Exhibit (c)(2)

| EMTEC, INC. | |||||||
| VALUATION ANALYSIS | |||||||
| As of April 30, 2013 | |||||||
| Table of Contents | |||||||
| Page | ||||||
| Valuation Summary | 1 | |||||
| Historical Balance Sheets | 2 | |||||
| Historical Income Statements | 5 | |||||
| Projected Balance Sheets | 7 | |||||
| Projected Income Statements | 10 | |||||
| Guideline Public Company Analysis | 12 | |||||
| Market Approach | 17 | |||||
| Income Approach | 18 | |||||
| Projected Capital Structure | 20 | |||||
| Tax Benefit of Amortization | 21 | |||||
| EMTEC, INC. | |||||||||||
| VALUATION ANALYSIS | |||||||||||
| As of April 30, 2013 | |||||||||||
| Valuation Summary | |||||||||||
| In Millions | |||||||||||
| EBITDA | EBITDA | EBITDA | EBITDA | EBITDA | EBITDA | DCF | DCF | |||||||||||||||||||||||||
| Based on | Based on | Based on | Based on | Based on | Based on | Based on | Based on | |||||||||||||||||||||||||
| LTM | LTM | FY 2013P | FY 2013P | FY 2014P | FY 2014P | Projections | Projections | |||||||||||||||||||||||||
| (Lower) | (Higher) | (Lower) | (Higher) | (Lower) | (Higher) | (Lower) | (Higher) | |||||||||||||||||||||||||
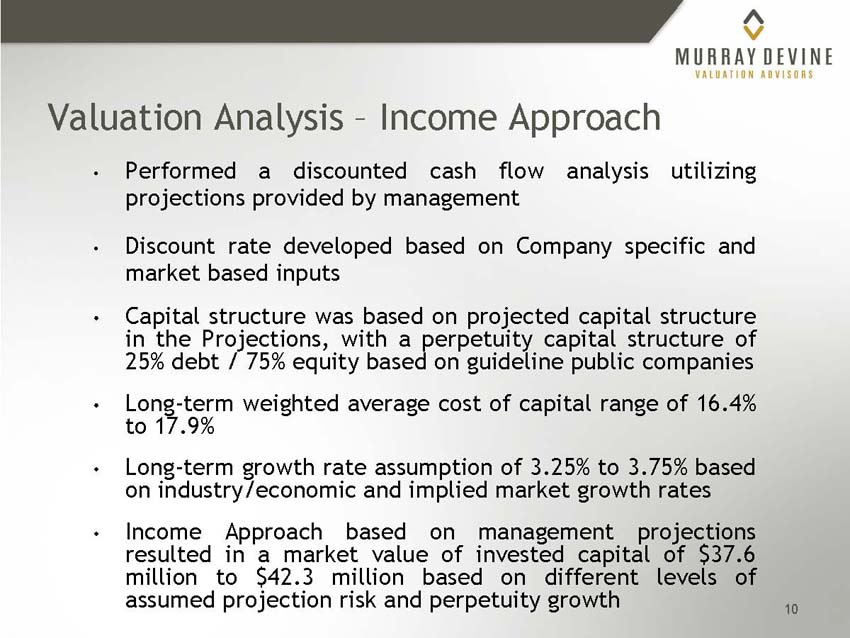
| Market Value of Invested Capital | $ | 38.9 | $ | 42.5 | $ | 35.2 | $ | 38.4 | $ | 38.2 | $ | 42.0 | $ | 37.6 | $ | 42.3 | ||||||||||||||||
| Add: Cash and Marketable Securities | 0.5 | 0.5 | 0.5 | 0.5 | 0.5 | 0.5 | 0.5 | 0.5 | ||||||||||||||||||||||||
| Less: Line of Credit | (9.8 | ) | (9.8 | ) | (9.8 | ) | (9.8 | ) | (9.8 | ) | (9.8 | ) | (9.8 | ) | (9.8 | ) | ||||||||||||||||
| Less: Long Term Debt [1] | (13.0 | ) | (13.0 | ) | (13.0 | ) | (13.0 | ) | (13.0 | ) | (13.0 | ) | (13.0 | ) | (13.0 | ) | ||||||||||||||||
| Less: Contingent Acquisition Liabilities | (4.8 | ) | (4.8 | ) | (4.8 | ) | (4.8 | ) | (4.8 | ) | (4.8 | ) | (4.8 | ) | (4.8 | ) | ||||||||||||||||
| Less: Capital Leases | (0.2 | ) | (0.2 | ) | (0.2 | ) | (0.2 | ) | (0.2 | ) | (0.2 | ) | (0.2 | ) | (0.2 | ) | ||||||||||||||||
| Equity Value | 11.7 | 15.3 | 8.0 | 11.2 | 11.0 | 14.8 | 10.4 | 15.1 | ||||||||||||||||||||||||
| Add: FV of Federal JV [2] | 4.0 | 4.0 | 4.0 | 4.0 | 4.0 | 4.0 | 4.0 | 4.0 | ||||||||||||||||||||||||
| Total Equity Value | 15.7 | 19.3 | 12.0 | 15.2 | 15.0 | 18.8 | 14.4 | 19.1 | ||||||||||||||||||||||||
| Number of Shares [3] | 19,166,599 | 19,166,599 | 19,166,599 | 19,166,599 | 19,166,599 | 19,166,599 | 19,166,599 | 19,166,599 | ||||||||||||||||||||||||
| FV Per Share | $ | 0.82 | $ | 1.00 | $ | 0.62 | $ | 0.79 | $ | 0.78 | $ | 0.98 | $ | 0.75 | $ | 1.00 | ||||||||||||||||
| Footnotes | |||||||
| [1] Long-term debt at face value of $13.0m. | |||||||
| [2] FV of Federal JV based on present value of projected future cash flows discounted at a cost of equity of 19.0%. | |||||||
| [3] Number of Shares includes 1,226,662 penny warrants owned by NewSpring and Peachtree. | |||||||
Appendix A
Page 1
| EMTEC, INC. | ||||||
| VALUATION ANALYSIS | ||||||
| As of April 30, 2013 | ||||||
| Historical Balance Sheets [1] | ||||||
| In Millions | ||||||
| February 28, | ||||||||||||||||
| Fiscal Year End August 31, | 2010 | 2011 | 2012 | 2013 | ||||||||||||
| Cash | $ | 2.4 | $ | 4.0 | $ | 1.8 | $ | 0.5 | ||||||||
| Receivables | 38.3 | 33.4 | 26.9 | 18.6 | ||||||||||||
| Inventories | 1.5 | 1.3 | 1.3 | 1.5 | ||||||||||||
| Prepaid Expenses and Others | 3.0 | 3.4 | 3.2 | 2.5 | ||||||||||||
| Deferred Tax Assets - Current | 0.9 | 1.1 | 1.0 | 1.0 | ||||||||||||
| Total Current Assets | 46.0 | 43.4 | 34.2 | 24.1 | ||||||||||||
| Net Fixed Assets | 2.2 | 4.3 | 3.5 | 2.8 | ||||||||||||
| Identified Intangibles | 10.9 | 18.4 | 14.4 | 9.2 | ||||||||||||
| Goodwill | 14.0 | 18.6 | 17.2 | 13.3 | ||||||||||||
| Deferred Tax Assets - Long-Term | 0.4 | 0.8 | 0.7 | 0.5 | ||||||||||||
| Other Assets | 0.7 | 1.1 | 1.8 | 1.7 | ||||||||||||
| Total Assets | 74.3 | 86.6 | 71.8 | 51.6 | ||||||||||||
| Line of Credit | 16.0 | 17.2 | 12.0 | 9.8 | ||||||||||||
| Accounts Payable | 24.7 | 23.8 | 22.3 | 12.0 | ||||||||||||
| Warrant Liability | 0.9 | 1.5 | 2.4 | 2.1 | ||||||||||||
| Income Taxes Payable | 0.3 | 0.3 | 0.1 | (0.5 | ) | |||||||||||
| Accrued Liabilities | 8.0 | 6.0 | 3.0 | 3.6 | ||||||||||||
| Due to Former Shareholders | - | - | 2.0 | - | ||||||||||||
| Customer Deposits and Other | 0.2 | 1.0 | 0.1 | (0.1 | ) | |||||||||||
| Deferred Revenue | 2.2 | 2.1 | 1.6 | 1.4 | ||||||||||||
| Total Current Liabilities | 52.3 | 51.8 | 43.6 | 28.3 | ||||||||||||
| Deferred Tax Liability - Long Term | 3.1 | 3.8 | 2.4 | (0.0 | ) | |||||||||||
| Accrued Liabilities | 0.9 | 0.2 | 0.2 | 0.2 | ||||||||||||
| Contingent Acquisition Liabilities | - | 5.9 | 4.8 | 4.8 | ||||||||||||
| Long Term Debt (adj. pre 2012) | 13.0 | 13.0 | 12.6 | 12.6 | ||||||||||||
| Capital Leases | - | 0.4 | 0.3 | 0.2 | ||||||||||||
| Equity | 18.0 | 15.0 | 8.0 | 5.5 | ||||||||||||
| Total Liabilities & Equity | $ | 87.3 | $ | 90.1 | $ | 71.8 | $ | 51.6 | ||||||||
| Footnotes: | ||||||
| [1] Pro Forma to exclude Federal business | ||||||
Appendix A
Page 2
| EMTEC, INC. | ||||||
| VALUATION ANALYSIS | ||||||
| As of April 30, 2013 | ||||||
| Historical Balance Sheets | ||||||
| Common Size Analysis |
| Fiscal Year End August 31, | 2010 | 2011 | 2012 | February 28, 2013 | |||||||||||||
| Cash | 3.2 | % | 4.7 | % | 2.5 | % | 1.0 | % | |||||||||
| Receivables | 51.5 | % | 38.6 | % | 37.4 | % | 36.1 | % | |||||||||
| Inventories | 2.0 | % | 1.5 | % | 1.9 | % | 2.9 | % | |||||||||
| Prepaid Expenses and Others | 4.0 | % | 4.0 | % | 4.4 | % | 4.8 | % | |||||||||
| Deferred Tax Assets - Current | 1.2 | % | 1.3 | % | 1.4 | % | 1.9 | % | |||||||||
| Total Current Assets | 62.0 | % | 50.1 | % | 47.6 | % | 46.7 | % | |||||||||
| Net Fixed Assets | 3.0 | % | 4.9 | % | 4.9 | % | 5.5 | % | |||||||||
| Identified Intangibles | 14.7 | % | 21.3 | % | 20.0 | % | 17.8 | % | |||||||||
| Goodwill | 18.8 | % | 21.5 | % | 23.9 | % | 25.8 | % | |||||||||
| Deferred Tax Assets - Long-Term | 0.6 | % | 1.0 | % | 1.0 | % | 1.0 | % | |||||||||
| Other Assets | 1.0 | % | 1.3 | % | 2.5 | % | 3.2 | % | |||||||||
| Total Assets | 100.0 | % | 100.0 | % | 100.0 | % | 100.0 | % | |||||||||
| Line of Credit | 21.6 | % | 19.9 | % | 16.7 | % | 18.9 | % | |||||||||
| Accounts Payable | 33.2 | % | 27.4 | % | 31.1 | % | 23.3 | % | |||||||||
| Warrant Liability | 1.2 | % | 1.7 | % | 3.4 | % | 4.2 | % | |||||||||
| Income Taxes Payable | 0.5 | % | 0.4 | % | 0.2 | % | -1.0 | % | |||||||||
| Accrued Liabilities | 10.8 | % | 6.9 | % | 4.1 | % | 7.0 | % | |||||||||
| Due to Former Shareholders | 0.0 | % | 0.0 | % | 2.8 | % | 0.0 | % | |||||||||
| Customer Deposits and Other | 0.3 | % | 1.1 | % | 0.2 | % | -0.3 | % | |||||||||
| Deferred Revenue | 2.9 | % | 2.4 | % | 2.2 | % | 2.8 | % | |||||||||
| Total Current Liabilities | 70.4 | % | 59.8 | % | 60.7 | % | 54.9 | % | |||||||||
| Deferred Tax Liability - Long Term | 4.1 | % | 4.3 | % | 3.3 | % | 0.0 | % | |||||||||
| Accrued Liabilities | 1.2 | % | 0.2 | % | 0.2 | % | 0.3 | % | |||||||||
| Contingent Acquisition Liabilities | 0.0 | % | 6.8 | % | 6.7 | % | 9.2 | % | |||||||||
| Long Term Debt (adj. pre 2012) | 17.5 | % | 15.0 | % | 17.5 | % | 24.5 | % | |||||||||
| Capital Leases | 0.0 | % | 0.5 | % | 0.4 | % | 0.3 | % | |||||||||
| Equity | 24.3 | % | 17.3 | % | 11.2 | % | 10.7 | % | |||||||||
| Total Liabilities & Equity | 117.5 | % | 104.0 | % | 100.0 | % | 100.0 | % | |||||||||
Appendix A
Page 3
| EMTEC, INC. | ||||||
| VALUATION ANALYSIS | ||||||
| As of April 30, 2013 | ||||||
| Historical Balance Sheets | ||||||
| Working Capital Analysis | ||||||
| In Millions |
| Fiscal Year End August 31, | 2010 | 2011 | 2012 | February 28, 2013 | ||||||||||||
| Receivables | $ | 38.3 | $ | 33.4 | $ | 26.9 | $ | 18.6 | ||||||||
| Inventories | 1.5 | 1.3 | 1.3 | 1.5 | ||||||||||||
| Prepaid Expenses and Others | 3.0 | 3.4 | 3.2 | 2.5 | ||||||||||||
| Total Current Assets | 42.8 | 38.2 | 31.4 | 22.6 | ||||||||||||
| Accounts Payable | 24.7 | 23.8 | 22.3 | 12.0 | ||||||||||||
| Accrued Liabilities | 8.0 | 6.0 | 3.0 | 3.6 | ||||||||||||
| Customer Deposits and Other | 0.2 | 1.0 | 0.1 | (0.1 | ) | |||||||||||
| Deferred Revenue | 2.2 | 2.1 | 1.6 | 1.4 | ||||||||||||
| Total Current Liabilities | 24.7 | 23.8 | 22.3 | 12.0 | ||||||||||||
| Net Working Capital | $ | 18.1 | $ | 14.4 | $ | 9.1 | $ | 10.6 | ||||||||
| As % of Rev. | ||||||||||||||||
Appendix A
Page 4
| EMTEC, INC. | |||||
| VALUATION ANALYSIS | |||||
| As of April 30, 2013 | |||||
| Historical Income Statements [1] | |||||
| In Millions | |||||
LTM February 28, | ||||||||||||||||
| Fiscal Year End August 31, | 2010 | 2011 | 2012 | 2013 | ||||||||||||
| Net Revenues | $ | 141.7 | $ | 146.3 | $ | 134.3 | $ | 140.7 | ||||||||
| Cost of Sales/Cost of Goods Sold | 102.6 | 113.3 | 105.8 | 110.5 | ||||||||||||
| Gross Profit | 39.1 | 32.9 | 28.5 | 30.2 | ||||||||||||
| Selling | 12.2 | 8.7 | 6.3 | 6.2 | ||||||||||||
| Commission expense | 2.5 | 1.1 | 2.4 | 1.9 | ||||||||||||
| Bus Unit G&A | 10.1 | 10.7 | 2.7 | 2.9 | ||||||||||||
| Corporate G&A | 13.5 | 7.6 | 12.6 | 12.1 | ||||||||||||
| SFAS 123 | 0.6 | 0.5 | 0.4 | 0.3 | ||||||||||||
| Warrant | 0.9 | 0.1 | 0.9 | 0.5 | ||||||||||||
| Impairment | - | - | 9.4 | 9.4 | ||||||||||||
| Restructuring | - | - | - | 1.1 | ||||||||||||
| Earn out Liability Adjustment | - | - | 0.6 | 1.0 | ||||||||||||
| M&A Expenses | 0.2 | 0.7 | 0.3 | 0.1 | ||||||||||||
| Retention Bonuses | 1.2 | 1.0 | 1.1 | 0.8 | ||||||||||||
| Other non-recurring | 0.4 | 1.3 | 0.3 | - | ||||||||||||
| Depreciation | 1.8 | 1.8 | 1.7 | 2.0 | ||||||||||||
| Amortization | 3.6 | 3.6 | 5.3 | 4.4 | ||||||||||||
| Total Operating Expenses | 47.0 | 37.2 | 43.7 | 42.6 | ||||||||||||
| Operating Income | (8.0 | ) | (4.2 | ) | (15.2 | ) | (12.4 | ) | ||||||||
| Non-recurring Items | ||||||||||||||||
| Retention Bonuses | 1.2 | 1.0 | 1.1 | 0.8 | ||||||||||||
| SFAS 123 | 0.6 | 0.5 | 0.4 | 0.3 | ||||||||||||
| Warrant | 0.9 | 0.1 | 0.9 | 0.5 | ||||||||||||
| Impairment | - | - | 9.4 | 9.4 | ||||||||||||
| Restructuring | - | - | - | 1.1 | ||||||||||||
| Earn out Liability Adjustment | - | - | 0.6 | 1.0 | ||||||||||||
| M&A Expenses | 0.2 | 0.7 | 0.3 | 0.1 | ||||||||||||
| Other non-recurring | 0.4 | 1.3 | 0.3 | - | ||||||||||||
| Non-recurring Items | 3.4 | 3.6 | 12.9 | 13.1 | ||||||||||||
| Normalized EBIT | (4.6 | ) | (0.6 | ) | (2.3 | ) | 0.7 | |||||||||
| Depreciation/Amortization | 5.4 | 5.4 | 7.0 | 6.4 | ||||||||||||
| Normalized EBITDA | $ | 0.8 | $ | 4.8 | $ | 4.7 | $ | 7.1 | ||||||||
| Supplemental Data: | ||||||||||||||||
| Revenue Growth | n/a | 3.3 | % | -8.2 | % | 4.7 | % | |||||||||
| EBITDA Growth | n/a | 476.6 | % | -3.0 | % | 51.8 | % | |||||||||
| Capital Expenditures | $ | 1.0 | $ | 3.0 | $ | 0.7 | 0.5 | |||||||||
| As % of Rev. | 0.7 | % | 2.1 | % | 0.5 | % | 0.4 | % | ||||||||
| Footnotes: | |||||
| [1] Pro Forma to exclude Federal business | |||||
Appendix A
Page 5
| EMTEC, INC. | |||||
| VALUATION ANALYSIS | |||||
| As of April 30, 2013 | |||||
| Historical Income Statements [1] Common Size Analysis | |||||
LTM February 28, | ||||||||||||||||
| Fiscal Year End August 31, | 2010 | 2011 | 2012 | 2013 | ||||||||||||
| Net Revenues | 100.0 | % | 100.0 | % | 100.0 | % | 100.0 | % | ||||||||
| Cost of Sales/Cost of Goods Sold | 72.4 | % | 77.5 | % | 78.8 | % | 78.5 | % | ||||||||
| Gross Profit | 27.6 | % | 22.5 | % | 21.2 | % | 21.5 | % | ||||||||
| Selling | 8.6 | % | 6.0 | % | 4.7 | % | 4.4 | % | ||||||||
| Commission expense | 1.8 | % | 0.7 | % | 1.8 | % | 1.4 | % | ||||||||
| Bus Unit G&A | 7.1 | % | 7.3 | % | 2.0 | % | 2.1 | % | ||||||||
| Corporate G&A | 9.5 | % | 5.2 | % | 9.4 | % | 8.6 | % | ||||||||
| SFAS 123 | 0.4 | % | 0.4 | % | 0.3 | % | 0.2 | % | ||||||||
| Warrant | 0.6 | % | 0.1 | % | 0.7 | % | 0.3 | % | ||||||||
| Impairment | 0.0 | % | 0.0 | % | 7.0 | % | 6.7 | % | ||||||||
| Earn out Liability Adjustment | 0.0 | % | 0.0 | % | 0.4 | % | 0.7 | % | ||||||||
| M&A Expenses | 0.2 | % | 0.5 | % | 0.2 | % | 0.1 | % | ||||||||
| Retention Bonuses | 0.9 | % | 0.7 | % | 0.8 | % | 0.6 | % | ||||||||
| Other non-recurring | 0.3 | % | 0.9 | % | 0.2 | % | 0.0 | % | ||||||||
| Depreciation | 1.3 | % | 1.2 | % | 1.2 | % | 1.4 | % | ||||||||
| Amortization | 2.5 | % | 2.5 | % | 4.0 | % | 3.1 | % | ||||||||
| Total Operating Expenses | 33.2 | % | 25.4 | % | 32.6 | % | 29.5 | % | ||||||||
| Operating Income | -5.6 | % | -2.9 | % | -11.3 | % | -8.0 | % | ||||||||
| Non-recurring Items | ||||||||||||||||
| Retention Bonuses | 0.9 | % | 0.7 | % | 0.8 | % | 0.6 | % | ||||||||
| SFAS 123 | 0.4 | % | 0.4 | % | 0.3 | % | 0.2 | % | ||||||||
| Warrant | 0.6 | % | 0.1 | % | 0.7 | % | 0.3 | % | ||||||||
| Impairment | 0.0 | % | 0.0 | % | 7.0 | % | 6.7 | % | ||||||||
| Earn out Liability Adjustment | 0.0 | % | 0.0 | % | 0.4 | % | 0.7 | % | ||||||||
| M&A Expenses | 0.2 | % | 0.5 | % | 0.2 | % | 0.1 | % | ||||||||
| Other non-recurring | 0.3 | % | 0.9 | % | 0.2 | % | 0.0 | % | ||||||||
| Non-recurring Items | 2.4 | % | 2.5 | % | 9.6 | % | 8.6 | % | ||||||||
| Normalized EBIT | -3.3 | % | -0.4 | % | -1.7 | % | 0.5 | % | ||||||||
| Depreciation/Amortization | 3.8 | % | 3.7 | % | 5.2 | % | 4.5 | % | ||||||||
| Normalized EBITDA | 0.6 | % | 3.3 | % | 3.5 | % | 5.0 | % | ||||||||
Appendix A
Page 6
| EMTEC, INC. | |||||
| VALUATION ANALYSIS | |||||
| As of April 30, 2013 | |||||
| Projected Balance Sheets | |||||
| In Millions | ||||||||||||||||||||||||
| Fiscal Year End August 31, | 2013 | 2014 | 2015 | 2016 | 2017 | 2018 | ||||||||||||||||||
| Cash | $ | - | $ | - | $ | - | $ | - | $ | - | $ | 0.8 | ||||||||||||
| Receivables | 17.8 | 19.1 | 20.1 | 19.4 | 20.2 | 21.0 | ||||||||||||||||||
| Inventories | 1.1 | 1.2 | 1.2 | 1.8 | 2.2 | 1.4 | ||||||||||||||||||
| Prepaid Expenses and Others | 3.0 | 3.1 | 3.4 | 3.5 | 3.2 | 3.4 | ||||||||||||||||||
| Deferred Tax Assets - Current | 1.0 | 1.0 | 1.0 | 1.0 | 1.0 | 1.0 | ||||||||||||||||||
| Total Current Assets | 22.8 | 24.3 | 25.6 | 25.7 | 26.6 | 27.6 | ||||||||||||||||||
| Net Fixed Assets | 2.1 | 1.4 | 1.6 | 1.7 | 1.9 | 2.0 | ||||||||||||||||||
| Identified Intangibles | 8.3 | 6.6 | 4.9 | 3.2 | 1.5 | (0.2 | ) | |||||||||||||||||
| Goodwill | 13.3 | 13.3 | 13.3 | 13.3 | 13.3 | 13.3 | ||||||||||||||||||
| Deferred Tax Assets - Long-Term | 0.5 | 0.5 | 0.5 | 0.5 | 0.5 | 0.5 | ||||||||||||||||||
| Other Assets | 1.7 | 1.7 | 1.7 | 1.7 | 1.7 | 1.7 | ||||||||||||||||||
| Total Assets | 48.8 | 47.9 | 47.6 | 46.2 | 45.5 | 44.9 | ||||||||||||||||||
| Line of Credit | 8.5 | 7.1 | 4.9 | 0.8 | 1.9 | - | ||||||||||||||||||
| Accounts Payable | 11.0 | 12.6 | 13.0 | 12.3 | 12.2 | 12.4 | ||||||||||||||||||
| Warrant Liability | 2.1 | 2.1 | 2.1 | 2.1 | 2.1 | 2.1 | ||||||||||||||||||
| Income Taxes Payable | 0.1 | 0.3 | 0.4 | 0.5 | 0.6 | 0.7 | ||||||||||||||||||
| Accrued Liabilities | 4.1 | 4.2 | 4.1 | 5.2 | 3.8 | 4.3 | ||||||||||||||||||
| Customer Deposits and Other | 0.1 | 0.1 | 0.1 | 0.1 | 0.2 | 0.1 | ||||||||||||||||||
| Deferred Revenue | 0.3 | 0.4 | 0.4 | 0.4 | 0.4 | 0.4 | ||||||||||||||||||
| Total Current Liabilities | 26.3 | 26.8 | 25.1 | 21.4 | 21.2 | 20.1 | ||||||||||||||||||
| Deferred Tax Liability - Long Term | (0.0 | ) | (0.0 | ) | (0.0 | ) | (0.0 | ) | (0.0 | ) | (0.0 | ) | ||||||||||||
| Accrued Liabilities | 0.1 | 0.1 | 0.1 | 0.6 | 0.5 | 0.6 | ||||||||||||||||||
| Contingent Acquisition Liabilities | 3.9 | 0.1 | (0.5 | ) | (0.5 | ) | (0.5 | ) | (0.5 | ) | ||||||||||||||
| Long Term Debt (adj. pre 2012) | 12.8 | 13.0 | 13.3 | 12.0 | 8.0 | 4.0 | ||||||||||||||||||
| Capital Leases | 0.1 | - | - | - | - | - | ||||||||||||||||||
| Equity | 5.7 | 7.9 | 9.7 | 12.7 | 16.3 | 20.7 | ||||||||||||||||||
| Total Liabilities & Equity | 48.8 | 47.9 | 47.6 | 46.2 | 45.5 | 44.9 | ||||||||||||||||||
Appendix A
Page 7
| EMTEC, INC. | |||||||
| VALUATION ANALYSIS | |||||||
| As of April 30, 2013 | |||||||
| Projected Balance Sheets | |||||||
| Common Size Analysis | |||||||
| Fiscal Year End August 31, | 2013 | 2014 | 2015 | 2016 | 2017 | 2018 | ||||||||||||||||||
| Cash | 0.0 | % | 0.0 | % | 0.0 | % | 0.0 | % | 0.0 | % | 1.8 | % | ||||||||||||
| Receivables | 36.4 | % | 39.8 | % | 42.2 | % | 42.0 | % | 44.4 | % | 46.7 | % | ||||||||||||
| Inventories | 2.2 | % | 2.5 | % | 2.6 | % | 3.9 | % | 4.9 | % | 3.2 | % | ||||||||||||
| Prepaid Expenses and Others | 6.1 | % | 6.4 | % | 7.0 | % | 7.7 | % | 7.1 | % | 7.6 | % | ||||||||||||
| Deferred Tax Assets - Current | 2.0 | % | 2.0 | % | 2.0 | % | 2.1 | % | 2.1 | % | 2.2 | % | ||||||||||||
| Total Current Assets | 46.8 | % | 50.8 | % | 53.8 | % | 55.7 | % | 58.5 | % | 61.4 | % | ||||||||||||
| Net Fixed Assets | 4.4 | % | 3.0 | % | 3.3 | % | 3.8 | % | 4.2 | % | 4.6 | % | ||||||||||||
| Identified Intangibles | 17.1 | % | 13.8 | % | 10.3 | % | 6.9 | % | 3.3 | % | -0.5 | % | ||||||||||||
| Goodwill | 27.3 | % | 27.8 | % | 27.9 | % | 28.8 | % | 29.2 | % | 29.6 | % | ||||||||||||
| Deferred Tax Assets - Long-Term | 1.1 | % | 1.1 | % | 1.1 | % | 1.2 | % | 1.2 | % | 1.2 | % | ||||||||||||
| Other Assets | 3.4 | % | 3.5 | % | 3.5 | % | 3.6 | % | 3.7 | % | 3.7 | % | ||||||||||||
| Total Assets | 100.0 | % | 100.0 | % | 100.0 | % | 100.0 | % | 100.0 | % | 100.0 | % | ||||||||||||
| Line of Credit | 17.4 | % | 14.8 | % | 10.3 | % | 1.7 | % | 4.2 | % | 0.0 | % | ||||||||||||
| Accounts Payable | 22.6 | % | 26.4 | % | 27.2 | % | 26.6 | % | 26.7 | % | 27.5 | % | ||||||||||||
| Warrant Liability | 4.4 | % | 4.5 | % | 4.5 | % | 4.6 | % | 4.7 | % | 4.8 | % | ||||||||||||
| Income Taxes Payable | 0.2 | % | 0.6 | % | 0.8 | % | 1.1 | % | 1.3 | % | 1.6 | % | ||||||||||||
| Accrued Liabilities | 8.4 | % | 8.7 | % | 8.7 | % | 11.3 | % | 8.4 | % | 9.6 | % | ||||||||||||
| Customer Deposits and Other | 0.2 | % | 0.2 | % | 0.3 | % | 0.3 | % | 0.3 | % | 0.3 | % | ||||||||||||
| Deferred Revenue | 0.7 | % | 0.8 | % | 0.8 | % | 0.8 | % | 0.9 | % | 0.9 | % | ||||||||||||
| Total Current Liabilities | 53.9 | % | 56.0 | % | 52.6 | % | 46.4 | % | 46.6 | % | 44.8 | % | ||||||||||||
| Deferred Tax Liability - Long Term | 0.0 | % | 0.0 | % | 0.0 | % | 0.0 | % | 0.0 | % | 0.0 | % | ||||||||||||
| Accrued Liabilities | 0.1 | % | 0.1 | % | 0.1 | % | 1.3 | % | 1.1 | % | 1.4 | % | ||||||||||||
| Contingent Acquisition Liabilities | 8.1 | % | 0.3 | % | -1.0 | % | -1.1 | % | -1.1 | % | -1.1 | % | ||||||||||||
| Long Term Debt (adj. pre 2012) | 26.1 | % | 27.2 | % | 28.0 | % | 26.0 | % | 17.6 | % | 8.9 | % | ||||||||||||
| Capital Leases | 0.1 | % | 0.0 | % | 0.0 | % | 0.0 | % | 0.0 | % | 0.0 | % | ||||||||||||
| Equity | 11.7 | % | 16.4 | % | 20.4 | % | 27.4 | % | 35.8 | % | 46.1 | % | ||||||||||||
| Total Liabilities & Equity | 100.0 | % | 100.0 | % | 100.0 | % | 100.0 | % | 100.0 | % | 100.0 | % | ||||||||||||
Appendix A
Page 8
| EMTEC, INC. | |||||||
| VALUATION ANALYSIS | |||||||
| As of April 30, 2013 | |||||||
| Projected Balance Sheets | |||||||
| Working Capital Analysis | |||||||
| In Millions | |||||||
| Fiscal Year End August 31, | 2013 | 2014 | 2015 | 2016 | 2017 | 2018 | ||||||||||||||||||
| Receivables | $ | 17.8 | $ | 19.1 | $ | 20.1 | $ | 19.4 | $ | 20.2 | $ | 21.0 | ||||||||||||
| Inventories | 1.1 | 1.2 | 1.2 | 1.8 | 2.2 | 1.4 | ||||||||||||||||||
| Prepaid Expenses and Others | 3.0 | 3.1 | 3.4 | 3.5 | 3.2 | 3.4 | ||||||||||||||||||
| Total Current Assets | 21.9 | 23.4 | 24.7 | 24.7 | 25.7 | 25.8 | ||||||||||||||||||
| Accounts Payable | 11.0 | 12.6 | 13.0 | 12.3 | 12.2 | 12.4 | ||||||||||||||||||
| Accrued Liabilities | 4.1 | 4.2 | 4.1 | 5.2 | 3.8 | 4.3 | ||||||||||||||||||
| Customer Deposits and Other | 0.1 | 0.1 | 0.1 | 0.1 | 0.2 | 0.1 | ||||||||||||||||||
| Deferred Revenue | 0.3 | 0.4 | 0.4 | 0.4 | 0.4 | 0.4 | ||||||||||||||||||
| Total Current Liabilities | 15.6 | 17.3 | 17.6 | 18.0 | 16.5 | 17.2 | ||||||||||||||||||
| Net Working Capital | $ | 6.3 | $ | 6.1 | $ | 7.1 | $ | 6.7 | $ | 9.1 | $ | 8.6 | ||||||||||||
| As % of Rev. | 4.7 | % | 4.3 | % | 4.8 | % | 4.5 | % | 5.9 | % | 5.4 | % | ||||||||||||
Appendix A
Page 9
| EMTEC, INC. | ||||||||
| VALUATION ANALYSIS | ||||||||
| As of April 30, 2013 | ||||||||
| Projected Income Statements | ||||||||
| In Millions | ||||||||
| Fiscal Year End August 31, | 2013 | 2014 | 2015 | 2016 | 2017 | 2018 | ||||||||||||||||||
| Net Revenues | $ | 134.4 | $ | 141.3 | $ | 145.7 | $ | 150.0 | $ | 155.3 | $ | 160.3 | ||||||||||||
| Cost of Sales/Cost of Goods Sold | 105.1 | 110.3 | 113.7 | 116.7 | 120.5 | 124.1 | ||||||||||||||||||
| Gross Profit | 29.3 | 31.1 | 32.0 | 33.3 | 34.8 | 36.3 | ||||||||||||||||||
| Selling | 7.0 | 7.5 | 8.0 | 8.2 | 8.3 | 8.5 | ||||||||||||||||||
| Commission expense | 2.1 | 2.4 | 2.3 | 2.6 | 2.6 | 2.6 | ||||||||||||||||||
| Bus Unit G&A | 3.1 | 3.4 | 3.4 | 3.4 | 3.5 | 3.6 | ||||||||||||||||||
| Corporate G&A | 10.6 | 10.1 | 10.6 | 10.9 | 11.2 | 11.6 | ||||||||||||||||||
| SFAS123 | 0.1 | - | - | - | - | - | ||||||||||||||||||
| Warrant | 0.0 | - | - | - | - | - | ||||||||||||||||||
| Restructuring | 0.6 | - | - | - | - | - | ||||||||||||||||||
| Earn out Liability Adjustment | 0.7 | (0.2 | ) | (0.1 | ) | - | - | - | ||||||||||||||||
| M&A Expenses | 0.2 | 0.2 | 0.1 | - | - | - | ||||||||||||||||||
| Retention Bonuses | 0.3 | 0.2 | 0.1 | - | - | - | ||||||||||||||||||
| Depreciation | 2.2 | 1.3 | 0.6 | 0.6 | 0.6 | 0.6 | ||||||||||||||||||
| Amortization | 1.7 | 1.7 | 1.7 | 1.7 | 1.7 | 1.7 | ||||||||||||||||||
| Total Operating Expenses | 28.8 | 26.7 | 26.7 | 27.3 | 28.0 | 28.7 | ||||||||||||||||||
| Operating Income | 0.5 | 4.4 | 5.3 | 6.0 | 6.8 | 7.6 | ||||||||||||||||||
| Non-recurring Items | ||||||||||||||||||||||||
| Retention Bonuses | 0.3 | 0.2 | 0.1 | - | - | - | ||||||||||||||||||
| SFAS123 | 0.1 | - | - | - | - | - | ||||||||||||||||||
| Warrant | 0.0 | - | - | - | - | - | ||||||||||||||||||
| Earn out Liability Adjustment | 0.7 | (0.2 | ) | (0.1 | ) | - | - | - | ||||||||||||||||
| M&A Expenses | 0.2 | 0.2 | 0.1 | - | - | - | ||||||||||||||||||
| Restructuring | 0.6 | - | - | - | - | - | ||||||||||||||||||
| Non-recurring Items | 1.9 | 0.2 | 0.1 | - | - | - | ||||||||||||||||||
| Normalized EBIT | 2.5 | 4.6 | 5.4 | 6.0 | 6.8 | 7.6 | ||||||||||||||||||
| Depreciation/Amortization | 3.9 | 3.0 | 2.3 | 2.3 | 2.3 | 2.3 | ||||||||||||||||||
| Normalized EBITDA | $ | 6.4 | $ | 7.6 | $ | 7.7 | $ | 8.2 | $ | 9.1 | $ | 9.9 | ||||||||||||
| Supplemental Data: | ||||||||||||||||||||||||
| Revenue Growth | n/a | 5.2 | % | 3.1 | % | 3.0 | % | 3.5 | % | 3.3 | % | |||||||||||||
| EBITDA Growth | n/a | 19.5 | % | 0.6 | % | 7.2 | % | 10.5 | % | 9.0 | % | |||||||||||||
| Capital Expenditures | $ | 0.6 | $ | 0.7 | $ | 0.7 | $ | 0.7 | $ | 0.8 | $ | 0.8 | ||||||||||||
| As % of Rev. | 0.5 | % | 0.5 | % | 0.5 | % | 0.5 | % | 0.5 | % | 0.5 | % | ||||||||||||
Appendix A
Page 10
| EMTEC, INC. | |||||||
| VALUATION ANALYSIS | |||||||
| As of April 30, 2013 | |||||||
| Projected Income Statements | |||||||
| Common Size Analysis | |||||||
| Fiscal Year End August 31, | 2013 | 2014 | 2015 | 2016 | 2017 | 2018 | ||||||||||||||||||
| Net Revenues | 100.0 | % | 100.0 | % | 100.0 | % | 100.0 | % | 100.0 | % | 100.0 | % | ||||||||||||
| Cost of Sales/Cost of Goods Sold | 78.2 | % | 78.0 | % | 78.0 | % | 77.8 | % | 77.6 | % | 77.4 | % | ||||||||||||
| Gross Profit | 21.8 | % | 22.0 | % | 22.0 | % | 22.2 | % | 22.4 | % | 22.6 | % | ||||||||||||
| Selling | 5.2 | % | 5.3 | % | 5.5 | % | 5.4 | % | 5.4 | % | 5.3 | % | ||||||||||||
| Commission expense | 1.6 | % | 1.7 | % | 1.6 | % | 1.7 | % | 1.7 | % | 1.6 | % | ||||||||||||
| Bus Unit G&A | 2.3 | % | 2.4 | % | 2.4 | % | 2.3 | % | 2.3 | % | 2.3 | % | ||||||||||||
| Corporate G&A | 7.9 | % | 7.1 | % | 7.3 | % | 7.3 | % | 7.2 | % | 7.2 | % | ||||||||||||
| SFAS123 | 0.1 | % | 0.0 | % | 0.0 | % | 0.0 | % | 0.0 | % | 0.0 | % | ||||||||||||
| Warrant | 0.0 | % | 0.0 | % | 0.0 | % | 0.0 | % | 0.0 | % | 0.0 | % | ||||||||||||
| Restructuring | 0.4 | % | 0.0 | % | 0.0 | % | 0.0 | % | 0.0 | % | 0.0 | % | ||||||||||||
| Earn out Liability Adjustment | 0.5 | % | -0.2 | % | -0.1 | % | 0.0 | % | 0.0 | % | 0.0 | % | ||||||||||||
| M&A Expenses | 0.1 | % | 0.2 | % | 0.1 | % | 0.0 | % | 0.0 | % | 0.0 | % | ||||||||||||
| Retention Bonuses | 0.3 | % | 0.2 | % | 0.1 | % | 0.0 | % | 0.0 | % | 0.0 | % | ||||||||||||
| Depreciation | 1.7 | % | 0.9 | % | 0.4 | % | 0.4 | % | 0.4 | % | 0.4 | % | ||||||||||||
| Amortization | 1.3 | % | 1.2 | % | 1.2 | % | 1.1 | % | 1.1 | % | 1.1 | % | ||||||||||||
| Total Operating Expenses | 21.4 | % | 18.9 | % | 18.3 | % | 18.2 | % | 18.0 | % | 17.9 | % | ||||||||||||
| Operating Income | 0.4 | % | 3.1 | % | 3.7 | % | 4.0 | % | 4.4 | % | 4.7 | % | ||||||||||||
| Non-recurring Items | ||||||||||||||||||||||||
| Retention Bonuses | 0.3 | % | 0.2 | % | 0.1 | % | 0.0 | % | 0.0 | % | 0.0 | % | ||||||||||||
| SFAS123 | 0.1 | % | 0.0 | % | 0.0 | % | 0.0 | % | 0.0 | % | 0.0 | % | ||||||||||||
| Warrant | 0.0 | % | 0.0 | % | 0.0 | % | 0.0 | % | 0.0 | % | 0.0 | % | ||||||||||||
| Earn out Liability Adjustment | 0.5 | % | -0.2 | % | -0.1 | % | 0.0 | % | 0.0 | % | 0.0 | % | ||||||||||||
| M&A Expenses | 0.1 | % | 0.2 | % | 0.1 | % | 0.0 | % | 0.0 | % | 0.0 | % | ||||||||||||
| Restructuring | 0.4 | % | 0.0 | % | 0.0 | % | 0.0 | % | 0.0 | % | 0.0 | % | ||||||||||||
| Non-recurring Items | 1.5 | % | 0.2 | % | 0.1 | % | 0.0 | % | 0.0 | % | 0.0 | % | ||||||||||||
| Normalized EBIT | 1.8 | % | 3.3 | % | 3.7 | % | 4.0 | % | 4.4 | % | 4.7 | % | ||||||||||||
| Depreciation/Amortization | 2.9 | % | 2.2 | % | 1.6 | % | 1.5 | % | 1.5 | % | 1.5 | % | ||||||||||||
| Normalized EBITDA | 4.8 | % | 5.4 | % | 5.3 | % | 5.5 | % | 5.9 | % | 6.2 | % | ||||||||||||
Appendix A
Page 11
| EMTEC, INC. | ||||||||||||
| VALUATION ANALYSIS | ||||||||||||
| As of April 30, 2013 | ||||||||||||
| Guideline Public Company Analysis | ||||||||||||
| Operating Value | ||||||||||||
| in millions except per share amounts | ||||||||||||
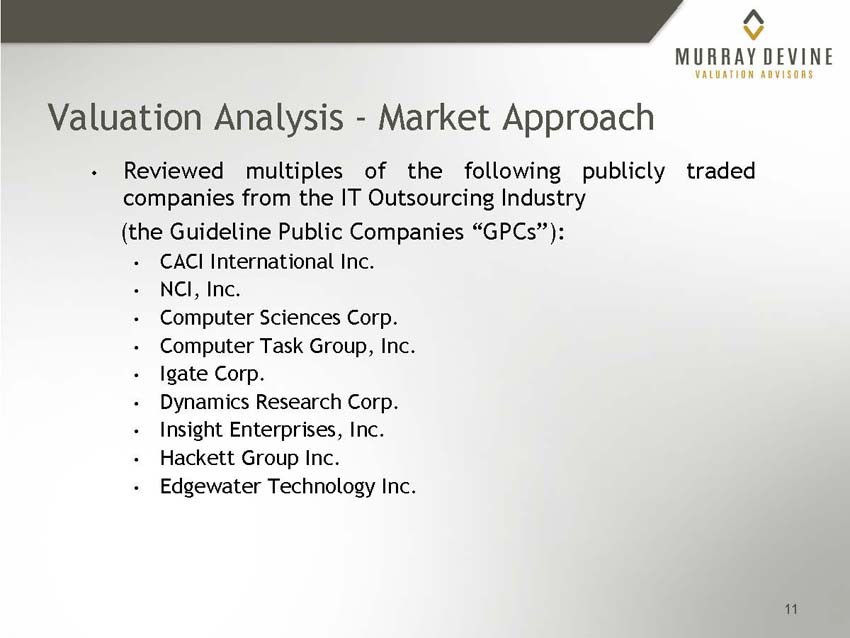
| CACI International Inc | NCI, Inc. | Computer Sciences Corp | Computer Task Group Inc | Igate Corp | Dynamics Research Corp | Insight Enterprises Inc | Hackett Group Inc/The | Edgewater Technology Inc | Emetec, Inc. | |||||||||||||||||||||||||||||||
| Ticker Symbol | CACI | NCIT | CSC | CTGX | IGTE | DRCO | NSIT | HCKT | EDGW | ETEC | ||||||||||||||||||||||||||||||
| Stock Exchange | NYSE | NDAQ | NYSE | NDAQ | NDAQ | NDAQ | NDAQ | NASDAQ GM | NASDAQ GM | OTC | ||||||||||||||||||||||||||||||
| Market Price per Common Share | $ | 58.09 | $ | 4.27 | $ | 46.37 | $ | 20.13 | $ | 16.75 | $ | 5.68 | $ | 17.79 | $ | 4.83 | $ | 4.14 | $ | 1.00 | ||||||||||||||||||||
| Shares Outstanding | 22.955 | 12.932 | 155.028 | 18.857 | 57.614 | 10.524 | 44.594 | 31.064 | 10.897 | 19.441 | ||||||||||||||||||||||||||||||
| Market Value of Common Equity | $ | 1,333.5 | $ | 55.2 | $ | 7,188.6 | $ | 379.6 | $ | 965.0 | $ | 59.8 | $ | 793.3 | $ | 150.0 | $ | 45.1 | $ | 19.4 | ||||||||||||||||||||
| Market Value of Preferred Equity | 0.0 | 0.0 | 0.0 | 0.0 | 386.1 | 0.0 | 0.0 | 0.0 | 0.0 | 0.0 | ||||||||||||||||||||||||||||||
| Long-Term Debt | 702.7 | 17.5 | 2,629.0 | 0.0 | 1,115.5 | 89.1 | 80.6 | 25.0 | 0.0 | 32.2 | ||||||||||||||||||||||||||||||
| Minority Interests | 2.3 | 0.0 | 20.0 | 0.0 | 27.3 | 0.0 | 0.0 | 0.0 | 0.0 | 0.0 | ||||||||||||||||||||||||||||||
| Less: Cash/Investments | (37.5 | ) | (0.8 | ) | (2,198.0 | ) | (30.8 | ) | (595.3 | ) | (0.0 | ) | (152.1 | ) | (16.9 | ) | (16.7 | ) | (0.5 | ) | ||||||||||||||||||||
Total Operating Value | $ | 2,001.0 | $ | 72.0 | $ | 7,639.6 | $ | 348.8 | $ | 1,898.6 | $ | 148.9 | $ | 721.8 | $ | 158.1 | $ | 28.5 | $ | 51.1 | ||||||||||||||||||||
Appendix A
Page 12
| EMTEC, INC. | ||||||||||||||
| VALUATION ANALYSIS | ||||||||||||||
| As of April 30, 2013 | ||||||||||||||
| Guideline Public Company Analysis | ||||||||||||||
| Selected Financial Data | ||||||||||||||
| in millions | ||||||||||||||
| CACI International Inc | NCI, Inc. | Computer Sciences Corp | Computer Task Group Inc | Igate Corp | Dynamics Research Corp | Insight Enterprises Inc | Hackett Group Inc/The | Edgewater Technology Inc | Emetec, Inc. | |||||||||||||||||||||||||||||||
| Most recent fiscal year end | 06/2012 | 12/2012 | 03/2012 | 12/2012 | 12/2012 | 12/2012 | 12/2012 | 12/2012 | 12/2012 | 8/2012 | ||||||||||||||||||||||||||||||
| Most recent fiscal quarter end | 12/12 Q2 | 12/12 Q4 | 12/12 Q3 | 03/13 Q1 | 03/13 Q1 | 12/12 Q4 | 12/12 Q4 | 12/12 Q4 | 12/12 Q4 | 02/13 Q2 | ||||||||||||||||||||||||||||||
| Operating Data | ||||||||||||||||||||||||||||||||||||||||
| Fiscal 2010 Sales | $ | 3,149.1 | $ | 581.3 | $ | 15,921.0 | $ | 331.4 | $ | 280.6 | $ | 272.1 | $ | 4,809.9 | $ | 201.3 | $ | 88.5 | $ | 259.0 | ||||||||||||||||||||
| Fiscal 2011 Sales | 3,577.8 | 558.3 | 16,042.0 | 396.3 | 779.6 | 322.6 | 5,287.2 | 225.1 | 102.4 | 239.6 | ||||||||||||||||||||||||||||||
| Fiscal 2012 Sales | 3,774.5 | 368.4 | 15,877.0 | 424.4 | 1,073.9 | 317.0 | 5,301.4 | 234.1 | 100.9 | 224.8 | ||||||||||||||||||||||||||||||
| LTM Sales | 3,739.7 | 368.4 | 15,706.0 | 429.5 | 1,085.6 | 317.0 | 5,301.4 | 234.1 | 100.9 | 205.1 | ||||||||||||||||||||||||||||||
| Projected 2013 Sales | 3,748.1 | 301.4 | 15,250.9 | 454.5 | 1,133.7 | 290.8 | 5,468.5 | 233.0 | 108.0 | 196.0 | ||||||||||||||||||||||||||||||
| Projected 2014 Sales | 3,645.3 | 278.8 | 14,746.3 | 495.5 | 1,231.4 | 284.8 | 5,706.5 | 245.5 | n/a | 205.9 | ||||||||||||||||||||||||||||||
| Average Sales of Past Three Years | 3,500.5 | 502.7 | 15,946.7 | 384.0 | 711.4 | 303.9 | 5,132.9 | 220.2 | 97.3 | 241.1 | ||||||||||||||||||||||||||||||
| Growth 2011-2012 | 5.5 | % | -34.0 | % | -1.0 | % | 7.1 | % | 37.7 | % | -1.7 | % | 0.3 | % | 4.0 | % | -1.5 | % | -6.2 | % | ||||||||||||||||||||
| Growth 2010-2012 | 9.5 | % | -20.4 | % | -0.1 | % | 13.2 | % | 95.6 | % | 7.9 | % | 5.0 | % | 7.8 | % | 6.7 | % | -6.8 | % | ||||||||||||||||||||
| Growth 2012-2013 | -0.7 | % | -18.2 | % | -3.9 | % | 7.1 | % | 5.6 | % | -8.2 | % | 3.2 | % | -0.5 | % | 7.1 | % | -12.8 | % | ||||||||||||||||||||
| Growth 2012-2014 | -1.7 | % | -13.0 | % | -3.6 | % | 8.1 | % | 7.1 | % | -5.2 | % | 3.7 | % | 2.4 | % | n/a | -4.3 | % | |||||||||||||||||||||
| Fiscal 2010 EBITDA Margin | 7.9 | % | 7.7 | % | 15.0 | % | 4.7 | % | 22.1 | % | 9.5 | % | 3.4 | % | 8.1 | % | 2.0 | % | 4.9 | % | ||||||||||||||||||||
| Fiscal 2011 EBITDA Margin | 8.6 | % | 6.2 | % | 13.8 | % | 5.4 | % | 18.6 | % | 10.5 | % | 3.6 | % | 8.9 | % | 6.3 | % | 1.6 | % | ||||||||||||||||||||
| Fiscal 2012 EBITDA Margin | 9.4 | % | 5.4 | % | 8.8 | % | 6.5 | % | 23.5 | % | 9.1 | % | 3.7 | % | 8.2 | % | 4.0 | % | 2.8 | % | ||||||||||||||||||||
| LTM EBITDA Margin | 9.0 | % | 5.4 | % | 11.5 | % | 6.5 | % | 23.1 | % | 9.1 | % | 3.7 | % | 8.2 | % | 3.8 | % | 3.0 | % | ||||||||||||||||||||
| Projected 2013 EBITDA Margin | 8.9 | % | 4.1 | % | 12.4 | % | 7.1 | % | 23.0 | % | 9.0 | % | 3.9 | % | 11.5 | % | 6.9 | % | 2.7 | % | ||||||||||||||||||||
| Projected 2014 EBITDA Margin | 8.8 | % | 4.3 | % | 13.5 | % | 7.9 | % | 24.2 | % | 8.5 | % | 3.9 | % | 12.3 | % | n/a | 3.0 | % | |||||||||||||||||||||
| Average EBITDA Margin of Past Three Years | 8.6 | % | 6.4 | % | 12.5 | % | 5.5 | % | 21.4 | % | 9.7 | % | 3.6 | % | 8.4 | % | 4.1 | % | 3.1 | % | ||||||||||||||||||||
| Fiscal 2010 EBITDA | $ | 247.8 | $ | 44.8 | $ | 2,383.0 | $ | 15.6 | $ | 62.0 | $ | 25.9 | $ | 165.0 | $ | 16.2 | $ | 1.8 | $ | 12.7 | ||||||||||||||||||||
| Fiscal 2011 EBITDA | 307.5 | 34.7 | 2,219.0 | 21.6 | 144.6 | 34.0 | 191.6 | 20.1 | 6.4 | 3.8 | ||||||||||||||||||||||||||||||
| Fiscal 2012 EBITDA | 355.8 | 20.0 | 1,390.0 | 27.4 | 252.6 | 28.9 | 195.6 | 19.2 | 4.1 | 6.3 | ||||||||||||||||||||||||||||||
| LTM EBITDA | 338.2 | 20.0 | 1,811.0 | 27.9 | 251.1 | 28.9 | 195.6 | 19.2 | 3.8 | 6.1 | ||||||||||||||||||||||||||||||
| Projected 2013 EBITDA | 334.6 | 12.3 | 1,891.3 | 32.3 | 260.6 | 26.2 | 212.0 | 26.9 | 7.4 | 5.3 | ||||||||||||||||||||||||||||||
| Projected 2014 EBITDA | 322.6 | 12.1 | 1,996.1 | 39.2 | 298.3 | 24.2 | 225.0 | 30.3 | n/a | 6.3 | ||||||||||||||||||||||||||||||
| Average EBITDA of Past Three Years | 277.6 | 33.2 | 1,997.3 | 21.5 | 153.1 | 29.6 | 184.1 | 18.5 | 4.1 | 7.6 | ||||||||||||||||||||||||||||||
| Growth 2011-2012 | 15.7 | % | -42.5 | % | -37.4 | % | 26.9 | % | 74.7 | % | -14.9 | % | 2.1 | % | -4.1 | % | -36.6 | % | 63.8 | % | ||||||||||||||||||||
| Growth 2010-2012 | 19.8 | % | -33.3 | % | -23.6 | % | 32.3 | % | 101.8 | % | 5.6 | % | 8.9 | % | 8.8 | % | 50.0 | % | -29.7 | % | ||||||||||||||||||||
| Growth 2012-2013 | -6.0 | % | -38.4 | % | 36.1 | % | 18.1 | % | 3.1 | % | -9.5 | % | 8.4 | % | 39.8 | % | 81.5 | % | -16.3 | % | ||||||||||||||||||||
| Growth 2012-2014 | -4.8 | % | -22.1 | % | �� | 19.8 | % | 19.7 | % | 8.7 | % | -8.5 | % | 7.2 | % | 25.5 | % | n/a | -0.2 | % | ||||||||||||||||||||
Appendix A
Page 13
| EMTEC, INC. | |||||||||||||
| VALUATION ANALYSIS | |||||||||||||
| As of April 30, 2013 | |||||||||||||
| Guideline Public Company Analysis | |||||||||||||
| Valuation Multiples | |||||||||||||
| CACI International Inc | NCI, Inc. | Computer Sciences Corp | Computer Task Group Inc | Igate Corp | Dynamics Research Corp | Insight Enterprises Inc | Hackett Group Inc/The | Edgewater Technology Inc | Emetec, Inc. | |||||||||||||||||||||||||||||||||||
| EBITDA Multiples | ||||||||||||||||||||||||||||||||||||||||||||
| Average Prior Three Years | 7.2 | 2.2 | 3.8 | 16.2 | 12.4 | 5.0 | 3.9 | 8.5 | 6.9 | 6.7 | ||||||||||||||||||||||||||||||||||
| Fiscal Year 2012 | 5.6 | 3.6 | 5.5 | 12.7 | 7.5 | 5.2 | 3.7 | 8.2 | 7.0 | 8.1 | ||||||||||||||||||||||||||||||||||
| LTM | 5.9 | 3.6 | 4.2 | 12.5 | 7.6 | 5.2 | 3.7 | 8.2 | 7.4 | 8.3 | ||||||||||||||||||||||||||||||||||
| Projected 2013 | 6.0 | 5.9 | 4.0 | 10.8 | 7.3 | 5.7 | 3.4 | 5.9 | 3.8 | 9.7 | ||||||||||||||||||||||||||||||||||
| Projected 2014 | 6.2 | 5.9 | 3.8 | 8.9 | 6.4 | 6.1 | 3.2 | 5.2 | n/a | 8.2 | ||||||||||||||||||||||||||||||||||
| Percentage of Debt in Capital Structure | 35 | % | 24 | % | 27 | % | 0 | % | 45 | % | 60 | % | 9 | % | 14 | % | 0 | % | ||||||||||||||||||||||||||
| Percentage of Equity in Capital Structure | 65 | % | 76 | % | 73 | % | 100 | % | 55 | % | 40 | % | 91 | % | 86 | % | 100 | % | ||||||||||||||||||||||||||
| Size Risk Premium Difference | 6.9 | % | 0.0 | % | 8.2 | % | 5.4 | % | 6.9 | % | 0.0 | % | 5.8 | % | 0.0 | % | 0.0 | % | ||||||||||||||||||||||||||
| mean | median | |||||||||||||||||||||||||||||||||||||||||||
| Size Risk Adjusted EBITDA Multiples | ||||||||||||||||||||||||||||||||||||||||||||
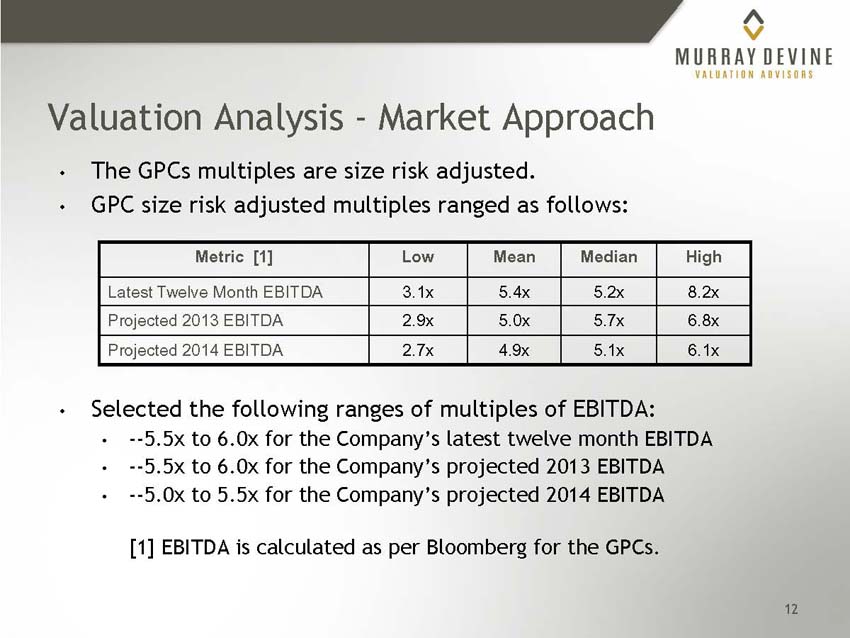
| Average Prior Three Years | 5.4 | 2.2 | 3.1 | 8.7 | 8.4 | 5.0 | 3.3 | 8.5 | 6.9 | 5.7 | 5.4 | |||||||||||||||||||||||||||||||||
| Fiscal Year 2012 | 4.5 | 3.6 | 4.1 | 7.6 | 5.8 | 5.2 | 3.1 | 8.2 | 7.0 | 5.5 | 5.2 | |||||||||||||||||||||||||||||||||
| LTM | 4.7 | 3.6 | 3.4 | 7.5 | 5.9 | 5.2 | 3.1 | 8.2 | 7.4 | 5.4 | 5.2 | |||||||||||||||||||||||||||||||||
| Projected 2013 | 4.7 | 5.9 | 3.2 | 6.8 | 5.7 | 5.7 | 2.9 | 5.9 | 3.8 | 5.0 | 5.7 | |||||||||||||||||||||||||||||||||
| Projected 2014 | 4.8 | 5.9 | 3.1 | 6.0 | 5.1 | 6.1 | 2.7 | 5.2 | n/a | 4.9 | 5.1 | |||||||||||||||||||||||||||||||||
Appendix A
Page 14
| EMTEC, INC. | ||||||||||||||
| VALUATION ANALYSIS | ||||||||||||||
| As of April 30, 2013 | ||||||||||||||
| Guideline Public Company Analysis | ||||||||||||||
| Implied Market Growth Rate Analysis | ||||||||||||||
| CACI International Inc | NCI, Inc. | Computer Sciences Corp | Computer Task Group Inc | Igate Corp | Dynamics Research Corp | Insight Enterprises Inc | Hackett Group Inc/The | Edgewater Technology Inc | |||||||||||||||||||||||||||||||||||||
| Beta | 0.93 | 0.97 | 1.09 | 1.14 | 0.99 | 0.83 | 1.22 | 1.06 | 0.78 | ||||||||||||||||||||||||||||||||||||
| Risk-Free Rate | 2.5 | % | 2.5 | % | 2.5 | % | 2.5 | % | 2.5 | % | 2.5 | % | 2.5 | % | 2.5 | % | 2.5 | % | |||||||||||||||||||||||||||
| Market Risk Premium | 6.1 | % | 6.1 | % | 6.1 | % | 6.1 | % | 6.1 | % | 6.1 | % | 6.1 | % | 6.1 | % | 6.1 | % | |||||||||||||||||||||||||||
Size Premium 6.0% | 1.7 | % | 6.0 | % | 0.9 | % | 2.7 | % | 1.7 | % | 6.0 | % | 2.5 | % | 6.0 | % | 6.0 | % | |||||||||||||||||||||||||||
| Cost of Equity | 9.9 | % | 14.5 | % | 10.1 | % | 12.2 | % | 10.3 | % | 13.6 | % | 12.4 | % | 15.0 | % | 13.3 | % | |||||||||||||||||||||||||||
| Cost of Debt | 2.3 | % | 3.7 | % | 1.9 | % | 0.0 | % | 2.5 | % | 1.9 | % | 2.3 | % | 2.7 | % | 0.0 | % | |||||||||||||||||||||||||||
| After-Tax Cost of Debt | 1.4 | % | 2.3 | % | 1.2 | % | 0.0 | % | 1.9 | % | 1.2 | % | 1.5 | % | 1.7 | % | 0.0 | % | |||||||||||||||||||||||||||
| % Equity in Capital Structure | 65.5 | % | 75.9 | % | 73.2 | % | 100.0 | % | 54.8 | % | 40.1 | % | 90.8 | % | 85.7 | % | 100.0 | % | |||||||||||||||||||||||||||
| % Debt in Capital Structure | 34.5 | % | 24.1 | % | 26.8 | % | 0.0 | % | 45.2 | % | 59.9 | % | 9.2 | % | 14.3 | % | 0.0 | % | |||||||||||||||||||||||||||
| Mean | Median | ||||||||||||||||||||||||||||||||||||||||||||
| Weighted Cost of Capital | 7.0 | % | 11.5 | % | 7.7 | % | 12.2 | % | 6.5 | % | 6.2 | % | 11.4 | % | 13.1 | % | 13.3 | % | 9.9% | 11.4% | |||||||||||||||||||||||||
| FYE EBITDA | $ | 355.8 | $ | 20.0 | $ | 1,390.0 | $ | 27.4 | $ | 252.6 | $ | 28.9 | $ | 195.6 | $ | 19.2 | $ | 4.1 | |||||||||||||||||||||||||||
| FYE Depreciation/Amortization | 56.0 | 6.9 | n/a | 2.9 | 46.4 | 8.0 | 41.2 | 2.6 | 1.8 | ||||||||||||||||||||||||||||||||||||
| Net Operating Profit | 299.8 | 13.0 | 1,390.0 | 24.5 | 206.3 | 20.9 | 154.5 | 16.6 | 2.3 | ||||||||||||||||||||||||||||||||||||
| Tax Rate | 39.0 | % | 38.0 | % | 38.0 | % | 36.5 | % | 23.4 | % | 38.0 | % | 35.9 | % | 38.0 | % | 21.7 | % | |||||||||||||||||||||||||||
| Taxes | 116.9 | 5.0 | 528.2 | 8.9 | 48.2 | 7.9 | 55.4 | 6.3 | 0.5 | ||||||||||||||||||||||||||||||||||||
| Net Operating Profit After-Tax (NOPAT) | $ | 182.9 | $ | 8.1 | $ | 861.8 | $ | 15.5 | $ | 158.1 | $ | 13.0 | $ | 99.0 | $ | 10.3 | $ | 1.8 | |||||||||||||||||||||||||||
| Total Company Value | $ | 2,001.0 | $ | 72.0 | $ | 7,639.6 | $ | 348.8 | $ | 1,898.6 | $ | 148.9 | $ | 721.8 | $ | 158.1 | $ | 28.5 | |||||||||||||||||||||||||||
| NOPAT Multiple | 10.9 | 8.9 | 8.9 | 22.4 | 12.0 | 11.5 | 7.3 | 15.3 | 16.0 | ||||||||||||||||||||||||||||||||||||
| Implied Market Capitalization Rate | 9.1 | % | 11.2 | % | 11.3 | % | 4.5 | % | 8.3 | % | 8.7 | % | 13.7 | % | 6.5 | % | 6.3 | % | |||||||||||||||||||||||||||
| Weighted Cost of Capital | 7.0 | % | 11.5 | % | 7.7 | % | 12.2 | % | 6.5 | % | 6.2 | % | 11.4 | % | 13.1 | % | 13.3 | % | |||||||||||||||||||||||||||
| Mean | Median | ||||||||||||||||||||||||||||||||||||||||||||
| Implied Market Growth Rate | -2.2 | % | 0.3 | % | -3.6 | % | 7.7 | % | -1.8 | % | -2.5 | % | -2.3 | % | 6.6 | % | 7.1 | % | 1.0% | -1.8% | |||||||||||||||||||||||||
Appendix A
Page 15
| EMTEC, INC. | ||||||||||||||
| VALUATION ANALYSIS | ||||||||||||||
| As of April 30, 2013 | ||||||||||||||
Guideline Public Company Analysis | ||||||||||||||
Risk Analysis | ||||||||||||||
| CACI International Inc | NCI, Inc. | Computer Sciences Corp | Computer Task Group Inc | Igate Corp | Dynamics Research Corp | Insight Enterprises Inc | Hackett Group Inc/The | Edgewater Technology Inc | |||||||||||||||||||||||||||||||
| Market Price per Common Share | $ | 58.09 | $ | 4.27 | $ | 46.37 | 20.13 | $ | 16.75 | $ | 5.68 | $ | 17.79 | $ | 4.83 | $ | 4.14 | ||||||||||||||||||||||
| Shares Outstanding | 22.955 | 12.932 | 155.028 | 18.857 | 57.614 | 10.524 | 44.594 | 31.064 | 10.897 | ||||||||||||||||||||||||||||||
| Stock Market Capitalization | $ | 1,333.5 | $ | 55.2 | $ | 7,188.6 | 379.6 | $ | 965.0 | $ | 59.8 | $ | 793.3 | $ | 150.0 | $ | 45.1 | ||||||||||||||||||||||
| Long-Term Debt | 702.7 | 17.5 | 2,629.0 | 0.0 | 1,115.5 | 89.1 | 80.6 | 25.0 | 0.0 | ||||||||||||||||||||||||||||||
| Preferred Stock | 0.0 | 0.0 | 0.0 | 0.0 | 386.1 | 0.0 | 0.0 | 0.0 | 0.0 | ||||||||||||||||||||||||||||||
| Total Capitalization | $ | 2,036.2 | $ | 72.7 | $ | 9,817.6 | 379.6 | $ | 2,466.6 | $ | 148.9 | $ | 873.9 | $ | 175.0 | $ | 45.1 | ||||||||||||||||||||||
| Ratio of Debt/Preferred to Total Capital | 34.5 | % | 24.1 | % | 26.8 | % | 0.0 | % | 60.9 | % | 59.9 | % | 9.2 | % | 14.3 | % | 0.0 | % | |||||||||||||||||||||
| Beta | 0.93 | 0.97 | 1.09 | 1.14 | 0.99 | 0.83 | 1.22 | 1.06 | 0.78 | ||||||||||||||||||||||||||||||
| Tax Rate | 39.0 | % | 38.0 | % | 38.0 | % | 36.5 | % | 23.4 | % | 38.0 | % | 35.9 | % | 38.0 | % | 21.7 | % | |||||||||||||||||||||
| Mean | Median | ||||||||||||||||||||||||||||||||||||||
| Business Risk Index | 0.70 | 0.81 | 0.89 | 1.14 | 0.45 | 0.43 | 1.15 | 0.96 | 0.78 | 0.81 | 0.81 | ||||||||||||||||||||||||||||
| Financial Risk Index | 0.23 | 0.16 | 0.20 | 0.00 | 0.54 | 0.40 | 0.07 | 0.10 | 0.00 | ||||||||||||||||||||||||||||||
Appendix A
Page 16
| EMTEC, INC. | ||||||||||||||
| VALUATION ANALYSIS | ||||||||||||||
| As of April 30, 2013 | ||||||||||||||
Market Approach | ||||||||||||||
Guideline Public Company Multiple Valuation | ||||||||||||||
In Millions
| Multiple of EBITDA | Lower | Higher | |||||||
| LTM | $ | 7.1 | $ | 7.1 | |||||
| Selected Multiple | 5.50 | x | 6.00 | x | |||||
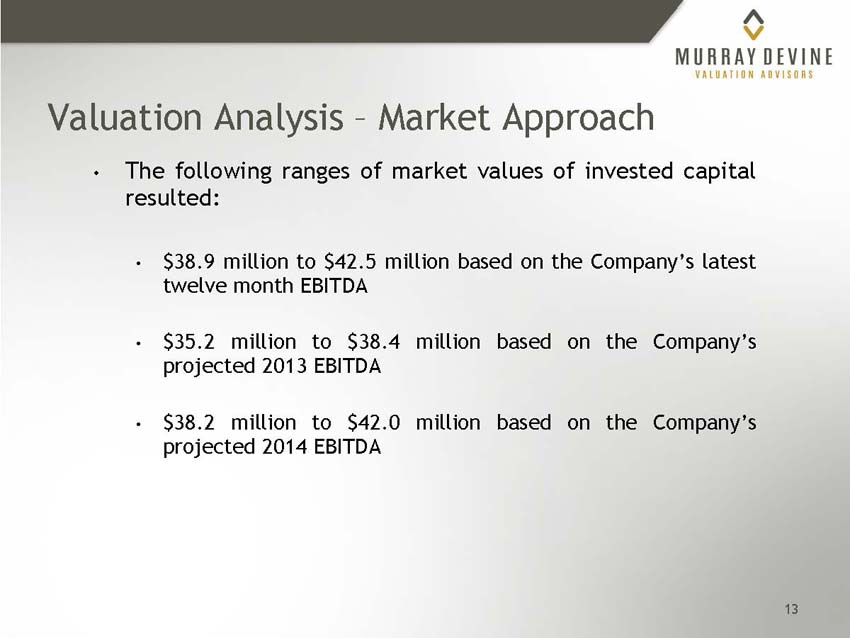
| Market Value of Invested Capital | $ | 38.9 | $ | 42.5 | |||||
| FY 2013P | $ | 6.4 | $ | 6.4 | |||||
| Selected Multiple | 5.50 | x | 6.00 | x | |||||
| Market Value of Invested Capital | $ | 35.2 | $ | 38.4 | |||||
| FY 2014P | $ | 7.6 | $ | 7.6 | |||||
| Selected Multiple | 5.00 | x | 5.50 | x | |||||
| Market Value of Invested Capital | $ | 38.2 | $ | 42.0 | |||||
Appendix A
Page 17
| EMTEC, INC. | ||||||||||||||
| VALUATION ANALYSIS | ||||||||||||||
| As of April 30, 2013 | ||||||||||||||
Income Approach | ||||||||||||||
Calculation of Free Cash Flow | ||||||||||||||
In Millions
| Fiscal Year End August 31, | 2013 | 2014 | 2015 | 2016 | 2017 | 2018 | Perpetuity | |||||||||||||||||||||
| Net Revenues | $ | 134.4 | $ | 141.3 | $ | 145.7 | $ | 150.0 | $ | 155.3 | $ | 160.3 | $ | 165.9 | ||||||||||||||
| EBITDA | 6.4 | 7.6 | 7.7 | 8.2 | 9.1 | 9.9 | 10.3 | |||||||||||||||||||||
| Depreciation [1] | 2.2 | 1.3 | 0.6 | 0.6 | 0.6 | 0.6 | 0.8 | |||||||||||||||||||||
| Operating Income | 4.2 | 6.3 | 7.1 | 7.7 | 8.5 | 9.3 | 9.5 | |||||||||||||||||||||
| Income Tax Rate | 35.0 | % | 35.0 | % | 35.0 | % | 35.0 | % | 35.0 | % | 35.0 | % | 35.0 | % | ||||||||||||||
| Income Taxes | 1.5 | 2.2 | 2.5 | 2.7 | 3.0 | 3.3 | 3.3 | |||||||||||||||||||||
| After-Tax Operating Income | 2.7 | 4.1 | 4.6 | 5.0 | 5.5 | 6.0 | 6.1 | |||||||||||||||||||||
| Add: Depreciation | 2.2 | 1.3 | 0.6 | 0.6 | 0.6 | 0.6 | 0.8 | |||||||||||||||||||||
| Less: Capital Expenditures | (0.6 | ) | (0.7 | ) | (0.7 | ) | (0.7 | ) | (0.8 | ) | (0.8 | ) | (0.8 | ) | ||||||||||||||
| Less: Incremental Working Capital [2] [3] | (0.0 | ) | 0.2 | (1.0 | ) | 0.3 | (2.4 | ) | 0.5 | (0.3 | ) | |||||||||||||||||
| Free Cash Flow | $ | 4.3 | $ | 5.0 | $ | 3.5 | $ | 5.1 | $ | 3.0 | $ | 6.4 | $ | 5.9 | ||||||||||||||
| Footnote(s): | ||||||||
| [1] Tax benefit of tax amortization calculated separately and added to concluded MVIC. | ||||||||
| [2] 2013 and perpetuity incremental WC based on projected average of 4.9% of revenues. | ||||||||
| [3] Increase in working capital use of cash in 2015 and 2017 due to business mix - move into services = higher payables burden than hardware. | ||||||||
Appendix A
Page 18
| EMTEC, INC. | ||||||||||||||
| VALUATION ANALYSIS | ||||||||||||||
| As of April 30, 2013 | ||||||||||||||
Income Approach | ||||||||||||||
Discounted Free Cash Flow Valuation | ||||||||||||||
In Millions
| Business Risk Index | 0.90 | ||||||||||||||||||||||||||||
| Risk-Free Rate | 2.5 | % | |||||||||||||||||||||||||||
| Market Risk Premium | 6.1 | % | |||||||||||||||||||||||||||
| Size Risk Premium | 6.0 | % | |||||||||||||||||||||||||||
| Specific Risk Premium | 5.0 | % | |||||||||||||||||||||||||||
| Perpetuity Growth Rate | 3.5 | % | |||||||||||||||||||||||||||
| Tax Rate | 35.0 | % | |||||||||||||||||||||||||||
| Unlevered Cost of Equity | 19.0 | % | |||||||||||||||||||||||||||
| Fiscal Year End August 31, | 2013 | 2014 | 2015 | 2016 | 2017 | 2018 | Perpetuity | ||||||||||||||||||||||
| Free Cash Flow | $ | 4.3 | $ | 5.0 | $ | 3.5 | $ | 5.1 | $ | 3.0 | $ | 6.4 | $ | 5.9 | |||||||||||||||
| Pro-Rata Adjustment Factor | 34 | % | 100 | % | 100 | % | 100 | % | 100 | % | 100 | % | 100 | % | |||||||||||||||
| Pro-Rata Free Cash Flow | $ | 1.4 | $ | 5.0 | $ | 3.5 | $ | 5.1 | $ | 3.0 | $ | 6.4 | $ | 5.9 | |||||||||||||||
| % Debt Capital | 66 | % | 53 | % | 38 | % | 25 | % | 17 | % | 25 | % | 25 | % | |||||||||||||||
| % Common Capital | 34 | % | 47 | % | 62 | % | 75 | % | 83 | % | 75 | % | 75 | % | |||||||||||||||
| After-Tax Cost of Debt | 6.1 | % | 6.0 | % | 6.4 | % | 7.5 | % | 6.8 | % | 7.8 | % | 7.8 | % | |||||||||||||||
| Levered Cost of Common | 25.9 | % | 23.0 | % | 21.3 | % | 20.2 | % | 19.8 | % | 20.2 | % | 20.2 | % | |||||||||||||||
| WEIGHTED COST OF CAPITAL | 12.9 | % | 14.1 | % | 15.5 | % | 17.0 | % | 17.5 | % | 17.1 | % | 17.1 | % | |||||||||||||||
| Years Remaining in 1st Period | 0.34 | ||||||||||||||||||||||||||||
| Years to Discount | 0.17 | 0.84 | 1.84 | 2.84 | 3.84 | 4.84 | 4.84 | ||||||||||||||||||||||
| PV Factor | 0.9798 | 0.8989 | 0.7830 | 0.6732 | 0.5740 | 0.4893 | 0.4893 | ||||||||||||||||||||||
| PV of Free Cash Flow | $ | 1.4 | $ | 4.5 | $ | 2.8 | $ | 3.5 | $ | 1.7 | $ | 3.2 | |||||||||||||||||
| Perpetuity Value | $ | 43.1 | |||||||||||||||||||||||||||
| PV of Perpetuity | $ | 21.1 | |||||||||||||||||||||||||||
| Total PV of Cash Flows | 38.1 | ||||||||||||||||||||||||||||
| Add: PV of Tax Amortization | 1.7 | ||||||||||||||||||||||||||||
| Market Value of Invested Capital | $ | 39.8 | |||||||||||||||||||||||||||
| Specific Risk Premium | |||||||||||||||||||||||||||||
| $ | 39.8 | 3.0% | 4.0% | 5.0% | 6.0% | 7.0% | |||||||||||||||||||||||
| Perpetuity Growth | 4.00% | 45.3 | 42.8 | 40.6 | 38.6 | 36.8 | |||||||||||||||||||||||
| 3.75% | 44.7 | 42.3 | 40.2 | 38.2 | 36.5 | ||||||||||||||||||||||||
| 3.50% | 44.2 | 41.9 | 39.8 | 37.9 | 36.2 | ||||||||||||||||||||||||
| 3.25% | 43.7 | 41.5 | 39.4 | 37.6 | 35.9 | ||||||||||||||||||||||||
| 3.00% | 43.3 | 41.1 | 39.1 | 37.3 | 35.7 | ||||||||||||||||||||||||
Appendix A
Page 19
| EMTEC, INC. | ||||||||||||||
| VALUATION ANALYSIS | ||||||||||||||
| As of April 30, 2013 | ||||||||||||||
PROJECTED CAPITAL STRUCTURE | ||||||||||||||
Dollars in Millions
| 2013 | 2014 | 2015 | 2016 | 2017 | 2018 | |||||||||||||||||||
| Adjusted EBITDA | $ | 6.4 | $ | 7.6 | $ | 7.7 | $ | 8.2 | $ | 9.1 | $ | 9.9 | ||||||||||||
| Multiple | 6.00 | 6.00 | 6.00 | 6.00 | 6.00 | 6.00 | ||||||||||||||||||
| Total Capital Value | $ | 38.4 | $ | 38.4 | $ | 46.1 | $ | 49.5 | $ | 54.7 | $ | 59.6 | ||||||||||||
| Line of Credit | 8.5 | 7.1 | 4.9 | 0.8 | 1.9 | 0.0 | ||||||||||||||||||
| Contingent Acquisition Liabilities | 3.9 | 0.1 | (0.5 | ) | (0.5 | ) | (0.5 | ) | (0.5 | ) | ||||||||||||||
| Long Term Debt | 12.8 | 13.0 | 13.3 | 12.0 | 8.0 | 4.0 | ||||||||||||||||||
| Capital Leases | 0.1 | 0.0 | 0.0 | 0.0 | 0.0 | 0.0 | ||||||||||||||||||
| Total Debt | 25.2 | 20.2 | 17.7 | 12.3 | 9.4 | 3.5 | ||||||||||||||||||
| Common Equity Value | $ | 13.1 | $ | 18.1 | $ | 28.4 | $ | 37.2 | $ | 45.2 | $ | 56.1 | ||||||||||||
| CAPITALIZATION %: | ||||||||||||||||||||||||
| Debt | 65.8 | % | 52.8 | % | 38.5 | % | 24.8 | % | 17.3 | % | 5.9 | % | ||||||||||||
| Common Equity | 34.2 | % | 47.2 | % | 61.5 | % | 75.2 | % | 82.7 | % | 94.1 | % | ||||||||||||
| Total | 100.0 | % | 100.0 | % | 100.0 | % | 100.0 | % | 100.0 | % | 100.0 | % | ||||||||||||
| Line of Credit Interest Rate | 4.25 | % | 4.25 | % | 4.25 | % | 4.25 | % | 4.25 | % | 4.25 | % | ||||||||||||
| Long Term Debt Interest Rate | 12.00 | % | 12.00 | % | 12.00 | % | 12.00 | % | 12.00 | % | 12.00 | % | ||||||||||||
| % Line of Credit | 33.6 | % | 34.9 | % | 27.6 | % | 6.3 | % | 20.5 | % | 0.0 | % | ||||||||||||
| % Contingent Acquisition Liabilities | 15.6 | % | 0.7 | % | -2.8 | % | -4.1 | % | -5.3 | % | -14.2 | % | ||||||||||||
| % Long Term Debt | 50.5 | % | 64.4 | % | 75.2 | % | 97.7 | % | 84.8 | % | 114.2 | % | ||||||||||||
| % Capital Leases | 0.3 | % | 0.0 | % | 0.0 | % | 0.0 | % | 0.0 | % | 0.0 | % | ||||||||||||
| Weighted Average Pre-Tax Interest | 9.4 | % | 9.3 | % | 9.9 | % | 11.5 | % | 10.4 | % | 12.0 | % | ||||||||||||
| After-Tax Interest Rate | 6.1 | % | 6.0 | % | 6.4 | % | 7.5 | % | 6.8 | % | 7.8 | % | ||||||||||||
Appendix A
Page 20
| EMTEC, INC. | ||||||||||||||
| VALUATION ANALYSIS | ||||||||||||||
| As of April 30, 2013 | ||||||||||||||
Tax Benefit Of Amortization | ||||||||||||||
In Millions
| Year | Amortization | Tax Benefit | Discount Rate | Time to Discount | PV Factor | PV | ||||||||||||||||||||
| 2013 | $ | 0.8 | $ | 0.3 | 12.9 | % | 0.1685 | 0.9798 | $ | 0.3 | ||||||||||||||||
| 2014 | 0.8 | 0.3 | 14.1 | % | 0.8370 | 0.8957 | 0.3 | |||||||||||||||||||
| 2015 | 0.8 | 0.3 | 15.5 | % | 1.8370 | 0.7668 | 0.2 | |||||||||||||||||||
| 2016 | 0.8 | 0.3 | 17.0 | % | 2.8370 | 0.6398 | 0.2 | |||||||||||||||||||
| 2017 | 0.8 | 0.3 | 17.5 | % | 3.8370 | 0.5381 | 0.2 | |||||||||||||||||||
| 2018 | 0.8 | 0.3 | 17.1 | % | 4.8370 | 0.4657 | 0.1 | |||||||||||||||||||
| 2019 | 0.8 | 0.3 | 17.1 | % | 5.8370 | 0.3977 | 0.1 | |||||||||||||||||||
| 2020 | 0.8 | 0.3 | 17.1 | % | 6.8370 | 0.3395 | 0.1 | |||||||||||||||||||
| 2021 | 0.8 | 0.3 | 17.1 | % | 7.8370 | 0.2899 | 0.1 | |||||||||||||||||||
| 2022 | 0.8 | 0.3 | 17.1 | % | 8.8370 | 0.2475 | 0.1 | |||||||||||||||||||
| 2023 | 0.7 | 0.2 | 17.1 | % | 9.8370 | 0.2114 | 0.1 | |||||||||||||||||||
| 2024 | 0.5 | 0.2 | 17.1 | % | 10.8370 | 0.1805 | 0.0 | |||||||||||||||||||
| 2025 | 0.5 | 0.2 | 17.1 | % | 11.8370 | 0.1541 | 0.0 | |||||||||||||||||||
| 2026 | 0.2 | 0.1 | 17.1 | % | 12.8370 | 0.1316 | 0.0 | |||||||||||||||||||
| 2027 | - | - | 17.1 | % | 13.8370 | 0.1124 | - | |||||||||||||||||||
| Tax Benefit of Amortization | $ | 1.7 | ||||||||||||||||||||||||
Appendix A
Page 21