Fourth Quarter <br/>Investors’ Webcast<br/>January 30, 2007
Robert M. Amen
Robert M. Amen
Chairman and CEO
Douglas J. Wetmore

These slides contain forward looking information, which may be identified by terms such as “expect”, “may”, “anticipated”, “guidance”, “outlook” and similar terms and involve significant risks and uncertainties. Actual results may differ materially. Risks and uncertainties include general economic and business conditions; interest rates; the price, quality and availability of raw materials; our ability to achieve our business strategy and anticipated cost savings, profitability and growth targets; the impact of currency fluctuation or devaluation; uncertainties related to litigation; the impact of possible pension funding obligations and increased pension expense; and the effect of legal and regulatory proceedings and restrictions. We do not undertake to update or revise such forward-looking statements. These and other factors that could cause actual results to differ materially from such forward-looking statements are discussed in greater detail in our accompanying quarterly earnings release and in our SEC filings.
Forward Looking Statement
Non-GAAP Financial Measures
The Company uses certain non-GAAP financial measures to supplement our GAAP financial results. These financial measures should not be considered in isolation or as superior to our GAAP financial measures. Additional information concerning our non-GAAP financial measures and a reconciliation to GAAP is available on our website at http://www.iff.com, on the “Investor Relations” page.
Agenda
Highlights
Highlights
Analysis of 4th quarter & full year 2006 results
Closing comments
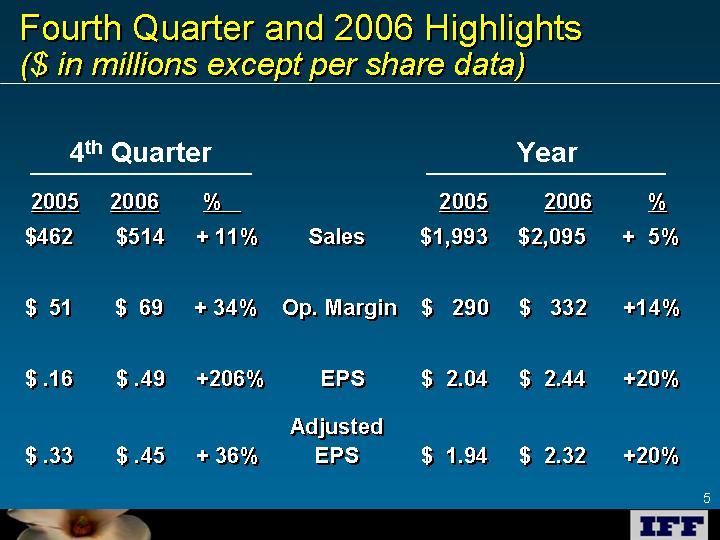
Fourth Quarter and 2006 Highlights <br/>($ in millions except per share data)
2005 2006 % 2005 2006 %
2005 2006 % 2005 2006 %
$462 $514 + 11% Sales $1,993 $2,095 + 5%
$ 51 $ 69 + 34% Op. Margin $ 290 $ 332 +14%
$ .16 $ .49 +206% EPS $ 2.04 $ 2.44 +20%
Adjusted
$ .33 $ .45 + 36% EPS $ 1.94 $ 2.32 +20%
4th Quarter
Year
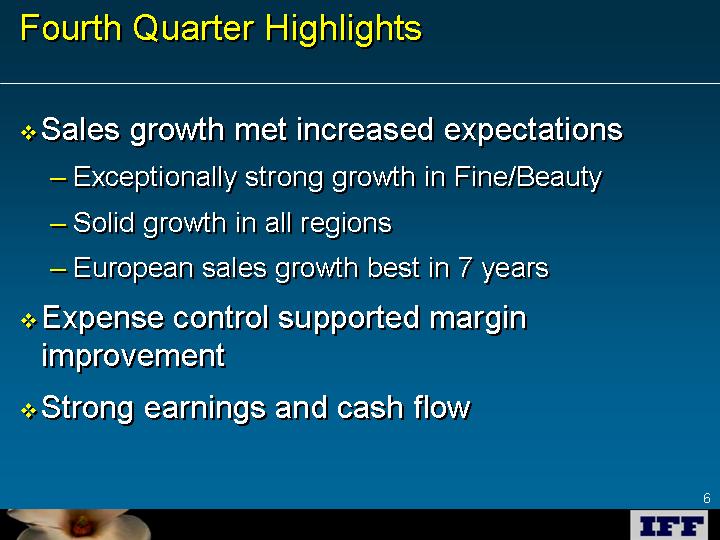
Fourth Quarter Highlights
Sales growth met increased expectations
Sales growth met increased expectations
Exceptionally strong growth in Fine/Beauty
Solid growth in all regions
European sales growth best in 7 years
Expense control supported margin improvement
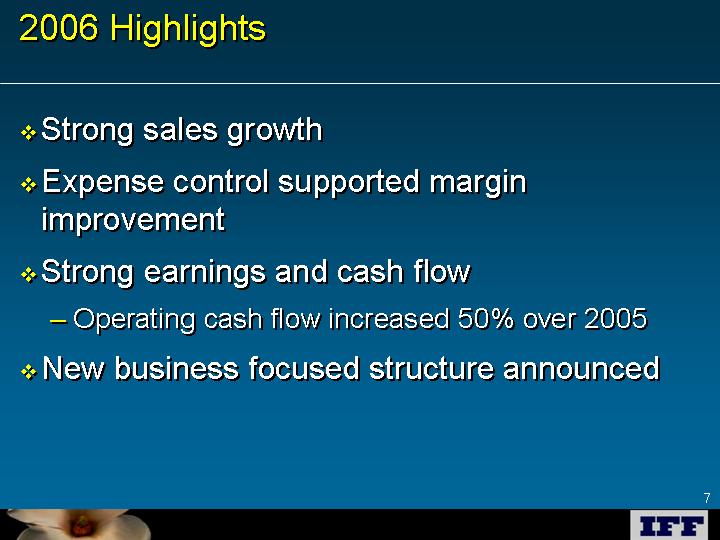
2006 Highlights
Strong sales growth
Strong sales growth
Expense control supported margin improvement
Strong earnings and cash flow
Operating cash flow increased 50% over 2005
Financial Review
Fourth Quarter 2006
Fourth Quarter 2006
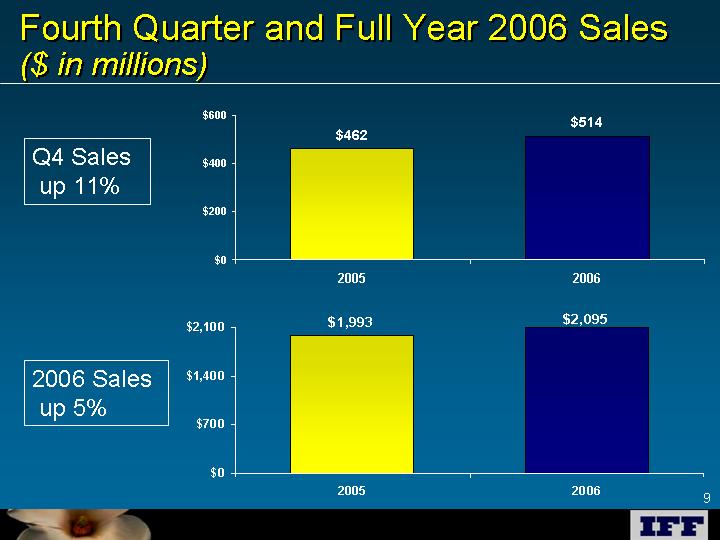
Fourth Quarter and Full Year 2006 Sales<br/>($ in millions)
Q4 Sales
Q4 Sales
2006 Sales
2006 Sales
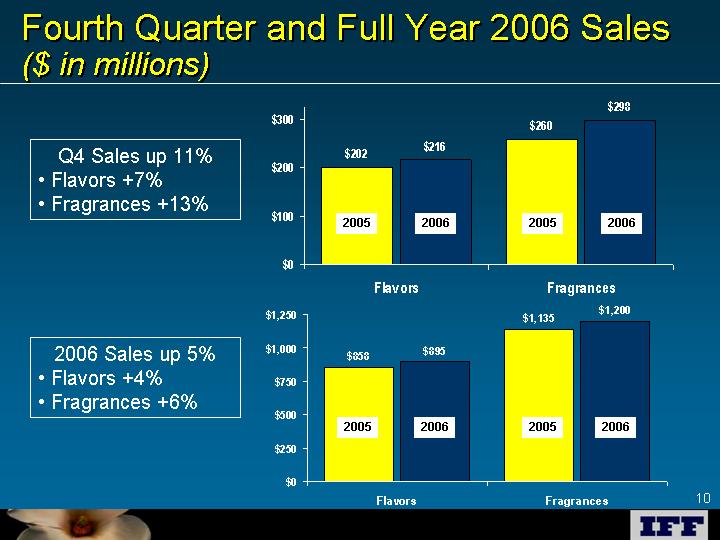
Fourth Quarter and Full Year 2006 Sales<br/>($ in millions)
2005
2006
2005
2006
Q4 Sales up 11%
Q4 Sales up 11%
Flavors +7%
2006 Sales up 5%
2006 Sales up 5%
Flavors +4%
2005
2006
2005
2006
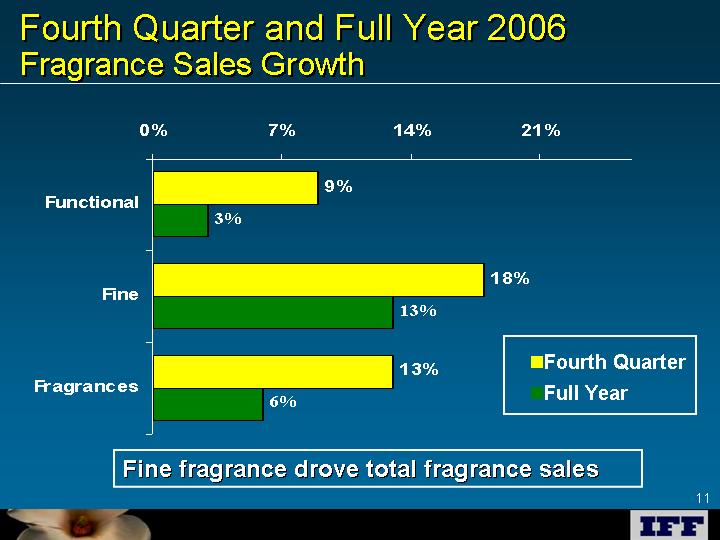
Fine fragrance drove total fragrance sales
Fourth Quarter and Full Year 2006<br/>Fragrance Sales Growth
Fourth Quarter
Full Year
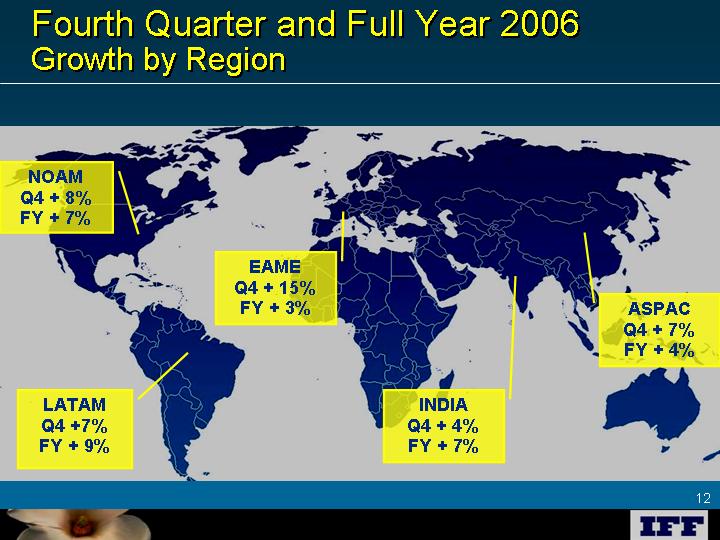
NOAM
NOAM
Q4 + 8%
LATAM
LATAM
Q4 +7%
ASPAC
ASPAC
Q4 + 7%
EAME
EAME
Q4 + 15%
INDIA
INDIA
Q4 + 4%
Fourth Quarter and Full Year 2006 <br/>Growth by Region
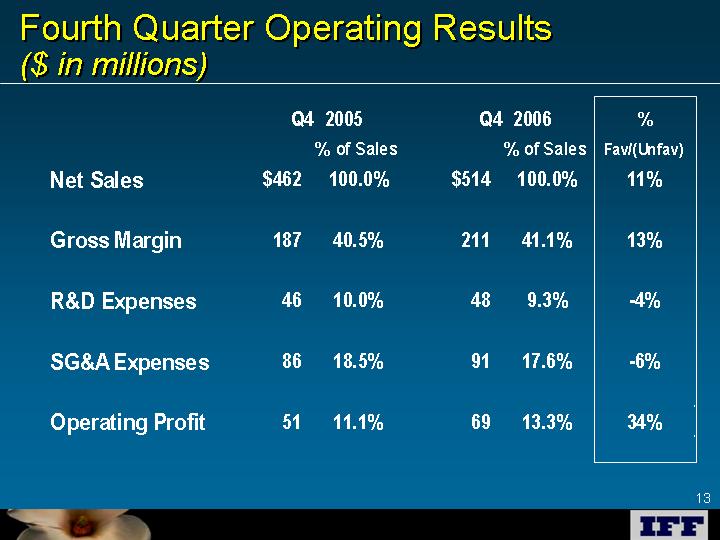
Fourth Quarter Operating Results <br/>($ in millions)

2006 Operating Results <br/>($ in millions)
2005
2005
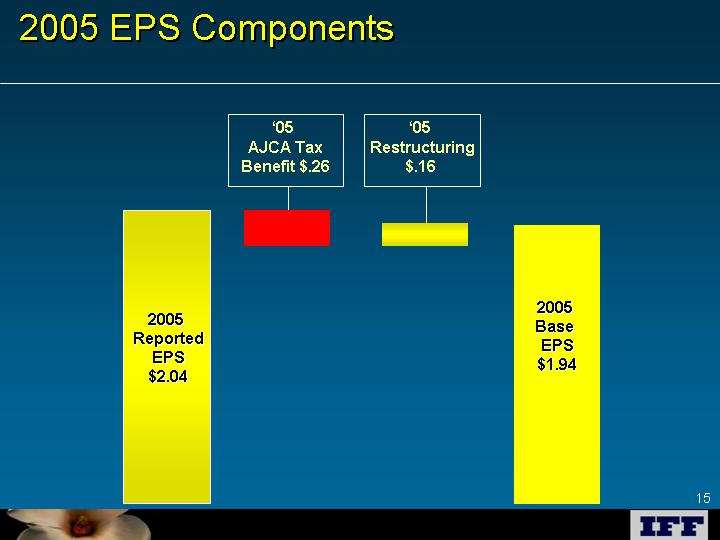
Base
EPS
2005 EPS Components
2005
2005
Reported
EPS
?05
?05
Restructuring
?05
?05
AJCA Tax
Sales
Sales
Growth
Other
Other
income
Tax
Tax
Rate
2006
2006
EPS
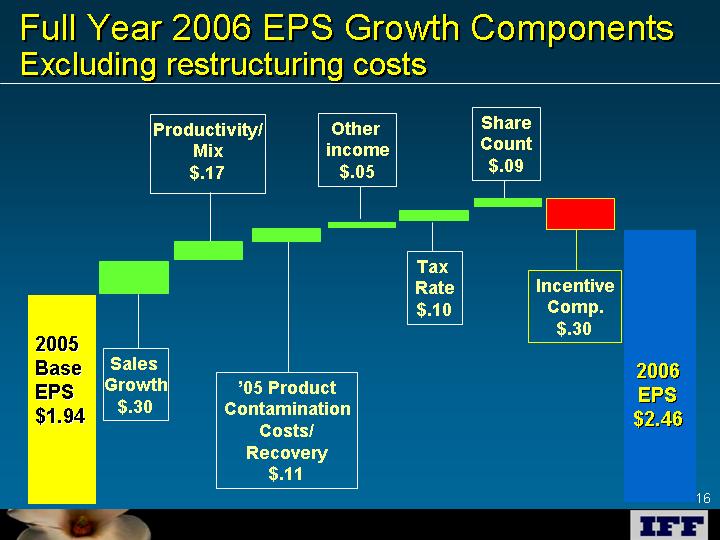
Full Year 2006 EPS Growth Components<br/>Excluding restructuring costs
Share
Share
Count
’05 Product
’05 Product
Contamination
Costs/
Recovery
2005
2005
Base
EPS
Incentive
Incentive
Comp.
Productivity/
Productivity/
Mix
Sales
Sales
Growth
Other
Other
income
Tax
Tax
Rate
2006
2006
EPS
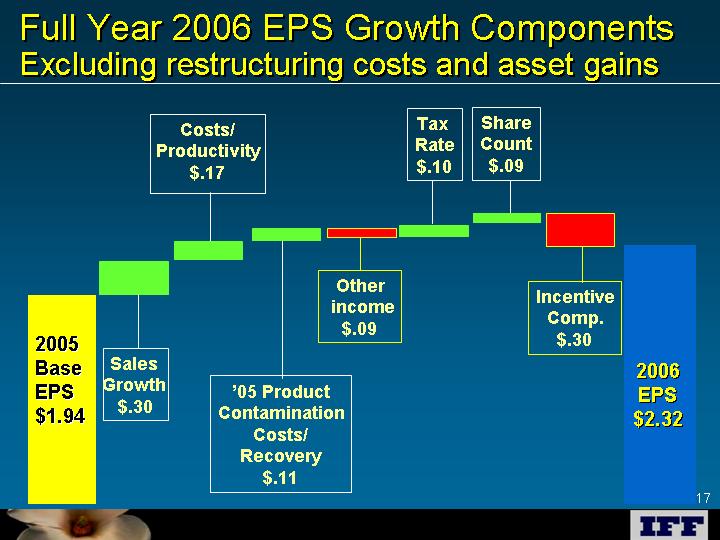
Full Year 2006 EPS Growth Components<br/>Excluding restructuring costs and asset gains
Share
Share
Count
’05 Product
’05 Product
Contamination
Costs/
Recovery
2005
2005
Base
EPS
Incentive
Incentive
Comp.
Costs/
Costs/
Productivity
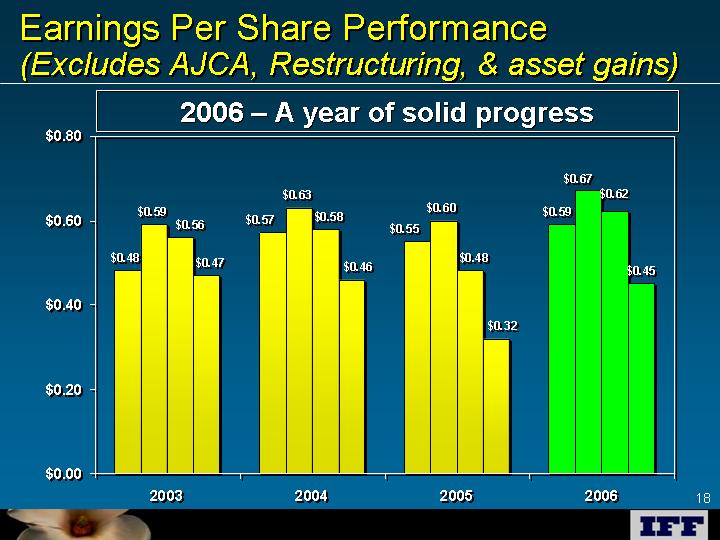
Earnings Per Share Performance (Excludes AJCA, Restructuring, & asset gains)
2006 – A year of solid progress
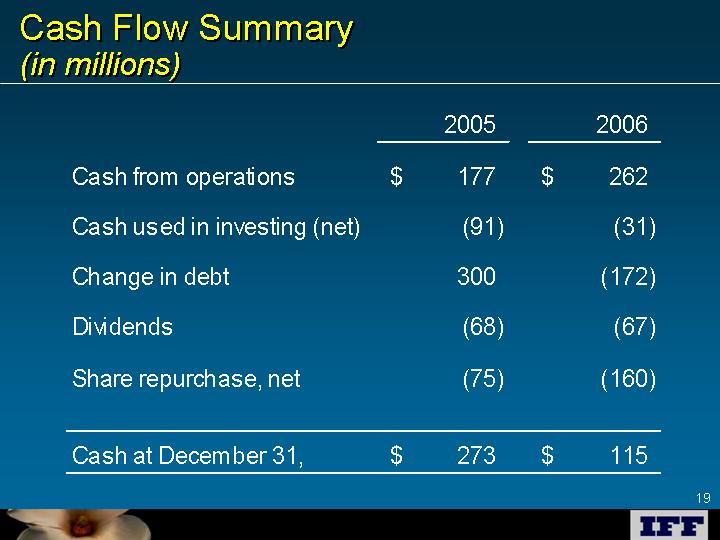
Cash Flow Summary<br/>(in millions)
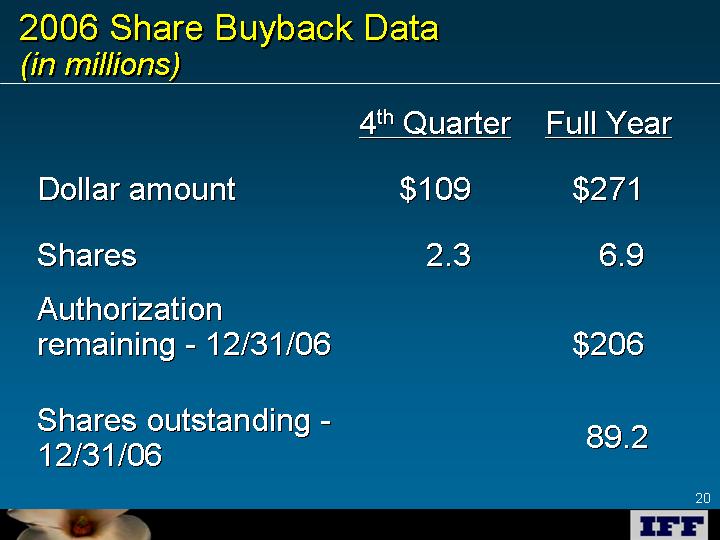
2006 Share Buyback Data <br/>(in millions)
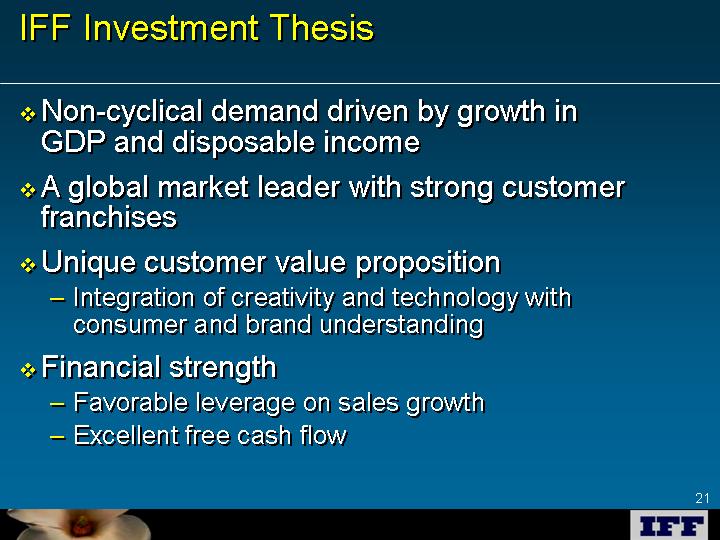
IFF Investment Thesis
Non-cyclical demand driven by growth in GDP and disposable income
Non-cyclical demand driven by growth in GDP and disposable income
A global market leader with strong customer franchises
Unique customer value proposition
Integration of creativity and technology with consumer and brand understanding
Financial strength
Favorable leverage on sales growth
Excellent free cash flow
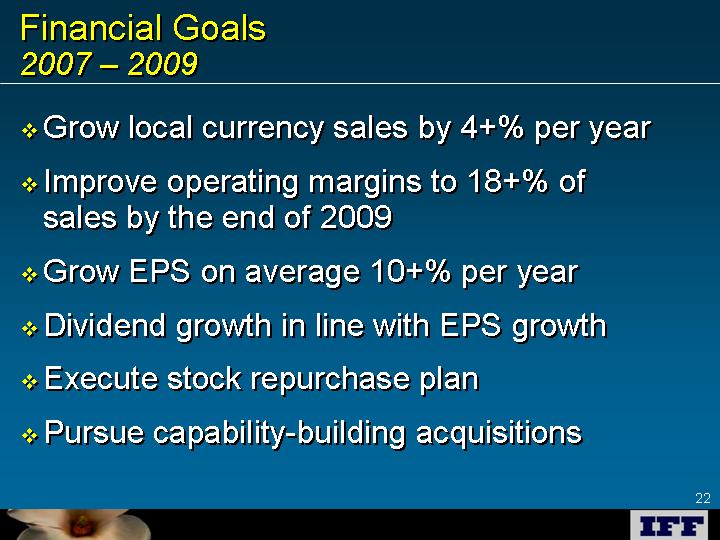
Financial Goals<br/>2007 – 2009
Grow local currency sales by 4+% per year
Grow local currency sales by 4+% per year
Improve operating margins to 18+% of sales by the end of 2009
Grow EPS on average 10+% per year
Dividend growth in line with EPS growth
Execute stock repurchase plan
Questions
Appendices
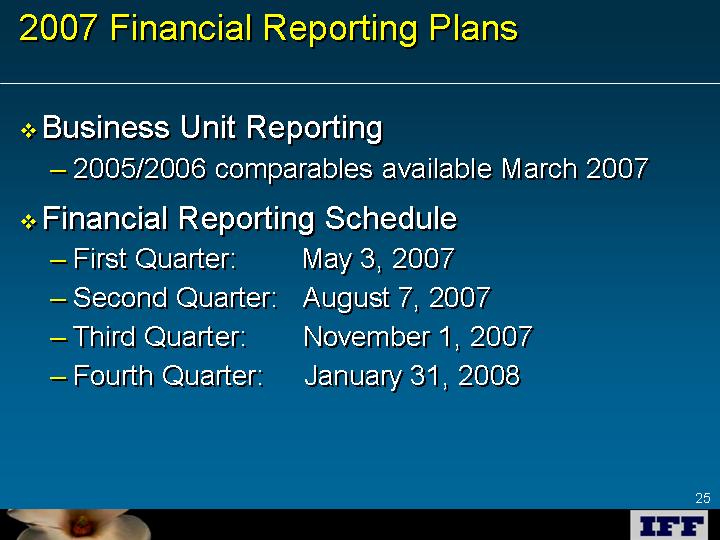
2007 Financial Reporting Plans
Business Unit Reporting
Business Unit Reporting
2005/2006 comparables available March 2007
Financial Reporting Schedule
First Quarter: May 3, 2007
Second Quarter: August 7, 2007
Third Quarter: November 1, 2007