Exhibit 99.1

Exhibit 99.1
Investor Day
2013
Operations
Francisco Fortanet
SVP, Operations
June 5, 2013
Operations Strategy
Reliable Service and Quality
#1 Priority is Customer Satisfaction
Reduce Cost and Optimize
Cash Flow
Productivity and Quality Agenda driven by Continuous Improvement
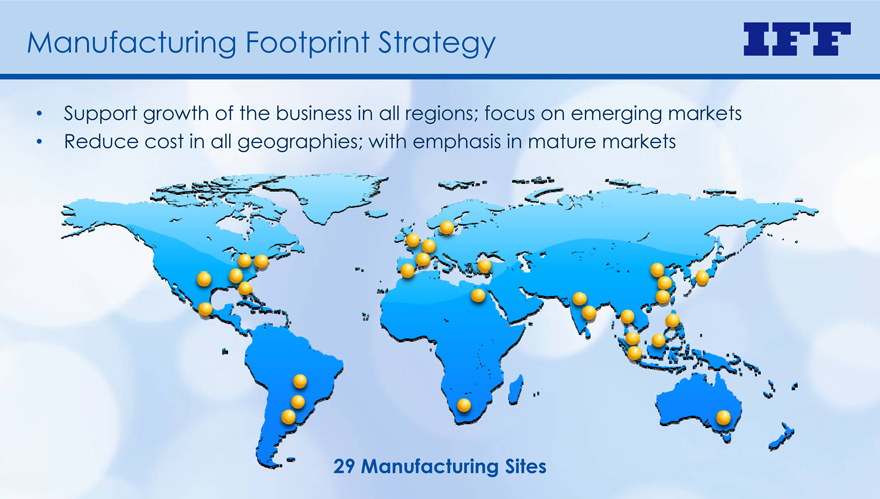
Manufacturing Footprint Strategy
Support growth of the business in all regions; focus on emerging markets
Reduce cost in all geographies; with emphasis in mature markets
29 Manufacturing Sites
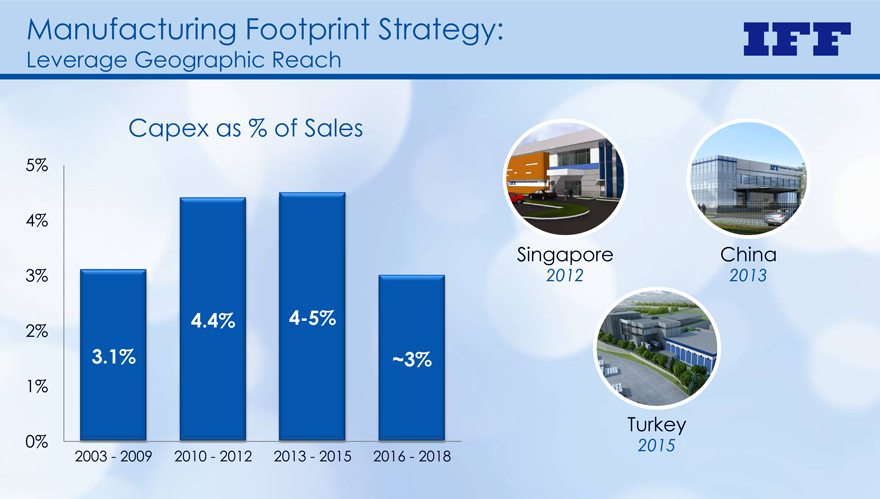
Manufacturing Footprint Strategy:
Leverage Geographic Reach
Capex as % of Sales
5%
4%
3%
2% 4.4% 4-5%
3.1% ~3%
1%
0%
2003 - 2009 2010 - 2012 2013 - 2015 2016 - 2018
Singapore
2012
China
2013
Turkey
2015
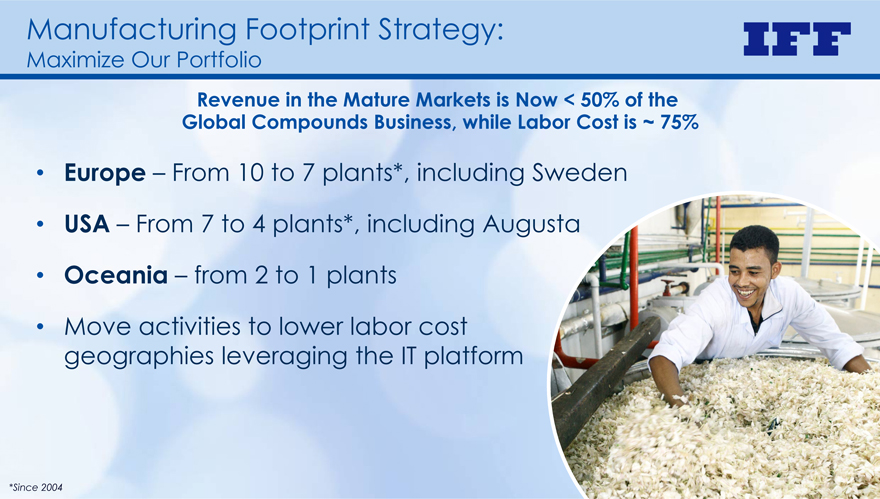
Manufacturing Footprint Strategy:
Maximize Our Portfolio
Revenue in the Mature Markets is Now < 50% of the Global Compounds Business, while Labor Cost is ~ 75%
Europe – From 10 to 7 plants*, including Sweden
USA – From 7 to 4 plants*, including Augusta
Oceania – from 2 to 1 plants
Move activities to lower labor cost geographies leveraging the IT platform
*Since 2004
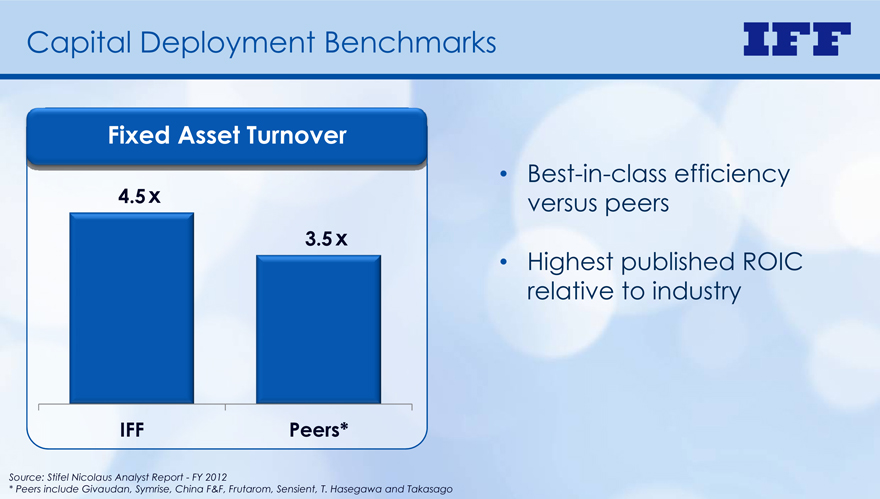
Capital Deployment Benchmarks
Fixed Asset Turnover
4.5 X
3.5 x
IFF Peers*
Best-in-class efficiency versus peers
Highest published ROIC relative to industry
Source: Stifel Nicolaus Analyst Report - FY 2012
* Peers include Givaudan, Symrise, China F&F, Frutarom, Sensient, T. Hasegawa and Takasago
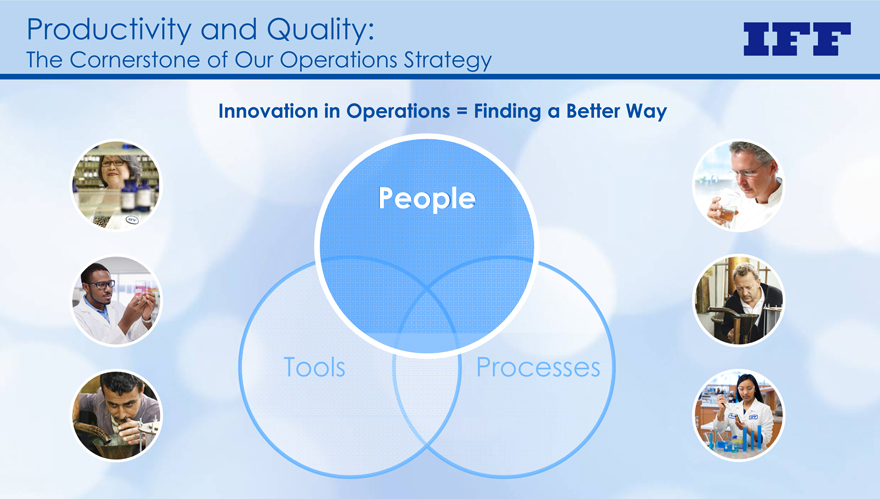
Productivity and Quality:
The Cornerstone of Our Operations Strategy
Innovation in Operations = Finding a Better Way
People
Tools
Processes
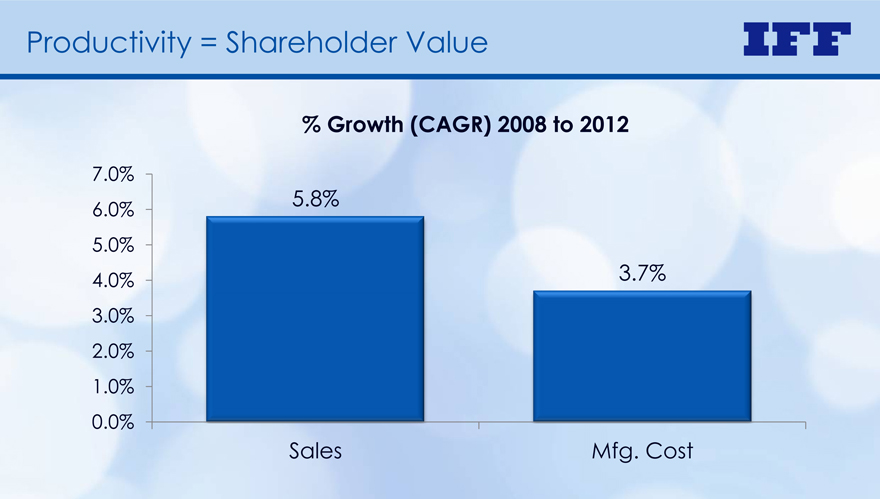
Productivity = Shareholder Value
% Growth (CAGR) 2008 to 2012
7.0%
6.0% 5.8%
5.0%
4.0% 3.7%
3.0%
2.0%
1.0%
0.0%
Sales Mfg. Cost
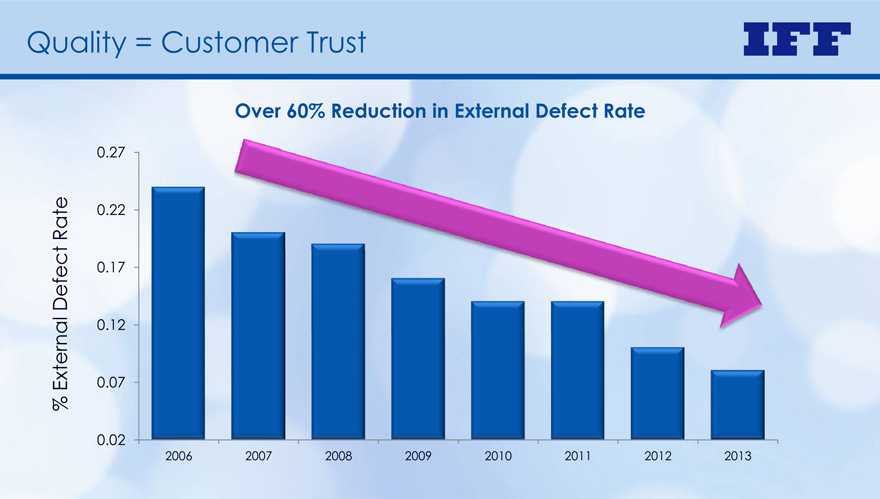
Quality = Customer Trust
Over 60% Reduction in External Defect Rate
% External Defect Rate
0.27 0.22 0.17 0.12 0.07 0.02
2006 2007 2008 2009 2010 2011 2012 2013
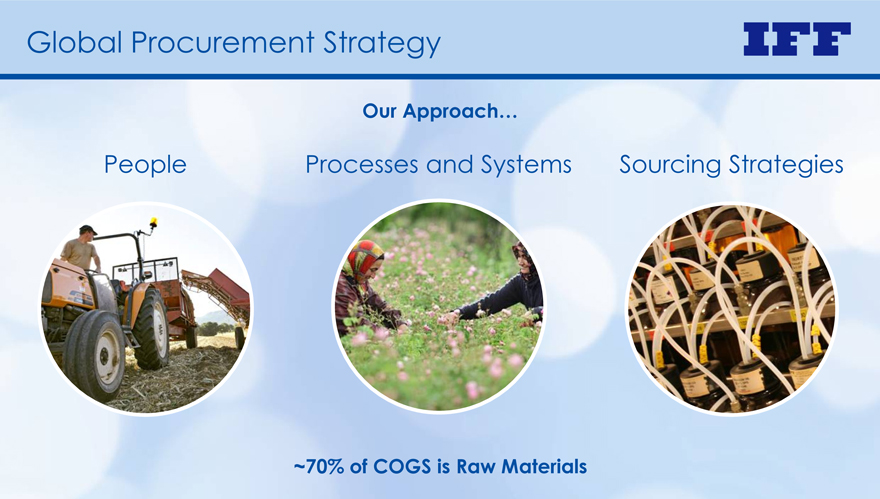
Global Procurement Strategy
Our Approach…
People
Processes and Systems
~70% of COGS is Raw Materials
Sourcing Strategies
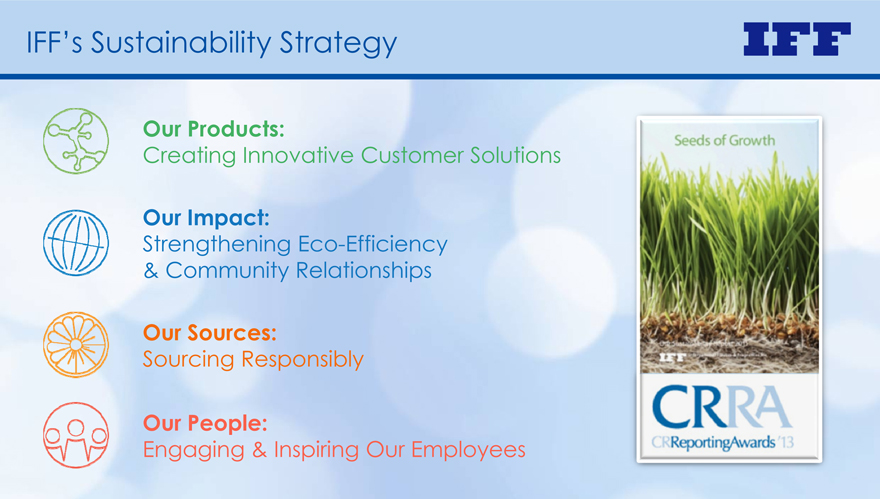
IFF’s Sustainability Strategy
Our Products:
Creating Innovative Customer Solutions
Our Impact:
Strengthening Eco-Efficiency
& Community Relationships
Our Sources:
Sourcing Responsibly
Our People:
Engaging & Inspiring Our Employees
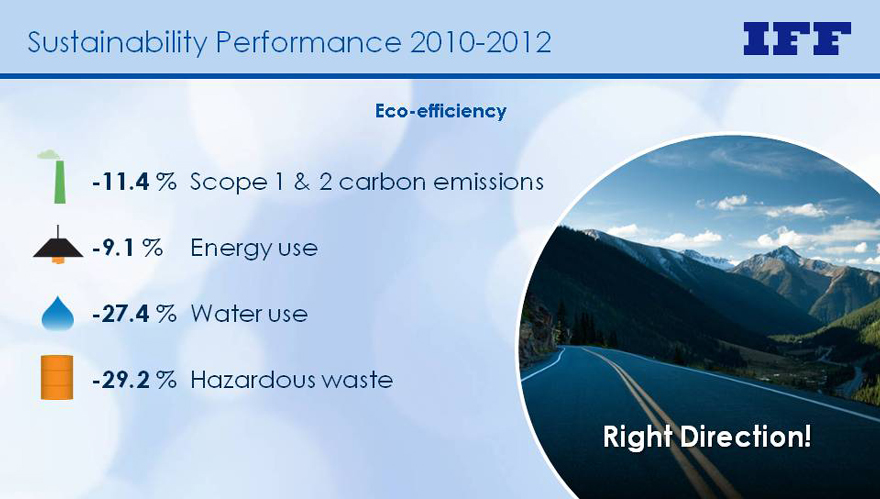
Sustainability Performance 2010-2012
Eco-efficiency
-11.4 % Scope 1 & 2 carbon emissions
-9.1 % Energy use
-27.4 % Water use
-29.2 % Hazardous waste
Right Direction!
Summary
Our #1 job is to satisfy our customers
Productivity and quality are the cornerstone of the operations strategy
Our best asset is our people
We are delivering results – strong manufacturing leverage, excellent reduction in waste and highest published industry ROIC
Well-Positioned to Capture Future Growth

Investor Day
2013
Operations

Investor Day 2013
Innovation
The Foundation of our Success
Kevin Berryman
EVP & CFO
June 5, 2013

Execution on Strategic Growth Pillars
Leverage
Geographic Reach
Strengthen
Innovation Platform
Maximize
Portfolio
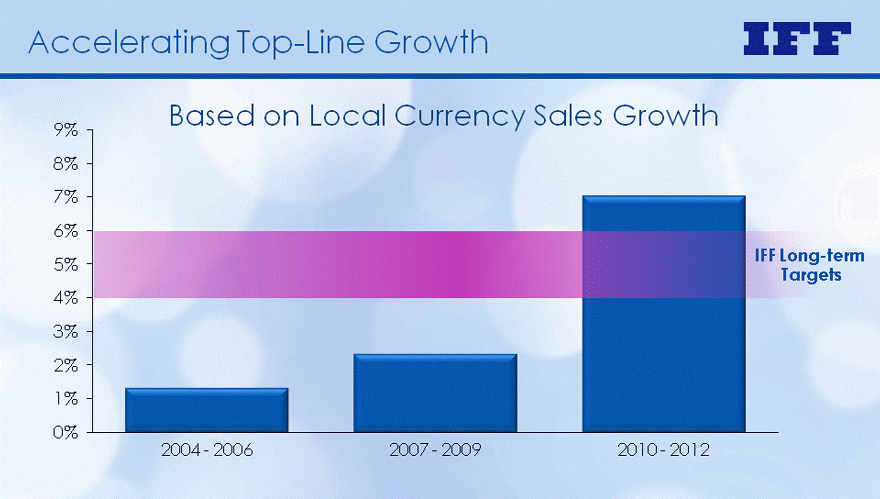
Accelerating Top-Line Growth
8%
9% Based on Local Currency Sales Growth
6%
7%
3%
4%
5% IFF Long-term
Targets
1%
2%
0%
2004-2006
2007-2009
2010-2012
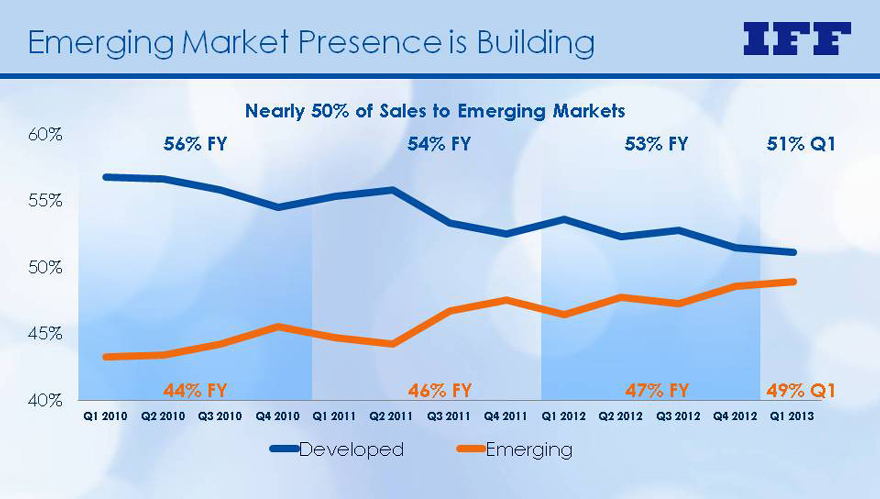
Emerging Market Presence is Building
60%
Nearly 50% of Sales to Emerging Markets
56% FY 54% FY 53% FY 51% Q1
55%
45%
50%
40%
Q1 Q2 Q3 Q4 Q1 Q2 Q3 Q4 Q1 Q2 Q3 Q4 Q1 44% FY 46% FY 47% FY 49% Q1
2010 2010 2010 2010 2011 2011 2011 2011 2012 2012 2012 2012 2013
Developed Emerging
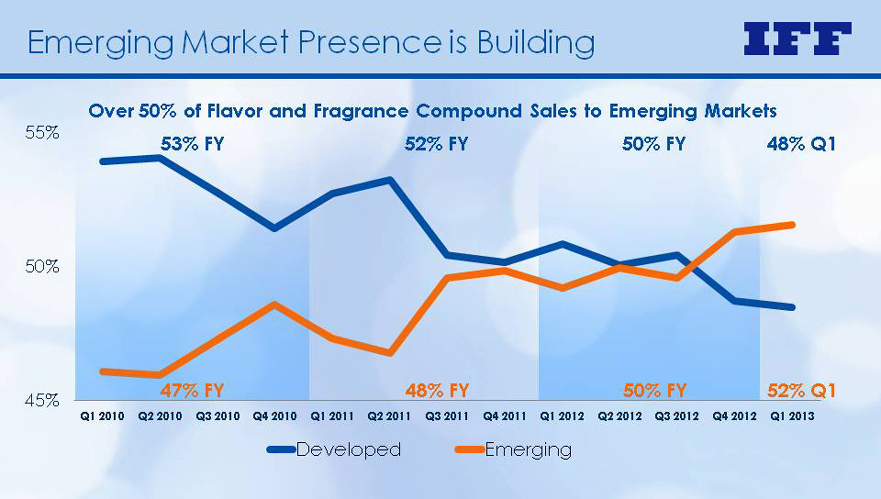
Emerging Market Presence is Building
55%
Over 50% of Flavor and Fragrance Compound Sales to Emerging Markets
53% FY 52% FY 50% FY 48% Q1
50%
45%
Q1 Q2 Q3 Q4 Q1 Q2 Q3 Q4 Q1 Q2 Q3 Q4 Q1 47% FY 48% FY 50% FY 52% Q1
2010 2010 2010 2010 2011 2011 2011 2011 2012 2012 2012 2012 2013
Developed Emerging
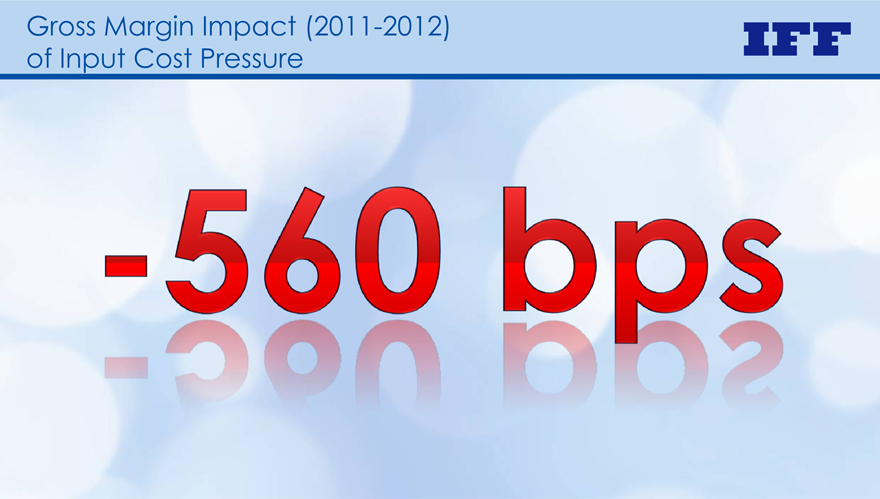
Gross Margin Impact (2011-2012) of Input Cost Pressure
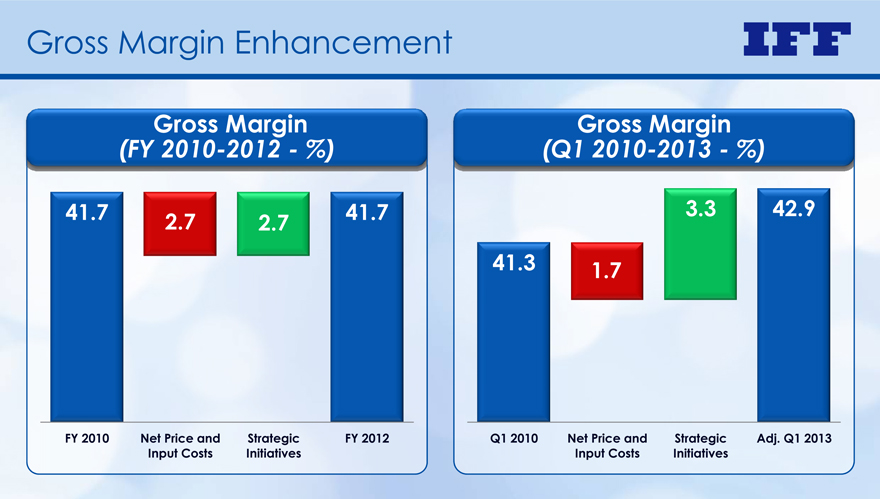
Gross Margin Enhancement
Gross Margin
(FY 2010-2012 - %)
Gross Margin
(Q1 2010-2013 - %)
41.7 2.7 2.7 41.7 3.3 42.9
41.3 1.7
FY 2010 Net Price and
Input Costs
Strategic
Initiatives
FY 2012 Q1 2010 Net Price and
Input Costs
Strategic
Initiatives
Adj. Q1 2013
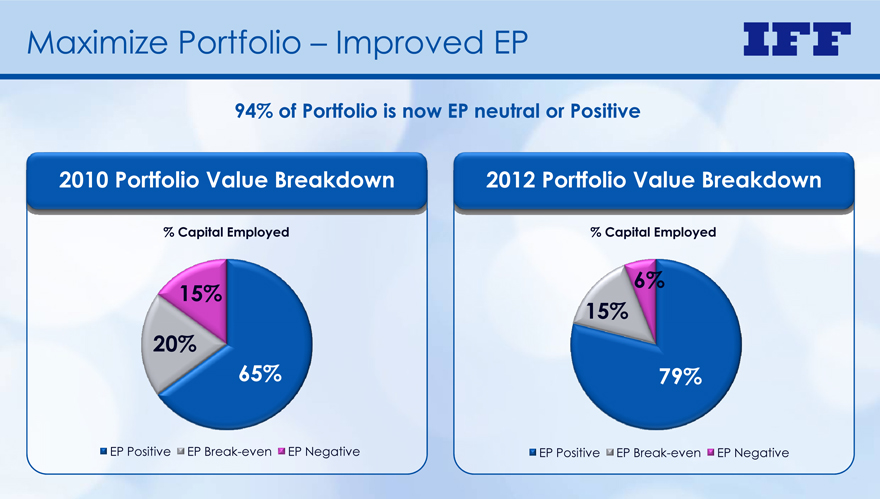
Maximize Portfolio – Improved EP
94% of Portfolio is now EP neutral or Positive
2010 Portfolio Value Breakdown 2012 Portfolio Value Breakdown
% Capital Employed % Capital Employed
15%
15%
6%
65%
20%
79%
EP Positive EP Break-even EP Negative EP Positive EP Break-even EP Negative
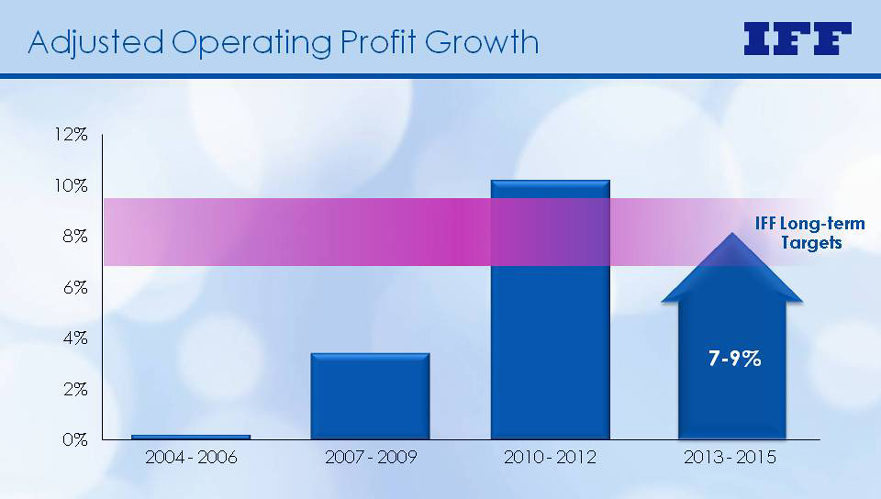
Adjusted Operating Profit Growth
12%
8%
10%
IFF Long-term
Targets
4%
6%
g
2%
7-9%
0%
2004-2006
2007-2009
2010-2012
2013-2015
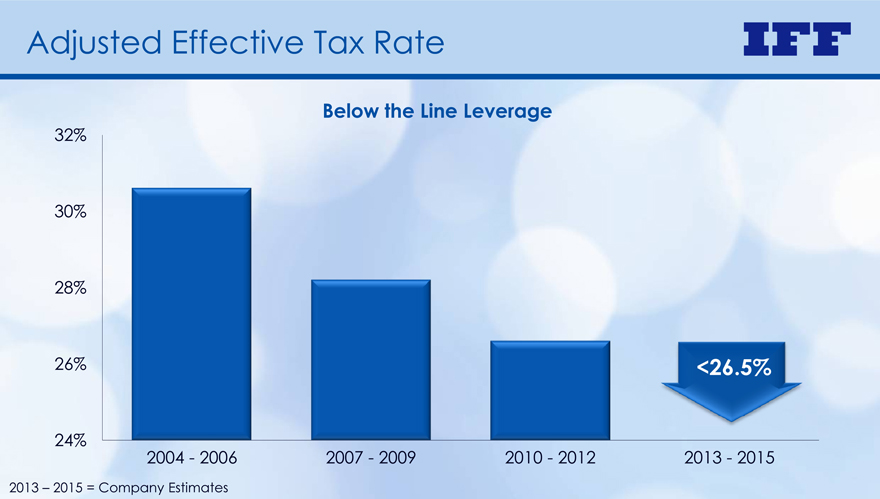
Adjusted Effective Tax Rate
32%
Below the Line Leverage
30%
28%
26% <26.5%
24%
2004 - 2006 2007 - 2009 2010 - 2012 2013 - 2015
2013 – 2015 = Company Estimates
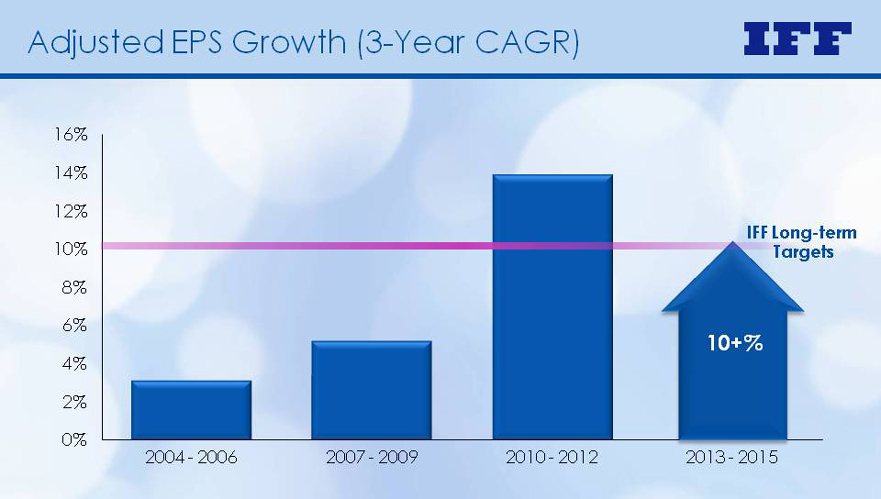
Adjusted EPS Growth (3-Year CAGR)
4%
16%
10%
12%
14%
IFF Long-term
Targets
6%
8%
2%
4%
10+%
0%
2004-2006
2007-2009
2010-2012
2013-2015
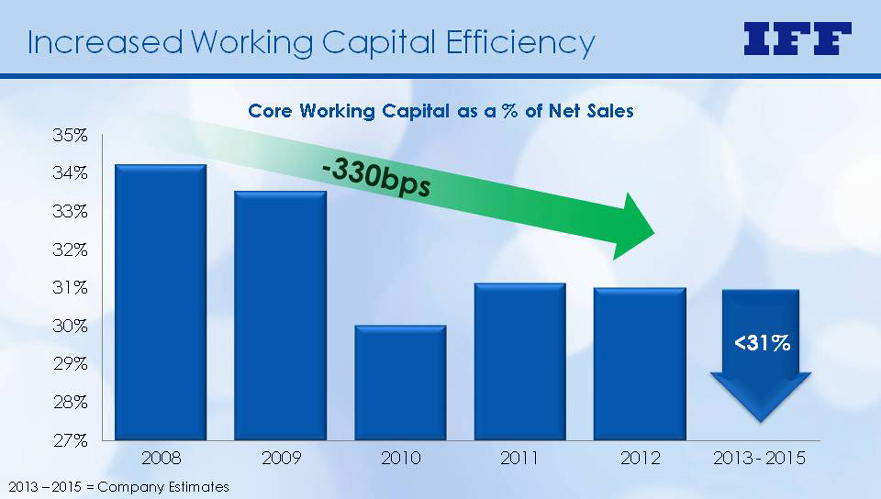
Increased Working Capital Efficiency
%
35%
Core Working Capital as a % of Net Sales
32%
33%
34%
30%
31%
28%
29%
<31%
27%
2008 2009 2010 2011 2012 2013 - 2015
2013 – 2015 = Company Estimates
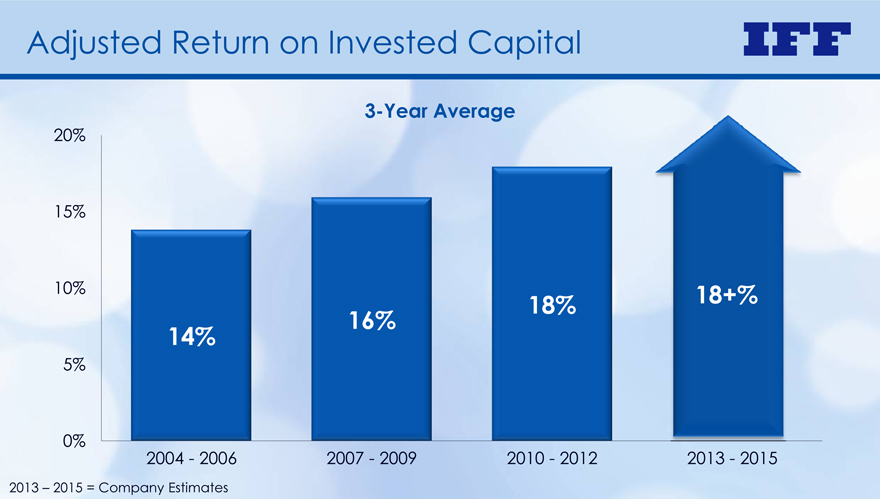
Adjusted Return on Invested Capital
20%
3-Year Average
15%
14%
16% 18% 10% 18+%
5%
0%
2004 - 2006 2007 - 2009 2010 - 2012 2013 - 2015
2013 – 2015 = Company Estimates
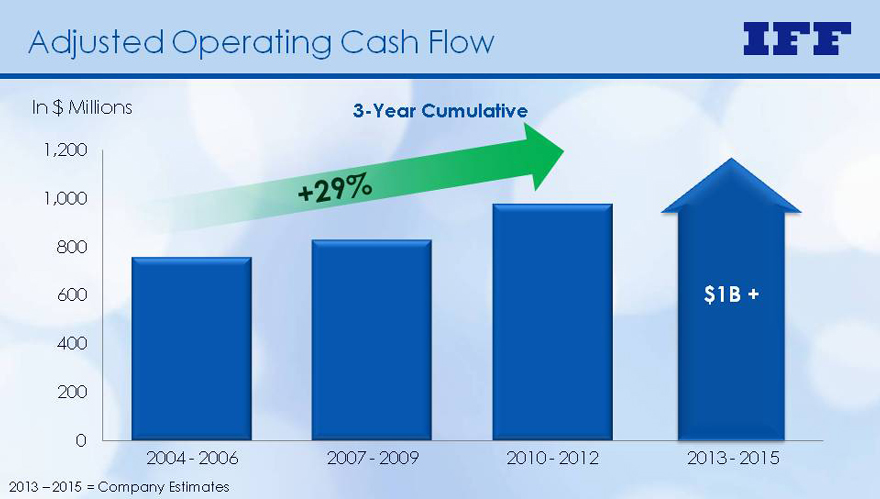
Adjusted Operating Cash Flow
1,200
In $ Millions 3-Year Cumulative
800
1,000
600
$1B +
200
400
0
2004 - 2006 2007 - 2009 2010 - 2012 2013 - 2015
2013 – 2015 = Company Estimates
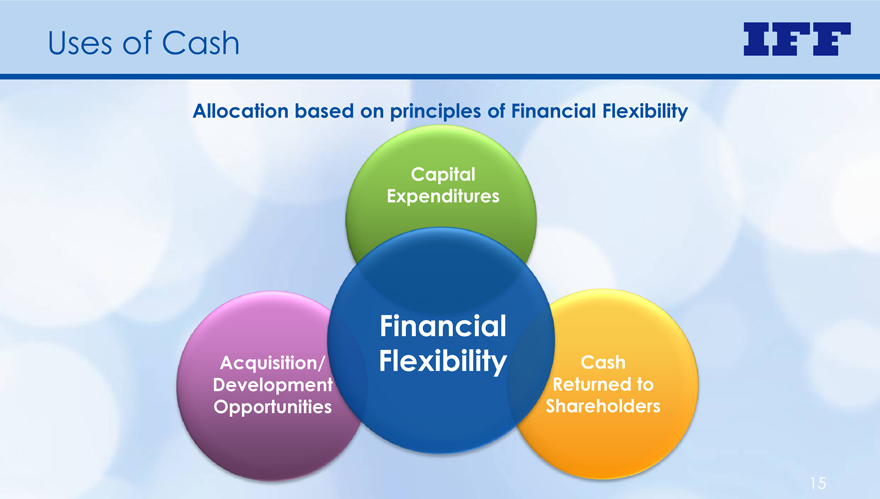
Uses of Cash
Allocation based on principles of Financial Flexibility
Capital
Expenditures
Financial
Acquisition/ Flexibility
Development
Opportunities
Cash
Returned to
shareholders
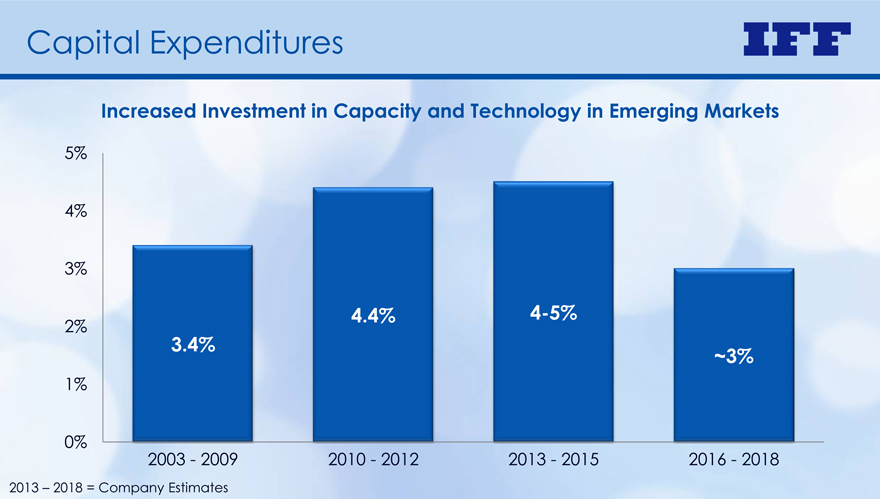
Capital Expenditures
5%
Increased Investment in Capacity and Technology in Emerging Markets
4%
4.4% 4-5%
2%
3%
3.4% ~3%
1%
%
0%
2003 - 2009 2010 - 2012 2013 - 2015 2016 - 2018
2013 – 2018 = Company Estimates
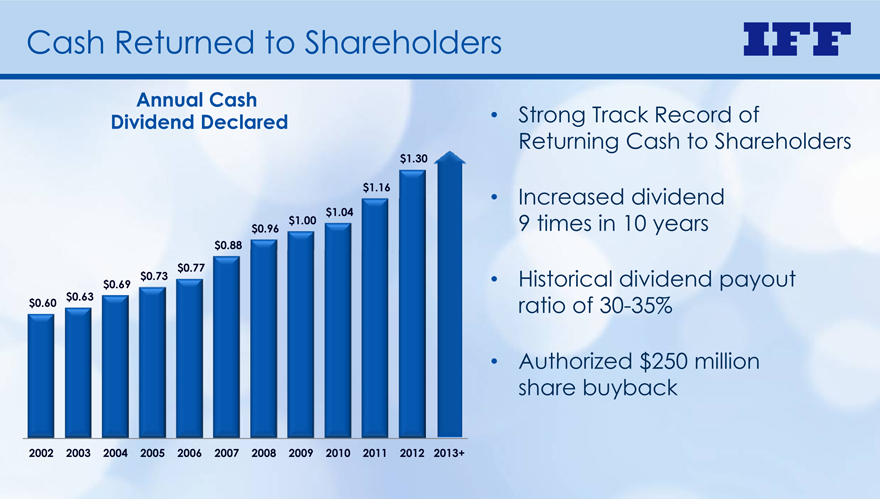
Cash Returned to Shareholders
• Strong Track Record of
Returning Cash to Shareholders
Annual Cash
Dividend Declared
$1.30
• Increased dividend
9 times in 10 years
$
0.88
$0.96
$1.00
$1.04
$1.16
• Historical dividend payout
$0.60 $0.63 ratio of 30-35%
$0.69
$0.73
$0.77
• Authorized $250 million
share buyback
2002 2003 2004 2005 2006 2007 2008 2009 2010 2011 2012 2013+

M&A Activity
• Routinely evaluate M&A opportunities
Augment our Organic Growth Strategy
– F&F companies participating in attractive markets
– F&F companies operating in geographies
where we are under- represented
– F&F companies with differentiated technology
• Evaluate consistent with principles
of Economic Profit
• Will consider adjacencies that bolster long-term growth prospects
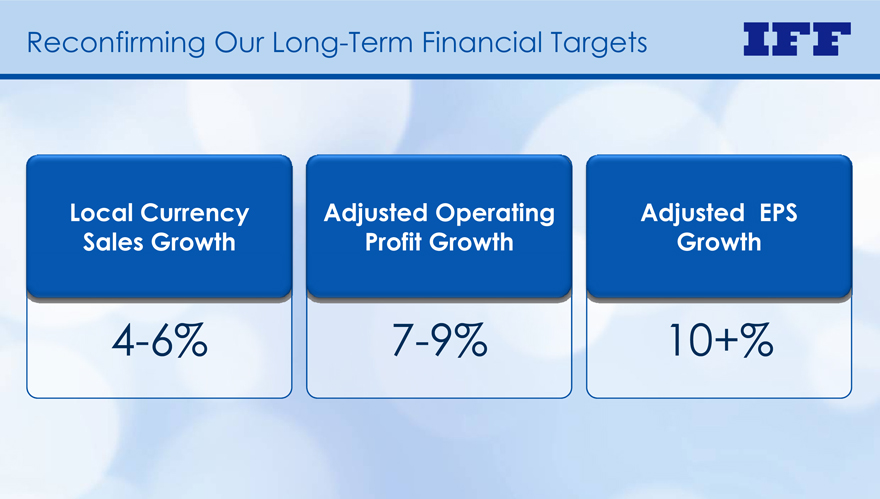
Reconfirming Our Long-Term Financial Targets
Local Currency
Sales Growth
Adjusted Operating
Profit Growth
Adjusted EPS
Growth
4- 6% 7- 9% 10+%
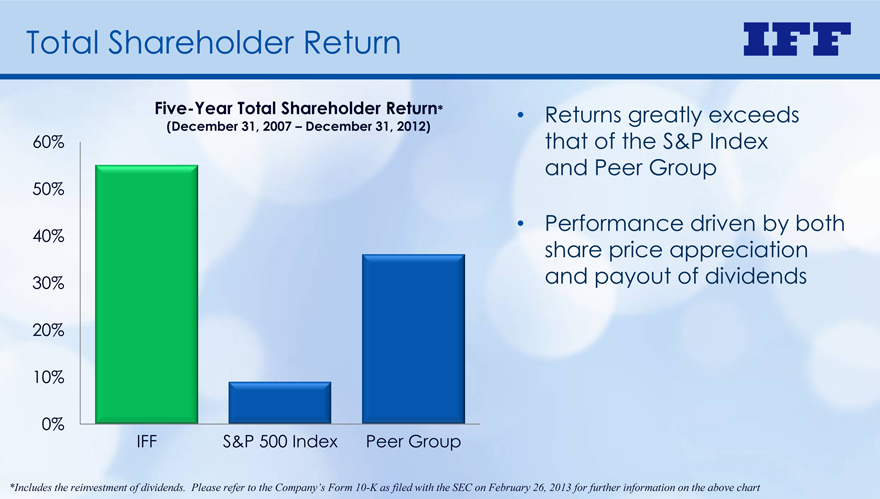
Total Shareholder Return
60%
Five-Year Total Shareholder Return*
(December 31, 2007 – December 31, 2012) • Returns greatly exceeds
that of the S&P Index
Group
40%
50%
and Peer • Performance driven by both
share price 20%
30%
appreciation
and payout of dividends
10%
0%
IFF S&P 500 Index Peer Group
*Includes the reinvestment of dividends. Please refer to the Company’s Form 10-K as filed with the SEC on February 26, 2013 for further information on the above chart
Summary
Geographically Diversified Company with Steady Growth
Partnered with Leading Global Consumer Companies
Strong Innovation Platforms – Focused on Consumer
Strong Financial Performance and Cash Flow
Abilityto Deliver Strong Returns Longer-Term

Investor Day 2013
Innovation
The Foundation of our Success

Investor Day
2013
Closing Remarks
Doug Tough
Chairman of the Board & Chief Executive Officersw
June 5, 2013
Innovation - Foundation for Our Success
Allocate resources to seize growth opportunities in emerging markets Align R&D Spend with Opportunities – in terms of category growth and EP profile Use EP principles to develop a stronger portfolio to deliver a higher ROIC
Invest behind advantaged businesses and remediate less profitable areas
Innovation - discovering new ways to create unique experiences that enhance consumers’ lives
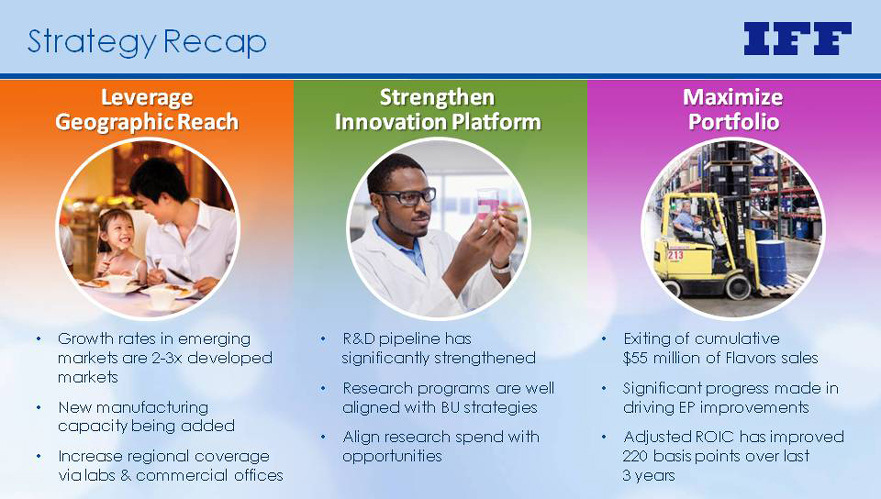
Strategy Recap
Leverage Geographic Reach
Growth rates in emerging markets are 2-3x developed markets
New manufacturing capacity being added
Increase regional coverage via labs & commercial offices
Strengthen Innovation Platform
R&D pipeline has significantly strengthened
Research programs are well aligned with BU strategies
Align research spend with opportunities
Maximize Portfolio
Exiting of cumulative $55 million of Flavors sales
Significant progress made in driving EP improvements
Adjusted ROIC has improved
basis points over last
years
Strategic Priorities Going Forward
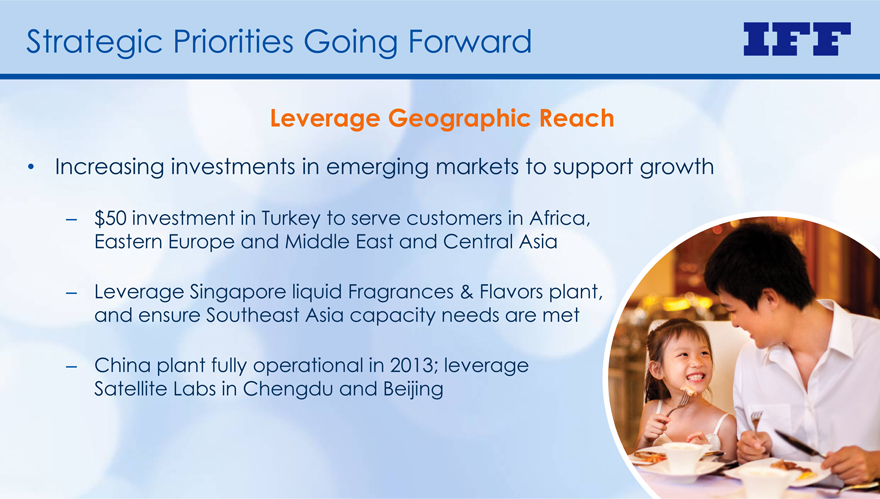
Leverage Geographic Reach
Increasing investments in emerging markets to support growth
$50 investment in Turkey to serve customers in Africa, Eastern Europe and Middle East and Central Asia
Leverage Singapore liquid Fragrances & Flavors plant, and ensure Southeast Asia capacity needs are met
China plant fully operational in 2013; leverage Satellite Labs in Chengdu and Beijing
Strategic Priorities Going Forward
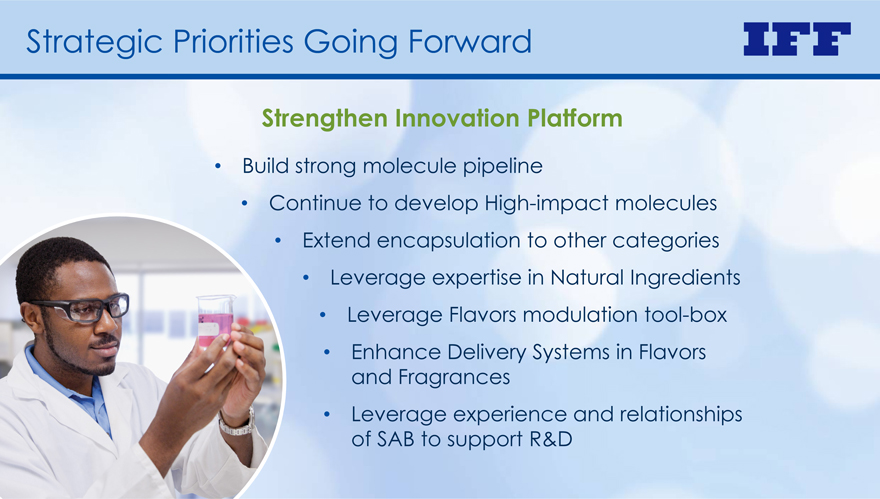
Strengthen Innovation Platform
Build strong molecule pipeline
Continue to develop High-impact molecules
Extend encapsulation to other categories
Leverage expertise in Natural Ingredients
Leverage Flavors modulation tool-box
Enhance Delivery Systems in Flavors and Fragrances
Leverage experience and relationships of SAB to support R&D
Strategic Priorities Going Forward
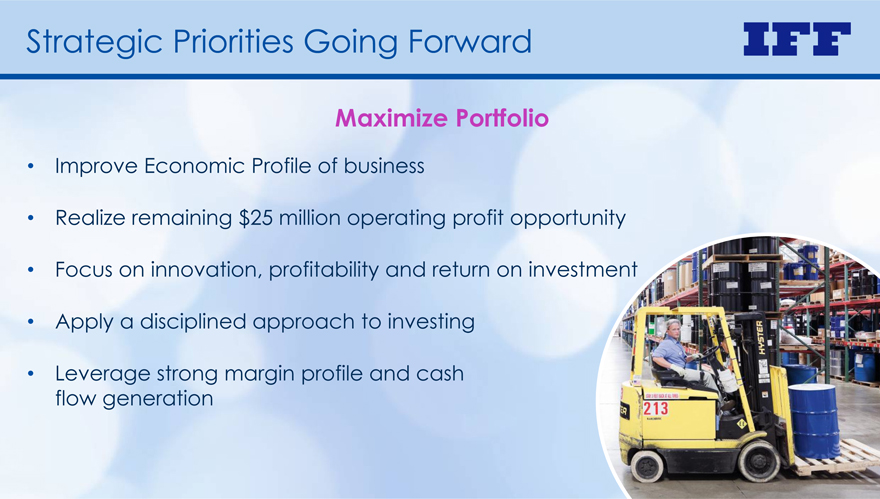
Maximize Portfolio
Improve Economic Profile of business
Realize remaining $25 million operating profit opportunity
Focus on innovation, profitability and return on investment
Apply a disciplined approach to investing
Leverage strong margin profile and cash flow generation
Summary
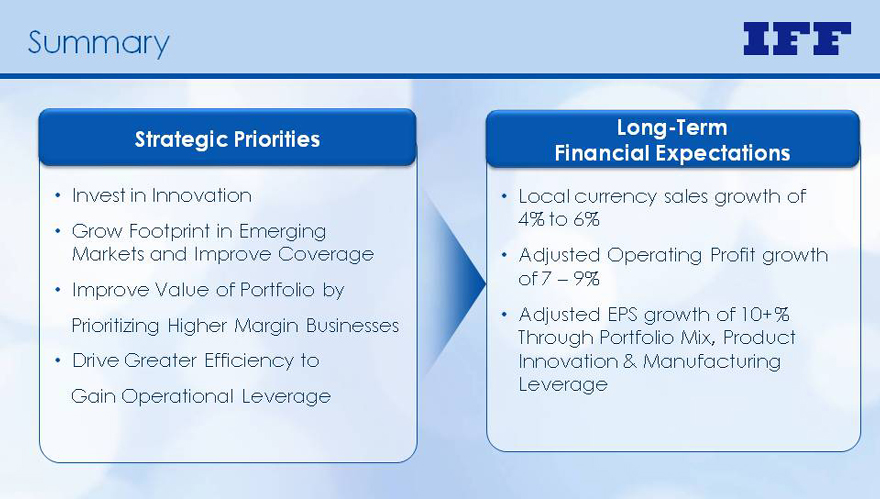
Strategic Priorities
Invest in Innovation
Grow Footprint in Emerging Markets and Improve Coverage
Improve Value of Portfolio by Prioritizing Higher Margin Businesses
Drive Greater Efficiency to Gain Operational Leverage
Long-Term Financial Expectations
Local currency sales growth of 4% to 6%
Adjusted Operating Profit growth of 7 – 9%
Adjusted EPS growth of 10+%
Through Portfolio Mix, Product
Innovation & Manufacturing Leverage

Investor Day
2013
Innovation
The Foundation of Our Success

| | | | | | | | | | | | | | | | | | | | | | | | | | | | | | | | | | | | | | | | | | | | | | | | |
ANNUAL REVENUE GROWTH | |
| | | 2004 | | | 2005 | | | 2006 | | | 3-Year | | | 2007 | | | 2008 | | | 2009 | | | 3-Year | | | 2010 | | | 2011 | | | 2012 | | | 3-Year | |
Total Company | | | | | | | | | | | | | | | | | | | | | | | | | | | | | | | | | | | | | | | | | | | | | | | | |
Reported Sales Growth | | | 7 | % | | | -2 | % | | | 5 | % | | | 3 | % | | | 9 | % | | | 5 | % | | | -3 | % | | | 4 | % | | | 13 | % | | | 6 | % | | | 1 | % | | | 7 | % |
Currency Impact | | | -5 | % | | | -1 | % | | | 0 | % | | | | | | | -4 | % | | | -3 | % | | | 3 | % | | | | | | | 0 | % | | | -2 | % | | | 3 | % | | | | |
Local Currency Sales Growth | | | 2 | % | | | -3 | % | | | 5 | % | | | 1 | % | | | 5 | % | | | 2 | % | | | 0 | % | | | 2 | % | | | 13 | % | | | 4 | % | | | 4 | % | | | 7 | % |
Flavors | | | | | | | | | | | | | | | | | | | | | | | | | | | | | | | | | | | | | | | | | | | | | | | | |
Reported Sales Growth | | | | | | | | | | | | | | | | | | | 12 | % | | | 9 | % | | | -1 | % | | | 7 | % | | | 11 | % | | | 12 | % | | | 2 | % | | | 8 | % |
Currency Impact | | | | | | | | | | | | | | | | | | | -3 | % | | | -3 | % | | | 3 | % | | | | | | | -1 | % | | | -3 | % | | | 3 | % | | | | |
Local Currency Sales Growth | | | | | | | | | | | | | | | | | | | 9 | % | | | 6 | % | | | 2 | % | | | 6 | % | | | 10 | % | | | 9 | % | | | 5 | % | | | 8 | % |
Exit of Flavors Low Margin Sales Activities | | | | | | | | | | | | | | | | | | | 0 | % | | | 0 | % | | | 0 | % | | | | | | | 0 | % | | | 0 | % | | | 3 | % | | | | |
Like-For-Like Local Currency Sales Growth | | | | | | | | | | | | | | | | | | | 9 | % | | | 6 | % | | | 2 | % | | | 6 | % | | | 10 | % | | | 9 | % | | | 8 | % | | | 9 | % |
| | | | | | | | | | | | |
Fragrance Compounds | | | | | | | | | | | | | | | | | | | | | | | | | | | | | | | | | | | | | | | | | | | | | | | | |
Reported Sales Growth | | | | | | | | | | | | | | | | | | | 5 | % | | | 1 | % | | | -4 | % | | | 1 | % | | | 14 | % | | | 4 | % | | | 3 | % | | | 7 | % |
Currency Impact | | | | | | | | | | | | | | | | | | | -4 | % | | | -2 | % | | | 3 | % | | | | | | | 1 | % | | | -3 | % | | | 4 | % | | | | |
Local Currency Sales Growth | | | | | | | | | | | | | | | | | | | 1 | % | | | -1 | % | | | -1 | % | | | 0 | % | | | 15 | % | | | 1 | % | | | 7 | % | | | 8 | % |
| | | | | | | | | | | | |
Ingredients | | | | | | | | | | | | | | | | | | | | | | | | | | | | | | | | | | | | | | | | | | | | | | | | |
Reported Sales Growth | | | | | | | | | | | | | | | | | | | 9 | % | | | 5 | % | | | -4 | % | | | 3 | % | | | 15 | % | | | -6 | % | | | -12 | % | | | -1 | % |
Currency Impact | | | | | | | | | | | | | | | | | | | -4 | % | | | -4 | % | | | 2 | % | | | | | | | 3 | % | | | -3 | % | | | 2 | % | | | | |
Local Currency Sales Growth | | | | | | | | | | | | | | | | | | | 5 | % | | | 1 | % | | | -2 | % | | | 1 | % | | | 18 | % | | | -9 | % | | | -10 | % | | | 0 | % |
| | | | | | | | | | | | | | | | | | | | | | | | | | | | | | | | | | | | | | | | | | | | | | | | |
QUARTERLY REVENUE GROWTH | |
| | | Q1 2010 | | | Q2 2010 | | | Q3 2010 | | | Q4 2010 | | | Q1 2011 | | | Q2 2011 | | | Q3 2011 | | | Q4 2011 | | | Q1 2012 | | | Q2 2012 | | | Q3 2012 | | | Q4 2012 | |
Flavors | | | | | | | | | | | | | | | | | | | | | | | | | | | | | | | | | | | | | | | | | | | | | | | | |
Reported Sales Growth | | | 13 | % | | | 13 | % | | | 9 | % | | | 10 | % | | | 13 | % | | | 14 | % | | | 13 | % | | | 8 | % | | | 3 | % | | | 5 | % | | | 0 | % | | | 1 | % |
Currency Impact | | | -5 | % | | | -2 | % | | | 1 | % | | | 1 | % | | | -1 | % | | | -6 | % | | | -5 | % | | | 0 | % | | | 2 | % | | | 3 | % | | | 6 | %�� | | | 2 | % |
Local Currency Sales Growth | | | 8 | % | | | 11 | % | | | 10 | % | | | 11 | % | | | 12 | % | | | 8 | % | | | 8 | % | | | 8 | % | | | 5 | % | | | 8 | % | | | 6 | % | | | 3 | % |
Exit of Flavors Low Margin Sales Activities | | | 0 | % | | | 0 | % | | | 0 | % | | | 0 | % | | | 0 | % | | | 0 | % | | | 0 | % | | | 0 | % | | | 1 | % | | | 1 | % | | | 3 | % | | | 4 | % |
Like-For-Like Local Currency Sales Growth | | | 8 | % | | | 11 | % | | | 10 | % | | | 11 | % | | | 12 | % | | | 8 | % | | | 8 | % | | | 8 | % | | | 6 | % | | | 9 | % | | | 9 | % | | | 7 | % |
The Company uses non-GAAP financial measures such as (i) local currency sales (which eliminates the effects that result from translating its international sales in U.S. dollars) and (ii) like-for-like sales (which excludes the impact of exiting low-margin sales activities, the impact of selling the Company’s fruit preparations business in Europe and foreign exchange) as the Company believes that these non-GAAP financial measures provide investors with an overall perspective of the period-to-period performance of our core business. Such information is supplemental to information presented in accordance with GAAP and is not intended to represent a presentation in accordance with GAAP. These non-GAAP measures may not be comparable to similarly titled measures used by other companies.
| | | | | | | | | | | | |
Adjusted Gross Margin | |
(IN THOUSANDS U.S. $) | | FY 2010 | | | Q1 2013 | | | Margin Improvement | |
As Reported Gross Profit | | | 1,092,602 | | | | 311,360 | | | | | |
Operational Improvement Initiative Costs | | | — | | | | 1,198 | | | | | |
| | | | | | | | | | | | |
Adjusted Gross Profit | | | 1,092,602 | | | | 312,558 | | | | | |
| | | | | | | | | | | | |
Net Sales | | | 2,622,862 | | | | 727,836 | | | | | |
| | | |
Adjusted Gross Margin | | | 41.7 | % | | | 42.9 | % | | | 1.2 | % |
The Company uses non-GAAP financial measures such as Adjusted Gross Profit and Adjusted Gross Margin (which exclude operational improvement initiative costs) as the Company believes that these non-GAAP financial measures provide investors with an overall perspective of the period-to-period performance of our core business. Such information is supplemental to information presented in accordance with GAAP and is not intended to represent a presentation in accordance with GAAP. These non-GAAP measures may not be comparable to similarly titled measures used by other companies.
| | | | | | | | | | | | | | | | | | | | | | | | | | | | |
ADJUSTED OPERATING PROFIT | |
(IN THOUSANDS U.S. $) | | 2003 | | | 2006 | | | 3-Year CAGR | | | 2009 | | | 3-Year CAGR | | | 2012 | | | 3-Year CAGR | |
As Reported Operating Profit | | | 285,774 | | | | 331,173 | | | | 5.0 | % | | | 340,288 | | | | 0.9 | % | | | 486,618 | | | | 12.7 | % |
Restructuring and Other Charges | | | 42,421 | | | | 2,680 | | | | | | | | 18,301 | | | | | | | | 1,668 | | | | | |
Employee Separation Costs | | | — | | | | — | | | | | | | | 6,320 | | | | | | | | — | | | | | |
Insurance Recovery | | | — | | | | (3,565 | ) | | | | | | | — | | | | | | | | — | | | | | |
| | | | | | | | | | | | | | | | | | | | | | | | | | | | |
Adjusted Operating Profit | | | 328,195 | | | | 330,288 | | | | 0.2 | % | | | 364,909 | | | | 3.4 | % | | | 488,286 | | | | 10.2 | % |
| | | | | | | | | | | | | | | | | | | | | | | | | | | | |
|
ADJUSTED EARNINGS PER SHARE (EPS) | |
(PER SHARE DATA U.S. $) | | 2003 | | | 2006 | | | 3-Year CAGR | | | 2009 | | | 3-Year CAGR | | | 2012 | | | 3-Year CAGR | |
As Reported EPS | | | 1.83 | | | | 2.48 | | | | 10.7 | % | | | 2.46 | | | | -0.3 | % | | | 3.09 | | | | 7.9 | % |
Restructuring and Other Charges | | | 0.29 | | | | 0.02 | | | | | | | | 0.19 | | | | | | | | 0.01 | | | | | |
Employee Separation Costs | | | — | | | | — | | | | | | | | 0.05 | | | | | | | | — | | | | | |
Insurance Recovery | | | — | | | | (0.03 | ) | | | | | | | — | | | | | | | | — | | | | | |
Tax Settlement | | | — | | | | (0.04 | ) | | | | | | | — | | | | | | | | — | | | | | |
Other Income (Primarily Asset Gains) | | | — | | | | (0.11 | ) | | | | | | | — | | | | | | | | — | | | | | |
Spanish Tax Settlement | | | — | | | | — | | | | | | | | — | | | | | | | | 0.88 | | | | | |
| | | | | | | | | | | | | | | | | | | | | | | | | | | | |
Adjusted EPS | | | 2.12 | | | | 2.32 | | | | 3.1 | % | | | 2.69 | ¹ | | | 5.1 | % | | | 3.98 | | | | 13.9 | % |
| | | | | | | | | | | | | | | | | | | | | | | | | | | | |
| 1 | The sum of Reported EPS plus the per share effects of items added back to reconcile to Adjusted EPS may not equal the total Adjusted EPS due to rounding differences. |
| | | | | | | | | | | | | | | | | | | | | | | | | | | | | | | | | | | | |
ADJUSTED EFFECTIVE TAX RATE | |
| | | 2004 | | | 2005 | | | 2006 | | | 2007 | | | 2008 | | | 2009 | | | 2010 | | | 2011 | | | 2012 | |
As Reported Effective Tax Rate | | | 30.2 | % | | | 21.6 | % | | | 28.2 | % | | | 25.3 | % | | | 19.1 | % | | | 29.3 | % | | | 26.7 | % | | | 28.6 | % | | | 42.7 | % |
Restructuring and Other Charges Tax Benefit | | | 0.6 | % | | | 1.0 | % | | | 0.0 | % | | | — | | | | 0.7 | % | | | -0.6 | % | | | -0.4 | % | | | 0.0 | % | | | 0.0 | % |
AJCA Tax Benefit | | | — | | | | 9.3 | % | | | — | | | | — | | | | — | | | | — | | | | — | | | | — | | | | — | |
Tax Settlements | | | — | | | | — | | | | 1.2 | % | | | 3.0 | % | | | 7.6 | % | | | — | | | | — | | | | — | | | | — | |
Curtailment Tax Benefit | | | — | | | | — | | | | — | | | | 0.2 | % | | | — | | | | — | | | | — | | | | — | | | | — | |
Asset Gain Tax Expense | | | — | | | | — | | | | — | | | | -0.1 | % | | | — | | | | — | | | | — | | | | — | | | | — | |
Employee Separation Costs Tax Benefit | | | — | | | | — | | | | — | | | | — | | | | 0.2 | % | | | 0.1 | % | | | — | | | | — | | | | — | |
Shared Service Implementation Tax Benefit | | | — | | | | — | | | | — | | | | — | | | | 0.1 | % | | | — | | | | — | | | | — | | | | — | |
Insurance Recovery Tax Expense | | | — | | | | — | | | | 0.0 | % | | | — | | | | -0.2 | % | | | — | | | | — | | | | — | | | | — | |
Other Income (Primarily Asset Gains) | | | — | | | | — | | | | -0.3 | % | | | — | | | | — | | | | — | | | | — | | | | — | | | | — | |
Patent Litigation Settlement Benefit | | | — | | | | — | | | | — | | | | — | | | | — | | | | — | | | | — | | | | -1.5 | % | | | — | |
Spanish Tax Settlement | | | — | | | | — | | | | — | | | | — | | | | — | | | | — | | | | — | | | | — | | | | -16.3 | % |
| | | | | | | | | | | | | | | | | | | | | | | | | | | | | | | | | | | | |
Adjusted Effective Tax Rate | | | 30.8 | % | | | 31.9 | % | | | 29.1 | % | | | 28.4 | % | | | 27.5 | % | | | 28.8 | % | | | 26.3 | % | | | 27.1 | % | | | 26.4 | % |
| | | | | | | | | | | | | | | | | | | | | | | | | | | | | | | | | | | | |
The Company uses non-GAAP financial measures such as Adjusted Operating Profit, Adjusted Effective Tax Rate and Adjusted EPS (which excludes the impact of our restructuring and strategic initiatives, the AJCA tax benefit, tax settlements, curtailments, gains on asset sales, employee separation costs, cost associated with the implementation of our shared services, insurance recoveries, the Mane patent litigation settlement and the Spanish tax settlement) as the Company believes that these non-GAAP financial measures provide investors with an overall perspective of the period-to-period performance of our core business. Such information is supplemental to information presented in accordance with GAAP and is not intended to represent a presentation in accordance with GAAP. These non-GAAP measures may not be comparable to similarly titled measures used by other companies.
| | | | | | | | | | | | | | | | | | | | | | | | | | | | | | | | | | | | |
FLAVORS | | | | | | | |
(IN THOUSANDS U.S. $) | | 2006 | | | 2007 | | | 2008 | | | 2009 | | | 2010 | | | 2011 | | | 2012 | | | 2006 - 2009 CAGR | | | Since 2009 | |
As Reported Segment Profit* | | | 153,099 | | | | 187,275 | | | | 197,838 | | | | 208,966 | | | | 242,528 | | | | 284,246 | | | | 298,326 | | | | 10.9 | % | | | 12.6 | % |
Insurance Recovery | | | (3,565 | ) | | | — | | | | — | | | | — | | | | — | | | | — | | | | — | | | | | | | | | |
Restructuring and Other Charges | | | (463 | ) | | | — | | | | 3,538 | | | | — | | | | — | | | | — | | | | — | | | | | | | | | |
| | | | | | | | | | | | | | | | | | | | | | | | | | | | | | | | | | | | |
Adjusted Segment Profit | | | 149,071 | | | | 187,275 | | | | 201,376 | | | | 208,966 | | | | 242,528 | | | | 284,246 | | | | 298,326 | | | | 11.9 | % | | | 12.6 | % |
| | | | | | | | | | | | | | | | | | | | | | | | | | | | | | | | | | | | |
Net Sales | | | 894,775 | | | | 1,005,544 | | | | 1,092,544 | | | | 1,081,488 | | | | 1,203,274 | | | | 1,347,340 | | | | 1,378,377 | | | | | | | | | |
| | | | | | | | | | | | | | | | | | | | | | | | | | | | | | | | | | | | |
Adjusted Segment Margin | | | 16.7 | % | | | 18.6 | % | | | 18.4 | % | | | 19.3 | % | | | 20.2 | % | | | 21.1 | % | | | 21.6 | % | | | | | | | | |
| | | | | | | | | | | | | | | | | | | | | | | | | | | | | | | | | | | | |
| | |
FRAGRANCES | | | | | | | |
(IN THOUSANDS U.S. $) | | 2006 | | | 2007 | | | 2008 | | | 2009 | | | 2010 | | | 2011 | | | 2012 | | | 2006 - 2009 CAGR | | | 2009 - 2012 CAGR | |
As Reported Segment Profit* | | | 212,240 | | | | 211,942 | | | | 202,081 | | | | 188,561 | | | | 244,966 | | | | 226,560 | | | | 238,379 | | | | -3.9 | % | | | 8.1 | % |
R&D Tax Credit | | | 2,180 | | | | — | | | | — | | | | — | | | | — | | | | — | | | | — | | | | | | | | | |
| | | | | | | | | | | | | | | | | | | | | | | | | | | | | | | | | | | | |
Revised Reported Segment Profit | | | 214,420 | | | | 211,942 | | | | 202,081 | | | | 188,561 | | | | 244,966 | | | | 226,560 | | | | 238,379 | | | | | | | | | |
Restructuring and Other Charges | | | 2,639 | | | | — | | | | 4,396 | | | | — | | | | — | | | | — | | | | — | | | | | | | | | |
| | | | | | | | | | | | | | | | | | | | | | | | | | | | | | | | | | | | |
Adjusted Segment Profit | | | 217,059 | | | | 211,942 | | | | 206,477 | | | | 188,561 | | | | 244,966 | | | | 226,560 | | | | 238,379 | | | | -4.6 | % | | | 8.1 | % |
| | | | | | | | | | | | | | | | | | | | | | | | | | | | | | | | | | | | |
Net Sales | | | 1,200,615 | | | | 1,271,094 | | | | 1,296,828 | | | | 1,244,670 | | | | 1,419,588 | | | | 1,440,678 | | | | 1,443,069 | | | | | | | | | |
| | | | | | | | | | | | | | | | | | | | | | | | | | | | | | | | | | | | |
Adjusted Segment Margin | | | 18.1 | % | | | 16.7 | % | | | 15.9 | % | | | 15.1 | % | | | 17.3 | % | | | 15.7 | % | | | 16.5 | % | | | | | | | | |
| | | | | | | | | | | | | | | | | | | | | | | | | | | | | | | | | | | | |
| * | In the 2009 period, segment profit was referred to as adjusted operating profit and excluded amounts related to restructuring and other costs. In the 2006 - 2008 periods, segment profit was referred to as operating income and included restructuring and other costs as well as insurance recoveries. |
The Company uses non-GAAP financial measures such as Adjusted Segment Profit (which excludes the impact of our restructuring and strategic initiatives and insurance recoveries) as the Company believes that these non-GAAP financial measures provide investors with an overall perspective of the period-to-period performance of our core business. Such information is supplemental to information presented in accordance with GAAP and is not intended to represent a presentation in accordance with GAAP. These non-GAAP measures may not be comparable to similarly titled measures used by other companies.
| | | | | | | | | | | | | | | | | | | | | | | | | | | | | | | | | | | | | | | | |
ADJUSTED RETURN ON AVERAGE INVESTED CAPITAL | |
| (IN THOUSANDS U.S. $) | | 2003 | | | 2004 | | | 2005 | | | 2006 | | | 2007 | | | 2008 | | | 2009 | | | 2010 | | | 2011 | | | 2012 | |
Debt | | | 884,535 | | | | 684,926 | | | | 950,673 | | | | 807,340 | | | | 1,212,641 | | | | 1,255,654 | | | | 1,011,529 | | | | 921,567 | | | | 894,936 | | | | 1,031,175 | |
Deferred gain on interest rate swaps | | | (39,685 | ) | | | (24,104 | ) | | | (2,296 | ) | | | (817 | ) | | | (151 | ) | | | (16,893 | ) | | | (14,953 | ) | | | (12,897 | ) | | | (10,965 | ) | | | (9,028 | ) |
Cash and cash equivalents | | | (12,081 | ) | | | (32,596 | ) | | | (272,545 | ) | | | (114,508 | ) | | | (151,471 | ) | | | (178,467 | ) | | | (80,135 | ) | | | (131,332 | ) | | | (88,279 | ) | | | (324,422 | ) |
| | | | | | | | | | | | | | | | | | | | | | | | | | | | | | | | | | | | | | | | |
Net Debt | | | 832,769 | | | | 628,226 | | | | 675,832 | | | | 692,015 | | | | 1,061,019 | | | | 1,060,294 | | | | 916,441 | | | | 777,338 | | | | 795,692 | | | | 697,725 | |
Equity | | | 742,631 | | | | 910,487 | | | | 915,347 | | | | 916,056 | | | | 626,359 | | | | 580,642 | | | | 771,910 | | | | 1,003,155 | | | | 1,107,407 | | | | 1,252,555 | |
| | | | | | | | | | | | | | | | | | | | | | | | | | | | | | | | | | | | | | | | |
Total Invested Capital | | | 1,575,400 | | | | 1,538,713 | | | | 1,591,179 | | | | 1,608,071 | | | | 1,687,378 | | | | 1,640,936 | | | | 1,688,351 | | | | 1,780,493 | | | | 1,903,099 | | | | 1,950,280 | |
| | | | | | | | | | | | | | | | | | | | | | | | | | | | | | | | | | | | | | | | |
Restructuring and Other Charges, net of tax | | | 27,514 | | | | 20,370 | | | | 15,857 | | | | 1,982 | | | | — | | | | 12,543 | | | | 14,763 | | | | 8,928 | | | | 9,444 | | | | 1,047 | |
AJCA Tax Benefit | | | — | | | | — | | | | (25,000 | ) | | | — | | | | — | | | | — | | | | — | | | | — | | | | — | | | | — | |
Tax Settlements | | | — | | | | — | | | | — | | | | (3,511 | ) | | | (9,718 | ) | | | (23,070 | ) | | | — | | | | — | | | | — | | | | — | |
Curtailment, net of tax | | | — | | | | — | | | | — | | | | — | | | | 3,685 | | | | — | | | | — | | | | — | | | | — | | | | — | |
Asset Gain, net of tax | | | — | | | | — | | | | — | | | | — | | | | (7,719 | ) | | | — | | | | — | | | | — | | | | — | | | | — | |
Employee Separation Costs, net of tax | | | — | | | | — | | | | — | | | | — | | | | — | | | | 2,217 | | | | 4,028 | | | | — | | | | — | | | | — | |
Shared Service Implementation, net of tax | | | — | | | | — | | | | — | | | | — | | | | — | | | | 1,377 | | | | — | | | | — | | | | — | | | | — | |
Insurance Recovery, net of tax | | | — | | | | — | | | | — | | | | (2,496 | ) | | | — | | | | (1,612 | ) | | | — | | | | — | | | | — | | | | — | |
Other Income (Primarily Asset Gains), net of tax | | | — | | | | — | | | | — | | | | (10,068 | ) | | | — | | | | — | | | | — | | | | — | | | | — | | | | — | |
Patent Litigation Settlement, net of tax | | | — | | | | — | | | | — | | | | — | | | | — | | | | — | | | | — | | | | — | | | | 29,846 | | | | — | |
Spanish Tax Settlement | | | — | | | | — | | | | — | | | | — | | | | — | | | | — | | | | — | | | | — | | | | — | | | | 72,362 | |
| | | | | | | | | | | | | | | | | | | | | | | | | | | | | | | | | | | | | | | | |
Total Non-recurring Items | | | 27,514 | | | | 20,370 | | | | (9,143 | ) | | | (14,093 | ) | | | (13,752 | ) | | | (8,545 | ) | | | 18,791 | | | | 8,928 | | | | 39,290 | | | | 73,409 | |
| | | | | | | | | | |
Cumulative Non-recurring Items | | | 27,514 | | | | 47,884 | | | | 38,741 | | | | 24,648 | | | | 10,896 | | | | 2,351 | | | | 21,142 | | | | 30,070 | | | | 69,360 | | | | 142,769 | |
| | | | | | | | | | | | | | | | | | | | | | | | | | | | | | | | | | | | | | | | |
Adjusted Total Invested Capital | | | 1,602,914 | | | | 1,586,597 | | | | 1,629,920 | | | | 1,632,719 | | | | 1,698,274 | | | | 1,643,287 | | | | 1,709,493 | | | | 1,810,563 | | | | 1,972,459 | | | | 2,093,049 | |
| | | | | | | | | | | | | | | | | | | | | | | | | | | | | | | | | | | | | | | | |
As Reported Operating Profit | | | | | | | 310,279 | | | | 266,876 | | | | 331,173 | | | | 361,213 | | | | 355,133 | | | | 340,288 | | | | 416,361 | | | | 427,729 | | | | 486,618 | |
Restructuring and Other Charges | | | | | | | 31,830 | | | | 23,319 | | | | 2,680 | | | | — | | | | 18,212 | | | | 18,301 | | | | 10,077 | | | | 13,172 | | | | 1,668 | |
Curtailment | | | | | | | — | | | | — | | | | — | | | | 5,943 | | | | — | | | | — | | | | — | | | | — | | | | — | |
Employee Separation Costs | | | | | | | — | | | | — | | | | — | | | | — | | | | 3,391 | | | | 6,320 | | | | — | | | | — | | | | — | |
Shared Service Implementation | | | | | | | — | | | | — | | | | — | | | | — | | | | 2,079 | | | | — | | | | — | | | | — | | | | — | |
Insurance Recovery | | | | | | | — | | | | — | | | | (3,565 | ) | | | — | | | | (2,600 | ) | | | — | | | | — | | | | — | | | | — | |
Patent Litigation Settlement | | | | | | | — | | | | — | | | | — | | | | — | | | | — | | | | — | | | | — | | | | 33,495 | | | | — | |
| | | | | | | | | | | | | | | | | | | | | | | | | | | | | | | | | | | | | | | | |
Adjusted Operating Profit | | | | | | | 342,109 | | | | 290,195 | | | | 330,288 | | | | 367,156 | | | | 376,215 | | | | 364,909 | | | | 426,438 | | | | 474,396 | | | | 488,286 | |
| | | | | | | | | | | | | | | | | | | | | | | | | | | | | | | | | | | | | | | | |
As Reported Effective Tax Rate | | | | | | | 30.2 | % | | | 21.6 | % | | | 28.2 | % | | | 25.3 | % | | | 19.1 | % | | | 29.3 | % | | | 26.7 | % | | | 28.6 | % | | | 42.7 | % |
Restructuring and Other Charges Tax Benefit | | | | | | | 0.6 | % | | | 1.0 | % | | | 0.0 | % | | | — | | | | 0.7 | % | | | -0.6 | % | | | -0.4 | % | | | 0.0 | % | | | 0.0 | % |
AJCA Tax Benefit | | | | | | | — | | | | 9.3 | % | | | — | | | | — | | | | — | | | | — | | | | — | | | | — | | | | — | |
Tax Settlements | | | | | | | — | | | | — | | | | 1.2 | % | | | 3.0 | % | | | 7.6 | % | | | — | | | | — | | | | — | | | | — | |
Curtailment Tax Benefit | | | | | | | — | | | | — | | | | — | | | | 0.2 | % | | | — | | | | — | | | | — | | | | — | | | | — | |
Asset Gain Tax Expense | | | | | | | — | | | | — | | | | — | | | | -0.1 | % | | | — | | | | — | | | | — | | | | — | | | | — | |
Employee Separation Costs Tax Benefit | | | | | | | — | | | | — | | | | — | | | | — | | | | 0.2 | % | | | 0.1 | % | | | — | | | | — | | | | — | |
Shared Service Implementation Tax Benefit | | | | | | | — | | | | — | | | | — | | | | — | | | | 0.1 | % | | | — | | | | — | | | | — | | | | — | |
Insurance Recovery Tax Expense | | | | | | | — | | | | — | | | | 0.0 | % | | | — | | | | -0.2 | % | | | — | | | | — | | | | — | | | | — | |
Other Income (Primarily Asset Gains) | | | | | | | — | | | | — | | | | -0.3 | % | | | — | | | | — | | | | — | | | | — | | | | — | | | | — | |
Patent Litigation Settlement Benefit | | | | | | | — | | | | — | | | | — | | | | — | | | | — | | | | — | | | | — | | | | -1.5 | % | | | — | |
Spanish Tax Settlement | | | | | | | — | | | | — | | | | — | | | | — | | | | — | | | | — | | | | — | | | | — | | | | -16.3 | % |
| | | | | | | | | | | | | | | | | | | | | | | | | | | | | | | | | | | | | | | | |
Adjusted Effective Tax Rate | | | | | | | 30.8 | % | | | 31.9 | % | | | 29.1 | % | | | 28.4 | % | | | 27.5 | % | | | 28.8 | % | | | 26.3 | % | | | 27.1 | % | | | 26.4 | % |
| | | | | | | | | | | | | | | | | | | | | | | | | | | | | | | | | | | | | | | | |
Adjusted Operating Profit After Tax | | | | | | | 236,739 | | | | 197,623 | | | | 234,174 | | | | 262,884 | | | | 272,756 | | | | 259,815 | | | | 314,285 | | | | 345,835 | | | | 359,378 | |
| | | | | | | | | | | | | | | | | | | | | | | | | | | | | | | | | | | | | | | | |
Adjusted Return on Invested Capital * | | | | | | | 14.8 | % | | | 12.3 | % | | | 14.4 | % | | | 15.8 | % | | | 16.3 | % | | | 15.5 | % | | | 17.9 | % | | | 18.3 | % | | | 17.7 | % |
| | | | | | | | | | | | | | | | | | | | | | | | | | | | | | | | | | | | | | | | |
| * | Return on average invested capital is defined as adjusted operating profit after tax divided by 2-year average adjusted invested capital. |
The Company uses non-GAAP financial measures such as Adjusted Return on Invested Capital (ROIC) (which excludes the net impact of our restructuring and strategic initiatives, the AJCA tax benefit, tax settlements, curtailments, gains on asset sales, employee separation costs, cost associated with the implementation of our shared services, insurance recoveries, the Mane patent litigation settlement and the Spanish tax settlement) as the Company believes that these non-GAAP financial measures provide investors with an overall perspective of the period-to-period performance of our core business. Such information is supplemental to information presented in accordance with GAAP and is not intended to represent a presentation in accordance with GAAP. These non-GAAP measures may not be comparable to similarly titled measures used by other companies.
| | | | | | | | | | | | | | | | | | | | |
WORKING CAPITAL EFFEICIENCY | |
| (IN THOUSANDS U.S. $) | | Q4 2011 | | | Q1 2012 | | | Q2 2012 | | | Q3 2012 | | | Q4 2012 | |
Trade Receivables (1) | | | 478,177 | | | | 527,709 | | | | 523,389 | | | | 543,133 | | | | 508,736 | |
Inventories | | | 544,439 | | | | 555,017 | | | | 539,267 | | | | 547,676 | | | | 540,658 | |
Accounts Payable | | | (208,759 | ) | | | (189,223 | ) | | | (169,673 | ) | | | (160,956 | ) | | | (199,272 | ) |
| | | | | | | | | | | | | | | | | | | | |
Core Working Capital | | | 813,857 | | | | 893,503 | | | | 892,983 | | | | 929,853 | | | | 850,122 | |
| | | | | |
FY 2012 Net Sales | | | | | | | | | | | | | | | | | | | 2,821,446 | |
| | | | | | | | | | | | | | | | | | | | |
Core Working Capital as a % of Net Sales* | | | | | | | | | | | | | | | | | | | 31.1 | % |
| | | | | | | | | | | | | | | | | | | | |
| | | | | |
| (IN THOUSANDS U.S. $) | | Q4 2010 | | | Q1 2011 | | | Q2 2011 | | | Q3 2011 | | | Q4 2011 | |
Trade Receivables (1) | | | 460,274 | | | | 528,541 | | | | 553,335 | | | | 524,893 | | | | 478,177 | |
Inventories | | | 531,675 | | | | 559,550 | | | | 568,162 | | | | 534,765 | | | | 544,439 | |
Accounts Payable | | | (200,153 | ) | | | (185,205 | ) | | | (166,438 | ) | | | (180,931 | ) | | | (208,759 | ) |
| | | | | | | | | | | | | | | | | | | | |
Core Working Capital | | | 791,796 | | | | 902,886 | | | | 955,059 | | | | 878,727 | | | | 813,857 | |
| | | | | |
FY 2011 Net Sales | | | | | | | | | | | | | | | | | | | 2,788,018 | |
| | | | | | | | | | | | | | | | | | | | |
Core Working Capital as a % of Net Sales* | | | | | | | | | | | | | | | | | | | 31.1 | % |
| | | | | | | | | | | | | | | | | | | | |
| | | | | |
| (IN THOUSANDS U.S. $) | | Q4 2009 | | | Q1 2010 | | | Q2 2010 | | | Q3 2010 | | | Q4 2010 | |
Trade Receivables (1) | | | 456,674 | | | | 480,553 | | | | 486,638 | | | | 521,524 | | | | 460,274 | |
Inventories | | | 444,977 | | | | 446,912 | | | | 454,608 | | | | 503,991 | | | | 531,675 | |
Accounts Payable | | | (161,027 | ) | | | (154,451 | ) | | | (155,056 | ) | | | (169,652 | ) | | | (200,153 | ) |
| | | | | | | | | | | | | | | | | | | | |
Core Working Capital | | | 740,624 | | | | 773,014 | | | | 786,190 | | | | 855,863 | | | | 791,796 | |
| | | | | |
FY 2010 Net Sales | | | | | | | | | | | | | | | | | | | 2,622,862 | |
| | | | | | | | | | | | | | | | | | | | |
Core Working Capital as a % of Net Sales* | | | | | | | | | | | | | | | | | | | 30.1 | % |
| | | | | | | | | | | | | | | | | | | | |
| | | | | |
| (IN THOUSANDS U.S. $) | | Q4 2008 | | | Q1 2009 | | | Q2 2009 | | | Q3 2009 | | | Q4 2009 | |
Trade Receivables (1) | | | 412,127 | | | | 430,219 | | | | 484,550 | | | | 490,549 | | | | 456,674 | |
Inventories | | | 479,567 | | | | 452,282 | | | | 441,007 | | | | 435,744 | | | | 444,977 | |
Accounts Payable | | | (114,997 | ) | | | (95,303 | ) | | | (117,892 | ) | | | (140,597 | ) | | | (161,027 | ) |
| | | | | | | | | | | | | | | | | | | | |
Core Working Capital | | | 776,697 | | | | 787,198 | | | | 807,665 | | | | 785,696 | | | | 740,624 | |
| | | | | |
FY 2009 Net Sales | | | | | | | | | | | | | | | | | | | 2,326,158 | |
| | | | | | | | | | | | | | | | | | | | |
Core Working Capital as a % of Net Sales* | | | | | | | | | | | | | | | | | | | 33.5 | % |
| | | | | | | | | | | | | | | | | | | | |
| | | | | |
| (IN THOUSANDS U.S. $) | | Q4 2007 | | | Q1 2008 | | | Q2 2008 | | | Q3 2008 | | | Q4 2008 | |
Trade Receivables | | | 412,221 | | | | 464,251 | | | | 477,195 | | | | 470,363 | | | | 412,127 | |
Inventories | | | 484,222 | | | | 512,034 | | | | 525,651 | | | | 509,281 | | | | 479,567 | |
Accounts Payable | | | (130,992 | ) | | | (133,236 | ) | | | (137,178 | ) | | | (115,511 | ) | | | (114,997 | ) |
| | | | | | | | | | | | | | | | | | | | |
Core Working Capital | | | 765,451 | | | | 843,049 | | | | 865,668 | | | | 864,133 | | | | 776,697 | |
| | | | | |
FY 2008 Net Sales | | | | | | | | | | | | | | | | | | | 2,389,372 | |
| | | | | | | | | | | | | | | | | | | | |
Core Working Capital as a % of Net Sales* | | | | | | | | | | | | | | | | | | | 34.4 | % |
| | | | | | | | | | | | | | | | | | | | |
| * | Core working capital as a % of net sales is defined as 5-quarter average core working capital divided by full year net sales |
| (1) | Q1 2013, Q1 - Q3 2011, Q1 - Q4 2010 and Q4 2009 have been revised to be consistent with other periods presented. |
| | | | | | | | | | | | | | | | | | | | | | | | | | | | | | | | | | | | | | | | | | | | | | | | |
ADJUSTED CASH FLOWS FROM OPERATIONS | |
| (IN THOUSANDS U.S. $) | | 2004 | | | 2005 | | | 2006 | | | 2004 - 2006 | | | 2007 | | | 2008 | | | 2009 | | | 2007 - 2009 | | | 2010 | | | 2011 | | | 2012 | | | 2010 - 2012 | |
Cash Flows Provided By Operating Activities | | | 295,847 | | | | 177,160 | | | | 281,619 | | | | 754,626 | | | | 314,062 | | | | 220,613 | | | | 291,637 | | | | 826,312 | | | | 315,136 | | | | 189,190 | | | | 323,796 | | | | 828,122 | |
Payments Pursuant To Patent Litigation Settlement | | | — | | | | — | | | | — | | | | | | | | — | | | | — | | | | — | | | | | | | | — | | | | 39,995 | | | | — | | | | | |
Payments Pursuant To Spanish Tax Settlement | | | — | | | | — | | | | — | | | | | | | | — | | | | — | | | | — | | | | | | | | — | | | | — | | | | 105,503 | | | | | |
| | | | | | | | | | | | | | | | | | | | | | | | | | | | | | | | | | | | | | | | | | | | | | | | |
Adjusted Cash Flows Provided By Operating Activities | | | 295,847 | | | | 177,160 | | | | 281,619 | | | | 754,626 | | | | 314,062 | | | | 220,613 | | | | 291,637 | | | | 826,312 | | | | 315,136 | | | | 229,185 | | | | 429,299 | | | | 973,620 | |
The Company uses non-GAAP financial measures such as adjusted cash flows provided by operations (which excludes payments made related to the Mane patent litigation settlement an Spanish tax settlement) as the Company believes that these non-GAAP financial measures provide investors with an overall perspective of the period-to-period performance of our core business. Such information is supplemental to information presented in accordance with GAAP and is not intended to represent a presentation in accordance with GAAP. These non-GAAP measures may not be comparable to similarly titled measures used by other companies.