 American Growth Fund, Inc.
Semi Annual Report
Series Two
For six months ended
January 31, 2015
Series One Page 1
Dear Shareholders:
I am pleased to deliver to you the American Growth Fund Series Two Annual Report for the six months ending January 31, 2015.
Investment StrategyWe use a fundamental top down approach to manage your portfolio. First we look at the general economic outlook, then we look at the industries that we feel have the biggest growth potential in the current economy. From that, our objective is to choose the best companies in those industries. Many of the stocks in your portfolio are household names that you will easily recognize.
Performance OverviewYour American Growth Fund Series Two Class E Shares delivered you a 1.77% return since July 31, 2014 through close of business on January 31, 2015. The Dow Jones Industrial Average posted a gain of 3.63% since July 31, 2014 through close of business on January 31, 2015 while the S&P 500 posted a gain of 3.33% since July 31, 2014 through close of business on July 31, 2015. Additional data, including long term performance data, can be found on page 18 of this report. Past performance is no guarantee of future results.
Manager´s DiscussionThe American economy continues to improve, evidenced by the gross domestic product increase of 2.2% in the forth quarter of 2014. This is according to the second estimate released by the Bureau of Economic Analysis
1. Additionally, we have seen a decrease in unemployment to 5.5%
2 as compared to the February 2014 rate of 6.7%
2. This is an improvement of 18%. The Federal Reserve Bank continues to keep policy in place that will stimulate the growth of the economy. The markets have reacted positively to this news and are near record highs; a sign that the investment community is anticipating economic growth. There are still challenges ahead which may dampen our growth rate:
* dollar value against the world currency
* price of oil and how it effects the world economy
* lack of bipartisanship
* the European debt crisis
* Greece´s bailout
As we look at these indicators of how our economy is doing, we are bullish that we have seen the worst. It is my hope that we will see continued growth in the gross domestic product in the upcoming months. While there are still problems that need to be addressed and dealt with, we are confident that the economic issues that present themselves will be correctly managed by our government as well as those of other countries.
We feel that problems in the global markets are being managed effectively; nevertheless, we are monitoring these areas closely. World economies, and how they are managed by the governments involved, will help to shape our economy in both the short and long term. I believe that the United States economy is not only recovering but may lead and outperform the overall world economy. There may be some short term corrections and adjustments in the overall economy yet to come and the markets may react. Accordingly, in the next 6 months, we may see the markets move to compensate for the world economic environment.
The position of your portfolio should take advantage of the current economic outlook as well as changes in our domestic policy. Of course this may be adjusted as economic trends emerge. The top three Industry that have attributed the most to the Fund are:
* Diversified Machinery
* Chemical Specialty Industry
* Biotechnology Industry
My staff and I are always available to discuss your account or answer any question you might have. Please call our toll free number, 800 525-2406 or, within Colorado, 303-626-0600.
American Growth Fund wishes you
A Good
Future!
Sincerely,
Timothy Taggart
1. http://bea.gov/newsreleases/national/gdp/gdpnewsrelease.htm
2. http://data.bls.gov/timeseries/LNS14000000
Series One Page 2
How American Growth Fund, Inc. Series Two
Has Its Shareholders´ Money Invested
STATEMENT OF INVESTMENTS
January 31, 2015 (unaudited)
| Description of Security | Shares | Market Value |
COMMON STOCK| Diversified Machinery 13.55% | | |
| 3 M Co. | 1,000 | $ 162,300 |
| (Operates as a diversified technology company worldwide.) | | |
| Cummins, Inc. | 1,000 | 139,460 |
| (Cummins Inc. designs, manufactures, distributes and services diesel engines for the heavy-duty, medium-duty and light-duty truck, bus auto and industrial markets, electric-power-generation systems and engine-related component products.) | |
Z |
| | 301,760 |
| |
Z |
| Chemical (Specialty) 10.10% | | |
| New Market Corp. | 500 | 224,835 |
| (Engages in the petroleum additives and real estate development businesses.) | |
Z |
| Biotechnology 9.41% | | |
| Gilead Sciences Inc. | 2,000 | 209,660 |
| (A biopharmaceutical company, engages in the discovery, development and commercialization of therapeutics for the treatment of life threatening diseases worldwide.) | |
Z |
| Personal Computer 7.36% | | |
| Apple Inc. | 1,400 | 164,024 |
| (With subsidiaries, designs, manufactures, and markets mobile communication and media devices, personal computers, and portable digital music players, sells related software, services, peripherals, networking solutions, and third-party digital content and applications worldwide.) | |
Z |
| Household Product 7.27% | | |
| Church & Dwight Co. | 2,000 | 161,840 |
| (With its subsidiaries, develops, manufactures and markets a range of household, personal care and specialty products under various brand names in the United States and internationally.) | |
Z |
| Computer Software 7.26% | | |
| Microsoft. | 4,000 | 161,600 |
| (Mircosoft Corp. is the largest independent maker of software. It develops and sells software products for a wide range of computing devices.) | |
Z |
*Non-income producing security See accompanying notes to financial statements.Series One Page 3
How American Growth Fund, Inc. Series One
Has Its Shareholders´ Money Invested
STATEMENT OF INVESTMENTS
January 31, 2015 (unaudited)
| Description of Security | Shares | Market Value |
COMMON STOCK (continued)
| Internet Information 7.22% | | |
| Google Inc. Class C* | 150 | $ 80,633 |
| (Maintains an index of Web sites and other online content for users, advertisers and Google network members and other content providers.) | | |
| Google Inc. Class A* | 150 | 80,178 |
| (Maintains an index of Web sites and other online content for users, advertisers and Google network members and other content providers.) | |
Z |
| | 160,811 |
| |
Z |
| Credit Services 7.08% | | |
| Credit Acceptance Corp.* | 1,000 | 157,640 |
| (Provides auto loans to consumers primarily in the United States.) | |
Z |
| Drug 7.00% | | |
| Novo Nordisk* | 3,500 | 155,960 |
| (A healthcare company, engages in the discovery, development, manufacture and marketing of pharmaceuticals products in Denmark and internationally.) | |
Z |
| Jewelry Stores 5.45% | | |
| Tiffany & Co. | 1,400 | 121,296 |
| (Through its subsidiaries, engages in the design, manufacture, and retail of fine jewelry worldwide.) | |
Z |
| Auto 5.28% | | |
| Ford Motor Co. | 8,000 | 117,680 |
| (Primarily develops, manufactures, distributes and services vehicles and parts worldwide.) | |
Z |
| Restaurant 4.54% | | |
| YUM! Brands, Inc. | 1,400 | 101,192 |
| (With its subsidiaries, operates as a quick service restaurant company in the United States and internationally.) | |
Z |
| Telecom Equipment 4.21% | | |
| Qualcomm Inc. | 1,500 | 93,690 |
| (Engages in the development, design, manufacture and marketing of digital wireless telecommunications products and services.) | |
Z |
*Non-income producing security See accompanying notes to financial statements.Series One Page 4
How American Growth Fund, Inc. Series One
Has Its Shareholders´ Money Invested
STATEMENT OF INVESTMENTS
January 31, 2015 (unaudited)
| Description of Security | Shares | Market Value |
COMMON STOCK (continued)
| Beverage 3.71% | | |
| Diageo plc | 700 | $ 82,691 |
| (Engages in producing, distilling, brewing, bottling, packaging, distributing, developing and marketing spirits, beer and wine products.) | |
Z |
| Total Common Stocks (cost $1,275,419) - 99.44% | | $2,214,679 |
| |
Z |
| Total Investments, at Market Value (cost $1,275,419) | 99.44% | 2,214,679 |
| Other Assets, Less Liabilities | 0.56% | 12,504 |
| Net Assets |
100.00% |
$2,227,183 |
|
Z |
Z |
*Non-income producing security See accompanying notes to financial statements.Series One Page 5
Financial Statements
AMERICAN GROWTH FUND, INC. SERIES TWO
STATEMENT OF ASSETS AND LIABILITIES, January 31, 2015 (unaudited)
| ASSETS: | |
| Investments, at market value (cost $1,275,419) | $ 2,214,679 |
| Cash | 19,707 |
| Receivables: | |
| Dividends and interest | 1,774 |
| Total assets |
2,236,160 |
| LIABILITIES: |
Z |
| 12b-1 fees | 7,084 |
| Management fee | 1,893 |
| Total liabilities |
8,977 |
| NET ASSETS |
$ 2,227,183 |
| COMPOSITION OF NET ASSETS: |
|
| Paid-in capital | $ 1,419,975 |
| Accumulated net realized loss from investment transactions | (132,052) |
| Net unrealized appreciation of investments | 939,260 |
| Net assets |
$ 2,227,183 |
| NET ASSET VALUE PER SHARE: |
|
| Class E Shares: | |
| Net asset value and redemption price per share (based on net assets of $1,502,548 and 130,912 shares of beneficial interest outstanding) | $11.48 |
| Maximum offering price per share (net asset value plus sales charge of 5.75% of offering price) | $12.18 |
| Class F Shares: | |
| Net asset value, redemption price and offering price per share (based on net assets of $724,635 and 64,845 shares of beneficial interest outstanding) | $11.17 |
See accompanying notes to financial statements.Series One Page 6
Financial Statements
AMERICAN GROWTH FUND, INC. SERIES TWO
STATEMENT OF OPERATIONS FOR THE SIX MONTHS ENDED January 31, 2015 (unaudited)
| INVESTMENT INCOME: | |
| Dividends (Net of $0 foreign withholding tax) | $ 17,214 |
| Total investment income |
17,214 |
|
Z |
| EXPENSES: | |
| Investment advisory fees (Note 3) | 11,496 |
| Administration expenses (Note 3) | 15,359 |
| Transfer agent, shareholder servicing and data processing fees (Note 3) | 2,250 |
| Accounting Fees (Note 3) | 21,477 |
| Rent expense (Note 3) | 7,663 |
| Custodian fees | 2,955 |
| Professional fees | 21,093 |
| Registration and filing fees(Note 1): | 3,280 |
| Shareholder reports | 414 |
| Distribution and service fees (Note 3): | |
| Class E | 2,343 |
| Class F | 3,687 |
| Directors fees (Note 3) | 1,377 |
| Other expenses | 1,362 |
| Total expenses |
94,756 |
| Net investment loss |
(77,542) |
|
Z |
| REALIZED AND UNREALIZED GAIN OR LOSS ON INVESTMENTS: | |
| Net realized gain on investments | 6,532 |
| Net change in unrealized appreciation on investments | 109,123 |
| Net gain on investments |
115,655 |
| Net increase in net assets resulting from operations |
$ 38,113 |
|
Z |
See accompanying notes to financial statements.Series One Page 7
Financial Statements
AMERICAN GROWTH FUND, INC. SERIES TWO
STATEMENTS OF CHANGES IN NET ASSETS
| Six Months Ended January 31, 2015 (unaudited) | Year Ended July 31, 2014 |
| INCREASE (DECREASE) IN NET ASSETS FROM OPERATIONS: |
Z |
Z |
| Net investment loss | $(77,542) | $(114,228) |
| Net realized gain (loss) on investments | 6,532 | 71,120 |
| Net change in unrealized appreciation/depreciation on investments | 109,123 | 287,491 |
| Net increase (decrease) in net assets resulting from operations |
38,113 |
244,383 |
| BENEFICIAL INTEREST TRANSACTIONS: | | |
| Net increase (decrease) in net assets resulting from beneficial interest transactions (Note 2): | | |
| Class E | (109,211) | (309,758) |
| Class F | (15,694) | (59,324) |
| Net change in net assets derived from beneficial interest transactions |
(124,905) |
(369,082) |
| Total increase |
(86,792) |
(124,699) |
| Net Assets - Beginning of year | 2,313,975 | 2,438,674 |
| Net Assets - End of year |
$2,227,183 |
$2,313,975 |
|
Z |
Z |
See accompanying notes to financial statements.Series One Page 8
Financial Statements
| Class E Six Months Ended January 31, (unaudited) | Year Ended July 31, | | | For the period February 23, 2011 (inception) to July 31, 2011 |
| 2015 | 2014 | 2013 | 2012 | 2011 |
| Per Share Operating Data: | | | | | |
| Net Asset Value, | | | | | |
| Beginning of Period | $11.28 | $10.14 | $8.78 | $9.43 | $10.00 |
| Income gain (loss) from investment operations: |
Z |
Z |
Z |
Z |
Z |
| Net investment loss | (0.02)5 | (0.50)5 | (0.37)5 | (0.40) | (0.16) |
| Net realized and unrealized gain (loss) | 0.22 | 1.64 | 1.73 | (0.25) | (0.41) |
| Total income gain (loss) from investment operations |
0.20 |
1.14 |
1.36 |
(0.65) |
(0.57) |
| Net Asset Value, End of Period |
$11.48 |
$11.28 |
$10.14 |
$8.78 |
$9.43 |
| Total Return at Net Asset Value1 |
1.8%4 |
11.2% |
15.5% |
(6.9)% |
(5.7)%4 |
| Ratios/Supplemental Data: | | | | | |
| Net assets, end of period (in thousands) | $1,503 | $1,584 | $1,721 | $1,508 | $1,392 |
| Ratio to average net assets: |
Z |
Z |
Z |
Z |
Z |
| Net investment loss | (4.76)%3 | (4.58)% | (3.92)% | (4.74)% | (5.25)%3 |
| Expenses | 8.02%3 | 6.16% | 6.04% | 6.38% | 6.30%3 |
| Portfolio Turnover Rate2 | 0%4 | 4% | 25% | 21% | 9%4 |
| Class F Six Months Ended January 31, (unaudited) | Year Ended July 31, | | | For the period February 23, 2011 (inception) to July 31, 2011 |
| 2015 | 2014 | 2013 | 2012 | 2011 |
| Per Share Operating Data: | | | | | |
| Net Asset Value, | | | | | |
| Beginning of Period | $11.02 | $9.98 | $8.70 | $9.40 | $10.00 |
| Income gain (loss) from investment operations: |
Z |
Z |
Z |
Z |
Z |
| Net investment loss | (0.11)5 | (0.57)5 | (0.43)5 | (0.46) | (0.18) |
| Net realized and unrealized gain (loss) | 0.26 | 1.61 | 1.71 | (0.24) | (0.42) |
| Total income gain (loss) from investment operations |
0.15 |
1.04 |
1.28 |
(0.70) |
(0.60) |
| Net Asset Value, End of Period |
$11.17 |
$11.02 |
$9.98 |
$8.70 |
$9.40 |
| Total Return at Net Asset Value1 |
1.4%4 |
10.4% |
14.7% |
(7.5)% |
(6.0)%4 |
| Ratios/Supplemental Data: | | | | | |
| Net assets, end of period (in thousands) | $725 | $730 | $718 | $625 | $558 |
| Ratio to average net assets: |
Z |
Z |
Z |
Z |
Z |
| Net investment loss | (5.46)%3 | (5.28)% | (4.62)% | (5.48)% | (5.80)%3 |
| Expenses | 8.72%3 | 6.86% | 6.74% | 7.14% | 6.84%3 |
| Portfolio Turnover Rate2 | 0%4 | 4% | 25% | 21% | 9%4 |
1. Assumes a hypothetical initial investment on the business day before the first day of the fiscal period with all dividends and distributions reinvested in additional shares on the reinvestment date and redemption at the net asset value calculated on the last business day of the fiscal period. Sales charges are not reflected in total returns.
2. The lesser of purchases or sales of portfolio securities for a period, divided by the monthly average of the market value of securities owned during the period. Securities with a maturity or expiration date at the time of acquisition of one year or less are excluded from the calculation. Purchases and sales of investment securities (other than short-term securities) from the period ended January 31, 2015, aggregated $0 and $192,558, respectively.
3. Annualized.
4. Not annualized.
5. Per share amounts have been calculated using the Average Shares Method.
See accompanying notes to financial statements.Series One Page 9
Notes to Financial Statements
American Growth Fund, Inc. Series Two (unaudited)
1. Summary of Significant Accounting PoliciesAmerican Growth Fund, Inc. (the "Fund") is registered under the Investment Company Act of 1940, as amended, as a diversified, open-end management investment company. The Fund is an investment company and accordingly follows the investment company accounting and reporting guidance of the Financial Accounting Standards Board (FASB) Accounting Standard Codification Topic 946 "Financial Services - Investment Companies." The Fund´s primary investment objective is to seek capital appreciation. The Fund´s investment advisor is Investment Research Corporation (IRC). The Fund offers Class E and Class F shares. Class E has a maximum sales charge (load) imposed on purchases (as a percentage of offering price) of 5.75%. Purchases of Class E shares in amounts of $1,000,000 or more which are not subject to an initial sales charge generally will be subject to a contingent deferred sales charge of 1.0% of amounts redeemed within the first year of purchase. Class F has a maximum deferred sales charge as a percentage of original purchase price or redemption proceeds, whichever is lower, of 1% for the first year. All classes of shares have identical rights to earnings, assets and voting privileges, except that each class has its own distribution and/or service plan and expenses directly attributable to that class and exclusive voting rights with respect to matters affecting that class.
Reclassifications - Accounting principles generally accepted in the United States of America require that certain components of net assets be reclassified between financial and tax reporting. These reclassifications have no effect on net assets or net asset value per share.
Investment Valuation - Investment securities traded on the New York Stock Exchange or other stock exchange approved for this purpose by the board of directors will be valued on the basis of the closing sale thereof on such stock exchange, or, if such sale is lacking, at the mean between closing bid and asked prices on such day. If no bid and asked prices are quoted for such day or information as to New York or other approved exchange transactions is not readily available, the security will be valued by reference to recognized composite quotations or such other method as the board of directors in good faith deems will reflect its fair market value. Securities not traded on any stock exchange but for which market quotations are readily available are valued on the basis of the mean of the last bid and asked prices. Short-term securities are valued at the mean between the closing bid and asked prices or by such other method as the board of directors determines to reflect their fair market value. The board of directors in good faith determines the manner of ascertaining the fair market value of other securities and assets.
Allocation of Income, Expenses, Gains and Losses - Income, expenses (other than those attributable to a specific class), gains and losses are allocated daily to each class of shares based upon the relative proportion of net assets represented by such class. Operating expenses directly attributable to a specific class are charged against the operations of that class.
Federal Income Taxes - No provision for federal income or excise taxes has been made because the Fund intends to comply with the provisions of subchapter M of the Internal Revenue Code applicable to regulated investment companies and to distribute all of its taxable income to shareholders.
The Fund recognizes the tax benefits of uncertain tax positions only where the position is "more likely than not" to be sustained assuming examination by tax authorities. Management has analyzed the Fund´s tax positions, and has concluded that no liability for unrecognized tax benefits should be recorded related to uncertain tax positions taken on the open tax year 2011-2013 and expected to be taken in the Fund´s 2014 tax returns. The Fund identifies its major tax jurisdictions as U.S. Federal, Colorado State and foreign jurisdictions where the Fund makes significant investments; however the Fund is not aware of any tax positions for which it is reasonably possible that the total amounts of unrecognized tax benefits will change materially in the next twelve months.
Classification of Distributions to Shareholders - The character of distributions made during the year from net investment income or net realized gains may differ from its ultimate characterization for federal income tax purposes. Also, due to timing of dividend distributions, the fiscal year in which amounts are distributed may differ from the fiscal year in which the income or realized gain was recorded by the Fund.
Security Transactions and Related Investment Income - Investment transactions are accounted for on the date the investments are purchased or sold (trade date). Dividend income and distributions to shareholders are recorded on the ex-dividend date. Interest income is recorded on the accrual basis. Realized gains and losses from investment transactions and unrealized appreciation and depreciation of investments are reported on an identified cost basis which is the same basis used for federal income tax purposes.
Use of Estimates - The preparation of financial statements in conformity with accounting principles generally accepted in the United States requires management to make estimates and assumptions that affect the reported amounts of assets and liabilities and disclosure of contingent assets and liabilities at the date of the financial statements and the reported amounts of increases and decreases in net assets from operations during the reporting period. Actual results could differ from those estimates.
Securities Valuations - As described in note 1, the Fund utilizes various methods to measure the fair value of most of its investments on a recurring basis. U.S. GAAP establishes a hierarchy that prioritizes inputs to valuation methods. The three levels of inputs are:
Level 1 - Unadjusted quoted prices in active markets for identical assets or liabilities that the Fund has the ability to access.
Level 2 - Observable inputs other than quoted prices included in level 1 that are observable for the asset or liability, either directly or indirectly. These inputs include quoted prices for the identical instrument on an inactive market, prices for similar instruments, interest rates, prepayment speeds, credit risk, yield curves, default rates and similar data.
Level 3 - Unobservable inputs for the asset or liability, to the extent relevant observable inputs are not available, representing the Fund´s own assumptions about the assumptions a market participant would use in valuing the asset or liability, and would be based on the best information available.
The availability of observable inputs can vary from security to security and is affected by a wide variety of factors, including, for example, the type of security, whether the security is new and not yet established in the marketplace, the liquidity of markets, and other characteristics particular to the security. To the extent that valuation is based on models or inputs that are less observable or unobservable in the market, the determination of fair value requires more judgment. Accordingly, the degree of judgment exercised in determining fair value is greatest for instruments categorized in level 3.
See accompanying notes to financial statements.Series One Page 10
Notes to Financial Statements
American Growth Fund, Inc. Series Two (unaudited)
The inputs used to measure fair value fall into different levels of the fair value hierarchy. In such cases, for disclosure purposes, the level in the fair value hierarchy within which the fair value measurement falls in its entirety, is determined based on the lowest level input that is significant to the fair value measurement in its entirety.
The following is a summary of the inputs used, as of January 31, 2015, in valuing the Fund´s assets carried at fair value:
| Equity | Level 1 | Level 2 | Level 3 | Total |
| Common Stock | $ 2,214,679 | 0 | 0 | $ 2,214,679 |
The industry classifications of Level 1 investments are included in the Statement of Investments.
There were no transfers in to or out of Level 1 or Level 2 for the period ended January, 31, 2015. Transferred are recognized at the end of the reporting period.
2. Shares of Beneficial InterestThe Fund has authorized an unlimited number of no par value shares of beneficial interest of each class. Transactions in shares of beneficial interest were as follows:
| Year Ended July 31, 2014 | | Year Ended July 31, 2013 | |
| Shares | Amount | Shares | Amount |
Class E: |
Z |
Z |
Z |
Z |
| Sold | 148 | $1,722 | 401 | $4,474 |
| Dividends and distributions reinvested | - | - | - | - |
| Redeemed | (9,695) | (110,933) | (29,599) | (314,232) |
| Net decrease (increase) |
(9,547) |
$(109,211) |
(29,198) |
$(309,758) |
Class F: |
Z |
Z |
Z |
Z |
| Sold | 192 | $2,138 | 56 | $600 |
| Dividends and distributions reinvested | - | - | - | - |
| Redeemed | (1,616) | (17,832) | (5,699) | (59,924) |
| Net (decrease) increase |
(1,424) |
$(15,694) |
(5,643) |
$(59,324) |
Z |
Z |
Z |
Z |
Z |
3. Underwriting, Investment Advisory Contracts, Service Fees and Other Related PartiesUnder the investment advisory contract with IRC, the advisor receives annual compensation for investment advice, computed and paid monthly, equal to 1% of the first $30 million of the Fund´s average annual net assets and 0.75% such assets in excess of $30 million. The Fund pays its own operating expenses.
In June of 2013 IRC underwent a change of ownership. The Board of Directors of the Fund was kept fully informed during this change of ownership and in August of 2013 approved a new Investment Advisory Agreement, which is discussed in more detail later in this Annual Report.
Class F shares are subject to annual service and distribution fees of 0.25% and 0.75% of average daily net assets, respectively. Class E shares are subject to annual service and distribution fees no greater than 0.30% of average daily net assets, respectively.
For the six months ended January 31, 2015 commissions and sales charges paid by investors on the purchase of Fund shares totaled $70 of which $25 was retained by World Capital Brokerage, Inc. ("WCB"), an affiliated broker/dealer which serves as the underwriter and distributor of the Fund. Sales charges advanced to broker/dealers by WCB on sales of the Fund´s Class F shares totaled $21.
Series One Page 11
Notes to Financial Statements
American Growth Fund, Inc. Series Two (unaudited)
For the six months ended January 31, 2015, WCB received contingent deferred sales charges of $0 upon redemption of Class F shares, as reimbursement for sales commissions advanced by WCB upon the sale of such shares. No payments were made by the Fund to WCB for brokerage commission on securities transactions.
Certain officers of the Fund are also officers of WCB and IRC. For six months ended January 31, 2015, the Fund paid directors´ fees and expenses of $1,377.
For the six months ended January 31, 2015, under an agreement with IRC, the Fund was charged $15,359 for the costs and expenses related to employees of IRC who provided administrative, clerical and accounting services to the Fund. In addition, the Fund was charged $7,663 by an affiliated company of IRC for the rental of office space.
Commonwealth Fund Accounting, Inc., an indirect wholly-owned subsidiary of Commonwealth Shareholder Services, Inc., serves as the Fund´s fund accountant and, in that capacity, performs daily pricing and various other accounting services for the Fund. Commonwealth Fund Services, Inc., also an indirect wholly-owned subsidiary of Commonwealth Shareholder Services, Inc., serves as the Fund´s transfer agent and dividend disbursing agent. For the six months ended January 31, 2015, the Fund incurred $15,356 and $2,250 in accounting and transfer agent fees, respectively. A Director of the Fund serves as Treasurer and Director of Commonwealth Shareholder Services, Inc.
4. Federal Income Tax MattersDividends paid by the Fund from net investment income and distributions of net realized short-term capital gains are, for federal income tax purposes, taxable as ordinary income to shareholders.
The Fund distributes net realized capital gains, if any, to its shareholders at least annually, if not offset by capital loss carryovers. Income distributions and capital gain distributions are determined in accordance with income tax regulations, which may differ from accounting principles generally accepted in the United States. These differences are primarily due to the differing treatment of net operating losses, foreign currency and tax allocations. Accordingly, these permanent differences in the character of income and distributions between financial statements and tax basis have been reclassified to paid-in capital.
As of July 31, 2014 the components of distributable losses on a tax-basis were as follows:
| Unrealized appreciation | 830,137) |
| Capital loss carryforward | (152,358) |
|
677,779 |
|
Z |
As of July 31, 2014, the Fund had capital loss carryforwards of $152,358 which do not expire. These capital loss carryforwards retain their original character of $55,865 short term loss and $96,493 long term loss.
As of July 31, 2014, cost and unrealized appreciation (depreciation) on a tax-basis were as follows:
| Tax cost | $ 1,461,445 |
| Gross appreciation | $ 834,166 |
| Gross depreciation | (4,029) |
| Net appreciation |
$ 830,147 |
|
Z |
5. Subsequent EventsIn preparing these financial statements, the Fund has evaluated events and transactions for potential recognition or disclosure through the date these financial statements were issued.
6. Review of Affiliated Company´s Expenses - The Fund´s Audit Committee reviews, on a monthly and quarterly basis, the details of each expense incurred by the Fund. These expenses are then presented to the Fund´s Board of Directors for review and approval.
For the six months ended 01/31/2015 the Fund reimbursed its affiliated companies, World Capital Brokerage, Inc. $21,804, Investment Research Corporation $83,974, AGF Properties, Inc. $68,453, for expenses incurred. The profitability to the affiliated companies were World Capital Brokerage, Inc. $13,608, Investment Research Corporation $26,073, AGF Properties, Inc. $3,914.
Series One Page 12
Analysis of Expenses (unaudited)
As a shareholder of the Fund, you may incur two types of costs: (1) transaction costs, including front-end sales charges with respect to Class E shares or contingent deferred sales charges ("CDSC") with respect to Class F shares; and (2) ongoing costs, including management fees; distribution and/or service (12b-1) fees; and other Fund expenses. The tables below are intended to help you understand your ongoing costs (in dollars) of investing in the Fund and to compare these costs with the ongoing costs of investing in other mutual funds.
The tables below are based on an investment of $1,000 invested on August 01, 2014 and held for the six months ended January 31, 2015.
Actual expensesThis table provides information about actual account values and actual expenses. You may use the information provided in this table, together with the amount you invested, to estimate the expenses that you paid over the period. To estimate the expenses you paid on your account, divide your ending account value by $1,000 (for example, an $8,600 ending account value divided by $1,000 = 8.6), then multiply the result by the number under the heading entitled "Expenses Paid During the year".
For the six months ended January 31, 2015
| Actual Total Return Without Sales Charges(1) | Beginning Account Value | Ending Account Value | Expenses Paid During The Year(2) |
| Class E |
1.77% |
$1,000.00 |
$936.08 |
$81.62 |
| Class F | 1.36% | $1,000.00 | $925.22 | $88.38 |
(1) Assumes reinvestment of all dividends and capital gain distributions, if any, at net asset value and does not reflect the deduction of the applicable sales charges with respect to Class E shares or the applicable Contingent Deferred Sales Charges ("CDSC") with respect to Class F Shares. Total return is annualized.
(2) Expenses are equal to the annualized expense ratio of 8.02% and 8.72% for the Fund´s Class E and F shares, respectively, multiplied by the average account value over the year.
Hypothetical example for comparison purposesThe table below provides information about hypothetical account values and hypothetical expenses based on the actual expense ratio and an assumed rate of return of 5.00% per year before expenses, which is not the Fund´s actual return. The hypothetical account values and expenses may not be used to estimate the actual ending account balance or expenses you paid for the period. You may use the information provided in this table to compare the ongoing costs of investing in the Fund and other mutual funds. To do so, compare this 5.00% hypothetical example relating to the Fund with the 5.00% hypothetical examples that appear in the shareholder reports of other mutual funds.
Please note that the expenses shown in the table below are meant to highlight your ongoing costs only and do not reflect any transactional costs. The example does not reflect the deduction of contingent deferred sales charges ("CDSC") with respect to Class F shares. Therefore, the table is useful in comparing ongoing costs only, and will not help you determine the relative total costs of owning different mutual funds. In addition, if these transaction costs were included, your costs would have been higher.
For the twelve months ended January 31, 2015
| Hypothetical Annualized Total Return | Beginning Account Value | Ending Account Value | Expenses Paid During The Year(1) |
| Class E |
5.00% |
$1,000.00 |
$942.99 |
$82.22 |
| Class F | 5.00% | $1,000.00 | $935.81 | $89.39 |
(1) Expenses are annualized expense ratio of 8.02% and 8.72% for the Fund´s Class E and F shares, respectively, multiplied by the average account value over the year.
Series One Page 13
Allocation of Portfolio Assets(Calculated as a percentage of Net Assets)
January 31, 2015
| Sector Breakdown | |
Diversified Machinery | 13.55% |
| Chemical (Specialty) | 10.10% |
| Biotechnology | 9.41% |
| Personal Computer | 7.36% |
| Household Product | 7.27% |
| Computer Software | 7.26% |
| Internet Information | 7.22% |
| Credit Services | 7.08% |
| Drug | 7.00% |
| Jewelry Stores | 5.45% |
| Automotive | 5.28% |
| Restaurant | 4.54% |
| Telecom Equipment | 4.21% |
| Beverage | 3.71% |
Investments - Common Stocks |
99.44%
Z |
| Cash and Receivables, less Liabilities | 0.56% |
Total Net Assets |
100.00% |
Z |
Z |
NOTICE TO SHAREHOLDERS at July 31, 2014 (Unaudited)
How to Obtain a Copy of the Fund´s Proxy Voting PoliciesA description of the policies and procedures that the Fund uses to determine how to vote proxies relating to portfolio securities is available without charge upon request by calling 1-800-525-2406 or on the SEC´s website at http://www.sec.gov.
How to Obtain a Copy of the Fund´s Proxy Voting Records for the 12-Month Period
Ended June 30, 2014Information regarding how the Fund voted proxies relating to portfolio securities during the most recent 12-month period ended June 30 is available without charge, upon request, by calling 1-800-525-2406. Furthermore, you can obtain the Fund´s proxy voting records on the SEC´s website at http://www.sec.gov.
Quarterly Filings on Form N-QThe Fund files its complete schedule of portfolio holdings with the SEC for the first and third quarters of each fiscal year on Form N-Q. The Fund´s Form N-Q is available on the SEC´s website at http://www.sec.gov. The Fund´s Form N-Q may be reviewed and copied at the SEC´s Public Reference Room in Washington, DC and information on the operation of the Public Reference Room may be obtained by calling 1-800-SEC-0330. Information included in the Fund´s Form N-Q is also available by calling 1-800-525-2406.
Series One Page 14
INFORMATION ABOUT TRUSTEES AND OFFICERS (Unaudited)The day-to-day operations of the Fund are managed by its officers subject to the overall supervision and control of the board of directors. The Fund´s Audit Committee meets quarterly and is responsible for reviewing the financial statements of the Fund.
The following information about the interested directors
2 of the Fund includes their principal occupations for the past five years:
| Name, Address, and Age | Position(s) Held with Fund | Term of Office1 and Length of Time Served | Principal Occupation(s) During Past 5 Years | Number of Portfolios in Fund Complex Overseen by Director | Other Directorships Held by Director for the Past Five Years |
| Timothy E. Taggart, 1636 Logan Street, Denver, CO DOB: October 18, 1953 | President, Director and Treasurer | Since April 2004 | Principal financial and accounting officer, employee of Adviser since 1983. See below for affiliation with Distributor. | 2 | Director of World Capital Brokerage, Inc. and Investment Research Corporation |
| John Pasco III, 8730 Stony Point Parkway, Suite 205, Richmond, VA DOB: April 10, 1945 | Director | Since December 2006 | Mr. Pasco is Treasurer of Commonwealth Shareholder Services, Inc., a mutual fund administrator; President of First Dominion Capital Corp., a Broker Dealer; President of Fund Services, Inc., a transfer and disbursing agent; President and Treasurer of Commonwealth Capital Management, Inc., a Registered Investment Adviser; President of Commonwealth Capital Management, LLC, a Registered Investment Advisor; President of Commonwealth Fund Accounting, Inc.; and President and Director of The World Insurance Trust, a registered investment company. | 2 | Director of Commonwealth Shareholder Services, Inc., Director of First Dominion Capital Corp., Director of Fund Services, Inc., Director of Commonwealth Fund Accounting, Inc. |
Series One Page 15
| Gerald Opalinski, 3465 Route 130 N, Harrison City, PA DOB: June 28, 1953 | Director | Since August 2013 | Owner of Opal Financial Services. See below for affiliation with Distributor. | 2 | Director of Manor Bank |
The following information about the non-interested directors, officers and advisors of the Fund includes their principal occupations for the past five years:
| Name, Address, and Age | Position(s) Held with Fund | Term of Office1 and Length of Time Served | Principal Occupation(s) During Past 5 Years | Number of Portfolios in Fund Complex Overseen by Director | Other Directorships Held by Director for the Past Five Years |
| Eddie R. Bush, 1400 W. 122nd Ave., Suite 100, Westminster, CO DOB: December 31, 1939 | Director and Audit Committee Member (financial expert) | Since September 1987 | Certified Public Accountant | 2 | None |
| Harold Rosen, 1 Middle Road, Englewood, CO DOB: July 4, 1927 | Director | Since December 1995 | Owner of Bi-Rite Furniture Stores. | 2 | None |
| Dr. Brian Brody*, 6901 S. Pierce St. Suite #100M, Littleton, CO DOB: September 23, 1952 | Director | Since June 2008 | Doctor of Professional Psychology | 2 | None |
| Mark Bomber, 1011 S. Valentia Street #91, Denver, CO DOB: October 18, 1964 | Director | Since August 2013 | United Airlines Flight Officer | 2 | None |
| Darrell E. Bush, 2714 West 118th Ave, Westminster, CO DOB: February 19, 1971 | Director | Since September 2013 | Accountant | 2 | None |
| Michael L. Gaughan, 2001 Avenue D, Scottsbluff, NE DOB: November 29, 1967 | Chief Compliance Officer and Secretary | Since September 2004 | Employee of the Fund since 1995. | N/A | World Capital Brokerage, Inc. and Investment Research Corporation |
| Patricia A. Blum, 1636 Logan Street, Denver, CO DOB: June 27, 1959 | Vice President | Since June 2013 | Employee of the Fund since 2001. | N/A | World Capital Brokerage, Inc. |
1. Trustees and officers of the fund serve until their resignation, removal or retirement.
2. Timothy Taggart, John Pasco III and Gerald Opalinski are "interested persons" of the Fund as defined by the Investment Company Act of 1940 because of the following position which they hold.
Timothy Taggart is the sole shareholder, president and a director of Investment Research Corporation. He is also president and a director of World Capital Brokerage, Inc., the Distributor.
John Pasco III is the Treasurer and a Director of Commonwealth Shareholder Services, Inc., the Fund´s administrator. President and Director of Fund Services, Inc., the Fund´s transfer agent, and President and Director of
Series One Page 16
Commonwealth Fund Accounting, Inc., the Fund´s accounting service agent.
Gerald Opalinski is a registered representative of World Capital Brokerage, Inc.
None of the above named persons received any retirement benefits or other form of deferred compensation from the Fund. There are no other funds that together with the Fund constitute a Fund Complex.
The Fund´s Statement of Additional Information includes additional information about the Fund´s trustees, and is available without charge upon request by calling 1-800-525-2406.
BOARD APPROVAL OF INVESTMENT ADVISORY AGREEMENT (Unaudited)At a meeting held on September 18, 2014, the board of trustees (the "Board") considered and approved the continuance of the investment advisory agreement (the "Advisory Agreement") with Investment Research Corp. (the "Advisor") pertaining to the American Growth Fund (the "Fund") for a period ending in September 2015. Prior to the meeting, the Board had requested and received detailed information from the Advisor regarding the Fund. This information formed the primary (but not exclusive) basis for the Board´s determinations. Below is a summary of the factors considered by the Board and the conclusions thereto that formed the basis for the Board approving the continuance of the Advisory Agreement:
1.
The nature, extent and quality of the services provided and to be provided by the Advisor under the Advisory Agreement. The Board considered the Advisor´s specific responsibilities in all aspects of day-to-day investment management of the Fund. The Board considered the qualifications, experience and responsibilities of the portfolio managers, as well as the responsibilities of other key personnel at the Advisor involved in the day-to-day activities of the Fund, including administration, marketing and compliance. The Board noted the ongoing Advisor´s commitment to responsible Fund growth. The Board also considered the resources and compliance structure of the Advisor, including information regarding its compliance program, its chief compliance officer and the Advisor´s compliance record, and the Advisor´s business continuity plan. The Board also considered the prior relationship between the Fund and the Advisor, as well as the Board´s knowledge of the Advisor´s operations. The Board concluded that the Advisor had the quality and depth of personnel, resources, investment methods and compliance policies and procedures essential to performing its duties under the Advisory Agreement and that the nature, overall quality, cost and extent of such management services are satisfactory and reliable.
2.
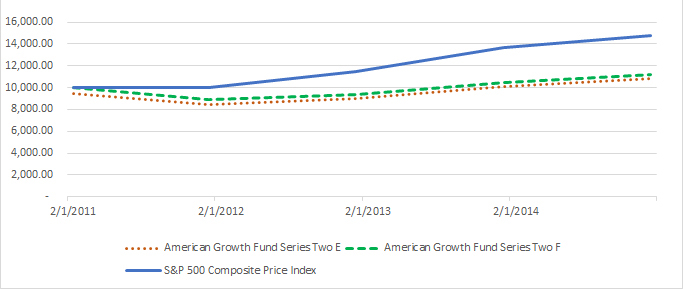
The Fund´s historical year-to-date performance and the overall performance of the Advisor. In assessing the quality of the portfolio management services delivered by the Advisor, the Board reviewed the short-term and long-term performance of the Fund on both an absolute basis, in comparison to the Standard and Poors 500 and in comparison to its peers.
Series One has been performing well against the other funds as well as the S&P 500 index in one and five year charts. Series Two shows slower results but as you can see by the charts, still tracks well with the comparison companies or the S&P 500.
3.
The costs of the services to be provided by the Advisor and the structure of the Advisor´s fees under the Advisory Agreement. In considering the advisory fee and total fees and expenses of the Fund, the Board held a discussion and concluded that based on past performance and the Advisor´s commitment to the betterment of the Fund that the fees and expenses associated with the Advisor were acceptable.
It was also noted that the Fund´s advisory fees were at an acceptable level. The Board concluded that the advisory fees paid to the Advisor were fair and reasonable in light of comparative performance and expenses.
4.
Economies of Scale. The Board also considered that economies of scale would be expected to be realized by the Advisor as the assets of the Fund grow and the Fund´s expense ratio begins to show signs of reduction. The Board concluded that there were no effective economies of scale to be shared by the Advisor at current asset levels, but considered revisiting this issue in the future as circumstances changed and asset levels increased.
5.
The profits to be realized by the Advisor and its affiliates from their relationship with the Fund. The Board considered the 12b-1 fees paid to the Advisor and to affiliates for the sale and distribution of shares and shareholder service fees paid to the advisor and underwriter as well as other fees paid to affiliates. After such review, the Board determined that the profitability rates to the Advisor with respect to the Advisory Agreement are not excessive, and that the Advisor had maintained adequate profit levels to support the services to the Fund.
No single factor was determinative of the Board´s decision to approve the continuance of the Advisory Agreement. The Board based their determination on the total mix of information available to them. Based on a consideration of all the factors in their totality, the Board determined that the advisory arrangements with the Advisor, including the advisory fee, were fair and reasonable to the Fund, and that the Fund´s shareholders received reasonable value in return for the advisory fees paid. The Board therefore determined that the continuance of the Advisory Agreement would be in the best interests of the Fund and its shareholders.
Series One Page 17
HYPOTHETICAL PERFORMANCE CHARTS (unaudited)The following charts compare the change in value of a $10,000 investment in the American Growth Fund versus the S&P 500 Index. Returns reflect a sales load for Class E and without load for Class F.
Performance data quoted represents past performance and is no guarantee of future results. The investment return and principal value of an investment will fluctuate, so that an investor´s shares, when redeemed, may be worth more or less than their original cost. The graph and table do not reflect the deduction of taxes that a shareholder would pay on fund distributions or the redemption of fund shares. Current performance data to the most recent month end can be obtained by calling 1-800-525-2406.
American Growth Fund Returns
On 2/23/2011, the Fund introduced a new Series consisting of Class E and Class F shares. Class E shares are subject to a maximum front-end sales charge of 5.75%, Class F shares are subject to a maximum contingent deferred sales charge of 5%. The Fund may incur 12b-1 expenses up to an annual maximum of .30 of 1% on its average daily net assets of its Class E shares and 1% of its average daily net assets of its Class F shares. The total annual fund operating expense ratios for Class E is 6.38% and for Class F is 7.14%. The investment return and principal value of an investment will fluctuate so that the investor´s shares, when redeemed, may be worth more or less than their original cost. Current performance may be lower or higher than the performance data quoted. This material must be preceded or accompanied by a current prospectus. If you have not received, or need a current prospectus, please feel free to call for one at 1-800-525-2406. Please read the prospectus carefully before investing. Period ending 01/31/2015.
For current month-end performance figures please call 1-800-525-2406.
| Series Two | One Year | Since Inception (February 23, 2011) |
Class E without load | 7.29% | 3.59% |
| Class E with load* | 1.15% | 2.03% |
| Class F without load | 6.48% | 2.87% |
*Includes a 5.75% sales charge based on a $10,000 initial purchase.
Series One Page 18
TRANSFER AGENT: Fund Services, Inc., 8730 Stony Point Parkway, Stony Point Bldg. III - Suite # 205, Richmond, Va. 23235
CUSTODIAN: UMB Bank NA Investment Services Group, 928 Grand Blvd, Fifth Floor, Kansas City, MO 64106
RETIREMENT PLAN CUSTODIAN: UMB Bank NA Investment Services Group, 928 Grand Blvd, Fifth Floor, Kansas City, MO 64106
INDEPENDENT REGISTERED PUBLIC ACCOUNTING FIRM: Tait, Weller & Baker LLP, 1818 Market St., Suite 2400, Philadelphia, PA 19103
LEGAL COUNSEL: Jones & Keller, 1999 Broadway, Suite 3150, Denver, CO 80202
UNDERWRITER/DISTRIBUTOR: World Capital Brokerage, Inc., 1636 Logan Street, Denver, CO 80203
OFFICERS AND DIRECTORS
Timothy E. Taggart President and Director
Eddie R. Bush Director
Harold Rosen Director
John Pasco III Director
Dr. Brian Brody Director
Mark Bomber Director
Gerald Opalinski Director
Darrell E. Bush Director
Patricia A. Blum Vice President
Michael L. Gaughan Chief Compliance Officer and Corporate Secretary
INVESTMENT ADVISORS
Investment Research Corporation
1636 Logan Street
Denver, CO 80203
OFFICERS AND DIRECTORS
Timothy E. Taggart President, Treasurer, and Director
Michael L. Gaughan Vice President, Secretary and Director
Patricia A. Blum Vice President
03/2015
Series One Page 19