UNITED STATES
SECURITIES AND EXCHANGE COMMISSION
Washington, D.C. 20549
FORM N-CSRS
CERTIFIED SHAREHOLDER REPORT OF REGISTERED
MANAGEMENT INVESTMENT COMPANIES
Investment Company Act file number_811-825_______________________________________________
American Growth Fund, Inc.______________________________________________________________
(Exact name of registrant as specified in charter)
1636 Logan Street, Denver, CO 80203______________________________________________________
(Address of principal executive offices)
(Zip code)
(Name and address of agent for service)
Registrant’s telephone number, including area code: _303-626-0600_____________________________
Date of fiscal year end: _July 31, 2022______________________________________________________
Date of reporting period: _January 31, 2022_________________________________________________
Form N-CSR is to be used by management investment companies to file reports with the Commission not later than 10 days after the transmission to stockholders of any report that is required to be transmitted to stockholders under Rule 30e-1 under the Investment Company Act of 1940 (17 CFR 270.30e-1). The Commission may use the information provided on Form N-CSR in its regulatory, disclosure review, inspection, and policymaking roles.
A registrant is required to disclose the information specified by Form N-CSR, and the Commission will make this information public. A registrant is not required to respond to the collection of information contained in Form N-CSR unless the Form displays a currently valid Office of Management and Budget (“OMB”) control number. Please direct comments concerning the accuracy of the information collection burden estimate and any suggestions for reducing the burden to Secretary, Securities and Exchange Commission, 450 Fifth Street, NW, Washington, DC 20549-0609. The OMB has reviewed this collection of information under the clearance requirements of 44 U.S.C. § 3507.

American Growth Fund, Inc – Page 2
Table of Contents
American Growth Fund, Inc Series One3
President’s Letter4
Statement of Investments8
American Growth Cannabis Fund15
President’s Letter16
Statement of Investments21
American Growth Fund, Inc. Financial Statements26
Statement of Assets and Liabilities26
Statement of Operations28
Statement of Changes30
American Growth Fund, Inc. Financial Highlights32
American Growth Fund, Inc. Series One32
American Growth Cannabis Fund36
American Growth Fund, Inc. Notes to Financial Statements37
Summary of Significant Accounting Policies37
Shares of Beneficial Interest39
Realized and Unrealized Gain and Losses on Investments40
Underwriting, Investment Advisory Contracts, Service Fees and Other Related Parties41
Federal Income Tax Matters42
Subsequent Events42
COVID-19 Virus43
Review of Affiliated Company’s Expenses43
Risk (American Growth Cannabis Fund)43
American Growth Fund, Inc. Analysis of Expenses44
American Growth Fund, Inc. Hypothetical example for comparison purposes45
American Growth Fund, Inc. Allocation of Portfolio Assets46
American Growth Fund, Inc. Notice to Shareholders47
American Growth Fund, Inc. How to Obtain a Copy of the Fund’s Proxy Voting Records47
American Growth Fund, Inc. Quarterly Filings on Form N-PORT47
American Growth Fund, Inc. Information About Trustees and Officers47
American Growth Fund, Inc. Board Approval of Investment Advisory Agreement49
American Growth Fund, Inc. Performance Charts51
American Growth Fund, Inc – Page 3
American Growth Fund, Inc – Page 4
Dear Shareholders:
Your Investment Committee is pleased to deliver to you the American Growth Fund, Inc. Series One Semi-Annual Report for the six months ended January 31, 2022.
While we are certainly living in uncertain times, it is very important to remember that the market loves predictability. We all find the events taking place in Russia and Ukraine as we write this horrifying. Events like these generally cause an initial bout of volatility followed by tremors of ups and downs but in the end, the markets stabilize and return to a more normal market pattern.
How do you deal with uncertain times in the market? With calmness and considered response. When markets have a sudden decline, a common reaction for a lot of investors is to sell their equity investments and raise cash. However, whenever you sell, you risk missing an upswing recovery in the market. You should carefully consider decisions like these; discuss them with your Representative, Advisor, or us, and then make an informed decision.
For the purposes of this letter, there are two specific functions your Investment Committee undertakes that we want to highlight in today’s market environment. First, professional management: it is our job to look at economic trends, world events, governmental activities, risks, etc. and then look at different companies that we might be able to add to the portfolio of Series One. Likewise, there are times to sell. Although the goal of Series One is to hold the positions in our portfolio for the long term, there are always exceptions. Second is diversification: one way to guard against market swings is to diversify. As you review the holdings in your portfolio, you will notice that you are invested in a wide range of types of businesses. This helps guard you against downturns in individual holdings as well as downturns in “like” companies (what we call sectors). If one sector has a difficult market day, the other sectors help support the portfolio.
A year ago we wrote that “The upside is that it appears that the country is generally moving forward in dealing with and recovering from COVID-19. While we are not out of the woods yet, businesses both local and around the world have learned how to cope with the pandemic. Lessons have been learned. Multiple vaccines have been approved, and federal and state governments are actively involved in vaccinating the public. Restaurants and businesses are returning closer to normal, sporting events are beginning to let people attend games, concert tickets are again going on sale. While your Investment Committee is optimistic that the worst is in the past, it is important to stay vigilant.” This is still true.
What is on the minds of your Investment Committee?
This is an exciting time in the tech industry. Covid 19 created the modern-day hybrid office opening the door for programs like Zoom and innovations to cell phone technologies. Cell phone technology has grown in leaps and bounds and can now track your health, exercise and even your glucose levels. Renewable energy is becoming more affordable, available and efficient. Factories are repositioning their employees from the assembly line to robotic maintenance and quality control.
The conflict in Eastern Europe is causing some ripples in our own economic environment as well as in other countries. Keep in mind as you read these next two lines, when problems arise, they create opportunities for others. “Ukraine and Russia are both major players in the world's supply of wheat, and combined they provide almost 30% of global wheat exports, according to one estimate. As financial markets do not like uncertainty over supply, they priced that risk premium in the futures markets already, making wheat futures contract prices increase over 40% in a week. US gas prices are technically at record highs but adjusted for inflation they are not there yet. Many families may be able to ride out the higher prices thanks to savings. The US consumes energy more efficiently today and the US is now the world's largest oil producer. Russia accounted for just 8% of US energy imports last year.”1 “Even before the war further accelerated price increases, robust consumer spending, solid pay raises and persistent supply shortages had sent U.S. inflation to its highest level in four decades. Propelled by surging costs for gas, food and housing, consumer inflation jumped 7.9% over the past year, the sharpest spike since 1982 and likely only a harbinger of even higher prices to come.”2
American Growth Fund, Inc – Series One – Page 5
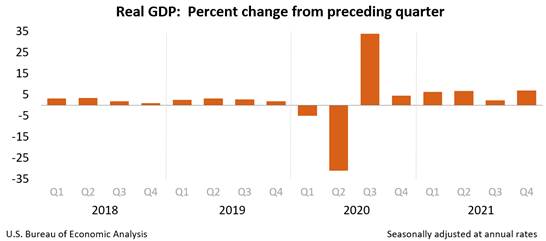
Real gross domestic product (GDP) increased at an annual rate of 7.0 percent in the fourth quarter of 2021, according to the "second" estimate released by the Bureau of Economic Analysis. In the third quarter, real GDP increased 2.3 percent. In the advance estimate, the increase in real GDP was 6.9 percent. The updated estimates primarily reflected upward revisions to nonresidential fixed investment, state and local government spending, and residential fixed investment, that were partly offset by downward revisions to personal consumption expenditures (PCE) and exports (refer to "Updates to GDP").3
In February of 2022, the unemployment rate fell to 3.8 percent, a far cry from 14.7 percent in April of 2020.4
Investment Committee
The Investment Committee that manages your Fund is made up of two veterans of the securities industry, Mr. Timothy Taggart and Mr. Robert Fleck. Mr. Taggart joined the securities industry in 1985 and is registered as a General Securities Principal, Financial and Operations Principal, Registered Options Principal and Municipal Securities Principal. Mr. Robert Fleck also joined the securities industry in 1985. He has held a General Securities license and currently is an Investment Advisor Representative. This past year the Investment Committee invited Mr. Matthew Taggart to join them. Throughout the previous years they have found his insight valuable.
Investment Strategy
Your Investment Committee uses a fundamental top-down approach to manage your portfolio. First, we look at the general economic outlook, then we look at the industries that we feel have the biggest growth potential in the current and upcoming economies. From that, our objective is to choose the best companies in those industries. Many of these companies are established, large cap (defined as companies with a market capitalization of $5 billion or more) securities many of which are household names that you may easily recognize.
American Growth Fund, Inc – Series One – Page 6
Performance Overview
Series One is invested primarily in large cap, growth-oriented domestic common stocks. When you review the portfolio on the following pages you will note that the largest investment sector is Diversified Company at 9.70% of your portfolio, and the largest security in your portfolio is Fair Isaac & Company at $1,781,964 which provides decision-making solutions to clients in the financial services, telecommunications and retail industries.
Your American Growth Fund Series One Class A Shares delivered you a 2.59% return (this number includes a sales load of 5.75% as well as Fund expenses and change in Market Value), since January 29, 2021 through close of business on January 31, 2022. The Dow Jones Industrial Average posted a gain of 19.36% while the S&P 500 posted a gain of 23.29% for the same time period as listed above.
Top 3 Performing Investments (The three stocks that contributed positively to the return are)
Investment | Industry | Percent Contribution to the Loss on the Portfolio for the six months ended January 31, 2022 | Individual Investment performance for the six months ended January 31, 2022 |
Apple, Inc | Computer Hardware | 0.99)% | 19.83)% |
Kansas City Southern | Railroad | 0.70)% | 9.63)% |
Microsoft Corporation | Application Software | 0.41)% | 9.15)% |
Bottom 3 Performing Investments (The three stocks that contributed positively to the return are)
Investment | Industry | Percent Contribution to the Loss the Portfolio for the six months ended January 31, 2022 | Individual Investment performance for the six months ended January 31, 2022 |
Charter Communications | Cable TV | (1.52)% | (20.26)% |
Teradyne, Inc. | Semiconductor Capital Equipment | (0.73)% | (7.54)% |
Fair Isaac & Co. | Computer Software and Services | (0.52)% | (5.52)% |
The investment sectors that had the most positive influence on your Series One portfolio were Computer Hardware, Railroad, and Application Software. The investment sectors that had the most adverse effect on your portfolio were Cable TV, Semiconductor Capital Equipment, and Computer Software and Services.
The performance data quoted above is past performance, which does not guarantee future results. Current performance may be lower or higher than the performance data quoted. An investment’s return and principal value will fluctuate such that an investor’s shares, when redeemed, may be worth more or less than their original cost. Additional data, including long-term performance data, can be found on page 53 of this report.
American Growth Fund, Inc – Series One – Page 7
Liquidity
As you are aware, Series One invests primarily in common stocks and securities convertible into common stock. These securities are issued by large companies, and to a lesser extent, small and mid-sized companies. Your Fund generally does not invest in illiquid securities. There are times where the Fund has sold shares of stock in order to pay for certain required services such as the annual audit performed by an independent outside auditor or legal fees. The Fund may also sell shares of stock when orders are placed to redeem shares. When either of these situations happen, your Investment Committee generally will first sell those holdings that they believe are currently, or in the future may, underperform in the market or, alternatively, they may sell holdings in sectors that the committee believes may over-weight that sector when looking at the portfolio as a whole to maintain or improve diversification.
As we look at these indicators of how our economy is doing, we generally continue to be cautiously optimistic. It is our hope that we will see continued growth in the upcoming months.
My staff and I are always available to discuss your account or answer any questions you may have. Please call our toll-free number, 800 525-2406 or, within Colorado, 303-626-0600. American Growth Fund wishes you A Good Future!
Sincerely,
Timothy E. Taggart
President
Investment Committee Member
American Growth Fund, Inc.
1. https://www.cnn.com/2022/03/09/politics/global-oil-wheat-prices-russia-what-matters/index.html
2. https://abcnews.go.com/US/wireStory/decade-inflation-high-expected-february-83357991
3. https://www.bea.gov/news/2022/gross-domestic-product-fourth-quarter-and-year-2021-second-estimate
4. https://data.bls.gov/timeseries/LNS14000000
American Growth Fund, Inc – Series One – Page 8
How American Growth Fund, Inc. Series One
Has Its Shareholders' Money Invested
STATEMENT OF INVESTMENTS
JANUARY 31, 2022 (unaudited)
|
| | Market |
Description of Security | Shares | Value |
COMMON STOCK
Diversified Company Industry 9.70%
Chemed Corp ...………………………………………………………………..…………………………………… | 3,115 | $1,460,654) |
(Operates two wholly owned subsidiaries: VITAS Healthcare Corp., end of life hospice care, and Roto-Rooter, plumbing and drain cleaning services.) | | |
Honeywell International, Inc. ……………………………………………………………………………..……….. | 2,291 | 468,464) |
(A Diversified technology and manufacturing company, serving customers worldwide with aerospace products and services, control, sensing and security technologies for buildings, homes, and industry; turbocharges and automotive products; and specialty chemicals, electronic and advanced materials, and process technology for refining and petrochemicals.) | | |
| | 1,929,118) |
Computer Software and Services Industry 8.96%
Fair Isaac Corp* ...…………………..……………………………...……………………………………...……….. | 3,600 | 1,781,964) |
(Provides decision-making solutions to clients in the financial services, telecommunications and retail industries.) | | |
Semiconductor Capital Equipment 8.92%
Teradyne, Inc ...……………………………………………………………………………………………..……… | 15,100 | 1,773,193) |
(The world's largest producer of automated test equipment for semiconductors.) | | |
Computer Hardware 5.99%
Apple Inc. …………..………………………...............………………...……………… | 6,816 | 1,191,301) |
(Designs, manufactures, & markets mobile communication & media devices, personal computers, & portable digital music plays, & sells a variety of related software, services, accessories, networking solutions, & third-party digital content.) | | |
Cable TV Industry 5.97%
Charter Communications, Inc * ....…..……………………………...…………………………………..………… | 2,000 | 1,186,680) |
(Is a provider of cable services in the United States. The Company offers entertainment, information and communication solutions to residential and commercial customers.) | | |
*Non-income producing security
See accompanying notes to financial statements.
American Growth Fund, Inc – Series One - Page 9
How American Growth Fund, Inc. Series One
Has Its Shareholders' Money Invested
STATEMENT OF INVESTMENTS
JANUARY 31, 2022 (unaudited)
|
| | Market |
Description of Security | Shares | Value |
COMMON STOCK (continued)
Online Media 5.59%
Alphabet Inc. Class A* ……………..……...…….……………………………………………………….…………. | 235 | $635,926) |
(Engaged in improving the ways people connect with information & products including Search, Android, YouTube, Apps, Maps & Ads. It also produces internet-connected home devices & provides internet services.) | | |
Facebook Inc.* ...……………….………….………………………………………………………………………… | 1,521 | 476,469) |
(Operates a social networking website. The Company’s products are Facebook, Instagram, Messenger, WhatsApp, and Oculus. Its products enable people to connect and share through mobile devices and personal computers.) | | |
| | 1,112,395) |
Railroad 5.56%
Canadian Pacific Railway, LTD. ......................…..………………..……………………………...…..………… | 15,481 | 1,105,343) |
(A holding company that has railroad investments in the U.S., Mexico and Panama.) | | |
Computer & Peripherals Industry 5.32%
Cisco Systems .................................…..…………………………...…………………………………………..… | 19,000 | 1,057,730) |
(The leading supplier of high-performance inter-networking products.) | | ) |
Environmental Industry 4.92%
Waste Management ……………...............………………………………………………………..……………… | 6,498 | 977,559) |
(The largest solid-waste disposal company in North America.) | | |
Biotechnology Industry 4.89%
Amgen Inc. …....…………………………………………………………………………………………………….. | 4,280 | 972,159) |
(Utilizes biotechnology to develop human pharmaceutical products.) | | |
Application Software 4.86%
Microsoft Corporation …………..…………...............………………...………………………………………..… | 3,109 | 966,837) |
(Engaged in designing, manufacturing, selling devices, and online advertising. Its products include operating systems for computing devices, servers, phones and other devices.) | | |
*Non-income producing security
See accompanying notes to financial statements.
American Growth Fund, Inc – Series One - Page 10
How American Growth Fund, Inc. Series One
Has Its Shareholders' Money Invested
STATEMENT OF INVESTMENTS
JANUARY 31, 2022 (unaudited)
|
| | Market |
Description of Security | Shares | Value |
COMMON STOCK (continued)
Machinery Industry 4.50%
Middleby Corp* ...……………….………………………………………………………………………...………… | 4,835 | $895,442) |
(Develops, manufactures, markets and services equipment used for commercial food cooking, preparation, and processing.) | | |
Transportation and Logistics 2.96%
Old Dominion Freight Line Inc. …………………………..……...………….……………………………..….….. | 945 | 285,324) |
(Is the fourth-largest less-than-truckload carrier in the United States, with more than 225 service centers and 6,900-plus tractors.) | | |
Norfolk Southern Corp …………………….………..…..…………………………………………………….…… | 620 | 168,634) |
(Is a $10.6 billion railroad operating in the Eastern United States. On 21,000 miles of track, Norfolk Southern hauls shipments of coal, intermodal traffic, and a diverse mix of automobile, agriculture, metal, chemical, and forest products.) | | |
JB Hunt Transportation ……..……………..…..……….…………….……………………………………………. | 700 | 134,778) |
(Its primary operating segments are intermodal delivery, which uses the Class I rail carriers for the underlying line-haul movement; dedicated contract services that provide customer-specific fleet needs; and highway brokerage.) | | |
| | 588,736) |
Retail – Apparel & Specialty 2.93%
Amazon* ………………………………………..……...………….…...……………………………………………. | 100 | 299,147) |
(Is among the world's highest-grossing online retailers, with $281 billion in net sales and roughly $365 billion in estimated physical/digital gross merchandise volume in 2019) | | |
Tractor Supply Company …………….………………..……………………………………………………...…… | 1,300 | 283,803) |
(Is the largest operator of retail farm and ranch stores in the United States.) | | |
| | 582,950) |
Semiconductor Industry 2.41%
Intel Corp …………….......................…..……………………………...…………………………………..……… | 6,200 | 302,684) |
(A leading manufacturer of integrated circuits.) | | |
NVIDIA Corp …………….......................…..……………………………...…………………………………….... | 720 | 176,299) |
(Is a developer of graphics processing unit.) | | |
| | 478,983) |
*Non-income producing security
See accompanying notes to financial statements.
American Growth Fund, Inc – Series One - Page 11
How American Growth Fund, Inc. Series One
Has Its Shareholders' Money Invested
STATEMENT OF INVESTMENTS
JANUARY 31, 2022 (unaudited)
|
| | Market |
Description of Security | Shares | Value |
COMMON STOCK (continued)
Home Improvement Stores 2.10%
Home Depot Inc. (The) ….………..……...…………...............……………………………………………..…… | 1,140 | $418,357) |
(Is a home improvement retailer. Its stores sell an assortment of building materials, home improvement and lawn and garden products and provide a number of services.) | | |
Farm & Construction Machinery 1.49%
Caterpillar Inc. ….………..……...…………...............………………...……………………………………..…… | 1,471 | 296,495) |
(Manufacturer of construction and mining equipment, diesel and natural gas engines, industrial gas turbines and diesel-electric locomotives. The Company is also a U.S. exporter.) | | |
Restaurants 1.36%
Starbucks Corporation …..………..……...…………...............………………...........................................….. | 2,748 | 270,183) |
(A roaster, marketer, & retailer of specialty coffee in the world, operating globally. It sells a variety of coffee & tea products. It sells goods and services under brands including Teavana, Tazo, and Seattle's Best Coffee.) | | |
Industrial Products 1.33%
Eaton Corp PLC …………………..……...………….…...……………………….……………………………….. | 970 | 153,677) |
(Provides power-management solutions to diversified industrial customers, including electrical transmission systems, lighting, hydraulics, aerospace fuel systems, and truck and auto powertrain systems.) | | |
Vestas Wind Systems A/S ……..……………..……...…………….…….……………………………………….. | 12,500 | 111,713) |
(Is one of the largest manufacturers of wind turbines in the world..) | | |
| | 265,390) |
Chemicals 1.16%
Balchem Corporation ……………..……...…….…………………….……………………………………..…….. | 1,575 | 231,430) |
(Is engaged in the development, manufacture and marketing of specialty performance ingredients and products for the food, nutritional, feed, pharmaceutical, medical sterilization and industrial markets.) | | |
*Non-income producing security
See accompanying notes to financial statements.
American Growth Fund, Inc – Series One - Page 12
How American Growth Fund, Inc. Series One
Has Its Shareholders' Money Invested
STATEMENT OF INVESTMENTS
JANUARY 31, 2022 (unaudited)
|
| | Market |
Description of Security | Shares | Value |
COMMON STOCK (continued)
Insurance (Property and Causality) 1.02%
Markel Corp* …………..……………..……...………….…………….…………………………………..……….. | 100 | $123,274) |
(Markel Corp is engaged in the business of property and casualty insurance. It focuses primarily on specialty lines, such as executive liability to commercial equine insurance. It also invests in bakery equipment manufacturing and residential homebuilding.) | | |
Selective Insurance Group Inc. ………….………………..………..…………………………………….….…… | 1,000 | 78,900) |
(Is a holding company that offers property and casualty insurance products and services in United States.) | | |
| | 202,174) |
Media – Diversified 1.01%
Comcast Corp. – Class A* ……..…………...............………………………………………….....……………… | 4,000 | 199,960) |
(Is made up of three parts. The core cable business owns networks capable of providing television, Internet access, and phone services to roughly 60 million U.S. homes and businesses, or nearly half of the country.) | | |
Business Services 0.98%
Paychex, Inc. .….………..……...…………...............………………...……………………………………..…… | 1,651 | 194,422) |
(Is a provider of integrated payroll, human resources, insurance, and benefits outsourcing solutions for small- to medium-sized business in the United States.) | | |
Health Care Plans 0.90%
UnitedHealth Group Inc. ....…..…………………..……...………………………………………………………… | 380 | 179,577) |
(Is a diversified health care company in the United States.) | | |
Banks 0.90%
J P Morgan Chase ....…..…………………..……...………………………………………………………… | 1,200 | 178,320) |
(Is a financial services firm and a banking institution. It is engaged in investment banking, commercial banking, treasury and securities services, asset management, retail financial services, and credit card businesses.) | | |
Telecommunication Services 0.82%
T-Mobile US, Inc.* ……..…………...............………………………..………………………….....……………… | 1,500 | 162,255) |
(The firm provided nationwide service in major markets but spottier coverage elsewhere.) | | |
*Non-income producing security
See accompanying notes to financial statements.
American Growth Fund, Inc – Series One - Page 13
How American Growth Fund, Inc. Series One
Has Its Shareholders' Money Invested
STATEMENT OF INVESTMENTS
JANUARY 31, 2022 (unaudited)
|
| | Market |
Description of Security | Shares | Value |
COMMON STOCK (continued)
Drug 0.69%
Johnson & Johnson ……………..……...…….…………………………………………………………….…….. | 796 | $137,143) |
(Engaged in the research and development, manufacture and sale of products in the health care field within its Consumer, Pharmaceutical and Medical Devices, and Diagnostic business segments.) | | |
Health Care Providers 0.61%
HCA Healthcare Inc. …………….....……....………...............………………..........................................…… | 505 | 121,225) |
(It operates general acute care hospitals, psychiatric hospitals, and rehabilitation hospitals.) | | |
Medical Diagnostics & Research 0.58%
Thermo Fisher Scientific Inc …..…..…………...............……..……………………………….....……………… | 200 | 116,260) |
(Sells scientific instruments and laboratory equipment, diagnostics consumables, and life science reagents.) | | |
Asset Management 0.53%
Blackstone, Inc. ………..………….............…………………………………………………….....……………… | 800 | 105,576) |
(Is one of the world's largest alternative asset managers with $731 billion in total asset under management, including $528 billion in fee-earning asset under management, at the end of September 2021.) | | |
Software 0.47%
Salesforce.com Inc*…..…………...............…………………………………………………….....……………… | 400 | 93,052) |
(Provides enterprise cloud computing solutions, including Sales Cloud, the company's main customer relationship management software-as-a-service product.) | | |
Total Common Stocks (cost $5,898,598) – 99.43%.……………………………………………………..…... | | $19,772,209) |
Total Investments, at Market Value (cost $5,898,598) ………………….........................................…….. | 99.43)% | 19,772,209) |
Other Assets, Less Liabilities ………………………………………………………………………………...… | 0.57)% | 114,342) |
Net Assets ………………………………………………………………………………………………………….. | 100.00)% | 19,886,551) |
*Non-income producing security
See accompanying notes to financial statements.
American Growth Fund, Inc – Series One - Page 14
How American Growth Fund, Inc. Series One
Has Its Shareholders' Money Invested
STATEMENT OF INVESTMENTS
JANUARY 31, 2022 (unaudited)
|
| | Market |
Description of Security | Shares | Value |
COMMON STOCK (continued)
See accompanying notes to financial statements.
American Growth Fund, Inc – Series One - Page 15

Dear Shareholders:
We are pleased to deliver to you the American Growth Cannabis Fund Semi-Annual Report for the six months ended January 31, 2022.
This past year showed us continued growth in the cannabis sector albeit somewhat restricted by what we perceive as the federal government’s slower than we want pace to enact laws that will allow the industry to grow as fast as it is capable of. Current laws enacted to help curb money laundering have made it difficult for legal cannabis business to take advantage of the simplest of things that the majority of us take advantage of... banking. “In 1970, the US Congress passed the Bank Secrecy Act (BSA), introducing specific record-keeping and reporting obligations for US banks and financial institutions. The BSA was one of the first examples of dedicated anti-money laundering legislation in the US and the world. Also known as the Currency and Foreign Transactions Reporting Act, the BSA was introduced as a response to the trend of criminals in the US using ‘secret foreign bank accounts’ to perpetrate money laundering and other illegal activities – and the inaction on the part of US banks to detect and prevent that activity.”1 Modification to this law (as well as others such delisting Cannabis from the Controlled Substances Act) continue to progress slowly despite multiple studies that show not only majority support but increasing support.
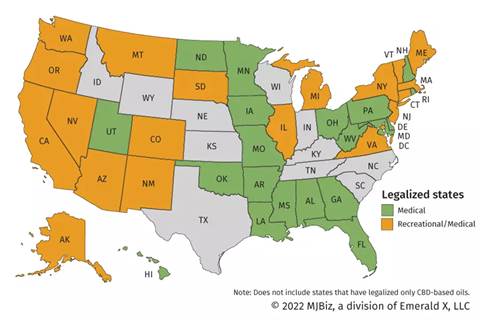 Consider this map:
* Only 11 states have not legalized cannabis for medical or recreational use.
* According to a Gallup poll released in November 2021, two in three Americans support legalizing cannabis.2
* According to a recent report released by the National Organization for the Reform of Marijuana Laws, lawmakers enacted more than 50 new cannabis-related reform laws in at least 27 states in 2021.2
* On the adult-use front, five states — Connecticut, New Jersey, New Mexico, New York, and Virginia — enacted laws legalizing and regulating the market. As things stand today, nearly half of the U.S. population lives in states where adult-use cannabis is legal (or will be legal) in 2022.2
* The trend is expected to continue in the coming year, with Delaware and Oklahoma poised to pass their own adult-use laws, and with momentum building in Maryland, Ohio, Pennsylvania and Rhode Island toward the same goal.2
* On the medical side, Mississippi is likely to pass legalization a second time (after its Supreme Court overturned a 2020 voter-approved ballot initiative), and advocates in Nebraska and Wyoming are renewing their own efforts. In addition, a number of other states such as Arkansas, Florida, Idaho, Missouri and Ohio all have cannabis-related initiatives on their 2022 ballots to expand their existing laws.2
American Growth Fund, Inc – American Growth Cannabis Fund - Page 17
* New classes at Syracuse University are focusing on the growth of the cannabis industry.3
* In Alaska, 2020 alone more than $24 million was collected in taxes from the industry, according to the Alcohol and Marijuana Control Office.4
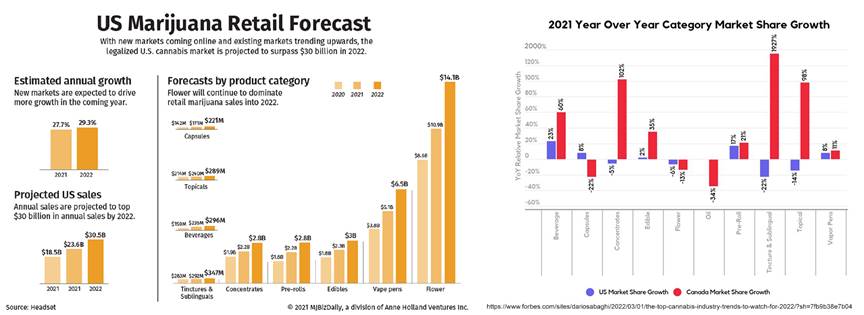
Despite federal prohibition, the U.S. cannabis industry has experienced dramatic growth in recent years. By some estimates, total U.S. cannabis sales were expected to surpass $24 billion in 2021, representing 38% growth over 2020 sales. In considering the industry's broader effects on the economy, a recent analysis published by MJBizFactbook projected that the cannabis industry is expected to add $92 billion to the U.S. economy in 2021.2
Although your American Growth Cannabis Fund is currently unable to invest in all businesses we want to (due to the above-mentioned legislative issues), the following charts are helpful to show general cannabis market trends. Of particular interest is the second chart which compares the U.S. cannabis market (which as we discussed is being depressed by current laws) versus the Canadian cannabis market (where cannabis is legal throughout the entire country). Please note that federal legalization in the U.S. may not produce the same results as they did in Canada.
Lastly, we wanted to touch on the capital gain distribution paid out to you this past December. Capital gains are generated when a mutual fund's manager sells an asset within the fund's portfolio for more than it cost. Much like buying a stock when prices are low and then selling on the upswing, fund managers look to liquidate holdings when they are at a premium and then distribute the gains to shareholders. Its a nice problem to have when you think about it. The capital gains paid out in December caused a drop in our share net asset value. In order to raise the share net asset value, the board approved a 10-1 reverse stock split. As you are aware, this reverse stock split did not impact the overall value of your account.
American Growth Fund, Inc – American Growth Cannabis Fund – Page 18
Investment Committee
The Investment Committee that manages your Fund is made up of two veterans of the securities industry, Mr. Timothy Taggart and Mr. Robert Fleck. Mr. Taggart joined the securities industry in 1985 and is registered as a General Securities Principal, Financial and Operations Principal, Registered Options Principal and Municipal Securities Principal. Mr. Robert Fleck also joined the securities industry in 1985. He has held a General Securities license and currently is an Investment Advisor Representative. This past year the Investment Committee invited Mr. Matthew Taggart to join them. Throughout the previous years they have found his insight valuable.
Investment Strategy
The Fund searches for companies/investments with growth potential that could show faster growth than markets indexes. The Advisor also looks for securities that are considered undervalued or out of favor with investors or are expected to increase in price over time. We use a consistent approach to build the Fund’s security portfolio which is made up primarily of common stocks involved in the legal cannabis and hemp businesses. The Fund will concentrate (i.e., invest more than 25% of its total assets) in the securities of issuers in the Pharmaceuticals, Botanical Medical Chemical and Biotechnology Industry Group. Under normal market conditions, the Fund will invest at least 80% of its net assets (plus any borrowings for investment purposes) in exchange-traded equity securities of companies engaged in legal cannabis and hemp related businesses. The Fund considers a company to be engaged in the legal cannabis and hemp business if the company derives at least 50% of its revenue from the legal cannabis and hemp industries. The Fund may invest in companies that are listed on exchanges in countries where cannabis is legal, but which have operations in the United States. These companies only supply products and/or perform activities that are legal under applicable national and local laws, including U.S. federal and state laws. For more information on the Investment Strategy, as well as other important information, please visit our website, www.amrexcannabis.com or call us at 800-525-2406 and we will gladly mail you a copy for free.
Performance Overview
Of the top ten stocks that were held in the American Growth Cannabis Fund’s portfolio, most of them contributed to the loss of the Fund. Looking at the portfolio, Medicinal Chemicals & Botanical Products makes up the largest industry of the portfolio at 18.21% and the portfolio’s largest investment, Innovative Industrial Properties, Inc.at $33,494. Innovative Industrial Properties, Inc. is engaged in the acquisitions, ownership, and management of specialized industrial properties leased to state-licensed operators for their regulated medical-use cannabis facilities.
Top 3 Performing Investments (The three stocks that contributed positively to the return are)
Investment | Industry | Percent Contribution to the Loss on the Portfolio for the six months ended January 31, 2022 | Individual Investment performance for the six months ended January 31, 2022 |
Namaste Technologies | Retail – Cyclical | 21.47% | 89.60% |
Power REIT | Real Estate Investment Trusts | 20.65% | 54.82% |
Innovative Industrial Properties, Inc. | Real Estate | 4.64% | 12.71% |
American Growth Fund, Inc – American Growth Cannabis Fund - Page 19
Bottom 3 Performing Investments (The three stocks that contributed positively to the return are)
Investment | Industry | Percent Contribution to the Loss on the Portfolio for the six months ended January 31, 2022 | Individual Investment performance for the six months ended January 31, 2022 |
Lifeist Wellness, Inc. | Retail – Cyclical | (33.54)% | (73.84)% |
GrowGeneration Corp. | Retail – Building Materials, Hardware, Garden Supply | (20.47)% | (62.11)% |
The Valens Company, Inc. | Drug Manufacturers | (20.42)% | (34.26)% |
Real Estate Investment Trusts, Real Estate, and Biological Products (No Diagnostic Substances) all boosted the portfolio’s Market Value while Medicinal Chemical & Botanical Products, Pharmaceutical Preparations, and Drug Manufactures worked against the portfolio’s Market Return.
Overall, your American Growth Cannabis Fund delivered you a (48.21)% return (this number includes a sales load of 5.75% as well as Fund expenses and change in Market Value) since January 29, 2021 through close of business on January 31, 2022. The Dow Jones Industrial Average posted a gain of 19.36% since January 29, 2021 through close of business on January 31, 2022 while the S&P 500 posted a gain of 23.29% since January 29, 2021 through close of business on January 31, 2022.
The performance data quoted above is past performance, which does not guarantee future results. Current performance may be lower or higher than the performance data quoted. An investment’s return and principal value will fluctuate such that an investor’s shares, when redeemed, may be worth more or less than their original cost. Additional data, including long-term performance data, can be found on page 53 of this report.
Liquidity
As you are aware, the American Growth Cannabis Fund investments are made up primarily of common stocks involved in the legal cannabis and hemp business. In addition to the principal investment strategy, we may also invest in securities convertible into common stock. Your Fund does purchase Microcap stocks. Microcap stocks are low-priced stocks issued by the smallest of companies. Many microcap companies do not file financial reports with the SEC, so it's hard for investors to get the facts about the company's management, products, services, and finances. Microcap stocks historically have been more volatile and less liquid than the stock of larger companies. Before we purchase a Microcap stock, your Investment Committee considers items such as prior purchases and sales of that equity to help them assess liquidity issues. The Investment Committee also purchases smaller percentages of Microcap stocks to help hedge against illiquidity. In the past six months there were no new instances where a Microcap stock that the Investment Committee purchased, could not be readily sold. There are also times where the Fund has sold shares of stock in order to pay for certain required services such as the annual audit performed by an independent outside auditor or legal fees. The Fund may also sell shares of stock when orders are placed to redeem shares. When either of these situations happen, your Investment Committee generally will first sell those holdings that they believe are currently, or in the future may, underperform in the market or, alternatively, they may sell holdings in sectors that the committee believes may over-weight that sector when looking at the portfolio as a whole to maintain or improve diversification.
American Growth Fund, Inc – American Growth Cannabis Fund – Page 20
As we look at how the cannabis business is trending, we are optimistic and will continue to look for growth opportunities for our shareholders but will remain somewhat guarded, yet optimistic, as the COVID-19 crisis appears to be ending and life begins to resemble, at least partially, what it did prior to the pandemic. It is our opinion that we will see continued growth in the legal cannabis and hemp business in the upcoming months.
My staff and I are always available to discuss your account or answer any questions you may have. Please call our toll-free number, 800 525-2406 or, within Colorado, 303-626-0600. American Growth Fund wishes you A Good Future!
Sincerely,
Timothy E. Taggart
President
Investment Committee Member
American Growth Fund, Inc.
1. https://complyadvantage.com/insights/us-anti-money-laundering-act-amla-history/
2. https://www.reuters.com/legal/transactional/five-cannabis-trends-watch-2022-2022-01-13/
3. https://www.wrvo.org/regional-news/2022-03-10/new-classes-at-syracuse-university-highlight-cannabis-industry
4. https://www.alaskasnewssource.com/2022/03/08/state-marijuana-concerns-grow-that-if-marijuana-becomes-federally-legal-alaskas-industry-could-be-hurt/
American Growth Fund, Inc – American Growth Cannabis Fund - Page 21
How American Growth Cannabis Fund
Has Its Shareholders' Money Invested
STATEMENT OF INVESTMENTS
JANUARY 31, 2022 (unaudited)
|
| | Market |
Description of Security | Shares | Value |
COMMON STOCK
Medicinal Chemicals & Botanical Products 18.21%
Sundial Growers Inc.* ……………………………………………………………………….……………………… | 33,193 | $15,856) |
(Is engaged in producing and marketing of cannabis for the adult-use market. Some of its products are Lemon Riot, Daydream, Zen Berry, Twilight, Tropical Bliss, Pillow Talk, Citrus Punch, and others. The company's primary focus is on producing and distributing inhalable products and brands (flower, pre-rolls, and vapes). It operates in two segments: Cannabis segment and Ornamental Flowers segment. Its Cannabis segment derives majority revenue.)) | | |
Aurora Cannabis Inc.* ……………………………………………………………………….……………………… | 3,811 | 15,854) |
(Cultivates and sells medicinal and recreational cannabis through a portfolio of brands that include Aurora, CanniMed, Daily Special, MedReleaf, and San Rafael '71. Although the company primarily operates in Canada, Auora has expanded internationally through medical cannabis exporting agreements or cultivation facilities in more than 25 countries.) | | |
Tilray Inc.* …...…………………………………………………….…………………………………………….…… | 2,061 | 12,284) |
(Cultivates and sells medical and recreational cannabis through a portfolio of brands that include Canaca, Dubon, and Manitoba Harvest. The bulk of Tilray's sales are in Canada, but the company also sells CBD Products in the U.S. and exports medical cannabis globally from its production facilities in Canada and Portugal.) | | |
Canopy Growth Corporation* ………………………………………………………………………………….…… | 1,313 | 10,557) |
(Cultivates and sells medicinal and recreational cannabis, and hemp, through a portfolio of brands that include Tweed, Spectrum Therapeutics, and CraftGrow. Although it primarily operates in Canada, Canopy has distribution and production licenses in more than a dozen countries to drive expansion in global medical cannabis and also holds an option to acquire Acreage Holdings upon U.S. federal cannabis legalization.) | | |
HEXO Corp.* ………………...……………………………………………………………………….…..………….. | 6,080 | 3,405) |
(An award-winning consumer packaged goods cannabis company that creates and distributes innovative products to serve the global cannabis market. Through its hub and spoke business strategy, HEXO Corp is partnering with Fortune 500 companies, bringing its brand value, cannabinoid isolation technology, licensed infrastructure and regulatory expertise to established companies, leveraging their distribution networks and capacity. The Company serves the Canadian adult-use markets under its HEXO Cannabis, Up Cannabis and Original Stash brands, and the medical market under HEXO medical cannabis.) | | |
| | 57,956) |
*Non-income producing security
See accompanying notes to financial statements.
American Growth Fund, Inc – American Growth Cannabis Fund - Page 22
How American Growth Cannabis Fund
Has Its Shareholders' Money Invested
STATEMENT OF INVESTMENTS
JANUARY 31, 2022 (unaudited)
|
| | Market |
Description of Security | Shares | Value |
COMMON STOCK (continued)
Pharmaceutical Preparations 13.39%
Organigram Holdings Inc.* …………...…………………………………………………………………………..… | 12,034 | $17,931) |
(Focuses on producing exceptional, indoor-grown cannabis for patients and adult recreational consumers, as well as developing global business partnerships.) | | |
Emerald Health Therapeutics, Inc..*……..………………………………………………………………….……… | 370,945 | 14,912) |
(Is engaged in the production, distribution, and sale of cannabis products in Canada. Its operating segment includes Cannabis and others. The company generates maximum revenue from the Cannabis segment.) | | |
Neptune Wellness Solutions Inc.* ……..……..………………………………………………...…………….…… | 31,020 | 9,777) |
(Is a health and wellness products company, with more than 50 years of combined experience in extraction, purification and formulation of value-added differentiated science-based products.) | | |
| | 42,620) |
Real Estate 10.52%
Innovative Industrial Properties Inc. …….….……………………..………….…………………………………… | 169 | 33,494) |
(Is engaged in the acquisitions, ownership, and management of specialized industrial properties leased to state-licensed operators for their regulated medical-use cannabis facilities.) | | |
Real Estate Investment Trusts 10.21%
Power REIT* ………...…..…..……………………………………………………………….…… | 520 | 32,510) |
(Power REIT is a real-estate investment trust focused on providing long-term real estate solutions to energy and transportation infrastructure asset owners and developers.) | | |
Drug Manufacturers 8.72%
The Valens Company Inc.* …..……………………………………………..……………………………………… | 14,531 | 27,754) |
(Engaged in the research, development and commercialization of cannabinoid prescription medicines using botanical extracts derived from the Cannabis Sativa plant.) | | |
*Non-income producing security
See accompanying notes to financial statements.
American Growth Fund, Inc – American Growth Cannabis Fund - Page 23
How American Growth Cannabis Fund
Has Its Shareholders' Money Invested
STATEMENT OF INVESTMENTS
JANUARY 31, 2022 (unaudited)
|
| | Market |
Description of Security | Shares | Value |
COMMON STOCK (continued)
Retail - Cyclical 8.00%
LIfeist Wellness, Inc.* …………………………………..……….…………..…..…………………………..……… | 325,055 | $25,452) |
(Is an online platform for cannabis products, accessories, and responsible education. The company's everything cannabis store, CannMart.com, provides customers with a diverse selection of hand-picked products from a multitude of federally licensed cultivators, all in one convenient site.) | | |
Exchange Traded Funds 4.79%
Amplify Seymour Cannabis ETF ..……….……………………………..…..…………………………..……… | 1,270 | 15,240) |
(The fund will invest at least 80% of its net assets (including investment borrowings) in the securities of companies that derive 50% or more of their revenue from the cannabis and hemp ecosystem.) | | |
Perfumes, Cosmetics & Other Toilet Preparations 3.15%
cbdMD, Inc*. ………...…..……………………..……………………………………………………………….…… | 9,648 | 10,034) |
(It owns and operates the consumer hemp-based cannabidiol (CBD) brand, cbdMD.) | | |
Retail - Building Materials, Hardware, Garden Supply 2.16%
GrowGeneration Corp.* ………...…..…..…………………………………………………………………….…… | 815 | 6,879) |
(GrowGeneration Corp operates hydroponic and organic specialty gardening retail outlets in the United States. It sells products including organic nutrients and soil, advanced lighting technology, hydroponic and aquaponics equipment and other products.) | | |
Agriculture Production – Crops 0.55%
Village Farms Intl Inc Com* ..……………..…..………………………………………………………………....… | 339 | 1,759) |
(Produces, markets, and sells tomatoes, bell peppers, and cucumbers. It also produces power. The company operates its business through segments that are JV Cannabis Segment, Produce Business and Energy Business.) | | |
Total Common Stocks (cost $681,741) – 79.70%.…………………………………………………..………. | | 253,698)) |
| | |
Total Investments, at Market Value (cost $681,741)……….…………………….....… | 79.70)% | $ 253,698)) |
Other Assets, Less Liabilities………………………..…………………………..…….…… | 20.30)% | 64,602)) |
Net Assets ………………………………………………………………………..……………. | 100.00)% | $ 318,300)) |
*Non-income producing security
See accompanying notes to financial statements.
American Growth Fund, Inc – American Growth Cannabis Fund - Page 24
How American Growth Cannabis Fund
Has Its Shareholders' Money Invested
STATEMENT OF INVESTMENTS
JANUARY 31, 2021 (unaudited)
|
| | Market |
Description of Security | Shares | Value |
COMMON STOCK (continued)
See accompanying notes to financial statements.
American Growth Fund, Inc – American Growth Cannabis Fund - Page 26
AMERICAN GROWTH FUND, INC.
STATEMENTS OF ASSETS AND LIABILITIES, JANUARY 31, 2022 (unaudited)
| | SERIES ONE | AMERICAN GROWTH CANNABIS FUND |
ASSETS: | | |
Investments, at market value ………………………………………..…………………………………… | $ 19,772,2091 | $ 253,6982 |
Cash………………..……………….............………………………………………………………………. | 155,469) | 82,232) |
Receivables: | | |
Shares of beneficial interest sold...........………………………………………………………………. | 2,356) | -) |
Securities sold ……………………………………………………………………………………………. | -) | -) |
Dividends and interest ..........................……………………………………………………………….. | 3,761) | -) |
Prepaid Insurance ..........................……………………………………………………………….. | -) | -) |
Other …………...…………………………………………………………………………………………. | -) | -) |
Total assets………………………….……………………………………………………………………… | 19,933,795) | 335,930) |
LIABILITIES: | | |
Shares of beneficial interest redeemed............................................................................................. | 4,850) | 1) |
Securities purchased payable ……………………………………………………………………………. | -) | -) |
12b-1 fees......................................................................................................................................... | 16,023) | 790) |
Management fee............................................................................................................................... | 17,629) | 16,554) |
Other Payables …………………………………………………………………………………………….. | 8,742) | 285) |
Total liabilities.......................................………………………………………………………………….. | 47,244) | 17,630) |
NET ASSETS………………………………………………………………………………………………. | $ 19,886,551) | $ 318,300) |
COMPOSITION OF NET ASSETS: | | |
Paid-in capital………………………………………………………………….…………………………… | $ 5,619,871) | $ 1,430,861) |
Distributable earnings (loss) ……………………………………………………………………………… | 14,266,680) | (1,112,561) |
Net assets…………………………………………………………………………..………………………. | $ 19,886,551) | $ 318,300) |
1 Cost of Investments for Series One was $5,898,598.
2 Cost of Investments for American Growth Cannabis Fund was $681,741.
See accompanying notes to financial statements.
American Growth Fund, Inc – Page 27
AMERICAN GROWTH FUND, INC.
STATEMENTS OF ASSETS AND LIABILITIES, JANUARY 31, 2022 (unaudited) (continued)
NET ASSET VALUE PER SHARE: | | |
Series One - Class A Shares: | | |
Net asset value and redemption price per share (based on net assets of $10,702.939 and 1,544,025 shares of beneficial interest outstanding) | $6.93 | |
Maximum offering price per share (net asset value plus sales charge of 5.75% of offering price) | $7.35 | |
Series One - Class B Shares: | | |
Net asset value and redemption price per share (based on net assets of $245,320 and 46,986 shares of beneficial interest outstanding) | $5.22 | |
Series One - Class C Shares: | | |
Net asset value and redemption price per share (based on net assets of $1,407,215 and 247,278 shares of beneficial interest outstanding) | $5.69 | |
Series One - Class D Shares: | | |
Net asset value and redemption price per share (based on net assets of $7,531,078 and 1,006,716 shares of beneficial interest outstanding) | $7.48 | |
Maximum offering price per share (net asset value plus sales charge of 5.75% of offering price) | $7.94 | |
American Growth Cannabis Fund - Class E Shares: | | |
Net asset value and redemption price per share (based on net assets of $318,300 and 563,497 shares of beneficial interest outstanding) | | $0.56 |
Maximum offering price per share (net asset value plus sales charge of 5.75% of offering price) | | $0.59 |
See accompanying notes to financial statements.
American Growth Fund, Inc – Page 28
AMERICAN GROWTH FUND, INC.
STATEMENTS OF OPERATIONS FOR THE SIX MONTHS ENDED JANUARY 31, 2022 (unaudited)
| | SERIES ONE | AMERICAN GROWTH CANNABIS FUND |
INVESTMENT INCOME: | | |
Dividends (Net of Foreign tax withholding of $0 / $0 respectively)………..…….……………. | $ 92,458) | $2,722) |
Interest …………………………………………….…...……………….……………………..……….. | 7) | 4)) |
Litigation ……………….………………………….…...……………….……………………..……….. | -) | -) |
Other ……………………………………………….…...……………….……………..………………. | -) | -) |
Total investment income……………………………………..…………………………..……………….. | 92,465) | 2,726) |
| | |
EXPENSES: | | |
Investment advisory fees (Note 4)…………………………………..………………………………….… | 105,574) | 5,449) |
Administration expenses (Note 4)……………………………………………………...………………… | 77,809) | 3,707) |
Transfer agent, shareholder servicing and data processing fees ………...………………………..… | 42,702) | 3,242) |
Accounting fees (Note 4)…………………………..……………………………………..……………….. | 14,194) | 806) |
Rent expense (Note 4)....………..………………………………………………………..……………… | 51,753) | 2,965) |
Custodian fees ..............…………………………………………………………………..……………… | 7,127) | 1,587) |
Professional fees………………………………………………………………………….………………… | 25,531) | 1,139) |
Registration and filing fees (Note 1):……………………………………………………………………… | 10,109) | 3,172) |
Shareholder reports………………………………………………………………………………………… | -) | -) |
Distribution and service fees (Note 4): | | |
Class A……………………………………………………………………………….……………..…... | 17,220) | -) |
Class B……………………………………………………………………………….……………..…... | 1,263) | -) |
Class C……………………………………………………………………………….……………..…... | 7,333) | -) |
Class E………………………………………………………………….…………….……………..…... | -) | 1,582) |
Class F………………………………………………………………………………..……………..…... | -) | -) |
Directors fees (Note 4).……………………………………………………………………………..……… | 16,497) | 803) |
D&O / E&O Insurance ……………………………………………………………………………………… | 17,460) | 573) |
Other expenses………………………………………………………………………………………...…… | 10,632) | 2,061) |
Total expenses…………………………………………………………………………………………...… | 405,204) | 27,086) |
Less fees waived and expenses reimbursed by Advisor ………………………………………………. | -) | (5,327) |
Reclaimed Fee Waiver by Advisor ……………………………………………………………………….. | -) | 5,327) |
Total fees waived and expenses reimbursed by Advisor | -) | -) |
STATEMENTS OF OPERATIONS FOR THE SIX MONTHS ENDED JANUARY 31, 2022 (unaudited) (continued) |
| | |
Net Expenses……………………………………………………………………………………………….. | 405,204) | 27,086) |
Net investment loss……………………………………………………….…………………………….… | (312,739) | (24,360) |
| | |
REALIZED AND UNREALIZED GAIN OR LOSS ON INVESTMENTS: | | |
Net realized gain on investments……………………………………………..……………….…..……… | $ 729,414) | $ (419,168) |
Net change in unrealized appreciation (depreciation) on investments…………......................…… | (1,193,232) | (79,969) |
Net gain (loss) on investments……………………………………………………………………………. | (463,818) | (499,137) |
Net decrease in net assets resulting from operations…………………………………………………… | $ (776,557) | $ (523,497) |
| | |
See accompanying notes to financial statements.
American Growth Fund, Inc – Page 29
AMERICAN GROWTH FUND, INC.
STATEMENTS OF CHANGES IN NET ASSETS
SERIES ONE
| Six Month Ended January 31, 2022 (unaudited) | Year Ended July 31, 2021 |
INCREASE (DECREASE) IN NET ASSETS FROM | | |
OPERATIONS: | | |
Net investment loss .……..………………………………………………………..……………………………. | $ (312,739) | $ (701,984) |
Net realized gain on investments………….....…………………………………..………………………….... | 729,414) | 2,289,347) |
Net change in unrealized appreciation/depreciation on investments ……………………………………... | (1,193,232) | 2,789,770) |
Net increase in net assets resulting from operations ….......................................................................... | (776,557) | 4,377,133) |
| | |
BENEFICIAL INTEREST TRANSACTIONS: | | |
Net decrease in net assets resulting from beneficial interest transactions (Note 2): | | |
Class A ……………………………………………………………..………………………………………… | 784,611) | (1,072,109) |
Class B ……………………………………………………………..………………………………………… | 22,875) | 60,258) |
Class C ……………………………………………………………..………………………………………… | 161,259) | (371,646) |
Class D ……………………………………………………………..………………………………………… | 602,906) | (348,953) |
Net change in net assets derived from beneficial interest transactions…………………………………… | 1,571,651) | (1,732,450) |
Distribution to shareholders from long term capital gains: | | |
Class A ……………………………………………………………..………………………………………… | (1,300,011) | (277,578) |
Class B ……………………………………………………………..………………………………………… | (28,394) | (7,846) |
Class C ……………………………………………………………..………………………………………… | (167,803) | (50,991) |
Class D ……………………………………………………………..………………………………………… | (900,761) | (179,326) |
Net change in net assets derived from distribution to shareholders from long term capital gains …….. | (2,396,969) | (515,741) |
| | |
Total increase ………………………………………………………………………………………………….... | (1,601,875) | 2,128,942) |
Net Assets - Beginning of year…...….…………………………….…......................................................... | 21,488,426) | 19,359,484) |
Net Assets - End of year1…....………………………………………...……………………………………….. | $ 19,886,551) | $ 21,488,426) |
| | |
See accompanying notes to financial statements.
American Growth Fund, Inc – Page 31
AMERICAN GROWTH FUND, INC.
STATEMENTS OF CHANGES IN NET ASSETS (continued)
AMERICAN GROWTH CANNABIS FUND
| Six Months Ended January 31, 2022 (unaudited) | Year Ended July 31, 2021 |
INCREASE (DECREASE) IN NET ASSETS FROM | | |
OPERATIONS: | | |
Net investment loss ……….……..………………………………………………..……………………………. | $ (24,360) | $ (84,625) |
Net realized gain on investments………….....……………………………………………………….... | (419,168) | 400,279) |
Net change in unrealized depreciation on investments ……………………………………... | (79,969) | (418,761) |
Net decrease in net assets resulting from operations …....................................................... | (523,497) | (103,107) |
| | |
BENEFICIAL INTEREST TRANSACTIONS: | | |
Net increase (decrease) in net assets resulting from beneficial interest transactions (Note 2): | | |
Class E …………………………………………………………………………..…………………………… | (265,929) | 1,002,401) |
Net change in net assets derived from beneficial interest transactions ...………………………………… | (265,929) | 1,002,401) |
Distribution to shareholders from short term capital gains: | | |
Class E ……………………………………………………………..………………………………………… | (473,929) | -) |
Net change in net assets derived from distribution to shareholders from short term capital gains ……. | (473,929) | -) |
Distribution to shareholders from long term capital gains: | | |
Class E ……………………………………………………………..………………………………………… | (168,804) | -) |
Net change in net assets derived from distribution to shareholders from long term capital gains …….. | (168,804) | -) |
Total increase (decrease) …………………………………………………………………………………….... | (1,432,159) | 899,294) |
Net Assets - Beginning of year…...….…………………………….…......................................................... | 1,750,459) | 851,165) |
Net Assets - End of year1…....……………………………………….....................………………………….. | $ 318,300) | $ 1,750,459) |
See accompanying notes to financial statements.
American Growth Fund, Inc – Page 32
AMERICAN GROWTH FUND, INC.
Series One - Class A
Six Months | Six | |
Ended | Month | |
| Ended | Year Ended |
January 31, | January 31 | July 31, |
(unaudited) | (unaudited) | |
| | 2022 | 2021 | 2020 | 2019 | 2018 | 2017 | |
Per Share Operating Data: | | | | | | | | |
Net Asset Value, | | | | | | | | |
Beginning of Period ………………………….……..….. | | $8.11) | $6.70) | $6.02) | $5.28) | $4.92) | $4.40) | |
Income gain (loss) from investment operations: | | | | | | | | |
Net investment loss4 .………….……………………..…… | | (0.12) | (0.26) | (0.24) | (0.22) | (0.21) | (0.22) | |
Net realized and unrealized gain (loss) 4 ……………….. | | (0.14) | 1.86) | 0.92) | 0.96) | 0.57) | 0.74) | |
Total income gain (loss) from investment operations .… | | (0.26) | 1.60) | 0.68) | 0.74) | 0.36) | 0.52) | |
Distributions: | | | | | | | | |
Long-term capital gains distributions …..……………….. | | (0.92) | (0.19) | -) | -) | -) | -) | |
Total distributions …………………………………………. | | (0.92) | (0.19) | -) | -) | -) | -) | |
Net Asset Value, End of Period ……………………….… | | 6.93) | $8.11) | $6.70) | $6.02) | $5.28) | $4.92) | |
Total Return at Net Asset Value1 ……………………... | | (3.8)% | 24.1)% | 11.3)% | 14.0)% | 7.3)% | 11.8)% | |
Ratios/Supplemental Data: | | | | | | | | |
Net assets, end of period (in thousands) ………………. | | $10,703 | $11,632) | $10,614) | $10,236) | $8,431) | $7,777) | |
Ratio to average net assets: | | | | | | | | |
Net investment loss4 …...……………………………...…. | | (2.98)% | (3.46)% | (3.89)% | (4.10)% | (4.10)% | (4.81)% | |
Expenses4. ……..……..…………………………………... | | 3.86)% | 4.42)% | 5.08)% | 5.44)% | 5.51)% | 6.37)% | |
Portfolio Turnover Rate2 ………………………………….. | | 7)% | 4)% | 0)% | 7)% | 11)% | 15)% | |
1. Assumes a hypothetical initial investment on the business day before the first day of the fiscal period with all dividends and distributions reinvested in additional shares on the reinvestment date and redemption at the net asset value calculated on the last business day of the fiscal period. Sales charges are not reflected in total returns.
2. The lesser of purchases or sales of Series One portfolio securities for a period, divided by the monthly average of the market value of securities owned during the period. Securities with a maturity or expiration date at the time of acquisition of one year or less are excluded from the calculation. Purchases and sales of investment securities (other than short-term securities) from the six months ended January 31, 2022, aggregated $480,153 and $1,374,902, respectively.
3. The lesser of purchases or sales of American Growth Cannabis Fund portfolio securities for a period, divided by the monthly average of the market value of securities owned during the period. Securities with a maturity or expiration date at the time of acquisition of one year or less are excluded from the calculation. Purchases and sales of investment securities (other than short-term securities) from the six month ended January 31, 2022, aggregated $0 and $0, respectively.
4. Per share amounts have been calculated using the Average Shares Method.
5. Legal Fees for the Objective and Name Change for the American Growth Cannabis Fund were $34,956 which attributed to 4.44% of the 11.79% after fee waiver expense ratio.
See accompanying notes to financial statements.
American Growth Fund, Inc – Page 33
AMERICAN GROWTH FUND, INC.
Series One - Class B
Six Months | Six | |
Ended | Month | |
| Ended | Year Ended |
January 31, | January 31 | July 31, |
(unaudited) | (unaudited) | |
| | 2022 | 2021 | 2020 | 2019 | 2018 | 2017 | |
Per Share Operating Data: | | | | | | | | |
Net Asset Value, | | | | | | | | |
Beginning of Period ………………………….……..….. | | $6.21) | $5.31) | $4.94) | $4.48) | $4.22) | $3.80) | |
Income gain (loss) from investment operations: | | | | | | | | |
Net investment loss4 .………….……………………..…… | | (0.18) | (0.35) | (0.37) | (0.34) | (0.33) | (0.22) | |
Net realized and unrealized gain (loss) 4 ……………….. | | (0.11) | 1.44) | 0.74) | 0.80) | 0.59) | 0.64) | |
Total income gain (loss) from investment operations .… | | (0.29) | 1.09) | 0.37) | 0.46) | 0.26) | 0.42) | |
Distributions: | | | | | | | | |
Long-term capital gains distributions …..……………….. | | (0.70) | (0.19) | -) | -) | -) | -) | |
Total distributions …………………………………………. | | (0.70) | (0.19) | -) | -) | -) | -) | |
Net Asset Value, End of Period ……………………….… | | $5.22) | $6.21) | $5.31) | $4.94) | $4.48) | $4.22) | |
Total Return at Net Asset Value1 ……………………... | | (5.4)% | 20.7)% | 7.5)% | 10.3)% | 6.2)% | 11.1)% | |
Ratios/Supplemental Data: | | | | | | | | |
Net assets, end of period (in thousands) ………………. | | $245) | $265) | $167) | $169) | $170) | $150) | |
Ratio to average net assets: | | | | | | | | |
Net investment loss4 …...……………………………...…. | | (6.16)% | (6.13)% | (7.49)% | (7.55)% | (7.60)% | (5.51)% | |
Expenses4. ……..……..…………………………………... | | 7.03)% | 7.09)% | 8.68)% | 8.89)% | 8.95)% | 7.07)% | |
Portfolio Turnover Rate2 ………………………………….. | | 7)% | 4)% | 0)% | 7)% | 11)% | 15)% | |
1. Assumes a hypothetical initial investment on the business day before the first day of the fiscal period with all dividends and distributions reinvested in additional shares on the reinvestment date and redemption at the net asset value calculated on the last business day of the fiscal period. Sales charges are not reflected in total returns.
2. The lesser of purchases or sales of Series One portfolio securities for a period, divided by the monthly average of the market value of securities owned during the period. Securities with a maturity or expiration date at the time of acquisition of one year or less are excluded from the calculation. Purchases and sales of investment securities (other than short-term securities) from the six months ended January 31, 2022, aggregated $480,153 and $1,374,902, respectively.
3. The lesser of purchases or sales of American Growth Cannabis Fund portfolio securities for a period, divided by the monthly average of the market value of securities owned during the period. Securities with a maturity or expiration date at the time of acquisition of one year or less are excluded from the calculation. Purchases and sales of investment securities (other than short-term securities) from the six month ended January 31, 2022, aggregated $0 and $0, respectively.
4. Per share amounts have been calculated using the Average Shares Method.
5. Legal Fees for the Objective and Name Change for the American Growth Cannabis Fund were $34,956 which attributed to 4.44% of the 11.79% after fee waiver expense ratio.
See accompanying notes to financial statements.
American Growth Fund, Inc – Page 34
AMERICAN GROWTH FUND, INC.
Series One - Class C
Six Months | Six | |
Ended | Month | |
| Ended | Year Ended |
January 31, | January 31 | July 31, |
(unaudited) | (unaudited) | |
| | 2022 | 2021 | 2020 | 2019 | 2018 | 2017 | |
Per Share Operating Data: | | | | | | | | |
Net Asset Value, | | | | | | | | |
Beginning of Period ………………………….……..….. | | $6.70) | $5.62) | $5.03) | $4.47) | $4.20) | $3.79) | |
Income gain (loss) from investment operations: | | | | | | | | |
Net investment loss4 .………….……………………..…… | | (0.13) | (0.27) | (0.25) | (0.23) | (0.20) | (0.22) | |
Net realized and unrealized gain (loss) 4 ……………..… | | (0.12) | 1.54) | 0.84) | 0.79) | 0.47) | 0.63) | |
Total income gain (loss) from investment operations .… | | (0.25) | 1.27) | 0.59) | 0.56) | 0.27) | 0.41) | |
Distributions: | | | | | | | | |
Long-term capital gains distributions …..……………….. | | (0.76) | (0.19) | -) | -) | -) | -) | |
Total distributions …………………………………………. | | (0.76) | (0.19) | -) | -) | -) | -) | |
Net Asset Value, End of Period ……………………….… | | $5.69) | $6.70) | $5.62) | $5.03) | $4.47) | $4.20) | |
Total Return at Net Asset Value1 ……………………... | | (4.4)% | 22.8)% | 11.7)% | 12.5)% | 6.4)% | 10.8)% | |
Ratios/Supplemental Data: | | | | | | | | |
Net assets, end of period (in thousands) ………………. | | $1,407) | $1,480) | $1,589) | $1,578) | $2,593) | $2,720) | |
Ratio to average net assets: | | | | | | | | |
Net investment loss4 …...……………………………...…. | | (4.13)% | (4.41)% | (4.80)% | (5.05)% | (4.60)% | (5.51)% | |
Expenses4. ……..……..…………………………………... | | 5.00)% | 5.41)% | 5.98)% | 6.41)% | 5.91)% | 7.07)% | |
Portfolio Turnover Rate2 ………………………………….. | | 7)% | 4)% | 0)% | 7)% | 11)% | 15)% | |
1. Assumes a hypothetical initial investment on the business day before the first day of the fiscal period with all dividends and distributions reinvested in additional shares on the reinvestment date and redemption at the net asset value calculated on the last business day of the fiscal period. Sales charges are not reflected in total returns.
2. The lesser of purchases or sales of Series One portfolio securities for a period, divided by the monthly average of the market value of securities owned during the period. Securities with a maturity or expiration date at the time of acquisition of one year or less are excluded from the calculation. Purchases and sales of investment securities (other than short-term securities) from the six months ended January 31, 2022, aggregated $480,153 and $1,374,902, respectively.
3. The lesser of purchases or sales of American Growth Cannabis Fund portfolio securities for a period, divided by the monthly average of the market value of securities owned during the period. Securities with a maturity or expiration date at the time of acquisition of one year or less are excluded from the calculation. Purchases and sales of investment securities (other than short-term securities) from the six month ended January 31, 2022, aggregated $0 and $0, respectively.
4. Per share amounts have been calculated using the Average Shares Method.
5. Legal Fees for the Objective and Name Change for the American Growth Cannabis Fund were $34,956 which attributed to 4.44% of the 11.79% after fee waiver expense ratio.
See accompanying notes to financial statements.
American Growth Fund, Inc – Page 35
AMERICAN GROWTH FUND, INC.
Series One - Class D
Six Months | Six | |
Ended | Month | |
| Ended | Year Ended |
January 31, | January 31 | July 31, |
(unaudited) | (unaudited) | |
| | 2022 | 2021 | 2020 | 2019 | 2018 | 2017 | |
Per Share Operating Data: | | | | | | | | |
Net Asset Value, | | | | | | | | |
Beginning of Period ………………………….……..….. | | $8.73) | $7.18) | $6.42) | $5.61) | $5.21) | $4.65) | |
Income gain (loss) from investment operations: | | | | | | | | |
Net investment loss4 .………….……………………..…… | | (0.11) | (0.25) | (0.23) | (0.21) | (0.19) | (0.22) | |
Net realized and unrealized gain (loss) 4 ……………….. | | (0.14) | 1.99) | 0.99) | 1.02) | 0.59) | 0.78) | |
Total income gain (loss) from investment operations .… | | (0.25) | 1.74) | 0.76) | 0.81) | 0.40) | 0.56) | |
Distributions: | | | | | | | | |
Long-term capital gains distributions ..………………….. | | (1.00) | (0.19) | -) | -) | -) | -) | |
Total distributions …………………………………………. | | (1.00) | (0.19) | -) | -) | -) | -) | |
Net Asset Value, End of Period ……………………….… | | $7.48) | $8.73) | $7.18) | $6.42) | $5.61) | $5.21) | |
Total Return at Net Asset Value1 ……………………... | | (3.5)% | 24.5)% | 11.8)% | 14.4)% | 7.7)% | 12.0)% | |
Ratios/Supplemental Data: | | | | | | | | |
Net assets, end of period (in thousands) ………………. | | $7,531) | $8,110) | $6,989) | $6,558) | $6,153) | $6,200) | |
Ratio to average net assets: | | | | | | | | |
Net investment loss4 …...……………………………...…. | | (2.60)% | (3.11)% | (3.49)% | (3.75)% | (3.51)% | (4.51)% | |
Expenses4. ……..………..………………………………... | | 3.48)% | 4.07)% | 4.68)% | 5.09)% | 4.83)% | 6.07)% | |
Portfolio Turnover Rate2 ………………………………….. | | 7)% | 4)% | 0)% | 7)% | 11)% | 15)% | |
1. Assumes a hypothetical initial investment on the business day before the first day of the fiscal period with all dividends and distributions reinvested in additional shares on the reinvestment date and redemption at the net asset value calculated on the last business day of the fiscal period. Sales charges are not reflected in total returns.
2. The lesser of purchases or sales of Series One portfolio securities for a period, divided by the monthly average of the market value of securities owned during the period. Securities with a maturity or expiration date at the time of acquisition of one year or less are excluded from the calculation. Purchases and sales of investment securities (other than short-term securities) from the six months ended January 31, 2022, aggregated $480,153 and $1,374,902, respectively.
3. The lesser of purchases or sales of American Growth Cannabis Fund portfolio securities for a period, divided by the monthly average of the market value of securities owned during the period. Securities with a maturity or expiration date at the time of acquisition of one year or less are excluded from the calculation. Purchases and sales of investment securities (other than short-term securities) from the six month ended January 31, 2022, aggregated $0 and $0, respectively.
4. Per share amounts have been calculated using the Average Shares Method.
5. Legal Fees for the Objective and Name Change for the American Growth Cannabis Fund were $34,956 which attributed to 4.44% of the 11.79% after fee waiver expense ratio.
See accompanying notes to financial statements.
American Growth Fund, Inc – Page 36
AMERICAN GROWTH FUND, INC.
American Growth Cannabis Fund - Class E
Six Months | Six | |
Ended | Month | |
| Ended | Year Ended |
January 31, | January 31 | July 31, |
(unaudited) | (unaudited) | |
| | 2022 | 2021 | 2020 | 2019 | 2018 | 2017 | |
Per Share Operating Data: | | | | | | | | |
Net Asset Value, | | | | | | | | |
Beginning of Period ………………………….……..….. | | $4.23) | $3.60) | $3.95) | $3.85) | $4.04) | $11.15) | |
Income gain (loss) from investment operations: | | | | | | | | |
Net investment loss4 .………….……………………..…… | | (0.02) | (0.25) | (0.36) | (0.36) | (0.58) | (0.64) | |
Net realized and unrealized gain (loss) 4 ……………….. | | (0.56) | 0.88) | 0.01) | 0.46) | 0.39) | (0.61) | |
Total income gain (loss) from investment operations .… | | (0.58) | 0.63) | (0.35) | 0.10) | (0.19) | (1.25) | |
Distributions: | | | | | | | | |
Short-term capital gains distributions ..………………….. | | (2.28) | -) | -) | -) | -) | -) | |
Long-term capital gains distributions ..………………….. | | (0.81) | | | | | (5.73) | |
Return of capital distributions ……………………………. | | -) | -) | -) | -) | -) | (0.13) | |
Total distributions …………………………………………. | | (3.09) | -) | -) | -) | -) | (5.86) | |
Net Asset Value, End of Period ………………���…….… | | $0.56) | $4.23) | $3.60) | $3.95) | $3.85) | $4.04) | |
Total Return at Net Asset Value1 ……………………... | | (40.3)% | 17.5)% | (8.9)% | 2.6)% | (4.7)% | (23.8)% | |
Ratios/Supplemental Data: | | | | | | | | |
Net assets, end of period (in thousands) ………………. | | $318 | $1,750 | $851 | $954 | $765) | $589) | |
Ratio to average net assets: | | | | | | | | |
Net investment loss (After Fee Waiver)4 …...………….. | | (4.45)% | (5.42)%0 | (10.71)%0 | (8.87)% | (14.30)% | (13.37)% | |
Expenses (Before Fee Waiver)4. ……...……………...…. | | 4.95)% | 6.28)%5 | 12.79)%5 | 9.90)% | 15.15)% | 14.53)% | |
Expenses (After Fee Waiver) 4. ….…..……………...…... | | 4.95)% | 5.99)%5 | 11.79)%5 | 9.90)% | 15.15)% | 14.53)% | |
Portfolio Turnover Rate3 ………………………………….. | | 0)% | 461)% | 54)% | 16)% | 8)% | 151)% | |
1. Assumes a hypothetical initial investment on the business day before the first day of the fiscal period with all dividends and distributions reinvested in additional shares on the reinvestment date and redemption at the net asset value calculated on the last business day of the fiscal period. Sales charges are not reflected in total returns.
2. The lesser of purchases or sales of Series One portfolio securities for a period, divided by the monthly average of the market value of securities owned during the period. Securities with a maturity or expiration date at the time of acquisition of one year or less are excluded from the calculation. Purchases and sales of investment securities (other than short-term securities) from the six months ended January 31, 2022, aggregated $480,153 and $1,374,902, respectively.
3. The lesser of purchases or sales of American Growth Cannabis Fund portfolio securities for a period, divided by the monthly average of the market value of securities owned during the period. Securities with a maturity or expiration date at the time of acquisition of one year or less are excluded from the calculation. Purchases and sales of investment securities (other than short-term securities) from the six month ended January 31, 2022, aggregated $0 and $0, respectively.
4. Per share amounts have been calculated using the Average Shares Method.
5. Legal Fees for the Objective and Name Change for the American Growth Cannabis Fund were $34,956 which attributed to 4.44% of the 11.79% after fee waiver expense ratio.
See accompanying notes to financial statements.
American Growth Fund, Inc – Page 37
Notes to Financial Statements
American Growth Fund, Inc. (unaudited)
1. Summary of Significant Accounting Policies
American Growth Fund, Inc. Series One ("Series One"), and American Growth Cannabis Fund, formerly American Growth Fund, Inc. – Series Two, are registered under the Investment Company Act of 1940, as amended. Series One is a diversified, open-end management investment company. The American Growth Cannabis Fund is a diversified mutual fund, open-end management mutual fund, focused on the legal cannabis business. Series One and American Growth Cannabis Fund follow the investment company accounting and reporting guidance of the Financial Accounting Standards Board Accounting Standards Codification Topic 946 “Financial Services – Investment Companies.” Series One’s and American Growth Cannabis Fund’s primary investment objectives are growth of capital. Series One’s and American Growth Cannabis Fund’s investment advisor is Investment Research Corporation (IRC). Series One offers Class A, Class B, Class C, and Class D shares and American Growth Cannabis Fund offers Class E and Class F shares. Class D shares are available to shareholders of accounts established prior to March 1, 1996. Class A, Class D, and Class E have a maximum sales charge (load) imposed on purchases (as a percentage of offering price) of 5.75%. Purchases of Class A, Class D, and Class E shares in amounts of $1,000,000 or more which are not subject to an initial sales charge generally will be subject to a contingent deferred sales charge of 1.0% of amounts redeemed within the first year of purchase. Class B has a maximum deferred sales charge (Contingent Deferred Sales Charge) as a percentage of original purchase price or redemption proceeds, whichever is lower, for the first 2 years of 5%, 3rd & 4th years - 4%, 5th yr. - 3%, 6th yr. - 2%, 7th yr. - 1%. Class C and Class F have a maximum deferred sales charge as a percentage of original purchase price or redemption proceeds, whichever is lower, of 1% for the first year. As of July 31, 2021, there were no shares of Class F outstanding. All classes of shares have identical rights to earnings, assets and voting privileges, except that each class has its own distribution and/or service plan and expenses directly attributable to that class and exclusive voting rights with respect to matters affecting that class.
Reclassifications - Accounting principles generally accepted in the United States of America require that certain components of net assets be reclassified between financial and tax reporting. These reclassifications have no effect on net assets nor net asset value per share. For the year ended July 31, 2021, the following reclassifications were made:
Series One | | American Growth Cannabis Fund |
Distributable earnings (loss) | Paid-In Capital | | | Distributable earnings (loss) | Paid-In Capital | |
$701,984 | $(701,984) | | | $- | $- | |
Investment Valuation – Investment securities traded on the New York Stock Exchange or other stock exchange approved for this purpose by the board of directors will be valued on the basis of the closing sale thereof on such stock exchange, or, if such sale is lacking, at the mean between closing bid and asked prices on such day. If no bid and asked prices are quoted for such day or information as to New York or other approved exchange transactions is not readily available, the security will be valued by reference to recognized composite quotations or such other method as the board of directors in good faith deem will reflect its fair market value. Securities not traded on any stock exchange but for which market quotations are readily available are valued on the basis of the mean of the last bid and asked prices. Short-term securities are valued at the mean between the closing bid and asked prices or by such other method as the board of directors determines to reflect their fair market value. The board of directors in good faith determine the manner of ascertaining the fair market value of other securities and assets.
Allocation of Income, Expenses, Gains and Losses - Income, expenses (other than those attributable to a specific class), gains and losses are allocated daily to each class of shares based upon the relative proportion of net assets represented by such class. Operating expenses directly attributable to a specific class are charged against the operations of that class.
Federal Income Taxes - No provision for federal income nor excise taxes have been made because the Fund intends to comply with the provisions of subchapter M of the Internal Revenue Code applicable to regulated investment companies and to distribute all of its taxable income to shareholders.
American Growth Fund, Inc – Page 38 Annual Report for the Six Months Ended January 31, 2022
Notes to Financial Statements
American Growth Fund, Inc. (unaudited)
The Fund recognizes the tax benefits of uncertain tax positions only where the position is "more likely than not" to be sustained assuming examination by tax authorities. Management has analyzed the Fund’s tax positions, and has concluded that no liability for unrecognized tax benefits should be recorded related to uncertain tax positions taken on the open tax year 2018-2020 and expected to be taken in the Fund's 2021 tax returns. The Fund identifies its major tax jurisdictions as U.S. Federal, Colorado State and foreign jurisdictions where the Fund makes significant investments; however the Fund is not aware of any tax positions for which it is reasonably possible that the total amounts of unrecognized tax benefits will change materially in the next twelve months.
Classification of Distributions to Shareholders - The character of distributions made during the year from net investment income or net realized gains may differ from its ultimate characterization for federal income tax purposes. Also, due to timing of dividend distributions, the fiscal year in which amounts are distributed may differ from the fiscal year in which the income or realized gain was recorded by the Fund.
Security Transactions and Related Investment Income - Investment transactions are accounted for on the date the investments are purchased or sold (trade date). Dividend income and distributions to shareholders are recorded on the ex-dividend date. Interest income is recorded on the accrual basis. Realized gains and losses from investment transactions and unrealized appreciation and depreciation of investments are reported on an identified cost basis which is the same basis used for federal income tax purposes.
Use of Estimates - The preparation of financial statements in conformity with accounting principles generally accepted in the United States requires management to make estimates and assumptions that affect the reported amounts of assets and liabilities and disclosure of contingent assets and liabilities at the date of the financial statements and the reported amounts of increases and decreases in net assets from operations during the reporting period. Actual results could differ from those estimates.
Securities Valuations – As described in note 1, the Fund utilizes various methods to measure the fair value of most of its investments on a recurring basis. U.S. GAAP establishes a hierarchy that prioritizes inputs to valuation methods. The three levels of inputs are:
Level 1 – Unadjusted quoted prices in active markets for identical assets or liabilities that the Fund has the ability to access.
Level 2 – Observable inputs other than quoted prices included in level 1 that are observable for the asset or liability, either directly or indirectly. These inputs include quoted prices for the identical instrument on an inactive market, prices for similar instruments, interest rates, prepayment speeds, credit risk, yield curves, default rates and similar data.
Level 3 – Unobservable inputs for the asset or liability, to the extent relevant observable inputs are not available, represent the Fund’s own assumptions about the assumptions a market participant would use in valuing the asset or liability, and would be based on the best information available.
The availability of observable inputs can vary from security to security and is affected by a wide variety of factors, including, for example, the type of security, whether the security is new and not yet established in the marketplace, the liquidity of markets, and other characteristics particular to the security. To the extent that valuation is based on models or inputs that are less observable or unobservable in the market, the determination of fair value requires more judgment. Accordingly, the degree of judgment exercised in determining fair value is greatest for instruments categorized in level 3.
The inputs used to measure fair value fall into different levels of the fair value hierarchy. In such cases, for disclosure purposes, the level in the fair value hierarchy within which the fair value measurement falls in its entirety, is determined based on the lowest level input that is significant to the fair value measurement in its entirety.
Annual Report for the Six Months Ended January 31, 2022 American Growth Fund, Inc – Page 39
Notes to Financial Statements
American Growth Fund, Inc. (unaudited)
The following is a summary of the inputs used, as of January 31, 2022, in valuing the Fund’s assets carried at fair value:
Series One | | | | |
Equity | | Level 1 | Level 2 | Level 3 | Total |
Common Stock | | $ 19,772,209 | 0 | 0 | $ 19,772,209 |
American Growth Cannabis Fund | | | | |
Equity | | Level 1 | Level 2 | Level 3 | Total |
Common Stock | | $ 253,698 | 0 | 0 | $ 253,698 |
The industry classifications of Level 1 investments are included in the Statement of Investments.
There were no transfers in to or out of Level 1 or Level 2 for the six months ended January 31, 2022. Transfers are recognized at the end of the reporting period.
2. Shares of Beneficial Interest
Series One and American Growth Cannabis Fund have authorized an unlimited number of no par value shares of beneficial interest of each class. Transactions in shares of beneficial interest were as follows:
| For the six months ended | For the year ended |
| January 31, 2022 | July 31, 2021 |
| (unaudited) | |
| Shares | Amount | Shares | Amount |
Series One - Class A: | | | | |
Sold | 33,126) | 259,815) | 69,757) | 536,783) |
Dividends and distributions Reinvested | 150,465) | 1,102,965) | 32,032) | 237,354) |
Redeemed | (73,603) | (578,169) | (250,961) | (1,846,246) |
Net decrease | 109,988) | 784,611) | (149,172) | (1,072,109) |
Series One - Class B: | | | | |
Sold | 5,681) | 33,656) | 12,589) | 68,806) |
Dividends and distributions Reinvested | 4,223) | 23,396) | 1,126) | 6,510) |
Redeemed | (5,620) | (34,177) | (2,493) | (15,058) |
Net increase (decrease) | 4,284) | 22,875) | 11,222) | 60,258) |
| | | | |
| | | | |
| | | | |
| | | | |
| | | | |
Series One - Class C: | | | | |
Sold | 15,773) | 103,223) | 16,890) | 105,407) |
Dividends and distributions Reinvested | 25,684) | 154,872) | 7,565) | 46,751) |
Redeemed | (15,170) | (96,836) | (86,408) | (523,804) |
Net decrease | 26,287) | 161,259) | (61,953) | (371,646) |
Series One - Class D: | | | | |
Sold | 742) | 6,222) | 3,547) | 28,900) |
Dividends and distributions Reinvested | 107,974) | 857,970) | 21,346) | 169,486) |
Redeemed | (30,665) | (261,285) | (69,498) | (547,339) |
Net decrease | 78,051) | 602,907) | (44,605) | (348,953) |
American Growth Cannabis Fund - Class E: | | | | |
Sold | 563,783) | 138,924) | 333,974) | 1,658,302) |
Dividends and distributions reinvested | 8,648,143) | 605,372) | -) | -) |
Reverse Stock Split | (5,047,995) | -) | -) | -) |
Redeemed | (4,013,980) | (1,010,225) | (156,829) | (655,901) |
Net increase (decrease) | 149,951) | (265,929)) | 177,145) | 1,002,401) |
American Growth Cannabis Fund - Class F: | | | | |
Sold | -) | -) | -) | -) |
Dividends and distributions reinvested | | | | |
Redeemed | -) | -) | -) | -) |
Net increase (decrease) | -) | -) | -) | -) |
American Growth Fund, Inc – Page 40 Annual Report for the Six Months Ended January 31, 2022
Notes to Financial Statements
American Growth Fund, Inc. (unaudited)
3. Realized and Unrealized Gains and Losses on Investments
The identified tax cost basis of investments for Series One and American Growth Cannabis Fund at January 31, 2022 was $6,100,810 and $800,721, respectively. Net unrealized appreciation (depreciation) on investments for Series One and American Growth Cannabis Fund of $13,671,399 and $(547,023), respectively, based on identified tax cost as of January 31, 2022, was comprised of gross appreciation of $13,734,656 and $63,257, respectively, and gross depreciation of $13,514 and $560,537, respectively.
Annual Report for the Six Months Ended January 31, 2022 American Growth Fund, Inc – Page 41
Notes to Financial Statements
American Growth Fund, Inc. (unaudited)
4. Underwriting, Investment Advisory Contracts, Service Fees and Other Related Parties (unaudited)
Under the investment advisory contract with IRC, the advisor receives annual compensation for investment advice, computed and paid monthly, for each of Series One and the American Growth Cannabis Fund equal to 1% of the first $30 million of the respective Fund's average annual net assets and 0.75% such assets in excess of $30 million. Series One and American Growth Cannabis Fund pay their own operating expenses.
A Fee Waiver Agreement for the American Growth Cannabis Fund was executed August 1, 2019 and currently ends July 31, 2022 unless it is extended. It may not be modified or terminated prior to such date without the consent of the board. If the Total Annual Fund Operating Expenses exceed an annual rate of 6.00% of the Fund’s average daily net assets during this period, the Adviser will waive all or a portion of its Management Fee payable with respect to the Fund to the extent of such excess up to the full amount of its Management Fee. The amount of the Adviser’s waiver shall be limited to, and shall not exceed, the maximum amount of the “Adviser’s Fee” that the Adviser is entitled to receive under the Investment Adviser Agreement between the Adviser and the American Growth Fund, Inc., with respect to the Fund, dated August 8, 2013 (the “Advisory Agreement”). The Adviser is permitted to recapture fees that it has waived for the Fund pursuant to the fee waiver agreement to the extent that a Fund’s expenses in later periods fall below the annual rate set forth in the fee waiver agreement; provided, however, that such recapture payments do not cause the Fund’s expense ratio (after recapture) to exceed the lesser of (i) an annual rate of 6.00% of the Fund’s average daily net assets and (ii) the expense cap (if any) in effect at the time of the recapture. Notwithstanding the
foregoing, the Fund will not be obligated to pay any such deferred fees more than three years after the date on which the fee were deferred. For the six months ended January 31, 2022 the investment advisor waived $0 for the annual compensation for investment advice.
The Advisor may recapture a portion of fees waived above no later than the years as states below:
| | July 31, 2025 | July 31, 2024 | July 31, 2023 | Total |
American Growth Cannabis Fund | | $0 | $4,541 | $7,871 | $12,412 |
Class B and Class C shares each are subject to annual service and distribution fees of 1.00% of average daily net assets. Class A shares are subject to annual service and distribution fees no greater than 0.30% of average daily net assets.
Class F shares are subject to annual service and distribution fees of 0.25% and 0.75% of average daily net assets, respectively. Class E shares are subject to annual service and distribution fees no greater than 0.30% of average daily net assets..
For the six months ended January 31, 2022 commissions and sales charges paid by investors on the purchase of Series One and American Growth Cannabis Fund shares to totaled $5,077 and $812, respectively, of which $57 and $0, respectively, was retained by World Capital Brokerage, Inc. ("WCB"), an affiliated broker/dealer which serves as the underwriter and distributor of the Series One and American Growth Cannabis Fund. Sales charges advanced to broker/dealers by WCB on sales of Series One Class B and C shares and American Growth Cannabis Fund Class F shares totaled $2,286 and $0, respectively, of which $0 and $0, respectively, was retained by WCB. For the six months ended January 31, 2022, WCB received contingent deferred sales charges of $835 and $0 upon redemption of Class B and C shares and F shares, respectively, as reimbursement for sales commissions advanced by WCB upon the sale of such shares. No payments were made by Series One nor American Growth Cannabis Fund to WCB for brokerage commission on securities transactions.
Certain officers of Series One and American Growth Cannabis Fund are also officers of WCB and IRC. For the six month ended January 31, 2022, Series One and American Growth Cannabis Fund paid directors' fees of $16,497 and $803, respectively, expenses of $0 and $0, respectively, and the audit chair $0 and $0, respectively, for review.
American Growth Fund, Inc – Page 42 Annual Report for the Six Months Ended January 31, 2022
Notes to Financial Statements
American Growth Fund, Inc. (unaudited)
For the six month ended January 31, 2022, under an agreement with IRC, Series One and American Growth Cannabis Fund were charged $77,065 and $3,686, respectively, for the costs and expenses related to employees of IRC who provided administrative, clerical and accounting services to the Fund and $14,194 and $806, respectively, to provide the daily fund accounting services. In addition, Series One and American Growth Cannabis Fund were charged $51,754 and $2,965, respectively, by an affiliated company of IRC for the rental of office space.
5. Federal Income Tax Matters
Dividends paid by Series One and American Growth Cannabis Fund from net investment income and distributions of net realized short-term capital gains are, for federal income tax purposes, taxable as ordinary income to shareholders.
Series One and American Growth Cannabis Fund distributes net realized capital gains, if any, to its shareholders at least annually, if not offset by capital loss carryovers. Income distributions and capital gain distributions are determined in accordance with income tax regulations, which may differ from accounting principles generally accepted in the United States of America. These differences are primarily due to the differing treatment of net operating losses, foreign currency and tax allocations. Accordingly, these permanent differences in the character of income and distributions between financial statements and tax basis have been reclassified to paid-in capital.
At July 31, 2021, Series One for federal income tax purposes had no available capital loss carryover.
As of July 31, 2021 American Growth Cannabis Fund had utilized short capital loss carryovers of $15,838.
Net capital losses incurred after October 31, and within the taxable year, are deemed to arise on the first business day of Series One’s and American Growth Cannabis Fund’s next taxable year.
At July 31, 2021, Series One had $217 of post-October losses. American Growth Cannabis Fund did not have any post-October losses.
Series One had a $515,741 long term capital gain distribution and $0 paid during the years ended July 31, 2021 and 2020, respectively. There were no distributions paid during the years ended July 31, 2021 and 2020 for American Growth Cannabis Fund.
As of July 31, 2021 the components of accumulated gains (loss) on a tax-basis were as follows:
Series One American Growth Cannabis Fund
Undistributed income $ -)) $ 594,213)
Long Capital Gains 2,245,149) 211,647)
Unrealized appreciation (depreciation) 14,823,698) ((854,119)
Post-October loss (217) -)
Total accumulated gain (loss) $17,068,630) $ (48,259)
6. Subsequent Events
In preparing these financial statements, the Fund has evaluated events and transactions for potential recognition or disclosure through the date these financial statements were issued.
Annual Report for the Six Months Ended January 31, 2022 American Growth Fund, Inc – Page 43
Notes to Financial Statements
American Growth Fund, Inc. (unaudited)
7. COVID-19 Virus
In early 2020, an outbreak of a novel strain of coronavirus (COVID-19) emerged globally. As a result, there have been various mandates from federal, state and local authorities which resulted in an overall decline in economic activity. Some mandates have been eased. The easing of these mandates has varied from state to state. The pandemic has not ended so the ultimate impact of COVID-19 on the financial performance of the Funds’ investments has lessened but continues to not be non-foreseeable at this time. The Investment Committee continues to monitor this event. The financial statements do not include any adjustment that might result from the outcome of this uncertainty.
8. Review of Affiliated Company’s Expenses (unaudited) – The Trust’s Audit Committee reviews, on a monthly and quarterly basis, the details of each expense incurred by the Trust in order to determine the appropriateness. These expenses are then presented to the Trust’s Board of Directors for review and approval at the next quarterly Board Meeting.
For the six months ended January 31, 2022 the Trust paid to its affiliated companies, World Capital Brokerage, Inc. $10,361, Investment Research Corporation $132,333, and AGF Properties, Inc. $55,076 for services they provided to the Trust and its shareholders. These payments resulted in these affiliated companies earning profit or losses totaling World Capital Brokerage, Inc. $828, Investment Research Corporation $11,615, and AGF Properties, Inc. $(13,467).
9. Risk (American Growth Cannabis Fund) – The American Growth Cannabis Fund concentrates its investments in the Pharmaceuticals, Botanical Medical Chemical and Biotechnology Industry Group and is subject to the risks associated with those industries. The value of the Fund’s shares will be affected by factors particular to the Pharmaceuticals, Botanical Medical Chemical and Biotechnology Industry Group and related sectors (such as government regulation) and may fluctuate more widely than that of a typical diversified fund.
Health Care Sector Concentration – Due to the concentration in the Pharmaceuticals, Botanical Medical Chemical and Biotechnology Industry Group, the fund has a higher than normal concentration in the health care sector. The health care sector is subject to government regulation and reimbursement rates, as well as government approval of products and services, which could have a significant effect on price and availability, and can be significantly affected by product liability claims, rapid obsolescence, and patent expirations.
Cannabis Industry Risk - The cannabis industry is a very young, fast evolving industry with possible increased exposure to rule changes, changes in laws, increasing regulations, increasing competition which may cause businesses to suddenly close or businesses to shrink as well as the possibility that a company currently operating legally may suddenly find itself exposed to illegal activities. The Fund invests mainly in over the counter securities.
For more details on the risks of investing, please refer to the Fund’s Prospectus/Statement of Additional Information available at www.americangrowthfund.com or by calling 800-525-2406.
American Growth Fund, Inc – Page 44 Annual Report for the Six Months Ended January 31, 2022
Analysis of Expenses (unaudited)
As a shareholder of the Fund, you may incur two types of costs: (1) transaction costs, including front-end sales charges with respect to Class A, D, and E shares or contingent deferred sales charges ("CDSC") with respect to Class B, C, and F shares; and (2) ongoing costs, including management fees; distribution and/or service (12b-1) fees; and other Fund expenses. The tables below are intended to help you understand your ongoing costs (in dollars) of investing in the Fund and to compare these costs with the ongoing costs of investing in other mutual funds.
The tables below are based on an investment of $1,000 invested on August 1, 2020 and held for the six months ended January 31, 2021.
Actual expenses (unaudited)
This table provides information about actual account values and actual expenses. You may use the information provided in this table, together with the amount you invested, to estimate the expenses that you paid over the period. To estimate the expenses you paid on your account, divide your ending account value by $1,000 (for example, an $8,600 ending account value divided by $1,000 = 8.6), then multiply the result by the number under the heading entitled "Expenses Paid During the Period".
For the six months ended January 31, 2022 (August 1, 2021 to January 31, 2022)
Actual Total
Return Beginning Ending Expenses
Without Account Account Paid Expenses
Sales Charges Value Value The Period(2)
Class A (3.78)% $1,000.00 $962.18 $ 37.14
Class B (5.35)% $1,000.00 $946.50 $ 66.54
Class C (4.38)% $1,000.00 $956.16 $ 47.81
Class D (3.52)% $1,000.00 $964.82 $ 33.58
Class E (40.25)% $1,000.00 $597.48 $ 29.58
(1) Assumes reinvestment of all dividends and capital gain distributions, if any, at net asset value and does not reflect the deduction of the applicable sales charges with respect to Class A, D or E shares or the applicable Contingent Deferred Sales Charges ("CDSC") with respect to Class B, C, or F Shares.
(2) Expenses are equal to the annualized expense ratio (after fee waivers) of 3.86%, 7.03%, 5.00%, 3.48% and 4.95% for the Fund’s Class A, B, C, D, and E shares, respectively, multiplied by the average account value over the period multiplied by 184/365 (to reflect a year period).
American Growth Fund, Inc – Page 45 Annual Report for the Six Months Ended January 31, 2022
Hypothetical example for comparison purposes (unaudited)
The table below provides information about hypothetical account values and hypothetical expenses based on the actual expense ratio and an assumed rate of return of 5.00% per year before expenses, which is not the Fund's actual return. The hypothetical account values and expenses may not be used to estimate the actual ending account balance nor expenses you paid for the period. You may use the information provided in this table to compare the ongoing costs of investing in the Fund and other mutual funds. To do so, compare this 5.00% hypothetical example relating to the Fund with the 5.00% hypothetical examples that appear in the shareholder reports of other mutual funds.
Please note that the expenses shown in the table below are meant to highlight your ongoing costs only and do not reflect any transactional costs. The example does not reflect the deduction of contingent deferred sales charges ("CDSC") with respect to Class B and C shares. Therefore, the table is useful in comparing ongoing costs only, and will not help you determine the relative total costs of owning different mutual funds. In addition, if these transaction costs were included, your costs would have been higher.
For the six months ended January 31, 2022 (August 1, 2021 to January 31, 2022)
Hypothetical
Annualized Beginning Ending Expenses
Total Account Account Paid Expenses
Return Value Value The Period(2)
Class A 5.00% $1,000.00 $1,050.56 $ 40.55
Class B 5.00% $1,000.00 $1,049.92 $ 73.81
Class C 5.00% $1,000.00 $1,050.75 $ 52.54
Class D 5.00% $1,000.00 $1,050.41 $ 36.55
Class E 5.00% $1,000.00 $1,049.65 $ 51.96
(2) Expenses are equal to the annualized expense ratio (after fee waivers) of 3.86%, 7.03%, 5.00%, 3.48% and 4.95% for the Fund’s Class A, B, C, D, and E shares, respectively, multiplied by the average account value over the period multiplied by 184/365 (to reflect a year period).
American Growth Fund, Inc – Page 46 Annual Report for the Six Months Ended January 31, 2022
Allocation of Portfolio Assets (unaudited)
(Calculated as a percentage of Net Assets)
January 31, 2022
| Series One | | | American Growth Cannabis Fund | | |
| Industry Breakdown | | | Industry Breakdown | | |
| Diversified Company | 9.70)% | | Medicinal Chemicals & Botanical Products | 18.21)% | |
| Computer Software and Services | 8.96)% | | Pharmaceutical Preparations | 13.39)% | |
| Semiconductor Capital Equipment | 8.92)% | | Real Estate | 10.52)% | |
| Computer Hardware | 5.99)% | | Real Estate Investment Trusts | 10.21)% | |
| Cable TV | 5.97)% | | Drug Manufacturers | 8.72)% | |
| Online Media | 5.59)% | | Retail – Cyclical | 8.00)% | |
| Railroad | 5.56)% | | Exchange Traded Funds | 4.79)% | |
| Computer & Peripherals | 5.32)% | | Perfumes, Cosmetics & Other Toilet Preparations | 3.15)% | |
| Environmental | 4.92)% | | Retail - Building Materials, Hardware, Garden Supply | 2.16)% | |
| Biotechnology | 4.89)% | | Agriculture Production - Crops | 0.55)% | |
| Application Software | 4.86)% | | | | |
| Machinery | 4.50)% | | | | |
| Transportation and Logistics | 2.96)% | | | | |
| Retail - Apparel & Specialty | 2.93)% | | | | |
| Semiconductor | 2.41)% | | | | |
| Home Improvement Stores | 2.10)% | | | | |
| Farm & Construction Machinery | 1.49)% | | | | |
| Restaurants | 1.36)% | | | | |
| Industrial Products | 1.33)% | | | | |
| Chemicals | 1.16)% | | | | |
| Insurance (Property and Causality) | 1.02)% | | | | |
| Media – Diversified | 1.01)% | | | | |
| Business Services | 0.98)% | | | | |
| Bank | 0.90)% | | | | |
| Health Care Plans | 0.90)% | | | | |
| Telecommunication Services | 0.82)% | | | | |
| Drug | 0.69)% | | | | |
| Health Care Providers | 0.61)% | | | | |
| Medical Diagnostic & Research | 0.58)% | | | | |
| Asset Management | 0.53)% | | | | |
| Software | 0.47)% | | | | |
| | | | | | |
| Total Investments …………………………………..…………..….. | 99.43)% | | Total Investments…………...…………………….....… | 79.70)% | |
| Cash and Receivables, less Liabilities …………………………... | 0.57)% | | Cash and Receivables, less Liabilities ………….…… | 20.30)% | |
| Total Net Assets ………………………………………..………..… | 100.00)% | | Total Net Assets …………………………………….…. | 100.00)% | |
Annual Report for the Six Months Ended January 31, 2022 American Growth Fund, Inc – Page 47
NOTICE TO SHAREHOLDERS AT JANUARY 31, 2022 (UNAUDITED)
How to Obtain a Copy of the Fund’s Proxy Voting Records for the 12-Month Period Ended June 30, 2021
Information regarding how the Fund voted proxies relating to portfolio securities during the most recent 12-month period ended June 30th is available without charge, upon request, by calling 1-800-525-2406. Furthermore, you can obtain the Fund’s proxy voting records on the SEC’s website at http://www.sec.gov.
Quarterly Filings on Form N-PORT
Each Fund files form N-PORT on a quarterly basis which contains information on each Fund’s portfolio holdings. Each Fund’s Forms N-PORT and Form N-Q are available on the SEC’s website at http://www.sec.gov. Each Fund’s Form N-PORT may be reviewed and copied at the SEC’s Public Reference Room in Washington, DC and information on the operation of the Public Reference Room may be obtained by calling 1-800-SEC-0330. Information included in each Fund’s Forms N-PORT are also available by calling 1-800-525-2406.
INFORMATION ABOUT TRUSTEES AND OFFICERS (Unaudited)
The day-to-day operations of the Fund are managed by its officers, subject to the overall supervision and control of the board of directors. The Fund´s Audit Committee meets quarterly and is responsible for reviewing the financial statements of the Fund.
The following information about the interested directors2 of the Fund includes their principal occupations for the past five years:
Name, Address, and Age | Position(s) Held with Fund | Term of Office1 and Length of Time Served | Principal Occupation(s) During Past 5 Years | Number of Portfolios in Fund Complex Overseen by Director | Other Directorships Held by Director for the Past Five Years |
Timothy E. Taggart, 1636 Logan Street, Denver, CO
DOB: October 18, 1953 | President, Director and Treasurer | Since April 2004 | Principal financial and accounting officer, employee of Adviser since 1983. See below for affiliation with Distributor. | 2 | Director of World Capital Brokerage, Inc. and Investment Research Corporation |
American Growth Fund, Inc – Page 48 Annual Report for the Six Months Ended January 31, 2022
The following information about the non-interested directors, officers and advisors of the Fund includes their principal occupations for the past five years:
Name, Address, and Age | Position(s) Held with Fund | Term of Office1 and Length of Time Served | Principal Occupation(s) During Past 5 Years | Number of Portfolios in Fund Complex Overseen by Director | Other Directorships Held by Director for the Past Five Years |
Eddie R. Bush, 1400 W. 122nd Ave., Suite 100, Westminster, CO DOB: December 31, 1939 | Director, Audit Committee Chairman (financial expert), Lead Independent Director | Since September 1987 | Certified Public Accountant | 2 | None |
Darrell E. Bush, 2714 West 118th Ave, Westminster, CO DOB: February 19, 1971 | Director | Since September 2013 | Accountant | 2 | None |
Michael L. Gaughan, 2001 Avenue D, Scottsbluff, NE DOB: November 29, 1967 | Chief Compliance Officer and Secretary | Since September 2004 | Employee of the Fund since 1995. | N/A | World Capital Brokerage, Inc. and Investment Research Corporation |
Patricia A. Blum, 1636 Logan Street, Denver, CO DOB: June 27, 1959 | Vice President | Since June 2013 | Employee of the Fund since 2001. | N/A | World Capital Brokerage, Inc. |
1. Trustees and officers of the fund serve until their resignation, removal or retirement.
2. Timothy Taggart is an "interested person” of the Fund as defined by the Investment Company Act of 1940 because of the following position which he holds.
Timothy Taggart is the sole shareholder, president and a director of Investment Research Corporation. He is also president and a director of World Capital Brokerage, Inc., the Distributor.
None of the above-named persons received any retirement benefits or other form of deferred compensation from the Fund. There are no other funds that together with the Fund constitute a Fund Complex.
The Fund's Statement of Additional Information includes additional information about the Fund's trustees, and is available without charge upon request by calling 1-800-525-2406.
Annual Report for the Six Months Ended January 31, 2022 American Growth Fund, Inc – Page 49
BOARD APPROVAL OF INVESTMENT ADVISORY AGREEMENT (Unaudited)
Meeting of the Board of Directors Held on November 19, 2021
At a regular meeting of the Board of Directors (the “Board”) held via video conference on November 19, 2021 (the “meeting”), the Board, assisted by legal counsel representing the American Growth Fund, Inc. and the Independent Directors, including a majority of the Directors who are not interested persons of the Board (the “Independent Directors”), considered the approval for another year of the investment advisory agreement (the “Agreement”) between Investment Research Corporation (the “Adviser”) and the Trust for Series One and American Growth Cannabis Fund (each, in this section, a “Fund”).
In connection with its review and approval of the Agreement for another year at the Meeting, the Independent Directors participating considered materials furnished by the Adviser, including information about, but not limited to, the Adviser’s personnel, operations and financial condition. The Independent Directors also submitted questions to the Adviser prior to the Meeting. At the Meeting, representatives from the Adviser, presented information to the Board regarding the Adviser and each Fund, discussed with the Independent Directors all information provided, and responded to questions from the Board.
Matters considered by the Board, including the Independent Directors, at the Meeting in connection with its re-approval of the Agreement included the following:
Performance. The Board reviewed each Fund’s investment performance reports, which compared the performance of each Fund with several other mutual funds with generally similar investment strategies, at least in part, over various time periods, as well as with relevant benchmarks, and discussed these reports with representatives of the Adviser. The Board considered each Fund’s comparative performance over short-term and longer-term time periods. The relative performance of each Series compared to peer funds and benchmarks over recent time periods showed steady but lagging growth and was deemed satisfactory given the nature of the Funds, did not reflect an unreasonable gap in performance and that the Advisor had presented substantive information which was discussed in length at the meeting including measures aimed at improving performance.
Costs of Services and Profitability. The Board reviewed and considered the contractual annual advisory fee paid by each Fund to the Adviser, in light of the extent and quality of the advisory services provided by the Adviser to each Fund. The Board received and considered information including a comparison of each Fund’s contractual advisory fee rate with those of peer funds. The Board also reviewed and considered the total expense ratio for each Fund, alongside comparative total expense ratio information for peer funds. In doing so, the Board also considered the relative size of each Fund compared to the peer funds.
In addition, the Board, including the Independent Directors, specifically considered the profits realized by the Adviser and its affiliates, based in part on the Adviser financial information presented at the meeting and information regarding amounts paid to the Adviser and its affiliates. The Board also reviewed "fall out" benefits realized by the Adviser and its affiliates arising from its relationship with the Trust, and the profitability of each Fund to the Adviser and its affiliates.
The Board noted that the Trust entered into a fee waiver agreement for American Growth Cannabis Fund with the Adviser. The Board took into account the fee waiver agreement and the benefits thereof to shareholders, and determined to continue to closely monitor expenses and assess additional measures to reduce fund expenses.
American Growth Fund, Inc – Page 50 Annual Report for the Six Months Ended January 31, 2022
Nature, Extent, and Quality of the Services under the Investment Advisory Agreement. The Board received and considered information regarding the nature, extent, and quality of services provided to each Fund under the Agreement. The Trustees reviewed certain background materials supplied by the Adviser in its presentation, including its Form ADV.
The Board reviewed and considered the Adviser’s investment advisory personnel, its history as an asset manager, and its performance and the amount of assets currently under management by the Adviser and its affiliated entities. The Board also reviewed the research and decision‐making processes utilized by the Adviser, including the methods adopted to seek to achieve compliance with the investment objectives, and policies of each Fund.
The Board considered the background and experience of the Adviser’s management in connection with each Fund, including reviewing the qualifications, backgrounds, and responsibilities of the parties primarily responsible for the day‐to‐day portfolio management of each Fund and the extent of the resources devoted to research and analysis of actual and potential investments.
Economies of Scale. After discussion, it was the consensus of the Board and the Independent Directors that neither Fund had not reached an asset level where any material economies of scale were being realized by the Adviser that could be shared with the Fund. The Board discussed the economies of scale for each Fund and the fact that while economies of scale is not something that can be applied to each Fund now given the small asset bases, it would be revisited at a later date.
Other Benefits to the Adviser. The Board reviewed and considered any other incidental benefits derived or to be derived by the Adviser from its relationship with each Fund.
In reviewing the factors above, the Board concluded that no single factor was identified by the Directors to be determinative as the principal factor in whether to renew the Agreement. The Board concluded that:
(1) The nature and quality of services provided to each Fund and its shareholders by IRC were reasonable and adequate;
(2) The profitability of IRC and its affiliates from their relationships with each Fund was not unreasonable with respect to each Fund;
(3) There were no material economies of scale or other incidental benefits accruing to the Adviser in connection with its relationship with each Fund;
(4) Performance of each Fund, as addressed above; The Board considered substantive information which was discussed in length at the meeting regarding the steady growth and lag in performance of both Funds, as well as, measures aimed at improving performance; and
(5) Each Fund’s contractual advisory fee rate was within an acceptable range of the median for peer funds; The Board noted that while each Fund’s total expense ratio was generally greater than the median for peer funds, that is showed improvement and that higher expense ratios could be attributed in part to the disparities in relative fund sizes;
The Directors gave consideration to the circumstances, which positively affected its decision to reapprove the Investment Advisory Agreement.
Based on the Board’s’ deliberations and their evaluation of the information described above, the Directors, including all of the Independent Directors, concluded that the Adviser’s compensation for investment advisory services is consistent with the best interests of its shareholders and accordingly approved continuation of the Investment Advisory Agreement for an additional period.
Annual Report for the Six Months Ended January 31, 2022 American Growth Fund, Inc – Page 51
PERFORMANCE CHARTS (unaudited)
The following charts compare the change in value of a $10,000 investment in the American Growth Fund versus the Standard and Poors 500. Returns reflect a sales load for Class A, D, and E while Class B and C are without a sales load.
Performance data quoted represents past performance and is no guarantee of future results. The investment return and principal value of an investment will fluctuate, so that an investor’s shares, when redeemed, may be worth more or less than their original cost. The graph and table do not reflect the deduction of taxes that a shareholder would pay on fund distributions or the redemption of fund shares. Indices are unmanaged and generally do not reflect deductions for management fees. You cannot invest directly in an index. Current performance data to the most recent month end can be obtained by calling 1-800-525-2406.
Series One
*Includes a 5.75% sales charge based on a $10,000 initial purchase.
^Includes conversion to A Shares after 7 years.
American Growth Fund, Inc – Page 52 Annual Report for the Six Months Ended January 31, 2022
American Growth Cannabis Fund
*Includes a 5.75% sales charge based on a $10,000 initial purchase.
Annual Report for the Six Months Ended January 31, 2022 American Growth Fund, Inc – Page 53
On 3/1/96, Series One adopted a multi-class distribution arrangement to issue additional classes of shares, designated as Class A, Class B and Class C shares. Shares existing prior to 3/1/96 became Class D shares. Class A and Class D shares are subject to a maximum front-end sales charge of 5.75%, Class B shares are subject to a maximum contingent deferred sales charge of 5% and Class C shares are subject to a 1% contingent deferred sales charge within the first year of purchase. The Fund may incur 12b-1 expenses up to an annual maximum of .30 of 1% on its average daily net assets of its Class A shares, 1% of its average daily net assets of its Class B shares, and 1% of its average daily net assets of its Class C shares. Class D shares have no 12b-1 fees. Performance figures for Class D shares include the 5.75% initial sales charge and assume the reinvestment of income dividends and capital gain distributions. On 2/23/2011, American Growth Fund introduced a new Series consisting of Class E shares. Class E shares are subject to a maximum front-end sales charge of 5.75%. The Fund may incur 12b-1 expenses up to an annual maximum of .30 of 1% on its average daily net assets of its Class E shares. Performance quoted for the period ending 1/31/2022 represents past performance and cannot be used to predict future results. The investment return and principal value of an investment will fluctuate so that the investor’s shares, when redeemed, may be worth more or less than their original cost. This material must be preceded or accompanied by a current prospectus. If you have not received, or need a current prospectus, please feel free to call for one at 1-800-525-2406. Please read the prospectus carefully before investing. For current performance figures please call 1-800-525-2406. 5 years 10 years Series One (unaudited) 1 year annualized annualized Class D without load 8.83)% 11.74)% 12.02)% Class D with load* 2.59)% 10.44)% 11.36)% Class A without load 8.38)% 11.33)% 11.64)% Class A with load* 2.14)% 10.00)% 10.99)% Class B without load 5.72)% 8.51)% 11.08)%1 Class C without load 7.31)% 10.49)% 11.10)%2 5 years 10 years American Growth Cannabis Fund 1 year annualized annualized Class E without load (45.06)% (13.14)% (5.18)% Class E with load* (48.21)% (14.16)% (5.74)% *Includes a 5.75% sales charge based on a $10,000 initial purchase. 1 Includes the B Share to A Share conversion after 7 years. 2 Includes the C Share to A Share conversion after 7 years. | TRANSFER AGENT: Fund Services, Inc., 8730 Stony Point Parkway, Stony Point Bldg. III - Suite # 205, Richmond, Va. 23235 CUSTODIAN: UMB Bank NA Investment Services Group, 928 Grand Blvd, Fifth Floor, Kansas City, MO 64106 RETIREMENT PLAN CUSTODIAN: UMB Bank NA Investment Services Group, 928 Grand Blvd, Fifth Floor, Kansas City, MO 64106 INDEPENDENT REGISTERED PUBLIC ACCOUNTING FIRM: Tait, Weller & Baker LLP, Two Liberty Place, 50 South 16th Street, Suite 2900, Philadelphia, PA 19102 LEGAL COUNSEL: K&L Gates LLP, 1601 K St NW, Washington, DC 20006 UNDERWRITER/DISTRIBUTOR: World Capital Brokerage, Inc., 1636 Logan Street, Denver, CO 80203 OFFICERS AND DIRECTORS Timothy E Taggart President and Director Eddie R Bush Director Darrell E. Bush Director Patricia A Blum Vice President Michael L Gaughan Chief Compliance Officer And Corporate Secretary INVESTMENT ADVISORS Investment Research Corporation 1636 Logan Street Denver, CO 80203 OFFICERS AND DIRECTORS Timothy E. Taggart President, Treasurer, and and Corporate Secretary Director Michael L. Gaughan Vice President, Secretary and Director Patricia A. Blum Vice President |
American Growth Fund, Inc – Page 54
ITEM 2 – Code of Ethics
The Fund has adopted a Code of Ethics that applies to its Principal Executive Officer and Principal Financial Officer.
The Fund undertakes to provide to any person without charge, upon request, a copy of the Code of Ethics. Such
request can be made to American Growth Fund, Inc. at 800-525-2406 or to 1636 Logan Street, Denver, CO 80203.
ITEM 3 – Audit Committee Financial Expert
The Fund’s board has determined that Eddie R. Bush, CPA, a member of the Fund’s audit committee, is an “audit
committee financial expert” and "independent," as such terms are defined in this Item. This designation will not
increase the designee’s duties, obligations or liability as compared to his or her duties, obligations and liability as a
member of the audit committee and of the board, nor will it reduce the responsibility of the other audit
committee members. There may be other individuals who, through education or experience, would qualify as
"audit committee financial experts" if the board had designated them as such. Most importantly, the board
believes each member of the audit committee contributes significantly to the effective oversight of the Fund’s
financial statements and condition.
ITEM 6 – Schedule of Investments
Not applicable, insofar as the schedule is included as part of the report to shareholders filed under Item 1 of this
Form.
ITEM 7 – Disclosure of Proxy Voting Policies and Procedures for Closed End Management Investment Companies
Not applicable to this Fund, insofar as the Fund is not a closed end management investment company.
ITEM 8 – Portfolio Managers of Closed End Management Investment Companies
Not applicable to this Fund, insofar as the Fund is not a closed end management investment company.
ITEM 9 – Purchases of Equity Securities by Closed End Management Investment Company and Affiliated
Purchasers
Not applicable to this Fund, insofar as the Fund is not a closed end management investment company.
ITEM 10 – Submission of Matters to a Vote of Security Holders
There were no material changes to the procedures by which shareholders may recommend nominees to the registrant’s board of Directors.
ITEM 11 – Controls and Procedures
(a) The Fund’s Principal Executive Officer and Principal Financial Officer have concluded, based on their
evaluation of the Fund’s disclosure controls and procedures (as such term is defined in Rule 30a-3 under the
Investment Company Act of 1940), that such controls and procedures are adequate and reasonably designed
American Growth Fund, Inc – Page 55
to achieve the purposes described in paragraph (c) of such rule.
(b) There were no changes in the Fund’s internal controls over financial reporting (as defined in Rule 30a 3(d)
under the Investment Company Act of 1940) that occurred during the Fund’s second fiscal quarter of the
period covered by this report that has materially affected, or is reasonably likely to materially affect, the
Fund’s internal control over financial reporting.
ITEM 12 – Disclosure of Securities Lending Activities for Closed-End Management Investment Companies.
Not applicable to this Fund, insofar as the Fund is not a closed end management investment company.
ITEM 13 – Exhibits
(a)(1) The Code of Ethics that is the subject of the disclosure required by Item 2 is attached as an exhibit hereto.
(a)(2) The certifications required by Rule 30a 2 of the Investment Company Act of 1940 and Sections 302 and
906 of the Sarbanes Oxley Act of 2002 are attached as exhibits hereto.
SIGNATURES
Pursuant to the requirements of the Securities Exchange Act of 1934 and the Investment Company Act of 1940, the
Fund has duly caused this report to be signed on its behalf by the undersigned, thereunto duly authorized.
AMERICAN GROWTH FUND, INC.
By /s/ Timothy E. Taggart
Timothy E Taggart, President
Principal Executive and Principal Financial Officer
Date: March 30, 2022
Pursuant to the requirements of the Securities Exchange Act of 1934 and the Investment Company Act of 1940,
this report has been signed below by the following persons on behalf of the Fund and in the capacities and on the
dates indicated.
By /s/ Timothy E. Taggart
Timothy E. Taggart, President
Principal Executive and Principal Financial Officer
Date: March 30, 2022
American Growth Fund, Inc – Page 56