
Third Quarter
2004 Review
October 26, 2004
John V. Faraci
Chairman & CEO
Christopher P. Liddell
SVP & CFO

Forward Looking Statements
Statements on these slides or in this presentation that are not historical are
2
forward-looking. These statements are subject to risks and uncertainties that
could cause actual results to differ materially, including but not limited to,
uncertainty as to whether the sale of Weldwood of Canada, Ltd. will be completed,
the ability of International Paper and West Fraser Timber Co. to meet closing
conditions, the strength of demand for the company’s products and changes in
overall demand, the effects of competition from foreign and domestic producers,
the level of housing starts, changes in the cost or availability of raw materials,
unanticipated expenditures related to the cost of compliance with environmental
and other governmental regulations, the ability of the company to continue to
realize anticipated cost savings, performance of the company’s manufacturing
operations, results of legal proceedings, changes related to international
economic conditions and changes in currency exchange rates. We undertake no
obligation to publicly update any forward-looking statements, whether as a result
of new information, future events or otherwise. These and other factors that could
cause or contribute to actual results differing materially from such forward looking
statements are discussed in greater detail in the company’s Securities and
Exchange Commission filings.

During the course of this presentation, certain non-
Statements Relating to
Non-GAAP Financial Measures
3
U.S. GAAP financial information will be presented.
A reconciliation of those numbers to U.S. GAAP
financial measures is available on the company’s
website at www.internationalpaper.com under
Investor Information

Agenda
Third Quarter Review
Business Performance
Outlook
4

Third Quarter 2004 Summary
Revenues growing, volumes remained strong,
reflecting healthy demand
Continued to implement IP announced price
increases
Raw material costs remained high and rising
Negative impact on earnings from hurricanes
Continued to focus on non-price improvement
5
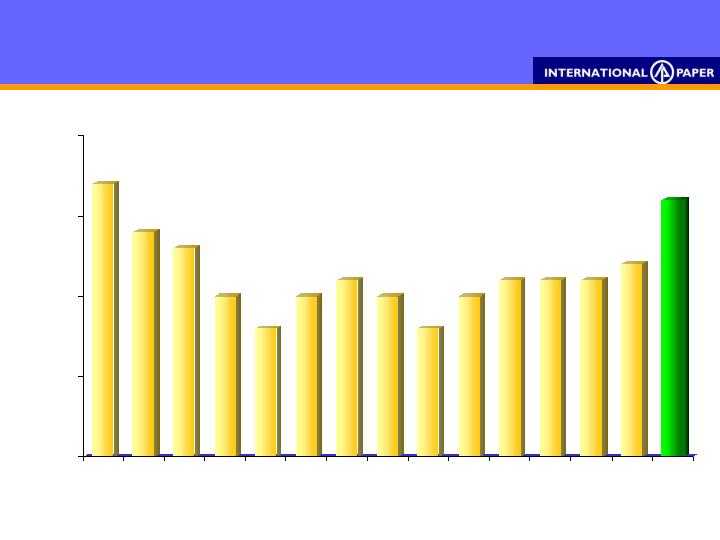
IP Net Sales Revenue
1Q
3Q
1Q
2001
2002
2Q
4Q
2Q
3Q
4Q
1Q
2Q
2003
3Q
4Q
1Q
2004
2Q
3Q
$B
3Q’04 highest net sales revenue since 1Q’01
6
5
5.5
6
6.5
7

EPS from Continuing Operations
and Before Special Items*
1Q
1Q
3Q
1Q
3Q
.75
.49
.24
2001
2002
2Q
.03
.59
4Q
2Q
4Q
2000
.11
.11
.11
.11
.32
2Q
3Q
4Q
1Q
2Q
2003
.32
3Q
.30
4Q
.14
1Q
* A reconciliation to GAAP EPS is available at www.internationalpaper.com under Investor Information
.20
.22
.20
.12
2004
2Q
.43
.33
3Q
7
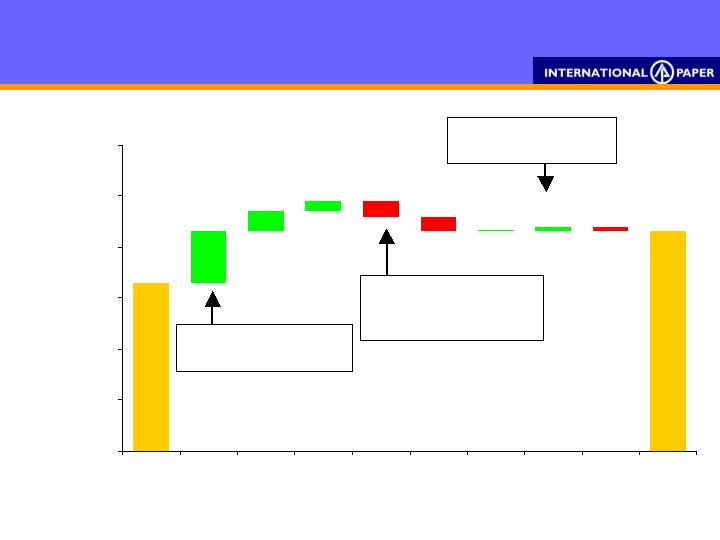
3Q’04 vs. 2Q’04
($.03)
EPS $ / Share
$.33
$.04
($.01)
$.01
($.03)
Wood Costs $0.00
Energy ($0.01)
Other ($0.02)
2Q’04 Tax Rate 31%
3Q’04 Tax Rate 29%
Paper/Pkg. $0.15
Wood Prod ($0.05)
EPS from cont. ops. before special items
$.10
$.43
$.00
$.02
8
$0.00
$0.10
$0.20
$0.30
$0.40
$0.50
$0.60
2Q'04
Price
Volume
Cost/Mix
Raw
Material
Hurricane
Land
Sales
Tax
Other
3Q'04
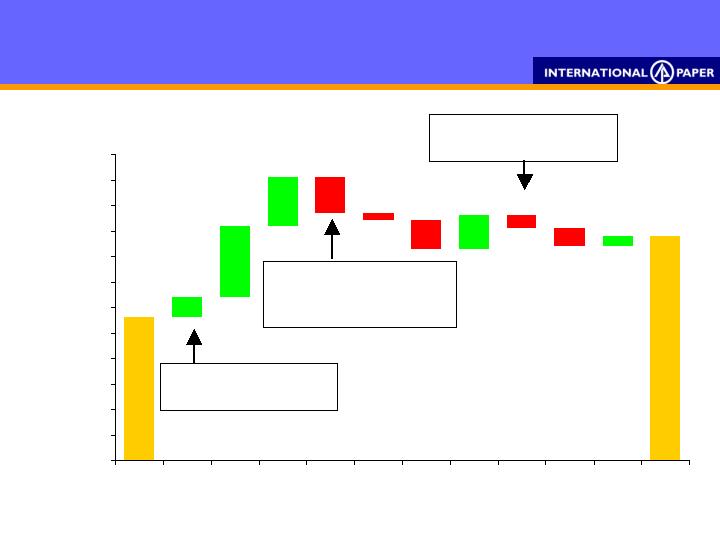
9M’04 vs. 9M’03
$0.00
$0.10
$0.20
$0.30
$0.40
$0.50
$0.60
$0.70
$0.80
$0.90
$1.00
$1.10
$1.20
9M'03
Price
Volume
Cost/Mix
Raw
Material
Hurricane
Land
Sales
Interest
Tax
Pension
Other
9M'04
($.14)
EPS $ / Share
$.56
$.28
$.13
($.05)
($.03)
$.19
Sep’03 Tax Rate 25%
Sep’04 Tax Rate 30%
Paper/Pkg. ($0.22)
Wood Prod $0.30
$.08
$.04
$.88
($.11)
EPS from cont. ops before special items
($.07)
9
Wood Costs
Energy
Other
($0.07)
($0.04)
($0.03)

(200)
(160)
(120)
(80)
(40)
0
Wood
Natural
Gas
LDPE
Oil/Coal
Impact of Higher Raw Material Cost
EBIT impact 2004 vs. 2002
EBIT ($)
(140)
(55)
(30)
(175)
(30)
Material costs $430 million negative EBIT
impact 2004 full year estimate versus 2002
Caustic/
Other
10
Cost Reduction Initiatives
Reducing purchased energy consumption
11
Purchased energy consumption in key
businesses reduced by 8-10% since 2002
10
11
12
13
14
15
16
Printing Papers
Bleached Board
2002
2004 YTD
2003
OSC

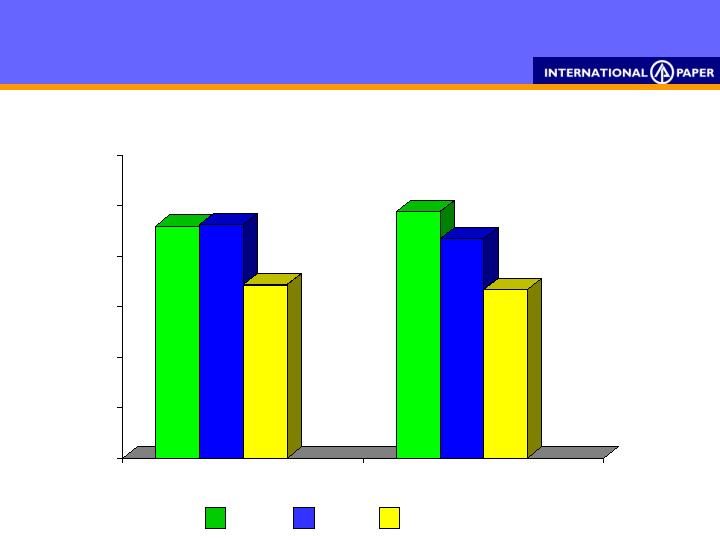
Earnings and ROI Improving
3Q’04
3.6
5.0
2Q’04
3.2
4.2
2003
2.9
3.8
EBITDA ($B)
ROI (%)
Annualized
12

Printing Papers
$ 1,920
160
Sales
Earnings
3Q’04
2Q’04
$ Millions
Uncoated*
Coated*
Pulp*
Europe
(1%)
8%
1%
(2%)
3Q’04 Change vs 2Q’04:
Volume
Realizations/ton
* U.S. operations only
Average IP realization (includes the impact of mix across all grades)
Europe is average commodity cut size price excluding Russia
$ 1,850
141
Cut size
Printing
Papers
Envelope
Bristols
13
$50
$50
$10
$35
$35
$10
(€20)
$30
$50
Forms

Packaging
$ 2,005
183
Sales
Earnings
3Q’04
2Q’04
$ Millions
Containerboard
U.S. Container
Bleached Board
$40
$40
$15
Volume
Realizations/ton
$ 1,775
115
3Q’04 Change vs 2Q’04:
Average IP realization (includes the impact of mix across all grades)
5%
21%
1%
14

Forest Products
$ 600
191
Sales
Earnings
3Q’04
2Q’04
$ Millions
Lumber (mbf)
Plywood (msf)
2%
2%
($5)
($65)
Volume
Realizations/unit
Average IP realization (includes the impact of mix across all grades)
$ 625
222
3Q’04 Change vs 2Q’04:
15

Reconciliation to Net Earnings
Per share
16
($1.13)
Net Earnings
Earnings from Continuing Operations
and Before Special Items
$0.43
Special Items
0.00
Earnings from Continuing Operations
$0.43
Discontinued Operations
(Weldwood)
($1.56)
$MM
EPS
Special Items & Discontinued
Operations – 3Q04
17
Special Items
Insurance Recoveries
103
Divestitures
(38)
Restructuring & Others
(49)
16
Tax & Min. Int. Impact of Above
(17)
Special Items Total
(1)
(0.00)
Discontinued Operations (Weldwood)
Loss on Sale
(385)
Tax Expense
(410)
3Q’04 Earnings
38
(757)
(1.56)
Net Loss
(758)
(1.56)

Outlook
Demand remains solid
Previously announced IP paper and packaging price
increases continue to be implemented
Higher prices in paper and packaging partly offset by
lower prices in wood products and higher raw material
costs
Operations improving
4Q’04 corporate expenses ~ $130 million; Tax rate 30%*
Continuing focus on non-price improvement
18
* Before special charges

Q & A
19

Appendix
20

* U.S. only. Uncoated excludes fine papers
Average Sales Realizations
Forest
Products
$/ton
Packaging
$/ton
Printing
Papers*
283
368
303
325
332
373
368
364
629
649
689
701
376
406
445
458
425
473
481
477
730
715
749
752
749
747
780
790
3Q’03
Segments
3Q’04
Average Sales Realizations
2Q’04
Sept 2004
Plywood, $/MSF
Lumber, $/MBF
Corrugated boxes
Containerboard
Pulp
Coated
Uncoated
Grades
21
Average IP realization (includes the impact of mix across all grades)

Hurricane Impact
Paper
Packaging
Forest Products
Other
$ (11)
(2)
(3)
(2)
Total
$ (18)
3Q’04 Earnings impact by segment
22
$ Millions

2004 Earnings from Continuing
Operations
MI – Minority Interest; Net – Net Income; ETR – Effective Tax Rate; EPS – Earnings per Share
* A reconciliation to GAAP EPS is available at www.internationalpaper.com under Investor Information
23
Pre-Tax
$ MM
Tax
$ MM
MI
$ MM
ETR
Avg. Shares
MM Shares
EPS
$/Share
Net
$ MM
Before Special Items
Q1
110
(36)
(14)
60
33%
484.4
.12
Q2
248
(77)
(12)
159
31%
485.6
.33
Q3
316
(90)
(17)
209
29%
486.4
.43
Special Items
Q1
(14)
5
-
(9)
36%
484.4
(.02)
Q2
(138)
62
(21)
(97)
45%
485.6
(.20)
Q3
16
(32)
15
(1)
200%
486.4
-
Earnings from Operations
Q1
96
(31)
(14)
51*
32%
484.4
.10
Q2
110
(15)
(33)
62*
14%
485.6
.13
Q3
332
(122)
(2)
208*
37%
486.4
.43

24