Exhibit 99.2
First Quarter 2005 Review
April 22, 2005
John V. Faraci
Chairman & CEO
Christopher P. Liddell
SVP & CFO
Forward Looking Statements
Statements on these slides or in this presentation that are not historical are forward-looking. These statements are subject to risks and uncertainties that could cause actual results to differ materially, including but not limited to, the strength of demand for the company’s products and changes in overall demand, the effects of competition from foreign and domestic producers, the level of housing starts, changes in the cost or availability of raw materials, unanticipated expenditures related to the cost of compliance with environmental and other governmental regulations, the ability of the company to continue to realize anticipated cost savings, performance of the company’s manufacturing operations, results of legal proceedings, changes related to international economic conditions and changes in currency exchange rates, particularly the relative value of the U.S. dollar to the Euro, economic conditions, specifically Brazil and Russia, the current military action in Iraq and the war on terrorism. We undertake no obligation to publicly update any forward-looking statements, whether as a result of new information, future events or otherwise. These and other factors that could cause or contribute to actual results differing materially from such forward looking statements are discussed in greater detail in the company’s Securities and Exchange Commission filings.
2
Statements Relating to Non-GAAP Financial Measures
During the course of this presentation, certain non-U.S. GAAP financial information will be presented.
A reconciliation of those numbers to U.S. GAAP financial measures is available on the company’s website at www.internationalpaper.com under Investors.
3

Agenda
First Quarter Review
Second Quarter Outlook
4
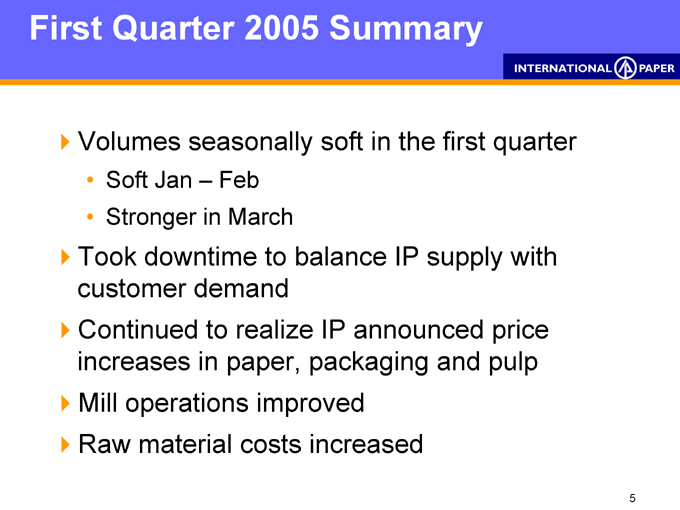
First Quarter 2005 Summary
Volumes seasonally soft in the first quarter
Soft Jan — Feb Stronger in March
Took downtime to balance IP supply with customer demand Continued to realize IP announced price increases in paper, packaging and pulp Mill operations improved Raw material costs increased
5
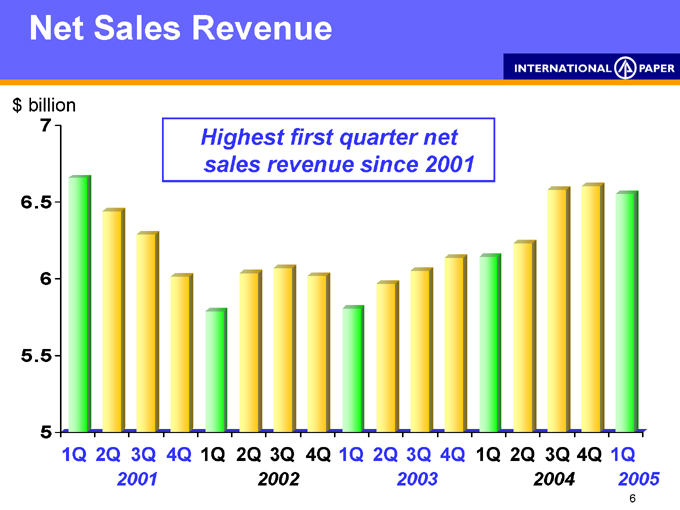
Net Sales Revenue
Highest first quarter net sales revenue since 2001 $billion
7 6.5 6 5.5 5
1Q 2Q 3Q 4Q 1Q 2Q 3Q 4Q 1Q 2Q 3Q 4Q 1Q 2Q 3Q 4Q 1Q
2001
2002
2003
2004
2005
6
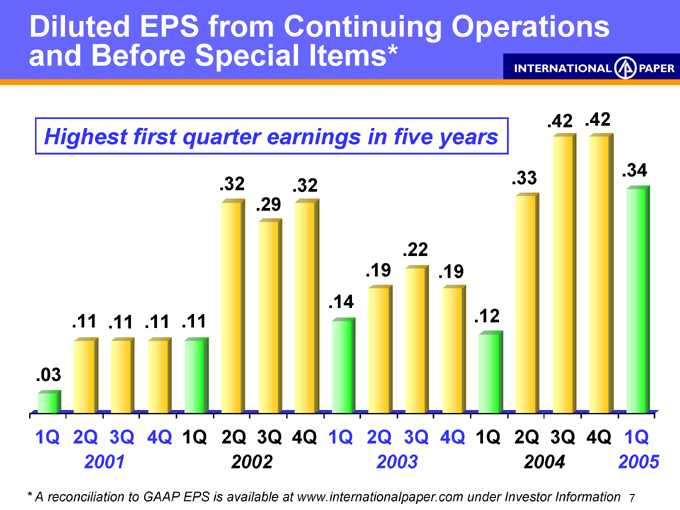
Diluted EPS from Continuing Operations and Before Special Items*
Highest first quarter earnings in five years
.03
.11 .11 ..11 .11
.32 .29 .32 .14 .19 .22 .19 .12 .33 .42 .42 .34
1Q 2Q 3Q 4Q 1Q 2Q 3Q 4Q 1Q 2Q 3Q 4Q 1Q 2Q 3Q 4Q 1Q
2001 2002 2003 2004 2005
* A reconciliation to GAAP EPS is available at www.internationalpaper.com under Investor Information
7
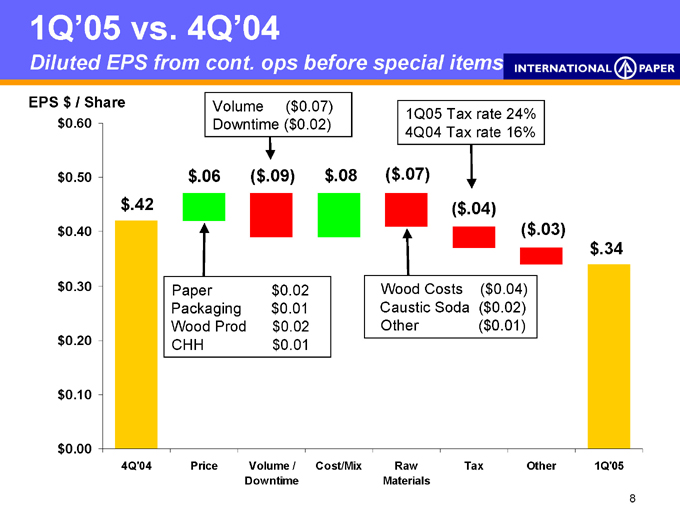
1Q’05 vs. 4Q’04
Diluted EPS from cont. ops before special items
Volume ($0.07) Downtime ($0.02)
1Q05 Tax rate 24% 4Q04 Tax rate 16%
EPS $/ Share $0.60 $0.50 $0.40
$0.30 $0.20 $0.10 $0.00 $.42 $.06
($09) $.08
($07)
($04)
($03) $.34
Paper $0.02
Packaging $0.01
Wood Prod $0.02
CHH $0.01
Wood Costs ($0.04)
Caustic Soda ($0.02)
Other ($0.01)
4Q’04 Price Volume / Cost/Mix Raw Tax Other 1Q’05 Downtime Materials
8
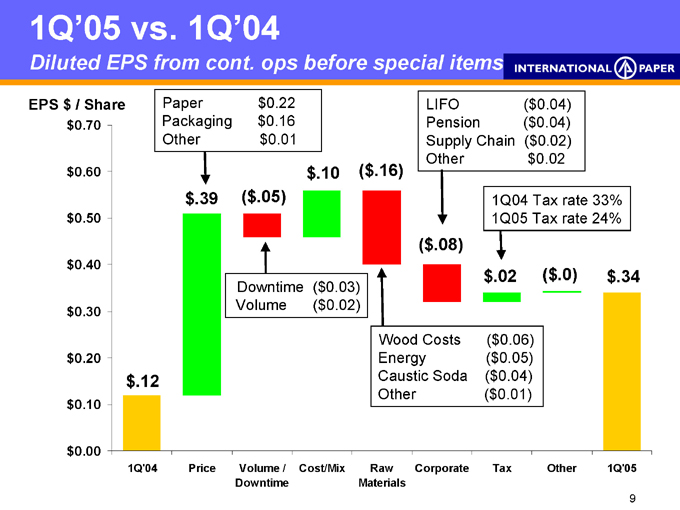
1Q’05 vs. 1Q’04
Diluted EPS from cont. ops before special items
Paper $0.22 Packaging $0.16 Other $0.01
LIFO ($0.04) Pension ($0.04) Supply Chain ($0.02) Other $0.02
EPS $ / Share $0.70 $0.60 $0.50 $0.40 $0.30 $0.20 $0.10 $0.00 $.12 $.39
($05) $.10
($16)
($08) $.02
($0) $.34
1Q04 Tax rate 33% 1Q05 Tax rate 24%
Downtime ($0.03) Volume ($0.02)
Wood Costs ($ 0.06)
Energy ($ 0.05)
Caustic Soda ($ 0.04)
Other ($ 0.01)
1Q’04 Price Volume / Cost/Mix Raw Corporate Tax Other 1Q’05 Downtime Materials
9
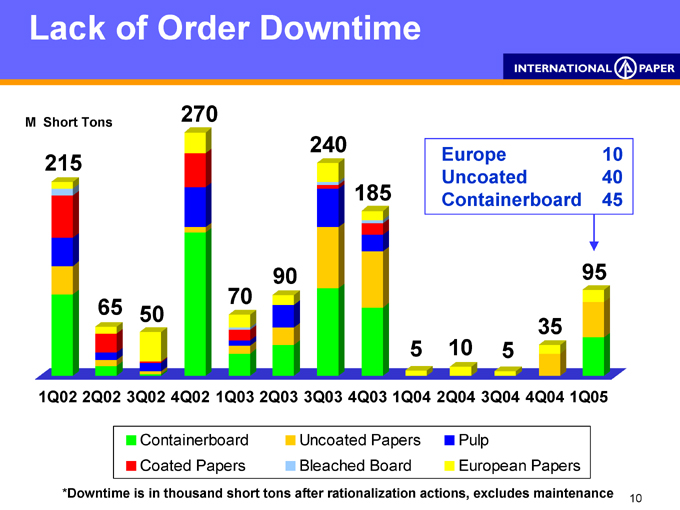
Lack of Order Downtime
M Short Tons
215
65
50
270
70
90
240
185
5
10
5
35
95
Europe 10 Uncoated 40 Containerboard 45
1Q02 2Q02 3Q02 4Q02 1Q03 2Q03 3Q03 4Q03 1Q04 2Q04 3Q04 4Q04 1Q05
Containerboard Coated Papers
Uncoated Papers Bleached Board
Pulp
European Papers
*Downtime is in thousand short tons after rationalization actions, excludes maintenance
10
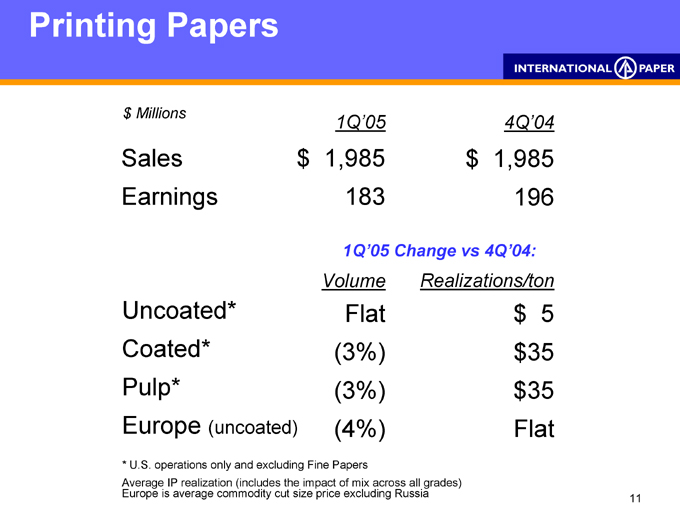
Printing Papers
$ Millions 1Q’05 4Q’04
Sales $1,985 $1,985
Earnings 183 196
1Q’05 Change vs 4Q’04:
Volume Realizations/ton
Uncoated* Flat $5
Coated* (3%) $35
Pulp* (3%) $35
Europe (uncoated) (4%) Flat
* U.S. operations only and excluding Fine Papers
Average IP realization (includes the impact of mix across all grades) Europe is average commodity cut size price excluding Russia
11
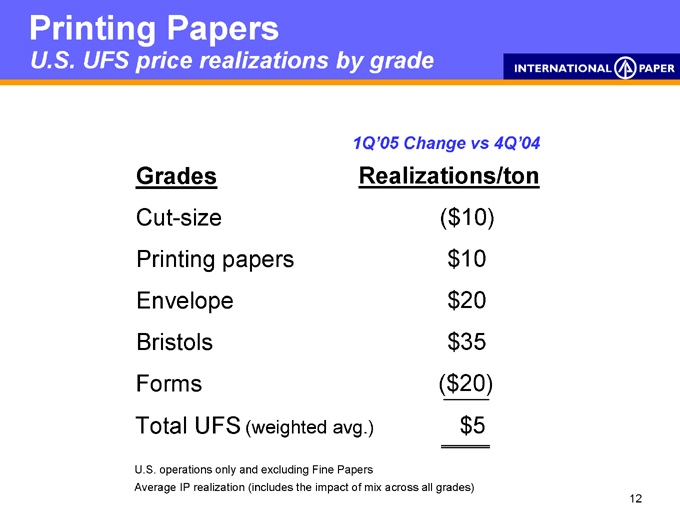
Printing Papers
U.S. UFS price realizations by grade
1Q’05 Change vs 4Q’04
Grades Realizations/ton
Cut-size ($10)
Printing papers $10
Envelope $20
Bristols $35
Forms ($20)
Total UFS (weighted avg.) $5
U.S. operations only and excluding Fine Papers
Average IP realization (includes the impact of mix across all grades)
12
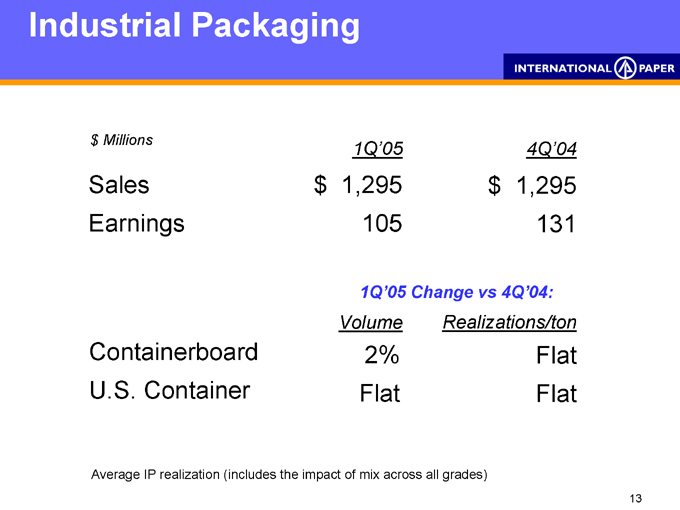
Industrial Packaging
$Millions 1Q’05
4Q’04
Sales $1,295 $1,295
Earnings 105 131
1Q’05 Change vs 4Q’04:
Volume Realizations/ton
Containerboard 2% Flat
U.S. Container Flat Flat
Average IP realization (includes the impact of mix across all grades)
13
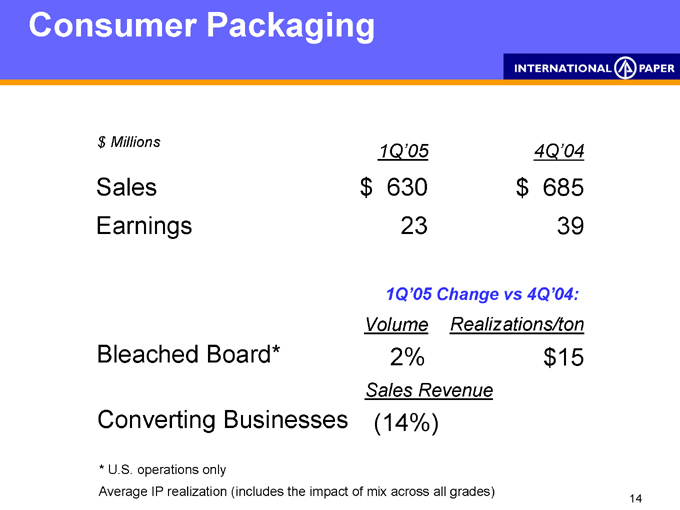
Consumer Packaging
$Millions 1Q’05
4Q’04
Sales $630 $685
Earnings 23 39
1Q’05 Change vs 4Q’04:
Volume Realizations/ton
Bleached Board* 2% $15
Sales Revenue
Converting Businesses (14%)
* U.S. operations only
Average IP realization (includes the impact of mix across all grades)
14
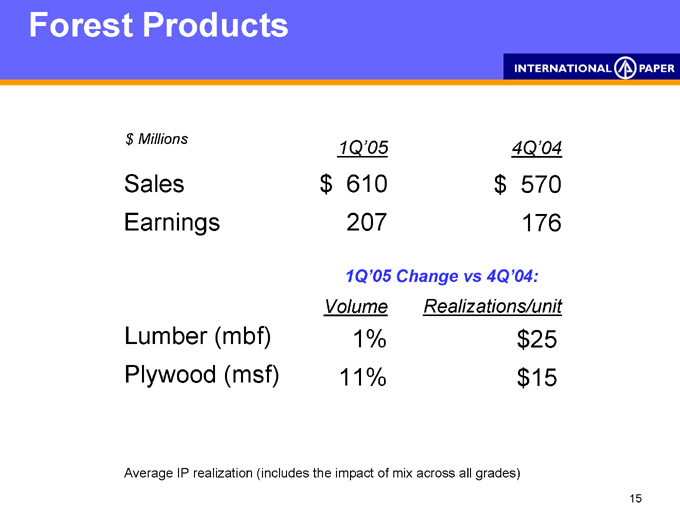
Forest Products
$Millions 1Q’05
4Q’04
Sales $610 $570
Earnings 207 176
1Q’05 Change vs 4Q’04:
Volume Realizations/unit
Lumber (mbf) 1% $25
Plywood (msf) 11% $15
Average IP realization (includes the impact of mix across all grades)
15
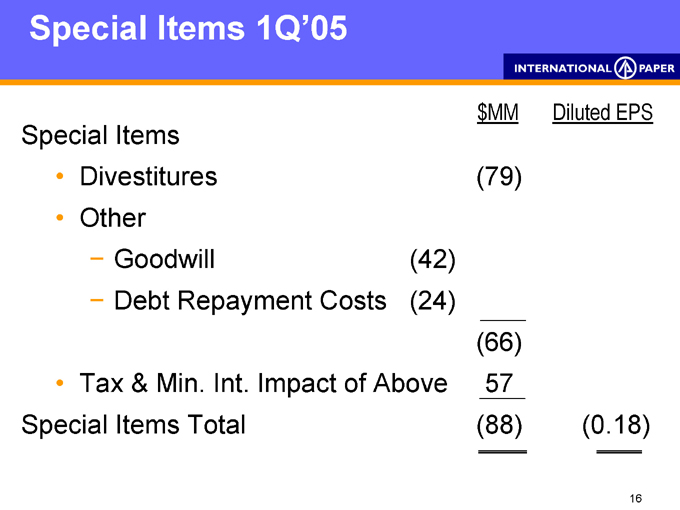
Special Items 1Q’05
$MM Diluted EPS
Special Items
Divestitures (79)
Other
Goodwill (42)
Debt Repayment Costs (24) (66)
Tax & Min. Int. Impact of Above 57
Special Items Total (88) (0.18)
16
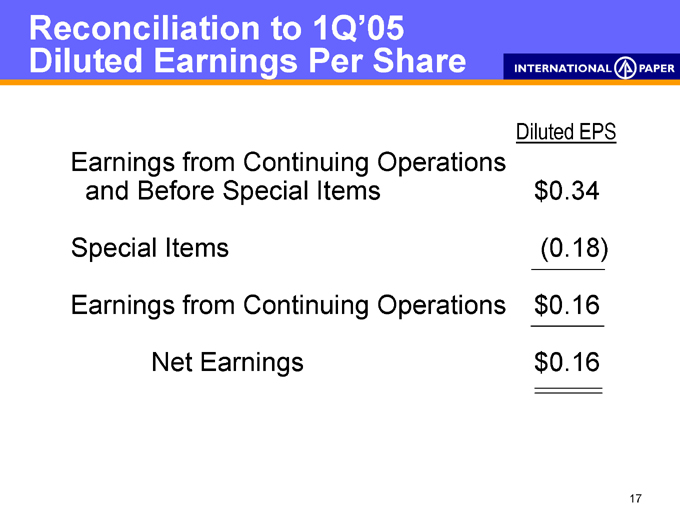
Reconciliation to 1Q’05 Diluted Earnings Per Share
Diluted EPS
Earnings from Continuing Operations and Before Special Items $0.34
Special Items (0.18) Earnings from Continuing Operations $0.16 Net Earnings $0.16
17
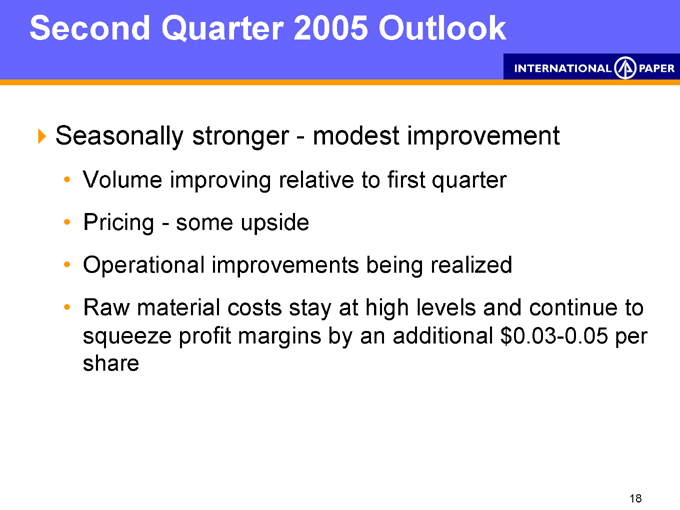
Second Quarter 2005 Outlook
Seasonally stronger—modest improvement
Volume improving relative to first quarter
Pricing - some upside
Operational improvements being realized
Raw material costs stay at high levels and continue to squeeze profit margins by an additional $0.03-0.05 per. share
18
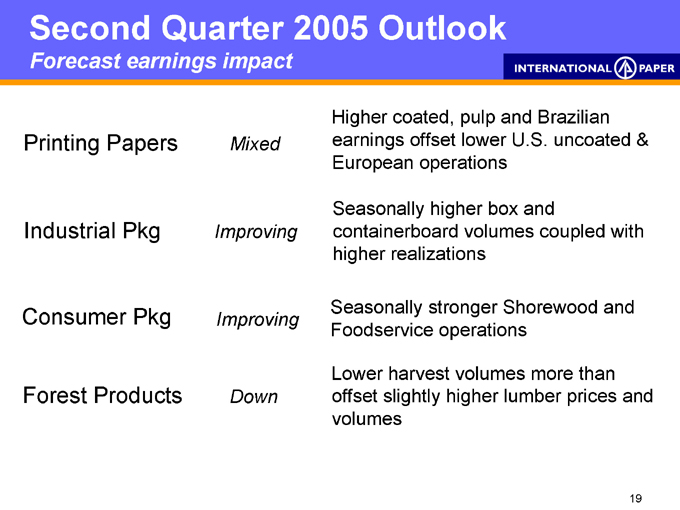
Second Quarter 2005 Outlook
Forecast earnings impact
Higher coated, pulp and Brazilian
Printing Papers Mixed earnings offset lower U.S. uncoated &
European operations
Seasonally higher box and
Industrial Pkg Improving containerboard volumes coupled with
higher realizations
Consumer Pkg Seasonally stronger Shorewood and
Improving
Foodservice operations
Lower harvest volumes more than
Forest Products Down offset slightly higher lumber prices and
volumes
19
Second Quarter 2005 Outlook
Targeting inventories at or below current levels
Continue to focus on customers and cost reduction through internal initiatives
20

Q & A
21

Appendix
22
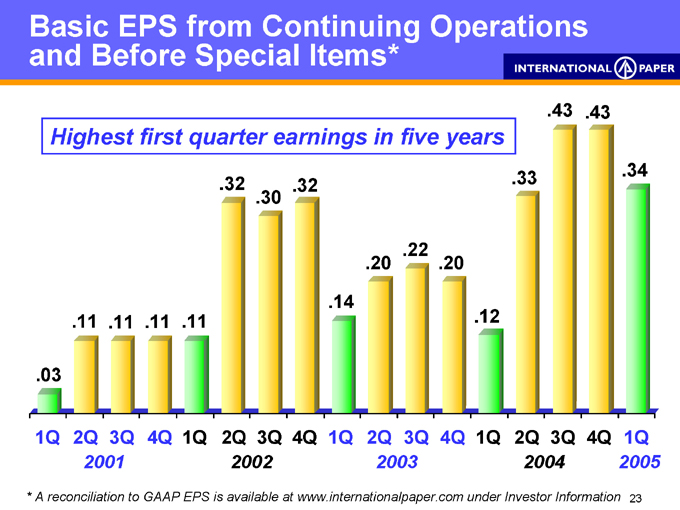
Basic EPS from Continuing Operations and Before Special Items*
Highest first quarter earnings in five years
.32 .32 .33 .30
.20 .22 .20
.14
.11 .11 .11 .11 .12
.03
.43 .43
.34
1Q 2Q 3Q 4Q 1Q 2Q 3Q 4Q 1Q 2Q 3Q 4Q 1Q 2Q 3Q 4Q 1Q
2001 2002 2003 2004 2005
* A reconciliation to GAAP EPS is available at www.internationalpaper.com under Investor Information
23
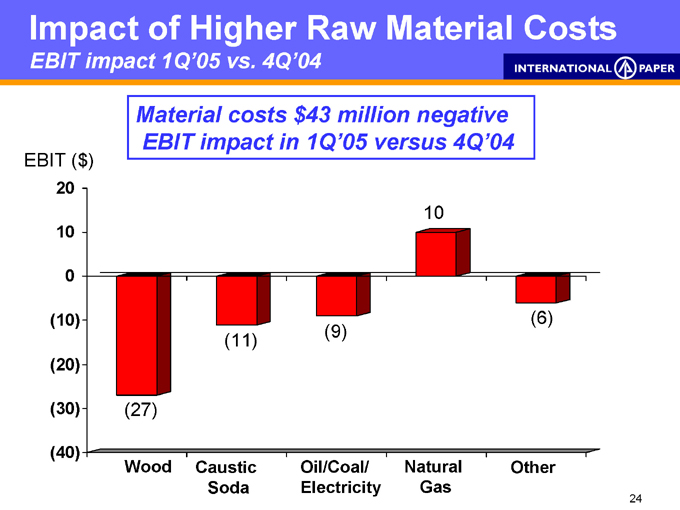
Impact of Higher Raw Material Costs
EBIT impact 1Q’05 vs. 4Q’04
Material costs $43 million negative EBIT impact in 1Q’05 versus 4Q’04
EBIT ($)
20 10 0 (10) (20) (30) (40)
(9) (11)
(27)
10
(6)
Wood Caustic Oil/Coal/ Natural Other Soda Electricity Gas
24
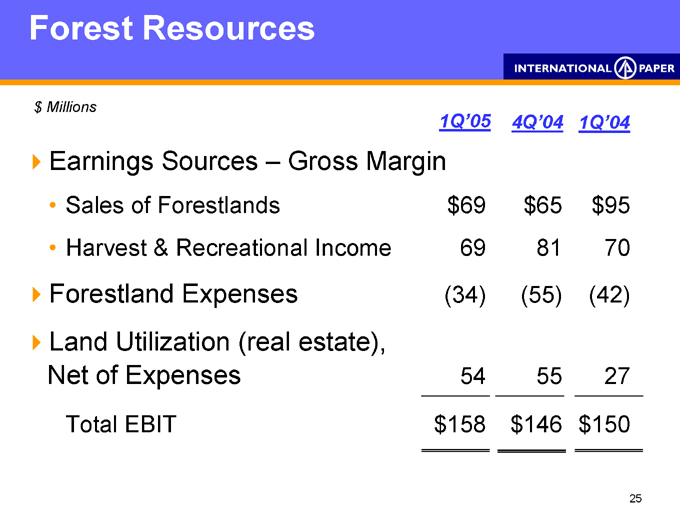
Forest Resources
$Millions
1Q’05 4Q’04 1Q’04
Earnings Sources — Gross Margin
Sales of Forestlands $69 $65 $95
Harvest & Recreational Income 69 81 70
Forestland Expenses (34) (55) (42)
Land Utilization (real estate),
Net of Expenses 54 55 27
Total EBIT $158 $146 $150
25
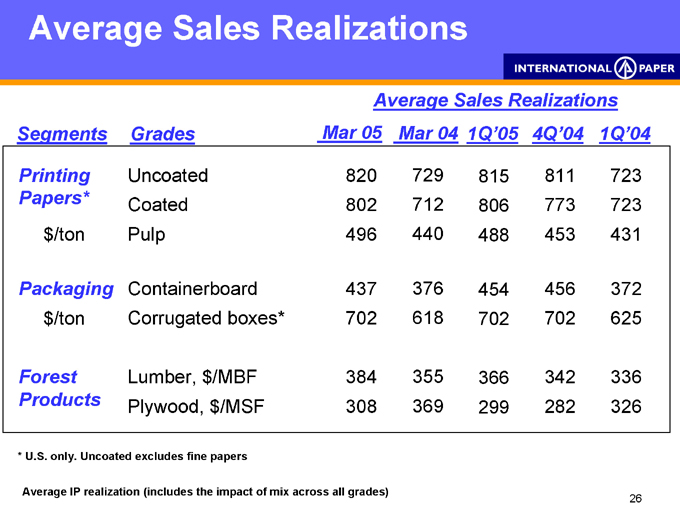
Average Sales Realizations
Average Sales Realizations
Segments Grades Mar 05 Mar 04 1Q’05 4Q’04 1Q’04
Printing Uncoated 820 729 815 811 723
Papers* Coated 802 712 806 773 723
$/ton Pulp 496 440 488 453 431
Packaging Containerboard 437 376 454 456 372
$/ton Corrugated boxes* 702 618 702 702 625
Forest Lumber, $/MBF 384 355 366 342 336
Products Plywood, $/MSF 308 369 299 282 326
* U.S. only. Uncoated excludes fine papers
Average IP realization (includes the impact of mix across all grades)
26
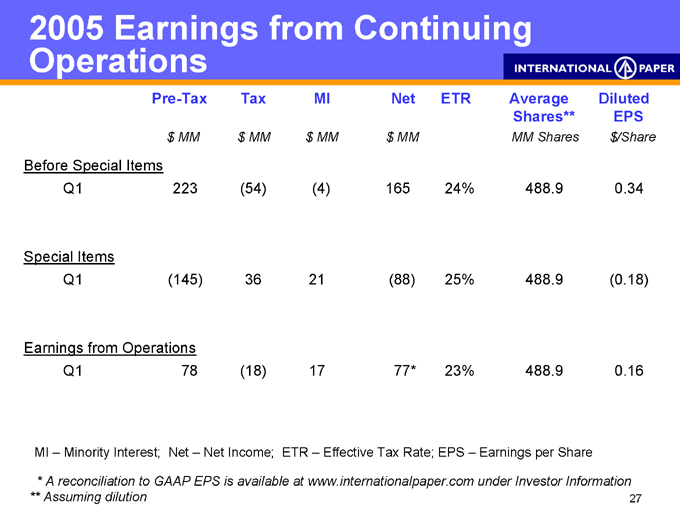
2005 Earnings from Continuing
Operations
Pre-Tax Tax MI Net ETR Average Diluted
Shares** EPS
$MM $MM $MM $MM MM Shares $/Share
Before Special Items
Q1 223 (54) (4) 165 24% 488.9 0.34
Special Items
Q1 (145) 36 21 (88) 25% 488.9 (0.18)
Earnings from Operations
Q1 78 (18) 17 77* 23% 488.9 0.16
MI – Minority Interest; Net – Net Income; ETR – Effective Tax Rate; EPS – Earnings per Share
* A reconciliation to GAAP EPS is available at www.internationalpaper.com under Investor Information
** Assuming dilution 27
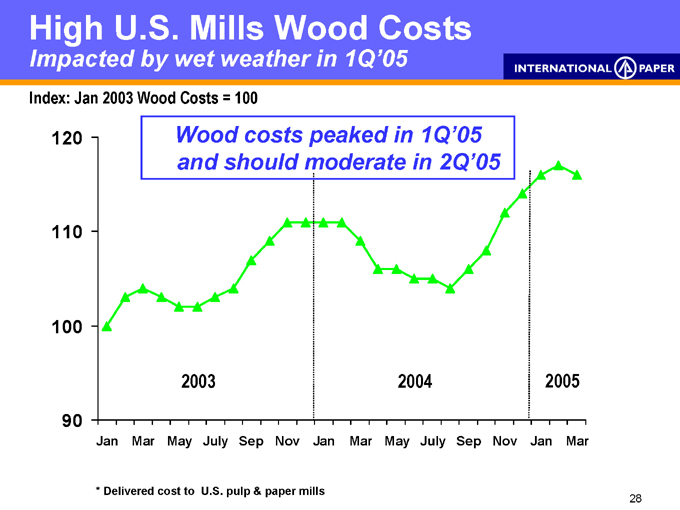
High U.S. Mills Wood Costs
Impacted by wet weather in 1Q’05
Index: Jan 2003 Wood Costs = 100
Wood costs peaked in 1Q’05 and should moderate in 2Q’05
120 110 100 90
2003 2004 2005
Jan Mar May July Sep Nov Jan Mar May July Sep Nov Jan Mar
* Delivered cost to U.S. pulp & paper mills
28
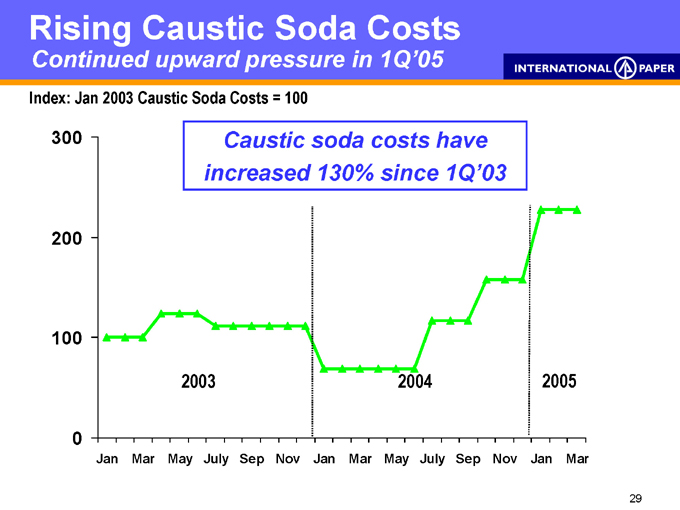
Rising Caustic Soda Costs
Continued upward pressure in 1Q’05
Index: Jan 2003 Caustic Soda Costs = 100
Caustic soda costs have increased 130% since 1Q’03
300 200 100 0
2003 2004 2005
Jan Mar May July Sep Nov Jan Mar May July Sep Nov Jan Mar
29
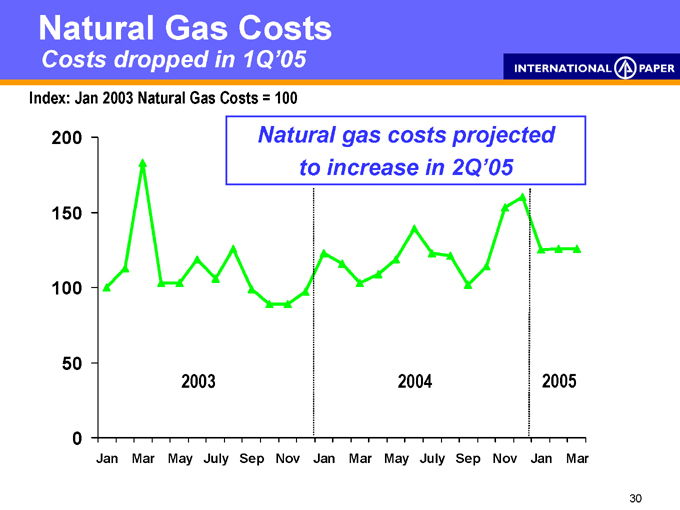
Natural Gas Costs
Costs dropped in 1Q’05
Index: Jan 2003 Natural Gas Costs = 100
Natural gas costs projected to increase in 2Q’05
200
150
100
50
0
2003 2004 2005
Jan Mar May July Sep Nov Jan Mar May July Sep Nov Jan Mar
30

31