Exhibit 99.2
Second Quarter 2005 Review
July 26, 2005
John V. Faraci
Chairman & CEO
Marianne M. Parrs
EVP & CFO
Forward-Looking Statements
These slides contain forward-looking statements. Such statements reflect management’s current views and are subject to risks and uncertainties that could cause actual results to differ materially, including but not limited to, the ability of the company to accomplish its transformation plan and to realize anticipated cost savings, the demand and pricing for the company’s products and changes in overall demand, the effects of competition from foreign and domestic producers, the level of housing starts, changes in the cost or availability of raw materials, changes in energy costs, unanticipated expenditures related to the cost of compliance with environmental and other governmental regulations, performance of the company’s manufacturing operations, results of legal proceedings, changes related to international economic conditions, specifically in Brazil, Russia and China, changes in currency exchange rates, particularly the relative value of the U.S. dollar to the Euro, and the war on terrorism. We undertake no obligation to publicly update any forward-looking statements, whether as a result of new information, future events or otherwise. These and other factors that could cause or contribute to actual results differing materially from such forward looking statements are discussed in greater detail in the company’s Securities and Exchange Commission filings.
2
During the course of this presentation, certain non-
U.S. GAAP financial information will be presented.
A reconciliation of those numbers to U.S. GAAP
financial measures is available on the company’s
website at www.internationalpaper.com under
Investors.
Statements Relating to
Non-GAAP Financial Measures
3
Agenda
Second Quarter Review Third Quarter Outlook Transformation Plan Summary
4
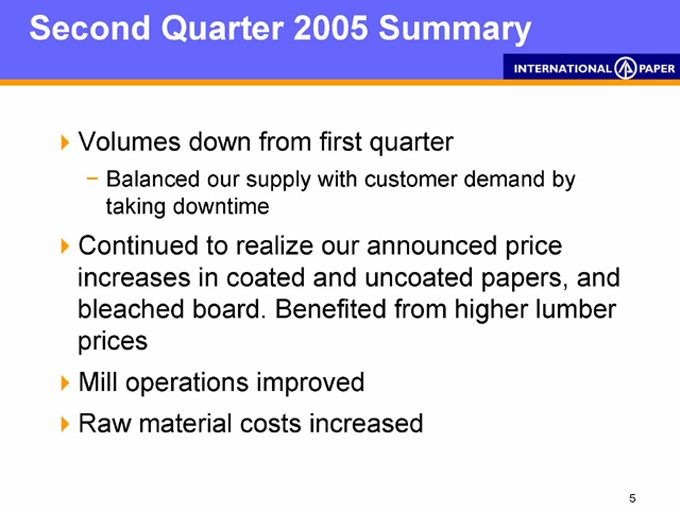
Second Quarter 2005 Summary
Volumes down from first quarter
Balanced our supply with customer demand by taking downtime
Continued to realize our announced price increases in coated and printing papers, and bleached board. Benefited from higher lumber prices Mill operations improved Raw material costs increased
5
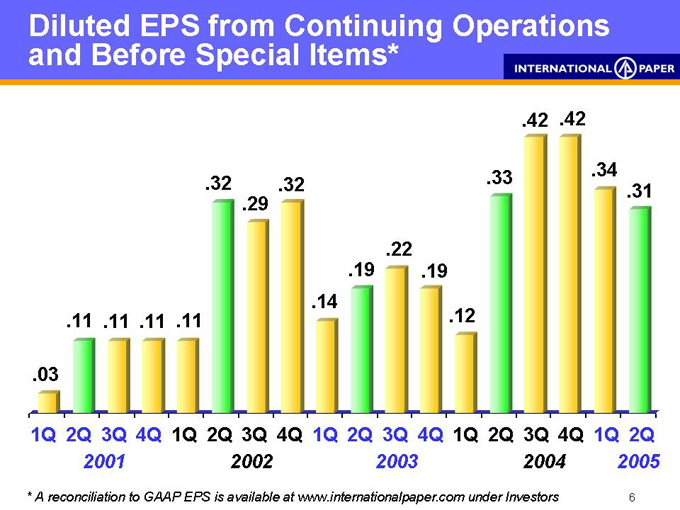
Diluted EPS from Continuing Operations and Before Special Items*
.03
.11 .11 .11 .11
.32
.29
.32
.14
.19
.22
.19
.12
.33
.42 .42
.34
.31
1Q 2Q 3Q 4Q 1Q 2Q 3Q 4Q 1Q 2Q 3Q 4Q 1Q 2Q 3Q 4Q 1Q 2Q
2001 2002 2003 2004 2005
* A reconciliation to GAAP EPS is available at www.internationalpaper.com under Investors
6
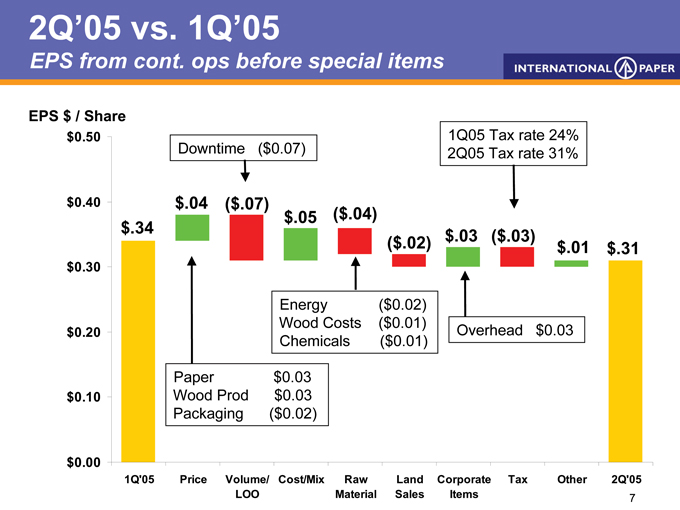
2Q’05 vs. 1Q’05
EPS from cont. ops before special items
EPS $ / Share $0.50 $0.40 $0.30 $0.20 $0.10 $0.00
Downtime ($0.07)
1Q05 Tax rate 24% 2Q05 Tax rate 31% $.34 $.04 ($.07) $.05 ($.04)
($.02) $.03 ($.03) $.01 $.31
Energy ($0.02) Wood Costs ($0.01) Chemicals ($0.01)
Overhead $0.03
Paper $0.03 Wood Prod $0.03 Packaging ($0.02)
1Q’05 Price Volume Cost/Mix
Raw Material
Land Sales
Corporate Items
Tax Other 2Q’05
7
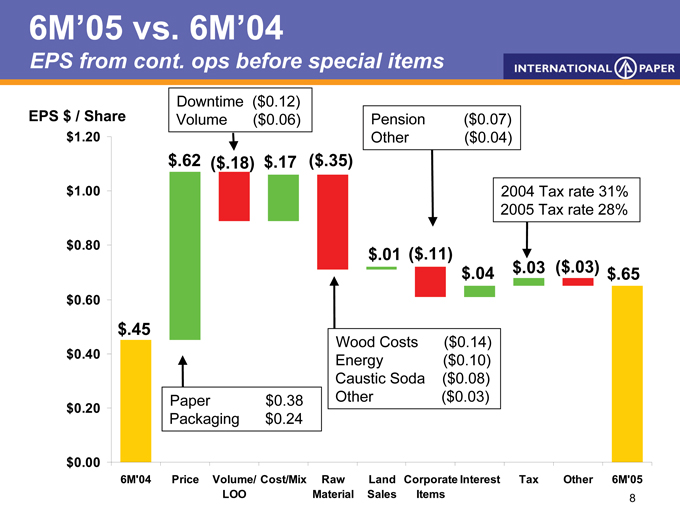
6M’05 vs. 6M’04
EPS from cont. ops before special items
EPS $ / Share $1.20 $1.00 $0.80
$0.60 $0.40 $0.20 $0.00
Downtime ($0.12) Volume ($0.06)
LIFO/Other ($0.04) Pension ($0.07) $.45 $.62 ($.18) $.17 ($.35)
2004 Tax rate 31% 2005 Tax rate 28% $.01 ($.11) $.04 $.03 ($.03) $.65
Paper $0.38 Packaging $0.24
Wood Costs ($0.14) Energy ($0.10) Caustic Soda ($0.08) Other ($0.03)
6M’04 Price Volume Cost/Mix
Raw Material
Land Sales
Corporate Interest Items
Tax Other 6M’05
9
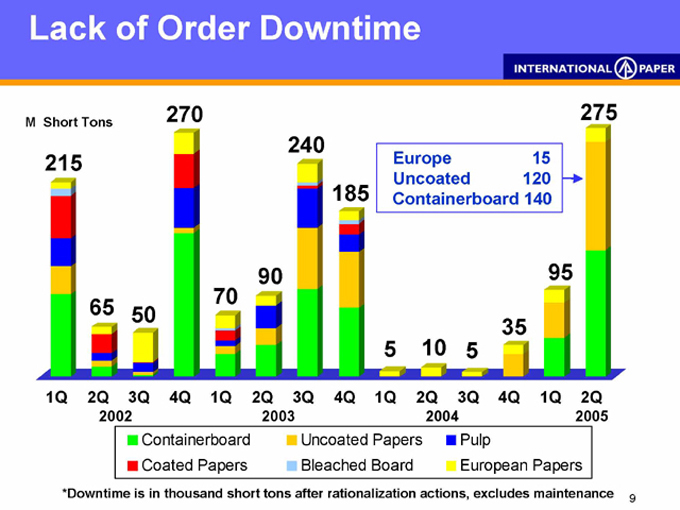
Lack of Order Downtime
M Short Tons
215
65 50
270
70 90
240
185
5
10
5
35
95
275
Europe 15 Uncoated 120 Containerboard 140
1Q 2Q 3Q 4Q 1Q 2Q 3Q 4Q 1Q 2Q 3Q 4Q 1Q 2Q
2002 2003 2004 2005
Containerboard Coated Papers
Uncoated Papers Bleached Board
Pulp
European Papers
*Downtime is in thousand short tons after rationalization actions, excludes maintenance
11
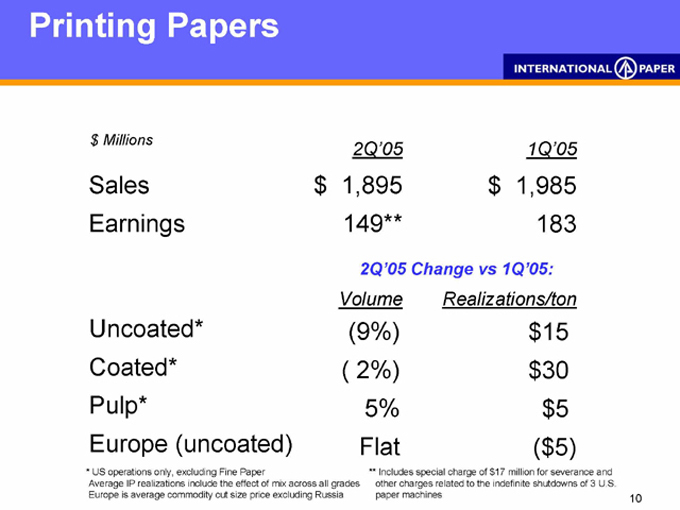
Printing Papers
$ Millions 2Q’05
1Q’05
Sales $1,895 $1,985
Earnings 149** 183
2Q’05 Change vs 1Q’05:
Volume Realizations/ton
Uncoated* (9%) $15
Coated* ( 2%) $30
Pulp* 5% $5
Europe (uncoated) Flat ( $5)
* US operations only, excluding Fine Paper
Average IP realizations include the effect of mix across all grades Europe is average commodity cut size price excluding Russia
** Includes special charge of $17 million for severance and other charges related to the indefinite shutdowns of 3 U.S. paper machines
12
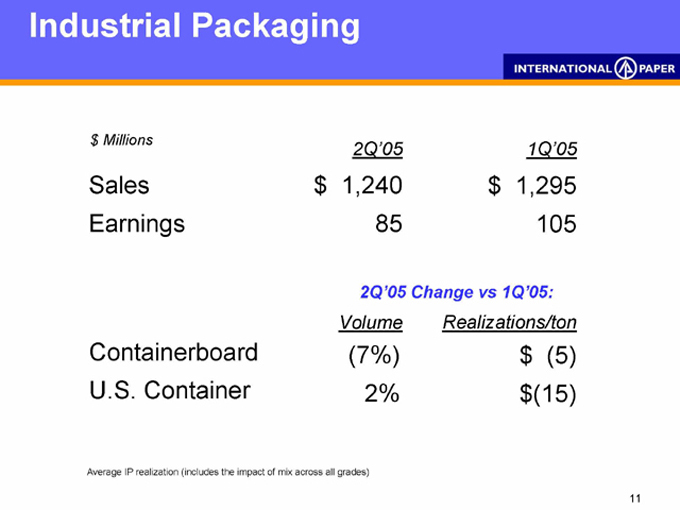
Industrial Packaging
$ Millions 2Q’05
1Q’05
Sales $1,240 $1,295
Earnings 85 105
2Q’05 Change vs 1Q’05:
Volume Realizations/ton
Containerboard (7%) $(5)
U.S. Container 2% $(15)
Average IP realization (includes the impact of mix across all grades)
13
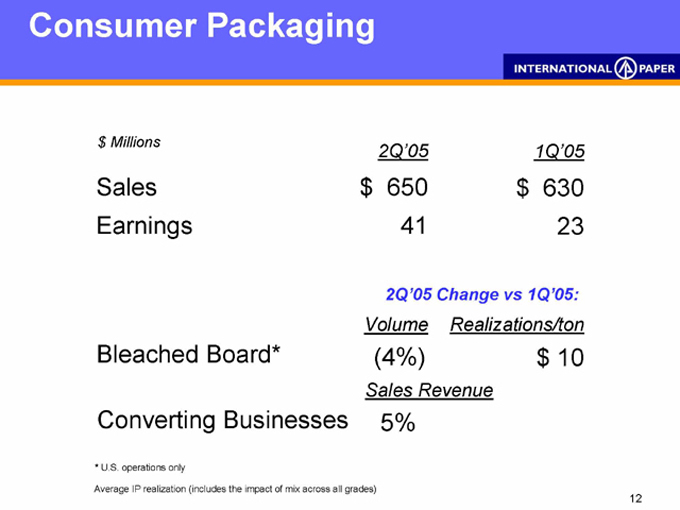
Consumer Packaging
$ Millions 2Q’05
1Q’05
Sales $650 $630
Earnings 41 23
2Q’05 Change vs 1Q’05:
Volume Realizations/ton
Bleached Board* (4%) $ 10
Sales Revenue
Converting Businesses 5%
* U.S. operations only
Average IP realization (includes the impact of mix across all grades)
14
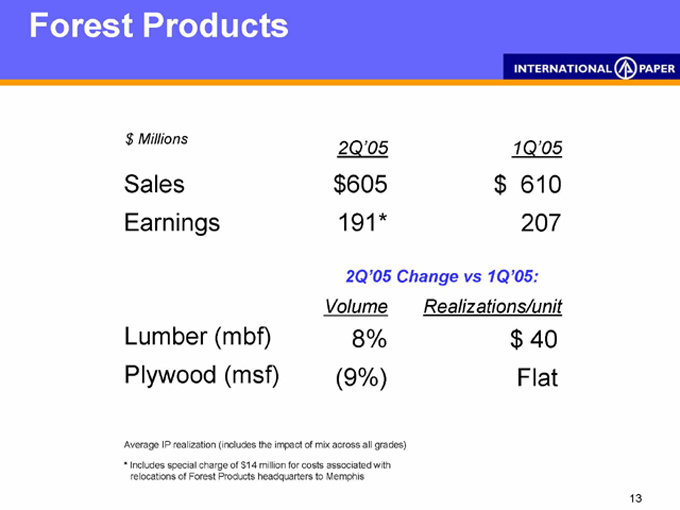
Forest Products
$ Millions 2Q’05
1Q’05
Sales $605 $610
Earnings 191* 207
2Q’05 Change vs 1Q’05:
Lumber (mbf) 8% $40
Plywood (msf) (9%) Flat
Average IP realization (includes the impact of mix across all grades)
* Includes special charge of $14 million for costs associated with relocations of Forest Products headquarters to Memphis
15
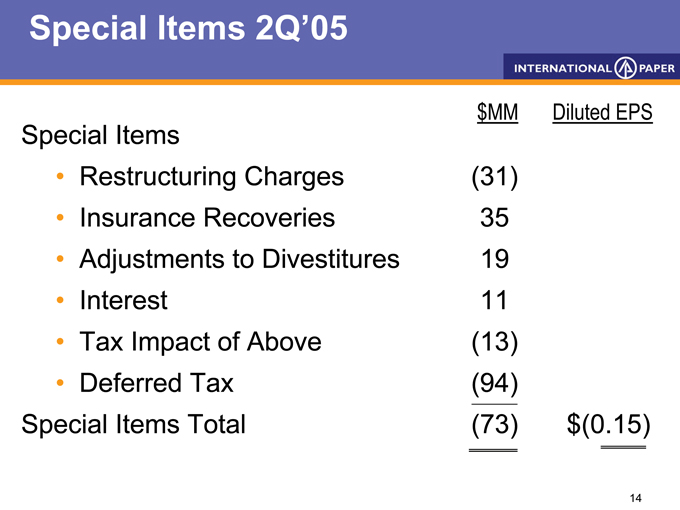
Special Items 2Q’05 $MM Diluted EPS
Special Items
Insurance Recoveries 35
Restructuring Charges (31)
Adjustments to Divestitures 19
Interest 11
Tax Impact of Above (13)
Deferred Tax (94)
Special Items Total (73) $(0.15)
16
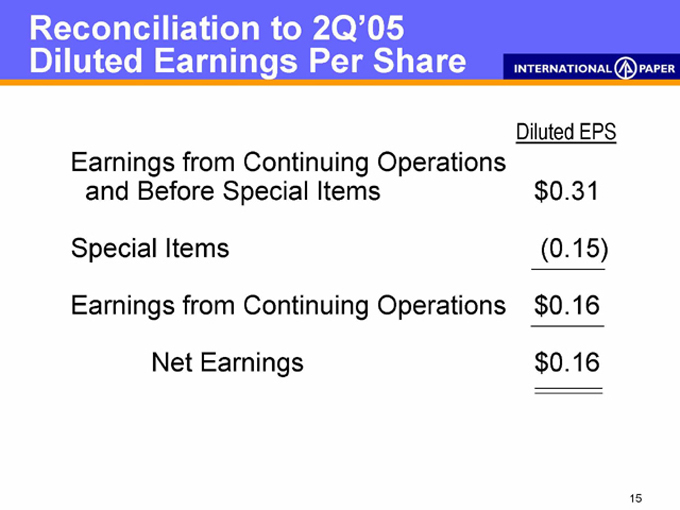
Reconciliation to 2Q’05 Diluted Earnings Per Share
Diluted EPS
Earnings from Continuing Operations
and Before Special Items $0.31
Special Items (0.15)
Earnings from Continuing Operations $0.16
Net Earnings $0.16
17
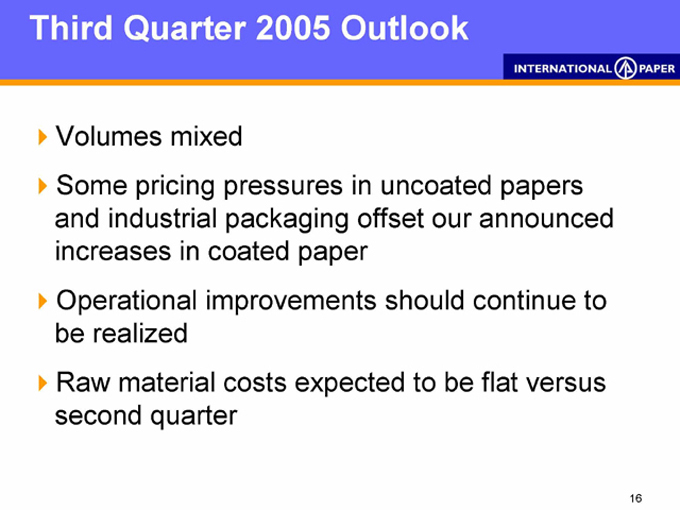
Third Quarter 2005 Outlook
Volumes mixed
Some pricing pressures in uncoated papers and industrial packaging offset our announced increases in coated paper Operational improvements should continue to be realized Raw material costs expected to be flat versus second quarter
18
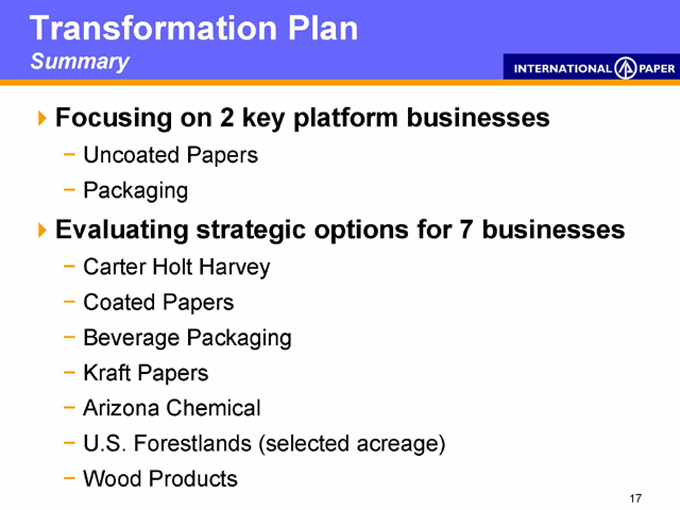
Transformation Plan
Summary
Focusing on 2 key platform businesses
Uncoated Papers Packaging
Evaluating strategic options for 7 businesses
Carter Holt Harvey Coated Papers Beverage Packaging Kraft Papers Arizona Chemical
U.S. Forestlands (selected acreage) Wood Products
19
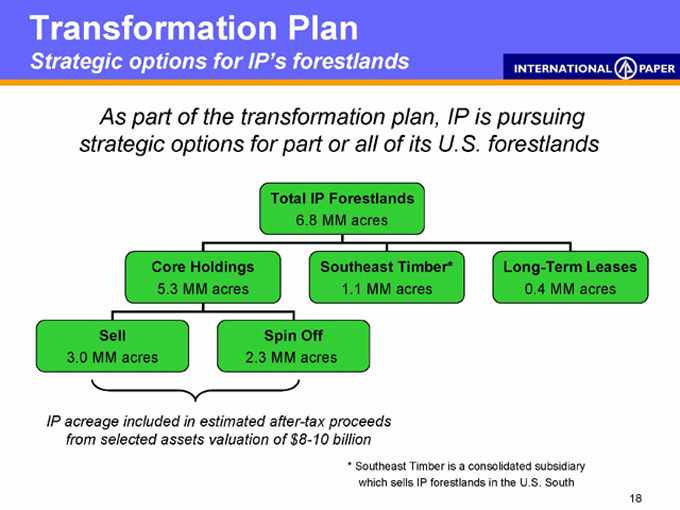
Transformation Plan
Strategic options for IP’s forestlands
As part of the transformation plan, IP is pursuing strategic options for part or all of its U.S. forestlands
Total IP Forestlands
6.8 MM acres
Core Holdings
5.3 MM acres
Southeast Timber*
1.1 MM acres
Long-Term Leases
0.4 MM acres
Sell
3.0 MM acres
Spin Off
2.3 MM acres
IP acreage included in estimated after-tax proceeds from selected assets valuation of $8-10 billion
* Southeast Timber is a consolidated subsidiary which sells IP forestlands in the U.S. South
20
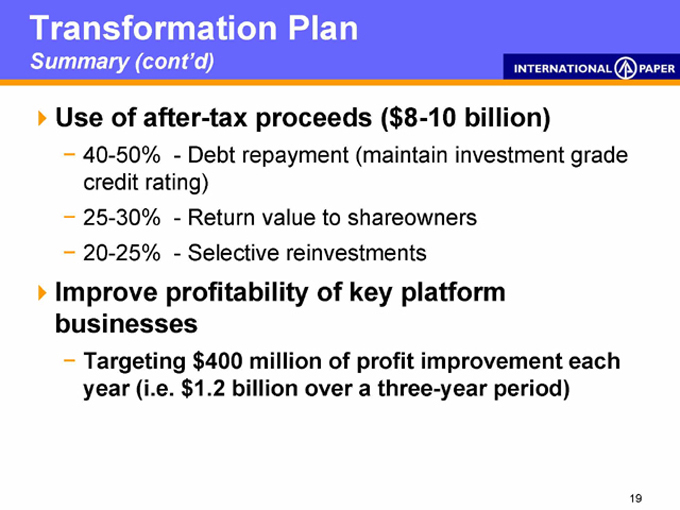
Transformation Plan
Summary (cont’d)
Use of after-tax proceeds ($8-10 billion)
40-50% - Debt repayment (maintain investment grade credit rating) 25-30% - Return value to shareowners 20-25% - Selective reinvestments
Improve profitability of key platform businesses
Targeting $400 million of profit improvement each year (i.e. $1.2 billion over a three-year period) .
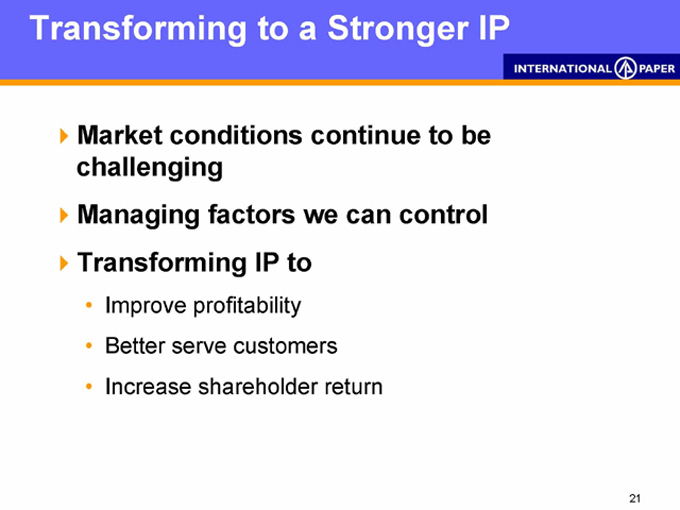
21
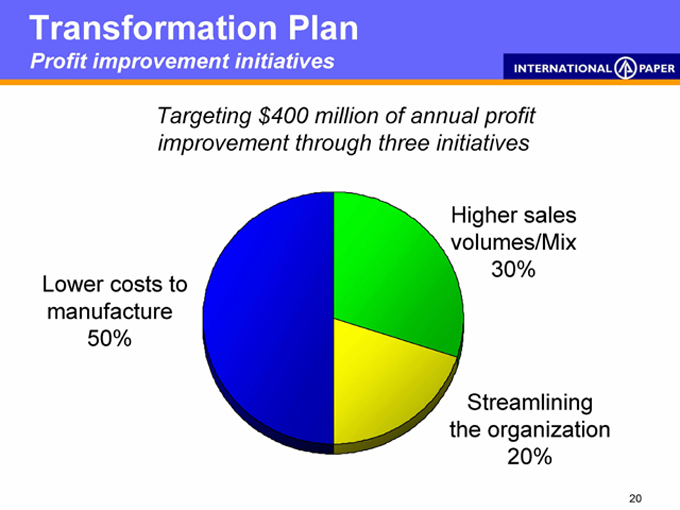
Transformation Plan
Profit improvement initiatives
Targeting $400 million of annual profit improvement through three initiatives
Lower costs to manufacture 50%
Higher sales volumes/Mix 30%
Streamlining the organization 20%
22

Q & A
22
Appendix
23
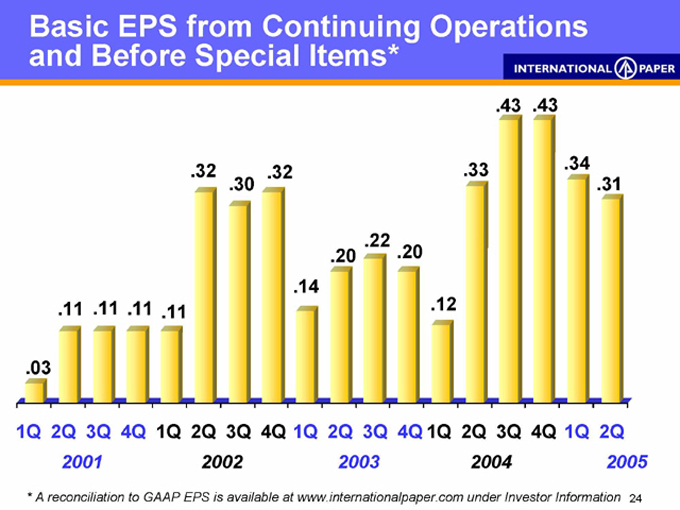
Basic EPS from Continuing Operations and Before Special Items*
.03
.11 .11 .11 .11
.32 .32 .30
.14
.20 .22 .20
.12
.33
.43 .43
.34 .31
1Q 2Q 3Q 4Q 1Q 2Q 3Q 4Q 1Q 2Q 3Q 4Q 1Q 2Q 3Q 4Q 1Q 2Q
2001 2002 2003 2004 2005
* A reconciliation to GAAP EPS is available at www.internationalpaper.com under Investor Information
24
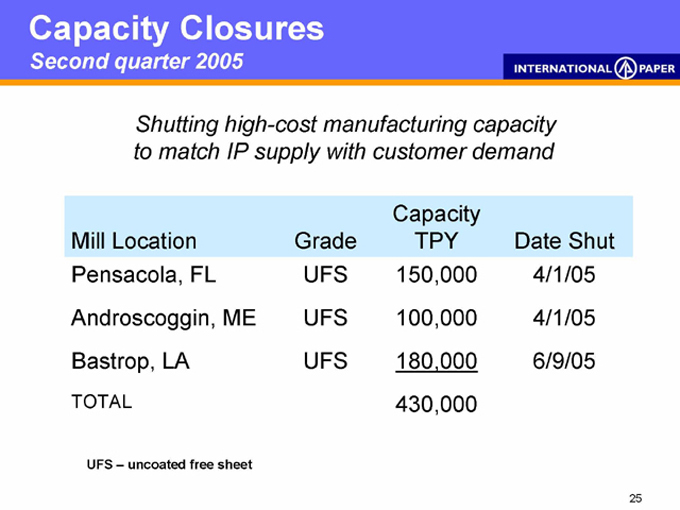
Capacity Closures
Second quarter 2005
Shutting high-cost manufacturing capacity to match IP supply with customer demand
Capacity
Mill Location Grade TPY Date Shut
Pensacola, FL UFS 150,000 4/1/05
Androscoggin, ME UFS 100,000 4/1/05
Bastrop, LA UFS 180,000 6/9/05
TOTAL 430,000
UFS – uncoated free sheet
25
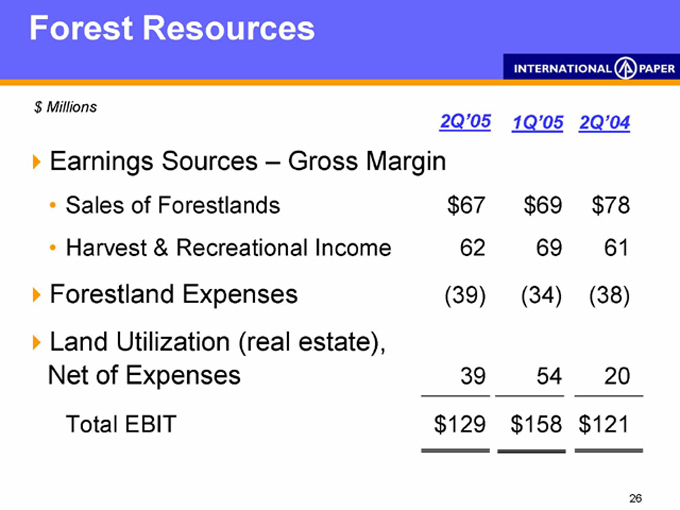
Forest Resources $ Millions
2Q’05 1Q’05 2Q’04
Earnings Sources – Gross Margin
Sales of Forestlands $67 $69 $78
Harvest & Recreational Income 62 69 61
Forestland Expenses (39) (34) (38)
Land Utilization (real estate),
Net of Expenses 39 54 20
Total EBIT $129 $158 $121
26
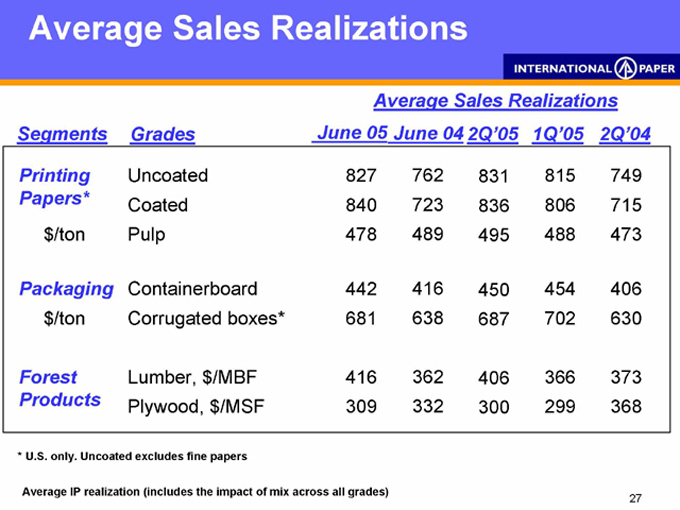
Average Sales Realizations
Average Sales Realizations
Segments Grades June 05 June 04 2Q’05 1Q’05 2Q’04
Printing Uncoated 827 762 831 815 749
Papers* Coated 840 723 836 806 715
$/ton Pulp 478 489 495 488 473
Packaging Containerboard 442 416 450 454 406
$/ton Corrugated boxes* 681 638 687 702 630
Forest Lumber, $/MBF 416 362 406 366 373
Products Plywood, $/MSF 309 332 300 299 368
* U.S. only. Uncoated excludes fine papers
Average IP realization (includes the impact of mix across all grades)
27
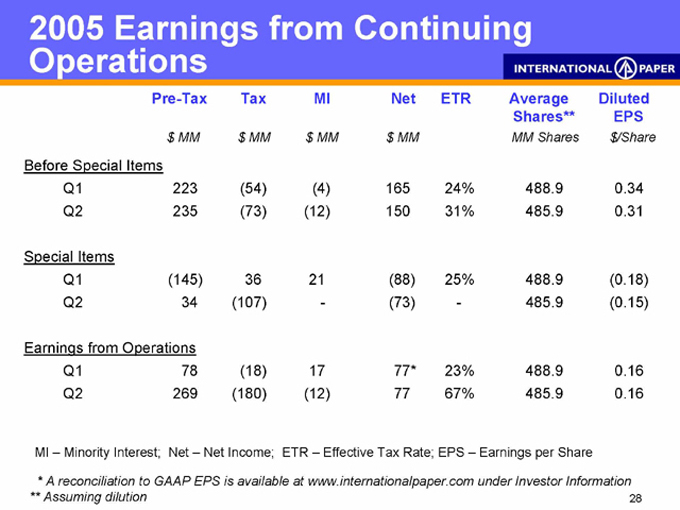
2005 Earnings from Continuing
Operations
Pre-Tax Tax MI Net ETR Average Diluted
Shares** EPS
$MM $MM $MM $MM MM Shares $/Share
Before Special Items
Q1 223 (54) (4) 165 24% 488.9 0.34
Q2 235 (73) (12) 150 31% 0.31
Special Items
Q1 (145) 36 21 (88) 25% 488.9 (0.18)
Q2 34 (107) - (73) - (0.15)
Earnings from Operations
Q1 78 (18) 17 77* 23% 488.9 0.16
Q2 269 (180) (12) 77 67% 0.16
MI – Minority Interest; Net – Net Income; ETR – Effective Tax Rate; EPS – Earnings per Share
* A reconciliation to GAAP EPS is available at www.internationalpaper.com under Investor Information
** Assuming dilution
28
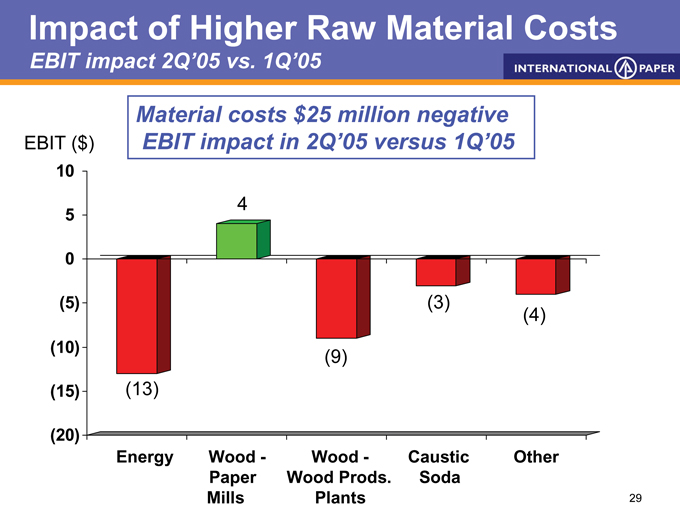
Impact of Higher Raw Material Costs
EBIT impact 2Q’05 vs. 1Q’05
Material costs $25 million negative EBIT impact in 2Q’05 versus 1Q’05
EBIT ($)
5 0 (5) (10) (15)
(5)
(3)
(8)
(5)
(4)
Wood
Caustic Soda
Oil/Coal/Electricity
Natural Gas
Other
29
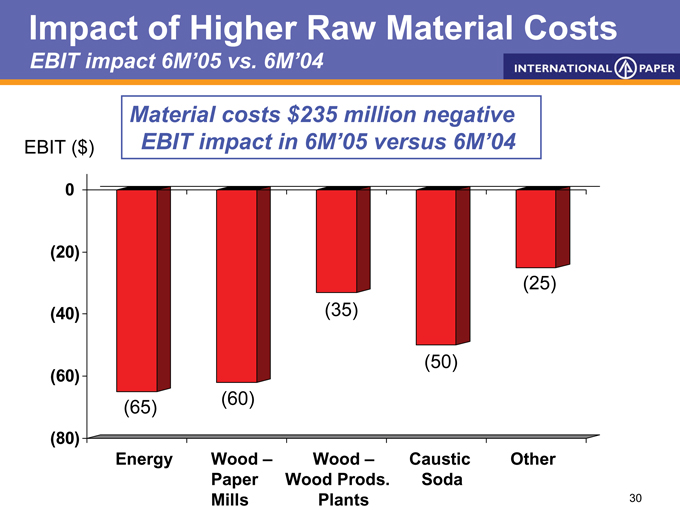
Impact of Higher Raw Material Costs
EBIT impact 6M’05 vs. 6M’04
Material costs $235 million negative EBIT impact in 6M’05 versus 6M’04
EBIT ($)
0 (20) (40) (60) (80) (100) (120)
(95)
(50)
(50)
(15)
(25)
Wood
Caustic Soda
Oil/Coal/Electricity
Natural Gas
Other
30
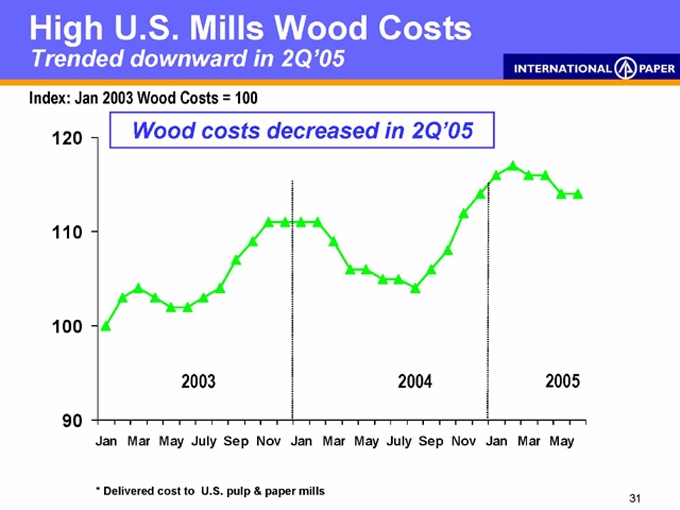
High U.S. Mills Wood Costs
Trended downward in 2Q’05
Index: Jan 2003 Wood Costs = 100
Wood costs decreased in 2Q’05 and should trend lower in 3Q’05
120 110 100 90
2003
2004
2005
Jan Mar May July Sep Nov Jan Mar May July Sep Nov Jan Mar May
* Delivered cost to U.S. pulp & paper mills
31
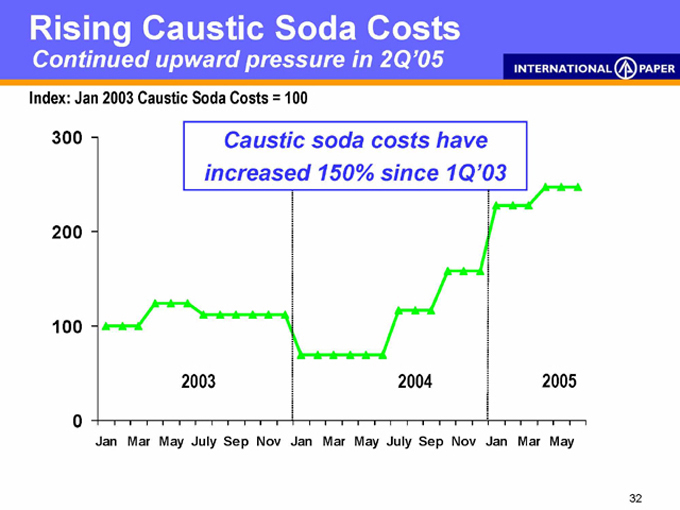
Rising Caustic Soda Costs
Continued upward pressure in 2Q’05
Index: Jan 2003 Caustic Soda Costs = 100
Caustic soda costs have increased 150% since 1Q’03
300 200 100 0
2003
2004
2005
Jan Mar May July Sep Nov Jan Mar May July Sep Nov Jan Mar May
32
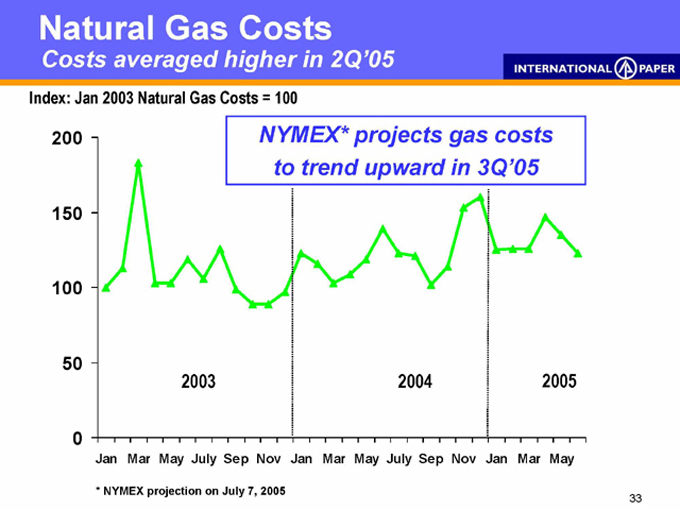
Natural Gas Costs
Costs averaged higher in 2Q’05
Index: Jan 2003 Natural Gas Costs = 100
Natural gas costs projected to trend upward in 3Q’05
200
150
100
50
0
2003
2004
2005
Jan Mar May July Sep Nov Jan Mar May July Sep Nov Jan Mar May
33

INTERNATIONAL PAPER
34