 Fourth Quarter 2006 Review February 1, 2007 Fourth Quarter 2006 Review February 1, 2007 John V. Faraci Chairman & CEO Marianne M. Parrs EVP & CFO John V. Faraci Chairman & CEO Marianne M. Parrs EVP & CFO Exhibit 99.2 |
 2 Forward-Looking Statements These slides and statements made during this presentation contain forward-looking statements. These statements reflect management's current views and are subject to risks and uncertainties that could cause actual results to differ materially from those expressed or implied in these statements. Factors which could cause actual results to differ relate to: (i) industry conditions, including changes in the cost or availability of raw materials and energy, changes in transportation costs, competition, changes in the Company's product mix and demand and pricing for the Company's products; (ii) market and economic factors, including changes in international conditions, specifically in Brazil, Russia, Poland, China and South Korea, changes in currency exchange rates, changes in credit ratings issued by nationally recognized statistical rating organizations, pension and healthcare costs and natural disasters, such as hurricanes; (iii) the Company's transformation plan, including the ability to continue to successfully execute the transformation plan, the impact of the plan on the Company's relationship with its employees, the ability to realize anticipated profit improvement from the plan and the ability to invest proceeds with attractive financial returns; (iv) the execution of sale transactions currently under contract and the realization of anticipated sales proceeds thereunder; and (v) unanticipated expenditures related to the cost of compliance with environmental and other governmental regulations and the uncertainty of the costs and other effects of potential litigation. We undertake no obligation to publicly update any forward-looking statements, whether as a result of new information, future events or otherwise. These and other factors that could cause or contribute to actual results differing materially from such forward looking statements are discussed in greater detail in the Company's Securities and Exchange Commission filings. |
 3 uring the course of this presentation, certain non- U.S. GAAP financial information will be presented. A reconciliation of those numbers to U.S. GAAP financial measures is available on the company’s website at www.internationalpaper.com under Investors. Statements Relating to Non-GAAP Financial Measures D |
 4 Agenda Fourth Quarter 2006 Review Transformation Plan Update First Quarter 2007 Outlook 2007 Priorities Fourth Quarter 2006 Review Transformation Plan Update First Quarter 2007 Outlook 2007 Priorities |
 5 Fourth Quarter 2006 Summary Best Fourth Quarter Since 1999 Volume • Seasonally slower in North America • Improved European and Brazilian volumes Pricing • Papers improve in North America, Europe, and Brazil • Packaging flat Manufacturing operations impacted by outages Higher Real Estate sales, but reduced harvest income Reduced corporate expense Lower net interest expense Reduced share count Beverage Packaging and Wood Products included in discontinued operations Volume • Seasonally slower in North America • Improved European and Brazilian volumes Pricing • Papers improve in North America, Europe, and Brazil • Packaging flat Manufacturing operations impacted by outages Higher Real Estate sales, but reduced harvest income Reduced corporate expense Lower net interest expense Reduced share count Beverage Packaging and Wood Products included in discontinued operations |
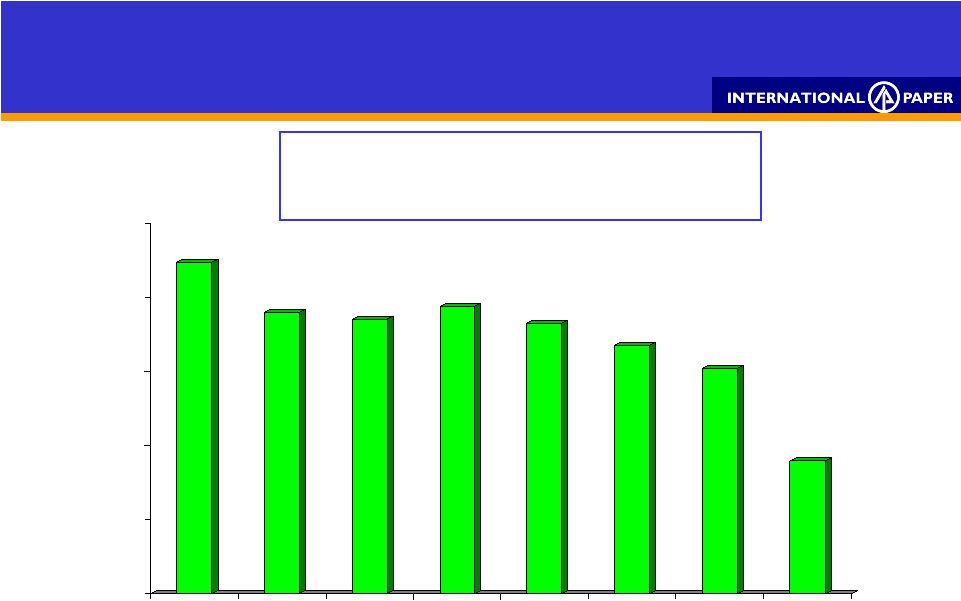
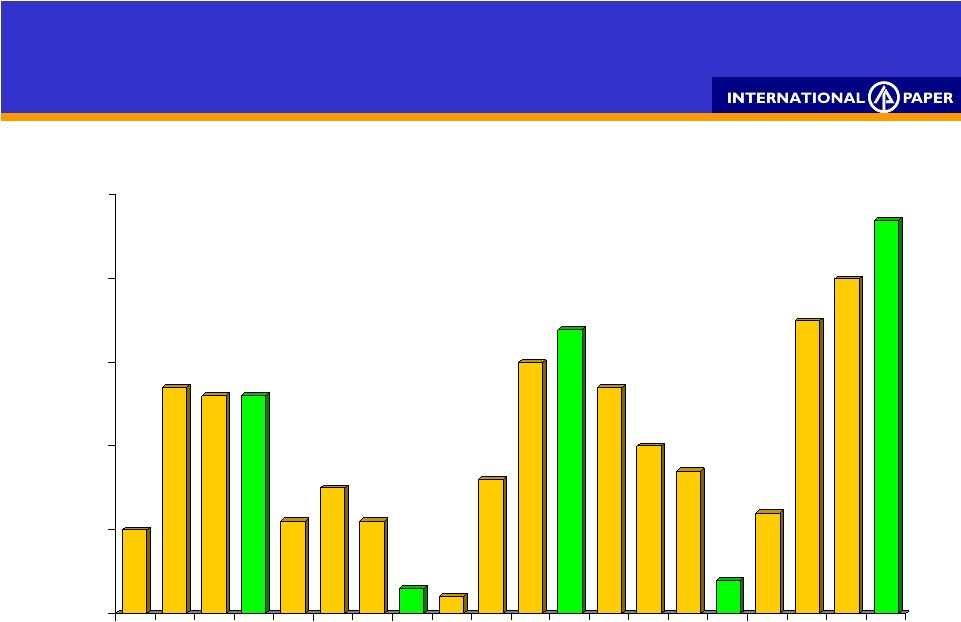 6 0.00 0.10 0.20 0.30 0.40 0.50 1Q 2Q 3Q 4Q 1Q 2Q 3Q 4Q 1Q 2Q 3Q 4Q 1Q 2Q 3Q 4Q 1Q 2Q 3Q 4Q 0.00 0.10 0.20 0.30 0.40 0.50 1Q 2Q 3Q 4Q 1Q 2Q 3Q 4Q 1Q 2Q 3Q 4Q 1Q 2Q 3Q 4Q 1Q 2Q 3Q 4Q 2002 2003 2004 2005 2006 .10 .27 .26 .26 .11 .15 .11 .03 .02 .30 .16 .34 .27 .20 .17 .04 .12 .35 Diluted EPS from Continuing Operations and Before Special Items $/Share * A reconciliation to GAAP EPS is available at www.internationalpaper.com under Investors/Presentations .40 .47 |
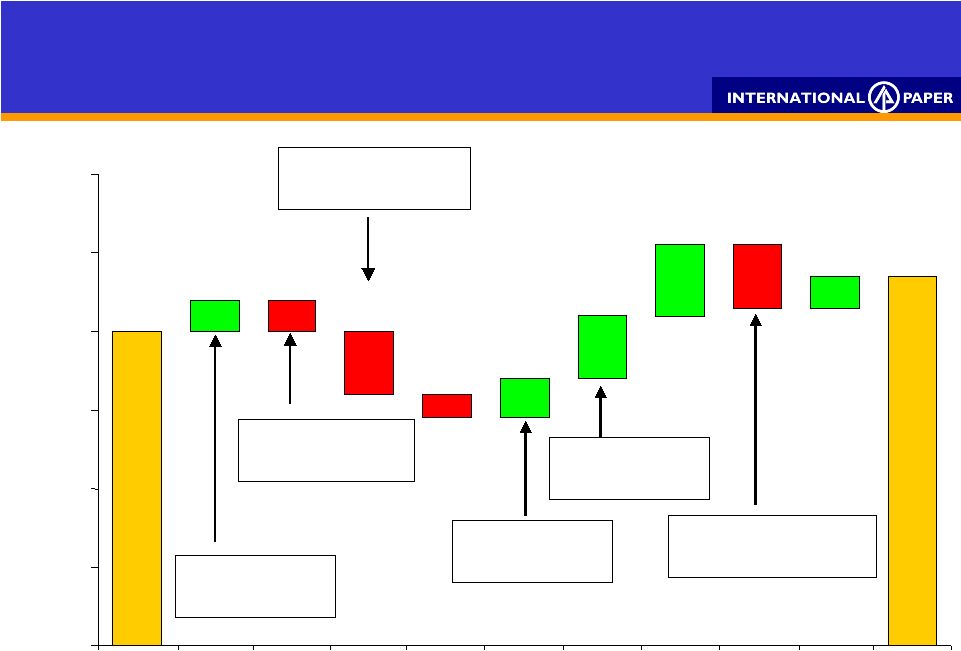 7 EPS $ / Share EPS $ / Share 4Q ‘06 vs. 3Q ‘06 EPS from cont. ops before special items NA Papers .02 Int’l Papers .02 IP Realty ..06 Land Sales (.01) NA Papers (.03) Others (.01) NA Papers (.05) NA Packaging (.03) Coated (.03) Harvest Income (.05) LIFO . 04 Benefits .04 .47 .40 .04 .09 .08 .05 .04 (.08) (.03) (.08) (.04) $0.00 $0.10 $0.20 $0.30 $0.40 $0.50 $0.60 3Q ' 06 Price Volume / Downtime Cost/Mix Brazil Outage Real Estate Corporate / Other Interest Divestitures Shares 4Q ' 06 |
 8 12M ‘06 vs. 12M ‘05 .70 1.33 .20 .32 .24 .80 (.19) (.09) (.24) (.05) (.36) $0.00 $0.50 $1.00 $1.50 $2.00 $2.50 12M '05 Price Volume / Downtime Cost/Mix Materials / Distrib Real Estate Corporate / Other Interest Divestitures Tax 12M '06 EPS $ / Share EPS $ / Share EPS from cont. ops before special items Packaging .35 Papers .44 Other .01 Chemicals (.09) Energy (.05) Wood Cost (.03) Distribution (.19) 2005 Tax rate 20% 2006 Tax rate 29% Coated (.04) Harvest Income (.05) Pension (.16) Benefits (.10) Other .02 |
 9 Raw Material & Distribution Costs EBIT impact 12M’06 vs. 12M’05 Total of $214 million or $0.36 per share negative impact in 12M’06 versus 12M’05 (130) (110) (90) (70) (50) (30) (10) (130) (110) (90) (70) (50) (30) (10) Energy Distribution Chemicals EBIT ($MM) (7) (12) (24) (58) Non-U.S. Wood (113) 1 All costs exclude coated papers and discontinued operations |
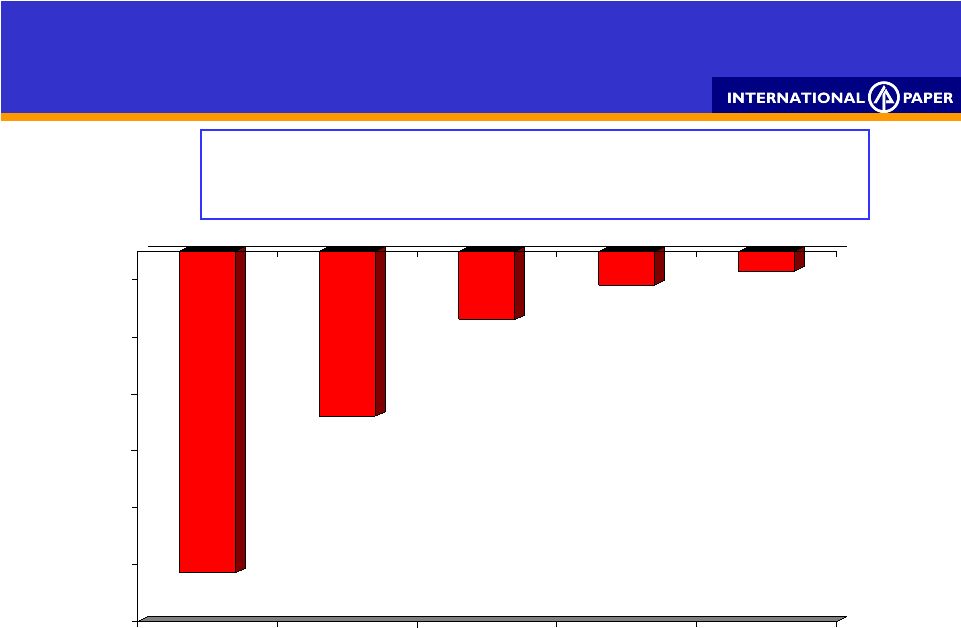
 10 0 4 8 12 16 20 0 4 8 12 16 20 2000 June 2001 Dec 2002 Dec 2003 Dec 2004 Dec 2005 Dec 17.9 15.2 14.8 15.5 14.6 12.2 $ Billion Reduced total debt by $10.7 billion since June 2000 Debt Reduction Except for December 2005 and January 2006, all periods include Carter Holt Harvey debt on IP’s balance sheet 7.2 2006 Dec 2005 June 13.4 |
 11 Printing Papers * Excluding a $128MM special charge $ 1,545 190* Sales Earnings 4Q’06 3Q’06 $ Millions $ Millions Uncoated Pulp Europe (uncoated) Brazil (uncoated) $9 $21 €16 R$20 Volume Realizations/ton $ 1,670 249 4Q’06 Change vs 3Q’06: 4Q’06 Change vs 3Q’06: (5%) (9%) 8% 2% Average IP realization (includes the impact of mix across all grades) |
 12 Industrial Packaging Average IP realization (includes the impact of mix across all grades) $ 1,265 122 Sales Earnings 4Q’06 3Q’06 $ Millions $ Millions Containerboard U.S. Container $7 ($4) Volume Realizations/ton $ 1,250 125* 4Q’06 Change vs 3Q’06: 4Q’06 Change vs 3Q’06: (4%) (1%) * Excluding a $13MM special gain |
 13 Consumer Packaging Average IP realization (includes the impact of mix across all grades) $ 665 28 Sales Earnings 4Q’06 3Q’06 $ Millions $ Millions Coated Paperboard $8 Volume Realizations/ton $ 645 48 4Q’06 Change vs 3Q’06: 4Q’06 Change vs 3Q’06: (5%) Converting Businesses Sales Revenue (4%) |
 14 Distribution $ 1,715 31 Sales Earnings 4Q’06 3Q’06 $ Millions $ Millions $ 1,730 34 Record fourth quarter EBIT; up 20% compared to 2005 Record Year |
 15 Forest Resources $ 190 162 Sales Earnings 4Q’06 3Q’06 $ Millions $ 135 166 |
 16 Special Items (net of tax & minority interest) $2,740 • Forestland Sale Gains (759) • Goodwill Impairments (84) • Saillat Mill Asset Impairment (69) • Restructuring / Corporate (4) • Tax Adjustment 7 • Other $4.06 $1,831 Total Special Items Discontinued Operations (net of tax) $(3) • Beverage Packaging (94) • Wood Products 22 • Weldwood Tariff Refund 4 • Other Items $(0.16) $(71) Total Discontinued Operations $MM $/Share Special Items & Discontinued Operations – 4Q’06 |
 17 Earnings from Continuing Operations and Before Special Items $0.47 Special Items 4.06 Earnings from Continuing Operations 4.53 Discontinued Operations (0.16) Net Earnings $4.37 Earnings from Continuing Operations and Before Special Items $0.47 Special Items 4.06 Earnings from Continuing Operations 4.53 Discontinued Operations (0.16) Net Earnings $4.37 Reconciliation to 4Q’06 Diluted Earnings Per Share Diluted EPS |
 18 Special Items & Discontinued Operations - 2006 22 • Other (185) • Restructuring / Corporate Special Items (net of tax & minority interest) $2,964 • Forestlands Sale (1,302) • Coated Papers Sale 78 • Other Divestitures (759) • Goodwill Impairment (121) • Asset Impairment (28) • Other $1.32 $647 Total Special Items Discontinued Operations (net of tax) $(54) • Beverage Packaging (244) • Wood Products (46) • Kraft Papers 90 • Brazil Coated Papers $(0.47) $(232) Total Discontinued Operations $MM $/Share |
 19 Earnings from Continuing Operations and Before Special Items $1.33 Special Items 1.32 Earnings from Continuing Operations 2.65 Discontinued Operations (0.47) Net Earnings $2.18 Earnings from Continuing Operations and Before Special Items $1.33 Special Items 1.32 Earnings from Continuing Operations 2.65 Discontinued Operations (0.47) Net Earnings $2.18 Diluted EPS Reconciliation to 2006 Diluted Earnings Per Share |
 20 2006 Summary Best year since 2000 Strong price realizations EBIT margin improved by 160 basis points Continued improvement in our manufacturing operations Good cost control Our supply/demand in balance Significant progress in transforming International Paper Best year since 2000 Strong price realizations EBIT margin improved by 160 basis points Continued improvement in our manufacturing operations Good cost control Our supply/demand in balance Significant progress in transforming International Paper Solid Foundation for Continued Improvement |
 21 $.330 Billion 12M06 $1.4 Billion $6.2 B Debt Reduction $2.0 B Announced Average Returns ~ 12% Improve Existing Businesses Improve Existing Businesses Return Value to Shareholders Return Value to Shareholders Strengthen Balance Sheet Strengthen Balance Sheet Selective Reinvestment Selective Reinvestment $9.7 Billion Received Divestitures Divestitures Transformation Plan Update Fourth Quarter 2006 Announced Divestitures Proceeds Totaling $11.3 Billion $1.0 B Pension Contribution |
 22 First Quarter 2007 Outlook Volume - seasonally stronger Prices • Implementing IP’s previously announced containerboard and coated board price increases • Implementing IP’s previously announced European and Brazilian paper price increases Continued progress in improving operations with fewer mill outages Input costs mixed and slightly higher Lower real estate sales First full quarter of IP/Sun Coated Paperboard JV Addition of Luiz Antonio operations in Brazil Volume - seasonally stronger Prices • Implementing IP’s previously announced containerboard and coated board price increases • Implementing IP’s previously announced European and Brazilian paper price increases Continued progress in improving operations with fewer mill outages Input costs mixed and slightly higher Lower real estate sales First full quarter of IP/Sun Coated Paperboard JV Addition of Luiz Antonio operations in Brazil |
 23 2007 Priorities Improve Existing Businesses Deliver on earnings from Selective Reinvestments • Luiz Antonio • IP/Sun JV Return Value to Shareholders Improve Existing Businesses Deliver on earnings from Selective Reinvestments • Luiz Antonio • IP/Sun JV Return Value to Shareholders Building on a Solid 2006 $400 MM Target $165 MM Up to $1.6 B |
 24 Q & A Q & A |
 25 Appendix Appendix |
 26 2006 Total Overhead Cost Pension, Supply Chain & Commissions $3.4 Billion Overhead Cost Base to Manage $100 Million or 4% Improvement Year-over-Year 28% 72% |
 27 Carter Holt Harvey Brazil Coated Papers US Coated Papers Kraft Papers Forestlands Wood Products Arizona Chemical Consider Strategic Options Distribute Sales Book Evaluate Bids Sales Agreement Announced Close on Sale 5.7 MM acres Bev. Packaging Proceeds $1.1B $0.4B *Expected to close first half of 2007 $1.4B $6.6B Transformation Plan Update Divestments status as of February 1, 2007 $0.2B Total Proceeds To date $0.5B $0.6B* $0.5B* $11.3B 1 Received $413 MM from the North American Portion of the Sale 1 |
 28 Transformation Plan Update 2006 Results for Businesses Sold or Sale Announced 4,460 1,340 220 770 235 845 1,050 Sales (MM) Total Wood Products Forest Harvests/ Recreation Income Arizona Chemical Kraft Papers Beverage Pkg US & Brazil Coated Paper Business Forest Products Forest Products Other Businesses Discontinued Operations Consumer Packaging Printing Papers Reporting Segment 350 (20) 125 60 40 50 95 Operating Profit (MM) Operating profit represents 12M’06 YTD, except for US and Brazil coated papers which are July and August YTD respectively |
 29 29% $ 746 MM $156 MM $521 MM $1.1 B $1.1 B 2006 1 Effective Tax Rate 2 Corporate Items Supply Chain Expense Net Interest Expense Depreciation & Amort. Capital Spending 20% $607 MM $135 MM $595 MM $1.2 B $1.1 B 2005 1 30-32% $675 – 725 MM $215 MM $350-380 MM $1.1 -1.2 B $1.1-1.2 B 2007 Est. 1 Excludes discontinued operations result and Coated Papers 2 Before special items Key Financial Statistics Updated as of February 1, 2007 |
 30 1Q 2Q 3Q 4Q 1Q 2Q 3Q 4Q 1Q 2Q 3Q 4Q 1Q 2Q 3Q 4Q 1Q 2Q 3Q 4Q Containerboard Uncoated Papers Pulp Coated Paperboard European Papers *Includes indefinitely closed uncoated papers capacity at Pensacola, FL, Bastrop, LA and Jay, ME in 2Q05 (72,000 tons), 3Q05 (108,000 tons) and 4Q’05 (108,000 tons). Permanently closed at end of 4Q’05. 168 44 49 232 Lack of Order Downtime 59 90 236 173 5 10 5 35 95 M Short Tons 2002 2003 2004 2005 274* 270* 180* 25 2006 25 28 70 |
 31 2 10 (19) 11 Q1’07 Period Impact vs. Full-Year 2007 Amortization $(MM) Total Impact Consumer Packaging Industrial Packaging Printing Papers 101,000 0 74,000 27,000 Maintenance Outage (tons) Maintenance outages and dollar impacts are estimated and are subject to change. Q1’07 Maintenance Outages |
 32 Earnings by Industry Segment Earnings by Industry Segment Printing Papers $190 $249 $64 805 $499 Industrial Packaging 122 125 5 386 223 Consumer Packaging 28 48 29 131 122 Distribution 31 34 25 128 84 Forest Products 162 166 224 678 732 Other Businesses 13 22 (6) 61 17 Operating Profit 546 644 341 2,189 1,677 Interest Expense (86) (144) (152) (527) (649) Minority Interest 3 - 3 8 - Corporate Items, net (166) (221) (173) (746) (607) Earnings from continuing operations before income taxes, minority interest & special items $297 $279 $19 $924 $421 Earnings by Industry Segment Printing Papers $190 $249 $64 805 $499 Industrial Packaging 122 125 5 386 223 Consumer Packaging 28 48 29 131 122 Distribution 31 34 25 128 84 Forest Products 162 166 224 678 732 Other Businesses 13 22 (6) 61 17 Operating Profit 546 644 341 2,189 1,677 Interest Expense (86) (144) (152) (527) (649) Minority Interest 3 - 3 8 - Corporate Items, net (166) (221) (173) (746) (607) Earnings from continuing operations before income taxes, minority interest & special items $297 $279 $19 $924 $421 $ Millions 3Q’06 3Q’06 4Q’05 4Q’05 4Q’06 4Q’06 2006 2006 2005 2005 Before special items *Industry segment information has been reclassified to conform with minor changes in 2006 organizational structure as well as to reflect Kraft Paper, the Brazil Coated Papers business, Wood Products and Beverage Packaging as discontinued operations. |
 33 Before Special Items Q1 86 (22) (5) 59 26% 486.3 0.12 Q2 262 (89) (4) 169 34% 487.2 0.35 Q3 279 (78) (5) 196 28% 484.9 0.40 Q4 297 (83) (3) 211 28% 451.2 0.47 Full Year Total 924 (272) (17) 635 29% 488.7 1.33 Special Items Q1 (1,308) 38 - (1,270) 3% 486.3 (2.61) Q2 (128) 45 - (83) 35% 487.2 (0.17) Q3 286 (117) - 169 41% 484.9 0.35 Q4 3,414 (1,583) - 1,831 46% 451.2 4.06 Full Year Total 2,264 (1,617) - 647 71% 488.7 1.32 Earnings from Continuing Operations Q1 (1,222) 16 (5) (1,211) 1% 486.3 (2.49) Q2 134 (44) (4) 86 33% 487.2 0.18 Q3 565 (195) (5) 365 35% 484.9 0.75 Q4 3,711 (1,666) (3) 2,042 45% 451.2 4.53 Full Year Total 3,188 (1,889) (17) 1,282 59% 488.7 2.65 2006 Earnings from Continuing Operations Pre-Tax Tax MI Net ETR Average Diluted Shares 2 EPS 1 $ MM MM Shares $/Share $ MM $ MM $ MM MI – Minority Interest; Net – Net Income; ETR – Effective Tax Rate; EPS – Earnings per Share 1 A reconciliation to GAAP EPS is available at www.internationalpaper.com under Investor Information and the presentation tab 2 Assuming dilution |
 34 Before Special Items Q1 151 (18) (2) 131 12% 488.9 0.27 Q2 133 (32) (2) 99 24% 487.4 0.20 Q3 118 (34) (3) 81 29% 507.1 0.17 Q4 19 1 (2) 18 (5%) 486.0 0.04 Full Year Total 421 (83) (9) 329 20% 507.0 0.70 Special Items Q1 (103) 36 - (67) 35% 488.9 (0.14) Q2 37 (96) - (59) 259% 487.4 (0.12) Q3 162 443 - 605 (273%) 507.1 1.19 Q4 (231) 107 - (124) 46% 486.0 (0.26) Full Year Total (135) 490 - 355 363 507.0 0.70 Earnings from Continuing Operations Q1 48 18 (2) 64 (38%) 488.9 0.13 Q2 170 (128) (2) 40 75% 487.4 0.08 Q3 280 409 (3) 686 (146%) 507.1 1.36 Q4 (212) 108 (2) (106) 51% 486.0 (0.22) Full Year Total 286 407 (9) 684 (142%) 507.0 1.40 2005 Earnings from Continuing Operations Pre-Tax Tax MI Net ETR Average Diluted Shares 2 EPS 1 $ MM MM Shares $/Share $ MM $ MM $ MM MI – Minority Interest; Net – Net Income; ETR – Effective Tax Rate; EPS – Earnings per Share 1 A reconciliation to GAAP EPS is available at www.internationalpaper.com under Investor Information and the presentation tab 2 Assuming dilution |
 35 Corrugated boxes * U.S. only. Average IP realization (includes the impact of mix across all grades) Average Sales Realizations 474 $/ton Packaging $/ton Printing Papers Segments 3Q’06 Average Sales Realizations 4Q’05 897 790 512 Dec 06 Containerboard Pulp Uncoated Grades* 4Q’06 Dec 05 2005 2004 2006 889 564 791 425 509 688 566 787 799 426 489 713 862 483 533 763 793 402 481 688 887 502 546 790 695 419 458 685 |
 36 Forest Resources Earnings Sources – Gross Margin • Sales of Forestlands $118 $125 $139 • Harvest & Recreational Income 26 63 75 Forestland Expenses (27) (27) (30) Land Utilization (real estate), Net of Expenses 45 5 40 Total EBIT $162 $166 $224 Earnings Sources – Gross Margin • Sales of Forestlands $118 $125 $139 • Harvest & Recreational Income 26 63 75 Forestland Expenses (27) (27) (30) Land Utilization (real estate), Net of Expenses 45 5 40 Total EBIT $162 $166 $224 $ Millions 3Q’06 3Q’06 4Q’05 4Q’05 4Q’06 4Q’06 |
 37 Forest Resources Earnings Sources – Gross Margin • Sales of Forestlands $447 $400 $315 • Harvest & Recreational Income 222 269 281 Forestland Expenses (114) (146) (178) Land Utilization (real estate), Net of Expenses 124 198 124 Total EBIT $679 $721 $542 Earnings Sources – Gross Margin • Sales of Forestlands $447 $400 $315 • Harvest & Recreational Income 222 269 281 Forestland Expenses (114) (146) (178) Land Utilization (real estate), Net of Expenses 124 198 124 Total EBIT $679 $721 $542 $ Millions 2005 2005 2004 2004 2006 2006 |
 38 Pension Returns Average annualized returns • 2006 14.9% • Past 5 years 11.5% • Past 10 years 10.0% • Portfolio asset allocation (at 12/31/06) • 62% Equity • 29% Debt • 9% Real estate & other |
 39 (500) (400) (300) (200) (100) 0 5.75 5.50 5.75 Discount Rate (%) 8.50 8.50 8.50 Rate of Return (%) 2007E 2006 2005 $ Millions 2005 2006 2007E Annual Pension Expense* Key Variables Pension Expense *U.S. plans only. Pension expense reflects service cost, interest cost, amortization of actuarial losses and expected return on plan assets (240) (377) (195) |
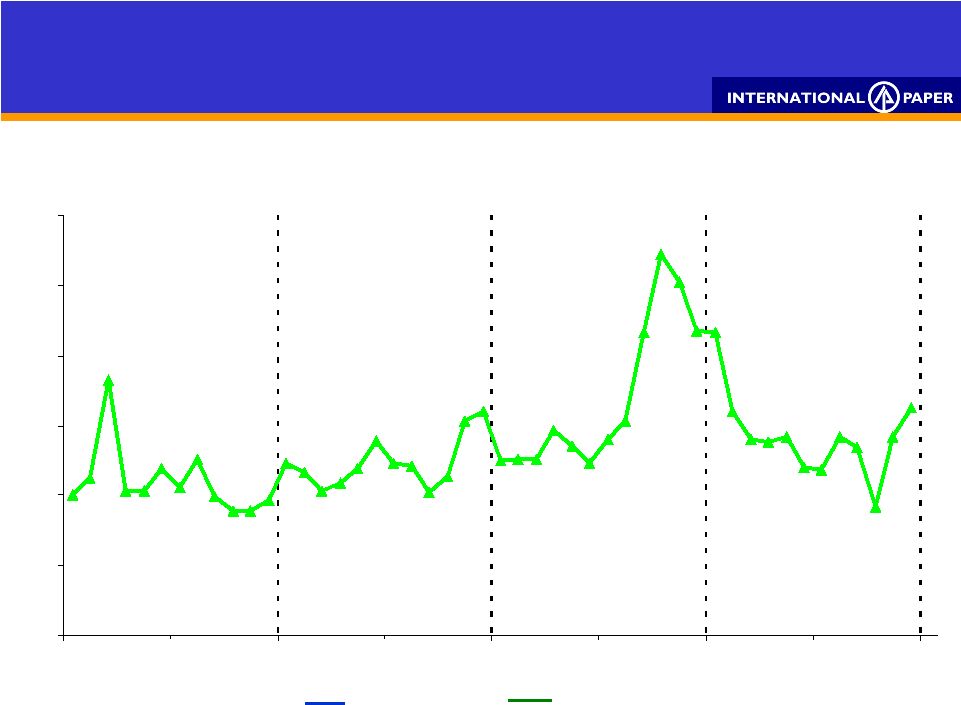 40 2006 YTD Average Index: Jan 2003 Natural Gas Costs = 100 2003 2004 Natural Gas Costs 2005 Trended higher in 4Q’06 2006 * NYMEX Natural Gas closing prices 0 50 100 150 200 250 300 Jan Apr July Oct Jan Apr July Oct Jan Apr July Oct Jan Apr July Oct Jan 2005 Average |
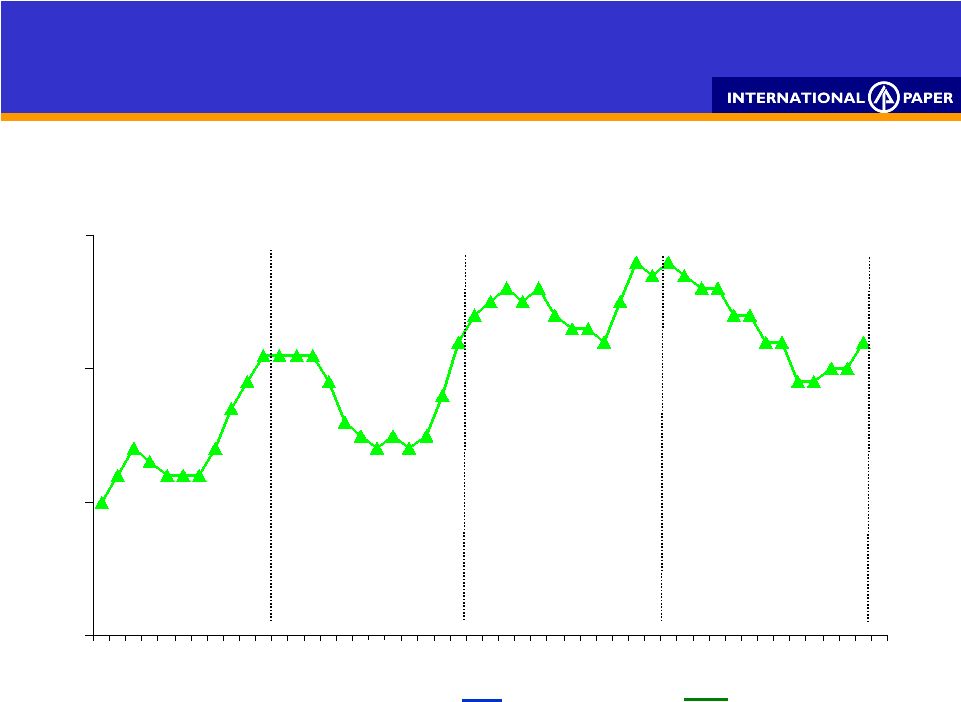 41 90 100 110 120 Jan Apr July Oct Jan Apr July Oct Jan Apr July Oct Jan Apr July Oct Jan U.S. Mill Wood Costs Index: Jan 2003 Wood Costs = 100 2003 2004 * Delivered cost to U.S. pulp & paper mills 2005 2006 2006 YTD Average 2005 Average |
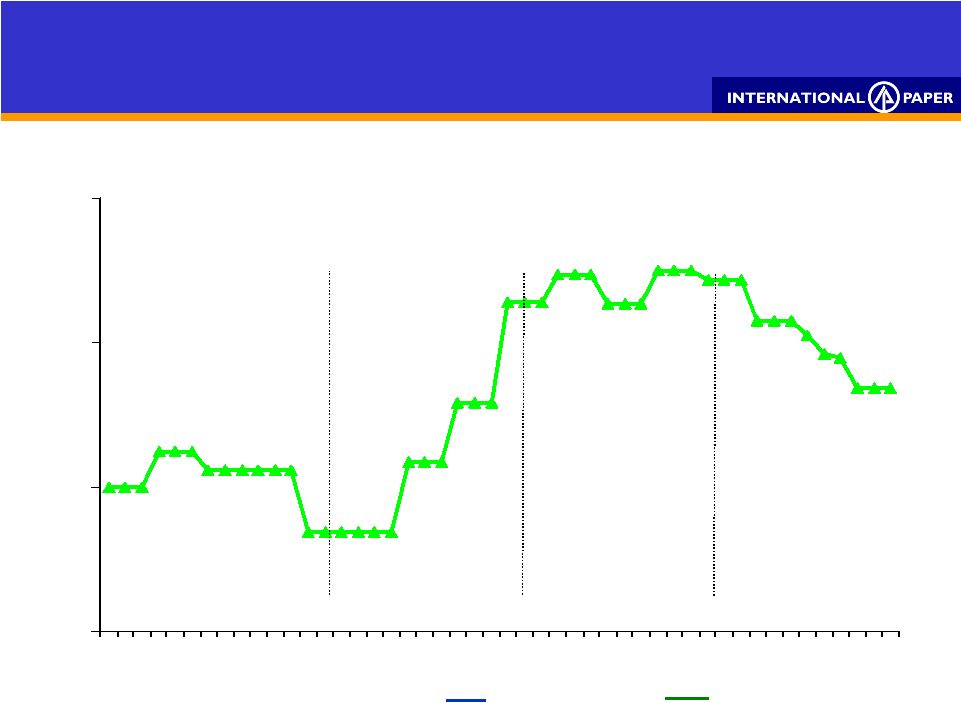 42 0 100 200 300 Jan Apr July Oct Jan Apr July Oct Jan Apr July Oct Jan Apr July Oct Index: Jan 2003 Caustic Soda Costs = 100 2003 2004 Caustic Soda Costs 2005 Trended lower in 4Q’06 2006 * Delivered cost to U.S. facilities 2006 YTD Average 2005 Average |
 43 Global Consumption Key input indicative annual purchase levels1 Natural Gas MMbtu 28,000,000 14,000,000 # 6 Fuel Oil BBL 4,100,000 400,000 Coal Tons 1,300,000 230,000 Wood Tons 40,000,000 8,200,000 OCC 3 Tons 600,000 313,000 Caustic Soda Tons 340,000 55,000 Sodium Chlorate Tons 215,000 49,000 LD Polyethylene Tons 40,000 - Latex Tons 24,000 4,000 Energy Energy Fiber Fiber Chemicals Chemicals Units Units U.S. 2 U.S. 2 Non- U.S. Non- U.S. 1 2006 Run Rate estimates 2 Excludes discontinued operations, Arizona Chemical and US Coated Paper business |
 44 |