  Second Quarter 2007 Review August 2, 2007 Second Quarter 2007 Review August 2, 2007 John V. Faraci Chairman & CEO Marianne M. Parrs EVP & CFO Exhibit 99.2 |
 Slide 2 Forward-Looking Statements Forward-Looking Statements These slides and statements made during this presentation contain forward-looking statements. These statements reflect management's current views and are subject to risks and uncertainties that could cause actual results to differ materially from those expressed or implied in these statements. Factors which could cause actual results to differ relate to: (i) industry conditions, including changes in the cost or availability of raw materials and energy, changes in transportation costs, competition, changes in the Company's product mix and demand and pricing for the Company's products; (ii) market and economic factors, including changes in international conditions, specifically in Brazil, Russia, Poland and China, changes in currency exchange rates, changes in credit ratings issued by nationally recognized statistical rating organizations, pension and healthcare costs and natural disasters, such as hurricanes; (iii) the Company's ability to realize anticipated profit improvement from its transformation plan and the ability to invest proceeds with attractive financial returns and (iv) unanticipated expenditures related to the cost of compliance with environmental and other governmental regulations and the uncertainty of the costs and other effects of potential litigation. We undertake no obligation to publicly update any forward-looking statements, whether as a result of new information, future events or otherwise. These and other factors that could cause or contribute to actual results differing materially from such forward looking statements are discussed in greater detail in the Company's Securities and Exchange Commission filings. |
 Slide 3 During the course of this presentation, certain non-U.S. GAAP financial information will be presented. A reconciliation of those numbers to U.S. GAAP financial measures is available on the company’s website at www.internationalpaper.com under Investors. Statements Relating to Non-GAAP Financial Measures Statements Relating to Non-GAAP Financial Measures |
 Slide 4 Agenda Agenda Second Quarter 2007 Review Third Quarter 2007 Outlook 2007 Priorities |
 Second Quarter 2007 Summary Second Quarter 2007 Summary Solid Quarter, best quarter since year 2000 Margins Expanding Manufacturing operations performed well Volumes solid Pricing strong Pensacola Conversion Lower tax rate Lower share count Slide 5 |
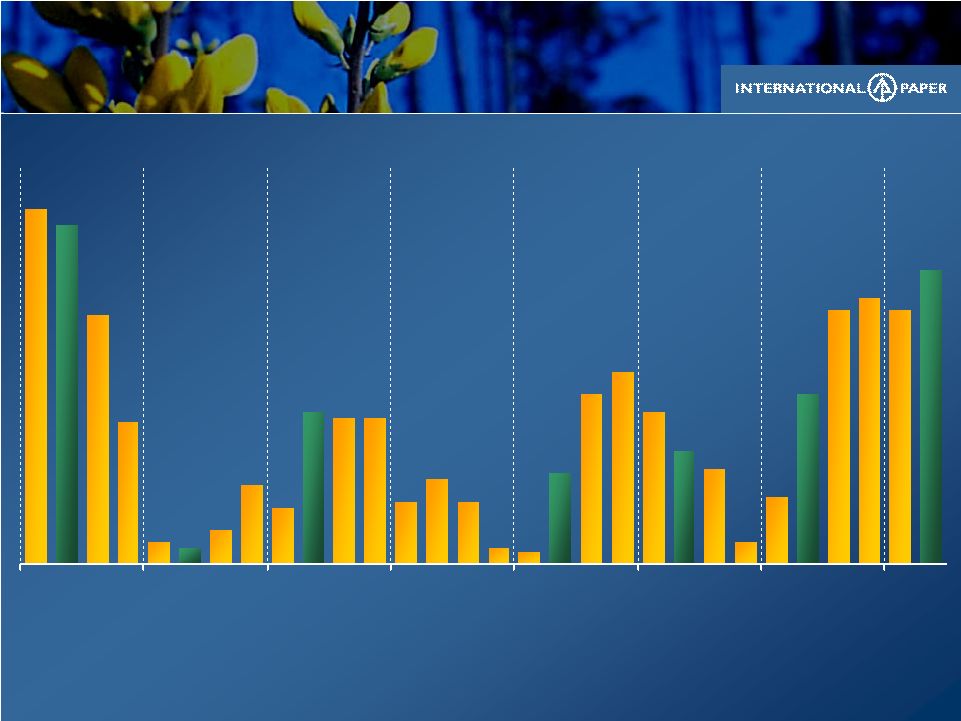 .63 .60 .44 .25 .04 .03 .06 .14 .10 .27 .26.26 .11 .15 .11 .03 .02 .16 .30 .34 .27 .04 .12 .30 .45 .47 .45 .52 .17 .20 1Q 2Q 3Q 4Q 1Q 2Q 3Q 4Q 1Q 2Q 3Q 4Q 1Q 2Q 3Q 4Q 1Q 2Q 3Q 4Q 1Q 2Q 3Q 4Q 1Q 2Q 3Q 4Q 1Q 2Q 2002 2003 2004 2005 2006 2007 2001 2000 Diluted EPS from Continuing Operations and Before Special Items Diluted EPS from Continuing Operations and Before Special Items * A reconciliation to GAAP EPS is available at www.internationalpaper.com under the Investors tab at presentations * 2006 EPS restated to reflect new accounting guidelines for planned maintenance outages Slide 6 |
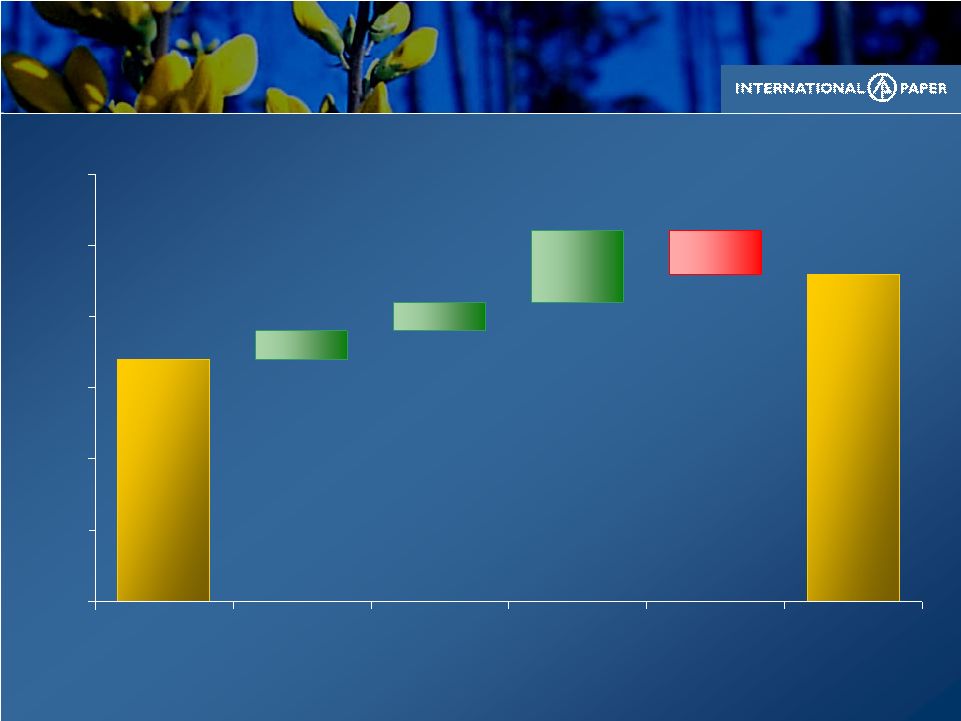
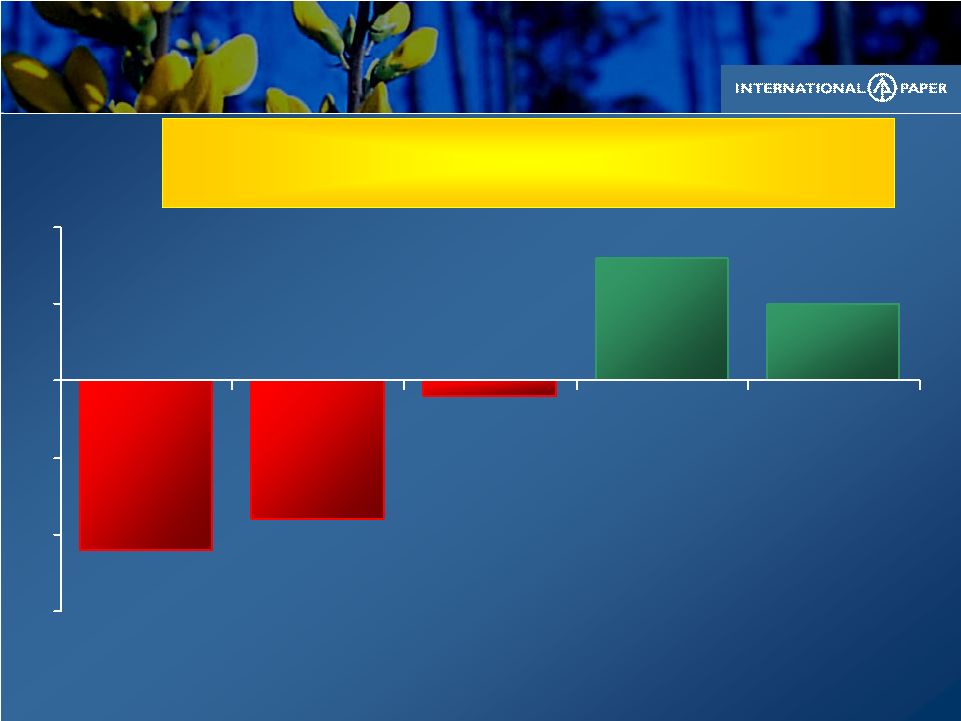
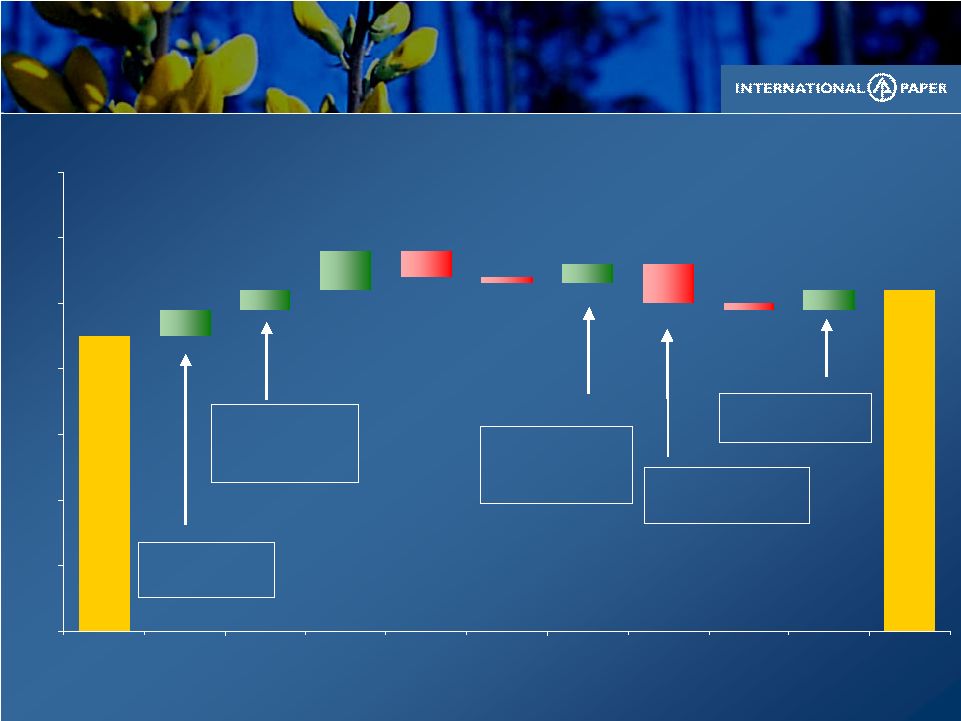 Slide 7 .52 .45 .03 .03 .06 .03 .04 (.01) (.06) (.01) (.04) $0.00 $0.10 $0.20 $0.30 $0.40 $0.50 $0.60 $0.70 1Q '07 Price Volumes Cost/Mix Pensacola / Maint. Outages Input & Distrib.Costs Cash Redeploy- ment Corporate / Other Divest. Tax 2Q '07 EPS $ / Share EPS $ / Share Corporate (0.02) Other (0.04) Packaging 0.03 Papers (0.01) xpedx 0 .01 P&C 0.02 Europe 0.02 Acquisitions 0.03 Shares 0.03 Interest (0.03) 2Q ‘07 vs. 1Q ’07 2Q ‘07 vs. 1Q ’07 EPS from cont. ops before special items EPS from cont. ops before special items 1Q07 Tax Rate 32% 2Q07 Tax Rate 29% |
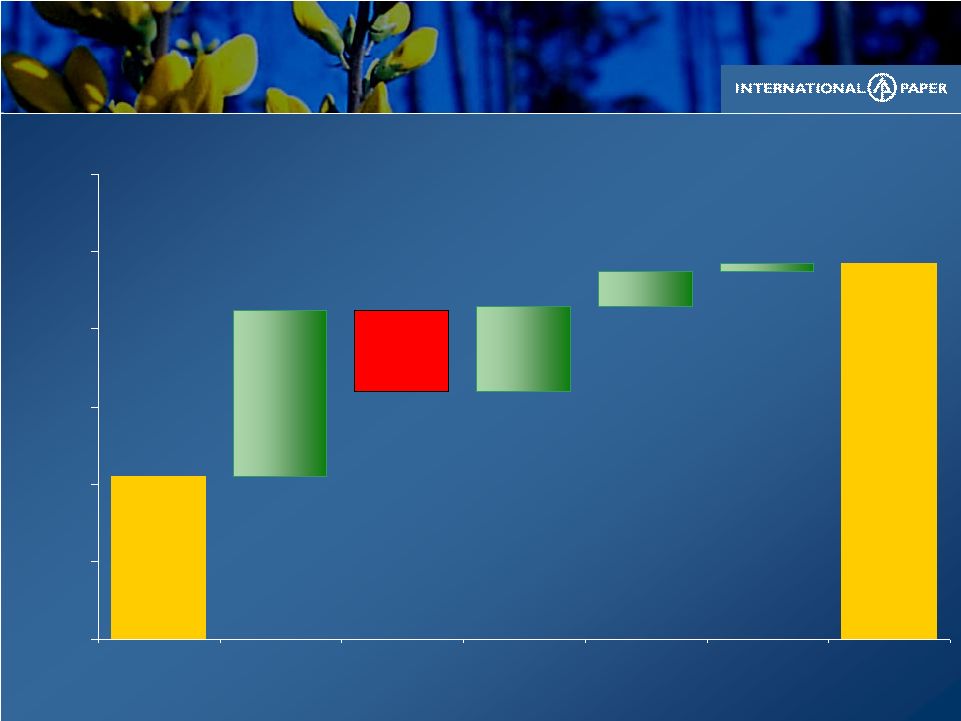
 Slide 8 .97 .42 .36 .05 .02 .21 .41 (.21) (.12) (.11) (.05) (.01) $0.00 $0.20 $0.40 $0.60 $0.80 $1.00 $1.20 $1.40 6M '06 Price Volume Cost/Mix Pensacola/ Maint. Outages Input & Distrib.Costs Land Sales Cash Redeployment Corporate / Other Divest. Tax 6M '07 EPS $ / Share EPS $ / Share IPG 0.11 Coated Paperboard 0.03 P&C 0.21 Europe 0.06 Wood (0.04) Energy 0.03 Chemicals (0.06) Freight (0.04) 6M‘07 vs. 6M’06 6M‘07 vs. 6M’06 EPS from cont. ops before special items EPS from cont. ops before special items 2007 Tax Rate 30% 2006 Tax Rate 32% Interest .22 Shares .09 Acquisitions .05 |
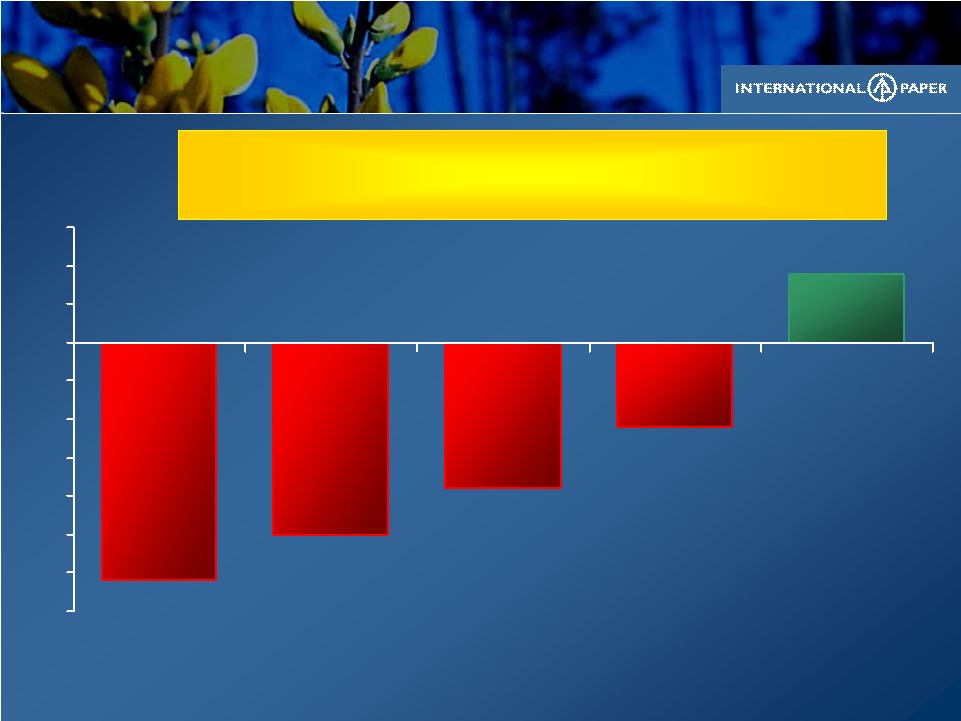 Slide 9 (11) (19) (31) 9 (25) (35) (30) (25) (20) (15) (10) (5) 0 5 10 15 Freight Chemicals Wood Non-US Energy $MM Higher Input & Distribution Costs Higher Input & Distribution Costs EBIT impact 6M’07 vs. 6M’06 EBIT impact 6M’07 vs. 6M’06 All costs include ongoing businesses Total of $77 million or $0.11 per share negative impact in 6M’07 versus 6M’06 |
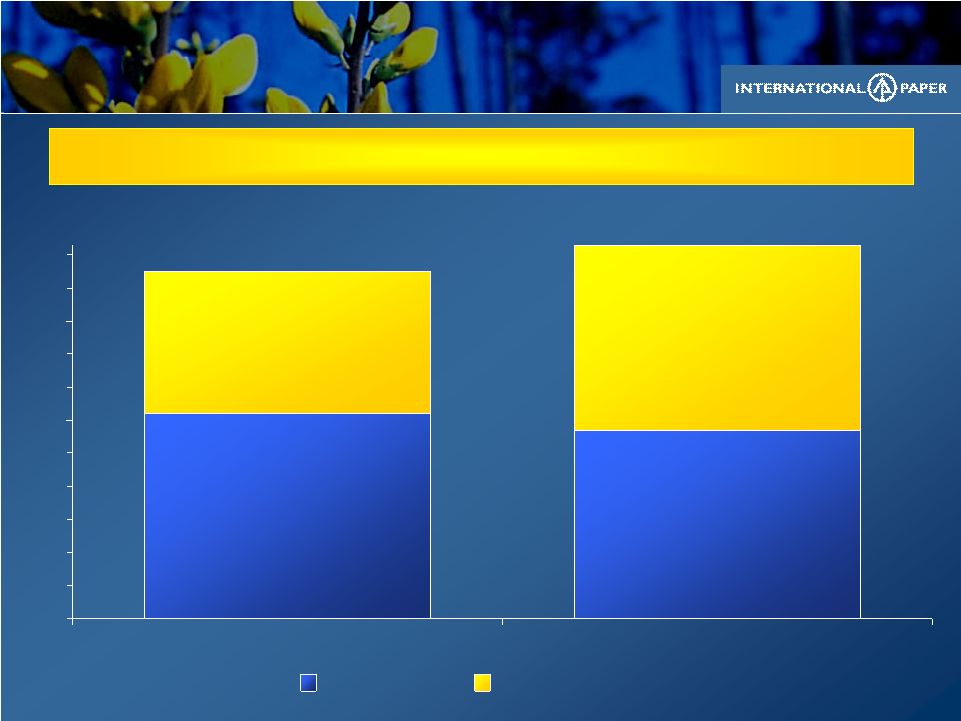
 Slide 10 Printing Papers $ 1,610 249 Sales Earnings 2Q’07 1Q’07 $ Millions Uncoated Pulp Europe (uncoated) Brazil (uncoated) $16 $9 €29 $27 Volume Realizations/ton $ 1,540 231 2Q’07 Change vs 1Q’07: (3%) (1%) (6%) 38% Average IP realization (includes the impact of mix across all grades) |
 Slide 11 300 100 275 240 25 23 20 3Q 4Q Depreciation & Amort. 2Q Operating Profit Improving Business in Brazil Improving Business in Brazil Avg. Monthly Run Rate Avg. Monthly Run Rate $MM Annualized Annualized EBITDA Run Rate Range ~375 - 400 |
 Slide 12 0 20 40 60 80 100 120 140 160 180 200 220 1Q07 2Q07 North America Brazil & Europe Uncoated Freesheet EBIT Growth Outside North America Uncoated Freesheet EBIT Growth Outside North America $ EBIT (MM) Increasing EBIT Outside North America |
 Slide 13 Industrial Packaging Average IP realization (includes the impact of mix across all grades) $ 1,315 139 Sales Earnings 2Q’07 1Q’07 $ Millions Containerboard U.S. Container $2 ($0.60) Volume Realizations/ton $ 1,235 103 2Q’07 Change vs 1Q’07: 17% 5% U.S. Container volumes and prices are reported in MSF |
 Slide 14 Industrial Packaging Q1 ‘07 vs. Q2 ‘07 Industrial Packaging Q1 ‘07 vs. Q2 ‘07 .17 .23 .02 .02 .05 (.03) $0.00 $0.05 $0.10 $0.15 $0.20 $0.25 $0.30 1Q '07 Volume Cost / Mix Maint. Outages Pensacola 2Q '07 EPS $ / Share EPS $ / Share Assumes constant tax rate and shares outstanding |
 Slide 15 Consumer Packaging Average IP realization (includes the impact of mix across all grades) $ 790 48 Sales Earnings 2Q’07 1Q’07 $ Millions Coated Paperboard $1 Volume Realizations/ton $ 750 61 2Q’07 Change vs 1Q’07: 3% Converting Businesses Sales Revenue 9% |
 Slide 16 Distribution $ 1,720 38 Sales Earnings 2Q’07 1Q’07 $ Millions $ 1,675 29 Record second quarter earnings; up 30% compared to first quarter 2007 Volume and margins up |
 Slide 17 Forest Products $ 90 98 Sales Earnings 2Q’07 1Q’07 $ Millions $ 85 100 |
 Slide 18 Special Items (net of tax) $(7) – Divestitures (16) – Restructuring / Corporate $(0.06) $(23) Total Special Items Discontinued Operations (net of tax) $(3) – Beverage Packaging (7) – Wood Products $(0.02) $(10) Total Discontinued Operations $MM $MM $/Share $/Share Special Items & Discontinued Operations – 2Q’07 |
 Slide 19 Earnings from Continuing Operations and Before Special Items $0.52 Special Items (0.06) Earnings from Continuing Operations 0.46 Discontinued Operations (0.02) Net Earnings $0.44 Reconciliation to 2Q’07 Diluted Earnings Per Share Diluted EPS Diluted EPS |
 Slide 20 Highlights Highlights Margin Expansion Record second quarter profit for Europe, xpedx, and Foodservice Conversion of Pensacola Mill Strength of global footprint Transformation plan on track Second Quarter 2007 Second Quarter 2007 |
 Slide 21 .97 .42 .02 .09 .22 .43 (.21) $0.00 $0.20 $0.40 $0.60 $0.80 $1.00 $1.20 6M '06 Core Business EBIT Divestitures* Interest Shares Tax 6M '07 EPS $ / Share EPS $ / Share Earnings Improvement Transformation Plan on Track Earnings Improvement Transformation Plan on Track * Includes Forest divestiture, Coated Papers and Arizona Chemical |
 Slide 22 Third Quarter 2007 Outlook Third Quarter 2007 Outlook Volumes steady Prices – modest improvement Continued progress in improving operations Input costs slightly higher Lower maintenance outage expenses Pensacola Conversion Expenses Forest Resources earnings higher than second quarter 2007 |
 Slide 23 IP / Ilim JV Update IP / Ilim JV Update Ilim’s EBITDA improved significantly Expecting lower EV/EBITDA multiple Expect to make decision soon |
 Slide 24 2007 Priorities 2007 Priorities Improve Existing Businesses Deliver value from Selective Reinvestments – Luiz Antonio – IP/Sun JV Return Value to Shareholders – Dutch Tender $1.4 Billion – Open market $1.1 Billion Building on a Solid Second Quarter 2007 G G G |
 Slide 25 Q & A Investor Relations Contacts Brian McDonald 901-419-4957 Ann-Marie Donaldson 901-419-4967 Media Contact Amy Sawyer 901-419-4312 |
 Slide 26 Appendix |
 Slide 27 29% $746 MM $156 MM $521 MM $1.1 B $1.1 B 2006 1 Effective Tax Rate² Corporate Items Supply Chain Expense Net Interest Expense Depreciation & Amort. Capital Spending 20% $607 MM $135 MM $595 MM $1.2 B $1.1 B 2005 1 30-31% $675–725 MM $200 MM $310 MM $1.1-1.2 B $1.1-1.2 B 2007 Est. 1 Excludes discontinued operations results and Coated Papers 2 Before special items Key Financial Statistics Key Financial Statistics Updated as of August 2, 2007 Updated as of August 2, 2007 |
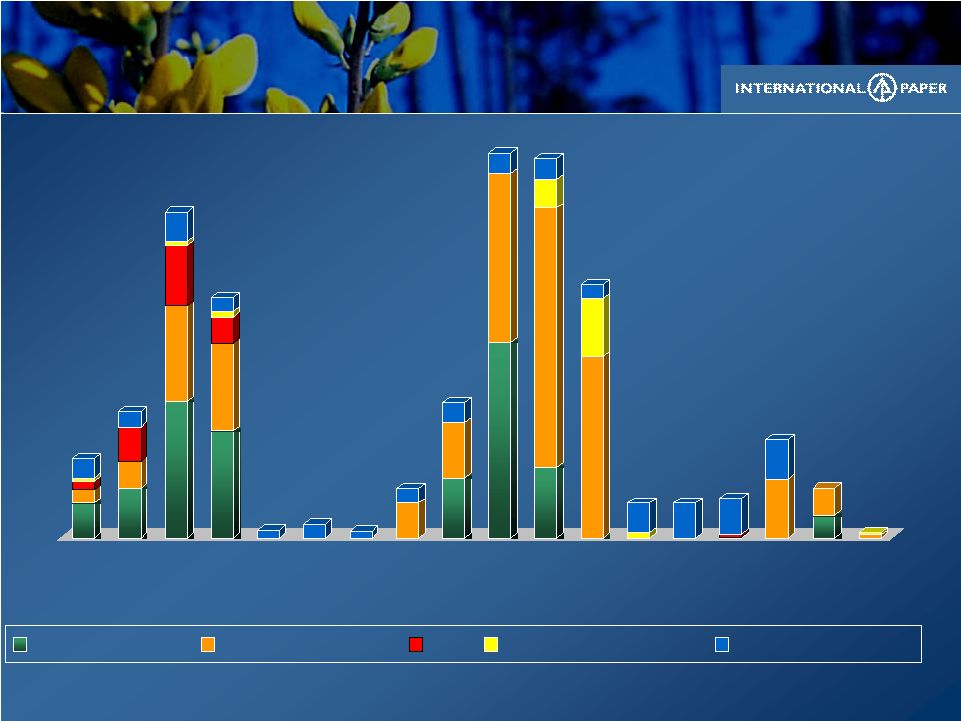 Slide 28 *Includes indefinitely closed uncoated papers capacity at Pensacola, FL, Bastrop, LA and Jay, ME in 2Q05 (72,000 tons), 3Q05 (108,000 tons) and 4Q’05 (108,000 tons) which we permanently closed at end of 4Q’05. Lack of Order Downtime Lack of Order Downtime 59 90 236 173 5 10 5 35 95 M Short Tons 2003 2004 2005 274* 270* 180* 25 2006 25 28 70 2007 35 4 1Q 2Q 3Q 4Q 1Q 2Q 3Q 4Q 1Q 2Q 3Q 4Q 1Q 2Q 3Q 4Q 1Q 2Q Containerboard Uncoated Papers Pulp Coated Paperboard European Papers |
 Slide 29 8 (1) (11) 5 (9) (15) (10) (5) 0 5 10 Chemicals Energy Non-US Wood Freight $MM Total of $8 million or $0.01 per share negative impact in 2Q’07 versus 1Q’07 Raw Material & Distribution Costs Raw Material & Distribution Costs All costs include ongoing businesses EBIT impact 2Q’07 vs. 1Q’07 EBIT impact 2Q’07 vs. 1Q’07 |
 Slide 30 30 7 10 13 3Q’07 Forecast vs. 2Q’07 Actual $(MM) Total Impact Consumer Packaging Industrial Packaging Printing Papers 80,000 6,000 22,000 52,000 Maintenance Outage (tons) Maintenance outages and dollar impacts are estimated and are subject to change. Q3’07 Maintenance Outages Q3’07 Maintenance Outages |
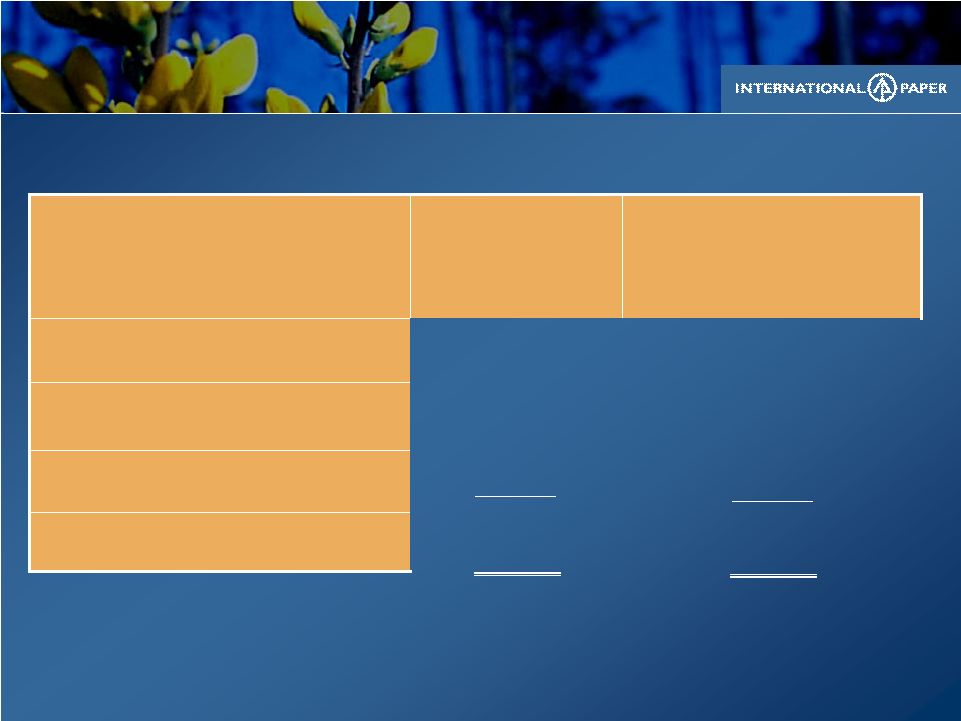
 Slide 31 Earnings by Industry Segment Earnings by Industry Segment Earnings by Industry Segment Printing Papers $249 $231 $209 Industrial Packaging 139 103 86 Consumer Packaging 48 61 44 Distribution 38 29 36 Forest Products 98 100 160 Other Businesses - 6 17 Operating Profit 572 530 552 Interest Expense, net (80) (63) (148) Minority Interest 6 5 2 Corporate Items, net (179) (164) (179) Earnings from continuing operations before income taxes, minority interest & special items $319 $308 $227 $ Millions 1Q’07 2Q’06 2Q’07 Before special items Before special items *Industry segment information has been reclassified to conform with minor changes in 2006 organizational structure |
 Slide 32 Before Special Items Q1 308 (99) (6) 203 32% 448.4 0.45 Q2 319 (91) (5) 223 29% 431.2 0.52 Special Items Q1 298 (44) 0 254 15% 448.4 0.57 Q2 (25) 2 0 (23) 8% 431.2 (0.06) Earnings from Continuing Operations Q1 606 (143) (6) 457 24% 448.4 1.02 Q2 294 (89) (5) 200 30% 431.2 0.46 2007 Earnings from Continuing Operations 2007 Earnings from Continuing Operations Pre-Tax Tax MI Net ETR Average Diluted Shares¹ EPS² $ MM MM Shares $/Share $ MM $ MM $ MM MI – Minority Interest; Net – Net Income; ETR – Effective Tax Rate; EPS – Earnings per Share 1 Assuming dilution 2 A reconciliation to GAAP EPS is available at www.internationalpaper.com under the Investors tab at presentations |
 Slide 33 * U.S. only Average IP realization (includes the impact of mix across all grades) Average Sales Realizations Packaging Printing Papers ($/ton) Segments* 62 511 577 888 1Q’07 Average Sales Realizations 60 489 525 862 2Q’06 61 514 593 912 Jun 07 Corrugated boxes ($/MSF) Containerboard ($/ton) Pulp Uncoated 61 513 586 904 2Q’07 61 454 510 817 Jun 06 |
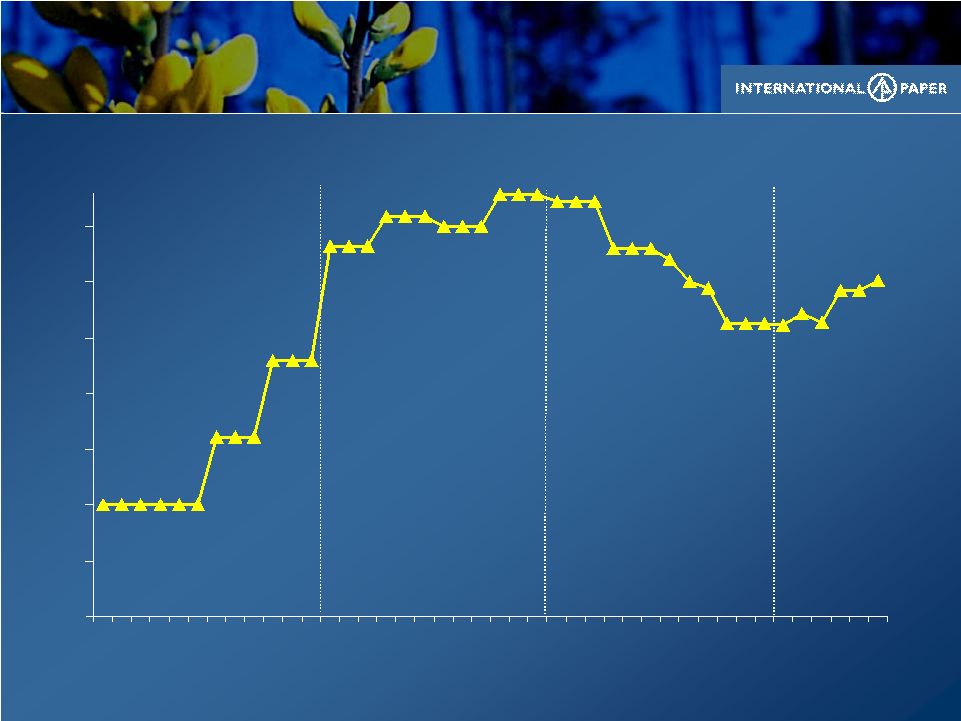
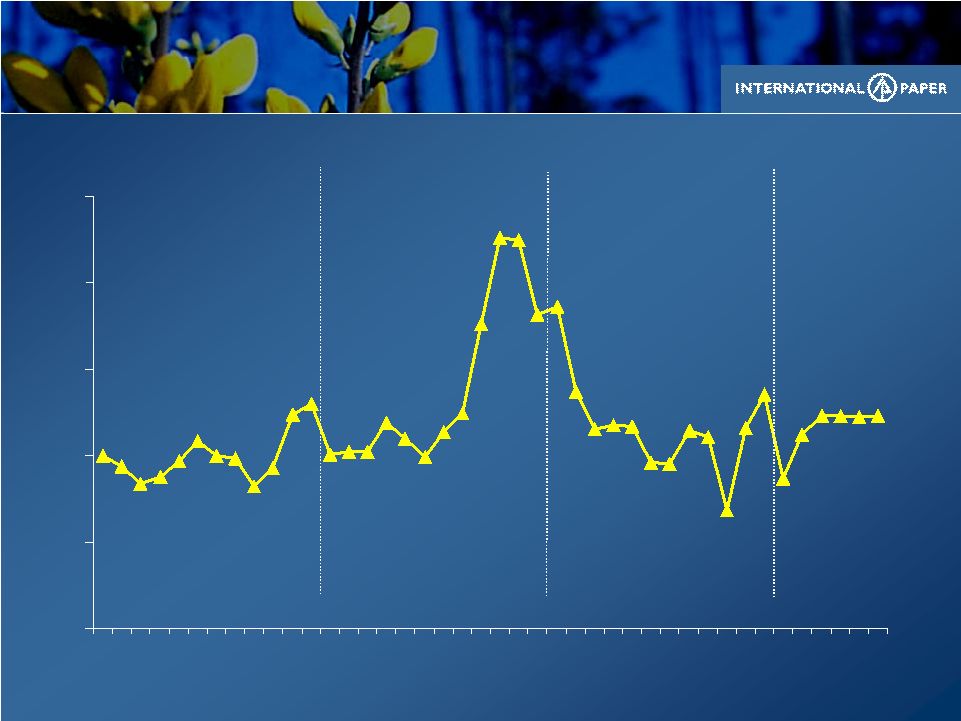 Slide 34 0 50 100 150 200 250 Jan Apr July Oct Jan Apr July Oct Jan Apr July Oct Jan Apr 2004 2005 2006 2007 Natural Gas Costs * NYMEX Natural Gas closing prices Index: Jan 2004 Natural Gas Costs = 100 |
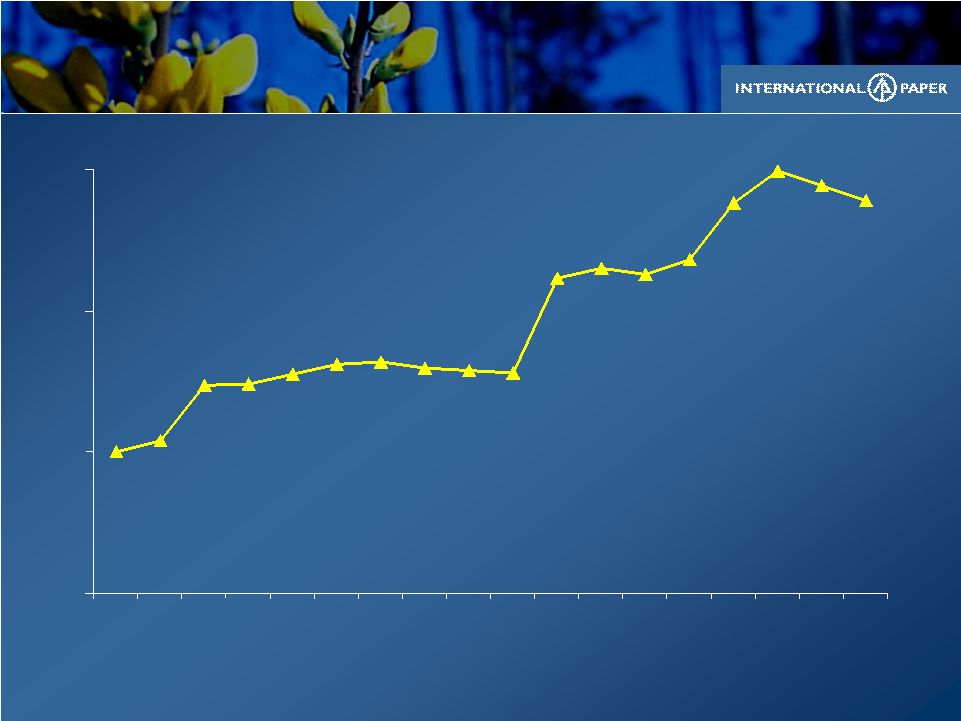
 Slide 35 90 95 100 105 Jan Apr July Oct Jan Apr July Oct Jan Apr July Oct Jan Apr U.S. Mill Wood Costs U.S. Mill Wood Costs Index: Jan 2004 Wood Costs = 100 2004 2005 * Delivered cost to U.S. pulp & paper ongoing mills 2006 2007 |
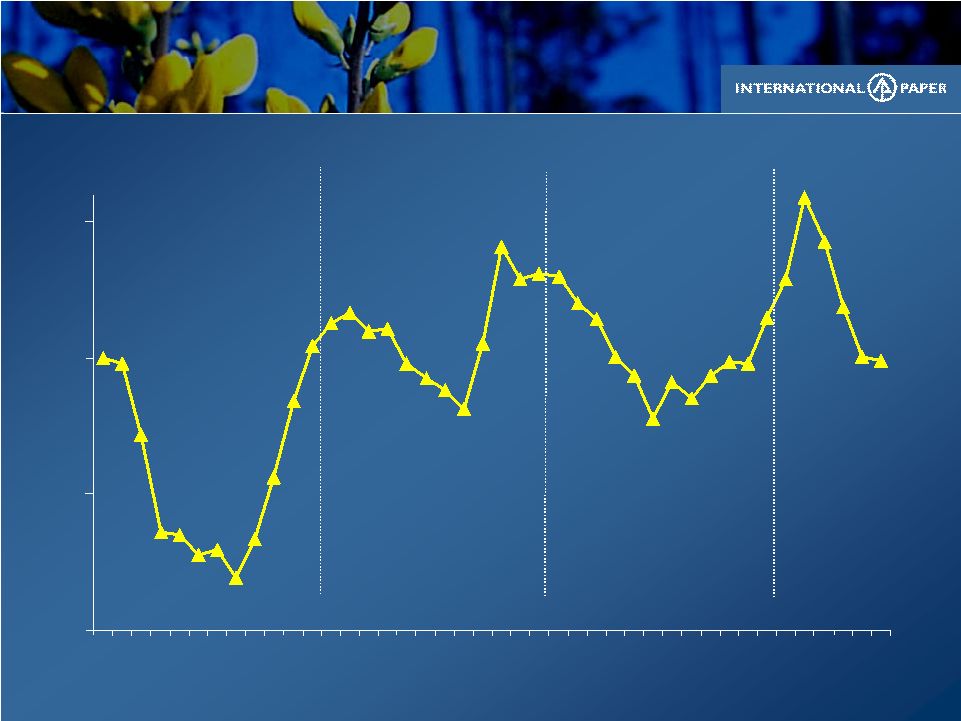
 Slide 36 0 50 100 150 200 250 300 350 Jan Apr Jul Oct Jan Apr Jul Oct Jan Apr Jul Oct Jan Apr 2004 2005 2006 2007 Caustic Soda Costs Index: Jan 2004 Caustic Soda Costs = 100 * Delivered cost to U.S. facilities |
 Slide 37 50 100 150 200 Jan Feb Mar Apr May Jun Jul Aug Sep Oct Nov Dec Jan Feb Mar Apr May Jun 2006 2007 Corn Starch Costs Index: Jan 2006 Corn Starch Costs = 100 * Delivered cost to U.S. facilities |
 Slide 38 Global Consumption Global Consumption Key input indicative annual purchase levels¹ Key input indicative annual purchase levels¹ Natural Gas MMbtu 28,000,000 14,000,000 # 6 Fuel Oil BBL 4,100,000 400,000 Coal Tons 1,300,000 230,000 Wood Tons 40,000,000 8,200,000 OCC³ Tons 600,000 313,000 Caustic Soda Tons 340,000 55,000 Sodium Chlorate Tons 215,000 49,000 LD Polyethylene Tons 40,000 - Latex Tons 24,000 4,000 Energy Fiber Chemicals Units U.S.² Non- U.S. 1 2007 Run Rate estimates 2 Only includes ongoing businesses 3 Old corrugated containers |
 Slide 39 |