 Second Quarter 2008 Review July 31, 2008 Second Quarter 2008 Review July 31, 2008 Tim S. Nicholls Senior Vice President & Chief Financial Officer John V. Faraci Chairman & Chief Executive Officer Exhibit 99.2 |
 2 Forward-Looking Statements Forward-Looking Statements These slides and statements made during this presentation contain forward-looking statements. These statements reflect management's current views and are subject to risks and uncertainties that could cause actual results to differ materially from those expressed or implied in these statements. Factors which could cause actual results to differ relate to: (i) the company's ability to realize anticipated profit improvement from its transformation plan, including our ability to realize the expected benefits of our acquisition of the assets of Weyerhaeuser Company’s containerboard, packaging and recycling business in light of integration difficulties and other challenges; (ii) increases in interest rates and our ability to meet our debt service obligations; (iii) industry conditions, including but not limited to changes in the cost or availability of raw materials and energy, transportation costs, competition we face, the company's product mix, demand and pricing for its products; (iv) global economic conditions and political changes, including but not limited to changes in currency exchange rates, credit availability, the company's credit ratings issued by recognized credit rating organizations and pension and health care costs; (v) unanticipated expenditures related to the cost of compliance with environmental and other governmental regulations and to actual or potential litigation; and (vi) whether we experience a material disruption at one of our manufacturing facilities. We undertake no obligation to publicly update any forward-looking statements, whether as a result of new information, future events or otherwise. These and other factors that could cause or contribute to actual results differing materially from such forward looking statements are discussed in greater detail in the company's Securities and Exchange Commission filings. |
 3 Statements Relating to Non-GAAP Financial Measures Statements Relating to Non-GAAP Financial Measures During the course of this presentation, certain non-U.S. GAAP financial information will be presented. A reconciliation of those numbers to U.S. GAAP financial measures is available on the company’s website at internationalpaper.com under Investors. |
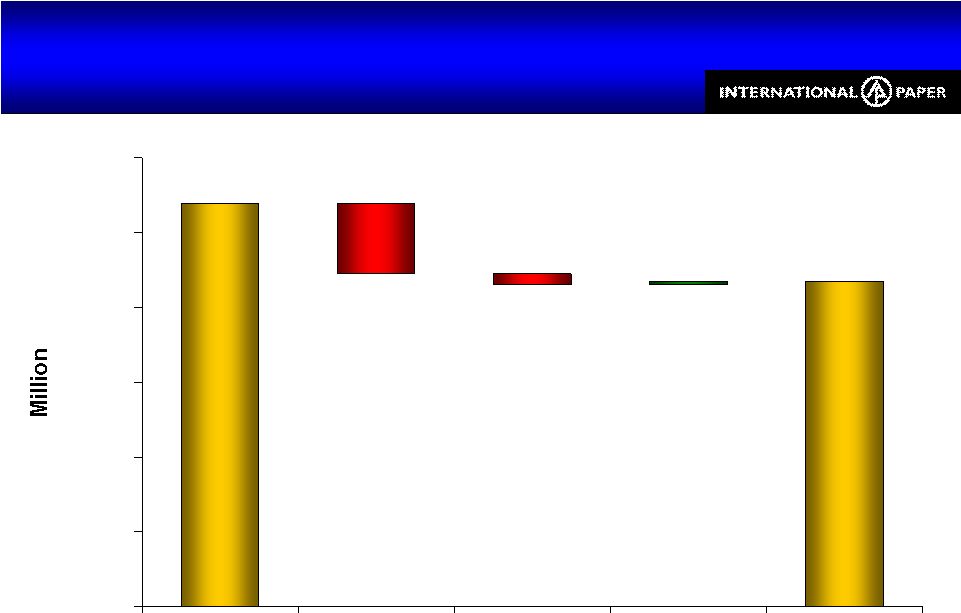
 4 Second Quarter 2008 Results Summary EPS up 8% vs. 2Q07 Second Quarter 2008 Results Summary EPS up 8% vs. 2Q07 Input costs escalated EPS excluding land sales up 35% vs. 2Q07 Prices improved Reduced mill operating costs Benefited from global balance $0.37 $0.37 $0.50 $0.15 $0.04 $0.06 2Q07 1Q08 2Q08 Forest Products EPS Operating Business EPS $0.52 $0.41 $0.56 Earnings from continuing operations before special items |
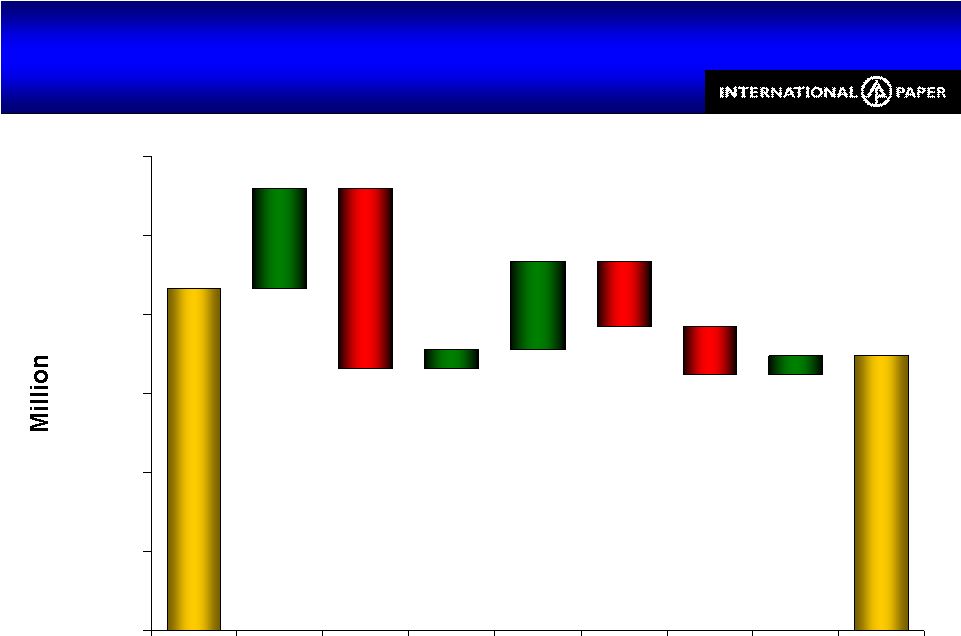
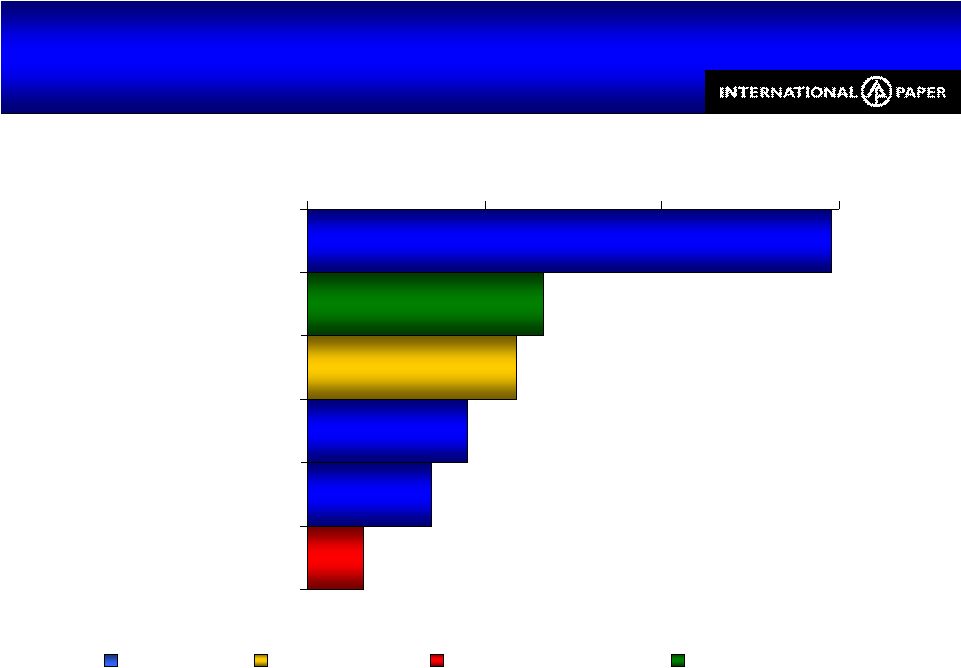
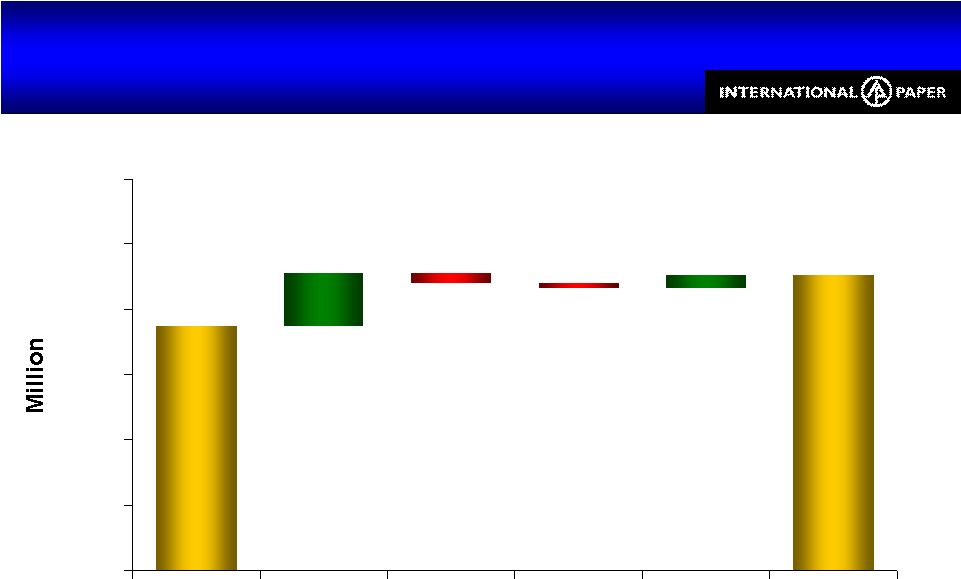
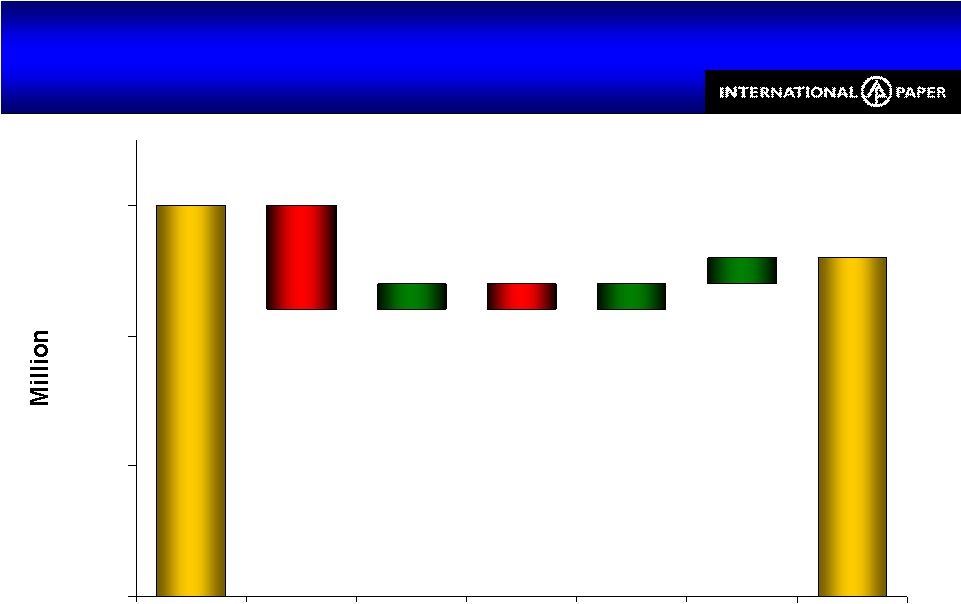
 5 Diluted EPS from Continuing Operations before Special Items Best nd -Quarter Results since 2000 Diluted EPS from Continuing Operations before Special Items Best nd -Quarter Results since 2000 2008 2 2 2004 2005 2006 2007 2003 2002 .10 .27 .26 .11 .15 .11 .03 .02 .16 .30 .34 .27 .04 .12 .30 .47 .41 .56 .20 .17 .26 .52 .45 .57 .45 .69 A reconciliation to GAAP EPS is available at www.internationalpaper.com under the Investors tab at presentations |
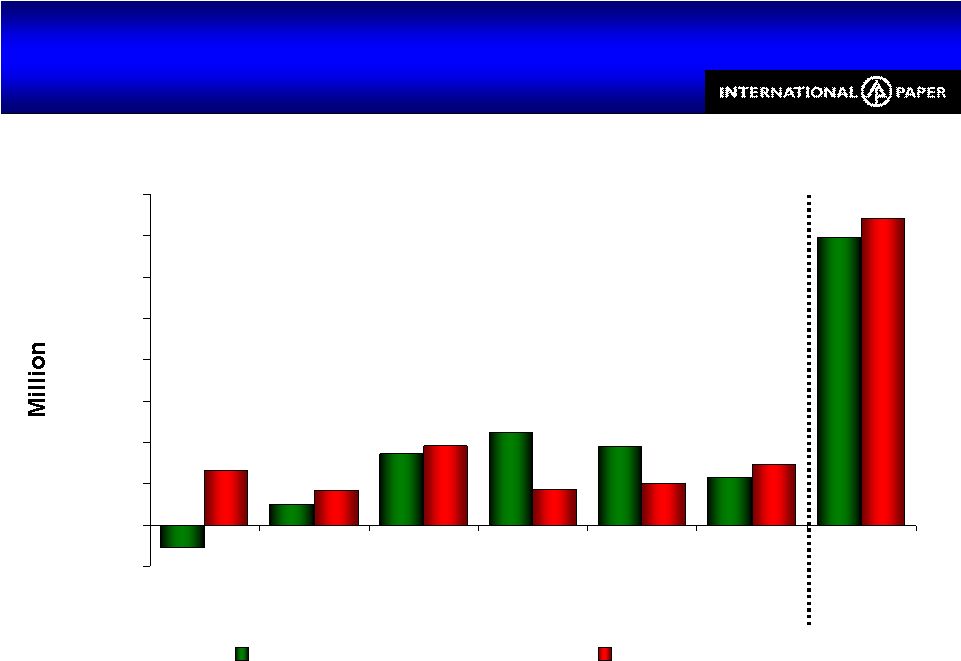
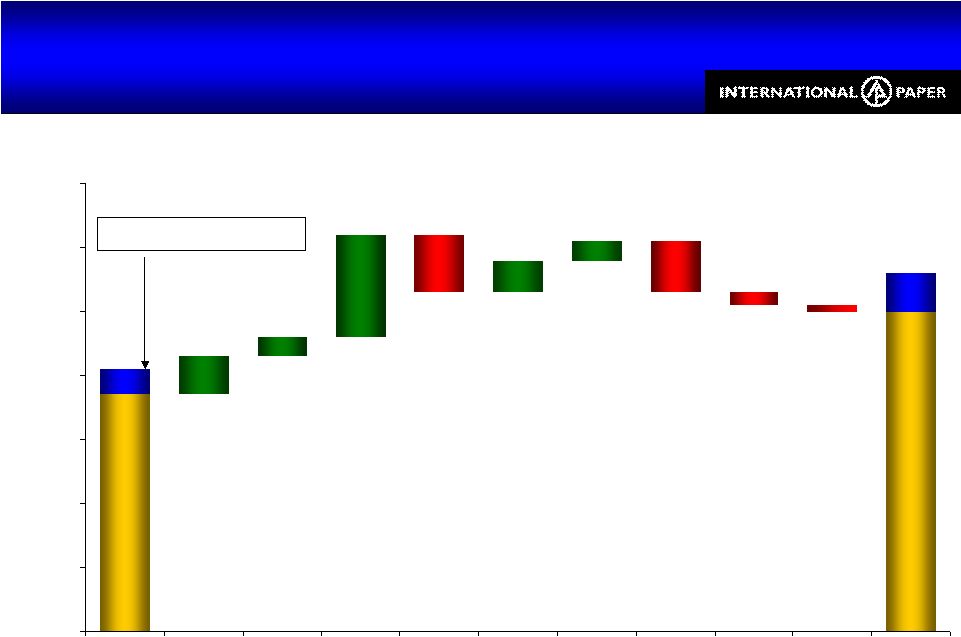
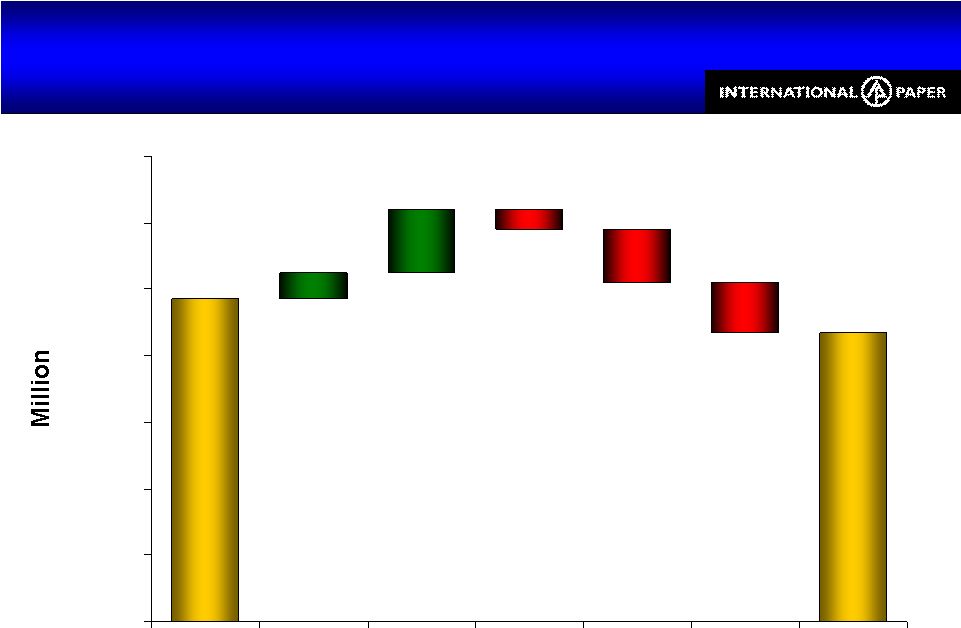
 6 (.03) .52 .50 .08 .24 .14 .06 .08 (.02) (.34) (.02) $0.00 $0.10 $0.20 $0.30 $0.40 $0.50 $0.60 $0.70 $0.80 2Q07 Price Volume Cost / Mix Materials & Freight Corporate / Other Ilim Vicksburg Tax 2Q08 $ / Share $ / Share IPG .05 CPG .03 P&C .12 Europe .04 Fiber (.07) Chemicals (.09) Energy (.12) Freight (.06) Cost / Mix .16 Outages (.02) 2Q08 vs. 2Q07 EPS Higher Costs, Higher Prices, Lower Forest Products Earnings 2Q08 vs. 2Q07 EPS Higher Costs, Higher Prices, Lower Forest Products Earnings .37 .15 Earnings from continuing operations before special items Forest Products Earnings .56 2Q08 33% 2Q07 29% |
 7 Global Sales Revenues 2Q08 vs. 2Q07 Global Sales Revenues 2Q08 vs. 2Q07 15% 11% 12% 7% 10% xpedx includes the addition of Central Lewmar revenues in 2Q08 *Includes Forest Products and inter-segment sales eliminations $0 $1,000 $2,000 $3,000 $4,000 $5,000 $6,000 xpedx Printing Papers Industrial Packaging Consumer Packaging Cumulative* 2Q07 2Q08 |
 8 (43) (40) (57) (71) ($80) ($60) ($40) ($20) $0 Energy Chemicals Fiber Freight North America Outside North America Increasing Global Input & Freight Costs $211MM, or $0.34/Share Impact vs. 2Q07 Increasing Global Input & Freight Costs $211MM, or $0.34/Share Impact vs. 2Q07 Input costs for continuing businesses Percentage change reflects estimated North American input cost increases N.A. 34% 17% 9% 34% |
 9 ($200) $0 $200 $400 $600 $800 $1,000 $1,200 $1,400 $1,600 2003 vs. 2002 2004 vs. 2003 2005 vs. 2004 2006 vs. 2005 2007 vs. 2006 6M08 vs. 6M07 Cumulative Price Increases / Decreases Input Cost Increases Recovering North American Input Cost Increases Increasing Prices to Recover Costs Recovering North American Input Cost Increases Increasing Prices to Recover Costs North American Papers & Packaging |
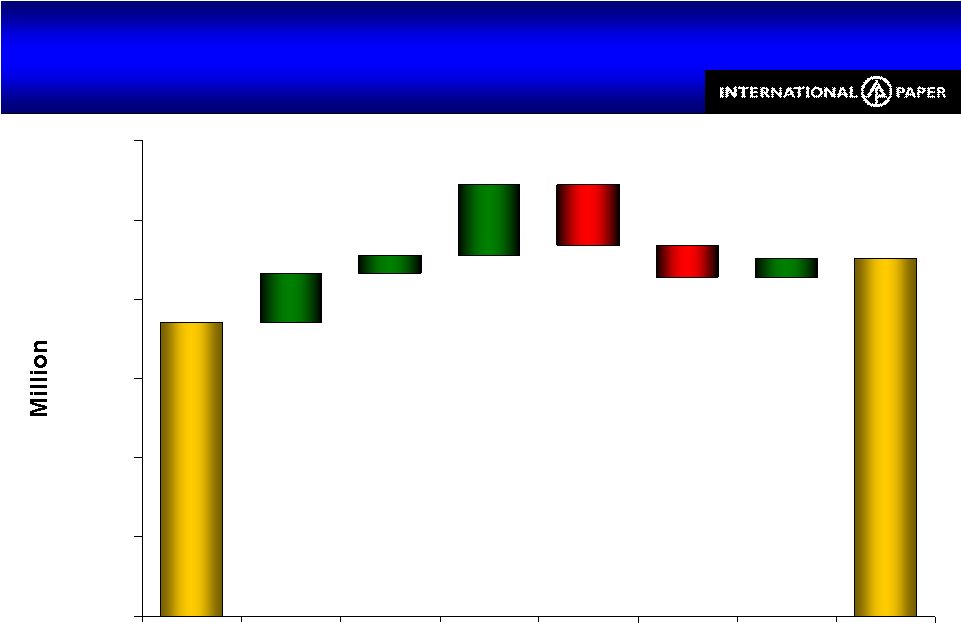
 10 Printing Papers Earnings $38 Million Increase Printing Papers Earnings $38 Million Increase 226 188 8 95 3 51 (119) $0 $50 $100 $150 $200 $250 $300 2Q07 Price Materials & Freight Volume Cost / Mix Outages 2Q08 |
 11 Average IP price realization (includes the impact of mix across all grades) $22 €18 $65 $84 Price/ton 6% 5% 18% (8%) Volume 2Q08 vs. 2Q07 Price/ton 2Q08 vs. 1Q08 0% 0% 22% (4%) Volume $10 Brazilian Uncoated Papers €3 European Uncoated Papers $5 U.S. Pulp $38 N.A. Uncoated Papers Business $226 $1,790 2Q08 $185 $1,715 1Q08 $188 $1,610 2Q07 Earnings Sales $ Million Printing Papers Margin Expansion Printing Papers Margin Expansion |
 12 108 87 28 6 6 32 (21) (15) (57) $0 $25 $50 $75 $100 $125 $150 2Q07 Price Materials & Freight Volume* Cost / Mix Outages Vicksburg Other 2Q08 Industrial Packaging Earnings Cost Inflation Exceeded Price Increases Industrial Packaging Earnings Cost Inflation Exceeded Price Increases *Excludes trade volume |
 13 €48 $60 $43 Price / Ton (3%) (1%) 8% Volume 2Q08 vs. 2Q07 €5 (3%) European Container 2Q08 vs. 1Q08 2% (2%) Volume $5 N.A. Container $2 N.A. Containerboard Price / Ton Business $87 $1,470 2Q08 $97 $1,445 1Q08 $108 $1,315 2Q07 Earnings Sales $ Million Industrial Packaging U.S. Margins Under Pressure Industrial Packaging U.S. Margins Under Pressure Average IP price realization (includes the impact of mix across all grades) |
 14 26 30 5 12 (1) (38) 18 $0 $10 $20 $30 $40 $50 2Q07 Price Materials & Freight Volume Cost / Mix Other 2Q08* Consumer Packaging Earnings Cost Inflation Exceeded Price Increases Consumer Packaging Earnings Cost Inflation Exceeded Price Increases *Excludes a special item of ($13) million related to the reorganization of Shorewood’s Canadian operations |
 15 Average IP price realization (includes the impact of mix across all grades) 1 Excludes a special item of ($5) and ($13) million in 1Q08 and 2Q08, respectively, related to the reorganization of Shorewood’s Canadian operations NA Price $44 Price/Ton 2% Revenue 1% Volume 2Q08 vs. 2Q07 Price Revenue Business 2Q08 vs. 1Q08 7% 0% Volume NA Converting Businesses $15 U.S. Coated Paperboard Price/Ton Business $795 2Q08 $770 1Q08 $30 $745 2Q07 Earnings Sales $ Million Consumer Packaging Margins Under Pressure Consumer Packaging Margins Under Pressure $26 1 $14 1 |
 16 $21 $19 $15 Fuel & Freight $26 $1,970 2Q08 $16 $1,985 1Q08 $30 $1,720 2Q07 Earnings Sales $ Million xpedx Focus on Cost Reduction xpedx Focus on Cost Reduction Weak demand for commercial printing and packaging Growth from price increases and national accounts Benefiting from cost reductions Offset by fuel costs despite fewer miles & deliveries |
 17 xpedx Product Diversity Overcoming Market Conditions xpedx Product Diversity Overcoming Market Conditions Revenue dollars and growth percentages are based on 6M08 vs. 6M07 results $0 $1 $2 $3 Merchant Printing National Accounts Merchant Packaging Central Lewmar Publishing Saalfeld Billions Printing Packaging Facility Supplies All Segments 6% 0% 2% 6% 22% 12% |
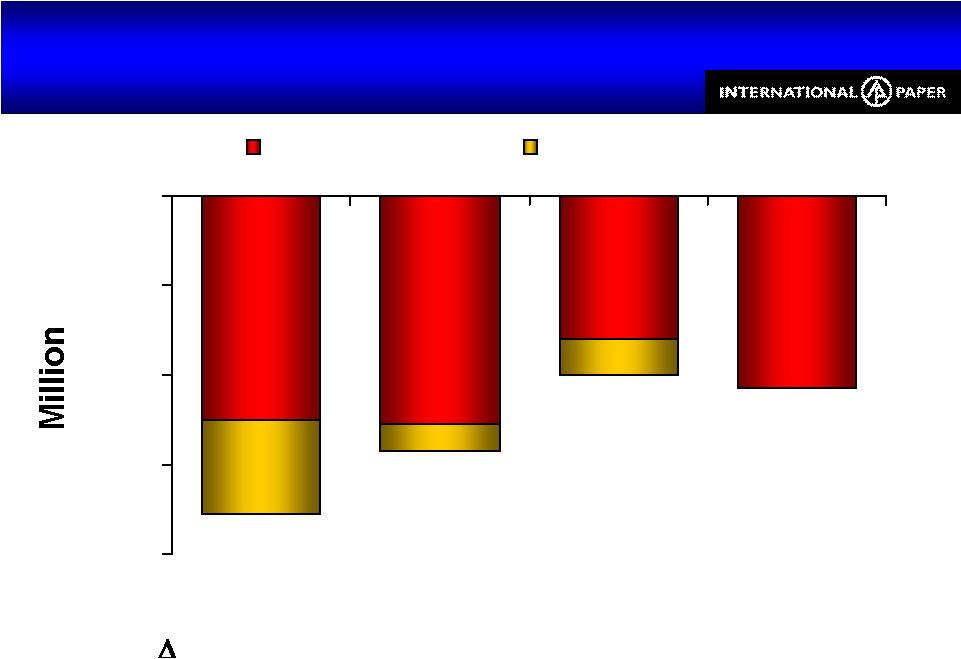
 18 Forest Products Focusing on Maximizing Value Forest Products Focusing on Maximizing Value 30,000 13,000 37,000 Acres Sold $1,872 $1,871 $2,144 Price / Acre $41 $55 2Q08 $25 $25 1Q08 $94 $90 2Q07 Earnings Sales ($ Million) ($ Million) |
 19 $15 $415 6M08 $10 $315 6M07 Earnings Sales $ Million Asia Building New Capabilities Asia Building New Capabilities This slide includes the Asian business segments in Printing Papers, Industrial Packaging, and Consumer Packaging as well as Asian sales and operating profits reported in Foodservice and Shorewood results Strong sales and earnings growth High demand growth for board and boxes Focus on domestic consumption |
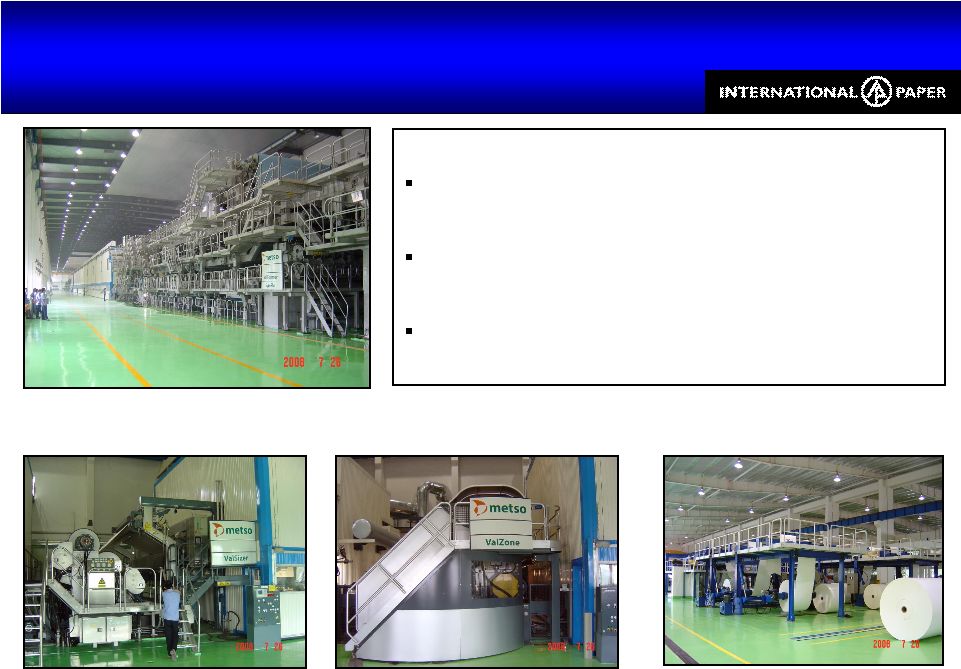 20 Asia World-Class Assets, Low Capital Costs Asia World-Class Assets, Low Capital Costs Heated Belt Calender Forming Section Film Size Press Start-up of 420,000-ton Sun joint venture coated board machine Chinese cartonboard demand growing at 7% annually Box plant and folding carton plant start ups Folio Sheeter |
 21 IP’s share of Ilim’s 1Q08 earnings include a $14 million after-tax foreign exchange gain and a $3 million after-tax charge to write off a share repurchase option 1Q08 vs. 4Q07 2% 0% Volume (000 Metric Tons) $13 Containerboard $42 Pulp Price / Ton Business $32 $555 1Q08 $17 $529 4Q07 Earnings (IP Share) Sales (100%) $ Million Ilim Joint Venture 1Q08 Results IP’s After-Tax Share: $32MM or $0.08 EPS Ilim Joint Venture 1Q08 Results IP’s After-Tax Share: $32MM or $0.08 EPS |
 22 Ilim Joint Venture Sale of KPK Mill Ilim Joint Venture Sale of KPK Mill Ilim Holding S. A. signed an agreement to sell its 56% interest in the KPK recycled paperboard mill to Knauf, its joint venture partner in this mill After the transaction has been completed, Knauf will own the 220,000-TPY mill The transaction is expected to close in 3Q08 After the divestiture, Ilim will continue to focus on its market pulp, industrial packaging, and paper businesses |
 23 Free Cash Flow Improvement Free Cash Flow Improvement $309 ($267) $576 2Q08 $528 ($482) $1,010 6M08 $93 ($299) $392 2Q07 $219 Free Cash Flow ($215) Less Capital Investment $434 Cash Provided by Continuing Operations 1Q08 Free Cash Flow ($ Million) |
 24 (132) (103) (80) (63) ($150) ($125) ($100) ($75) ($50) ($25) $0 Energy Chemicals Fiber Freight North America Outside North America Increasing Global Input & Freight Costs $378MM, or $0.60/Share Impact vs. 6M07 Increasing Global Input & Freight Costs $378MM, or $0.60/Share Impact vs. 6M07 Input costs for continuing businesses Percentage change reflects North American input costs N.A. 28% 13% 6% 30% |
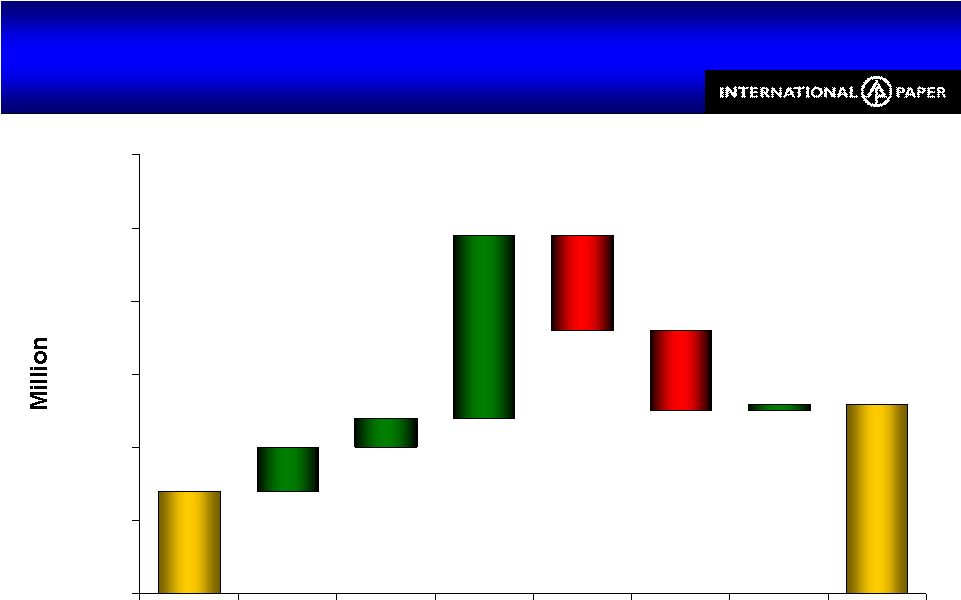
 25 $ / Share $ / Share 6M08 vs. 6M07 EPS Higher Costs, Higher Prices, Lower Forest Products Earnings 6M08 vs. 6M07 EPS Higher Costs, Higher Prices, Lower Forest Products Earnings .07 Earnings from continuing operations before special items IPG .10 CPG .05 P&C .22 Europe .08 Fiber (.13) Chemicals (.16) Energy (.21) Freight (.10) Cost / Mix .17 Outages .02 Forest Products Earnings 2008A 32% 2007A 30% .97 .97 .66 .86 .45 .19 .11 .09 .04 (.01) (.02) (.60) (.03) (.02) .31 .11 $0.00 $0.20 $0.40 $0.60 $0.80 $1.00 $1.20 $1.40 6M07 Price Volume Cost / Mix Vicksburg Materials & Freight Interest Ilim Corporate / Other Tax Shares 6M08 |
 26 Weyerhaeuser CBPR Acquisition Update Weyerhaeuser CBPR Acquisition Update On schedule for August close Management team in place Expecting more merger benefits at faster pace Expect acquisition to be cash positive in 2008 |
 27 Weyerhaeuser CBPR Acquisition Update Financing in Place Weyerhaeuser CBPR Acquisition Update Financing in Place Original Financing Plan $2 Billion 5-Year Term Loan $2.5 Billion 5-Year Term Loan $4 Billion 18-Month Bridge Loan $3.0 Billion Bond Offering $0.5 Billion Cash & Short-Term Debt Current Financing |
 28 Weyerhaeuser CBPR Acquisition Key Financial Statistics Weyerhaeuser CBPR Acquisition Key Financial Statistics $50 million in 2008 merger benefits $80 million one-time costs in 2008 – Establish data center and IT systems – Severance and relocation expenses – Transition costs $35 million one-time, non-cash charge in 3Q08 due to the write up of inventory in connection with the asset purchase $160 - $180 million in 2008 incremental interest expense Also targeting $150 - $200 million in incremental IP overhead reduction by 2010 |
 29 3Q08 Outlook Changes from 2Q08 3Q08 Outlook Changes from 2Q08 Increase Increase Input & Freight Costs Ex-North America North America Steady Slight Increase Flat Slight Increase Under Pressure Improving Steady Operations Volume Pricing Flat Packaging Improving Paper Decrease Maintenance Outages Flat Improving Paper Packaging |
 30 2008 Forest Products Earnings 2008 Forest Products Earnings Signed agreement to sell mineral rights in northwest Louisiana for $263 million Expect transaction to close in 3Q08 At end of 2Q08, portfolio includes 270,000 acres of land and mineral rights with an NPV of $675 million to $775 million Expect 2008 Forest Products earnings of $350 million to $400 million |
 31 Summary 2Q08 Solid Results in Tough Market Conditions Summary 2Q08 Solid Results in Tough Market Conditions • 8% year-over-year earnings increase • $0.34 per share of increased input costs • Announced price increases to recover costs • Reduced mill operating costs • Benefit of global operations |
 32 Questions & Answers Questions & Answers Investor Relations Contacts Thomas A. Cleves 901-419-7566 Ann-Marie Donaldson 901-419-4967 Emily Nix 901-419-4987 Media Contact Patty Neuhoff 901-419-4052 |
 33 Appendix |
 34 Special Items & Discontinued Operations 2Q08 Special Items & Discontinued Operations 2Q08 $0.00 ($1) Total Discontinued Operations $0.54 $227 Net Earnings $0.56 $235 Earnings from Continuing Operations & Before Special Items Special Items Earnings per Share $ Million ($9) Shorewood Canadian Reorganization $2 Adjustment to Gain on Sale of Forestlands ($0.02) ($7) Total Special Items $0.54 $228 Earnings from Continuing Operations |
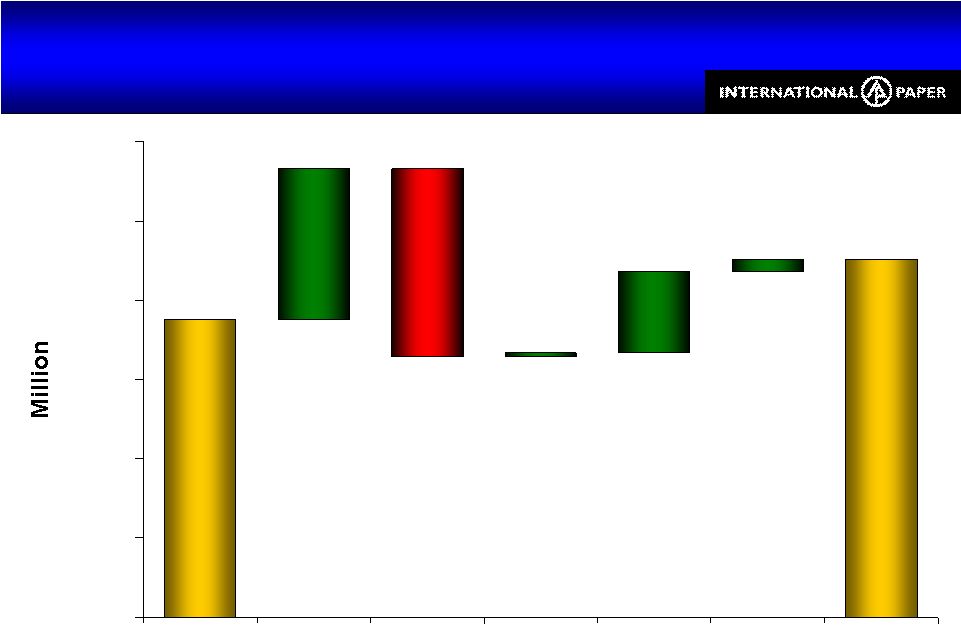
 35 $0 $24 $9 $0 Europe $19 $28 $41 $28 North America $63 $8 $3 $52 3Q08E $103 $13 $40 $50 2Q08 $43 $13 $11 $19 4Q08E Total Impact Consumer Packaging Industrial Packaging Printing Papers Total $ Millions $53 $1 $24 $28 1Q08 Dollar impact of planned maintenance outages are estimates and subject to change Planned Maintenance Outages Planned Maintenance Outages |
 36 Operating Profits by Industry Segment from Continuing Operations before Special Items Operating Profits by Industry Segment from Continuing Operations before Special Items $302 $198 $294 Earnings from continuing operations before income taxes, equity earnings & minority interest $32 $17 $0 Equity Earnings, net of taxes - Ilim ($21) ($21) ($57) Corporate Items ($25) $6 ($80) $450 $0 $94 $30 $30 $108 $188 2Q07 ($10) $8 ($81) $406 $0 $41 $26 $26 $87 $226 2Q08 ($41) Special Items $0 Other Businesses $337 Operating Profit ($81) Net Interest Expense $4 Minority Interest / Equity Earnings Adjustment $25 $16 $14 $97 $185 1Q08 Forest Products Distribution Consumer Packaging Industrial Packaging Printing Papers $ Million |
 37 Geographic Business Segment Operating Results from Continuing Operations before Special Items Geographic Business Segment Operating Results from Continuing Operations before Special Items Operating Profit Sales $ Million $16 $3 $9 $2 $0 $18 $79 $0 $4 $33 $42 $106 1Q08 $30 $3 $6 $21 $1 $23 $84 $0 $18 $41 $44 $85 2Q07 $5 $95 $95 $85 Asian $26 $8 $13 $2 $20 $65 $0 $11 $51 $39 $125 2Q08 $1,970 $75 $625 $95 $315 $1,060 $5 $205 $255 $445 $880 2Q08 $1,985 $75 $600 $80 $315 $1,050 $5 $165 $225 $435 $885 1Q08 $1,720 $65 $595 $70 $270 $975 $5 $155 $205 $370 $875 2Q07 Asian Industrial Packaging North American European Asian Distribution European North American Consumer Packaging U.S. Market Pulp Brazilian European North American Printing Papers Excludes Forest Products |
 38 2008 Earnings from Continuing Operations 2008 Earnings from Continuing Operations 1 Assuming dilution 2 A reconciliation to GAAP EPS is available at www.internationalpaper.com under the Investors tab at presentations $0.35 423 30% $150 $16 ($5) ($59) $198 1Q08 ($0.06) 423 39% ($25) $0 $0 $16 ($41) 1Q08 $0.41 423 31.5% $175 $16 ($5) ($75) $239 1Q08 $30 $0 $30 Equity Earnings $0.54 ($0.02) $0.56 Diluted EPS 423 30% ($7) $0 $3 ($10) 2Q08 Earnings from Continuing Operations 423 32% $228 ($7) ($97) $302 2Q08 $235 Net Income $MM 32.5% Estimated Tax Rate ($7) Minority Interest $MM Special Items $312 Pre-Tax $MM 423 ($100) 2Q08 Before Special Items Average Shares MM Tax $MM 2 1 |
 39 Business Segment Price Realization Business Segment Price Realization $851 $556 2Q08 $651 $988 2Q08 $846 $554 1Q08 $646 $950 1Q08 $791 $513 2Q07 $586 $904 2Q07 Average Selling Price Realizations Industrial Packaging ($/ton) Printing Papers ($/ton) Containerboard Corrugated Boxes Market Pulp Uncoated Freesheet Average IP U.S. selling price realizations (includes the impact of mix across all grades) |
 40 226 188 10 (4) 40 (8) $0 $50 $100 $150 $200 $250 $300 2Q07 North America Paper North America Pulp Europe Brazil 2Q08 Printing Papers Earnings 2Q08 vs. 2Q07 Printing Papers Earnings 2Q08 vs. 2Q07 Brazilian earnings include a one-time, $6 million gain from the sale of government credits |
 41 87 108 (3) (19) 1 $0 $20 $40 $60 $80 $100 $120 2Q07 North America Europe Asia 2Q08 Industrial Packaging Earnings 2Q08 vs. 2Q07 Industrial Packaging Earnings 2Q08 vs. 2Q07 Average IP U.S. selling price realizations (includes the impact of mix across all grades) |
 42 26 30 2 2 (2) 2 (8) $0 $10 $20 $30 2Q07 US Coated Paperboard Shorewood Food Service Europe Asia 2Q08* Consumer Packaging Earnings 2Q08 vs. 2Q07 Consumer Packaging Earnings 2Q08 vs. 2Q07 *Excludes a special item of ($13) million related to the reorganization of Shorewood’s Canadian operations |
 43 .50 .37 .16 .03 .06 .05 .03 (.08) (.01) (.02) (.09) $0.00 $0.10 $0.20 $0.30 $0.40 $0.50 $0.60 $0.70 1Q08 Price Volume Cost / Mix Materials / Freight Corporate / Other Ilim Outages Vicksburg Tax 2Q08 $ / Share $ / Share 2Q08 vs. 1Q08 EPS Higher Costs, Higher Prices, Higher Maintenance Outages 2Q08 vs. 1Q08 EPS Higher Costs, Higher Prices, Higher Maintenance Outages .04 .06 .56 .41 Earnings from continuing operations before special items Forest Products Earnings |
 44 Printing Papers Earnings 2Q08 vs. 1Q08 Printing Papers Earnings 2Q08 vs. 1Q08 226 185 12 12 44 31 (38) (20) $0 $50 $100 $150 $200 $250 $300 1Q08 Price Volume Cost / Mix Materials & Freight Outages Other 2Q08 |
 45 87 97 19 8 (15) (16) (6) $0 $20 $40 $60 $80 $100 $120 $140 1Q08 Volume* Cost / Mix Materials & Freight Outages Vicksburg 2Q08 Industrial Packaging Earnings 2Q08 vs. 1Q08 Industrial Packaging Earnings 2Q08 vs. 1Q08 *Excludes trade volume |
 46 14 26 (11) (13) 1 25 4 6 $0 $10 $20 $30 $40 $50 $60 1Q08* Price Volume Cost / Mix Materials & Freight Outages Other 2Q08* Consumer Packaging Earnings 2Q08 vs. 1Q08 Consumer Packaging Earnings 2Q08 vs. 1Q08 * Excludes a special item of ($5) and ($13) million in 1Q08 and 2Q08, respectively, related to the reorganization of Shorewood’s Canadian operations |
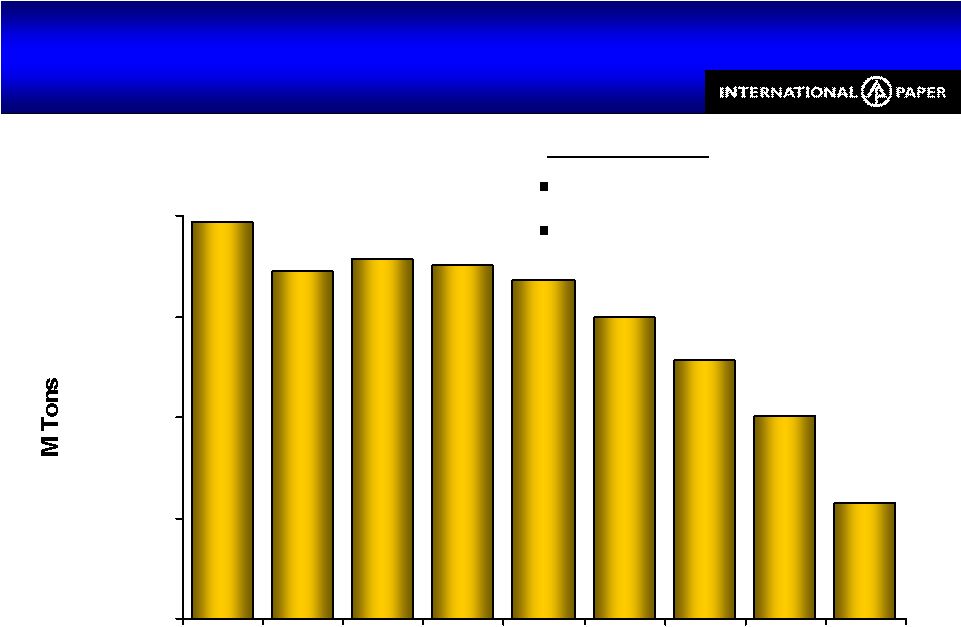 47 North American Industry Capacity Closures Uncoated Freesheet North American Industry Capacity Closures Uncoated Freesheet 12,000 13,000 14,000 15,000 16,000 2000 2001 2002 2003 2004 2005 2006 2007 2008E 2000 – 2008 Demand CAGR = (2.4%) Capacity closures = (18%) Source: AF&PA, RISI, IP Analysis |
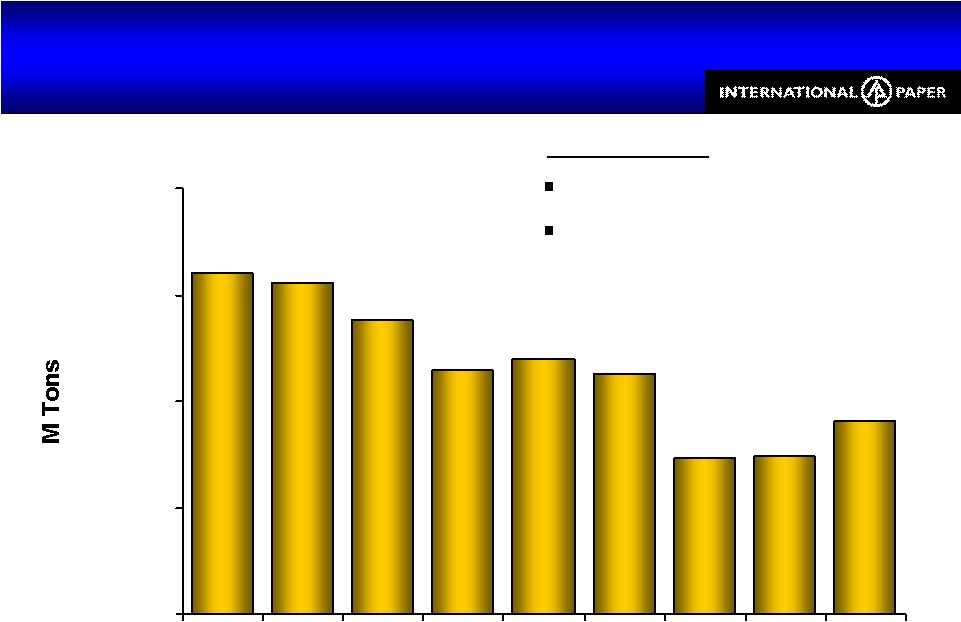 48 North American Industry Capacity Closures Containerboard North American Industry Capacity Closures Containerboard 38,000 39,000 40,000 41,000 42,000 2000 2001 2002 2003 2004 2005 2006 2007 2008E Source: AF&PA, RISI, IP Analysis 2008E includes Pratt’s new machine in Shreveport, LA: 360 M Tons 2000 – 2008 Demand CAGR = (0.4%) Capacity closures = (3%) |
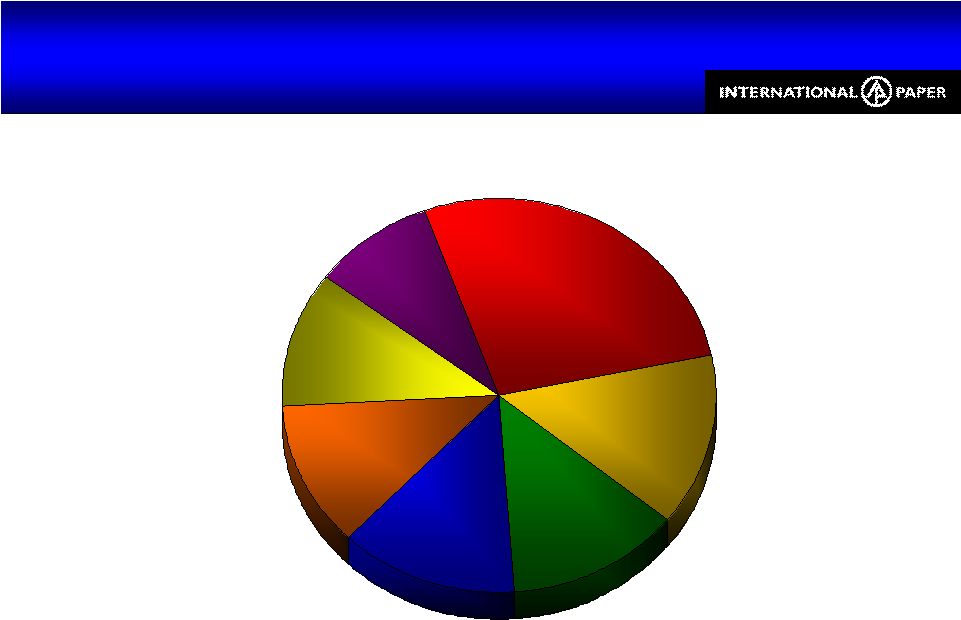 49 Total Cash Cost Components 6M08 Total Cash Cost Components 6M08 North American Mills Only Energy 11% Materials 13% Labor 14% Fiber 27% Freight 13% Overhead 9% Chemicals 12% |
 50 Energy Substituting Lower-Cost Energy Energy Substituting Lower-Cost Energy 0% 20% 40% 60% 80% 100% 2001 2002 2003 2004 2005 2006 2007 2008P Coal Gas Wood Waste Fuel Oil Power Other *Other includes shredded tires, recycled oil, and any other fossil fuels |
 51 ($120) ($100) ($80) ($60) ($40) ($20) $0 Wood Energy Chemicals Freight OCC Global Input & Freight Costs by Segment $211 Million Global Impact vs. 2Q07 Global Input & Freight Costs by Segment $211 Million Global Impact vs. 2Q07 Consumer Packaging ($37) Industrial Packaging ($56) Printing Papers ($118) |
 52 (24) (17) (2) (19) ($35) ($25) ($15) ($5) $5 Energy Chemicals Fiber Freight North America Outside North America Increasing Global Input & Freight Costs $62MM, or $0.10/Share Impact vs. 1Q08 Increasing Global Input & Freight Costs $62MM, or $0.10/Share Impact vs. 1Q08 Input costs for continuing businesses Percentage change reflects North American input costs N.A. 18% 15% 1% 7% |
 53 0 50 100 150 200 250 Jan Apr Jul Oct Jan Apr Jul Oct Jan Apr Jul Oct Jan Apr 2005 2006 2007 NYMEX Natural Gas closing prices Index: Jan 2005 Natural Gas Costs = 100 Natural Gas Costs 45% increase vs. 2Q07 average cost Natural Gas Costs 45% increase vs. 2Q07 average cost 2008 |
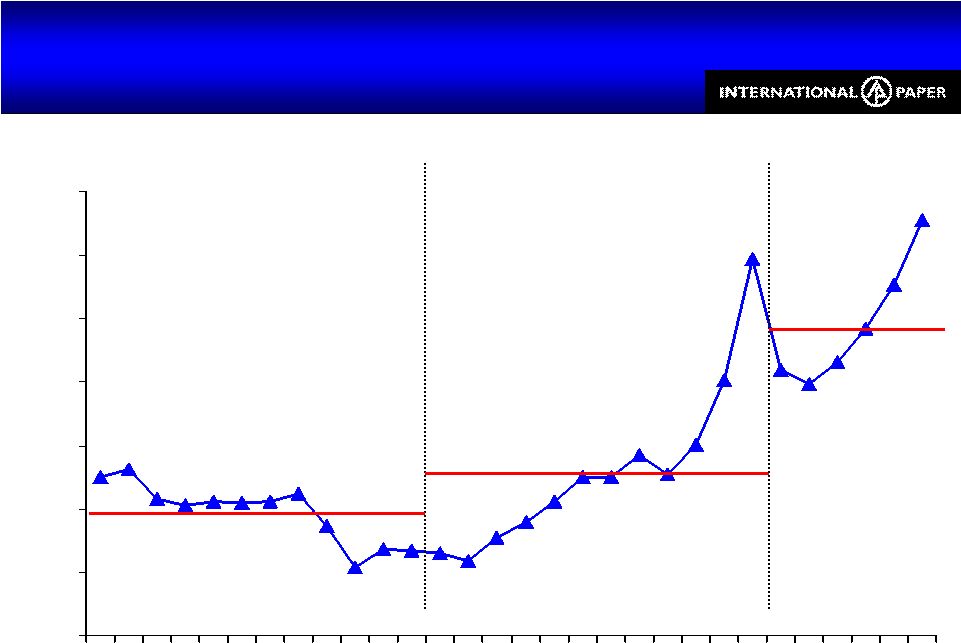 54 50 70 90 110 130 150 170 190 Jan Apr Jul Oct Jan Apr Jul Oct Jan Apr 2006 2007 Index: Jan 2006 #6 Fuel Costs = 100 Delivered cost to U.S. facilities U.S. #6 Fuel Oil 75% increase vs. 2Q07 average cost U.S. #6 Fuel Oil 75% increase vs. 2Q07 average cost 2008 |
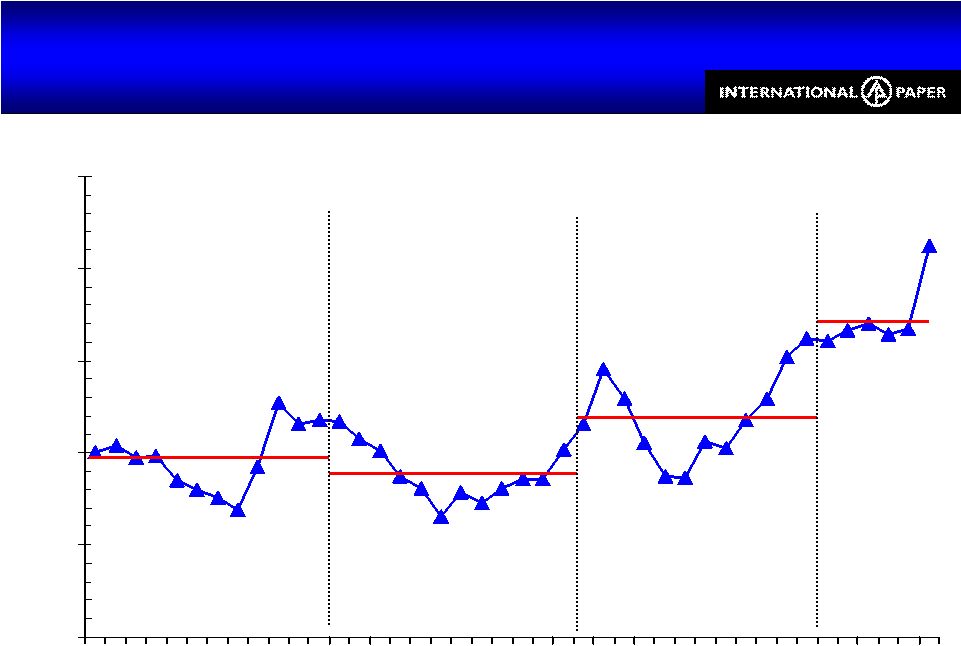 55 90 95 100 105 110 115 Jan Apr Jul Oct Jan Apr Jul Oct Jan Apr Jul Oct Jan Apr U.S. Mill Wood Costs 9% increase vs. 2Q07 average cost U.S. Mill Wood Costs 9% increase vs. 2Q07 average cost Index: Jan 2005 Wood Costs = 100 2005 2006 2007 2008 Delivered cost to U.S. facilities |
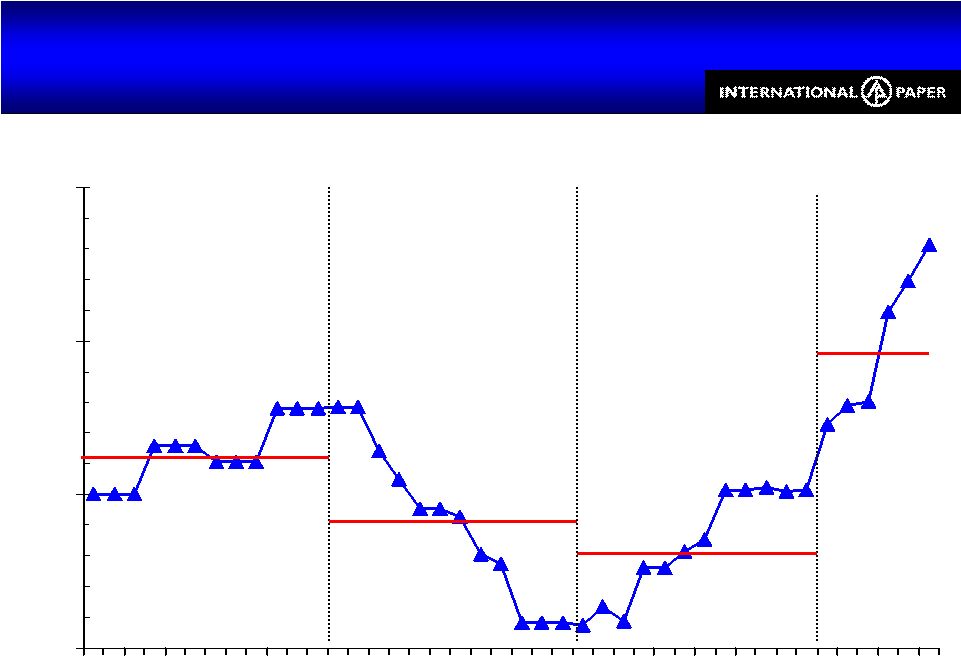 56 75 100 125 150 Jan Apr Jul Oct Jan Apr Jul Oct Jan Apr Jul Oct Jan Apr 2005 2006 2007 2008 Index: Jan 2005 Caustic Soda Costs = 100 Delivered cost to U.S. facilities U.S. Caustic Soda Costs 52% increase vs. 2Q07 average cost U.S. Caustic Soda Costs 52% increase vs. 2Q07 average cost |
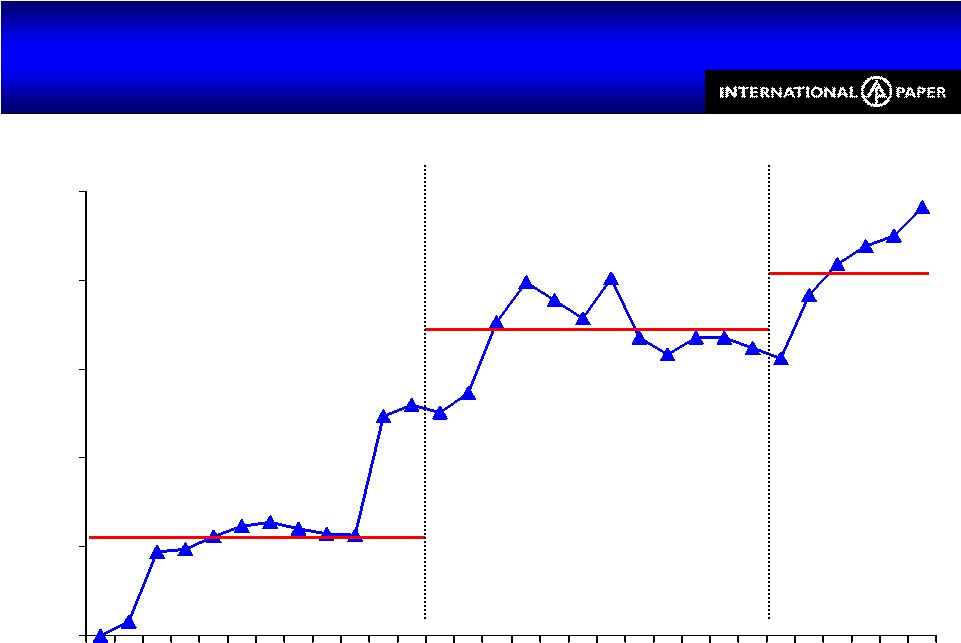 57 100 125 150 175 200 225 Jan Apr Jul Oct Jan Apr Jul Oct Jan Apr 2006 2007 Index: Jan 2006 Corn Starch Costs = 100 Delivered cost to U.S. facilities U.S. Corn Starch Costs 10% increase vs. 2Q07 average cost U.S. Corn Starch Costs 10% increase vs. 2Q07 average cost 2008 |
 58 110,000 350,000 Corn Starch (Tons) Chemicals Fiber Energy 50,000 240,000 Sodium Chlorate (Tons) - 40,000 LD Polyethylene (Tons) 4,000 24,000 Latex (Tons) 230,000 1,300,000 Coal (Tons) 8,200,000 43,000,000 Wood (Tons) 60,000 300,000 Caustic Soda (Tons) 310,000 600,000 Old Corrugated Containers (Tons) Commodity 500,000 15,000,000 Non – U. S. 3,000,000 #6 Fuel Oil (Barrels) 28,000,000 Natural Gas (MM BTUs) U. S. Global Consumption 2008 Purchase Estimates for Key Inputs Global Consumption 2008 Purchase Estimates for Key Inputs Includes only continuing businesses; does not include Asian or Weyerhaeuser consumption |