Free signup for more
- Track your favorite companies
- Receive email alerts for new filings
- Personalized dashboard of news and more
- Access all data and search results
Filing tables
Filing exhibits
Related financial report
IP similar filings
- 25 Mar 11 Departure of Directors or Certain Officers
- 10 Mar 11 Other Events
- 11 Feb 11 Entry into a Material Definitive Agreement
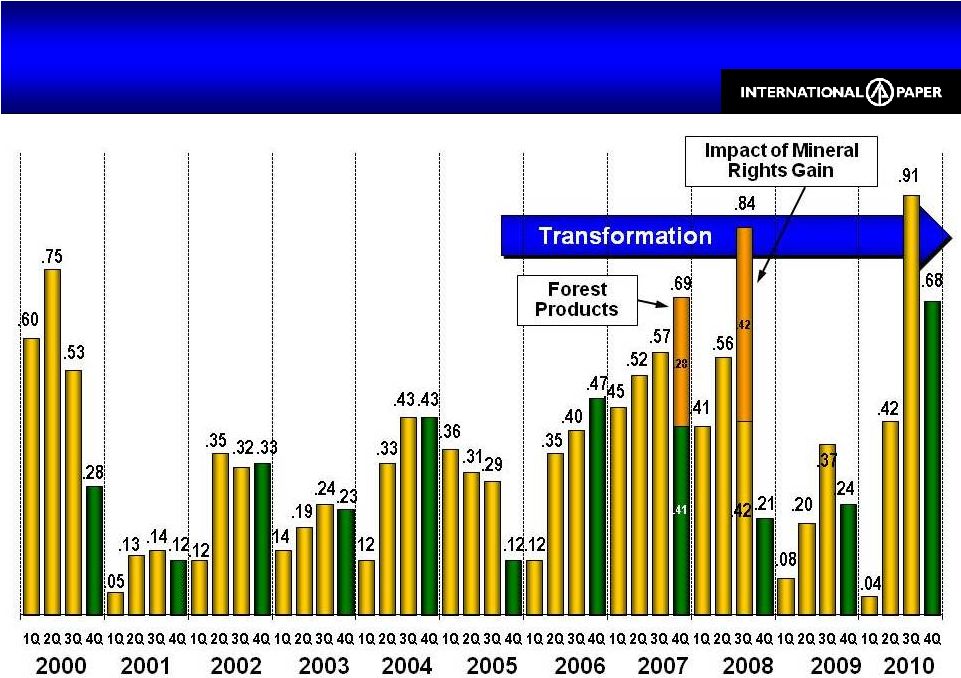
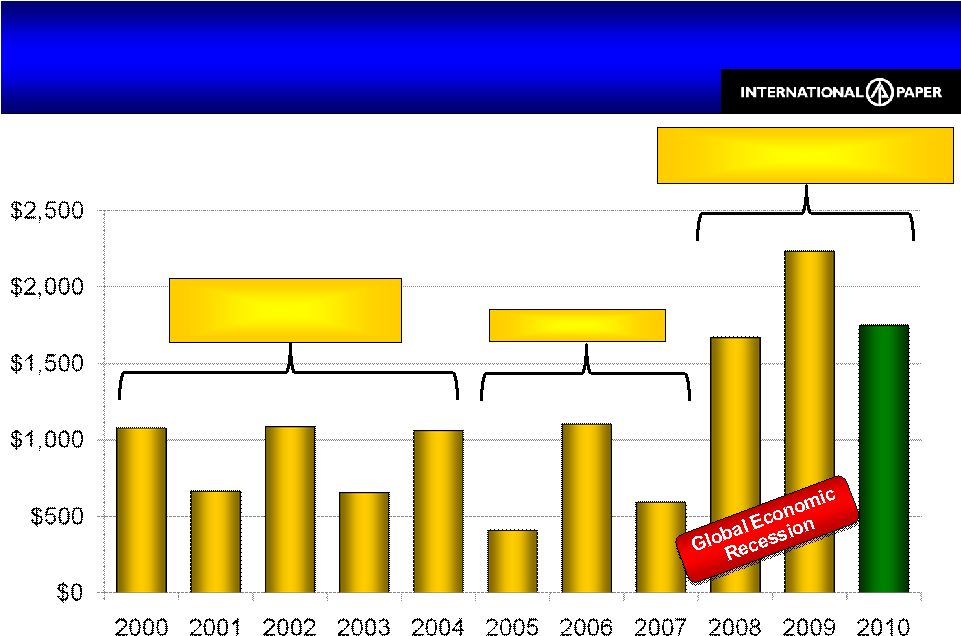
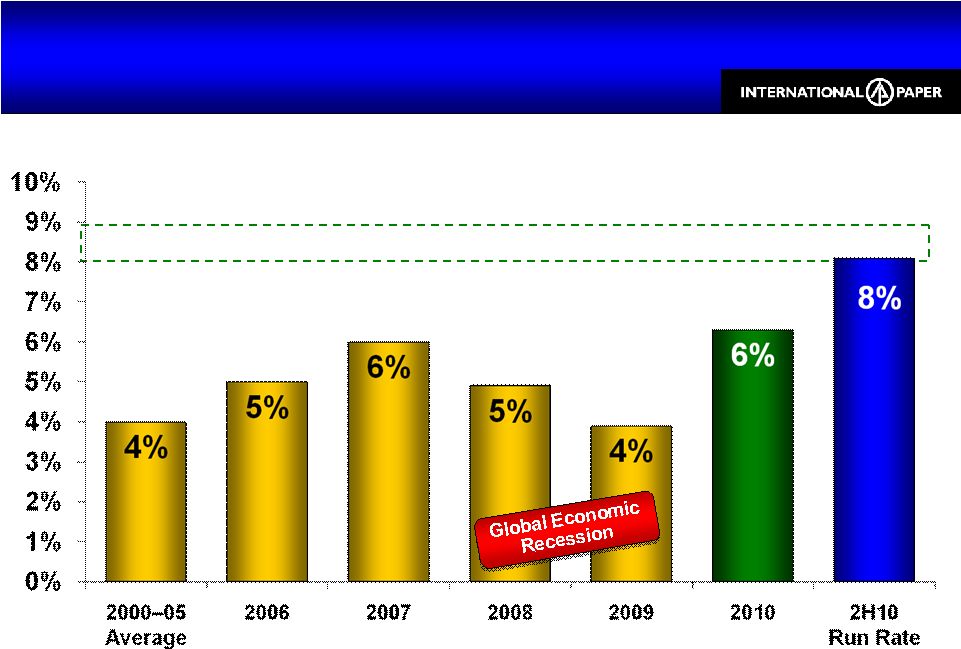
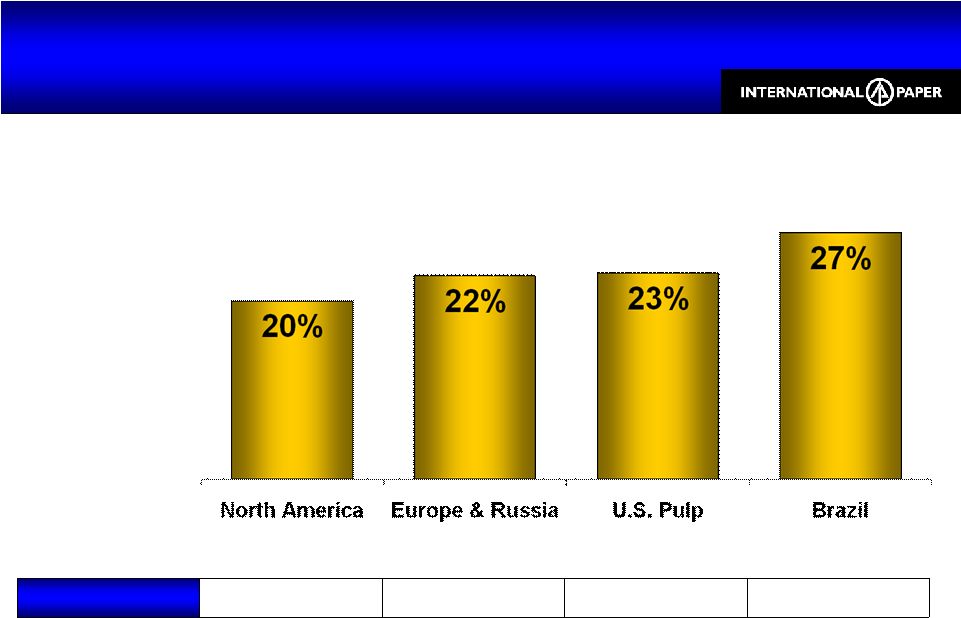
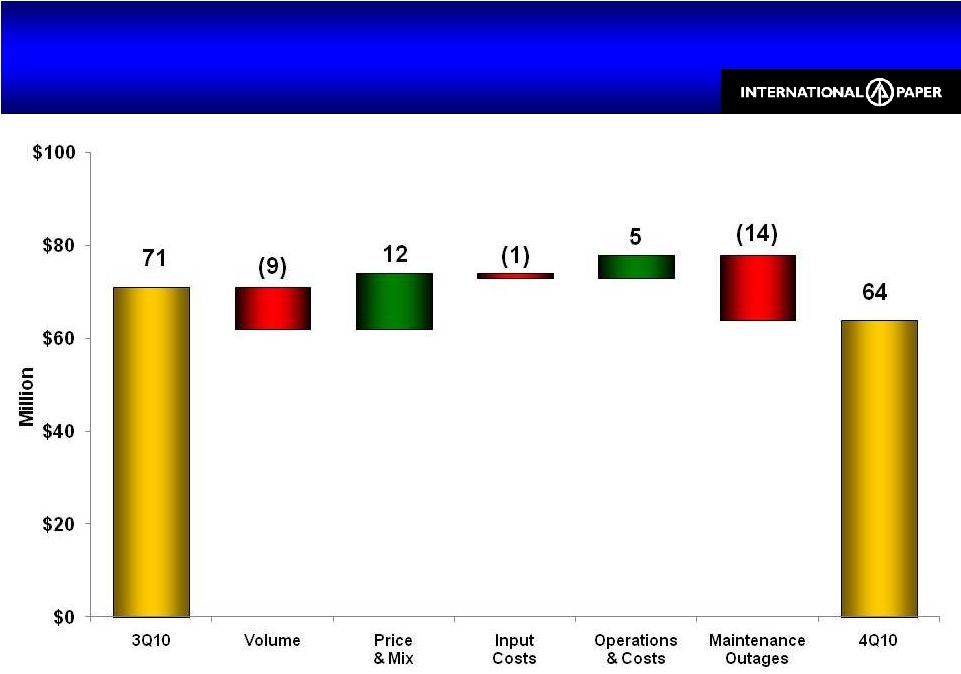
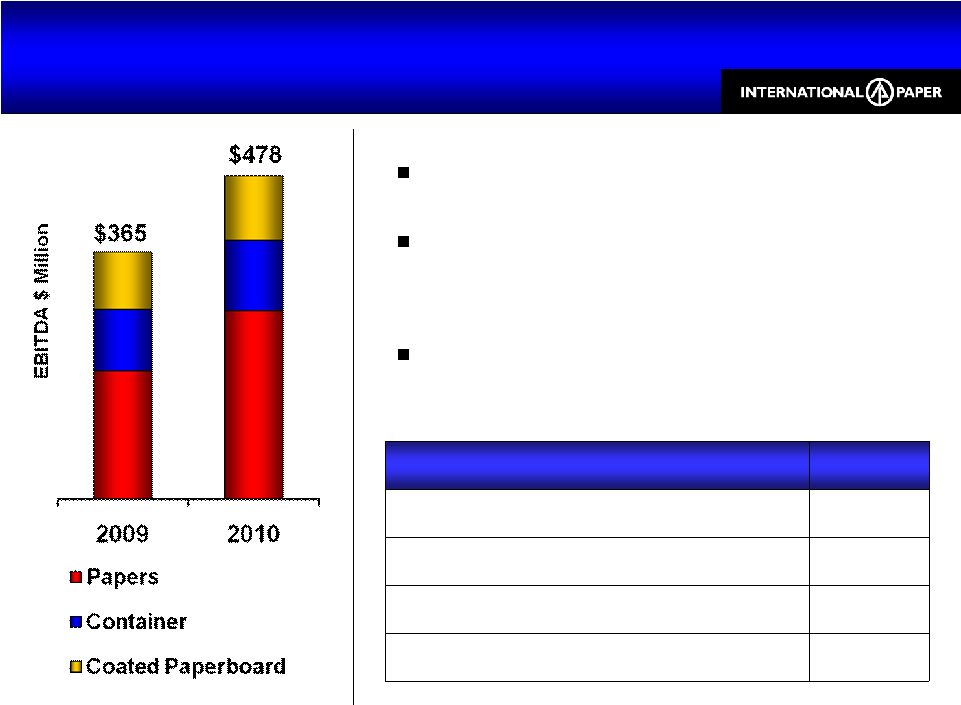
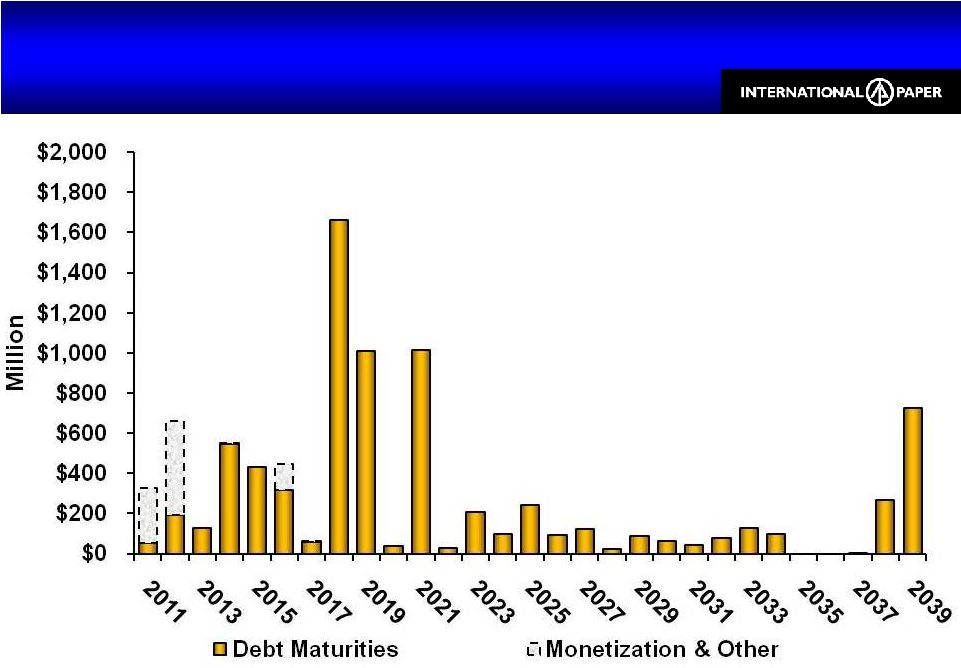
- 3 Feb 11 International Paper Reports Fourth-Quarter and 2010 Earnings
- 7 Jan 11 Departure of Directors or Certain Officers
- 22 Dec 10 Departure of Directors or Certain Officers
- 27 Oct 10 International Paper Reports Record Earnings
Filing view
External links