|
Exhibit 99.2 
|
John V. Faraci Second Quarter Chairman & 2011 Review Chief Executive Officer
July 28, 2011
Tim S. Nicholls Senior Vice President & Chief Financial Officer
Forward-Looking Statements
Certain statements in these slides and made during this presentation may be considered forward-looking statements. These statements reflect management’s current views and are subject to risks and uncertainties that could cause actual results to differ materially from those expressed or implied in these statements. Factors which could cause actual results to differ include but are not limited to: (i) increases in interest rates; (ii) industry conditions, including but not limited to changes in the cost or availability of raw materials, energy and transportation costs, competition we face, cyclicality and changes in consumer preferences, demand and pricing for our products; (iii) global economic conditions and political changes, including but not limited to the impairment of financial institutions, changes in currency exchange rates, credit ratings issued by recognized credit rating organizations, the amount of our future pension funding obligation, changes in tax laws and pension and health care costs; (iv) unanticipated expenditures related to the cost of compliance with existing and new environmental and other governmental regulations and to actual or potential litigation; (v) whether we experience a material disruption at one of our manufacturing facilities and risks inherent in conducting business through a joint venture; and (vi) our ability to achieve the benefits we expect from strategic acquisitions and divestitures. These and other factors that could cause or contribute to actual results differing materially from such forward looking statements are discussed in greater detail in the company’s Securities and Exchange Commission (“SEC”) filings. Other important factors that could cause or contribute to actual results differing materially are included but are not limited to those discussed in the SEC filings of Temple-Inland Inc. (“Temple-Inland”). We undertake no obligation to publicly update any forward-looking statements or other information related to this presentation or the tender offer for the outstanding shares of common stock (including the associated preferred stock purchase rights) of Temple-Inland, whether as a result of new information, future events or otherwise.
Statements Relating to Non-GAAP Financial Measures
During the course of this presentation, certain non-U.S. GAAP financial information will be presented.
A reconciliation of those numbers to U.S. GAAP financial measures is available on the company ‘s website at internationalpaper.com under Investors.
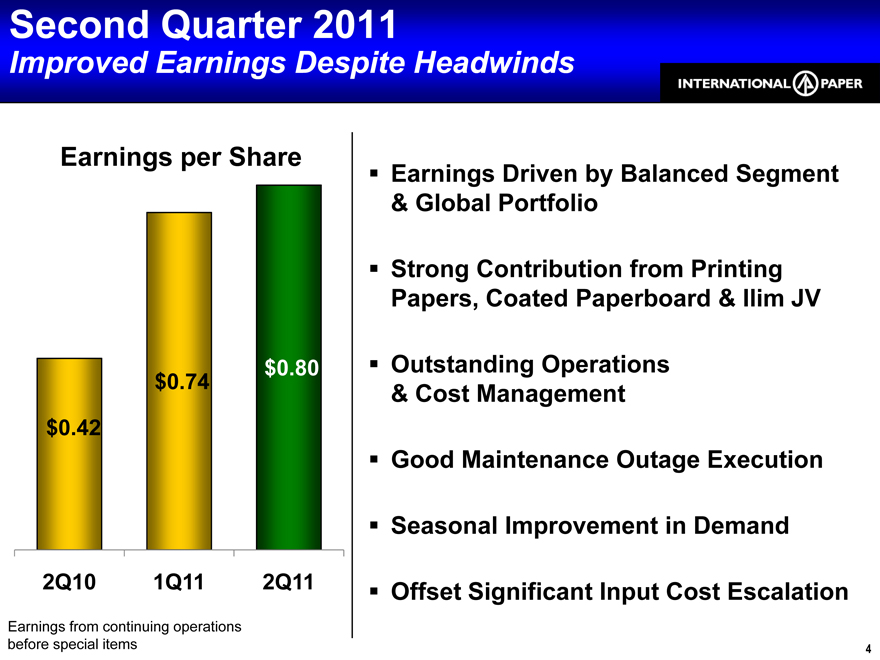
Second Quarter 2011
Improved Earnings Despite Headwinds
Earnings per Share
$0.80 $0.74
$0.42
2Q10 1Q11 2Q11
Earnings from continuing operations before special items
Earnings Driven by Balanced Segment
& Global Portfolio
Strong Contribution from Printing Papers, Coated Paperboard & Ilim JV
Outstanding Operations
& Cost Management
Good Maintenance Outage Execution Seasonal Improvement in Demand Offset Significant Input Cost Escalation
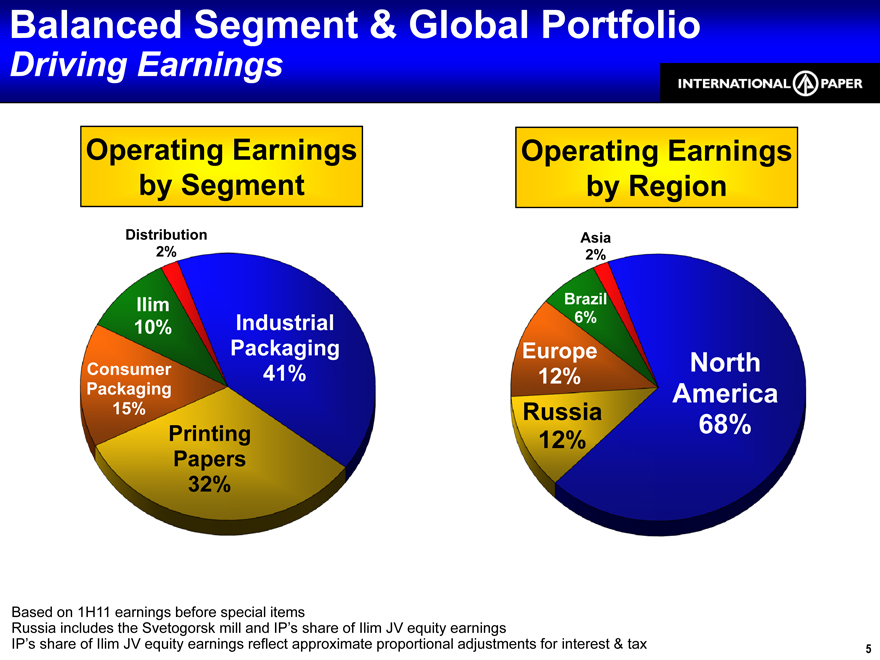
Balanced Segment & Global Portfolio
Driving Earnings
Operating Earnings by Segment
Distribution 2%
Ilim
10% Industrial Packaging
Consumer 41% Packaging 15%
Printing Papers 32%
Operating Earnings by Region
Asia 2%
Brazil 6%
Europe North 12%
America
Russia
68%
12%
Based on 1H11 earnings before special items
Russia includes the Svetogorsk mill and IP’s share of Ilim JV equity earnings
IP’s share of Ilim JV equity earnings reflect approximate proportional adjustments for interest & tax 5
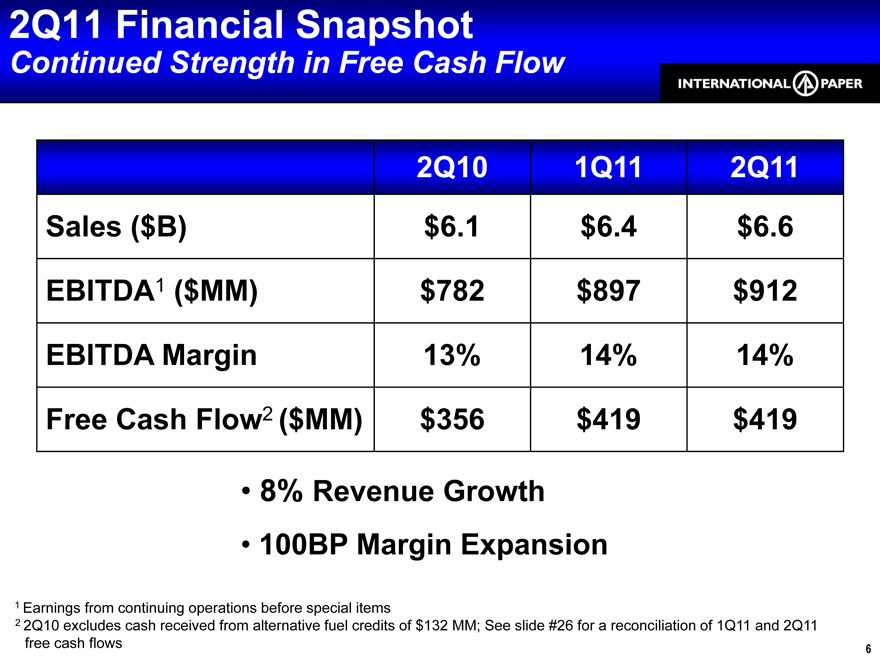
2Q11 Financial Snapshot
Continued Strength in Free Cash Flow
2Q10 1Q11 2Q11 Sales ($B) $6.1 $6.4 $6.6
EBITDA1 ($MM) $782 $897 $912 EBITDA Margin 13% 14% 14% Free Cash Flow2 ($MM) $356 $419 $419
• 8% Revenue Growth
• 100BP Margin Expansion
1 Earnings from continuing operations before special items
2 2Q10 excludes cash received from alternative fuel credits of $132 MM; See slide #26 for a reconciliation of 1Q11 and 2Q11 free cash flows 6
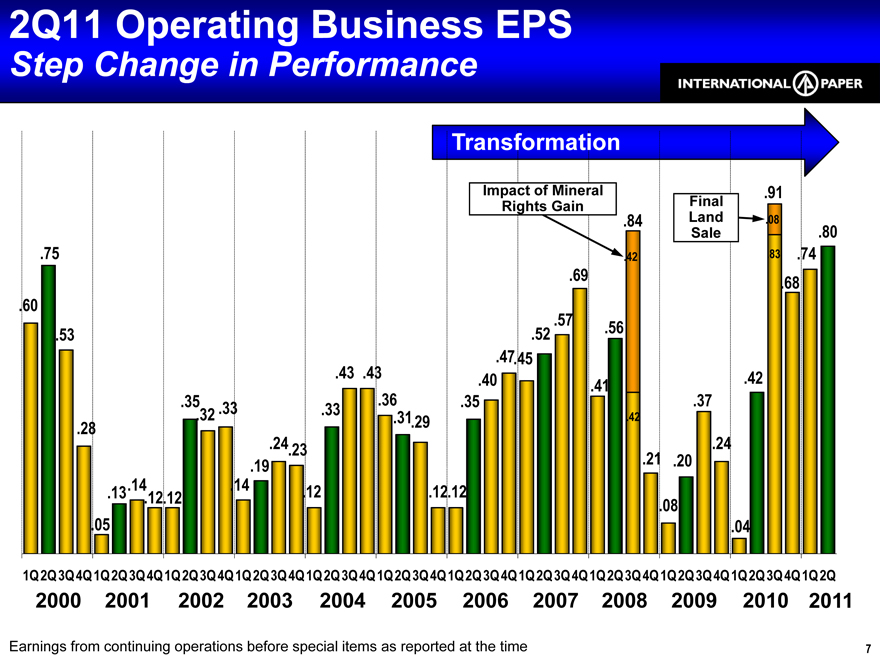
2Q11 Operating Business EPS
Step Change in Performance
Transformation
Impact of Mineral .91 Rights Gain Final
.84 Land ..08 .80
Sale
.75 .42 .83 .74 .69 .68 .60 .57 .56 .53 .52 .43 .43 .47.45 .40 .41 .42 .35 .36 .35 .37 .32 .33 .33 .31.29 .42 .28 .24.23 .21 .24 .19 .20 .13.14 .14 .12 .12.12 .12.12 .08 .05 .04
1Q 2Q 3Q4Q 1Q2Q 3Q4Q 1Q 2Q3Q 4Q1Q 2Q3Q 4Q1Q 2Q 3Q4Q 1Q2Q 3Q4Q 1Q2Q 3Q 4Q1Q 2Q3Q 4Q1Q 2Q3Q 4Q 1Q2Q 3Q4Q 1Q2Q 3Q 4Q1Q 2Q
2000 2001 2002 2003 2004 2005 2006 2007 2008 2009 2010 2011
Earnings from continuing operations before special items as reported at the time 7
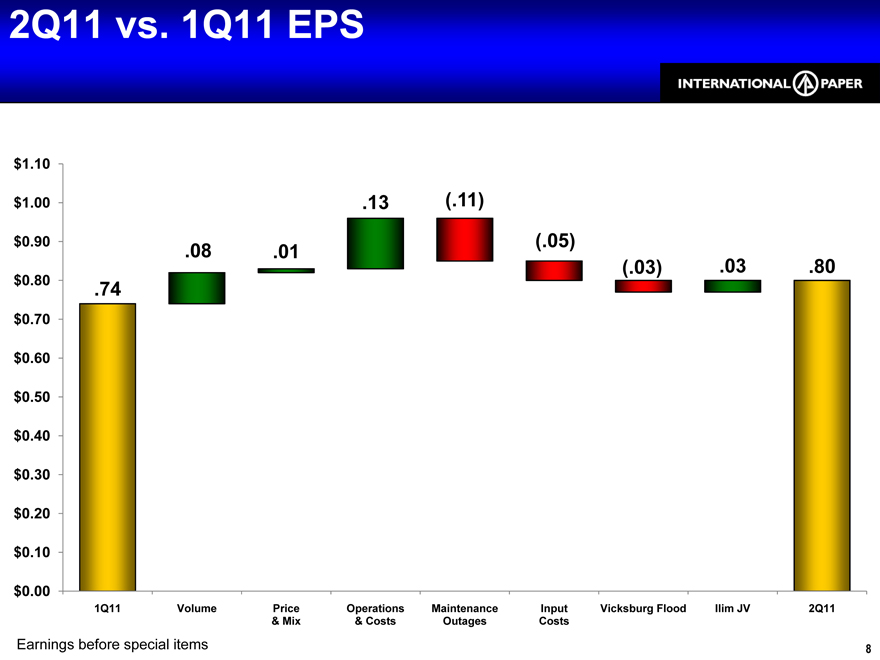
2Q11 vs. 1Q11 EPS
$1.10
$1.00 .13 (.11) $0.90 .08 (.05) .01 $0.80 (.03) .03 .80 .74
$0.70 $0.60 $0.50 $0.40 $0.30 $0.20 $0.10
$0.00
1Q11 Volume Price Operations Maintenance Input Vicksburg Flood Ilim JV 2Q11
& Mix & Costs Outages Costs
Earnings before special items 8
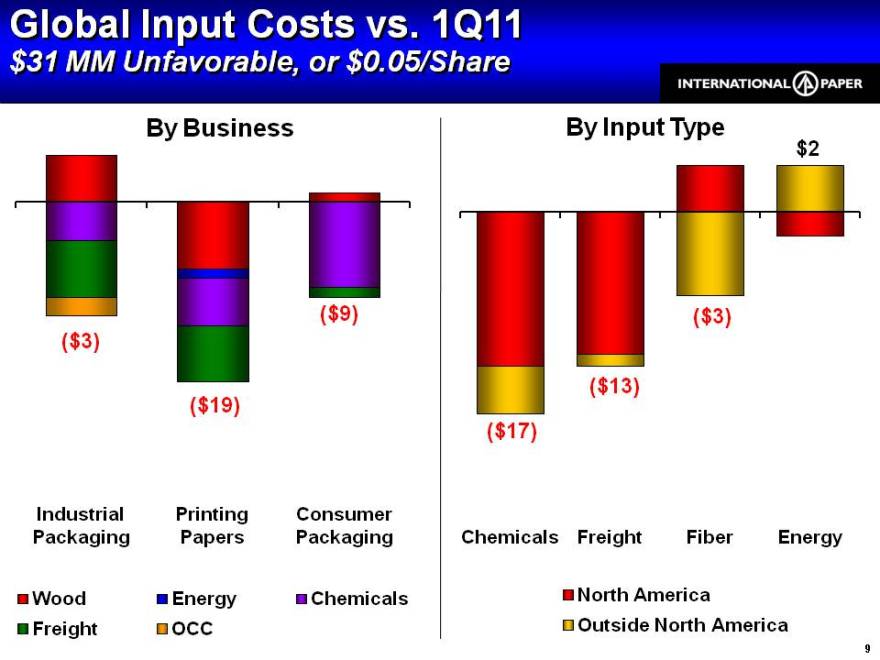
Global Input Costs vs. 1Q11
$31 MM Unfavorable, or $0.05/Share
By Business
($9)
($3)
($19)
Industrial Printing Consumer Packaging Papers Packaging
OCC Freight Chemicals Energy Wood
By Input Type $2
($3)
($13)
($17)
Chemicals Freight Fiber Energy
Outside North America North America
9
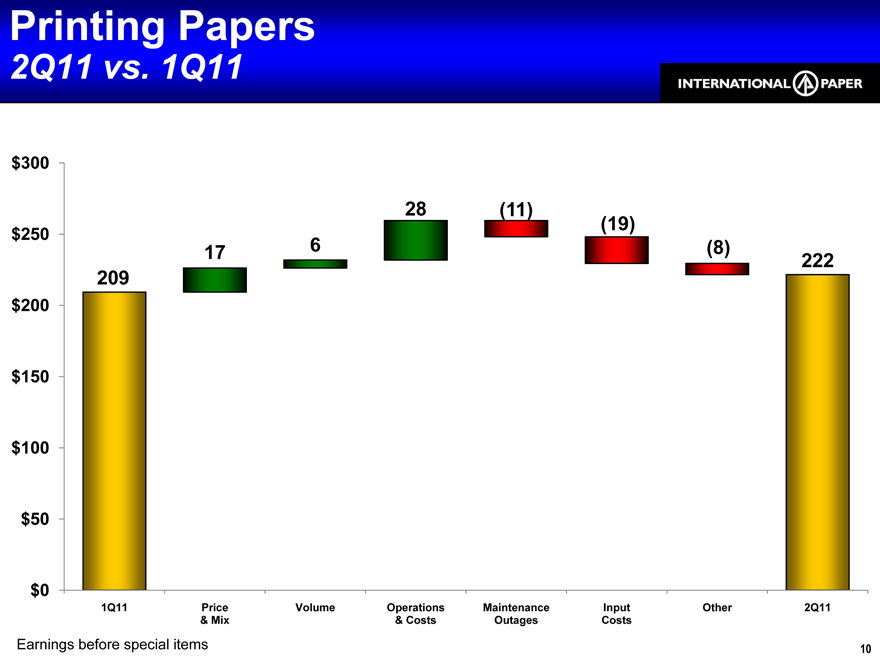
Printing Papers
2Q11 vs. 1Q11
$300
28 (11)
$250
17 6 (8)
209 222
$200 $150 $100 $50
$0
1Q11 Price Volume Operations Maintenance Input Other 2Q11
& Mix & Costs Outages Costs
Earnings before special items 10
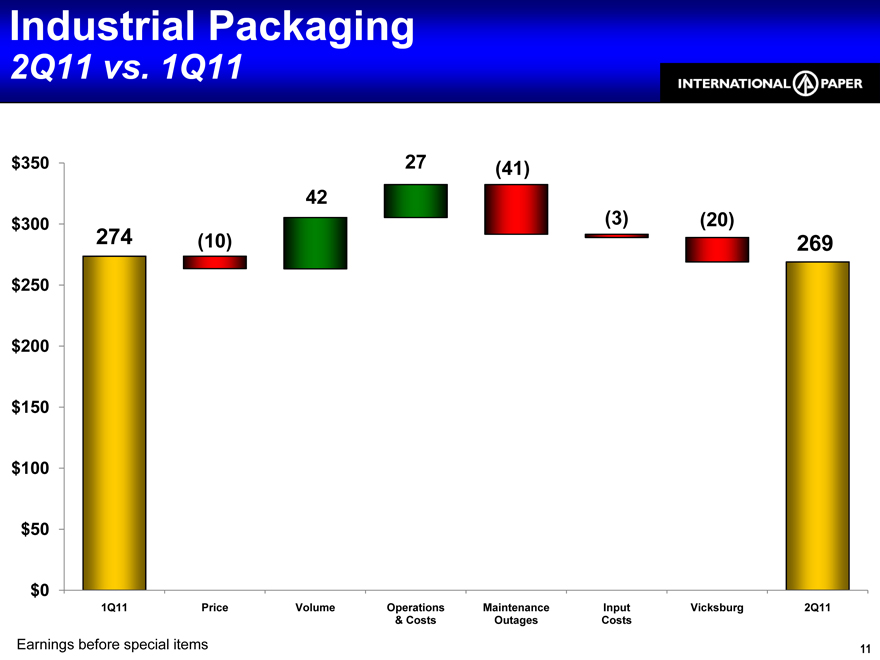
Industrial Packaging
2Q11 vs. 1Q11
$350 27 (41) 42 $300 274 (3) (20)
$250 $200 $150 $100 $50
$0
1Q11 Price Volume Operations Maintenance Input Vicksburg 2Q11
& Costs Outages Costs
Earnings before special items 11
N.A. Industrial Packaging Relative EBITDA Margins
18.5%
17.6% 17.5% 17.0%
15.8% 16.1%
12.8%
12.2% 9.7%
IP Competitor A Competitor B 2Q10 1Q11 2Q11
IP EBITDA margins based on North American Industrial Packaging operating profit before special items. Competitor EBITDA margin estimates obtained from public filings and IP analysis
Excludes revenue from trade volumes 12
U.S. Box Demand
Agriculture West Impacted by Weather
1H11 vs. 1H10 Box Shipments
1.5% 1.4%
1.2%
1.0%
0.6% 0.5%
0.0%
(0.3%) -0.5%
IP Industry
Total Shipments Total Shipments Excluding West Region
Box demand on an FBA reporting basis 13
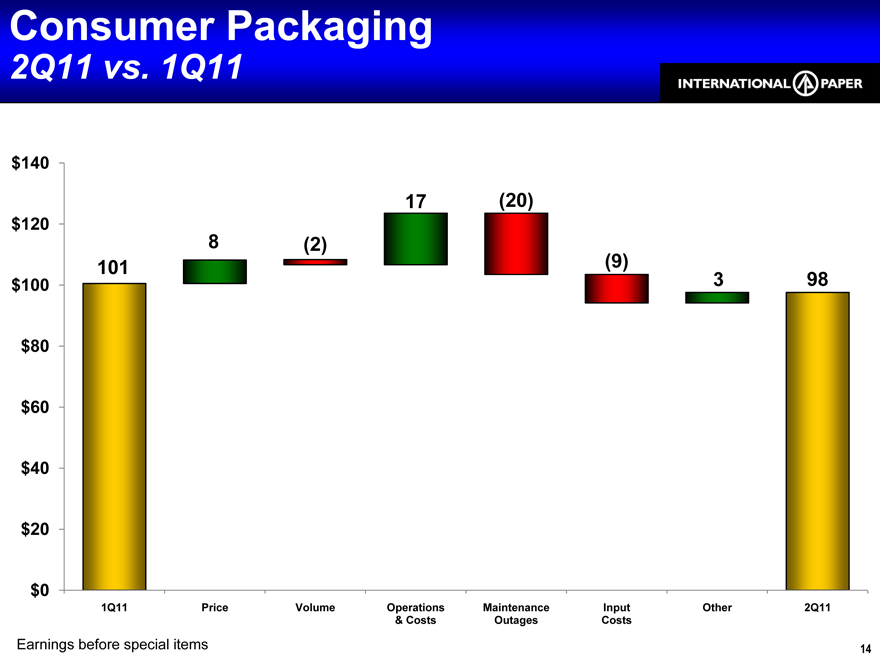
Consumer Packaging
2Q11 vs. 1Q11
$140
17 (20)
$120
8 (2)
101 (9) 98
$100 3 $80 $60 $40 $20
$0
1Q11 Price Volume Operations Maintenance Input Other 2Q11
& Costs Outages Costs
Earnings before special items 14
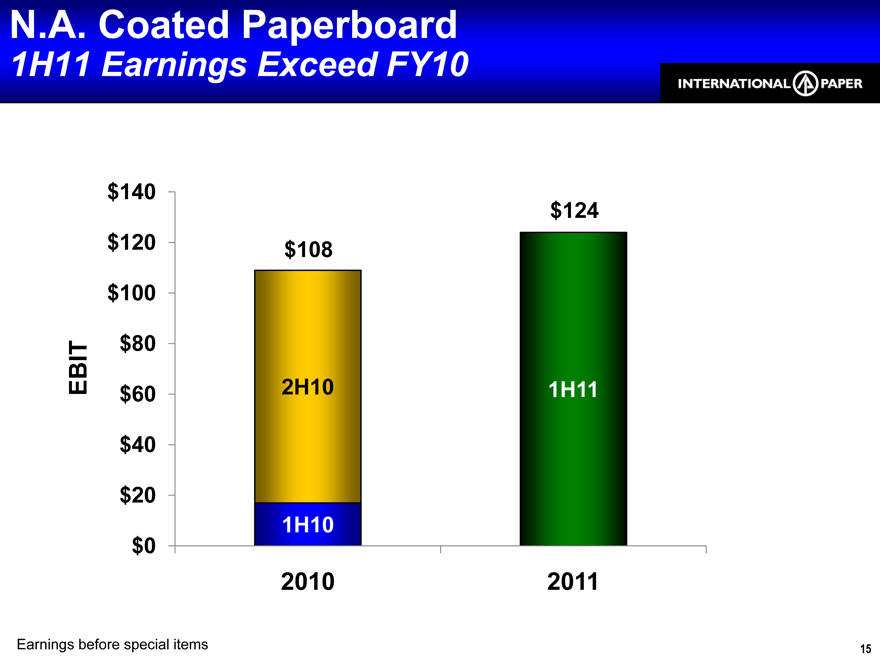
N.A. Coated Paperboard
1H11 Earnings Exceed FY10
$140 $124 $120 $108 $100
IT $80
EB $60 2H10 1H11 $40
$20
1H10 $0
2010 2011
Earnings before special items 15
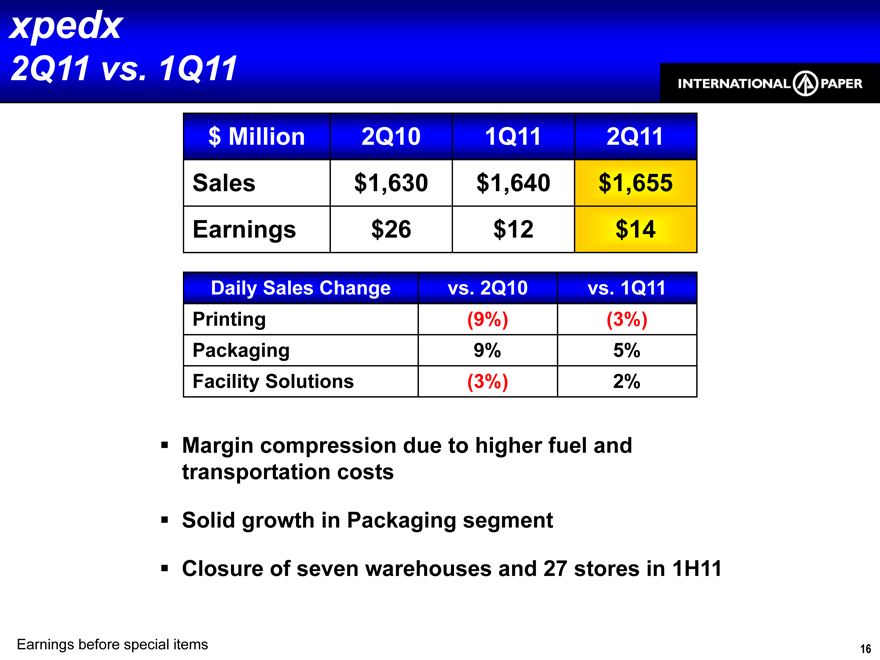
xpedx
2Q11 vs. 1Q11
$ Million 2Q10 1Q11 2Q11 Sales $1,630 $1,640 $1,655 Earnings $26 $12 $14
Daily Sales Change vs. 2Q10 vs. 1Q11 Printing (9%) (3%) Packaging 9% 5% Facility Solutions (3%) 2%
Margin compression due to higher fuel and transportation costs
Solid growth in Packaging segment
Closure of seven warehouses and 27 stores in 1H11
Earnings before special items 16
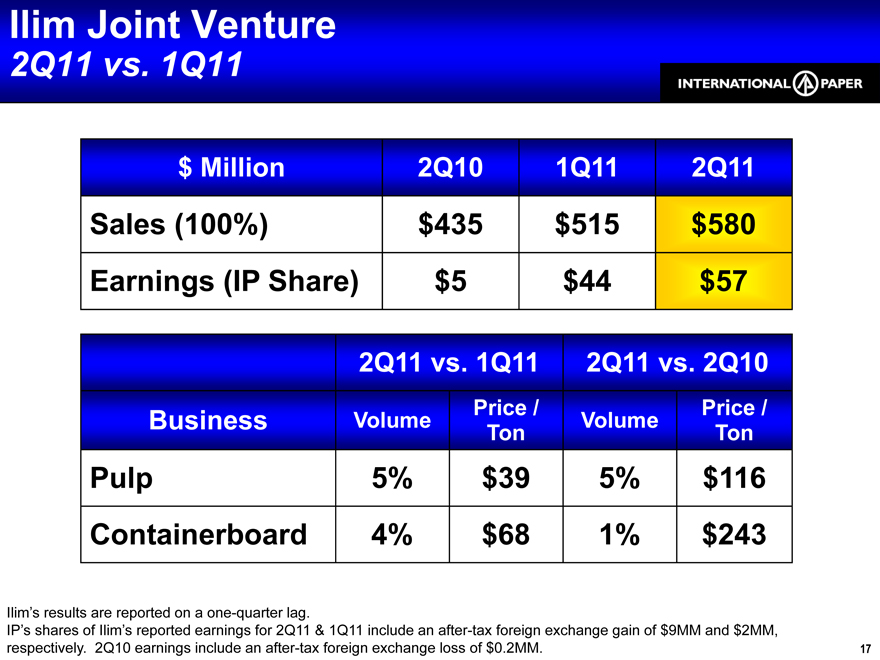
Ilim Joint Venture
2Q11 vs. 1Q11
$ Million 2Q10 1Q11 2Q11
Sales (100%) $435 $515 $580 Earnings (IP Share) $5 $44 $57
2Q11 vs. 1Q11 2Q11 vs. 2Q10
Price / Price / Business Volume Volume Ton Ton
Pulp 5% $39 5% $116 Containerboard 4% $68 1% $243
Ilim’s results are reported on a one-quarter lag.
IP’s shares of Ilim’s reported earnings for 2Q11 & 1Q11 include an after-tax foreign exchange gain of $9MM and $2MM, respectively. 2Q10 earnings include an after-tax foreign exchange loss of $0.2MM. 17
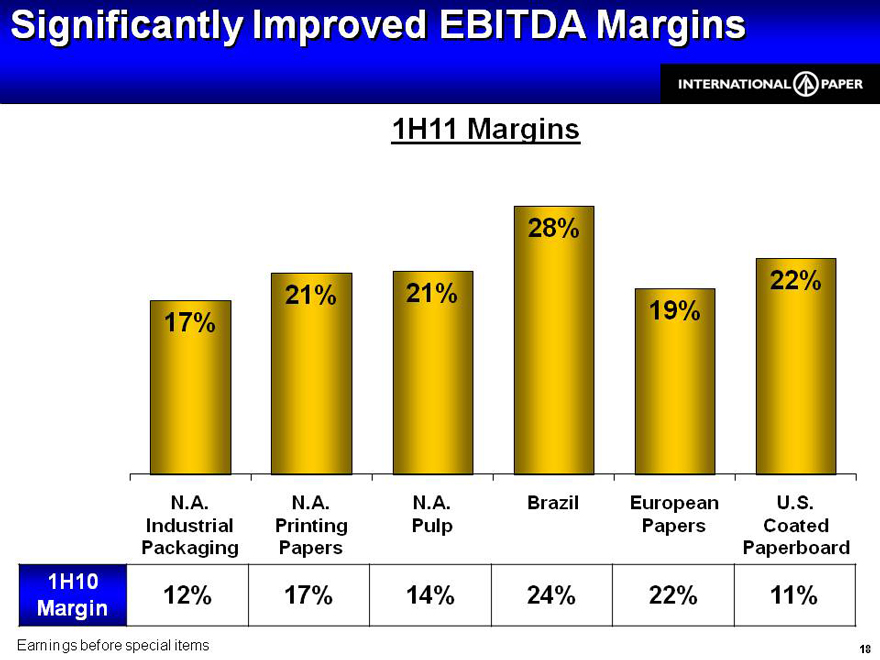
Significantly Improved EBITDA Margins
1H11 Margins
28%
22% 21% 21% 17% 19%
N.A. N.A. N.A. Brazil European U.S. Industrial Printing Pulp Papers Coated Packaging Papers Paperboard 1H10 12% 17% 14% 24% 22% 11% Margin
Earnings before special items 18
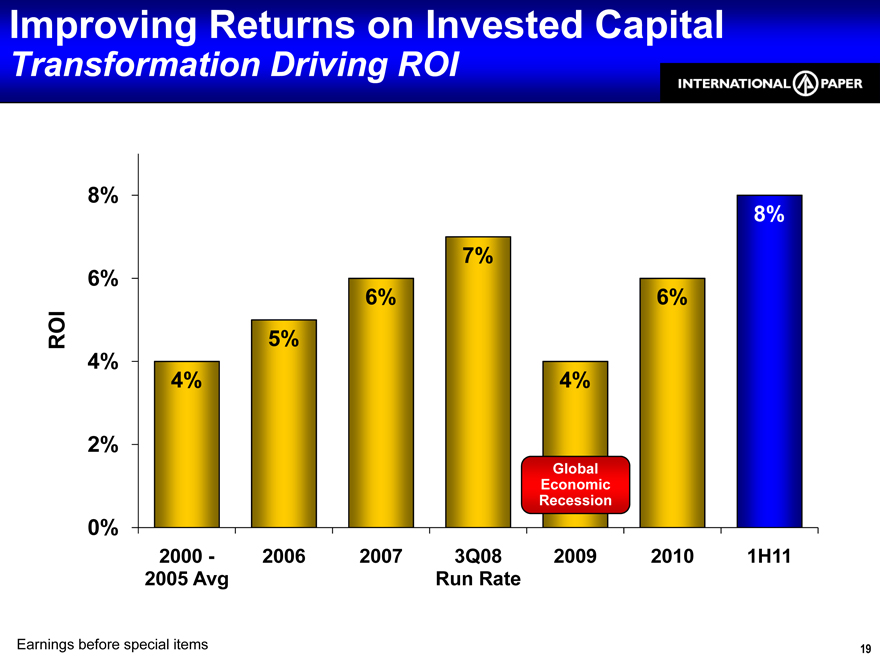
Improving Returns on Invested Capital
Transformation Driving ROI
8%
8% 7% 6%
6% 6% ROI 5% 4%
4% 4%
2%
Global Economic Recession
0%
2000—2006 2007 3Q08 2009 2010 1H11 2005 Avg Run Rate
Earnings before special items 19
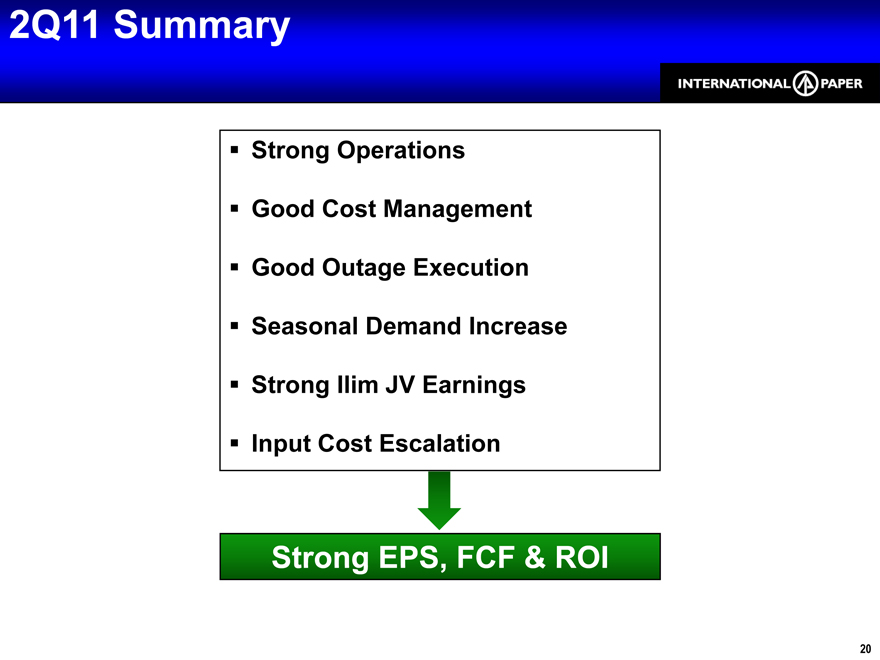
2Q11 Summary
Strong Operations Good Cost Management Good Outage Execution Seasonal Demand Increase Strong Ilim JV Earnings Input Cost Escalation
Strong EPS, FCF & ROI
20
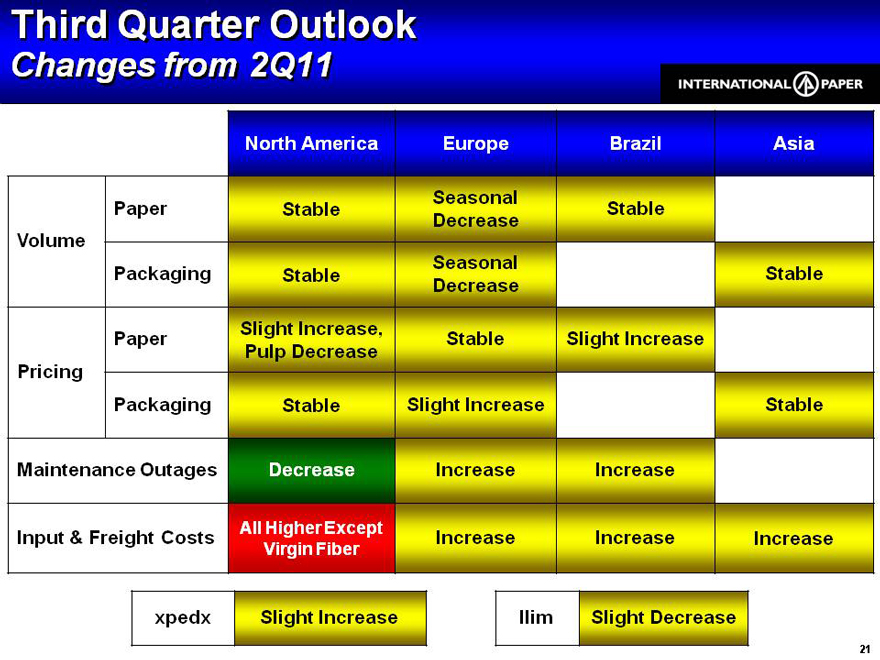
Third Quarter Outlook
Changes from 2Q11
North America Europe Brazil Asia
Seasonal
Paper Stable Stable Decrease Volume Seasonal
Packaging Stable Decrease
Slight Increase,
Paper Stable Slight Increase Pulp Decrease Pricing
Packaging Stable Slight Increase Stable
Maintenance Outages
Decrease Increase Increase
All Higher Except
Input & Freight Costs Increase Increase Increase
Virgin Fiber
xpedx Slight Increase Ilim Slight Decrease
21
Other Information
Additional Information
This communication does not constitute an offer to buy or solicitation of an offer to sell any securities. The offer and solicitation to purchase shares of common stock, par value $1.00 per share (and the associated preferred stock purchase rights), of Temple-Inland is only being made pursuant to a Tender Offer Statement on Schedule TO (including the Offer to Purchase, Letter of Transmittal and other related tender offer materials) filed by International Paper Company (the “Company”) and Metal Acquisition Inc. with the SEC on July 12, 2011 (as they may be amended and supplemented from time to time). INVESTORS AND SECURITY HOLDERS OF TEMPLE-INLAND ARE URGED TO READ THESE AND OTHER DOCUMENTS FILED WITH THE SEC CAREFULLY IN THEIR ENTIRETY BECAUSE THEY CONTAIN IMPORTANT INFORMATION ABOUT THE PROPOSED TRANSACTION. Investors and security holders may obtain free copies of these documents and other documents filed with the SEC by the Company through the web site maintained by the SEC at http://www.sec.gov. The tender offer expires at 5:00 p.m., Eastern time, on August 9, 2011, unless it is extended. If the tender offer is extended, the Company will issue a press release announcing the extension at or before 9:00 a.m., Eastern time, on the next business day after the date the tender offer was scheduled to expire.
In connection with the proposed transaction, the Company may file a proxy statement with the SEC. Any definitive proxy statement will be mailed to stockholders of Temple-Inland. INVESTORS AND SECURITY HOLDERS OF TEMPLE-INLAND ARE URGED TO READ THESE AND OTHER DOCUMENTS FILED WITH THE SEC CAREFULLY IN THEIR ENTIRETY WHEN THEY BECOME AVAILABLE BECAUSE THEY WILL CONTAIN IMPORTANT INFORMATION ABOUT THE PROPOSED TRANSACTION. Investors and security holders will be able to obtain free copies of these documents (if and when available) and other documents filed with the SEC by the Company through the web site maintained by the SEC at http://www.sec.gov. 22
Other Information
Certain Information Regarding Participants
The Company and certain of its respective directors and executive officers may be deemed to be participants in the proposed transaction under the rules of the SEC. Security holders may obtain information regarding the names, affiliations and interests of the Company’s directors and executive officers in the Company’s Annual Report on Form 10–K for the year ended December 31, 2010 which was filed with the SEC on February 25, 2011, and its proxy statement for the 2011 Annual Meeting, which was filed with the SEC on April 8, 2011. These documents can be obtained free of charge from the sources indicated above. Additional information regarding the interests of these participants in the proxy solicitation and a description of their direct and indirect interests, by security holdings or otherwise, will also be included in any proxy statement and other relevant materials to be filed with the SEC when they become available.
23
Appendix
Investor Relations Contacts
Glenn R. Landau 901-419-1731 Emily Nix 901-419-4987
Media Contact
Tom Ryan 901-419-4333
24
Key Financial Statistics
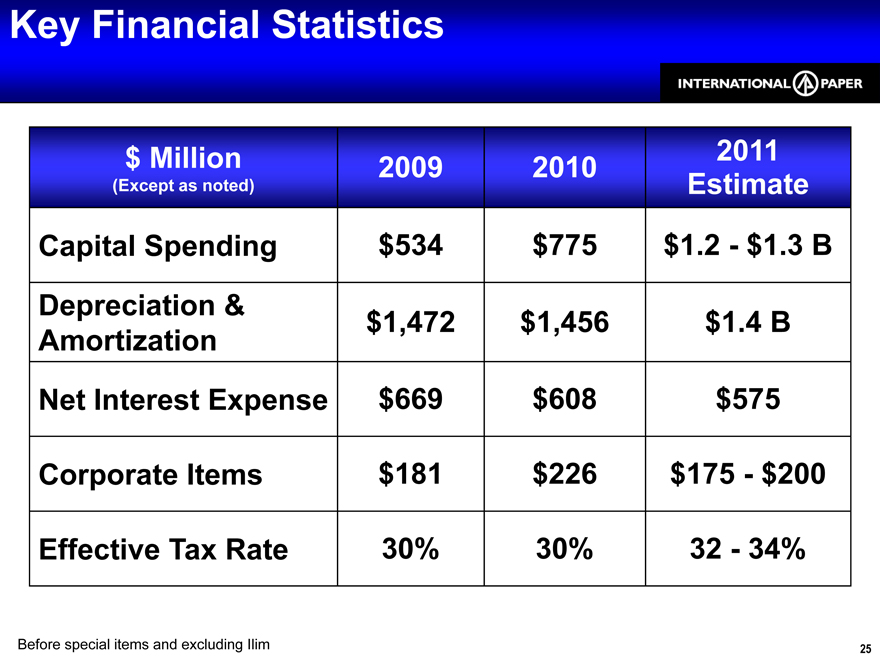
$ Million 2011 2009 2010
(Except as noted) Estimate
Capital Spending $534 $775 $1.2 - $1.3 B Depreciation & $1,472 $1,456 $1.4 B Amortization Net Interest Expense $669 $608 $575
Corporate Items $181 $226 $175 - $200
Effective Tax Rate 30% 30% 32 - 34%
Before special items and excluding Ilim 25
Free Cash Flow
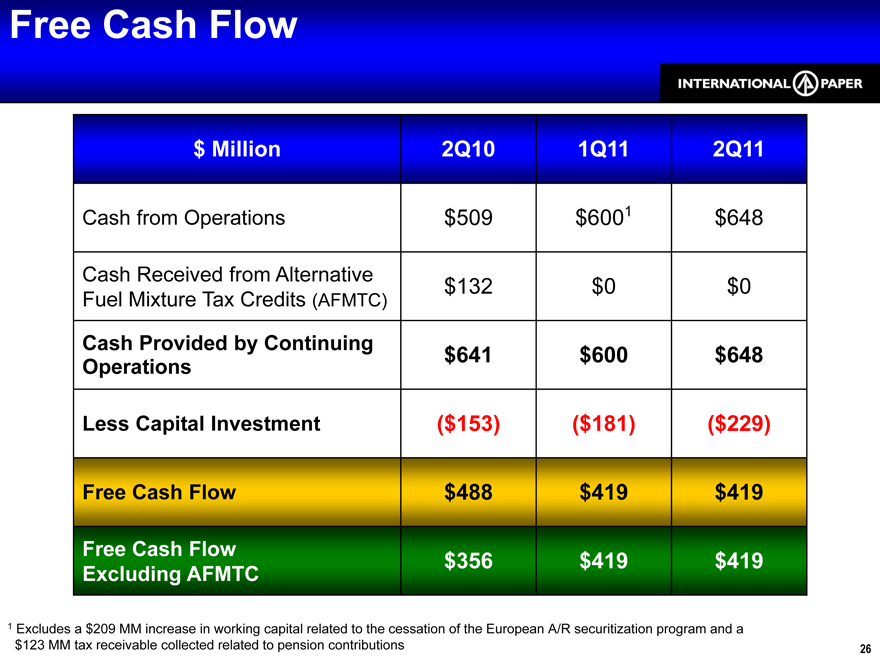
$ Million 2Q10 1Q11 2Q11
Cash from Operations $509 $6001 $648
Cash Received from Alternative $132 $0 $0 Fuel Mixture Tax Credits (AFMTC)
Cash Provided by Continuing $641 $600 $648 Operations
Less Capital Investment ($153) ($181) ($229)
Free Cash Flow $488 $419 $419
Free Cash Flow $356 $419 $419 Excluding AFMTC
1 Excludes a $209 MM increase in working capital related to the cessation of the European A/R securitization program and a $123 MM tax receivable collected related to pension contributions 26
Maintenance Outages Expenses
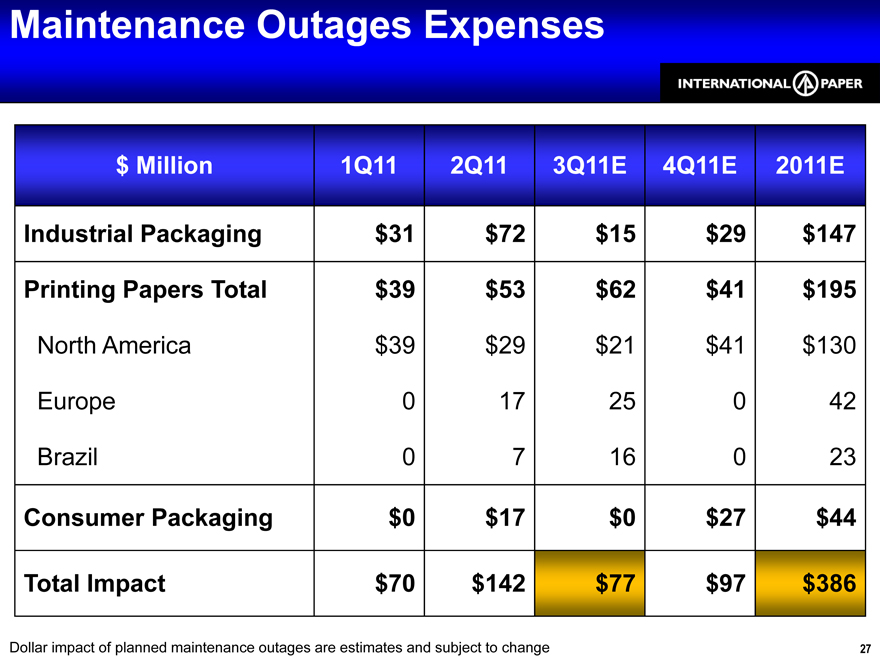
$ Million 1Q11 2Q11 3Q11E 4Q11E 2011E
Industrial Packaging $31 $72 $15 $29 $147
Printing Papers Total $39 $53 $62 $41 $195
North America $39 $29 $21 $41 $130 Europe 0 17 25 0 42 Brazil 0 7 16 0 23
Consumer Packaging $0 $17 $0 $27 $44
Total Impact $70 $142 $77 $97 $386
Dollar impact of planned maintenance outages are estimates and subject to change 27
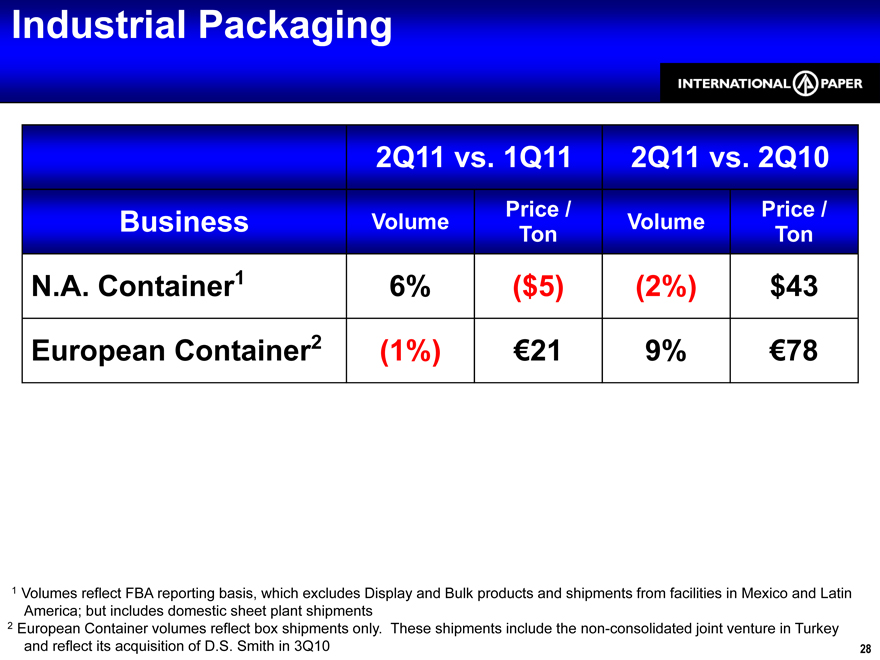
Industrial Packaging
2Q11 vs. 1Q11 2Q11 vs. 2Q10
Price / Price / Business Volume Volume Ton Ton
N.A. Container1 6% ($5) (2%) $43 European Container2 (1%) €21 9% €78
1 Volumes reflect FBA reporting basis, which excludes Display and Bulk products and shipments from facilities in Mexico and Latin America; but includes domestic sheet plant shipments
2 European Container volumes reflect box shipments only. These shipments include the non-consolidated joint venture in Turkey and reflect its acquisition of D.S. Smith in 3Q10 28
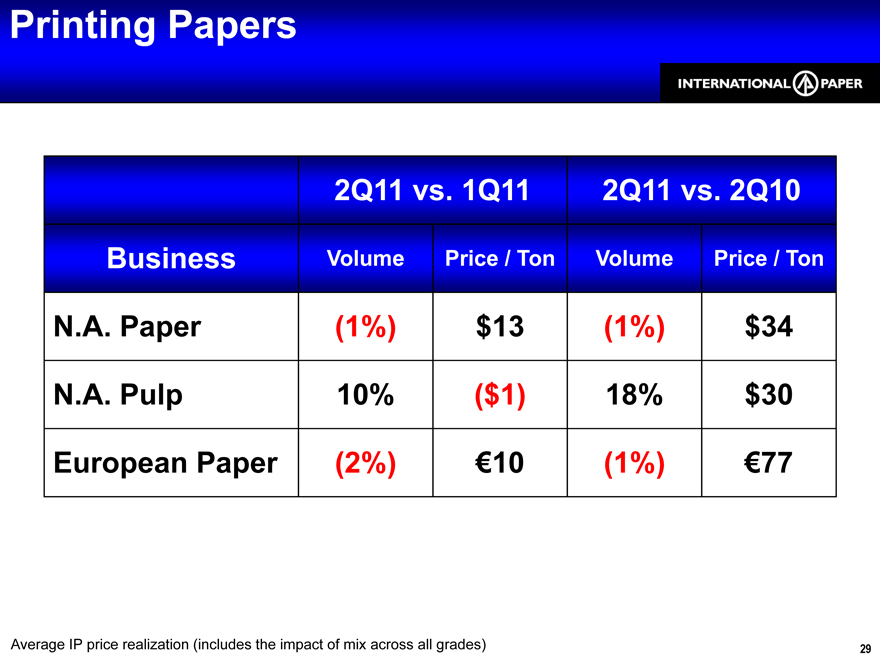
Printing Papers
2Q11 vs. 1Q11 2Q11 vs. 2Q10
Business Volume Price / Ton Volume Price / Ton
N.A. Paper (1%) $13 (1%) $34 N.A. Pulp 10% ($1) 18% $30 European Paper (2%) €10 (1%) €77
Average IP price realization (includes the impact of mix across all grades) 29
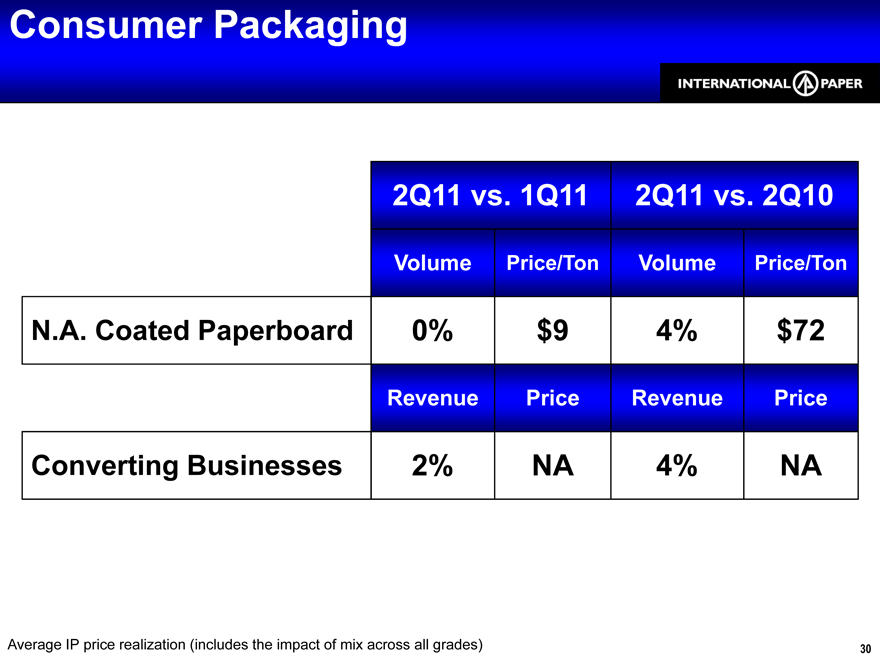
Consumer Packaging
2Q11 vs. 1Q11 2Q11 vs. 2Q10
Volume Price/Ton Volume Price/Ton
N.A. Coated Paperboard 0% $9 4% $72
Revenue Price Revenue Price
Converting Businesses 2% NA 4% NA
Average IP price realization (includes the impact of mix across all grades) 30
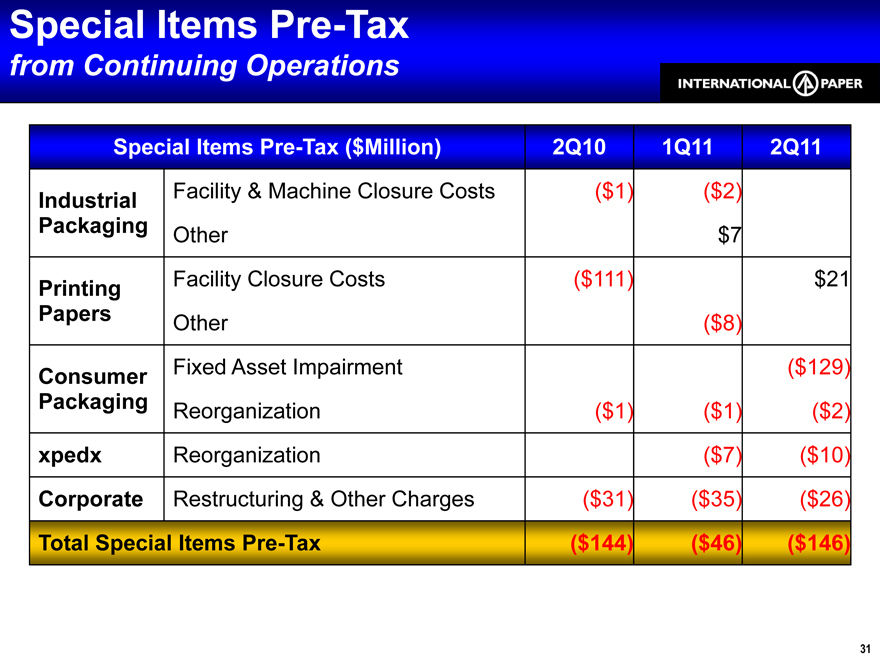
Special Items Pre-Tax
from Continuing Operations
Special Items Pre-Tax ($Million) 2Q10 1Q11 2Q11 Industrial Facility & Machine Closure Costs ($1) ($2)
Packaging Other $7
Printing Facility Closure Costs ($111) $21
Papers Other ($8)
Consumer Fixed Asset Impairment ($129) Packaging Reorganization ($1) ($1) ($2) xpedx Reorganization ($7) ($10) Corporate Restructuring & Other Charges ($31) ($35) ($26)
Total Special Items Pre-Tax ($144) ($46) ($146)
31
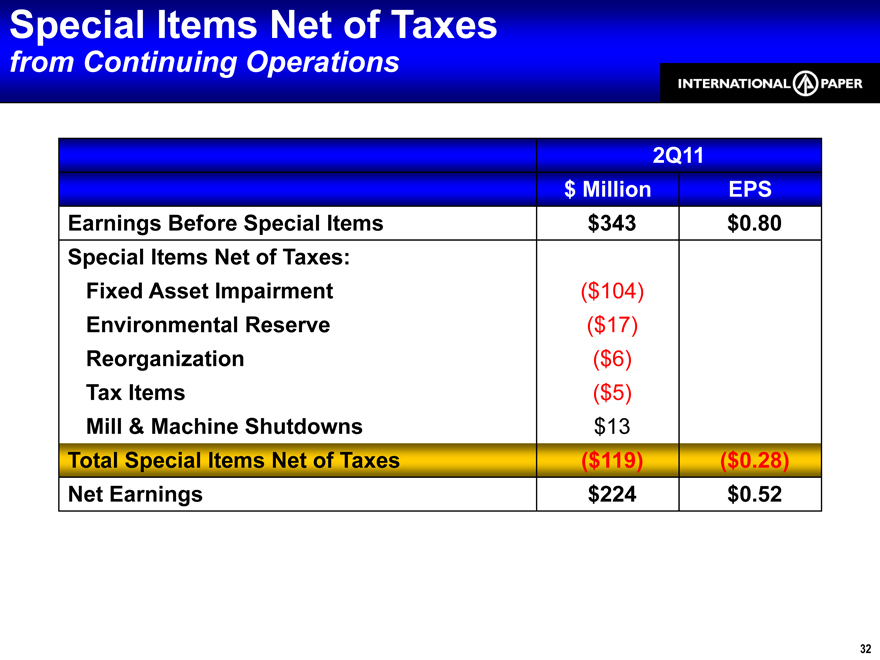
Special Items Net of Taxes
from Continuing Operations
2Q11 $ Million EPS
Earnings Before Special Items $343 $0.80 Special Items Net of Taxes: Fixed Asset Impairment ($104) Environmental Reserve ($17) Reorganization ($6) Tax Items ($5) Mill & Machine Shutdowns $13 Total Special Items Net of Taxes ($119) ($0.28) Net Earnings $224 $0.52
32
2Q11 EBITDA
Operating
D & A Tons EBITDA EBITDA Profit $ Million Thousand per Ton Margin $ Million
Industrial Packaging
North America1 $250 $120 2,578 $144 17.9% Europe $16 $7 266 $86 7.8%
Printing Papers
North America2 $101 $50 681 $222 21.7% Europe3 $45 $20 306 $212 19.7% Brazil $39 $38 270 $285 26.1% U.S. Market Pulp $35 $13 252 $190 24.6%
Consumer Packaging
N.A. Coated Paperboard $60 $35 364 $261 21.6%
1 Excludes Recycling & Bag businesses; includes Saturating Kraft business
2 Includes Bleached Kraft business
3 Excludes Market Pulp 33
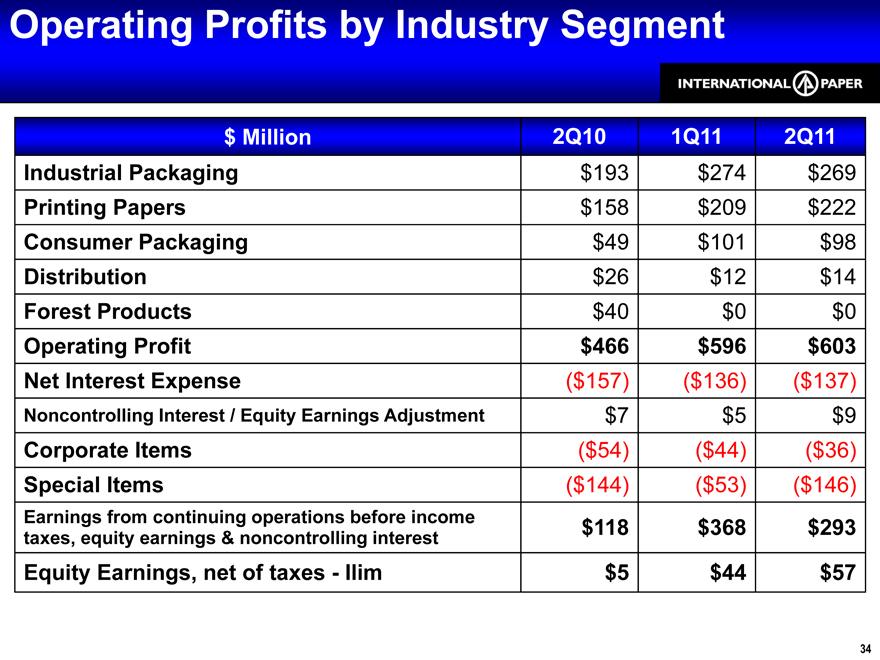
Operating Profits by Industry Segment
$ Million 2Q10 1Q11 2Q11 Industrial Packaging $193 $274 $269 Printing Papers $158 $209 $222 Consumer Packaging $49 $101 $98 Distribution $26 $12 $14 Forest Products $40 $0 $0 Operating Profit $466 $596 $603 Net Interest Expense ($157) ($136) ($137)
Noncontrolling Interest / Equity Earnings Adjustment $7 $5 $9
Corporate Items ($54) ($44) ($36) Special Items ($144) ($53) ($146)
Earnings from continuing operations before income
$118 $368 $293
taxes, equity earnings & noncontrolling interest
Equity Earnings, net of taxes—Ilim $5 $44 $57
34
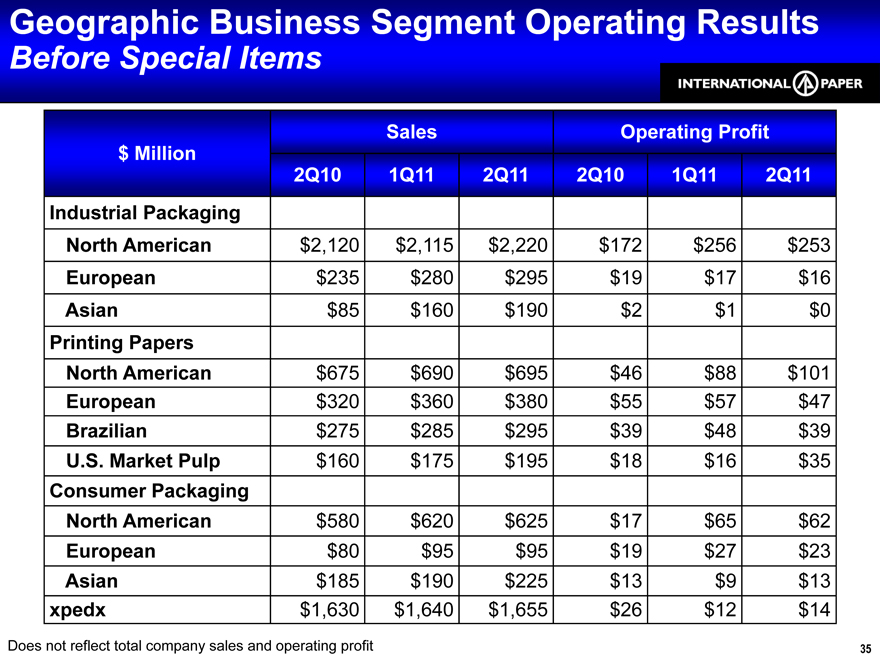
Geographic Business Segment Operating Results
Before Special Items
Sales Operating Profit $ Million 2Q10 1Q11 2Q11 2Q10 1Q11 2Q11 Industrial Packaging North American $2,120 $2,115 $2,220 $172 $256 $253
European $235 $280 $295 $19 $17 $16
Asian $85 $160 $190 $2 $1 $0
Printing Papers
North American $675 $690 $695 $46 $88 $101 European $320 $360 $380 $55 $57 $47 Brazilian $275 $285 $295 $39 $48 $39 U.S. Market Pulp $160 $175 $195 $18 $16 $35
Consumer Packaging
North American $580 $620 $625 $17 $65 $62 European $80 $95 $95 $19 $27 $23 Asian $185 $190 $225 $13 $9 $13 xpedx $1,630 $1,640 $1,655 $26 $12 $14
Does not reflect total company sales and operating profit 35
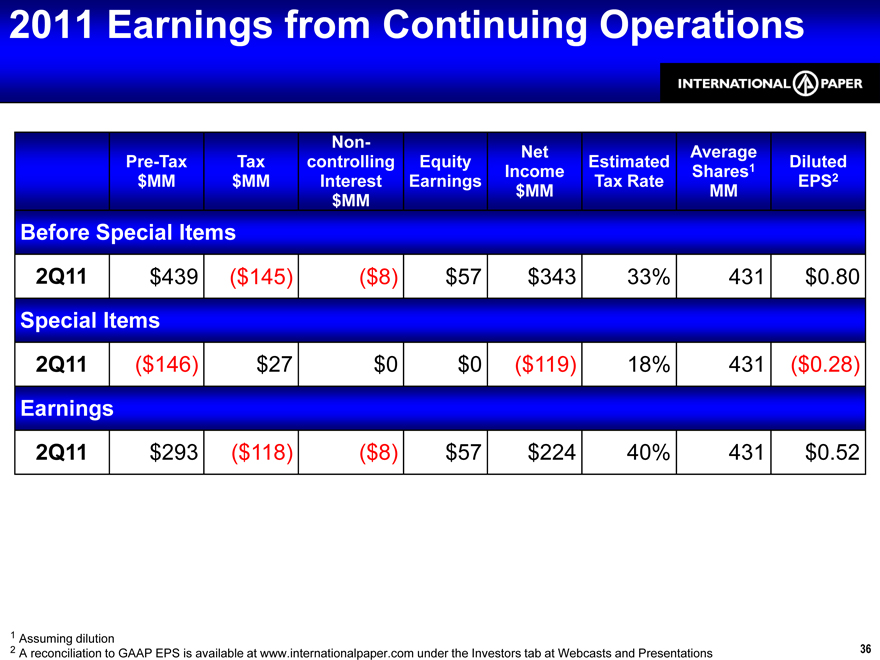
2011 Earnings from Continuing Operations
Non-
Net Average
Pre-Tax Tax controlling Equity Estimated 1 Diluted Income Shares 2 $MM $MM Interest Earnings Tax Rate EPS $MM MM $MM
Before Special Items
2Q11 $439 ($145) ($8) $57 $343 33% 431 $0.80
Special Items
2Q11 ($146) $27 $0 $0 ($119) 18% 431 ($0.28)
Earnings
2Q11 $293 ($118) ($8) $57 $224 40% 431 $0.52
1 Assuming dilution
2 A reconciliation to GAAP EPS is available at www.internationalpaper.com under the Investors tab at Webcasts and Presentations 36
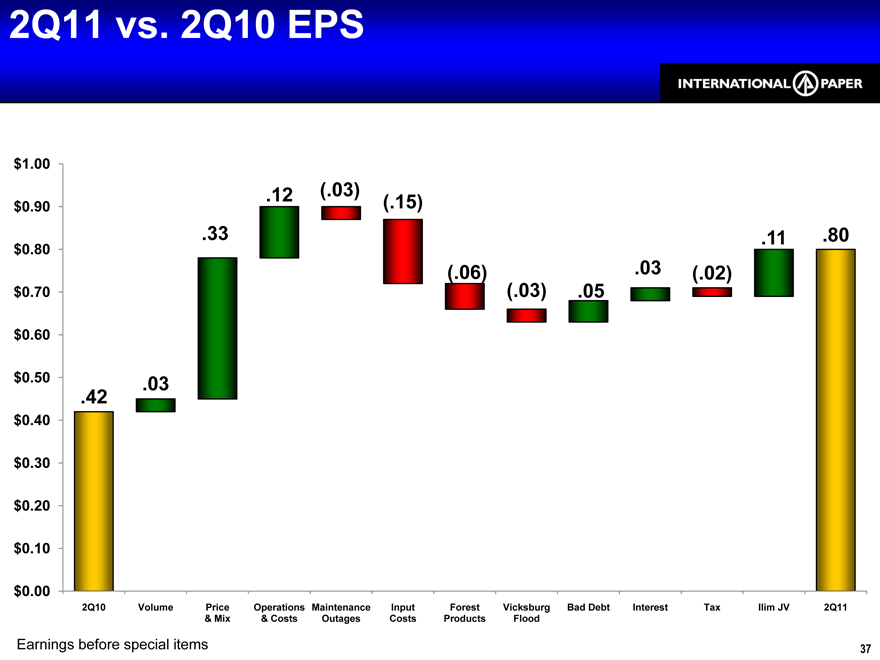
2Q11 vs. 2Q10 EPS
$1.00
.12 (.03)
$0.90 (.15)
.33 .11 .80
$0.80
( .06) .03 ( .02) $0.70 (.03) .05
$0.60
$0.50 .03
.42
$0.40 $0.30 $0.20 $0.10
$0.00
2Q10 Volume Price Operations Maintenance Input Forest Vicksburg Bad Debt Interest Tax Ilim JV 2Q11
& Mix & Costs Outages Costs Products Flood
Earnings before special items 37
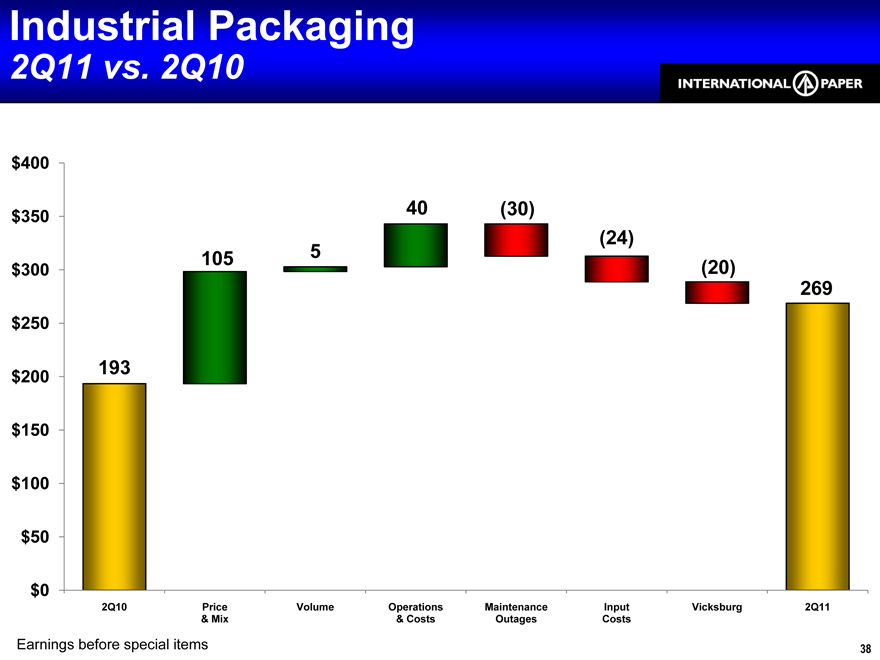
Industrial Packaging
2Q11 vs. 2Q10
$400
$350 40 (30)
$300 (20)
269
$250
193
$200 $150 $100 $50
$0
2Q10 Price Volume Operations Maintenance Input Vicksburg 2Q11
& Mix & Costs Outages Costs
Earnings before special items 38
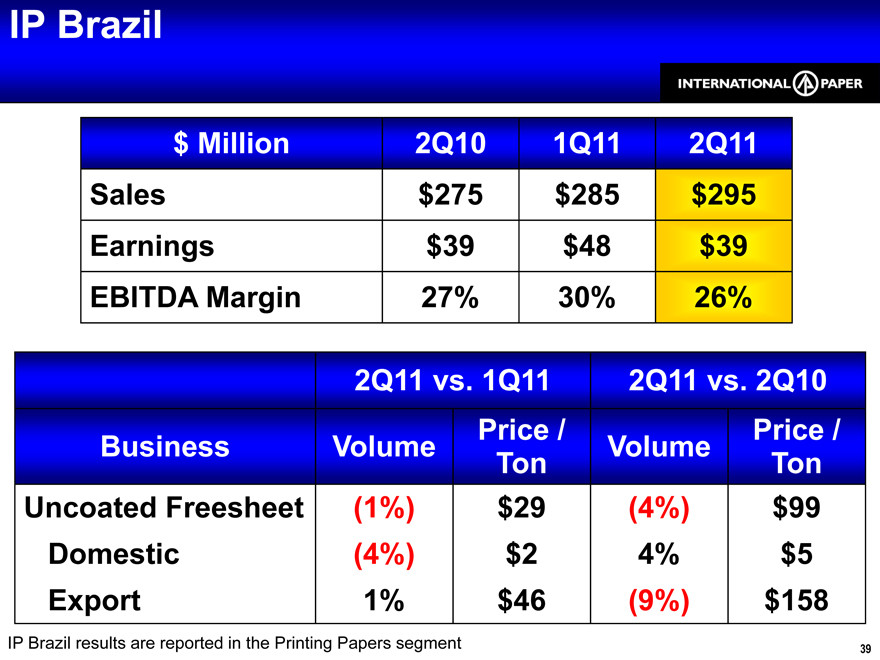
IP Brazil
$ Million 2Q10 1Q11 2Q11 Sales $275 $285 $295 Earnings $39 $48 $39 EBITDA Margin 27% 30% 26%
2Q11 vs. 1Q11 2Q11 vs. 2Q10 Price / Price / Business Volume Volume Ton Ton Uncoated Freesheet (1%) $29 (4%) $99 Domestic (4%) $2 4% $5 Export 1% $46 (9%) $158
IP Brazil results are reported in the Printing Papers segment 39
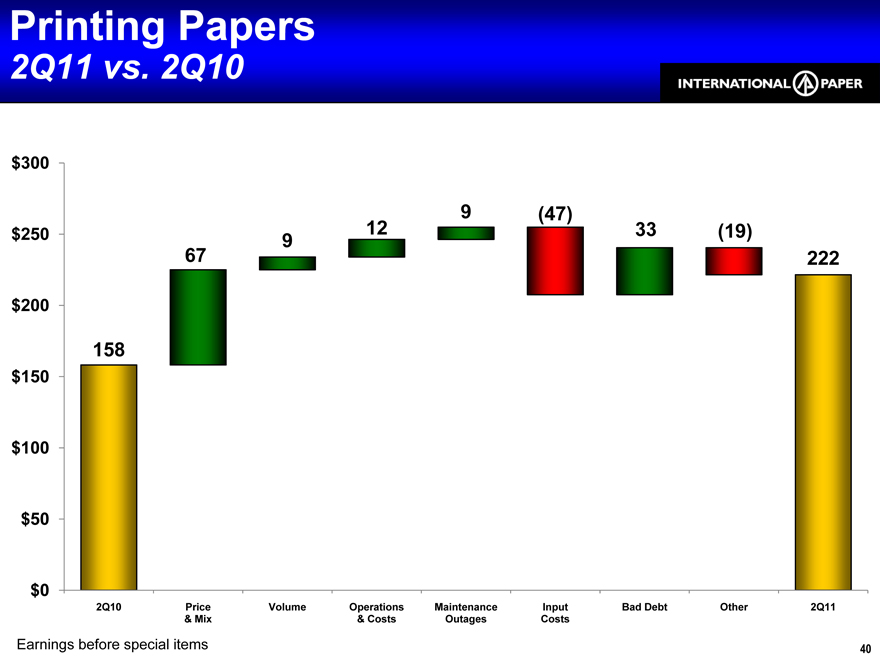
Printing Papers
2Q11 vs. 2Q10
$300
9 (47) $250 12 33 (19) 9
67 222
$200
158
$150 $100 $50
$0
2Q10 Price Volume Operations Maintenance Input Bad Debt Other 2Q11
& Mix & Costs Outages Costs
Earnings before special items 40
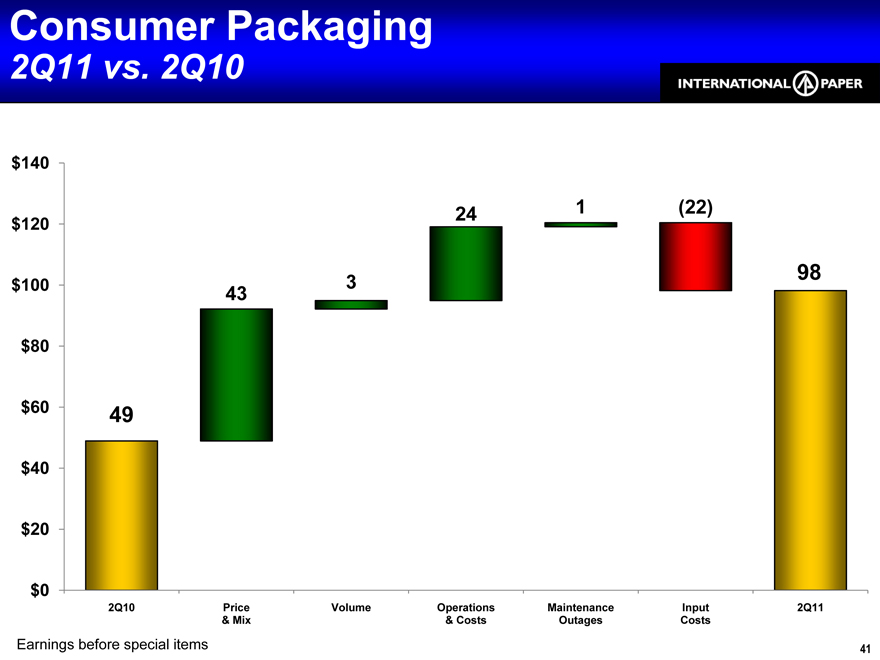
Consumer Packaging
2Q11 vs. 2Q10
$140
24 1 (22)
$120
98
$100 3
43
$80
$60 49 $40
$20
$0
2Q10 Price Volume Operations Maintenance Input 2Q11
& Mix & Costs Outages Costs
Earnings before special items 41
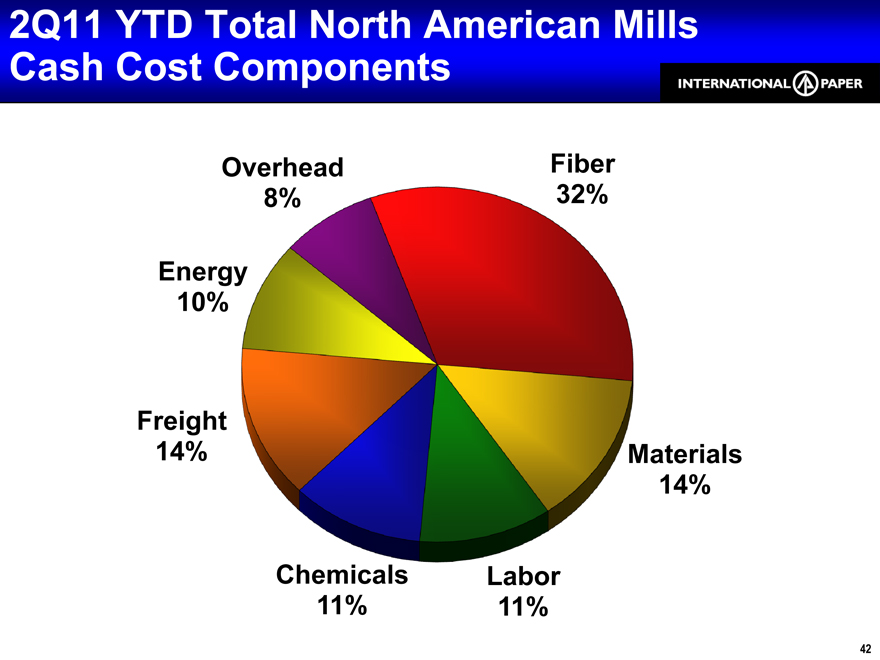
2Q11 YTD Total North American Mills Cash Cost Components
Overhead Fiber
8% 32%
Energy 10%
Freight
14% Materials 14%
Chemicals Labor 11% 11%
42
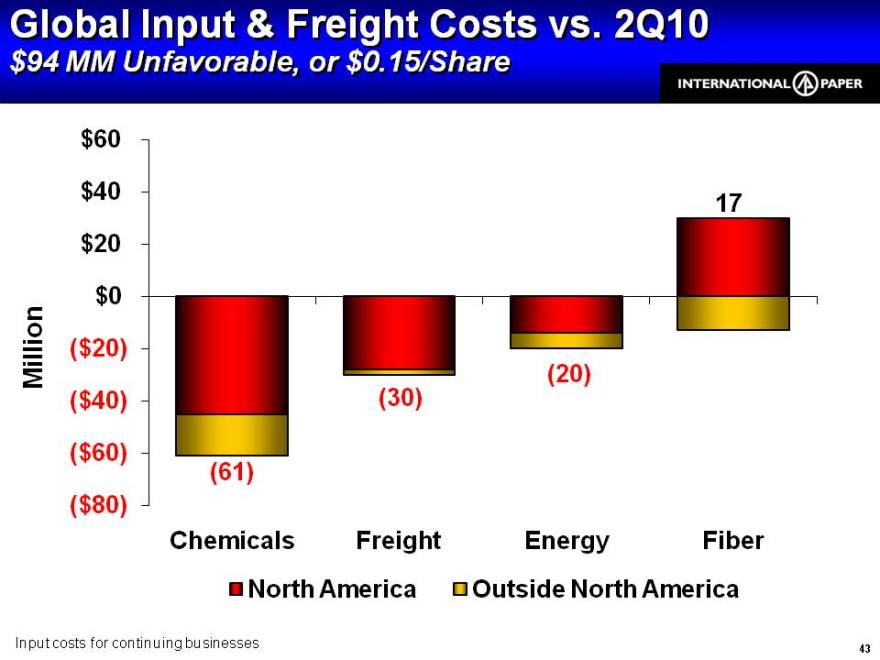
Global Input & Freight Costs vs. 2Q10
$94 MM Unfavorable, or $0.15/Share
$60
$40
17 $20
$0
Million ($20)
(20)
($40) (30)
($60)
($80)
Chemicals Freight Energy Fiber Outside North America North America
Input costs for continuing businesses 43
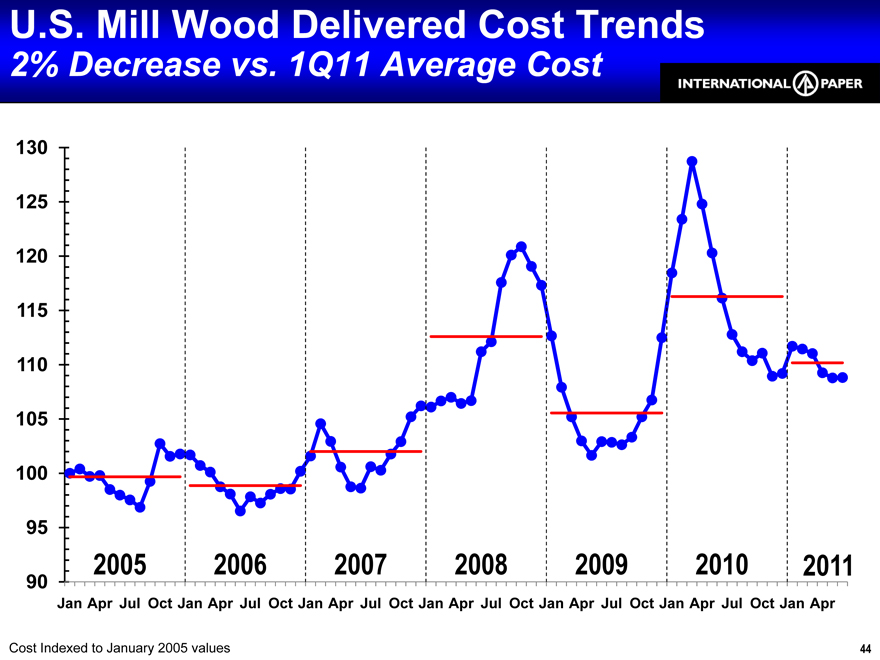
U.S. Mill Wood Delivered Cost Trends
2% Decrease vs. 1Q11 Average Cost
130 125 120 115 110 105 100
95
2005 2006 2007 2008 2009 2010 2011
90
Jan Apr Jul Oct Jan Apr Jul Oct Jan Apr Jul Oct Jan Apr Jul Oct Jan Apr Jul Oct Jan Apr Jul Oct Jan Apr
Cost Indexed to January 2005 values 44
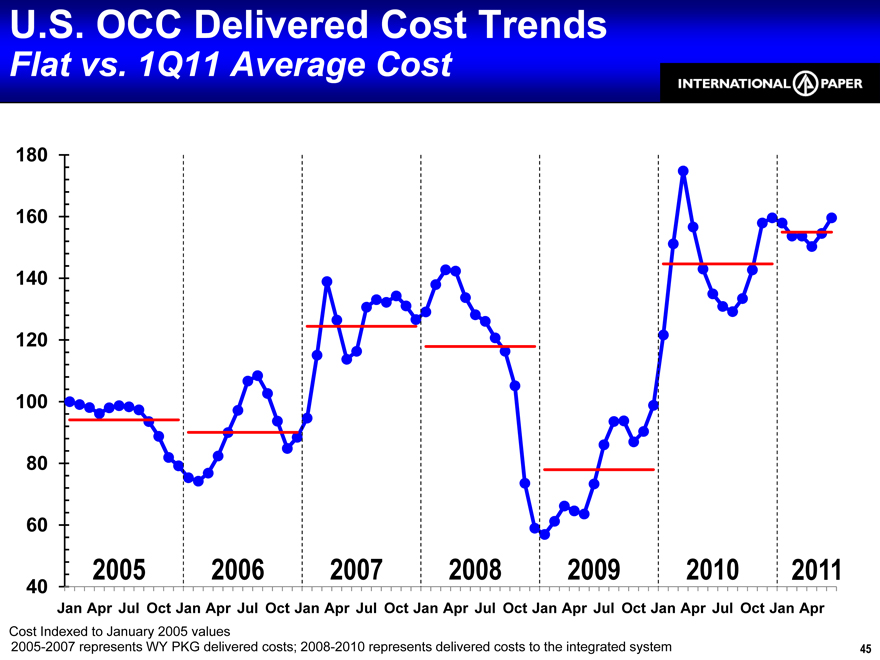
U.S. OCC Delivered Cost Trends
Flat vs. 1Q11 Average Cost
180 160 140 120 100 80
60
2005 2006 2007 2008 2009 2010 2011
40
Jan Apr Jul Oct Jan Apr Jul Oct Jan Apr Jul Oct Jan Apr Jul Oct Jan Apr Jul Oct Jan Apr Jul Oct Jan Apr
Cost Indexed to January 2005 values
2005-2007 represents WY PKG delivered costs; 2008-2010 represents delivered costs to the integrated system 45
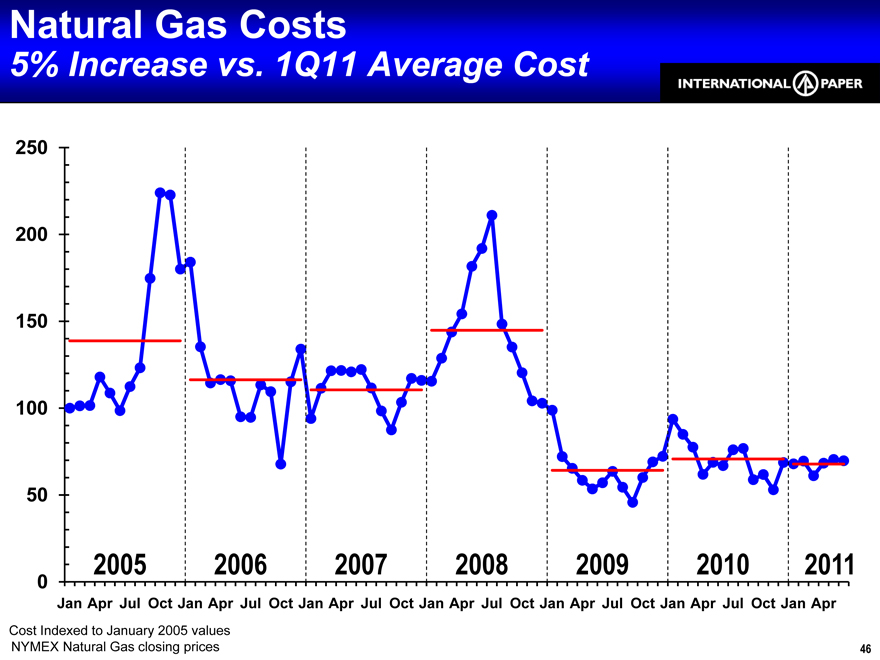
Natural Gas Costs
5% Increase vs. 1Q11 Average Cost
250 200 150 100
50
2005 2006 2007 2008 2009 2010 2011
0
Jan Apr Jul Oct Jan Apr Jul Oct Jan Apr Jul Oct Jan Apr Jul Oct Jan Apr Jul Oct Jan Apr Jul Oct Jan Apr
Cost Indexed to January 2005 values
NYMEX Natural Gas closing prices 46
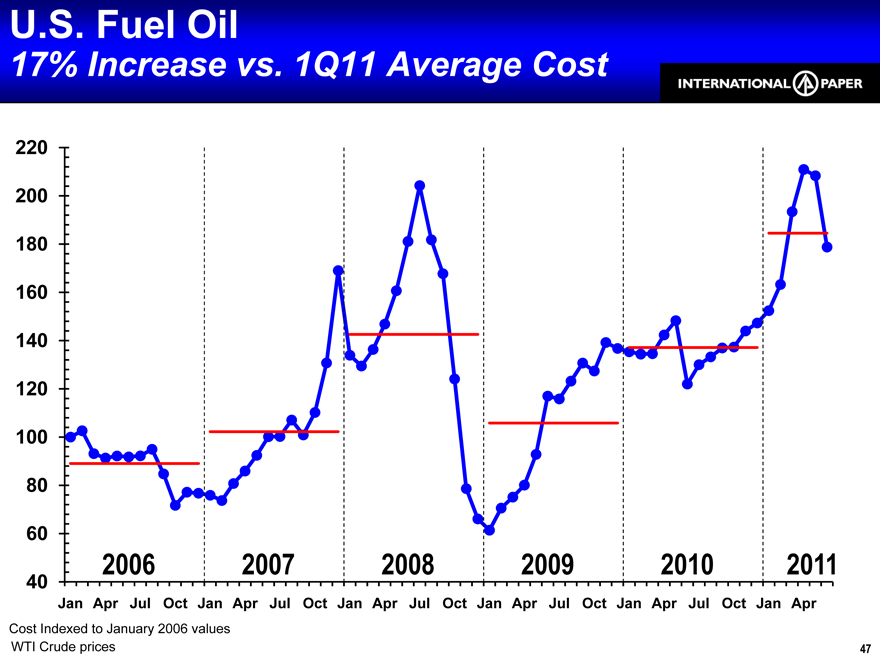
U.S. Fuel Oil
17% Increase vs. 1Q11 Average Cost
220 200 180 160 140 120 100 80
60
2006 2007 2008 2009 2010 2011
40
Jan Apr Jul Oct Jan Apr Jul Oct Jan Apr Jul Oct Jan Apr Jul Oct Jan Apr Jul Oct Jan Apr
Cost Indexed to January 2006 values
WTI Crude prices 47
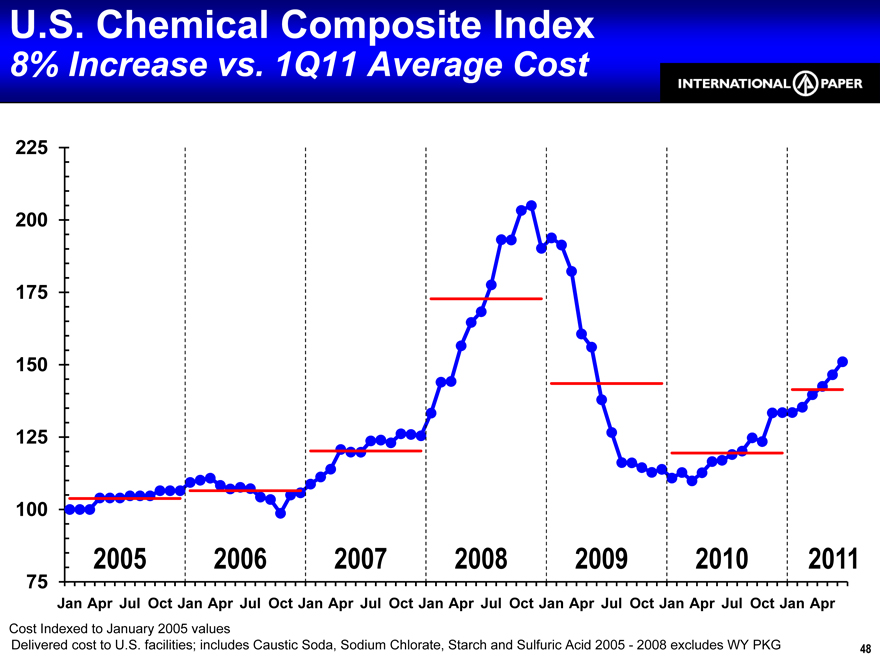
U.S. Chemical Composite Index
8% Increase vs. 1Q11 Average Cost
225 200 175 150 125
100
2005 2006 2007 2008 2009 2010 2011
75
Jan Apr Jul Oct Jan Apr Jul Oct Jan Apr Jul Oct Jan Apr Jul Oct Jan Apr Jul Oct Jan Apr Jul Oct Jan Apr
Cost Indexed to January 2005 values
Delivered cost to U.S. facilities; includes Caustic Soda, Sodium Chlorate, Starch and Sulfuric Acid 2005—2008 excludes WY PKG 48
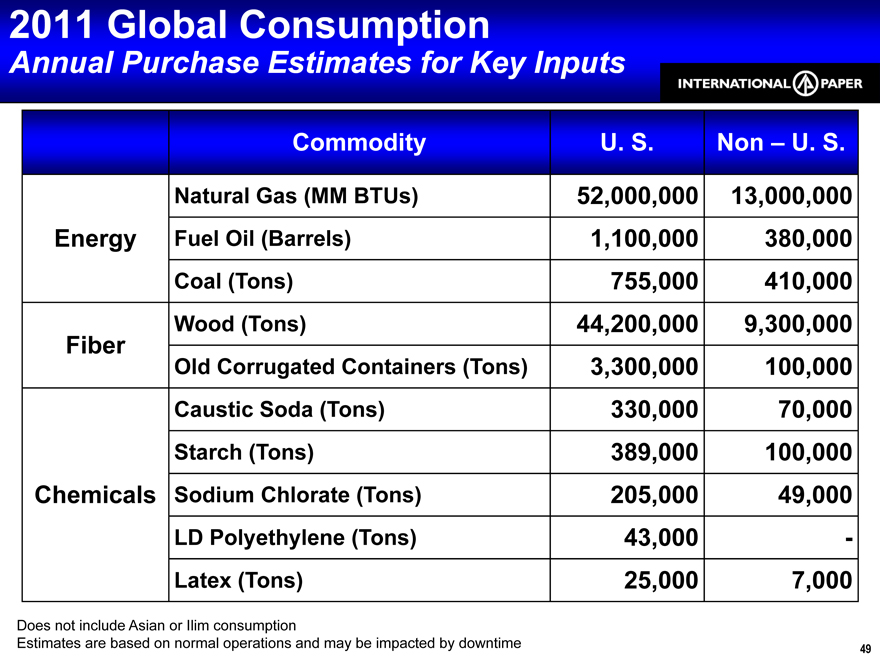
2011 Global Consumption
Annual Purchase Estimates for Key Inputs
Commodity U. S. Non – U. S.
Natural Gas (MM BTUs) 52,000,000 13,000,000 Energy Fuel Oil (Barrels) 1,100,000 380,000 Coal (Tons) 755,000 410,000 Fiber Wood (Tons) 44,200,000 9,300,000 Old Corrugated Containers (Tons) 3,300,000 100,000 Caustic Soda (Tons) 330,000 70,000 Starch (Tons) 389,000 100,000 Chemicals Sodium Chlorate (Tons) 205,000 49,000 LD Polyethylene (Tons) 43,000 -Latex (Tons) 25,000 7,000
Does not include Asian or Ilim consumption
Estimates are based on normal operations and may be impacted by downtime 49