
Exhibit 99.1 On April 28, 2022, The Interpublic Group of Companies, Inc. held a conference call to discuss its first-quarter 2022 results. CALL PARTICIPANTS IPG PARTICIPANTS Philippe Krakowsky Chief Executive Officer Ellen Johnson Executive Vice President, Chief Financial Officer Jerry Leshne Senior Vice President, Investor Relations ANALYST PARTICIPANTS Jason B. Bazinet Citi David Karnovsky J.P. Morgan Tim Nollen Macquarie Daniel Salmon BMO Capital Markets Michael Nathanson MoffettNathanson

2 CONFERENCE CALL TRANSCRIPT COMPANY PRESENTATION AND REMARKS Operator: Good morning, and welcome to the Interpublic Group first-quarter 2022 conference call. . . . I would now like to introduce Mr. Jerry Leshne, Senior Vice President of Investor Relations. Sir, you may begin. Jerry Leshne, Senior Vice President, Investor Relations: Good morning. Thank you. I hope you are all well. This morning we are joined by our CEO, Philippe Krakowsky, and by Ellen Johnson, our CFO. We have posted our earnings release and our slide presentation on our website, interpublic.com. We plan to begin our call with prepared remarks, to be followed by Q&A. We plan to conclude before market open at 9:30 Eastern time. During this call, we will refer to forward-looking statements about our Company. These are subject to the uncertainties in the cautionary statement that is included in our earnings release and the slide presentation, and further detailed in our 10-Q and other filings with the SEC. We will also refer to certain non-GAAP measures. We believe that these measures provide useful supplemental data that, while not a substitute for GAAP measures, allow for greater transparency in the review of our financial and operational performance. At this point, it is my pleasure to turn things over to Philippe Krakowsky. Philippe Krakowsky, Chief Executive Officer Thanks, Jerry, and good morning. As you all know, for two years now, since the onset of the pandemic, we’ve begun these calls by sharing wishes for our collective health and safety. Yet, in the early part of this year, the world dramatically changed again, and the invasion of Ukraine means that people on the ground there are anything but safe. So before getting on with the business of this call, it seems appropriate and actually even necessary to express our support for the Ukrainian people. Across our Company, IPG colleagues have been focused on doing their part to help during this crisis. Some of us closer to Ukraine have assisted with transportation near the border. Others have helped with refugees’ resettlement and with access to housing and medical services, and several of our agencies in Eastern Europe have opened their doors to displaced colleagues. Of course we are also making significant donations to
3 humanitarian organizations at all levels of the Company and matching employee donations as well. On a related note, we’ve disengaged from our Russian operations, though having first provided for our associates there, many of whom are individuals with whom we’ve worked for many decades, to receive a minimum of six months’ salaries. And amid this ongoing tragedy, all of us continue to hope for a de-escalation of the war and ultimately for peace, so as to bring an end to the immense and senseless human suffering that we are witnessing. Turning now to the reason for our call, which is obviously to discuss our business results, I’m going to start with a high-level view of our performance in the quarter. Ellen will then provide additional details. And I’ll conclude with updates on the highlights at our agencies, to be followed, as Jerry said, by Q&A. We are pleased to report a strong start to the year. First-quarter organic net revenue growth was 11.5%. That reflects strong performance in both the U.S., with organic growth of 12.2%, and in our international markets, with organic growth of 10.2%, as well as increases in every world region. We’re also pleased to share with you strong first-quarter growth across each of our three new reportable segments. We indicated in February that operational changes would result in revisions to our segment structure as of the start of the year. Many of you have already seen last week’s filing, in which we describe our new segments and their recent history of financial performance. Going back nearly two decades, we had operated and reported with two segments, IAN and DXTRA. Yet during that time period, there have of course been significant changes in our business, the needs of our clients and the workings of consumer and media ecosystems. Those changes were significantly accelerated as a result of the pandemic. And as you know, above all, IPG is a client-centric company. Our offerings and businesses collaborate by design, in order to help clients win in an increasingly digital- first, fragmented media environment. Our go-to-market strategy therefore supports the need to provide integrated, multi-agency services that span reportable segments. That means that our operations will always reflect the strategic reality that marketers should have access to the best capabilities and talent, no matter where they sit across IPG. We bring these complementary skill sets together in what we call “Open Architecture” teams that drive clients’ business success. Concurrently, the speed at which market and client needs are changing requires a focused and disciplined approach to the way in which, as a company, we operationally manage investments in key areas of our business. This includes the creation of infrastructure and expertise that supports and can be shared by like-with-like assets. And you saw an example of that last year, when we created IPG Health, which continues to perform very well for us. Reflecting our evolution, and following a recent strategic review of operations, we’ve therefore realigned our business operations to comprise three reportable segments.

4 They are Media, Data & Engagement Solutions, Integrated Advertising & Creativity Led Solutions, and Specialized Communications & Experiential Solutions. In the first quarter, each segment grew at a double-digit organic rate, which demonstrates the strength of our offerings across the portfolio. Organic growth was 11.5% at MD&E, 11.2% at IA&C, and 12.5% at SC&E. Our global growth was also highlighted by consistent increases across client sectors. We were paced by double-digit percentage increases in our “Other” sector of leisure, government and industrial clients, as well as double-digit growth in the retail, tech & telecom, financial services, healthcare and auto & transportation sectors. Turning to operating expenses and profitability, our teams once again demonstrated outstanding discipline, even as we continued to invest to support our growth. Net income in the quarter was $159.4 million as reported. And our adjusted EBITA was $273.6 million, which excludes a small charge related to the 2020 restructuring program, resulting in net revenue margin of 12.3%, in our smallest seasonal quarter. Our margin comparisons to prior first quarters continue to reflect the ins and outs of the pandemic. Compared to a year ago, under very strong revenue growth, headcount has grown approximately 11%. Some variable expenses, such as travel & related, and return-to-office costs, are well above the levels of a year ago, though not fully to historic norms. A year ago, comparable first-quarter margin was 13.1%. And for context, in both 2019 and 2020, our first-quarter margins were approximately 5%. With our strong margin result in this year’s first quarter, we are confident that we continue to see the benefits of the strategic restructuring actions taken in 2020. Diluted earnings per share was $0.40 as reported and was $0.47 as adjusted for intangibles amortization and other items. You’ll recall that, in February, we announced that our Board had reauthorized our share repurchase program. And in the first quarter, we repurchased 1.8 million shares, using $63 million. We’re pleased to be able to share with you this strong set of results, which builds on our long-term record of industry outperformance, as well as our new disclosure, which furthers our longstanding commitment to transparency, in order to assist in your analytical work and assessment of our Company. A differentiator of our performance, in the quarter and over a period of many years, has been our ability to create marketing and media solutions that bring together creativity, technology and data. This combination is responsive to the evolving needs of our clients and allows us to assist them by delivering higher-order client solutions. The growth you are seeing is driven by these highly relevant capabilities, amidst an expanding set of marketer needs for more precise, personalized and accountable engagements with their audiences at an individual level. Our first quarter, as I said earlier, is seasonally our smallest quarter, and most of the year remains ahead of us. We understand that we are at a moment of elevated global uncertainty across multiple dimensions, whether geopolitical, macroeconomic or in

5 terms of public health. These are part of the current reality facing every company today. However, despite these uncertainties, and having recently refreshed our bottom-up outlook for the year with key clients and with our operating teams, the tone of the business remains positive. This leads us to believe it’s appropriate to update our revenue target for the year. You’ll recall that, in February, we shared our expectation for approximately 5% organic growth in 2022. We would see that as a strong result, given that it compounds IPG’s multi-year growth stack, which significantly leads our industry going back a number of years. At this point, we are nonetheless increasing that outlook for the year, to approximately 6% organic growth, along with our expectation for adjusted EBITA margin of 16.6%. We remain confident in the things we can control, including the quality of our talent, the resources across our portfolio, and our ability to bring them together in collaborative, effective and impactful client solutions. We are, of course, staying close to our people and our clients and carefully managing expenses, and we will keep you apprised of our progress as the year develops. Our colleagues’ skill and commitment have helped us to start this year on a strong footing, and I’d therefore like to conclude this part of my remarks by once again recognizing and thanking our people for their work, on behalf of clients but also in support of each other. And at this point, I’m going to hand the call over to Ellen for a more in-depth view on our results.

6 Ellen Johnson, Executive Vice President, Chief Financial Officer: Thank you. I hope that everyone is safe and healthy. I would like to join Philippe in the recognition of our people, and to add my thanks to all of them. As a reminder, my remarks will track to the presentation slides that accompany our webcast. Beginning with the highlights on slide 2 of the presentation: Our first-quarter net revenue increased 9.8% from a year ago, with organic growth of 11.5%. Organic growth was 12.2% in the U.S., and growth was 10.2% in our international markets. We had double-digit growth in each of our three segments. First-quarter adjusted EBITA, before a small restructuring adjustment, was $273.6 million, and margin was 12.3%. Diluted earnings per share was $0.40 cents as reported and $0.47 cents as adjusted. The adjustments exclude the after-tax impacts of the amortization of acquired intangibles, the small refinement to our 2020 restructuring program and non-operating losses on certain small, nonstrategic businesses. Beginning in late February, following the $400 million re-authorization by our Board, we repurchased 1.8 million of our common shares during the quarter for $63.1 million. Turning to slide 3, you’ll see our P&L for the quarter. I’ll cover revenue and operating expenses in detail in the slides that follow. Turning to first quarter revenue in more detail, on slide 4: Our net revenue in the quarter was $2.23 billion, an increase of $199.5 million. Compared to Q1-21, the impact of the change in exchange rates was negative 1.4%, with the dollar stronger against currencies in nearly all of our international markets. Net divestitures were negative 30 basis points. Our organic net revenue increase was 11.5%. At the bottom of this slide, we break out revenue for the three new segments: Our Media, Data & Engagement Solutions segment grew 11.5%. As you can see on this slide, the segment is comprised of IPG Mediabrands, Acxiom, Kinesso and our digital and commerce specialist agencies, which include MRM, R/GA and Huge. We had very strong growth in Q1 across this segment. Our Integrated Advertising & Creativity Led Solutions segment grew 11.2%. The segment is comprised of McCann, IPG Health, MullenLowe Group, FCB and our domestic integrated agencies. We had strong growth at all of our global networks. At our Specialized Communications & Experiential Solutions segment, organic growth was 12.5%. The segment is comprised of IPG DXTRA and DXTRA Health,

7 Weber, Golin, Jack Morton, Momentum and Octagon. We had strong Q1 growth across all of our major disciplines. We were led by events and sports & entertainment, continuing an unmistakable recovery from the impact of the pandemic. The three-year organic growth of our Jack Morton, Momentum and Octagon agencies is now positive from the pre-pandemic level of Q1 2019. Moving on to slide 5, our organic revenue growth by region: In the U.S., which was 66% of net revenue in the quarter, our organic increase was 12.2%. We exhibited strong broad-based growth across segments, agencies and client sectors. International markets were 34% of our net revenue in the quarter and increased 10.2% organically. We grew in every international region. o Continental Europe grew 9.4%. It is worth noting that’s on top of 12.4% a year ago. We had increases in nearly every national market, including our largest markets of France, Germany, Spain and Italy. There was no noticeable drop-off in the quarter in our smaller Eastern European markets. o The U.K. increased 1.5% organically. We had very strong increases in the experiential, media and tech disciplines, and at McCann, but those were largely offset by client-specific actions elsewhere in the portfolio. o AsiaPac grew 9.2% organically, driven by growth across our largest markets of Australia, India and Japan, while Singapore was flat and China decreased. o Our organic growth in LatAm was 21.5%, with strong results across all disciplines. This was notably so at our digital specialist agencies and media in our MD&E segment and our global networks in our IA&C segment. o Our Other Markets group, which is Canada, the Middle East and Africa, grew 19.9%, with strong growth in each region. Moving on to slide 6 and operating expenses in the quarter: Our net operating expenses, which exclude billable expenses, the amortization of acquired intangibles and the restructuring adjustment, increased 10.9% from a year ago, under growth of net revenue of 9.8%. The result was margin of 12.3%, compared to 13.1% a year ago. Our first-quarter result is a significant increase from 2019 and 2020, when our first-quarter margins were approximately 5%. Our fully adjusted EBITA margins by segment in the quarter were 10.9% in MD&E, 14.2% in IA&C and 16.8% in SC&E. These margins are in the appendix on slide 17. In general, we expect each segment margin to have quarterly seasonality similar to that of our consolidated results over time, with MD&E showing the stronger seasonality over the course of the year.

8 As you can see on this slide, our ratio of total salaries & related expense as a percentage of net revenue was 70.2%. Again, all of these ratios are against our smallest quarterly revenue base of the year. o Underneath that SRS result, we de-levered on our expense for base payroll, benefits & tax due to aggressive hiring over the course of the past year that was necessary to support our 14.3% organic growth over the trailing twelve months. o Our expense for performance-based employee incentive comp was equal to last year’s in dollar terms and, therefore, lower as a percent of net revenue, 4.0% this year, compared with 4.3% a year ago. o Severance expense was 50 basis points of net revenue, compared with 30 basis points a year ago. o Temporary labor expense was 4.8% of revenue, compared with 4.6% in Q1-21. o At quarter-end, total worldwide headcount increased by 11% from a year ago to 56,800, to support our growth. Also on this slide, our office & other direct expense was 14.5% of net revenue, compared to 14.4% a year ago. o Underneath that, we continued to leverage our expense for occupancy, which was 5.1% of net revenue, an improvement of 50 basis points from Q1-21. o All other O&G was 9.4% of net revenue, compared with 8.8% a year ago, due to the return of certain variable expenses, such as our investment in travel, employment and client-service costs as a result of increased levels of business activity. Our SG&A expense was 0.9% of net revenue, a decrease of 50 basis points from the prior year. On slide 7 we present detail on adjustments to our reported first-quarter results, in order to provide better transparency and a picture of comparable performance. This begins on the left-hand side with our reported results and steps through to adjusted EBITA and our adjusted diluted EPS. Our expense for the amortization of acquired intangibles, in the second column, was $21.3 million. The restructuring charges were $6.6 million, which are small estimate adjustments related to our 2020 restructuring program. Below operating expenses, in column 4, we had a pre-tax loss in the quarter of $6.4 million in other expenses, due to the disposition of a few small, nonstrategic businesses. At the foot of this slide, you can see the after-tax impact per diluted share of each of these adjustments, which bridges our diluted EPS as reported at $0.40 to adjusted earnings of $0.47 per diluted share.

9 On slide 8 we turn to cash flow in the quarter: Cash used in operations was $633.6 million, compared with $249.8 million a year ago. o As a reminder, our operating cash flow is highly seasonal. We typically generate significant cash from working capital in the fourth quarter and use cash in the first quarter. During this year’s first quarter, cash used in working capital was $865 million and follows our fourth quarter of last year, when we generated over a billion dollars from working capital. The net of the two is $194 million of cash generated from working capital, which is squarely in the range of our recent history. In our investing activities, we used $28.8 million, mainly for cap-ex in the quarter. Our financing activities in the quarter were $210.1 million, primarily for our common stock dividend, share repurchases and taxes withheld on shares in our performance-based incentive compensation. Our net decrease in cash for the quarter was $867.5 million. Slide 9 is the current portion of our balance sheet. We ended the quarter with $2.40 billion of cash and equivalents, compared with $2.02 billion a year ago. Slide 10 depicts the maturities of our outstanding debt. As you can see on this schedule, total debt at quarter end was $3.0 billion. Our next maturity is April 2024 for only $250 million. Thereafter, our next maturity is not until 2028. In summary, on slide 11, our teams continue to execute at a high level and have us well-positioned to deliver on our expectations for the year. I would like to reiterate our pride in and gratitude for the efforts of our people. The strength of our balance sheet and liquidity mean that we remain well-positioned both financially and commercially. And with that, I’ll turn it back to Philippe.
10 Mr. Krakowsky: Thank you. As Ellen just said, our work and our people continue to set the standard for the industry, so I would also like to again thank our approximately 57,000 IPG colleagues around the globe, who contribute to our clients’ growth and the continued evolution of our business. Collectively, we are implementing our strategic vision, which is to integrate brand experiences across consumer touchpoints by combining award-winning creativity with best-in-class technology and data infrastructure. That commitment has translated into new client engagements, expanded relationships with our existing partners and programs that deliver significant growth outcomes for our clients, as well as for our own business. Turning now to specific highlights at the agency level, in the quarter, at our Media, Data & Engagement Solutions segment, we continued to see strong growth. UM won Grubhub and Eargo in the quarter. R/GA continued to perform well in new business, with a notable win when it was named AOR for the XFL pro football league. And the agency also earned a top position on Ad Age’s 2022 A-List. New client wins were strong across Acxiom, Kinesso and Matterkind. And all three of those organizations worked together with UM to provide a behavioral science led solution for the Grubhub win I mentioned a minute ago. During the quarter, Acxiom extended California Consumer Privacy Act rights to all U.S. residents. In the absence of a national U.S. privacy law, we believe this is a meaningful step because it’s clearly responsive to individual consumers who increasingly want more access to, and control of, their personal data. So I think it is fair to say this move is aligned with IPG’s commitment to going above and beyond what’s required by law, and this allows us to ensure we can support our clients’ business needs with the best data, tools and advice, and to do so by leading the way in the ethical use of data. In addition, we launched the Acxiom Partner Marketplace, which is a comprehensive offering of the leading industry-specific data under one roof. The Acxiom Partner Marketplace complements our best-in-class and foundational InfoBase data, and it gives marketers greater access to actionable and precise people-based data across a range of use cases and touchpoints on the consumer journey. And this is particularly important at a time when the ecosystem faces severe disruption due to proxy and ID deprecation. At the end of the quarter, Kinesso also launched its Outcome Navigator, which is a suite of performance-based services that drive specific business outcomes for brands, and this puts Kinesso’s Matterkind unit in line to capture more performance-based marketing budgets. During the quarter, MRM expanded its commerce consulting service in health, forming a strategic partnership with Salesforce Health Cloud, which allows it to deliver enterprise-level solutions at scale for the insurance, pharmaceutical and medical device sectors.

11 Looking now at our Integrated Advertising & Creativity Led Solutions segment, IPG Health continues its very strong performance with clients, in new business and within the industry. At the recent Manny Awards, where Med Ad News honors the best in pharmaceutical and healthcare advertising, IPG Health took home nearly 60% of the awards given. The agencies within the network won across many categories, including Most Creative Agency, Most Admired Agency, Advertising Agency of the Year and, additionally, IPG Health was named Network of the Year. Elsewhere at IA&C, following a highly competitive review, MullenLowe was named as creative agency of record by KFC, and some of that new positioning and work will be in the market shortly. MullenLowe was also named U.S. agency of record by Bayer for their Aleve brand, which further builds on our relationship with a valued existing client. Mediahub continued to show very well, winning new clients Topgolf Entertainment, Post Consumer Brands and Pacaso, which is a technology-based real estate marketplace. At FCB, we promoted a dynamic new team to lead the network. And we’ve seen a very smooth transition, so they’ve hit the ground running, with a focus on building new business opportunities. They’re fueled by the agency’s exceptional creative reputation. During the quarter, FCB was named one of the ten most innovative advertising agencies of 2022 by Fast Company, and they also featured in Ad Age’s prestigious 2022 A-List. During the quarter, FCB won new assignments from Hershey’s and Kellogg’s in North America. At McCann, Q1 saw the network win Velocity Global, a distributed workplace platform, Hansgrohe out of the U.K. and Club Med Canada. Worldgroup also continued to win organic assignments across its global client roster. At the ANDY Awards, the first major creative awards show of the season, not only was IPG named the most-awarded holding company, but McCann was named the most-awarded global network. It’s also worth noting that FCB and McCann were ranked number one and two, respectively, in ACT Responsible’s “Good Report,” which identifies the global networks doing the most powerful and effective cause-related work in our industry. And we see this as a clear reflection of the degree to which IPG’s commitment to ESG directly manifests in the work we create. Reflecting an increase in the number of global in-person events as we enter a post- pandemic world, our Specialized Communications & Experiential Solutions segment saw strong growth during the quarter. DXTRA Health posted a number of wins, where Weber Shandwick, Golin and Jack Morton came together to help companies in the biotech and pharma sector define, protect and enhance their reputations. Also during the quarter, Grubhub selected Golin to handle its consumer PR work, and NAPA Auto Parts named Golin as its first-ever PR agency. At the 2022 PRWeek U.S. Awards, which celebrate the industry’s best public relations work, Current Global, DeVries Global, Weber Shandwick, The Martin Agency and
12 MullenLowe Group combined to win 11 awards, which is more than any other holding company. R&CPMK continued to spearhead global campaigns across the entertainment industry, including the launch of Apple TV+’s “They Call Me Magic” campaign. And Octagon secured a multi-year agreement to manage event programming for Toyota to activate the company’s Olympic partnership as a lead sponsor. As a result, Octagon will develop and produce the client’s full range of activity related to the 2024 Games in Paris. As we know, the pandemic disrupted pretty much every facet of human interactions. And for brands, it upended how they seek to engage with audiences in live formats. As real-world events have begun to rebound, marketers are seeing that a hybrid component to events offers a path to reach larger, new audiences and also to improve and deepen engagement. That’s why IPG recently announced that we are bolstering our capabilities in the hybrid and digital event space by acquiring a significant stake in The Famous Group, which is an award-winning fan experience technology company which creates connected, immersive augmented and mixed reality experiences to enhance the reach and impact of live events. The capabilities at Famous Group demonstrate what we’re working to develop across all of our agencies, which is proprietary technology skills and IP that can help our agencies build deeper connections to our data resources and capabilities, as well as a path to higher-order consulting engagements with our clients. In assessing the overall IPG portfolio, we believe that we are fully provisioned and well- positioned for the future, without notable gaps in our offering. That said, we will continue to look closely at strategic options to bolster our capabilities through targeted M&A, especially opportunities that further our technology capabilities and bring proprietary tools or platform skill sets in to the Company. On prior calls, you’ll recall that we’ve identified marketing technology and business transformation consulting as key areas of focus for us going forward, as we see these as areas that can help us build on our technology layer and further accelerate our evolution into higher-value partnerships with our clients. Staying at the holding company level, we have long been clear that, for IPG, our commitment to ESG is a key strategic priority. And this includes activity in five key pillars: diversity, equity and inclusion; sustainability; human capital; data privacy; and media responsibility. As such, we are proud that, earlier this week, Forbes released its list of The Best Employers for Diversity 2022, and Interpublic is not only the highest-ranked company in our industry, we are the #5 among all U.S. companies with more than 1,000 employees. This is prestigious recognition, which was determined by Forbes and Statista, the leading statistics portal. They spoke to over 60,000 U.S. employees from across a range of large businesses, surveying them, asking them to provide direct experience and opinions about each company in the rankings. So we’re very proud of this ranking, and yet we know there is still a great deal of work to do in this space, and we’re committed to doing more to become a fairer and more representative workspace.

13 As we continue to navigate a very competitive talent market, it was also gratifying to see a number of our agencies stand out as employers of choice. IPG Health, Reprise, Revive Health and UM were recently named among Ad Age’s Best Places to Work of 2022. Stepping back now, I think that overall, we’re very pleased with our quarterly results, as they represent a strong start to 2022. Both the tone of the business as well as our net new business remain positive. And as stated earlier on this call, we feel comfortable increasing our outlook for the year, to approximately 6% organic growth, along with our expectation for adjusted EBITA margin of 16.6%. That’s not to say we don’t acknowledge the ongoing uncertainty that continues to exist across multiple dimensions. But, in the case, should it be the case, that some of that were to begin to materialize, it’s important to note that we have a flexible cost model, which, as we have consistently demonstrated over many years, can be an important lever not only for improving margins in times of growth, but also against downturns in the macro business environment. Another key area for value creation remains our strong balance sheet and liquidity. Our ongoing commitment to capital returns has been clearly underscored by both our recent dividend increase as well as the resumption of share repurchases, which you saw in the quarter. And our teams remain highly focused on delivering, as our Company continues to provide higher-order business solutions to clients, which can help them drive growth across a range of marketing activities and economic conditions. So I’ll just close by thanking our partners, our people and those of you on the call for your continued support. At this point, I think we should open the floor to questions.

14 QUESTIONS AND ANSWERS Operator: Thank you. . . . Our first question is from Jason Bazinet with Citi. You may go ahead. Jason B. Bazinet, Citi: Thank you for the new reporting segments. Over the last three years, it’s pretty clear that MD&E grew faster than IA&C, which in turn grew faster than SC&E, but we didn’t see that in the first quarter. And I was just wondering if you could provide a little commentary. Is that a function of inflation rising, you know, lifting all boats? Is it somewhat a function of the comps? And when do you think that three-year track record from ’19 to ’21, with your larger segment growing more quickly, will reassert itself? Thanks. Philippe Krakowsky, Chief Executive Officer: Thanks, Jason. Look, I think quarter-to-quarter there is a lot of volatility at any given point in time. So you can have the impact — in the case of MD&E in Q1, there was a very sharp ramp in headcount to keep up with growth that we saw last year. So I think looking at anything on a quarter-to-quarter basis, there can obviously be a client win, or, not something we clearly look forward to, but the opposite. So I think that the macro trend is definitely the one that you want to focus on, so whether that’s an annual or clearly a multi-year trend. I think that you’re right to assume that you’re going to see higher growth in certain segments. You’re obviously going to see that the segments that have kind of embedded tech and data, we also believe, represent an opportunity from a margin perspective. But then I think what is heartening as well is, you’ve heard us talk a lot about both how we go to market as an integrated company. And so what’s interesting is the segments reflect there’s been such acceleration. And there is really the need to manage these businesses in a way that’s consistent with the underlying dynamics of each segment. But when we go to market with a client, we bring all of this together. And so what I think that you’ve heard us talk about the fact that, for example, the Acxiom offering is increasingly helping to power through behavioral science; the way in which some of the advertising agencies go to clients with audience-led solutions and insights that actually inform the creative work. So we think it will help increase growth, and it will definitely, as we incorporate more of that and more of the accountable solutions into the rest of the portfolio, there is upside on both. It will help fuel growth elsewhere. And I think we definitely see opportunity on the margin side consistent with what you’re seeing there. So I can’t tell you that on a quarter-to-quarter basis, the ins and outs or, to your point, there are comps at play on what we would refer to as segment three on the SC&E segment. Clearly, that’s a segment that got meaningfully impacted by the pandemic. So ’20 to ’21 was improvement,’21 to ’22 is improvement. And we have underlying strong assets there, but there is also a benefit to the comp in that segment. So I think it’s a fair question, but, yeah.
15 Mr. Bazinet: Okay, super helpful. Thank you. Mr. Krakowsky: No worries. Thank you. Operator: Thank you. The next question is from David Karnovsky with J.P.Morgan. You may go ahead. Philippe Krakowsky, Chief Executive Officer: Hi, David. David Karnovsky, J.P.Morgan: Hi, thank you. Hi. Philippe, we’ve heard from a number of your peers these past few weeks who have said they aren’t seeing clients materially adjust budgets, even while some see supply chain pressure or have real concern over macro or inflation. So, wondering if you’re hearing the same. And then, what do you think is driving that dynamic? Did marketers simply anticipate some of this to start the year? Or are there competitive pressures that are keeping budgets and spend steady? Mr. Krakowsky: Well, I think there are a lot of moving parts. So, as we shared with you, we’ve recently come through a process that’s pretty much one we go through every year. But we spent time with all of our operators, and we’ve spent time with clients, and our sense is that the tone of the business remains positive. The moving parts component to it is, I think we’ve talked about the fact that the pandemic itself, there was that initial three to six months, which clearly had an impact. But then clients began to find their footing, and then they started to really lean into digital channels, and we started to see much more active discussions around implementing e-com, going through their own business transformation journeys. So I think as we’ve seen subsequent waves of the pandemic itself, they’ve really been less and less disruptive to marketing activity. So you look at our trailing-12-month growth in the 14% to 15% range. You look at, for us, a Magna forecast for ‘22, and that’s directional. As you know, it speaks to an adjacent industry, which at least reflects client investment. The way we trade in media, it’s not — we’re clearly much more consultative in our approach to media — but all of those things say to you that the environment for the moment, with the caveat that there are some uncertainties out there, is still very active. And then you get to what you said, which is that I think clients don’t want to step out of complex processes. So if you’ve got a client who has a 360 campaign, where they are integrated in their approach, and they are thinking about all of the ways in which along the consumer journey, I’m going to need to understand who you are as an

16 audience, figure out where and how to intersect with you, to pull out of that, it’s not something that you can necessarily easily restart. So with the larger national, multinational, clients, I think that that means that there continues to be commitment. And there is concern, to your point, that if you pull back, you cede ground. And so if that means somebody else jumps the line and gets into that conversation, or if that means that you’re beginning to lose share at a time when obviously you want to, in essence, use the leverage that your brand and your position in the marketplace provide to you to take price, to offset some of these pressures that you’re feeling that every business is feeling. So I can’t tell you — and again we’ve got a very, very broad portfolio of clients, so the specifics of client category and geography and marketing mix are different each time out. But at the moment, we are definitely seeing that commitment to stay invested hold. Mr. Karnovsky: Okay, great. That’s good. And then, Ellen, maybe one for you. I think generally in the past, you’ve noted organic growth as a driver of higher margins over time, and you did leave your margin outlook the same while raising organic. I just want to better understand the dynamic there and see if costs are potentially coming in different than you had expected when you last guided or whether there’re other factors we should consider. Thanks. Ellen Johnson, Executive Vice President, Chief Financial Officer: Sure. Thank you for the question. As Philippe mentioned, we just finished a bottoms-up process of meeting with all the operators. So our outlook reflects that, both on the revised up in growth and the maintain of the margin. You know, 16.6% margin, if you look at the progress we’ve made over the last several years, is pretty substantial, and we think will be a great result. As we said earlier in this year, there’s just a lot of ins and outs coming out of the period of time that we just did. Mr. Karnovsky: Great, thank you. Mr. Krakowsky: Thank you. Operator: Thank you. The next question is from Tim Nollen with Macquarie. You may go ahead. Philippe Krakowsky, Chief Executive Officer: Hi, Tim.
17 Tim Nollen, Macquarie: Great. Hi, thanks very much. You know, there is a number that I just can’t help but comparing, which is that your revenue growth was, probably for the first time ever, much higher than Facebook’s, which reported last night. [Laughter] Yes, I have to laugh too. I know that the businesses are clearly different. I know the Facebook issue clearly has quite a bit to do with Apple. I just wonder if you could give a bit more color on your optimism for the second half, in general for the agency business, reflected in your upgraded target for the full year. With some of these larger tech companies and issues that they face, is it just about the Apple changes that are coming through, or are there other things that are going on in there as well? Thanks. Mr. Krakowsky: That’s such a broad-based question in that I’m not sure that an opinion about what might or might not be impacting all of them. So could it be what we’ve seen with iOS? Absolutely. You know, could it be a dawning that you’re seeing consumers more focused on — I talked a bit about what we’ve done at Acxiom with extending CCPA to — we believe that, in the long term, the idea that you invest behind having the benefits of data, the precision that it gives you, the ability to be kind of much more accountable to what that investment is yielding, and yet to do it in a way that is much more sort of future-proofed and built for a world in which you’re not necessarily assuming this extremely asymmetrical relationship between the platform and the individual consumer. So, it could be that. It could be that they’re dealing with clients for whom brand safety and the responsible deployment of media is an issue. It could clearly be that, that there is probably some share shift going on over there. And you’ve definitely had at least one or two — I mean, TikTok is clearly showing up and making a really big impact. And then you’ve got some nascent categories, be it a sports betting, be it a crypto, that I think are looking at the space with a much cleaner, with fewer preconceived notions. So they might be much more democratic in their use of digital media, right? So that’s the question that I think you were asking, at least in part. The question about us and the agency space, I think it’s the same thesis that we’ve had for some time. So the thesis has been the complexity is going to continue to increase. So the ways in which fragmentation is both, potentially, there is a challenge there as a marketer, there is also an opportunity there as a marketer. Then there is the get more digital in the way in which you engage, so put more time and thought and then ultimately, invest more money behind those kinds of channels. And then ultimately build one-to-one connections and relationships with individuals. And you do that with the right, both marketing technology, suite and skill sets and then definitively with the right data infrastructure. So we see that all of what’s going on in the space that you noted is being at least — I don’t know if they’re being disrupted; they are clearly going through some changes. We see that as continued opportunity, because, clearly, marketers are saying, okay, what do we do about that, what are the implications of that, how do we make sure we’re making the right decisions. And we are well positioned to help them as their
18 adviser, as a consultant, who shows up and is able to help them with those kinds of opportunities and challenges. Mr. Nollen: Yes. That answers it perfectly. Thanks, Philippe. Mr. Krakowsky: Well you know, happy — very few people ever say that about anything I do, so thank you, Tim. Operator: Thank you. The next question is from Dan Salmon with BMO Capital Markets. You may go ahead. Daniel Salmon, BMO Capital Markets: Great. Good morning, everyone. Philippe Krakowsky, Chief Executive Officer: Hi, Dan. Mr. Salmon: Thanks for taking my questions. I hope they get as good, as interesting, answers as that one, too. So, Philippe, it feels like we’re hearing a little bit more, I guess it’s a similar theme, across the industry about developing solutions that reach more small and mid-sized businesses. Maybe that goes a little bit hand-in-hand with more focus on data and technology and platforms and things that are naturally a little bit more scalable. So I’ll maybe ask my question this way: do you expect the holding companies, and obviously IPG specifically, do you expect the number of clients to grow significantly over time? It looks historically thousands of clients, with that sort of top 200, top 300, accounting for the majority of revenue. Do you see tens, hundreds, of thousands of clients? Any thoughts on that would be great. And then, Ellen, thank you to you and Philippe both, for the comments on the macro, and lots of talk about that lately. And I think the reality is CMOs often just sit downstream from those decisions, so too do the agencies. So my question is, do you engage with your agency CFOs a little differently at times like this? Like, you check in more often, is there like a DEFCON level that gets raised during periods like this? So maybe let us know what goes on inside in your organization to help check on these things during periods like this. Thanks. Philippe Krakowsky, Chief Executive Officer: So, the initial question is a great question, and I think, to my mind, it’s definitely a place I would like to see us go. I think it is factored into the planning and the thinking around here, because, as you say, the client universe that has been able to work with us has been significant, but ultimately reached limits. If and as we build more services that have a technology layer or component, capabilities that you can in essence plug in

19 off the shelf, whether that’s dashboards, whether that’s IP that you can license from us, so that you can then do a certain kind of analytic work or certain kind of segmentation work or put data to work in mid-sized businesses, that’s definitely a place we want to go. I don’t know that I can tell you that we’ve sought that out to the point where it will go from our current 5,000 clients to two times that or three times that. I think it’s sort of too early to, it’s sort of premature to put that out there. But I think that what you suggest about how these capabilities and the way these capabilities are delivered do mean that we can think about an addressable market and think about a middle market of clients with whom we can engage is absolutely consistent with our thinking. And then I’ll pass things over to Ellen for the interesting question on the CFO side of things. Ellen Johnson, Executive Vice President, Chief Financial Officer: Yes. So our financial community, yes, it’s CFOs, but it’s broader than that, too. And it’s really a team sport if I can use that analogy. And it’s not different now. But we always do talk and communicate and stay very close to our operators to make sure that we are very close to what’s happening in the business and on the clients. So it’s continuous. And this year is no different than the previous years. It’s just the way we do things. And we’re constantly speaking, we get together as a community regularly, share ideas, best practices and information. Mr. Salmon: Okay. So, business as usual. But I’m sure that there are a bit more interesting conversations. So, anyway, thank you, both. Mr. Krakowsky: Thank you. Operator: Thank you. And our final question is from Michael Nathanson with MoffettNathanson. You may go ahead. Michael Nathanson, MoffettNathanson: Thanks. So, Philippe, I will try to ask you the question that takes all the previous questions together, and then, Ellen, I’ve one for you. [Laughter] Do you think, given the commentary about digital advertising, which is mostly SMB and e-commerce, in terms of where the weakness is, do you think this environment is favoring multinational companies, larger companies, which is the backbone of your business, versus maybe small enterprises? Is there anything that you’ve thought of in terms of size operation, ability to pass on costs, you know, power with distributors? So that’s one. And second for you, Ellen. If the dollar keeps weakening, I’ve always thought that your U.S. operations have higher margins than international operations. I don’t know if
20 that’s true or not, that’s our assumption. So if a weaker dollar — the dollar keep strengthening, won’t there be a natural flattering of margins just simply from translation purposes? So those are my questions. Thanks. Philippe Krakowsky, Chief Executive Officer: That’s a question that I’m trying to sort of pull it apart. As, to your point, it pulls in so much of what we’ve been talking about earlier. So I think larger clients clearly have a number of benefits. So to your point, the complexity of the work they do, the fact that they’ve got the full range of capabilities at their disposal, and then the fact that if they’ve invested in, and many of them are further along that curve than others, but to the extent that they are thinking about and working to incorporate more of the digital channels that intersect with consumers, the digital channels are the sort of ways to do D2C, whether that’s in the e-com space or whether that’s through ad tech. So clearly, I do think that you’re right that, at this point, they do have an advantage. It’s difficult for me to say whether or not — I don’t think it disqualifies, I mean we see a lot of well-funded sophisticated D2C companies that are young companies coming in to market, and they’re looking to us for services once they get to a certain point of their maturation process. But it’s still fairly early on for them. And then when I think about healthcare, which as you know is a big part of our mix, and really what we continue to see as a very robust area with some real promise, we work with the majors. We work with the vast majority of the really large players in that space. But we’re also bringing a lot of biotech companies into the fold. When we win, we’re looking for a balanced mix. So I would say, yes, what you say definitely holds true. Do we have a perfect lens to that? No, because our client roster does skew pretty heavily to the folks that you pointed out likely are advantaged, but there are definitely a lot of new entrants into this space who show up with a pretty sophisticated view and the ability to take on board a pretty broad range of our services and put them to use. Mr. Nathanson: Okay. Ellen Johnson, Executive Vice President, Chief Financial Officer: And as far as FX, in general, our revenue and expenses are very well matched by currency, so impact on margin is de-minimis from FX changes. Mr. Nathanson: Okay, so I have that wrong. Thanks. Philippe Krakowsky, Chief Executive Officer: And I understand that, yes, we are at the hour. Again, we appreciate the time, we

21 appreciate the continued support. We will get back to it. I don’t know if I can do perfection again, even any time the next week, but thanks for that. But as I said, the focus on execution here is very clear. And as always, we’ll keep you posted, and we look forward to our next conversation. Operator: And this concludes today’s conference. You may disconnect at this time. * * * * *
22 Cautionary Statement This transcript contains forward-looking statements. Statements in this transcript that are not historical facts, including statements about management’s beliefs and expectations, constitute forward-looking statements. These statements are based on current plans, estimates and projections, and are subject to change based on a number of factors, including those outlined in our most recent Annual Report on Form 10-K and Quarterly Reports on Form 10-Q under Item 1A, Risk Factors, and our other filings with the Securities and Exchange Commission (the “SEC”). Forward-looking statements speak only as of the date they are made, and we undertake no obligation to update publicly any of them in light of new information or future events. Forward-looking statements involve inherent risks and uncertainties. A number of important factors could cause actual results to differ materially from those contained in any forward-looking statement. Such factors include, but are not limited to, the following: the effects of a challenging economy on the demand for our advertising and marketing services, on our clients’ financial condition and on our business or financial condition; the impacts of the Covid-19 pandemic, including unanticipated developments like the emergence of new coronavirus variants or any shortfalls in vaccination efforts, and associated mitigation measures such as social distancing efforts and restrictions on businesses, social activities and travel on the economy, our clients and demand for our services, which may precipitate or exacerbate other risks and uncertainties; our ability to attract new clients and retain existing clients; our ability to retain and attract key employees; risks associated with assumptions we make in connection with our critical accounting estimates, including changes in assumptions associated with any effects of a challenging economy; potential adverse effects if we are required to recognize impairment charges or other adverse accounting-related developments; risks associated with the effects of global, national and regional economic and political conditions, including counterparty risks and fluctuations in interest rates, inflation rates and currency exchange rates; developments from changes in the regulatory and legal environment for advertising and marketing and communications services companies around the world, including laws and regulations related to data protection and consumer privacy; the impact on our operations of general or directed cybersecurity events; and failure to fully realize the anticipated benefits of our 2020 restructuring actions and other cost-saving initiatives. Investors should carefully consider these factors and the additional risk factors outlined in more detail in our most recent Annual Report on Form 10-K and Quarterly Reports on Form 10-Q under Item 1A, Risk Factors, and our other SEC filings.
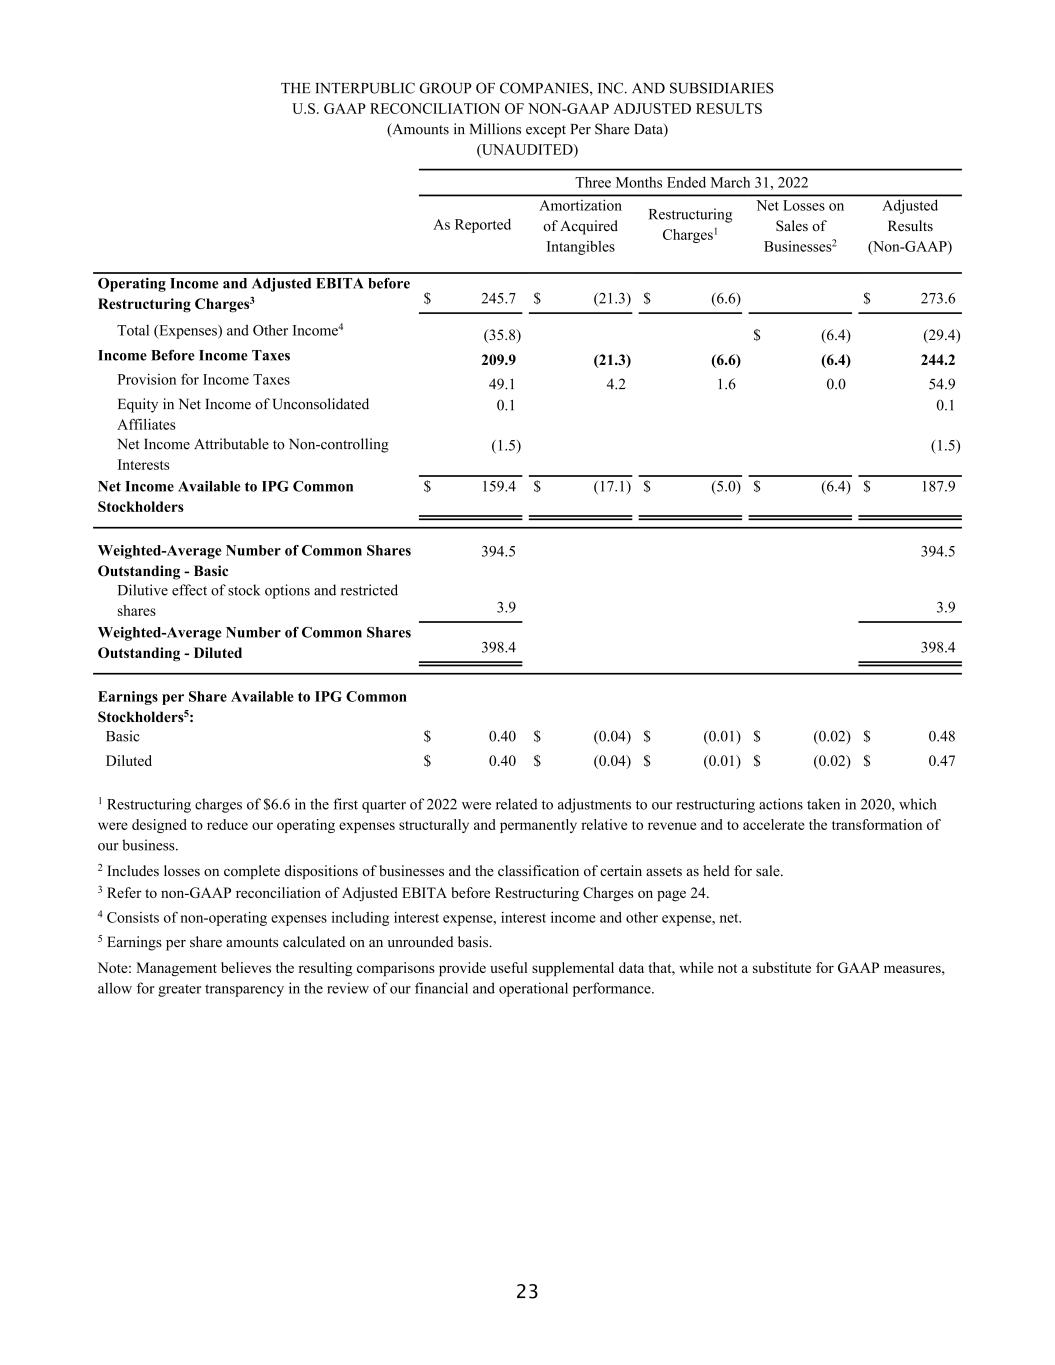
23 THE INTERPUBLIC GROUP OF COMPANIES, INC. AND SUBSIDIARIES U.S. GAAP RECONCILIATION OF NON-GAAP ADJUSTED RESULTS (Amounts in Millions except Per Share Data) (UNAUDITED) Three Months Ended March 31, 2022 As Reported Amortization of Acquired Intangibles Restructuring Charges1 Net Losses on Sales of Businesses2 Adjusted Results (Non-GAAP) Operating Income and Adjusted EBITA before Restructuring Charges3 $ 245.7 $ (21.3) $ (6.6) $ 273.6 Total (Expenses) and Other Income4 (35.8) $ (6.4) (29.4) Income Before Income Taxes 209.9 (21.3) (6.6) (6.4) 244.2 Provision for Income Taxes 49.1 4.2 1.6 0.0 54.9 Equity in Net Income of Unconsolidated Affiliates 0.1 0.1 Net Income Attributable to Non-controlling Interests (1.5) (1.5) Net Income Available to IPG Common Stockholders $ 159.4 $ (17.1) $ (5.0) $ (6.4) $ 187.9 Weighted-Average Number of Common Shares Outstanding - Basic 394.5 394.5 Dilutive effect of stock options and restricted shares 3.9 3.9 Weighted-Average Number of Common Shares Outstanding - Diluted 398.4 398.4 Earnings per Share Available to IPG Common Stockholders5: Basic $ 0.40 $ (0.04) $ (0.01) $ (0.02) $ 0.48 Diluted $ 0.40 $ (0.04) $ (0.01) $ (0.02) $ 0.47 1 Restructuring charges of $6.6 in the first quarter of 2022 were related to adjustments to our restructuring actions taken in 2020, which were designed to reduce our operating expenses structurally and permanently relative to revenue and to accelerate the transformation of our business. 2 Includes losses on complete dispositions of businesses and the classification of certain assets as held for sale. 3 Refer to non-GAAP reconciliation of Adjusted EBITA before Restructuring Charges on page 24. 4 Consists of non-operating expenses including interest expense, interest income and other expense, net. 5 Earnings per share amounts calculated on an unrounded basis. Note: Management believes the resulting comparisons provide useful supplemental data that, while not a substitute for GAAP measures, allow for greater transparency in the review of our financial and operational performance.
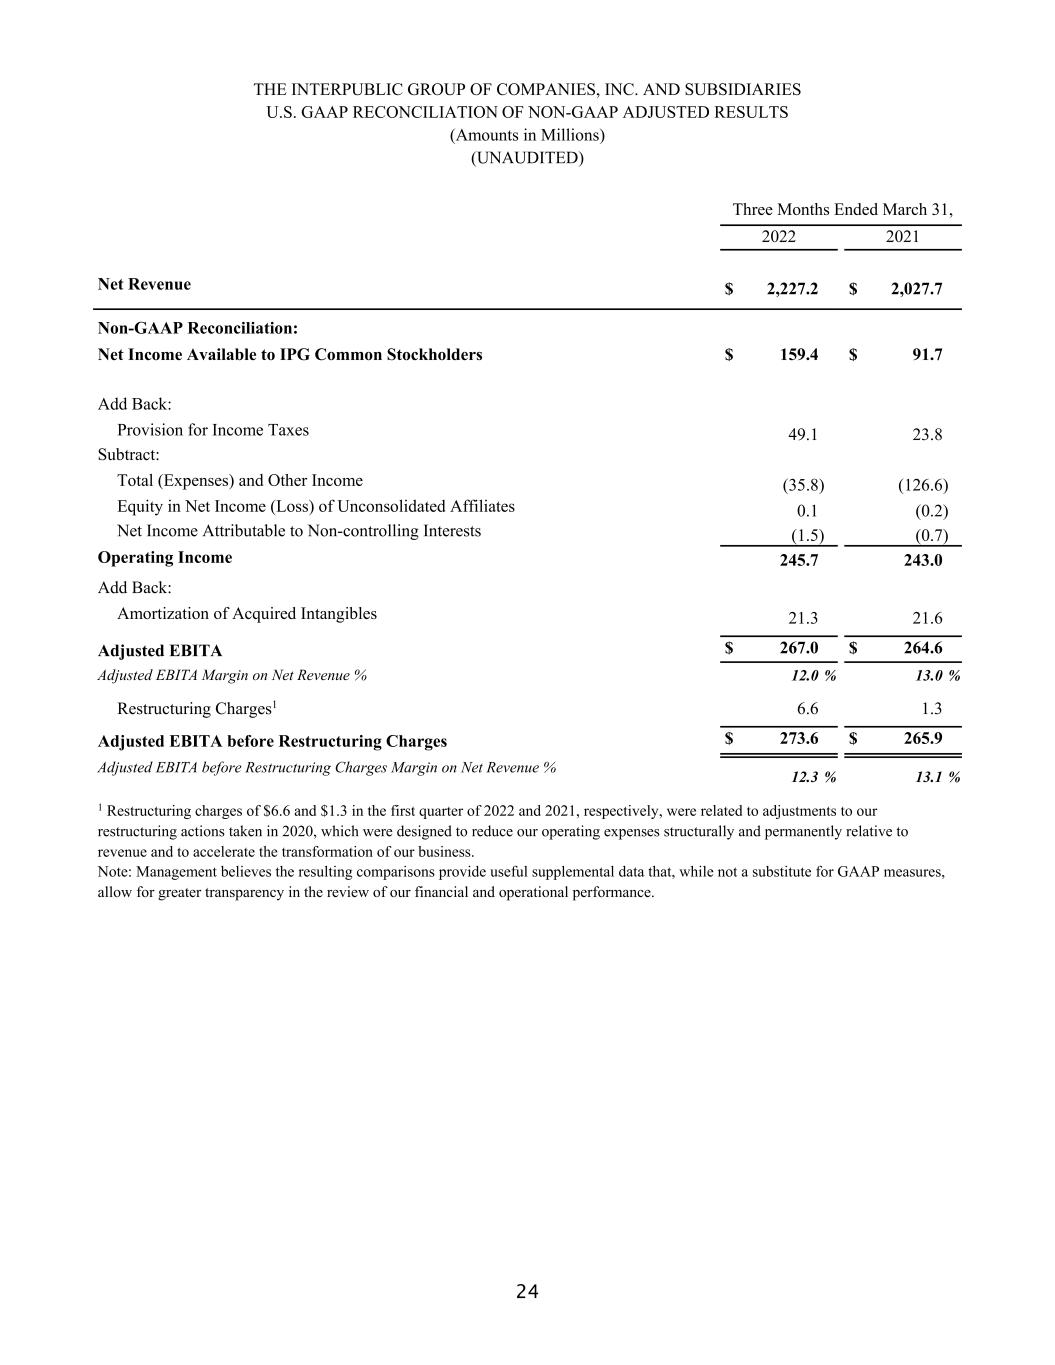
24 THE INTERPUBLIC GROUP OF COMPANIES, INC. AND SUBSIDIARIES U.S. GAAP RECONCILIATION OF NON-GAAP ADJUSTED RESULTS (Amounts in Millions) (UNAUDITED) Three Months Ended March 31, 2022 2021 Net Revenue $ 2,227.2 $ 2,027.7 Non-GAAP Reconciliation: Net Income Available to IPG Common Stockholders $ 159.4 $ 91.7 Add Back: Provision for Income Taxes 49.1 23.8 Subtract: Total (Expenses) and Other Income (35.8) (126.6) Equity in Net Income (Loss) of Unconsolidated Affiliates 0.1 (0.2) Net Income Attributable to Non-controlling Interests (1.5) (0.7) Operating Income 245.7 243.0 Add Back: Amortization of Acquired Intangibles 21.3 21.6 Adjusted EBITA $ 267.0 $ 264.6 Adjusted EBITA Margin on Net Revenue % 12.0 % 13.0 % Restructuring Charges1 6.6 1.3 Adjusted EBITA before Restructuring Charges $ 273.6 $ 265.9 Adjusted EBITA before Restructuring Charges Margin on Net Revenue % 12.3 % 13.1 % 1 Restructuring charges of $6.6 and $1.3 in the first quarter of 2022 and 2021, respectively, were related to adjustments to our restructuring actions taken in 2020, which were designed to reduce our operating expenses structurally and permanently relative to revenue and to accelerate the transformation of our business. Note: Management believes the resulting comparisons provide useful supplemental data that, while not a substitute for GAAP measures, allow for greater transparency in the review of our financial and operational performance.
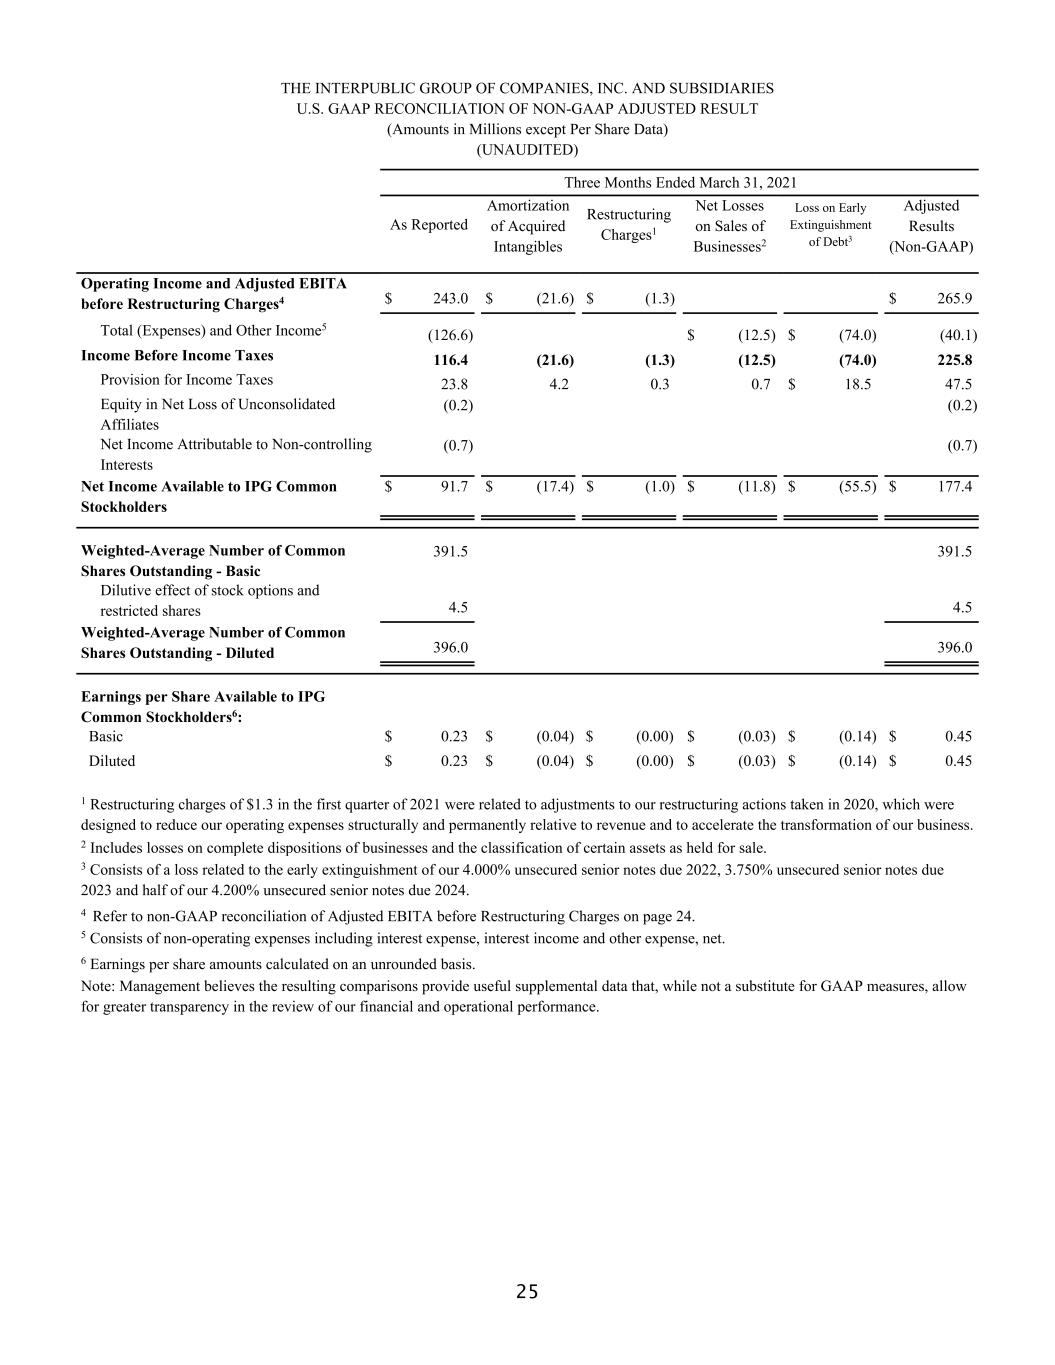
25 THE INTERPUBLIC GROUP OF COMPANIES, INC. AND SUBSIDIARIES U.S. GAAP RECONCILIATION OF NON-GAAP ADJUSTED RESULT (Amounts in Millions except Per Share Data) (UNAUDITED) Three Months Ended March 31, 2021 As Reported Amortization of Acquired Intangibles Restructuring Charges1 Net Losses on Sales of Businesses2 Loss on Early Extinguishment of Debt3 Adjusted Results (Non-GAAP) Operating Income and Adjusted EBITA before Restructuring Charges4 $ 243.0 $ (21.6) $ (1.3) $ 265.9 Total (Expenses) and Other Income5 (126.6) $ (12.5) $ (74.0) (40.1) Income Before Income Taxes 116.4 (21.6) (1.3) (12.5) (74.0) 225.8 Provision for Income Taxes 23.8 4.2 0.3 0.7 $ 18.5 47.5 Equity in Net Loss of Unconsolidated Affiliates (0.2) (0.2) Net Income Attributable to Non-controlling Interests (0.7) (0.7) Net Income Available to IPG Common Stockholders $ 91.7 $ (17.4) $ (1.0) $ (11.8) $ (55.5) $ 177.4 Weighted-Average Number of Common Shares Outstanding - Basic 391.5 391.5 Dilutive effect of stock options and restricted shares 4.5 4.5 Weighted-Average Number of Common Shares Outstanding - Diluted 396.0 396.0 Earnings per Share Available to IPG Common Stockholders6: Basic $ 0.23 $ (0.04) $ (0.00) $ (0.03) $ (0.14) $ 0.45 Diluted $ 0.23 $ (0.04) $ (0.00) $ (0.03) $ (0.14) $ 0.45 1 Restructuring charges of $1.3 in the first quarter of 2021 were related to adjustments to our restructuring actions taken in 2020, which were designed to reduce our operating expenses structurally and permanently relative to revenue and to accelerate the transformation of our business. 2 Includes losses on complete dispositions of businesses and the classification of certain assets as held for sale. 3 Consists of a loss related to the early extinguishment of our 4.000% unsecured senior notes due 2022, 3.750% unsecured senior notes due 2023 and half of our 4.200% unsecured senior notes due 2024. 4 Refer to non-GAAP reconciliation of Adjusted EBITA before Restructuring Charges on page 24. 5 Consists of non-operating expenses including interest expense, interest income and other expense, net. 6 Earnings per share amounts calculated on an unrounded basis. Note: Management believes the resulting comparisons provide useful supplemental data that, while not a substitute for GAAP measures, allow for greater transparency in the review of our financial and operational performance.


