UNITED STATES
SECURITIES AND EXCHANGE COMMISSION
Washington, D.C. 20549
FORM N-CSR
Certified Shareholder Report of
Registered Management Investment Companies
Investment Company Act File Number: 811-00116
The Investment Company of America
(Exact Name of Registrant as Specified in Charter)
333 South Hope Street
Los Angeles, California 90071
(Address of Principal Executive Offices)
Registrant's telephone number, including area code: (213) 486-9200
Date of fiscal year end: December 31
Date of reporting period: December 31, 2018
Laurie D. Neat
The Investment Company of America
333 South Hope Street
Los Angeles, California 90071
(Name and Address of Agent for Service)
ITEM 1 – Reports to Stockholders
ICA The Investment
Company of America® |  |
Annual report
for the year ended
December 31, 2018 |
| |

Invest in a fund whose objective has stood the test of time.
Beginning January 1, 2021, as permitted by regulations adopted by the U.S. Securities and Exchange Commission, we intend to no longer mail paper copies of the fund’s shareholder reports, unless specifically requested from American Funds or your financial intermediary, such as a broker-dealer or bank. Instead, the reports will be made available on the American Funds website (americanfunds.com); you will be notified by mail and provided with a website link to access the report each time a report is posted. If you have already elected to receive shareholder reports electronically, you will not be affected by this change and do not need to take any action. If you prefer to receive shareholder reports and other communications electronically, you may update your mailing preferences with your financial intermediary, or enroll in e-delivery at americanfunds.com (for accounts held directly with the fund).
You may elect to receive paper copies of all future reports free of charge. If you invest through a financial intermediary, you may contact your financial intermediary to request that you continue to receive paper copies of your shareholder reports. If you invest directly with the fund, you may inform American Funds that you wish to continue receiving paper copies of your shareholder reports by contacting us at (800) 421-4225. Your election to receive paper reports will apply to all funds held with American Funds or through your financial intermediary.
The Investment Company of America seeks to achieve long-term growth of capital and income.
This fund is one of more than 40 offered by Capital Group, home of American Funds, one of the nation’s largest mutual fund families. For more than 85 years, Capital Group has invested with a long-term focus based on thorough research and attention to risk.
Fund results shown in this report, unless otherwise indicated, are for Class A shares at net asset value. If a sales charge (maximum 5.75%) had been deducted, the results would have been lower. Results are for past periods and are not predictive of results for future periods. Current and future results may be lower or higher than those shown. Share prices and returns will vary, so investors may lose money. Investing for short periods makes losses more likely. For current information and month-end results, visit americanfunds.com.
See page 4 for Class A share results with relevant sales charges deducted. For other share class results, visit americanfunds.com and americanfundsretirement.com.
Investment results assume all distributions are reinvested and reflect applicable fees and expenses. When applicable, investment results reflect fee waivers, without which results would have been lower. Visit americanfunds.com for more information.
The fund’s 30-day yield for Class A shares as of January 31, 2019, reflecting the 5.75% maximum sales charge and calculated in accordance with the U.S. Securities and Exchange Commission formula, was 1.84%.
Investing outside the United States may be subject to risks, such as currency fluctuations, political instability, differing securities regulations and periods of illiquidity. Global diversification can help reduce these risks. Refer to the fund prospectus and the Risk Factors section of this report for more information on these and other risks associated with investing in the fund.
Investments are not FDIC-insured, nor are they deposits of or guaranteed by a bank or any other entity, so they may lose value.
Fellow investors:
The U.S. equity market had a negative calendar year for the first time since 2008. Concerns over trade conflicts, slowing global growth and high valuations contributed to volatility and halted one of the longest-running bull markets in history. While growth-oriented stocks performed relatively better than defensive stocks, due to strength in the first three-quarters of the year, many companies experienced wild swings throughout the year. As a reminder, the Investment Company of America (ICA) has a balanced objective we term “growth and income,” which combines long-term growth with dividend income and tends to focus on quality companies. Against this backdrop, ICA fell 6.51% for the 12-month period ended December 31, 2018, with distributions reinvested. In comparison, the unmanaged Standard & Poor’s 500 Composite Index, a market-capitalization weighted index based on the results of approximately 500 widely held common stocks, declined 4.38% during the same time period.
For the 20 years ended December 31, 2018, ICA posted an average annual total return of 6.50% with distributions reinvested, compared with 5.62% by the S&P 500. Over its lifetime, ICA has had an average annual total return of 11.95% with distributions reinvested, compared with 10.73% by the S&P 500.
Late stages of the U.S. economic cycle
The United States enjoyed an annualized 3.4% growth of gross domestic product in the third quarter of 2018, continuing a trend of strong economic growth, while unemployment remained very low. Lower taxes and a trend toward deregulation were positive factors in driving this result.
However, a series of retaliatory tariffs between the U.S. and China, political turmoil, slowing growth outside the U.S. and high valuations contributed to persistent volatility. During this time, the Federal Reserve continued on its path to reducing the size of its balance sheet and raised rates by a quarter percentage point four times over the past 12 months to a range of 2.25% to 2.50%.
ICA’s portfolio in review
While an eclectic mix of stocks fueled the fund’s positive return during the first part of the year, the market turned down sharply in the fourth quarter, reversing the gains for many of those stocks. Some of the fund’s largest sector holdings, such as health care and consumer discretionary contributed positively to relative returns during the fiscal year. Shares of health care company Abbott Laboratories (+26.74%) rose as markets reacted positively to several new product releases, including the FreeStyle Libre glucose monitoring system that works through a sensor on the skin rather than a finger prick. Consumer discretionary company and the fund’s sixth-largest equity holding, Amazon also rose 28.43% as the company reported strong earnings that beat analyst estimates thanks to its cloud and advertising segments.
Detracting from results were tobacco companies British American Tobacco (-52.75%) and Phillip Morris International (-36.81%) as shares slumped on proposed plans by U.S. regulators to possibly reduce nicotine levels, and ban menthol, in cigarettes. New competition in the electronic cigarette market, such as JUUL, also impacted tobacco companies.
| The Investment Company of America | 1 |
2018 results at a glance
Year ended December 31, 2018 (with all distributions reinvested)
| | | ICA | | Standard & Poor’s 500 |
| | | (Class A shares) | | Composite Index* |
| Income return | | | 1.85 | % | | | 2.03 | % |
| Capital return | | | -8.36 | % | | | -6.41 | % |
| Total return | | | -6.51 | % | | | -4.38 | % |
| * | Source: S&P Dow Jones Indices LLC. The S&P 500 is unmanaged and, therefore, has no expenses. Investors cannot invest directly in an index. |
Dividends and capital gain distributions paid in 2018
| | | Per Class A | | |
| | | share | | Payment date |
| Income dividends | | | $ | 0.150 | | | March 16 |
| | | | | 0.155 | | | June 15 |
| | | | | 0.155 | | | September 14 |
| | | | | 0.275 | | | December 19 |
| | | | $ | 0.735 | | | |
| | | | | | | | |
| Capital gain distributions | | | $ | 0.561 | | | June 15 |
| | | | $ | 2.644 | | | December 19 |
| | | | $ | 3.205 | | | |
Expense ratios and portfolio turnover rates1
Year ended December 31, 2018
| | | Expense ratio | | Portfolio
turnover rate |
| ICA | | | 0.57 | % | | | 36 | % |
| Industry average2 | | | 1.04 | % | | | 47 | % |
| 1 | 1The expense ratio is the annual percentage of net assets used to pay fund expenses. The ratio shown is for Class A shares as of the prospectus dated March 1, 2019 (unaudited). The portfolio turnover rate is a measure of how often securities are bought and sold by a fund. |
| 2 | Source: Thomson Reuters Lipper. Lipper Growth & Income Funds Average (industry average expense ratio based on statistics for front-end load funds, for the most recent fiscal year-ends available as of 12/31/18.) |
Our cash position of approximately 6.5% of net assets at the end of the period is at a reasonable level for ICA given current market conditions. As a naturally defensive holding, cash provides protection during market volatility and downturns. Cash also provides portfolio managers the flexibility to easily finance additional or new investments.
We remain focused on the long term
The markets over the past year were at first driven by very strong earnings from large U.S. corporations, helped along by a growing economy, federal tax cuts and lessened regulations across a number of industries. Investor attitudes changed in the final quarter. Investors became concerned about slowing global growth, whether interest rates had become too high, and especially about the economic ramifications of the U.S.-China trade-related tensions. It is hard to tell how valid these concerns will become. We will certainly monitor and analyze them in the months ahead. But, we can also say that valuations have come down, which makes well-chosen individual securities more attractive on a long term, forward-moving basis.
Long term shareholders should not lose their nerve, as we do not appear to be in a systemically risky situation like we experienced in 2008–2009. This recent market action appears to be more like a garden-variety retrenchment, something that occurs frequently, and can be healthy for long-term investors. Thus, there is no change to our approach. We will continue
| 2 | The Investment Company of America |
to search for high-potential, long-horizon investments for our shareholders, with an eye towards risk and valuation. Our robust research-driven investment process has stood the test of time, and we believe it can continue to help our shareholders meet their long-term financial goals.
We thank you for your confidence in our investment philosophy and look forward to reporting to you again in six months.
Cordially,

James B. Lovelace
Co-President

Donald D. O’Neal
Co-President
February 11, 2019
For current information about the fund, visit americanfunds.com.
The New Geography of Investing®
Where a company does business can be more important than where it’s located. Here’s a look at The Investment Company of America’s portfolio in terms of where its equity holdings earn their revenue. The charts below show the countries and regions in which the fund’s equity investments are located, and where the revenue comes from.
Equity portion breakdown by domicile (%)
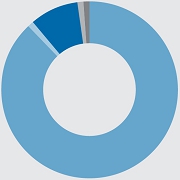
| | Region | | Fund | | | Index | |
| g | United States | | | 88 | % | | | 100 | % |
| g | Canada | | | 1 | | | | — | |
| g | Europe | | | 9 | | | | — | |
| g | Japan | | | 1 | | | | — | |
| g | Asia-Pacific ex. Japan | | | — | * | | | — | |
| g | Emerging markets | | | 1 | | | | — | |
| | Total | | | 100 | % | | | 100 | % |
Equity portion breakdown by revenue (%)
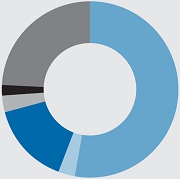
| | Region | | Fund | | | Index | |
| g | United States | | | 53 | % | | | 62 | % |
| g | Canada | | | 3 | | | | 2 | |
| g | Europe | | | 15 | | | | 12 | |
| g | Japan | | | 3 | | | | 3 | |
| g | Asia-Pacific ex. Japan | | | 2 | | | | 1 | |
| g | Emerging markets | | | 24 | | | | 20 | |
| | Total | | | 100 | % | | | 100 | % |
Compared with the S&P 500 as a percent of net assets. All figures include convertible securities.
Source: Capital Group (as of December 31, 2018).
| The Investment Company of America | 3 |
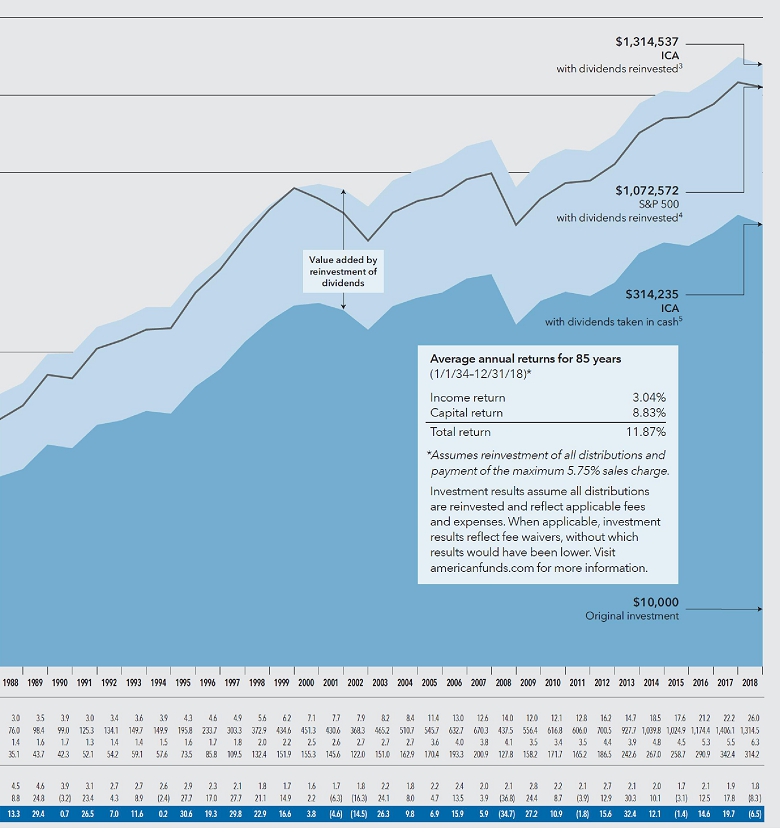
The value of a long-term perspective
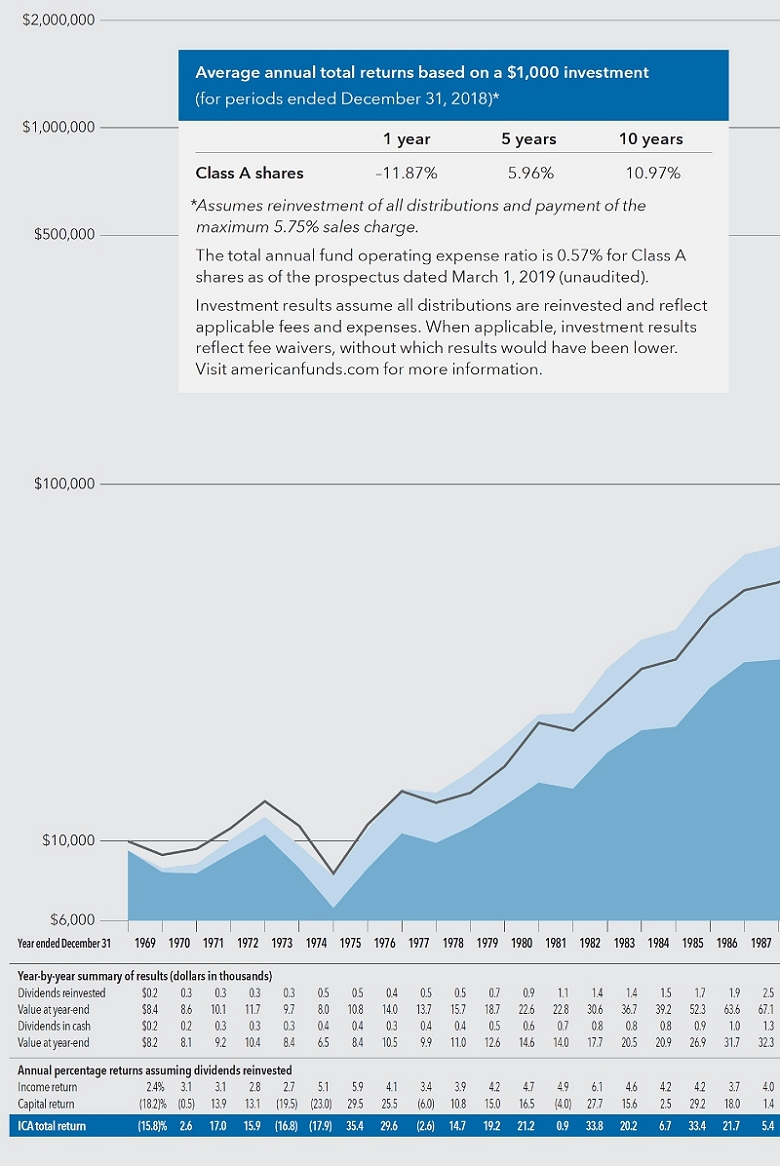
Fund results shown are for Class A shares and reflect deduction of the maximum sales charge of 5.75% on the $10,000 investment.1Thus, the net amount invested was $9,425.2Results are for past periods and are not predictive of results for future periods. Current and future results may be lower or higher than those shown. Share prices and returns will vary, so investors may lose money. For current information and month-end results, visit americanfunds.com.
The results shown are before taxes on fund distributions and sale of fund shares.
| 1 | As outlined in the prospectus, the sales charge is reduced for accounts (and aggregated investments) of $25,000 or more and is eliminated for purchases of $1 million or more. There is no sales charge on dividends or capital gain distributions that are reinvested in additional shares. |
| 2 | The maximum initial sales charge was 8.5% prior to July 1, 1988. |
| 3 | Includes dividends of $330,158 and capital gain distributions of $755,731 reinvested in the years 1969 to 2018. |
| 4 | Source: S&P Dow Jones Indices LLC. The S&P 500 is unmanaged and, therefore, has no expenses. Investors cannot invest directly in an index. |
| 5 | Includes reinvested capital gain distributions of $223,719, but does not reflect income dividends of $103,903 taken in cash. |
| 4 | The Investment Company of America |
How a $10,000 investment has grown over 50 years
This chart illustrates a hypothetical $10,000 investment in The Investment Company of America over the past 50 years, from December 31, 1968, through December 31, 2018, showing the closing values for each year. The figures in the table below the chart include the fund’s total return for each of those years.
| The Investment Company of America | 5 |
Summary investment portfolioDecember 31, 2018
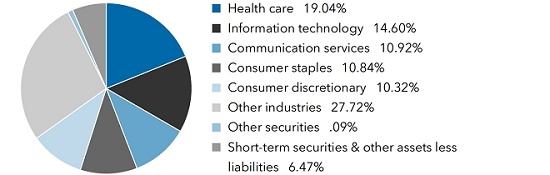
| Industry sector diversification | Percent of net assets |
| Common stocks 93.44% | | Shares | | | Value
(000) | |
| Energy 8.62% | | | | | | | | |
| Canadian Natural Resources, Ltd. (CAD denominated) | | | 24,565,075 | | | $ | 592,714 | |
| Chevron Corp. | | | 5,964,500 | | | | 648,878 | |
| Concho Resources Inc.1 | | | 7,437,500 | | | | 764,501 | |
| EOG Resources, Inc. | | | 14,873,200 | | | | 1,297,092 | |
| Exxon Mobil Corp. | | | 19,001,835 | | | | 1,295,735 | |
| Noble Energy, Inc.2 | | | 29,272,023 | | | | 549,143 | |
| Royal Dutch Shell PLC, Class B | | | 6,355,000 | | | | 189,542 | |
| Royal Dutch Shell PLC, Class B (ADR) | | | 5,000,000 | | | | 299,700 | |
| Other securities | | | | | | | 1,725,060 | |
| | | | | | | | 7,362,365 | |
| | | | | | | | | |
| Materials 3.13% | | | | | | | | |
| Linde PLC | | | 5,328,100 | | | | 831,397 | |
| Other securities | | | | | | | 1,843,017 | |
| | | | | | | | 2,674,414 | |
| | | | | | | | | |
| Industrials 7.69% | | | | | | | | |
| CSX Corp. | | | 16,750,958 | | | | 1,040,737 | |
| General Dynamics Corp. | | | 6,999,000 | | | | 1,100,313 | |
| Illinois Tool Works Inc. | | | 3,800,000 | | | | 481,422 | |
| United Technologies Corp. | | | 4,314,803 | | | | 459,440 | |
| Other securities | | | | | | | 3,484,317 | |
| | | | | | | | 6,566,229 | |
| | | | | | | | | |
| Consumer discretionary 10.32% | | | | | | | | |
| Amazon.com, Inc.1 | | | 1,396,100 | | | | 2,096,900 | |
| Hasbro, Inc.2 | | | 7,618,390 | | | | 618,994 | |
| Home Depot, Inc. | | | 7,938,000 | | | | 1,363,907 | |
| Lowe’s Companies, Inc. | | | 12,501,000 | | | | 1,154,592 | |
| Marriott International, Inc., Class A | | | 4,666,200 | | | | 506,563 | |
| McDonald’s Corp. | | | 5,450,000 | | | | 967,757 | |
| NIKE, Inc., Class B | | | 11,178,900 | | | | 828,804 | |
| Other securities | | | | | | | 1,284,084 | |
| | | | | | | | 8,821,601 | |
| | | | | | | | | |
| Consumer staples 10.84% | | | | | | | | |
| Altria Group, Inc. | | | 28,357,787 | | | | 1,400,591 | |
| British American Tobacco PLC | | | 47,632,300 | | | | 1,517,803 | |
| British American Tobacco PLC (ADR) | | | 3,597,865 | | | | 114,628 | |
| Coca-Cola Co. | | | 24,856,000 | | | | 1,176,932 | |
| Lamb Weston Holdings, Inc.2 | | | 10,333,473 | | | | 760,130 | |
| Nestlé SA3 | | | 8,260,098 | | | | 670,476 | |
| Philip Morris International Inc. | | | 24,005,300 | | | | 1,602,594 | |
| Other securities | | | | | | | 2,019,479 | |
| | | | | | | | 9,262,633 | |
| 6 | The Investment Company of America |
| | | Shares | | | Value
(000) | |
| Health care 19.04% | | | | | | | | |
| Abbott Laboratories | | | 33,431,000 | | | $ | 2,418,064 | |
| AbbVie Inc. | | | 56,947,449 | | | | 5,249,985 | |
| Amgen Inc. | | | 10,302,639 | | | | 2,005,615 | |
| Cigna Corp. | | | 2,494,173 | | | | 473,693 | |
| Daiichi Sankyo Co., Ltd.3 | | | 15,595,000 | | | | 498,255 | |
| Gilead Sciences, Inc. | | | 21,055,591 | | | | 1,317,027 | |
| Stryker Corp. | | | 3,691,917 | | | | 578,708 | |
| Thermo Fisher Scientific Inc. | | | 2,816,000 | | | | 630,193 | |
| UnitedHealth Group Inc. | | | 5,142,997 | | | | 1,281,223 | |
| Other securities | | | | | | | 1,811,799 | |
| | | | | | | | 16,264,562 | |
| | | | | | | | | |
| Financials 6.05% | | | | | | | | |
| American International Group, Inc. | | | 15,289,351 | | | | 602,553 | |
| Berkshire Hathaway Inc., Class B1 | | | 4,050,000 | | | | 826,929 | |
| JPMorgan Chase & Co. | | | 7,685,000 | | | | 750,210 | |
| Wells Fargo & Co. | | | 13,490,400 | | | | 621,638 | |
| Other securities | | | | | | | 2,365,670 | |
| | | | | | | | 5,167,000 | |
| | | | | | | | | |
| Information technology 14.60% | | | | | | | | |
| Accenture PLC, Class A | | | 4,610,300 | | | | 650,098 | |
| Broadcom Inc. | | | 6,371,500 | | | | 1,620,145 | |
| Intel Corp. | | | 29,558,000 | | | | 1,387,157 | |
| Mastercard Inc., Class A | | | 2,800,000 | | | | 528,220 | |
| Microsoft Corp. | | | 35,174,673 | | | | 3,572,691 | |
| QUALCOMM Inc. | | | 17,016,800 | | | | 968,426 | |
| Texas Instruments Inc. | | | 9,686,983 | | | | 915,420 | |
| Other securities | | | | | | | 2,827,744 | |
| | | | | | | | 12,469,901 | |
| | | | | | | | | |
| Communication services 10.92% | | | | | | | | |
| Alphabet Inc., Class A1 | | | 1,691,300 | | | | 1,767,341 | |
| Alphabet Inc., Class C1 | | | 1,465,559 | | | | 1,517,747 | |
| CBS Corp., Class B | | | 16,789,300 | | | | 734,028 | |
| Facebook, Inc., Class A1 | | | 23,202,700 | | | | 3,041,642 | |
| Verizon Communications Inc. | | | 24,156,792 | | | | 1,358,095 | |
| Other securities | | | | | | | 912,210 | |
| | | | | | | | 9,331,063 | |
| | | | | | | | | |
| Utilities 1.77% | | | | | | | | |
| Dominion Energy, Inc. | | | 7,723,824 | | | | 551,945 | |
| Other securities | | | | | | | 962,777 | |
| | | | | | | | 1,514,722 | |
| | | | | | | | | |
| Real estate 0.46% | | | | | | | | |
| Other securities | | | | | | | 393,425 | |
| | | | | | | | | |
| Total common stocks (cost: $62,622,515,000) | | | | | | | 79,827,915 | |
| | | | | | | | | |
| Bonds, notes & other debt instruments 0.09% | | Principal amount
(000) | | | | | |
| U.S. Treasury bonds & notes 0.09% | | | | | | | | |
| U.S. Treasury 2.75% 2023 | | $ | 70,360 | | | | 71,099 | |
| | | | | | | | | |
| Total bonds, notes & other debt instruments (cost: $70,096,000) | | | | | | | 71,099 | |
| The Investment Company of America | 7 |
| Short-term securities 6.14% | | Principal amount
(000) | | | Value
(000) | |
| Coca-Cola Co. 2.40% due 1/15/2019–1/23/20194 | | $ | 65,000 | | | $ | 64,910 | |
| ExxonMobil Corp. 2.32% due 1/8/2019 | | | 50,000 | | | | 49,973 | |
| Federal Home Loan Bank 2.24%–2.40% due 1/9/2019–3/6/2019 | | | 1,641,700 | | | | 1,638,040 | |
| U.S. Treasury Bills 2.17%–2.44% due 1/10/2019–5/23/2019 | | | 2,551,900 | | | | 2,537,010 | |
| Other securities | | | | | | | 957,777 | |
| | | | | | | | | |
| Total short-term securities (cost: $5,247,704,000) | | | | | | | 5,247,710 | |
| Total investment securities 99.67% (cost: $67,940,315,000) | | | | | | | 85,146,724 | |
| Other assets less liabilities 0.33% | | | | | | | 285,535 | |
| | | | | | | | | |
| Net assets 100.00% | | | | | | $ | 85,432,259 | |
This summary investment portfolio is designed to streamline the report and help investors better focus on the fund’s principal holdings. See the inside back cover for details on how to obtain a complete schedule of portfolio holdings.
“Other securities” includes all issues that are not disclosed separately in the summary investment portfolio.
Investments in affiliates
A company is an affiliate of the fund under the Investment Company Act of 1940 if the fund’s holdings in that company represent 5% or more of the outstanding voting shares. The value of the fund’s affiliated-company holdings is either shown in the summary investment portfolio or included in the value of “Other securities” under the respective industry sectors. Further details on these holdings and related transactions during the year ended December 31, 2018, appear below.
| | | Beginning
shares | | Additions | | Reductions | | Ending
shares | | Net
realized
gain (loss)
(000) | | | Net
unrealized
(depreciation)
appreciation
(000) | | | Dividend
income
(000) | | | Value of
affiliates at
12/31/2018
(000) | |
| Common stocks 2.75% | | | | | | | | | | | | | | | | | | | | | | | | |
| Energy 0.64% | | | | | | | | | | | | | | | | | | | | | | | | |
| Noble Energy, Inc. | | 19,908,889 | | 9,363,134 | | — | | 29,272,023 | | $ | — | | | $ | (277,069 | ) | | $ | 10,642 | | | $ | 549,143 | |
| | | | | | | | | | | | | | | | | | | | | | | | | |
| Consumer discretionary 0.73% | | | | | | | | | | | | | | | | | | | | | | | | |
| Hasbro, Inc. | | 2,000,000 | | 5,618,390 | | — | | 7,618,390 | | | — | | | | (66,422 | ) | | | 13,639 | | | | 618,994 | |
| | | | | | | | | | | | | | | | | | | | | | | | | |
| Consumer staples 0.89% | | | | | | | | | | | | | | | | | | | | | | | | |
| Lamb Weston Holdings, Inc. | | 9,502,013 | | 2,127,000 | | 1,295,540 | | 10,333,473 | | | 31,437 | | | | 130,712 | | | | 7,347 | | | | 760,130 | |
| Avon Products, Inc.1,5 | | 25,493,441 | | — | | 25,493,441 | | — | | | (97,688 | ) | | | 83,326 | | | | — | | | | — | |
| | | | | | | | | | | | | | | | | | | | | | | | 760,130 | |
| | | | | | | | | | | | | | | | | | | | | | | | | |
| Information technology 0.49% | | | | | | | | | | | | | | | | | | | | | | | | |
| Western Union Co. | | 31,972,600 | | — | | 7,338,000 | | 24,634,600 | | | 15,092 | | | | (58,582 | ) | | | 18,722 | | | | 420,266 | |
| Total 2.75% | | | | | | | | | | $ | (51,159 | ) | | $ | (188,035 | ) | | $ | 50,350 | | | $ | 2,348,533 | |
The following footnotes apply to either the individual securities noted or one or more of the securities aggregated and listed as a single line item.
| 1 | Security did not produce income during the last 12 months. |
| 2 | Represents an affiliated company as defined under the Investment Company Act of 1940. |
| 3 | Valued under fair value procedures adopted by authority of the board of trustees. The total value of all such securities, including those in “Other securities,” was $2,362,001,000, which represented 2.76% of the net assets of the fund. This entire amount relates to certain securities trading outside the U.S. whose values were adjusted as a result of significant market movements following the close of local trading. |
| 4 | Acquired in a transaction exempt from registration under Rule 144A or Section 4(2) of the Securities Act of 1933. May be resold in the U.S. in transactions exempt from registration, normally to qualified institutional buyers. The total value of all such securities, including those in “Other securities,” was $831,380,000, which represented .97% of the net assets of the fund. |
| 5 | Unaffiliated issuer at 12/31/2018. |
Key to abbreviations
ADR = American Depositary Receipts
CAD = Canadian dollars
See notes to financial statements
| 8 | The Investment Company of America |
Financial statements
Statement of assets and liabilities
at December 31, 2018 | | (dollars in thousands) | |
| | | | |
| Assets: | | | | | | | | |
| Investment securities, at value: | | | | | | | | |
| Unaffiliated issuers (cost: $65,697,015) | | $ | 82,798,191 | | | | | |
| Affiliated issuers (cost: $2,243,300) | | | 2,348,533 | | | $ | 85,146,724 | |
| Cash | | | | | | | 154,812 | |
| Cash denominated in currencies other than U.S. dollars (cost: $6,634) | | | | | | | 6,634 | |
| Receivables for: | | | | | | | | |
| Sales of investments | | | 63,233 | | | | | |
| Sales of fund’s shares | | | 152,181 | | | | | |
| Dividends and interest | | | 152,247 | | | | | |
| Other | | | 146 | | | | 367,807 | |
| | | | | | | | 85,675,977 | |
| Liabilities: | | | | | | | | |
| Payables for: | | | | | | | | |
| Purchases of investments | | | 46,985 | | | | | |
| Repurchases of fund’s shares | | | 150,607 | | | | | |
| Investment advisory services | | | 17,564 | | | | | |
| Services provided by related parties | | | 19,607 | | | | | |
| Trustees’ deferred compensation | | | 5,846 | | | | | |
| Other | | | 3,109 | | | | 243,718 | |
| Net assets at December 31, 2018 | | | | | | $ | 85,432,259 | |
| | | | | | | | | |
| Net assets consist of: | | | | | | | | |
| Capital paid in on shares of beneficial interest | | | | | | $ | 67,059,942 | |
| Total distributable earnings | | | | | | | 18,372,317 | |
| Net assets at December 31, 2018 | | | | | | $ | 85,432,259 | |
(dollars and shares in thousands, except per-share amounts)
Shares of beneficial interest issued and outstanding (no stated par value) —
unlimited shares authorized (2,520,559 total shares outstanding)
| | | Net assets | | | Shares
outstanding | | | Net asset value
per share | |
| Class A | | $ | 54,973,311 | | | | 1,620,927 | | | $ | 33.91 | |
| Class C | | | 1,497,916 | | | | 44,666 | | | | 33.54 | |
| Class T | | | 9 | | | | — | * | | | 33.91 | |
| Class F-1 | | | 1,639,057 | | | | 48,461 | | | | 33.82 | |
| Class F-2 | | | 6,066,431 | | | | 178,969 | | | | 33.90 | |
| Class F-3 | | | 2,562,115 | | | | 75,579 | | | | 33.90 | |
| Class 529-A | | | 2,495,266 | | | | 73,774 | | | | 33.82 | |
| Class 529-C | | | 293,122 | | | | 8,687 | | | | 33.74 | |
| Class 529-E | | | 78,920 | | | | 2,341 | | | | 33.71 | |
| Class 529-T | | | 11 | | | | — | * | | | 33.91 | |
| Class 529-F-1 | | | 93,380 | | | | 2,764 | | | | 33.78 | |
| Class R-1 | | | 71,977 | | | | 2,141 | | | | 33.63 | |
| Class R-2 | | | 581,831 | | | | 17,279 | | | | 33.67 | |
| Class R-2E | | | 52,247 | | | | 1,545 | | | | 33.81 | |
| Class R-3 | | | 863,996 | | | | 25,578 | | | | 33.78 | |
| Class R-4 | | | 1,346,027 | | | | 39,810 | | | | 33.81 | |
| Class R-5E | | | 23,697 | | | | 699 | | | | 33.89 | |
| Class R-5 | | | 244,515 | | | | 7,211 | | | | 33.91 | |
| Class R-6 | | | 12,548,431 | | | | 370,128 | | | | 33.90 | |
| * | Amount less than one thousand. |
See notes to financial statements
| The Investment Company of America | 9 |
Statement of operations
for the year ended December 31, 2018 | | (dollars in thousands) | |
| | | | | | | | | |
| Investment income: | | | | | | | | |
| Income: | | | | | | | | |
| Dividends (net of non-U.S. taxes of $30,268; also includes $50,350 from affiliates) | | $ | 2,168,630 | | | | | |
| Interest | | | 119,746 | | | $ | 2,288,376 | |
| Fees and expenses*: | | | | | | | | |
| Investment advisory services | | | 221,930 | | | | | |
| Distribution services | | | 197,923 | | | | | |
| Transfer agent services | | | 65,824 | | | | | |
| Administrative services | | | 22,312 | | | | | |
| Reports to shareholders | | | 2,362 | | | | | |
| Registration statement and prospectus | | | 3,074 | | | | | |
| Trustees’ compensation | | | 630 | | | | | |
| Auditing and legal | | | 72 | | | | | |
| Custodian | | | 1,624 | | | | | |
| Other | | | 2,641 | | | | | |
| Total fees and expenses before reimbursements | | | 518,392 | | | | | |
| Less transfer agent services reimbursements | | | 11 | | | | | |
| Total fees and expenses after reimbursements | | | | | | | 518,381 | |
| Net investment income | | | | | | | 1,769,995 | |
| | | | | | | | | |
| Net realized gain and unrealized depreciation: | | | | | | | | |
| Net realized gain (loss) on: | | | | | | | | |
| Investments: | | | | | | | | |
| Unaffiliated issuers | | | 6,760,979 | | | | | |
| Affiliated issuers | | | (51,159 | ) | | | | |
| Currency transactions | | | (2,076 | ) | | | 6,707,744 | |
| Net unrealized depreciation on: | | | | | | | | |
| Investments: | | | | | | | | |
| Unaffiliated issuers | | | (14,190,797 | ) | | | | |
| Affiliated issuers | | | (188,035 | ) | | | | |
| Currency translations | | | (249 | ) | | | (14,379,081 | ) |
| Net realized gain and unrealized depreciation | | | | | | | (7,671,337 | ) |
| | | | | | | | | |
| Net decrease in net assets resulting from operations | | | | | | $ | (5,901,342 | ) |
| * | Additional information related to class-specific fees and expenses is included in the notes to financial statements. |
Statements of changes in net assets
| | | Year ended December 31 | |
| | | 2018 | | | 2017 | |
| Operations: | | | | | | | | |
| Net investment income | | $ | 1,769,995 | | | $ | 1,534,169 | |
| Net realized gain | | | 6,707,744 | | | | 6,752,903 | |
| Net unrealized (depreciation) appreciation | | | (14,379,081 | ) | | | 7,447,391 | |
| Net (decrease) increase in net assets resulting from operations | | | (5,901,342 | ) | | | 15,734,463 | |
| | | | | | | | | |
| Distributions paid to shareholders | | | (9,207,183 | ) | | | (6,490,489 | )* |
| | | | | | | | | |
| Net capital share transactions | | | 6,591,604 | | | | 4,741,269 | |
| | | | | | | | | |
| Total (decrease) increase in net assets | | | (8,516,921 | ) | | | 13,985,243 | |
| | | | | | | | | |
| Net assets: | | | | | | | | |
| Beginning of year | | | 93,949,180 | | | | 79,963,937 | |
| End of year | | $ | 85,432,259 | | | $ | 93,949,180 | |
| * | Prior year comparative amounts have been adjusted to reflect current presentation under new accounting standards. Prior year distributions were $1,510,695 from net investment income and $4,979,794 from net realized gain on investments. |
See notes to financial statements
| 10 | The Investment Company of America |
Notes to financial statements
1. Organization
The Investment Company of America (the “fund”) is registered under the Investment Company Act of 1940 as an open-end, diversified management investment company. The fund seeks long-term growth of capital and income.
The fund has 19 share classes consisting of six retail share classes (Classes A, C, T, F-1, F-2 and F-3), five 529 college savings plan share classes (Classes 529-A, 529-C, 529-E, 529-T and 529-F-1) and eight retirement plan share classes (Classes R-1, R-2, R-2E, R-3, R-4, R-5E, R-5 and R-6). The 529 college savings plan share classes can be used to save for college education. The retirement plan share classes are generally offered only through eligible employer-sponsored retirement plans. The fund’s share classes are described further in the following table:
| Share class | | Initial sales charge | | Contingent deferred sales charge upon
redemption | | Conversion feature |
| Classes A and 529-A | | Up to 5.75% | | None (except 1% for certain redemptions within 18 months of purchase without an initial sales charge) | | None |
| Class C | | None | | 1% for redemptions within one year of purchase | | Class C converts to Class F-1 after 10 years |
| Class 529-C | | None | | 1% for redemptions within one year of purchase | | Class 529-C converts to Class 529-A after 10 years |
| Class 529-E | | None | | None | | None |
| Classes T and 529-T* | | Up to 2.50% | | None | | None |
| Classes F-1, F-2, F-3 and 529-F-1 | | None | | None | | None |
| Classes R-1, R-2, R-2E, R-3, R-4, R-5E, R-5 and R-6 | | None | | None | | None |
| * | Class T and 529-T shares are not available for purchase. |
Holders of all share classes have equal pro rata rights to the assets, dividends and liquidation proceeds of the fund. Each share class has identical voting rights, except for the exclusive right to vote on matters affecting only its class. Share classes have different fees and expenses (“class-specific fees and expenses”), primarily due to different arrangements for distribution, transfer agent and administrative services. Differences in class-specific fees and expenses will result in differences in net investment income and, therefore, the payment of different per-share dividends by each share class.
2. Significant accounting policies
The fund is an investment company that applies the accounting and reporting guidance issued in Topic 946 by the U.S. Financial Accounting Standards Board. The fund’s financial statements have been prepared to comply with U.S. generally accepted accounting principles (“U.S. GAAP”). These principles require the fund’s investment adviser to make estimates and assumptions that affect reported amounts and disclosures. Actual results could differ from those estimates. Subsequent events, if any, have been evaluated through the date of issuance in the preparation of the financial statements. The fund follows the significant accounting policies described in this section, as well as the valuation policies described in the next section on valuation.
Cash— Cash may include amounts held in an interest bearing deposit facility.
Security transactions and related investment income— Security transactions are recorded by the fund as of the date the trades are executed with brokers. Realized gains and losses from security transactions are determined based on the specific identified cost of the securities. In the event a security is purchased with a delayed payment date, the fund will segregate liquid assets sufficient to meet its payment obligations. Dividend income is recognized on the ex-dividend date and interest income is recognized on an accrual basis. Market discounts, premiums and original issue discounts on fixed-income securities are amortized daily over the expected life of the security.
Class allocations— Income, fees and expenses (other than class-specific fees and expenses) and realized and unrealized gains and losses are allocated daily among the various share classes based on their relative net assets. Class-specific fees and expenses, such as distribution, transfer agent and administrative services, are charged directly to the respective share class.
Distributions paid to shareholders— Income dividends and capital gain distributions are recorded on the ex-dividend date.
| The Investment Company of America | 11 |
Currency translation— Assets and liabilities, including investment securities, denominated in currencies other than U.S. dollars are translated into U.S. dollars at the exchange rates supplied by one or more pricing vendors on the valuation date. Purchases and sales of investment securities and income and expenses are translated into U.S. dollars at the exchange rates on the dates of such transactions. The effects of changes in exchange rates on investment securities are included with the net realized gain or loss and net unrealized appreciation or depreciation on investments in the fund’s statement of operations. The realized gain or loss and unrealized appreciation or depreciation resulting from all other transactions denominated in currencies other than U.S. dollars are disclosed separately.
3. Valuation
Capital Research and Management Company (“CRMC”), the fund’s investment adviser, values the fund’s investments at fair value as defined by U.S. GAAP. The net asset value of each share class of the fund is generally determined as of approximately 4:00 p.m. New York time each day the New York Stock Exchange is open.
Methods and inputs— The fund’s investment adviser uses the following methods and inputs to establish the fair value of the fund’s assets and liabilities. Use of particular methods and inputs may vary over time based on availability and relevance as market and economic conditions evolve.
Equity securities are generally valued at the official closing price of, or the last reported sale price on, the exchange or market on which such securities are traded, as of the close of business on the day the securities are being valued or, lacking any sales, at the last available bid price. Prices for each security are taken from the principal exchange or market on which the security trades.
Fixed-income securities, including short-term securities, are generally valued at prices obtained from one or more pricing vendors. Vendors value such securities based on one or more of the inputs described in the following table. The table provides examples of inputs that are commonly relevant for valuing particular classes of fixed-income securities in which the fund is authorized to invest. However, these classifications are not exclusive, and any of the inputs may be used to value any other class of fixed-income security.
| Fixed-income class | | Examples of standard inputs |
| All | | Benchmark yields, transactions, bids, offers, quotations from dealers and trading systems, new issues, spreads and other relationships observed in the markets among comparable securities; and proprietary pricing models such as yield measures calculated using factors such as cash flows, financial or collateral performance and other reference data (collectively referred to as “standard inputs”) |
| Corporate bonds & notes; convertible securities | | Standard inputs and underlying equity of the issuer |
| Bonds & notes of governments & government agencies | | Standard inputs and interest rate volatilities |
| Mortgage-backed; asset-backed obligations | | Standard inputs and cash flows, prepayment information, default rates, delinquency and loss assumptions, collateral characteristics, credit enhancements and specific deal information |
When the fund’s investment adviser deems it appropriate to do so (such as when vendor prices are unavailable or deemed to be not representative), fixed-income securities will be valued in good faith at the mean quoted bid and ask prices that are reasonably and timely available (or bid prices, if ask prices are not available) or at prices for securities of comparable maturity, quality and type.
Securities with both fixed-income and equity characteristics, or equity securities traded principally among fixed-income dealers, are generally valued in the manner described for either equity or fixed-income securities, depending on which method is deemed most appropriate by the fund’s investment adviser.
Securities and other assets for which representative market quotations are not readily available or are considered unreliable by the fund’s investment adviser are fair valued as determined in good faith under fair valuation guidelines adopted by authority of the fund’s board of trustees as further described. The investment adviser follows fair valuation guidelines, consistent with U.S. Securities and Exchange Commission rules and guidance, to consider relevant principles and factors when making fair value determinations. The investment adviser considers relevant indications of value that are reasonably and timely available to it in determining the fair value to be assigned to a particular security, such as the type and cost of the security; contractual or legal restrictions on resale of the security; relevant financial or business developments of the issuer; actively traded similar or related securities; conversion or exchange rights on the security; related corporate actions; significant events occurring after the close of trading in the security; and changes in overall market conditions. In addition, the closing prices of equity securities that trade in markets outside U.S. time zones may be adjusted to reflect significant events that occur after the close of local trading but before the net asset value of each share class of the fund is determined. Fair valuations and
| 12 | The Investment Company of America |
valuations of investments that are not actively trading involve judgment and may differ materially from valuations that would have been used had greater market activity occurred.
Processes and structure— The fund’s board of trustees has delegated authority to the fund’s investment adviser to make fair value determinations, subject to board oversight. The investment adviser has established a Joint Fair Valuation Committee (the “Fair Valuation Committee”) to administer, implement and oversee the fair valuation process, and to make fair value decisions. The Fair Valuation Committee regularly reviews its own fair value decisions, as well as decisions made under its standing instructions to the investment adviser’s valuation teams. The Fair Valuation Committee reviews changes in fair value measurements from period to period and may, as deemed appropriate, update the fair valuation guidelines to better reflect the results of back testing and address new or evolving issues. The Fair Valuation Committee reports any changes to the fair valuation guidelines to the board of trustees. The fund’s board and audit committee also regularly review reports that describe fair value determinations and methods.
The fund’s investment adviser has also established a Fixed-Income Pricing Review Group to administer and oversee the fixed-income valuation process, including the use of fixed-income pricing vendors. This group regularly reviews pricing vendor information and market data. Pricing decisions, processes and controls over security valuation are also subject to additional internal reviews, including an annual control self-evaluation program facilitated by the investment adviser’s compliance group.
Classifications— The fund’s investment adviser classifies the fund’s assets and liabilities into three levels based on the inputs used to value the assets or liabilities. Level 1 values are based on quoted prices in active markets for identical securities. Level 2 values are based on significant observable market inputs, such as quoted prices for similar securities and quoted prices in inactive markets. Certain securities trading outside the U.S. may transfer between Level 1 and Level 2 due to valuation adjustments resulting from significant market movements following the close of local trading. Level 3 values are based on significant unobservable inputs that reflect the investment adviser’s determination of assumptions that market participants might reasonably use in valuing the securities. The valuation levels are not necessarily an indication of the risk or liquidity associated with the underlying investment. For example, U.S. government securities are reflected as Level 2 because the inputs used to determine fair value may not always be quoted prices in an active market. The following table presents the fund’s valuation levels as of December 31, 2018 (dollars in thousands):
| | | Investment securities | |
| | | Level 1 | | | Level 2 | | | Level 3 | | | Total | |
| Assets: | | | | | | | | | | | | | | | | |
| Common stocks: | | | | | | | | | | | | | | | | |
| Energy | | $ | 7,232,927 | | | $ | 129,438 | | | $ | — | | | $ | 7,362,365 | |
| Materials | | | 2,674,414 | | | | — | | | | — | | | | 2,674,414 | |
| Industrials | | | 6,566,229 | | | | — | | | | — | | | | 6,566,229 | |
| Consumer discretionary | | | 8,582,542 | | | | 239,059 | | | | — | | | | 8,821,601 | |
| Consumer staples | | | 8,592,157 | | | | 670,476 | | | | — | | | | 9,262,633 | |
| Health care | | | 15,551,179 | | | | 713,383 | | | | — | | | | 16,264,562 | |
| Financials | | | 5,002,933 | | | | 164,067 | | | | — | | | | 5,167,000 | |
| Information technology | | | 12,024,323 | | | | 445,578 | | | | — | | | | 12,469,901 | |
| Communication services | | | 9,331,063 | | | | — | | | | — | | | | 9,331,063 | |
| Utilities | | | 1,514,722 | | | | — | | | | — | | | | 1,514,722 | |
| Real estate | | | 393,425 | | | | — | | | | — | | | | 393,425 | |
| Bonds, notes & other debt instruments | | | — | | | | 71,099 | | | | — | | | | 71,099 | |
| Short-term securities | | | — | | | | 5,247,710 | | | | — | | | | 5,247,710 | |
| Total | | $ | 77,465,914 | | | $ | 7,680,810 | | | $ | — | | | $ | 85,146,724 | |
4. Risk factors
Investing in the fund may involve certain risks including, but not limited to, those described below.
Market conditions— The prices of, and the income generated by, the common stocks and other securities held by the fund may decline — sometimes rapidly or unpredictably — due to various factors, including events or conditions affecting the general economy or particular industries; overall market changes; local, regional or global political, social or economic instability; governmental, governmental agency or central bank responses to economic conditions; and currency exchange rate, interest rate and commodity price fluctuations.
Issuer risks— The prices of, and the income generated by, securities held by the fund may decline in response to various factors directly related to the issuers of such securities, including reduced demand for an issuer’s goods or services, poor management performance, major litigation against the issuer, changes in government regulations affecting the issuer or its competitive environment and strategic initiatives such as mergers, acquisitions or dispositions and the market response to any such initiatives.
| The Investment Company of America | 13 |
Investing in income-oriented stocks— The value of the fund’s securities and income provided by the fund may be reduced by changes in the dividend policies of, and the capital resources available for dividend payments at, the companies in which the fund invests.
Investing in growth-oriented stocks— Growth-oriented common stocks and other equity-type securities (such as preferred stocks, convertible preferred stocks and convertible bonds) may involve larger price swings and greater potential for loss than other types of investments.
Investing outside the U.S.— Securities of issuers domiciled outside the U.S., or with significant operations or revenues outside the U.S., may lose value because of adverse political, social, economic or market developments (including social instability, regional conflicts, terrorism and war) in the countries or regions in which the issuers operate or generate revenue. These securities may also lose value due to changes in foreign currency exchange rates against the U.S. dollar and/or currencies of other countries. Issuers of these securities may be more susceptible to actions of foreign governments, such as nationalization, currency blockage or the imposition of price controls or punitive taxes, each of which could adversely impact the value of these securities. Securities markets in certain countries may be more volatile and/or less liquid than those in the U.S. Investments outside the U.S. may also be subject to different accounting practices and different regulatory, legal and reporting standards and practices, and may be more difficult to value, than those in the U.S. In addition, the value of investments outside the U.S. may be reduced by foreign taxes, including foreign withholding taxes on interest and dividends. Further, there may be increased risks of delayed settlement of securities purchased or sold by the fund. The risks of investing outside the U.S. may be heightened in connection with investments in emerging markets.
Management— The investment adviser to the fund actively manages the fund’s investments. Consequently, the fund is subject to the risk that the methods and analyses, including models, tools and data, employed by the investment adviser in this process may be flawed or incorrect and may not produce the desired results. This could cause the fund to lose value or its investment results to lag relevant benchmarks or other funds with similar objectives.
5. Taxation and distributions
Federal income taxation— The fund complies with the requirements under Subchapter M of the Internal Revenue Code applicable to mutual funds and intends to distribute substantially all of its net taxable income and net capital gains each year. The fund is not subject to income taxes to the extent such distributions are made. Therefore, no federal income tax provision is required.
As of and during the period ended December 31, 2018, the fund did not have a liability for any unrecognized tax benefits. The fund recognizes interest and penalties, if any, related to unrecognized tax benefits as income tax expense in the statement of operations. During the period, the fund did not incur any significant interest or penalties.
The fund’s tax returns are not subject to examination by federal, state and, if applicable, non-U.S. tax authorities after the expiration of each jurisdiction’s statute of limitations, which is generally three years after the date of filing but can be extended in certain jurisdictions.
Non-U.S. taxation— Dividend and interest income are recorded net of non-U.S. taxes paid. The fund may file withholding tax reclaims in certain jurisdictions to recover a portion of amounts previously withheld. As a result of rulings from European courts, the fund filed for additional reclaims related to prior years. These reclaims are recorded when the amount is known and there are no significant uncertainties on collectability. Gains realized by the fund on the sale of securities in certain countries, if any, may be subject to non-U.S. taxes. If applicable, the fund records an estimated deferred tax liability based on unrealized gains to provide for potential non-U.S. taxes payable upon the sale of these securities.
Distributions— Distributions paid to shareholders are based on net investment income and net realized gains determined on a tax basis, which may differ from net investment income and net realized gains for financial reporting purposes. These differences are due primarily to different treatment for items such as currency gains and losses; short-term capital gains and losses; capital losses related to sales of certain securities within 30 days of purchase; cost of investments sold and income on certain investments. The fiscal year in which amounts are distributed may differ from the year in which the net investment income and net realized gains are recorded by the fund for financial reporting purposes. The fund may also designate a portion of the amount paid to redeeming shareholders as a distribution for tax purposes.
During the year ended December 31, 2018, the fund reclassified $312,187,000 from total distributable earnings to capital paid in on shares of beneficial interest to align financial reporting with tax reporting.
| 14 | The Investment Company of America |
As of December 31, 2018, the tax basis components of distributable earnings, unrealized appreciation (depreciation) and cost of investments were as follows (dollars in thousands):
| Undistributed ordinary income | | $ | 553,848 | |
| Undistributed long-term capital gains | | | 307,385 | |
| Post-October capital loss deferral | | | (141,619 | ) |
| Gross unrealized appreciation on investments | | | 23,515,442 | |
| Gross unrealized depreciation on investments | | | (5,857,036 | ) |
| Net unrealized appreciation on investments | | | 17,658,406 | |
| Cost of investments | | | 67,488,318 | |
| * | This deferral is considered incurred in the subsequent year. |
Distributions paid were characterized for tax purposes as follows (dollars in thousands):
| | | Year ended December 31, 2018 | | | Year ended December 31, 2017 | |
| Share class | | Ordinary
income | | | Long-term
capital gains | | | Total
distributions
paid | | | Ordinary
income | | | Long-term
capital gains | | | Total
distributions
paid | |
| Class A | | $ | 1,121,730 | | | $ | 4,848,652 | | | $ | 5,970,382 | | | $ | 1,044,673 | | | $ | 3,382,486 | | | $ | 4,427,159 | |
| Class B1 | | | | | | | | | | | | | | | — | | | | — | | | | — | |
| Class C | | | 17,309 | | | | 132,978 | | | | 150,287 | | | | 16,174 | | | | 96,616 | | | | 112,790 | |
| Class T2 | | | — | 3 | | | 1 | | | | 1 | | | | — | 3 | | | — | 3 | | | — | 3 |
| Class F-1 | | | 32,834 | | | | 147,189 | | | | 180,023 | | | | 33,043 | | | | 109,027 | | | | 142,070 | |
| Class F-2 | | | 120,859 | | | | 517,165 | | | | 638,024 | | | | 84,654 | | | | 254,585 | | | | 339,239 | |
| Class F-34 | | | 59,032 | | | | 223,374 | | | | 282,406 | | | | 36,371 | | | | 148,708 | | | | 185,079 | |
| Class 529-A | | | 48,157 | | | | 219,103 | | | | 267,260 | | | | 42,287 | | | | 150,850 | | | | 193,137 | |
| Class 529-B1 | | | | | | | | | | | | | | | — | | | | — | | | | — | |
| Class 529-C | | | 3,233 | | | | 26,082 | | | | 29,315 | | | | 3,622 | | | | 19,905 | | | | 23,527 | |
| Class 529-E | | | 1,333 | | | | 6,998 | | | | 8,331 | | | | 1,239 | | | | 4,942 | | | | 6,181 | |
| Class 529-T2 | | | — | 3 | | | 1 | | | | 1 | | | | — | 3 | | | — | 3 | | | — | 3 |
| Class 529-F-1 | | | 1,824 | | | | 7,965 | | | | 9,789 | | | | 1,426 | | | | 4,366 | | | | 5,792 | |
| Class R-1 | | | 829 | | | | 6,448 | | | | 7,277 | | | | 775 | | | | 4,713 | | | | 5,488 | |
| Class R-2 | | | 6,548 | | | | 51,498 | | | | 58,046 | | | | 6,022 | | | | 36,557 | | | | 42,579 | |
| Class R-2E | | | 681 | | | | 4,384 | | | | 5,065 | | | | 408 | | | | 2,253 | | | | 2,661 | |
| Class R-3 | | | 14,092 | | | | 76,352 | | | | 90,444 | | | | 13,449 | | | | 55,089 | | | | 68,538 | |
| Class R-4 | | | 27,197 | | | | 120,188 | | | | 147,385 | | | | 26,722 | | | | 89,576 | | | | 116,298 | |
| Class R-5E | | | 415 | | | | 1,928 | | | | 2,343 | | | | 51 | | | | 153 | | | | 204 | |
| Class R-5 | | | 5,936 | | | | 22,217 | | | | 28,153 | | | | 5,663 | | | | 16,645 | | | | 22,308 | |
| Class R-6 | | | 271,045 | | | | 1,061,606 | | | | 1,332,651 | | | | 194,116 | | | | 603,323 | | | | 797,439 | |
| Total | | $ | 1,733,054 | | | $ | 7,474,129 | | | $ | 9,207,183 | | | $ | 1,510,695 | | | $ | 4,979,794 | | | $ | 6,490,489 | |
| 1 | Class B and 529-B shares were fully liquidated on May 5, 2017. |
| 2 | Class T and 529-T shares began investment operations on April 7, 2017. |
| 3 | Amount less than one thousand. |
| 4 | Class F-3 shares began investment operations on January 27, 2017. |
6. Fees and transactions with related parties
CRMC, the fund’s investment adviser, is the parent company of American Funds Distributors,® Inc. (“AFD”), the principal underwriter of the fund’s shares, and American Funds Service Company® (“AFS”), the fund’s transfer agent. CRMC, AFD and AFS are considered related parties to the fund.
Investment advisory services— The fund has an investment advisory and service agreement with CRMC that provides for monthly fees accrued daily. These fees are based on a series of decreasing annual rates beginning with 0.390% on the first $1 billion of daily net assets and decreasing to 0.219% on such assets in excess of $89 billion. For the year ended December 31, 2018, the investment advisory services fee was $221,930,000, which was equivalent to an annualized rate of 0.234% of average daily net assets.
| The Investment Company of America | 15 |
Class-specific fees and expenses— Expenses that are specific to individual share classes are accrued directly to the respective share class. The principal class-specific fees and expenses are further described below:
Distribution services— The fund has plans of distribution for all share classes, except Class F-2, F-3, R-5E, R-5 and R-6 shares. Under the plans, the board of trustees approves certain categories of expenses that are used to finance activities primarily intended to sell fund shares and service existing accounts. The plans provide for payments, based on an annualized percentage of average daily net assets, ranging from 0.25% to 1.00% as noted in this section. In some cases, the board of trustees has limited the amounts that may be paid to less than the maximum allowed by the plans. All share classes with a plan may use up to 0.25% of average daily net assets to pay service fees, or to compensate AFD for paying service fees, to firms that have entered into agreements with AFD to provide certain shareholder services. The remaining amounts available to be paid under each plan are paid to dealers to compensate them for their sales activities.
| Share class | | Currently approved limits | | Plan limits |
| Class A | | 0.25 | % | | 0.25 | % |
| Class 529-A | | 0.25 | | | 0.50 | |
| Classes C, 529-C and R-1 | | 1.00 | | | 1.00 | |
| Class R-2 | | 0.75 | | | 1.00 | |
| Class R-2E | | 0.60 | | | 0.85 | |
| Classes 529-E and R-3 | | 0.50 | | | 0.75 | |
| Classes T, F-1, 529-T, 529-F-1 and R-4 | | 0.25 | | | 0.50 | |
For Class A and 529-A shares, distribution-related expenses include the reimbursement of dealer and wholesaler commissions paid by AFD for certain shares sold without a sales charge. These share classes reimburse AFD for amounts billed within the prior 15 months but only to the extent that the overall annual expense limits are not exceeded. As of December 31, 2018, there were no unreimbursed expenses subject to reimbursement for Class A or 529-A shares.
Transfer agent services— The fund has a shareholder services agreement with AFS under which the fund compensates AFS for providing transfer agent services to each of the fund’s share classes. These services include recordkeeping, shareholder communications and transaction processing. In addition, the fund reimburses AFS for amounts paid to third parties for performing transfer agent services on behalf of fund shareholders.
Administrative services— The fund has an administrative services agreement with CRMC under which the fund compensates CRMC for providing administrative services to Class A, C, T, F, 529 and R shares. Administrative services are provided by CRMC to help assist third parties providing non-distribution services to fund shareholders. These services include providing in depth information on the fund and market developments that impact fund investments. Administrative services also include, but are not limited to, coordinating, monitoring and overseeing third parties that provide services to fund shareholders. The agreement between the fund and CRMC provides the fund the ability to charge an administrative services fee of 0.05% of average daily net assets for all share classes. Currently Class A shares pay an annual fee of 0.01% of average daily net assets (which could be increased as noted above) and Class C, T, F, 529 and R shares pay an annual fee of 0.05% of their respective average daily net assets.
529 plan services— Each 529 share class is subject to service fees to compensate the Virginia College Savings Plan (“Virginia529”) for its oversight and administration of the CollegeAmerica 529 college savings plan. The fee is based on the combined net assets invested in Class 529 and ABLE shares of the American Funds. Class ABLE shares are offered on other American Funds by Virginia529 through ABLEAmerica, a tax-advantaged savings program for individuals with disabilities. The quarterly fee is based on a series of decreasing annual rates beginning with 0.10% on the first $20 billion of the combined net assets invested in the American Funds and decreasing to 0.03% on such assets in excess of $100 billion. The fee for any given calendar quarter is accrued and calculated on the basis of the average net assets of Class 529 and ABLE shares of the American Funds for the last month of the prior calendar quarter. The fee is included in other expenses in the fund’s statement of operations. Virginia529 is not considered a related party to the fund.
| 16 | The Investment Company of America |
For the year ended December 31, 2018, class-specific expenses under the agreements were as follows (dollars in thousands):
| Share class | | Distribution
services | | | Transfer agent
services | | | Administrative
services | | | 529 plan
services | |
| Class A | | | $150,471 | | | | $48,077 | | | | $6,252 | | | Not applicable | |
| Class C | | | 17,153 | | | | 1,318 | | | | 862 | | | Not applicable | |
| Class T | | | — | | | | — | * | | | — | * | | Not applicable | |
| Class F-1 | | | 4,802 | | | | 2,334 | | | | 968 | | | Not applicable | |
| Class F-2 | | Not applicable | | | | 5,689 | | | | 2,906 | | | Not applicable | |
| Class F-3 | | Not applicable | | | | 287 | | | | 1,442 | | | Not applicable | |
| Class 529-A | | | 6,556 | | | | 1,911 | | | | 1,407 | | | $1,851 | |
| Class 529-C | | | 3,415 | | | | 243 | | | | 175 | | | 230 | |
| Class 529-E | | | 448 | | | | 36 | | | | 45 | | | 59 | |
| Class 529-T | | | — | | | | — | * | | | — | * | | — | * |
| Class 529-F-1 | | | — | | | | 59 | | | | 45 | | | 59 | |
| Class R-1 | | | 839 | | | | 85 | | | | 42 | | | Not applicable | |
| Class R-2 | | | 4,968 | | | | 2,350 | | | | 332 | | | Not applicable | |
| Class R-2E | | | 302 | | | | 103 | | | | 25 | | | Not applicable | |
| Class R-3 | | | 4,971 | | | | 1,523 | | | | 499 | | | Not applicable | |
| Class R-4 | | | 3,998 | | | | 1,612 | | | | 800 | | | Not applicable | |
| Class R-5E | | | Not applicable | | | | 27 | | | | 10 | | | Not applicable | |
| Class R-5 | | | Not applicable | | | | 150 | | | | 148 | | | Not applicable | |
| Class R-6 | | | Not applicable | | | | 20 | | | | 6,354 | | | Not applicable | |
| Total class-specific expenses | | | $197,923 | | | | $65,824 | | | | $22,312 | | | $2,199 | |
| * | Amount less than one thousand. |
Trustees’ deferred compensation— Trustees who are unaffiliated with CRMC may elect to defer the cash payment of part or all of their compensation. These deferred amounts, which remain as liabilities of the fund, are treated as if invested in shares of the fund or other American Funds. These amounts represent general, unsecured liabilities of the fund and vary according to the total returns of the selected funds. Trustees’ compensation of $630,000 in the fund’s statement of operations reflects $407,000 in current fees (either paid in cash or deferred) and a net increase of $223,000 in the value of the deferred amounts.
Affiliated officers and trustees— Officers and certain trustees of the fund are or may be considered to be affiliated with CRMC, AFD and AFS. No affiliated officers or trustees received any compensation directly from the fund.
Security transactions with related funds— The fund has purchased from, and sold securities to, other funds managed by CRMC (or funds managed by certain affiliates of CRMC) under procedures adopted by the fund’s board of trustees. The funds involved in such transactions are considered related by virtue of having a common investment adviser (or affiliated investment advisers), common trustees and/or common officers. Each transaction was executed at the current market price of the security and no brokerage commissions or fees were paid in accordance with Rule 17a-7 of the 1940 Act. During the year ended December 31, 2018, the fund engaged in such purchase and sale transactions with related funds in the amounts of $1,576,711,000 and $487,154,000, respectively.
Interfund lending— Pursuant to an exemptive order issued by the SEC, the fund, along with other CRMC-managed funds (or funds managed by certain affiliates of CRMC), may participate in an interfund lending program. The program provides an alternate credit facility that permits the funds to lend or borrow cash for temporary purposes directly to or from one another, subject to the conditions of the exemptive order. The fund did not lend or borrow cash through the interfund lending program at any time during the year ended December 31, 2018.
7. Warrants
As of December 31, 2018, the fund had warrants outstanding which may be exercised at any time for the purchase of 818,231 Class A shares at approximately $5.24 per share. If these warrants had been exercised as of December 31, 2018, the net asset value of each share class would have been reduced by less than $0.01 per share. No warrants were exercised during the year ended December 31, 2018.
| The Investment Company of America | 17 |
8. Capital share transactions
Capital share transactions in the fund were as follows (dollars and shares in thousands):
| | | Sales1 | | | Reinvestments of
distributions | | | Repurchases1 | | | Net increase
(decrease) | |
| Share class | | Amount | | | Shares | | | Amount | | | Shares | | | Amount | | | Shares | | | Amount | | | Shares | |
| | | | | | | | | | | | | | | | | | | | | | | | | | | | | | | | | |
| Year ended December 31, 2018 | | | | | | | | | | | | | | | | | | | | | | |
| | | | | | | | | | | | | | | | | | | | | | | | | | | | | | | | | |
| Class A | | $ | 2,945,664 | | | | 73,418 | | | $ | 5,821,577 | | | | 164,270 | | | $ | (7,686,915 | ) | | | (192,501 | ) | | $ | 1,080,326 | | | | 45,187 | |
| Class C | | | 259,474 | | | | 6,515 | | | | 149,245 | | | | 4,293 | | | | (450,983 | ) | | | (11,307 | ) | | | (42,264 | ) | | | (499 | ) |
| Class T | | | — | | | | — | | | | — | | | | — | | | | — | | | | — | | | | — | | | | — | |
| Class F-1 | | | 262,167 | | | | 6,461 | | | | 176,053 | | | | 4,977 | | | | (547,109 | ) | | | (13,579 | ) | | | (108,889 | ) | | | (2,141 | ) |
| Class F-2 | | | 2,934,521 | | | | 72,633 | | | | 612,761 | | | | 17,395 | | | | (1,218,623 | ) | | | (30,958 | ) | | | 2,328,659 | | | | 59,070 | |
| Class F-3 | | | 865,361 | | | | 21,413 | | | | 260,045 | | | | 7,332 | | | | (931,381 | ) | | | (22,950 | ) | | | 194,025 | | | | 5,795 | |
| Class 529-A | | | 241,120 | | | | 5,982 | | | | 267,168 | | | | 7,564 | | | | (417,484 | ) | | | (10,342 | ) | | | 90,804 | | | | 3,204 | |
| Class 529-C | | | 34,931 | | | | 870 | | | | 29,298 | | | | 837 | | | | (93,775 | ) | | | (2,320 | ) | | | (29,546 | ) | | | (613 | ) |
| Class 529-E | | | 7,459 | | | | 184 | | | | 8,327 | | | | 237 | | | | (15,341 | ) | | | (381 | ) | | | 445 | | | | 40 | |
| Class 529-T | | | — | | | | — | | | | 1 | | | | — | 2 | | | — | | | | — | | | | 1 | | | | — | 2 |
| Class 529-F-1 | | | 33,158 | | | | 826 | | | | 9,780 | | | | 278 | | | | (16,374 | ) | | | (411 | ) | | | 26,564 | | | | 693 | |
| Class R-1 | | | 8,311 | | | | 207 | | | | 7,243 | | | | 208 | | | | (19,215 | ) | | | (479 | ) | | | (3,661 | ) | | | (64 | ) |
| Class R-2 | | | 140,690 | | | | 3,497 | | | | 58,020 | | | | 1,662 | | | | (200,620 | ) | | | (4,992 | ) | | | (1,910 | ) | | | 167 | |
| Class R-2E | | | 23,121 | | | | 573 | | | | 5,065 | | | | 145 | | | | (9,518 | ) | | | (237 | ) | | | 18,668 | | | | 481 | |
| Class R-3 | | | 182,687 | | | | 4,530 | | | | 90,347 | | | | 2,567 | | | | (285,053 | ) | | | (7,074 | ) | | | (12,019 | ) | | | 23 | |
| Class R-4 | | | 196,535 | | | | 4,839 | | | | 147,305 | | | | 4,164 | | | | (444,899 | ) | | | (11,104 | ) | | | (101,059 | ) | | | (2,101 | ) |
| Class R-5E | | | 20,001 | | | | 487 | | | | 2,341 | | | | 67 | | | | (3,734 | ) | | | (93 | ) | | | 18,608 | | | | 461 | |
| Class R-5 | | | 45,590 | | | | 1,121 | | | | 28,132 | | | | 790 | | | | (100,683 | ) | | | (2,499 | ) | | | (26,961 | ) | | | (588 | ) |
| Class R-6 | | | 2,381,786 | | | | 59,919 | | | | 1,332,600 | | | | 37,642 | | | | (554,573 | ) | | | (13,628 | ) | | | 3,159,813 | | | | 83,933 | |
| Total net increase (decrease) | | $ | 10,582,576 | | | | 263,475 | | | $ | 9,005,308 | | | | 254,428 | | | $ | (12,996,280 | ) | | | (324,855 | ) | | $ | 6,591,604 | | | | 193,048 | |
| | | | | | | | | | | | | | | | | | | | | | | | | | | | | | | | | |
| Year ended December 31, 2017 | | | | | | | | | | | | | | | | | | | | | | |
| | | | | | | | | | | | | | | | | | | | | | | |
| Class A | | $ | 2,927,983 | | | | 75,405 | | | $ | 4,307,498 | | | | 107,283 | | | $ | (8,574,411 | ) | | | (218,994 | ) | | $ | (1,338,930 | ) | | | (36,306 | ) |
| Class B3 | | | 57 | | | | 2 | | | | — | | | | — | | | | (42,509 | ) | | | (1,128 | ) | | | (42,452 | ) | | | (1,126 | ) |
| Class C | | | 281,369 | | | | 7,323 | | | | 111,784 | | | | 2,806 | | | | (487,379 | ) | | | (12,603 | ) | | | (94,226 | ) | | | (2,474 | ) |
| Class T4 | | | 10 | | | | — | 2 | | | — | | | | — | | | | — | | | | — | | | | 10 | | | | — | 2 |
| Class F-1 | | | 343,690 | | | | 8,865 | | | | 138,940 | | | | 3,469 | | | | (639,856 | ) | | | (16,299 | ) | | | (157,226 | ) | | | (3,965 | ) |
| Class F-2 | | | 2,720,163 | | | | 69,888 | | | | 321,565 | | | | 8,015 | | | | (3,026,774 | ) | | | (78,362 | ) | | | 14,954 | | | | (459 | ) |
| Class F-35 | | | 2,857,494 | | | | 73,658 | | | | 171,491 | | | | 4,262 | | | | (324,662 | ) | | | (8,136 | ) | | | 2,704,323 | | | | 69,784 | |
| Class 529-A | | | 389,301 | | | | 9,648 | | | | 192,977 | | | | 4,815 | | | | (350,807 | ) | | | (8,935 | ) | | | 231,471 | | | | 5,528 | |
| Class 529-B3 | | | 13 | | | | — | 2 | | | — | | | | — | | | | (6,604 | ) | | | (175 | ) | | | (6,591 | ) | | | (175 | ) |
| Class 529-C | | | 44,893 | | | | 1,159 | | | | 23,515 | | | | 588 | | | | (264,363 | ) | | | (6,450 | ) | | | (195,955 | ) | | | (4,703 | ) |
| Class 529-E | | | 7,026 | | | | 181 | | | | 6,181 | | | | 154 | | | | (14,154 | ) | | | (361 | ) | | | (947 | ) | | | (26 | ) |
| Class 529-T4 | | | 10 | | | | — | 2 | | | 1 | | | | — | 2 | | | — | | | | — | | | | 11 | | | | — | 2 |
| Class 529-F-1 | | | 16,995 | | | | 435 | | | | 5,790 | | | | 145 | | | | (17,504 | ) | | | (450 | ) | | | 5,281 | | | | 130 | |
| Class R-1 | | | 10,237 | | | | 266 | | | | 5,466 | | | | 137 | | | | (21,598 | ) | | | (557 | ) | | | (5,895 | ) | | | (154 | ) |
| Class R-2 | | | 154,196 | | | | 3,988 | | | | 42,546 | | | | 1,064 | | | | (235,797 | ) | | | (6,083 | ) | | | (39,055 | ) | | | (1,031 | ) |
| Class R-2E | | | 26,758 | | | | 687 | | | | 2,660 | | | | 66 | | | | (4,859 | ) | | | (121 | ) | | | 24,559 | | | | 632 | |
| Class R-3 | | | 235,765 | | | | 6,084 | | | | 68,503 | | | | 1,711 | | | | (333,203 | ) | | | (8,569 | ) | | | (28,935 | ) | | | (774 | ) |
| Class R-4 | | | 314,429 | | | | 8,149 | | | | 116,258 | | | | 2,903 | | | | (435,903 | ) | | | (11,165 | ) | | | (5,216 | ) | | | (113 | ) |
| Class R-5E | | | 6,903 | | | | 171 | | | | 203 | | | | 5 | | | | (491 | ) | | | (13 | ) | | | 6,615 | | | | 163 | |
| Class R-5 | | | 90,239 | | | | 2,321 | | | | 22,301 | | | | 556 | | | | (89,950 | ) | | | (2,300 | ) | | | 22,590 | | | | 577 | |
| Class R-6 | | | 3,482,563 | | | | 89,665 | | | | 797,439 | | | | 19,863 | | | | (633,119 | ) | | | (15,955 | ) | | | 3,646,883 | | | | 93,573 | |
| Total net increase (decrease) | | $ | 13,910,094 | | | | 357,895 | | | $ | 6,335,118 | | | | 157,842 | | | $ | (15,503,943 | ) | | | (396,656 | ) | | $ | 4,741,269 | | | | 119,081 | |
| 1 | Includes exchanges between share classes of the fund. |
| 2 | Amount less than one thousand. |
| 3 | Class B and 529-B shares were fully liquidated on May 5, 2017. |
| 4 | Class T and 529-T shares began investment operations on April 7, 2017. |
| 5 | Class F-3 shares began investment operations on January 27, 2017. |
| 18 | The Investment Company of America |
9. Investment transactions
The fund made purchases and sales of investment securities, excluding short-term securities and U.S. government obligations, if any, of $34,430,169,000 and $31,890,543,000, respectively, during the year ended December 31, 2018.
| The Investment Company of America | 19 |
Financial highlights
| | | | | | (Loss) income from
investment operations1 | | Dividends and distributions | | | | | | | | | | | | | | | |
| Period ended | | | Net asset
value,
beginning
of period | | | | Net
investment
income2 | | | | Net (losses)
gains on
securities
(both
realized and
unrealized) | | | | Total from
investment
operations | | | | Dividends
(from net
investment
income) | | | | Distributions
(from capital
gains) | | | | Total
dividends
and
distributions | | | | Net asset
value,
end
of period | | | | Total
return3 | | | | Net assets,
end of period
(in millions) | | | | Ratio of
expenses to
average
net assets | | | | Ratio of
net income
to average
net assets2 | |
| Class A: | | | | | | | | | | | | | | | | | | | | | | | | | | | | | | | | | | | | | | | | | | | | | | | | |
| 12/31/2018 | | $ | 40.39 | | | $ | .75 | | | $ | (3.28 | ) | | $ | (2.53 | ) | | $ | (.74 | ) | | $ | (3.21 | ) | | $ | (3.95 | ) | | $ | 33.91 | | | | (6.51 | )% | | $ | 54,973 | | | | .57 | % | | | 1.85 | % |
| 12/31/2017 | | | 36.23 | | | | .69 | | | | 6.41 | | | | 7.10 | | | | (.68 | ) | | | (2.26 | ) | | | (2.94 | ) | | | 40.39 | | | | 19.73 | | | | 63,640 | | | | .57 | | | | 1.76 | |
| 12/31/2016 | | | 33.37 | | | | .65 | | | | 4.20 | | | | 4.85 | | | | (.69 | ) | | | (1.30 | ) | | | (1.99 | ) | | | 36.23 | | | | 14.59 | | | | 58,402 | | �� | | .59 | | | | 1.86 | |
| 12/31/2015 | | | 37.08 | | | | .66 | | | | (1.24 | ) | | | (.58 | ) | | | (.62 | ) | | | (2.51 | ) | | | (3.13 | ) | | | 33.37 | | | | (1.44 | ) | | | 54,725 | | | | .58 | | | | 1.79 | |
| 12/31/2014 | | | 36.70 | | | | .85 | | | | 3.60 | | | | 4.45 | | | | (.73 | ) | | | (3.34 | ) | | | (4.07 | ) | | | 37.08 | | | | 12.09 | | | | 58,430 | | | | .59 | | | | 2.21 | |
| Class C: | | | | | | | | | | | | | | | | | | | | | | | | | | | | | | | | | | | | | | | | | | | | | | | | |
| 12/31/2018 | | | 39.98 | | | | .42 | | | | (3.24 | ) | | | (2.82 | ) | | | (.41 | ) | | | (3.21 | ) | | | (3.62 | ) | | | 33.54 | | | | (7.24 | ) | | | 1,498 | | | | 1.36 | | | | 1.05 | |
| 12/31/2017 | | | 35.89 | | | | .37 | | | | 6.34 | | | | 6.71 | | | | (.36 | ) | | | (2.26 | ) | | | (2.62 | ) | | | 39.98 | | | | 18.77 | | | | 1,806 | | | | 1.38 | | | | .95 | |
| 12/31/2016 | | | 33.08 | | | | .37 | | | | 4.14 | | | | 4.51 | | | | (.40 | ) | | | (1.30 | ) | | | (1.70 | ) | | | 35.89 | | | | 13.70 | | | | 1,710 | | | | 1.39 | | | | 1.06 | |
| 12/31/2015 | | | 36.77 | | | | .36 | | | | (1.22 | ) | | | (.86 | ) | | | (.32 | ) | | | (2.51 | ) | | | (2.83 | ) | | | 33.08 | | | | (2.24 | ) | | | 1,635 | | | | 1.39 | | | | .98 | |
| 12/31/2014 | | | 36.42 | | | | .54 | | | | 3.56 | | | | 4.10 | | | | (.41 | ) | | | (3.34 | ) | | | (3.75 | ) | | | 36.77 | | | | 11.20 | | | | 1,774 | | | | 1.39 | | | | 1.41 | |
| Class T: | | | | | | | | | | | | | | | | | | | | | | | | | | | | | | | | | | | | | | | | | | | | | | | | |
| 12/31/2018 | | | 40.38 | | | | .83 | | | | (3.27 | ) | | | (2.44 | ) | | | (.82 | ) | | | (3.21 | ) | | | (4.03 | ) | | | 33.91 | | | | (6.29 | )4 | | | — | 5 | | | .36 | 4 | | | 2.05 | 4 |
| 12/31/20176,7 | | | 38.08 | | | | .56 | | | | 4.59 | | | | 5.15 | | | | (.59 | ) | | | (2.26 | ) | | | (2.85 | ) | | | 40.38 | | | | 13.61 | 4,8 | | | — | 5 | | | .38 | 4,9 | | | 1.92 | 4,9 |
| Class F-1: | | | | | | | | | | | | | | | | | | | | | | | | | | | | | | | | | | | | | | | | | | | | | | | | |
| 12/31/2018 | | | 40.29 | | | | .71 | | | | (3.27 | ) | | | (2.56 | ) | | | (.70 | ) | | | (3.21 | ) | | | (3.91 | ) | | | 33.82 | | | | (6.59 | ) | | | 1,639 | | | | .66 | | | | 1.76 | |
| 12/31/2017 | | | 36.15 | | | | .65 | | | | 6.39 | | | | 7.04 | | | | (.64 | ) | | | (2.26 | ) | | | (2.90 | ) | | | 40.29 | | | | 19.60 | | | | 2,039 | | | | .68 | | | | 1.66 | |
| 12/31/2016 | | | 33.30 | | | | .62 | | | | 4.18 | | | | 4.80 | | | | (.65 | ) | | | (1.30 | ) | | | (1.95 | ) | | | 36.15 | | | | 14.48 | | | | 1,972 | | | | .69 | | | | 1.78 | |
| 12/31/2015 | | | 37.01 | | | | .62 | | | | (1.23 | ) | | | (.61 | ) | | | (.59 | ) | | | (2.51 | ) | | | (3.10 | ) | | | 33.30 | | | | (1.53 | ) | | | 2,459 | | | | .67 | | | | 1.70 | |
| 12/31/2014 | | | 36.63 | | | | .82 | | | | 3.59 | | | | 4.41 | | | | (.69 | ) | | | (3.34 | ) | | | (4.03 | ) | | | 37.01 | | | | 12.02 | | | | 2,518 | | | | .67 | | | | 2.13 | |
| Class F-2: | | | | | | | | | | | | | | | | | | | | | | | | | | | | | | | | | | | | | | | | | | | | | | | | |
| 12/31/2018 | | | 40.37 | | | | .82 | | | | (3.27 | ) | | | (2.45 | ) | | | (.81 | ) | | | (3.21 | ) | | | (4.02 | ) | | | 33.90 | | | | (6.31 | ) | | | 6,067 | | | | .39 | | | | 2.03 | |
| 12/31/2017 | | | 36.21 | | | | .76 | | | | 6.41 | | | | 7.17 | | | | (.75 | ) | | | (2.26 | ) | | | (3.01 | ) | | | 40.37 | | | | 19.94 | | | | 4,840 | | | | .40 | | | | 1.93 | |
| 12/31/2016 | | | 33.36 | | | | .71 | | | | 4.19 | | | | 4.90 | | | | (.75 | ) | | | (1.30 | ) | | | (2.05 | ) | | | 36.21 | | | | 14.78 | | | | 4,359 | | | | .41 | | | | 2.02 | |
| 12/31/2015 | | | 37.07 | | | | .72 | | | | (1.23 | ) | | | (.51 | ) | | | (.69 | ) | | | (2.51 | ) | | | (3.20 | ) | | | 33.36 | | | | (1.26 | ) | | | 1,950 | | | | .41 | | | | 1.97 | |
| 12/31/2014 | | | 36.69 | | | | .90 | | | | 3.62 | | | | 4.52 | | | | (.80 | ) | | | (3.34 | ) | | | (4.14 | ) | | | 37.07 | | | | 12.31 | | | | 1,762 | | | | .39 | | | | 2.32 | |
| Class F-3: | | | | | | | | | | | | | | | | | | | | | | | | | | | | | | | | | | | | | | | | | | | | | | | | |
| 12/31/2018 | | | 40.37 | | | | .86 | | | | (3.28 | ) | | | (2.42 | ) | | | (.84 | ) | | | (3.21 | ) | | | (4.05 | ) | | | 33.90 | | | | (6.24 | ) | | | 2,562 | | | | .30 | | | | 2.12 | |
| 12/31/20176,10 | | | 37.51 | | | | .74 | | | | 5.17 | | | | 5.91 | | | | (.79 | ) | | | (2.26 | ) | | | (3.05 | ) | | | 40.37 | | | | 15.91 | 8 | | | 2,817 | | | | .30 | 9 | | | 1.99 | 9 |
| Class 529-A: | | | | | | | | | | | | | | | | | | | | | | | | | | | | | | | | | | | | | | | | | | | | | | | | |
| 12/31/2018 | | | 40.29 | | | | .71 | | | | (3.27 | ) | | | (2.56 | ) | | | (.70 | ) | | | (3.21 | ) | | | (3.91 | ) | | | 33.82 | | | | (6.59 | ) | | | 2,495 | | | | .66 | | | | 1.76 | |
| 12/31/2017 | | | 36.15 | | | | .65 | | | | 6.40 | | | | 7.05 | | | | (.65 | ) | | | (2.26 | ) | | | (2.91 | ) | | | 40.29 | | | | 19.62 | | | | 2,843 | | | | .66 | | | | 1.67 | |
| 12/31/2016 | | | 33.30 | | | | .62 | | | | 4.18 | | | | 4.80 | | | | (.65 | ) | | | (1.30 | ) | | | (1.95 | ) | | | 36.15 | | | | 14.49 | | | | 2,351 | | | | .68 | | | | 1.77 | |
| 12/31/2015 | | | 37.01 | | | | .62 | | | | (1.24 | ) | | | (.62 | ) | | | (.58 | ) | | | (2.51 | ) | | | (3.09 | ) | | | 33.30 | | | | (1.55 | ) | | | 2,132 | | | | .69 | | | | 1.68 | |
| 12/31/2014 | | | 36.64 | | | | .81 | | | | 3.58 | | | | 4.39 | | | | (.68 | ) | | | (3.34 | ) | | | (4.02 | ) | | | 37.01 | | | | 11.97 | | | | 2,234 | | | | .69 | | | | 2.10 | |
| 20 | The Investment Company of America |
| | | | | | (Loss) income from
investment operations1 | | Dividends and distributions | | | | | | | | | | | | | | | |
| Period ended | | Net asset
value,
beginning
of period | | | Net
investment
income2 | | | Net (losses)
gains on
securities
(both
realized and
unrealized) | | | Total from
investment
operations | | | Dividends
(from net
investment
income) | | | Distributions
(from capital
gains) | | | Total
dividends
and
distributions | | | Net asset
value,
end
of period | | | Total
return3 | | | Net assets,
end of period
(in millions) | | | Ratio of
expenses to
average
net assets | | | Ratio of
net income
to average
net assets2 | |
| Class 529-C: | | | | | | | | | | | | | | | | | | | | | | | | | | | | | | | | | | | | | | | | | | | | | | | | |
| 12/31/2018 | | $ | 40.19 | | | $ | .41 | | | $ | (3.26 | ) | | $ | (2.85 | ) | | $ | (.39 | ) | | $ | (3.21 | ) | | $ | (3.60 | ) | | $ | 33.74 | | | | (7.28 | )% | | $ | 293 | | | | 1.41 | % | | | 1.01 | % |
| 12/31/2017 | | | 36.03 | | | | .35 | | | | 6.37 | | | | 6.72 | | | | (.30 | ) | | | (2.26 | ) | | | (2.56 | ) | | | 40.19 | | | | 18.71 | | | | 374 | | | | 1.43 | | | | .90 | |
| 12/31/2016 | | | 33.20 | | | | .35 | | | | 4.16 | | | | 4.51 | | | | (.38 | ) | | | (1.30 | ) | | | (1.68 | ) | | | 36.03 | | | | 13.61 | | | | 504 | | | | 1.45 | | | | 1.00 | |
| 12/31/2015 | | | 36.90 | | | | .33 | | | | (1.22 | ) | | | (.89 | ) | | | (.30 | ) | | | (2.51 | ) | | | (2.81 | ) | | | 33.20 | | | | (2.31 | ) | | | 475 | | | | 1.46 | | | | .91 | |
| 12/31/2014 | | | 36.54 | | | | .51 | | | | 3.58 | | | | 4.09 | | | | (.39 | ) | | | (3.34 | ) | | | (3.73 | ) | | | 36.90 | | | | 11.13 | | | | 509 | | | | 1.46 | | | | 1.33 | |
| Class 529-E: | | | | | | | | | | | | | | | | | | | | | | | | | | | | | | | | | | | | | | | | | | | | | | | | |
| 12/31/2018 | | | 40.16 | | | | .61 | | | | (3.25 | ) | | | (2.64 | ) | | | (.60 | ) | | | (3.21 | ) | | | (3.81 | ) | | | 33.71 | | | | (6.78 | ) | | | 79 | | | | .90 | | | | 1.52 | |
| 12/31/2017 | | | 36.04 | | | | .56 | | | | 6.37 | | | | 6.93 | | | | (.55 | ) | | | (2.26 | ) | | | (2.81 | ) | | | 40.16 | | | | 19.34 | | | | 92 | | | | .90 | | | | 1.43 | |
| 12/31/2016 | | | 33.21 | | | | .53 | | | | 4.17 | | | | 4.70 | | | | (.57 | ) | | | (1.30 | ) | | | (1.87 | ) | | | 36.04 | | | | 14.20 | | | | 84 | | | | .92 | | | | 1.53 | |
| 12/31/2015 | | | 36.91 | | | | .53 | | | | (1.23 | ) | | | (.70 | ) | | | (.49 | ) | | | (2.51 | ) | | | (3.00 | ) | | | 33.21 | | | | (1.77 | ) | | | 78 | | | | .93 | | | | 1.44 | |
| 12/31/2014 | | | 36.55 | | | | .71 | | | | 3.58 | | | | 4.29 | | | | (.59 | ) | | | (3.34 | ) | | | (3.93 | ) | | | 36.91 | | | | 11.70 | | | | 82 | | | | .93 | | | | 1.86 | |
| Class 529-T: | | | | | | | | | | | | | | | | | | | | | | | | | | | | | | | | | | | | | | | | | | | | | | | | |
| 12/31/2018 | | | 40.38 | | | | .81 | | | | (3.27 | ) | | | (2.46 | ) | | | (.80 | ) | | | (3.21 | ) | | | (4.01 | ) | | | 33.91 | | | | (6.34 | )4 | | | — | 5 | | | .42 | 4 | | | 2.00 | 4 |
| 12/31/20176,7 | | | 38.08 | | | | .55 | | | | 4.59 | | | | 5.14 | | | | (.58 | ) | | | (2.26 | ) | | | (2.84 | ) | | | 40.38 | | | | 13.57 | 4,8 | | | — | 5 | | | .43 | 4,9 | | | 1.88 | 4,9 |
| Class 529-F-1: | | | | | | | | | | | | | | | | | | | | | | | | | | | | | | | | | | | | | | | | | | | | | | | |
| 12/31/2018 | | | 40.24 | | | | .80 | | | | (3.25 | ) | | | (2.45 | ) | | | (.80 | ) | | | (3.21 | ) | | | (4.01 | ) | | | 33.78 | | | | (6.34 | ) | | | 93 | | | | .43 | | | | 1.99 | |
| 12/31/2017 | | | 36.11 | | | | .74 | | | | 6.38 | | | | 7.12 | | | | (.73 | ) | | | (2.26 | ) | | | (2.99 | ) | | | 40.24 | | | | 19.88 | | | | 83 | | | | .44 | | | | 1.89 | |
| 12/31/2016 | | | 33.27 | | | | .70 | | | | 4.17 | | | | 4.87 | | | | (.73 | ) | | | (1.30 | ) | | | (2.03 | ) | | | 36.11 | | | | 14.73 | | | | 70 | | | | .46 | | | | 1.99 | |
| 12/31/2015 | | | 36.98 | | | | .70 | | | | (1.24 | ) | | | (.54 | ) | | | (.66 | ) | | | (2.51 | ) | | | (3.17 | ) | | | 33.27 | | | | (1.32 | ) | | | 61 | | | | .47 | | | | 1.91 | |
| 12/31/2014 | | | 36.61 | | | | .89 | | | | 3.59 | | | | 4.48 | | | | (.77 | ) | | | (3.34 | ) | | | (4.11 | ) | | | 36.98 | | | | 12.23 | | | | 61 | | | | .46 | | | | 2.32 | |
| Class R-1: | | | | | | | | | | | | | | | | | | | | | | | | | | | | | | | | | | | | | | | | | | | | | | | | |
| 12/31/2018 | | | 40.07 | | | | .41 | | | | (3.24 | ) | | | (2.83 | ) | | | (.40 | ) | | | (3.21 | ) | | | (3.61 | ) | | | 33.63 | | | | (7.24 | ) | | | 72 | | | | 1.38 | | | | 1.03 | |
| 12/31/2017 | | | 35.97 | | | | .36 | | | | 6.36 | | | | 6.72 | | | | (.36 | ) | | | (2.26 | ) | | | (2.62 | ) | | | 40.07 | | | | 18.73 | | | | 88 | | | | 1.39 | | | | .94 | |
| 12/31/2016 | | | 33.15 | | | | .37 | | | | 4.15 | | | | 4.52 | | | | (.40 | ) | | | (1.30 | ) | | | (1.70 | ) | | | 35.97 | | | | 13.66 | | | | 85 | | | | 1.40 | | | | 1.05 | |
| 12/31/2015 | | | 36.84 | | | | .35 | | | | (1.21 | ) | | | (.86 | ) | | | (.32 | ) | | | (2.51 | ) | | | (2.83 | ) | | | 33.15 | | | | (2.22 | ) | | | 83 | | | | 1.40 | | | | .97 | |
| 12/31/2014 | | | 36.49 | | | | .54 | | | | 3.56 | | | | 4.10 | | | | (.41 | ) | | | (3.34 | ) | | | (3.75 | ) | | | 36.84 | | | | 11.19 | | | | 94 | | | | 1.40 | | | | 1.40 | |
| Class R-2: | | | | | | | | | | | | | | | | | | | | | | | | | | | | | | | | | | | | | | | | | | | | | | | | |
| 12/31/2018 | | | 40.12 | | | | .41 | | | | (3.25 | ) | | | (2.84 | ) | | | (.40 | ) | | | (3.21 | ) | | | (3.61 | ) | | | 33.67 | | | | (7.26 | ) | | | 582 | | | | 1.40 | | | | 1.02 | |
| 12/31/2017 | | | 36.01 | | | | .36 | | | | 6.37 | | | | 6.73 | | | | (.36 | ) | | | (2.26 | ) | | | (2.62 | ) | | | 40.12 | | | | 18.75 | | | | 687 | | | | 1.39 | | | | .94 | |
| 12/31/2016 | | | 33.18 | | | | .37 | | | | 4.16 | | | | 4.53 | | | | (.40 | ) | | | (1.30 | ) | | | (1.70 | ) | | | 36.01 | | | | 13.68 | | | | 653 | | | | 1.39 | | | | 1.06 | |
| 12/31/2015 | | | 36.88 | | | | .37 | | | | (1.23 | ) | | | (.86 | ) | | | (.33 | ) | | | (2.51 | ) | | | (2.84 | ) | | | 33.18 | | | | (2.21 | ) | | | 637 | | | | 1.36 | | | | 1.01 | |
| 12/31/2014 | | | 36.53 | | | | .55 | | | | 3.56 | | | | 4.11 | | | | (.42 | ) | | | (3.34 | ) | | | (3.76 | ) | | | 36.88 | | | | 11.20 | | | | 722 | | | | 1.37 | | | | 1.43 | |
| Class R-2E: | | | | | | | | | | | | | | | | | | | | | | | | | | | | | | | | | | | | | | | | | | | | | | | | |
| 12/31/2018 | | | 40.28 | | | | .53 | | | | (3.26 | ) | | | (2.73 | ) | | | (.53 | ) | | | (3.21 | ) | | | (3.74 | ) | | | 33.81 | | | | (6.99 | ) | | | 52 | | | | 1.10 | | | | 1.33 | |
| 12/31/2017 | | | 36.15 | | | | .48 | | | | 6.40 | | | | 6.88 | | | | (.49 | ) | | | (2.26 | ) | | | (2.75 | ) | | | 40.28 | | | | 19.14 | | | | 43 | | | | 1.09 | | | | 1.23 | |
| 12/31/2016 | | | 33.33 | | | | .47 | | | | 4.19 | | | | 4.66 | | | | (.54 | ) | | | (1.30 | ) | | | (1.84 | ) | | | 36.15 | | | | 14.03 | | | | 16 | | | | 1.09 | | | | 1.32 | |
| 12/31/2015 | | | 37.06 | | | | .51 | | | | (1.23 | ) | | | (.72 | ) | | | (.50 | ) | | | (2.51 | ) | | | (3.01 | ) | | | 33.33 | | | | (1.83 | ) | | | 1 | | | | 1.04 | | | | 1.48 | |
| 12/31/20146,11 | | | 40.36 | | | | .25 | | | | .25 | | | | .50 | | | | (.46 | ) | | | (3.34 | ) | | | (3.80 | ) | | | 37.06 | | | | 1.08 | 4,8 | | | — | 5 | | | .23 | 4,8 | | | .62 | 4,8 |
See end of table for footnotes.
| The Investment Company of America | 21 |
Financial highlights(continued)
| | | | | | (Loss) income from
investment operations1 | | Dividends and distributions | | | | | | | | | | | | | | | |
| Period ended | | Net asset
value,
beginning
of period | | | Net
investment
income2 | | | Net (losses)
gains on
securities
(both
realized and
unrealized) | | | Total from
investment
operations | | | Dividends
(from net
investment
income) | | | Distributions
(from capital
gains) | | | Total
dividends
and
distributions | | | Net asset
value,
end
of period | | | Total
return3 | | | Net assets,
end of period
(in millions) | | | Ratio of
expenses to
average
net assets | | | Ratio of
net income
to average
net assets2 | |
| Class R-3: | | | | | | | | | | | | | | | | | | | | | | | | | | | | | | | | | | | | | | | | | | | | | | | | |
| 12/31/2018 | | $ | 40.24 | | | $ | .59 | | | $ | (3.26 | ) | | $ | (2.67 | ) | | $ | (.58 | ) | | $ | (3.21 | ) | | $ | (3.79 | ) | | $ | 33.78 | | | | (6.84 | )% | | $ | 864 | | | | .94 | % | | | 1.47 | % |
| 12/31/2017 | | | 36.11 | | | | .54 | | | | 6.38 | | | | 6.92 | | | | (.53 | ) | | | (2.26 | ) | | | (2.79 | ) | | | 40.24 | | | | 19.28 | | | | 1,028 | | | | .95 | | | | 1.38 | |
| 12/31/2016 | | | 33.27 | | | | .52 | | | | 4.18 | | | | 4.70 | | | | (.56 | ) | | | (1.30 | ) | | | (1.86 | ) | | | 36.11 | | | | 14.17 | | | | 951 | | | | .95 | | | | 1.50 | |
| 12/31/2015 | | | 36.97 | | | | .52 | | | | (1.23 | ) | | | (.71 | ) | | | (.48 | ) | | | (2.51 | ) | | | (2.99 | ) | | | 33.27 | | | | (1.79 | ) | | | 860 | | | | .95 | | | | 1.41 | |
| 12/31/2014 | | | 36.60 | | | | .71 | | | | 3.58 | | | | 4.29 | | | | (.58 | ) | | | (3.34 | ) | | | (3.92 | ) | | | 36.97 | | | | 11.68 | | | | 936 | | | | .96 | | | | 1.83 | |
| Class R-4: | | | | | | | | | | | | | | | | | | | | | | | | | | | | | | | | | | | | | | | | | | | | | | | | |
| 12/31/2018 | | | 40.28 | | | | .72 | | | | (3.28 | ) | | | (2.56 | ) | | | (.70 | ) | | | (3.21 | ) | | | (3.91 | ) | | | 33.81 | | | | (6.58 | ) | | | 1,346 | | | | .64 | | | | 1.77 | |
| 12/31/2017 | | | 36.14 | | | | .66 | | | | 6.39 | | | | 7.05 | | | | (.65 | ) | | | (2.26 | ) | | | (2.91 | ) | | | 40.28 | | | | 19.64 | | | | 1,688 | | | | .65 | | | | 1.68 | |
| 12/31/2016 | | | 33.29 | | | | .63 | | | | 4.19 | | | | 4.82 | | | | (.67 | ) | | | (1.30 | ) | | | (1.97 | ) | | | 36.14 | | | | 14.55 | | | | 1,518 | | | | .64 | | | | 1.80 | |
| 12/31/2015 | | | 37.00 | | | | .63 | | | | (1.23 | ) | | | (.60 | ) | | | (.60 | ) | | | (2.51 | ) | | | (3.11 | ) | | | 33.29 | | | | (1.50 | ) | | | 983 | | | | .64 | | | | 1.73 | |
| 12/31/2014 | | | 36.63 | | | | .83 | | | | 3.58 | | | | 4.41 | | | | (.70 | ) | | | (3.34 | ) | | | (4.04 | ) | | | 37.00 | | | | 12.02 | | | | 998 | | | | .65 | | | | 2.15 | |
| Class R-5E: | | | | | | | | | | | | | | | | | | | | | | | | | | | | | | | | | | | | | | | | | | | | | | | | |
| 12/31/2018 | | | 40.36 | | | | .81 | | | | (3.27 | ) | | | (2.46 | ) | | | (.80 | ) | | | (3.21 | ) | | | (4.01 | ) | | | 33.89 | | | | (6.35 | ) | | | 24 | | | | .43 | | | | 2.01 | |
| 12/31/2017 | | | 36.20 | | | | .76 | | | | 6.39 | | | | 7.15 | | | | (.73 | ) | | | (2.26 | ) | | | (2.99 | ) | | | 40.36 | | | | 19.89 | | | | 10 | | | | .44 | | | | 1.95 | |
| 12/31/2016 | | | 33.36 | | | | .62 | | | | 4.24 | | | | 4.86 | | | | (.72 | ) | | | (1.30 | ) | | | (2.02 | ) | | | 36.20 | | | | 14.69 | | | | 3 | | | | .43 | | | | 1.71 | |
| 12/31/20156,12 | | | 36.83 | | | | .07 | | | | (1.08 | ) | | | (1.01 | ) | | | (.21 | ) | | | (2.25 | ) | | | (2.46 | ) | | | 33.36 | | | | (2.64 | )8 | | | — | 5 | | | .05 | 8 | | | .20 | 8 |
| Class R-5: | | | | | | | | | | | | | | | | | | | | | | | | | | | | | | | | | | | | | | | | | | | | | | | | |
| 12/31/2018 | | | 40.38 | | | | .84 | | | | (3.27 | ) | | | (2.43 | ) | | | (.83 | ) | | | (3.21 | ) | | | (4.04 | ) | | | 33.91 | | | | (6.27 | ) | | | 245 | | | | .34 | | | | 2.07 | |
| 12/31/2017 | | | 36.22 | | | | .78 | | | | 6.41 | | | | 7.19 | | | | (.77 | ) | | | (2.26 | ) | | | (3.03 | ) | | | 40.38 | | | | 20.00 | | | | 315 | | | | .35 | | | | 1.98 | |
| 12/31/2016 | | | 33.36 | | | | .74 | | | | 4.18 | | | | 4.92 | | | | (.76 | ) | | | (1.30 | ) | | | (2.06 | ) | | | 36.22 | | | | 14.85 | | | | 262 | | | | .35 | | | | 2.12 | |
| 12/31/2015 | | | 37.07 | | | | .74 | | | | (1.23 | ) | | | (.49 | ) | | | (.71 | ) | | | (2.51 | ) | | | (3.22 | ) | | | 33.36 | | | | (1.20 | ) | | | 755 | | | | .35 | | | | 2.02 | |
| 12/31/2014 | | | 36.69 | | | | .96 | | | | 3.58 | | | | 4.54 | | | | (.82 | ) | | | (3.34 | ) | | | (4.16 | ) | | | 37.07 | | | | 12.36 | | | | 820 | | | | .35 | | | | 2.50 | |
| Class R-6: | | | | | | | | | | | | | | | | | | | | | | | | | | | | | | | | | | | | | | | | | | | | | | | | |
| 12/31/2018 | | | 40.38 | | | | .86 | | | | (3.28 | ) | | | (2.42 | ) | | | (.85 | ) | | | (3.21 | ) | | | (4.06 | ) | | | 33.90 | | | | (6.25 | ) | | | 12,548 | | | | .29 | | | | 2.13 | |
| 12/31/2017 | | | 36.22 | | | | .80 | | | | 6.41 | | | | 7.21 | | | | (.79 | ) | | | (2.26 | ) | | | (3.05 | ) | | | 40.38 | | | | 20.07 | | | | 11,556 | | | | .30 | | | | 2.03 | |
| 12/31/2016 | | | 33.36 | | | | .75 | | | | 4.20 | | | | 4.95 | | | | (.79 | ) | | | (1.30 | ) | | | (2.09 | ) | | | 36.22 | | | | 14.92 | | | | 6,977 | | | | .30 | | | | 2.14 | |
| 12/31/2015 | | | 37.07 | | | | .76 | | | | (1.24 | ) | | | (.48 | ) | | | (.72 | ) | | | (2.51 | ) | | | (3.23 | ) | | | 33.36 | | | | (1.15 | ) | | | 4,875 | | | | .30 | | | | 2.08 | |
| 12/31/2014 | | | 36.69 | | | | .95 | | | | 3.61 | | | | 4.56 | | | | (.84 | ) | | | (3.34 | ) | | | (4.18 | ) | | | 37.07 | | | | 12.41 | | | | 4,160 | | | | .30 | | | | 2.45 | |
| | | Year ended December 31 |
| | | 2018 | | 2017 | | 2016 | | 2015 | | 2014 |
| Portfolio turnover rate for all share classes | | | 36% | | | | 28% | | | | 25% | | | | 30% | | | | 29% | |
| 1 | Based on average shares outstanding. |
| 2 | For the year ended December 31, 2014, this column reflects the impact of a corporate action event that resulted in a one-time increase to net investment income. If the corporate action event had not occurred, the Class A net investment income per share and ratio of net income to average net assets would have been lower by $.20 and .52 percentage points, respectively. The impact to the other share classes would have been similar. |
| 3 | Total returns exclude any applicable sales charges, including contingent deferred sales charges. |
| 4 | All or a significant portion of assets in this class consisted of seed capital invested by CRMC and/or its affiliates. Fees for distribution services are not charged or accrued on these seed capital assets. If such fees were paid by the fund on seed capital assets, fund expenses would have been higher and net income and total return would have been lower. |
| 5 | Amount less than $1 million. |
| 6 | Based on operations for a period that is less than a full year. |
| 7 | Class T and 529-T shares began investment operations on April 7, 2017. |
| 8 | Not annualized. |
| 9 | Annualized. |
| 10 | Class F-3 shares began investment operations on January 27, 2017. |
| 11 | Class R-2E shares began investment operations on August 29, 2014. |
| 12 | Class R-5E shares began investment operations on November 20, 2015. |
See notes to financial statements
| 22 | The Investment Company of America |
Report of Independent Registered Public Accounting Firm
To the Shareholders and Board of Trustees of The Investment Company of America:
Opinion on the Financial Statements and Financial Highlights
We have audited the accompanying statement of assets and liabilities of The Investment Company of America (the “Fund”), including the summary investment portfolio, as of December 31, 2018, the related statement of operations for the year then ended, the statements of changes in net assets for each of the two years in the period then ended, the financial highlights for each of the five years in the period then ended, and the related notes. In our opinion, the financial statements and financial highlights present fairly, in all material respects, the financial position of the Fund as of December 31, 2018, and the results of its operations for the year then ended, the changes in its net assets for each of the two years in the period then ended, and the financial highlights for each of the five years in the period then ended, in conformity with accounting principles generally accepted in the United States of America.
Basis for Opinion
These financial statements and financial highlights are the responsibility of the Fund’s management. Our responsibility is to express an opinion on the Fund’s financial statements and financial highlights based on our audits. We are a public accounting firm registered with the Public Company Accounting Oversight Board (United States) (PCAOB) and are required to be independent with respect to the Fund in accordance with the U.S. federal securities laws and the applicable rules and regulations of the Securities and Exchange Commission and the PCAOB.
We conducted our audits in accordance with the standards of the PCAOB. Those standards require that we plan and perform the audit to obtain reasonable assurance about whether the financial statements and financial highlights are free of material misstatement, whether due to error or fraud. The Fund is not required to have, nor were we engaged to perform, an audit of its internal control over financial reporting. As part of our audits we are required to obtain an understanding of internal control over financial reporting but not for the purpose of expressing an opinion on the effectiveness of the Fund’s internal control over financial reporting. Accordingly, we express no such opinion.
Our audits included performing procedures to assess the risks of material misstatement of the financial statements and financial highlights, whether due to error or fraud, and performing procedures that respond to those risks. Such procedures included examining, on a test basis, evidence regarding the amounts and disclosures in the financial statements and financial highlights. Our audits also included evaluating the accounting principles used and significant estimates made by management, as well as evaluating the overall presentation of the financial statements and financial highlights. Our procedures included confirmation of securities owned as of December 31, 2018, by correspondence with the custodian and brokers; when replies were not received from brokers, we performed other auditing procedures. We believe that our audits provide a reasonable basis for our opinion.
Deloitte & Touche LLP
Costa Mesa, California
February 11, 2019
We have served as the auditor of one or more American Funds investment companies since 1956.
| The Investment Company of America | 23 |
As a fund shareholder, you incur two types of costs: (1) transaction costs, such as initial sales charges on purchase payments and contingent deferred sales charges on redemptions (loads), and (2) ongoing costs, including management fees, distribution and service (12b-1) fees, and other expenses. This example is intended to help you understand your ongoing costs (in dollars) of investing in the fund so you can compare these costs with the ongoing costs of investing in other mutual funds. The example is based on an investment of $1,000 invested at the beginning of the period and held for the entire six-month period (July 1, 2018, through December 31, 2018).
Actual expenses:
The first line of each share class in the table on the following page provides information about actual account values and actual expenses. You may use the information in this line, together with the amount you invested, to estimate the expenses that you paid over the period. Simply divide your account value by $1,000 (for example, an $8,600 account value divided by $1,000 = 8.6), then multiply the result by the number in the first line under the heading titled “Expenses paid during period” to estimate the expenses you paid on your account during this period.
Hypothetical example for comparison purposes:
The second line of each share class in the table on the following page provides information about hypothetical account values and hypothetical expenses based on the actual expense ratio for the share class and an assumed rate of return of 5.00% per year before expenses, which is not the actual return of the share class. The hypothetical account values and expenses may not be used to estimate the actual ending account balance or expenses you paid for the period. You may use this information to compare the ongoing costs of investing in the fund and other funds. To do so, compare this 5.00% hypothetical example with the 5.00% hypothetical examples that appear in the shareholder reports of the other funds.
Notes:
Retirement plan participants may be subject to certain fees charged by the plan sponsor, and Class F-1, F-2, F-3 and 529-F-1 shareholders may be subject to fees charged by financial intermediaries, typically ranging from 0.75% to 1.50% of assets annually depending on services offered. You can estimate the impact of these fees by adding the amount of the fees to the total estimated expenses you paid on your account during the period as calculated above. In addition, your ending account value would be lower by the amount of these fees.
Note that the expenses shown in the table on the following page are meant to highlight your ongoing costs only and do not reflect any transactional costs, such as sales charges (loads). Therefore, the second line of each share class in the table is useful in comparing ongoing costs only and will not help you determine the relative total costs of owning different funds. In addition, if these transactional costs were included, your costs would have been higher.
| 24 | The Investment Company of America |
| | | Beginning
account value
7/1/2018 | | | Ending
account value
12/31/2018 | | | Expenses paid
during period* | | | Annualized
expense ratio | |
| Class A – actual return | | $ | 1,000.00 | | | $ | 916.35 | | | $ | 2.80 | | | | .58 | % |
| Class A – assumed 5% return | | | 1,000.00 | | | | 1,022.28 | | | | 2.96 | | | | .58 | |
| Class C – actual return | | | 1,000.00 | | | | 912.99 | | | | 6.56 | | | | 1.36 | |
| Class C – assumed 5% return | | | 1,000.00 | | | | 1,018.35 | | | | 6.92 | | | | 1.36 | |
| Class T – actual return | | | 1,000.00 | | | | 917.40 | | | | 1.74 | | | | .36 | |
| Class T – assumed 5% return | | | 1,000.00 | | | | 1,023.39 | | | | 1.84 | | | | .36 | |
| Class F-1 – actual return | | | 1,000.00 | | | | 916.05 | | | | 3.19 | | | | .66 | |
| Class F-1 – assumed 5% return | | | 1,000.00 | | | | 1,021.88 | | | | 3.36 | | | | .66 | |
| Class F-2 – actual return | | | 1,000.00 | | | | 917.47 | | | | 1.88 | | | | .39 | |
| Class F-2 – assumed 5% return | | | 1,000.00 | | | | 1,023.24 | | | | 1.99 | | | | .39 | |
| Class F-3 – actual return | | | 1,000.00 | | | | 917.64 | | | | 1.45 | | | | .30 | |
| Class F-3 – assumed 5% return | | | 1,000.00 | | | | 1,023.69 | | | | 1.53 | | | | .30 | |
| Class 529-A – actual return | | | 1,000.00 | | | | 916.01 | | | | 3.19 | | | | .66 | |
| Class 529-A – assumed 5% return | | | 1,000.00 | | | | 1,021.88 | | | | 3.36 | | | | .66 | |
| Class 529-C – actual return | | | 1,000.00 | | | | 912.67 | | | | 6.75 | | | | 1.40 | |
| Class 529-C – assumed 5% return | | | 1,000.00 | | | | 1,018.15 | | | | 7.12 | | | | 1.40 | |
| Class 529-E – actual return | | | 1,000.00 | | | | 915.09 | | | | 4.34 | | | | .90 | |
| Class 529-E – assumed 5% return | | | 1,000.00 | | | | 1,020.67 | | | | 4.58 | | | | .90 | |
| Class 529-T – actual return | | | 1,000.00 | | | | 917.13 | | | | 2.03 | | | | .42 | |
| Class 529-T – assumed 5% return | | | 1,000.00 | | | | 1,023.09 | | | | 2.14 | | | | .42 | |
| Class 529-F-1 – actual return | | | 1,000.00 | | | | 917.33 | | | | 2.03 | | | | .42 | |
| Class 529-F-1 – assumed 5% return | | | 1,000.00 | | | | 1,023.09 | | | | 2.14 | | | | .42 | |
| Class R-1 – actual return | | | 1,000.00 | | | | 912.79 | | | | 6.70 | | | | 1.39 | |
| Class R-1 – assumed 5% return | | | 1,000.00 | | | | 1,018.20 | | | | 7.07 | | | | 1.39 | |
| Class R-2 – actual return | | | 1,000.00 | | | | 912.52 | | | | 6.80 | | | | 1.41 | |
| Class R-2 – assumed 5% return | | | 1,000.00 | | | | 1,018.10 | | | | 7.17 | | | | 1.41 | |
| Class R-2E – actual return | | | 1,000.00 | | | | 914.12 | | | | 5.31 | | | | 1.10 | |
| Class R-2E – assumed 5% return | | | 1,000.00 | | | | 1,019.66 | | | | 5.60 | | | | 1.10 | |
| Class R-3 – actual return | | | 1,000.00 | | | | 914.76 | | | | 4.58 | | | | .95 | |
| Class R-3 – assumed 5% return | | | 1,000.00 | | | | 1,020.42 | | | | 4.84 | | | | .95 | |
| Class R-4 – actual return | | | 1,000.00 | | | | 916.05 | | | | 3.14 | | | | .65 | |
| Class R-4 – assumed 5% return | | | 1,000.00 | | | | 1,021.93 | | | | 3.31 | | | | .65 | |
| Class R-5E – actual return | | | 1,000.00 | | | | 917.23 | | | | 2.13 | | | | .44 | |
| Class R-5E – assumed 5% return | | | 1,000.00 | | | | 1,022.99 | | | | 2.24 | | | | .44 | |
| Class R-5 – actual return | | | 1,000.00 | | | | 917.71 | | | | 1.69 | | | | .35 | |
| Class R-5 – assumed 5% return | | | 1,000.00 | | | | 1,023.44 | | | | 1.79 | | | | .35 | |
| Class R-6 – actual return | | | 1,000.00 | | | | 917.71 | | | | 1.40 | | | | .29 | |
| Class R-6 – assumed 5% return | | | 1,000.00 | | | | 1,023.74 | | | | 1.48 | | | | .29 | |
| * | The “expenses paid during period” are equal to the “annualized expense ratio,” multiplied by the average account value over the period, multiplied by the number of days in the period, and divided by 365 (to reflect the one-half year period). |
We are required to advise you of the federal tax status of certain distributions received by shareholders during the fiscal year. The fund hereby designates the following amounts for the fund’s fiscal year ended December 31, 2018:
| Long-term capital gains | | $ | 7,786,195,000 | |
| Qualified dividend income | | | 100% | |
| Corporate dividends received deduction | | $ | 1,724,554,000 | |
| U.S. government income that may be exempt from state taxation | | | $29,800,000 | |
Individual shareholders should refer to their Form 1099 or other tax information, which was mailed in January 2019, to determine thecalendar yearamounts to be included on their 2018 tax returns. Shareholders should consult their tax advisors.
| The Investment Company of America | 25 |
Board of trustees and other officers
Independent trustees1
| Name and year of birth | | Year first
elected
a trustee
of the fund2 | | Principal occupation(s) during past five years | | Number of
portfolios in fund
complex overseen
by trustee | | Other directorships3
held by trustee |
| Louise H. Bryson,1944 | | 1999 | | Chair Emerita of the Board of Trustees, J. Paul Getty Trust; former President, Distribution, Lifetime Entertainment Network (retired 2008); former Executive Vice President and General Manager, Lifetime Movie Network (retired 2008) | | 7 | | None |
| Mary Anne Dolan,1947 | | 2000 | | Founder and President, MAD Ink (communications company); former Editor-in-Chief,The Los Angeles Herald Examiner (retired 1989) | | 10 | | None |
| James G. Ellis,1947 | | 2008 | | Dean and Professor of Marketing, Marshall School of Business, University of Southern California | | 91 | | Mercury General Corporation |
| Pablo R. González Guajardo, 1967 | | 2015 | | CEO, Kimberly-Clark de México, S.A.B. de C.V. | | 17 | | América Móvil, S.A.B. de C.V.; Grupo Lala, S.A.B. de C.V.; Grupo Sanborns, S.A.B. de C.V.; Kimberly-Clark de México, S.A.B. de C.V. |
William D. Jones,1955
Chairman of the Board
(Independent and Non-Executive) | | 2010 | | Real estate developer/owner, President and CEO, CityLink Investment Corporation (acquires, develops and manages real estate ventures in urban communities) and for the former City Scene Management Company (provides commercial asset management services) | | 18 | | Sempra Energy |
| John C. Mazziotta, MD, PhD, 1949 | | 2011 | | Physician; Professor of Neurology, University of California, Los Angeles; Vice Chancellor, UCLA Health Sciences; CEO, UCLA Health System; former Dean, David Geffen School of Medicine at UCLA; former Chair, Department of Neurology, UCLA; former Associate Director, Semel Institute, UCLA; former Director, Brain Mapping Center, UCLA | | 4 | | None |
| William R. McLaughlin,1956 | | 2015 | | President and CEO, The Orvis Company (outdoor equipment retailer) | | 4 | | None |
| Kenneth M. Simril,1965 | | 2019 | | President and CEO, SCI Ingredients Holdings, Inc. (food manufacturing) | | 7 | | None |
| Kathy J. Williams,1955 | | 2019 | | Commissioner, Marin County Human Rights Commission; Commissioner, Juvenile Justice Delinquency Prevention Commission; Board Member, Aspen Public Radio | | 4 | | None |
Bailey Morris-Eck, a trustee of the fund since 1993, and Leonard R. Fuller, a trustee of the fund since 2002, have retired from the board. The trustees thank Mr. Fuller and Ms. Morris-Eck for their dedication and service to the fund and its shareholders.
Interested trustees4,5
Name, year of birth and
position with fund | | Year first
elected
a trustee
or officer
of the fund2 | | Principal occupation(s) during past five years
and positions held with affiliated entities or
the principal underwriter of the fund | | Number of
portfolios in fund
complex overseen
by trustee | | Other directorships3
held by trustee |
| William L. Robbins,1968 | | 2019 | | Partner — Capital International Investors, Capital Research and Management Company | | 4 | | None |
| James Terrile,1965 | | 2019 | | Partner — Capital Research Global Investors, Capital Research and Management Company; Director, The Capital Group Companies, Inc;6 Director, Capital Strategy Research, Inc.6 | | 4 | | None |
| 26 | The Investment Company of America |
Other officers5
Name, year of birth and
position with fund | | Year first
elected
an officer
of the fund2 | | Principal occupation(s) during past five years and positions held with affiliated entities
or the principal underwriter of the fund |
James B. Lovelace,1956
Co-President | | 1994 | | Partner — Capital Research Global Investors, Capital Research and Management Company; Director, Capital Research and Management Company |
Donald D. O’Neal, 1960
Co-President | | 1994 | | Partner — Capital International Investors, Capital Research and Management Company; Director, Capital Research and Management Company |
Herbert Y. Poon, 1973
Executive Vice President | | 2012 | | Senior Vice President and Senior Counsel — Fund Business Management Group, Capital Research and Management Company |
Christopher D. Buchbinder, 1971
Senior Vice President | | 2010 | | Partner — Capital Research Global Investors, Capital Research and Management Company |
Joyce E. Gordon, 1956
Senior Vice President | | 1998 | | Partner — Capital Research Global Investors, Capital Research and Management Company; Director, Capital Research and Management Company |
Martin Romo, 1967
Senior Vice President | | 2018 | | Partner — Capital Research Global Investors, Capital Research and Management Company; Chairman and Director, Capital Research Company;6 Director, The Capital Group Companies, Inc.6 |
Paul F. Roye, 1953
Senior Vice President | | 2008 | | Director, Capital Research and Management Company; Senior Vice President and Senior Counsel — Fund Business Management Group, Capital Research and Management Company |
Jessica Chase Spaly,1977
Vice President | | 2010 | | Partner — Capital Research Global Investors, Capital Research and Management Company; Director, The Capital Group Companies, Inc.6 |
Laurie D. Neat, 1971
Secretary | | 2016 | | Vice President — Fund Business Management Group, Capital Research and Management Company; Vice President, Capital Guardian Trust Company;6 Vice President and Trust Officer, Capital Bank and Trust Company;6 Vice President, Capital International, Inc.6 |
Brian D. Bullard, 1969
Treasurer | | 2016 | | Senior Vice President — Investment Operations, Capital Research and Management Company |
Dori Laskin, 1951
Assistant Treasurer | | 2011 | | Vice President — Investment Operations, Capital Research and Management Company |
Hong T. Le, 1978
Assistant Treasurer | | 2016 | | Assistant Vice President — Investment Operations, Capital Research and Management Company; Assistant Vice President, Capital Bank and Trust Company6 |
The fund’s statement of additional information includes further details about fund trustees and is available without charge upon request by calling American Funds Service Company at (800) 421-4225 or by visiting the American Funds website at americanfunds.com. The address for all trustees and officers of the fund is 333 South Hope Street, Los Angeles, CA 90071, Attention: Secretary.
| 1 | The term independent trustee refers to a trustee who is not an “interested person” of the fund within the meaning of the Investment Company Act of 1940. |
| 2 | Trustees and officers of the fund serve until their resignation, removal or retirement. |
| 3 | This includes all directorships/trusteeships (other than those in the American Funds or other funds managed by Capital Research and Management Company or its affiliates) that are held by each trustee as a trustee or director of a public company or a registered investment company. |
| 4 | The term interested trustee refers to a trustee who is an “interested person” within the meaning of the Investment Company Act of 1940, on the basis of their affiliation with the fund’s investment adviser, Capital Research and Management Company, or affiliated entities (including the fund’s principal underwriter). |
| 5 | All of the trustees and/or officers listed are officers and/or directors/trustees of one or more of the other funds for which Capital Research and Management Company serves as investment adviser. |
| 6 | Company affiliated with Capital Research and Management Company. |
| The Investment Company of America | 27 |
Board of trustees and other officers(continued)
Results of special meeting of shareholders
Held November 28, 2018
Shares outstanding (all classes) on August 31, 2018 (record date)
2,337,791,360
Total shares voting on November 28, 2018
1,972,597,741 (84.4% of shares outstanding)
The proposal: to elect board members
| | | Votes for | | Percent
of shares
voting for | | Votes withheld | | Percent
of shares
voting withheld |
| Louise H. Bryson | | | 1,927,676,211 | | | | 97.7 | % | | | 44,921,530 | | | | 2.3 | % |
| Mary Anne Dolan | | | 1,928,213,709 | | | | 97.8 | | | | 44,384,032 | | | | 2.2 | |
| James G. Ellis | | | 1,924,929,252 | | | | 97.6 | | | | 47,668,489 | | | | 2.4 | |
| Pablo R. González Guajardo | | | 1,732,805,998 | | | | 87.8 | | | | 239,791,743 | | | | 12.2 | |
| William D. Jones | | | 1,926,772,596 | | | | 97.7 | | | | 45,825,145 | | | | 2.3 | |
| John C. Mazziotta | | | 1,926,489,404 | | | | 97.7 | | | | 46,108,337 | | | | 2.3 | |
| William R. McLaughlin | | | 1,928,676,128 | | | | 97.8 | | | | 43,921,612 | | | | 2.2 | |
| William L. Robbins | | | 1,928,407,691 | | | | 97.8 | | | | 44,190,050 | | | | 2.2 | |
| Kenneth M. Simril | | | 1,927,585,315 | | | | 97.7 | | | | 45,012,426 | | | | 2.3 | |
| James R. Terrile | | | 1,928,749,194 | | | | 97.8 | | | | 43,848,547 | | | | 2.2 | |
| Kathy J. Williams | | | 1,928,005,587 | | | | 97.7 | | | | 44,592,154 | | | | 2.3 | |
| 28 | The Investment Company of America |
Offices of the fund and of the investment adviser
Capital Research and Management Company
333 South Hope Street
Los Angeles, CA 90071-1406
6455 Irvine Center Drive
Irvine, CA 92618-4518
Transfer agent for shareholder accounts
American Funds Service Company
(Write to the address near you.)
P.O. Box 6007
Indianapolis, IN 46206-6007
P.O. Box 2280
Norfolk, VA 23501-2280
Custodian of assets
JPMorgan Chase Bank
270 Park Avenue
New York, NY 10017-2070
Counsel
O’Melveny & Myers LLP
400 South Hope Street
Los Angeles, CA 90071-2899
Independent registered public accounting firm
Deloitte & Touche LLP
695 Town Center Drive
Suite 1200
Costa Mesa, CA 92626-7188
Principal underwriter
American Funds Distributors, Inc.
333 South Hope Street
Los Angeles, CA 90071-1406
Investors should carefully consider investment objectives, risks, charges and expenses. This and other important information is contained in the fund prospectus and summary prospectus, which can be obtained from your financial professional and should be read carefully before investing. You may also call American Funds Service Company (AFS) at (800) 421-4225 or visit the American Funds website at americanfunds.com. Fund shares offered through American Funds Distributors, Inc.
“American Funds Proxy Voting Procedures and Principles” — which describes how we vote proxies relating to portfolio securities — is available on the American Funds website or upon request by calling AFS. The fund files its proxy voting record with the U.S. Securities and Exchange Commission (SEC) for the 12 months ended June 30 by August 31. The proxy voting record is available free of charge on the SEC website at sec.gov and on the American Funds website.
A complete December 31, 2018, portfolio of The Investment Company of America’s investments is available free of charge by calling AFS or visiting the SEC website (where it is part of Form N-CSR).
The Investment Company of America files a complete list of its portfolio holdings with the SEC for the first and third quarters of each fiscal year on Form N-Q. This filing is available free of charge on the SEC website. Additionally, the list of portfolio holdings is available by calling AFS.
This report is for the information of shareholders of The Investment Company of America, but it also may be used as sales literature when preceded or accompanied by the current prospectus or summary prospectus, which gives details about charges, expenses, investment objectives and operating policies of the fund. If used as sales material after March 31, 2019, this report must be accompanied by an American Funds statistical update for the most recently completed calendar quarter.
The Standard & Poor’s 500 Composite Index is a product of S&P Dow Jones Indices LLC and/or its affiliates and has been licensed for use by Capital Group. Copyright © 2019 S&P Dow Jones Indices LLC, a division of S&P Global, and/or its affiliates. All rights reserved. Redistribution or reproduction in whole or in part is prohibited without written permission of S&P Dow Jones Indices LLC.
The Capital Advantage®
Since 1931, Capital Group, home of American Funds, has helped investors pursue long-term investment success. Our consistent approach — in combination with The Capital SystemSM— has resulted in a superior long-term track record.
| | Aligned with investor success |
| | We base our decisions on a long-term perspective, which we believe aligns our goals with the interests of our clients. Our portfolio managers average 27 years of investment experience, including 20 years at our company, reflecting a career commitment to our long-term approach.1 |
| | |
| | The Capital System |
| | The Capital System combines individual accountability with teamwork. Funds using The Capital System are divided into portions that are managed independently by investment professionals with diverse backgrounds, ages and investment approaches. An extensive global research effort is the backbone of our system. |
| | |
| | American Funds’ superior long-term track record |
| | Equity funds have beaten their Lipper peer indexes in 92% of 10-year periods and 99% of 20-year periods. Fixed income funds have beaten their Lipper indexes in 75% of 10-year periods and 80% of 20-year periods.2Fund management fees have been among the lowest in the industry.3 |
| | 1 | Portfolio manager experience as of December 31, 2018. |
| | 2 | Based on Class F-2 share results for rolling periods through December 31, 2018. Periods covered are the shorter of the fund’s lifetime or since the comparable Lipper index inception date (except Capital Income Builder and SMALLCAP World Fund, for which the Lipper average was used). Expenses differ for each share class, so results will vary. Class F-2 shares were first offered on August 1, 2008. Class F-2 share results prior to the date of first sale are hypothetical based on Class A share results without a sales charge, adjusted for typical estimated expenses. Results for certain funds with an inception date after August 1, 2008, also include hypothetical returns because those funds’ Class F-2 shares sold after the funds’ date of first offering. Please see americanfunds.com for more information on specific expense adjustments and the actual dates of first sale. |
| | 3 | On average, our management fees were in the lowest quintile 70% of the time, based on the 20-year period ended December 31, 2018, versus comparable Lipper categories, excluding funds of funds. |
All Capital Group trademarks referenced are registered trademarks owned by The Capital Group Companies, Inc. or an affiliated company. All other company and product names mentioned are the trademarks or registered trademarks of their respective companies.

ITEM 2 – Code of Ethics
The Registrant has adopted a Code of Ethics that applies to its Principal Executive Officer and Principal Financial Officer. The Registrant undertakes to provide to any person without charge, upon request, a copy of the Code of Ethics. Such request can be made by calling 800/421-4225 or to the Secretary of the Registrant, 333 South Hope Street, Los Angeles, California 90071.
ITEM 3 – Audit Committee Financial Expert
The Registrant’s board has determined that James G. Ellis, a member of the Registrant’s audit committee, is an “audit committee financial expert” and "independent," as such terms are defined in this Item. This designation will not increase the designee’s duties, obligations or liability as compared to his or her duties, obligations and liability as a member of the audit committee and of the board, nor will it reduce the responsibility of the other audit committee members. There may be other individuals who, through education or experience, would qualify as "audit committee financial experts" if the board had designated them as such. Most importantly, the board believes each member of the audit committee contributes significantly to the effective oversight of the Registrant’s financial statements and condition.
| ITEM 4 – Principal Accountant Fees and Services | ICA |
| | | |
| Registrant: | |
| a) Audit Fees: | |
| | | |
| | 2017 | $124,000 |
| | 2018 | $2,000 |
| | | |
| b) Audit-Related Fees: | |
| | 2017 | $22,000 |
| | 2018 | $25,000 |
| | | |
| c) Tax Fees: | |
| | 2017 | $8,000 |
| | 2018 | $8,000 |
| | The tax fees consist of professional services relating to the preparation of the Registrant’s tax returns. |
| | | |
| d) All Other Fees: | |
| | 2017 | None |
| | 2018 | None |
| | | |
| | Adviser and affiliates (includes only fees for non-audit services billed to the adviser and affiliates for engagements that relate directly to the operations and financial reporting of the Registrant and were subject to the pre-approval policies described below): |
| a) Audit Fees: | |
| | Not Applicable | |
| | | |
| b) Audit-Related Fees: | |
| | 2017 | $1,429,000 |
| | 2018 | $2,258,000 |
| | The audit-related fees consist of assurance and related services relating to the examination of the Registrant’s transfer agent, principal underwriter and investment adviser conducted in accordance with Statement on Standards for Attestation Engagements Number 16 issued by the American Institute of Certified Public Accountants. |
| | | |
| c) Tax Fees: | |
| | 2017 | None |
| | 2018 | None |
| | The tax fees consist of consulting services relating to the Registrant’s investments. |
| | | |
| | | |
| d) All Other Fees: | |
| | 2017 | None |
| | 2018 | None |
| | The other fees consist of subscription services related to an accounting research tool. |
| | | |
| | | |
| | All audit and permissible non-audit services that the Registrant’s audit committee considers compatible with maintaining the independent registered public accounting firm’s independence are required to be pre-approved by the committee. The pre-approval requirement will extend to all non-audit services provided to the Registrant, the investment adviser, and any entity controlling, controlled by, or under common control with the investment adviser that provides ongoing services to the Registrant, if the engagement relates directly to the operations and financial reporting of the Registrant. The committee will not delegate its responsibility to pre-approve these services to the investment adviser. The committee may delegate to one or more committee members the authority to review and pre-approve audit and permissible non-audit services. Actions taken under any such delegation will be reported to the full committee at its next meeting. The pre-approval requirement is waived with respect to non-audit services if certain conditions are met. The pre-approval requirement was not waived for any of the non-audit services listed above provided to the Registrant, adviser and affiliates. |
| | | |
| | Aggregate non-audit fees paid to the Registrant’s auditors, including fees for all services billed to the Registrant, adviser and affiliates that provide ongoing services to the Registrant, were $1,546,000 for fiscal year 2017 and $2,371,000 for fiscal year 2018. The non-audit services represented by these amounts were brought to the attention of the committee and considered to be compatible with maintaining the auditors’ independence. |
ITEM 5 – Audit Committee of Listed Registrants
Not applicable to this Registrant, insofar as the Registrant is not a listed issuer as defined in Rule 10A-3 under the Securities Exchange Act of 1934.
ITEM 6 – Schedule of Investments
The Investment Company of America®
Investment portfolio
December 31, 2018
Common stocks 93.44%
Energy 8.62% | Shares | Value
(000) |
| Baker Hughes, a GE Co., Class A | 10,912,500 | $234,619 |
| Canadian Natural Resources, Ltd. (CAD denominated) | 24,565,075 | 592,714 |
| Chesapeake Energy Corp.1 | 20,000,000 | 42,000 |
| Chevron Corp. | 5,964,500 | 648,878 |
| Concho Resources Inc.1 | 7,437,500 | 764,501 |
| Enbridge Inc. | 2,014,172 | 62,600 |
| Enbridge Inc. (CAD denominated) | 567,371 | 17,625 |
| Eni SpA2 | 8,229,671 | 129,438 |
| EOG Resources, Inc. | 14,873,200 | 1,297,092 |
| Exxon Mobil Corp. | 19,001,835 | 1,295,735 |
| Halliburton Co. | 7,700,000 | 204,666 |
| Noble Energy, Inc.3 | 29,272,023 | 549,143 |
| ONEOK, Inc. | 2,650,000 | 142,968 |
| Plains GP Holdings, LP, Class A | 2,413,163 | 48,505 |
| Royal Dutch Shell PLC, Class B | 6,355,000 | 189,542 |
| Royal Dutch Shell PLC, Class B (ADR) | 5,000,000 | 299,700 |
| Schlumberger Ltd. | 4,815,000 | 173,725 |
| Southwestern Energy Co.1 | 9,247,030 | 31,532 |
| Suncor Energy Inc. | 4,890,292 | 136,586 |
| TechnipFMC PLC | 2,289,861 | 44,836 |
| TOTAL SA | 4,527,972 | 239,578 |
| TransCanada Corp. | 3,038,579 | 108,505 |
| Williams Companies, Inc. | 4,892,400 | 107,877 |
| | | 7,362,365 |
| Materials 3.13% | | |
| Alcoa Corp.1 | 6,144,610 | 163,324 |
| BHP Group PLC | 7,063,000 | 148,685 |
| Celanese Corp. | 1,435,000 | 129,107 |
| DowDuPont Inc. | 6,031,972 | 322,590 |
| Freeport-McMoRan Inc. | 27,494,099 | 283,464 |
| Glencore PLC | 15,139,000 | 56,219 |
| International Flavors & Fragrances Inc. | 1,358,853 | 182,453 |
| Linde PLC | 5,328,100 | 831,397 |
| PPG Industries, Inc. | 1,743,000 | 178,187 |
| Rio Tinto PLC | 2,233,000 | 106,163 |
| Vale SA, ordinary nominative (ADR) | 20,684,215 | 272,825 |
| | | 2,674,414 |
| Industrials 7.69% | | |
| 3M Co. | 1,000,000 | 190,540 |
| Airbus SE, non-registered shares | 3,250,000 | 312,641 |
| BAE Systems PLC | 51,320,100 | 300,374 |
| Boeing Co. | 700,000 | 225,750 |
| Caterpillar Inc. | 612,000 | 77,767 |
| CSX Corp. | 16,750,958 | 1,040,737 |
| Cummins Inc. | 242,500 | 32,408 |
The Investment Company of America — Page 1 of 5
Common stocks (continued)
Industrials (continued) | Shares | Value
(000) |
| General Dynamics Corp. | 6,999,000 | $1,100,313 |
| General Electric Co. | 14,275,000 | 108,062 |
| Harris Corp. | 1,300,000 | 175,045 |
| Illinois Tool Works Inc. | 3,800,000 | 481,422 |
| Johnson Controls International PLC | 7,469,000 | 221,456 |
| L3 Technologies, Inc. | 742,000 | 128,856 |
| Lockheed Martin Corp. | 1,250,000 | 327,300 |
| Masco Corp. | 5,650,000 | 165,206 |
| Nielsen Holdings PLC | 7,502,000 | 175,022 |
| Northrop Grumman Corp. | 1,100,000 | 269,390 |
| Rolls-Royce Holdings PLC1 | 38,286,000 | 405,034 |
| Safran SA | 700,000 | 84,533 |
| Stanley Black & Decker, Inc. | 237,500 | 28,438 |
| Union Pacific Corp. | 1,855,568 | 256,495 |
| United Technologies Corp. | 4,314,803 | 459,440 |
| | | 6,566,229 |
| Consumer discretionary 10.32% | | |
| Amazon.com, Inc.1 | 1,396,100 | 2,096,900 |
| Booking Holdings Inc.1 | 148,500 | 255,779 |
| General Motors Co. | 12,293,400 | 411,214 |
| Hasbro, Inc.3 | 7,618,390 | 618,994 |
| Home Depot, Inc. | 7,938,000 | 1,363,907 |
| Las Vegas Sands Corp. | 2,000,000 | 104,100 |
| Lowe’s Companies, Inc. | 12,501,000 | 1,154,592 |
| Marriott International, Inc., Class A | 4,666,200 | 506,563 |
| McDonald’s Corp. | 5,450,000 | 967,757 |
| NIKE, Inc., Class B | 11,178,900 | 828,804 |
| PUMA SE2 | 10,033 | 4,908 |
| Starbucks Corp. | 2,517,500 | 162,127 |
| Toyota Motor Corp.2 | 4,000,000 | 234,151 |
| YUM! Brands, Inc. | 1,216,329 | 111,805 |
| | | 8,821,601 |
| Consumer staples 10.84% | | |
| Altria Group, Inc. | 28,357,787 | 1,400,591 |
| British American Tobacco PLC | 47,632,300 | 1,517,803 |
| British American Tobacco PLC (ADR) | 3,597,865 | 114,628 |
| Coca-Cola Co. | 24,856,000 | 1,176,932 |
| Costco Wholesale Corp. | 1,000,000 | 203,710 |
| Diageo PLC | 918,800 | 32,732 |
| Hormel Foods Corp. | 2,934,000 | 125,223 |
| Imperial Brands PLC | 5,466,000 | 165,605 |
| Keurig Dr Pepper Inc. | 1,964,900 | 50,380 |
| Kraft Heinz Co. | 6,124,722 | 263,608 |
| Lamb Weston Holdings, Inc.3 | 10,333,473 | 760,130 |
| Nestlé SA2 | 8,260,098 | 670,476 |
| PepsiCo, Inc. | 3,600,000 | 397,728 |
| Pernod Ricard SA | 2,664,000 | 437,391 |
| Philip Morris International Inc. | 24,005,300 | 1,602,594 |
| Reckitt Benckiser Group PLC | 1,000,000 | 76,642 |
| Walgreens Boots Alliance, Inc. | 3,899,600 | 266,460 |
| | | 9,262,633 |
The Investment Company of America — Page 2 of 5
Common stocks (continued)
Health care 19.04% | Shares | Value
(000) |
| Abbott Laboratories | 33,431,000 | $2,418,064 |
| AbbVie Inc. | 56,947,449 | 5,249,985 |
| Amgen Inc. | 10,302,639 | 2,005,615 |
| AstraZeneca PLC | 1,050,000 | 78,600 |
| Cigna Corp. | 2,494,173 | 473,693 |
| Daiichi Sankyo Co., Ltd.2 | 15,595,000 | 498,255 |
| Gilead Sciences, Inc. | 21,055,591 | 1,317,027 |
| Humana Inc. | 1,125,000 | 322,290 |
| Illumina, Inc.1 | 1,000,000 | 299,930 |
| Johnson & Johnson | 1,100,000 | 141,955 |
| Medtronic PLC | 1,225,000 | 111,426 |
| Merck & Co., Inc. | 3,790,000 | 289,594 |
| Novartis AG2 | 2,518,303 | 215,128 |
| Stryker Corp. | 3,691,917 | 578,708 |
| Teva Pharmaceutical Industries Ltd. (ADR) | 22,884,300 | 352,876 |
| Thermo Fisher Scientific Inc. | 2,816,000 | 630,193 |
| UnitedHealth Group Inc. | 5,142,997 | 1,281,223 |
| | | 16,264,562 |
| Financials 6.05% | | |
| American International Group, Inc. | 15,289,351 | 602,553 |
| Banco Santander, SA | 7,440,000 | 33,867 |
| Bank of Montreal | 2,343,478 | 153,102 |
| Bank of New York Mellon Corp. | 2,200,000 | 103,554 |
| Barclays PLC | 86,839,411 | 166,604 |
| Berkshire Hathaway Inc., Class B1 | 4,050,000 | 826,929 |
| BNP Paribas SA | 3,948,894 | 178,602 |
| Chubb Ltd. | 1,750,000 | 226,065 |
| CME Group Inc., Class A | 1,145,000 | 215,397 |
| First Republic Bank | 1,494,000 | 129,829 |
| JPMorgan Chase & Co. | 7,685,000 | 750,210 |
| Marsh & McLennan Companies, Inc. | 2,500,000 | 199,375 |
| PNC Financial Services Group, Inc. | 2,000,000 | 233,820 |
| Société Générale | 3,915,000 | 124,790 |
| UBS Group AG2 | 13,176,406 | 164,067 |
| Wells Fargo & Co. | 13,490,400 | 621,638 |
| Willis Towers Watson PLC | 2,875,000 | 436,598 |
| | | 5,167,000 |
| Information technology 14.60% | | |
| Accenture PLC, Class A | 4,610,300 | 650,098 |
| Adobe Inc.1 | 507,000 | 114,704 |
| Amphenol Corp., Class A | 2,455,000 | 198,904 |
| Apple Inc. | 2,908,200 | 458,739 |
| ASML Holding NV | 1,898,773 | 298,394 |
| Broadcom Inc. | 6,371,500 | 1,620,145 |
| Cisco Systems, Inc. | 766,000 | 33,191 |
| Intel Corp. | 29,558,000 | 1,387,157 |
| Intuit Inc. | 549,000 | 108,071 |
| Mastercard Inc., Class A | 2,800,000 | 528,220 |
| Microsoft Corp. | 35,174,673 | 3,572,691 |
| QUALCOMM Inc. | 17,016,800 | 968,426 |
| salesforce.com, inc.1 | 495,000 | 67,800 |
| Samsung Electronics Co., Ltd.2 | 12,900,000 | 445,578 |
| ServiceNow, Inc.1 | 421,000 | 74,959 |
The Investment Company of America — Page 3 of 5
Common stocks (continued)
Information technology (continued) | Shares | Value
(000) |
| Skyworks Solutions, Inc. | 3,550,000 | $237,921 |
| Symantec Corp. | 4,057,890 | 76,674 |
| TE Connectivity Ltd. | 2,314,000 | 175,008 |
| Texas Instruments Inc. | 9,686,983 | 915,420 |
| Western Union Co.3 | 24,634,600 | 420,266 |
| Xilinx, Inc. | 1,380,000 | 117,535 |
| | | 12,469,901 |
| Communication services 10.92% | | |
| Alphabet Inc., Class A1 | 1,691,300 | 1,767,341 |
| Alphabet Inc., Class C1 | 1,465,559 | 1,517,747 |
| BT Group PLC | 40,331,000 | 122,397 |
| CBS Corp., Class B | 16,789,300 | 734,028 |
| Comcast Corp., Class A | 4,000,000 | 136,200 |
| Discovery, Inc., Class A1 | 1,708,121 | 42,259 |
| Discovery, Inc., Class C1 | 8,537,945 | 197,056 |
| Facebook, Inc., Class A1 | 23,202,700 | 3,041,642 |
| Twenty-First Century Fox, Inc., Class A | 2,000,000 | 96,240 |
| Verizon Communications Inc. | 24,156,792 | 1,358,095 |
| Viacom Inc., Class B | 7,446,760 | 191,382 |
| Vodafone Group PLC | 65,000,000 | 126,676 |
| | | 9,331,063 |
| Utilities 1.77% | | |
| American Electric Power Co., Inc. | 3,769,088 | 281,702 |
| Dominion Energy, Inc. | 7,723,824 | 551,945 |
| Edison International | 4,645,400 | 263,719 |
| Exelon Corp. | 3,300,000 | 148,830 |
| NextEra Energy, Inc. | 300,000 | 52,146 |
| Sempra Energy | 2,000,000 | 216,380 |
| | | 1,514,722 |
| Real estate 0.46% | | |
| American Tower Corp. REIT | 1,699,298 | 268,812 |
| SBA Communications Corp. REIT1 | 769,737 | 124,613 |
| | | 393,425 |
| Total common stocks (cost: $62,622,515,000) | | 79,827,915 |
Bonds, notes & other debt instruments 0.09%
U.S. Treasury bonds & notes 0.09%
U.S. Treasury 0.09% | Principal amount
(000) | |
| U.S. Treasury 2.75% 2023 | $70,360 | 71,099 |
| Total bonds, notes & other debt instruments (cost: $70,096,000) | | 71,099 |
| Short-term securities 6.14% | | |
| Apple Inc. 2.33%–2.48% due 1/9/2019–2/25/20194 | 171,100 | 170,591 |
| CAFCO, LLC 2.51% due 1/18/20194 | 60,800 | 60,724 |
| Chevron Corp. 2.32%–2.39% due 1/10/2019–1/18/20194 | 108,600 | 108,487 |
| Coca-Cola Co. 2.40% due 1/15/2019–1/23/20194 | 65,000 | 64,910 |
| Emerson Electric Co. 2.37% due 1/4/20194 | 40,000 | 39,990 |
| ExxonMobil Corp. 2.32% due 1/8/2019 | 50,000 | 49,973 |
The Investment Company of America — Page 4 of 5
| Short-term securities (continued) | Principal amount
(000) | Value
(000) |
| Fannie Mae 2.23%–2.25% due 1/2/2019–1/14/2019 | $136,200 | $136,135 |
| Federal Home Loan Bank 2.24%–2.40% due 1/9/2019–3/6/2019 | 1,641,700 | 1,638,040 |
| Freddie Mac 2.27%–2.36% due 1/18/2019–2/20/2019 | 55,300 | 55,172 |
| HSBC USA Inc. 2.73% due 3/4/20194 | 75,000 | 74,647 |
| Merck & Co. Inc. 2.38% due 1/28/20194 | 100,000 | 99,807 |
| Pfizer Inc. 2.31%–2.51% due 1/15/2019–3/11/20194 | 164,600 | 164,239 |
| Simon Property Group, LP 2.36% due 1/7/20194 | 25,000 | 24,988 |
| U.S. Treasury Bills 2.17%–2.44% due 1/10/2019–5/23/2019 | 2,551,900 | 2,537,010 |
| Wal-Mart Stores, Inc. 2.35% due 1/2/20194 | 23,000 | 22,997 |
| Total short-term securities (cost: $5,247,704,000) | | 5,247,710 |
| Total investment securities99.67% (cost: $67,940,315,000) | | 85,146,724 |
| Other assets less liabilities0.33% | | 285,535 |
| Net assets100.00% | | $85,432,259 |
The following footnotes apply to either the individual securities noted or one or more of the securities aggregated and listed as a single line item.
| 1 | Security did not produce income during the last 12 months. |
| 2 | Valued under fair value procedures adopted by authority of the board of trustees. The total value of all such securities was $2,362,001,000, which represented 2.76% of the net assets of the fund. This entire amount relates to certain securities trading outside the U.S. whose values were adjusted as a result of significant market movements following the close of local trading. |
| 3 | Represents an affiliated company as defined under the Investment Company Act of 1940. |
| 4 | Acquired in a transaction exempt from registration under Rule 144A or Section 4(2) of the Securities Act of 1933. May be resold in the U.S. in transactions exempt from registration, normally to qualified institutional buyers. The total value of all such securities was $831,380,000, which represented .97% of the net assets of the fund. |
| Key to abbreviations |
| ADR = American Depositary Receipts |
| CAD = Canadian dollars |
Additional financial disclosures are included in the fund’s current shareholder report and should be read in conjunction with this report.
Investments are not FDIC-insured, nor are they deposits of or guaranteed by a bank or any other entity, so they may lose value.
Investors should carefully consider investment objectives, risks, charges and expenses. This and other important information is contained in the fund prospectus and summary prospectus, which can be obtained from your financial professional and should be read carefully before investing. You may also call American Funds Service Company (AFS) at (800) 421-4225 or visit the American Funds website at americanfunds.com. Fund shares offered through American Funds Distributors, Inc.
All Capital Group trademarks referenced are registered trademarks owned by The Capital Group Companies, Inc. or an affiliated company. All other company and product names mentioned are the trademarks or registered trademarks of their respective companies.
©2019 Capital Group. All rights reserved.
| MFGEFPX-004-0219O-S66089 | The Investment Company of America — Page 5 of 5 |
REPORT OF INDEPENDENT REGISTERED PUBLIC ACCOUNTING FIRM ON INVESTMENT PORTFOLIO
To the Shareholders and Board of Trustees of The Investment Company of America:
Opinion on the Investment Portfolio
We have audited the accompanying investment portfolio of The Investment Company of America (the “Fund”), as of December 31, 2018, and the related notes (“investment portfolio”) (included in Item 6 of this Form N-CSR). In our opinion, the investment portfolio presents fairly, in all material respects, the investments in securities of the Fund as of December 31, 2018, in conformity with accounting principles generally accepted in the United States of America.
Basis for Opinion
The investment portfolio is the responsibility of the Fund’s management. Our responsibility is to express an opinion on the investment portfolio based on our audit. We are a public accounting firm registered with the Public Company Accounting Oversight Board (United States) (PCAOB) and are required to be independent with respect to the Fund in accordance with the U.S. federal securities laws and the applicable rules and regulations of the Securities and Exchange Commission and the PCAOB.
We conducted our audit in accordance with the standards of the PCAOB. Those standards require that we plan and perform the audit to obtain reasonable assurance about whether the investment portfolio is free of material misstatement, whether due to error or fraud. The Fund is not required to have, nor were we engaged to perform, an audit of its internal control over financial reporting. As part of our audit we are required to obtain an understanding of internal control over financial reporting but not for the purpose of expressing an opinion on the effectiveness of the Fund's internal control over financial reporting. Accordingly, we express no such opinion.
Our audit included performing procedures to assess the risks of material misstatement of the investment portfolio, whether due to error or fraud, and performing procedures that respond to those risks. Such procedures included examining, on a test basis, evidence regarding the amounts and disclosures in the investment portfolio. Our audit also included evaluating the accounting principles used and significant estimates made by management, as well as evaluating the overall presentation of the investment portfolio. We believe that our audit provides a reasonable basis for our opinion.
DELOITTE & TOUCHE LLP
Costa Mesa, California
February 11, 2019
We have served as the auditor of one or more American Funds investment companies since 1956.
ITEM 7 – Disclosure of Proxy Voting Policies and Procedures for Closed-End Management Investment Companies
Not applicable to this Registrant, insofar as the Registrant is not a closed-end management investment company.
ITEM 8 – Portfolio Managers of Closed-End Management Investment Companies
Not applicable to this Registrant, insofar as the Registrant is not a closed-end management investment company.
ITEM 9 – Purchases of Equity Securities by Closed-End Management Investment Company and Affiliated Purchasers
Not applicable to this Registrant, insofar as the Registrant is not a closed-end management investment company.
ITEM 10 – Submission of Matters to a Vote of Security Holders
There have been no material changes to the procedures by which shareholders may recommend nominees to the Registrant’s board of trustees since the Registrant last submitted a proxy statement to its shareholders. The procedures are as follows. The Registrant has a nominating and governance committee comprised solely of persons who are not considered ‘‘interested persons’’ of the Registrant within the meaning of the Investment Company Act of 1940, as amended. The committee periodically reviews such issues as the board’s composition, responsibilities, committees, compensation and other relevant issues, and recommends any appropriate changes to the full board of trustees. While the committee normally is able to identify from its own resources an ample number of qualified candidates, it will consider shareholder suggestions of persons to be considered as nominees to fill future vacancies on the board. Such suggestions must be sent in writing to the nominating and governance committee of the Registrant, c/o the Registrant’s Secretary, and must be accompanied by complete biographical and occupational data on the prospective nominee, along with a written consent of the prospective nominee for consideration of his or her name by the nominating and governance committee.
ITEM 11 – Controls and Procedures
| (a) | The Registrant’s Principal Executive Officer and Principal Financial Officer have concluded, based on their evaluation of the Registrant’s disclosure controls and procedures (as such term is defined in Rule 30a-3 under the Investment Company Act of 1940), that such controls and procedures are adequate and reasonably designed to achieve the purposes described in paragraph (c) of such rule. |
| | |
| (b) | Effective May 28, 2018, the The Investment Company of America’s investment adviser implemented a new fixed income order management, trading, and compliance system. In connection with introducing this new system, additional automated and manual controls were implemented and some existing controls were modified. None of these changes were in response to any identified deficiency or weakness in the The Investment Company of America’s internal control over financial reporting. |
ITEM 12 – Exhibits
| (a)(1) | The Code of Ethics that is the subject of the disclosure required by Item 2 is attached as an exhibit hereto. |
| | |
| (a)(2) | The certifications required by Rule 30a-2 of the Investment Company Act of 1940 and Sections 302 and 906 of the Sarbanes-Oxley Act of 2002 are attached as exhibits hereto. |
SIGNATURES
Pursuant to the requirements of the Securities Exchange Act of 1934 and the Investment Company Act of 1940, the Registrant has duly caused this report to be signed on its behalf by the undersigned, thereunto duly authorized.
| | THE INVESTMENT COMPANY OF AMERICA |
| | |
| | By/s/ Herbert Y. Poon |
| | Herbert Y. Poon, Executive Vice President and Principal Executive Officer |
| | |
| | Date: February 28, 2019 |
Pursuant to the requirements of the Securities Exchange Act of 1934 and the Investment Company Act of 1940, this report has been signed below by the following persons on behalf of the Registrant and in the capacities and on the dates indicated.
| By/s/ Herbert Y. Poon |
Herbert Y. Poon, Executive Vice President and Principal Executive Officer |
| |
| Date: February 28, 2019 |
| By/s/ Brian D. Bullard |
Brian D. Bullard, Treasurer and Principal Financial Officer |
| |
| Date: February 28, 2019 |