UNITED STATES
SECURITIES AND EXCHANGE COMMISSION
Washington, D.C. 20549
FORM N-CSR
CERTIFIED SHAREHOLDER REPORT OF REGISTERED
MANAGEMENT INVESTMENT COMPANIES
Investment Company Act file number: 811-00242
Natixis Funds Trust II
(Exact name of Registrant as specified in charter)
888 Boylston Street, Suite 800 Boston, Massachusetts 02199-8197
(Address of principal executive offices) (Zip code)
Susan McWhan Tobin, Esq.
Natixis Distribution, LLC
888 Boylston Street, Suite 800
Boston, Massachusetts 02199-8197
(Name and address of agent for service)
Registrant’s telephone number, including area code: (617) 449-2139
Date of fiscal year end: November 30
Date of reporting period: May 31, 2024
Item 1. Reports to Stockholders.
| | (a) | The Registrant’s Tailored Shareholder Reports transmitted to shareholders pursuant to Rule 30e-1 under the Investment Company Act of 1940 are as follows: |
Vaughan Nelson Select Fund
Semi-annual Shareholder Report - May 31, 2024
This Semi-annual report contains important information about Vaughan Nelson Select Fund for the period of December 1, 2023 to May 31, 2024. You can find additional information (including tax information) about the Fund at im.natixis.com/funddocuments.You can also request the information by contacting us at 800-225-5478 or by contacting your financial intermediary directly.
What were the fund costs for the last six months? (based on a hypothetical $10,000 investment)
| Class Name | Cost of a $10,000 investment | Costs paid as a percentage of a $10,000 investment |
|---|
| Class N | $42 | 0.80% |
| Total Net Assets | $760,352,001 |
| # of Portfolio Holdings | 26 |
| Portfolio Turnover Rate | 41% |
| Total Advisory Fees Paid | $2,434,812 |
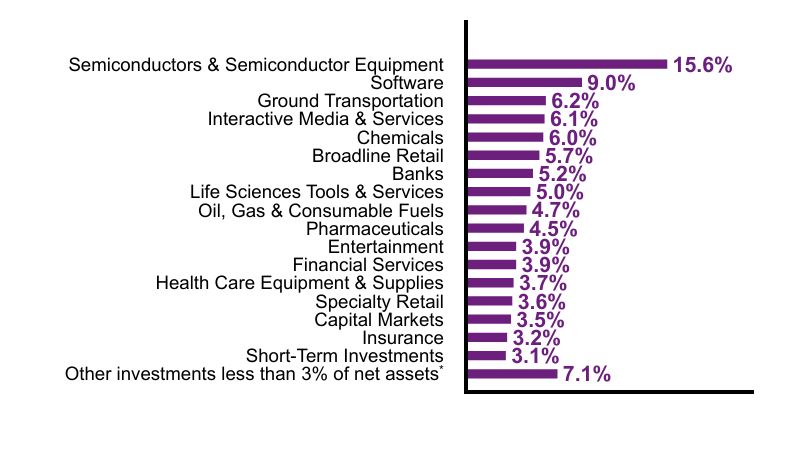
What did the Fund invest in? (% of Net Assets)
| Value | Value |
|---|
Other investments less than 3% of net assetsFootnote Reference* | 7.1% |
| Short-Term Investments | 3.1% |
| Insurance | 3.2% |
| Capital Markets | 3.5% |
| Specialty Retail | 3.6% |
| Health Care Equipment & Supplies | 3.7% |
| Financial Services | 3.9% |
| Entertainment | 3.9% |
| Pharmaceuticals | 4.5% |
| Oil, Gas & Consumable Fuels | 4.7% |
| Life Sciences Tools & Services | 5.0% |
| Banks | 5.2% |
| Broadline Retail | 5.7% |
| Chemicals | 6.0% |
| Interactive Media & Services | 6.1% |
| Ground Transportation | 6.2% |
| Software | 9.0% |
| Semiconductors & Semiconductor Equipment | 15.6% |
| Footnote | Description |
Footnote* | Net of other assets less liabilities |
| Microsoft Corp. | 7.1% |
| NVIDIA Corp. | 6.3% |
| Alphabet, Inc., Class A | 6.1% |
| Amazon.com, Inc. | 5.8% |
| Monolithic Power Systems, Inc. | 5.2% |
| JPMorgan Chase & Co. | 5.2% |
| Danaher Corp. | 5.0% |
| Zoetis, Inc. | 4.5% |
| ON Semiconductor Corp. | 4.1% |
| Walt Disney Co. | 3.9% |
There are no material fund changes during the period.
There were no changes in or disagreements with Accountants during the period.
For additional information about the Fund, including its prospectus, financial information, holdings and proxy information, scan the QR code or visit im.natixis.com/funddocuments
Phone: 800-225-5478
Email: secretaryofthefunds@natixis.com
Vaughan Nelson Select Fund
Semi-annual Shareholder Report - May 31, 2024
This Semi-annual report contains important information about Vaughan Nelson Select Fund for the period of December 1, 2023 to May 31, 2024. You can find additional information (including tax information) about the Fund at im.natixis.com/funddocuments.You can also request the information by contacting us at 800-225-5478 or by contacting your financial intermediary directly.
What were the fund costs for the last six months? (based on a hypothetical $10,000 investment)
| Class Name | Cost of a $10,000 investment | Costs paid as a percentage of a $10,000 investment |
|---|
| Class Y | $44 | 0.85% |
| Total Net Assets | $760,352,001 |
| # of Portfolio Holdings | 26 |
| Portfolio Turnover Rate | 41% |
| Total Advisory Fees Paid | $2,434,812 |
What did the Fund invest in? (% of Net Assets)
| Value | Value |
|---|
Other investments less than 3% of net assetsFootnote Reference* | 7.1% |
| Short-Term Investments | 3.1% |
| Insurance | 3.2% |
| Capital Markets | 3.5% |
| Specialty Retail | 3.6% |
| Health Care Equipment & Supplies | 3.7% |
| Financial Services | 3.9% |
| Entertainment | 3.9% |
| Pharmaceuticals | 4.5% |
| Oil, Gas & Consumable Fuels | 4.7% |
| Life Sciences Tools & Services | 5.0% |
| Banks | 5.2% |
| Broadline Retail | 5.7% |
| Chemicals | 6.0% |
| Interactive Media & Services | 6.1% |
| Ground Transportation | 6.2% |
| Software | 9.0% |
| Semiconductors & Semiconductor Equipment | 15.6% |
| Footnote | Description |
Footnote* | Net of other assets less liabilities |
| Microsoft Corp. | 7.1% |
| NVIDIA Corp. | 6.3% |
| Alphabet, Inc., Class A | 6.1% |
| Amazon.com, Inc. | 5.8% |
| Monolithic Power Systems, Inc. | 5.2% |
| JPMorgan Chase & Co. | 5.2% |
| Danaher Corp. | 5.0% |
| Zoetis, Inc. | 4.5% |
| ON Semiconductor Corp. | 4.1% |
| Walt Disney Co. | 3.9% |
There are no material fund changes during the period.
There were no changes in or disagreements with Accountants during the period.
For additional information about the Fund, including its prospectus, financial information, holdings and proxy information, scan the QR code or visit im.natixis.com/funddocuments
Phone: 800-225-5478
Email: secretaryofthefunds@natixis.com
Loomis Sayles Senior Floating Rate and Fixed Income Fund
Semi-annual Shareholder Report - May 31, 2024
This Semi-annual report contains important information about Loomis Sayles Senior Floating Rate and Fixed Income Fund for the period of December 1, 2023 to May 31, 2024. You can find additional information (including tax information) about the Fund at im.natixis.com/funddocuments.You can also request the information by contacting us at 800-225-5478 or by contacting your financial intermediary directly. This report describes changes to the Fund that occurred during the reporting period.
What were the fund costs for the last six months? (based on a hypothetical $10,000 investment)
| Class Name | Cost of a $10,000 investment | Costs paid as a percentage of a $10,000 investment |
|---|
| Class C | $90 | 1.75% |
| Total Net Assets | $813,711,453 |
| # of Portfolio Holdings | 292 |
| Portfolio Turnover Rate | 50% |
| Total Advisory Fees Paid | $2,287,407 |
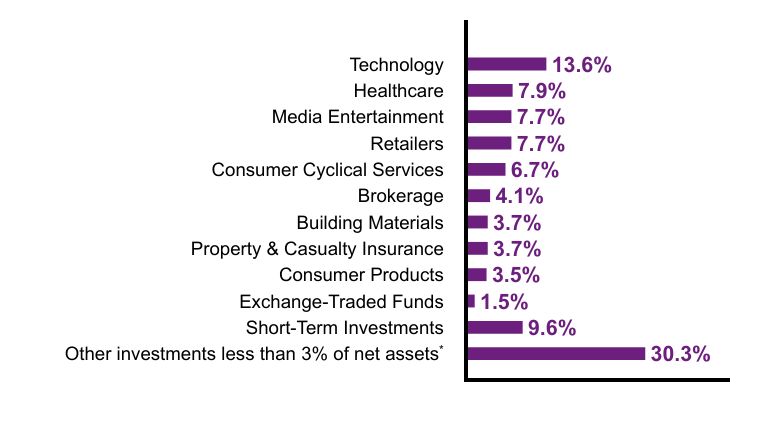
What did the Fund invest in? (% of Net Assets)
| Value | Value |
|---|
Other investments less than 3% of net assetsFootnote Reference* | 30.3% |
| Short-Term Investments | 9.6% |
| Exchange-Traded Funds | 1.5% |
| Consumer Products | 3.5% |
| Property & Casualty Insurance | 3.7% |
| Building Materials | 3.7% |
| Brokerage | 4.1% |
| Consumer Cyclical Services | 6.7% |
| Retailers | 7.7% |
| Media Entertainment | 7.7% |
| Healthcare | 7.9% |
| Technology | 13.6% |
| Footnote | Description |
Footnote* | Net of other assets less liabilities |
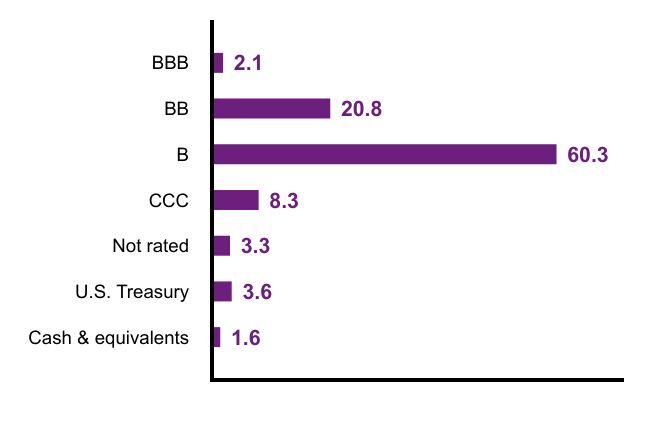
| Value | Value |
|---|
| Cash & equivalents | 1.6 |
| U.S. Treasury | 3.6 |
| Not rated | 3.3 |
| CCC | 8.3 |
| B | 60.3 |
| BB | 20.8 |
| BBB | 2.1 |
Effective July 1, 2024, the Fund had the following material changes, which were reported in a supplement to the Fund's prospectus. For more information, you may review the Fund's prospectus at im.natixis.com/funddocuments or upon request at 800-225-5478 or through your financial intermediary.
Expenses: The expense limit as a percentage of average daily net assets was reduced to 1.73% from 1.75%.
There were no changes in or disagreements with Accountants during the period.
For additional information about the Fund, including its prospectus, financial information, holdings and proxy information, scan the QR code or visit im.natixis.com/funddocuments
Phone: 800-225-5478
Email: secretaryofthefunds@natixis.com
Loomis Sayles Global Growth Fund
Semi-annual Shareholder Report - May 31, 2024
This Semi-annual report contains important information about Loomis Sayles Global Growth Fund for the period of December 1, 2023 to May 31, 2024. You can find additional information (including tax information) about the Fund at im.natixis.com/funddocuments.You can also request the information by contacting us at 800-225-5478 or by contacting your financial intermediary directly.
What were the fund costs for the last six months? (based on a hypothetical $10,000 investment)
| Class Name | Cost of a $10,000 investment | Costs paid as a percentage of a $10,000 investment |
|---|
| Class A | $63 | 1.20% |
| Total Net Assets | $95,166,661 |
| # of Portfolio Holdings | 45 |
| Portfolio Turnover Rate | 4% |
| Total Advisory Fees Paid | $274,509 |
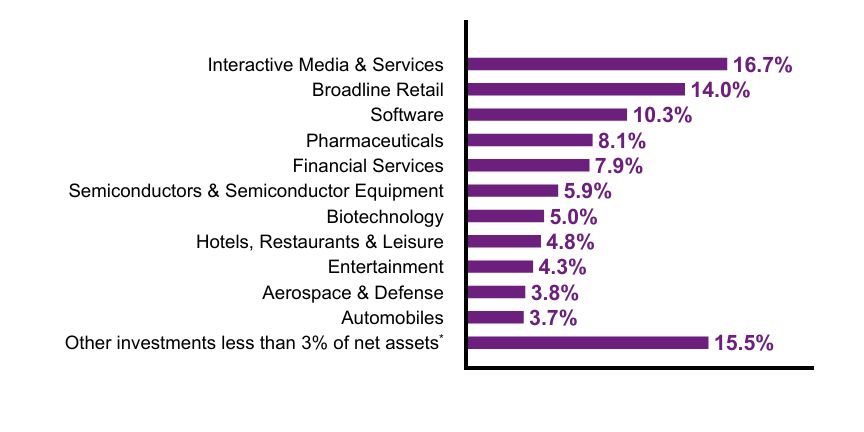
What did the Fund invest in? (% of Net Assets)
| Value | Value |
|---|
Other investments less than 3% of net assetsFootnote Reference* | 15.5% |
| Automobiles | 3.7% |
| Aerospace & Defense | 3.8% |
| Entertainment | 4.3% |
| Hotels, Restaurants & Leisure | 4.8% |
| Biotechnology | 5.0% |
| Semiconductors & Semiconductor Equipment | 5.9% |
| Financial Services | 7.9% |
| Pharmaceuticals | 8.1% |
| Software | 10.3% |
| Broadline Retail | 14.0% |
| Interactive Media & Services | 16.7% |
| Footnote | Description |
Footnote* | Net of other assets less liabilities |
| Meta Platforms, Inc., Class A | 7.1% |
| MercadoLibre, Inc. | 6.7% |
| Amazon.com, Inc. | 6.3% |
| Alphabet, Inc., Class A | 5.8% |
| Netflix, Inc. | 4.3% |
| Microsoft Corp. | 4.1% |
| Boeing Co. | 3.8% |
| Tesla, Inc. | 3.7% |
| Visa, Inc., Class A | 3.7% |
| Novo Nordisk AS, Class B | 3.6% |
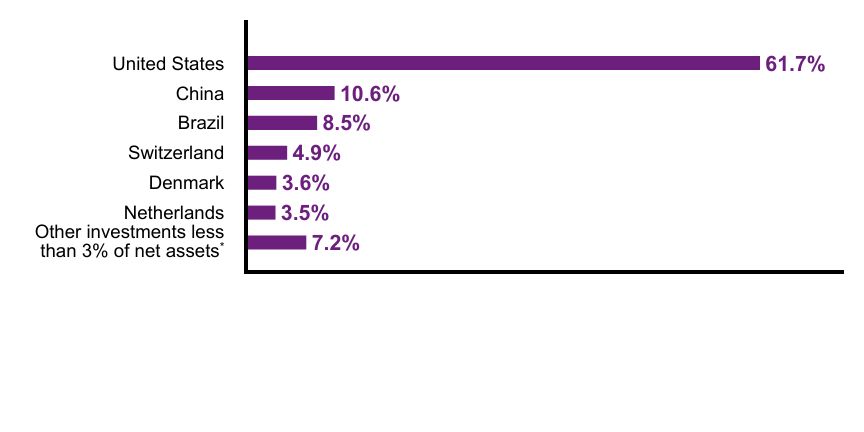
| Value | Value |
|---|
Other investments less than 3% of net assetsFootnote Reference* | 7.2% |
| Netherlands | 3.5% |
| Denmark | 3.6% |
| Switzerland | 4.9% |
| Brazil | 8.5% |
| China | 10.6% |
| United States | 61.7% |
| Footnote | Description |
Footnote* | Net of other assets less liabilities |
There are no material fund changes during the period.
There were no changes in or disagreements with Accountants during the period.
For additional information about the Fund, including its prospectus, financial information, holdings and proxy information, scan the QR code or visit im.natixis.com/funddocuments
Phone: 800-225-5478
Email: secretaryofthefunds@natixis.com
Loomis Sayles Global Growth Fund
Semi-annual Shareholder Report
May 31, 2024
Loomis Sayles Senior Floating Rate and Fixed Income Fund
Semi-annual Shareholder Report - May 31, 2024
This Semi-annual report contains important information about Loomis Sayles Senior Floating Rate and Fixed Income Fund for the period of December 1, 2023 to May 31, 2024. You can find additional information (including tax information) about the Fund at im.natixis.com/funddocuments.You can also request the information by contacting us at 800-225-5478 or by contacting your financial intermediary directly. This report describes changes to the Fund that occurred during the reporting period.
What were the fund costs for the last six months? (based on a hypothetical $10,000 investment)
| Class Name | Cost of a $10,000 investment | Costs paid as a percentage of a $10,000 investment |
|---|
| Class N | $36 | 0.70% |
| Total Net Assets | $813,711,453 |
| # of Portfolio Holdings | 292 |
| Portfolio Turnover Rate | 50% |
| Total Advisory Fees Paid | $2,287,407 |
What did the Fund invest in? (% of Net Assets)
| Value | Value |
|---|
Other investments less than 3% of net assetsFootnote Reference* | 30.3% |
| Short-Term Investments | 9.6% |
| Exchange-Traded Funds | 1.5% |
| Consumer Products | 3.5% |
| Property & Casualty Insurance | 3.7% |
| Building Materials | 3.7% |
| Brokerage | 4.1% |
| Consumer Cyclical Services | 6.7% |
| Retailers | 7.7% |
| Media Entertainment | 7.7% |
| Healthcare | 7.9% |
| Technology | 13.6% |
| Footnote | Description |
Footnote* | Net of other assets less liabilities |
| Value | Value |
|---|
| Cash & equivalents | 1.6 |
| U.S. Treasury | 3.6 |
| Not rated | 3.3 |
| CCC | 8.3 |
| B | 60.3 |
| BB | 20.8 |
| BBB | 2.1 |
Effective July 1, 2024, the Fund had the following material changes, which were reported in a supplement to the Fund's prospectus. For more information, you may review the Fund's prospectus at im.natixis.com/funddocuments or upon request at 800-225-5478 or through your financial intermediary.
Expenses: The expense limit as a percentage of average daily net assets was reduced to 0.68% from 0.70%.
There were no changes in or disagreements with Accountants during the period.
For additional information about the Fund, including its prospectus, financial information, holdings and proxy information, scan the QR code or visit im.natixis.com/funddocuments
Phone: 800-225-5478
Email: secretaryofthefunds@natixis.com
Loomis Sayles Senior Floating Rate and Fixed Income Fund
Semi-annual Shareholder Report - May 31, 2024
This Semi-annual report contains important information about Loomis Sayles Senior Floating Rate and Fixed Income Fund for the period of December 1, 2023 to May 31, 2024. You can find additional information (including tax information) about the Fund at im.natixis.com/funddocuments.You can also request the information by contacting us at 800-225-5478 or by contacting your financial intermediary directly. This report describes changes to the Fund that occurred during the reporting period.
What were the fund costs for the last six months? (based on a hypothetical $10,000 investment)
| Class Name | Cost of a $10,000 investment | Costs paid as a percentage of a $10,000 investment |
|---|
| Class Y | $38 | 0.75% |
| Total Net Assets | $813,711,453 |
| # of Portfolio Holdings | 292 |
| Portfolio Turnover Rate | 50% |
| Total Advisory Fees Paid | $2,287,407 |
What did the Fund invest in? (% of Net Assets)
| Value | Value |
|---|
Other investments less than 3% of net assetsFootnote Reference* | 30.3% |
| Short-Term Investments | 9.6% |
| Exchange-Traded Funds | 1.5% |
| Consumer Products | 3.5% |
| Property & Casualty Insurance | 3.7% |
| Building Materials | 3.7% |
| Brokerage | 4.1% |
| Consumer Cyclical Services | 6.7% |
| Retailers | 7.7% |
| Media Entertainment | 7.7% |
| Healthcare | 7.9% |
| Technology | 13.6% |
| Footnote | Description |
Footnote* | Net of other assets less liabilities |
| Value | Value |
|---|
| Cash & equivalents | 1.6 |
| U.S. Treasury | 3.6 |
| Not rated | 3.3 |
| CCC | 8.3 |
| B | 60.3 |
| BB | 20.8 |
| BBB | 2.1 |
Effective July 1, 2024, the Fund had the following material changes, which were reported in a supplement to the Fund's prospectus. For more information, you may review the Fund's prospectus at im.natixis.com/funddocuments or upon request at 800-225-5478 or through your financial intermediary.
Expenses: The expense limit as a percentage of average daily net assets was reduced to 0.73% from 0.75%.
There were no changes in or disagreements with Accountants during the period.
For additional information about the Fund, including its prospectus, financial information, holdings and proxy information, scan the QR code or visit im.natixis.com/funddocuments
Phone: 800-225-5478
Email: secretaryofthefunds@natixis.com
Vaughan Nelson Select Fund
Semi-annual Shareholder Report - May 31, 2024
This Semi-annual report contains important information about Vaughan Nelson Select Fund for the period of December 1, 2023 to May 31, 2024. You can find additional information (including tax information) about the Fund at im.natixis.com/funddocuments.You can also request the information by contacting us at 800-225-5478 or by contacting your financial intermediary directly.
What were the fund costs for the last six months? (based on a hypothetical $10,000 investment)
| Class Name | Cost of a $10,000 investment | Costs paid as a percentage of a $10,000 investment |
|---|
| Class A | $58 | 1.10% |
| Total Net Assets | $760,352,001 |
| # of Portfolio Holdings | 26 |
| Portfolio Turnover Rate | 41% |
| Total Advisory Fees Paid | $2,434,812 |
What did the Fund invest in? (% of Net Assets)
| Value | Value |
|---|
Other investments less than 3% of net assetsFootnote Reference* | 7.1% |
| Short-Term Investments | 3.1% |
| Insurance | 3.2% |
| Capital Markets | 3.5% |
| Specialty Retail | 3.6% |
| Health Care Equipment & Supplies | 3.7% |
| Financial Services | 3.9% |
| Entertainment | 3.9% |
| Pharmaceuticals | 4.5% |
| Oil, Gas & Consumable Fuels | 4.7% |
| Life Sciences Tools & Services | 5.0% |
| Banks | 5.2% |
| Broadline Retail | 5.7% |
| Chemicals | 6.0% |
| Interactive Media & Services | 6.1% |
| Ground Transportation | 6.2% |
| Software | 9.0% |
| Semiconductors & Semiconductor Equipment | 15.6% |
| Footnote | Description |
Footnote* | Net of other assets less liabilities |
| Microsoft Corp. | 7.1% |
| NVIDIA Corp. | 6.3% |
| Alphabet, Inc., Class A | 6.1% |
| Amazon.com, Inc. | 5.8% |
| Monolithic Power Systems, Inc. | 5.2% |
| JPMorgan Chase & Co. | 5.2% |
| Danaher Corp. | 5.0% |
| Zoetis, Inc. | 4.5% |
| ON Semiconductor Corp. | 4.1% |
| Walt Disney Co. | 3.9% |
There are no material fund changes during the period.
There were no changes in or disagreements with Accountants during the period.
For additional information about the Fund, including its prospectus, financial information, holdings and proxy information, scan the QR code or visit im.natixis.com/funddocuments
Phone: 800-225-5478
Email: secretaryofthefunds@natixis.com
Loomis Sayles Global Growth Fund
Semi-annual Shareholder Report - May 31, 2024
This Semi-annual report contains important information about Loomis Sayles Global Growth Fund for the period of December 1, 2023 to May 31, 2024. You can find additional information (including tax information) about the Fund at im.natixis.com/funddocuments.You can also request the information by contacting us at 800-225-5478 or by contacting your financial intermediary directly.
What were the fund costs for the last six months? (based on a hypothetical $10,000 investment)
| Class Name | Cost of a $10,000 investment | Costs paid as a percentage of a $10,000 investment |
|---|
| Class C | $102 | 1.95% |
| Total Net Assets | $95,166,661 |
| # of Portfolio Holdings | 45 |
| Portfolio Turnover Rate | 4% |
| Total Advisory Fees Paid | $274,509 |
What did the Fund invest in? (% of Net Assets)
| Value | Value |
|---|
Other investments less than 3% of net assetsFootnote Reference* | 15.5% |
| Automobiles | 3.7% |
| Aerospace & Defense | 3.8% |
| Entertainment | 4.3% |
| Hotels, Restaurants & Leisure | 4.8% |
| Biotechnology | 5.0% |
| Semiconductors & Semiconductor Equipment | 5.9% |
| Financial Services | 7.9% |
| Pharmaceuticals | 8.1% |
| Software | 10.3% |
| Broadline Retail | 14.0% |
| Interactive Media & Services | 16.7% |
| Footnote | Description |
Footnote* | Net of other assets less liabilities |
| Meta Platforms, Inc., Class A | 7.1% |
| MercadoLibre, Inc. | 6.7% |
| Amazon.com, Inc. | 6.3% |
| Alphabet, Inc., Class A | 5.8% |
| Netflix, Inc. | 4.3% |
| Microsoft Corp. | 4.1% |
| Boeing Co. | 3.8% |
| Tesla, Inc. | 3.7% |
| Visa, Inc., Class A | 3.7% |
| Novo Nordisk AS, Class B | 3.6% |
| Value | Value |
|---|
Other investments less than 3% of net assetsFootnote Reference* | 7.2% |
| Netherlands | 3.5% |
| Denmark | 3.6% |
| Switzerland | 4.9% |
| Brazil | 8.5% |
| China | 10.6% |
| United States | 61.7% |
| Footnote | Description |
Footnote* | Net of other assets less liabilities |
There are no material fund changes during the period.
There were no changes in or disagreements with Accountants during the period.
For additional information about the Fund, including its prospectus, financial information, holdings and proxy information, scan the QR code or visit im.natixis.com/funddocuments
Phone: 800-225-5478
Email: secretaryofthefunds@natixis.com
Loomis Sayles Global Growth Fund
Semi-annual Shareholder Report
May 31, 2024
Loomis Sayles Senior Floating Rate and Fixed Income Fund
Semi-annual Shareholder Report - May 31, 2024
This Semi-annual report contains important information about Loomis Sayles Senior Floating Rate and Fixed Income Fund for the period of December 1, 2023 to May 31, 2024. You can find additional information (including tax information) about the Fund at im.natixis.com/funddocuments.You can also request the information by contacting us at 800-225-5478 or by contacting your financial intermediary directly. This report describes changes to the Fund that occurred during the reporting period.
What were the fund costs for the last six months? (based on a hypothetical $10,000 investment)
| Class Name | Cost of a $10,000 investment | Costs paid as a percentage of a $10,000 investment |
|---|
| Class A | $51 | 1.00% |
| Total Net Assets | $813,711,453 |
| # of Portfolio Holdings | 292 |
| Portfolio Turnover Rate | 50% |
| Total Advisory Fees Paid | $2,287,407 |
What did the Fund invest in? (% of Net Assets)
| Value | Value |
|---|
Other investments less than 3% of net assetsFootnote Reference* | 30.3% |
| Short-Term Investments | 9.6% |
| Exchange-Traded Funds | 1.5% |
| Consumer Products | 3.5% |
| Property & Casualty Insurance | 3.7% |
| Building Materials | 3.7% |
| Brokerage | 4.1% |
| Consumer Cyclical Services | 6.7% |
| Retailers | 7.7% |
| Media Entertainment | 7.7% |
| Healthcare | 7.9% |
| Technology | 13.6% |
| Footnote | Description |
Footnote* | Net of other assets less liabilities |
| Value | Value |
|---|
| Cash & equivalents | 1.6 |
| U.S. Treasury | 3.6 |
| Not rated | 3.3 |
| CCC | 8.3 |
| B | 60.3 |
| BB | 20.8 |
| BBB | 2.1 |
Effective July 1, 2024, the Fund had the following material changes, which were reported in a supplement to the Fund's prospectus. For more information, you may review the Fund's prospectus at im.natixis.com/funddocuments or upon request at 800-225-5478 or through your financial intermediary.
Expenses: The expense limit as a percentage of average daily net assets was reduced to 0.98% from 1.00%.
There were no changes in or disagreements with Accountants during the period.
For additional information about the Fund, including its prospectus, financial information, holdings and proxy information, scan the QR code or visit im.natixis.com/funddocuments
Phone: 800-225-5478
Email: secretaryofthefunds@natixis.com
Vaughan Nelson Select Fund
Semi-annual Shareholder Report - May 31, 2024
This Semi-annual report contains important information about Vaughan Nelson Select Fund for the period of December 1, 2023 to May 31, 2024. You can find additional information (including tax information) about the Fund at im.natixis.com/funddocuments.You can also request the information by contacting us at 800-225-5478 or by contacting your financial intermediary directly.
What were the fund costs for the last six months? (based on a hypothetical $10,000 investment)
| Class Name | Cost of a $10,000 investment | Costs paid as a percentage of a $10,000 investment |
|---|
| Class C | $97 | 1.85% |
| Total Net Assets | $760,352,001 |
| # of Portfolio Holdings | 26 |
| Portfolio Turnover Rate | 41% |
| Total Advisory Fees Paid | $2,434,812 |
What did the Fund invest in? (% of Net Assets)
| Value | Value |
|---|
Other investments less than 3% of net assetsFootnote Reference* | 7.1% |
| Short-Term Investments | 3.1% |
| Insurance | 3.2% |
| Capital Markets | 3.5% |
| Specialty Retail | 3.6% |
| Health Care Equipment & Supplies | 3.7% |
| Financial Services | 3.9% |
| Entertainment | 3.9% |
| Pharmaceuticals | 4.5% |
| Oil, Gas & Consumable Fuels | 4.7% |
| Life Sciences Tools & Services | 5.0% |
| Banks | 5.2% |
| Broadline Retail | 5.7% |
| Chemicals | 6.0% |
| Interactive Media & Services | 6.1% |
| Ground Transportation | 6.2% |
| Software | 9.0% |
| Semiconductors & Semiconductor Equipment | 15.6% |
| Footnote | Description |
Footnote* | Net of other assets less liabilities |
| Microsoft Corp. | 7.1% |
| NVIDIA Corp. | 6.3% |
| Alphabet, Inc., Class A | 6.1% |
| Amazon.com, Inc. | 5.8% |
| Monolithic Power Systems, Inc. | 5.2% |
| JPMorgan Chase & Co. | 5.2% |
| Danaher Corp. | 5.0% |
| Zoetis, Inc. | 4.5% |
| ON Semiconductor Corp. | 4.1% |
| Walt Disney Co. | 3.9% |
There are no material fund changes during the period.
There were no changes in or disagreements with Accountants during the period.
For additional information about the Fund, including its prospectus, financial information, holdings and proxy information, scan the QR code or visit im.natixis.com/funddocuments
Phone: 800-225-5478
Email: secretaryofthefunds@natixis.com
Loomis Sayles Global Growth Fund
Semi-annual Shareholder Report - May 31, 2024
This Semi-annual report contains important information about Loomis Sayles Global Growth Fund for the period of December 1, 2023 to May 31, 2024. You can find additional information (including tax information) about the Fund at im.natixis.com/funddocuments.You can also request the information by contacting us at 800-225-5478 or by contacting your financial intermediary directly.
What were the fund costs for the last six months? (based on a hypothetical $10,000 investment)
| Class Name | Cost of a $10,000 investment | Costs paid as a percentage of a $10,000 investment |
|---|
| Class N | $47 | 0.90% |
| Total Net Assets | $95,166,661 |
| # of Portfolio Holdings | 45 |
| Portfolio Turnover Rate | 4% |
| Total Advisory Fees Paid | $274,509 |
What did the Fund invest in? (% of Net Assets)
| Value | Value |
|---|
Other investments less than 3% of net assetsFootnote Reference* | 15.5% |
| Automobiles | 3.7% |
| Aerospace & Defense | 3.8% |
| Entertainment | 4.3% |
| Hotels, Restaurants & Leisure | 4.8% |
| Biotechnology | 5.0% |
| Semiconductors & Semiconductor Equipment | 5.9% |
| Financial Services | 7.9% |
| Pharmaceuticals | 8.1% |
| Software | 10.3% |
| Broadline Retail | 14.0% |
| Interactive Media & Services | 16.7% |
| Footnote | Description |
Footnote* | Net of other assets less liabilities |
| Meta Platforms, Inc., Class A | 7.1% |
| MercadoLibre, Inc. | 6.7% |
| Amazon.com, Inc. | 6.3% |
| Alphabet, Inc., Class A | 5.8% |
| Netflix, Inc. | 4.3% |
| Microsoft Corp. | 4.1% |
| Boeing Co. | 3.8% |
| Tesla, Inc. | 3.7% |
| Visa, Inc., Class A | 3.7% |
| Novo Nordisk AS, Class B | 3.6% |
| Value | Value |
|---|
Other investments less than 3% of net assetsFootnote Reference* | 7.2% |
| Netherlands | 3.5% |
| Denmark | 3.6% |
| Switzerland | 4.9% |
| Brazil | 8.5% |
| China | 10.6% |
| United States | 61.7% |
| Footnote | Description |
Footnote* | Net of other assets less liabilities |
There are no material fund changes during the period.
There were no changes in or disagreements with Accountants during the period.
For additional information about the Fund, including its prospectus, financial information, holdings and proxy information, scan the QR code or visit im.natixis.com/funddocuments
Phone: 800-225-5478
Email: secretaryofthefunds@natixis.com
Loomis Sayles Global Growth Fund
Semi-annual Shareholder Report
May 31, 2024
Loomis Sayles Global Growth Fund
Semi-annual Shareholder Report - May 31, 2024
This Semi-annual report contains important information about Loomis Sayles Global Growth Fund for the period of December 1, 2023 to May 31, 2024. You can find additional information (including tax information) about the Fund at im.natixis.com/funddocuments.You can also request the information by contacting us at 800-225-5478 or by contacting your financial intermediary directly.
What were the fund costs for the last six months? (based on a hypothetical $10,000 investment)
| Class Name | Cost of a $10,000 investment | Costs paid as a percentage of a $10,000 investment |
|---|
| Class Y | $50 | 0.95% |
| Total Net Assets | $95,166,661 |
| # of Portfolio Holdings | 45 |
| Portfolio Turnover Rate | 4% |
| Total Advisory Fees Paid | $274,509 |
What did the Fund invest in? (% of Net Assets)
| Value | Value |
|---|
Other investments less than 3% of net assetsFootnote Reference* | 15.5% |
| Automobiles | 3.7% |
| Aerospace & Defense | 3.8% |
| Entertainment | 4.3% |
| Hotels, Restaurants & Leisure | 4.8% |
| Biotechnology | 5.0% |
| Semiconductors & Semiconductor Equipment | 5.9% |
| Financial Services | 7.9% |
| Pharmaceuticals | 8.1% |
| Software | 10.3% |
| Broadline Retail | 14.0% |
| Interactive Media & Services | 16.7% |
| Footnote | Description |
Footnote* | Net of other assets less liabilities |
| Meta Platforms, Inc., Class A | 7.1% |
| MercadoLibre, Inc. | 6.7% |
| Amazon.com, Inc. | 6.3% |
| Alphabet, Inc., Class A | 5.8% |
| Netflix, Inc. | 4.3% |
| Microsoft Corp. | 4.1% |
| Boeing Co. | 3.8% |
| Tesla, Inc. | 3.7% |
| Visa, Inc., Class A | 3.7% |
| Novo Nordisk AS, Class B | 3.6% |
| Value | Value |
|---|
Other investments less than 3% of net assetsFootnote Reference* | 7.2% |
| Netherlands | 3.5% |
| Denmark | 3.6% |
| Switzerland | 4.9% |
| Brazil | 8.5% |
| China | 10.6% |
| United States | 61.7% |
| Footnote | Description |
Footnote* | Net of other assets less liabilities |
There are no material fund changes during the period.
There were no changes in or disagreements with Accountants during the period.
For additional information about the Fund, including its prospectus, financial information, holdings and proxy information, scan the QR code or visit im.natixis.com/funddocuments
Phone: 800-225-5478
Email: secretaryofthefunds@natixis.com
Loomis Sayles Global Growth Fund
Semi-annual Shareholder Report
May 31, 2024
Item 2. Code of Ethics.
Not applicable.
Item 3. Audit Committee Financial Expert.
Not applicable.
Item 4. Principal Accountant Fees and Services.
Not applicable.
Item 5. Audit Committee of Listed Registrants.
Not applicable.
Item 6. Schedule of Investments.
The Schedule of Investments are incorporated by reference as part of the Financial Statements and Other Important Information for Open-End Management Investment Companies filed as Item 7 herewith.
Item 7. Financial Statements and Financial Highlights for Open-End Management Investment Companies.
The Registrant’s Financial Statements and Other Important Information are as follows:
Semiannual Financial Statements and Other Important Information
Loomis Sayles Global Growth Fund |
Loomis Sayles Senior Floating Rate and Fixed Income Fund |
Vaughan Nelson Select Fund |
Portfolio of Investments – as of May 31, 2024 (Unaudited)Loomis Sayles Global Growth Fund
| | |
Common Stocks — 99.3% of Net Assets |
| |
| | |
| | |
| | |
| |
| Shopify, Inc., Class A(a) | |
| |
| Alibaba Group Holding Ltd., ADR(b) | |
| | |
| Budweiser Brewing Co. APAC Ltd.(b) | |
| | |
| | |
| Trip.com Group Ltd., ADR(a)(b) | |
| | |
| | |
| |
| | |
| |
| | |
| |
| | |
| |
| | |
| | |
| | |
| |
| CRISPR Therapeutics AG(a) | |
| Novartis AG, (Registered) | |
| | |
| |
| Reckitt Benckiser Group PLC | |
| | |
| | |
| |
| Alnylam Pharmaceuticals, Inc.(a) | |
| Alphabet, Inc., Class A(a) | |
| | |
| | |
| | |
| | |
| | |
| | |
| Doximity, Inc., Class A(a) | |
| Expeditors International of Washington, Inc. | |
| | |
| Meta Platforms, Inc., Class A | |
| | |
| | |
| | |
| | |
| | |
| | |
| | |
| | |
| | |
| Under Armour, Inc., Class A(a) | |
| Vertex Pharmaceuticals, Inc.(a) | |
| | |
| United States — continued |
| | |
| | |
| | |
| Total Common Stocks
(Identified Cost $71,921,003) | |
| | |
Short-Term Investments — 0.6% |
| Tri-Party Repurchase Agreement with Fixed Income Clearing Corporation, dated 5/31/2024 at 3.500% to be repurchased at $601,837 on 6/03/2024 collateralized by $616,500 U.S. Treasury Note, 4.000% due 1/15/2027 valued at $613,834 including accrued interest (Note 2 of Notes to Financial Statements)
(Identified Cost $601,662) | |
| Total Investments — 99.9%
(Identified Cost $72,522,665) | |
| Other assets less liabilities — 0.1% | |
| | |
| See Note 2 of Notes to Financial Statements. |
| Non-income producing security. |
| Security invests in variable interest entities based in China. See Note 9 of Notes to Financial Statements. |
| An American Depositary Receipt is a certificate issued by a custodian bank representing the right to receive securities of the foreign issuer described. The values of ADRs may be significantly influenced by trading on exchanges not located in the United States. |
Industry Summary at May 31, 2024 (Unaudited)
Interactive Media & Services | |
| |
| |
| |
| |
Semiconductors & Semiconductor Equipment | |
| |
Hotels, Restaurants & Leisure | |
| |
| |
| |
| |
| |
| |
| |
Other Investments, less than 2% each | |
| |
| |
Other assets less liabilities | |
| |
See accompanying notes to financial statements.
Portfolio of Investments – as of May 31, 2024 (Unaudited)Loomis Sayles Global Growth Fund (continued) Currency Exposure Summary at May 31, 2024 (Unaudited)
| |
| |
| |
| |
| |
| |
| |
| |
Other assets less liabilities | |
| |
See accompanying notes to financial statements.
Portfolio of Investments – as of May 31, 2024 (Unaudited)Loomis Sayles Senior Floating Rate and Fixed Income Fund
| | |
Senior Loans — 91.2% of Net Assets |
| Aerospace & Defense — 1.8% |
| Bleriot U.S. Bidco, Inc., 2023 Term Loan B, 10/31/2030(a) | |
| Kaman Corp., 2024 Term Loan, 3 mo. USD SOFR + 3.500%, 8.827%, 4/21/2031(b)(c) | |
| Spirit Aerosystems, Inc., 2022 Term Loan, 3 mo. USD SOFR + 4.250%, 9.580%, 1/15/2027(b)(c) | |
| TransDigm, Inc., 2024 Term Loan I, 3 mo. USD SOFR + 2.750%, 8.059%, 8/24/2028(b)(c) | |
| Vertex Aerospace Services Corp., 2024 Term Loan B, 12/06/2030(a) | |
| | |
| |
| American Airlines, Inc., 2021 Term Loan, 3 mo. USD SOFR + 4.750%, 10.336%, 4/20/2028(c) | |
| LifeMiles Ltd., 2021 Term Loan B, 3 mo. USD SOFR + 5.250%, 10.859%, 8/30/2026(c) | |
| Mileage Plus Holdings LLC, 2020 Term Loan B, 3 mo. USD SOFR + 5.250%, 10.733%, 6/21/2027(c) | |
| SkyMiles IP Ltd., 2020 Skymiles Term Loan B, 3 mo. USD SOFR + 3.750%, 9.075%, 10/20/2027(b)(c) | |
| | |
| |
| Autokiniton U.S. Holdings, Inc., 2024 Term Loan B, 1 mo. USD SOFR + 4.000%, 9.444%, 4/06/2028(b)(c) | |
| Clarios Global LP, 2024 Term Loan B, 1 mo. USD SOFR + 3.000%, 8.329%, 5/06/2030(b)(c) | |
| First Brands Group LLC, 2021 2nd Lien Term Loan, 3 mo. USD SOFR + 8.500%, 14.141%, 3/30/2028(c) | |
| First Brands Group LLC, 2021 Term Loan, 3 mo. USD SOFR + 5.000%, 10.591%, 3/30/2027(b)(c) | |
| IXS Holdings, Inc., 2020 Term Loan B, 3 mo. USD SOFR + 4.250%, 9.697%, 3/05/2027(c) | |
| Wheel Pros LLC, 2023 3rd Amendment Term Loan, 3 mo. USD SOFR + 4.500%, 10.058%, 5/11/2028(b)(c) | |
| Wheel Pros LLC, 2023 FILO Term Loan, 3 mo. USD SOFR + 8.875%, 14.461%, 2/10/2028(b)(c) | |
| | |
| |
| Schweitzer-Mauduit International, Inc., 2021 Term Loan B, 1 mo. USD SOFR + 3.750%, 9.194%, 4/20/2028(c) | |
| |
| Citadel Securities LP, 2024 Term Loan B, 1 mo. USD SOFR + 2.250%, 7.579%, 7/29/2030(b)(c) | |
| DRW Holdings LLC, 2021 Term Loan, 1 mo. USD SOFR + 3.750%, 9.192%, 3/01/2028(c) | |
| Edelman Financial Center LLC, 2018 2nd Lien Term Loan, 1 mo. USD SOFR + 6.750%, 12.194%, 7/20/2026(c) | |
| Edelman Financial Engines Center LLC, 2024 2nd Lien Term Loan, 10/20/2028(a) | |
| Eisner Advisory Group LLC, 2024 Term Loan B, 1 mo. USD SOFR + 4.000%, 9.329%, 2/28/2031(b)(c) | |
| Focus Financial Partners LLC, 2024 Term Loan B7, 1 mo. USD SOFR + 2.750%, 8.079%, 6/30/2028(b)(c) | |
| Harbourvest Partners LLC, 2024 Term Loan B, 3 mo. USD SOFR + 2.500%, 7.829%, 4/18/2030(b)(c) | |
| HighTower Holdings LLC, 2021 Term Loan B, 3 mo. USD SOFR + 4.000%, 9.586%, 4/21/2028(b)(c) | |
| | |
| |
| Resolute Investment Managers, Inc., 2023 Tranche C - 1st Lien Take Back Term Loan, 3 mo. USD SOFR + 6.500%, 12.071%, 4/30/2027(b)(c) | |
| Teneo Holdings LLC, 2024 Term Loan B, 1 mo. USD SOFR + 4.750%, 10.072%, 3/13/2031(b)(c) | |
| | |
| Building Materials — 3.7% |
| Chamberlain Group, Inc., 2024 Incremental Term Loan B, 1 mo. USD SOFR + 3.750%, 9.079%, 11/03/2028(b)(c) | |
| Foley Products Co. LLC, 2021 Term Loan, 3 mo. USD SOFR + 4.750%, 10.209%, 12/29/2028(b)(c) | |
| Foundation Building Materials Holding Co. LLC, 2024 Term Loan B2, USD SOFR + 4.000%, 9.330%, 1/29/2031(b)(c) | |
| Janus International Group LLC, 2024 Term Loan B, 8/03/2030(a) | |
| Kodiak Building Partners, Inc., 2024 Term Loan B2, 3 mo. USD SOFR + 3.750%, 9.059%, 3/12/2028(b)(c) | |
| LHS Borrower LLC, 2022 Term Loan B, 1 mo. USD SOFR + 4.750%, 10.179%, 2/16/2029(b)(c) | |
| Mannington Mills, Inc., 2021 Term Loan B, 3 mo. USD SOFR + 3.750%, 9.321%, 8/06/2026(b)(c) | |
| MI Windows & Doors LLC, 2024 Term Loan B2, 1 mo. USD SOFR + 3.500%, 8.829%, 3/28/2031(b)(c) | |
| MI Windows and Doors LLC, 2024 Term Loan B2, 3/28/2031(a) | |
| Oscar AcquisitionCo LLC, Term Loan B, 3 mo. USD SOFR + 4.500%, 9.902%, 4/29/2029(c) | |
| U.S. Silica Co., 2023 Term Loan B, 1 mo. USD SOFR + 4.000%, 9.329%, 3/25/2030(b)(c) | |
| | |
| |
| CSC Holdings LLC, 2019 Term Loan B5, 4/15/2027(a) | |
| CSC Holdings LLC, 2022 Term Loan B6, 1/18/2028(a) | |
| DirecTV Financing LLC, 2024 Term Loan, 1 mo. USD SOFR + 5.250%, 10.694%, 8/02/2029(b)(c) | |
| Virgin Media Bristol LLC, USD Term Loan N, 1/31/2028(a) | |
| WideOpenWest Finance LLC, 2021 Term Loan B, 3 mo. USD SOFR + 3.000%, 8.302%, 12/20/2028(b)(c) | |
| | |
| |
| Aruba Investments Holdings LLC, 2020 2nd Lien Term Loan, 3 mo. USD SOFR + 7.750%, 13.179%, 11/24/2028(c) | |
| Bakelite U.S. Holdco, Inc., 2024 Term Loan, 3 mo. USD SOFR + 3.500%, 8.824%, 5/29/2029(b)(c) | |
| Chemours Co., 2023 USD Term Loan B, 1 mo. USD SOFR + 3.500%, 8.829%, 8/18/2028(b)(c) | |
| GEON Performance Solutions LLC, 2021 Term Loan, 3 mo. USD SOFR + 4.250%, 9.571%, 8/18/2028(b)(c) | |
| Groupe Solmax, Inc., Term Loan, 3 mo. USD SOFR + 4.750%, 10.252%, 5/29/2028(c) | |
| LSF11 A5 Holdco LLC, 2023 Incremental Term Loan B, 1 mo. USD SOFR + 4.250%, 9.679%, 10/15/2028(c) | |
| Windsor Holdings III LLC, 2024 USD Term Loan B, 1 yr. USD SOFR + 4.000%, 9.320%, 8/01/2030(b)(c) | |
| | |
See accompanying notes to financial statements.
Portfolio of Investments – as of May 31, 2024 (Unaudited)Loomis Sayles Senior Floating Rate and Fixed Income Fund (continued) | | |
| Consumer Cyclical Services — 6.7% |
| BIFM US Finance LLC, 2024 Term Loan, 1 mo. USD SOFR + 4.250%, 9.579%, 5/31/2028(b)(c) | |
| CHG Healthcare Services, Inc., 2023 Incremental Term Loan, 1 mo. USD SOFR + 3.750%, 9.079%, 9/29/2028(b)(c) | |
| Cushman & Wakefield U.S. Borrower LLC, 2024 Term Loan, 1 mo. USD SOFR + 3.750%, 9.079%, 1/31/2030(b)(c) | |
| Galaxy U.S. Opco, Inc., Term Loan, 3 mo. USD SOFR + 4.750%, 10.080%, 4/29/2029(b)(c) | |
| Grant Thornton Advisors LLC, Term Loan B, 6/02/2031(a) | |
| Inmar, Inc., 2023 Term Loan, USD SOFR + 5.500%, 10.816%, 5/01/2026(b)(c) | |
| Kingpin Intermediate Holdings LLC, 2023 Term Loan B, 1 mo. USD SOFR + 3.500%, 8.829%, 2/08/2028(b)(c) | |
| Latham Pool Products, Inc., 2022 Term Loan B, 1 mo. USD SOFR + 4.000%, 9.425%, 2/23/2029(c) | |
| OMNIA Partners LLC, 2024 Term Loan, 7/25/2030(a) | |
| PUG LLC, 2024 Extended Term Loan B, 1 mo. USD SOFR + 4.750%, 10.079%, 3/15/2030(c) | |
| R1 RCM, Inc., 2022 Term Loan B, 1 mo. USD SOFR + 3.000%, 8.329%, 6/21/2029(b)(c) | |
| Ryan LLC, Delayed Draw Term Loan, 4.500%, 11/14/2030(d) | |
| Ryan LLC, Term Loan, 11/14/2030(a) | |
| Sweetwater Borrower LLC, Term Loan B, 1 mo. USD SOFR + 4.250%, 9.694%, 8/07/2028(c) | |
| TTF Holdings LLC, Term Loan, 1 mo. USD SOFR + 4.000%, 9.444%, 3/31/2028(c) | |
| Uber Technologies, Inc., 2023 Term Loan B, 3 mo. USD SOFR + 2.750%, 8.079%, 3/03/2030(b)(c) | |
| Vistage Worldwide, Inc., Term Loan, 3 mo. USD SOFR + 4.750%, 10.052%, 7/13/2029(b)(c) | |
| | |
| |
| AI Aqua Merger Sub, Inc., 2021 1st Lien Term Loan B, 1 mo. USD SOFR + 4.000%, 9.320%, 7/31/2028(b)(c) | |
| AI Aqua Merger Sub, Inc., 2023 Incremental Term Loan, 1 mo. USD SOFR + 4.250%, 9.578%, 7/31/2028(b)(c) | |
| American Greetings Corp., 2024 Term Loan B, 1 mo. USD SOFR + 5.750%, 11.079%, 10/30/2029(b)(c) | |
| Bombardier Recreational Products, Inc., 2023 Term Loan B3, 1 mo. USD SOFR + 2.750%, 8.079%, 12/13/2029(b)(c) | |
| Illuminate Merger Sub Corp., 1st Lien Term Loan, 3 mo. USD SOFR + 3.000%, 8.571%, 7/21/2028(b)(c) | |
| Mattress Firm, Inc., 2021 Term Loan B, 3 mo. USD SOFR + 4.250%, 9.814%, 9/25/2028(c) | |
| Recess Holdings, Inc., 2024 Term Loan B, 3 mo. USD SOFR + 4.500%, 9.893%, 2/20/2030(b)(c) | |
| Solis IV BV, USD Term Loan B1, 3 mo. USD SOFR + 3.500%, 8.836%, 2/26/2029(c) | |
| Springs Windows Fashions LLC, 2021 Term Loan B, 1 mo. USD SOFR + 4.000%, 9.444%, 10/06/2028(c) | |
| | |
| Consumer Products — continued |
| Topgolf Callaway Brands Corp., Term Loan B, 1 mo. USD SOFR + 3.000%, 8.329%, 3/15/2030(b)(c) | |
| Weber-Stephen Products LLC, 2022 Incremental Term Loan B, 1 mo. USD SOFR + 4.250%, 9.679%, 10/30/2027(c) | |
| | |
| Diversified Manufacturing — 2.2% |
| Arcline FM Holdings LLC, 2021 1st Lien Term Loan, 3 mo. USD SOFR + 4.750%, 10.321%, 6/23/2028(b)(c) | |
| Barnes Group, Inc., 2024 Term Loan, 1 mo. USD SOFR + 2.500%, 7.829%, 9/03/2030(b)(c) | |
| Chart Industries, Inc., 2023 Term Loan, 1 mo. USD SOFR + 3.250%, 8.673%, 3/15/2030(c) | |
| Filtration Group Corp., 2021 Incremental Term Loan, 10/21/2028(a) | |
| Infinite Bidco LLC, 2nd Lien Term Loan, 3 mo. USD SOFR + 7.000%, 12.591%, 3/02/2029(b)(c) | |
| INNIO Group Holding GmbH, 2023 USD Term Loan B, 11/02/2028(a) | |
| INNIO Group Holding GmbH, 2023 USD Term Loan B, 3 mo. USD SOFR + 4.250%, 9.575%, 11/02/2028(b)(c) | |
| LSF12 Badger Bidco LLC, Term Loan B, 1 mo. USD SOFR + 6.000%, 11.329%, 8/30/2030(b)(c) | |
| Project Castle, Inc., Term Loan B, 3 mo. USD SOFR + 5.500%, 10.798%, 6/01/2029(b)(c) | |
| Watlow Electric Manufacturing Co., Term Loan B, 3 mo. USD SOFR + 3.750%, 9.341%, 3/02/2028(b)(c) | |
| | |
| |
| Kohler Energy Co. LLC, USD Term Loan B, 3 mo. USD SOFR + 4.750%, 10.063%, 5/01/2031(b)(c) | |
| Talen Energy Supply LLC, 2023 Term Loan B, 3 mo. USD SOFR + 3.500%, 8.827%, 5/17/2030(b)(c) | |
| Talen Energy Supply LLC, 2023 Term Loan C, 3 mo. USD SOFR + 3.500%, 8.827%, 5/17/2030(b)(c) | |
| | |
| |
| Covanta Holding Corp., 2024 Term Loan B, 1 yr. USD SOFR + 2.750%, 8.071%, 11/30/2028(b)(c) | |
| Covanta Holding Corp., 2024 Term Loan C, 1 yr. USD SOFR + 2.750%, 8.071%, 11/30/2028(b)(c) | |
| Northstar Group Services, Inc., 2024 Term Loan B, 5/08/2030(a) | |
| Rockwood Service Corp., 2020 Term Loan, 1 mo. USD SOFR + 4.000%, 9.444%, 1/23/2027(c) | |
| The Action Environmental Group, Inc., 2023 Delayed Draw Term Loan B, 4.500%, 10/24/2030(d) | |
| The Action Environmental Group, Inc., 2023 Term Loan B, 3 mo. USD SOFR + 4.000%, 9.825%, 10/24/2030(b)(c) | |
| | |
| |
| Aragorn Parent Corp., Term Loan, 1 yr. USD SOFR + 4.250%, 9.570%, 12/15/2028(b)(c) | |
| Chrysaor Bidco SARL, EUR Delayed Draw Term Loan, 5/14/2031, (EUR)(a) | |
See accompanying notes to financial statements.
Portfolio of Investments – as of May 31, 2024 (Unaudited)Loomis Sayles Senior Floating Rate and Fixed Income Fund (continued) | | |
| Financial Other — continued |
| Chrysaor Bidco SARL, USD Term Loan B, 5/14/2031(a) | |
| Luxembourg Investment Co. 428 SARL, Term Loan B, 6 mo. USD SOFR + 5.000%, 10.391%, 1/03/2029(e) | |
| | |
| |
| Aspire Bakeries Holdings LLC, Term Loan, 1 mo. USD SOFR + 4.250%, 9.571%, 12/13/2030(b)(c) | |
| Chobani LLC, 2023 Incremental Term Loan, 1 mo. USD SOFR + 3.750%, 9.067%, 10/25/2027(b)(c) | |
| Fiesta Purchaser, Inc., 2024 Term Loan B, 1 mo. USD SOFR + 4.000%, 9.329%, 2/12/2031(b)(c) | |
| Naked Juice LLC, 2nd Lien Term Loan, 3 mo. USD SOFR + 6.000%, 11.402%, 1/24/2030(c) | |
| Northeast Grocery, Inc., Term Loan B, 3 mo. USD SOFR + 7.500%, 12.827%, 12/13/2028(b)(c) | |
| Triton Water Holdings, Inc., 2024 Incremental Term Loan B, 3/31/2028(a) | |
| Triton Water Holdings, Inc., 2024 Incremental Term Loan B, 3 mo. USD SOFR + 4.000%, 9.302%, 3/31/2028(b)(c) | |
| | |
| |
| Bally's Corp., 2021 Term Loan B, 3 mo. USD SOFR + 3.250%, 8.836%, 10/02/2028(b)(c) | |
| Caesars Entertainment, Inc., 2024 Term Loan B1, 3 mo. USD SOFR + 2.750%, 8.086%, 2/06/2031(b)(c) | |
| GVC Holdings (Gibraltar) Ltd., 2024 USD Term Loan B, 10/31/2029(a) | |
| J&J Ventures Gaming LLC, 2023 Incremental Term Loan B, 1 mo. USD SOFR + 4.250%, 9.694%, 4/26/2028(b)(c) | |
| Ontario Gaming GTA LP, Term Loan B, 3 mo. USD SOFR + 4.250%, 9.559%, 8/01/2030(b)(c) | |
| | |
| |
| Bausch & Lomb Corp., 2023 Incremental Term Loan, 1 mo. USD SOFR + 4.000%, 9.329%, 9/29/2028(b)(c) | |
| Bausch & Lomb Corp., Term Loan, 1 mo. USD SOFR + 3.250%, 8.670%, 5/10/2027(c) | |
| Carestream Dental Equipment, Inc., 2021 Term Loan, 3 mo. USD SOFR + 4.500%, 9.809%, 9/01/2024(b)(c) | |
| Catalent Pharma Solutions, Inc., 2023 Term Loan B4, 1 mo. USD SOFR + 3.000%, 8.321%, 2/22/2028(b)(c) | |
| Charlotte Buyer, Inc., 1st Lien Term Loan, 1 yr. USD SOFR + 5.250%, 10.571%, 2/11/2028(b)(c) | |
| Dermatology Intermediate Holdings III, Inc., 2022 Term Loan B, 3 mo. USD SOFR + 4.250%, 9.580%, 3/30/2029(b)(c) | |
| Element Materials Technology Group U.S. Holdings, Inc., 2022 USD Delayed Draw Term Loan, 3 mo. USD SOFR + 4.250%, 9.659%, 7/06/2029(c) | |
| Element Materials Technology Group U.S. Holdings, Inc., 2022 USD Term Loan, 3 mo. USD SOFR + 4.250%, 9.659%, 7/06/2029(c) | |
| | |
| |
| Embecta Corp., Term Loan B, 1 mo. USD SOFR + 3.000%, 8.329%, 3/30/2029(b)(c) | |
| Fortrea Holdings, Inc., Term Loan B, 1 mo. USD SOFR + 3.750%, 9.079%, 7/01/2030(b)(c) | |
| Gainwell Acquisition Corp., Term Loan B, 3 mo. USD SOFR + 4.000%, 9.409%, 10/01/2027(c) | |
| GHX Ultimate Parent Corp., 2024 Term Loan B, 3 mo. USD SOFR + 4.000%, 9.326%, 6/30/2027(b)(c) | |
| Inception Holdco SARL, 2024 USD Term Loan B, 3/14/2031(a) | |
| Inception Holdco SARL, 2024 USD Term Loan B, 3 mo. USD SOFR + 4.500%, 9.817%, 4/18/2031(b)(c) | |
| IVC Acquisition Ltd., 2023 USD Term Loan B, 12/12/2028(a) | |
| IVC Acquisition Ltd., 2023 USD Term Loan B, 3 mo. USD SOFR + 5.500%, 10.809%, 12/12/2028(b)(c) | |
| LifePoint Health, Inc., 2024 Incremental Term Loan B, 3 mo. USD SOFR + 4.000%, 9.329%, 5/17/2031(b)(c) | |
| MDVIP, Inc., 2021 2nd Lien Term Loan, 1 mo. USD SOFR + 6.500%, 11.944%, 10/15/2029(b)(c) | |
| MDVIP, Inc., 2021 Term Loan, 1 mo. USD SOFR + 3.500%, 8.944%, 10/16/2028(b)(c) | |
| National Mentor Holdings, Inc., 2021 Term Loan, 1 mo. USD SOFR + 3.750%, 9.175%, 3/02/2028(c) | |
| National Mentor Holdings, Inc., 2021 Term Loan C, 3 mo. USD SOFR + 3.750%, 9.159%, 3/02/2028(c) | |
| Onex TSG Intermediate Corp., 2021 Term Loan B, 1 mo. USD SOFR + 4.750%, 10.194%, 2/28/2028(b)(c) | |
| Parexel International Corp., 2021 1st Lien Term Loan, 1 mo. USD SOFR + 3.250%, 8.694%, 11/15/2028(c) | |
| Radnet Management, Inc., 2024 Term Loan B, 3 mo. USD SOFR + 2.500%, 7.823%, 4/18/2031(b)(c) | |
| Southern Veterinary Partners LLC, 2024 Term Loan, 1 mo. USD SOFR + 3.750%, 9.079%, 10/05/2027(b)(c) | |
| Star Parent, Inc., Term Loan B, 3 mo. USD SOFR + 4.000%, 9.309%, 9/27/2030(b)(c) | |
| Surgery Center Holdings, Inc., 2023 Term Loan, 1 mo. USD SOFR + 3.500%, 8.821%, 12/19/2030(b)(c) | |
| Surgery Center Holdings, Inc., 2024 Term Loan B, 12/19/2030(a) | |
| | |
| Independent Energy — 0.5% |
| Matador Bidco SARL, Term Loan, 1 mo. USD SOFR + 4.750%, 10.416%, 10/15/2026(c) | |
| |
| Colibri Group LLC, 2022 Term Loan, 3 mo. USD SOFR + 5.000%, 10.472%, 3/12/2029(b)(c) | |
| KUEHG Corp., 2024 Term Loan B, 3 mo. USD SOFR + 4.500%, 9.802%, 6/12/2030(b)(c) | |
| Learning Care Group (U.S.) No. 2 Inc., 2024 Term Loan B, 3 mo. USD SOFR + 4.000%, 9.327%, 8/11/2028(b)(c) | |
| Michael Baker International LLC, 2021 Term Loan, 1 mo. USD SOFR + 4.750%, 10.078%, 12/01/2028(c) | |
| Michael Baker Interntional LLC, 2024 Term Loan B, 12/01/2028(a) | |
See accompanying notes to financial statements.
Portfolio of Investments – as of May 31, 2024 (Unaudited)Loomis Sayles Senior Floating Rate and Fixed Income Fund (continued) | | |
| Industrial Other — continued |
| Service Logic Acquisition, Inc., Term Loan, USD SOFR + 4.000%, 9.591%, 10/29/2027(c) | |
| St. George's University Scholastic Services, 2022 Term Loan B, 1 mo. USD SOFR + 3.000%, 8.429%, 2/10/2029(c) | |
| | |
| |
| Carnival Corp., 2024 Term Loan B2, 1 mo. USD SOFR + 2.750%, 8.075%, 8/08/2027(b)(c) | |
| SeaWorld Parks & Entertainment, Inc., 2024 Term Loan B, 1 mo. USD SOFR + 2.500%, 7.829%, 8/25/2028(b)(c) | |
| | |
| |
| Hilton Grand Vacations Borrower LLC, 2024 Incremental Term Loan B, 1 mo. USD SOFR + 2.750%, 8.079%, 1/17/2031(b)(c) | |
| Hilton Grand Vacations Borrower LLC, 2021 Term Loan B, 3 mo. USD SOFR + 2.500%, 7.829%, 8/02/2028(c) | |
| Marriott Ownership Resorts, Inc., 2024 Term Loan B, 1 mo. USD SOFR + 2.250%, 7.579%, 4/01/2031(c) | |
| | |
| Media Entertainment — 7.4% |
| Advantage Sales & Marketing, Inc., 2024 Term Loan, 3 mo. USD SOFR + 4.250%, 9.818%, 10/28/2027(b)(c) | |
| AP Core Holdings II LLC, Amortization Term Loan B1, 1 mo. USD SOFR + 5.500%, 10.944%, 9/01/2027(c) | |
| AP Core Holdings II LLC, High-Yield Term Loan B2, 1 mo. USD SOFR + 5.500%, 10.944%, 9/01/2027(c) | |
| Cengage Learning, Inc., 2024 Term Loan B, 6 mo. USD SOFR + 4.250%, 9.538%, 3/22/2031(b)(c) | |
| Clear Channel Outdoor Holdings, Inc., 2024 Term Loan, 1 mo. USD SOFR + 4.000%, 9.444%, 8/23/2028(b)(c) | |
| CMG Media Corp., 2021 Term Loan, 3 mo. USD SOFR + 3.500%, 8.909%, 12/17/2026(c) | |
| Creative Artists Agency LLC, 2024 Term Loan B, 1 mo. USD SOFR + 3.250%, 8.579%, 11/27/2028(b)(c) | |
| Dotdash Meredith, Inc., Term Loan B, 1 mo. USD SOFR + 4.000%, 9.413%, 12/01/2028(c) | |
| Fleet Midco I Ltd., 2024 Term Loan B, 1 mo. USD SOFR + 3.250%, 8.579%, 2/21/2031(b)(c) | |
| Gray Television, Inc., 2021 Term Loan D, 1 mo. USD SOFR + 3.000%, 8.428%, 12/01/2028(b)(c) | |
| iHeartCommunications, Inc., 2020 Term Loan, 1 mo. USD SOFR + 3.000%, 8.444%, 5/01/2026(c) | |
| McGraw-Hill Global Education Holdings LLC, 2021 Term Loan, 1 mo. USD SOFR + 4.750%, 10.194%, 7/28/2028(c) | |
| MH Sub I LLC, 2021 2nd Lien Term Loan, 1 mo. USD SOFR + 6.250%, 11.579%, 2/23/2029(b)(c) | |
| Simon & Schuster, Inc., Term Loan B, 3 mo. USD SOFR + 4.000%, 9.330%, 10/30/2030(b)(c) | |
| Sinclair Television Group, Inc., 2022 Term Loan B4, 1 mo. USD SOFR + 3.750%, 9.179%, 4/21/2029(c) | |
| Syndigo LLC, 2020 2nd Lien Term Loan, 1 mo. USD SOFR + 8.000%, 13.435%, 12/15/2028(c) | |
| | |
| Media Entertainment — continued |
| Syndigo LLC, 2020 Term Loan, 1 mo. USD SOFR + 4.500%, 9.944%, 12/15/2027(c) | |
| Voyage Digital (NZ) Ltd., 2024 Term Loan, 3 mo. USD SOFR + 3.250%, 8.576%, 5/11/2029(b)(c) | |
| Wood Mackenzie Ltd., 2024 Term Loan B, 3 mo. USD SOFR + 3.500%, 8.823%, 2/07/2031(b)(c) | |
| | |
| |
| AL GCX Holdings LLC, Term Loan B, 5/17/2029(a) | |
| AL NGPL Holdings LLC, Term Loan B, 3 mo. USD SOFR + 3.250%, 8.556%, 4/13/2028(b)(c) | |
| GIP Pilot Acquisition Partners LP, 2024 Term Loan B, 3 mo. USD SOFR + 2.500%, 7.827%, 10/04/2030(b)(c) | |
| Oryx Midstream Services Permian Basin LLC, 2024 Term Loan B, 1 mo. USD SOFR + 3.000%, 8.436%, 10/05/2028(c) | |
| Whitewater Whistler Holdings LLC, 2023 Term Loan B, 3 mo. USD SOFR + 2.750%, 8.063%, 2/15/2030(b)(c) | |
| | |
| Oil Field Services — 0.6% |
| BANGL LLC, Term Loan B, 3 mo. USD SOFR + 4.500%, 9.798%, 2/01/2029(b)(c) | |
| Brazos Delaware II LLC, 2024 Term Loan B, 1 mo. USD SOFR + 3.500%, 8.822%, 2/11/2030(b)(c) | |
| | |
| |
| Apollo Commercial Real Estate Finance, Inc., 2021 Incremental Term Loan B1, 1 mo. USD SOFR + 3.500%, 8.944%, 3/11/2028(c) | |
| Starwood Property Trust, Inc., 2022 Term Loan B, 1 mo. USD SOFR + 3.250%, 8.579%, 11/18/2027(b)(c) | |
| | |
| |
| Anchor Packaging, Inc., 2024 Term Loan, 7/18/2029(a) | |
| Anchor Packaging, Inc., 2024 Term Loan, 1 mo. USD SOFR + 3.750%, 9.079%, 7/18/2029(b)(c) | |
| | |
| |
| Domtar Corp., 2021 Term Loan B, 1 mo. USD SOFR + 5.500%, 10.939%, 11/30/2028(c) | |
| Spa Holdings 3 Oy, USD Term Loan B, 3 mo. USD SOFR + 4.000%, 9.571%, 2/04/2028(c) | |
| | |
| |
| Bausch Health Cos., Inc., 2022 Term Loan B, 1 mo. USD SOFR + 5.250%, 10.675%, 2/01/2027(c) | |
| Jazz Financing Lux SARL, 2024 Term Loan B, 1 mo. USD SOFR + 3.000%, 8.444%, 5/05/2028(c) | |
| LSCS Holdings, Inc., 2021 1st Lien Term Loan, 1 mo. USD SOFR + 4.614%, 9.944%, 12/16/2028(b)(c) | |
| LSCS Holdings, Inc., 2021 2nd Lien Term Loan, 1 mo. USD SOFR + 8.000%, 13.444%, 12/17/2029(b)(c) | |
| | |
See accompanying notes to financial statements.
Portfolio of Investments – as of May 31, 2024 (Unaudited)Loomis Sayles Senior Floating Rate and Fixed Income Fund (continued) | | |
| Property & Casualty Insurance — 3.7% |
| Amynta Agency Borrower, Inc., 2023 1st Lien Term Loan B, 3 mo. USD SOFR + 4.250%, 9.552%, 2/28/2028(b)(c) | |
| AssuredPartners, Inc., 2024 Incremental Term Loan B5, 1 mo. USD SOFR + 3.500%, 8.829%, 2/14/2031(b)(c) | |
| Asurion LLC, 2020 Term Loan B8, 1 mo. USD SOFR + 3.250%, 8.694%, 12/23/2026(c) | |
| Asurion LLC, 2021 2nd Lien Term Loan B3, 1 mo. USD SOFR + 5.250%, 10.694%, 1/31/2028(c) | |
| Asurion LLC, 2023 Term Loan B11, 1 mo. USD SOFR + 4.250%, 9.679%, 8/19/2028(c) | |
| Baldwin Insurance Group Holdings LLC, 2024 Term Loan B, 3 mo. USD SOFR + 3.250%, 8.576%, 5/26/2031(b)(c) | |
| Broadstreet Partners, Inc., 2024 Term Loan B4, 5/09/2031(a) | |
| Howden Group Holdings Ltd., 2023 USD Term Loan B, 1 mo. USD SOFR + 4.000%, 9.329%, 4/18/2030(b)(c) | |
| Truist Insurance Holdings LLC, 1st Lien Term Loan, 3 mo. USD SOFR + 3.250%, 8.586%, 5/06/2031(b)(c) | |
| Truist Insurance Holdings LLC, 2nd Lien Term Loan, 3 mo. USD SOFR + 4.750%, 10.086%, 3/08/2032(b)(c) | |
| USI, Inc., 2024 Term Loan (2029), 11/22/2029(a) | |
| | |
| |
| 1011778 B.C. Unlimited Liability Co., 2023 Term Loan B5, 1 mo. USD SOFR + 2.250%, 7.578%, 9/20/2030(b)(c) | |
| Dave & Buster's, Inc., 2024 Term Loan B, 1 mo. USD SOFR + 3.250%, 8.625%, 6/29/2029(b)(c) | |
| Whatabrands LLC, 2024 Term Loan B, 8/03/2028(a) | |
| Whatabrands LLC, 2024 Term Loan B, 1 mo. USD SOFR + 2.750%, 8.079%, 8/03/2028(b)(c) | |
| | |
| |
| ABG Intermediate Holdings 2 LLC, 2021 Term Loan B1, 1 mo. USD SOFR + 3.500%, 8.929%, 12/21/2028(c) | |
| At Home Group, Inc., Term Loan B, 1 mo. USD SOFR + 4.250%, 9.678%, 7/24/2028(b)(c) | |
| Canada Goose, Inc., 2021 Term Loan, 1 mo. USD SOFR + 3.500%, 8.944%, 10/07/2027(b)(c) | |
| Container Store, Inc., 2020 Term Loan B3, 3 mo. USD SOFR + 5.000%, 10.571%, 1/31/2026(b)(c) | |
| CWGS Group LLC, 2021 Term Loan B, 1 mo. USD SOFR + 2.500%, 7.935%, 6/03/2028(c) | |
| Evergreen Acqco 1 LP, 2021 USD Term Loan, 3 mo. USD SOFR + 3.750%, 9.052%, 4/26/2028(b)(c) | |
| Great Outdoors Group LLC, 2021 Term Loan B1, 1 mo. USD SOFR + 3.750%, 9.194%, 3/06/2028(c) | |
| Harbor Freight Tools USA, Inc., 2021 Term Loan B, 1 mo. USD SOFR + 2.750%, 8.194%, 10/19/2027(c) | |
| International Textile Group, Inc., 2023 Last Out Term Loan, 5.500% PIK or 3 mo. USD SOFR + 1.150% Cash, 6.452%, 9/30/2027(b)(c)(f) | |
| International Textile Group, Inc., 2023 Term Loan, 3 mo. USD SOFR + 8.650%, 13.952%, 9/30/2027(b)(c) | |
| Michaels Cos., Inc., 2021 Term Loan B, 3 mo. USD SOFR + 4.250%, 9.821%, 4/15/2028(b)(c) | |
| | |
| |
| Olaplex, Inc., 2022 Term Loan, 1 mo. USD SOFR + 3.500%, 8.929%, 2/23/2029(c) | |
| Peer Holding III BV, 2023 USD Term Loan B4, 3 mo. USD SOFR + 3.250%, 8.559%, 10/28/2030(b)(c) | |
| Petco Health & Wellness Co., Inc., 2021 Term Loan B, 3 mo. USD SOFR + 3.250%, 8.821%, 3/03/2028(c) | |
| PetSmart, Inc., 2021 Term Loan B, 1 mo. USD SOFR + 3.750%, 9.179%, 2/11/2028(c) | |
| Rent-A-Center, Inc., 2021 First Lien Term Loan B, 2/17/2028(a) | |
| Restoration Hardware, Inc., 2022 Incremental Term Loan, 1 mo. USD SOFR + 3.250%, 8.679%, 10/20/2028(c) | |
| RVR Dealership Holdings LLC, Term Loan B, 1 mo. USD SOFR + 3.750%, 9.175%, 2/08/2028(b)(c) | |
| S&S Holdings LLC, Term Loan, 1 mo. USD SOFR + 5.000%, 10.421%, 3/11/2028(b)(c) | |
| Tory Burch LLC, Term Loan B, 1 mo. USD SOFR + 3.250%, 8.694%, 4/16/2028(c) | |
| Wand NewCo 3, Inc., 2024 Term Loan B, 1 mo. USD SOFR + 3.750%, 9.079%, 1/30/2031(b)(c) | |
| | |
| |
| Access CIG LLC, 2023 Term Loan, 3 mo. USD SOFR + 5.000%, 10.330%, 8/18/2028(b)(c) | |
| Altar Bidco, Inc., 2021 2nd Lien Term Loan, 3 mo. USD SOFR + 5.600%, 10.399%, 2/01/2030(b)(c) | |
| Applied Systems, Inc., 2024 2nd Lien Term Loan, 3 mo. USD SOFR + 5.250%, 10.559%, 2/23/2032(b)(c) | |
| Camelot U.S. Acquisition LLC, 2024 Term Loan B, 1 mo. USD SOFR + 2.750%, 8.079%, 1/31/2031(b)(c) | |
| Central Parent, Inc., 2024 Term Loan B, 3 mo. USD SOFR + 3.250%, 8.577%, 7/06/2029(b)(c) | |
| Corel Corp., 2019 Term Loan, 3 mo. USD SOFR + 5.000%, 10.447%, 7/02/2026(b)(c) | |
| Cornerstone OnDemand, Inc., 2021 Term Loan, 1 mo. USD SOFR + 3.750%, 9.194%, 10/16/2028(c) | |
| Cotiviti Corp., 2024 Term Loan, 6 mo. USD SOFR + 3.250%, 8.563%, 5/01/2031(b)(c) | |
| CT Technologies Intermediate Holdings, Inc., 2021 Term Loan B, 1 mo. USD SOFR + 4.250%, 9.694%, 12/16/2025(b)(c) | |
| Endure Digital, Inc., Term Loan, 1 mo. USD SOFR + 3.500%, 8.935%, 2/10/2028(c) | |
| EP Purchaser LLC, 2021 Term Loan B, 3 mo. USD SOFR + 3.500%, 9.071%, 11/06/2028(c) | |
| Fortress Intermediate 3, Inc., Term Loan B, 5/09/2031(a) | |
| Foundever Worldwide Corp., 2021 USD Term Loan, 1 mo. USD SOFR + 3.750%, 9.194%, 8/28/2028(c) | |
| Genesys Cloud Services Holdings II LLC, First Lien Term Loan B, 1 mo. USD SOFR + 3.500%, 8.829%, 12/01/2027(b)(c) | |
| Genesys Cloud Services Holdings II LLC, Term Loan B, 1 mo. USD SOFR + 3.750%, 9.194%, 12/01/2027(c) | |
| Genuine Financial Holdings LLC, 2023 Term Loan B, 9/27/2030(a) | |
| Genuine Financial Holdings LLC, 2023 Term Loan B, 1 mo. USD SOFR + 4.000%, 9.329%, 9/27/2030(b)(c) | |
| Global Client Solutions LLC, Term Loan B, 3 mo. USD SOFR + 6.000%, 11.477%, 3/16/2026(b)(c) | |
See accompanying notes to financial statements.
Portfolio of Investments – as of May 31, 2024 (Unaudited)Loomis Sayles Senior Floating Rate and Fixed Income Fund (continued) | | |
| |
| GoTo Group, Inc., 2024 First Out Term Loan, 1 mo. USD SOFR + 4.750%, 10.173%, 4/30/2028(b)(c) | |
| GoTo Group, Inc., 2024 Second Out Term Loan, 1 mo. USD SOFR + 4.750%, 10.173%, 4/30/2028(b)(c) | |
| GTCR W Merger Sub LLC, USD Term Loan B, 1 mo. USD SOFR + 3.000%, 8.309%, 1/31/2031(b)(c) | |
| Iron Mountain, Inc., 2023 Term Loan B, 1 mo. USD SOFR + 2.250%, 7.579%, 1/31/2031(b)(c) | |
| Loyalty Ventures, Inc., Term Loan B, PRIME + 5.500%, 13.750%, 11/03/2027(g) | |
| Magenta Buyer LLC, 2021 USD 1st Lien Term Loan, 3 mo. USD SOFR + 5.000%, 10.591%, 7/27/2028(b)(c) | |
| McAfee LLC, 2024 USD Term Loan B, 3/01/2029(a) | |
| MedAssets Software Intermediate Holdings, Inc., 2021 Term Loan, 3 mo. USD SOFR + 4.000%, 9.424%, 12/18/2028(c) | |
| MKS Instruments, Inc., 2023 USD Term Loan B, 1 yr. USD SOFR + 2.500%, 7.822%, 8/17/2029(b)(c) | |
| Modena Buyer LLC, Term Loan, 4/18/2031(a) | |
| Mosel Bidco SE, USD Term Loan B, 3 mo. USD SOFR + 4.750%, 10.059%, 9/16/2030(b)(c) | |
| NCR Atleos LLC, 2023 Term Loan B, 1 mo. USD SOFR + 4.750%, 10.179%, 3/27/2029(c) | |
| Neptune Bidco U.S., Inc., 2022 USD Term Loan A, 3 mo. USD SOFR + 4.750%, 10.156%, 4/11/2029(c) | |
| Neptune Bidco U.S., Inc., 2022 USD Term Loan B, 3 mo. USD SOFR + 5.000%, 10.406%, 4/11/2029(c) | |
| Nuvei Technologies Corp., USD Term Loan, 1 mo. USD SOFR + 3.000%, 8.429%, 12/19/2030(c) | |
| Open Text Corp., 2023 Term Loan B, 1 mo. USD SOFR + 2.250%, 7.579%, 1/31/2030(c) | |
| Physician Partners LLC, Term Loan, 3 mo. USD SOFR + 4.000%, 9.564%, 12/26/2028(b)(c) | |
| Press Ganey Holdings, Inc., 2024 Term Loan B, 1 mo. USD SOFR + 3.500%, 8.829%, 4/30/2031(b)(c) | |
| Project Alpha Intermediate Holding, Inc., 2024 Term Loan B, 3 mo. USD SOFR + 3.750%, 9.072%, 10/28/2030(b)(c) | |
| Quest Software U.S. Holdings, Inc., 2022 Term Loan, 3 mo. USD SOFR + 4.250%, 9.730%, 2/01/2029(c) | |
| Redstone Holdco 2 LP, 2021 Term Loan, 1 mo. USD SOFR + 4.750%, 10.194%, 4/27/2028(c) | |
| Sabre GLBL, Inc., 2022 1st Lien Term Loan B, 1 mo. USD SOFR + 5.000%, 10.429%, 6/30/2028(c) | |
| UKG, Inc., 2024 Term Loan B, 1 mo. USD SOFR + 3.250%, 8.570%, 2/10/2031(b)(c) | |
| Vision Solutions, Inc., 2021 2nd Lien Term Loan, 3 mo. USD SOFR + 7.250%, 12.841%, 4/23/2029(c) | |
| Waystar Technologies, Inc., 2024 Term Loan B, 1 mo. USD SOFR + 4.000%, 9.329%, 10/22/2029(b)(c) | |
| | |
| Transportation Services — 1.7% |
| AIT Worldwide Logistics, Inc., 2021 Term Loan, 1 mo. USD SOFR + 4.750%, 10.171%, 4/06/2028(c) | |
| Brown Group Holding LLC, 2022 Incremental Term Loan B2, 3 mo. USD SOFR + 3.000%, 8.323%, 7/02/2029(b)(c) | |
| Carriage Purchaser, Inc., 2021 Term Loan B, 1 mo. USD SOFR + 4.250%, 9.694%, 10/02/2028(b)(c) | |
| | |
| Transportation Services — continued |
| Hertz Corp., 2021 Term Loan B, 1 mo. USD SOFR + 3.250%, 8.859%, 6/30/2028(c) | |
| Hertz Corp., 2021 Term Loan C, 1 mo. USD SOFR + 3.250%, 8.859%, 6/30/2028(c) | |
| KKR Apple Bidco LLC, 2022 Incremental Term Loan, 1 mo. USD SOFR + 3.500%, 8.829%, 9/22/2028(b)(c) | |
| PODS LLC, 2021 Term Loan B, 3 mo. USD SOFR + 3.000%, 8.591%, 3/31/2028(c) | |
| St. George Warehousing & Trucking Co. of California, Inc., 2022 Term Loan, 3 mo. USD SOFR + 6.000%, 11.452%, 3/24/2028(c) | |
| | |
| |
| Altice France SA, 2023 USD Term Loan B14, 3 mo. USD SOFR + 5.500%, 10.829%, 8/15/2028(b)(c) | |
| CCI Buyer, Inc., Term Loan, 3 mo. USD SOFR + 4.000%, 9.302%, 12/17/2027(b)(c) | |
| Crown Subsea Communications Holding, Inc., 2024 Term Loan B, 3 mo. USD SOFR + 4.750%, 10.080%, 1/30/2031(b)(c) | |
| | |
| |
| Voyage Australia Pty. Ltd., USD Term Loan B, 3 mo. USD SOFR + 3.500%, 9.086%, 7/20/2028(c) | |
| Zacapa SARL, 2022 Term Loan, 3 mo. USD SOFR + 4.000%, 9.309%, 3/22/2029(b)(c) | |
| | |
| Total Senior Loans
(Identified Cost $762,120,370) | |
|
|
|
| |
| Allegiant Travel Co., 7.250%, 8/15/2027(h) | |
| |
| DISH DBS Corp., 7.750%, 7/01/2026 | |
| |
| Iris Holdings, Inc., 9.500% PIK or 8.750% Cash, 2/15/2026(h)(i) | |
| |
| Newell Brands, Inc., 6.375%, 9/15/2027 | |
| |
| NCL Corp. Ltd., 8.125%, 1/15/2029(h) | |
| Media Entertainment — 0.3% |
| Millennium Escrow Corp., 6.625%, 8/01/2026(h) | |
| |
| Starwood Property Trust, Inc., 4.375%, 1/15/2027(h) | |
| |
| Evergreen Acqco 1 LP/TVI, Inc., 9.750%, 4/26/2028(h) | |
| |
| GoTo Group, Inc., 5.500%, 5/01/2028(h) | |
| GoTo Group, Inc., 5.500%, 5/01/2028(h) | |
| | |
| Total Bonds and Notes
(Identified Cost $27,897,303) | |
See accompanying notes to financial statements.
Portfolio of Investments – as of May 31, 2024 (Unaudited)Loomis Sayles Senior Floating Rate and Fixed Income Fund (continued)
| | |
Exchange-Traded Funds — 1.5% |
| SPDR® Blackstone Senior Loan ETF | |
| SPDR® Bloomberg Short Term High Yield Bond ETF | |
| Total Exchange-Traded Funds
(Identified Cost $12,370,103) | |
|
|
|
| |
| | |
| Oil, Gas & Consumable Fuels — 0.0% |
| Ameriforge Group, Inc.(e)(j) | |
| Textiles, Apparel & Luxury Goods — 0.0% |
| Elevate Textiles Holding Corp.(e) | |
| Total Common Stocks
(Identified Cost $10,673,568) | |
|
|
|
| Elevate Textiles Holding Corp., Expiration on 6/21/2028(e)
(Identified Cost $2,333) | |
| | |
Short-Term Investments — 9.6% |
| Tri-Party Repurchase Agreement with Fixed Income Clearing Corporation, dated 5/31/2024 at 3.500% to be repurchased at $48,877,768 on 6/03/2024 collateralized by $40,656,300 U.S. Treasury Inflation Indexed Note, 0.375% due 1/15/2027 valued at $49,840,860 including accrued interest (Note 2 of Notes to Financial Statements) | |
| U.S. Treasury Bills, 5.268%, 6/25/2024(k) | |
| Total Short-Term Investments
(Identified Cost $78,259,923) | |
| Total Investments — 105.1%
(Identified Cost $891,323,600) | |
| Other assets less liabilities — (5.1)% | |
| | |
| See Note 2 of Notes to Financial Statements. |
| Principal Amount stated in U.S. dollars unless otherwise noted. |
| Position is unsettled. Contract rate was not determined at May 31, 2024 and does not take effect until settlement date. Maturity date is not finalized until settlement date. |
| Stated interest rate has been determined in accordance with the provisions of the loan agreement and is subject to a minimum benchmark floor rate which may range from 0.00% to 2.50%, to which the spread is added. |
| Variable rate security. Rate as of May 31, 2024 is disclosed. Issuers comprised of various lots with differing coupon rates have been aggregated for the purpose of presentation in the Portfolio of Investments and show a weighted average rate. Certain variable rate securities are not based on a published reference rate and spread, rather are determined by the issuer or agent and are based on current market conditions. These securities may not indicate a reference rate and/or spread in their description. |
| Unfunded loan commitment. An unfunded loan commitment is a contractual obligation for future funding at the option of the borrower. The Fund receives a stated coupon rate until the borrower draws on the loan commitment, at which time the rate will become the stated rate in the loan agreement. See Note 2 of Notes to Financial Statements. |
| Non-income producing security. |
| Payment–in–kind security for which the issuer, at each interest payment date, may make interest payments in cash and/or additional principal. For the period ended May 31, 2024, interest payments were made in principal. |
| The issuer is in default with respect to interest and/or principal payments. Income is not being accrued. |
| All or a portion of these securities are exempt from registration under Rule 144A of the Securities Act of 1933. These securities may be resold in transactions exempt from registration, normally to qualified institutional buyers. At May 31, 2024, the value of Rule 144A holdings amounted to $17,288,011 or 2.1% of net assets. |
| Payment-in-kind security for which the issuer, at each interest payment date, may make interest payments in cash and/or additional principal. For the period ended May 31, 2024, interest payments were made in cash. |
| Level 3 security. Value has been determined using significant unobservable inputs. See Note 3 of Notes to Financial Statements. |
| Interest rate represents discount rate at time of purchase; not a coupon rate. |
| |
| |
| Real Estate Investment Trusts |
| Secured Overnight Financing Rate |
| Standard & Poor's Depositary Receipt |
Industry Summary at May 31, 2024 (Unaudited)
| |
| |
| |
| |
Consumer Cyclical Services | |
| |
| |
Property & Casualty Insurance | |
| |
| |
| |
| |
Diversified Manufacturing | |
| |
| |
| |
Other Investments, less than 2% each | |
| |
| |
| |
Other assets less liabilities | |
| |
See accompanying notes to financial statements.
Portfolio of Investments – as of May 31, 2024 (Unaudited)Vaughan Nelson Select Fund
| | |
Common Stocks — 97.3% of Net Assets |
| |
| | |
| |
| | |
| |
| Intercontinental Exchange, Inc. | |
| |
| | |
| | |
| | |
| |
| | |
| Financial Services — 3.9% |
| Berkshire Hathaway, Inc., Class B(a) | |
| Ground Transportation — 6.2% |
| | |
| | |
| | |
| Health Care Equipment & Supplies — 3.7% |
| | |
| Hotels, Restaurants & Leisure — 2.0% |
| DoorDash, Inc., Class A(a) | |
| |
| Kinsale Capital Group, Inc. | |
| Interactive Media & Services — 6.1% |
| Alphabet, Inc., Class A(a) | |
| |
| Snowflake, Inc., Class A(a) | |
| Life Sciences Tools & Services — 5.0% |
| | |
| Oil, Gas & Consumable Fuels — 4.7% |
| Antero Resources Corp.(a) | |
| | |
| | |
| Personal Care Products — 2.7% |
| Estee Lauder Cos., Inc., Class A | |
| |
| | |
| Semiconductors & Semiconductor Equipment — 15.6% |
| Monolithic Power Systems, Inc. | |
| | |
| ON Semiconductor Corp.(a) | |
| | |
| |
| | |
| | |
| | |
| | |
| |
| O'Reilly Automotive, Inc.(a) | |
| Total Common Stocks
(Identified Cost $608,102,010) | |
| | |
Short-Term Investments — 3.0% |
| Tri-Party Repurchase Agreement with Fixed Income Clearing Corporation, dated 5/31/2024 at 3.500% to be repurchased at $23,208,530 on 6/03/2024 collateralized by $23,771,300 U.S. Treasury Note, 4.000% due 1/15/2027 valued at $23,665,844 including accrued interest (Note 2 of Notes to Financial Statements)
(Identified Cost $23,201,763) | |
| Total Investments — 100.3%
(Identified Cost $631,303,773) | |
| Other assets less liabilities — (0.3)% | |
| | |
| See Note 2 of Notes to Financial Statements. |
| Non-income producing security. |
Industry Summary at May 31, 2024 (Unaudited)
Semiconductors & Semiconductor Equipment | |
| |
| |
Interactive Media & Services | |
| |
| |
| |
Life Sciences Tools & Services | |
Oil, Gas & Consumable Fuels | |
| |
| |
| |
Health Care Equipment & Supplies | |
| |
| |
| |
| |
| |
Hotels, Restaurants & Leisure | |
| |
| |
Other assets less liabilities | |
| |
See accompanying notes to financial statements.
Statements of Assets and Liabilities
| Loomis Sayles
Global Growth
Fund | Loomis Sayles
Senior Floating
Rate and Fixed
Income Fund | Vaughan Nelson
Select Fund |
| | | |
| | | |
Net unrealized appreciation (depreciation) | | | |
| | | |
| | | |
Foreign currency at value (identified cost $24,313, $0 and $0, respectively) | | | |
Receivable for Fund shares sold | | | |
Receivable for securities sold | | | |
Dividends and interest receivable | | | |
| | | |
Prepaid expenses (Note 8) | | | |
| | | |
| | | |
Payable for securities purchased | | | |
Unfunded loan commitments (Note 2) | | | |
Payable for Fund shares redeemed | | | |
| | | |
Management fees payable (Note 5) | | | |
Deferred Trustees’ fees (Note 5) | | | |
Administrative fees payable (Note 5) | | | |
Payable to distributor (Note 5d) | | | |
Audit and tax services fees payable | | | |
Other accounts payable and accrued expenses | | | |
| | | |
COMMITMENTS AND CONTINGENCIES(a) | | | |
| | | |
| | | |
| | | |
Accumulated earnings (loss) | | | |
| | | |
COMPUTATION OF NET ASSET VALUE AND OFFERING PRICE: | | | |
| | | |
| | | |
Shares of beneficial interest | | | |
Net asset value and redemption price per share | | | |
Offering price per share (100/[100-maximum sales charge] of net asset value) (Note 1) | | | |
Class C shares: (redemption price per share is equal to net asset value less any applicable contingent deferred sales charge) (Note 1) | | | |
| | | |
Shares of beneficial interest | | | |
Net asset value and offering price per share | | | |
| | | |
| | | |
Shares of beneficial interest | | | |
Net asset value, offering and redemption price per share | | | |
| | | |
| | | |
Shares of beneficial interest | | | |
Net asset value, offering and redemption price per share | | | |
| As disclosed in the Notes to Financial Statements, if applicable. |
See accompanying notes to financial statements.
For the Six Months Ended May 31, 2024 (Unaudited)
| Loomis Sayles
Global Growth
Fund | Loomis Sayles
Senior Floating
Rate and Fixed
Income Fund | Vaughan Nelson
Select Fund |
| | | |
| | | |
| | | |
Less net foreign taxes withheld | | | |
| | | |
| | | |
| | | |
Service and distribution fees (Note 5) | | | |
Administrative fees (Note 5) | | | |
Trustees' fees and expenses (Note 5) | | | |
Transfer agent fees and expenses (Notes 5, 6 and 7) | | | |
Audit and tax services fees | | | |
Custodian fees and expenses | | | |
| | | |
| | | |
Shareholder reporting expenses | | | |
| | | |
| | | |
Less waiver and/or expense reimbursement (Note 5) | | | |
Less expense offset (Note 7) | | | |
| | | |
Net investment income (loss) | | | |
Net realized and unrealized gain (loss) on Investments and Foreign currency transactions | | | |
Net realized gain (loss) on: | | | |
| | | |
Foreign currency transactions (Note 2c) | | | |
Net change in unrealized appreciation (depreciation) on: | | | |
| | | |
Foreign currency translations (Note 2c) | | | |
Net realized and unrealized gain on Investments and Foreign currency transactions | | | |
NET INCREASE IN NET ASSETS RESULTING FROM OPERATIONS | | | |
See accompanying notes to financial statements.
Statements of Changes in Net Assets
| Loomis Sayles Global
Growth Fund | Loomis Sayles Senior Floating
Rate and Fixed Income Fund |
| Six Months Ended
May 31,2024
(Unaudited) | Year Ended
November 30,2023 | Six Months Ended
May 31,2024
(Unaudited) | Year Ended
November 30,2023 |
| | | | |
Net investment income (loss) | | | | |
Net realized gain (loss) on investments and foreign currency transactions | | | | |
Net change in unrealized appreciation on investments and foreign currency translations | | | | |
Net increase in net assets resulting from operations | | | | |
FROM DISTRIBUTIONS TO SHAREHOLDERS: | | | | |
| | | | |
| | | | |
| | | | |
| | | | |
| | | | |
NET DECREASE IN NET ASSETS
FROM CAPITAL SHARES TRANSACTIONS
(Note 11) | | | | |
Net increase (decrease) in net assets | | | | |
| | | | |
| | | | |
| | | | |
See accompanying notes to financial statements.
Statements of Changes in Net Assets (continued)
| Vaughan Nelson Select Fund |
| Six Months Ended
May 31,2024
(Unaudited) | Year Ended
November 30,2023 |
| | |
Net investment income (loss) | | |
Net realized gain (loss) on investments | | |
Net change in unrealized appreciation on investments | | |
Net increase in net assets resulting from operations | | |
FROM DISTRIBUTIONS TO SHAREHOLDERS: | | |
| | |
| | |
| | |
| | |
| | |
NET INCREASE IN NET ASSETS
FROM CAPITAL SHARES TRANSACTIONS
(Note 11) | | |
Net increase in net assets | | |
| | |
| | |
| | |
See accompanying notes to financial statements.
For a share outstanding throughout each period.
| Loomis Sayles Global Growth Fund—Class A |
| Six Months
Ended
May 31,
2024
(Unaudited) | Year Ended
November 30,
2023 | Year Ended
November 30,
2022 | Year Ended
November 30,
2021 | Year Ended
November 30,
2020 | Year Ended
November 30,
2019 |
Net asset value, beginning of the period | | | | | | |
INCOME (LOSS) FROM INVESTMENT OPERATIONS: | | | | | | |
Net investment income (loss)(a) | | | | | | |
Net realized and unrealized gain (loss) | | | | | | |
Total from Investment Operations | | | | | | |
| | | | | | |
| | | | | | |
Net realized capital gains | | | | | | |
| | | | | | |
Net asset value, end of the period | | | | | | |
| | | | | | |
RATIOS TO AVERAGE NET ASSETS: | | | | | | |
Net assets, end of the period (000's) | | | | | | |
| | | | | | |
| | | | | | |
Net investment income (loss) | | | | | | |
| | | | | | |
| Per share net investment income (loss) has been calculated using the average shares outstanding during the period. |
| Amount rounds to less than $0.01 per share. |
| A sales charge for Class A shares is not reflected in total return calculations. |
| Had certain expenses not been waived/reimbursed during the period, total returns would have been lower. |
| Periods less than one year are not annualized. |
| The investment adviser agreed to waive its fees and/or reimburse a portion of the Fund’s expenses during the period. Without this waiver/reimbursement, expenses would have been higher. |
| Computed on an annualized basis for periods less than one year. |
| Includes interest expense. Without this expense the ratio of net expenses would have been 1.20% and the ratio of gross expenses would have been 1.37%. |
| Effective December 15, 2020, the expense limit decreased from 1.25% to 1.20%. |
| Effective July 1, 2019, the expense limit decreased from 1.30% to 1.25%. |
| Includes transfer agent fees and expenses before expense offset. Without these expenses the ratio of gross expenses would have been 1.41%. See Note 7 of Notes to Financial Statements. |
See accompanying notes to financial statements.
Financial Highlights (continued)
For a share outstanding throughout each period.
| Loomis Sayles Global Growth Fund—Class C |
| Six Months
Ended
May 31,
2024
(Unaudited) | Year Ended
November 30,
2023 | Year Ended
November 30,
2022 | Year Ended
November 30,
2021 | Year Ended
November 30,
2020 | Year Ended
November 30,
2019 |
Net asset value, beginning of the period | | | | | | |
INCOME (LOSS) FROM INVESTMENT OPERATIONS: | | | | | | |
| | | | | | |
Net realized and unrealized gain (loss) | | | | | | |
Total from Investment Operations | | | | | | |
| | | | | | |
| | | | | | |
Net realized capital gains | | | | | | |
| | | | | | |
Net asset value, end of the period | | | | | | |
| | | | | | |
RATIOS TO AVERAGE NET ASSETS: | | | | | | |
Net assets, end of the period (000's) | | | | | | |
| | | | | | |
| | | | | | |
| | | | | | |
| | | | | | |
| Per share net investment loss has been calculated using the average shares outstanding during the period. |
| Amount rounds to less than $0.01 per share. |
| A contingent deferred sales charge for Class C shares is not reflected in total return calculations. |
| Had certain expenses not been waived/reimbursed during the period, total returns would have been lower. |
| Periods less than one year are not annualized. |
| The investment adviser agreed to waive its fees and/or reimburse a portion of the Fund’s expenses during the period. Without this waiver/reimbursement, expenses would have been higher. |
| Computed on an annualized basis for periods less than one year. |
| Includes interest expense. Without this expense the ratio of net expenses would have been 1.95% and the ratio of gross expenses would have been 2.13%. |
| Effective December 15, 2020, the expense limit decreased from 2.00% to 1.95%. |
| Effective July 1, 2019, the expense limit decreased from 2.05% to 2.00%. |
See accompanying notes to financial statements.
Financial Highlights (continued)
For a share outstanding throughout each period.
| Loomis Sayles Global Growth Fund—Class N |
| Six Months
Ended
May 31,
2024
(Unaudited) | Year Ended
November 30,
2023 | Year Ended
November 30,
2022 | Year Ended
November 30,
2021 | Year Ended
November 30,
2020 | Year Ended
November 30,
2019 |
Net asset value, beginning of the period | | | | | | |
INCOME (LOSS) FROM INVESTMENT OPERATIONS: | | | | | | |
Net investment income (loss)(a) | | | | | | |
Net realized and unrealized gain (loss) | | | | | | |
Total from Investment Operations | | | | | | |
| | | | | | |
| | | | | | |
Net realized capital gains | | | | | | |
| | | | | | |
Net asset value, end of the period | | | | | | |
| | | | | | |
RATIOS TO AVERAGE NET ASSETS: | | | | | | |
Net assets, end of the period (000's) | | | | | | |
| | | | | | |
| | | | | | |
Net investment income (loss) | | | | | | |
| | | | | | |
| Per share net investment income (loss) has been calculated using the average shares outstanding during the period. |
| Amount rounds to less than $0.01 per share. |
| Had certain expenses not been waived/reimbursed during the period, total returns would have been lower. |
| Periods less than one year are not annualized. |
| The investment adviser agreed to waive its fees and/or reimburse a portion of the Fund’s expenses during the period. Without this waiver/reimbursement, expenses would have been higher. |
| Computed on an annualized basis for periods less than one year. |
| Includes interest expense. Without this expense the ratio of net expenses would have been 0.90% and the ratio of gross expenses would have been 1.05%. |
| Effective December 15, 2020, the expense limit decreased from 0.95% to 0.90%. |
| Effective July 1, 2019, the expense limit decreased from 1.00% to 0.95%. |
See accompanying notes to financial statements.
Financial Highlights (continued)
For a share outstanding throughout each period.
| Loomis Sayles Global Growth Fund—Class Y |
| Six Months
Ended
May 31,
2024
(Unaudited) | Year Ended
November 30,
2023 | Year Ended
November 30,
2022 | Year Ended
November 30,
2021 | Year Ended
November 30,
2020 | Year Ended
November 30,
2019 |
Net asset value, beginning of the period | | | | | | |
INCOME (LOSS) FROM INVESTMENT OPERATIONS: | | | | | | |
Net investment income (loss)(a) | | | | | | |
Net realized and unrealized gain (loss) | | | | | | |
Total from Investment Operations | | | | | | |
| | | | | | |
| | | | | | |
Net realized capital gains | | | | | | |
| | | | | | |
Net asset value, end of the period | | | | | | |
| | | | | | |
RATIOS TO AVERAGE NET ASSETS: | | | | | | |
Net assets, end of the period (000's) | | | | | | |
| | | | | | |
| | | | | | |
Net investment income (loss) | | | | | | |
| | | | | | |
| Per share net investment income (loss) has been calculated using the average shares outstanding during the period. |
| Had certain expenses not been waived/reimbursed during the period, total returns would have been lower. |
| Periods less than one year are not annualized. |
| The investment adviser agreed to waive its fees and/or reimburse a portion of the Fund’s expenses during the period. Without this waiver/reimbursement, expenses would have been higher. |
| Computed on an annualized basis for periods less than one year. |
| Includes interest expense. Without this expense the ratio of net expenses would have been 0.95% and the ratio of gross expenses would have been 1.13%. |
| Effective December 15, 2020, the expense limit decreased from 1.00% to 0.95%. |
| Effective July 1, 2019, the expense limit decreased from 1.05% to 1.00%. |
See accompanying notes to financial statements.
Financial Highlights (continued)
For a share outstanding throughout each period.
| Loomis Sayles Senior Floating Rate and Fixed Income Fund—Class A |
| Six Months
Ended
May 31,
2024
(Unaudited) | Year Ended
November 30,
2023 | Year Ended
November 30,
2022 | Year Ended
November 30,
2021 | Year Ended
November 30,
2020 | Year Ended
November 30,
2019 |
Net asset value, beginning of the period | | | | | | |
INCOME (LOSS) FROM INVESTMENT OPERATIONS: | | | | | | |
| | | | | | |
Net realized and unrealized gain (loss) | | | | | | |
Total from Investment Operations | | | | | | |
| | | | | | |
| | | | | | |
Net asset value, end of the period | | | | | | |
| | | | | | |
RATIOS TO AVERAGE NET ASSETS: | | | | | | |
Net assets, end of the period (000's) | | | | | | |
| | | | | | |
| | | | | | |
| | | | | | |
| | | | | | |
| Per share net investment income has been calculated using the average shares outstanding during the period. |
| A sales charge for Class A shares is not reflected in total return calculations. |
| Had certain expenses not been waived/reimbursed during the period, total returns would have been lower. |
| Periods less than one year are not annualized. |
| The investment adviser agreed to waive its fees and/or reimburse a portion of the Fund’s expenses during the period. Without this waiver/reimbursement, expenses would have been higher. |
| Computed on an annualized basis for periods less than one year. |
| Effective July 1, 2023, the expense limit decreased from 1.05% to 1.00%. |
| Includes interest expense. Without this expense the ratio of net expenses would have been 1.05% and the ratio of gross expenses would have been 1.18%. |
| Includes interest expense. Without this expense the ratio of net expenses would have been 1.05% and the ratio of gross expenses would have been 1.08%. |
See accompanying notes to financial statements.
Financial Highlights (continued)
For a share outstanding throughout each period.
| Loomis Sayles Senior Floating Rate and Fixed Income Fund—Class C |
| Six Months
Ended
May 31,
2024
(Unaudited) | Year Ended
November 30,
2023 | Year Ended
November 30,
2022 | Year Ended
November 30,
2021 | Year Ended
November 30,
2020 | Year Ended
November 30,
2019 |
Net asset value, beginning of the period | | | | | | |
INCOME (LOSS) FROM INVESTMENT OPERATIONS: | | | | | | |
| | | | | | |
Net realized and unrealized gain (loss) | | | | | | |
Total from Investment Operations | | | | | | |
| | | | | | |
| | | | | | |
Net asset value, end of the period | | | | | | |
| | | | | | |
RATIOS TO AVERAGE NET ASSETS: | | | | | | |
Net assets, end of the period (000's) | | | | | | |
| | | | | | |
| | | | | | |
| | | | | | |
| | | | | | |
| Per share net investment income has been calculated using the average shares outstanding during the period. |
| A contingent deferred sales charge for Class C shares is not reflected in total return calculations. |
| Had certain expenses not been waived/reimbursed during the period, total returns would have been lower. |
| Periods less than one year are not annualized. |
| The investment adviser agreed to waive its fees and/or reimburse a portion of the Fund’s expenses during the period. Without this waiver/reimbursement, expenses would have been higher. |
| Computed on an annualized basis for periods less than one year. |
| Effective July 1, 2023, the expense limit decreased from 1.80% to 1.75%. |
| Includes interest expense. Without this expense the ratio of net expenses would have been 1.80% and the ratio of gross expenses would have been 1.93%. |
| Includes interest expense. Without this expense the ratio of net expenses would have been 1.80% and the ratio of gross expenses would have been 1.83%. |
See accompanying notes to financial statements.
Financial Highlights (continued)
For a share outstanding throughout each period.
| Loomis Sayles Senior Floating Rate and Fixed Income Fund—Class N |
| Six Months
Ended
May 31,
2024
(Unaudited) | Year Ended
November 30,
2023 | Year Ended
November 30,
2022 | Year Ended
November 30,
2021 | Year Ended
November 30,
2020 | Year Ended
November 30,
2019 |
Net asset value, beginning of the period | | | | | | |
INCOME (LOSS) FROM INVESTMENT OPERATIONS: | | | | | | |
| | | | | | |
Net realized and unrealized gain (loss) | | | | | | |
Total from Investment Operations | | | | | | |
| | | | | | |
| | | | | | |
Net asset value, end of the period | | | | | | |
| | | | | | |
RATIOS TO AVERAGE NET ASSETS: | | | | | | |
Net assets, end of the period (000's) | | | | | | |
| | | | | | |
| | | | | | |
| | | | | | |
| | | | | | |
| Per share net investment income has been calculated using the average shares outstanding during the period. |
| Had certain expenses not been waived/reimbursed during the period, total returns would have been lower. |
| Periods less than one year are not annualized. |
| The investment adviser agreed to waive its fees and/or reimburse a portion of the Fund’s expenses during the period. Without this waiver/reimbursement, expenses would have been higher. |
| Computed on an annualized basis for periods less than one year. |
| Effective July 1, 2023, the expense limit decreased from 0.75% to 0.70%. |
| Includes interest expense. Without this expense the ratio of net expenses would have been 0.75% and the ratio of gross expenses would have been 1.22%. |
| Includes interest expense. Without this expense the ratio of net expenses would have been 0.75% and the ratio of gross expenses would have been 1.09%. |
See accompanying notes to financial statements.
Financial Highlights (continued)
For a share outstanding throughout each period.
| Loomis Sayles Senior Floating Rate and Fixed Income Fund—Class Y |
| Six Months
Ended
May 31,
2024
(Unaudited) | Year Ended
November 30,
2023 | Year Ended
November 30,
2022 | Year Ended
November 30,
2021 | Year Ended
November 30,
2020 | Year Ended
November 30,
2019 |
Net asset value, beginning of the period | | | | | | |
INCOME (LOSS) FROM INVESTMENT OPERATIONS: | | | | | | |
| | | | | | |
Net realized and unrealized gain (loss) | | | | | | |
Total from Investment Operations | | | | | | |
| | | | | | |
| | | | | | |
Net asset value, end of the period | | | | | | |
| | | | | | |
RATIOS TO AVERAGE NET ASSETS: | | | | | | |
Net assets, end of the period (000's) | | | | | | |
| | | | | | |
| | | | | | |
| | | | | | |
| | | | | | |
| Per share net investment income has been calculated using the average shares outstanding during the period. |
| Had certain expenses not been waived/reimbursed during the period, total returns would have been lower. |
| Periods less than one year are not annualized. |
| The investment adviser agreed to waive its fees and/or reimburse a portion of the Fund’s expenses during the period. Without this waiver/reimbursement, expenses would have been higher. |
| Computed on an annualized basis for periods less than one year. |
| Effective July 1, 2023, the expense limit decreased from 0.80% to 0.75%. |
| Includes interest expense. Without this expense the ratio of net expenses would have been 0.80% and the ratio of gross expenses would have been 0.93%. |
| Includes interest expense. Without this expense the ratio of net expenses would have been 0.80% and the ratio of gross expenses would have been 0.83%. |
See accompanying notes to financial statements.
Financial Highlights (continued)
For a share outstanding throughout each period.
| Vaughan Nelson Select Fund—Class A |
| Six Months
Ended
May 31,
2024
(Unaudited) | Year Ended
November 30,
2023 | Year Ended
November 30,
2022 | Year Ended
November 30,
2021 | Year Ended
November 30,
2020 | Year Ended
November 30,
2019 |
Net asset value, beginning of the period | | | | | | |
INCOME (LOSS) FROM INVESTMENT OPERATIONS: | | | | | | |
Net investment income (loss)(a) | | | | | | |
Net realized and unrealized gain (loss) | | | | | | |
Total from Investment Operations | | | | | | |
| | | | | | |
| | | | | | |
Net realized capital gains | | | | | | |
| | | | | | |
Net asset value, end of the period | | | | | | |
| | | | | | |
RATIOS TO AVERAGE NET ASSETS: | | | | | | |
Net assets, end of the period (000's) | | | | | | |
| | | | | | |
| | | | | | |
Net investment income (loss) | | | | | | |
| | | | | | |
| Per share net investment income (loss) has been calculated using the average shares outstanding during the period. |
| Amount rounds to less than $0.01 per share. |
| Includes a non-recurring dividend. Without this dividend, net investment loss per share would have been $(0.06), total return would have been 40.82% and the ratio of net investment loss to average net assets would have been (0.25)%. |
| A sales charge for Class A shares is not reflected in total return calculations. |
| Had certain expenses not been waived/reimbursed during the period, total returns would have been lower. |
| Periods less than one year are not annualized. |
| The investment adviser agreed to waive its fees and/or reimburse a portion of the Fund’s expenses during the period. Without this waiver/reimbursement, expenses would have been higher. |
| Computed on an annualized basis for periods less than one year. |
| Includes additional voluntary waiver of advisory fee of 0.01%. |
| Effective July 1, 2021, the expense limit decreased from 1.15% to 1.10%. |
| Includes additional voluntary waiver of advisory fee of 0.03%. |
| Effective July 1, 2019, the expense limit decreased from 1.20% to 1.15%. |
| Includes transfer agent fees and expenses before expense offset. Without these expenses the ratio of gross expenses would have been 1.13%. See Note 7 of Notes to Financial Statements. |
See accompanying notes to financial statements.
Financial Highlights (continued)
For a share outstanding throughout each period.
| Vaughan Nelson Select Fund—Class C |
| Six Months
Ended
May 31,
2024
(Unaudited) | Year Ended
November 30,
2023 | Year Ended
November 30,
2022 | Year Ended
November 30,
2021 | Year Ended
November 30,
2020 | Year Ended
November 30,
2019 |
Net asset value, beginning of the period | | | | | | |
INCOME (LOSS) FROM INVESTMENT OPERATIONS: | | | | | | |
Net investment income (loss)(a) | | | | | | |
Net realized and unrealized gain (loss) | | | | | | |
Total from Investment Operations | | | | | | |
| | | | | | |
Net realized capital gains | | | | | | |
Net asset value, end of the period | | | | | | |
| | | | | | |
RATIOS TO AVERAGE NET ASSETS: | | | | | | |
Net assets, end of the period (000's) | | | | | | |
| | | | | | |
| | | | | | |
Net investment income (loss) | | | | | | |
| | | | | | |
| Per share net investment income (loss) has been calculated using the average shares outstanding during the period. |
| Includes a non-recurring dividend. Without this dividend, net investment loss per share would have been $(0.21), total return would have been 39.76% and the ratio of net investment loss to average net assets would have been (1.00)%. |
| A contingent deferred sales charge for Class C shares is not reflected in total return calculations. |
| Had certain expenses not been waived/reimbursed during the period, total returns would have been lower. |
| Periods less than one year are not annualized. |
| The investment adviser agreed to waive its fees and/or reimburse a portion of the Fund’s expenses during the period. Without this waiver/reimbursement, expenses would have been higher. |
| Computed on an annualized basis for periods less than one year. |
| Includes additional voluntary waiver of advisory fee of 0.01%. |
| Effective July 1, 2021, the expense limit decreased from 1.90% to 1.85%. |
| Includes additional voluntary waiver of advisory fee of 0.03%. |
| Effective July 1, 2019, the expense limit decreased from 1.95% to 1.90%. |
| Includes transfer agent fees and expenses before expense offset. Without these expenses the ratio of gross expenses would have been 1.88%. See Note 7 of Notes to Financial Statements. |
See accompanying notes to financial statements.
Financial Highlights (continued)
For a share outstanding throughout each period.
| Vaughan Nelson Select Fund—Class N |
| Six Months
Ended
May 31,
2024
(Unaudited) | Year Ended
November 30,
2023 | Year Ended
November 30,
2022 | Year Ended
November 30,
2021 | Year Ended
November 30,
2020 | Year Ended
November 30,
2019 |
Net asset value, beginning of the period | | | | | | |
INCOME (LOSS) FROM INVESTMENT OPERATIONS: | | | | | | |
Net investment income (loss)(a) | | | | | | |
Net realized and unrealized gain (loss) | | | | | | |
Total from Investment Operations | | | | | | |
| | | | | | |
| | | | | | |
Net realized capital gains | | | | | | |
| | | | | | |
Net asset value, end of the period | | | | | | |
| | | | | | |
RATIOS TO AVERAGE NET ASSETS: | | | | | | |
Net assets, end of the period (000's) | | | | | | |
| | | | | | |
| | | | | | |
Net investment income (loss) | | | | | | |
| | | | | | |
| Per share net investment income (loss) has been calculated using the average shares outstanding during the period. |
| Includes a non-recurring dividend. Without this dividend, net investment income per share would have been $0.01, total return would have been 41.24% and the ratio of net investment income to average net assets would have been 0.02%. |
| Had certain expenses not been waived/reimbursed during the period, total returns would have been lower. |
| Periods less than one year are not annualized. |
| The investment adviser agreed to waive its fees and/or reimburse a portion of the Fund’s expenses during the period. Without this waiver/reimbursement, expenses would have been higher. |
| Computed on an annualized basis for periods less than one year. |
| Effective July 1, 2021, the expense limit decreased from 0.85% to 0.80%. |
| Effective July 1, 2019, the expense limit decreased from 0.90% to 0.85%. |
| Includes transfer agent fees and expenses before expense offset. Without these expenses the ratio of gross expenses would have been 1.38%. See Note 7 of Notes to Financial Statements. |
See accompanying notes to financial statements.
Financial Highlights (continued)
For a share outstanding throughout each period.
| Vaughan Nelson Select Fund—Class Y |
| Six Months
Ended
May 31,
2024
(Unaudited) | Year Ended
November 30,
2023 | Year Ended
November 30,
2022 | Year Ended
November 30,
2021 | Year Ended
November 30,
2020 | Year Ended
November 30,
2019 |
Net asset value, beginning of the period | | | | | | |
INCOME (LOSS) FROM INVESTMENT OPERATIONS: | | | | | | |
Net investment income (loss)(a) | | | | | | |
Net realized and unrealized gain (loss) | | | | | | |
Total from Investment Operations | | | | | | |
| | | | | | |
| | | | | | |
Net realized capital gains | | | | | | |
| | | | | | |
Net asset value, end of the period | | | | | | |
| | | | | | |
RATIOS TO AVERAGE NET ASSETS: | | | | | | |
Net assets, end of the period (000's) | | | | | | |
| | | | | | |
| | | | | | |
Net investment income (loss) | | | | | | |
| | | | | | |
| Per share net investment income (loss) has been calculated using the average shares outstanding during the period. |
| Includes a non-recurring dividend. Without this dividend, net investment loss per share would have been less than $(0.01), total return would have been 41.17% and the ratio of net investment loss to average net assets would have been less than (0.01)%. |
| Had certain expenses not been waived/reimbursed during the period, total returns would have been lower. |
| Periods less than one year are not annualized. |
| The investment adviser agreed to waive its fees and/or reimburse a portion of the Fund’s expenses during the period. Without this waiver/reimbursement, expenses would have been higher. |
| Computed on an annualized basis for periods less than one year. |
| Includes additional voluntary waiver of advisory fee of 0.01%. |
| Effective July 1, 2021, the expense limit decreased from 0.90% to 0.85%. |
| Includes additional voluntary waiver of advisory fee of 0.03%. |
| Effective July 1, 2019, the expense limit decreased from 0.95% to 0.90%. |
See accompanying notes to financial statements.
Notes to Financial Statements
1.Organization. Natixis Funds Trust II (the “Trust”) is organized as a Massachusetts business trust. The Trust is registered under the Investment Company Act of 1940, as amended (the “1940 Act”), as an open-end management investment company. The Declaration of Trust permits the Board of Trustees to authorize the issuance of an unlimited number of shares of the Trust in multiple series. The financial statements for certain funds of the Trust are presented in separate reports. The following funds (individually, a “Fund” and collectively, the “Funds”) are included in this report:
Loomis Sayles Global Growth Fund (“Global Growth Fund”)
Loomis Sayles Senior Floating Rate and Fixed Income Fund (“Senior Floating Rate and Fixed Income Fund”)
Vaughan Nelson Select Fund (“Select Fund”)
Global Growth Fund and Senior Floating Rate and Fixed Income Fund are diversified investment companies. Select Fund is a non-diversified investment company.
Each Fund offers Class A, Class C, Class N and Class Y shares. Class A shares are sold with a maximum front-end sales charge of 5.75% for Global Growth Fund and Select Fund and 3.50% for Senior Floating Rate and Fixed Income Fund. Class C shares do not pay a front-end sales charge, pay higher Rule 12b-1 fees than Class A shares for eight years (at which point they automatically convert to Class A shares) (prior to May 1, 2021, Class C shares automatically converted to Class A shares after ten years) and may be subject to a contingent deferred sales charge (“CDSC”) of 1.00% if those shares are redeemed within one year of acquisition, except for reinvested distributions. Class N and Class Y shares do not pay a front-end sales charge, a CDSC or Rule 12b-1 fees. Class N shares are offered with an initial minimum investment of $1,000,000. Class Y shares are offered with an initial minimum investment of $100,000. Certain categories of investors are exempted from the minimum investment amounts for Class N and Class Y as outlined in the relevant Fund’s prospectus.
Most expenses can be directly attributed to a Fund. Expenses which cannot be directly attributed to a Fund are generally apportioned based on the relative net assets of each of the Funds in Natixis Funds Trust I, Natixis Funds Trust II, Natixis Funds Trust IV and Gateway Trust (“Natixis Funds Trusts”), Loomis Sayles Funds I and Loomis Sayles Funds II (“Loomis Sayles Funds Trusts”) and Natixis ETF Trust and Natixis ETF Trust II (“Natixis ETF Trusts”). Expenses of a Fund are borne pro rata by the holders of each class of shares, except that each class bears expenses unique to that class (such as the Rule 12b-1 fees applicable to Class A and Class C), and transfer agent fees are borne collectively for Class A, Class C and Class Y, and individually for Class N. In addition, each class votes as a class only with respect to its own Rule 12b-1 Plan. Shares of each class would receive their pro rata share of the net assets of a Fund if the Fund were liquidated. The Trustees approve separate distributions from net investment income on each class of shares.
2.Significant Accounting Policies. The following is a summary of significant accounting policies consistently followed by each Fund in the preparation of its financial statements. The Funds' financial statements follow the accounting and reporting guidelines provided for investment companies and are prepared in accordance with accounting principles generally accepted in the United States of America which require the use of management estimates that affect the reported amounts and disclosures in the financial statements. Actual results could differ from those estimates. Management has evaluated the events and transactions subsequent to period-end through the date the financial statements were issued and has determined that there were no material events that would require disclosure in the Funds' financial statements.
a. Valuation. Registered investment companies are required to value portfolio investments using an unadjusted, readily available market quotation. Each Fund obtains readily available market quotations from independent pricing services. Fund investments for which readily available market quotations are not available are priced at fair value pursuant to the Funds’ Valuation Procedures. The Board of Trustees has approved a valuation designee who is subject to the Board’s oversight.
Unadjusted readily available market quotations that are utilized for exchange traded equity securities (including shares of closed-end investment companies and exchange-traded funds) include the last sale price quoted on the exchange where the security is traded most extensively. Shares of open-end investment companies are valued at net asset value ("NAV") per share.
Exchange traded equity securities for which there is no reported sale during the day are fair valued at the closing bid quotation as reported by an independent pricing service. Unlisted equity securities (except unlisted preferred equity securities) are fair valued at the last sale price quoted in the market where they are traded most extensively or, if there is no reported sale during the day, the closing bid quotation as reported by an independent pricing service. If there is no last sale price or closing bid quotation available, unlisted equity securities will be fair valued using evaluated bids furnished by an independent pricing service, if available.
Debt securities and unlisted preferred equity securities are fair valued based on evaluated bids furnished to the Funds by an independent pricing service or bid prices obtained from broker-dealers. Senior loans and collateralized loan obligations ("CLOs") are fair valued at bid prices supplied by an independent pricing service, if available. Broker-dealer bid prices may be used to fair value
Notes to Financial Statements (continued)
debt, unlisted equities, senior loans and CLOs where an independent pricing service is unable to price an investment or where an independent pricing service does not provide a reliable price for the investment.
The Funds may also fair value investments in other circumstances such as when extraordinary events occur after the close of a foreign market, but prior to the close of the New York Stock Exchange. This may include situations relating to a single issuer (such as a declaration of bankruptcy or a delisting of the issuer’s security from the primary market on which it has traded) as well as events affecting the securities markets in general (such as market disruptions or closings and significant fluctuations in U.S. and/or foreign markets). When fair valuing a Fund’s investments, the valuation designee may, among other things, use modeling tools or other processes that may take into account factors such as issuer specific information, or other related market activity and/or information that occurred after the close of the foreign market but before the time the Fund’s NAV is calculated. Fair valuation by the Fund(s) valuation designee may require subjective determinations about the value of the investment, and fair values used to determine a Fund’s NAV may differ from quoted or published prices, or from prices that are used by others, for the same investments. In addition, the use of fair value pricing may not always result in adjustments to the prices of investments held by a Fund.
b. Investment Transactions and Related Investment Income. Investment transactions are accounted for on a trade date plus one day basis for daily NAV calculation. However, for financial reporting purposes, investment transactions are reported on trade date. Dividend income (including income reinvested) and foreign withholding tax, if applicable, are recorded on the ex-dividend date, or in the case of certain foreign securities, as soon as a Fund is notified, and interest income is recorded on an accrual basis. Dividends reinvested and stock dividends are reflected as non-cash dividends on the Statements of Operations. Loan consent fees, upfront origination fees and/or amendment fees are recorded when received and included in interest income on the Statements of Operations. Interest income is increased by the accretion of discount and decreased by the amortization of premium, if applicable. For securities with paydown provisions, principal payments received are treated as a proportionate reduction to the cost basis of the securities, and excess or shortfall amounts are recorded as income. For payment-in-kind securities, income received in-kind is reflected as an increase to the principal and cost basis of the securities. In determining net gain or loss on securities sold, the cost of securities has been determined on an identified cost basis. Investment income, non-class specific expenses and realized and unrealized gains and losses are allocated on a pro rata basis to each class based on the relative net assets of each class to the total net assets of the Fund.
c. Foreign Currency Translation. The books and records of the Funds are maintained in U.S. dollars. The values of securities, currencies and other assets and liabilities denominated in currencies other than U.S. dollars, if any, are translated into U.S. dollars based upon foreign exchange rates prevailing at the end of the period. Purchases and sales of investment securities, income and expenses are translated into U.S. dollars on the respective dates of such transactions.
Net realized foreign exchange gains or losses arise from sales of foreign currency, changes in exchange rates between the trade and settlement dates on securities transactions and the difference between the amounts of dividends, interest and foreign withholding taxes recorded in the Funds’ books and records and the U.S. dollar equivalent of the amounts actually received or paid. Net unrealized foreign exchange gains or losses arise from changes in the value of assets and liabilities, other than investment securities, as of the end of the fiscal period, resulting from changes in exchange rates. Net realized foreign exchange gains or losses and the net change in unrealized foreign exchange gains or losses are disclosed in the Statements of Operations. For federal income tax purposes, net realized foreign exchange gains or losses are characterized as ordinary income, and may, if the Funds have net losses, reduce the amount of income available to be distributed by the Funds.
The values of investment securities are presented at the foreign exchange rates prevailing at the end of the period for financial reporting purposes. Net realized and unrealized gains or losses on investments reported in the Statements of Operations reflect gains or losses resulting from changes in exchange rates and fluctuations which arise due to changes in market prices of investment securities. For federal income tax purposes, a portion of the net realized gain or loss on investments arising from changes in exchange rates, which is reflected in the Statements of Operations, may be characterized as ordinary income and may, if the Funds have net losses, reduce the amount of income available to be distributed by the Funds.
The Funds may use foreign currency exchange contracts to facilitate transactions in foreign-denominated investments. Losses may arise from changes in the value of the foreign currency or if the counterparties do not perform under the contracts’ terms.
d. Federal and Foreign Income Taxes. The Trust treats each Fund as a separate entity for federal income tax purposes. Each Fund intends to meet the requirements of the Internal Revenue Code of 1986, as amended, applicable to regulated investment companies, and to distribute to its shareholders substantially all of its net investment income and any net realized capital gains at least annually. Management has performed an analysis of each Fund’s tax positions for the open tax years as of May 31, 2024 and has concluded that no provisions for income tax are required. The Funds’ federal tax returns for the prior three fiscal years remain subject to examination by the Internal Revenue Service. Management is not aware of any events that are reasonably possible to occur in the next six months that would result in the amounts of any unrecognized tax benefits significantly increasing or decreasing for the Funds. However,
Notes to Financial Statements (continued)
management’s conclusions regarding tax positions taken may be subject to review and adjustment at a later date based on factors including, but not limited to, new tax laws and accounting regulations and interpretations thereof.
A Fund may be subject to foreign withholding taxes on investment income and taxes on capital gains on investments that are accrued and paid based upon the Fund’s understanding of the tax rules and regulations that exist in the countries in which the Fund invests. Foreign withholding taxes on dividend and interest income are reflected on the Statements of Operations as a reduction of investment income, net of amounts that have been or are expected to be reclaimed and paid. Dividends and interest receivable on the Statements of Assets and Liabilities are net of foreign withholding taxes. Foreign withholding taxes where reclaims have been or are expected to be filed and paid are reflected on the Statements of Assets and Liabilities as tax reclaims receivable. Capital gains taxes paid are included in net realized gain (loss) on investments in the Statements of Operations. Accrued but unpaid capital gains taxes are reflected as foreign taxes payable on the Statements of Assets and Liabilities, if applicable, and reduce unrealized gains on investments. In the event that realized gains on investments are subsequently offset by realized losses, taxes paid on realized gains may be returned to a Fund. Such amounts, if applicable, are reflected as foreign tax rebates receivable on the Statements of Assets and Liabilities and are recorded as a realized gain when received.
e. Dividends and Distributions to Shareholders. Dividends and distributions are recorded on the ex-dividend date. The timing and characterization of certain income and capital gain distributions are determined annually in accordance with federal tax regulations, which may differ from accounting principles generally accepted in the United States of America. When the Fund identifies the character of distributions paid by REITs in the previous calendar year, certain distributions to Fund shareholders may be redesignated as capital gain distributions or, if in excess of taxable income, as a return of capital. Permanent differences are primarily due to differing treatments for book and tax purposes of items such as foreign currency gains and losses, premium amortization, corporate actions, deferred Trustees' fees, distributions in excess of income and/or capital gain, return of capital distributions received, paydown gains and losses, capital gain distribution received and distribution re-designations. Permanent book and tax basis differences relating to shareholder distributions, net investment income, and net realized gains will result in reclassifications to the capital accounts reported on the Statements of Assets and Liabilities. Temporary differences between book and tax distributable earnings are primarily due to deferred Trustees’ fees, passive foreign investment company adjustments, premium amortization, corporate actions, dividends payable, capital gain distribution received, return of capital distributions received and wash sales. Amounts of income and capital gain available to be distributed on a tax basis are determined annually, and at other times during the Fund’s fiscal year as may be necessary to avoid knowingly declaring and paying a return of capital distribution. Distributions from net investment income and short-term capital gains are considered to be distributed from ordinary income for tax purposes.
The tax characterization of distributions is determined on an annual basis. The tax character of distributions paid to shareholders during the year ended November 30, 2023 was as follows:
| |
| | | |
| | | |
Senior Floating Rate and Fixed Income Fund | | | |
| | | |
Distributions paid to shareholders from net investment income and net realized capital gains, based on accounting principles generally accepted in the United States of America, are consolidated and reported on the Statements of Changes in Net Assets as Distributions to Shareholders. Distributions paid to shareholders from net investment income and net realized capital gains expressed in per-share amounts, based on accounting principles generally accepted in the United States of America, are separately stated and reported within the Financial Highlights.
Notes to Financial Statements (continued)
As of November 30, 2023, capital loss carryforwards were as follows:
| | Senior
Floating Rate
and Fixed
Income Fund | |
Capital loss carryforward: | | | |
| | | |
| | | |
| | | |
| | | |
Total capital loss carryforward | | | |
As of May 31, 2024, the tax cost of investments (including derivatives, if applicable) and unrealized appreciation (depreciation) on a federal tax basis were as follows:
| | Senior
Floating Rate
and Fixed
Income Fund | |
| | | |
| | | |
| | | |
Net tax appreciation (depreciation) | | | |
Amounts in the table above exclude certain adjustments that will be made at the end of the Fund's fiscal year for tax purposes. Adjustments may include, but are not limited to, wash sales.
f. Senior Loans. Senior Floating Rate and Fixed Income Fund may invest in senior loans to corporate, governmental or other borrowers. Senior loans, which include both secured and unsecured loans made by banks and other financial institutions to corporate customers, typically hold the most senior position in a borrower’s capital structure, may be secured by the borrower’s assets and have interest rates that reset frequently. Senior loans can include term loans, revolving credit facility loans and second lien loans. A senior loan is often administered by a bank or other financial institution that acts as agent for all holders. The agent administers the terms of the senior loan, as specified in the loan agreement. Large loans may be shared or syndicated among several lenders. The Fund may enter into the primary syndicate for a loan or it may also purchase all or a portion of loans from other lenders (sometimes referred to as loan assignments), in either case becoming a direct lender. The settlement period for senior loans is uncertain as there is no standardized settlement schedule applicable to such investments. Senior loans outstanding at the end of the period are listed in the Fund’s Portfolio of Investments.
g. Repurchase Agreements. Each Fund may enter into repurchase agreements, under the terms of a Master Repurchase Agreement, under which each Fund acquires securities as collateral and agrees to resell the securities at an agreed upon time and at an agreed upon price. It is each Fund’s policy that the market value of the collateral for repurchase agreements be at least equal to 102% of the repurchase price, including interest. Certain repurchase agreements are tri-party arrangements whereby the collateral is held in a segregated account for the benefit of the Fund and on behalf of the counterparty. Repurchase agreements could involve certain risks in the event of default or insolvency of the counterparty, including possible delays or restrictions upon a Fund’s ability to dispose of the underlying securities. As of May 31, 2024, each Fund, as applicable, had investments in repurchase agreements for which the value of the related collateral exceeded the value of the repurchase agreement. The gross value of repurchase agreements is included in the Statements of Assets and Liabilities for financial reporting purposes.
h. Unfunded Loan Commitments. Senior Floating Rate and Fixed Income Fund may enter into unfunded loan commitments, which are contractual obligations for future funding at the option of the borrower. Unfunded loan commitments represent a future obligation, in full, even though a percentage of the committed amount may not be utilized by the borrower. Unfunded loan commitments, and the obligation for future funding, are recorded as a liability on the Statements of Assets and Liabilities at par value at the time the commitment is entered into. Purchases of unfunded loan commitments may have a similar effect on the Fund's NAV as if the Fund had created a degree of leverage in the portfolio. Market risk exists with these commitments to the same extent as if the securities were owned on a settled basis. Losses may arise due to changes in the value of the unfunded loan commitments.
Notes to Financial Statements (continued)
As of May 31, 2024, the Fund had unfunded loan commitments reflected on the Statements of Assets and Liabilities, which could be extended at the option of the borrower, pursuant to loan agreements with the following borrowers:
| | |
The Action Environmental Group, Inc | 2023 Delayed Draw Term Loan B | |
| | |
| | |
Under the terms of the contract, the Fund has the option to assign (sell) all or a portion of the unfunded loan commitment. Upon the completion of such assignment, the Fund is released from its rights and obligations pertaining to the portion of the unfunded loan commitment assigned. When the Fund sells a portion of an unfunded loan commitment, the portion sold is removed from the Portfolio of Investments and the unsettled amount is reflected as unfunded loan commitments sold on the Statements of Assets and Liabilities until settlement date. Once settled, the portion of the unfunded loan commitment assigned is relieved from the Fund’s unfunded loan commitments liability.
i. Indemnifications. Under the Trust’s organizational documents, its officers and Trustees are indemnified against certain liabilities arising out of the performance of their duties to the Funds. Additionally, in the normal course of business, the Funds enter into contracts with service providers that contain general indemnification clauses. The Funds' maximum exposure under these arrangements is unknown as this would involve future claims that may be made against the Funds that have not yet occurred. However, based on experience, the Funds expect the risk of loss to be remote.
3.Fair Value Measurements In accordance with accounting standards related to fair value measurements and disclosures, the Funds have categorized the inputs utilized in determining the value of each Fund’s assets or liabilities. These inputs are summarized in the three broad levels listed below:
• Level 1 — quoted prices in active markets for identical assets or liabilities;
• Level 2 — prices determined using other significant inputs that are observable either directly, or indirectly through corroboration with observable market data (which could include quoted prices for similar assets or liabilities, interest rates, credit risk, etc.); and
• Level 3 — prices determined using significant unobservable inputs when quoted prices or observable inputs are unavailable such as when there is little or no market activity for an asset or liability (unobservable inputs reflect each Fund’s own assumptions in determining the fair value of assets or liabilities and would be based on the best information available).
The inputs or methodology used for valuing securities are not necessarily an indication of the risk associated with investing in those securities.
The Funds' pricing policies have been approved by the Board of Trustees. Investments for which market quotations are readily available are categorized in Level 1. Other investments for which an independent pricing service is utilized are categorized in Level 2. Broker-dealer bid prices for which the Funds have knowledge of the inputs used by the broker-dealer are categorized in Level 2. All other investments, including broker-dealer bid prices for which the Funds do not have knowledge of the inputs used by the broker-dealer, as well as investments fair valued by the valuation designee, are categorized in Level 3. All Level 2 and 3 securities are defined as being fair valued.
Notes to Financial Statements (continued)
Under certain conditions and based upon specific facts and circumstances, the Fund’s valuation designee may determine that a fair valuation should be made for portfolio investment(s). These valuation designee fair valuations will be based upon a significant amount of Level 3 inputs.
The following is a summary of the inputs used to value the Funds' investments as of May 31, 2024, at value:
|
|
| | | | |
| | | | |
| | | | |
| | | | |
| | | | |
| | | | |
| | | | |
| | | | |
| | | | |
| | | | |
All Other Common Stocks(a) | | | | |
| | | | |
| | | | |
| | | | |
| Details of the major categories of the Fund’s investments are reflected within the Portfolio of Investments. |
Senior Floating Rate and Fixed Income Fund |
|
| | | | |
| | | | |
| | | | |
| | | | |
| | | | |
Oil, Gas & Consumable Fuels | | | | |
All Other Common Stocks(a) | | | | |
| | | | |
| | | | |
| | | | |
| | | | |
| Details of the major categories of the Fund’s investments are reflected within the Portfolio of Investments. |
| Details of the major categories of the Fund’s investments are reflected within the Portfolio of Investments. |
Notes to Financial Statements (continued)
The following is a reconciliation of Level 3 investments for which significant unobservable inputs were used to determine fair value as of November 30, 2023 and/or May 31, 2024:
Senior Floating Rate and Fixed Income Fund |
|
Investments in Securities | Balance as of
November 30,
2023 | Accrued
Discounts
(Premiums) | | Change in
Unrealized
Appreciation
(Depreciation) | | | | | | Change in
Unrealized
Appreciation
(Depreciation)
from
Investments
Still Held at
May 31,
2024 |
| | | | | | | | | | |
Oil, Gas & Consumable Fuels | | | | | | | | | | |
4.Purchases and Sales of Securities. For the six months ended May 31, 2024, purchases and sales of securities (excluding short-term investments and including paydowns) were as follows:
| U.S. Government/
Agency Securities | |
| | | | |
| | | | |
Senior Floating Rate and Fixed Income Fund | | | | |
| | | | |
5.Management Fees and Other Transactions with Affiliates.
a. Management Fees. Loomis, Sayles & Company, L.P. (“Loomis Sayles”) serves as investment adviser to Global Growth Fund and Senior Floating Rate and Fixed Income Fund. Loomis Sayles is a limited partnership whose sole general partner, Loomis, Sayles & Company, Inc., is indirectly owned by Natixis Investment Managers, LLC ("Natixis"), which is part of Natixis Investment Managers, an international asset management group based in Paris, France.
Under the terms of the management agreements, each Fund pays a management fee at the following annual rates, calculated daily and payable monthly, based on each Fund’s average daily net assets:
| Percentage of
Average Daily
Net Assets |
| |
Senior Floating Rate and Fixed Income Fund | |
Natixis Advisors, LLC (“Natixis Advisors”) serves as investment adviser to Select Fund. Natixis Advisors is a wholly-owned subsidiary of Natixis. Under the terms of the management agreement, the Fund pays a management fee at the annual rate of 0.70%, calculated daily and payable monthly, based on the Fund’s average daily net assets.
Natixis Advisors has entered into a subadvisory agreement with Vaughan Nelson Investment Management, L.P. (“Vaughan Nelson”). Under the terms of the subadvisory agreement, the Fund pays a subadvisory fee at the annual rate of 0.47%, calculated daily and payable monthly, based on the Fund’s average daily net assets. Payments to Natixis Advisors are reduced by the amount of payments to Vaughan Nelson.
Loomis Sayles and Natixis Advisors have given binding undertakings to the Funds to waive management fees and/or reimburse certain expenses to limit the Funds’ operating expenses, exclusive of acquired fund fees and expenses, brokerage expenses, interest expense, taxes, organizational and extraordinary expenses such as litigation and indemnification expenses. These undertakings are in effect until March 31, 2025, may be terminated before then only with the consent of the Funds’ Board of Trustees, and are reevaluated on an annual basis. Management fees payable, as reflected on the Statements of Assets and Liabilities, is net of waivers and/or expense
Notes to Financial Statements (continued)
reimbursements, if any, pursuant to these undertakings. Waivers/reimbursements that exceed management fees payable are reflected on the Statements of Assets and Liabilities as receivable from investment adviser.
For the six months ended May 31, 2024, the expense limits as a percentage of average daily net assets under the expense limitation agreements were as follows:
| Expense Limit as a Percentage of
Average Daily Net Assets |
| | | | |
| | | | |
Senior Floating Rate and Fixed Income Fund | | | | |
| | | | |
Effective July 1, 2024 the expense limits as a percentage of average daily net assets under the expense limitation agreements for Senior Floating Rate and Fixed Income Fund are as follows:
| Expense Limit as a Percentage of
Average Daily Net Assets |
| | | | |
Senior Floating Rate and Fixed Income Fund | | | | |
This new undertaking is in effect until March 31, 2026, may be terminated before then only with the consent of the Fund’s Board of Trustees, and will be reevaluated on an annual basis.
Loomis Sayles and Natixis Advisors shall be permitted to recover expenses borne under the expense limitation agreements (whether through waiver of management fees or otherwise) on a class by class basis in later periods to the extent the annual operating expenses of a class fall below both (1) a class’ expense limitation ratio in place at the time such amounts were waived/reimbursed and (2) a class’ current applicable expense limitation ratio, provided, however, that a class is not obligated to pay such waived/reimbursed fees or expenses more than one year after the end of the fiscal year in which the fees or expenses were waived/reimbursed.
For the six months ended May 31, 2024, the management fees and waivers of management fees for each Fund were as follows:
| | Contractual
Waivers of
Management
| | Percentage of
Average
Daily Net Assets |
| | |
| | | | | |
Senior Floating Rate and Fixed Income Fund | | | | | |
| | | | | |
| Contractual management fee waivers are subject to possible recovery until November 30, 2025. |
No expenses were recovered for any of the Funds during the six months ended May 31, 2024 under the terms of the expense limitation agreements.
b. Service and Distribution Fees. Natixis Distribution, LLC (“Natixis Distribution”), which is a wholly-owned subsidiary of Natixis Investment Managers, LLC, has entered into a distribution agreement with the Trust. Pursuant to this agreement, Natixis Distribution serves as principal underwriter of the Funds of the Trust.
Pursuant to Rule 12b-1 under the 1940 Act, the Trust has adopted a Service Plan relating to the Fund’s Class A shares (the “Class A Plans”) and a Distribution and Service Plan relating to the Fund’s Class C shares (the “Class C Plans”).
Under the Class A Plans, each Fund pays Natixis Distribution a monthly service fee at an annual rate not to exceed 0.25% of the average daily net assets attributable to the Fund’s Class A shares, as reimbursement for expenses incurred by Natixis Distribution in providing personal services to investors in Class A shares and/or the maintenance of shareholder accounts.
Under the Class C Plans, each Fund pays Natixis Distribution a monthly service fee at an annual rate not to exceed 0.25% of the average daily net assets attributable to the Fund’s Class C shares, as compensation for services provided by Natixis Distribution in providing personal services to investors in Class C shares and/or the maintenance of shareholder accounts.
Notes to Financial Statements (continued)
Also under the Class C Plans, each Fund pays Natixis Distribution a monthly distribution fee at the annual rate of 0.75% of the average daily net assets attributable to the Fund’s Class C shares, as compensation for services provided by Natixis Distribution in connection with the marketing or sale of Class C shares.
For the six months ended May 31, 2024, the service and distribution fees for each Fund were as follows:
| | | |
| | | | |
| | | | |
Senior Floating Rate and Fixed Income Fund | | | | |
| | | | |
c. Administrative Fees. Natixis Advisors provides certain administrative services for the Funds and contracts with State Street Bank and Trust Company (“State Street Bank”) to serve as sub-administrator. Pursuant to an agreement among Natixis Funds Trusts, Loomis Sayles Funds Trusts, Natixis ETF Trusts and Natixis Advisors, each Fund pays Natixis Advisors monthly its pro rata portion of fees equal to an annual rate of 0.0540% of the first $15 billion of the average daily net assets of the Natixis Funds Trusts, Loomis Sayles Funds Trusts and Natixis ETF Trusts, 0.0500% of the next $15 billion, 0.0400% of the next $30 billion, 0.0275% of the next $30 billion and 0.0225% of such assets in excess of $90 billion, subject to an annual aggregate minimum fee for the Natixis Funds Trusts, Loomis Sayles Funds Trusts and Natixis ETF Trusts of $10 million, which is reevaluated on an annual basis.
For the six months ended May 31, 2024, the administrative fees for each Fund were as follows:
| |
| |
Senior Floating Rate and Fixed Income Fund | |
| |
d. Sub-Transfer Agent Fees. Natixis Distribution has entered into agreements, which include servicing agreements, with financial intermediaries that provide recordkeeping, processing, shareholder communications and other services to customers of the intermediaries that hold positions in the Funds and has agreed to compensate the intermediaries for providing those services. Intermediaries transact with the Funds primarily through the use of omnibus accounts on behalf of their customers who hold positions in the Funds. These services would have been provided by the Funds’ transfer agent and other service providers if the shareholders’ accounts were maintained directly at the Funds’ transfer agent. Accordingly, the Funds have agreed to reimburse Natixis Distribution for all or a portion of the servicing fees paid to these intermediaries. The reimbursement amounts (sub-transfer agent fees) paid to Natixis Distribution are subject to a current per-account equivalent fee limit approved by the Funds’ Board of Trustees, which is based on fees for similar services paid to the Funds’ transfer agent and other service providers. Class N shares do not bear such expenses.
For the six months ended May 31, 2024, the sub-transfer agent fees (which are reflected in transfer agent fees and expenses in the Statements of Operations) for each Fund were as follows:
| |
| |
Senior Floating Rate and Fixed Income Fund | |
| |
As of May 31, 2024, the Funds owe Natixis Distribution the following reimbursements for sub-transfer agent fees (which are reflected in the Statements of Assets and Liabilities as payable to distributor):
| Reimbursements
of Sub-Transfer
Agent Fees |
| |
Senior Floating Rate and Fixed Income Fund | |
| |
Sub-transfer agent fees attributable to Class A, Class C and Class Y are allocated on a pro rata basis to each class based on the relative net assets of each class to the total net assets of those classes.
Notes to Financial Statements (continued)
e. Commissions. Commissions (including CDSCs) on Fund shares retained by Natixis Distribution during the six months ended May 31, 2024 were as follows:
| |
| |
Senior Floating Rate and Fixed Income Fund | |
| |
f. Trustees Fees and Expenses. The Trust does not pay any compensation directly to its officers or Trustees who are directors, officers or employees of Natixis Advisors, Natixis Distribution, Natixis Investment Managers, LLC or their affiliates. The Chairperson of the Board of Trustees receives a retainer fee at the annual rate of $400,000. The Chairperson does not receive any meeting attendance fees for Board of Trustees meetings or committee meetings that he attends. Each Independent Trustee (other than the Chairperson) receives, in the aggregate, a retainer fee at the annual rate of $225,000. Each Independent Trustee also receives a meeting attendance fee of $10,000 for each meeting of the Board of Trustees that he or she attends in person and $5,000 for each meeting of the Board of Trustees that he or she attends telephonically. In addition, the Chairperson of the Contract Review Committee and the Chairperson of the Audit Committee each receive an additional retainer fee at the annual rate of $25,000. The Chairperson of the Governance Committee receives an additional retainer fee at the annual rate of $20,000. Each Contract Review Committee member is compensated $6,000 for each Committee meeting that he or she attends in person and $3,000 for each meeting that he or she attends telephonically. Each Audit Committee member is compensated $6,000 for each Committee meeting that he or she attends in person and $3,000 for each meeting that he or she attends telephonically. Each Governance Committee member is compensated $2,500 for each Committee meeting that he or she attends. These fees are allocated among the funds in the Natixis Funds Trusts, Loomis Sayles Funds Trusts and Natixis ETF Trusts based on a formula that takes into account, among other factors, the relative net assets of each fund. Trustees are reimbursed for travel expenses in connection with attendance at meetings.
Prior to January 1, 2024, the Chairperson of the Board of Trustees received a retainer fee at the annual rate of $369,000 and each Independent Trustee (other than the Chairperson) received, in the aggregate, a retainer fee at the annual rate of $210,000. Each Independent Trustee received a meeting attendance fee of $10,000 for each meeting of the Board of Trustees that he or she attended in person. The Chairperson of the Contract Review Committee and the Chairperson of the Audit Committee each received an additional retainer fee at the annual rate of $20,000. All other Trustees fees remained unchanged.
A deferred compensation plan (the “Plan”) is available to the Trustees on a voluntary basis. The value of a participating Trustee’s deferral account is based on theoretical investments of deferred amounts, on the normal payment dates, in certain funds of the Natixis Funds Trusts, Loomis Sayles Funds Trusts and Natixis ETF Trusts as designated by the participating Trustees. Changes in the value of participants’ deferral accounts are allocated pro rata among the funds in the Natixis Funds Trusts, Loomis Sayles Funds Trusts and Natixis ETF Trusts and are normally reflected as Trustees’ fees and expenses in the Statements of Operations. Deferred amounts remain in the funds until distributed in accordance with the provisions of the Plan. The portions of the accrued obligations allocated to the Funds under the Plan are reflected as Deferred Trustees’ fees in the Statements of Assets and Liabilities.
Certain officers and employees of Natixis Advisors and Loomis Sayles are also officers and/or Trustees of the Trust.
g. Affiliated Ownership. As of May 31, 2024, Natixis and affiliates (“Natixis”) and Loomis Sayles Employees’ Profit Sharing Retirement Plan (“Retirement Plan”) held shares of the Funds representing the following percentages of the Funds’ net assets:
| | |
| | |
Senior Floating Rate and Fixed Income Fund | | |
Investment activities of affiliated shareholders could have material impacts on the Funds.
h. Reimbursement of Transfer Agent Fees and Expenses. Natixis Advisors has given a binding contractual undertaking to the Funds to reimburse any and all transfer agency expenses for the Fund’s Class N shares. This undertaking is in effect through March 31, 2025 and is not subject to recovery under the expense limitation agreement described above.
Notes to Financial Statements (continued)
For the six months ended May 31, 2024, Natixis Advisors reimbursed the Funds for transfer agency expenses as follows:
| Reimbursement of
Transfer Agency
Expenses |
| |
| |
Senior Floating Rate and Fixed Income Fund | |
| |
6.Class-Specific Transfer Agent Fees and Expenses. Transfer agent fees and expenses attributable to Class A, Class C and Class Y are allocated on a pro rata basis to each class based on the relative net assets of each class to the total net assets of those classes. Transfer agent fees and expenses attributable to Class N are allocated to Class N.
For the six months ended May 31, 2024 the Funds incurred the following class-specific transfer agent fees and expenses (net of expense offsets and including sub-transfer agent fees, where applicable):
| Transfer Agent Fees and Expenses |
| | | | |
| | | | |
Senior Floating Rate and Fixed Income Fund | | | | |
| | | | |
7.Expense Offset Arrangements. The Funds have entered into an agreement with the transfer agent whereby certain transfer agent fees and expenses may be paid indirectly by credits earned on the Funds' cash balances. Transfer agent fees and expenses are presented in the Statements of Operations gross of such credits, and the credits are presented as offsets to expenses.
8.Line of Credit. Each Fund, together with certain other funds of Natixis Funds Trusts, Loomis Sayles Funds Trusts and Natixis ETF Trusts, entered into a syndicated, revolving, committed, unsecured line of credit with State Street Bank as administrative agent. The aggregate revolving commitment amount is $575,000,000. Any one Fund may borrow up to $402,500,000 under the line of credit agreement (as long as all borrowings by all Funds in the aggregate do not exceed the $575,000,000 limit at any time), subject to each Fund’s investment restrictions and its contractual obligations under the line of credit. Interest is charged to the Funds based upon the terms set forth in the agreement. In addition, a commitment fee of 0.15% per annum, payable at the end of each calendar quarter, is accrued and apportioned among the participating funds based on their average daily unused portion of the line of credit. The Funds paid certain legal fees in connection with the line of credit agreement, which are being amortized over a period of 364 days and are reflected in legal fees on the Statements of Operations. The unamortized balance is reflected as prepaid expenses on the Statements of Assets and Liabilities.
For the six months ended May 31, 2024, none of the Funds had borrowings under this agreement.
9.Risk. Global Growth Fund’s investments in foreign securities may be subject to greater political, economic, environmental, credit/ counterparty and information risks. The Fund’s investments in foreign securities also are subject to foreign currency fluctuations and other foreign currency-related risks. Foreign securities may be subject to higher volatility than U.S. securities, varying degrees of regulation and limited liquidity.
Global Growth Fund may invest to a significant extent in variable interest entity (“VIE”) structures. VIE structures can vary, but generally consist of a U.S.-listed company with contractual arrangements, through one or more wholly-owned special purpose vehicles, with a Chinese company that ultimately provides the U.S.-listed company with contractual rights to obtain economic benefits from the Chinese company. The VIE structure enables foreign investors, such as the Fund, to obtain investment exposure similar to that of an equity owner in a Chinese company in situations in which the Chinese government has restricted or prohibited the ownership of such company by foreign investors. The Fund’s exposure to VIE structures may pose additional risks because the VIE structure is not formally recognized under Chinese law. The Chinese government may cease to tolerate VIE structures at any time or impose new restrictions. In addition, Chinese companies using the VIE structure, and listed on stock exchanges in the U.S., could also face delisting or other ramifications for failure to meet the expectations and/or requirements of the U.S. Securities and Exchange Commission, the Public Company Accounting Oversight Board, or other U.S. regulators. Any of these risks could reduce the liquidity and value of these investments or render them valueless.
Notes to Financial Statements (continued)
Select Fund is non-diversified, which means that it is not limited under the 1940 Act to a percentage of assets that it may invest in any one issuer. Because the Fund may invest in the securities of a limited number of issuers, an investment in the Fund may involve a higher degree of risk than would be present in a diversified portfolio.
The senior loans in which Senior Floating Rate and Fixed Income Fund expects to invest will generally not be rated investment grade by the rating agencies. Economic downturns generally increase non-payment rates and a senior loan could lose a substantial part of its value prior to default. Senior loans are subject to credit risk, and secured loans may not be adequately collateralized. The interest rates of senior loans reset frequently, and thus senior loans are subject to interest rate risk. There may also be less public information available about senior loans as compared to other debt securities.
Senior loans are generally less liquid than many other debt securities. Transactions in senior loans may settle on a delayed basis, such that the Fund may not receive the proceeds from the sale of a loan for a substantial period of time (greater than seven days) after the sale. As a result, the proceeds related to the sale of senior loans may not be available to make additional investments or to meet the Fund’s redemption obligations until substantial period (greater than seven days) after the sale of the loans.
Geopolitical events (such as trading halts, sanctions or wars) could increase volatility and uncertainty in the financial markets and adversely affect regional and global economies. These, and other related events, could significantly impact a Fund's performance and the value of an investment in the Fund, even if the Fund does not have direct exposure to issuers in the country or countries involved.
10.Concentration of Ownership. From time to time, a Fund may have a concentration of one or more accounts constituting a significant percentage of shares outstanding. Investment activities by holders of such accounts could have material impacts on the Funds. As of May 31, 2024, based on management’s evaluation of the shareholder account base, the Funds had accounts representing controlling ownership of more than 5% of the Funds' total outstanding shares. The number of such accounts, based on accounts that represent more than 5% of an individual class of shares, and the aggregate percentage of net assets represented by such holdings were as follows:
| Number of 5%
Non-Affiliated
Account Holders | Percentage of
Non-Affiliated
Ownership | Percentage of
Affiliated
Ownership
(Note 5g) | Total
Percentage of
Ownership |
| | | | |
| | | | |
Omnibus shareholder accounts for which Natixis Advisors understands that the intermediary has discretion over the underlying shareholder accounts or investment models where a shareholder account may be invested for a non-discretionary customer are included in the table above. For other omnibus accounts, the Funds do not have information on the individual shareholder accounts underlying the omnibus accounts; therefore, there could be other 5% shareholders in addition to those disclosed in the table above.
Notes to Financial Statements (continued)
11.Capital Shares. Each Fund may issue an unlimited number of shares of beneficial interest, without par value. Transactions in capital shares were as follows:
|
| Six Months Ended
May 31, 2024 | Year Ended
November 30, 2023 |
| | | | |
| | | | |
Issued from the sale of shares | | | | |
Issued in connection with the reinvestment of distributions | | | | |
| | | | |
| | | | |
| | | | |
Issued from the sale of shares | | | | |
Issued in connection with the reinvestment of distributions | | | | |
| | | | |
| | | | |
| | | | |
Issued from the sale of shares | | | | |
Issued in connection with the reinvestment of distributions | | | | |
| | | | |
| | | | |
| | | | |
Issued from the sale of shares | | | | |
Issued in connection with the reinvestment of distributions | | | | |
| | | | |
| | | | |
Decrease from capital share transactions | | | | |
Notes to Financial Statements (continued)
11.Capital Shares (continued).
|
| Six Months Ended
May 31, 2024 | Year Ended
November 30, 2023 |
Senior Floating Rate and Fixed Income Fund | | | | |
| | | | |
Issued from the sale of shares | | | | |
Issued in connection with the reinvestment of distributions | | | | |
| | | | |
| | | | |
| | | | |
Issued from the sale of shares | | | | |
Issued in connection with the reinvestment of distributions | | | | |
| | | | |
| | | | |
| | | | |
Issued from the sale of shares | | | | |
Issued in connection with the reinvestment of distributions | | | | |
| | | | |
| | | | |
| | | | |
Issued from the sale of shares | | | | |
Issued in connection with the reinvestment of distributions | | | | |
| | | | |
| | | | |
Decrease from capital share transactions | | | | |
Notes to Financial Statements (continued)
11.Capital Shares (continued).
|
| Six Months Ended
May 31, 2024 | Year Ended
November 30, 2023 |
| | | | |
| | | | |
Issued from the sale of shares | | | | |
Issued in connection with the reinvestment of distributions | | | | |
| | | | |
| | | | |
| | | | |
Issued from the sale of shares | | | | |
Issued in connection with the reinvestment of distributions | | | | |
| | | | |
| | | | |
| | | | |
Issued from the sale of shares | | | | |
Issued in connection with the reinvestment of distributions | | | | |
| | | | |
| | | | |
| | | | |
Issued from the sale of shares | | | | |
Issued in connection with the reinvestment of distributions | | | | |
| | | | |
| | | | |
Increase from capital share transactions | | | | |
BOARD APPROVAL OF THE EXISTING ADVISORY AND SUB-ADVISORY AGREEMENTS
The Board of Trustees of the Trust (the “Board”), including the Independent Trustees, considers matters bearing on each Fund’s advisory agreement and, with respect to Vaughan Nelson Select Fund, sub-advisory agreement (collectively, the “Agreements”), at most of its meetings throughout the year. Each year, usually in the spring, the Contract Review Committee of the Board meets to review the Agreements to determine whether to recommend that the full Board approve the continuation of the Agreements, typically for an additional one-year period. This meeting typically includes all the Independent Trustees, including the Trustees who do not serve on the Contract Review Committee. After the Contract Review Committee has made its recommendation, the full Board, including the Independent Trustees, determines whether to approve the continuation of the Agreements at its June Board meeting.
In connection with these meetings, the Trustees receive materials that the Funds’ investment advisers and sub-adviser, as applicable (collectively, the “Advisers”), believe to be reasonably necessary for the Trustees to evaluate the Agreements. These materials generally include, among other items, (i) information on the investment performance of the Funds and the performance of peer groups of funds and the Funds’ performance benchmarks, (ii) information on the Funds’ advisory fees and sub-advisory fees, if any, and other expenses, including information comparing the Funds’ advisory and sub-advisory fees to the fees charged to institutional accounts with similar strategies managed by the Advisers, if any, and to those of peer groups of funds and information about any applicable expense limitations and/or fee “breakpoints,” (iii) sales and redemption data in respect of the Funds, (iv) information about the profitability of the Agreements to the Advisers, including how profitability is determined for the Funds, and (v) information obtained through the completion by the Advisers of questionnaires distributed on behalf of the Trustees throughout the year. The Board, including the Independent Trustees, also considers other matters such as (i) each Fund’s investment objective and strategies and the size, education and experience of the Advisers’ respective investment staffs and their use of technology, external research and trading cost measurement tools, (ii) arrangements in respect of the distribution of the Funds’ shares and the related costs, (iii) the allocation of the Funds’ brokerage, if any, including, to the extent applicable, allocations to brokers affiliated with the Advisers and the use of “soft” commission dollars to pay for research and other similar services, (iv) each Adviser’s policies and procedures relating to, among other things, compliance, trading and best execution, proxy voting, liquidity and valuation, (v) information about amounts invested by the Funds’ portfolio managers in the Funds or in similar accounts that they manage and (vi) the general economic outlook with particular emphasis on the mutual fund industry. Throughout the process, the Trustees are afforded the opportunity to ask questions of and request additional materials from the Advisers and the Independent Trustees meet separately with independent legal counsel outside the presence of Adviser personnel.
In addition to the materials requested by the Trustees in connection with their annual consideration of the continuation of the Agreements, the Trustees receive materials in advance of each regular quarterly meeting of the Board that provide detailed information about the Funds’ investment performance and the fees charged to the Funds for advisory and other services. The information received by the Trustees generally includes, where available, among other things, an internal performance rating for each Fund based on agreed-upon criteria, graphs showing each Fund’s performance and expense differentials against each Fund’s peer group/category of funds, total return information for various periods, performance rankings provided by a third-party data provider for various periods comparing a Fund against similarly categorized funds, and performance ratings provided by a different third-party rating organization. The portfolio management team for each Fund or other representatives of the Advisers make periodic presentations to the Contract Review Committee and/or the full Board, and Funds identified as presenting possible performance concerns may be subject to more frequent Board or Committee presentations and reviews. In addition, the Trustees are periodically provided with detailed statistical information about each Fund’s portfolio. The Trustees also receive periodic updates between meetings, both at the Board and at the Committee level.
The Board most recently approved the continuation of the Agreements for a one-year period at its meeting held in June 2024. In considering whether to approve the continuation of the Agreements, the Board, including the Independent Trustees, did not identify any single factor as determinative. Individual Trustees may have evaluated the information presented differently from one another, giving different weights to various factors. Matters considered by the Trustees, including the Independent Trustees, in connection with their approval of the Agreements included, but were not limited to, the factors listed below.
The nature, extent and quality of the services provided to the Funds under the Agreements. The Trustees considered the nature, extent and quality of the services provided by the Advisers and their affiliates to the Funds and the resources dedicated to the Funds by the Advisers and their affiliates. The Trustees also considered their experience with other funds advised or sub-advised by the Advisers, as well as the affiliation between the Advisers and Natixis Investment Managers, LLC, whose affiliates provide investment advisory services to other funds in the Natixis family of funds.
The Trustees considered not only the advisory services provided by the Advisers to the Funds, but also the benefits to the Funds from the monitoring and oversight services provided by Natixis Advisors, LLC (“Natixis Advisors”). They also considered the administrative and shareholder services provided by Natixis Advisors and its affiliates to the Funds. They also took into consideration increases in the services provided resulting from new regulatory requirements, such as recent rules relating to the fair valuation of investments and the
use of derivatives, implementation of tailored shareholder reports and amendments to the Names Rule, as well as from monitoring proposed rules, such as those relating to cybersecurity, environmental, social, and governance-specific regulatory changes, and vendor oversight.
For each Fund, the Trustees also considered the benefits to shareholders of investing in a mutual fund that is part of a family of funds that offers shareholders the right to exchange shares of one type of fund for shares of another type of fund, and provides a variety of fund and shareholder services.
After reviewing these and related factors, the Trustees concluded, within the context of their overall conclusions regarding each of the Agreements, that the nature, extent and quality of services provided supported the renewal of the Agreements.
Investment performance of the Funds and the Advisers. As noted above, the Trustees received information about the performance of the Funds over various time periods, including information that compared the performance of the Funds to the performance of peer groups and categories of funds and the Funds’ respective performance benchmarks. The Board noted that while it found the data provided by the independent third-party data provider useful, it recognized its limitations, including, in particular, that notable differences may exist between the Funds and the performance comparisons (for example, with respect to investment strategies) and that the results of the performance comparisons may vary depending on (i) the end dates for the performance periods that were selected and (ii) the selection of the performance comparisons. The Trustees also received information about how comparative peer groups are constructed. In addition, the Trustees reviewed data prepared by an independent third-party rating organization that analyzed the performance of the Funds using a variety of performance metrics, including metrics that measured the performance of the Funds on a risk adjusted basis.
The Board noted that, through December 31, 2023, each Fund’s one-, three- and five-year performance stated as percentile rankings within categories selected by the independent third-party data provider, was as follows (where the best performance would be in the first percentile of its category):
| | | |
Loomis Sayles Global Growth Fund | | | |
Loomis Sayles Senior Floating Rate and Fixed Income Fund | | | |
Vaughan Nelson Select Fund | | | |
In the case of a Fund that had performance that lagged that of a relevant category median as determined by the independent third-party data provider for certain periods, the Board concluded that other factors relevant to performance supported renewal of the Agreements. These factors included the following: (1) that the underperformance was attributable, to a significant extent, to investment decisions (such as security selection or sector allocation) by the Advisers that were reasonable and consistent with the Fund’s investment objective and policies; (2) that the Fund had outperformed its relevant benchmark for the one-year period ended December 31, 2023; (3) that the Fund’s shorter-term (one-year) performance has been strong relative to its category; (4) that the Fund’s longer-term (three- and/or five-year) performance has been stronger relative to its category; (5) that the Fund’s long-term (10-year) performance has been stronger relative to its category and (6) that the Fund’s performance for a recent (though not necessarily the most recent) calendar year was stronger relative to its category. The Board also considered information about the Funds’ more recent performance, including how performance over various periods had been impacted by various factors such as market and economic events.
The Trustees also considered each Adviser’s performance and reputation generally, the performance of the fund family generally, and the historical responsiveness of the Advisers to Trustee concerns about performance and the willingness of the Advisers to take steps intended to improve performance.
After reviewing these and related factors, the Trustees concluded, within the context of their overall conclusions regarding each of the Agreements, that the performance of the Funds and the Advisers and/or other relevant factors supported the renewal of the Agreements.
The costs of the services to be provided and profits to be realized by the Advisers and their affiliates from their respective relationships with the Funds. The Trustees considered the fees charged to the Funds for advisory, sub-advisory and administrative services, as applicable, as well as the total expense levels of the Funds. This information included comparisons (provided both by management and by an independent third party) of the Funds’ advisory fees and total expense levels to those of their peer groups and information about the advisory fees charged by the Advisers to comparable accounts (such as institutional separate accounts), as well as information about differences in such fees and the reasons for any such differences. In considering the fees charged to comparable accounts, the Trustees considered, among other things, management’s representations about the differences between managing mutual funds as compared to other types of accounts, including the additional resources required to effectively manage mutual fund assets, the greater regulatory costs associated with the management of such assets, and the entrepreneurial, regulatory and other risks associated with sponsoring and managing mutual funds. In evaluating each Fund’s advisory and sub-advisory fees, as applicable, the Trustees also took into
account the demands, complexity and quality of the investment management of such Fund and the need for the Advisers to offer competitive compensation and the potential need to expend additional resources to the extent the Fund grows in size. The Trustees considered that over the past several years, management had demonstrated its intention to have competitive fee levels by making recommendations regarding reductions in advisory fee rates, implementation of advisory fee breakpoints and the institution of advisory fee waivers and expense limitations for various funds in the fund family. They noted that the Funds have expense limitations in place, and they considered the amounts waived or reimbursed by the Advisers for the Funds under their expense limitation agreements. They further noted that management had proposed to reduce the expense limitation for Loomis Sayles Senior Floating Rate and Fixed Income Fund on all share classes, effective as of July 1, 2024. The Trustees also considered that the proposed reduction of the Loomis Sayles Senior Floating Rate and Fixed Income Fund’s expense limitation would further reduce the Fund’s effective advisory fee rate. The Trustees further noted that the Loomis Sayles Global Growth Fund and Loomis Sayles Senior Floating Rate and Fixed Income Fund had total advisory fee rates that were at or below the medians of their respective peer groups of funds. The Board also considered that the fee and expense information reflected information as of a certain date and that historical asset levels may differ from current asset levels, particularly in a period of market volatility.
The Trustees noted that Vaughan Nelson Select Fund had a total advisory fee rate that was above the median of a peer group of funds. In this regard, the Trustees considered the factors that management believed justified such relatively higher advisory fee rates, including: (1) that the advisory fee was only five basis points higher than the median of a peer group of funds; (2) that the Fund’s longer-term performance has been consistently strong; and (3) that the Fund’s overall net expenses are consistent with its peer group.
The Trustees also considered the compensation directly or indirectly received by the Advisers and their affiliates from their relationships with the Funds. The Trustees reviewed information provided by management as to the profitability of the Advisers’ and their affiliates’ relationships with the Funds, and information about how expenses are determined and allocated for purposes of profitability calculations. They also reviewed information provided by management about the effect of distribution costs and changes in asset levels on Adviser profitability, including information regarding resources spent on distribution activities. When reviewing profitability, the Trustees also considered information about court cases in which adviser compensation or profitability were issues, the performance of the relevant Funds, the expense levels of the Funds, whether the Advisers had implemented breakpoints and/or expense limitations with respect to such Funds and the overall profit margin of Natixis Investment Managers, LLC compared to that of certain other investment managers for which such data was available. The Board also noted the competitive nature of the global asset management industry.
After reviewing these and related factors, the Trustees concluded, within the context of their overall conclusions regarding each of the Agreements, that the advisory fees charged to each of the Funds were fair and reasonable, and that the costs of these services generally and the related profitability of the Advisers and their affiliates in respect of their relationships with the Funds supported the renewal of the Agreements.
Economies of Scale. The Trustees considered the existence of any economies of scale in the provision of services by the Advisers and whether those economies are shared with the Funds through breakpoints in their investment advisory fees or other means, such as expense limitations. The Trustees also considered management’s explanation of the factors that are taken into account with respect to the implementation of breakpoints in investment advisory fees or expense limitations, which reduced the total expenses borne by shareholders. With respect to economies of scale, the Trustees noted that although the Funds’ management fees were not subject to breakpoints, each Fund was subject to an expense limitation. The Trustees also considered management’s proposal to reduce the expense limitation for Loomis Sayles Senior Floating Rate and Fixed Income Fund on all share classes, effective as of July 1, 2024. In considering these issues, the Trustees also took note of the costs of the services provided (both on an absolute and on a relative basis) and the profitability to the Advisers and their affiliates of their relationships with the Funds, as discussed above. The Trustees also considered that the Funds have benefitted from the substantial reinvestment each Adviser has made into its business.
After reviewing these and related factors, the Trustees concluded, within the context of their overall conclusions regarding each of the Agreements, that the extent to which economies of scale were shared with the Funds supported the renewal of the Agreements.
The Trustees also considered other factors, which included but were not limited to the following:
• The effect of various factors and recent market and economic events, such as recent market volatility, geopolitical instability, aggressive domestic and foreign central bank policies, and adverse developments affecting the financial services industry generally, as applicable, on the performance, asset levels and expense ratios of each Fund.
• Whether each Fund has operated in accordance with its investment objective and the Fund’s record of compliance with its investment restrictions, and the compliance programs of the Funds and the Advisers. They also considered the compliance-related resources the Advisers and their affiliates were providing to the Funds.
• So-called “fallout benefits” to the Advisers, such as the engagement of affiliates of the Advisers to provide distribution and administrative services to the Funds, and the benefits of research made available to the Advisers by reason of brokerage commissions (if any) generated by the Funds’ securities transactions. The Trustees considered the possible conflicts of interest associated with these fallout and other benefits, and the reporting, disclosure and other processes in place to disclose and monitor such possible conflicts of interest.
• The Trustees’ review and discussion of the Funds’ advisory arrangements in prior years, and management’s record of responding to Trustee concerns raised during the year and in prior years.
Based on their evaluation of all factors that they deemed to be material, including those factors described above, and assisted by the advice of independent counsel, the Trustees, including the Independent Trustees, concluded that each of the existing Agreements should be continued through June 30, 2025.
˃To learn more about Natixis Funds products and services:
Visit: im.natixis.com Call: 800-225-5478
Before investing, consider the fund’s investment objectives, risks, charges, and expenses. Visit im.natixis.com or call 800-225-5478 for a prospectus or summary prospectus containing this and other information.
Contact us by mail:
If you wish to communicate with the funds’ Board of Trustees, you may do so by writing to:
Secretary of the Funds
Natixis Advisors, LLC
888 Boylston Street, Suite 800
Boston, MA 02199-8197
The correspondence must (a) be signed by the shareholder; (b) include the shareholder’s name and address; and (c) identify the fund(s), account number, share class, and number of shares held in that fund, as of a recent date.
Or by e-mail:
secretaryofthefunds@natixis.com (Communications regarding recommendations for Trustee candidates may not be submitted by e-mail.)
Please note: Unlike written correspondence, e-mail is not secure. Please do NOT include your account number, Social Security number, PIN, or any other non-public personal information in an e-mail communication because this information may be viewed by others.
 Exp. 7/31/256799475.1.1LSAR58SA-0524
This page is not part of the financial statements and other important information
Item 8. Changes in and Disagreements with Accountants for Open-End Management Investment Companies
Not applicable.
Item 9. Proxy Disclosures for Open-End Management Investment Companies.
Not applicable.
Item 10. Remuneration Paid to Directors, Officers, and Others of Open-End Management Investment Companies.
The remuneration paid to Directors and Officers are incorporated by reference as part of the Financial Statements and Other Important Information for Open-End Management Investment Companies filed as Item 7 herewith.
Item 11. Statement Regarding Basis for Approval of Investment Advisory Contract.
The statements regarding basis for approval of investment advisory contracts are incorporated by reference as part of the Financial Statements and Other Important Information for Open-End Management Investment Companies filed as Item 7 herewith.
Item 12. Disclosure of Proxy Voting Policies and Procedures for Closed-End Management Investment Companies.
Not applicable.
Item 13. Portfolio Managers of Closed-End Management Investment Companies.
Not applicable.
Item 14. Purchases of Equity Securities by Closed-End Management Investment Companies and Affiliated Purchasers.
Not applicable.
Item 15. Submission of Matters to a Vote of Securities Holders.
There were no material changes to the procedures by which shareholders may recommend nominees to the Registrant’s Board of Trustees.
Item 16. Controls and Procedures.
The Registrant’s principal executive officer and principal financial officer have concluded that the Registrant’s disclosure controls and procedures are sufficient to ensure that information required to be disclosed by the Registrant in this Form N-CSR was recorded, processed, summarized and reported within the time periods specified in the Securities and Exchange Commission’s rules and forms, based upon such officers’ evaluation of these controls and procedures as of a date within 90 days of the filing date of the report.
There were no changes in the Registrant’s internal control over financial reporting that occurred during the period covered by the report that have materially affected, or are reasonably likely to materially affect, the Registrant’s internal control over financial reporting.
Item 17. Disclosure of Securities Lending Activities for Closed-End Management Investment Companies.
Not applicable.
Item 18. Recovery of Erroneously Awarded Compensation.
Not applicable.
Item 19. Exhibits.
SIGNATURES
Pursuant to the requirements of the Securities Exchange Act of 1934 and the Investment Company Act of 1940, the Registrant has duly caused this report to be signed on its behalf by the undersigned, thereunto duly authorized.
| | |
| Natixis Funds Trust II |
| |
| By: | | /s/ David L. Giunta |
| Name: | | David L. Giunta |
| Title: | | President and Chief Executive Officer |
| Date: | | July 23, 2024 |
Pursuant to the requirements of the Securities Exchange Act of 1934 and the Investment Company Act of 1940, this report has been signed by the following persons on behalf of the Registrant and in the capacities and on the dates indicated.
| | |
| By: | | /s/ David L. Giunta |
| Name: | | David L. Giunta |
| Title: | | President and Chief Executive Officer |
| Date: | | July 23, 2024 |
| |
| By: | | /s/ Matthew J. Block |
| Name: | | Matthew J. Block |
| Title: | | Treasurer and Principal Financial and Accounting Officer |
| Date: | | July 23, 2024 |