0000052136natixis:NatixisIndexMorningstarLSTAUSLeveragedLoanIndex18027AdditionalIndexMember2020-07-31
UNITED STATES
SECURITIES AND EXCHANGE COMMISSION
Washington, D.C. 20549
FORM N-CSR
CERTIFIED SHAREHOLDER REPORT OF REGISTERED
MANAGEMENT INVESTMENT COMPANIES
Investment Company Act file number: 811-00242
Natixis Funds Trust II
(Exact name of Registrant as specified in charter)
888 Boylston Street, Suite 800 Boston, Massachusetts 02199-8197
(Address of principal executive offices) (Zip code)
Susan McWhan Tobin, Esq.
Natixis Distribution, LLC
888 Boylston Street, Suite 800
Boston, Massachusetts 02199-8197
(Name and address of agent for service)
Registrant’s telephone number, including area code: (617) 449-2139
Date of fiscal year end: November 30
Date of reporting period: November 30, 2024
Item 1. Reports to Stockholders.
| (a) | The Registrant’s annual report transmitted to shareholders pursuant to Rule 30e-1 under the Investment Company Act of 1940 is as follows: |
Loomis Sayles Global Growth Fund
Annual Shareholder Report - November 30, 2024
This annual shareholder report contains important information about Loomis Sayles Global Growth Fund for the period of December 1, 2023 to November 30, 2024. You can find additional information (including tax information) about the Fund at im.natixis.com/funddocuments. You can also request the information by contacting us at (800) 225-5478 or by contacting your financial intermediary directly.
What were the fund costs for the last year? (based on a hypothetical $10,000 investment)
| Class Name | Costs of a $10,000 investment | Costs paid as a percentage of a $10,000 investmentFootnote Reference† |
|---|
| Class Y | $109 | 0.95% |
|---|
| Footnote | Description |
Footnote† | Annualized for periods less than one year (if applicable). |
How did the fund perform last year and what affected its performance?
Explanation of Fund Performance
We are an active manager with a long-term, private equity approach to investing. Through our proprietary bottom-up research framework, we look to invest in those few high-quality businesses with sustainable competitive advantages and profitable growth when they trade at a significant discount to intrinsic value. Given the rare confluence of quality, growth, and valuation, ours is a selective, high-conviction portfolio of typically 30-45 names.
Top Contributors to Performance
• The Fund’s positions in Meta Platforms, Netflix, and Amazon.com contributed the most to performance.
• Stock selection in the consumer discretionary, communication services, healthcare, and information technology sectors, along with our allocations in the communication services and consumer staples sectors, contributed positively to relative performance.
Top Detractors from Performance
• The Fund’s positions in Boeing, Crispr Therapeutics, and Baidu detracted the most from performance.
• Stock selection in the industrials, consumer staples, and financials sectors, along with our allocations in the financials, healthcare, information technology, consumer discretionary, and industrials sectors, detracted from relative performance.
All aspects of our quality-growth-valuation investment thesis must be present simultaneously for us to make an investment. Often our research is completed well in advance of the opportunity to invest. We are patient investors and maintain coverage of high-quality businesses in order to take advantage of meaningful price dislocations if and when they occur. During the period, we added to our existing holdings in Boeing, Shopify, and Tesla. We trimmed our position in Meta Platforms as it reached our historic maximum allowable position size due to market appreciation. We sold our position in Sandoz which we received as a spin-off from existing holdings Novartis.
The Fund’s benchmarks are unmanaged indices used as a general measure of market performance. Calculations assume dividends and capital gains are reinvested. The tables do not reflect taxes shareholders might owe on any fund distributions or when they redeem their shares. You cannot invest directly in an index.
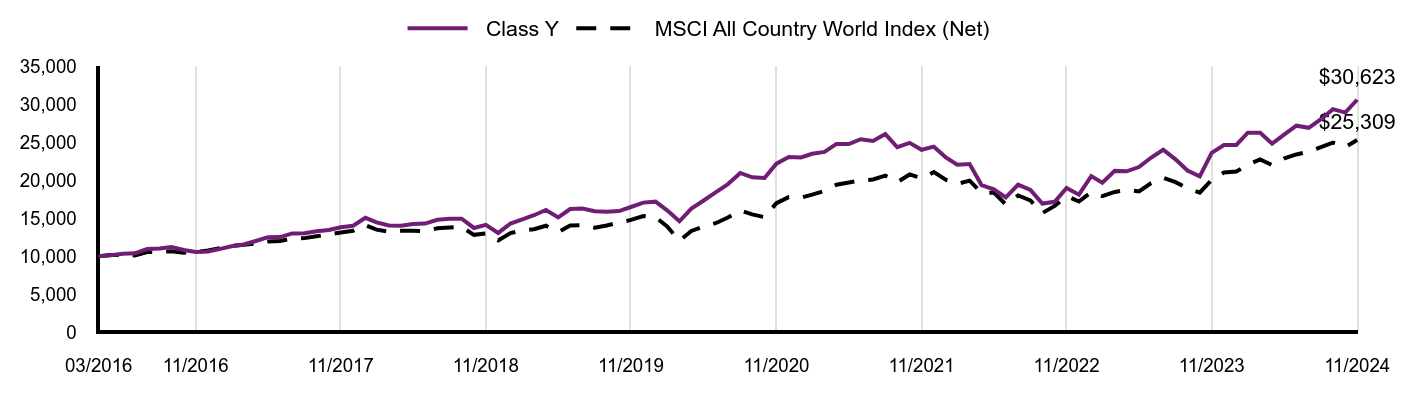
Total Return Based on a Hypothetical $10,000 Investment
| Class Y | MSCI All Country World Index (Net) |
|---|
| 03/2016 | $10,000 | $10,000 |
|---|
| 04/2016 | $10,120 | $10,148 |
|---|
| 05/2016 | $10,310 | $10,160 |
|---|
| 06/2016 | $10,370 | $10,099 |
|---|
| 07/2016 | $10,930 | $10,534 |
|---|
| 08/2016 | $11,010 | $10,570 |
|---|
| 09/2016 | $11,200 | $10,634 |
|---|
| 10/2016 | $10,810 | $10,454 |
|---|
| 11/2016 | $10,550 | $10,533 |
|---|
| 12/2016 | $10,608 | $10,761 |
|---|
| 01/2017 | $10,957 | $11,055 |
|---|
| 02/2017 | $11,305 | $11,365 |
|---|
| 03/2017 | $11,541 | $11,504 |
|---|
| 04/2017 | $12,002 | $11,683 |
|---|
| 05/2017 | $12,504 | $11,941 |
|---|
| 06/2017 | $12,515 | $11,996 |
|---|
| 07/2017 | $12,996 | $12,331 |
|---|
| 08/2017 | $13,037 | $12,378 |
|---|
| 09/2017 | $13,273 | $12,617 |
|---|
| 10/2017 | $13,447 | $12,879 |
|---|
| 11/2017 | $13,816 | $13,129 |
|---|
| 12/2017 | $14,003 | $13,340 |
|---|
| 01/2018 | $15,053 | $14,093 |
|---|
| 02/2018 | $14,449 | $13,501 |
|---|
| 03/2018 | $14,035 | $13,212 |
|---|
| 04/2018 | $14,025 | $13,338 |
|---|
| 05/2018 | $14,237 | $13,355 |
|---|
| 06/2018 | $14,300 | $13,283 |
|---|
| 07/2018 | $14,798 | $13,683 |
|---|
| 08/2018 | $14,936 | $13,791 |
|---|
| 09/2018 | $14,936 | $13,851 |
|---|
| 10/2018 | $13,717 | $12,813 |
|---|
| 11/2018 | $14,131 | $13,000 |
|---|
| 12/2018 | $13,064 | $12,084 |
|---|
| 01/2019 | $14,307 | $13,039 |
|---|
| 02/2019 | $14,829 | $13,387 |
|---|
| 03/2019 | $15,395 | $13,556 |
|---|
| 04/2019 | $16,083 | $14,013 |
|---|
| 05/2019 | $15,107 | $13,182 |
|---|
| 06/2019 | $16,217 | $14,045 |
|---|
| 07/2019 | $16,283 | $14,087 |
|---|
| 08/2019 | $15,917 | $13,752 |
|---|
| 09/2019 | $15,850 | $14,042 |
|---|
| 10/2019 | $15,950 | $14,426 |
|---|
| 11/2019 | $16,483 | $14,778 |
|---|
| 12/2019 | $17,060 | $15,299 |
|---|
| 01/2020 | $17,189 | $15,130 |
|---|
| 02/2020 | $16,050 | $13,908 |
|---|
| 03/2020 | $14,594 | $12,030 |
|---|
| 04/2020 | $16,273 | $13,319 |
|---|
| 05/2020 | $17,342 | $13,898 |
|---|
| 06/2020 | $18,422 | $14,342 |
|---|
| 07/2020 | $19,502 | $15,101 |
|---|
| 08/2020 | $20,970 | $16,025 |
|---|
| 09/2020 | $20,394 | $15,508 |
|---|
| 10/2020 | $20,300 | $15,131 |
|---|
| 11/2020 | $22,202 | $16,996 |
|---|
| 12/2020 | $23,087 | $17,785 |
|---|
| 01/2021 | $23,012 | $17,705 |
|---|
| 02/2021 | $23,499 | $18,115 |
|---|
| 03/2021 | $23,748 | $18,598 |
|---|
| 04/2021 | $24,801 | $19,412 |
|---|
| 05/2021 | $24,788 | $19,714 |
|---|
| 06/2021 | $25,424 | $19,973 |
|---|
| 07/2021 | $25,200 | $20,111 |
|---|
| 08/2021 | $26,098 | $20,614 |
|---|
| 09/2021 | $24,365 | $19,763 |
|---|
| 10/2021 | $24,938 | $20,772 |
|---|
| 11/2021 | $24,028 | $20,271 |
|---|
| 12/2021 | $24,440 | $21,082 |
|---|
| 01/2022 | $22,981 | $20,047 |
|---|
| 02/2022 | $22,056 | $19,529 |
|---|
| 03/2022 | $22,137 | $19,952 |
|---|
| 04/2022 | $19,369 | $18,355 |
|---|
| 05/2022 | $18,820 | $18,377 |
|---|
| 06/2022 | $17,735 | $16,828 |
|---|
| 07/2022 | $19,436 | $18,003 |
|---|
| 08/2022 | $18,726 | $17,340 |
|---|
| 09/2022 | $16,931 | $15,680 |
|---|
| 10/2022 | $17,172 | $16,626 |
|---|
| 11/2022 | $18,994 | $17,916 |
|---|
| 12/2022 | $18,111 | $17,211 |
|---|
| 01/2023 | $20,550 | $18,444 |
|---|
| 02/2023 | $19,684 | $17,916 |
|---|
| 03/2023 | $21,243 | $18,468 |
|---|
| 04/2023 | $21,185 | $18,734 |
|---|
| 05/2023 | $21,748 | $18,533 |
|---|
| 06/2023 | $22,974 | $19,609 |
|---|
| 07/2023 | $24,028 | $20,327 |
|---|
| 08/2023 | $22,772 | $19,759 |
|---|
| 09/2023 | $21,286 | $18,942 |
|---|
| 10/2023 | $20,521 | $18,372 |
|---|
| 11/2023 | $23,624 | $20,068 |
|---|
| 12/2023 | $24,648 | $21,032 |
|---|
| 01/2024 | $24,663 | $21,155 |
|---|
| 02/2024 | $26,279 | $22,063 |
|---|
| 03/2024 | $26,279 | $22,756 |
|---|
| 04/2024 | $24,836 | $22,005 |
|---|
| 05/2024 | $26,048 | $22,899 |
|---|
| 06/2024 | $27,203 | $23,409 |
|---|
| 07/2024 | $26,928 | $23,786 |
|---|
| 08/2024 | $28,054 | $24,390 |
|---|
| 09/2024 | $29,382 | $24,957 |
|---|
| 10/2024 | $28,934 | $24,397 |
|---|
| 11/2024 | $30,623 | $25,309 |
|---|
Performance data shown represents past performance and is no guarantee of, and is not necessarily indicative of, future results. Total return and value will vary, and you may have a gain or loss when shares are sold. Current performance may be lower or higher than quoted. For the most recent month-end performance, visit im.natixis.com/en-us/products/mutual-funds/price-and-performance.
Average Annual Total Returns (%)
| AATR | 1 Year | 5 Years | Since Inception 3/31/16 |
|---|
| Class Y | 29.63% | 13.19% | 13.78% |
|---|
| MSCI All Country World Index (Net) | 26.12% | 11.36% | 11.31% |
|---|
| Total Net Assets | $108,208,441 |
|---|
| # of Portfolio Holdings (including overnight repurchase agreements) | 46 |
|---|
| Portfolio Turnover Rate | 6% |
|---|
| Total Advisory Fees Paid (after waiver/reimbursement, if applicable) | $584,539 |
|---|
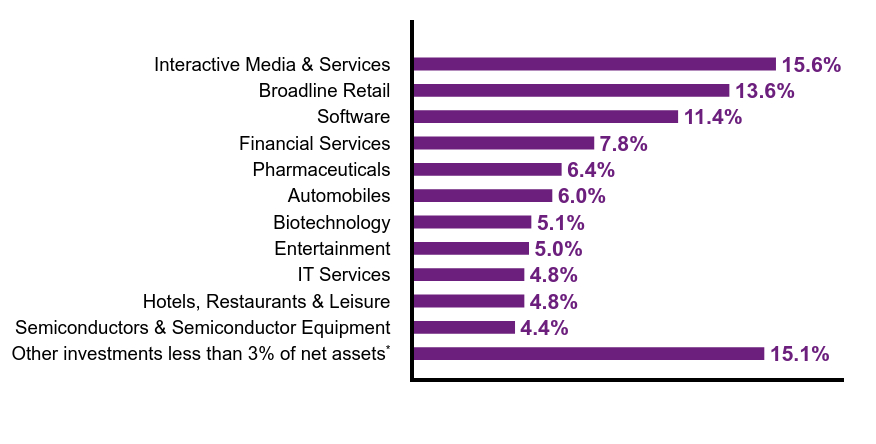
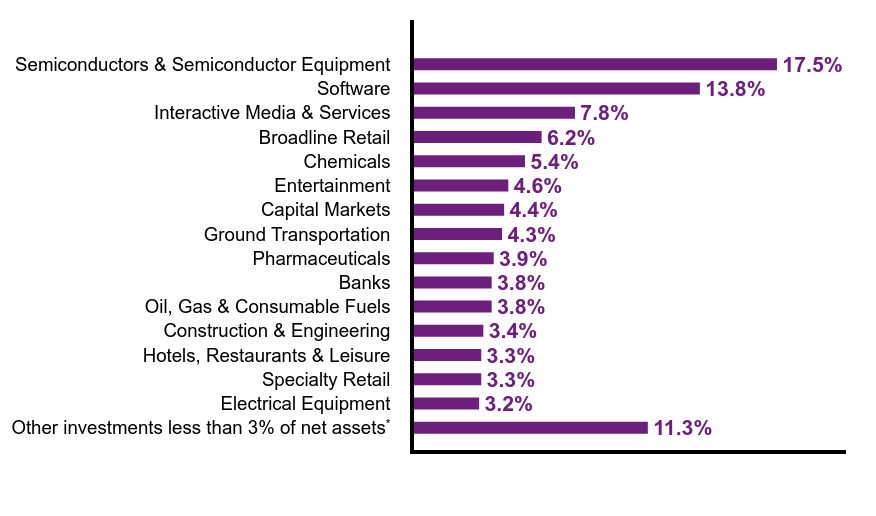
What did the Fund invest in? (% of Net Assets)
| Value | Value |
|---|
Other investments less than 3% of net assetsFootnote Reference* | 15.1% |
| Semiconductors & Semiconductor Equipment | 4.4% |
| Hotels, Restaurants & Leisure | 4.8% |
| IT Services | 4.8% |
| Entertainment | 5.0% |
| Biotechnology | 5.1% |
| Automobiles | 6.0% |
| Pharmaceuticals | 6.4% |
| Financial Services | 7.8% |
| Software | 11.4% |
| Broadline Retail | 13.6% |
| Interactive Media & Services | 15.6% |
| Footnote | Description |
Footnote* | Net of other assets less liabilities |
| Meta Platforms, Inc., Class A | 7.4% |
| MercadoLibre, Inc. | 6.5% |
| Amazon.com, Inc. | 6.2% |
| Tesla, Inc. | 6.0% |
| Netflix, Inc. | 5.0% |
| Shopify, Inc., Class A | 4.8% |
| Alphabet, Inc., Class A | 4.8% |
| Oracle Corp. | 4.6% |
| Microsoft Corp. | 3.6% |
| Visa, Inc., Class A | 3.6% |
There were no material fund changes during the period.
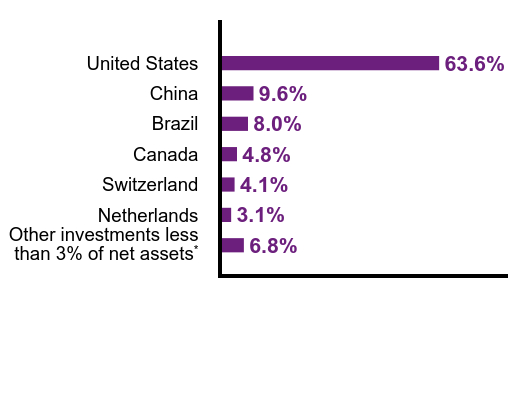
| Value | Value |
|---|
Other investments less than 3% of net assetsFootnote Reference* | 6.8% |
| Netherlands | 3.1% |
| Switzerland | 4.1% |
| Canada | 4.8% |
| Brazil | 8.0% |
| China | 9.6% |
| United States | 63.6% |
| Footnote | Description |
Footnote* | Net of other assets less liabilities |
There were no changes in or disagreements with Accountants during the period.
For additional information about the Fund; including its prospectus, financial information, holdings and proxy information, scan the QR code or visit im.natixis.com/funddocuments.
Loomis Sayles Global Growth Fund
Annual Shareholder Report
November 30, 2024
Loomis Sayles Global Growth Fund
Annual Shareholder Report - November 30, 2024
This annual shareholder report contains important information about Loomis Sayles Global Growth Fund for the period of December 1, 2023 to November 30, 2024. You can find additional information (including tax information) about the Fund at im.natixis.com/funddocuments. You can also request the information by contacting us at (800) 225-5478 or by contacting your financial intermediary directly.
What were the fund costs for the last year? (based on a hypothetical $10,000 investment)
| Class Name | Costs of a $10,000 investment | Costs paid as a percentage of a $10,000 investmentFootnote Reference† |
|---|
| Class A | $138 | 1.20% |
|---|
| Footnote | Description |
Footnote† | Annualized for periods less than one year (if applicable). |
How did the fund perform last year and what affected its performance?
Explanation of Fund Performance
We are an active manager with a long-term, private equity approach to investing. Through our proprietary bottom-up research framework, we look to invest in those few high-quality businesses with sustainable competitive advantages and profitable growth when they trade at a significant discount to intrinsic value. Given the rare confluence of quality, growth, and valuation, ours is a selective, high-conviction portfolio of typically 30-45 names.
Top Contributors to Performance
• The Fund’s positions in Meta Platforms, Netflix, and Amazon.com contributed the most to performance.
• Stock selection in the consumer discretionary, communication services, healthcare, and information technology sectors, along with our allocations in the communication services and consumer staples sectors, contributed positively to relative performance.
Top Detractors from Performance
• The Fund’s positions in Boeing, Crispr Therapeutics, and Baidu detracted the most from performance.
• Stock selection in the industrials, consumer staples, and financials sectors, along with our allocations in the financials, healthcare, information technology, consumer discretionary, and industrials sectors, detracted from relative performance.
All aspects of our quality-growth-valuation investment thesis must be present simultaneously for us to make an investment. Often our research is completed well in advance of the opportunity to invest. We are patient investors and maintain coverage of high-quality businesses in order to take advantage of meaningful price dislocations if and when they occur. During the period, we added to our existing holdings in Boeing, Shopify, and Tesla. We trimmed our position in Meta Platforms as it reached our historic maximum allowable position size due to market appreciation. We sold our position in Sandoz which we received as a spin-off from existing holdings Novartis.
The Fund’s benchmarks are unmanaged indices used as a general measure of market performance. Calculations assume dividends and capital gains are reinvested. The tables do not reflect taxes shareholders might owe on any fund distributions or when they redeem their shares. You cannot invest directly in an index.
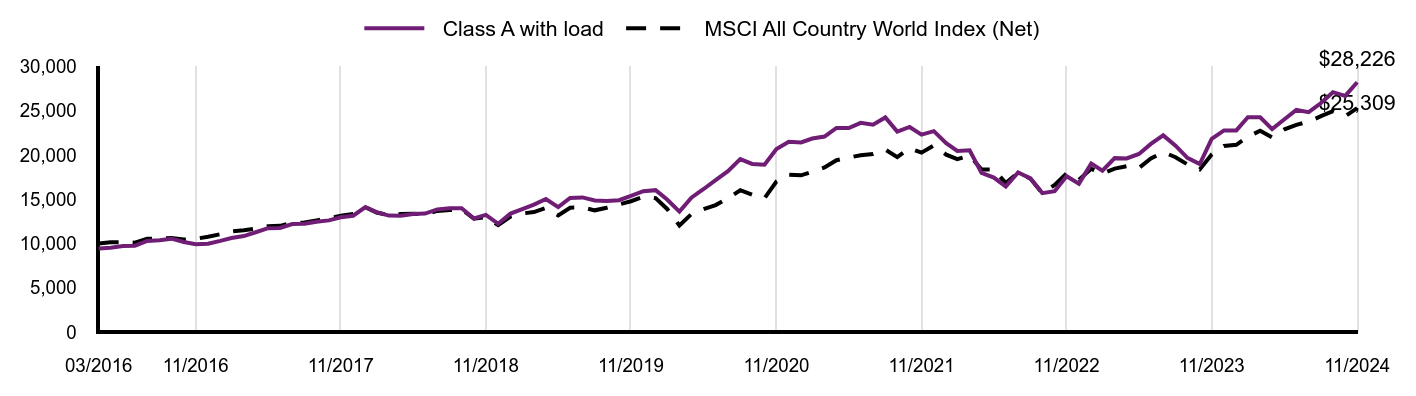
Total Return Based on a Hypothetical $10,000 Investment
| Class A with load | MSCI All Country World Index (Net) |
|---|
| 03/2016 | $9,425 | $10,000 |
|---|
| 04/2016 | $9,529 | $10,148 |
|---|
| 05/2016 | $9,708 | $10,160 |
|---|
| 06/2016 | $9,755 | $10,099 |
|---|
| 07/2016 | $10,292 | $10,534 |
|---|
| 08/2016 | $10,368 | $10,570 |
|---|
| 09/2016 | $10,547 | $10,634 |
|---|
| 10/2016 | $10,170 | $10,454 |
|---|
| 11/2016 | $9,925 | $10,533 |
|---|
| 12/2016 | $9,974 | $10,761 |
|---|
| 01/2017 | $10,302 | $11,055 |
|---|
| 02/2017 | $10,630 | $11,365 |
|---|
| 03/2017 | $10,842 | $11,504 |
|---|
| 04/2017 | $11,276 | $11,683 |
|---|
| 05/2017 | $11,739 | $11,941 |
|---|
| 06/2017 | $11,759 | $11,996 |
|---|
| 07/2017 | $12,202 | $12,331 |
|---|
| 08/2017 | $12,241 | $12,378 |
|---|
| 09/2017 | $12,463 | $12,617 |
|---|
| 10/2017 | $12,617 | $12,879 |
|---|
| 11/2017 | $12,964 | $13,129 |
|---|
| 12/2017 | $13,141 | $13,340 |
|---|
| 01/2018 | $14,117 | $14,093 |
|---|
| 02/2018 | $13,549 | $13,501 |
|---|
| 03/2018 | $13,161 | $13,212 |
|---|
| 04/2018 | $13,141 | $13,338 |
|---|
| 05/2018 | $13,340 | $13,355 |
|---|
| 06/2018 | $13,390 | $13,283 |
|---|
| 07/2018 | $13,858 | $13,683 |
|---|
| 08/2018 | $13,988 | $13,791 |
|---|
| 09/2018 | $13,988 | $13,851 |
|---|
| 10/2018 | $12,832 | $12,813 |
|---|
| 11/2018 | $13,231 | $13,000 |
|---|
| 12/2018 | $12,227 | $12,084 |
|---|
| 01/2019 | $13,383 | $13,039 |
|---|
| 02/2019 | $13,872 | $13,387 |
|---|
| 03/2019 | $14,402 | $13,556 |
|---|
| 04/2019 | $15,037 | $14,013 |
|---|
| 05/2019 | $14,121 | $13,182 |
|---|
| 06/2019 | $15,152 | $14,045 |
|---|
| 07/2019 | $15,214 | $14,087 |
|---|
| 08/2019 | $14,860 | $13,752 |
|---|
| 09/2019 | $14,808 | $14,042 |
|---|
| 10/2019 | $14,891 | $14,426 |
|---|
| 11/2019 | $15,381 | $14,778 |
|---|
| 12/2019 | $15,921 | $15,299 |
|---|
| 01/2020 | $16,031 | $15,130 |
|---|
| 02/2020 | $14,974 | $13,908 |
|---|
| 03/2020 | $13,609 | $12,030 |
|---|
| 04/2020 | $15,184 | $13,319 |
|---|
| 05/2020 | $16,164 | $13,898 |
|---|
| 06/2020 | $17,166 | $14,342 |
|---|
| 07/2020 | $18,179 | $15,101 |
|---|
| 08/2020 | $19,533 | $16,025 |
|---|
| 09/2020 | $18,993 | $15,508 |
|---|
| 10/2020 | $18,905 | $15,131 |
|---|
| 11/2020 | $20,667 | $16,996 |
|---|
| 12/2020 | $21,497 | $17,785 |
|---|
| 01/2021 | $21,427 | $17,705 |
|---|
| 02/2021 | $21,871 | $18,115 |
|---|
| 03/2021 | $22,093 | $18,598 |
|---|
| 04/2021 | $23,069 | $19,412 |
|---|
| 05/2021 | $23,058 | $19,714 |
|---|
| 06/2021 | $23,643 | $19,973 |
|---|
| 07/2021 | $23,432 | $20,111 |
|---|
| 08/2021 | $24,251 | $20,614 |
|---|
| 09/2021 | $22,648 | $19,763 |
|---|
| 10/2021 | $23,175 | $20,772 |
|---|
| 11/2021 | $22,309 | $20,271 |
|---|
| 12/2021 | $22,696 | $21,082 |
|---|
| 01/2022 | $21,338 | $20,047 |
|---|
| 02/2022 | $20,470 | $19,529 |
|---|
| 03/2022 | $20,546 | $19,952 |
|---|
| 04/2022 | $17,972 | $18,355 |
|---|
| 05/2022 | $17,457 | $18,377 |
|---|
| 06/2022 | $16,438 | $16,828 |
|---|
| 07/2022 | $18,023 | $18,003 |
|---|
| 08/2022 | $17,356 | $17,340 |
|---|
| 09/2022 | $15,696 | $15,680 |
|---|
| 10/2022 | $15,910 | $16,626 |
|---|
| 11/2022 | $17,608 | $17,916 |
|---|
| 12/2022 | $16,768 | $17,211 |
|---|
| 01/2023 | $19,030 | $18,444 |
|---|
| 02/2023 | $18,231 | $17,916 |
|---|
| 03/2023 | $19,653 | $18,468 |
|---|
| 04/2023 | $19,612 | $18,734 |
|---|
| 05/2023 | $20,127 | $18,533 |
|---|
| 06/2023 | $21,265 | $19,609 |
|---|
| 07/2023 | $22,226 | $20,327 |
|---|
| 08/2023 | $21,061 | $19,759 |
|---|
| 09/2023 | $19,680 | $18,942 |
|---|
| 10/2023 | $18,976 | $18,372 |
|---|
| 11/2023 | $21,820 | $20,068 |
|---|
| 12/2023 | $22,781 | $21,032 |
|---|
| 01/2024 | $22,781 | $21,155 |
|---|
| 02/2024 | $24,271 | $22,063 |
|---|
| 03/2024 | $24,271 | $22,756 |
|---|
| 04/2024 | $22,930 | $22,005 |
|---|
| 05/2024 | $24,041 | $22,899 |
|---|
| 06/2024 | $25,098 | $23,409 |
|---|
| 07/2024 | $24,854 | $23,786 |
|---|
| 08/2024 | $25,883 | $24,390 |
|---|
| 09/2024 | $27,102 | $24,957 |
|---|
| 10/2024 | $26,682 | $24,397 |
|---|
| 11/2024 | $28,226 | $25,309 |
|---|
Performance data shown represents past performance and is no guarantee of, and is not necessarily indicative of, future results. Total return and value will vary, and you may have a gain or loss when shares are sold. Current performance may be lower or higher than quoted. For the most recent month-end performance, visit im.natixis.com/en-us/products/mutual-funds/price-and-performance.
Average Annual Total Returns (%)
| AATR | 1 Year | 5 Years | Since Inception 3/31/16 |
|---|
| Class A at NAV | 29.36% | 12.91% | 13.49% |
|---|
Class A with 5.75% MSCFootnote Reference1 | 21.94% | 11.58% | 12.72% |
|---|
| MSCI All Country World Index (Net) | 26.12% | 11.36% | 11.31% |
|---|
| Footnote | Description |
Footnote1 | Maximum sales charge |
| Total Net Assets | $108,208,441 |
|---|
| # of Portfolio Holdings (including overnight repurchase agreements) | 46 |
|---|
| Portfolio Turnover Rate | 6% |
|---|
| Total Advisory Fees Paid (after waiver/reimbursement, if applicable) | $584,539 |
|---|
What did the Fund invest in? (% of Net Assets)
| Value | Value |
|---|
Other investments less than 3% of net assetsFootnote Reference* | 15.1% |
| Semiconductors & Semiconductor Equipment | 4.4% |
| Hotels, Restaurants & Leisure | 4.8% |
| IT Services | 4.8% |
| Entertainment | 5.0% |
| Biotechnology | 5.1% |
| Automobiles | 6.0% |
| Pharmaceuticals | 6.4% |
| Financial Services | 7.8% |
| Software | 11.4% |
| Broadline Retail | 13.6% |
| Interactive Media & Services | 15.6% |
| Footnote | Description |
Footnote* | Net of other assets less liabilities |
| Meta Platforms, Inc., Class A | 7.4% |
| MercadoLibre, Inc. | 6.5% |
| Amazon.com, Inc. | 6.2% |
| Tesla, Inc. | 6.0% |
| Netflix, Inc. | 5.0% |
| Shopify, Inc., Class A | 4.8% |
| Alphabet, Inc., Class A | 4.8% |
| Oracle Corp. | 4.6% |
| Microsoft Corp. | 3.6% |
| Visa, Inc., Class A | 3.6% |
There were no material fund changes during the period.
| Value | Value |
|---|
Other investments less than 3% of net assetsFootnote Reference* | 6.8% |
| Netherlands | 3.1% |
| Switzerland | 4.1% |
| Canada | 4.8% |
| Brazil | 8.0% |
| China | 9.6% |
| United States | 63.6% |
| Footnote | Description |
Footnote* | Net of other assets less liabilities |
There were no changes in or disagreements with Accountants during the period.
For additional information about the Fund; including its prospectus, financial information, holdings and proxy information, scan the QR code or visit im.natixis.com/funddocuments.
Loomis Sayles Global Growth Fund
Annual Shareholder Report
November 30, 2024
Loomis Sayles Global Growth Fund
Annual Shareholder Report - November 30, 2024
This annual shareholder report contains important information about Loomis Sayles Global Growth Fund for the period of December 1, 2023 to November 30, 2024. You can find additional information (including tax information) about the Fund at im.natixis.com/funddocuments. You can also request the information by contacting us at (800) 225-5478 or by contacting your financial intermediary directly.
What were the fund costs for the last year? (based on a hypothetical $10,000 investment)
| Class Name | Costs of a $10,000 investment | Costs paid as a percentage of a $10,000 investmentFootnote Reference† |
|---|
| Class C | $223 | 1.95% |
|---|
| Footnote | Description |
Footnote† | Annualized for periods less than one year (if applicable). |
How did the fund perform last year and what affected its performance?
Explanation of Fund Performance
We are an active manager with a long-term, private equity approach to investing. Through our proprietary bottom-up research framework, we look to invest in those few high-quality businesses with sustainable competitive advantages and profitable growth when they trade at a significant discount to intrinsic value. Given the rare confluence of quality, growth, and valuation, ours is a selective, high-conviction portfolio of typically 30-45 names.
Top Contributors to Performance
• The Fund’s positions in Meta Platforms, Netflix, and Amazon.com contributed the most to performance.
• Stock selection in the consumer discretionary, communication services, healthcare, and information technology sectors, along with our allocations in the communication services and consumer staples sectors, contributed positively to relative performance.
Top Detractors from Performance
• The Fund’s positions in Boeing, Crispr Therapeutics, and Baidu detracted the most from performance.
• Stock selection in the industrials, consumer staples, and financials sectors, along with our allocations in the financials, healthcare, information technology, consumer discretionary, and industrials sectors, detracted from relative performance.
All aspects of our quality-growth-valuation investment thesis must be present simultaneously for us to make an investment. Often our research is completed well in advance of the opportunity to invest. We are patient investors and maintain coverage of high-quality businesses in order to take advantage of meaningful price dislocations if and when they occur. During the period, we added to our existing holdings in Boeing, Shopify, and Tesla. We trimmed our position in Meta Platforms as it reached our historic maximum allowable position size due to market appreciation. We sold our position in Sandoz which we received as a spin-off from existing holdings Novartis.
The Fund’s benchmarks are unmanaged indices used as a general measure of market performance. Calculations assume dividends and capital gains are reinvested. The tables do not reflect taxes shareholders might owe on any fund distributions or when they redeem their shares. You cannot invest directly in an index.
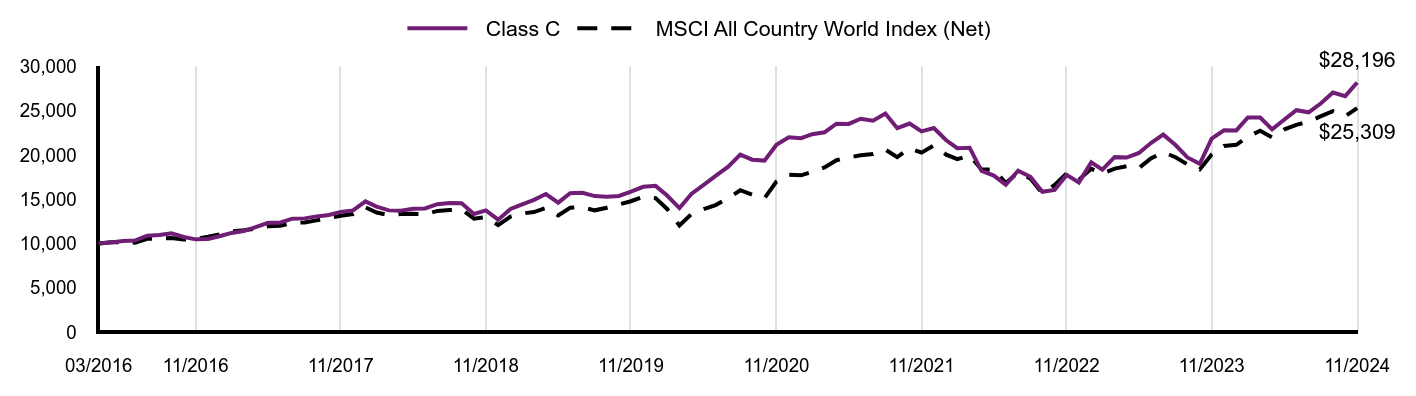
Total Return Based on a Hypothetical $10,000 Investment
| Class C | MSCI All Country World Index (Net) |
|---|
| 03/2016 | $10,000 | $10,000 |
|---|
| 04/2016 | $10,110 | $10,148 |
|---|
| 05/2016 | $10,290 | $10,160 |
|---|
| 06/2016 | $10,340 | $10,099 |
|---|
| 07/2016 | $10,890 | $10,534 |
|---|
| 08/2016 | $10,970 | $10,570 |
|---|
| 09/2016 | $11,150 | $10,634 |
|---|
| 10/2016 | $10,740 | $10,454 |
|---|
| 11/2016 | $10,470 | $10,533 |
|---|
| 12/2016 | $10,514 | $10,761 |
|---|
| 01/2017 | $10,851 | $11,055 |
|---|
| 02/2017 | $11,198 | $11,365 |
|---|
| 03/2017 | $11,412 | $11,504 |
|---|
| 04/2017 | $11,862 | $11,683 |
|---|
| 05/2017 | $12,341 | $11,941 |
|---|
| 06/2017 | $12,352 | $11,996 |
|---|
| 07/2017 | $12,811 | $12,331 |
|---|
| 08/2017 | $12,842 | $12,378 |
|---|
| 09/2017 | $13,066 | $12,617 |
|---|
| 10/2017 | $13,219 | $12,879 |
|---|
| 11/2017 | $13,577 | $13,129 |
|---|
| 12/2017 | $13,746 | $13,340 |
|---|
| 01/2018 | $14,767 | $14,093 |
|---|
| 02/2018 | $14,167 | $13,501 |
|---|
| 03/2018 | $13,746 | $13,212 |
|---|
| 04/2018 | $13,715 | $13,338 |
|---|
| 05/2018 | $13,925 | $13,355 |
|---|
| 06/2018 | $13,967 | $13,283 |
|---|
| 07/2018 | $14,441 | $13,683 |
|---|
| 08/2018 | $14,567 | $13,791 |
|---|
| 09/2018 | $14,557 | $13,851 |
|---|
| 10/2018 | $13,346 | $12,813 |
|---|
| 11/2018 | $13,746 | $13,000 |
|---|
| 12/2018 | $12,698 | $12,084 |
|---|
| 01/2019 | $13,903 | $13,039 |
|---|
| 02/2019 | $14,385 | $13,387 |
|---|
| 03/2019 | $14,932 | $13,556 |
|---|
| 04/2019 | $15,590 | $14,013 |
|---|
| 05/2019 | $14,615 | $13,182 |
|---|
| 06/2019 | $15,677 | $14,045 |
|---|
| 07/2019 | $15,732 | $14,087 |
|---|
| 08/2019 | $15,360 | $13,752 |
|---|
| 09/2019 | $15,294 | $14,042 |
|---|
| 10/2019 | $15,371 | $14,426 |
|---|
| 11/2019 | $15,864 | $14,778 |
|---|
| 12/2019 | $16,411 | $15,299 |
|---|
| 01/2020 | $16,515 | $15,130 |
|---|
| 02/2020 | $15,424 | $13,908 |
|---|
| 03/2020 | $14,008 | $12,030 |
|---|
| 04/2020 | $15,610 | $13,319 |
|---|
| 05/2020 | $16,620 | $13,898 |
|---|
| 06/2020 | $17,641 | $14,342 |
|---|
| 07/2020 | $18,662 | $15,101 |
|---|
| 08/2020 | $20,043 | $16,025 |
|---|
| 09/2020 | $19,475 | $15,508 |
|---|
| 10/2020 | $19,370 | $15,131 |
|---|
| 11/2020 | $21,169 | $16,996 |
|---|
| 12/2020 | $21,997 | $17,785 |
|---|
| 01/2021 | $21,910 | $17,705 |
|---|
| 02/2021 | $22,355 | $18,115 |
|---|
| 03/2021 | $22,565 | $18,598 |
|---|
| 04/2021 | $23,546 | $19,412 |
|---|
| 05/2021 | $23,522 | $19,714 |
|---|
| 06/2021 | $24,102 | $19,973 |
|---|
| 07/2021 | $23,880 | $20,111 |
|---|
| 08/2021 | $24,695 | $20,614 |
|---|
| 09/2021 | $23,040 | $19,763 |
|---|
| 10/2021 | $23,559 | $20,772 |
|---|
| 11/2021 | $22,682 | $20,271 |
|---|
| 12/2021 | $23,053 | $21,082 |
|---|
| 01/2022 | $21,668 | $20,047 |
|---|
| 02/2022 | $20,775 | $19,529 |
|---|
| 03/2022 | $20,829 | $19,952 |
|---|
| 04/2022 | $18,210 | $18,355 |
|---|
| 05/2022 | $17,677 | $18,377 |
|---|
| 06/2022 | $16,638 | $16,828 |
|---|
| 07/2022 | $18,236 | $18,003 |
|---|
| 08/2022 | $17,544 | $17,340 |
|---|
| 09/2022 | $15,852 | $15,680 |
|---|
| 10/2022 | $16,065 | $16,626 |
|---|
| 11/2022 | $17,757 | $17,916 |
|---|
| 12/2022 | $16,907 | $17,211 |
|---|
| 01/2023 | $19,168 | $18,444 |
|---|
| 02/2023 | $18,347 | $17,916 |
|---|
| 03/2023 | $19,787 | $18,468 |
|---|
| 04/2023 | $19,715 | $18,734 |
|---|
| 05/2023 | $20,234 | $18,533 |
|---|
| 06/2023 | $21,357 | $19,609 |
|---|
| 07/2023 | $22,307 | $20,327 |
|---|
| 08/2023 | $21,126 | $19,759 |
|---|
| 09/2023 | $19,730 | $18,942 |
|---|
| 10/2023 | $19,009 | $18,372 |
|---|
| 11/2023 | $21,846 | $20,068 |
|---|
| 12/2023 | $22,797 | $21,032 |
|---|
| 01/2024 | $22,783 | $21,155 |
|---|
| 02/2024 | $24,251 | $22,063 |
|---|
| 03/2024 | $24,237 | $22,756 |
|---|
| 04/2024 | $22,905 | $22,005 |
|---|
| 05/2024 | $24,015 | $22,899 |
|---|
| 06/2024 | $25,070 | $23,409 |
|---|
| 07/2024 | $24,827 | $23,786 |
|---|
| 08/2024 | $25,855 | $24,390 |
|---|
| 09/2024 | $27,073 | $24,957 |
|---|
| 10/2024 | $26,653 | $24,397 |
|---|
| 11/2024 | $28,196 | $25,309 |
|---|
Performance data shown represents past performance and is no guarantee of, and is not necessarily indicative of, future results. Total return and value will vary, and you may have a gain or loss when shares are sold. Current performance may be lower or higher than quoted. For the most recent month-end performance, visit im.natixis.com/en-us/products/mutual-funds/price-and-performance.
Average Annual Total Returns (%)
| AATR | 1 Year | 5 Years | Since Inception 3/31/16 |
|---|
| Class C at NAV | 28.41% | 12.08% | 12.70% |
|---|
Class C with 1.00% CDSCFootnote Reference1 | 27.41% | 12.08% | 12.70% |
|---|
| MSCI All Country World Index (Net) | 26.12% | 11.36% | 11.31% |
|---|
| Footnote | Description |
Footnote1 | Contingent deferred sales charge |
| Total Net Assets | $108,208,441 |
|---|
| # of Portfolio Holdings (including overnight repurchase agreements) | 46 |
|---|
| Portfolio Turnover Rate | 6% |
|---|
| Total Advisory Fees Paid (after waiver/reimbursement, if applicable) | $584,539 |
|---|
What did the Fund invest in? (% of Net Assets)
| Value | Value |
|---|
Other investments less than 3% of net assetsFootnote Reference* | 15.1% |
| Semiconductors & Semiconductor Equipment | 4.4% |
| Hotels, Restaurants & Leisure | 4.8% |
| IT Services | 4.8% |
| Entertainment | 5.0% |
| Biotechnology | 5.1% |
| Automobiles | 6.0% |
| Pharmaceuticals | 6.4% |
| Financial Services | 7.8% |
| Software | 11.4% |
| Broadline Retail | 13.6% |
| Interactive Media & Services | 15.6% |
| Footnote | Description |
Footnote* | Net of other assets less liabilities |
| Meta Platforms, Inc., Class A | 7.4% |
| MercadoLibre, Inc. | 6.5% |
| Amazon.com, Inc. | 6.2% |
| Tesla, Inc. | 6.0% |
| Netflix, Inc. | 5.0% |
| Shopify, Inc., Class A | 4.8% |
| Alphabet, Inc., Class A | 4.8% |
| Oracle Corp. | 4.6% |
| Microsoft Corp. | 3.6% |
| Visa, Inc., Class A | 3.6% |
There were no material fund changes during the period.
| Value | Value |
|---|
Other investments less than 3% of net assetsFootnote Reference* | 6.8% |
| Netherlands | 3.1% |
| Switzerland | 4.1% |
| Canada | 4.8% |
| Brazil | 8.0% |
| China | 9.6% |
| United States | 63.6% |
| Footnote | Description |
Footnote* | Net of other assets less liabilities |
There were no changes in or disagreements with Accountants during the period.
For additional information about the Fund; including its prospectus, financial information, holdings and proxy information, scan the QR code or visit im.natixis.com/funddocuments.
Loomis Sayles Global Growth Fund
Annual Shareholder Report
November 30, 2024
Loomis Sayles Global Growth Fund
Annual Shareholder Report - November 30, 2024
This annual shareholder report contains important information about Loomis Sayles Global Growth Fund for the period of December 1, 2023 to November 30, 2024. You can find additional information (including tax information) about the Fund at im.natixis.com/funddocuments. You can also request the information by contacting us at (800) 225-5478 or by contacting your financial intermediary directly.
What were the fund costs for the last year? (based on a hypothetical $10,000 investment)
| Class Name | Costs of a $10,000 investment | Costs paid as a percentage of a $10,000 investmentFootnote Reference† |
|---|
| Class N | $103 | 0.90% |
|---|
| Footnote | Description |
Footnote† | Annualized for periods less than one year (if applicable). |
How did the fund perform last year and what affected its performance?
Explanation of Fund Performance
We are an active manager with a long-term, private equity approach to investing. Through our proprietary bottom-up research framework, we look to invest in those few high-quality businesses with sustainable competitive advantages and profitable growth when they trade at a significant discount to intrinsic value. Given the rare confluence of quality, growth, and valuation, ours is a selective, high-conviction portfolio of typically 30-45 names.
Top Contributors to Performance
• The Fund’s positions in Meta Platforms, Netflix, and Amazon.com contributed the most to performance.
• Stock selection in the consumer discretionary, communication services, healthcare, and information technology sectors, along with our allocations in the communication services and consumer staples sectors, contributed positively to relative performance.
Top Detractors from Performance
• The Fund’s positions in Boeing, Crispr Therapeutics, and Baidu detracted the most from performance.
• Stock selection in the industrials, consumer staples, and financials sectors, along with our allocations in the financials, healthcare, information technology, consumer discretionary, and industrials sectors, detracted from relative performance.
All aspects of our quality-growth-valuation investment thesis must be present simultaneously for us to make an investment. Often our research is completed well in advance of the opportunity to invest. We are patient investors and maintain coverage of high-quality businesses in order to take advantage of meaningful price dislocations if and when they occur. During the period, we added to our existing holdings in Boeing, Shopify, and Tesla. We trimmed our position in Meta Platforms as it reached our historic maximum allowable position size due to market appreciation. We sold our position in Sandoz which we received as a spin-off from existing holdings Novartis.
The Fund’s benchmarks are unmanaged indices used as a general measure of market performance. Calculations assume dividends and capital gains are reinvested. The tables do not reflect taxes shareholders might owe on any fund distributions or when they redeem their shares. You cannot invest directly in an index.
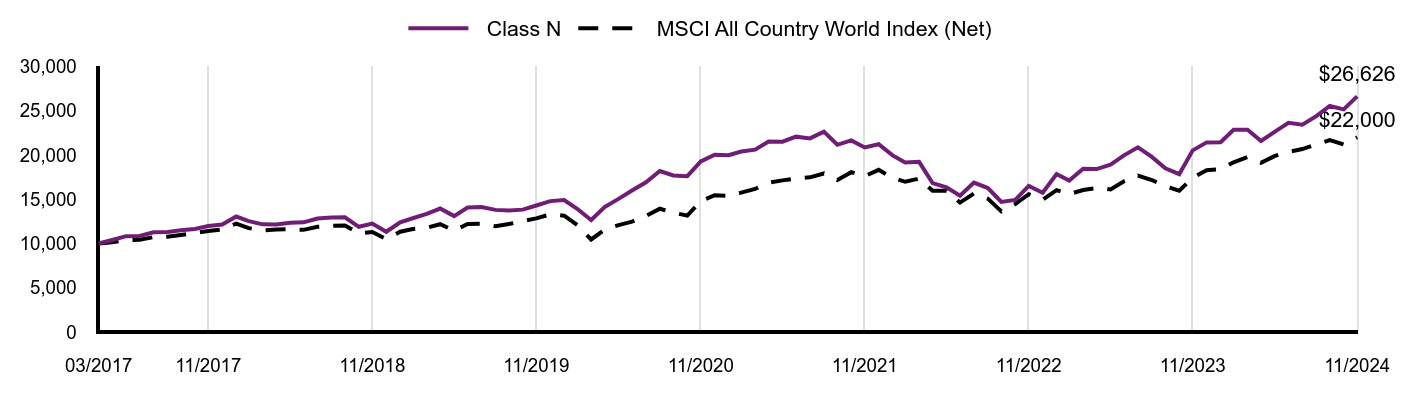
Total Return Based on a Hypothetical $10,000 Investment
| Class N | MSCI All Country World Index (Net) |
|---|
| 03/2017 | $10,000 | $10,000 |
|---|
| 04/2017 | $10,400 | $10,156 |
|---|
| 05/2017 | $10,835 | $10,380 |
|---|
| 06/2017 | $10,844 | $10,427 |
|---|
| 07/2017 | $11,261 | $10,719 |
|---|
| 08/2017 | $11,297 | $10,760 |
|---|
| 09/2017 | $11,510 | $10,968 |
|---|
| 10/2017 | $11,652 | $11,195 |
|---|
| 11/2017 | $11,980 | $11,412 |
|---|
| 12/2017 | $12,138 | $11,596 |
|---|
| 01/2018 | $13,047 | $12,250 |
|---|
| 02/2018 | $12,533 | $11,736 |
|---|
| 03/2018 | $12,165 | $11,485 |
|---|
| 04/2018 | $12,156 | $11,594 |
|---|
| 05/2018 | $12,340 | $11,609 |
|---|
| 06/2018 | $12,395 | $11,546 |
|---|
| 07/2018 | $12,827 | $11,894 |
|---|
| 08/2018 | $12,946 | $11,988 |
|---|
| 09/2018 | $12,955 | $12,040 |
|---|
| 10/2018 | $11,890 | $11,137 |
|---|
| 11/2018 | $12,257 | $11,300 |
|---|
| 12/2018 | $11,329 | $10,504 |
|---|
| 01/2019 | $12,407 | $11,334 |
|---|
| 02/2019 | $12,859 | $11,637 |
|---|
| 03/2019 | $13,360 | $11,783 |
|---|
| 04/2019 | $13,956 | $12,181 |
|---|
| 05/2019 | $13,100 | $11,459 |
|---|
| 06/2019 | $14,062 | $12,209 |
|---|
| 07/2019 | $14,120 | $12,245 |
|---|
| 08/2019 | $13,802 | $11,954 |
|---|
| 09/2019 | $13,745 | $12,206 |
|---|
| 10/2019 | $13,831 | $12,540 |
|---|
| 11/2019 | $14,293 | $12,846 |
|---|
| 12/2019 | $14,794 | $13,298 |
|---|
| 01/2020 | $14,906 | $13,151 |
|---|
| 02/2020 | $13,928 | $12,089 |
|---|
| 03/2020 | $12,655 | $10,457 |
|---|
| 04/2020 | $14,122 | $11,577 |
|---|
| 05/2020 | $15,048 | $12,081 |
|---|
| 06/2020 | $15,985 | $12,467 |
|---|
| 07/2020 | $16,921 | $13,126 |
|---|
| 08/2020 | $18,194 | $13,930 |
|---|
| 09/2020 | $17,695 | $13,480 |
|---|
| 10/2020 | $17,614 | $13,153 |
|---|
| 11/2020 | $19,273 | $14,774 |
|---|
| 12/2020 | $20,041 | $15,460 |
|---|
| 01/2021 | $19,976 | $15,390 |
|---|
| 02/2021 | $20,397 | $15,746 |
|---|
| 03/2021 | $20,614 | $16,167 |
|---|
| 04/2021 | $21,527 | $16,874 |
|---|
| 05/2021 | $21,516 | $17,136 |
|---|
| 06/2021 | $22,078 | $17,362 |
|---|
| 07/2021 | $21,883 | $17,482 |
|---|
| 08/2021 | $22,651 | $17,919 |
|---|
| 09/2021 | $21,159 | $17,179 |
|---|
| 10/2021 | $21,656 | $18,056 |
|---|
| 11/2021 | $20,856 | $17,621 |
|---|
| 12/2021 | $21,225 | $18,326 |
|---|
| 01/2022 | $19,959 | $17,426 |
|---|
| 02/2022 | $19,158 | $16,976 |
|---|
| 03/2022 | $19,228 | $17,343 |
|---|
| 04/2022 | $16,828 | $15,955 |
|---|
| 05/2022 | $16,352 | $15,974 |
|---|
| 06/2022 | $15,400 | $14,627 |
|---|
| 07/2022 | $16,886 | $15,649 |
|---|
| 08/2022 | $16,271 | $15,073 |
|---|
| 09/2022 | $14,703 | $13,630 |
|---|
| 10/2022 | $14,923 | $14,452 |
|---|
| 11/2022 | $16,503 | $15,573 |
|---|
| 12/2022 | $15,735 | $14,960 |
|---|
| 01/2023 | $17,851 | $16,033 |
|---|
| 02/2023 | $17,112 | $15,573 |
|---|
| 03/2023 | $18,452 | $16,053 |
|---|
| 04/2023 | $18,414 | $16,284 |
|---|
| 05/2023 | $18,902 | $16,110 |
|---|
| 06/2023 | $19,966 | $17,045 |
|---|
| 07/2023 | $20,880 | $17,669 |
|---|
| 08/2023 | $19,791 | $17,175 |
|---|
| 09/2023 | $18,502 | $16,465 |
|---|
| 10/2023 | $17,838 | $15,970 |
|---|
| 11/2023 | $20,530 | $17,444 |
|---|
| 12/2023 | $21,431 | $18,282 |
|---|
| 01/2024 | $21,444 | $18,389 |
|---|
| 02/2024 | $22,846 | $19,178 |
|---|
| 03/2024 | $22,858 | $19,780 |
|---|
| 04/2024 | $21,594 | $19,128 |
|---|
| 05/2024 | $22,645 | $19,905 |
|---|
| 06/2024 | $23,647 | $20,348 |
|---|
| 07/2024 | $23,421 | $20,676 |
|---|
| 08/2024 | $24,398 | $21,201 |
|---|
| 09/2024 | $25,550 | $21,694 |
|---|
| 10/2024 | $25,162 | $21,207 |
|---|
| 11/2024 | $26,626 | $22,000 |
|---|
Performance data shown represents past performance and is no guarantee of, and is not necessarily indicative of, future results. Total return and value will vary, and you may have a gain or loss when shares are sold. Current performance may be lower or higher than quoted. For the most recent month-end performance, visit im.natixis.com/en-us/products/mutual-funds/price-and-performance.
Average Annual Total Returns (%)
| AATR | 1 Year | 5 Years | Since Inception 3/31/17 |
|---|
| Class N | 29.70% | 13.25% | 13.62% |
|---|
| MSCI All Country World Index (Net) | 26.12% | 11.36% | 10.83% |
|---|
| Total Net Assets | $108,208,441 |
|---|
| # of Portfolio Holdings (including overnight repurchase agreements) | 46 |
|---|
| Portfolio Turnover Rate | 6% |
|---|
| Total Advisory Fees Paid (after waiver/reimbursement, if applicable) | $584,539 |
|---|
What did the Fund invest in? (% of Net Assets)
| Value | Value |
|---|
Other investments less than 3% of net assetsFootnote Reference* | 15.1% |
| Semiconductors & Semiconductor Equipment | 4.4% |
| Hotels, Restaurants & Leisure | 4.8% |
| IT Services | 4.8% |
| Entertainment | 5.0% |
| Biotechnology | 5.1% |
| Automobiles | 6.0% |
| Pharmaceuticals | 6.4% |
| Financial Services | 7.8% |
| Software | 11.4% |
| Broadline Retail | 13.6% |
| Interactive Media & Services | 15.6% |
| Footnote | Description |
Footnote* | Net of other assets less liabilities |
| Meta Platforms, Inc., Class A | 7.4% |
| MercadoLibre, Inc. | 6.5% |
| Amazon.com, Inc. | 6.2% |
| Tesla, Inc. | 6.0% |
| Netflix, Inc. | 5.0% |
| Shopify, Inc., Class A | 4.8% |
| Alphabet, Inc., Class A | 4.8% |
| Oracle Corp. | 4.6% |
| Microsoft Corp. | 3.6% |
| Visa, Inc., Class A | 3.6% |
There were no material fund changes during the period.
| Value | Value |
|---|
Other investments less than 3% of net assetsFootnote Reference* | 6.8% |
| Netherlands | 3.1% |
| Switzerland | 4.1% |
| Canada | 4.8% |
| Brazil | 8.0% |
| China | 9.6% |
| United States | 63.6% |
| Footnote | Description |
Footnote* | Net of other assets less liabilities |
There were no changes in or disagreements with Accountants during the period.
For additional information about the Fund; including its prospectus, financial information, holdings and proxy information, scan the QR code or visit im.natixis.com/funddocuments.
Loomis Sayles Global Growth Fund
Annual Shareholder Report
November 30, 2024
Loomis Sayles Senior Floating Rate and Fixed Income Fund
Annual Shareholder Report - November 30, 2024
This annual shareholder report contains important information about Loomis Sayles Senior Floating Rate and Fixed Income Fund for the period of December 1, 2023 to November 30, 2024. You can find additional information (including tax information) about the Fund at im.natixis.com/funddocuments. You can also request the information by contacting us at (800) 225-5478 or by contacting your financial intermediary directly. This report describes changes to the Fund that occurred during the reporting period.
What were the fund costs for the last year? (based on a hypothetical $10,000 investment)
| Class Name | Costs of a $10,000 investment | Costs paid as a percentage of a $10,000 investmentFootnote Reference† |
|---|
| Class Y | $78 | 0.74% |
|---|
| Footnote | Description |
Footnote† | Annualized for periods less than one year (if applicable). |
How did the fund perform last year and what affected its performance?
Explanation of Fund Performance
The Fund's performance was influenced by various factors, including mild underperformance from specific loans in the chemicals, health care providers and services, and software industries.
Top Contributors to Performance
• A modest allocation to high yield bonds, particularly in the cable industry, was a strong contributor.
• The fund maintained a steady level of dividend income as interest rates remained high.
Top Detractors from Performance
• Holdings in cash and Treasury bills modestly detracted from relative performance, as these categories could not keep pace with the strong returns of the loan market.
• The fund experienced one default during the period.
We target a yield advantage through strategic investments which can be enhanced through primary market new issue discounts and by swapping into loans or bonds with more appealing risk/return characteristics as those opportunities arise, while also maintaining an appropriate liquidity policy. We have maintained less liquidity in the portfolio this year than in previous periods given the positive trend in financial conditions, though we are required to maintain a baseline level of liquidity for regulatory reasons, and to meet any redemption activity.
We examine the relative attractiveness of the high yield bond market in relation to bank loans based on potential risk-adjusted return. Currently, we view that tradeoff as poorly compensated given the shape of the yield curve and the tight spreads in much of the bond market. As of period end, the fund is positioned with approximately 93% bank loans.
The Fund’s benchmarks are unmanaged indices used as a general measure of market performance. Calculations assume dividends and capital gains are reinvested. The tables do not reflect taxes shareholders might owe on any fund distributions or when they redeem their shares. You cannot invest directly in an index.
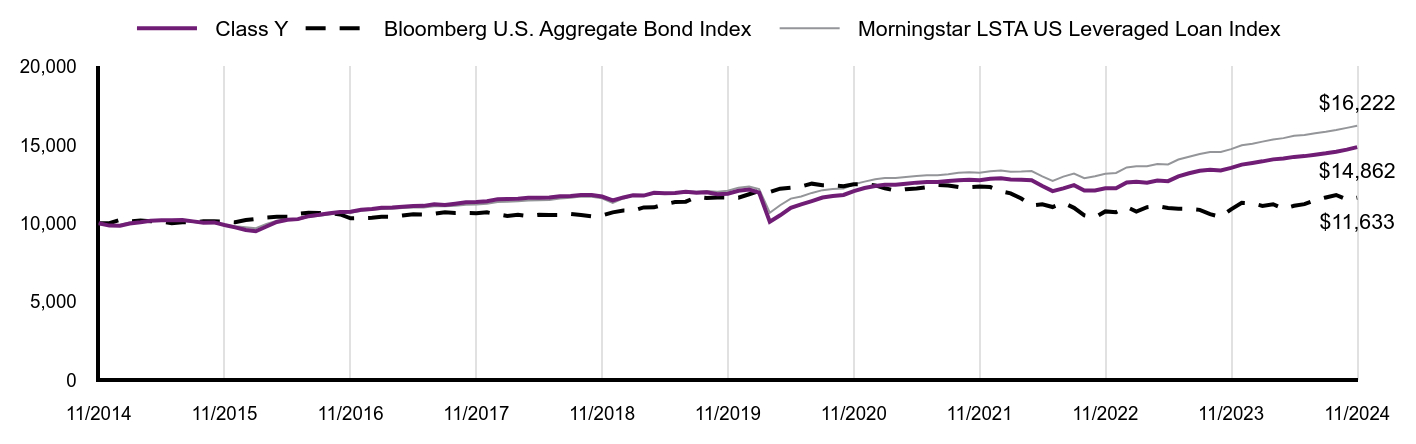
Total Return Based on a Hypothetical $10,000 Investment
| Class Y | Bloomberg U.S. Aggregate Bond Index | Morningstar LSTA US Leveraged Loan Index |
|---|
| 11/2014 | $10,000 | $10,000 | $10,000 |
|---|
| 12/2014 | $9,851 | $10,009 | $9,875 |
|---|
| 01/2015 | $9,845 | $10,219 | $9,907 |
|---|
| 02/2015 | $9,982 | $10,123 | $10,047 |
|---|
| 03/2015 | $10,060 | $10,170 | $10,084 |
|---|
| 04/2015 | $10,156 | $10,134 | $10,177 |
|---|
| 05/2015 | $10,194 | $10,109 | $10,196 |
|---|
| 06/2015 | $10,189 | $9,999 | $10,154 |
|---|
| 07/2015 | $10,202 | $10,069 | $10,153 |
|---|
| 08/2015 | $10,122 | $10,054 | $10,082 |
|---|
| 09/2015 | $10,035 | $10,122 | $10,016 |
|---|
| 10/2015 | $10,057 | $10,124 | $9,998 |
|---|
| 11/2015 | $9,892 | $10,097 | $9,911 |
|---|
| 12/2015 | $9,739 | $10,064 | $9,807 |
|---|
| 01/2016 | $9,574 | $10,203 | $9,743 |
|---|
| 02/2016 | $9,488 | $10,275 | $9,691 |
|---|
| 03/2016 | $9,794 | $10,370 | $9,958 |
|---|
| 04/2016 | $10,085 | $10,409 | $10,156 |
|---|
| 05/2016 | $10,225 | $10,412 | $10,246 |
|---|
| 06/2016 | $10,265 | $10,599 | $10,249 |
|---|
| 07/2016 | $10,455 | $10,666 | $10,395 |
|---|
| 08/2016 | $10,543 | $10,654 | $10,473 |
|---|
| 09/2016 | $10,645 | $10,648 | $10,564 |
|---|
| 10/2016 | $10,721 | $10,566 | $10,651 |
|---|
| 11/2016 | $10,741 | $10,316 | $10,679 |
|---|
| 12/2016 | $10,860 | $10,331 | $10,803 |
|---|
| 01/2017 | $10,917 | $10,351 | $10,863 |
|---|
| 02/2017 | $10,986 | $10,421 | $10,918 |
|---|
| 03/2017 | $11,005 | $10,415 | $10,926 |
|---|
| 04/2017 | $11,054 | $10,496 | $10,974 |
|---|
| 05/2017 | $11,102 | $10,576 | $11,014 |
|---|
| 06/2017 | $11,112 | $10,566 | $11,009 |
|---|
| 07/2017 | $11,212 | $10,611 | $11,085 |
|---|
| 08/2017 | $11,163 | $10,706 | $11,080 |
|---|
| 09/2017 | $11,241 | $10,655 | $11,124 |
|---|
| 10/2017 | $11,336 | $10,662 | $11,190 |
|---|
| 11/2017 | $11,362 | $10,648 | $11,203 |
|---|
| 12/2017 | $11,410 | $10,697 | $11,248 |
|---|
| 01/2018 | $11,532 | $10,574 | $11,356 |
|---|
| 02/2018 | $11,555 | $10,473 | $11,378 |
|---|
| 03/2018 | $11,570 | $10,540 | $11,410 |
|---|
| 04/2018 | $11,629 | $10,462 | $11,458 |
|---|
| 05/2018 | $11,633 | $10,537 | $11,477 |
|---|
| 06/2018 | $11,642 | $10,524 | $11,490 |
|---|
| 07/2018 | $11,725 | $10,526 | $11,575 |
|---|
| 08/2018 | $11,745 | $10,594 | $11,621 |
|---|
| 09/2018 | $11,812 | $10,526 | $11,701 |
|---|
| 10/2018 | $11,804 | $10,443 | $11,698 |
|---|
| 11/2018 | $11,707 | $10,505 | $11,592 |
|---|
| 12/2018 | $11,455 | $10,698 | $11,297 |
|---|
| 01/2019 | $11,650 | $10,812 | $11,585 |
|---|
| 02/2019 | $11,785 | $10,805 | $11,769 |
|---|
| 03/2019 | $11,767 | $11,013 | $11,749 |
|---|
| 04/2019 | $11,942 | $11,016 | $11,943 |
|---|
| 05/2019 | $11,911 | $11,211 | $11,917 |
|---|
| 06/2019 | $11,934 | $11,352 | $11,946 |
|---|
| 07/2019 | $12,004 | $11,377 | $12,042 |
|---|
| 08/2019 | $11,950 | $11,672 | $12,008 |
|---|
| 09/2019 | $11,982 | $11,610 | $12,064 |
|---|
| 10/2019 | $11,849 | $11,645 | $12,010 |
|---|
| 11/2019 | $11,882 | $11,639 | $12,081 |
|---|
| 12/2019 | $12,075 | $11,630 | $12,273 |
|---|
| 01/2020 | $12,151 | $11,854 | $12,342 |
|---|
| 02/2020 | $11,953 | $12,068 | $12,179 |
|---|
| 03/2020 | $10,104 | $11,997 | $10,672 |
|---|
| 04/2020 | $10,509 | $12,210 | $11,153 |
|---|
| 05/2020 | $10,983 | $12,267 | $11,576 |
|---|
| 06/2020 | $11,207 | $12,344 | $11,708 |
|---|
| 07/2020 | $11,416 | $12,528 | $11,937 |
|---|
| 08/2020 | $11,641 | $12,427 | $12,115 |
|---|
| 09/2020 | $11,741 | $12,420 | $12,192 |
|---|
| 10/2020 | $11,808 | $12,365 | $12,217 |
|---|
| 11/2020 | $12,053 | $12,486 | $12,489 |
|---|
| 12/2020 | $12,247 | $12,504 | $12,657 |
|---|
| 01/2021 | $12,373 | $12,414 | $12,807 |
|---|
| 02/2021 | $12,451 | $12,235 | $12,883 |
|---|
| 03/2021 | $12,462 | $12,082 | $12,882 |
|---|
| 04/2021 | $12,526 | $12,177 | $12,949 |
|---|
| 05/2021 | $12,594 | $12,217 | $13,024 |
|---|
| 06/2021 | $12,633 | $12,303 | $13,072 |
|---|
| 07/2021 | $12,642 | $12,440 | $13,070 |
|---|
| 08/2021 | $12,696 | $12,417 | $13,132 |
|---|
| 09/2021 | $12,749 | $12,309 | $13,217 |
|---|
| 10/2021 | $12,777 | $12,306 | $13,252 |
|---|
| 11/2021 | $12,744 | $12,342 | $13,231 |
|---|
| 12/2021 | $12,842 | $12,311 | $13,315 |
|---|
| 01/2022 | $12,870 | $12,046 | $13,364 |
|---|
| 02/2022 | $12,793 | $11,911 | $13,295 |
|---|
| 03/2022 | $12,779 | $11,580 | $13,302 |
|---|
| 04/2022 | $12,748 | $11,141 | $13,330 |
|---|
| 05/2022 | $12,377 | $11,213 | $12,989 |
|---|
| 06/2022 | $12,050 | $11,037 | $12,708 |
|---|
| 07/2022 | $12,227 | $11,306 | $12,979 |
|---|
| 08/2022 | $12,430 | $10,987 | $13,175 |
|---|
| 09/2022 | $12,087 | $10,512 | $12,875 |
|---|
| 10/2022 | $12,090 | $10,376 | $13,003 |
|---|
| 11/2022 | $12,230 | $10,758 | $13,159 |
|---|
| 12/2022 | $12,240 | $10,709 | $13,213 |
|---|
| 01/2023 | $12,604 | $11,039 | $13,565 |
|---|
| 02/2023 | $12,645 | $10,753 | $13,643 |
|---|
| 03/2023 | $12,589 | $11,026 | $13,639 |
|---|
| 04/2023 | $12,732 | $11,093 | $13,783 |
|---|
| 05/2023 | $12,690 | $10,972 | $13,757 |
|---|
| 06/2023 | $12,996 | $10,933 | $14,069 |
|---|
| 07/2023 | $13,190 | $10,926 | $14,250 |
|---|
| 08/2023 | $13,355 | $10,856 | $14,417 |
|---|
| 09/2023 | $13,408 | $10,580 | $14,555 |
|---|
| 10/2023 | $13,366 | $10,413 | $14,553 |
|---|
| 11/2023 | $13,532 | $10,885 | $14,730 |
|---|
| 12/2023 | $13,744 | $11,301 | $14,973 |
|---|
| 01/2024 | $13,850 | $11,270 | $15,074 |
|---|
| 02/2024 | $13,952 | $11,111 | $15,211 |
|---|
| 03/2024 | $14,078 | $11,214 | $15,341 |
|---|
| 04/2024 | $14,129 | $10,930 | $15,433 |
|---|
| 05/2024 | $14,236 | $11,116 | $15,578 |
|---|
| 06/2024 | $14,286 | $11,221 | $15,632 |
|---|
| 07/2024 | $14,377 | $11,483 | $15,739 |
|---|
| 08/2024 | $14,463 | $11,648 | $15,839 |
|---|
| 09/2024 | $14,564 | $11,804 | $15,952 |
|---|
| 10/2024 | $14,699 | $11,511 | $16,089 |
|---|
| 11/2024 | $14,862 | $11,633 | $16,222 |
|---|
Performance data shown represents past performance and is no guarantee of, and is not necessarily indicative of, future results. Total return and value will vary, and you may have a gain or loss when shares are sold. Current performance may be lower or higher than quoted. For the most recent month-end performance, visit im.natixis.com/en-us/products/mutual-funds/price-and-performance.
Average Annual Total Returns (%)
| AATR | 1 Year | 5 Years | 10 Years |
|---|
| Class Y | 9.83% | 4.58% | 4.04% |
|---|
| Bloomberg U.S. Aggregate Bond Index | 6.88% | (0.01%) | 1.52% |
|---|
| Morningstar LSTA US Leveraged Loan Index | 10.13% | 6.07% | 4.96% |
|---|
Effective April 1, 2024, in accordance with new regulations, the Fund's primary broad-based index changed to the Bloomberg U.S. Aggregate Bond Index. The Fund will retain the Morningstar LSTA US Leveraged Loan Index as an additional benchmark for performance comparison.
| Total Net Assets | $822,515,408 |
|---|
| # of Portfolio Holdings (including overnight repurchase agreements) | 306 |
|---|
| Portfolio Turnover Rate | 107% |
|---|
| Total Advisory Fees Paid (after waiver/reimbursement, if applicable) | $4,472,711 |
|---|
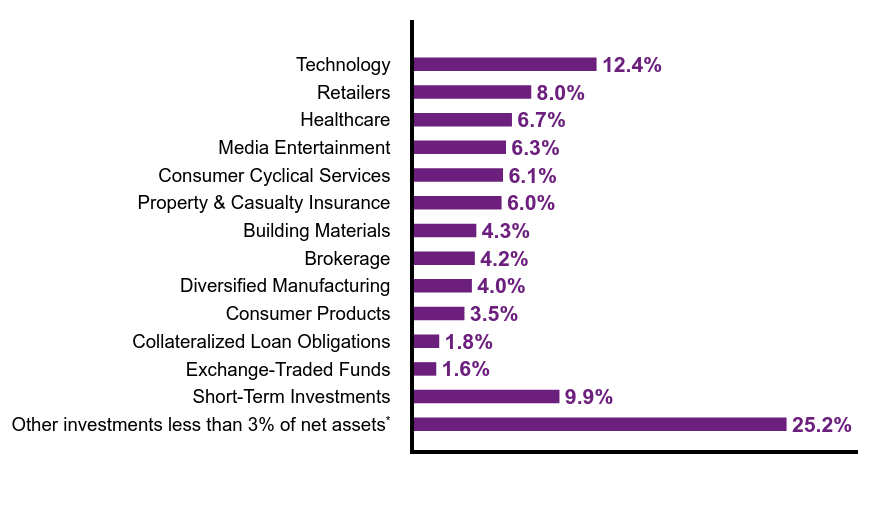
What did the Fund invest in? (% of Net Assets)
| Value | Value |
|---|
Other investments less than 3% of net assetsFootnote Reference* | 25.2% |
| Short-Term Investments | 9.9% |
| Exchange-Traded Funds | 1.6% |
| Collateralized Loan Obligations | 1.8% |
| Consumer Products | 3.5% |
| Diversified Manufacturing | 4.0% |
| Brokerage | 4.2% |
| Building Materials | 4.3% |
| Property & Casualty Insurance | 6.0% |
| Consumer Cyclical Services | 6.1% |
| Media Entertainment | 6.3% |
| Healthcare | 6.7% |
| Retailers | 8.0% |
| Technology | 12.4% |
| Footnote | Description |
Footnote* | Net of other assets less liabilities |
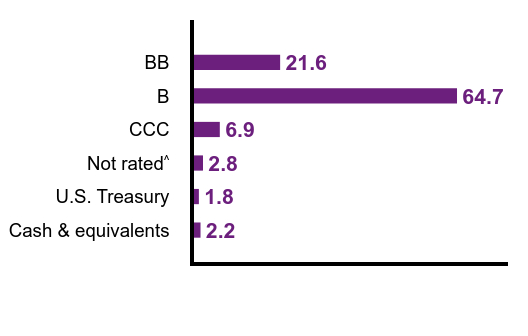
Credit QualityFootnote Reference†
| Value | Value |
|---|
| Cash & equivalents | 2.2 |
| U.S. Treasury | 1.8 |
Not ratedFootnote Reference^ | 2.8 |
| CCC | 6.9 |
| B | 64.7 |
| BB | 21.6 |
| Footnote | Description |
Footnote† | Credit ratings are by S&P Global Ratings. A credit rating is an assessment provided by a nationally recognized statistical rating organization (NRSRO) of the creditworthiness of an issuer with respect to debt obligations except for those debt obligations that are only privately rated. Ratings are measured on a scale that generally ranges from AAA (highest) to D (lowest). The credit ratings shown relate to the creditworthiness of the issuers of the underlying securities in the Fund, and not to the Fund or its shares. Credit ratings are subject to change. |
Footnote^ | Not Rated category represents only those securities not rated by S&P Global Ratings. Such securities may be rated by other NRSROs not shown here. |
Effective July 1, 2024, the Fund had the following material changes, which were reported in a supplement to the Fund's prospectus. For more information, you may review the Fund's prospectus at im.natixis.com/funddocuments or upon request at 800-225-5478 or through your financial intermediary.
Expenses: The expense limit as a percentage of average daily net assets was reduced to 0.73% from 0.75%.
There were no changes in or disagreements with Accountants during the period.
For additional information about the Fund; including its prospectus, financial information, holdings and proxy information, scan the QR code or visit im.natixis.com/funddocuments.
Loomis Sayles Senior Floating Rate and Fixed Income Fund
Annual Shareholder Report
November 30, 2024
Loomis Sayles Senior Floating Rate and Fixed Income Fund
Annual Shareholder Report - November 30, 2024
This annual shareholder report contains important information about Loomis Sayles Senior Floating Rate and Fixed Income Fund for the period of December 1, 2023 to November 30, 2024. You can find additional information (including tax information) about the Fund at im.natixis.com/funddocuments. You can also request the information by contacting us at (800) 225-5478 or by contacting your financial intermediary directly. This report describes changes to the Fund that occurred during the reporting period.
What were the fund costs for the last year? (based on a hypothetical $10,000 investment)
| Class Name | Costs of a $10,000 investment | Costs paid as a percentage of a $10,000 investmentFootnote Reference† |
|---|
| Class A | $104 | 0.99% |
|---|
| Footnote | Description |
Footnote† | Annualized for periods less than one year (if applicable). |
How did the fund perform last year and what affected its performance?
Explanation of Fund Performance
The Fund's performance was influenced by various factors, including mild underperformance from specific loans in the chemicals, health care providers and services, and software industries.
Top Contributors to Performance
• A modest allocation to high yield bonds, particularly in the cable industry, was a strong contributor.
• The fund maintained a steady level of dividend income as interest rates remained high.
Top Detractors from Performance
• Holdings in cash and Treasury bills modestly detracted from relative performance, as these categories could not keep pace with the strong returns of the loan market.
• The fund experienced one default during the period.
We target a yield advantage through strategic investments which can be enhanced through primary market new issue discounts and by swapping into loans or bonds with more appealing risk/return characteristics as those opportunities arise, while also maintaining an appropriate liquidity policy. We have maintained less liquidity in the portfolio this year than in previous periods given the positive trend in financial conditions, though we are required to maintain a baseline level of liquidity for regulatory reasons, and to meet any redemption activity.
We examine the relative attractiveness of the high yield bond market in relation to bank loans based on potential risk-adjusted return. Currently, we view that tradeoff as poorly compensated given the shape of the yield curve and the tight spreads in much of the bond market. As of period end, the fund is positioned with approximately 93% bank loans.
The Fund’s benchmarks are unmanaged indices used as a general measure of market performance. Calculations assume dividends and capital gains are reinvested. The tables do not reflect taxes shareholders might owe on any fund distributions or when they redeem their shares. You cannot invest directly in an index.
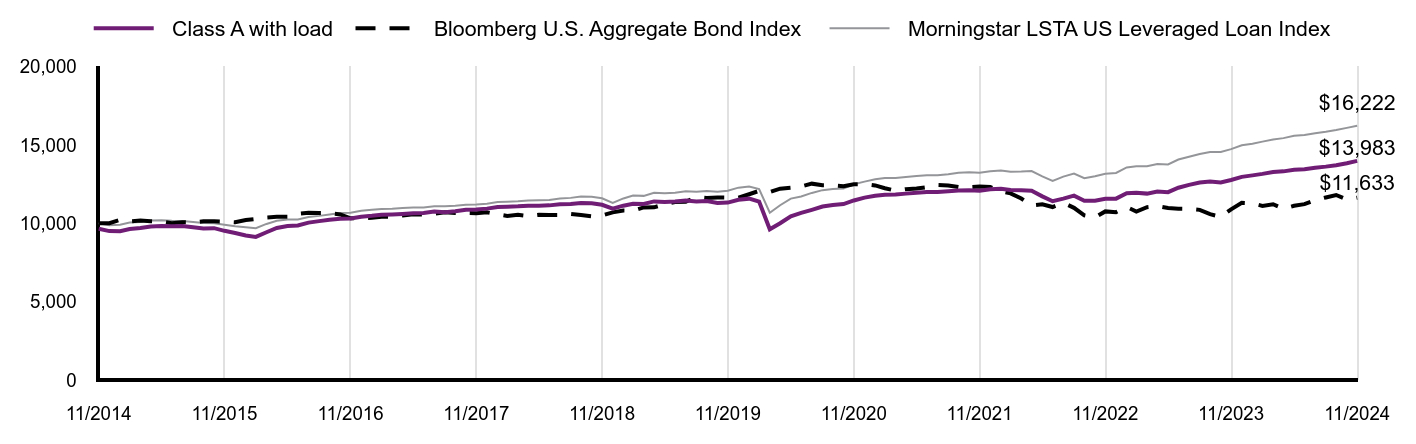
Total Return Based on a Hypothetical $10,000 Investment
| Class A with load | Bloomberg U.S. Aggregate Bond Index | Morningstar LSTA US Leveraged Loan Index |
|---|
| 11/2014 | $9,647 | $10,000 | $10,000 |
|---|
| 12/2014 | $9,501 | $10,009 | $9,875 |
|---|
| 01/2015 | $9,493 | $10,219 | $9,907 |
|---|
| 02/2015 | $9,633 | $10,123 | $10,047 |
|---|
| 03/2015 | $9,697 | $10,170 | $10,084 |
|---|
| 04/2015 | $9,797 | $10,134 | $10,177 |
|---|
| 05/2015 | $9,822 | $10,109 | $10,196 |
|---|
| 06/2015 | $9,815 | $9,999 | $10,154 |
|---|
| 07/2015 | $9,826 | $10,069 | $10,153 |
|---|
| 08/2015 | $9,747 | $10,054 | $10,082 |
|---|
| 09/2015 | $9,671 | $10,122 | $10,016 |
|---|
| 10/2015 | $9,690 | $10,124 | $9,998 |
|---|
| 11/2015 | $9,519 | $10,097 | $9,911 |
|---|
| 12/2015 | $9,379 | $10,064 | $9,807 |
|---|
| 01/2016 | $9,218 | $10,203 | $9,743 |
|---|
| 02/2016 | $9,133 | $10,275 | $9,691 |
|---|
| 03/2016 | $9,426 | $10,370 | $9,958 |
|---|
| 04/2016 | $9,704 | $10,409 | $10,156 |
|---|
| 05/2016 | $9,827 | $10,412 | $10,246 |
|---|
| 06/2016 | $9,863 | $10,599 | $10,249 |
|---|
| 07/2016 | $10,044 | $10,666 | $10,395 |
|---|
| 08/2016 | $10,137 | $10,654 | $10,473 |
|---|
| 09/2016 | $10,232 | $10,648 | $10,564 |
|---|
| 10/2016 | $10,293 | $10,566 | $10,651 |
|---|
| 11/2016 | $10,310 | $10,316 | $10,679 |
|---|
| 12/2016 | $10,423 | $10,331 | $10,803 |
|---|
| 01/2017 | $10,475 | $10,351 | $10,863 |
|---|
| 02/2017 | $10,539 | $10,421 | $10,918 |
|---|
| 03/2017 | $10,566 | $10,415 | $10,926 |
|---|
| 04/2017 | $10,600 | $10,496 | $10,974 |
|---|
| 05/2017 | $10,644 | $10,576 | $11,014 |
|---|
| 06/2017 | $10,651 | $10,566 | $11,009 |
|---|
| 07/2017 | $10,745 | $10,611 | $11,085 |
|---|
| 08/2017 | $10,707 | $10,706 | $11,080 |
|---|
| 09/2017 | $10,768 | $10,655 | $11,124 |
|---|
| 10/2017 | $10,857 | $10,662 | $11,190 |
|---|
| 11/2017 | $10,880 | $10,648 | $11,203 |
|---|
| 12/2017 | $10,935 | $10,697 | $11,248 |
|---|
| 01/2018 | $11,039 | $10,574 | $11,356 |
|---|
| 02/2018 | $11,058 | $10,473 | $11,378 |
|---|
| 03/2018 | $11,081 | $10,540 | $11,410 |
|---|
| 04/2018 | $11,124 | $10,462 | $11,458 |
|---|
| 05/2018 | $11,126 | $10,537 | $11,477 |
|---|
| 06/2018 | $11,143 | $10,524 | $11,490 |
|---|
| 07/2018 | $11,210 | $10,526 | $11,575 |
|---|
| 08/2018 | $11,237 | $10,594 | $11,621 |
|---|
| 09/2018 | $11,288 | $10,526 | $11,701 |
|---|
| 10/2018 | $11,277 | $10,443 | $11,698 |
|---|
| 11/2018 | $11,182 | $10,505 | $11,592 |
|---|
| 12/2018 | $10,939 | $10,698 | $11,297 |
|---|
| 01/2019 | $11,123 | $10,812 | $11,585 |
|---|
| 02/2019 | $11,250 | $10,805 | $11,769 |
|---|
| 03/2019 | $11,231 | $11,013 | $11,749 |
|---|
| 04/2019 | $11,395 | $11,016 | $11,943 |
|---|
| 05/2019 | $11,363 | $11,211 | $11,917 |
|---|
| 06/2019 | $11,383 | $11,352 | $11,946 |
|---|
| 07/2019 | $11,447 | $11,377 | $12,042 |
|---|
| 08/2019 | $11,392 | $11,672 | $12,008 |
|---|
| 09/2019 | $11,421 | $11,610 | $12,064 |
|---|
| 10/2019 | $11,292 | $11,645 | $12,010 |
|---|
| 11/2019 | $11,320 | $11,639 | $12,081 |
|---|
| 12/2019 | $11,502 | $11,630 | $12,273 |
|---|
| 01/2020 | $11,572 | $11,854 | $12,342 |
|---|
| 02/2020 | $11,381 | $12,068 | $12,179 |
|---|
| 03/2020 | $9,616 | $11,997 | $10,672 |
|---|
| 04/2020 | $10,000 | $12,210 | $11,153 |
|---|
| 05/2020 | $10,450 | $12,267 | $11,576 |
|---|
| 06/2020 | $10,661 | $12,344 | $11,708 |
|---|
| 07/2020 | $10,857 | $12,528 | $11,937 |
|---|
| 08/2020 | $11,069 | $12,427 | $12,115 |
|---|
| 09/2020 | $11,162 | $12,420 | $12,192 |
|---|
| 10/2020 | $11,224 | $12,365 | $12,217 |
|---|
| 11/2020 | $11,455 | $12,486 | $12,489 |
|---|
| 12/2020 | $11,636 | $12,504 | $12,657 |
|---|
| 01/2021 | $11,754 | $12,414 | $12,807 |
|---|
| 02/2021 | $11,825 | $12,235 | $12,883 |
|---|
| 03/2021 | $11,834 | $12,082 | $12,882 |
|---|
| 04/2021 | $11,892 | $12,177 | $12,949 |
|---|
| 05/2021 | $11,954 | $12,217 | $13,024 |
|---|
| 06/2021 | $11,989 | $12,303 | $13,072 |
|---|
| 07/2021 | $11,994 | $12,440 | $13,070 |
|---|
| 08/2021 | $12,043 | $12,417 | $13,132 |
|---|
| 09/2021 | $12,091 | $12,309 | $13,217 |
|---|
| 10/2021 | $12,115 | $12,306 | $13,252 |
|---|
| 11/2021 | $12,081 | $12,342 | $13,231 |
|---|
| 12/2021 | $12,171 | $12,311 | $13,315 |
|---|
| 01/2022 | $12,196 | $12,046 | $13,364 |
|---|
| 02/2022 | $12,120 | $11,911 | $13,295 |
|---|
| 03/2022 | $12,104 | $11,580 | $13,302 |
|---|
| 04/2022 | $12,072 | $11,141 | $13,330 |
|---|
| 05/2022 | $11,718 | $11,213 | $12,989 |
|---|
| 06/2022 | $11,406 | $11,037 | $12,708 |
|---|
| 07/2022 | $11,570 | $11,306 | $12,979 |
|---|
| 08/2022 | $11,761 | $10,987 | $13,175 |
|---|
| 09/2022 | $11,433 | $10,512 | $12,875 |
|---|
| 10/2022 | $11,433 | $10,376 | $13,003 |
|---|
| 11/2022 | $11,564 | $10,758 | $13,159 |
|---|
| 12/2022 | $11,571 | $10,709 | $13,213 |
|---|
| 01/2023 | $11,913 | $11,039 | $13,565 |
|---|
| 02/2023 | $11,949 | $10,753 | $13,643 |
|---|
| 03/2023 | $11,893 | $11,026 | $13,639 |
|---|
| 04/2023 | $12,026 | $11,093 | $13,783 |
|---|
| 05/2023 | $11,983 | $10,972 | $13,757 |
|---|
| 06/2023 | $12,270 | $10,933 | $14,069 |
|---|
| 07/2023 | $12,451 | $10,926 | $14,250 |
|---|
| 08/2023 | $12,604 | $10,856 | $14,417 |
|---|
| 09/2023 | $12,667 | $10,580 | $14,555 |
|---|
| 10/2023 | $12,609 | $10,413 | $14,553 |
|---|
| 11/2023 | $12,763 | $10,885 | $14,730 |
|---|
| 12/2023 | $12,961 | $11,301 | $14,973 |
|---|
| 01/2024 | $13,058 | $11,270 | $15,074 |
|---|
| 02/2024 | $13,152 | $11,111 | $15,211 |
|---|
| 03/2024 | $13,268 | $11,214 | $15,341 |
|---|
| 04/2024 | $13,313 | $10,930 | $15,433 |
|---|
| 05/2024 | $13,410 | $11,116 | $15,578 |
|---|
| 06/2024 | $13,455 | $11,221 | $15,632 |
|---|
| 07/2024 | $13,538 | $11,483 | $15,739 |
|---|
| 08/2024 | $13,616 | $11,648 | $15,839 |
|---|
| 09/2024 | $13,708 | $11,804 | $15,952 |
|---|
| 10/2024 | $13,832 | $11,511 | $16,089 |
|---|
| 11/2024 | $13,983 | $11,633 | $16,222 |
|---|
Performance data shown represents past performance and is no guarantee of, and is not necessarily indicative of, future results. Total return and value will vary, and you may have a gain or loss when shares are sold. Current performance may be lower or higher than quoted. For the most recent month-end performance, visit im.natixis.com/en-us/products/mutual-funds/price-and-performance.
Average Annual Total Returns (%)
| AATR | 1 Year | 5 Years | 10 Years |
|---|
| Class A at NAV | 9.56% | 4.32% | 3.78% |
|---|
Class A with 3.50% MSCFootnote Reference1 | 5.70% | 3.58% | 3.41% |
|---|
| Bloomberg U.S. Aggregate Bond Index | 6.88% | (0.01%) | 1.52% |
|---|
| Morningstar LSTA US Leveraged Loan Index | 10.13% | 6.07% | 4.96% |
|---|
| Footnote | Description |
Footnote1 | Maximum sales charge |
Effective April 1, 2024, in accordance with new regulations, the Fund's primary broad-based index changed to the Bloomberg U.S. Aggregate Bond Index. The Fund will retain the Morningstar LSTA US Leveraged Loan Index as an additional benchmark for performance comparison.
| Total Net Assets | $822,515,408 |
|---|
| # of Portfolio Holdings (including overnight repurchase agreements) | 306 |
|---|
| Portfolio Turnover Rate | 107% |
|---|
| Total Advisory Fees Paid (after waiver/reimbursement, if applicable) | $4,472,711 |
|---|
What did the Fund invest in? (% of Net Assets)
| Value | Value |
|---|
Other investments less than 3% of net assetsFootnote Reference* | 25.2% |
| Short-Term Investments | 9.9% |
| Exchange-Traded Funds | 1.6% |
| Collateralized Loan Obligations | 1.8% |
| Consumer Products | 3.5% |
| Diversified Manufacturing | 4.0% |
| Brokerage | 4.2% |
| Building Materials | 4.3% |
| Property & Casualty Insurance | 6.0% |
| Consumer Cyclical Services | 6.1% |
| Media Entertainment | 6.3% |
| Healthcare | 6.7% |
| Retailers | 8.0% |
| Technology | 12.4% |
| Footnote | Description |
Footnote* | Net of other assets less liabilities |
Credit QualityFootnote Reference†
| Value | Value |
|---|
| Cash & equivalents | 2.2 |
| U.S. Treasury | 1.8 |
Not ratedFootnote Reference^ | 2.8 |
| CCC | 6.9 |
| B | 64.7 |
| BB | 21.6 |
| Footnote | Description |
Footnote† | Credit ratings are by S&P Global Ratings. A credit rating is an assessment provided by a nationally recognized statistical rating organization (NRSRO) of the creditworthiness of an issuer with respect to debt obligations except for those debt obligations that are only privately rated. Ratings are measured on a scale that generally ranges from AAA (highest) to D (lowest). The credit ratings shown relate to the creditworthiness of the issuers of the underlying securities in the Fund, and not to the Fund or its shares. Credit ratings are subject to change. |
Footnote^ | Not Rated category represents only those securities not rated by S&P Global Ratings. Such securities may be rated by other NRSROs not shown here. |
Effective July 1, 2024, the Fund had the following material changes, which were reported in a supplement to the Fund's prospectus. For more information, you may review the Fund's prospectus at im.natixis.com/funddocuments or upon request at 800-225-5478 or through your financial intermediary.
Expenses: The expense limit as a percentage of average daily net assets was reduced to 0.98% from 1.00%.
There were no changes in or disagreements with Accountants during the period.
For additional information about the Fund; including its prospectus, financial information, holdings and proxy information, scan the QR code or visit im.natixis.com/funddocuments.
Loomis Sayles Senior Floating Rate and Fixed Income Fund
Annual Shareholder Report
November 30, 2024
Loomis Sayles Senior Floating Rate and Fixed Income Fund
Annual Shareholder Report - November 30, 2024
This annual shareholder report contains important information about Loomis Sayles Senior Floating Rate and Fixed Income Fund for the period of December 1, 2023 to November 30, 2024. You can find additional information (including tax information) about the Fund at im.natixis.com/funddocuments. You can also request the information by contacting us at (800) 225-5478 or by contacting your financial intermediary directly. This report describes changes to the Fund that occurred during the reporting period.
What were the fund costs for the last year? (based on a hypothetical $10,000 investment)
| Class Name | Costs of a $10,000 investment | Costs paid as a percentage of a $10,000 investmentFootnote Reference† |
|---|
| Class C | $182 | 1.74% |
|---|
| Footnote | Description |
Footnote† | Annualized for periods less than one year (if applicable). |
How did the fund perform last year and what affected its performance?
Explanation of Fund Performance
The Fund's performance was influenced by various factors, including mild underperformance from specific loans in the chemicals, health care providers and services, and software industries.
Top Contributors to Performance
• A modest allocation to high yield bonds, particularly in the cable industry, was a strong contributor.
• The fund maintained a steady level of dividend income as interest rates remained high.
Top Detractors from Performance
• Holdings in cash and Treasury bills modestly detracted from relative performance, as these categories could not keep pace with the strong returns of the loan market.
• The fund experienced one default during the period.
We target a yield advantage through strategic investments which can be enhanced through primary market new issue discounts and by swapping into loans or bonds with more appealing risk/return characteristics as those opportunities arise, while also maintaining an appropriate liquidity policy. We have maintained less liquidity in the portfolio this year than in previous periods given the positive trend in financial conditions, though we are required to maintain a baseline level of liquidity for regulatory reasons, and to meet any redemption activity.
We examine the relative attractiveness of the high yield bond market in relation to bank loans based on potential risk-adjusted return. Currently, we view that tradeoff as poorly compensated given the shape of the yield curve and the tight spreads in much of the bond market. As of period end, the fund is positioned with approximately 93% bank loans.
The Fund’s benchmarks are unmanaged indices used as a general measure of market performance. Calculations assume dividends and capital gains are reinvested. The tables do not reflect taxes shareholders might owe on any fund distributions or when they redeem their shares. You cannot invest directly in an index.
Total Return Based on a Hypothetical $10,000 Investment
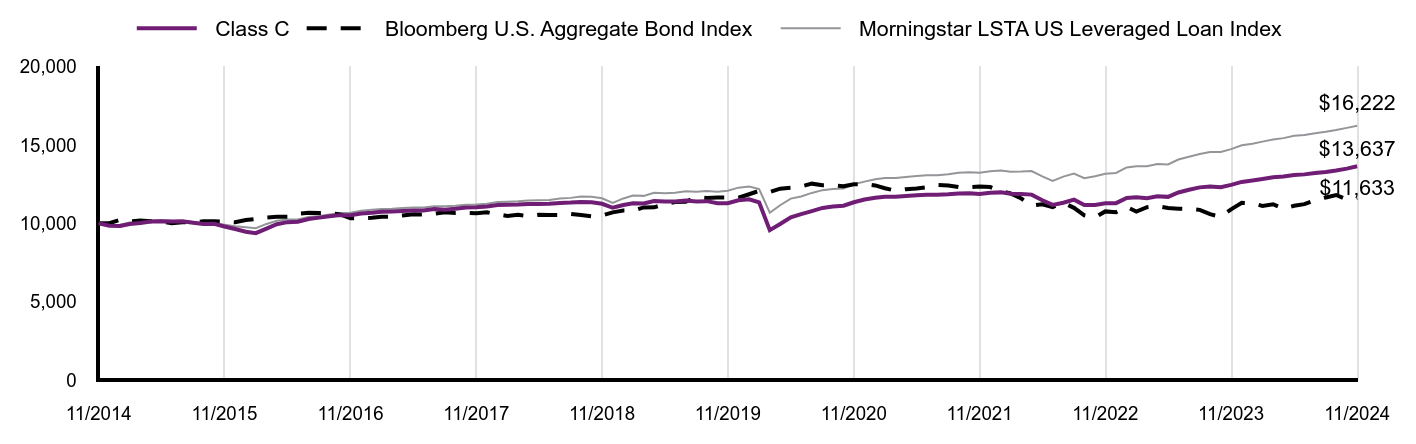
| Class C | Bloomberg U.S. Aggregate Bond Index | Morningstar LSTA US Leveraged Loan Index |
|---|
| 11/2014 | $10,000 | $10,000 | $10,000 |
|---|
| 12/2014 | $9,841 | $10,009 | $9,875 |
|---|
| 01/2015 | $9,826 | $10,219 | $9,907 |
|---|
| 02/2015 | $9,956 | $10,123 | $10,047 |
|---|
| 03/2015 | $10,017 | $10,170 | $10,084 |
|---|
| 04/2015 | $10,114 | $10,134 | $10,177 |
|---|
| 05/2015 | $10,134 | $10,109 | $10,196 |
|---|
| 06/2015 | $10,121 | $9,999 | $10,154 |
|---|
| 07/2015 | $10,126 | $10,069 | $10,153 |
|---|
| 08/2015 | $10,038 | $10,054 | $10,082 |
|---|
| 09/2015 | $9,953 | $10,122 | $10,016 |
|---|
| 10/2015 | $9,966 | $10,124 | $9,998 |
|---|
| 11/2015 | $9,794 | $10,097 | $9,911 |
|---|
| 12/2015 | $9,633 | $10,064 | $9,807 |
|---|
| 01/2016 | $9,461 | $10,203 | $9,743 |
|---|
| 02/2016 | $9,368 | $10,275 | $9,691 |
|---|
| 03/2016 | $9,663 | $10,370 | $9,958 |
|---|
| 04/2016 | $9,943 | $10,409 | $10,156 |
|---|
| 05/2016 | $10,073 | $10,412 | $10,246 |
|---|
| 06/2016 | $10,094 | $10,599 | $10,249 |
|---|
| 07/2016 | $10,273 | $10,666 | $10,395 |
|---|
| 08/2016 | $10,362 | $10,654 | $10,473 |
|---|
| 09/2016 | $10,453 | $10,648 | $10,564 |
|---|
| 10/2016 | $10,520 | $10,566 | $10,651 |
|---|
| 11/2016 | $10,520 | $10,316 | $10,679 |
|---|
| 12/2016 | $10,628 | $10,331 | $10,803 |
|---|
| 01/2017 | $10,676 | $10,351 | $10,863 |
|---|
| 02/2017 | $10,735 | $10,421 | $10,918 |
|---|
| 03/2017 | $10,756 | $10,415 | $10,926 |
|---|
| 04/2017 | $10,784 | $10,496 | $10,974 |
|---|
| 05/2017 | $10,823 | $10,576 | $11,014 |
|---|
| 06/2017 | $10,823 | $10,566 | $11,009 |
|---|
| 07/2017 | $10,911 | $10,611 | $11,085 |
|---|
| 08/2017 | $10,866 | $10,706 | $11,080 |
|---|
| 09/2017 | $10,921 | $10,655 | $11,124 |
|---|
| 10/2017 | $11,005 | $10,662 | $11,190 |
|---|
| 11/2017 | $11,021 | $10,648 | $11,203 |
|---|
| 12/2017 | $11,068 | $10,697 | $11,248 |
|---|
| 01/2018 | $11,167 | $10,574 | $11,356 |
|---|
| 02/2018 | $11,180 | $10,473 | $11,378 |
|---|
| 03/2018 | $11,197 | $10,540 | $11,410 |
|---|
| 04/2018 | $11,234 | $10,462 | $11,458 |
|---|
| 05/2018 | $11,229 | $10,537 | $11,477 |
|---|
| 06/2018 | $11,239 | $10,524 | $11,490 |
|---|
| 07/2018 | $11,299 | $10,526 | $11,575 |
|---|
| 08/2018 | $11,320 | $10,594 | $11,621 |
|---|
| 09/2018 | $11,364 | $10,526 | $11,701 |
|---|
| 10/2018 | $11,346 | $10,443 | $11,698 |
|---|
| 11/2018 | $11,243 | $10,505 | $11,592 |
|---|
| 12/2018 | $10,990 | $10,698 | $11,297 |
|---|
| 01/2019 | $11,169 | $10,812 | $11,585 |
|---|
| 02/2019 | $11,279 | $10,805 | $11,769 |
|---|
| 03/2019 | $11,264 | $11,013 | $11,749 |
|---|
| 04/2019 | $11,422 | $11,016 | $11,943 |
|---|
| 05/2019 | $11,383 | $11,211 | $11,917 |
|---|
| 06/2019 | $11,395 | $11,352 | $11,946 |
|---|
| 07/2019 | $11,452 | $11,377 | $12,042 |
|---|
| 08/2019 | $11,390 | $11,672 | $12,008 |
|---|
| 09/2019 | $11,412 | $11,610 | $12,064 |
|---|
| 10/2019 | $11,274 | $11,645 | $12,010 |
|---|
| 11/2019 | $11,283 | $11,639 | $12,081 |
|---|
| 12/2019 | $11,471 | $11,630 | $12,273 |
|---|
| 01/2020 | $11,533 | $11,854 | $12,342 |
|---|
| 02/2020 | $11,335 | $12,068 | $12,179 |
|---|
| 03/2020 | $9,565 | $11,997 | $10,672 |
|---|
| 04/2020 | $9,955 | $12,210 | $11,153 |
|---|
| 05/2020 | $10,384 | $12,267 | $11,576 |
|---|
| 06/2020 | $10,588 | $12,344 | $11,708 |
|---|
| 07/2020 | $10,777 | $12,528 | $11,937 |
|---|
| 08/2020 | $10,981 | $12,427 | $12,115 |
|---|
| 09/2020 | $11,067 | $12,420 | $12,192 |
|---|
| 10/2020 | $11,121 | $12,365 | $12,217 |
|---|
| 11/2020 | $11,343 | $12,486 | $12,489 |
|---|
| 12/2020 | $11,516 | $12,504 | $12,657 |
|---|
| 01/2021 | $11,625 | $12,414 | $12,807 |
|---|
| 02/2021 | $11,689 | $12,235 | $12,883 |
|---|
| 03/2021 | $11,690 | $12,082 | $12,882 |
|---|
| 04/2021 | $11,741 | $12,177 | $12,949 |
|---|
| 05/2021 | $11,794 | $12,217 | $13,024 |
|---|
| 06/2021 | $11,821 | $12,303 | $13,072 |
|---|
| 07/2021 | $11,819 | $12,440 | $13,070 |
|---|
| 08/2021 | $11,846 | $12,417 | $13,132 |
|---|
| 09/2021 | $11,899 | $12,309 | $13,217 |
|---|
| 10/2021 | $11,916 | $12,306 | $13,252 |
|---|
| 11/2021 | $11,875 | $12,342 | $13,231 |
|---|
| 12/2021 | $11,943 | $12,311 | $13,315 |
|---|
| 01/2022 | $11,972 | $12,046 | $13,364 |
|---|
| 02/2022 | $11,890 | $11,911 | $13,295 |
|---|
| 03/2022 | $11,867 | $11,580 | $13,302 |
|---|
| 04/2022 | $11,829 | $11,141 | $13,330 |
|---|
| 05/2022 | $11,473 | $11,213 | $12,989 |
|---|
| 06/2022 | $11,172 | $11,037 | $12,708 |
|---|
| 07/2022 | $11,313 | $11,306 | $12,979 |
|---|
| 08/2022 | $11,506 | $10,987 | $13,175 |
|---|
| 09/2022 | $11,164 | $10,512 | $12,875 |
|---|
| 10/2022 | $11,170 | $10,376 | $13,003 |
|---|
| 11/2022 | $11,277 | $10,758 | $13,159 |
|---|
| 12/2022 | $11,284 | $10,709 | $13,213 |
|---|
| 01/2023 | $11,618 | $11,039 | $13,565 |
|---|
| 02/2023 | $11,653 | $10,753 | $13,643 |
|---|
| 03/2023 | $11,598 | $11,026 | $13,639 |
|---|
| 04/2023 | $11,728 | $11,093 | $13,783 |
|---|
| 05/2023 | $11,686 | $10,972 | $13,757 |
|---|
| 06/2023 | $11,966 | $10,933 | $14,069 |
|---|
| 07/2023 | $12,142 | $10,926 | $14,250 |
|---|
| 08/2023 | $12,292 | $10,856 | $14,417 |
|---|
| 09/2023 | $12,353 | $10,580 | $14,555 |
|---|
| 10/2023 | $12,296 | $10,413 | $14,553 |
|---|
| 11/2023 | $12,447 | $10,885 | $14,730 |
|---|
| 12/2023 | $12,640 | $11,301 | $14,973 |
|---|
| 01/2024 | $12,734 | $11,270 | $15,074 |
|---|
| 02/2024 | $12,826 | $11,111 | $15,211 |
|---|
| 03/2024 | $12,939 | $11,214 | $15,341 |
|---|
| 04/2024 | $12,983 | $10,930 | $15,433 |
|---|
| 05/2024 | $13,078 | $11,116 | $15,578 |
|---|
| 06/2024 | $13,121 | $11,221 | $15,632 |
|---|
| 07/2024 | $13,202 | $11,483 | $15,739 |
|---|
| 08/2024 | $13,278 | $11,648 | $15,839 |
|---|
| 09/2024 | $13,368 | $11,804 | $15,952 |
|---|
| 10/2024 | $13,489 | $11,511 | $16,089 |
|---|
| 11/2024 | $13,637 | $11,633 | $16,222 |
|---|
Performance data shown represents past performance and is no guarantee of, and is not necessarily indicative of, future results. Total return and value will vary, and you may have a gain or loss when shares are sold. Current performance may be lower or higher than quoted. For the most recent month-end performance, visit im.natixis.com/en-us/products/mutual-funds/price-and-performance.
Average Annual Total Returns (%)
| AATR | 1 Year | 5 Years | 10 Years |
|---|
| Class C at NAV | 8.75% | 3.55% | 3.15% |
|---|
Class C with 1.00% CDSCFootnote Reference1 | 7.75% | 3.55% | 3.15% |
|---|
| Bloomberg U.S. Aggregate Bond Index | 6.88% | (0.01%) | 1.52% |
|---|
| Morningstar LSTA US Leveraged Loan Index | 10.13% | 6.07% | 4.96% |
|---|
| Footnote | Description |
Footnote1 | Contingent deferred sales charge |
Effective April 1, 2024, in accordance with new regulations, the Fund's primary broad-based index changed to the Bloomberg U.S. Aggregate Bond Index. The Fund will retain the Morningstar LSTA US Leveraged Loan Index as an additional benchmark for performance comparison.
| Total Net Assets | $822,515,408 |
|---|
| # of Portfolio Holdings (including overnight repurchase agreements) | 306 |
|---|
| Portfolio Turnover Rate | 107% |
|---|
| Total Advisory Fees Paid (after waiver/reimbursement, if applicable) | $4,472,711 |
|---|
What did the Fund invest in? (% of Net Assets)
| Value | Value |
|---|
Other investments less than 3% of net assetsFootnote Reference* | 25.2% |
| Short-Term Investments | 9.9% |
| Exchange-Traded Funds | 1.6% |
| Collateralized Loan Obligations | 1.8% |
| Consumer Products | 3.5% |
| Diversified Manufacturing | 4.0% |
| Brokerage | 4.2% |
| Building Materials | 4.3% |
| Property & Casualty Insurance | 6.0% |
| Consumer Cyclical Services | 6.1% |
| Media Entertainment | 6.3% |
| Healthcare | 6.7% |
| Retailers | 8.0% |
| Technology | 12.4% |
| Footnote | Description |
Footnote* | Net of other assets less liabilities |
Credit QualityFootnote Reference†
| Value | Value |
|---|
| Cash & equivalents | 2.2 |
| U.S. Treasury | 1.8 |
Not ratedFootnote Reference^ | 2.8 |
| CCC | 6.9 |
| B | 64.7 |
| BB | 21.6 |
| Footnote | Description |
Footnote† | Credit ratings are by S&P Global Ratings. A credit rating is an assessment provided by a nationally recognized statistical rating organization (NRSRO) of the creditworthiness of an issuer with respect to debt obligations except for those debt obligations that are only privately rated. Ratings are measured on a scale that generally ranges from AAA (highest) to D (lowest). The credit ratings shown relate to the creditworthiness of the issuers of the underlying securities in the Fund, and not to the Fund or its shares. Credit ratings are subject to change. |
Footnote^ | Not Rated category represents only those securities not rated by S&P Global Ratings. Such securities may be rated by other NRSROs not shown here. |
Effective July 1, 2024, the Fund had the following material changes, which were reported in a supplement to the Fund's prospectus. For more information, you may review the Fund's prospectus at im.natixis.com/funddocuments or upon request at 800-225-5478 or through your financial intermediary.
Expenses: The expense limit as a percentage of average daily net assets was reduced to 1.73% from 1.75%.
There were no changes in or disagreements with Accountants during the period.
For additional information about the Fund; including its prospectus, financial information, holdings and proxy information, scan the QR code or visit im.natixis.com/funddocuments.
Loomis Sayles Senior Floating Rate and Fixed Income Fund
Annual Shareholder Report
November 30, 2024
Loomis Sayles Senior Floating Rate and Fixed Income Fund
Annual Shareholder Report - November 30, 2024
This annual shareholder report contains important information about Loomis Sayles Senior Floating Rate and Fixed Income Fund for the period of December 1, 2023 to November 30, 2024. You can find additional information (including tax information) about the Fund at im.natixis.com/funddocuments. You can also request the information by contacting us at (800) 225-5478 or by contacting your financial intermediary directly. This report describes changes to the Fund that occurred during the reporting period.
What were the fund costs for the last year? (based on a hypothetical $10,000 investment)
| Class Name | Costs of a $10,000 investment | Costs paid as a percentage of a $10,000 investmentFootnote Reference† |
|---|
| Class N | $72 | 0.69% |
|---|
| Footnote | Description |
Footnote† | Annualized for periods less than one year (if applicable). |
How did the fund perform last year and what affected its performance?
Explanation of Fund Performance
The Fund's performance was influenced by various factors, including mild underperformance from specific loans in the chemicals, health care providers and services, and software industries.
Top Contributors to Performance
• A modest allocation to high yield bonds, particularly in the cable industry, was a strong contributor.
• The fund maintained a steady level of dividend income as interest rates remained high.
Top Detractors from Performance
• Holdings in cash and Treasury bills modestly detracted from relative performance, as these categories could not keep pace with the strong returns of the loan market.
• The fund experienced one default during the period.
We target a yield advantage through strategic investments which can be enhanced through primary market new issue discounts and by swapping into loans or bonds with more appealing risk/return characteristics as those opportunities arise, while also maintaining an appropriate liquidity policy. We have maintained less liquidity in the portfolio this year than in previous periods given the positive trend in financial conditions, though we are required to maintain a baseline level of liquidity for regulatory reasons, and to meet any redemption activity.
We examine the relative attractiveness of the high yield bond market in relation to bank loans based on potential risk-adjusted return. Currently, we view that tradeoff as poorly compensated given the shape of the yield curve and the tight spreads in much of the bond market. As of period end, the fund is positioned with approximately 93% bank loans.
The Fund’s benchmarks are unmanaged indices used as a general measure of market performance. Calculations assume dividends and capital gains are reinvested. The tables do not reflect taxes shareholders might owe on any fund distributions or when they redeem their shares. You cannot invest directly in an index.
Total Return Based on a Hypothetical $10,000 Investment
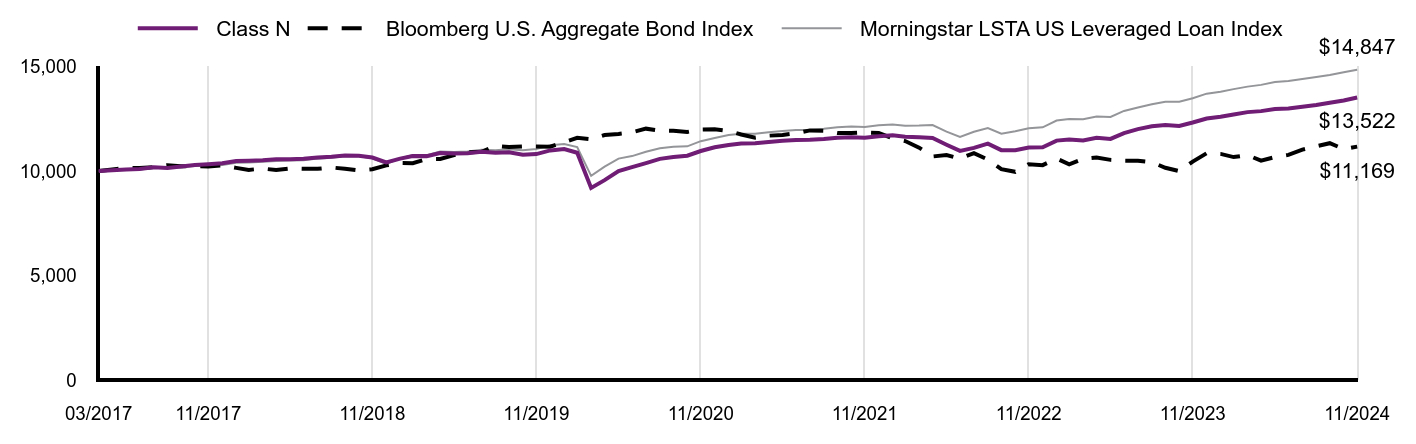
| Class N | Bloomberg U.S. Aggregate Bond Index | Morningstar LSTA US Leveraged Loan Index |
|---|
| 03/2017 | $10,000 | $10,000 | $10,000 |
|---|
| 04/2017 | $10,034 | $10,077 | $10,044 |
|---|
| 05/2017 | $10,079 | $10,155 | $10,080 |
|---|
| 06/2017 | $10,098 | $10,145 | $10,076 |
|---|
| 07/2017 | $10,179 | $10,188 | $10,145 |
|---|
| 08/2017 | $10,145 | $10,280 | $10,141 |
|---|
| 09/2017 | $10,217 | $10,231 | $10,181 |
|---|
| 10/2017 | $10,293 | $10,237 | $10,241 |
|---|
| 11/2017 | $10,328 | $10,223 | $10,253 |
|---|
| 12/2017 | $10,372 | $10,270 | $10,294 |
|---|
| 01/2018 | $10,483 | $10,152 | $10,393 |
|---|
| 02/2018 | $10,494 | $10,056 | $10,414 |
|---|
| 03/2018 | $10,518 | $10,120 | $10,443 |
|---|
| 04/2018 | $10,561 | $10,045 | $10,486 |
|---|
| 05/2018 | $10,566 | $10,117 | $10,504 |
|---|
| 06/2018 | $10,585 | $10,104 | $10,516 |
|---|
| 07/2018 | $10,650 | $10,107 | $10,594 |
|---|
| 08/2018 | $10,680 | $10,172 | $10,636 |
|---|
| 09/2018 | $10,741 | $10,106 | $10,709 |
|---|
| 10/2018 | $10,734 | $10,026 | $10,706 |
|---|
| 11/2018 | $10,646 | $10,086 | $10,609 |
|---|
| 12/2018 | $10,418 | $10,271 | $10,339 |
|---|
| 01/2019 | $10,596 | $10,381 | $10,603 |
|---|
| 02/2019 | $10,719 | $10,375 | $10,771 |
|---|
| 03/2019 | $10,714 | $10,574 | $10,753 |
|---|
| 04/2019 | $10,862 | $10,576 | $10,930 |
|---|
| 05/2019 | $10,835 | $10,764 | $10,907 |
|---|
| 06/2019 | $10,856 | $10,899 | $10,933 |
|---|
| 07/2019 | $10,920 | $10,923 | $11,021 |
|---|
| 08/2019 | $10,871 | $11,206 | $10,990 |
|---|
| 09/2019 | $10,900 | $11,147 | $11,042 |
|---|
| 10/2019 | $10,781 | $11,180 | $10,992 |
|---|
| 11/2019 | $10,811 | $11,175 | $11,056 |
|---|
| 12/2019 | $10,987 | $11,167 | $11,233 |
|---|
| 01/2020 | $11,056 | $11,382 | $11,296 |
|---|
| 02/2020 | $10,877 | $11,587 | $11,146 |
|---|
| 03/2020 | $9,195 | $11,518 | $9,768 |
|---|
| 04/2020 | $9,564 | $11,723 | $10,207 |
|---|
| 05/2020 | $9,996 | $11,778 | $10,595 |
|---|
| 06/2020 | $10,188 | $11,852 | $10,715 |
|---|
| 07/2020 | $10,378 | $12,029 | $10,925 |
|---|
| 08/2020 | $10,582 | $11,932 | $11,088 |
|---|
| 09/2020 | $10,674 | $11,925 | $11,158 |
|---|
| 10/2020 | $10,735 | $11,872 | $11,181 |
|---|
| 11/2020 | $10,958 | $11,989 | $11,430 |
|---|
| 12/2020 | $11,135 | $12,005 | $11,584 |
|---|
| 01/2021 | $11,250 | $11,919 | $11,722 |
|---|
| 02/2021 | $11,321 | $11,747 | $11,790 |
|---|
| 03/2021 | $11,332 | $11,600 | $11,790 |
|---|
| 04/2021 | $11,391 | $11,692 | $11,851 |
|---|
| 05/2021 | $11,453 | $11,730 | $11,920 |
|---|
| 06/2021 | $11,489 | $11,812 | $11,964 |
|---|
| 07/2021 | $11,497 | $11,945 | $11,962 |
|---|
| 08/2021 | $11,534 | $11,922 | $12,019 |
|---|
| 09/2021 | $11,596 | $11,819 | $12,096 |
|---|
| 10/2021 | $11,622 | $11,815 | $12,128 |
|---|
| 11/2021 | $11,593 | $11,850 | $12,109 |
|---|
| 12/2021 | $11,669 | $11,820 | $12,187 |
|---|
| 01/2022 | $11,708 | $11,565 | $12,231 |
|---|
| 02/2022 | $11,638 | $11,436 | $12,168 |
|---|
| 03/2022 | $11,613 | $11,119 | $12,174 |
|---|
| 04/2022 | $11,585 | $10,697 | $12,200 |
|---|
| 05/2022 | $11,261 | $10,766 | $11,888 |
|---|
| 06/2022 | $10,964 | $10,597 | $11,631 |
|---|
| 07/2022 | $11,111 | $10,856 | $11,879 |
|---|
| 08/2022 | $11,311 | $10,549 | $12,058 |
|---|
| 09/2022 | $10,999 | $10,093 | $11,783 |
|---|
| 10/2022 | $11,001 | $9,962 | $11,900 |
|---|
| 11/2022 | $11,129 | $10,329 | $12,043 |
|---|
| 12/2022 | $11,139 | $10,282 | $12,093 |
|---|
| 01/2023 | $11,457 | $10,598 | $12,415 |
|---|
| 02/2023 | $11,509 | $10,324 | $12,487 |
|---|
| 03/2023 | $11,458 | $10,587 | $12,483 |
|---|
| 04/2023 | $11,589 | $10,651 | $12,614 |
|---|
| 05/2023 | $11,536 | $10,535 | $12,591 |
|---|
| 06/2023 | $11,816 | $10,497 | $12,876 |
|---|
| 07/2023 | $12,007 | $10,490 | $13,041 |
|---|
| 08/2023 | $12,144 | $10,423 | $13,194 |
|---|
| 09/2023 | $12,207 | $10,158 | $13,321 |
|---|
| 10/2023 | $12,154 | $9,998 | $13,319 |
|---|
| 11/2023 | $12,321 | $10,451 | $13,481 |
|---|
| 12/2023 | $12,515 | $10,851 | $13,703 |
|---|
| 01/2024 | $12,597 | $10,821 | $13,796 |
|---|
| 02/2024 | $12,705 | $10,668 | $13,921 |
|---|
| 03/2024 | $12,820 | $10,766 | $14,040 |
|---|
| 04/2024 | $12,867 | $10,495 | $14,124 |
|---|
| 05/2024 | $12,965 | $10,672 | $14,257 |
|---|
| 06/2024 | $12,995 | $10,773 | $14,307 |
|---|
| 07/2024 | $13,078 | $11,025 | $14,404 |
|---|
| 08/2024 | $13,157 | $11,184 | $14,496 |
|---|
| 09/2024 | $13,265 | $11,333 | $14,599 |
|---|
| 10/2024 | $13,373 | $11,052 | $14,725 |
|---|
| 11/2024 | $13,522 | $11,169 | $14,847 |
|---|
Performance data shown represents past performance and is no guarantee of, and is not necessarily indicative of, future results. Total return and value will vary, and you may have a gain or loss when shares are sold. Current performance may be lower or higher than quoted. For the most recent month-end performance, visit im.natixis.com/en-us/products/mutual-funds/price-and-performance.
Average Annual Total Returns (%)
| AATR | 1 Year | 5 Years | Since Inception 3/31/17 |
|---|
| Class N | 9.75% | 4.58% | 4.01% |
|---|
| Bloomberg U.S. Aggregate Bond Index | 6.88% | (0.01%) | 1.46% |
|---|
| Morningstar LSTA US Leveraged Loan Index | 10.13% | 6.07% | 5.30% |
|---|
Effective April 1, 2024, in accordance with new regulations, the Fund's primary broad-based index changed to the Bloomberg U.S. Aggregate Bond Index. The Fund will retain the Morningstar LSTA US Leveraged Loan Index as an additional benchmark for performance comparison.
| Total Net Assets | $822,515,408 |
|---|
| # of Portfolio Holdings (including overnight repurchase agreements) | 306 |
|---|
| Portfolio Turnover Rate | 107% |
|---|
| Total Advisory Fees Paid (after waiver/reimbursement, if applicable) | $4,472,711 |
|---|
What did the Fund invest in? (% of Net Assets)
| Value | Value |
|---|
Other investments less than 3% of net assetsFootnote Reference* | 25.2% |
| Short-Term Investments | 9.9% |
| Exchange-Traded Funds | 1.6% |
| Collateralized Loan Obligations | 1.8% |
| Consumer Products | 3.5% |
| Diversified Manufacturing | 4.0% |
| Brokerage | 4.2% |
| Building Materials | 4.3% |
| Property & Casualty Insurance | 6.0% |
| Consumer Cyclical Services | 6.1% |
| Media Entertainment | 6.3% |
| Healthcare | 6.7% |
| Retailers | 8.0% |
| Technology | 12.4% |
| Footnote | Description |
Footnote* | Net of other assets less liabilities |
Credit QualityFootnote Reference†
| Value | Value |
|---|
| Cash & equivalents | 2.2 |
| U.S. Treasury | 1.8 |
Not ratedFootnote Reference^ | 2.8 |
| CCC | 6.9 |
| B | 64.7 |
| BB | 21.6 |
| Footnote | Description |
Footnote† | Credit ratings are by S&P Global Ratings. A credit rating is an assessment provided by a nationally recognized statistical rating organization (NRSRO) of the creditworthiness of an issuer with respect to debt obligations except for those debt obligations that are only privately rated. Ratings are measured on a scale that generally ranges from AAA (highest) to D (lowest). The credit ratings shown relate to the creditworthiness of the issuers of the underlying securities in the Fund, and not to the Fund or its shares. Credit ratings are subject to change. |
Footnote^ | Not Rated category represents only those securities not rated by S&P Global Ratings. Such securities may be rated by other NRSROs not shown here. |
Effective July 1, 2024, the Fund had the following material changes, which were reported in a supplement to the Fund's prospectus. For more information, you may review the Fund's prospectus at im.natixis.com/funddocuments or upon request at 800-225-5478 or through your financial intermediary.
Expenses: The expense limit as a percentage of average daily net assets was reduced to 0.68% from 0.70%.
There were no changes in or disagreements with Accountants during the period.
For additional information about the Fund; including its prospectus, financial information, holdings and proxy information, scan the QR code or visit im.natixis.com/funddocuments.
Loomis Sayles Senior Floating Rate and Fixed Income Fund
Annual Shareholder Report
November 30, 2024
Vaughan Nelson Select Fund
Annual Shareholder Report - November 30, 2024
This annual shareholder report contains important information about Vaughan Nelson Select Fund for the period of December 1, 2023 to November 30, 2024. You can find additional information (including tax information) about the Fund at im.natixis.com/funddocuments. You can also request the information by contacting us at (800) 225-5478 or by contacting your financial intermediary directly.
What were the fund costs for the last year? (based on a hypothetical $10,000 investment)
| Class Name | Costs of a $10,000 investment | Costs paid as a percentage of a $10,000 investmentFootnote Reference† |
|---|
| Class Y | $93 | 0.85% |
|---|
| Footnote | Description |
Footnote† | Annualized for periods less than one year (if applicable). |
How did the fund perform last year and what affected its performance?
Explanation of Fund Performance
Top Contributors to Performance
• The largest contributor to year-to-date performance was the portfolio's overweight position and selection in Consumer Discretionary led by DoorDash.
• Selection in Industrials also contributed to performance with Comfort Systems USA, Inc leading.
Top Detractors from Performance
• The largest detractor from year-to-date performance was the security selection within Information Technology. Snowflake, Inc. Class A hindered the sector the most.
• The portfolio's selection within Health Care also negatively impacted performance. DexCom, Inc. was the weakest name.
As a result of buys and sells and market action, the portfolio is overweight Materials, Financials, Consumer Discretionary, Energy, and Communication Services while underweight Industrials, Health Care, Information Technology, Real Estate, Utilities, and Consumer Staples.
We continued to sell positions that we believe to be fully valued or that could face increased earnings pressure as we move into the late stages of this economic recovery and added to existing positions or established new positions that met our investment criteria.
We continue to position the portfolio into companies that have lower earnings variability, higher profitability, and stronger balance sheets than the broader investment universe, and where we can get these characteristics at similar valuation levels to the benchmark index. We still do not favor any single industry or sector and continue to look for the characteristics noted above across all industries.
The Fund’s benchmarks are unmanaged indices used as a general measure of market performance. Calculations assume dividends and capital gains are reinvested. The tables do not reflect taxes shareholders might owe on any fund distributions or when they redeem their shares. You cannot invest directly in an index.
Total Return Based on a Hypothetical $10,000 Investment
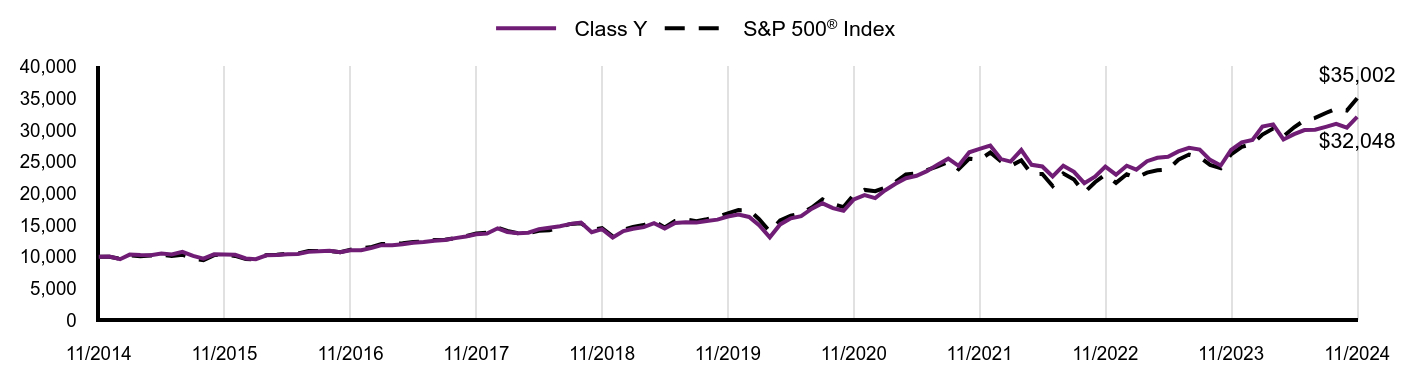
| Class Y | S&P 500® Index |
|---|
| 11/2014 | $10,000 | $10,000 |
|---|
| 12/2014 | $10,016 | $9,975 |
|---|
| 01/2015 | $9,592 | $9,675 |
|---|
| 02/2015 | $10,322 | $10,231 |
|---|
| 03/2015 | $10,245 | $10,070 |
|---|
| 04/2015 | $10,231 | $10,166 |
|---|
| 05/2015 | $10,502 | $10,297 |
|---|
| 06/2015 | $10,342 | $10,098 |
|---|
| 07/2015 | $10,766 | $10,309 |
|---|
| 08/2015 | $10,127 | $9,687 |
|---|
| 09/2015 | $9,696 | $9,447 |
|---|
| 10/2015 | $10,370 | $10,244 |
|---|
| 11/2015 | $10,356 | $10,275 |
|---|
| 12/2015 | $10,297 | $10,113 |
|---|
| 01/2016 | $9,707 | $9,611 |
|---|
| 02/2016 | $9,608 | $9,598 |
|---|
| 03/2016 | $10,212 | $10,249 |
|---|
| 04/2016 | $10,269 | $10,289 |
|---|
| 05/2016 | $10,368 | $10,474 |
|---|
| 06/2016 | $10,411 | $10,501 |
|---|
| 07/2016 | $10,752 | $10,888 |
|---|
| 08/2016 | $10,866 | $10,903 |
|---|
| 09/2016 | $10,922 | $10,905 |
|---|
| 10/2016 | $10,709 | $10,706 |
|---|
| 11/2016 | $11,001 | $11,103 |
|---|
| 12/2016 | $11,011 | $11,322 |
|---|
| 01/2017 | $11,388 | $11,537 |
|---|
| 02/2017 | $11,815 | $11,995 |
|---|
| 03/2017 | $11,786 | $12,009 |
|---|
| 04/2017 | $11,960 | $12,132 |
|---|
| 05/2017 | $12,184 | $12,303 |
|---|
| 06/2017 | $12,300 | $12,380 |
|---|
| 07/2017 | $12,503 | $12,635 |
|---|
| 08/2017 | $12,640 | $12,673 |
|---|
| 09/2017 | $12,923 | $12,935 |
|---|
| 10/2017 | $13,183 | $13,237 |
|---|
| 11/2017 | $13,545 | $13,642 |
|---|
| 12/2017 | $13,631 | $13,794 |
|---|
| 01/2018 | $14,472 | $14,584 |
|---|
| 02/2018 | $13,898 | $14,046 |
|---|
| 03/2018 | $13,710 | $13,689 |
|---|
| 04/2018 | $13,782 | $13,742 |
|---|
| 05/2018 | $14,340 | $14,073 |
|---|
| 06/2018 | $14,575 | $14,160 |
|---|
| 07/2018 | $14,803 | $14,686 |
|---|
| 08/2018 | $15,172 | $15,165 |
|---|
| 09/2018 | $15,385 | $15,251 |
|---|
| 10/2018 | $13,860 | $14,209 |
|---|
| 11/2018 | $14,340 | $14,498 |
|---|
| 12/2018 | $13,009 | $13,189 |
|---|
| 01/2019 | $14,029 | $14,246 |
|---|
| 02/2019 | $14,395 | $14,704 |
|---|
| 03/2019 | $14,656 | $14,989 |
|---|
| 04/2019 | $15,284 | $15,596 |
|---|
| 05/2019 | $14,447 | $14,605 |
|---|
| 06/2019 | $15,327 | $15,635 |
|---|
| 07/2019 | $15,432 | $15,859 |
|---|
| 08/2019 | $15,371 | $15,608 |
|---|
| 09/2019 | $15,632 | $15,900 |
|---|
| 10/2019 | $15,841 | $16,245 |
|---|
| 11/2019 | $16,338 | $16,834 |
|---|
| 12/2019 | $16,627 | $17,342 |
|---|
| 01/2020 | $16,268 | $17,335 |
|---|
| 02/2020 | $14,963 | $15,908 |
|---|
| 03/2020 | $13,044 | $13,944 |
|---|
| 04/2020 | $15,086 | $15,731 |
|---|
| 05/2020 | $16,041 | $16,480 |
|---|
| 06/2020 | $16,400 | $16,808 |
|---|
| 07/2020 | $17,563 | $17,756 |
|---|
| 08/2020 | $18,413 | $19,032 |
|---|
| 09/2020 | $17,648 | $18,309 |
|---|
| 10/2020 | $17,241 | $17,822 |
|---|
| 11/2020 | $19,037 | $19,773 |
|---|
| 12/2020 | $19,718 | $20,533 |
|---|
| 01/2021 | $19,241 | $20,326 |
|---|
| 02/2021 | $20,438 | $20,886 |
|---|
| 03/2021 | $21,492 | $21,801 |
|---|
| 04/2021 | $22,374 | $22,964 |
|---|
| 05/2021 | $22,759 | $23,125 |
|---|
| 06/2021 | $23,489 | $23,665 |
|---|
| 07/2021 | $24,523 | $24,227 |
|---|
| 08/2021 | $25,456 | $24,963 |
|---|
| 09/2021 | $24,341 | $23,802 |
|---|
| 10/2021 | $26,480 | $25,470 |
|---|
| 11/2021 | $26,997 | $25,294 |
|---|
| 12/2021 | $27,520 | $26,427 |
|---|
| 01/2022 | $25,395 | $25,060 |
|---|
| 02/2022 | $25,006 | $24,309 |
|---|
| 03/2022 | $26,826 | $25,212 |
|---|
| 04/2022 | $24,492 | $23,013 |
|---|
| 05/2022 | $24,228 | $23,056 |
|---|
| 06/2022 | $22,645 | $21,152 |
|---|
| 07/2022 | $24,353 | $23,103 |
|---|
| 08/2022 | $23,381 | $22,161 |
|---|
| 09/2022 | $21,589 | $20,120 |
|---|
| 10/2022 | $22,617 | $21,749 |
|---|
| 11/2022 | $24,214 | $22,964 |
|---|
| 12/2022 | $22,938 | $21,641 |
|---|
| 01/2023 | $24,343 | $23,001 |
|---|
| 02/2023 | $23,725 | $22,440 |
|---|
| 03/2023 | $25,060 | $23,263 |
|---|
| 04/2023 | $25,594 | $23,626 |
|---|
| 05/2023 | $25,749 | $23,729 |
|---|
| 06/2023 | $26,606 | $25,297 |
|---|
| 07/2023 | $27,169 | $26,110 |
|---|
| 08/2023 | $26,902 | $25,694 |
|---|
| 09/2023 | $25,285 | $24,469 |
|---|
| 10/2023 | $24,386 | $23,955 |
|---|
| 11/2023 | $26,831 | $26,142 |
|---|
| 12/2023 | $28,036 | $27,330 |
|---|
| 01/2024 | $28,416 | $27,789 |
|---|
| 02/2024 | $30,542 | $29,273 |
|---|
| 03/2024 | $30,879 | $30,215 |
|---|
| 04/2024 | $28,501 | $28,981 |
|---|
| 05/2024 | $29,331 | $30,418 |
|---|
| 06/2024 | $29,979 | $31,509 |
|---|
| 07/2024 | $30,035 | $31,893 |
|---|
| 08/2024 | $30,485 | $32,666 |
|---|
| 09/2024 | $30,950 | $33,364 |
|---|
| 10/2024 | $30,359 | $33,061 |
|---|
| 11/2024 | $32,048 | $35,002 |
|---|
Performance data shown represents past performance and is no guarantee of, and is not necessarily indicative of, future results. Total return and value will vary, and you may have a gain or loss when shares are sold. Current performance may be lower or higher than quoted. For the most recent month-end performance, visit im.natixis.com/en-us/products/mutual-funds/price-and-performance.
Average Annual Total Returns (%)
| AATR | 1 Year | 5 Years | 10 Years |
|---|
| Class Y | 19.44% | 14.42% | 12.35% |
|---|
S&P 500® Index | 33.89% | 15.77% | 13.35% |
|---|
| Total Net Assets | $788,624,729 |
|---|
| # of Portfolio Holdings (including overnight repurchase agreements) | 32 |
|---|
| Portfolio Turnover Rate | 84% |
|---|
| Total Advisory Fees Paid (after waiver/reimbursement, if applicable) | $5,057,273 |
|---|
What did the Fund invest in? (% of Net Assets)
| Value | Value |
|---|
Other investments less than 3% of net assetsFootnote Reference* | 11.3% |
| Electrical Equipment | 3.2% |
| Specialty Retail | 3.3% |
| Hotels, Restaurants & Leisure | 3.3% |
| Construction & Engineering | 3.4% |
| Oil, Gas & Consumable Fuels | 3.8% |
| Banks | 3.8% |
| Pharmaceuticals | 3.9% |
| Ground Transportation | 4.3% |
| Capital Markets | 4.4% |
| Entertainment | 4.6% |
| Chemicals | 5.4% |
| Broadline Retail | 6.2% |
| Interactive Media & Services | 7.8% |
| Software | 13.8% |
| Semiconductors & Semiconductor Equipment | 17.5% |
| Footnote | Description |
Footnote* | Net of other assets less liabilities |
| NVIDIA Corp. | 7.2% |
| Microsoft Corp. | 6.7% |
| Amazon.com, Inc. | 6.2% |
| Walt Disney Co. | 4.6% |
| Taiwan Semiconductor Manufacturing Co. Ltd., ADR | 4.6% |
| Alphabet, Inc., Class A | 4.5% |
| Intercontinental Exchange, Inc. | 4.4% |
| Saia, Inc. | 4.3% |
| ServiceNow, Inc. | 3.9% |
| Zoetis, Inc. | 3.9% |
There were no material fund changes during the period.
There were no changes in or disagreements with Accountants during the period.
For additional information about the Fund; including its prospectus, financial information, holdings and proxy information, scan the QR code or visit im.natixis.com/funddocuments.
Vaughan Nelson Select Fund
Annual Shareholder Report
November 30, 2024
Vaughan Nelson Select Fund
Annual Shareholder Report - November 30, 2024
This annual shareholder report contains important information about Vaughan Nelson Select Fund for the period of December 1, 2023 to November 30, 2024. You can find additional information (including tax information) about the Fund at im.natixis.com/funddocuments. You can also request the information by contacting us at (800) 225-5478 or by contacting your financial intermediary directly.
What were the fund costs for the last year? (based on a hypothetical $10,000 investment)
| Class Name | Costs of a $10,000 investment | Costs paid as a percentage of a $10,000 investmentFootnote Reference† |
|---|
| Class A | $121 | 1.10% |
|---|
| Footnote | Description |
Footnote† | Annualized for periods less than one year (if applicable). |
How did the fund perform last year and what affected its performance?
Explanation of Fund Performance
Top Contributors to Performance
• The largest contributor to year-to-date performance was the portfolio's overweight position and selection in Consumer Discretionary led by DoorDash.
• Selection in Industrials also contributed to performance with Comfort Systems USA, Inc leading.
Top Detractors from Performance
• The largest detractor from year-to-date performance was the security selection within Information Technology. Snowflake, Inc. Class A hindered the sector the most.
• The portfolio's selection within Health Care also negatively impacted performance. DexCom, Inc. was the weakest name.
As a result of buys and sells and market action, the portfolio is overweight Materials, Financials, Consumer Discretionary, Energy, and Communication Services while underweight Industrials, Health Care, Information Technology, Real Estate, Utilities, and Consumer Staples.
We continued to sell positions that we believe to be fully valued or that could face increased earnings pressure as we move into the late stages of this economic recovery and added to existing positions or established new positions that met our investment criteria.
We continue to position the portfolio into companies that have lower earnings variability, higher profitability, and stronger balance sheets than the broader investment universe, and where we can get these characteristics at similar valuation levels to the benchmark index. We still do not favor any single industry or sector and continue to look for the characteristics noted above across all industries.
The Fund’s benchmarks are unmanaged indices used as a general measure of market performance. Calculations assume dividends and capital gains are reinvested. The tables do not reflect taxes shareholders might owe on any fund distributions or when they redeem their shares. You cannot invest directly in an index.
Total Return Based on a Hypothetical $10,000 Investment
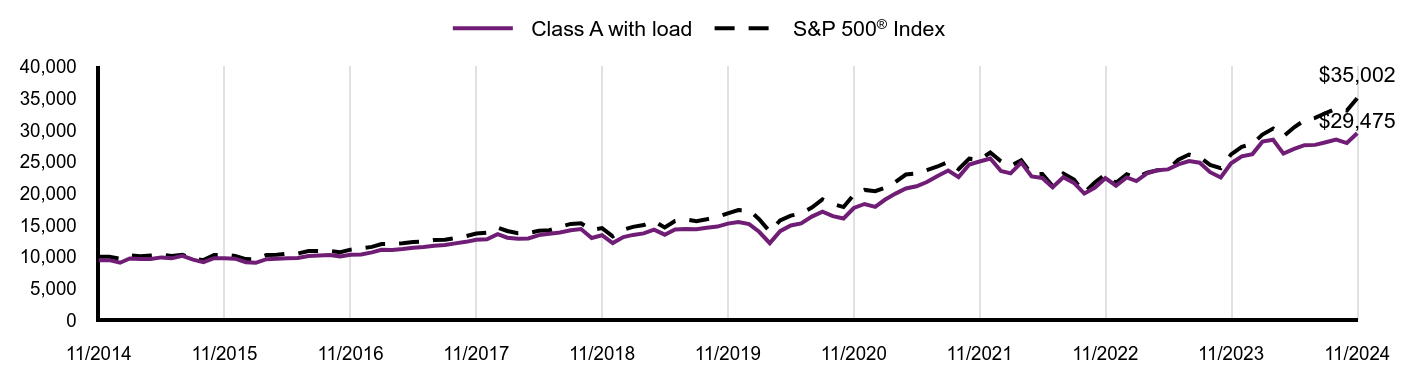
| Class A with load | S&P 500® Index |
|---|
| 11/2014 | $9,426 | $10,000 |
|---|
| 12/2014 | $9,442 | $9,975 |
|---|
| 01/2015 | $9,041 | $9,675 |
|---|
| 02/2015 | $9,718 | $10,231 |
|---|
| 03/2015 | $9,646 | $10,070 |
|---|
| 04/2015 | $9,633 | $10,166 |
|---|
| 05/2015 | $9,882 | $10,297 |
|---|
| 06/2015 | $9,731 | $10,098 |
|---|
| 07/2015 | $10,125 | $10,309 |
|---|
| 08/2015 | $9,527 | $9,687 |
|---|
| 09/2015 | $9,120 | $9,447 |
|---|
| 10/2015 | $9,751 | $10,244 |
|---|
| 11/2015 | $9,738 | $10,275 |
|---|
| 12/2015 | $9,676 | $10,113 |
|---|
| 01/2016 | $9,126 | $9,611 |
|---|
| 02/2016 | $9,025 | $9,598 |
|---|
| 03/2016 | $9,595 | $10,249 |
|---|
| 04/2016 | $9,649 | $10,289 |
|---|
| 05/2016 | $9,736 | $10,474 |
|---|
| 06/2016 | $9,776 | $10,501 |
|---|
| 07/2016 | $10,092 | $10,888 |
|---|
| 08/2016 | $10,199 | $10,903 |
|---|
| 09/2016 | $10,246 | $10,905 |
|---|
| 10/2016 | $10,045 | $10,706 |
|---|
| 11/2016 | $10,313 | $11,103 |
|---|
| 12/2016 | $10,326 | $11,322 |
|---|
| 01/2017 | $10,680 | $11,537 |
|---|
| 02/2017 | $11,069 | $11,995 |
|---|
| 03/2017 | $11,041 | $12,009 |
|---|
| 04/2017 | $11,205 | $12,132 |
|---|
| 05/2017 | $11,416 | $12,303 |
|---|
| 06/2017 | $11,525 | $12,380 |
|---|
| 07/2017 | $11,709 | $12,635 |
|---|
| 08/2017 | $11,832 | $12,673 |
|---|
| 09/2017 | $12,091 | $12,935 |
|---|
| 10/2017 | $12,336 | $13,237 |
|---|
| 11/2017 | $12,670 | $13,642 |
|---|
| 12/2017 | $12,754 | $13,794 |
|---|
| 01/2018 | $13,537 | $14,584 |
|---|
| 02/2018 | $12,991 | $14,046 |
|---|
| 03/2018 | $12,813 | $13,689 |
|---|
| 04/2018 | $12,881 | $13,742 |
|---|
| 05/2018 | $13,398 | $14,073 |
|---|
| 06/2018 | $13,619 | $14,160 |
|---|
| 07/2018 | $13,826 | $14,686 |
|---|
| 08/2018 | $14,165 | $15,165 |
|---|
| 09/2018 | $14,365 | $15,251 |
|---|
| 10/2018 | $12,940 | $14,209 |
|---|
| 11/2018 | $13,383 | $14,498 |
|---|
| 12/2018 | $12,142 | $13,189 |
|---|
| 01/2019 | $13,089 | $14,246 |
|---|
| 02/2019 | $13,432 | $14,704 |
|---|
| 03/2019 | $13,669 | $14,989 |
|---|
| 04/2019 | $14,249 | $15,596 |
|---|
| 05/2019 | $13,465 | $14,605 |
|---|
| 06/2019 | $14,290 | $15,635 |
|---|
| 07/2019 | $14,371 | $15,859 |
|---|
| 08/2019 | $14,322 | $15,608 |
|---|
| 09/2019 | $14,559 | $15,900 |
|---|
| 10/2019 | $14,747 | $16,245 |
|---|
| 11/2019 | $15,212 | $16,834 |
|---|
| 12/2019 | $15,477 | $17,342 |
|---|
| 01/2020 | $15,142 | $17,335 |
|---|
| 02/2020 | $13,922 | $15,908 |
|---|
| 03/2020 | $12,127 | $13,944 |
|---|
| 04/2020 | $14,028 | $15,731 |
|---|
| 05/2020 | $14,921 | $16,480 |
|---|
| 06/2020 | $15,248 | $16,808 |
|---|
| 07/2020 | $16,317 | $17,756 |
|---|
| 08/2020 | $17,113 | $19,032 |
|---|
| 09/2020 | $16,397 | $18,309 |
|---|
| 10/2020 | $16,017 | $17,822 |
|---|
| 11/2020 | $17,678 | $19,773 |
|---|
| 12/2020 | $18,309 | $20,533 |
|---|
| 01/2021 | $17,865 | $20,326 |
|---|
| 02/2021 | $18,972 | $20,886 |
|---|
| 03/2021 | $19,946 | $21,801 |
|---|
| 04/2021 | $20,760 | $22,964 |
|---|
| 05/2021 | $21,110 | $23,125 |
|---|
| 06/2021 | $21,782 | $23,665 |
|---|
| 07/2021 | $22,738 | $24,227 |
|---|
| 08/2021 | $23,599 | $24,963 |
|---|
| 09/2021 | $22,558 | $23,802 |
|---|
| 10/2021 | $24,545 | $25,470 |
|---|
| 11/2021 | $25,009 | $25,294 |
|---|
| 12/2021 | $25,486 | $26,427 |
|---|
| 01/2022 | $23,513 | $25,060 |
|---|
| 02/2022 | $23,149 | $24,309 |
|---|
| 03/2022 | $24,837 | $25,212 |
|---|
| 04/2022 | $22,669 | $23,013 |
|---|
| 05/2022 | $22,422 | $23,056 |
|---|
| 06/2022 | $20,955 | $21,152 |
|---|
| 07/2022 | $22,526 | $23,103 |
|---|
| 08/2022 | $21,630 | $22,161 |
|---|
| 09/2022 | $19,956 | $20,120 |
|---|
| 10/2022 | $20,903 | $21,749 |
|---|
| 11/2022 | $22,383 | $22,964 |
|---|
| 12/2022 | $21,189 | $21,641 |
|---|
| 01/2023 | $22,500 | $23,001 |
|---|
| 02/2023 | $21,923 | $22,440 |
|---|
| 03/2023 | $23,142 | $23,263 |
|---|
| 04/2023 | $23,640 | $23,626 |
|---|
| 05/2023 | $23,772 | $23,729 |
|---|
| 06/2023 | $24,558 | $25,297 |
|---|
| 07/2023 | $25,083 | $26,110 |
|---|
| 08/2023 | $24,821 | $25,694 |
|---|
| 09/2023 | $23,326 | $24,469 |
|---|
| 10/2023 | $22,487 | $23,955 |
|---|
| 11/2023 | $24,742 | $26,142 |
|---|
| 12/2023 | $25,843 | $27,330 |
|---|
| 01/2024 | $26,184 | $27,789 |
|---|
| 02/2024 | $28,151 | $29,273 |
|---|
| 03/2024 | $28,453 | $30,215 |
|---|
| 04/2024 | $26,263 | $28,981 |
|---|
| 05/2024 | $27,010 | $30,418 |
|---|
| 06/2024 | $27,600 | $31,509 |
|---|
| 07/2024 | $27,640 | $31,893 |
|---|
| 08/2024 | $28,059 | $32,666 |
|---|
| 09/2024 | $28,479 | $33,364 |
|---|
| 10/2024 | $27,928 | $33,061 |
|---|
| 11/2024 | $29,475 | $35,002 |
|---|
Performance data shown represents past performance and is no guarantee of, and is not necessarily indicative of, future results. Total return and value will vary, and you may have a gain or loss when shares are sold. Current performance may be lower or higher than quoted. For the most recent month-end performance, visit im.natixis.com/en-us/products/mutual-funds/price-and-performance.
Average Annual Total Returns (%)
| AATR | 1 Year | 5 Years | 10 Years |
|---|
| Class A at NAV | 19.13% | 14.14% | 12.08% |
|---|
Class A with 5.75% MSCFootnote Reference1 | 12.29% | 12.80% | 11.42% |
|---|
S&P 500® Index | 33.89% | 15.77% | 13.35% |
|---|
| Footnote | Description |
Footnote1 | Maximum sales charge |
| Total Net Assets | $788,624,729 |
|---|
| # of Portfolio Holdings (including overnight repurchase agreements) | 32 |
|---|
| Portfolio Turnover Rate | 84% |
|---|
| Total Advisory Fees Paid (after waiver/reimbursement, if applicable) | $5,057,273 |
|---|
What did the Fund invest in? (% of Net Assets)
| Value | Value |
|---|
Other investments less than 3% of net assetsFootnote Reference* | 11.3% |
| Electrical Equipment | 3.2% |
| Specialty Retail | 3.3% |
| Hotels, Restaurants & Leisure | 3.3% |
| Construction & Engineering | 3.4% |
| Oil, Gas & Consumable Fuels | 3.8% |
| Banks | 3.8% |
| Pharmaceuticals | 3.9% |
| Ground Transportation | 4.3% |
| Capital Markets | 4.4% |
| Entertainment | 4.6% |
| Chemicals | 5.4% |
| Broadline Retail | 6.2% |
| Interactive Media & Services | 7.8% |
| Software | 13.8% |
| Semiconductors & Semiconductor Equipment | 17.5% |
| Footnote | Description |
Footnote* | Net of other assets less liabilities |
| NVIDIA Corp. | 7.2% |
| Microsoft Corp. | 6.7% |
| Amazon.com, Inc. | 6.2% |
| Walt Disney Co. | 4.6% |
| Taiwan Semiconductor Manufacturing Co. Ltd., ADR | 4.6% |
| Alphabet, Inc., Class A | 4.5% |
| Intercontinental Exchange, Inc. | 4.4% |
| Saia, Inc. | 4.3% |
| ServiceNow, Inc. | 3.9% |
| Zoetis, Inc. | 3.9% |
There were no material fund changes during the period.
There were no changes in or disagreements with Accountants during the period.
For additional information about the Fund; including its prospectus, financial information, holdings and proxy information, scan the QR code or visit im.natixis.com/funddocuments.
Vaughan Nelson Select Fund
Annual Shareholder Report
November 30, 2024
Vaughan Nelson Select Fund
Annual Shareholder Report - November 30, 2024
This annual shareholder report contains important information about Vaughan Nelson Select Fund for the period of December 1, 2023 to November 30, 2024. You can find additional information (including tax information) about the Fund at im.natixis.com/funddocuments. You can also request the information by contacting us at (800) 225-5478 or by contacting your financial intermediary directly.
What were the fund costs for the last year? (based on a hypothetical $10,000 investment)
| Class Name | Costs of a $10,000 investment | Costs paid as a percentage of a $10,000 investmentFootnote Reference† |
|---|
| Class C | $202 | 1.85% |
|---|
| Footnote | Description |
Footnote† | Annualized for periods less than one year (if applicable). |
How did the fund perform last year and what affected its performance?
Explanation of Fund Performance
Top Contributors to Performance
• The largest contributor to year-to-date performance was the portfolio's overweight position and selection in Consumer Discretionary led by DoorDash.
• Selection in Industrials also contributed to performance with Comfort Systems USA, Inc leading.
Top Detractors from Performance
• The largest detractor from year-to-date performance was the security selection within Information Technology. Snowflake, Inc. Class A hindered the sector the most.
• The portfolio's selection within Health Care also negatively impacted performance. DexCom, Inc. was the weakest name.
As a result of buys and sells and market action, the portfolio is overweight Materials, Financials, Consumer Discretionary, Energy, and Communication Services while underweight Industrials, Health Care, Information Technology, Real Estate, Utilities, and Consumer Staples.
We continued to sell positions that we believe to be fully valued or that could face increased earnings pressure as we move into the late stages of this economic recovery and added to existing positions or established new positions that met our investment criteria.
We continue to position the portfolio into companies that have lower earnings variability, higher profitability, and stronger balance sheets than the broader investment universe, and where we can get these characteristics at similar valuation levels to the benchmark index. We still do not favor any single industry or sector and continue to look for the characteristics noted above across all industries.
The Fund’s benchmarks are unmanaged indices used as a general measure of market performance. Calculations assume dividends and capital gains are reinvested. The tables do not reflect taxes shareholders might owe on any fund distributions or when they redeem their shares. You cannot invest directly in an index.
Total Return Based on a Hypothetical $10,000 Investment
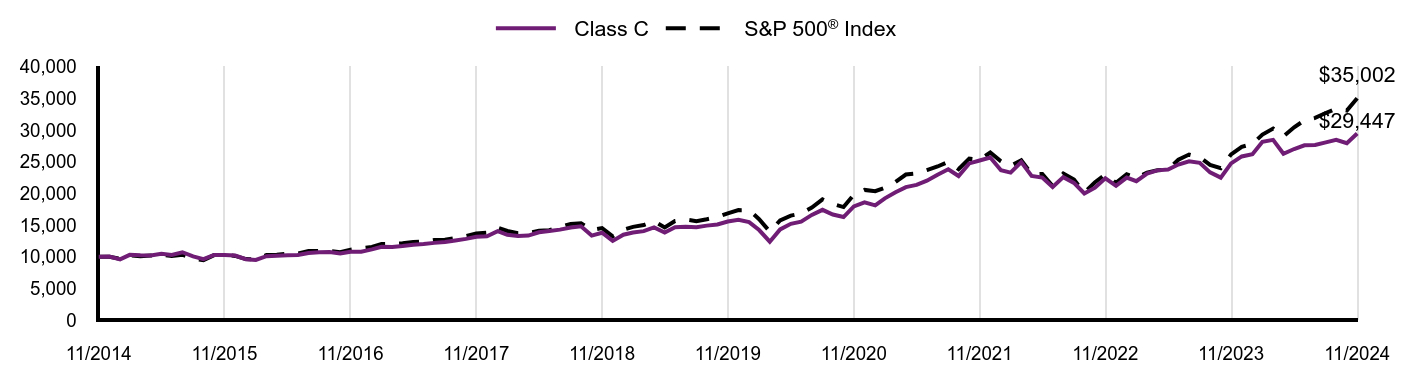
| Class C | S&P 500® Index |
|---|
| 11/2014 | $10,000 | $10,000 |
|---|
| 12/2014 | $10,003 | $9,975 |
|---|
| 01/2015 | $9,577 | $9,675 |
|---|
| 02/2015 | $10,287 | $10,231 |
|---|
| 03/2015 | $10,209 | $10,070 |
|---|
| 04/2015 | $10,181 | $10,166 |
|---|
| 05/2015 | $10,443 | $10,297 |
|---|
| 06/2015 | $10,280 | $10,098 |
|---|
| 07/2015 | $10,692 | $10,309 |
|---|
| 08/2015 | $10,046 | $9,687 |
|---|
| 09/2015 | $9,613 | $9,447 |
|---|
| 10/2015 | $10,273 | $10,244 |
|---|
| 11/2015 | $10,252 | $10,275 |
|---|
| 12/2015 | $10,177 | $10,113 |
|---|
| 01/2016 | $9,597 | $9,611 |
|---|
| 02/2016 | $9,488 | $9,598 |
|---|
| 03/2016 | $10,075 | $10,249 |
|---|
| 04/2016 | $10,126 | $10,289 |
|---|
| 05/2016 | $10,213 | $10,474 |
|---|
| 06/2016 | $10,249 | $10,501 |
|---|
| 07/2016 | $10,568 | $10,888 |
|---|
| 08/2016 | $10,677 | $10,903 |
|---|
| 09/2016 | $10,720 | $10,905 |
|---|
| 10/2016 | $10,503 | $10,706 |
|---|
| 11/2016 | $10,778 | $11,103 |
|---|
| 12/2016 | $10,780 | $11,322 |
|---|
| 01/2017 | $11,141 | $11,537 |
|---|
| 02/2017 | $11,546 | $11,995 |
|---|
| 03/2017 | $11,510 | $12,009 |
|---|
| 04/2017 | $11,672 | $12,132 |
|---|
| 05/2017 | $11,885 | $12,303 |
|---|
| 06/2017 | $11,989 | $12,380 |
|---|
| 07/2017 | $12,173 | $12,635 |
|---|
| 08/2017 | $12,298 | $12,673 |
|---|
| 09/2017 | $12,556 | $12,935 |
|---|
| 10/2017 | $12,806 | $13,237 |
|---|
| 11/2017 | $13,145 | $13,642 |
|---|
| 12/2017 | $13,213 | $13,794 |
|---|
| 01/2018 | $14,017 | $14,584 |
|---|
| 02/2018 | $13,452 | $14,046 |
|---|
| 03/2018 | $13,253 | $13,689 |
|---|
| 04/2018 | $13,318 | $13,742 |
|---|
| 05/2018 | $13,843 | $14,073 |
|---|
| 06/2018 | $14,058 | $14,160 |
|---|
| 07/2018 | $14,265 | $14,686 |
|---|
| 08/2018 | $14,608 | $15,165 |
|---|
| 09/2018 | $14,799 | $15,251 |
|---|
| 10/2018 | $13,326 | $14,209 |
|---|
| 11/2018 | $13,772 | $14,498 |
|---|
| 12/2018 | $12,489 | $13,189 |
|---|
| 01/2019 | $13,454 | $14,246 |
|---|
| 02/2019 | $13,799 | $14,704 |
|---|
| 03/2019 | $14,030 | $14,989 |
|---|
| 04/2019 | $14,623 | $15,596 |
|---|
| 05/2019 | $13,808 | $14,605 |
|---|
| 06/2019 | $14,640 | $15,635 |
|---|
| 07/2019 | $14,720 | $15,859 |
|---|
| 08/2019 | $14,658 | $15,608 |
|---|
| 09/2019 | $14,897 | $15,900 |
|---|
| 10/2019 | $15,074 | $16,245 |
|---|
| 11/2019 | $15,543 | $16,834 |
|---|
| 12/2019 | $15,802 | $17,342 |
|---|
| 01/2020 | $15,449 | $17,335 |
|---|
| 02/2020 | $14,197 | $15,908 |
|---|
| 03/2020 | $12,363 | $13,944 |
|---|
| 04/2020 | $14,293 | $15,731 |
|---|
| 05/2020 | $15,181 | $16,480 |
|---|
| 06/2020 | $15,515 | $16,808 |
|---|
| 07/2020 | $16,585 | $17,756 |
|---|
| 08/2020 | $17,388 | $19,032 |
|---|
| 09/2020 | $16,643 | $18,309 |
|---|
| 10/2020 | $16,251 | $17,822 |
|---|
| 11/2020 | $17,923 | $19,773 |
|---|
| 12/2020 | $18,554 | $20,533 |
|---|
| 01/2021 | $18,083 | $20,326 |
|---|
| 02/2021 | $19,198 | $20,886 |
|---|
| 03/2021 | $20,170 | $21,801 |
|---|
| 04/2021 | $20,978 | $22,964 |
|---|
| 05/2021 | $21,326 | $23,125 |
|---|
| 06/2021 | $21,991 | $23,665 |
|---|
| 07/2021 | $22,932 | $24,227 |
|---|
| 08/2021 | $23,791 | $24,963 |
|---|
| 09/2021 | $22,727 | $23,802 |
|---|
| 10/2021 | $24,711 | $25,470 |
|---|
| 11/2021 | $25,172 | $25,294 |
|---|
| 12/2021 | $25,639 | $26,427 |
|---|
| 01/2022 | $23,632 | $25,060 |
|---|
| 02/2022 | $23,257 | $24,309 |
|---|
| 03/2022 | $24,931 | $25,212 |
|---|
| 04/2022 | $22,737 | $23,013 |
|---|
| 05/2022 | $22,477 | $23,056 |
|---|
| 06/2022 | $20,990 | $21,152 |
|---|
| 07/2022 | $22,549 | $23,103 |
|---|
| 08/2022 | $21,640 | $22,161 |
|---|
| 09/2022 | $19,965 | $20,120 |
|---|
| 10/2022 | $20,889 | $21,749 |
|---|
| 11/2022 | $22,362 | $22,964 |
|---|
| 12/2022 | $21,168 | $21,641 |
|---|
| 01/2023 | $22,478 | $23,001 |
|---|
| 02/2023 | $21,902 | $22,440 |
|---|
| 03/2023 | $23,120 | $23,263 |
|---|
| 04/2023 | $23,618 | $23,626 |
|---|
| 05/2023 | $23,749 | $23,729 |
|---|
| 06/2023 | $24,535 | $25,297 |
|---|
| 07/2023 | $25,059 | $26,110 |
|---|
| 08/2023 | $24,797 | $25,694 |
|---|
| 09/2023 | $23,303 | $24,469 |
|---|
| 10/2023 | $22,465 | $23,955 |
|---|
| 11/2023 | $24,718 | $26,142 |
|---|
| 12/2023 | $25,818 | $27,330 |
|---|
| 01/2024 | $26,159 | $27,789 |
|---|
| 02/2024 | $28,124 | $29,273 |
|---|
| 03/2024 | $28,425 | $30,215 |
|---|
| 04/2024 | $26,237 | $28,981 |
|---|
| 05/2024 | $26,984 | $30,418 |
|---|
| 06/2024 | $27,574 | $31,509 |
|---|
| 07/2024 | $27,613 | $31,893 |
|---|
| 08/2024 | $28,032 | $32,666 |
|---|
| 09/2024 | $28,451 | $33,364 |
|---|
| 10/2024 | $27,901 | $33,061 |
|---|
| 11/2024 | $29,447 | $35,002 |
|---|
Performance data shown represents past performance and is no guarantee of, and is not necessarily indicative of, future results. Total return and value will vary, and you may have a gain or loss when shares are sold. Current performance may be lower or higher than quoted. For the most recent month-end performance, visit im.natixis.com/en-us/products/mutual-funds/price-and-performance.
Average Annual Total Returns (%)
| AATR | 1 Year | 5 Years | 10 Years |
|---|
| Class C at NAV | 18.21% | 13.27% | 11.40% |
|---|
Class C with 1.00% CDSCFootnote Reference1 | 17.21% | 13.27% | 11.40% |
|---|
S&P 500® Index | 33.89% | 15.77% | 13.35% |
|---|
| Footnote | Description |
Footnote1 | Contingent deferred sales charge |
| Total Net Assets | $788,624,729 |
|---|
| # of Portfolio Holdings (including overnight repurchase agreements) | 32 |
|---|
| Portfolio Turnover Rate | 84% |
|---|
| Total Advisory Fees Paid (after waiver/reimbursement, if applicable) | $5,057,273 |
|---|
What did the Fund invest in? (% of Net Assets)
| Value | Value |
|---|
Other investments less than 3% of net assetsFootnote Reference* | 11.3% |
| Electrical Equipment | 3.2% |
| Specialty Retail | 3.3% |
| Hotels, Restaurants & Leisure | 3.3% |
| Construction & Engineering | 3.4% |
| Oil, Gas & Consumable Fuels | 3.8% |
| Banks | 3.8% |
| Pharmaceuticals | 3.9% |
| Ground Transportation | 4.3% |
| Capital Markets | 4.4% |
| Entertainment | 4.6% |
| Chemicals | 5.4% |
| Broadline Retail | 6.2% |
| Interactive Media & Services | 7.8% |
| Software | 13.8% |
| Semiconductors & Semiconductor Equipment | 17.5% |
| Footnote | Description |
Footnote* | Net of other assets less liabilities |
| NVIDIA Corp. | 7.2% |
| Microsoft Corp. | 6.7% |
| Amazon.com, Inc. | 6.2% |
| Walt Disney Co. | 4.6% |
| Taiwan Semiconductor Manufacturing Co. Ltd., ADR | 4.6% |
| Alphabet, Inc., Class A | 4.5% |
| Intercontinental Exchange, Inc. | 4.4% |
| Saia, Inc. | 4.3% |
| ServiceNow, Inc. | 3.9% |
| Zoetis, Inc. | 3.9% |
There were no material fund changes during the period.
There were no changes in or disagreements with Accountants during the period.
For additional information about the Fund; including its prospectus, financial information, holdings and proxy information, scan the QR code or visit im.natixis.com/funddocuments.
Vaughan Nelson Select Fund
Annual Shareholder Report
November 30, 2024
Vaughan Nelson Select Fund
Annual Shareholder Report - November 30, 2024
This annual shareholder report contains important information about Vaughan Nelson Select Fund for the period of December 1, 2023 to November 30, 2024. You can find additional information (including tax information) about the Fund at im.natixis.com/funddocuments. You can also request the information by contacting us at (800) 225-5478 or by contacting your financial intermediary directly.
What were the fund costs for the last year? (based on a hypothetical $10,000 investment)
| Class Name | Costs of a $10,000 investment | Costs paid as a percentage of a $10,000 investmentFootnote Reference† |
|---|
| Class N | $88 | 0.80% |
|---|
| Footnote | Description |
Footnote† | Annualized for periods less than one year (if applicable). |
How did the fund perform last year and what affected its performance?
Explanation of Fund Performance
Top Contributors to Performance
• The largest contributor to year-to-date performance was the portfolio's overweight position and selection in Consumer Discretionary led by DoorDash.
• Selection in Industrials also contributed to performance with Comfort Systems USA, Inc leading.
Top Detractors from Performance
• The largest detractor from year-to-date performance was the security selection within Information Technology. Snowflake, Inc. Class A hindered the sector the most.
• The portfolio's selection within Health Care also negatively impacted performance. DexCom, Inc. was the weakest name.
As a result of buys and sells and market action, the portfolio is overweight Materials, Financials, Consumer Discretionary, Energy, and Communication Services while underweight Industrials, Health Care, Information Technology, Real Estate, Utilities, and Consumer Staples.
We continued to sell positions that we believe to be fully valued or that could face increased earnings pressure as we move into the late stages of this economic recovery and added to existing positions or established new positions that met our investment criteria.
We continue to position the portfolio into companies that have lower earnings variability, higher profitability, and stronger balance sheets than the broader investment universe, and where we can get these characteristics at similar valuation levels to the benchmark index. We still do not favor any single industry or sector and continue to look for the characteristics noted above across all industries.
The Fund’s benchmarks are unmanaged indices used as a general measure of market performance. Calculations assume dividends and capital gains are reinvested. The tables do not reflect taxes shareholders might owe on any fund distributions or when they redeem their shares. You cannot invest directly in an index.
Total Return Based on a Hypothetical $10,000 Investment
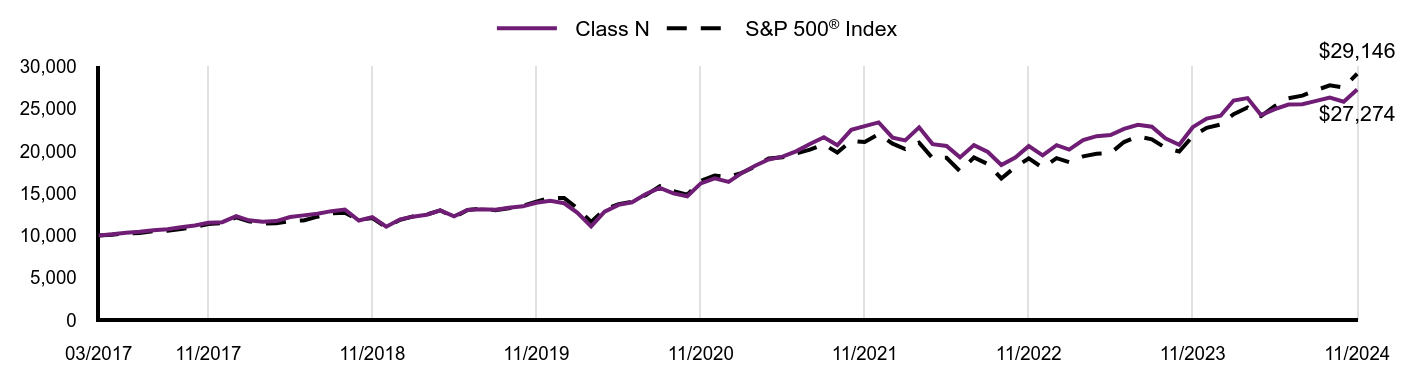
| Class N | S&P 500® Index |
|---|
| 03/2017 | $10,000 | $10,000 |
|---|
| 04/2017 | $10,147 | $10,103 |
|---|
| 05/2017 | $10,338 | $10,245 |
|---|
| 06/2017 | $10,442 | $10,309 |
|---|
| 07/2017 | $10,614 | $10,521 |
|---|
| 08/2017 | $10,737 | $10,553 |
|---|
| 09/2017 | $10,971 | $10,771 |
|---|
| 10/2017 | $11,198 | $11,022 |
|---|
| 11/2017 | $11,505 | $11,360 |
|---|
| 12/2017 | $11,583 | $11,486 |
|---|
| 01/2018 | $12,296 | $12,144 |
|---|
| 02/2018 | $11,803 | $11,696 |
|---|
| 03/2018 | $11,643 | $11,399 |
|---|
| 04/2018 | $11,710 | $11,443 |
|---|
| 05/2018 | $12,184 | $11,718 |
|---|
| 06/2018 | $12,384 | $11,791 |
|---|
| 07/2018 | $12,577 | $12,229 |
|---|
| 08/2018 | $12,884 | $12,628 |
|---|
| 09/2018 | $13,071 | $12,700 |
|---|
| 10/2018 | $11,777 | $11,832 |
|---|
| 11/2018 | $12,184 | $12,073 |
|---|
| 12/2018 | $11,048 | $10,983 |
|---|
| 01/2019 | $11,921 | $11,863 |
|---|
| 02/2019 | $12,232 | $12,244 |
|---|
| 03/2019 | $12,454 | $12,482 |
|---|
| 04/2019 | $12,979 | $12,987 |
|---|
| 05/2019 | $12,269 | $12,162 |
|---|
| 06/2019 | $13,023 | $13,019 |
|---|
| 07/2019 | $13,105 | $13,206 |
|---|
| 08/2019 | $13,060 | $12,997 |
|---|
| 09/2019 | $13,282 | $13,240 |
|---|
| 10/2019 | $13,452 | $13,527 |
|---|
| 11/2019 | $13,882 | $14,018 |
|---|
| 12/2019 | $14,125 | $14,441 |
|---|
| 01/2020 | $13,820 | $14,435 |
|---|
| 02/2020 | $12,712 | $13,247 |
|---|
| 03/2020 | $11,073 | $11,611 |
|---|
| 04/2020 | $12,816 | $13,099 |
|---|
| 05/2020 | $13,627 | $13,723 |
|---|
| 06/2020 | $13,932 | $13,996 |
|---|
| 07/2020 | $14,912 | $14,785 |
|---|
| 08/2020 | $15,642 | $15,848 |
|---|
| 09/2020 | $14,992 | $15,246 |
|---|
| 10/2020 | $14,647 | $14,840 |
|---|
| 11/2020 | $16,172 | $16,465 |
|---|
| 12/2020 | $16,758 | $17,098 |
|---|
| 01/2021 | $16,353 | $16,925 |
|---|
| 02/2021 | $17,361 | $17,392 |
|---|
| 03/2021 | $18,266 | $18,154 |
|---|
| 04/2021 | $19,007 | $19,122 |
|---|
| 05/2021 | $19,334 | $19,256 |
|---|
| 06/2021 | $19,963 | $19,706 |
|---|
| 07/2021 | $20,842 | $20,174 |
|---|
| 08/2021 | $21,635 | $20,787 |
|---|
| 09/2021 | $20,687 | $19,820 |
|---|
| 10/2021 | $22,505 | $21,209 |
|---|
| 11/2021 | $22,945 | $21,062 |
|---|
| 12/2021 | $23,393 | $22,006 |
|---|
| 01/2022 | $21,586 | $20,867 |
|---|
| 02/2022 | $21,256 | $20,242 |
|---|
| 03/2022 | $22,803 | $20,994 |
|---|
| 04/2022 | $20,819 | $19,163 |
|---|
| 05/2022 | $20,595 | $19,198 |
|---|
| 06/2022 | $19,249 | $17,614 |
|---|
| 07/2022 | $20,701 | $19,238 |
|---|
| 08/2022 | $19,886 | $18,453 |
|---|
| 09/2022 | $18,351 | $16,754 |
|---|
| 10/2022 | $19,225 | $18,110 |
|---|
| 11/2022 | $20,583 | $19,122 |
|---|
| 12/2022 | $19,492 | $18,020 |
|---|
| 01/2023 | $20,699 | $19,153 |
|---|
| 02/2023 | $20,174 | $18,685 |
|---|
| 03/2023 | $21,297 | $19,371 |
|---|
| 04/2023 | $21,763 | $19,674 |
|---|
| 05/2023 | $21,895 | $19,759 |
|---|
| 06/2023 | $22,624 | $21,065 |
|---|
| 07/2023 | $23,102 | $21,742 |
|---|
| 08/2023 | $22,875 | $21,395 |
|---|
| 09/2023 | $21,500 | $20,375 |
|---|
| 10/2023 | $20,747 | $19,947 |
|---|
| 11/2023 | $22,827 | $21,769 |
|---|
| 12/2023 | $23,849 | $22,757 |
|---|
| 01/2024 | $24,173 | $23,140 |
|---|
| 02/2024 | $25,981 | $24,375 |
|---|
| 03/2024 | $26,268 | $25,160 |
|---|
| 04/2024 | $24,257 | $24,132 |
|---|
| 05/2024 | $24,951 | $25,329 |
|---|
| 06/2024 | $25,502 | $26,238 |
|---|
| 07/2024 | $25,550 | $26,557 |
|---|
| 08/2024 | $25,933 | $27,201 |
|---|
| 09/2024 | $26,340 | $27,782 |
|---|
| 10/2024 | $25,837 | $27,530 |
|---|
| 11/2024 | $27,274 | $29,146 |
|---|
Performance data shown represents past performance and is no guarantee of, and is not necessarily indicative of, future results. Total return and value will vary, and you may have a gain or loss when shares are sold. Current performance may be lower or higher than quoted. For the most recent month-end performance, visit im.natixis.com/en-us/products/mutual-funds/price-and-performance.
Average Annual Total Returns (%)
| AATR | 1 Year | 5 Years | Since Inception 3/31/17 |
|---|
| Class N | 19.48% | 14.46% | 13.98% |
|---|
S&P 500® Index | 33.89% | 15.77% | 14.97% |
|---|
| Total Net Assets | $788,624,729 |
|---|
| # of Portfolio Holdings (including overnight repurchase agreements) | 32 |
|---|
| Portfolio Turnover Rate | 84% |
|---|
| Total Advisory Fees Paid (after waiver/reimbursement, if applicable) | $5,057,273 |
|---|
What did the Fund invest in? (% of Net Assets)
| Value | Value |
|---|
Other investments less than 3% of net assetsFootnote Reference* | 11.3% |
| Electrical Equipment | 3.2% |
| Specialty Retail | 3.3% |
| Hotels, Restaurants & Leisure | 3.3% |
| Construction & Engineering | 3.4% |
| Oil, Gas & Consumable Fuels | 3.8% |
| Banks | 3.8% |
| Pharmaceuticals | 3.9% |
| Ground Transportation | 4.3% |
| Capital Markets | 4.4% |
| Entertainment | 4.6% |
| Chemicals | 5.4% |
| Broadline Retail | 6.2% |
| Interactive Media & Services | 7.8% |
| Software | 13.8% |
| Semiconductors & Semiconductor Equipment | 17.5% |
| Footnote | Description |
Footnote* | Net of other assets less liabilities |
| NVIDIA Corp. | 7.2% |
| Microsoft Corp. | 6.7% |
| Amazon.com, Inc. | 6.2% |
| Walt Disney Co. | 4.6% |
| Taiwan Semiconductor Manufacturing Co. Ltd., ADR | 4.6% |
| Alphabet, Inc., Class A | 4.5% |
| Intercontinental Exchange, Inc. | 4.4% |
| Saia, Inc. | 4.3% |
| ServiceNow, Inc. | 3.9% |
| Zoetis, Inc. | 3.9% |
There were no material fund changes during the period.
There were no changes in or disagreements with Accountants during the period.
For additional information about the Fund; including its prospectus, financial information, holdings and proxy information, scan the QR code or visit im.natixis.com/funddocuments.
Vaughan Nelson Select Fund
Annual Shareholder Report
November 30, 2024
(b) Not Applicable
Item 2. Code of Ethics.
The Registrant has adopted a code of ethics that applies to the Registrant’s principal executive officer, principal financial officer and persons performing similar functions. There have been no amendments or waivers of the Registrant’s code of ethics during the period.
Item 3. Audit Committee Financial Expert.
The Board of Trustees of the Registrant has established an audit committee. Mr. Richard A. Goglia, Mr. James P. Palermo, Mr. Kirk A. Sykes and Ms. Cynthia L. Walker are members of the audit committee and have been designated as “audit committee financial experts” by the Board of Trustees. Each of these individuals is also an Independent Trustee of the Registrant.
Item 4. Principal Accountant Fees and Services.
Fees billed by the Principal Accountant for services rendered to the Registrant.
The table below sets forth fees billed by the principal accountant, PricewaterhouseCoopers LLP, for the past two fiscal years for professional services rendered in connection with a) the audit of the Registrant’s annual financial statements and services provided in connection with regulatory filings; b) audit-related services (including services that are reasonably related to the performance of the audit of the Registrant’s financial statements but not reported under “Audit Fees”); c) tax compliance, tax advice and tax planning; and d) all other fees billed for professional services rendered by the principal accountant to the Registrant, other than the services reported as a part of (a) through (c) of this Item.
| | | | | | | | | | | | | | | | | | | | | | | | | | | | | | | | |
| | | Audit fees | | | Audit-related fees1 | | | Tax fees2 | | | All other fees | |
| | | 12/1/22-
11/30/23 | | | 12/1/23-
11/30/24 | | | 12/1/22-
11/30/23 | | | 12/1/23-
11/30/24 | | | 12/1/22-
11/30/23 | | | 12/1/23-
11/30/24 | | | 12/1/22-
11/30/23 | | | 12/1/23-
11/30/24 | |
Natixis Funds Trust II- Loomis Sayles Global Growth Fund, Loomis Sayles Senior Floating Rate and Fixed Income Fund and Vaughan Nelson Select Fund | | $ | 159,833 | | | $ | 164,628 | | | $ | 358 | | | $ | 336 | | | $ | 26,169 | | | $ | 26,954 | | | $ | — | | | $ | — | |
1. Audit-related fees consist of:
2023 & 2024 – performance of agreed-upon procedures related to the Registrant’s deferred compensation plan.
2. Tax fees consist of:
2023 & 2024 – review of Registrant’s tax returns
Aggregate fees billed to the Registrant for non-audit services during 2023 and 2024 were $26,527and $27,290, respectively.
(e)(1) Audit Committee Pre-Approval Policies.
Annually, the Registrant’s Audit Committee reviews the audit, audit-related, tax and other non-audit services together with the projected fees, for services proposed to be rendered to the Registrant and/or other entities for which pre-approval is required during the upcoming year. Any subsequent revisions to already pre-approved services or fees (including fee increases) and requests for pre-approval of new services would be presented for consideration quarterly as needed.
If, in the opinion of management, a proposed engagement by the Registrant’s independent accountants needs to commence before the next regularly scheduled Audit Committee meeting, any member of the Audit Committee who is an Independent Trustee of the Registrant is authorized to pre-approve the engagement, but only for engagements to provide audit, audit related and tax services. This approval is subject to review by the full Audit Committee at its next quarterly meeting. All other engagements require the approval of all the members of the Audit Committee.
(e)(2) None of the services described in each of Items 4 (b) through (d) were approved pursuant to de minimis exception in paragraph (c)(7)(i)(C) of Rule 2-01 of Regulation S-X.
(f) Not applicable.
(g) Fees billed by the Principal Accountant for services rendered to the Adviser and Control Affiliates.
The following table sets forth the fees billed by the Registrant’s principal accountant for non-audit services rendered to Loomis, Sayles & Company, L.P. (“Loomis”), Natixis Advisors, LLC (“Natixis”) and entities controlling, controlled by or under common control with Loomis and Natixis (“Control Affiliates”) that provide ongoing services to the Registrant, for engagements that related directly to the operations and financial reporting of the Registrant for the last two fiscal years.
| | | | | | | | | | | | | | | | | | | | | | | | |
| | | Audit-related fees | | | Tax fees | | | All other fees | |
| | | 12/1/22-
11/30/23 | | | 12/1/23-
11/30/24 | | | 12/1/22-
11/30/23 | | | 12/1/23-
11/30/24 | | | 12/1/22-
11/30/23 | | | 12/1/23-
11/30/24 | |
Control Affiliates | | $ | — | | | $ | — | | | $ | — | | | $ | — | | | $ | — | | | $ | — | |
The following table sets forth the aggregate fees billed by the Registrant’s principal accountant for non-audit services rendered to Loomis, Natixis and Control Affiliates that provide ongoing services to the Registrant, for the last two fiscal years, including the fees disclosed in the table above.
| | | | | | | | |
| | | Aggregate Non-Audit Fees | |
| | | 12/1/22-11/30/23 | | | 12/1/23-11/30/24 | |
Control Affiliates | | $ | 110,000 | | | $ | 55,000 | |
(h) The audit committee has considered and determined that the provisions of non-audit services that were rendered to the Registrant’s investment adviser, and any entity controlling, controlled by, or under common control with the investment adviser that provides ongoing services to the Registrant that were not pre-approved pursuant to paragraph (c)(7)(i)(C) of Rule 2-01 of Regulation S-X is compatible with maintaining the principal accountant’s independence.
(i) Not applicable.
(j) Not applicable.
Item 5. Audit Committee of Listed Registrants.
Not applicable.
Item 6. Schedule of Investments.
The Schedule of Investments are incorporated by reference as part of the Financial Statements and Other Important Information for Open-End Management Investment Companies filed as Item 7 herewith.
Item 7. Financial Statements and Financial Highlights for Open-End Management Investment Companies.
(a) The Registrant’s Financial Statements are attached herewith.
(b) The Registrant’s Financial Highlights are attached herewith.
Annual Financial Statements and Other Important Information
Loomis Sayles Global Growth Fund |
Loomis Sayles Senior Floating Rate and Fixed Income Fund |
Vaughan Nelson Select Fund |
Portfolio of Investments – as of November 30, 2024Loomis Sayles Global Growth Fund
| | |
Common Stocks — 98.5% of Net Assets |
| |
| | |
| | |
| | |
| | |
| |
| Shopify, Inc., Class A(a) | |
| |
| Alibaba Group Holding Ltd., ADR(b) | |
| | |
| Budweiser Brewing Co. APAC Ltd. | |
| | |
| | |
| Trip.com Group Ltd., ADR(a)(b) | |
| Yum China Holdings, Inc.(b) | |
| | |
| |
| | |
| |
| | |
| |
| | |
| |
| | |
| |
| CRISPR Therapeutics AG(a) | |
| Novartis AG, (Registered) | |
| | |
| |
| Reckitt Benckiser Group PLC | |
| | |
| | |
| |
| Alnylam Pharmaceuticals, Inc.(a) | |
| | |
| | |
| | |
| | |
| | |
| | |
| | |
| Doximity, Inc., Class A(a) | |
| Expeditors International of Washington, Inc. | |
| | |
| Meta Platforms, Inc., Class A | |
| | |
| | |
| | |
| | |
| | |
| | |
| | |
| | |
| | |
| Under Armour, Inc., Class A(a) | |
| Vertex Pharmaceuticals, Inc.(a) | |
| | |
| United States — continued |
| | |
| | |
| | |
| Total Common Stocks
(Identified Cost $68,090,137) | |
| | |
Short-Term Investments — 1.4% |
| Tri-Party Repurchase Agreement with Fixed Income Clearing Corporation, dated 11/29/2024 at 2.750% to be repurchased at $1,527,149 on 12/02/2024 collateralized by $1,539,900 U.S. Treasury Note, 4.875% due 4/30/2026 valued at $1,557,471 including accrued interest (Note 2 of Notes to Financial Statements)
(Identified Cost $1,526,799) | |
| Total Investments — 99.9%
(Identified Cost $69,616,936) | |
| Other assets less liabilities — 0.1% | |
| | |
| See Note 2 of Notes to Financial Statements. |
| Non-income producing security. |
| Security invests in variable interest entities based in China. See Note 9 of Notes to Financial Statements. |
| An American Depositary Receipt is a certificate issued by a custodian bank representing the right to receive securities of the foreign issuer described. The values of ADRs may be significantly influenced by trading on exchanges not located in the United States. |
Industry Summary at November 30, 2024
Interactive Media & Services | |
| |
| |
| |
| |
| |
| |
| |
| |
Hotels, Restaurants & Leisure | |
Semiconductors & Semiconductor Equipment | |
| |
| |
| |
Other Investments, less than 2% each | |
| |
| |
Other assets less liabilities | |
| |
See accompanying notes to financial statements.
Portfolio of Investments – as of November 30, 2024Loomis Sayles Global Growth Fund (continued) Currency Exposure Summary at November 30, 2024
| |
| |
| |
| |
| |
| |
| |
| |
Other assets less liabilities | |
| |
See accompanying notes to financial statements.
Portfolio of Investments – as of November 30, 2024Loomis Sayles Senior Floating Rate and Fixed Income Fund
| | |
Senior Loans — 92.9% of Net Assets |
| Aerospace & Defense — 1.8% |
| Air Comm Corporation LLC, 2024 Delayed Draw Term Loan, 11/21/2031(a) | |
| Air Comm Corporation LLC, 2024 Term Loan, 11/21/2031(a) | |
| Azorra Soar Tlb Finance Ltd., Term Loan B, 3 mo. USD SOFR + 3.500%, 8.132%, 10/18/2029(b)(c) | |
| Spirit AeroSystems, Inc., 2022 Term Loan, 3 mo. USD SOFR + 4.500%, 9.085%, 1/15/2027(c) | |
| TransDigm, Inc., 2024 Term Loan, 3 mo. USD SOFR + 2.500%, 7.320%, 1/19/2032(c) | |
| TransDigm, Inc., 2024 Term Loan I, 3 mo. USD SOFR + 2.750%, 7.354%, 8/24/2028(b)(c) | |
| Vertex Aerospace Services LLC, 2021 First Lien Term Loan, 1 mo. USD SOFR + 2.750%, 7.323%, 12/06/2030(c) | |
| | |
| |
| American Airlines, Inc., 2021 Term Loan, 3 mo. USD SOFR + 4.750%, 9.629%, 4/20/2028(b)(c) | |
| LifeMiles Ltd., 2021 Term Loan B, 3 mo. USD SOFR + 5.250%, 10.026%, 8/30/2026(b)(c) | |
| | |
| |
| Clarios Global LP, 2024 USD Term Loan B, 1 mo. USD SOFR + 2.500%, 7.073%, 5/06/2030(c) | |
| First Brands Group LLC, 2021 2nd Lien Term Loan, 3 mo. USD SOFR + 8.500%, 13.347%, 3/30/2028(c) | |
| First Brands Group LLC, 2021 Term Loan, 3 mo. USD SOFR + 5.000%, 9.847%, 3/30/2027(b)(c) | |
| IXS Holdings, Inc., 2020 Term Loan B, 3 mo. USD SOFR + 4.250%, 8.954%, 3/05/2027(b)(c) | |
| | |
| |
| AssetMark Financial Holdings, Inc., 2024 Term Loan, 3 mo. USD SOFR + 3.000%, 7.604%, 9/05/2031(b)(c) | |
| Edelman Financial Center LLC, 2024 2nd Lien Term Loan, 1 mo. USD SOFR + 5.250%, 9.823%, 10/06/2028(c) | |
| Eisner Advisory Group LLC, 2024 Term Loan B, 1 mo. USD SOFR + 4.000%, 8.573%, 2/28/2031(c) | |
| Focus Financial Partners LLC, 2024 Delayed Draw Term Loan, 9/15/2031(d) | |
| Focus Financial Partners LLC, 2024 Term Loan B8, 1 mo. USD SOFR + 3.250%, 7.823%, 9/15/2031(b)(c) | |
| GEN II Fund Services LLC, 2024 Term Loan B, 11/19/2031(a) | |
| Guggenheim Partners LLC, 2024 Term Loan B, 11/21/2031(a) | |
| HarbourVest Partners LLC, 2024 1st Lien Term Loan B, 3 mo. USD SOFR + 2.250%, 6.854%, 4/18/2030(b)(c) | |
| HighTower Holdings LLC, 2024 Term Loan B, 3 mo. USD SOFR + 3.500%, 8.071%, 4/21/2028(b)(c) | |
| Janney Montgomery Scott LLC, Delayed Draw Term Loan, 9/11/2031(a) | |
| Janney Montgomery Scott LLC, Term Loan, 9/11/2031(a) | |
| | |
| |
| Jefferies Finance LLC, 2024 Term Loan, 1 mo. USD SOFR + 3.000%, 7.599%, 10/21/2031(b)(c) | |
| Teneo Holdings LLC, 2024 Term Loan B, 1 mo. USD SOFR + 4.750%, 9.323%, 3/13/2031(c) | |
| | |
| Building Materials — 4.3% |
| Chamberlain Group, Inc., 2024 Fungible 1st Lien Term Loan B, 11/03/2028(a) | |
| Foley Products Co. LLC, 2024 Term Loan, 3 mo. USD SOFR + 4.750%, 9.504%, 12/29/2028(b)(c) | |
| Foundation Building Materials Holding Co. LLC, 2024 Term Loan B2, USD SOFR + 4.000%, 8.585%, 1/29/2031(b)(c) | |
| Janus International Group LLC, 2024 Term Loan B, 1 mo. USD SOFR + 2.500%, 7.073%, 8/03/2030(c) | |
| Kodiak Building Partners, Inc., 2024 Term Loan B, 11/26/2031(a) | |
| Kodiak Building Partners, Inc., 2024 Term Loan B2, 1 mo. USD SOFR + 3.750%, 8.323%, 3/12/2028(b)(c) | |
| LHS Borrower LLC, 2022 Term Loan B, 1 mo. USD SOFR + 4.750%, 9.423%, 2/16/2029(c) | |
| Madison Safety & Flow LLC, 2024 Term Loan B, 1 mo. USD SOFR + 3.250%, 7.823%, 9/26/2031(b)(c) | |
| MI Windows & Doors LLC, 2024 Term Loan B2, 1 mo. USD SOFR + 3.000%, 7.573%, 3/28/2031(b)(c) | |
| Oscar AcquisitionCo LLC, Term Loan B, 3 mo. USD SOFR + 4.250%, 8.495%, 4/29/2029(b)(c) | |
| Specialty Building Products Holdings LLC, 2021 Term Loan B, 1 mo. USD SOFR + 3.750%, 8.423%, 10/15/2028(c) | |
| White Cap Buyer LLC, 2024 Term Loan B, 1 mo. USD SOFR + 3.250%, 7.823%, 10/19/2029(b)(c) | |
| | |
| |
| CSC Holdings LLC, 2019 Term Loan B5, 6 mo. USD SOFR + 2.500%, 7.174%, 4/15/2027(b)(c) | |
| CSC Holdings LLC, 2022 Term Loan B6, 1 mo. USD SOFR + 4.500%, 9.109%, 1/18/2028(b)(c) | |
| DirecTV Financing LLC, 2024 Term Loan, 3 mo. USD SOFR + 5.250%, 10.097%, 8/02/2029(b)(c) | |
| | |
| |
| Aruba Investments Holdings LLC, 2020 2nd Lien Term Loan, 1 mo. USD SOFR + 7.750%, 12.423%, 11/24/2028(c) | |
| Bakelite U.S. Holdco, Inc., 2024 Term Loan, 3 mo. USD SOFR + 3.500%, 8.104%, 5/29/2029(b)(c) | |
| Chemours Co., 2023 USD Term Loan B, 8.073%, 8/18/2028(a) | |
| GEON Performance Solutions LLC, 2021 Term Loan, 3 mo. USD SOFR + 4.250%, 9.115%, 8/18/2028(b)(c) | |
| Groupe Solmax, Inc., Term Loan, USD SOFR + 4.750%, 9.533%, 5/29/2028(c) | |
| LSF11 A5 HoldCo LLC, 2024 Term Loan B, 1 mo. USD SOFR + 3.500%, 8.187%, 10/15/2028(b)(c) | |
| Paint Intermediate III LLC, 2024 Term Loan B, 3 mo. USD SOFR + 3.000%, 7.522%, 10/09/2031(b)(c) | |
See accompanying notes to financial statements.
Portfolio of Investments – as of November 30, 2024Loomis Sayles Senior Floating Rate and Fixed Income Fund (continued) | | |
| |
| Tronox Finance LLC, 2024 1st Lien Term Loan B, USD SOFR + 2.500%, 7.090%, 9/18/2031(b)(c) | |
| Windsor Holdings III LLC, 2024 USD 1st Lien Term Loan B, 1 mo. USD SOFR + 3.500%, 8.099%, 8/01/2030(b)(c) | |
| | |
| Consumer Cyclical Services — 6.1% |
| BIFM US Finance LLC, 2024 Term Loan, 1 mo. USD SOFR + 4.250%, 8.823%, 5/31/2028(c) | |
| CHG Healthcare Services, Inc., 2024 Term Loan B2, USD SOFR + 3.500%, 8.275%, 9/29/2028(b)(c) | |
| Cushman & Wakefield U.S. Borrower LLC, 2024 Tranche 2 Incremental Term Loan, 1 mo. USD SOFR + 3.250%, 7.823%, 1/31/2030(b)(c) | |
| Ensemble RCM LLC, 2024 Term Loan B, 3 mo. USD SOFR + 3.000%, 7.585%, 8/01/2029(b)(c) | |
| Fleet Midco I Ltd., 2024 1st Lien Term Loan B, 6 mo. USD SOFR + 2.750%, 7.578%, 2/21/2031(b)(c) | |
| Galaxy U.S. Opco, Inc., Term Loan, 3 mo. USD SOFR + 4.750%, 9.335%, 4/29/2029(c) | |
| Grant Thornton Advisors LLC, Term Loan B, 1 mo. USD SOFR + 3.250%, 7.823%, 6/02/2031(b)(c) | |
| Inmar, Inc., 2023 Term Loan, USD SOFR + 5.000%, 9.582%, 10/30/2031(c) | |
| Kingpin Intermediate Holdings LLC, 2023 Term Loan B, 1 mo. USD SOFR + 3.500%, 8.073%, 2/08/2028(c) | |
| Latham Pool Products, Inc., 2022 Term Loan B, 3 mo. USD SOFR + 3.750%, 8.485%, 2/23/2029(c) | |
| OMNIA Partners LLC, 2024 Term Loan B, 3 mo. USD SOFR + 3.250%, 7.867%, 7/25/2030(b)(c) | |
| PUG LLC, 2024 Extended Term Loan B, 1 mo. USD SOFR + 4.750%, 9.323%, 3/15/2030(c) | |
| Raven Acquisition Holdings LLC, Delayed Draw Term Loan, 11/19/2031(a) | |
| Raven Acquisition Holdings LLC, Delayed Draw Term Loan, 1.625%, 11/19/2031(d) | |
| Raven Acquisition Holdings LLC, Term Loan B, 11/19/2031(a) | |
| Raven Acquisition Holdings LLC, Term Loan B, 1 mo. USD SOFR + 3.250%, 7.861%, 11/19/2031(b)(c) | |
| Ryan LLC, Delayed Draw Term Loan, 1 mo. USD SOFR + 3.500%, 8.073%, 11/14/2030(b)(c) | |
| Ryan LLC, Term Loan, 1 mo. USD SOFR + 3.500%, 8.073%, 11/14/2030(b)(c) | |
| Sweetwater Borrower LLC, Term Loan B, 1 mo. USD SOFR + 4.250%, 8.937%, 8/07/2028(b)(c) | |
| Vistage Worldwide, Inc., Term Loan, 3 mo. USD SOFR + 4.750%, 9.354%, 7/13/2029(c) | |
| | |
| |
| AI Aqua Merger Sub, Inc., 2021 1st Lien Term Loan B, 1 mo. USD SOFR + 3.500%, 8.156%, 7/31/2028(b)(c) | |
| American Greetings Corp., 2024 Term Loan B, 1 mo. USD SOFR + 5.750%, 10.323%, 10/30/2029(c) | |
| Bombardier Recreational Products, Inc., 2023 Term Loan B3, 1 mo. USD SOFR + 2.750%, 7.323%, 12/13/2029(b)(c) | |
| Champ Acquisition Corp., 2024 Term Loan B, 11/07/2031(a) | |
| | |
| Consumer Products — continued |
| Hayward Industries, Inc., 2021 Term Loan, 1 mo. USD SOFR + 2.500%, 7.187%, 5/30/2028(c) | |
| Mattress Firm, Inc., 2021 Term Loan B, 6 mo. USD SOFR + 4.250%, 8.924%, 9/25/2028(b)(c) | |
| Recess Holdings, Inc., 2024 Term Loan B, 3 mo. USD SOFR + 4.500%, 9.085%, 2/20/2030(c) | |
| Solis IV BV, USD Term Loan B1, 3 mo. USD SOFR + 3.500%, 8.021%, 2/26/2029(b)(c) | |
| Topgolf Callaway Brands Corp., Term Loan B, 1 mo. USD SOFR + 3.000%, 7.573%, 3/18/2030(b)(c) | |
| VC GB Holdings I Corp., 1st Lien Term Loan, 3 mo. USD SOFR + 3.500%, 8.365%, 7/21/2028(b)(c) | |
| Weber-Stephen Products LLC, 2022 Incremental Term Loan B, 1 mo. USD SOFR + 4.250%, 8.923%, 10/30/2027(c) | |
| | |
| Diversified Manufacturing — 4.0% |
| Alliance Laundry Systems LLC, 2024 Term Loan B, 1 mo. USD SOFR + 3.500%, 8.073%, 8/19/2031(b)(c) | |
| Arcline FM Holdings LLC, 2024 Term Loan, USD SOFR + 4.500%, 9.054%, 6/23/2028(b)(c) | |
| Chart Industries, Inc., 2024 Term Loan B, 3 mo. USD SOFR + 2.500%, 7.092%, 3/15/2030(b)(c) | |
| Crown Equipment Corp., Term Loan B, 1 mo. USD SOFR + 2.500%, 7.122%, 10/10/2031(b)(c) | |
| Dynamo Newco II GmbH, USD Term Loan B, 6 mo. USD SOFR + 4.000%, 8.245%, 10/01/2031(b)(c) | |
| Emrld Borrower LP, 2024 Fungible Incremental Term Loan B, 8/04/2031(a) | |
| Filtration Group Corp., 2021 Incremental Term Loan, 1 mo. USD SOFR + 3.500%, 8.187%, 10/21/2028(b)(c) | |
| Infinite Bidco LLC, 2nd Lien Term Loan, 3 mo. USD SOFR + 7.000%, 11.847%, 3/02/2029(c) | |
| INNIO Group Holding GmbH, 2024 USD Term Loan B, 3 mo. USD SOFR + 3.250%, 7.897%, 11/02/2028(b)(c) | |
| LSF12 Badger Bidco LLC, Term Loan B, 1 mo. USD SOFR + 6.000%, 10.573%, 8/30/2030(c) | |
| LSF12 Crown U.S. Commercial Bidco LLC, Term Loan B, 10/10/2031(a) | |
| Nvent Electric Public Ltd., Term Loan B, 9/12/2031(a) | |
| | |
| |
| Alpha Generation LLC, Term Loan B, 1 mo. USD SOFR + 2.750%, 7.323%, 9/30/2031(b)(c) | |
| Kohler Energy Co. LLC, USD Term Loan B, 3 mo. USD SOFR + 4.750%, 9.354%, 5/01/2031(b)(c) | |
| Lightning Power LLC, Term Loan B, 3 mo. USD SOFR + 3.250%, 7.735%, 8/18/2031(b)(c) | |
| Talen Energy Supply LLC, 2023 Term Loan B, 3 mo. USD SOFR + 3.500%, 8.024%, 5/17/2030(c) | |
| Talen Energy Supply LLC, 2023 Term Loan C, 3 mo. USD SOFR + 3.500%, 8.024%, 5/17/2030(c) | |
| | |
| |
| Covanta Holding Corp., 2024 1st Lien Term Loan B, 1 mo. USD SOFR + 2.500%, 7.156%, 11/30/2028(b)(c) | |
| Covanta Holding Corp., 2024 1st Lien Term Loan C, 1 mo. USD SOFR + 2.500%, 7.156%, 11/30/2028(b)(c) | |
See accompanying notes to financial statements.
Portfolio of Investments – as of November 30, 2024Loomis Sayles Senior Floating Rate and Fixed Income Fund (continued) | | |
| Environmental — continued |
| Northstar Group Services, Inc., 2024 Term Loan B, 6 mo. USD SOFR + 4.750%, 10.014%, 5/08/2030(b)(c) | |
| The Action Environmental Group, Inc., 2023 Term Loan B, 3 mo. USD SOFR + 3.750%, 8.617%, 10/24/2030(c) | |
| The Action Environmental Group, Inc., 2024 Delayed Draw Term Loan, 2.000%, 10/24/2030(d) | |
| | |
| |
| AAL Delaware Holdco, Inc., 2024 Term Loan B, 1 mo. USD SOFR + 3.500%, 8.073%, 7/30/2031(c) | |
| Aragorn Parent Corp., Term Loan, 12/15/2028(a) | |
| Aragorn Parent Corp., Term Loan, 1 mo. USD SOFR + 4.000%, 8.588%, 12/15/2028(b)(c) | |
| Dragon Buyer, Inc., Term Loan B, 3 mo. USD SOFR + 3.250%, 7.897%, 9/30/2031(b)(c) | |
| Luxembourg Investment Co. 428 SARL, Term Loan B, 6 mo. USD SOFR + 5.000%, 1/03/2029(e) | |
| Mariner Wealth Advisors LLC, Term Loan B, 8/18/2028(a) | |
| Mermaid Bidco, Inc., 2024 USD Term Loan B, 3 mo. USD SOFR + 3.250%, 7.804%, 7/03/2031(b)(c) | |
| | |
| |
| Aspire Bakeries Holdings LLC, Term Loan, 12/13/2030(a) | |
| Aspire Bakeries Holdings LLC, Term Loan, 1 mo. USD SOFR + 4.250%, 8.823%, 12/13/2030(b)(c) | |
| CHG PPC Parent LLC, 2021 Term Loan, 1 mo. USD SOFR + 3.000%, 7.687%, 12/08/2028(c) | |
| Chobani LLC, 2023 Incremental Term Loan, 1 mo. USD SOFR + 3.750%, 8.323%, 10/25/2027(b)(c) | |
| Fiesta Purchaser, Inc., 2024 Term Loan B, 1 mo. USD SOFR + 4.000%, 8.573%, 2/12/2031(b)(c) | |
| Northeast Grocery, Inc., Term Loan B, 3 mo. USD SOFR + 7.500%, 12.024%, 12/13/2028(b)(c) | |
| Triton Water Holdings, Inc., 2024 Incremental Term Loan B, 3 mo. USD SOFR + 4.000%, 8.604%, 3/31/2028(b)(c) | |
| | |
| |
| Bally's Corp., 2021 Term Loan B, 3 mo. USD SOFR + 3.250%, 8.143%, 10/02/2028(b)(c) | |
| Caesars Entertainment, Inc., 2024 Term Loan B1, 2/06/2031(a) | |
| Caesars Entertainment, Inc., 2024 Term Loan B1, 1 mo. USD SOFR + 2.250%, 6.823%, 2/06/2031(c) | |
| GVC Holdings (Gibraltar) Ltd., 2024 USD Term Loan B3, 6 mo. USD SOFR + 2.750%, 8.014%, 10/31/2029(b)(c) | |
| J&J Ventures Gaming LLC, 2023 Incremental Term Loan B, 1 mo. USD SOFR + 4.250%, 8.964%, 4/26/2028(b)(c) | |
| Ontario Gaming GTA LP, Term Loan B, 3 mo. USD SOFR + 4.250%, 8.893%, 8/01/2030(b)(c) | |
| | |
| Government Owned - No Guarantee — 0.5% |
| Element Materials Technology Group U.S. Holdings, Inc., 2022 USD Term Loan, 3 mo. USD SOFR + 3.750%, 8.354%, 7/06/2029(b)(c) | |
| | |
| |
| Bausch & Lomb Corp., 2023 Incremental Term Loan, 1 mo. USD SOFR + 4.000%, 8.573%, 9/29/2028(b)(c) | |
| Bausch & Lomb Corp., Term Loan, 1 mo. USD SOFR + 3.250%, 7.938%, 5/10/2027(b)(c) | |
| Catalent Pharma Solutions, Inc., 2023 Term Loan B4, 1 mo. USD SOFR + 3.000%, 7.595%, 2/22/2028(b)(c) | |
| Charlotte Buyer, Inc., 2024 Term Loan B, 1 mo. USD SOFR + 4.750%, 9.372%, 2/11/2028(b)(c) | |
| Dermatology Intermediate Holdings III, Inc., 2022 Term Loan B, 3 mo. USD SOFR + 4.250%, 8.835%, 3/30/2029(c) | |
| Gainwell Acquisition Corp., Term Loan B, 3 mo. USD SOFR + 4.000%, 8.704%, 10/01/2027(b)(c) | |
| GHX Ultimate Parent Corp., 2024 Term Loan B, 3 mo. USD SOFR + 4.000%, 8.520%, 6/30/2027(b)(c) | |
| Hanger, Inc., 2024 Delayed Draw Term Loan, 10/23/2031(d) | |
| Hanger, Inc., 2024 Term Loan B, 1 mo. USD SOFR + 3.500%, 8.073%, 10/23/2031(b)(c) | |
| IVC Acquisition Ltd., 2024 USD Term Loan B, 3 mo. USD SOFR + 4.750%, 9.393%, 12/12/2028(b)(c) | |
| LifePoint Health, Inc., 2024 Incremental Term Loan B, 3 mo. USD SOFR + 4.000%, 8.632%, 5/17/2031(c) | |
| LifePoint Health, Inc., 2024 Incremental Term Loan B1, 5/17/2031(a) | |
| MDVIP, Inc., 2024 Term Loan, 1 mo. USD SOFR + 3.250%, 7.861%, 10/16/2028(b)(c) | |
| National Mentor Holdings, Inc., 2021 Term Loan, USD SOFR + 3.750%, 8.429%, 3/02/2028(b)(c) | |
| National Mentor Holdings, Inc., 2021 Term Loan C, 3 mo. USD SOFR + 3.750%, 8.454%, 3/02/2028(b)(c) | |
| Onex TSG Intermediate Corp., 2021 Term Loan B, 3 mo. USD SOFR + 4.750%, 9.597%, 2/28/2028(b)(c) | |
| Parexel International Corp., 2024 Term Loan B, 1 mo. USD SOFR + 3.000%, 7.573%, 11/15/2028(b)(c) | |
| Southern Veterinary Partners LLC, 2024 1st Lien Term Loan, 10/31/2031(a) | |
| Southern Veterinary Partners LLC, 2024 Term Loan, 6 mo. USD SOFR + 3.750%, 7.995%, 10/05/2027(b)(c) | |
| Star Parent, Inc., Term Loan B, 3 mo. USD SOFR + 3.750%, 8.354%, 9/27/2030(b)(c) | |
| Surgery Center Holdings, Inc., 2024 Term Loan B, 1 mo. USD SOFR + 2.750%, 7.338%, 12/19/2030(b)(c) | |
| TTF Holdings LLC, 2024 Term Loan, 1 mo. USD SOFR + 3.750%, 8.323%, 7/18/2031(b)(c) | |
| | |
| Independent Energy — 0.4% |
| Matador Bidco SARL, 2024 Term Loan B, 1 mo. USD SOFR + 4.250%, 8.923%, 7/30/2029(c) | |
| |
| Archkey Solutions LLC, 2024 Delayed Draw Term Loan B, 10/10/2031(a) | |
| Archkey Solutions LLC, 2024 Term Loan B, 10/10/2031(a) | |
| Colibri Group LLC, 2022 Term Loan, 3 mo. USD SOFR + 5.000%, 9.797%, 3/12/2029(b)(c) | |
| KUEHG Corp., 2024 Term Loan, 3 mo. USD SOFR + 3.250%, 7.839%, 6/12/2030(b)(c) | |
See accompanying notes to financial statements.
Portfolio of Investments – as of November 30, 2024Loomis Sayles Senior Floating Rate and Fixed Income Fund (continued) | | |
| Industrial Other — continued |
| Learning Care Group U.S. No. 2, Inc., 2024 Term Loan B, 3 mo. USD SOFR + 4.000%, 8.602%, 8/11/2028(c) | |
| Lernen Bidco Ltd., 2024 Term Loan B, 3 mo. USD SOFR + 4.000%, 8.605%, 10/27/2031(b)(c) | |
| Michael Baker International LLC, 2024 Term Loan B, 1 mo. USD SOFR + 4.750%, 9.323%, 12/01/2028(b)(c) | |
| Service Logic Acquisition, Inc., 2024 Term Loan B, USD SOFR + 3.500%, 8.085%, 10/29/2027(b)(c) | |
| St. George's University Scholastic Services LLC, 2022 Term Loan B, 1 mo. USD SOFR + 2.750%, 7.323%, 2/10/2029(b)(c) | |
| | |
| |
| SeaWorld Parks & Entertainment, Inc., 2024 Term Loan B, 1 mo. USD SOFR + 2.500%, 7.073%, 8/25/2028(c) | |
| SeaWorld Parks & Entertainment, Inc., 2024 Term Loan B3, 12/04/2031(a) | |
| | |
| |
| Hilton Grand Vacations Borrower LLC, 2021 Term Loan B, 1 mo. USD SOFR + 2.500%, 7.073%, 8/02/2028(b)(c) | |
| Hilton Grand Vacations Borrower LLC, 2024 Incremental Term Loan B, 1 mo. USD SOFR + 2.250%, 6.823%, 1/17/2031(b)(c) | |
| | |
| Media Entertainment — 5.9% |
| Advantage Sales & Marketing, Inc., 2024 Term Loan, 3 mo. USD SOFR + 4.250%, 9.121%, 10/28/2027(b)(c) | |
| AP Core Holdings II LLC, High-Yield Term Loan B2, 1 mo. USD SOFR + 5.500%, 10.187%, 9/01/2027(c) | |
| Cengage Learning, Inc., 2024 1st Lien Term Loan B, USD SOFR + 3.500%, 8.054%, 3/22/2031(b)(c) | |
| Century DE Buyer LLC, Term Loan B, 3 mo. USD SOFR + 4.000%, 8.605%, 10/30/2030(b)(c) | |
| Clear Channel Outdoor Holdings, Inc., 2024 Term Loan, 1 mo. USD SOFR + 4.000%, 8.687%, 8/23/2028(b)(c) | |
| Creative Artists Agency LLC, 2024 1st Lien Term Loan B, 1 mo. USD SOFR + 2.750%, 7.323%, 10/01/2031(b)(c) | |
| Dotdash Meredith, Inc., 2024 Term Loan, 12/01/2028(a) | |
| Gray Television, Inc., 2021 Term Loan D, 1 mo. USD SOFR + 3.000%, 7.786%, 12/01/2028(c) | |
| McGraw-Hill Global Education Holdings LLC, 2024 Term Loan B, 8/01/2031(a) | |
| McGraw-Hill Global Education Holdings LLC, 2024 Term Loan B, 3 mo. USD SOFR + 4.000%, 8.604%, 8/06/2031(b)(c) | |
| MH Sub I LLC, 2021 2nd Lien Term Loan, 1 mo. USD SOFR + 6.250%, 10.823%, 2/23/2029(c) | |
| Planet U.S. Buyer LLC, 2024 1st Lien Term Loan B, 2/07/2031(a) | |
| | |
| Media Entertainment — continued |
| Plano HoldCo, Inc., Term Loan B, 3 mo. USD SOFR + 3.500%, 8.092%, 10/02/2031(b)(c) | |
| Voyage Digital (NZ) Ltd., 2024 Term Loan, 3 mo. USD SOFR + 3.250%, 7.741%, 5/11/2029(b)(c) | |
| | |
| |
| AL GCX Holdings LLC, Term Loan B, 1 mo. USD SOFR + 2.750%, 7.380%, 5/17/2029(b)(c) | |
| AL NGPL Holdings LLC, Term Loan B, 3 mo. USD SOFR + 2.500%, 7.090%, 4/17/2028(b)(c) | |
| Brazos Delaware II LLC, 2024 Term Loan B, 6 mo. USD SOFR + 3.500%, 8.255%, 2/11/2030(b)(c) | |
| Oryx Midstream Services Permian Basin LLC, 2024 Term Loan B, 1 mo. USD SOFR + 3.000%, 7.724%, 10/05/2028(b)(c) | |
| | |
| Oil Field Services — 0.8% |
| BANGL LLC, Term Loan B, 3 mo. USD SOFR + 4.500%, 9.092%, 2/01/2029(b)(c) | |
| MRC Global U.S., Inc., 2024 Term Loan B, 3 mo. USD SOFR + 3.500%, 8.071%, 10/24/2031(b)(c) | |
| Star Holding LLC, 2024 1st Lien Term Loan B, 1 mo. USD SOFR + 4.500%, 9.073%, 7/31/2031(b)(c) | |
| | |
| |
| Apollo Commercial Real Estate Finance, Inc., 2021 Incremental Term Loan B1, 1 mo. USD SOFR + 3.500%, 8.187%, 3/11/2028(b)(c) | |
| Starwood Property Trust, Inc., 2024 Term Loan B, 1 mo. USD SOFR + 2.750%, 7.323%, 11/18/2027(c) | |
| | |
| |
| Anchor Packaging, Inc., 2024 Term Loan, 1 mo. USD SOFR + 3.750%, 8.323%, 7/18/2029(c) | |
| Ring Container Technologies Group LLC, 2024 Term Loan B, 1 mo. USD SOFR + 2.750%, 7.323%, 8/12/2028(b)(c) | |
| | |
| |
| Domtar Corp., 2021 Term Loan B, 1 mo. USD SOFR + 5.500%, 10.187%, 11/30/2028(b)(c) | |
| Glatfelter Corp., Term Loan B, 3 mo. USD SOFR + 4.250%, 8.764%, 11/04/2031(b)(c) | |
| Schweitzer-Mauduit International, Inc., 2021 Term Loan B, 1 mo. USD SOFR + 3.750%, 8.437%, 4/20/2028(b)(c) | |
| Spa Holdings 3 Oy, USD Term Loan B, 3 mo. USD SOFR + 3.750%, 8.615%, 2/04/2028(b)(c) | |
| | |
| |
| Bausch Health Cos., Inc., 2022 Term Loan B, 1 mo. USD SOFR + 5.250%, 9.923%, 2/01/2027(c) | |
| Property & Casualty Insurance — 6.0% |
| Acrisure LLC, 2024 Term Loan B6, 1 mo. USD SOFR + 3.250%, 7.849%, 11/06/2030(b)(c) | |
| Alliant Holdings Intermediate LLC, 2024 Term Loan B6, 1 mo. USD SOFR + 2.750%, 7.349%, 9/19/2031(b)(c) | |
See accompanying notes to financial statements.
Portfolio of Investments – as of November 30, 2024Loomis Sayles Senior Floating Rate and Fixed Income Fund (continued) | | |
| Property & Casualty Insurance — continued |
| Amynta Agency Borrower, Inc., 2024 Term Loan B, 1 mo. USD SOFR + 3.750%, 8.323%, 2/28/2028(b)(c) | |
| Ardonagh Midco 3 PLC, 2024 USD Term Loan B, 3 mo. USD SOFR + 3.750%, 8.277%, 2/15/2031(b)(c) | |
| AssuredPartners, Inc., 2024 Incremental Term Loan B5, 1 mo. USD SOFR + 3.500%, 8.073%, 2/14/2031(b)(c) | |
| Asurion LLC, 2020 Term Loan B8, 1 mo. USD SOFR + 3.250%, 7.937%, 12/23/2026(b)(c) | |
| Asurion LLC, 2021 2nd Lien Term Loan B3, 1 mo. USD SOFR + 5.250%, 9.937%, 1/31/2028(c) | |
| Asurion LLC, 2023 Term Loan B11, 1 mo. USD SOFR + 4.250%, 8.923%, 8/19/2028(b)(c) | |
| Asurion LLC, 2024 Term Loan B12, 9/19/2030(a) | |
| Baldwin Insurance Group Holdings LLC, 2024 Term Loan B, 1 mo. USD SOFR + 3.250%, 7.823%, 5/26/2031(c) | |
| BroadStreet Partners, Inc., 2024 1st Lien Term Loan B4, 6/13/2031(a) | |
| BroadStreet Partners, Inc., 2024 Term Loan B4, 1 mo. USD SOFR + 3.250%, 7.823%, 6/13/2031(b)(c) | |
| Howden Group Holdings Ltd., 2024 Term Loan B, 1 mo. USD SOFR + 3.500%, 8.073%, 4/18/2030(b)(c) | |
| HUB International Ltd., 2024 1st Lien Term Loan B, 3 mo. USD SOFR + 2.750%, 7.367%, 6/20/2030(b)(c) | |
| Ryan Specialty Group LLC, 2024 USD Term Loan B, 1 mo. USD SOFR + 2.250%, 6.823%, 9/15/2031(b)(c) | |
| Sedgwick Claims Management Services, Inc., 2023 Term Loan B, 3 mo. USD SOFR + 3.000%, 7.585%, 7/31/2031(b)(c) | |
| Truist Insurance Holdings LLC, 1st Lien Term Loan, 3 mo. USD SOFR + 3.250%, 7.854%, 5/06/2031(b)(c) | |
| Truist Insurance Holdings LLC, 2nd Lien Term Loan, 3 mo. USD SOFR + 4.750%, 9.354%, 5/06/2032(b)(c) | |
| USI, Inc., 2024 Term Loan (2029), 3 mo. USD SOFR + 2.750%, 7.354%, 11/22/2029(c) | |
| | |
| |
| 1011778 B.C. Unlimited Liability Co., 2024 Term Loan B6, 1 mo. USD SOFR + 1.750%, 6.323%, 9/20/2030(b)(c) | |
| Dave & Buster's, Inc., 2024 Term Loan B, 1 mo. USD SOFR + 3.250%, 7.938%, 6/29/2029(c) | |
| Whatabrands LLC, 2024 Term Loan B, 1 mo. USD SOFR + 2.750%, 7.323%, 8/03/2028(b)(c) | |
| | |
| |
| ABG Intermediate Holdings 2 LLC, 2024 Term Loan B, 1 mo. USD SOFR + 2.750%, 7.323%, 12/21/2028(b)(c) | |
| At Home Group, Inc., Term Loan B, 1 mo. USD SOFR + 4.250%, 9.036%, 7/24/2028(b)(c) | |
| Belron Finance LLC, 2024 USD Term Loan B, 3 mo. USD SOFR + 2.750%, 7.273%, 10/16/2031(b)(c) | |
| Canada Goose, Inc., 2021 Term Loan, 1 mo. USD SOFR + 3.500%, 8.187%, 10/07/2027(b)(c) | |
| Container Store, Inc., 2020 Term Loan B3, 3 mo. USD SOFR + 5.000%, 9.865%, 1/31/2026(c) | |
| CWGS Group LLC, 2021 Term Loan B, 1 mo. USD SOFR + 2.500%, 7.187%, 6/03/2028(b)(c) | |
| | |
| |
| Driven Holdings LLC, Term Loan B, 1 mo. USD SOFR + 3.000%, 7.687%, 12/17/2028(b)(c) | |
| Evergreen Acqco 1 LP, 2021 USD Term Loan, 3 mo. USD SOFR + 3.750%, 8.393%, 4/26/2028(b)(c) | |
| Great Outdoors Group LLC, 2021 Term Loan B2, 1 mo. USD SOFR + 3.750%, 8.437%, 3/06/2028(b)(c) | |
| Harbor Freight Tools USA, Inc., 2024 Term Loan B, USD SOFR + 2.500%, 7.092%, 6/11/2031(c) | |
| International Textile Group, Inc., 2023 Last Out Term Loan, 5.500% PIK or 3 mo. USD SOFR + 6.650% Cash, 9/30/2027(c)(f) | |
| International Textile Group, Inc., 2023 Term Loan, 3 mo. USD SOFR + 8.500%, 13.243%, 9/30/2027(c) | |
| Michaels Cos., Inc., 2021 Term Loan B, 3 mo. USD SOFR + 4.250%, 9.115%, 4/17/2028(b)(c) | |
| Olaplex, Inc., 2022 Term Loan, 1 mo. USD SOFR + 3.500%, 8.173%, 2/23/2029(b)(c) | |
| Peer Holding III BV, 2023 USD Term Loan B4, 3 mo. USD SOFR + 3.250%, 7.854%, 10/28/2030(b)(c) | |
| Peer Holding III BV, 2024 USD Term Loan B5, 3 mo. USD SOFR + 3.000%, 7.604%, 7/01/2031(b)(c) | |
| Petco Health & Wellness Co., Inc., 2021 Term Loan B, 3 mo. USD SOFR + 3.250%, 8.115%, 3/03/2028(b)(c) | |
| PetSmart, Inc., 2021 Term Loan B, 1 mo. USD SOFR + 3.750%, 8.423%, 2/11/2028(b)(c) | |
| Restoration Hardware, Inc., 2022 Incremental Term Loan, 1 mo. USD SOFR + 3.250%, 7.923%, 10/20/2028(b)(c) | |
| RVR Dealership Holdings LLC, Term Loan B, 3 mo. USD SOFR + 3.750%, 8.504%, 2/08/2028(b)(c) | |
| S&S Holdings LLC, 2024 Term Loan, 1 mo. USD SOFR + 5.000%, 9.599%, 10/01/2031(b)(c) | |
| S&S Holdings LLC, Term Loan, 1 mo. USD SOFR + 5.000%, 9.699%, 3/11/2028(b)(c) | |
| Tory Burch LLC, Term Loan B, 1 mo. USD SOFR + 3.250%, 7.937%, 4/16/2028(c) | |
| Varsity Brands, Inc., 2024 Term Loan B, 3 mo. USD SOFR + 3.750%, 8.271%, 8/26/2031(b)(c) | |
| Wand NewCo 3, Inc., 2024 1st Lien Term Loan B, USD SOFR + 3.250%, 7.834%, 1/30/2031(b)(c) | |
| | |
| |
| Access CIG LLC, 2023 Term Loan, 3 mo. USD SOFR + 5.000%, 9.585%, 8/18/2028(c) | |
| Altar Bidco, Inc., 2021 2nd Lien Term Loan, 1 yr. USD SOFR + 5.600%, 9.747%, 2/01/2030(b)(c) | |
| Boost Newco Borrower LLC, 2024 USD Term Loan B, 3 mo. USD SOFR + 2.500%, 7.104%, 1/31/2031(b)(c) | |
| Camelot U.S. Acquisition LLC, 2024 Term Loan B, 1 mo. USD SOFR + 2.750%, 7.323%, 1/31/2031(c) | |
| Central Parent, Inc., 2024 Term Loan B, 3 mo. USD SOFR + 3.250%, 7.854%, 7/06/2029(b)(c) | |
| Corel Corp., 2019 Term Loan, 3 mo. USD SOFR + 5.000%, 9.614%, 7/02/2026(b)(c) | |
| Cornerstone OnDemand, Inc., 2021 Term Loan, 1 mo. USD SOFR + 3.750%, 8.437%, 10/16/2028(b)(c) | |
| Cotiviti Corp., 2024 Term Loan, 1 mo. USD SOFR + 3.000%, 7.672%, 5/01/2031(c) | |
| Cotiviti Corp., 2024 Term Loan B, 5/01/2031(c) | |
See accompanying notes to financial statements.
Portfolio of Investments – as of November 30, 2024Loomis Sayles Senior Floating Rate and Fixed Income Fund (continued) | | |
| |
| EP Purchaser LLC, 2021 Term Loan B, 3 mo. USD SOFR + 3.500%, 8.365%, 11/06/2028(b)(c) | |
| First Advantage Holdings LLC, 2024 Term Loan B, 1 mo. USD SOFR + 3.250%, 7.823%, 10/31/2031(b)(c) | |
| Fortress Intermediate 3, Inc., Term Loan B, 1 mo. USD SOFR + 3.500%, 8.073%, 6/27/2031(b)(c) | |
| Foundever Worldwide Corp., 2021 USD Term Loan, 1 mo. USD SOFR + 3.750%, 8.437%, 8/28/2028(b)(c) | |
| Genesys Cloud Services Holdings II LLC, 2024 USD Term Loan B, 1 mo. USD SOFR + 3.000%, 7.573%, 12/01/2027(b)(c) | |
| Genuine Financial Holdings LLC, 2024 Incremental Term Loan, 1 mo. USD SOFR + 4.000%, 8.573%, 9/27/2030(b)(c) | |
| Global Holdings Interco LLC, Term Loan B, 1 mo. USD SOFR + 5.500%, 10.211%, 3/16/2026(b)(c) | |
| Imprivata, Inc., 2024 Term Loan, 3 mo. USD SOFR + 3.500%, 8.085%, 12/01/2027(b)(c) | |
| Loyalty Ventures, Inc., Term Loan B, PRIME + 5.500%, 11/03/2027(g)(h) | |
| McAfee LLC, 2024 USD Term Loan B, 1 mo. USD SOFR + 3.250%, 7.906%, 3/01/2029(c) | |
| MedAssets Software Intermediate Holdings, Inc., 2021 Term Loan, 1 mo. USD SOFR + 4.000%, 8.725%, 12/18/2028(c) | |
| Modena Buyer LLC, Term Loan, 3 mo. USD SOFR + 4.500%, 9.104%, 7/01/2031(b)(c) | |
| Mosel Bidco SE, USD Term Loan B, 3 mo. USD SOFR + 4.500%, 9.104%, 9/16/2030(b)(c) | |
| NCR Atleos LLC, 2024 Term Loan B, 3 mo. USD SOFR + 3.750%, 8.398%, 3/27/2029(b)(c) | |
| Neptune Bidco U.S., Inc., 2022 USD Term Loan A, 3 mo. USD SOFR + 4.750%, 9.508%, 4/11/2029(b)(c) | |
| Neptune Bidco U.S., Inc., 2022 USD Term Loan B, 3 mo. USD SOFR + 5.000%, 9.758%, 4/11/2029(c) | |
| Nuvei Technologies Corp., 2024 Term Loan B1, 11/15/2031(a) | |
| Physician Partners LLC, Term Loan, 3 mo. USD SOFR + 4.000%, 8.735%, 12/26/2028(b)(c) | |
| PointClickCare Technologies, Inc., 2024 USD Term Loan B, 3 mo. USD SOFR + 3.250%, 7.821%, 11/03/2031(b)(c) | |
| Press Ganey Holdings, Inc., 2024 1st Lien Term Loan B, 4/30/2031(a) | |
| Project Alpha Intermediate Holding, Inc., 2024 1st Lien Term Loan B, 10/28/2030(a) | |
| Project Alpha Intermediate Holding, Inc., 2024 2nd Lien Incremental Term Loan, 11/22/2032(a) | |
| Quest Software U.S. Holdings, Inc., 2022 Term Loan, 3 mo. USD SOFR + 4.250%, 8.985%, 2/01/2029(b)(c) | |
| Redstone Holdco 2 LP, 2021 Term Loan, 3 mo. USD SOFR + 4.750%, 9.597%, 4/27/2028(b)(c) | |
| S2P Acquisition Borrower, Inc., 2024 1st Lien Term Loan, 10/08/2031(a) | |
| Sabre GLBL, Inc., 2022 1st Lien Term Loan B, 1 mo. USD SOFR + 5.000%, 9.673%, 6/30/2028(c) | |
| UKG, Inc., 2024 Term Loan B, 3 mo. USD SOFR + 3.000%, 7.617%, 2/10/2031(b)(c) | |
| Virtusa Corp., 2024 Term Loan B, 1 mo. USD SOFR + 3.250%, 7.823%, 2/15/2029(c) | |
| | |
| |
| Vision Solutions, Inc., 2021 Incremental Term Loan, 4/24/2028(a) | |
| Waystar Technologies, Inc., 2024 USD Term Loan B, 1 mo. USD SOFR + 2.750%, 7.323%, 10/22/2029(b)(c) | |
| | |
| Transportation Services — 2.2% |
| AIT Worldwide Logistics Holdings, Inc., 2024 Term Loan B, 1 mo. USD SOFR + 4.750%, 9.480%, 4/05/2030(b)(c) | |
| Brown Group Holding LLC, 2022 Incremental Term Loan B2, USD SOFR + 2.750%, 7.315%, 7/01/2031(b)(c) | |
| Brown Group Holding LLC, Term Loan B, 1 mo. USD SOFR + 2.750%, 7.323%, 7/01/2031(b)(c) | |
| Construction Partners, Inc., Term Loan B, 1 mo. USD SOFR + 2.500%, 7.073%, 11/03/2031(b)(c) | |
| KKR Apple Bidco LLC, 2022 Incremental Term Loan, 1 mo. USD SOFR + 3.500%, 8.073%, 9/22/2028(b)(c) | |
| PODS LLC, 2021 Term Loan B, 3 mo. USD SOFR + 3.000%, 7.847%, 3/31/2028(b)(c) | |
| Rand Parent LLC, 2023 Term Loan B, 3 mo. USD SOFR + 3.750%, 8.354%, 3/17/2030(b)(c) | |
| St. George Warehousing & Trucking Co. of California, Inc., 2022 Term Loan, 3 mo. USD SOFR + 6.000%, 10.754%, 3/24/2028(b)(c) | |
| Worldwide Express Operations LLC, 2024 Term Loan B, 3 mo. USD SOFR + 4.000%, 8.522%, 7/26/2028(b)(c) | |
| | |
| |
| Altice France SA, 2023 USD Term Loan B14, 3 mo. USD SOFR + 5.500%, 10.147%, 8/15/2028(b)(c) | |
| CCI Buyer, Inc., Term Loan, 3 mo. USD SOFR + 4.000%, 8.604%, 12/17/2027(b)(c) | |
| Crown Subsea Communications Holding, Inc., 2024 Term Loan B1, 1 mo. USD SOFR + 4.000%, 8.553%, 1/30/2031(c) | |
| | |
| |
| Frontier Communications Corp., 2024 Term Loan B, 3 mo. USD SOFR + 3.500%, 8.763%, 7/01/2031(b)(c) | |
| Voyage Australia Pty. Ltd., USD Term Loan B, 3 mo. USD SOFR + 3.500%, 8.379%, 7/20/2028(b)(c) | |
| Zayo Group Holdings, Inc., USD Term Loan, 1 mo. USD SOFR + 3.000%, 7.687%, 3/09/2027(b)(c) | |
| | |
| Total Senior Loans
(Identified Cost $778,924,919) | |
|
|
|
| |
| Allegiant Travel Co., 7.250%, 8/15/2027(i) | |
| |
| DISH DBS Corp., 7.750%, 7/01/2026 | |
| |
| Iris Holdings, Inc., 9.500% PIK or 8.750% Cash, 2/15/2026(i)(j) | |
| |
| Alpha Generation LLC, 6.750%, 10/15/2032(i) | |
See accompanying notes to financial statements.
Portfolio of Investments – as of November 30, 2024Loomis Sayles Senior Floating Rate and Fixed Income Fund (continued) | | |
|
| Media Entertainment — 0.4% |
| Millennium Escrow Corp., 6.625%, 8/01/2026(i) | |
| |
| Evergreen Acqco 1 LP/TVI, Inc., 9.750%, 4/26/2028(i) | |
| |
| Level 3 Financing, Inc., 4.250%, 7/01/2028(i) | |
| Total Bonds and Notes
(Identified Cost $20,214,047) | |
|
|
Collateralized Loan Obligations — 1.8% |
| 720 East CLO VI Ltd., Series 2024-3A, Class E, 3 mo. USD SOFR + 5.500%, 10.061%, 1/20/2038(c)(i) | |
| AGL CLO 35 Ltd., Series 2024-35A, Class E, 3 mo. USD SOFR + 5.150%, 1/21/2038(c)(i)(k) | |
| Benefit Street Partners CLO XXVIII Ltd., Series 2022-28A, Class ER, 3 mo. USD SOFR + 5.400%, 9.962%, 10/20/2037(c)(i) | |
| OHA Credit Partners XVII Ltd., Series 2024-17A, Class E, 3 mo. USD SOFR + 5.000%, 1/18/2038(c)(i)(k) | |
| Palmer Square CLO Ltd., Series 2022-4A, Class ER, 3 mo. USD SOFR + 5.500%, 10.061%, 10/20/2037(c)(i) | |
| Total Collateralized Loan Obligations
(Identified Cost $14,690,000) | |
| | |
Exchange-Traded Funds — 1.6% |
| | |
| SPDR® Blackstone Senior Loan ETF | |
| Total Exchange-Traded Funds
(Identified Cost $13,182,236) | |
|
|
|
| |
| | |
| Oil, Gas & Consumable Fuels — 0.0% |
| Ameriforge Group, Inc.(e)(h) | |
| | |
| | |
| Textiles, Apparel & Luxury Goods — 0.0% |
| Elevate Textiles Holding Corp.(e) | |
| Total Common Stocks
(Identified Cost $10,520,119) | |
|
|
|
| Elevate Textiles Holding Corp., Expiration on 6/21/2028(e)
(Identified Cost $2,333) | |
| | |
Short-Term Investments — 9.9% |
| Tri-Party Repurchase Agreement with Fixed Income Clearing Corporation, dated 11/29/2024 at 2.750% to be repurchased at $66,585,606 on 12/02/2024 collateralized by $67,138,700 U.S. Treasury Note, 4.875% due 4/30/2026 valued at $67,901,884 including accrued interest (Note 2 of Notes to Financial Statements) | |
| U.S. Treasury Bills, 4.502%, 12/10/2024(l) | |
| Total Short-Term Investments
(Identified Cost $81,553,466) | |
| Total Investments — 108.5%
(Identified Cost $919,087,120) | |
| Other assets less liabilities — (8.5)% | |
| | |
| See Note 2 of Notes to Financial Statements. |
| Position is unsettled. Contract rate was not determined at November 30, 2024 and does not take effect until settlement date. Maturity date is not finalized until settlement date. |
| Stated interest rate has been determined in accordance with the provisions of the loan agreement and is subject to a minimum benchmark floor rate which may range from 0.00% to 1.00%, to which the spread is added. |
| Variable rate security. Rate as of November 30, 2024 is disclosed. Issuers comprised of various lots with differing coupon rates have been aggregated for the purpose of presentation in the Portfolio of Investments and show a weighted average rate. Certain variable rate securities are not based on a published reference rate and spread, rather are determined by the issuer or agent and are based on current market conditions. These securities may not indicate a reference rate and/or spread in their description. |
| Unfunded loan commitment. An unfunded loan commitment is a contractual obligation for future funding at the option of the borrower. The Fund receives a stated coupon rate until the borrower draws on the loan commitment, at which time the rate will become the stated rate in the loan agreement. See Note 2 of Notes to Financial Statements. |
| Non-income producing security. |
| Payment–in–kind security for which the issuer, at each interest payment date, may make interest payments in cash and/or additional principal. For the period ended November 30, 2024, interest payments were made in principal. |
| The issuer is in default with respect to interest and/or principal payments. Income is not being accrued. |
| Level 3 security. Value has been determined using significant unobservable inputs. See Note 3 of Notes to Financial Statements. |
| All or a portion of these securities are exempt from registration under Rule 144A of the Securities Act of 1933. These securities may be resold in transactions exempt from registration, normally to qualified institutional buyers. At November 30, 2024, the value of Rule 144A holdings amounted to $29,045,550 or 3.5% of net assets. |
| Payment-in-kind security for which the issuer, at each interest payment date, may make interest payments in cash and/or additional principal. For the period ended November 30, 2024, interest payments were made in cash. |
| New issue unsettled as of November 30, 2024. Coupon rate does not take effect until settlement date. |
| Interest rate represents discount rate at time of purchase; not a coupon rate. |
See accompanying notes to financial statements.
Portfolio of Investments – as of November 30, 2024Loomis Sayles Senior Floating Rate and Fixed Income Fund (continued) | |
| |
| Real Estate Investment Trusts |
| Secured Overnight Financing Rate |
| Standard & Poor's Depositary Receipt |
Industry Summary at November 30, 2024
| |
| |
| |
| |
Consumer Cyclical Services | |
Property & Casualty Insurance | |
| |
| |
Diversified Manufacturing | |
| |
| |
| |
| |
| |
| |
Other Investments, less than 2% each | |
Collateralized Loan Obligations | |
| |
| |
| |
Other assets less liabilities | |
| |
See accompanying notes to financial statements.
Portfolio of Investments – as of November 30, 2024Vaughan Nelson Select Fund
| | |
Common Stocks — 98.7% of Net Assets |
| |
| | |
| |
| Coca-Cola Consolidated, Inc. | |
| |
| | |
| |
| Intercontinental Exchange, Inc. | |
| |
| | |
| | |
| | |
| Construction & Engineering — 3.4% |
| Comfort Systems USA, Inc. | |
| Electrical Equipment — 3.2% |
| | |
| |
| | |
| Financial Services — 1.0% |
| Berkshire Hathaway, Inc., Class B(a) | |
| Ground Transportation — 4.3% |
| | |
| Health Care Equipment & Supplies — 1.8% |
| | |
| Hotels, Restaurants & Leisure — 3.3% |
| DoorDash, Inc., Class A(a) | |
| Household Durables — 2.1% |
| | |
| Interactive Media & Services — 7.8% |
| | |
| Meta Platforms, Inc., Class A | |
| | |
| Life Sciences Tools & Services — 2.7% |
| | |
| Mortgage Real Estate Investment Trusts (REITs) — 1.3% |
| | |
| Oil, Gas & Consumable Fuels — 3.8% |
| Antero Resources Corp.(a) | |
| | |
| | |
| | |
| | |
| |
| | |
| Semiconductors & Semiconductor Equipment — 17.5% |
| Monolithic Power Systems, Inc. | |
| | |
| ON Semiconductor Corp.(a) | |
| Taiwan Semiconductor Manufacturing Co. Ltd., ADR | |
| | |
| |
| | |
| | |
| |
| | |
| | |
| | |
| |
| O'Reilly Automotive, Inc.(a) | |
| Total Common Stocks
(Identified Cost $580,156,511) | |
| | |
Short-Term Investments — 0.3% |
| Tri-Party Repurchase Agreement with Fixed Income Clearing Corporation, dated 11/29/2024 at 2.750% to be repurchased at $2,337,490 on 12/02/2024 collateralized by $2,357,000 U.S. Treasury Note, 4.875% due 4/30/2026 valued at $2,383,887 including accrued interest (Note 2 of Notes to Financial Statements)
(Identified Cost $2,336,955) | |
| Total Investments — 99.0%
(Identified Cost $582,493,466) | |
| Other assets less liabilities — 1.0% | |
| | |
| See Note 2 of Notes to Financial Statements. |
| Non-income producing security. |
| An American Depositary Receipt is a certificate issued by a custodian bank representing the right to receive securities of the foreign issuer described. The values of ADRs may be significantly influenced by trading on exchanges not located in the United States. |
| Real Estate Investment Trusts |
See accompanying notes to financial statements.
Portfolio of Investments – as of November 30, 2024Vaughan Nelson Select Fund (continued) Industry Summary at November 30, 2024
Semiconductors & Semiconductor Equipment | |
| |
Interactive Media & Services | |
| |
| |
| |
| |
| |
| |
| |
Oil, Gas & Consumable Fuels | |
Construction & Engineering | |
Hotels, Restaurants & Leisure | |
| |
| |
Life Sciences Tools & Services | |
| |
Other Investments, less than 2% each | |
| |
| |
Other assets less liabilities | |
| |
See accompanying notes to financial statements.
Statements of Assets and Liabilities
| Loomis Sayles
Global Growth
Fund | Loomis Sayles
Senior Floating
Rate and Fixed
Income Fund | Vaughan Nelson
Select Fund |
| | | |
| | | |
Net unrealized appreciation (depreciation) | | | |
| | | |
| | | |
Receivable for Fund shares sold | | | |
Receivable for securities sold | | | |
Dividends and interest receivable | | | |
| | | |
| | | |
| | | |
| | | |
Payable for securities purchased | | | |
Unfunded loan commitments (Note 2) | | | |
Payable for Fund shares redeemed | | | |
| | | |
Management fees payable (Note 5) | | | |
Deferred Trustees’ fees (Note 5) | | | |
Administrative fees payable (Note 5) | | | |
Payable to distributor (Note 5d) | | | |
Audit and tax services fees payable | | | |
Other accounts payable and accrued expenses | | | |
| | | |
COMMITMENTS AND CONTINGENCIES(a) | | | |
| | | |
| | | |
| | | |
Accumulated earnings (loss) | | | |
| | | |
COMPUTATION OF NET ASSET VALUE AND OFFERING PRICE: | | | |
| | | |
| | | |
Shares of beneficial interest | | | |
Net asset value and redemption price per share | | | |
Offering price per share (100/[100-maximum sales charge] of net asset value) (Note 1) | | | |
Class C shares: (redemption price per share is equal to net asset value less any applicable contingent deferred sales charge) (Note 1) | | | |
| | | |
Shares of beneficial interest | | | |
Net asset value and offering price per share | | | |
| | | |
| | | |
Shares of beneficial interest | | | |
Net asset value, offering and redemption price per share | | | |
| | | |
| | | |
Shares of beneficial interest | | | |
Net asset value, offering and redemption price per share | | | |
| As disclosed in the Notes to Financial Statements, if applicable. |
See accompanying notes to financial statements.
For the Year Ended November 30, 2024
| Loomis Sayles
Global Growth
Fund | Loomis Sayles
Senior Floating
Rate and Fixed
Income Fund | Vaughan Nelson
Select Fund |
| | | |
| | | |
| | | |
Less net foreign taxes withheld | | | |
| | | |
| | | |
| | | |
Service and distribution fees (Note 5) | | | |
Administrative fees (Note 5) | | | |
Trustees' fees and expenses (Note 5) | | | |
Transfer agent fees and expenses (Notes 5, 6 and 7) | | | |
Audit and tax services fees | | | |
Custodian fees and expenses | | | |
| | | |
| | | |
Shareholder reporting expenses | | | |
| | | |
| | | |
Expense recovery (Note 5) | | | |
Less waiver and/or expense reimbursement (Note 5) | | | |
Less expense offset (Note 7) | | | |
| | | |
Net investment income (loss) | | | |
Net realized and unrealized gain (loss) on Investments and Foreign currency transactions | | | |
Net realized gain (loss) on: | | | |
| | | |
Foreign currency transactions (Note 2c) | | | |
Net change in unrealized appreciation (depreciation) on: | | | |
| | | |
Foreign currency translations (Note 2c) | | | |
Net realized and unrealized gain on Investments and Foreign currency transactions | | | |
NET INCREASE IN NET ASSETS RESULTING FROM OPERATIONS | | | |
See accompanying notes to financial statements.
Statements of Changes in Net Assets
| Loomis Sayles Global
Growth Fund | Loomis Sayles Senior Floating
Rate and Fixed Income Fund |
| Year Ended
November 30,2024 | Year Ended
November 30,2023 | Year Ended
November 30,2024 | Year Ended
November 30,2023 |
| | | | |
Net investment income (loss) | | | | |
Net realized gain (loss) on investments and foreign currency transactions | | | | |
Net change in unrealized appreciation on investments and foreign currency translations | | | | |
Net increase in net assets resulting from operations | | | | |
FROM DISTRIBUTIONS TO SHAREHOLDERS: | | | | |
| | | | |
| | | | |
| | | | |
| | | | |
| | | | |
NET DECREASE IN NET ASSETS
FROM CAPITAL SHARES TRANSACTIONS
(Note 11) | | | | |
Net increase (decrease) in net assets | | | | |
| | | | |
| | | | |
| | | | |
See accompanying notes to financial statements.
Statements of Changes in Net Assets (continued)
| Vaughan Nelson Select Fund |
| Year Ended
November 30,2024 | Year Ended
November 30,2023 |
| | |
Net investment income (loss) | | |
Net realized gain (loss) on investments | | |
Net change in unrealized appreciation on investments | | |
Net increase in net assets resulting from operations | | |
FROM DISTRIBUTIONS TO SHAREHOLDERS: | | |
| | |
| | |
| | |
| | |
| | |
NET INCREASE IN NET ASSETS
FROM CAPITAL SHARES TRANSACTIONS
(Note 11) | | |
Net increase in net assets | | |
| | |
| | |
| | |
See accompanying notes to financial statements.
For a share outstanding throughout each period.
| Loomis Sayles Global Growth Fund—Class A |
| Year Ended
November 30,
2024 | Year Ended
November 30,
2023 | Year Ended
November 30,
2022 | Year Ended
November 30,
2021 | Year Ended
November 30,
2020 |
Net asset value, beginning of the period | | | | | |
INCOME (LOSS) FROM INVESTMENT OPERATIONS: | | | | | |
| | | | | |
Net realized and unrealized gain (loss) | | | | | |
Total from Investment Operations | | | | | |
| | | | | |
Net realized capital gains | | | | | |
Net asset value, end of the period | | | | | |
| | | | | |
RATIOS TO AVERAGE NET ASSETS: | | | | | |
Net assets, end of the period (000's) | | | | | |
| | | | | |
| | | | | |
| | | | | |
| | | | | |
| Per share net investment loss has been calculated using the average shares outstanding during the period. |
| A sales charge for Class A shares is not reflected in total return calculations. |
| Had certain expenses not been waived/reimbursed during the period, total returns would have been lower. |
| The investment adviser agreed to waive its fees and/or reimburse a portion of the Fund’s expenses during the period. Without this waiver/reimbursement, expenses would have been higher. |
| Includes interest expense. Without this expense the ratio of net expenses would have been 1.20% and the ratio of gross expenses would have been 1.37%. |
| Effective December 15, 2020, the expense limit decreased from 1.25% to 1.20% |
See accompanying notes to financial statements.
Financial Highlights (continued)
For a share outstanding throughout each period.
| Loomis Sayles Global Growth Fund—Class C |
| Year Ended
November 30,
2024 | Year Ended
November 30,
2023 | Year Ended
November 30,
2022 | Year Ended
November 30,
2021 | Year Ended
November 30,
2020 |
Net asset value, beginning of the period | | | | | |
INCOME (LOSS) FROM INVESTMENT OPERATIONS: | | | | | |
| | | | | |
Net realized and unrealized gain (loss) | | | | | |
Total from Investment Operations | | | | | |
| | | | | |
Net realized capital gains | | | | | |
Net asset value, end of the period | | | | | |
| | | | | |
RATIOS TO AVERAGE NET ASSETS: | | | | | |
Net assets, end of the period (000's) | | | | | |
| | | | | |
| | | | | |
| | | | | |
| | | | | |
| Per share net investment loss has been calculated using the average shares outstanding during the period. |
| A contingent deferred sales charge for Class C shares is not reflected in total return calculations. |
| Had certain expenses not been waived/reimbursed during the period, total returns would have been lower. |
| The investment adviser agreed to waive its fees and/or reimburse a portion of the Fund’s expenses during the period. Without this waiver/reimbursement, expenses would have been higher. |
| Includes interest expense. Without this expense the ratio of net expenses would have been 1.95% and the ratio of gross expenses would have been 2.13%. |
| Effective December 15, 2020, the expense limit decreased from 2.00% to 1.95%. |
See accompanying notes to financial statements.
Financial Highlights (continued)
For a share outstanding throughout each period.
| Loomis Sayles Global Growth Fund—Class N |
| Year Ended
November 30,
2024 | Year Ended
November 30,
2023 | Year Ended
November 30,
2022 | Year Ended
November 30,
2021 | Year Ended
November 30,
2020 |
Net asset value, beginning of the period | | | | | |
INCOME (LOSS) FROM INVESTMENT OPERATIONS: | | | | | |
| | | | | |
Net realized and unrealized gain (loss) | | | | | |
Total from Investment Operations | | | | | |
| | | | | |
| | | | | |
Net realized capital gains | | | | | |
| | | | | |
Net asset value, end of the period | | | | | |
| | | | | |
RATIOS TO AVERAGE NET ASSETS: | | | | | |
Net assets, end of the period (000's) | | | | | |
| | | | | |
| | | | | |
| | | | | |
| | | | | |
| Per share net investment loss has been calculated using the average shares outstanding during the period. |
| Amount rounds to less than $0.01 per share. |
| Had certain expenses not been waived/reimbursed during the period, total returns would have been lower. |
| The investment adviser agreed to waive its fees and/or reimburse a portion of the Fund’s expenses during the period. Without this waiver/reimbursement, expenses would have been higher. |
| Includes interest expense. Without this expense the ratio of net expenses would have been 0.90% and the ratio of gross expenses would have been 1.05%. |
| Effective December 15, 2020, the expense limit decreased from 0.95% to 0.90%. |
See accompanying notes to financial statements.
Financial Highlights (continued)
For a share outstanding throughout each period.
| Loomis Sayles Global Growth Fund—Class Y |
| Year Ended
November 30,
2024 | Year Ended
November 30,
2023 | Year Ended
November 30,
2022 | Year Ended
November 30,
2021 | Year Ended
November 30,
2020 |
Net asset value, beginning of the period | | | | | |
INCOME (LOSS) FROM INVESTMENT OPERATIONS: | | | | | |
| | | | | |
Net realized and unrealized gain (loss) | | | | | |
Total from Investment Operations | | | | | |
| | | | | |
| | | | | |
Net realized capital gains | | | | | |
| | | | | |
Net asset value, end of the period | | | | | |
| | | | | |
RATIOS TO AVERAGE NET ASSETS: | | | | | |
Net assets, end of the period (000's) | | | | | |
| | | | | |
| | | | | |
| | | | | |
| | | | | |
| Per share net investment loss has been calculated using the average shares outstanding during the period. |
| Had certain expenses not been waived/reimbursed during the period, total returns would have been lower. |
| The investment adviser agreed to waive its fees and/or reimburse a portion of the Fund’s expenses during the period. Without this waiver/reimbursement, expenses would have been higher. |
| Includes interest expense. Without this expense the ratio of net expenses would have been 0.95% and the ratio of gross expenses would have been 1.13%. |
| Effective December 15, 2020, the expense limit decreased from 1.00% to 0.95%. |
See accompanying notes to financial statements.
Financial Highlights (continued)
For a share outstanding throughout each period.
| Loomis Sayles Senior Floating Rate and Fixed Income Fund—Class A |
| Year Ended
November 30,
2024 | Year Ended
November 30,
2023 | Year Ended
November 30,
2022 | Year Ended
November 30,
2021 | Year Ended
November 30,
2020 |
Net asset value, beginning of the period | | | | | |
INCOME (LOSS) FROM INVESTMENT OPERATIONS: | | | | | |
| | | | | |
Net realized and unrealized gain (loss) | | | | | |
Total from Investment Operations | | | | | |
| | | | | |
| | | | | |
Net asset value, end of the period | | | | | |
| | | | | |
RATIOS TO AVERAGE NET ASSETS: | | | | | |
Net assets, end of the period (000's) | | | | | |
| | | | | |
| | | | | |
| | | | | |
| | | | | |
| Per share net investment income has been calculated using the average shares outstanding during the period. |
| A sales charge for Class A shares is not reflected in total return calculations. |
| Had certain expenses not been waived/reimbursed during the period, total returns would have been lower. |
| The investment adviser agreed to waive its fees and/or reimburse a portion of the Fund’s expenses during the period. Without this waiver/reimbursement, expenses would have been higher. |
| Effective July 1, 2024, the expense limit decreased from 1.00% to 0.98%. See Note 5 of Notes to Financial Statements. |
| Effective July 1, 2023, the expense limit decreased from 1.05% to 1.00%. |
| Includes interest expense. Without this expense the ratio of net expenses would have been 1.05% and the ratio of gross expenses would have been 1.18%. |
See accompanying notes to financial statements.
Financial Highlights (continued)
For a share outstanding throughout each period.
| Loomis Sayles Senior Floating Rate and Fixed Income Fund—Class C |
| Year Ended
November 30,
2024 | Year Ended
November 30,
2023 | Year Ended
November 30,
2022 | Year Ended
November 30,
2021 | Year Ended
November 30,
2020 |
Net asset value, beginning of the period | | | | | |
INCOME (LOSS) FROM INVESTMENT OPERATIONS: | | | | | |
| | | | | |
Net realized and unrealized gain (loss) | | | | | |
Total from Investment Operations | | | | | |
| | | | | |
| | | | | |
Net asset value, end of the period | | | | | |
| | | | | |
RATIOS TO AVERAGE NET ASSETS: | | | | | |
Net assets, end of the period (000's) | | | | | |
| | | | | |
| | | | | |
| | | | | |
| | | | | |
| Per share net investment income has been calculated using the average shares outstanding during the period. |
| A contingent deferred sales charge for Class C shares is not reflected in total return calculations. |
| Had certain expenses not been waived/reimbursed during the period, total returns would have been lower. |
| The investment adviser agreed to waive its fees and/or reimburse a portion of the Fund’s expenses during the period. Without this waiver/reimbursement, expenses would have been higher. |
| Effective July 1, 2024, the expense limit decreased from 1.75% to 1.73%. See Note 5 of Notes to Financial Statements. |
| Effective July 1, 2023, the expense limit decreased from 1.80% to 1.75%. |
| Includes interest expense. Without this expense the ratio of net expenses would have been 1.80% and the ratio of gross expenses would have been 1.93%. |
See accompanying notes to financial statements.
Financial Highlights (continued)
For a share outstanding throughout each period.
| Loomis Sayles Senior Floating Rate and Fixed Income Fund—Class N |
| Year Ended
November 30,
2024 | Year Ended
November 30,
2023 | Year Ended
November 30,
2022 | Year Ended
November 30,
2021 | Year Ended
November 30,
2020 |
Net asset value, beginning of the period | | | | | |
INCOME (LOSS) FROM INVESTMENT OPERATIONS: | | | | | |
| | | | | |
Net realized and unrealized gain (loss) | | | | | |
Total from Investment Operations | | | | | |
| | | | | |
| | | | | |
Net asset value, end of the period | | | | | |
| | | | | |
RATIOS TO AVERAGE NET ASSETS: | | | | | |
Net assets, end of the period (000's) | | | | | |
| | | | | |
| | | | | |
| | | | | |
| | | | | |
| Per share net investment income has been calculated using the average shares outstanding during the period. |
| Had certain expenses not been waived/reimbursed during the period, total returns would have been lower. |
| The investment adviser agreed to waive its fees and/or reimburse a portion of the Fund’s expenses during the period. Without this waiver/reimbursement, expenses would have been higher. |
| Effective July 1, 2024, the expense limit decreased from 0.70% to 0.68%. See Note 5 of Notes to Financial Statements. |
| Effective July 1, 2023, the expense limit decreased from 0.75% to 0.70%. |
| Includes interest expense. Without this expense the ratio of net expenses would have been 0.75% and the ratio of gross expenses would have been 1.22%. |
See accompanying notes to financial statements.
Financial Highlights (continued)
For a share outstanding throughout each period.
| Loomis Sayles Senior Floating Rate and Fixed Income Fund—Class Y |
| Year Ended
November 30,
2024 | Year Ended
November 30,
2023 | Year Ended
November 30,
2022 | Year Ended
November 30,
2021 | Year Ended
November 30,
2020 |
Net asset value, beginning of the period | | | | | |
INCOME (LOSS) FROM INVESTMENT OPERATIONS: | | | | | |
| | | | | |
Net realized and unrealized gain (loss) | | | | | |
Total from Investment Operations | | | | | |
| | | | | |
| | | | | |
Net asset value, end of the period | | | | | |
| | | | | |
RATIOS TO AVERAGE NET ASSETS: | | | | | |
Net assets, end of the period (000's) | | | | | |
| | | | | |
| | | | | |
| | | | | |
| | | | | |
| Per share net investment income has been calculated using the average shares outstanding during the period. |
| Had certain expenses not been waived/reimbursed during the period, total returns would have been lower. |
| The investment adviser agreed to waive its fees and/or reimburse a portion of the Fund’s expenses during the period. Without this waiver/reimbursement, expenses would have been higher. |
| Effective July 1, 2024, the expense limit decreased from 0.75% to 0.73%. See Note 5 of Notes to Financial Statements. |
| Effective July 1, 2023, the expense limit decreased from 0.80% to 0.75%. |
| Includes interest expense. Without this expense the ratio of net expenses would have been 0.80% and the ratio of gross expenses would have been 0.93%. |
See accompanying notes to financial statements.
Financial Highlights (continued)
For a share outstanding throughout each period.
| Vaughan Nelson Select Fund—Class A |
| Year Ended
November 30,
2024 | Year Ended
November 30,
2023 | Year Ended
November 30,
2022 | Year Ended
November 30,
2021 | Year Ended
November 30,
2020 |
Net asset value, beginning of the period | | | | | |
INCOME (LOSS) FROM INVESTMENT OPERATIONS: | | | | | |
Net investment income (loss)(a) | | | | | |
Net realized and unrealized gain (loss) | | | | | |
Total from Investment Operations | | | | | |
| | | | | |
| | | | | |
Net realized capital gains | | | | | |
| | | | | |
Net asset value, end of the period | | | | | |
| | | | | |
RATIOS TO AVERAGE NET ASSETS: | | | | | |
Net assets, end of the period (000's) | | | | | |
| | | | | |
| | | | | |
Net investment income (loss) | | | | | |
| | | | | |
| Per share net investment income (loss) has been calculated using the average shares outstanding during the period. |
| Amount rounds to less than $0.01 per share. |
| Includes a non-recurring dividend. Without this dividend, net investment loss per share would have been $(0.06), total return would have been 40.82% and the ratio of net investment loss to average net assets would have been (0.25)%. |
| A sales charge for Class A shares is not reflected in total return calculations. |
| Had certain expenses not been waived/reimbursed during the period, total returns would have been lower. |
| The investment adviser agreed to waive its fees and/or reimburse a portion of the Fund’s expenses during the period. Without this waiver/reimbursement, expenses would have been higher. |
| Includes additional voluntary waiver of advisory fee of 0.01%. |
| Effective July 1, 2021, the expense limit decreased from 1.15% to 1.10%. |
| Includes additional voluntary waiver of advisory fee of 0.03%. |
See accompanying notes to financial statements.
Financial Highlights (continued)
For a share outstanding throughout each period.
| Vaughan Nelson Select Fund—Class C |
| Year Ended
November 30,
2024 | Year Ended
November 30,
2023 | Year Ended
November 30,
2022 | Year Ended
November 30,
2021 | Year Ended
November 30,
2020 |
Net asset value, beginning of the period | | | | | |
INCOME (LOSS) FROM INVESTMENT OPERATIONS: | | | | | |
| | | | | |
Net realized and unrealized gain (loss) | | | | | |
Total from Investment Operations | | | | | |
| | | | | |
Net realized capital gains | | | | | |
Net asset value, end of the period | | | | | |
| | | | | |
RATIOS TO AVERAGE NET ASSETS: | | | | | |
Net assets, end of the period (000's) | | | | | |
| | | | | |
| | | | | |
| | | | | |
| | | | | |
| Per share net investment loss has been calculated using the average shares outstanding during the period. |
| Includes a non-recurring dividend. Without this dividend, net investment loss per share would have been $(0.21), total return would have been 39.76% and the ratio of net investment loss to average net assets would have been (1.00)%. |
| A contingent deferred sales charge for Class C shares is not reflected in total return calculations. |
| Had certain expenses not been waived/reimbursed during the period, total returns would have been lower. |
| The investment adviser agreed to waive its fees and/or reimburse a portion of the Fund’s expenses during the period. Without this waiver/reimbursement, expenses would have been higher. |
| Includes additional voluntary waiver of advisory fee of 0.01%. |
| Effective July 1, 2021, the expense limit decreased from 1.90% to 1.85%. |
| Includes additional voluntary waiver of advisory fee of 0.03%. |
See accompanying notes to financial statements.
Financial Highlights (continued)
For a share outstanding throughout each period.
| Vaughan Nelson Select Fund—Class N |
| Year Ended
November 30,
2024 | Year Ended
November 30,
2023 | Year Ended
November 30,
2022 | Year Ended
November 30,
2021 | Year Ended
November 30,
2020 |
Net asset value, beginning of the period | | | | | |
INCOME (LOSS) FROM INVESTMENT OPERATIONS: | | | | | |
Net investment income (loss)(a) | | | | | |
Net realized and unrealized gain (loss) | | | | | |
Total from Investment Operations | | | | | |
| | | | | |
| | | | | |
Net realized capital gains | | | | | |
| | | | | |
Net asset value, end of the period | | | | | |
| | | | | |
RATIOS TO AVERAGE NET ASSETS: | | | | | |
Net assets, end of the period (000's) | | | | | |
| | | | | |
| | | | | |
Net investment income (loss) | | | | | |
| | | | | |
| Per share net investment income (loss) has been calculated using the average shares outstanding during the period. |
| Includes a non-recurring dividend. Without this dividend, net investment income per share would have been $0.01, total return would have been 41.24% and the ratio of net investment income to average net assets would have been 0.02%. |
| Had certain expenses not been waived/reimbursed during the period, total returns would have been lower. |
| The investment adviser agreed to waive its fees and/or reimburse a portion of the Fund’s expenses during the period. Without this waiver/reimbursement, expenses would have been higher. |
| Effective July 1, 2021, the expense limit decreased from 0.85% to 0.80%. |
See accompanying notes to financial statements.
Financial Highlights (continued)
For a share outstanding throughout each period.
| Vaughan Nelson Select Fund—Class Y |
| Year Ended
November 30,
2024 | Year Ended
November 30,
2023 | Year Ended
November 30,
2022 | Year Ended
November 30,
2021 | Year Ended
November 30,
2020 |
Net asset value, beginning of the period | | | | | |
INCOME (LOSS) FROM INVESTMENT OPERATIONS: | | | | | |
Net investment income (loss)(a) | | | | | |
Net realized and unrealized gain (loss) | | | | | |
Total from Investment Operations | | | | | |
| | | | | |
| | | | | |
Net realized capital gains | | | | | |
| | | | | |
Net asset value, end of the period | | | | | |
| | | | | |
RATIOS TO AVERAGE NET ASSETS: | | | | | |
Net assets, end of the period (000's) | | | | | |
| | | | | |
| | | | | |
Net investment income (loss) | | | | | |
| | | | | |
| Per share net investment income (loss) has been calculated using the average shares outstanding during the period. |
| Includes a non-recurring dividend. Without this dividend, net investment loss per share would have been less than $(0.01), total return would have been 41.17% and the ratio of net investment loss to average net assets would have been less than (0.01)%. |
| Had certain expenses not been waived/reimbursed during the period, total returns would have been lower. |
| The investment adviser agreed to waive its fees and/or reimburse a portion of the Fund’s expenses during the period. Without this waiver/reimbursement, expenses would have been higher. |
| Includes additional voluntary waiver of advisory fee of 0.01%. |
| Effective July 1, 2021, the expense limit decreased from 0.90% to 0.85%. |
| Includes additional voluntary waiver of advisory fee of 0.03%. |
See accompanying notes to financial statements.
Notes to Financial Statements
1.Organization. Natixis Funds Trust II (the “Trust”) is organized as a Massachusetts business trust. The Trust is registered under the Investment Company Act of 1940, as amended (the “1940 Act”), as an open-end management investment company. The Declaration of Trust permits the Board of Trustees to authorize the issuance of an unlimited number of shares of the Trust in multiple series. The financial statements for certain funds of the Trust are presented in separate reports. The following funds (individually, a “Fund” and collectively, the “Funds”) are included in this report:
Loomis Sayles Global Growth Fund (“Global Growth Fund”)
Loomis Sayles Senior Floating Rate and Fixed Income Fund (“Senior Floating Rate and Fixed Income Fund”)
Vaughan Nelson Select Fund (“Select Fund”)
Global Growth Fund and Senior Floating Rate and Fixed Income Fund are diversified investment companies. Select Fund is a non-diversified investment company.
Each Fund offers Class A, Class C, Class N and Class Y shares. Class A shares are sold with a maximum front-end sales charge of 5.75% for Global Growth Fund and Select Fund and 3.50% for Senior Floating Rate and Fixed Income Fund. Class C shares do not pay a front-end sales charge, pay higher Rule 12b-1 fees than Class A shares for eight years (at which point they automatically convert to Class A shares) (prior to May 1, 2021, Class C shares automatically converted to Class A shares after ten years) and may be subject to a contingent deferred sales charge (“CDSC”) of 1.00% if those shares are redeemed within one year of acquisition, except for reinvested distributions. Class N and Class Y shares do not pay a front-end sales charge, a CDSC or Rule 12b-1 fees. Class N shares are offered with an initial minimum investment of $1,000,000. Class Y shares are offered with an initial minimum investment of $100,000. Certain categories of investors are exempted from the minimum investment amounts for Class N and Class Y as outlined in the relevant Fund’s prospectus.
Most expenses can be directly attributed to a Fund. Expenses which cannot be directly attributed to a Fund are generally apportioned based on the relative net assets of each of the Funds in Natixis Funds Trust I, Natixis Funds Trust II, Natixis Funds Trust IV and Gateway Trust (“Natixis Funds Trusts”), Loomis Sayles Funds I and Loomis Sayles Funds II (“Loomis Sayles Funds Trusts”) and Natixis ETF Trust and Natixis ETF Trust II (“Natixis ETF Trusts”). Expenses of a Fund are borne pro rata by the holders of each class of shares, except that each class bears expenses unique to that class (such as the Rule 12b-1 fees applicable to Class A and Class C), and transfer agent fees are borne collectively for Class A, Class C and Class Y, and individually for Class N. In addition, each class votes as a class only with respect to its own Rule 12b-1 Plan. Shares of each class would receive their pro rata share of the net assets of a Fund if the Fund were liquidated. The Trustees approve separate distributions from net investment income on each class of shares.
2.Significant Accounting Policies. The following is a summary of significant accounting policies consistently followed by each Fund in the preparation of its financial statements. The Funds' financial statements follow the accounting and reporting guidelines provided for investment companies and are prepared in accordance with accounting principles generally accepted in the United States of America which require the use of management estimates that affect the reported amounts and disclosures in the financial statements. Actual results could differ from those estimates. Management has evaluated the events and transactions subsequent to year-end through the date the financial statements were issued and has determined that there were no material events that would require disclosure in the Funds' financial statements.
a. Valuation. Registered investment companies are required to value portfolio investments using an unadjusted, readily available market quotation. Each Fund obtains readily available market quotations from independent pricing services. Fund investments for which readily available market quotations are not available are priced at fair value pursuant to the Funds’ Valuation Procedures. The Board of Trustees has approved a valuation designee who is subject to the Board’s oversight.
Unadjusted readily available market quotations that are utilized for exchange traded equity securities (including shares of closed-end investment companies and exchange-traded funds) include the last sale price quoted on the exchange where the security is traded most extensively. Shares of open-end investment companies are valued at net asset value ("NAV") per share.
Exchange traded equity securities for which there is no reported sale during the day are fair valued at the closing bid quotation as reported by an independent pricing service. Unlisted equity securities (except unlisted preferred equity securities) are fair valued at the last sale price quoted in the market where they are traded most extensively or, if there is no reported sale during the day, the closing bid quotation as reported by an independent pricing service. If there is no last sale price or closing bid quotation available, unlisted equity securities will be fair valued using evaluated bids furnished by an independent pricing service, if available.
Debt securities and unlisted preferred equity securities are fair valued based on evaluated bids furnished to the Funds by an independent pricing service or bid prices obtained from broker-dealers. Senior loans and collateralized loan obligations ("CLOs") are fair valued at bid prices supplied by an independent pricing service, if available. Broker-dealer bid prices may be used to fair value
Notes to Financial Statements (continued)
debt, unlisted equities, senior loans and CLOs where an independent pricing service is unable to price an investment or where an independent pricing service does not provide a reliable price for the investment.
The Funds may also fair value investments in other circumstances such as when extraordinary events occur after the close of a foreign market, but prior to the close of the New York Stock Exchange. This may include situations relating to a single issuer (such as a declaration of bankruptcy or a delisting of the issuer’s security from the primary market on which it has traded) as well as events affecting the securities markets in general (such as market disruptions or closings and significant fluctuations in U.S. and/or foreign markets). When fair valuing a Fund’s investments, the valuation designee may, among other things, use modeling tools or other processes that may take into account factors such as issuer specific information, or other related market activity and/or information that occurred after the close of the foreign market but before the time the Fund’s NAV is calculated. Fair valuation by the Fund(s) valuation designee may require subjective determinations about the value of the investment, and fair values used to determine a Fund’s NAV may differ from quoted or published prices, or from prices that are used by others, for the same investments. In addition, the use of fair value pricing may not always result in adjustments to the prices of investments held by a Fund.
b. Investment Transactions and Related Investment Income. Investment transactions are accounted for on a trade date plus one day basis for daily NAV calculation. However, for financial reporting purposes, investment transactions are reported on trade date. Dividend income (including income reinvested) and foreign withholding tax, if applicable, are recorded on the ex-dividend date, or in the case of certain foreign securities, as soon as a Fund is notified, and interest income is recorded on an accrual basis. Dividends reinvested and stock dividends are reflected as non-cash dividends on the Statements of Operations. Loan consent fees, upfront origination fees and/or amendment fees are recorded when received and included in interest income on the Statements of Operations. Interest income is increased by the accretion of discount and decreased by the amortization of premium, if applicable. For securities with paydown provisions, principal payments received are treated as a proportionate reduction to the cost basis of the securities, and excess or shortfall amounts are recorded as income. For payment-in-kind securities, income received in-kind is reflected as an increase to the principal and cost basis of the securities. In determining net gain or loss on securities sold, the cost of securities has been determined on an identified cost basis. Investment income, non-class specific expenses and realized and unrealized gains and losses are allocated on a pro rata basis to each class based on the relative net assets of each class to the total net assets of the Fund.
c. Foreign Currency Translation. The books and records of the Funds are maintained in U.S. dollars. The values of securities, currencies and other assets and liabilities denominated in currencies other than U.S. dollars, if any, are translated into U.S. dollars based upon foreign exchange rates prevailing at the end of the period. Purchases and sales of investment securities, income and expenses are translated into U.S. dollars on the respective dates of such transactions.
Net realized foreign exchange gains or losses arise from sales of foreign currency, changes in exchange rates between the trade and settlement dates on securities transactions and the difference between the amounts of dividends, interest and foreign withholding taxes recorded in the Funds’ books and records and the U.S. dollar equivalent of the amounts actually received or paid. Net unrealized foreign exchange gains or losses arise from changes in the value of assets and liabilities, other than investment securities, as of the end of the fiscal period, resulting from changes in exchange rates. Net realized foreign exchange gains or losses and the net change in unrealized foreign exchange gains or losses are disclosed in the Statements of Operations. For federal income tax purposes, net realized foreign exchange gains or losses are characterized as ordinary income, and may, if the Funds have net losses, reduce the amount of income available to be distributed by the Funds.
The values of investment securities are presented at the foreign exchange rates prevailing at the end of the period for financial reporting purposes. Net realized and unrealized gains or losses on investments reported in the Statements of Operations reflect gains or losses resulting from changes in exchange rates and fluctuations which arise due to changes in market prices of investment securities. For federal income tax purposes, a portion of the net realized gain or loss on investments arising from changes in exchange rates, which is reflected in the Statements of Operations, may be characterized as ordinary income and may, if the Funds have net losses, reduce the amount of income available to be distributed by the Funds.
The Funds may use foreign currency exchange contracts to facilitate transactions in foreign-denominated investments. Losses may arise from changes in the value of the foreign currency or if the counterparties do not perform under the contracts’ terms.
d. Federal and Foreign Income Taxes. The Trust treats each Fund as a separate entity for federal income tax purposes. Each Fund intends to meet the requirements of the Internal Revenue Code of 1986, as amended, applicable to regulated investment companies, and to distribute to its shareholders substantially all of its net investment income and any net realized capital gains at least annually. Management has performed an analysis of each Fund’s tax positions for the open tax years as of November 30, 2024 and has concluded that no provisions for income tax are required. The Funds’ federal tax returns for the prior three fiscal years remain subject to examination by the Internal Revenue Service. Management is not aware of any events that are reasonably possible to occur in the next twelve months that would result in the amounts of any unrecognized tax benefits significantly increasing or decreasing for the
Notes to Financial Statements (continued)
Funds. However, management’s conclusions regarding tax positions taken may be subject to review and adjustment at a later date based on factors including, but not limited to, new tax laws and accounting regulations and interpretations thereof.
A Fund may be subject to foreign withholding taxes on investment income and taxes on capital gains on investments that are accrued and paid based upon the Fund’s understanding of the tax rules and regulations that exist in the countries in which the Fund invests. Foreign withholding taxes on dividend and interest income are reflected on the Statements of Operations as a reduction of investment income, net of amounts that have been or are expected to be reclaimed and paid. Dividends and interest receivable on the Statements of Assets and Liabilities are net of foreign withholding taxes. Foreign withholding taxes where reclaims have been or are expected to be filed and paid are reflected on the Statements of Assets and Liabilities as tax reclaims receivable. Capital gains taxes paid are included in net realized gain (loss) on investments in the Statements of Operations. Accrued but unpaid capital gains taxes are reflected as foreign taxes payable on the Statements of Assets and Liabilities, if applicable, and reduce unrealized gains on investments. In the event that realized gains on investments are subsequently offset by realized losses, taxes paid on realized gains may be returned to a Fund. Such amounts, if applicable, are reflected as foreign tax rebates receivable on the Statements of Assets and Liabilities and are recorded as a realized gain when received.
e. Dividends and Distributions to Shareholders. Dividends and distributions are recorded on the ex-dividend date. The timing and characterization of certain income and capital gain distributions are determined annually in accordance with federal tax regulations, which may differ from accounting principles generally accepted in the United States of America. When the Fund identifies the character of distributions paid by REITs in the previous calendar year, certain distributions to Fund shareholders may be redesignated as capital gain distributions or, if in excess of taxable income, as a return of capital. Permanent differences are primarily due to differing treatments for book and tax purposes of items such as foreign currency gains and losses, premium amortization, corporate actions, defaulted and/or non-income producing securities, distributions in excess of income and/or capital gain, return of capital distributions received, paydown gains and losses, capital gain distribution received and net operating losses. Permanent book and tax basis differences relating to shareholder distributions, net investment income, and net realized gains will result in reclassifications to the capital accounts reported on the Statements of Assets and Liabilities. Temporary differences between book and tax distributable earnings are primarily due to deferred Trustees’ fees, passive foreign investment company adjustments, premium amortization, corporate actions, dividends payable, capital gain distribution received, return of capital distributions received, defaulted and/or non-income producing securities and wash sales. Amounts of income and capital gain available to be distributed on a tax basis are determined annually, and at other times during the Fund’s fiscal year as may be necessary to avoid knowingly declaring and paying a return of capital distribution. Distributions from net investment income and short-term capital gains are considered to be distributed from ordinary income for tax purposes.
The tax characterization of distributions is determined on an annual basis. The tax character of distributions paid to shareholders during the years ended November 30, 2024 and 2023 was as follows:
| | |
| | | | | | |
| | | | | | |
Senior Floating Rate and Fixed Income Fund | | | | | | |
| | | | | | |
Distributions paid to shareholders from net investment income and net realized capital gains, based on accounting principles generally accepted in the United States of America, are consolidated and reported on the Statements of Changes in Net Assets as Distributions to Shareholders. Distributions paid to shareholders from net investment income and net realized capital gains expressed in per-share amounts, based on accounting principles generally accepted in the United States of America, are separately stated and reported within the Financial Highlights.
Notes to Financial Statements (continued)
As of November 30, 2024, the components of distributable earnings on a tax basis were as follows:
| | Senior
Floating Rate
and Fixed
Income Fund | |
Undistributed ordinary income | | | |
Capital loss carryforward: | | | |
| | | |
| | | |
| | | |
| | | |
Total capital loss carryforward | | | |
Late-year ordinary and post-October
| | | |
Unrealized appreciation (depreciation) | | | |
Total accumulated earnings (losses) | | | |
| Under current tax law, net operating losses, capital losses, foreign currency losses, and losses on passive foreign investment companies and contingent payment debt instruments after October 31 or December 31, as applicable, may be deferred and treated as occurring on the first day of the following taxable year. Global Growth Fund and Select Fund are deferring net operating losses. |
As of November 30, 2024, the tax cost of investments (including derivatives, if applicable) and unrealized appreciation (depreciation) on a federal tax basis were as follows:
| | Senior
Floating Rate
and Fixed
Income Fund | |
| | | |
| | | |
| | | |
Net tax appreciation (depreciation) | | | |
The difference between these amounts and those reported in the components of distributable earnings, if any, is primarily attributable to foreign currency mark-to-market.
f. Senior Loans. Senior Floating Rate and Fixed Income Fund may invest in senior loans to corporate, governmental or other borrowers. Senior loans, which include both secured and unsecured loans made by banks and other financial institutions to corporate customers, typically hold the most senior position in a borrower’s capital structure, may be secured by the borrower’s assets and have interest rates that reset frequently. Senior loans can include term loans, revolving credit facility loans and second lien loans. A senior loan is often administered by a bank or other financial institution that acts as agent for all holders. The agent administers the terms of the senior loan, as specified in the loan agreement. Large loans may be shared or syndicated among several lenders. The Fund may enter into the primary syndicate for a loan or it may also purchase all or a portion of loans from other lenders (sometimes referred to as loan assignments), in either case becoming a direct lender. The settlement period for senior loans is uncertain as there is no standardized settlement schedule applicable to such investments. Senior loans outstanding at the end of the period are listed in the Fund’s Portfolio of Investments.
g. Repurchase Agreements. Each Fund may enter into repurchase agreements, under the terms of a Master Repurchase Agreement, under which each Fund acquires securities as collateral and agrees to resell the securities at an agreed upon time and at an agreed upon price. It is each Fund’s policy that the market value of the collateral for repurchase agreements be at least equal to 102% of the repurchase price, including interest. Certain repurchase agreements are tri-party arrangements whereby the collateral is held in a segregated account for the benefit of the Fund and on behalf of the counterparty. Repurchase agreements could involve certain risks in the event of default or insolvency of the counterparty, including possible delays or restrictions upon a Fund’s ability to dispose of the underlying securities. As of November 30, 2024, each Fund, as applicable, had investments in repurchase agreements for which the
Notes to Financial Statements (continued)
value of the related collateral exceeded the value of the repurchase agreement. The gross value of repurchase agreements is included in the Statements of Assets and Liabilities for financial reporting purposes.
h. Unfunded Loan Commitments. Senior Floating Rate and Fixed Income Fund may enter into unfunded loan commitments, which are contractual obligations for future funding at the option of the borrower. Unfunded loan commitments represent a future obligation, in full, even though a percentage of the committed amount may not be utilized by the borrower. Unfunded loan commitments, and the obligation for future funding, are recorded as a liability on the Statements of Assets and Liabilities at par value at the time the commitment is entered into. Purchases of unfunded loan commitments may have a similar effect on the Fund's NAV as if the Fund had created a degree of leverage in the portfolio. Market risk exists with these commitments to the same extent as if the securities were owned on a settled basis. Losses may arise due to changes in the value of the unfunded loan commitments.
As of November 30, 2024, the Fund had unfunded loan commitments reflected on the Statements of Assets and Liabilities, which could be extended at the option of the borrower, pursuant to loan agreements with the following borrowers:
| | |
The Action Environmental Group, Inc. | 2024 Delayed Draw Term Loan | |
Focus Financial Partners LLC | 2024 Delayed Draw Term Loan | |
| 2024 Delayed Draw Term Loan | |
Raven Acquisition Holdings LLC | | |
| | |
Under the terms of the contract, the Fund has the option to assign (sell) all or a portion of the unfunded loan commitment. Upon the completion of such assignment, the Fund is released from its rights and obligations pertaining to the portion of the unfunded loan commitment assigned. When the Fund sells a portion of an unfunded loan commitment, the portion sold is removed from the Portfolio of Investments and the unsettled amount is reflected as unfunded loan commitments sold on the Statements of Assets and Liabilities until settlement date. Once settled, the portion of the unfunded loan commitment assigned is relieved from the Fund’s unfunded loan commitments liability.
i. Indemnifications. Under the Trust’s organizational documents, its officers and Trustees are indemnified against certain liabilities arising out of the performance of their duties to the Funds. Additionally, in the normal course of business, the Funds enter into contracts with service providers that contain general indemnification clauses. The Funds' maximum exposure under these arrangements is unknown as this would involve future claims that may be made against the Funds that have not yet occurred. However, based on experience, the Funds expect the risk of loss to be remote.
3.Fair Value Measurements. In accordance with accounting standards related to fair value measurements and disclosures, the Funds have categorized the inputs utilized in determining the value of each Fund’s assets or liabilities. These inputs are summarized in the three broad levels listed below:
• Level 1 — quoted prices in active markets for identical assets or liabilities;
• Level 2 — prices determined using other significant inputs that are observable either directly, or indirectly through corroboration with observable market data (which could include quoted prices for similar assets or liabilities, interest rates, credit risk, etc.); and
• Level 3 — prices determined using significant unobservable inputs when quoted prices or observable inputs are unavailable such as when there is little or no market activity for an asset or liability (unobservable inputs reflect each Fund’s own assumptions in determining the fair value of assets or liabilities and would be based on the best information available).
The inputs or methodology used for valuing securities are not necessarily an indication of the risk associated with investing in those securities.
The Funds' pricing policies have been approved by the Board of Trustees. Investments for which market quotations are readily available are categorized in Level 1. Other investments for which an independent pricing service is utilized are categorized in Level 2. Broker-dealer bid prices for which the Funds have knowledge of the inputs used by the broker-dealer are categorized in Level 2. All other investments, including broker-dealer bid prices for which the Funds do not have knowledge of the inputs used by the broker-dealer, as well as investments fair valued by the valuation designee, are categorized in Level 3. All Level 2 and 3 securities are defined as being fair valued.
Notes to Financial Statements (continued)
Under certain conditions and based upon specific facts and circumstances, the Fund’s valuation designee may determine that a fair valuation should be made for portfolio investment(s). These valuation designee fair valuations will be based upon a significant amount of Level 3 inputs.
The following is a summary of the inputs used to value the Funds' investments as of November 30, 2024, at value:
Senior Floating Rate and Fixed Income Fund |
|
| | | | |
| | | | |
| | | | |
All Other Senior Loans(a) | | | | |
| | | | |
| | | | |
Collateralized Loan Obligations | | | | |
| | | | |
| | | | |
| | | | |
Oil, Gas & Consumable Fuels | | | | |
Textiles, Apparel & Luxury Goods | | | | |
| | | | |
| | | | |
| | | | |
| | | | |
| Details of the major categories of the Fund’s investments are reflected within the Portfolio of Investments. |
Notes to Financial Statements (continued)
| Details of the major categories of the Fund’s investments are reflected within the Portfolio of Investments. |
The following is a reconciliation of Level 3 investments for which significant unobservable inputs were used to determine fair value as of November 30, 2023 and/or November 30, 2024:
Senior Floating Rate and Fixed Income Fund |
|
Investments in Securities | Balance as of
November 30,
2023 | Accrued
Discounts
(Premiums) | | Change in
Unrealized
Appreciation
(Depreciation) | | | | | Balance as of
November 30,
2024 | Change in
Unrealized
Appreciation
(Depreciation)
from
Investments
Still Held at
November 30,
2024 |
| | | | | | | | | | |
| | | | | | | | | | |
| | | | | | | | | | |
Oil, Gas & Consumable Fuels | | | | | | | | | | |
| | | | | | | | | | |
A debt security valued at $49,104 was transferred from Level 2 to Level 3 during the period ended November 30, 2024. At November 30, 2023, this security was fair valued at a bid price furnished to the Fund by an independent pricing service in accordance with the Fund's valuation policies. At November 30, 2024, this security was fair valued using broker-dealer bid prices based on inputs unobservable to the Fund as an independent pricing service was unable to price the security.
4.Purchases and Sales of Securities. For the year ended November 30, 2024, purchases and sales of securities (excluding short-term investments and including paydowns) were as follows:
| U.S. Government/
Agency Securities | |
| | | | |
| | | | |
Senior Floating Rate and Fixed Income Fund | | | | |
| | | | |
5.Management Fees and Other Transactions with Affiliates.
a. Management Fees. Loomis, Sayles & Company, L.P. (“Loomis Sayles”) serves as investment adviser to Global Growth Fund and Senior Floating Rate and Fixed Income Fund. Loomis Sayles is a limited partnership whose sole general partner, Loomis, Sayles & Company, Inc., is indirectly owned by Natixis Investment Managers, LLC ("Natixis"), which is part of Natixis Investment Managers, an international asset management group based in Paris, France.
Notes to Financial Statements (continued)
Under the terms of the management agreements, each Fund pays a management fee at the following annual rates, calculated daily and payable monthly, based on each Fund’s average daily net assets:
| Percentage of
Average Daily
Net Assets |
| |
Senior Floating Rate and Fixed Income Fund | |
Natixis Advisors, LLC (“Natixis Advisors”) serves as investment adviser to Select Fund. Natixis Advisors is a wholly-owned subsidiary of Natixis. Under the terms of the management agreement, the Fund pays a management fee at the annual rate of 0.70%, calculated daily and payable monthly, based on the Fund’s average daily net assets.
Natixis Advisors has entered into a subadvisory agreement with Vaughan Nelson Investment Management, L.P. (“Vaughan Nelson”). Under the terms of the subadvisory agreement, the Fund pays a subadvisory fee at the annual rate of 0.47%, calculated daily and payable monthly, based on the Fund’s average daily net assets. Payments to Natixis Advisors are reduced by the amount of payments to Vaughan Nelson.
Loomis Sayles and Natixis Advisors have given binding undertakings to the Funds to waive management fees and/or reimburse certain expenses to limit the Funds’ operating expenses, exclusive of acquired fund fees and expenses, brokerage expenses, interest expense, taxes, organizational and extraordinary expenses such as litigation and indemnification expenses. These undertakings are in effect until March 31, 2025, except for Senior Floating Rate and Fixed Income Fund which is in effect until March 31, 2026, may be terminated before then only with the consent of the Funds’ Board of Trustees, and are reevaluated on an annual basis. Management fees payable, as reflected on the Statements of Assets and Liabilities, is net of waivers and/or expense reimbursements, if any, pursuant to these undertakings. Waivers/reimbursements that exceed management fees payable are reflected on the Statements of Assets and Liabilities as receivable from investment adviser.
For the year ended November 30, 2024, the expense limits as a percentage of average daily net assets under the expense limitation agreements were as follows:
| Expense Limit as a Percentage of
Average Daily Net Assets |
| | | | |
| | | | |
Senior Floating Rate and Fixed Income Fund | | | | |
| | | | |
Prior to July 1, 2024, the expense limits as a percentage of average daily net assets under the expense limitation agreements for Senior Floating Rate and Fixed Income Fund were as follows:
| Expense Limit as a Percentage of
Average Daily Net Assets |
| | | | |
Senior Floating Rate and Fixed Income Fund | | | | |
Loomis Sayles and Natixis Advisors shall be permitted to recover expenses borne under the expense limitation agreements (whether through waiver of management fees or otherwise) on a class by class basis in later periods to the extent the annual operating expenses of a class fall below both (1) a class’ expense limitation ratio in place at the time such amounts were waived/reimbursed and (2) a class’ current applicable expense limitation ratio, provided, however, that a class is not obligated to pay such waived/reimbursed fees or expenses more than one year after the end of the fiscal year in which the fees or expenses were waived/reimbursed.
Notes to Financial Statements (continued)
For the year ended November 30, 2024, the management fees and waivers of management fees for each Fund were as follows:
| | Contractual
Waivers of
Management
| | Percentage of
Average
Daily Net Assets |
| | |
| | | | | |
Senior Floating Rate and Fixed Income Fund | | | | | |
| | | | | |
| Contractual management fee waivers are subject to possible recovery until November 30, 2025. |
For the year ended November 30, 2024, expense reimbursements related to the prior fiscal year were recovered as follows:
b. Service and Distribution Fees. Natixis Distribution, LLC (“Natixis Distribution”), which is a wholly-owned subsidiary of Natixis Investment Managers, LLC, has entered into a distribution agreement with the Trust. Pursuant to this agreement, Natixis Distribution serves as principal underwriter of the Funds of the Trust.
Pursuant to Rule 12b-1 under the 1940 Act, the Trust has adopted a Service Plan relating to the Fund’s Class A shares (the “Class A Plans”) and a Distribution and Service Plan relating to the Fund’s Class C shares (the “Class C Plans”).
Under the Class A Plans, each Fund pays Natixis Distribution a monthly service fee at an annual rate not to exceed 0.25% of the average daily net assets attributable to the Fund’s Class A shares, as reimbursement for expenses incurred by Natixis Distribution in providing personal services to investors in Class A shares and/or the maintenance of shareholder accounts.
Under the Class C Plans, each Fund pays Natixis Distribution a monthly service fee at an annual rate not to exceed 0.25% of the average daily net assets attributable to the Fund’s Class C shares, as compensation for services provided by Natixis Distribution in providing personal services to investors in Class C shares and/or the maintenance of shareholder accounts.
Also under the Class C Plans, each Fund pays Natixis Distribution a monthly distribution fee at the annual rate of 0.75% of the average daily net assets attributable to the Fund’s Class C shares, as compensation for services provided by Natixis Distribution in connection with the marketing or sale of Class C shares.
For the year ended November 30, 2024, the service and distribution fees for each Fund were as follows:
| | | |
| | | | |
| | | | |
Senior Floating Rate and Fixed Income Fund | | | | |
| | | | |
c. Administrative Fees. Natixis Advisors provides certain administrative services for the Funds and contracts with State Street Bank and Trust Company (“State Street Bank”) to serve as sub-administrator. Pursuant to an agreement among Natixis Funds Trusts, Loomis Sayles Funds Trusts, Natixis ETF Trusts and Natixis Advisors, each Fund pays Natixis Advisors monthly its pro rata portion of fees equal to an annual rate of 0.0540% of the first $15 billion of the average daily net assets of the Natixis Funds Trusts, Loomis Sayles Funds Trusts and Natixis ETF Trusts, 0.0500% of the next $15 billion, 0.0400% of the next $30 billion, 0.0275% of the next $30 billion and 0.0225% of such assets in excess of $90 billion, subject to an annual aggregate minimum fee for the Natixis Funds Trusts, Loomis Sayles Funds Trusts and Natixis ETF Trusts of $10 million, which is reevaluated on an annual basis.
For the year ended November 30, 2024, the administrative fees for each Fund were as follows:
| |
| |
Senior Floating Rate and Fixed Income Fund | |
| |
Notes to Financial Statements (continued)
d. Sub-Transfer Agent Fees. Natixis Distribution has entered into agreements, which include servicing agreements, with financial intermediaries that provide recordkeeping, processing, shareholder communications and other services to customers of the intermediaries that hold positions in the Funds and has agreed to compensate the intermediaries for providing those services. Intermediaries transact with the Funds primarily through the use of omnibus accounts on behalf of their customers who hold positions in the Funds. These services would have been provided by the Funds’ transfer agent and other service providers if the shareholders’ accounts were maintained directly at the Funds’ transfer agent. Accordingly, the Funds have agreed to reimburse Natixis Distribution for all or a portion of the servicing fees paid to these intermediaries. The reimbursement amounts (sub-transfer agent fees) paid to Natixis Distribution are subject to a current per-account equivalent fee limit approved by the Funds’ Board of Trustees, which is based on fees for similar services paid to the Funds’ transfer agent and other service providers. Class N shares do not bear such expenses.
For the year ended November 30, 2024, the sub-transfer agent fees (which are reflected in transfer agent fees and expenses in the Statements of Operations) for each Fund were as follows:
| |
| |
Senior Floating Rate and Fixed Income Fund | |
| |
As of November 30, 2024, the Funds owe Natixis Distribution the following reimbursements for sub-transfer agent fees (which are reflected in the Statements of Assets and Liabilities as payable to distributor):
| Reimbursements
of Sub-Transfer
Agent Fees |
| |
Senior Floating Rate and Fixed Income Fund | |
| |
Sub-transfer agent fees attributable to Class A, Class C and Class Y are allocated on a pro rata basis to each class based on the relative net assets of each class to the total net assets of those classes.
e. Commissions. Commissions (including CDSCs) on Fund shares retained by Natixis Distribution during the year ended November 30, 2024 were as follows:
| |
| |
Senior Floating Rate and Fixed Income Fund | |
| |
f. Trustees Fees and Expenses. The Trust does not pay any compensation directly to its officers or Trustees who are directors, officers or employees of Natixis Advisors, Natixis Distribution, Natixis Investment Managers, LLC or their affiliates. The Chairperson of the Board of Trustees receives a retainer fee at the annual rate of $400,000. The Chairperson does not receive any meeting attendance fees for Board of Trustees meetings or committee meetings that he attends. Each Independent Trustee (other than the Chairperson) receives, in the aggregate, a retainer fee at the annual rate of $225,000. Each Independent Trustee also receives a meeting attendance fee of $10,000 for each meeting of the Board of Trustees that he or she attends in person and $5,000 for each meeting of the Board of Trustees that he or she attends telephonically. In addition, the Chairperson of the Contract Review Committee and the Chairperson of the Audit Committee each receive an additional retainer fee at the annual rate of $25,000. The Chairperson of the Governance Committee receives an additional retainer fee at the annual rate of $20,000. Each Contract Review Committee member is compensated $6,000 for each Committee meeting that he or she attends in person and $3,000 for each meeting that he or she attends telephonically. Each Audit Committee member is compensated $6,000 for each Committee meeting that he or she attends in person and $3,000 for each meeting that he or she attends telephonically. Each Governance Committee member is compensated $2,500 for each Committee meeting that he or she attends. These fees are allocated among the funds in the Natixis Funds Trusts, Loomis Sayles Funds Trusts and Natixis ETF Trusts based on a formula that takes into account, among other factors, the relative net assets of each fund. Trustees are reimbursed for travel expenses in connection with attendance at meetings.
Prior to January 1, 2024, the Chairperson of the Board of Trustees received a retainer fee at the annual rate of $369,000 and each Independent Trustee (other than the Chairperson) received, in the aggregate, a retainer fee at the annual rate of $210,000. Each
Notes to Financial Statements (continued)
Independent Trustee received a meeting attendance fee of $10,000 for each meeting of the Board of Trustees that he or she attended in person. The Chairperson of the Contract Review Committee and the Chairperson of the Audit Committee each received an additional retainer fee at the annual rate of $20,000. All other Trustees fees remained unchanged.
Effective January 1, 2025, the Chairperson of the Board of Trustees will receive a retainer fee at the annual rate of $410,000 and each Independent Trustee (other than the Chairperson) will receive, in the aggregate, a retainer fee at the annual rate of $235,000. The Chairperson of the Contract Review Committee and the Chairperson of the Audit Committee each will receive an additional retainer fee at the annual rate of $30,000. All other Trustees fees will remain unchanged.
A deferred compensation plan (the “Plan”) is available to the Trustees on a voluntary basis. The value of a participating Trustee’s deferral account is based on theoretical investments of deferred amounts, on the normal payment dates, in certain funds of the Natixis Funds Trusts, Loomis Sayles Funds Trusts and Natixis ETF Trusts as designated by the participating Trustees. Changes in the value of participants’ deferral accounts are allocated pro rata among the funds in the Natixis Funds Trusts, Loomis Sayles Funds Trusts and Natixis ETF Trusts and are normally reflected as Trustees’ fees and expenses in the Statements of Operations. Deferred amounts remain in the funds until distributed in accordance with the provisions of the Plan. The portions of the accrued obligations allocated to the Funds under the Plan are reflected as Deferred Trustees’ fees in the Statements of Assets and Liabilities.
Certain officers and employees of Natixis Advisors and Loomis Sayles are also officers and/or Trustees of the Trust.
g. Affiliated Ownership. As of November 30, 2024, Natixis and affiliates (“Natixis”) and Loomis Sayles Employees’ Profit Sharing Retirement Plan (“Retirement Plan”) held shares of the Funds representing the following percentages of the Funds’ net assets:
| | |
| | |
Senior Floating Rate and Fixed Income Fund | | |
Investment activities of affiliated shareholders could have material impacts on the Funds.
h. Reimbursement of Transfer Agent Fees and Expenses. Natixis Advisors has given a binding contractual undertaking to the Funds to reimburse any and all transfer agency expenses for the Fund’s Class N shares. This undertaking is in effect through March 31, 2025 and is not subject to recovery under the expense limitation agreement described above.
For the year ended November 30, 2024, Natixis Advisors reimbursed the Funds for transfer agency expenses as follows:
| Reimbursement of
Transfer Agency
Expenses |
| |
| |
Senior Floating Rate and Fixed Income Fund | |
| |
6.Class-Specific Transfer Agent Fees and Expenses. Transfer agent fees and expenses attributable to Class A, Class C and Class Y are allocated on a pro rata basis to each class based on the relative net assets of each class to the total net assets of those classes. Transfer agent fees and expenses attributable to Class N are allocated to Class N.
For the year ended November 30, 2024 the Funds incurred the following class-specific transfer agent fees and expenses (net of expense offsets and including sub-transfer agent fees, where applicable):
| Transfer Agent Fees and Expenses |
| | | | |
| | | | |
Senior Floating Rate and Fixed Income Fund | | | | |
| | | | |
7.Expense Offset Arrangements. The Funds have entered into an agreement with the transfer agent whereby certain transfer agent fees and expenses may be paid indirectly by credits earned on the Funds' cash balances. Transfer agent fees and expenses are presented in the Statements of Operations gross of such credits, and the credits are presented as offsets to expenses.
Notes to Financial Statements (continued)
8.Line of Credit. Each Fund, together with certain other funds of Natixis Funds Trusts, Loomis Sayles Funds Trusts and Natixis ETF Trusts, entered into a syndicated, revolving, committed, unsecured line of credit with State Street Bank as administrative agent. The aggregate revolving commitment amount is $575,000,000. Any one Fund may borrow up to $402,500,000 under the line of credit agreement (as long as all borrowings by all Funds in the aggregate do not exceed the $575,000,000 limit at any time), subject to each Fund’s investment restrictions and its contractual obligations under the line of credit. Interest is charged to the Funds based upon the terms set forth in the agreement. In addition, a commitment fee of 0.15% per annum, payable at the end of each calendar quarter, is accrued and apportioned among the participating funds based on their average daily unused portion of the line of credit.
For the year ended November 30, 2024, none of the Funds had borrowings under this agreement.
9.Risk. Global Growth Fund’s investments in foreign securities may be subject to greater political, economic, environmental, credit/ counterparty and information risks. The Fund’s investments in foreign securities also are subject to foreign currency fluctuations and other foreign currency-related risks. Foreign securities may be subject to higher volatility than U.S. securities, varying degrees of regulation and limited liquidity.
Global Growth Fund may invest to a significant extent in variable interest entity (“VIE”) structures. VIE structures can vary, but generally consist of a U.S.-listed company with contractual arrangements, through one or more wholly-owned special purpose vehicles, with a Chinese company that ultimately provides the U.S.-listed company with contractual rights to obtain economic benefits from the Chinese company. The VIE structure enables foreign investors, such as the Fund, to obtain investment exposure similar to that of an equity owner in a Chinese company in situations in which the Chinese government has restricted or prohibited the ownership of such company by foreign investors. The Fund’s exposure to VIE structures may pose additional risks because the VIE structure is not formally recognized under Chinese law. The Chinese government may cease to tolerate VIE structures at any time or impose new restrictions. In addition, Chinese companies using the VIE structure, and listed on stock exchanges in the U.S., could also face delisting or other ramifications for failure to meet the expectations and/or requirements of the U.S. Securities and Exchange Commission, the Public Company Accounting Oversight Board, or other U.S. regulators. Any of these risks could reduce the liquidity and value of these investments or render them valueless.
Select Fund is non-diversified, which means that it is not limited under the 1940 Act to a percentage of assets that it may invest in any one issuer. Because the Fund may invest in the securities of a limited number of issuers, an investment in the Fund may involve a higher degree of risk than would be present in a diversified portfolio.
The senior loans in which Senior Floating Rate and Fixed Income Fund expects to invest will generally not be rated investment grade by the rating agencies. Economic downturns generally increase non-payment rates and a senior loan could lose a substantial part of its value prior to default. Senior loans are subject to credit risk, and secured loans may not be adequately collateralized. The interest rates of senior loans reset frequently, and thus senior loans are subject to interest rate risk. There may also be less public information available about senior loans as compared to other debt securities.
Senior loans are generally less liquid than many other debt securities. Transactions in senior loans may settle on a delayed basis, such that the Fund may not receive the proceeds from the sale of a loan for a substantial period of time (greater than seven days) after the sale. As a result, the proceeds related to the sale of senior loans may not be available to make additional investments or to meet the Fund’s redemption obligations until substantial period (greater than seven days) after the sale of the loans.
Geopolitical events (such as trading halts, sanctions or wars) could increase volatility and uncertainty in the financial markets and adversely affect regional and global economies. These, and other related events, could significantly impact a Fund's performance and the value of an investment in the Fund, even if the Fund does not have direct exposure to issuers in the country or countries involved.
10.Concentration of Ownership. From time to time, a Fund may have a concentration of one or more accounts constituting a significant percentage of shares outstanding. Investment activities by holders of such accounts could have material impacts on the Funds. As of November 30, 2024, based on management’s evaluation of the shareholder account base, the Funds had accounts representing controlling ownership of more than 5% of the Funds' total outstanding shares. The number of such accounts, based on accounts that represent more than 5% of an individual class of shares, and the aggregate percentage of net assets represented by such holdings were as follows:
| Number of 5%
Non-Affiliated
Account Holders | Percentage of
Non-Affiliated
Ownership | Percentage of
Affiliated
Ownership
(Note 5g) | Total
Percentage of
Ownership |
| | | | |
| | | | |
Notes to Financial Statements (continued)
Omnibus shareholder accounts for which Natixis Advisors understands that the intermediary has discretion over the underlying shareholder accounts or investment models where a shareholder account may be invested for a non-discretionary customer are included in the table above. For other omnibus accounts, the Funds do not have information on the individual shareholder accounts underlying the omnibus accounts; therefore, there could be other 5% shareholders in addition to those disclosed in the table above.
11.Capital Shares. Each Fund may issue an unlimited number of shares of beneficial interest, without par value. Transactions in capital shares were as follows:
|
| Year Ended
November 30, 2024 | Year Ended
November 30, 2023 |
| | | | |
| | | | |
Issued from the sale of shares | | | | |
Issued in connection with the reinvestment of distributions | | | | |
| | | | |
| | | | |
| | | | |
Issued from the sale of shares | | | | |
Issued in connection with the reinvestment of distributions | | | | |
| | | | |
| | | | |
| | | | |
Issued from the sale of shares | | | | |
Issued in connection with the reinvestment of distributions | | | | |
| | | | |
| | | | |
| | | | |
Issued from the sale of shares | | | | |
Issued in connection with the reinvestment of distributions | | | | |
| | | | |
| | | | |
Decrease from capital share transactions | | | | |
Notes to Financial Statements (continued)
11.Capital Shares (continued).
|
| Year Ended
November 30, 2024 | Year Ended
November 30, 2023 |
Senior Floating Rate and Fixed Income Fund | | | | |
| | | | |
Issued from the sale of shares | | | | |
Issued in connection with the reinvestment of distributions | | | | |
| | | | |
| | | | |
| | | | |
Issued from the sale of shares | | | | |
Issued in connection with the reinvestment of distributions | | | | |
| | | | |
| | | | |
| | | | |
Issued from the sale of shares | | | | |
Issued in connection with the reinvestment of distributions | | | | |
| | | | |
| | | | |
| | | | |
Issued from the sale of shares | | | | |
Issued in connection with the reinvestment of distributions | | | | |
| | | | |
| | | | |
Decrease from capital share transactions | | | | |
Notes to Financial Statements (continued)
11.Capital Shares (continued).
|
| Year Ended
November 30, 2024 | Year Ended
November 30, 2023 |
| | | | |
| | | | |
Issued from the sale of shares | | | | |
Issued in connection with the reinvestment of distributions | | | | |
| | | | |
| | | | |
| | | | |
Issued from the sale of shares | | | | |
Issued in connection with the reinvestment of distributions | | | | |
| | | | |
| | | | |
| | | | |
Issued from the sale of shares | | | | |
Issued in connection with the reinvestment of distributions | | | | |
| | | | |
| | | | |
| | | | |
Issued from the sale of shares | | | | |
Issued in connection with the reinvestment of distributions | | | | |
| | | | |
| | | | |
Increase from capital share transactions | | | | |
Report of Independent Registered Public Accounting Firm
To the Board of Trustees of Natixis Funds Trust II and Shareholders of Loomis Sayles Global Growth Fund, Loomis Sayles Senior Floating Rate and Fixed Income Fund and Vaughan Nelson Select Fund:
Opinions on the Financial Statements
We have audited the accompanying statements of assets and liabilities, including the portfolios of investments, of Loomis Sayles Global Growth Fund, Loomis Sayles Senior Floating Rate and Fixed Income Fund, and Vaughan Nelson Select Fund (three of the funds constituting Natixis Funds Trust II, hereafter collectively referred to as the "Funds") as of November 30, 2024, the related statements of operations for the year ended November 30, 2024, the statements of changes in net assets for each of the two years in the period ended November 30, 2024, including the related notes, and the financial highlights for each of the five years in the period ended November 30, 2024 (collectively referred to as the “financial statements”). In our opinion, the financial statements present fairly, in all material respects, the financial position of each of the Funds as of November 30, 2024, the results of each of their operations for the year then ended, the changes in each of their net assets for each of the two years in the period ended November 30, 2024 and each of the financial highlights for each of the five years in the period ended November 30, 2024 in conformity with accounting principles generally accepted in the United States of America.
These financial statements are the responsibility of the Funds’ management. Our responsibility is to express an opinion on the Funds’ financial statements based on our audits. We are a public accounting firm registered with the Public Company Accounting Oversight Board (United States) (PCAOB) and are required to be independent with respect to the Funds in accordance with the U.S. federal securities laws and the applicable rules and regulations of the Securities and Exchange Commission and the PCAOB.
We conducted our audits of these financial statements in accordance with the standards of the PCAOB. Those standards require that we plan and perform the audit to obtain reasonable assurance about whether the financial statements are free of material misstatement, whether due to error or fraud.
Our audits included performing procedures to assess the risks of material misstatement of the financial statements, whether due to error or fraud, and performing procedures that respond to those risks. Such procedures included examining, on a test basis, evidence regarding the amounts and disclosures in the financial statements. Our audits also included evaluating the accounting principles used and significant estimates made by management, as well as evaluating the overall presentation of the financial statements. Our procedures included confirmation of securities owned as of November 30, 2024 by correspondence with the custodian, agent banks and brokers; when replies were not received from brokers and agent banks, we performed other auditing procedures. We believe that our audits provide a reasonable basis for our opinions.
/s/PricewaterhouseCoopers LLP
Boston, Massachusetts
January 22, 2025
We have served as the auditor of one or more investment companies in the Natixis Investment Company Complex since at least 1995. We have not determined the specific year we began serving as auditor.
2024 U.S. Tax Distribution Information to Shareholders (Unaudited)
Corporate Dividends Received Deduction. For the fiscal year ended November 30, 2024, a percentage of dividends distributed by the Fund listed below qualifies for the dividends received deduction for corporate shareholders. This percentage is as follows:
This Page Intentionally Left Blank
˃To learn more about Natixis Funds products and services:
Visit: im.natixis.com Call: 800-225-5478
Before investing, consider the fund’s investment objectives, risks, charges, and expenses. Visit im.natixis.com or call 800-225-5478 for a prospectus or summary prospectus containing this and other information.
Contact us by mail:
If you wish to communicate with the funds’ Board of Trustees, you may do so by writing to:
Secretary of the Funds
Natixis Advisors, LLC
888 Boylston Street, Suite 800
Boston, MA 02199-8197
The correspondence must (a) be signed by the shareholder; (b) include the shareholder’s name and address; and (c) identify the fund(s), account number, share class, and number of shares held in that fund, as of a recent date.
Or by e-mail:
secretaryofthefunds@natixis.com (Communications regarding recommendations for Trustee candidates may not be submitted by e-mail.)
Please note: Unlike written correspondence, e-mail is not secure. Please do NOT include your account number, Social Security number, PIN, or any other non-public personal information in an e-mail communication because this information may be viewed by others.
 Exp. 1/31/26LSAR58A-1124
This page is not part of the financial statements and other important information
Item 8. Changes in and Disagreements with Accountants for Open-End Management Investment Companies
Not applicable.
Item 9. Proxy Disclosures for Open-End Management Investment Companies.
Not applicable.
Item 10. Remuneration Paid to Directors, Officers, and Others of Open-End Management Investment Companies.
The remuneration paid to Directors and Officers are incorporated by reference as part of the Financial Statements and Other Important Information for Open-End Management Investment Companies filed as Item 7 herewith.
Item 11. Statement Regarding Basis for Approval of Investment Advisory Contract.
The statements regarding basis for approval of investment advisory contracts are incorporated by reference as part of the Financial Statements and Other Important Information for Open-End Management Investment Companies filed as Item 7 herewith.
Item 12. Disclosure of Proxy Voting Policies and Procedures for Closed-End Management Investment Companies.
Not applicable.
Item 13. Portfolio Managers of Closed-End Management Investment Companies.
Not applicable.
Item 14. Purchases of Equity Securities by Closed-End Management Investment Companies and Affiliated Purchasers.
Not applicable.
Item 15. Submission of Matters to a Vote of Securities Holders.
There were no material changes to the procedures by which shareholders may recommend nominees to the Registrant’s Board of Trustees.
Item 16. Controls and Procedures.
(a) The Registrant’s principal executive officer and principal financial officer have concluded that the Registrant’s disclosure controls and procedures are sufficient to ensure that information required to be disclosed by the Registrant in this Form N-CSR was recorded, processed, summarized and reported within the time periods specified in the Securities and Exchange Commission’s rules and forms, based upon such officers’ evaluation of these controls and procedures as of a date within 90 days of the filing date of the report.
(b) There were no changes in the Registrant’s internal control over financial reporting that occurred during the period covered by the report that have materially affected, or is reasonably likely to materially affect, the Registrant’s internal control over financial reporting.
Item 17. Disclosure of Securities Lending Activities for Closed-End Management Investment Companies.
Not applicable.
Item 18. Recovery of Erroneously Awarded Compensation.
Not applicable.
Item 19. Exhibits.
SIGNATURES
Pursuant to the requirements of the Securities Exchange Act of 1934 and the Investment Company Act of 1940, the Registrant has duly caused this report to be signed on its behalf by the undersigned, thereunto duly authorized.
| | |
| Natixis Funds Trust II |
| |
| By: | | /s/ David L. Giunta |
| Name: | | David L. Giunta |
| Title: | | President and Chief Executive Officer |
| |
| Date: | | January 22, 2025 |
Pursuant to the requirements of the Securities Exchange Act of 1934 and the Investment Company Act of 1940, this report has been signed by the following persons on behalf of the Registrant and in the capacities and on the dates indicated.
| | |
| By: | | /s/ David L. Giunta |
| Name: | | David L. Giunta |
| Title: | | President and Chief Executive Officer |
| |
| Date: | | January 22, 2025 |
| |
| By: | | /s/ Matthew J. Block |
| Name: | | Matthew J. Block |
| Title: | | Treasurer and Principal Financial and |
| | Accounting Officer |
| |
| Date: | | January 22, 2025 |