 American International Group, Inc. Investor Presentation Fourth Quarter 2014 March 10, 2015 Exhibit 99.1 |
 2 Cautionary Statement Regarding Forward Looking Information This document and the remarks made within this presentation may include, and officers and representatives of American International Group, Inc. (AIG) may from time to time make, projections, goals, assumptions and statements that may constitute “forward-looking statements” within the meaning of the Private Securities Litigation Reform Act of 1995. These projections, goals, assumptions and statements are not historical facts but instead represent only AIG’s belief regarding future events, many of which, by their nature, are inherently uncertain and outside AIG’s control. These projections, goals, assumptions and statements include statements preceded by, followed by or including words such as “believe,” “anticipate,” “expect,” “intend,” “plan,” “view,” “target” or “estimate”. It is possible that AIG’s actual results and financial condition will differ, possibly materially, from the results and financial condition indicated in these projections, goals, assumptions and statements. Factors that could cause AIG’s actual results to differ, possibly materially, from those in the specific projections, goals, assumptions and statements include: changes in market conditions; the occurrence of catastrophic events, both natural and man-made; significant legal proceedings; the timing and applicable requirements of any new regulatory framework to which AIG is subject as a nonbank systemically important financial institution and as a global systemically important insurer; concentrations in AIG’s investment portfolios; actions by credit rating agencies; judgments concerning casualty insurance underwriting and insurance liabilities; judgments concerning the recognition of deferred tax assets; and such other factors discussed in Part I, Item 2. Management’s Discussion and Analysis of Financial Condition and Results of Operations (MD&A) in AIG’s Quarterly Report on Form 10-Q for the quarterly periods ended September 30, 2014, June 30, 2014 and March 31, 2014 and in Part I, Item 1A. Risk Factors and Part II, Item 7. MD&A in AIG’s Annual Report on Form 10-K for the year ended December 31, 2014. AIG is not under any obligation (and expressly disclaims any obligation) to update or alter any projections, goals, assumptions or other statements, whether written or oral, that may be made from time to time, whether as a result of new information, future events or otherwise. This document and the remarks made orally may also contain certain non-GAAP financial measures. The reconciliation of such measures to the most comparable GAAP measures in accordance with Regulation G is included in the Fourth Quarter 2014 Financial Supplement available in the Investor Information section of AIG's corporate website, www.aig.com, as well as in this presentation. Note: Information included in the presentation is as of December 31, 2014, unless otherwise indicated. |
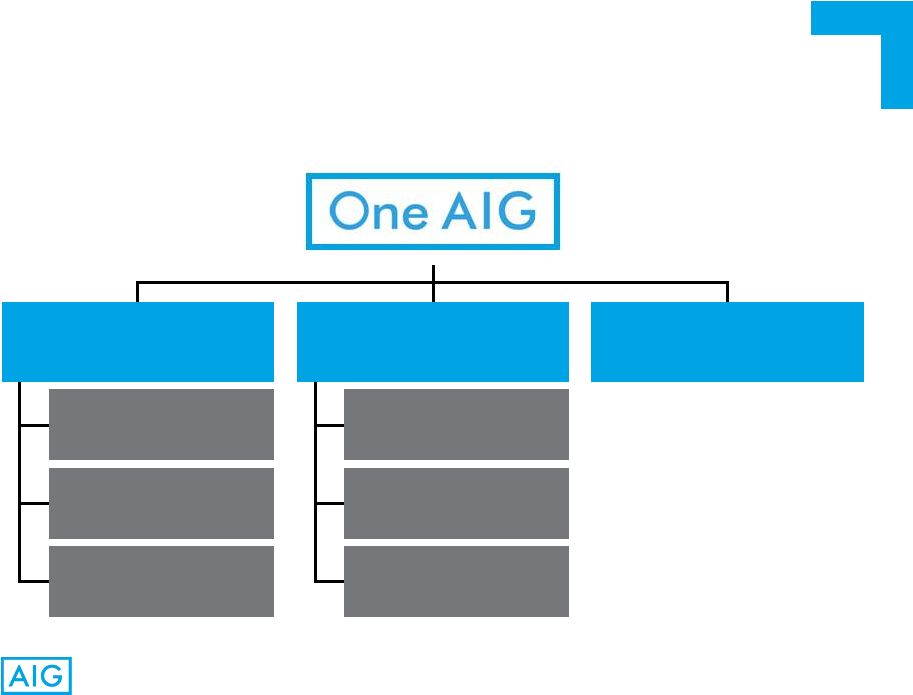
 3 Balancing Growth, Profitability and Risk to Increase Long-term Intrinsic Value AIG Today Global Insurance Franchise Expansive global footprint with operations in over 100 countries and jurisdictions Diversification across products and geographies Customer focus Value Based Metrics Risk Adjusted Profitability and Value of New Business Information driven underwriting approach Debt retirements deliver incremental economic value Balance Sheet Strength Business mix shift to less capital intensive lines Optimizing economic return on non-core assets Managing capital for sustained strength and stability |
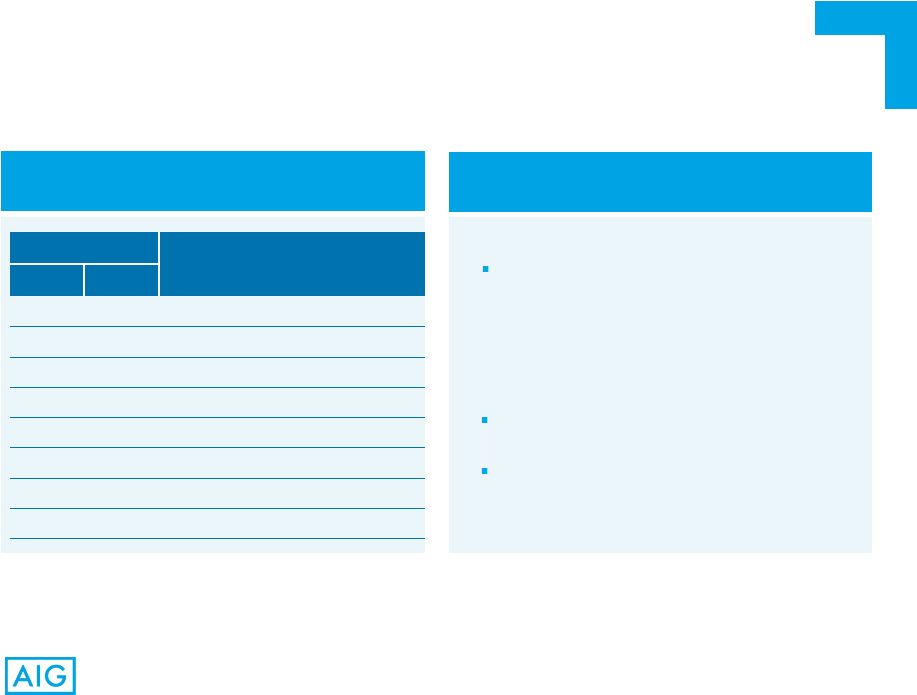
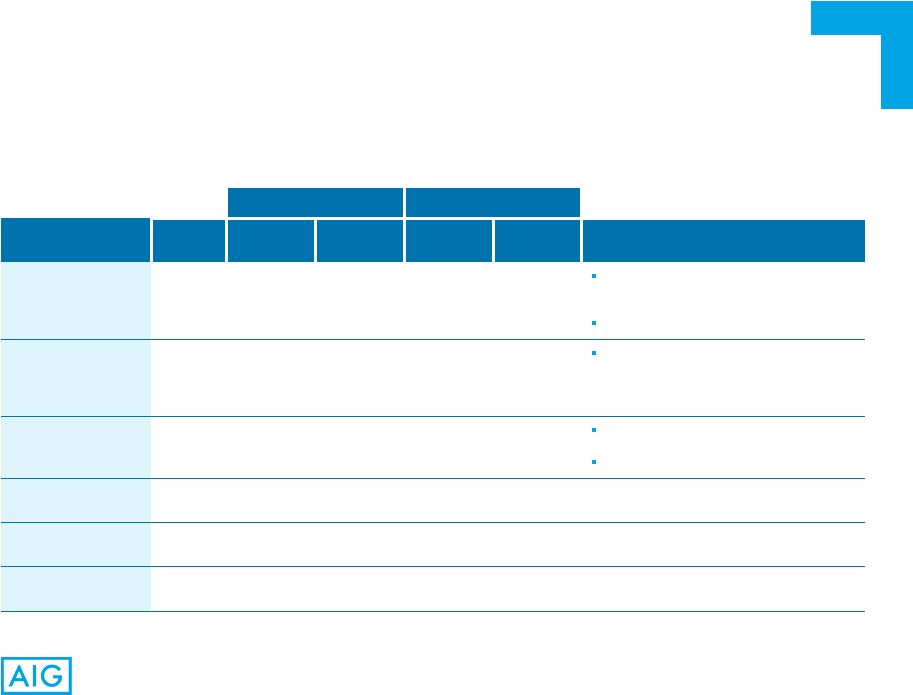
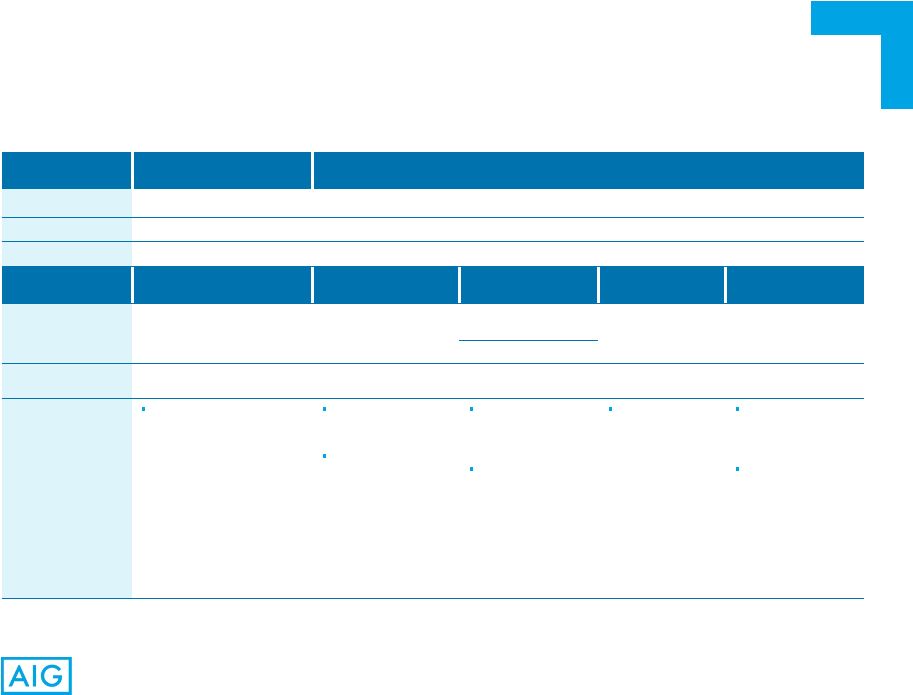
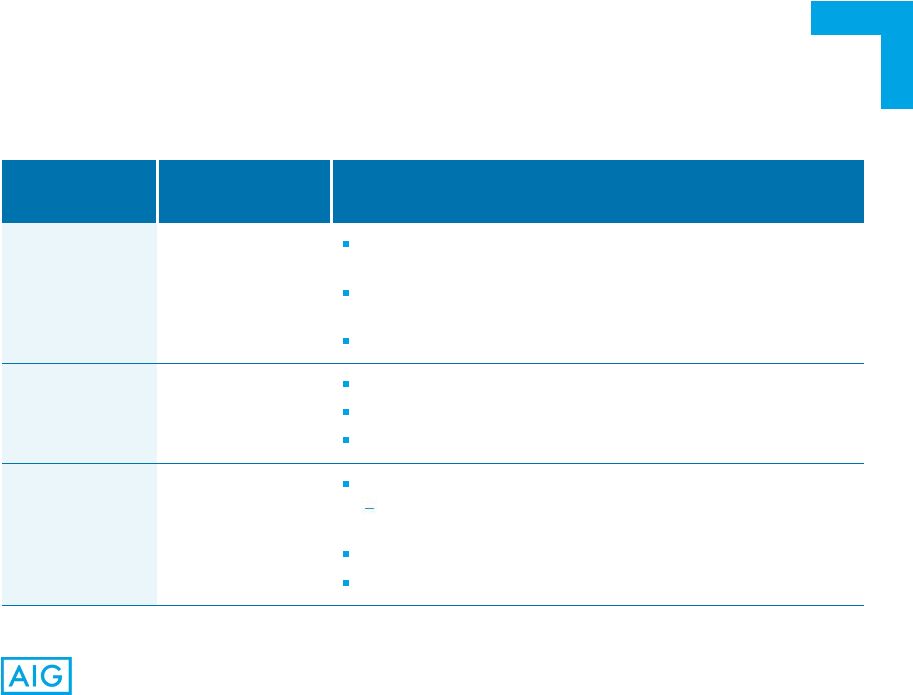 4 To Deliver Sustainable ROE At or Above Our Cost of Capital * General operating expenses, operating basis (see non-GAAP measures in appendix). Financial Objectives Key Metric Annual Targets Through 2017 Outlook and Key Levers for Improvement ROE, ex. AOCI and DTA ~50+ bps increase Baseline of 7.4% ROE, normalized for CATs and alternative returns Expense efficiencies and capital return are key levers for improvement 10+% ROE remains the long term objective Expense Management 3–5% reduction in net expense* Simplification of processes and organizational structure Execution and discipline on strategic projects New initiatives to be funded from GOE savings Book Value Per Share, ex. AOCI and DTA 10+% growth Balanced capital deployment Non-core assets contribute to capital flexibility over time Disciplined risk appetite for new business and acquisitions Announced $2.5 billion share repurchase authorization in February 2015 |
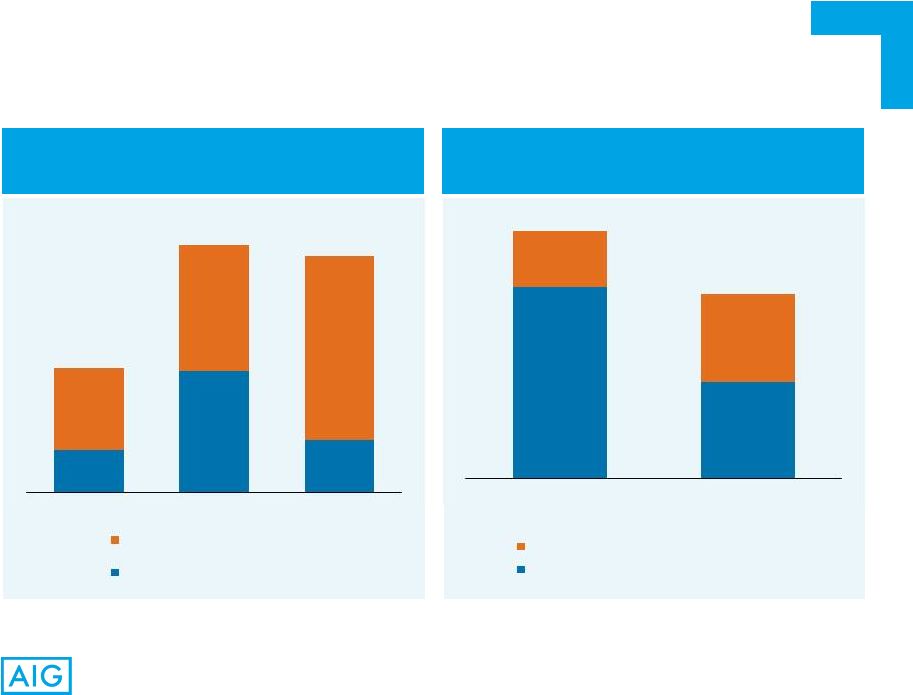
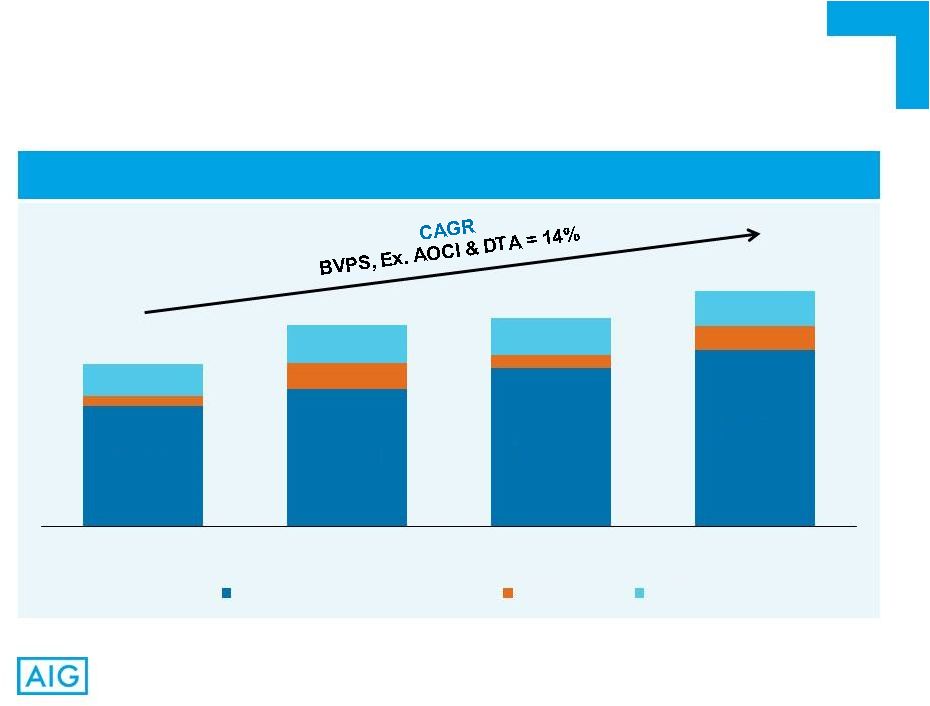 5 Consistent Value Creation for Shareholders Book Value Per Share Growth Book Value Per Share $39.57 $45.30 $52.12 $58.23 $3.42 $8.51 $4.34 $7.71 $10.54 $12.57 $12.16 $11.75 $53.53 $66.38 $68.62 $77.69 Dec. 31, 2011 Dec. 31, 2012 Dec. 31, 2013 Dec. 31, 2014 BVPS, Ex. AOCI & DTA AOCI DTA |
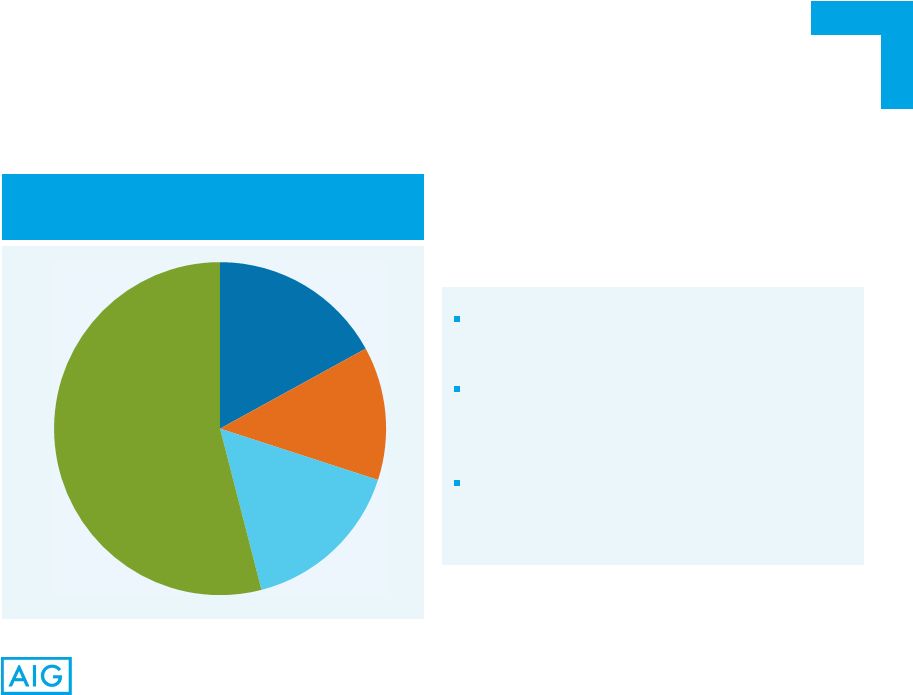
 6 Total Operating Revenue of $61.0 Billion for FY 2014 Note: Percentages computed based on total AIG operating revenues. 1) Includes consolidation, eliminations and other adjustments. AIG – A Diverse Customer-Focused Operating Platform Commercial Insurance FY 2014 Operating Revenue $28.8 Billion, 47% Consumer Insurance FY 2014 Operating Revenue $28.5 Billion, 47% Corporate and Other FY 2014 Operating Revenue $3.7 Billion¹, 6% Property Casualty 41% Mortgage Guaranty 2% Institutional Markets 4% Retirement 16% Life 11% Personal Insurance 20% |
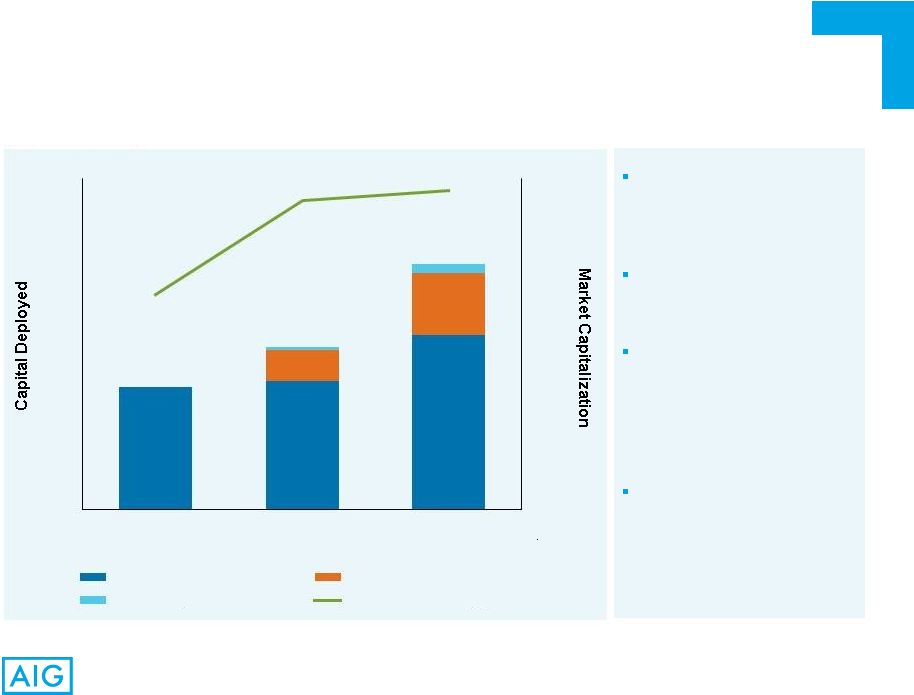 7 ($ in Billions) Market capitalization data from Bloomberg as of year ended December 31. 1) Represents shares purchased from the Department of Treasury. AIG – Returning Capital to Stakeholders Legacy debt reductions decreased net annual interest expense by over $500 million since 2012 $2.5 billion share repurchase authorized in February 2015 $6–$7 billion in potential share repurchases and shareholder dividends for 2015, ex. potential monetization of non-core assets Stable cash flows from operating companies 1 $13.0 $13.6 $18.5 $3.3 $6.5 $0.3 $1.0 $13.0 $17.2 $26.0 $52.1 $74.7 $77.1 $0 $10 $20 $30 $40 $50 $60 $70 $80 $0 $5 $10 $15 $20 $25 $30 $35 2012 Cumulative 2012–2013 Cumulative 2012–2014 Share Repurchases Liability Management, Net Dividends Market Capitalization Note: Liability management amounts exclude activities related to the Direct Investment book. |
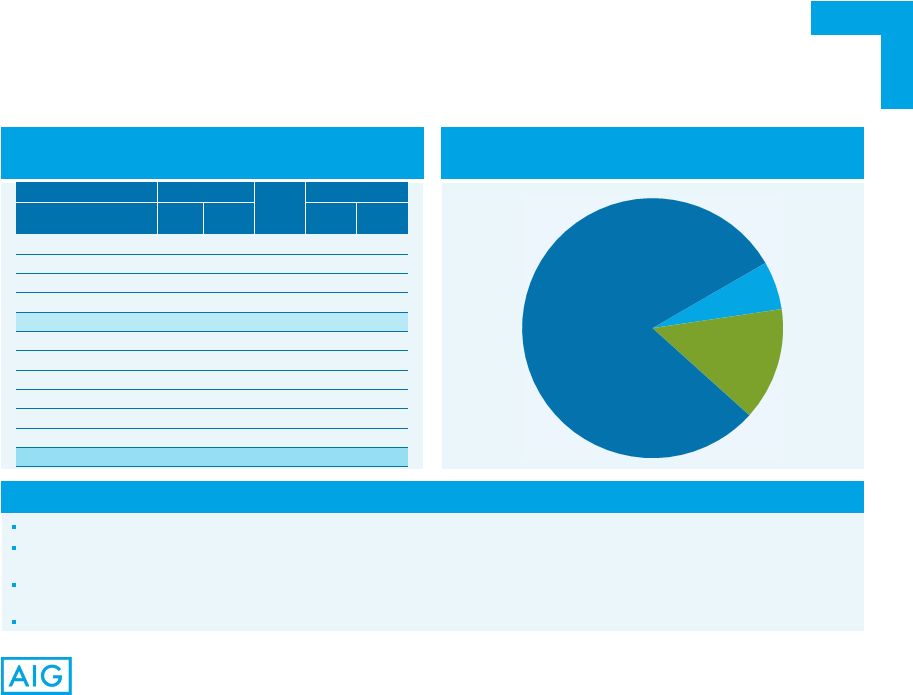
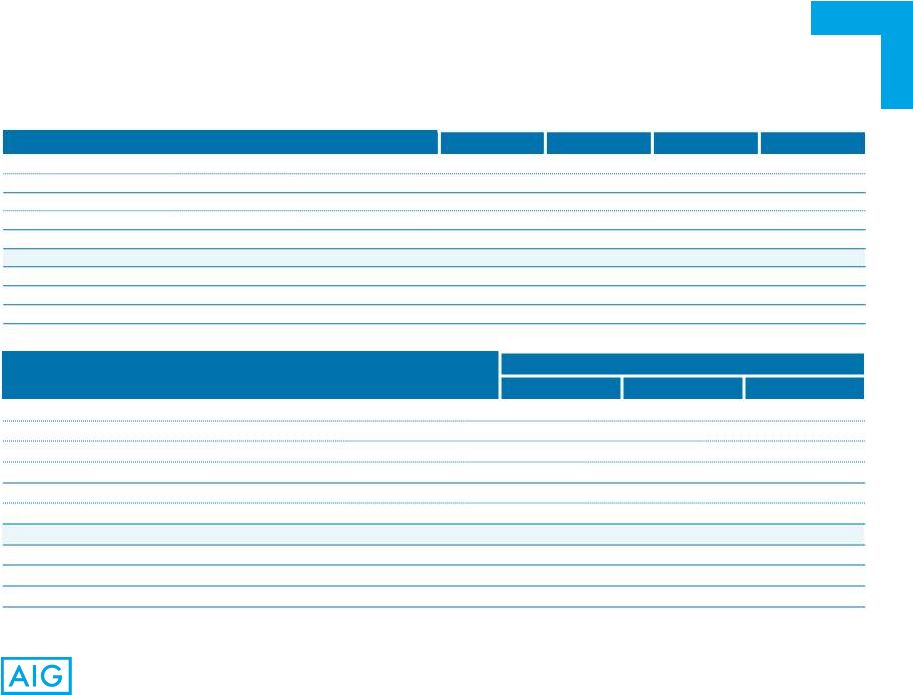
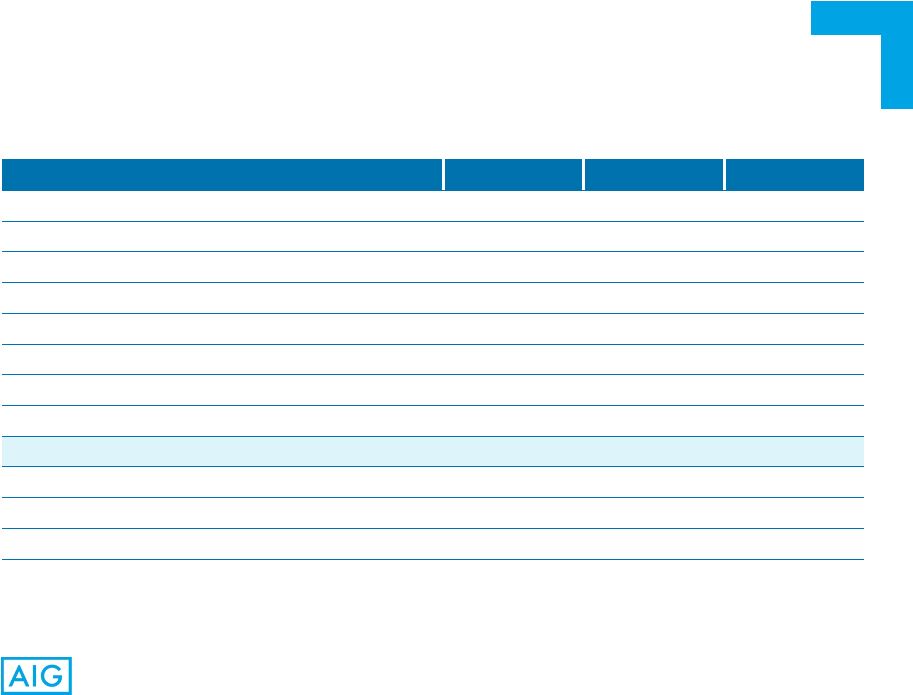 8 Note: Refer to Appendix included herein for Non-GAAP reconciliations. 1) Ratio of financial and hybrid debt to total capital. AIG Consolidated Balance Sheet Selected Highlights ($ in Millions, Except per Share Amounts) Dec. 31, 2012 Dec. 31, 2013 Dec. 31, 2014 Cash and investments $376,975 $358,669 $357,524 Total assets 548,633 541,329 515,581 Net property casualty reserves 68,782 64,316 61,612 Financial and hybrid debt 25,466 21,199 19,106 AIG shareholders’ equity 98,002 100,470 106,898 Total capital $124,135 $122,280 $126,378 Total assets to shareholders’ equity 5.6x 5.4x 4.8x Debt to Total capital ratio (1) 20.5% 17.3% 15.1% Per Share Data: Book value per common share $66.38 $68.62 $77.69 Book value per common share – ex. AOCI $57.87 $64.28 $69.98 Book value per common share – ex. AOCI and DTA $45.30 $52.12 $58.23 |
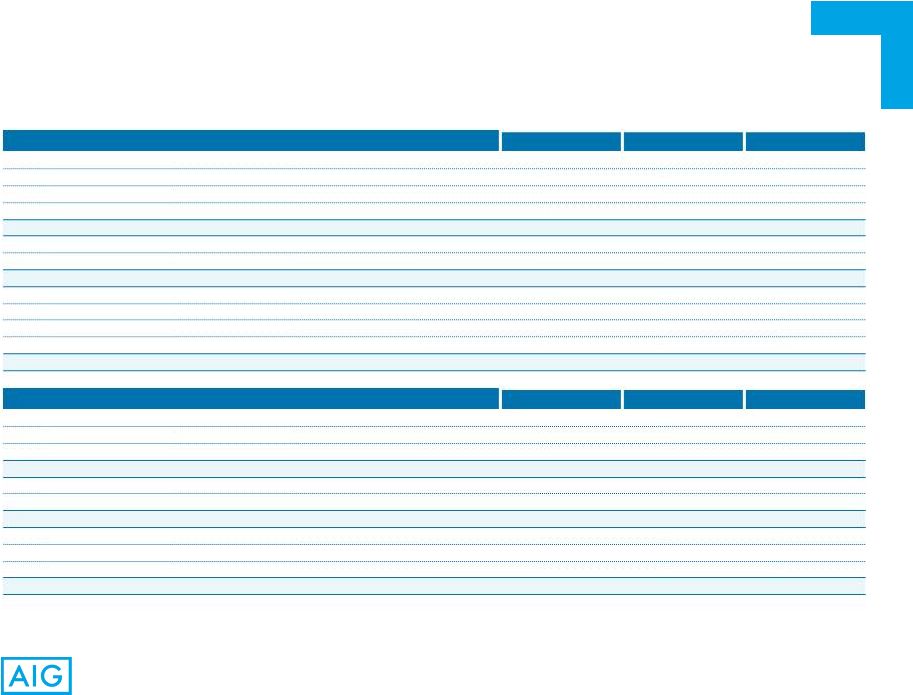
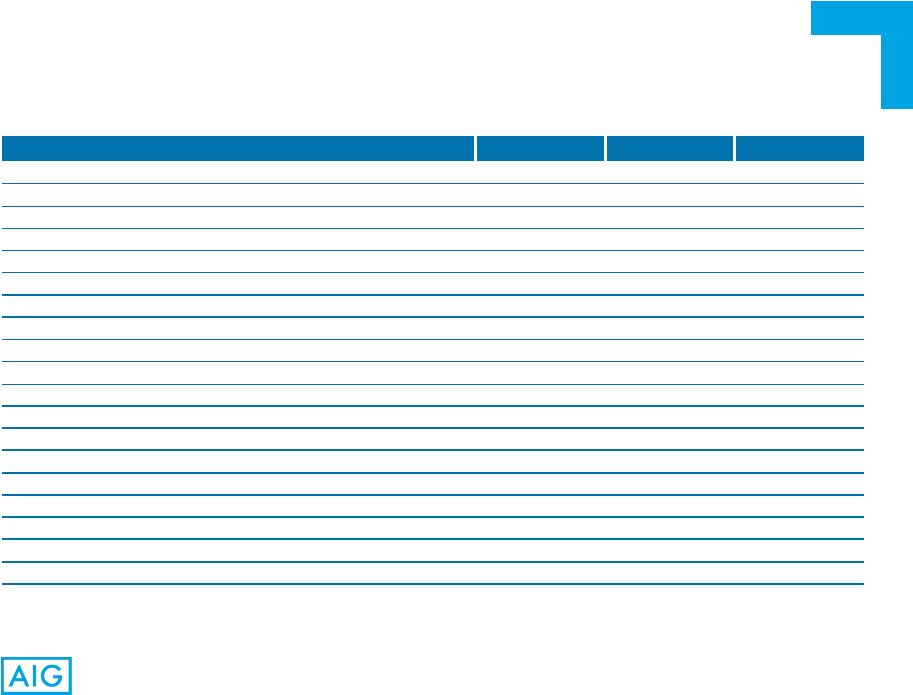 9 Note: Refer to Appendix included herein for Non-GAAP reconciliations. 1) Includes consolidation, eliminations and other adjustments. AIG Consolidated Operating Financial Highlights ($ in Millions, Except per Share Amounts) Full Year 2012 Full Year 2013 Full Year 2014 Operating revenues $65,379 $61,524 $61,001 Pre-tax operating income: Commercial Insurance: Property Casualty 1,681 4,095 4,248 Mortgage Guaranty 9 205 592 Institutional Markets 525 680 670 Total Commercial Insurance 2,215 4,980 5,510 Consumer Insurance: Retirement 2,801 3,490 3,495 Life 736 806 580 Personal Insurance 199 268 399 Total Consumer Insurance 3,736 4,564 4,474 Total Insurance Operations 5,951 9,544 9,984 Corporate and Other¹ 3,987 (154) (410) Total Pre-tax operating income $9,938 $9,390 $9,574 After-tax operating income attributable to AIG $6,542 $6,650 $6,630 After-tax operating income attributable to AIG per common share $3.88 $4.49 $4.58 ROE – After-tax operating income – ex. AOCI 7.1% 7.4% 6.9% ROE – After-tax operating income – ex. AOCI & DTA 9.0% 9.3% 8.4% |
 10 Commercial Insurance |
 11 Commercial Insurance – Strategy Customer Strategic Growth Underwriting Excellence Claims Excellence Operational Effectiveness Capital Efficiency Investment Strategy Strive to be our customers’ most valued insurer by offering innovative products, superior service and access to an extensive global network Grow our higher-value businesses while investing in transformative opportunities Improve our business portfolio through better pricing and risk selection by using enhanced data, analytics and the application of science to deliver superior risk- adjusted returns Improve claims processes, analytics and tools to deliver superior customer service and decrease our loss ratio Continue initiatives to modernize our technology and infrastructure; implement best practices to improve speed and quality of service Increase capital fungibility and diversification, streamline our legal entity structure, optimize reinsurance and improve tax efficiency Increase asset diversification and take advantage of yield- enhancement opportunities to meet our capital, liquidity, risk and return objectives Strategic Levers to Drive Shareholder Value Creation |
 12 Commercial Insurance – Diversified Product Suite General Liability Commercial Automobile Liability Workers’ Compensation Excess Casualty Crisis Management Risk Management Other Customized Structured Programs for Large Corporate and Multinational Customers Global Property covers exposures to man- made and natural disasters, includes business interruption Industrial, Energy and Commercial Property Multinational Property D&O, E&O Cyber Security Fidelity Employment Practices Fiduciary Liability Kidnap and Ransom Aerospace Environmental Political Risk Trade Credit Marine Surety Protects mortgage investors against the risk of borrower default related to high loan to value mortgages Stable Wrap Products Structured Settlement and Terminal Funding Annuities High Net Worth Products Corporate- and Bank-owned Life Insurance GICs Specialty Lines Casualty Property Property Casualty Mortgage Guaranty Institutional Markets Financial Lines |
 13 AIG is ranked among the top 10 most preferred commercial insurance carriers. AIG is the #1 commercial insurer in the U.S. and has an established and growing position in Latin America. 2 AIG is a recognized leader in the Construction/Builders, Cyber, Directors and Officers, Employment Practices, Environmental, Errors and Omissions, Excess and Surplus, General Liability, Marine – Ocean, Medical Malpractice, Terrorism, Umbrella/Excess Liability, and Workers’ Compensation markets. AIG is ranked as the #1 insurer of Terrorism, Medical Malpractice, Excess and Surplus, Environmental, Errors and Omissions 1 and Mortgage Guaranty insurance 3 ; and the #2 provider of Umbrella/Excess Liability and Cyber insurance. 1 AIG is recognized as being in the top 25% of insurers for handling of producers’ global insurance needs. 1 AIG is the #1 carrier in the Directors and Officers, Employment Practices Liability Insurance, Umbrella/Excess Liability markets and is the #2 carrier in the Property market based on policy counts. 4 AIG is the #1 carrier in the Fiduciary Liability market based on premiums. 4 AIG is the largest nonlife insurer in the world by market capitalization. 5 AIG was ranked as the 2 nd largest group in the U.S. surplus lines market in 2013, and Lexington Insurance Company was the largest surplus lines insurance carrier in the U.S. 6 Leading Market Positions Commercial Insurance – Leading Businesses 1) According to the 2014 Flaspöhler Survey, which is based on opinions of over 500 producers on 37 commercial insurance carriers. 2) As measured by full year 2014 net premiums written. Refer to AIG 2014 10-K for further information. 3) According to Inside Mortgage Finance as measured by new insurance written as of December 31, 2014. 4) According to the 2014 RIMS Benchmark Survey. 5) According to Bloomberg as of March 5, 2015. 6) According to AM Best in the 2013 Best’s Review Surplus Lines Report. 1 1 |
 14 Commercial Insurance Operations Continue to Be Recognized for Excellence Globally Commercial Insurance – Leading Businesses Business Insurance 2015 Innovation Award – Unmanned Aircraft Insurance UK Captive Review 2015 Innovation in Fronting Award UK CIR Magazine 2014 Commercial Insurer and Specialist Provider of the Year Awards MENA Insurance Review 2014 Financial Insurer of the Year Insurance Times UK 2014 Insurer Claims Initiative of the Year Commercial Lines Global Finance Magazine 2013 Best in Insurance Awards 2013 Best Environmental Liability Insurer 2014 Advisen Management Liability Awards Innovation of the Year: Halliburton Event Study Endorsement British Insurance Award 2013 Underwriter of the Year UK Insurance Claims Award 2013 Innovation of the Year Australia and New Zealand Institute of Insurance & Finance (ANZIIF) 2013 Innovation of the Year – CyberEdge Risk & Försäkring 2013 Insurance Company of the Year National Underwriter 2013 #1 Ranking Ocean Marine Insurer Trade Finance Magazine 2013 Best Private Insurer (6-time winner since 1999) 2013 Best Trade Insurer in Asia (2-time winner since 2007) GTR Magazine 2013 Best Trade Credit Insurance Underwriter (for 6 th Consecutive Year) PropertyCasualty360 2013 Best Overall Commercial Insurance Provider • Best Claim Handler • Best Management Liability Insurer |
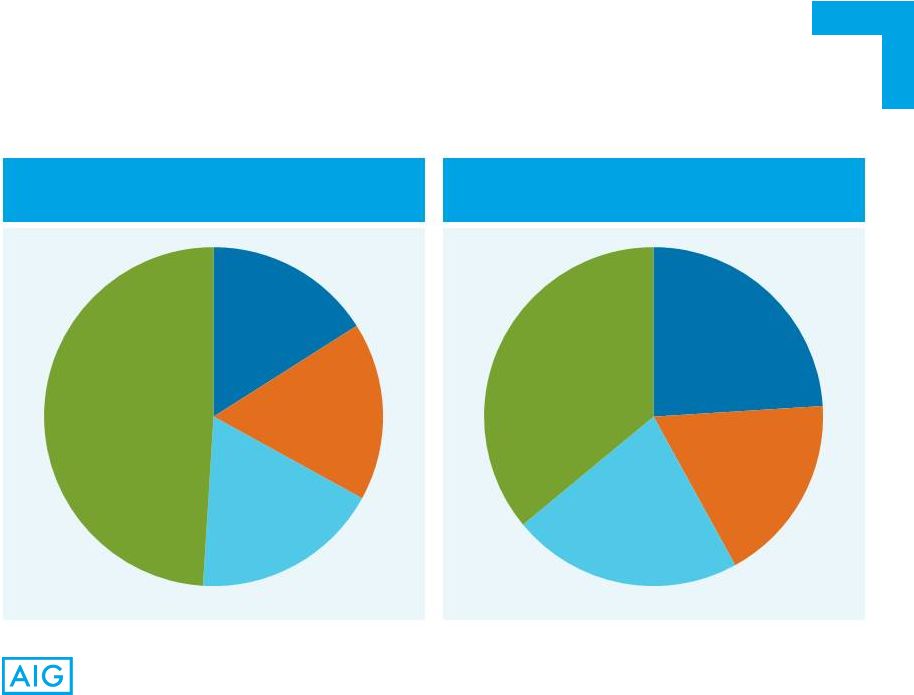
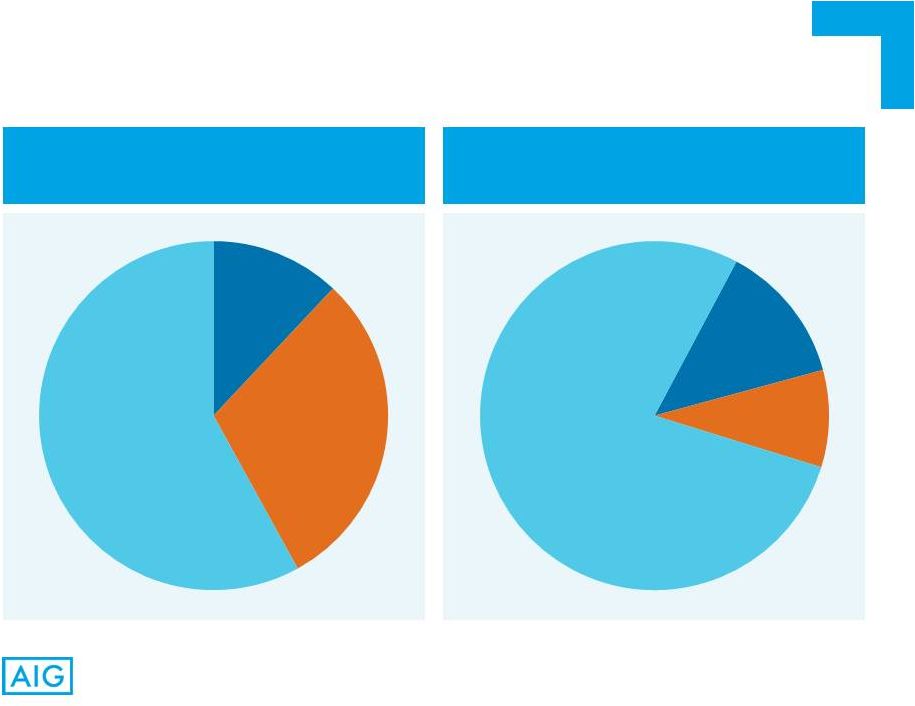
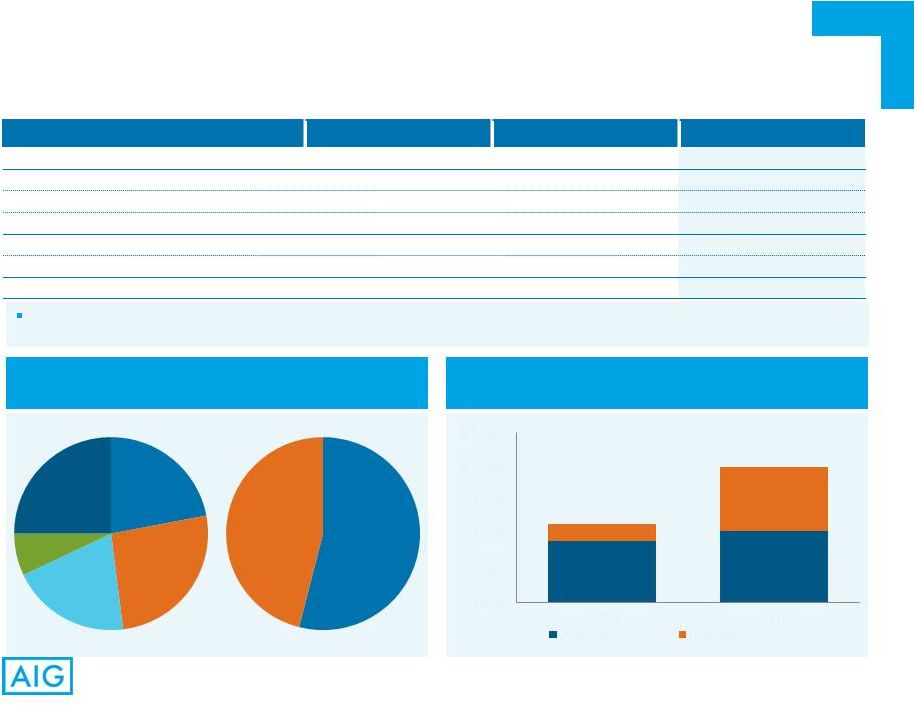
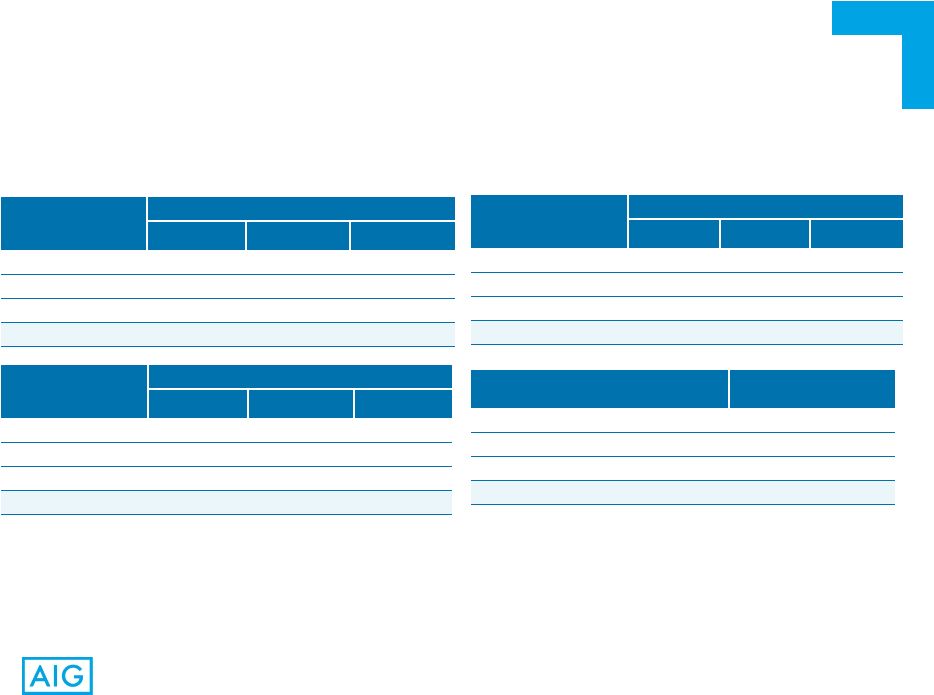
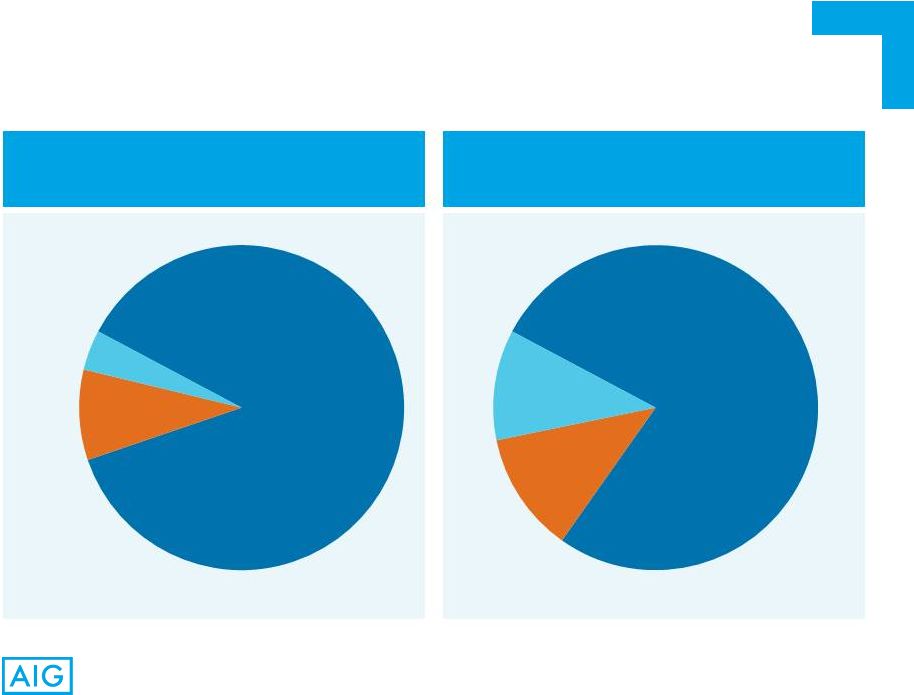 15 Commercial Insurance – Overview Total Operating Revenue Full Year 2014 – $28.8 Billion Total Pre-tax Operating Income Full Year 2014 – $5.5 Billion Property Casualty Institutional Markets Mortgage Guaranty Property Casualty Institutional Markets Mortgage Guaranty 87% 9% 4% 77% 12% 11% |
 16 Commercial Insurance – Property Casualty Financial Highlights ($ in Millions) Full Year 2012 Full Year 2013 Full Year 2014 Net premiums written $20,348 $20,880 $21,020 Net premiums earned 20,848 20,677 20,885 Underwriting loss (2,270) (336) (50) Net investment income 3,951 4,431 4,298 Pre-tax operating income $1,681 $4,095 $4,248 Net Premiums Written FY 2014 – $21.0 Billion Combined Ratios 110.9 101.6 100.2 99.3 95.1 94.2 Property Specialty Financial Lines Casualty Americas EMEA Asia Pacific Continued Improvement in Accident Year Combined Ratios, As Adjusted Accident Year, as Adjusted Calendar Year 24% 18% 22% 36% 65% 25% 10% 80.5 71.9 71.6 68.9 65.4 65.6 16.6 16.1 15.7 16.6 16.1 15.7 13.8 13.6 12.9 13.8 13.6 12.9 0 20 40 60 80 100 120 2012 2013 2014 2012 2013 2014 Loss Ratio Acquisition Ratio GOE Ratio |
 17 Meaningful Remediation of Casualty Lines and Growth in Property Commercial Insurance – Property Casualty Product Mix Shift Property Casualty Full Year 2010 NPW – $20.2 Billion Property Casualty Full Year 2014 NPW – $21.0 Billion Property Specialty Financial Lines Casualty Property Specialty Financial Lines Casualty 16% 17% 18% 49% 24% 18% 22% 36% |
 18 Strong growth in operating earnings reflects lower delinquency rates, higher cure rates, new business growth and higher persistency. Volume and quality of new business remain strong despite competitive pressures. – Average FICO of new insurance written in Full Year 2014 was 750. – Average loan-to-value of new insurance written in Full Year 2014 was 92%. Mortgage Guaranty’s primary insurance subsidiary, United Guaranty Residential Insurance Company, maintains an S&P rating of A and Moody's rating of Baa1 with stable outlooks.¹ 1) As of the date of this presentation. Commercial Insurance – Mortgage Guaranty Financial Highlights ($ in Millions) Full Year 2012 Full Year 2013 Full Year 2014 Net premiums written $858 $1,048 $1,024 Underwriting income (loss) (137) 73 454 Net investment income 146 132 138 Pre-tax operating income $9 $205 $592 Combined ratio 119.2 90.9 49.8 |
 19 Mortgage Guaranty’s Risk Quality Index (RQI) is a proprietary model that uses over a dozen variables to estimate the potential for a mortgage to default. RQI is the key driver in Mortgage Guaranty’s risk-based pricing plan, Performance Premium. Primary delinquency rate has returned to pre-crisis level due to a combination of strong growth of new business and proactive management of delinquent book. * Internal data. Commercial Insurance – Mortgage Guaranty Credit Quality of Loans Mortgage Guaranty Risk Quality Index* Primary Risk-in-force (RIF) – $42.1 Billion Low Quality (uninsurable) Loan with Average Risk High Quality 2014 2013 2012 2011 2010 2009 2008 2007 2006 2005 and Prior 6% 4% 8% 5% 2% 2% 6% 17% 26% 24% 2005 2006 2007 2008 2009 2010 2011 2012 2013 2014 Vintage 19 |
 20 ($ in Millions) Commercial Insurance – Institutional Markets Financial Highlights Reserves & Stable Value Wraps Assets Under Management Full Year 2012 Full Year 2013 Full Year 2014 Premiums and deposits $774 $991 $3,797 Premiums 458 610 432 Policy fees 102 113 187 Net investment income 2,066 2,090 1,957 Total operating revenues 2,626 2,813 2,576 Benefits and expenses 2,101 2,133 1,906 Pre-tax operating income $525 $680 $670 Stable profitability in 2014 as fee income was offset by lower net investment income. Reserves and assets under management growth driven by strong development of the stable value wrap business. $32,095 $36,129 $24,565 $32,320 $56,660 $68,449 $0 $10,000 $20,000 $30,000 $40,000 $50,000 $60,000 $70,000 $80,000 Dec. 31, 2013 Dec. 31, 2014 Total Reserves SVW – AUM |
 21 Consumer Insurance |
 22 Consumer Insurance – Strategy Customer Information- Driven Strategy Focused Growth Operational Effectiveness Profitability and Capital Management Investment Strategy Strive to be our customers’ most valued insurer. Through our unique franchise, which brings together a broad portfolio of retirement, life insurance and personal insurance products offered through multiple distribution networks, Consumer Insurance aims to provide customers with the products they need, delivered through the channels they prefer. Utilize customer insight, analytics and the application of science to optimize customer acquisition, product profitability, product mix, channel performance and risk management capabilities. Invest in areas where Consumer Insurance can grow profitably and sustainably. Target growth in select markets according to market size, growth potential, market maturity and customer demographics. Simplify processes, enhance operating environments, and leverage the best platforms and tools for multiple operating segments to increase competitiveness, improve service and product capabilities and facilitate delivery of our target customer experience. Deliver solid earnings through disciplined pricing, sustainable underwriting improvements and diversification of risk, and increase capital efficiency within insurance entities to enhance return on equity. Maintain a diversified, high quality portfolio of fixed maturity securities that largely matches the duration characteristics of related insurance liabilities, and pursue yield-enhancement opportunities that meet liquidity, risk and return objectives. Distinguish Ourselves in the Markets and Products We Choose. Be the Provider of Choice Among Our Target Segments and Channels. |
 23 Focused Growth Consumer Insurance – Market Maturity Model Early Stage Market Advanced Stage Market Product Channel Customer Segment Personal Accident Travel Warranty Auto & Home Life Health Retirement Micro Insurance Broad Market/ Wholesaling Career Agency, IFAs Public Agencies Financial Services Sponsors – including Brokers, Banks & Reinsurance Self-Employed Employed Emerging Banked Middle Class Affluent High Net Worth General Population |
 24 1) As of 3Q14 Year-to-Date. Based on LIMRA rankings for respective periods. 2) Source – Non-Life Insurance Statistics, AIG internal analysis (includes Medical products sold by Non-Life Insurance Companies) 3) Source – General Insurance Rating Organization of Japan. Consumer Insurance – Leading Market Positions U.S. Life and Retirement Businesses 1 Personal Insurance Rank Metric 3Q14 3Q13 2 2 Total Annuity Sales 1 1 Fixed-Rate Deferred Annuity Sales 3 5 Variable Annuity Sales 7 10 Total Life Issued 8 8 Term Life Sales 12 9 Universal Life Sales 2 2 Total K-12 Assets 3 3 Total 403(b) Assets U.S. – 40% of the Forbes 400 Richest Americans – 48% of the American Listed on the ARTnews Top 200 Collectors Japan Private Client Group 2 nd in Personal Accident with 20% market share 2 4 th in Personal Property with 13% market share 3 |
 25 Consumer Insurance Operations Continue to Be Recognized for Excellence Globally Consumer Insurance – Leading Businesses Market Tools – U.S. 2014 Achievement in Customer Excellence for Life Insurance (ACE Award for 7 Consecutive Year) DALBAR – U.S. 2014 Annuity Service Excellence Award (8 Consecutive Year) 2014 #1 Ranking for Annuity Client Quarterly Statements (14 Consecutive Year) 2014 Communication Seal for VALIC.com (3 Consecutive Year) 2014 Mobile InSIGHT – Innovations in the World of Apps Trailblazer Rating (VALIC Mobile for iPad) PlanSponsor Magazine – U.S. Earned 14 Best-in-Class Awards for Participant and Plan Sponsor Services for VALIC in 2014 International MarCom Awards – U.S. 2014 Platinum and Gold Awards for Retirement (34 in total) Insurance and Financial Communications Association – U.S. 2014 Best in Show and Awards of Excellence for Retirement (4 in total) Money Week Awards – China AIG Travel – China Named Best Travel Insurance Product in 2014 Underwriting Services Awards – U.K. AIG UK Group Travel and Personal Accident Team of the Year in 2014 Australian Business Awards 2014 ABA100 Winner for Best Technology Product in 2014 JD Power Asia Pacific – Japan AIG Japan (AIU, FFM and American Home) ranked #1 in 2014 Auto Insurance Claims Satisfaction survey (for 6 Year) Reader’s Digest – Singapore AIG Singapore Most Trusted Brand Award for Auto Insurance 2014 Indonesian Insurance Awards AIG Indonesia Named Best Private General Insurance 2014 Gaivota de Ouro Insurance Industry Awards, Seguro Total Magazine – Brazil AIG Brazil Earned Group Life Award in 2014 AVA Digital Awards – U.S. Earned 4 Platinum Awards in 2015 Travvy Awards – U.S. AIG Travel Named Top Travel Insurance Provider in 2015 Saigon Liberation Newspaper Awards AIG Travel Named Favorite Vietnamese Brand Award (9 Consecutive Year) Motordata Research Consortium – Malaysia AIG Malaysia Named Insurer of the Year 2014 MENA Insurance Awards – EMEA EMEA Consumer Named Most Innovative Insurer Product in 2014 Business Insurance 2014 Innovation Award – AIG Multinational Program Design Tool World Travel Fair AIG Travel Named Best Quality Service Travel Insurance Company for Travel Accident 2014 th th th th th rd |
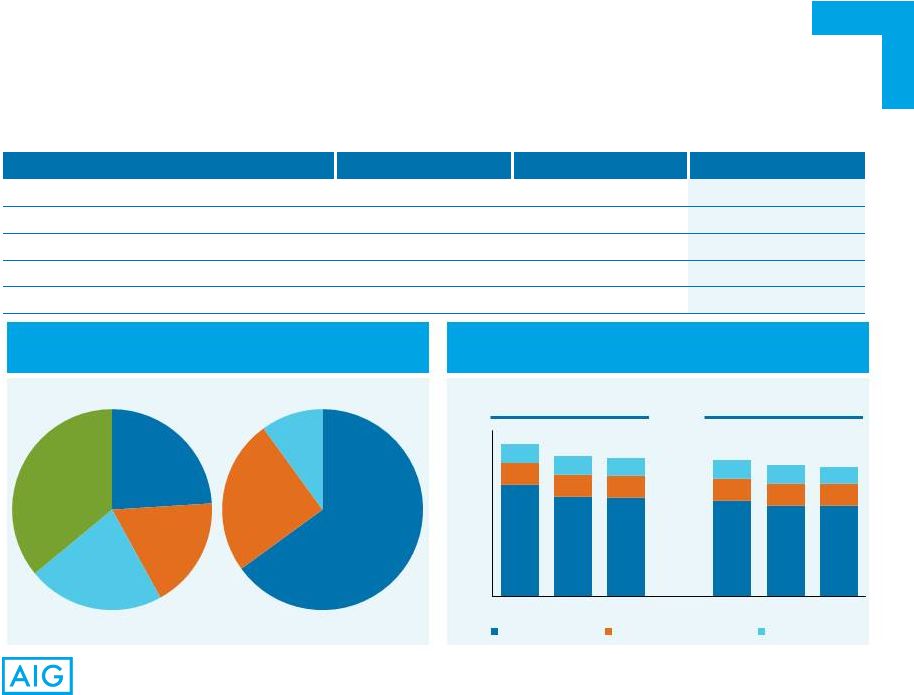
 26 1)Premiums and deposits include net premiums written for the Personal Insurance operating segment and premiums and deposits for the Retirement and Life operating segments. Consumer Insurance – Overview Life Personal Insurance Retirement Life Personal Insurance Retirement 12% 30% 58% 13% 9% 78% Premiums and Deposits Full Year 2014 – $41.3 Billion Pre-Tax Operating Income Full Year 2014 – $4.5 Billion 1 |
 27 * Retail Mutual Funds. 1) Includes activity related to closed blocks of fixed and variable annuities. Consumer Insurance – Retirement Financial Highlights RMF* Fixed Annuities Group Retirement Retirement Income Solutions RMF* and Advisory Group Fixed Annuities Group Retirement Retirement Income Solutions 14% 15% 28% 43% 6% 30% 42% 22% Premiums and Deposits Full Year 2014 – $24.1 Billion Assets Under Management December 31, 2014 – $224.2 Billion ($ in Millions) Full Year 2012 Full Year 2013 Full Year 2014 Premiums and deposits (1) $16,159 $23,788 $24,077 Premiums 120 188 287 Policy fees 743 861 1,010 Net investment income 6,502 6,628 6,489 Other income 1,344 1,754 1,998 Total operating revenues 8,709 9,431 9,784 Benefits and expenses 5,908 5,941 6,289 Pre - tax operating income $2,801 $3,490 $3,495 |
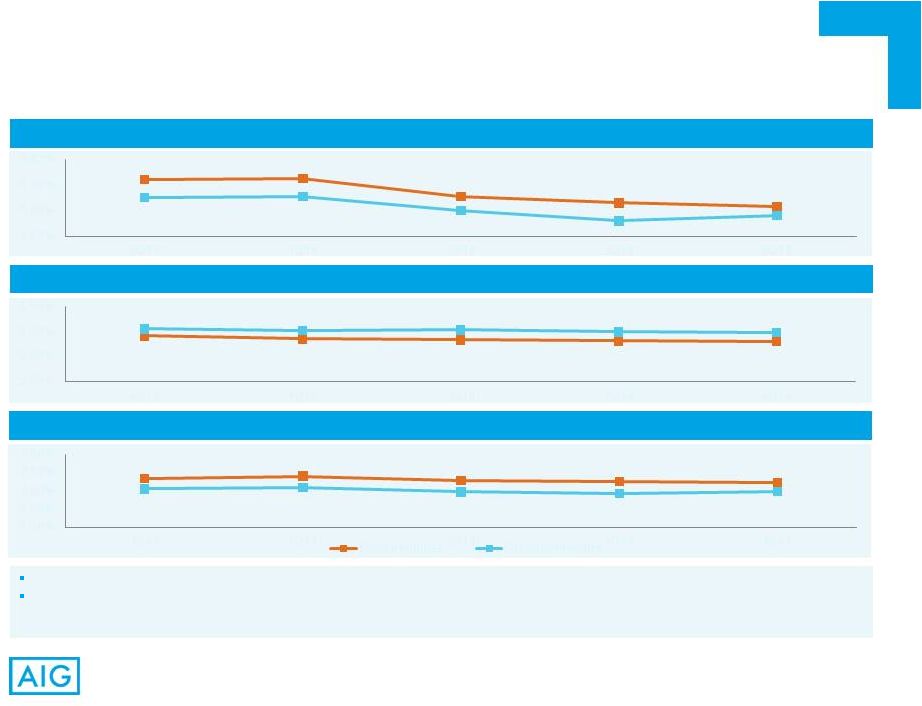 28 1) Includes return on base portfolio. Quarterly results are annualized. 2) Excludes the amortization of sales inducement assets. Consumer Insurance – Retirement – Base Yields and Spreads Trend in base yields reflects the reinvestment of cash flows at yields lower than the overall portfolio rate. Management remains focused on actions to reduce the cost of funds in order to support base spreads. In the fourth quarter, cost of funds continued to benefit from active management of crediting rates, disciplined new business pricing and the run-off of older business with crediting rates generally higher than the overall cost of funds. 5.24% 5.25% 5.11% 5.06% 5.03% 5.10% 5.11% 5.00% 4.92% 4.96% 4.80% 5.00% 5.20% 5.40% 4Q13 1Q14 2Q14 3Q14 4Q14 2.91% 2.85% 2.83% 2.81% 2.80% 3.05% 3.02% 3.03% 2.99% 2.98% 2.00% 2.50% 3.00% 3.50% 4Q13 1Q14 2Q14 3Q14 4Q14 2.33% 2.40% 2.28% 2.25% 2.23% 2.05% 2.09% 1.97% 1.93% 1.98% 1.00% 1.50% 2.00% 2.50% 3.00% 4Q13 1Q14 2Q14 3Q14 4Q14 Fixed Annuities Group Retirement Base Net Investment Spreads Cost of Funds Base Yields 1 2 1 |
 29 Individual variable annuities represented 17% of total reserves at September 30, 2014 for AIG’s U.S. life insurance companies. AIG significantly improved its industry ranking since 2009; remaining growth opportunity in variable annuities due to market share of only 8.0%. Disciplined pricing and de-risked benefits: VIX indexing of rider fees, volatility control funds, mandatory asset allocation to fixed accounts. Sales of index annuities with living benefits diversifies AIG’s guaranteed income offerings. * Source: LIMRA VA Sales report. VA industry sales data reported herein excludes Employer Plan sales and internal exchange sales. 1) Excludes $3.9 billion of AUM at VALIC with GMWB guarantees. 2) De-Risked Benefits: Features on contracts issued since 2010 (VIX indexing/volatility control fund in 2012). 3) Pre-2010 Partially De-Risked Benefits: Due to actual policyholder election of extension offers to-date. Consumer Insurance – Retirement – Individual Variable Annuities Industry Retail Variable Annuity Sales* Account Value by GMWB Guarantee at 12/31/14 (1) – $30.8 Billion Unique Opportunity for AIG 3Q YTD 2014 % Change 3Q YTD 2013 Company ($ in millions) Rank Sales Rank Sales Jackson National 1 18,413 19% 1 15,461 Lincoln Financial Group 2 9,326 (9%) 2 10,304 Prudential Financial 3 7,361 (16%) 3 8,811 AEGON/Transamerica 4 7,207 20% 5 6,011 AIG 5 6,816 16% 6 5,901 AXA Equitable 6 5,457 (1%) 7 5,498 Nationwide 7 4,538 11% 8 4,106 MetLife 8 3,868 (51%) 4 7,864 Ameriprise 9 3,521 (7%) 9 3,768 Pacific Life 10 3,288 0% 10 3,290 All Others 19,045 (2%) 19,369 Industry 88,841 (2%) 90,383 De-Risked Benefits Early Benefits Revised Benefits³ 6% 14% 80% 2 |
 30 $916.6 $1,000.7 Whole Life Term Life Health Other Universal Life U.S. Japan 1) Includes the acquisition of Ageas Protect. Consumer Insurance – Life Financial Highlights Decline in pre-tax operating income in 2014 primarily reflected an $104 million addition to reserves for IBNR death claims and lower net investment income. 22% 26% 20% 7% 25% 54% 46% $890.8 $906.2 $25.8 $94.5 $800 $850 $900 $950 $1,000 $1,050 2013 2014 Domestic International New Business Sales Full Year 2014 – $461 Million Gross Life Insurance In-Force End of Period, $ in Billions ($ in Millions) Full Year 2012 Full Year 2013 Full Year 2014 Premiums and deposits $4,864 $4,862 $4,806 Premiums 2,804 2,737 2,679 Policy fees 1,370 1,391 1,443 Net investment income 2,283 2,269 2,199 Total operating revenues 6,457 6,397 6,321 Benefits and expenses 5,721 5,591 5,741 Pre-tax operating income $736 $806 $580 1 |
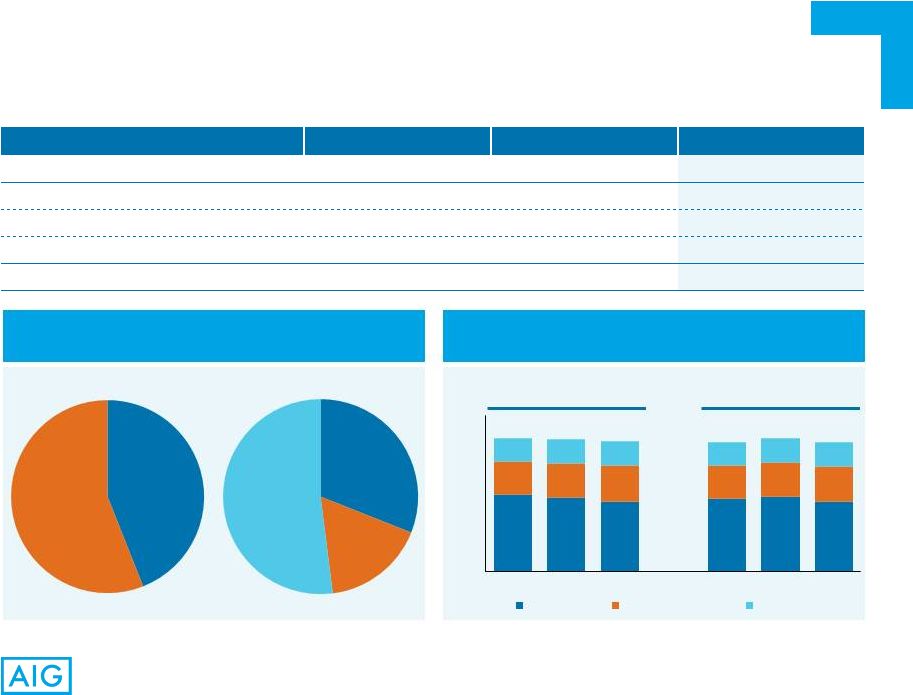 Consumer Insurance – Personal Insurance Financial Highlights Net Premiums Written FY 2014 – $12.4 Billion Combined Ratios ($ in Millions) Full Year 2012 Full Year 2013 Full Year 2014 Net premiums written $13,302 $12,700 $12,412 Net premiums earned 13,103 12,377 11,970 Underwriting income (loss) (278) (187) 5 Net investment income 477 455 394 Pre-tax operating income $199 $268 $399 Accident Year, as Adjusted Calendar Year 102.1 101.5 99.9 99.3 102.1 99.5 Accidental and Health Personal Lines Americas EMEA Asia Pacific 59.3 56.8 54.2 56.5 57.4 53.8 25.3 26.2 27.2 25.3 26.2 27.2 17.5 18.5 18.5 17.5 18.5 18.5 0 20 40 60 80 100 120 2012 2013 2014 2012 2013 2014 Loss Ratio Acquisition Ratio GOE Ratio 44% 56% 31% 17% 52% 31 |
 32 Balance Sheet and Other |
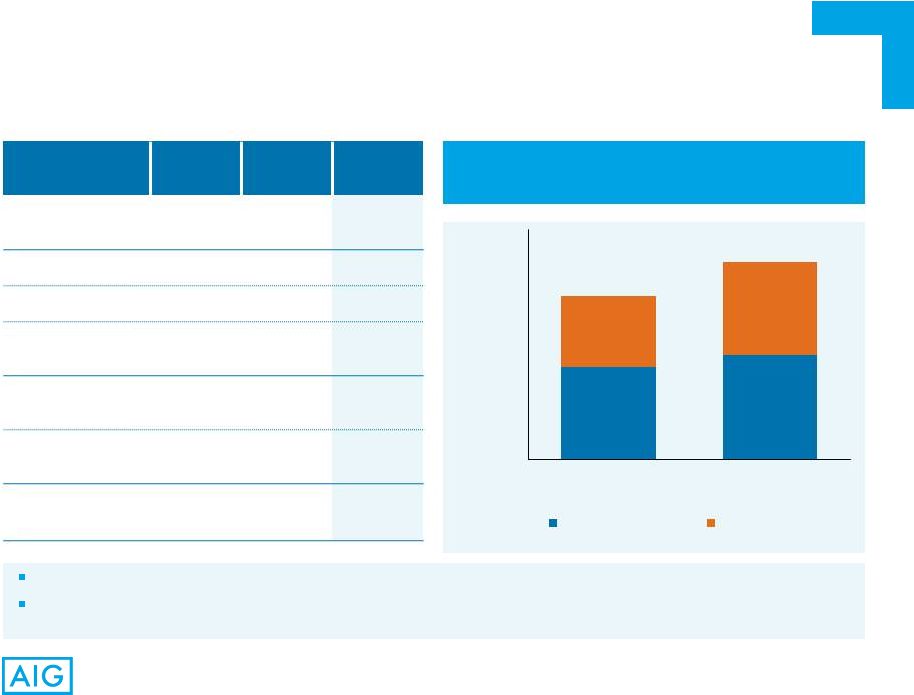
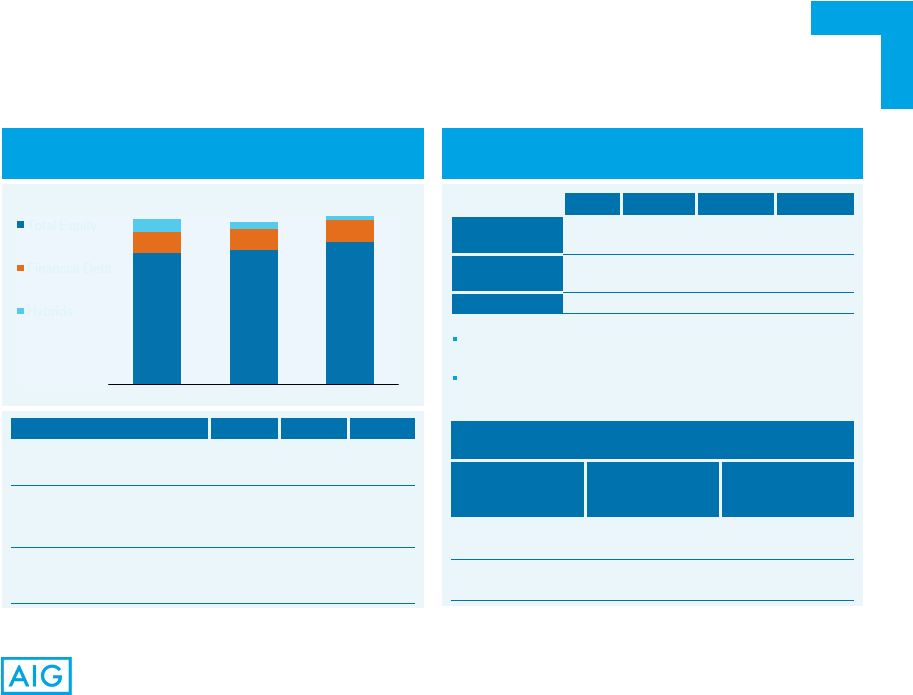 33 Credit Ratings Capital Structure ($ in Billions, Except per Share Data) 1) Includes AIG Notes, Bonds, Loans and Mortgages Payable, and AIG Life Holdings, Inc. (AIGLH) Notes and Bonds Payable and junior subordinated debt. 2) Excludes $1.2 billion aggregate principal amount of 3.875% Notes due 2035 and $800 million aggregate principal amount of 4.375% Notes due 2055 issued in January 2015. 3) Strong Capital Position As of the date of this presentation, all ratings have stable outlooks, except for Fitch which has positive outlooks. For Non-Life Insurance Companies FSR and Life Insurance Companies FSR, ratings only reflect those of the core insurance companies. $124.1 $122.3 Ratios: 2012 2013 2014 Hybrids/ Total capital 7.6% 4.5% 1.9% Financial debt/ Total capital 12.9% 12.8% 13.2% Financial debt and Hybrids/ Total capital 20.5% 17.3% 15.1% Risk Based Capital Ratios (3) Year End Domestic Life Insurance Companies Domestic Non-Life Insurance Companies 2013 568% (CAL) 416% (ACL) 2014 534% (CAL) 432% (ACL) S&P Moody’s Fitch AM Best AIG – Senior Debt A- Baa1 BBB+ NR AIG Non-Life – FSR A+ A1 A A AIG Life – FSR A+ A2 A+ A $126.4 1 2 $98.7 $101.1 $107.3 $16.1 $15.7 $16.6 $9.4 $5.5 $2.5 Dec. 31, 2012 Dec. 31, 2013 Dec. 31, 2014 Total Equity Financial Debt Hybrids The inclusion of RBC measures is intended solely for the information of investors and is not intended for the purpose of ranking any insurance company or for use in connection with any marketing, advertising or promotional activities. ACL is defined as Authorized Control Level and CAL is defined as Company Action Level. RBC ratio for Domestic Life Insurance Companies excludes holding company, AGC Life Insurance Company. |
 34 AIG Parent Liquidity ($ in Billions) Insurance Company Cash Distributions ($ in Millions) 1) Excludes an additional $1.1 billion of distributions of fixed maturity securities in 2014. Additional dividends declared in 4Q14 and paid in 1Q15 were $2.8 billion ($2.2 billion for Life Insurance Companies, which included $2.0 billion of fixed maturity securities, and $600 million for Non-Life Insurance Companies). 2) Reflects full year 2014 net tax sharing payments from insurance businesses of $1.0 billion. The tax sharing payments may be subject to further adjustment in future periods. Also includes $2.9 billion allocated toward future maturities of liabilities and contingent liquidity stress needs of the Direct Investment book and Global Capital Markets as of December 31, 2014. December 31, 2014 balance excludes $2.0 billion debt issuance in January 2015. Financial Flexibility – A Source of Strength $8,286 (1) $8,671 $4,349 $13.1 $9.8 (2) $1,496 $4,238 $1,834 $2,853 $4,433 $6,452 FY 2012 FY 2013 FY 2014 Life Insurance Companies $10.2 $5.1 $3.0 $4.7 Dec. 31, 2013 Dec. 31, 2014 Cash & Short-term Investments Non-Life Insurance Companies Unencumbered Fixed Maturity Securities |
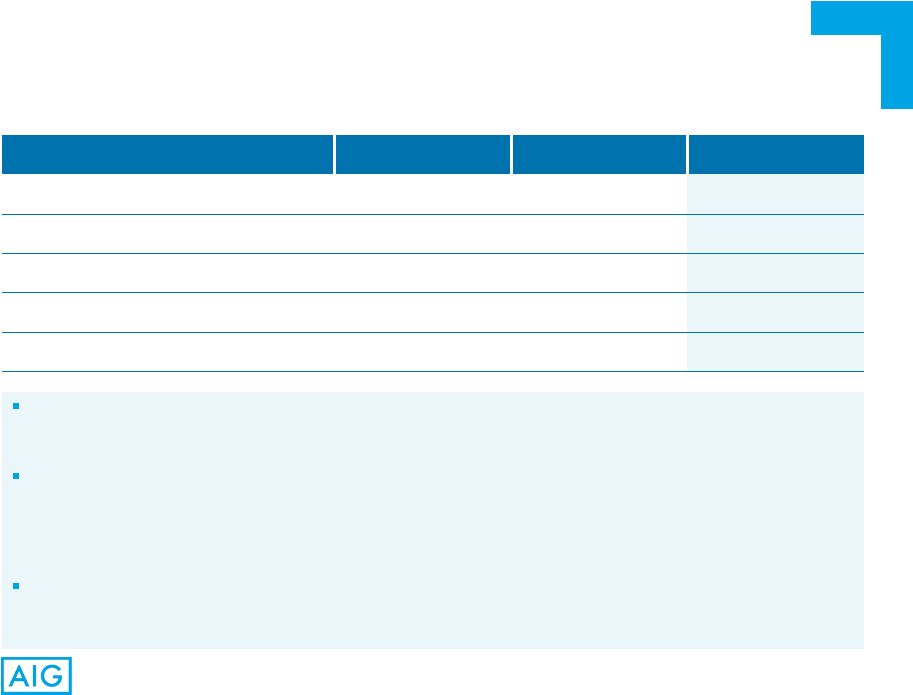
 35 AIG Continues to Have Substantial Deferred Tax Assets That Are Available to Offset Future Tax Obligations Deferred Tax Asset Overview As of 12/31/13 As of 12/31/14 ($ in Billions) Type Gross Attributes Deferred Tax Asset Gross Attributes Deferred Tax Asset Utilization/Expiration Net Operating Loss Carryforwards Non-Life & Life $35.8 $12.5 $29.4 $10.3 Utilize against Non-Life Insurance Companies, Corporate & Other and 35% of Life Insurance Companies’ income 2028–2031 Expiration Capital Loss Carryforwards Valuation Allowance Life $1.4 $0.5 ($0.5) – – – Capital loss carryforward fully utilized in 2014 Foreign Tax Credits General $5.3 $5.9 Utilize against 65% of Life Insurance Companies income 2016–2023 Expiration Subtotal – U.S. Tax Attributes 17.8 16.2 Other Deferred Tax Assets/(Liabilities) 3.4 2.5 Net Deferred Tax Assets $21.2 $18.7 |
 36 Business Mix Shifts Away from Long-Tail Casualty Lines and Accelerated Commutation of Legacy Portfolios (Especially 2004 and Prior) Are Expected to Also Reduce Reserve Variability Note: Allocation by accident year for illustration purposes only and subject to change. Net reserves presented above are shown before the effect of a $3.1 billion loss reserve discount. Net loss reserves for the Non-Life Insurance Companies includes Property Casualty, Personal Insurance, Mortgage Guaranty and run-off Non-Life Insurance Companies’ businesses. Reserves – Non-Life Insurance Businesses Net Reserves by Accident Year $64.7 Billion at December 31, 2014 Business mix shift to shorter-tail lines, expected to reduce net reserves 54% of reserves is from business that has been substantially re-underwritten (i.e. post 2011) Reduction in outstanding loss reserves for long-tail reserve segments expected to reduce reserve variability 2004 and Prior 2005–2007 2008–2010 2011–2014 17% 13% 16% 54% |
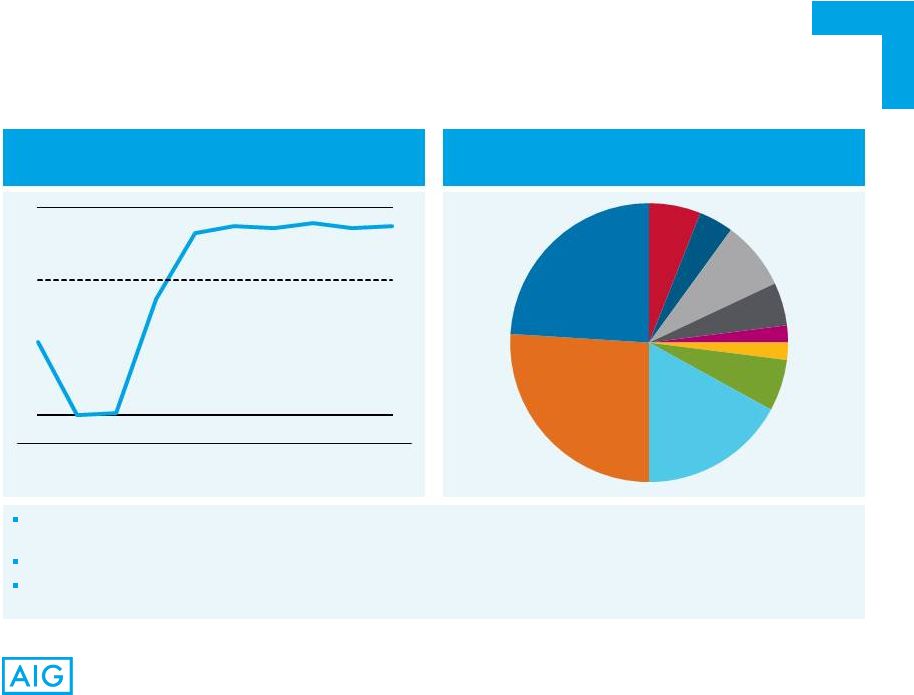
 37 1) Includes intercompany invested assets that are eliminated in consolidation. Non-Life Insurance Companies – Invested Assets Total Portfolio Composition Bond Portfolio – $94.7 Billion – by Agency Credit Rating Total Cash & Invested Assets as of December 31, 2014 – $121.8 Billion (1) Corporate debt Non-U.S. Governments U.S. Governments States municipalities, and political subdivisions Cash and short-term investments Loans Other invested assets Equities CDO/ABS RMBS CMBS AAA AA A BBB Not Rated BB B <B 2% 6% 4% 9% 6% 4% 18% 1% 11% 29% 20% 27% 25% 15% 3% 2% 8% <1% 10% |
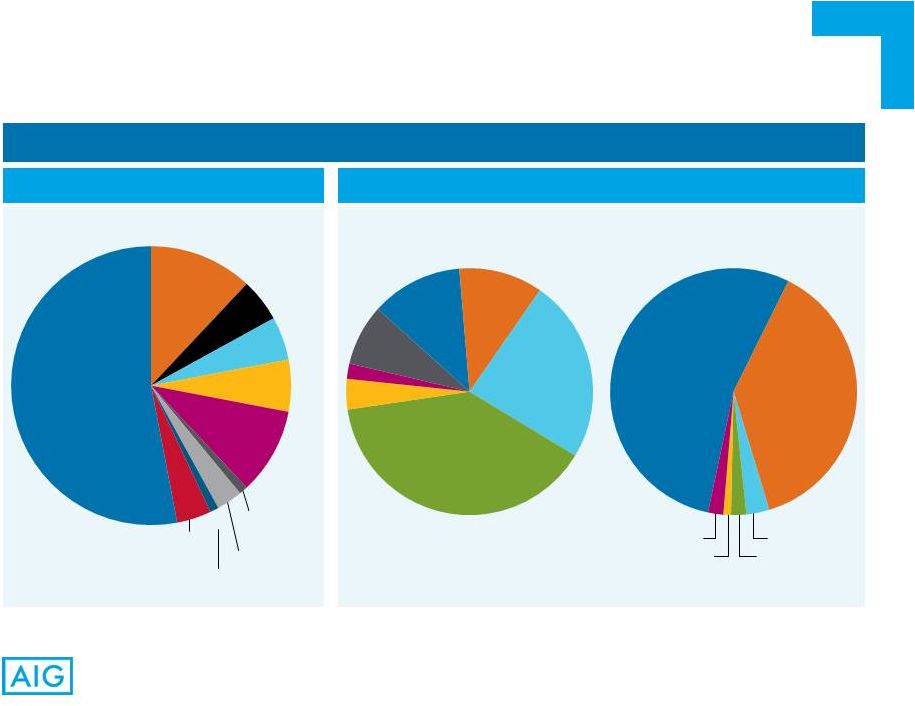 38 1) Includes intercompany invested assets that are eliminated in consolidation. 2) Excludes $4.3 billion of fixed maturity securities for which no NAIC Designation is available because they are not held in legal entities within Life Insurance Companies that require a statutory filing. A significant portion of instruments with below investment grade credit ratings from rating agencies are comprised of non-agency RMBS, most of which are rated higher when using the NAIC’s cash flow based evaluation approach comparing book value to expected recoveries. Life Insurance Companies – Invested Assets Total Portfolio Composition Bond Portfolio – $167.3 Billion Total Cash & Invested Assets as of December 31, 2014 – $202.8 Billion (1) Corporate debt RMBS CMBS CDO/ ABS Other invested assets Loans Cash and short-term investments Non-U.S. Governments U.S. Governments States, municipalities, and political subdivisions AAA AA A BBB BB B <B Not Rated NAIC 1 NAIC 2 NAIC 3 NAIC 4 NAIC 5 & 6 – 1% Not Rated By Agency Credit Rating By NAIC Ratings (2) 12% 5% 5% 6% 10% 1% 3% 1% 4% 53% 12% 11% 24% 39% 4% 2% 8% <1% 54% 38% 3% 2% 2% |
 39 (As of December 31, 2014) 1) The DIB consists of a portfolio of assets and liabilities held directly by AIG Parent in the MIP and certain non-derivative assets and liabilities of AIGFP. The DIB and GCM are included in Other Operations in AIG’s Consolidated Balance Sheet. 2) The overall hedging activity for the assets and liabilities of the DIB is executed by GCM. The value of hedges related to the non-derivative assets and liabilities of AIGFP in the DIB is included within the assets, liabilities and operating results of GCM and is not included within the DIB assets, liabilities or operating results. Direct Investment Book and Global Capital Markets ($ in Billions) Direct Investment Book¹ Global Capital Markets¹ Assets $15.1 $4.5 Liabilities 9.7 3.1 Net Asset Value $5.4 $1.4 ($ in Billions) Legacy Matched Assets & Liabilities Third-Party Derivatives Notional -- $45 Multi- Sector Corporate Arbitrage $1 $84 $3 $2 Weighted Average Life (Years) -- 8.5 4.7 2.7 8.4 8.3 Strategy Assets managed to ensure liabilities can be met as they come due, even under stress scenarios Primarily hedges of DIB assets and liabilities Bulk of risk related to interest rates, foreign exchange and equities has been hedged Remaining credit risk viewed as attractive risk- reward In July 2014, terminated additional Corporate Arbitrage CDSs with a notional amount of $9 billion Since 3Q 2012, notional value of $16 billion has been novated to Institutional Markets “Clearing house” for operating company hedging and risk management needs Increase of $38 billion during Q4 2014 is due to additional hedging and continued centralization of existing derivatives activity related to the operating companies Stable Value Wraps Go Forward Hedging Platform Market Derivatives (2) Legacy AIGFP CDS Portfolio AIG Hedging & |
 40 Appendix – Non-GAAP Measures |
 41 Operating revenue excludes Net realized capital gains (losses), Aircraft leasing revenues, income from legal settlements (included in Other income for GAAP purposes) and changes in fair values of fixed maturity securities designated to hedge living benefit liabilities, net if interest expense (included in Net investment income for GAAP purposes). Book Value Per Share Excluding Accumulated Other Comprehensive Income (AOCI) and Book Value Per Share Excluding AOCI and DTA (Deferred Tax Assets) are used to show the amount of our net worth on a per-share basis. We believe these measures are useful to investors because they eliminate the effect of non-cash items that can fluctuate significantly from period to period, including changes in fair value of our available for sale securities portfolio, foreign currency translation adjustments and U.S. tax attribute deferred tax assets. Book Value Per Share Excluding AOCI is derived by dividing Total AIG shareholders’ equity, excluding AOCI, by Total common shares outstanding. Book Value Per Share Excluding AOCI and DTA is derived by dividing Total AIG shareholders’ equity, excluding AOCI and DTA, by Total common shares outstanding. After-tax operating income attributable to AIG is derived by excluding the following items from net income attributable to AIG: General operating expenses, operating basis, is derived by making the following adjustments to general operating and other expenses: include (i) loss adjustment expenses, reported as policyholder benefits and losses incurred and (ii) investment expenses reported as net investment income, and exclude (i) advisory fee expenses, (ii) non-deferrable insurance commissions, (iii) direct marketing and acquisition expenses, net of deferrals, (iv) legal reserves related to legacy crisis matters and (v) other expense related to retroactive reinsurance agreement. We use general operating expenses, operating basis, because we believe it provides a more meaningful indication of our ordinary course of business operating costs. Glossary of Non-GAAP Financial Measures AIG – income and loss from divested businesses, including: • gain on the sale of International Lease Finance Corporation (ILFC); and • certain post-acquisition transaction expenses incurred by AerCap Holdings N.V. (AerCap) in connection with its acquisition of ILFC and the difference between expensing AerCap’s maintenance rights assets over the remaining lease term as compared to the remaining economic life of the related aircraft and related tax effects; – legacy tax adjustments primarily related to certain changes in uncertain tax positions and other tax adjustments; and – legal reserves and settlements related to legacy crisis matters, which include favorable and unfavorable settlements related to events leading up to and resulting from our September 2008 liquidity crisis and legal fees incurred as the plaintiff in connection with such legal matters. deferred income tax valuation allowance releases and charges; changes in fair value of fixed maturity securities designated to hedge living benefit liabilities (net of interest expense); changes in benefit reserves and deferred policy acquisition costs (DAC), value of business acquired (VOBA), and sales inducement assets (SIA) related to net realized capital gains and losses; other income and expense — net, related to Corporate and Other run-off insurance lines; loss on extinguishment of debt; net realized capital gains and losses; non-qualifying derivative hedging activities, excluding net realized capital gains and losses; income or loss from discontinued operations; |
 42 Pre-tax operating income and loss is derived by excluding the following items from pre-tax income and loss: Glossary of Non-GAAP Financial Measures (continued) Commercial Insurance: Institutional Markets; Consumer Insurance: Retirement and Life Pre-tax operating income is derived by excluding the following items from pre-tax income: Premiums and deposits: includes direct and assumed amounts received and earned on traditional life insurance policies, group benefit policies and life- contingent payout annuities, as well as deposits received on universal life, investment-type annuity contracts and mutual funds. Commercial Insurance: Property Casualty and Mortgage Guaranty; Consumer Insurance: Personal Insurance Corporate and Other – net gain or loss on sale of divested businesses, including: • gain on the sale of ILFC and • certain post-acquisition transaction expenses incurred by AerCap in connection with its acquisition of ILFC and the difference between expensing AerCap’s maintenance rights assets over the remaining lease term as compared to the remaining economic life of the related aircraft and our share of AerCap’s income taxes – Certain legal reserves and settlements related to legacy crisis matters described above Results from discontinued operations are excluded from all of these measures. – changes in fair values of fixed maturity securities designated to hedge living benefit liabilities (net of interest expense); – net realized capital gains and losses; – changes in benefit reserves and DAC, VOBA and SIA related to net realized capital gains and losses; – legal settlements related to legacy crisis matters described above. – loss on extinguishment of debt – net realized capital gains and losses – changes in benefit reserves and DAC, VOBA and SIA related to net realized capital gains and losses – income and loss from divested business, including Aircraft Leasing Pre-tax operating income: includes both underwriting income and loss and net investment income, but excludes net realized capital gains and losses, other income and expense — net and legal settlements related to legacy crisis matters described above. Underwriting income and loss is derived by reducing net premiums earned by losses and loss adjustment expenses incurred, acquisition expenses and general operating expenses. Ratios: We, along with most property and casualty insurance companies, use the loss ratio, the expense ratio and the combined ratio as measures of underwriting performance. These ratios are relative measurements that describe, for every $100 of net premiums earned, the amount of losses and loss adjustment expenses, and the amount of other underwriting expenses that would be incurred. A combined ratio of less than 100 indicates underwriting income and a combined ratio of over 100 indicates an underwriting loss. The underwriting environment varies across countries and products, as does the degree of litigation activity, all of which affect such ratios. In addition, investment returns, local taxes, cost of capital, regulation, product type and competition can have an effect on pricing and consequently on profitability as reflected in underwriting income and associated ratios. Accident year loss and combined ratios, as adjusted: both the accident year loss and combined ratios, as adjusted, exclude catastrophe losses and related reinstatement premiums, prior year development, net of premium adjustments, and the impact of reserve discounting. Catastrophe losses are generally weather or seismic events having a net impact in excess of $10 million each. |
 43 Non-GAAP Reconciliation – Operating Revenues Total Operating Revenues (In Millions) Full Year 2012 Full Year 2013 Full Year 2014 Total operating revenues $65,379 $61,524 $61,001 Reconciling Items: Changes in fair values of fixed maturity securities designated to living benefit liabilities, net of interest expense 37 (161) 260 Net realized capital gains 1,086 1,939 739 Income from divested businesses 4,502 4,420 1,602 Legal settlements related to legacy crisis matters 210 1,152 804 Total revenues $71,214 $68,874 $64,406 |
 44 Non-GAAP Reconciliation – Pre-tax and After-tax Operating Income Pre-tax and After-tax Operating Income (In Millions, Except Per Share Data) Full Year 2012 Full Year 2013 Full Year 2014 Pre-tax income from continuing operations $2,891 $9,368 $10,501 Adjustments to arrive at Pre-tax operating income: Changes in fair values of fixed maturity securities designated to hedge living benefit liabilities, net of interest expense (37) 161 (260) Changes in benefit reserves and DAC, VOBA and SIA related to net realized capital gains (losses) 1,213 1,608 217 Other (income) expense – net – 72 – Loss on extinguishment of debt 32 651 2,282 Net realized capital (gains) losses (1,086) (1,939) (739) (Income) loss from divested businesses, including gain on sale of ILFC 6,411 177 (2,169) Legal settlements related to legacy crisis matters (210) (1,152) (804) Legal reserves related to legacy crisis matters 754 444 546 Non-qualifying derivative hedging gains, excluding net realized capital gains (30) – – Pre-tax operating income $9,938 $9,390 $9,574 Net income attributable to AIG $3,438 $9,085 $7,529 Adjustments to arrive at After-tax operating income (amounts net of tax): Uncertain tax positions and other tax adjustments 543 791 59 Deferred income tax valuation allowance releases (1,911) (3,237) (181) Changes in fair values of fixed maturity securities designated to hedge living benefit liabilities, net of interest expense (24) 105 (169) Changes in benefit reserves and DAC, VOBA and SIA related to net realized capital gains (losses) 789 1,148 141 Other (income) expense – net – 47 – Loss on extinguishment of debt 21 423 1,483 Net realized capital (gains) losses (687) (1,285) (470) (Income) loss from discontinued businesses (1) (84) 50 (Income) loss from divested businesses, including gain on sale of ILFC 4,039 117 (1,462) Legal reserves (settlements) related to legacy crisis matters 353 (460) (350) Non-qualifying derivative hedging gains, excluding net realized capital gains (18) – – After-tax operating income $6,542 $6,650 $6,630 After-tax operating income per diluted share $3.88 $4.49 $4.58 |
 45 Non-GAAP Reconciliation – Book Value Per Share and Return On Equity Book Value Per Common Share ($ in Millions, Except Per Share Data) Dec. 31, 2011 Dec. 31, 2012 Dec. 31, 2013 Dec. 31, 2014 Total AIG shareholders’ equity (a) $101,538 $98,002 $100,470 $106,898 Less: Accumulated other comprehensive income (AOCI) (6,481) (12,574) (6,360) (10,617) Total AIG shareholders’ equity, excluding AOCI (b) 95,057 85,428 94,110 96,281 Less: Deferred tax assets (DTA)* (20,007) (18,549) (17,797) (16,158) Total AIG shareholders’ equity, excluding AOCI and DTA (c) 75,050 $66,879 $76,313 $80,123 Total common shares outstanding (d) 1,896.8 1,476.3 1,464.1 1,375.9 Book value per share (a÷d) $53.53 $66.38 $68.62 $77.69 Book value per share, excluding AOCI (b÷d) $50.11 $57.87 $64.28 $69.98 Book value per share, excluding AOCI and DTA (c÷d) $39.57 $45.30 $52.12 $58.23 Return On Equity (ROE) Computations ($ in Millions) Twelve Months Ended Dec. 31, 2012 Dec. 31, 2013 Dec. 31, 2014 Actual or annualized net income attributable to AIG (a) $3,438 $9,085 $7,529 Actual or annualized after-tax operating income (b) $6,542 $6,650 $6,630 Average AIG shareholders’ equity (c) 101,873 98,850 105,589 Less: Average AOCI (9,718) (8,865) (9,781) Average AIG shareholders’ equity, excluding average AOCI (d) 92,155 89,985 95,808 Less: Average DTA (19,250) (18,150) (16,611) Average AIG shareholders’ equity, excluding average AOCI and DTA (c) $72,905 $71,835 $79,197 ROE (a÷c) 3.4% 9.2% 7.1% ROE – after-tax operating income, excluding AOCI (b÷d) 7.1% 7.4% 6.9% ROE – after-tax operating income, excluding AOCI and DTA (b÷c) 9.0% 9.3% 8.4% |
 46 Property Casualty Accident Year Combined Ratio, As Adjusted Full Year 2012 Full Year 2013 Full Year 2014 Loss ratio 80.5 71.9 71.6 Catastrophe losses and reinstatement premiums (10.9) (3.4) (2.9) Prior year development net of premium adjustments (1.2) (1.5) (2.8) Net reserve discount benefit (change) 0.5 (1.6) (0.3) Accident year loss ratio, as adjusted 68.9 65.4 65.6 Acquisition ratio 16.6 16.1 15.7 General operating expense ratio 13.8 13.6 12.9 Expense ratio 30.4 29.7 28.6 Combined ratio 110.9 101.6 100.2 Catastrophe losses and reinstatement premiums (10.9) (3.4) (2.9) Prior year development net of premium adjustments (1.2) (1.5) (2.8) Net reserve discount benefit (charge) 0.5 (1.6) (0.3) Accident year combined ratio, as adjusted 99.3 95.1 94.2 Non-GAAP Reconciliation – Accident Year Combined Ratio, as Adjusted Personal Insurance Accident Year Combined Ratio, As Adjusted Full Year 2012 Full Year 2013 Full Year 2014 Loss ratio 59.3 56.8 54.2 Catastrophe losses and reinstatement premiums (3.0) (0.7) (1.1) Prior year development net of premium adjustments 0.2 1.3 0.7 Accident year loss ratio, as adjusted 56.5 57.4 53.8 Acquisition ratio 25.3 26.2 27.2 General operating expense ratio 17.5 18.5 18.5 Expense ratio 42.8 44.7 45.7 Combined ratio 102.1 101.5 99.9 Catastrophe losses and reinstatement premiums (3.0) (0.7) (1.1) Prior year development net of premium adjustments 0.2 1.3 0.7 Accident year combined ratio, as adjusted 99.3 102.1 99.5 |
 Non-GAAP Reconciliation – Premiums and Deposits Retirement Premiums and Deposits ($ in Millions) Year Ended December 31, 2012 2013 2014 Premiums and Deposits $16,048 $23,729 $24,023 Deposits (16,203) (23,690) (23,903) Other 275 149 167 Premiums $120 $188 $287 Consumer Premiums and Deposits ($ in Millions) Year Ended December 31, 2014 Total Retirement Premiums and Deposits $24,077 Total Life Premiums and Deposits 4,806 Net Premiums Written for Personal Insurance 12,412 Total Premiums and Deposits $41,295 Life Premiums and Deposits ($ in Millions) Year Ended December 31, 2012 2013 2014 Premiums and Deposits $4,864 $4,862 $4,806 Deposits (1,531) (1,541) (1,532) Other (529) (584) (595) Premiums $2,804 $2,737 $2,679 Institutional Markets Premiums and Deposits ($ in Millions) Year Ended December 31, 2012 2013 2014 Premiums and Deposits $774 $991 $3,797 Deposits (289) (354) (3,344) Other (27) (27) (21) Premiums $458 $610 $432 47 |
 American International Group, Inc. (AIG) is a leading global insurance organization serving customers in more than 100 countries and jurisdictions. AIG companies serve commercial, institutional, and individual customers through one of the most extensive worldwide property-casualty networks of any insurer. In addition, AIG companies are leading providers of life insurance and retirement services in the United States. AIG common stock is listed on the New York Stock Exchange and the Tokyo Stock Exchange. Additional information about AIG can be found at www.aig.com | YouTube: www.youtube.com/aig | Twitter: @AIG_LatestNews | LinkedIn: http://www.linkedin.com/company/aig AIG is the marketing name for the worldwide property-casualty, life and retirement, and general insurance operations of American International Group, Inc. For additional information, please visit our website at www.aig.com. All products and services are written or provided by subsidiaries or affiliates of American International Group, Inc. Products or services may not be available in all countries, and coverage is subject to actual policy language. Non-insurance products and services may be provided by independent third parties. Certain property-casualty coverages may be provided by a surplus lines insurer. Surplus lines insurers do not generally participate in state guaranty funds, and insureds are therefore not protected by such funds. |