American International Group, Inc. Investor Presentation First Quarter 2015 May 12, 2015 Exhibit 99.1 |
Cautionary Statement Regarding Forward Looking Information This document and the remarks made within this presentation may include, and officers and representatives of American International Group, Inc. (AIG) may from time to time make, projections, goals, assumptions and statements that may constitute “forward-looking statements” within the meaning of the Private Securities Litigation Reform Act of 1995. These projections, goals, assumptions and statements are not historical facts but instead represent only AIG’s belief regarding future events, many of which, by their nature, are inherently uncertain and outside AIG’s control. These projections, goals, assumptions and statements include statements preceded by, followed by or including words such as “believe,” “anticipate,” “expect,” “intend,” “plan,” “view,” “target” or “estimate”. It is possible that AIG’s actual results and financial condition will differ, possibly materially, from the results and financial condition indicated in these projections, goals, assumptions and statements. Factors that could cause AIG’s actual results to differ, possibly materially, from those in the specific projections, goals, assumptions and statements include: changes in market conditions; the occurrence of catastrophic events, both natural and man-made; significant legal proceedings; the timing and applicable requirements of any new regulatory framework to which AIG is subject as a nonbank systemically important financial institution and as a global systemically important insurer; concentrations in AIG’s investment portfolios; actions by credit rating agencies; judgments concerning casualty insurance underwriting and insurance liabilities; judgments concerning the recognition of deferred tax assets; and such other factors discussed in Part I, Item 2. Management’s Discussion and Analysis of Financial Condition and Results of Operations (MD&A) in AIG’s Quarterly Report on Form 10-Q for the quarterly period ended March 31, 2015 and in Part I, Item 1A. Risk Factors and Part II, Item 7. MD&A in AIG’s Annual Report on Form 10-K for the year ended December 31, 2014. AIG is not under any obligation (and expressly disclaims any obligation) to update or alter any projections, goals, assumptions or other statements, whether written or oral, that may be made from time to time, whether as a result of new information, future events or otherwise. This document and the remarks made orally may also contain certain non-GAAP financial measures. The reconciliation of such measures to the most comparable GAAP measures in accordance with Regulation G is included in the First Quarter 2015 Financial Supplement available in the Investor Information section of AIG's corporate website, www.aig.com, as well as in the Appendix to this presentation. Note: Information included in the presentation is as of March 31, 2015, unless otherwise indicated. 2 |
A Global Insurance Company Balancing Growth, Profitability, and Risk AIG Today Value-Based Metrics Economic risk selection based on risk adjusted profitability and value of new business Information-driven underwriting approach Reduced exposure to capital intensive lines of business Balance Sheet Quality and Strength Significant de-risking of the balance sheet Optimizing economic return on non-core assets Actively managing capital for sustained strength and stability Scale, Diversity, and Sustainability Unique global insurance franchise serving customers in over 100 countries and jurisdictions A sustained history of product innovation meeting our customers’ risk demands Financial strength supporting our commitment to customers 3 |
4 Building Long Term Intrinsic Value Simplifying Balance Sheet & Reducing Risk Reductions in non-core risk assets Improved balance sheet strength Multiple sources of liquidity, including insurance subsidiaries and DTA Well balanced investment portfolio Operational Performance Three year financial targets (book value, ROE, and expense reduction) Improvement in Property Casualty accident year loss ratio Optimizing business mix Managing net investment spreads Active Capital Management Organic growth Share repurchases Dividends Liability management M&A |
A Foundation for Sustainability Accelerated wind down of DIB/GCM will eliminate separate reporting Legacy Financial Products derivatives portfolio insignificant relative to AIG’s overall balance sheet Balance sheet management actions reduced risk, leverage, and volatility A Simplified and Significantly De-Risked Balance Sheet Super Senior CDS ($ in Billions, Notional Amounts) AIG 5-Year CDS (bps) Total Assets to Note: AIG 5-Year CDS is sourced from Bloomberg. ~92% ~14% ~54% (As of Period End) 5 $15.9 $15.1 $5.1 $1.2 2012 2013 2014 1Q15 5.6x 5.4x 4.8x 4.8x 2012 2013 2014 1Q15 130 72 48 60 2012 2013 2014 1Q15 Shareholders’ Equity |
6 AIG Consolidated Balance Sheet Selected Highlights ($ in Millions, Except per Share Amounts) Dec. 31, 2012 Dec. 31, 2013 Dec. 31, 2014 Mar. 31, 2015 Cash and investments $376,975 $358,669 Total assets 548,633 541,329 Net property casualty reserves 68,782 64,316 Life insurance companies reserves 1 159,508 160,887 Financial and hybrid debt 25,466 21,199 AIG shareholders’ equity 98,002 100,470 Less: Accumulated other comprehensive income (AOCI) (12,574) (6,360) Less: Deferred tax assets (DTA) 3 (18,549) (17,797) AIG shareholders’ equity – ex. AOCI & DTA $66,879 $76,313 $357,524 $358,636 515,581 520,701 61,612 165,647 166,187 19,106 21,214 2 106,898 107,979 (10,617) (10,657) (16,158) $80,123 $81,756 60,143 Note: Refer to Appendix included herein for Non-GAAP reconciliations. 1) Represents Life Insurance Companies’ future policy benefits, policyholder contract deposits, and excludes separate accounts. 2) Does not reflect repurchases through cash tender offers of Parent debt during April 2015. 3) Represents U.S. tax attributes related to net operating loss carryforwards and foreign tax credits. (15,566) |
Credit Ratings Capital Structure ($ in Billions, Except per Share Data) Strong Capital Position As of the date of this presentation, all ratings have stable outlooks, except for Fitch which has positive outlooks. For Non-Life Insurance Companies FSR and Life Insurance Companies FSR, ratings only reflect those of the core insurance companies. $124.1 $122.3 Ratios: Dec. 31 2012 Dec. 31 2013 Dec. 31 2014 Mar. 31 2015 Hybrids / Total capital Financial debt / Total capital Total debt / Total capital Risk Based Capital Ratios Year End Domestic Life Insurance Companies Domestic Non-Life Insurance Companies 2013 2014 S&P Moody’s Fitch AM Best AIG – Senior Debt A- Baa1 BBB+ NR AIG Non-Life – FSR A+ A1 A A AIG Life – FSR A+ A2 A+ A $126.4 $129.6 $98.7 $101.1 $107.3 108.4 $15.7 $16.6 $18.8 $9.4 $5.5 $2.5 $2.4 Dec. 31, 2012 Dec. 31, 2013 Dec. 31, 2014 Mar. 31, 2015 $16.1 Total Equity Financial Debt Hybrids 7.6% 12.9% 20.5% 4.5% 12.8% 17.3% 1.9% 13.2% 15.1% 1.9% 14.5% 16.4% 2 7 1 568% (CAL) 534% (CAL) 416% (ACL) 432% (ACL) 1) Includes AIG notes, bonds, loans and mortgages payable, and AIG Life Holdings, Inc. (AIGLH) notes and bonds payable and junior subordinated debt. 2) The inclusion of RBC measures is intended solely for the information of investors and is not intended for the purpose of ranking any insurance company or for use in connection with any marketing, advertising or promotional activities. ACL is defined as Authorized Control Level and CAL is defined as Company Action Level. RBC ratio for Domestic Life Insurance Companies excludes its holding company, AGC Life Insurance Company. |
8 AIG Parent Liquidity ($ in Billions) Insurance Company Distributions ($ in Millions) Financial Flexibility $4,349 $9.8 $8,671 $10,417 $3,528 $11.3 Multiple Sources of Liquidity $1,496 $4,238 $2,618 $800 $2,853 $4,433 $6,761 $2,437 $1,038 $291 FY 2012 FY 2013 FY 2014 1Q15 $5.1 $6.3 $4.7 $5.0 Dec. 31, 2014 March 31, 2015 Cash & Short-term Investments Unencumbered Fixed Maturity Securities 1) Includes distributions of both cash and fixed maturity securities. Non-Life Insurance Companies Life Insurance Companies Tax Sharing Payments, Net 1 2 2) Includes $2.9 billion and $2.1 billion for December 31, 2014 and March 31, 2015, respectively, allocated toward future maturities of liabilities and contingent liquidity stress needs of the Direct Investment book and Global Capital Markets. |
9 Continued Monetization of Deferred Tax Assets Deferred Tax Assets 9 As of 12/31/13 As of 12/31/14 ($ in Billions) Type Gross Attributes Deferred Tax Asset Gross Attributes Deferred Tax Asset Utilization/Expiration Net Operating Loss Carryforwards Non-Life & Life $35.8 $12.5 $29.4 $10.3 Utilize against Non-Life Insurance Companies, Corporate & Other and 35% of Life Insurance Companies’ income 2028–2031 Expiration Capital Loss Carryforwards Valuation Allowance Life $1.4 $0.5 ($0.5) – – – Capital loss carryforward fully utilized in 2014 Foreign Tax Credits General $5.3 $5.9 Utilize against 65% of Life Insurance Companies income 2016–2023 Expiration Subtotal – U.S. Tax Attributes 17.8 16.2 Other Deferred Tax Assets/(Liabilities) 3.4 2.5 Net Deferred Tax Assets $21.2 $18.7 |
10 1) Includes intercompany invested assets that are eliminated in consolidation. Non-Life Insurance Companies – Invested Assets Total Portfolio Composition Bond Portfolio – $94.7 Billion – by Agency Credit Rating Total Cash & Invested Assets as of March 31, 2015 – $119.7 Billion Corporate debt Non-U.S. Governments U.S. Governments States, municipalities, and political subdivisions Cash and short-term investments Loans Other invested assets Equities CDO/ABS RMBS CMBS AAA AA A BBB Not Rated BB B <B 1 11% 3% 6% 3% 8% 6% 4% 18% 1% 10% 30% 19% 27% 25% 16% 3% 2% 8% <1% |
1) Includes intercompany invested assets that are eliminated in consolidation. Life Insurance Companies – Invested Assets Total Cash & Invested Assets as of March 31, 2015 – $203.5 Billion Corporate debt RMBS CMBS CDO/ ABS Other invested assets Loans Cash and short-term investments Non-U.S. Governments U.S. Governments States, municipalities, and political subdivisions AAA AA A BBB BB B <B Not Rated NAIC 1 NAIC 2 NAIC 3 NAIC 4 NAIC 5 & 6 – 1% Not Rated By Agency Credit Rating By NAIC Ratings 13% 10% 23% 39% 4% 3% 8% 12% 5% 6% 6% 10% 1% 4% 52% 54% 38% 2% 2% <1% 3% 3% 1% 11 1 Total Portfolio Composition Bond Portfolio – $167.8 Billion |
1) General operating expenses, operating basis (see non-GAAP measures in appendix). Progress on Financial Targets Annual Targets Through 2017 2015 Target 1Q15 Commentary 10+% Growth in Book Value Per Share, ex. AOCI and DTA $64.05 $60.69 Growth of 4% since year-end 2014 was largely driven by net earnings, including significant net realized capital gains in 1Q15, as well as accretive share repurchases. ~50+ bps Increase in Normalized ROE, ex. AOCI and DTA 7.9% 7.8% 1Q15 demonstrates progress towards our full year target, however, volatility can impact quarter-to-quarter returns. 3–5% Reduction in $350 - $600 $95 from 1Q14 Net expenses declined 3% from 1Q14. Progress on Financial Targets ($ in Millions, Except per Share Amounts) 12 Net Expenses 1 |
Consistent Value Creation for Shareholders Book Value Per Share Growth Book Value Per Share $39.57 $45.30 $52.12 $58.23 $60.69 $3.42 $8.51 $4.34 $7.71 $7.91 $10.54 $12.57 $12.16 $11.75 $11.56 $53.53 $66.38 $68.62 $77.69 $80.16 Dec. 31, 2011 Dec. 31, 2012 Dec. 31, 2013 Dec. 31, 2014 March 31, 2015 BVPS, Ex. AOCI & DTA AOCI DTA 13 |
Normalized ROE, Ex. AOCI & DTA* Full Year 2014 First Quarter 2015 Pre-tax After-tax ROE Pre-tax After-tax ROE As reported $9,574 $6,630 8.4% $2,527 $1,691 8.4% Adjustments to arrive at Normalized ROE, ex. AOCI & DTA: Catastrophe losses below expectations (821) (534) (0.7%) (113) (74) (0.4%) Better than expected alternative returns (340) (221) (0.3%) (141) (92) (0.4%) Better than expected DIB & GCM returns (939) (610) (0.8%) (60) (39) (0.2%) Fair value changes on PICC investments (164) (107) (0.1%) (54) (35) (0.2%) DAC Unlocking (127) (83) (0.1%) - - - Net reserve discount charge 478 311 0.4% 165 107 0.5% Life Insurance – IBNR death claims 104 68 0.1% - - - Unfavorable prior year loss reserve development 598 389 0.5% 35 23 0.1% Normalized ROE, ex. AOCI & DTA $8,363 $5,843 7.4% $2,359 $1,581 7.8% * Normalizing adjustments are tax effected using a 35% tax rate and computed based on average shareholders’ equity, excluding AOCI and DTA, for the respective period. 14 |
Targeting 3-5% of Annual Reduction Through 2017 General Operating Expenses Note: General operating expenses, operating basis (see non-GAAP measures in appendix). General operating expenses, operating basis, declined 3% from 1Q14. General Operating Expenses, Operating Basis ($ in Millions) $2,071 $2,238 $2,206 $2,206 $1,972 $376 $368 $355 $365 $369 $407 $418 $408 $434 $423 $25 $28 $24 $11 $20 $2,879 $3,052 $2,993 $3,016 $2,784 1Q14 2Q14 3Q14 4Q14 1Q15 General operating expenses Other acquisition expenses Loss adjustment expenses Investment and other expenses 15 We manage our expenses on a gross basis – before allocation to loss adjustment expenses, other acquisition expenses and investment and other expenses – as it provides a more meaningful indication of our fixed operating costs. |
($ in Billions) Market capitalization data from Bloomberg as of year ended December 31 except for 2015, which is as of March 31. Note: Liability management amounts exclude activities related to the Direct Investment book. 1) Represents shares purchased from the Department of Treasury. 2) Reflects repurchase of Parent debt in cash tenders in April 2015. AIG – Returning Capital to Stakeholders Legacy debt reductions decreased net annual interest expense by approximately $500 million 2 since 2012 $3.5 billion increase in share repurchase authorization in April 2015 $6 billion in year-to-date authorization excludes further de-risking activity or monetization of non- core assets Stable cash flows from operating companies 1 $0.0 $10.0 $20.0 $30.0 $40.0 $50.0 $60.0 $70.0 $80.0 $13.0 $13.6 $18.5 $19.9 $3.3 $6.5 $5.1 $0.3 $1.0 $1.2 $13.0 $17.2 $26.0 $26.2 $52.1 $74.7 $77.1 $73.8 $0 $5 $15 $20 $25 $30 $35 2012 Cumulative 2012–2013 Cumulative 2012–2014 Cumulative 2012– 3/31/2015 $10 Share Repurchases Dividends Liability Management, Net Market Capitalization 16 |
Note: Refer to Appendix included herein for Non-GAAP reconciliations. AIG Consolidated Operating Financial Highlights Full Year First Quarter ($ in Millions, Except per Share Amounts) 2012 2013 2014 2015 Operating revenues $65,379 $61,524 $61,001 $14,590 Pre-tax operating income: Commercial Insurance 2,215 4,980 5,510 1,462 Consumer Insurance 3,736 4,564 4,474 945 Total Insurance Operations 5,951 9,544 9,984 2,407 Corporate and Other 3,987 (154) (410) 120 Total Pre-tax operating income $9,938 $9,390 $9,574 $2,527 After-tax operating income attributable to AIG $6,542 $6,650 $6,630 $1,691 After-tax operating income attributable to AIG per common share - diluted $3.88 $4.49 $4.58 $1.22 ROE – After-tax operating income – ex. AOCI & DTA 9.0% 9.3% 8.4% 8.4% 17 |
Retirement 16% Life 11% Personal Insurance 20% Total Operating Revenue of $61.0 Billion for FY 2014 Note: Percentages computed based on total AIG operating revenues. 1) AIG – A Diverse Customer-Focused Operating Platform Commercial Insurance FY 2014 Operating Revenue $28.8 Billion, 47% Consumer Insurance FY 2014 Operating Revenue $28.5 Billion, 47% FY 2014 Operating Revenue $3.7 Billion, 6% Property Casualty 41% Mortgage Guaranty 2% Institutional Markets 4% 18 Corporate and Other 1 Includes AIG Parent, Global Capital Markets, Direct Investment book, Runoff insurance lines, and AIG Life Holdings (a non-operating holding company) and consolidation, eliminations and other adjustments. |
19 Commercial Insurance |
Commercial Insurance – Strategy Customer Strategic Growth Underwriting Excellence Claims Excellence Operational Effectiveness Capital Efficiency Investment Strategy Strive to be our customers’ most valued insurer by offering innovative products, superior service and access to an extensive global network Grow our higher-value businesses while investing in transformative opportunities Improve our business portfolio through better pricing and risk selection by using enhanced data, analytics and the application of science to deliver superior risk- adjusted returns Improve claims processes, analytics and tools to deliver superior customer service and decrease our loss ratio Continue initiatives to modernize our technology and infrastructure; implement best practices to improve speed and quality of service Increase capital fungibility and diversification, streamline our legal entity structure, optimize reinsurance and improve tax efficiency Increase asset diversification and take advantage of yield- enhancement opportunities to meet our capital, liquidity, risk and return objectives Strategic Levers to Drive Shareholder Value Creation 20 |
Commercial Insurance – Diversified Products and Services General Liability Commercial Automobile Liability Workers’ Compensation Excess Casualty Crisis Management Risk Management Other Customized Structured Programs for Large Corporate and Multinational Customers Global Property covers exposures to man- made and natural disasters, includes business interruption Industrial, Energy and Commercial Property Multinational Property Directors & Officers Liability, Errors & Omissions Cyber Security Fidelity Employment Practices Fiduciary Liability Kidnap and Ransom Aerospace Environmental Political Risk Trade Credit Marine Surety Package Protects mortgage investors against the risk of borrower default related to high loan to value mortgages First-Lien Mortgage Guaranty Insurance Stable Wrap Products Structured Settlement and Terminal Funding Annuities High Net Worth Products Corporate- and Bank-owned Life Insurance GICs Specialty Property Financial Lines Property Casualty Mortgage Guaranty Institutional Markets 21 Financial Lines Casualty |
22 Commercial Insurance – A Market Leader Significant Market Positions Ranked among the top 10 most preferred commercial insurance carriers. 1 Recognized leader in the Construction/Builders, Cyber, Directors and Officers, Employment Practices, Environmental, Errors and Omissions, Excess and Surplus, General Liability, Marine – Ocean, Medical Malpractice, Terrorism, Umbrella/Excess Liability, and Workers’ Compensation markets. 1 Recognized as being in the top 25% of insurers for handling of producers’ global insurance needs. 1 #1 in casualty claims service among insurers and TPAs by U.S. clients with more than $1 billion in revenue 5 Superior Sales & Underwriting Capabilities #1 commercial insurer in the U.S. with an established and growing position in Latin America 2 ; #1 insurer of Terrorism, Medical Malpractice, Excess and Surplus, Environmental, Errors and Omissions 1 and Mortgage Guaranty insurance 3 ; #1 carrier in the Directors and Officers, Employment Practices Liability Insurance, Umbrella/Excess Liability markets 4 ; #1 carrier in the Fiduciary Liability market 4 ; #2 provider of Umbrella/Excess Liability and Cyber insurance 1 ; #2 carrier in the Property market 4 ; Ranked 2 nd largest group in the U.S. surplus lines market in 2013 6 ; Lexington Insurance Company was the largest surplus lines insurance carrier in the U.S. 6 1) According to the 2014 Flaspöhler Survey, which is based on opinions of over 500 producers on 37 commercial insurance carriers. 2) As measured by full year 2014 net premiums written. Refer to AIG 2014 10-K for further information. 3) According to Inside Mortgage Finance as measured by new insurance written as of December 31, 2014. 4) According to the 2014 RIMS Benchmark Survey. Property based on policy counts. Fiduciary liability based on premiums. 5) According to the 2015 Advisen Claims Satisfaction Survey. 6) According to AM Best in the 2013 Best’s Review Surplus Lines Report. |
Commercial Insurance – Property Casualty Financial Highlights Full Year First Quarter ($ in Millions) 2012 2013 2014 2015 Net premiums written $20,348 $20,880 $21,020 $5,047 Net premiums earned 20,848 20,677 20,885 4,931 Underwriting income (loss) (2,270) (336) (50) 145 Net investment income 3,951 4,431 4,298 1,025 Pre-tax operating income $1,681 $4,095 $4,248 $1,170 Net Premiums Written FY 2014 – $21.0 Billion Combined Ratios Accident Year, as Adjusted Calendar Year Property Specialty Financial Lines Casualty Americas EMEA Asia Pacific Continued Improvement in Accident Year Combined Ratios, As Adjusted Severe losses 1.4 2.8 2.8 2.7 1.4 2.8 2.8 2.7 24% 18% 22% 36% 65% 25% 10% 80.5 71.9 71.6 68.1 68.9 65.4 65.6 64.4 16.6 16.1 15.7 16.2 16.6 16.1 15.7 16.2 13.8 13.6 12.9 12.8 13.8 13.6 12.9 12.8 0 20 40 60 80 100 120 2012 2013 2014 1Q15 2012 2013 2014 1Q15 Loss Ratio Acquisition Ratio GOE Ratio 23 110.9 101.6 100.2 99.3 95.1 94.2 97.1 93.4 |
Meaningful Remediation of Casualty Lines and Growth Outside of the U.S. Commercial Insurance – Property Casualty Product Mix & Geography Shift Property Casualty Full Year 2010 NPW – $20.2 Billion Property Casualty Full Year 2014 NPW – $21.0 Billion Casualty Property Specialty Financial lines Casualty Property Specialty Financial lines EMEA Americas Asia Pacific EMEA Americas Asia Pacific 71% 7% 22% 65% 10% 25% 24% 18% 22% 36% 16% 17% 18% 49% 24 |
Business Mix Shifts Away from Long-Tail Casualty Lines and Accelerated Commutation of Legacy Portfolios (Especially 2004 and Prior) Are Expected to Also Reduce Reserve Variability Reserves – Non-Life Insurance Businesses Total Net Reserves $63.1 Billion at March 31, 2015 Business mix shift to shorter-tail lines, expected to reduce net reserves 60% of reserves is from business that has been substantially re-underwritten (i.e., post 2011) Reduction in outstanding loss reserves for long-tail reserve segments expected to reduce reserve variability 2004 and Prior 2005–2007 2008–2010 2011–2015 Casualty Financial Lines Specialty Property UGC Personal Lines 4% Accident and Health 3% Other Run-Off Lines - 7% By Accident Year By Line of Business 25 60% 15% 8% 17% 55% 15% 9% 6% 1% Note: Allocation by accident year for illustration purposes only and subject to change. Net reserves presented above are shown before the effect of a $2.9 billion loss reserve discount. Net loss reserves for the Non-Life Insurance Companies includes Property Casualty, Personal Insurance, Mortgage Guaranty and run-off Non-Life Insurance Companies’ businesses. |
Strong growth in operating earnings reflects lower delinquency rates, higher cure rates, new business growth and higher persistency. Volume and quality of new business remain strong despite competitive pressures. – Average FICO of new insurance written in 1Q15 was 752. – Average loan-to-value of new insurance written in 1Q15 was 91%. Mortgage Guaranty’s primary insurance subsidiary, United Guaranty Residential Insurance Company, maintains an S&P rating of A and Moody's rating of Baa1 with stable outlooks. Mortgage Guaranty will be compliant with the PMIER’s standards on the December 31, 2015 effective date. 1) Domestic First-lien only. 2) As of the date of this presentation. Commercial Insurance – Mortgage Guaranty Financial Highlights Full Year First Quarter ($ in Millions) 2012 2013 2014 2015 Net premiums written $858 $1,048 $1,024 $258 Underwriting income (loss) (137) 73 454 111 Net investment income 146 132 138 34 Pre-tax operating income $9 $205 $592 $145 Delinquency ratio 8.8% 5.9% 4.4% 3.9% 1 26 2 |
27 Mortgage Guaranty’s Risk Quality Index (RQI) is a proprietary model that uses over a dozen variables to estimate the potential for a mortgage to default. RQI is the key driver in Mortgage Guaranty’s risk-based pricing plan, Performance Premium. Primary delinquency rate has returned to pre-crisis level due to a combination of strong growth of new business and proactive management of delinquent book. * Internal data. Commercial Insurance – Mortgage Guaranty Credit Quality of Loans Mortgage Guaranty Risk Quality Index* Primary Risk-in-force (RIF) – $42.8 Billion Low Quality Loan with Average Risk High Quality 2014 2013 2012 2011 2010 2009 2008 2007 2015 2006 and Prior (As of March 31, 2015) 9% 8% 4% 2% 2% 5% 16% 25% 24% 5% 2005 2006 2007 2008 2009 2010 2011 2012 2013 2014 Vintage |
($ in Millions) Commercial Insurance – Institutional Markets Financial Highlights Reserves & Stable Value Wraps Assets Under Management Full Year First Quarter 2012 2013 2014 2015 Premiums and deposits $774 $991 $3,797 $146 Premiums 458 610 432 96 Policy fees 102 113 187 49 Net investment income 2,066 2,090 1,957 479 Total operating revenues 2,626 2,813 2,576 624 Benefits and expenses 2,101 2,133 1,906 477 Pre-tax operating income $525 $680 $670 $147 28 $36,129 $36,503 $32,320 $32,422 $68,449 $68,925 $0 $10,000 $20,000 $30,000 $40,000 $50,000 $60,000 $70,000 $80,000 Dec. 31, 2014 Mar. 31, 2015 Total Reserves SVW – AUM |
Consumer Insurance 29 |
Consumer Insurance – Strategy Customer Information- Driven Strategy Focused Growth Operational Effectiveness Profitability and Capital Management Investment Strategy Strive to be our customers’ most valued insurer. Through our unique franchise, which brings together a broad portfolio of retirement, life insurance and personal insurance products offered through multiple distribution networks, Consumer Insurance aims to provide customers with the products they need, delivered through the channels they prefer. Utilize customer insight, analytics and the application of science to optimize customer acquisition, product profitability, product mix, channel performance and risk management capabilities. Invest in areas where Consumer Insurance can grow profitably and sustainably. Target growth in select markets according to market size, growth potential, market maturity and customer demographics. Simplify processes, enhance operating environments, and leverage the best platforms and tools for multiple operating segments to increase competitiveness, improve service and product capabilities and facilitate delivery of our target customer experience. Deliver solid earnings through disciplined pricing and expense management, sustainable underwriting improvements and diversification of risk, and increase capital efficiency within insurance entities to enhance return on equity. Maintain a diversified, high quality portfolio of fixed maturity securities that largely matches the duration characteristics of the related insurance liabilities, and pursue yield-enhancement opportunities that meet liquidity, risk and return objectives. Distinguish Ourselves in the Markets and Products We Choose. Be the Provider of Choice Among Our Target Segments and Channels. 30 |
Focused Growth Consumer Insurance – Market Maturity Model Early Stage Market Advanced Stage Market Product Channel Customer Segment 31 Personal Accident Travel Warranty Auto & Home Life Health Retirement Micro Insurance Broad Market/ Wholesaling Career Agency, IFAs Public Agencies Financial Services Sponsors – including Brokers, Banks & Reinsurance Self-Employed Employed Emerging Banked Middle Class Affluent High Net Worth General Population |
1) Based on LIMRA rankings for respective periods. 2) Source – Non-Life Insurance Statistics, AIG internal analysis (includes Medical products sold by Non-Life Insurance Companies). 3) Source – General Insurance Rating Organization of Japan. Consumer Insurance – Leading Market Positions U.S. Life and Retirement Businesses Personal Insurance Rank Metric 2014 2013 2 2 Total Annuity Sales 1 1 Fixed-Rate Deferred Annuity Sales 3 4 Variable Annuity Sales 7 10 Total Life Issued 8 8 Term Life Sales 12 9 Universal Life Sales 2 2 Total K-12 Assets 3 3 Total 403(b) Assets 32 – 40% of the Forbes 400 Richest Americans – 43% of the American Listed on the ARTnews Top 200 Collectors Japan 2 nd in Personal Accident with 20% market share 2 4 th in Personal Property with 13% market share 3 U.S. Private Client Group 1 |
33 Consumer Insurance Operations Continue to Be Recognized for Excellence Globally Consumer Insurance – Leading Businesses Market Tools – U.S. 2014 Achievement in Customer Excellence for Life Insurance (ACE Award for 7 th Consecutive Year) DALBAR – U.S. 2014 Annuity Service Excellence Award (8 th Consecutive Year) 2014 #1 Ranking for Annuity Client Quarterly Statements (14 th Consecutive Year) 2014 Communication Seal for VALIC.com (3 rd Consecutive Year) 2014 Mobile InSIGHT – Innovations in the World of Apps Trailblazer Rating (VALIC Mobile for iPad) PlanSponsor Magazine – U.S. Earned 14 Best-in-Class Awards for Participant and Plan Sponsor Services for VALIC in 2014 International MarCom Awards – U.S. 2014 Platinum and Gold Awards for Retirement (34 in total) Insurance and Financial Communications Association – U.S. 2014 Best in Show and Awards of Excellence for Retirement (4 in total) Money Week Awards – China AIG Travel – China Named Best Travel Insurance Product in 2014 Underwriting Services Awards – U.K. AIG UK Group Travel and Personal Accident Team of the Year in 2014 Australian Business Awards 2014 ABA100 Winner for Best Technology Product in 2014 JD Power Asia Pacific – Japan AIG Japan (AIU, FFM and American Home) ranked #1 in 2014 Auto Insurance Claims Satisfaction survey (for 6 th Year) Reader’s Digest – Singapore AIG Singapore Most Trusted Brand Award for Auto Insurance 2014 Indonesian Insurance Awards AIG Indonesia Named Best Private General Insurance 2014 Gaivota de Ouro Insurance Industry Awards, Seguro Total Magazine – Brazil AIG Brazil Earned Group Life Award in 2014 AVA Digital Awards – U.S. Earned 4 Platinum Awards in 2015 Travvy Awards – U.S. AIG Travel Named Top Travel Insurance Provider in 2015 Saigon Liberation Newspaper Awards AIG Travel Named Favorite Vietnamese Brand Award (9 th Consecutive Year) Motordata Research Consortium – Malaysia AIG Malaysia Named Insurer of the Year 2014 MENA Insurance Awards – EMEA EMEA Consumer Named Most Innovative Insurer Product in 2014 Business Insurance 2014 Innovation Award – AIG Multinational Program Design Tool World Travel Fair AIG Travel Named Best Quality Service Travel Insurance Company for Travel Accident 2014 |
Consumer Insurance – Overview Premiums and Deposits Full Year 2014 – $41.3 Billion Pre-Tax Operating Income Full Year 2014 – $4.5 Billion Life Retirement Life Personal Insurance Retirement Personal Insurance 34 1) Premiums and deposits include net premiums written for the Personal Insurance operating segment and premiums and deposits for the Retirement and Life operating segments. 1 58% 30% 12% 78% 13% 9% |
35 1) Includes activity related to closed blocks of fixed and variable annuities. Consumer Insurance – Retirement Financial Highlights Full Year First Quarter ($ in Millions) 2012 2013 2014 2015 Premiums and deposits $16,159 $23,788 $24,077 $5,522 Premiums 120 188 287 46 Policy fees 743 861 1,010 264 Net investment income 6,502 6,628 6,489 1,570 Other income 1,344 1,754 1,998 508 Total operating revenues 8,709 9,431 9,784 2,388 Benefits and expenses 5,908 5,941 6,289 1,588 Pre-tax operating income $2,801 $3,490 $3,495 $800 Premiums and Deposits Full Year 2014 – $24.1 Billion Assets Under Management March 31, 2015 – $226.5 Billion Retail Mutual Funds Fixed Annuities Group Retirement Retirement Income Solutions Retail Mutual Funds Fixed Annuities Group Retirement Retirement Income Solutions 14% 15% 28% 43% 6% 29% 42% 23% 1 |
36 Base Net Investment Spreads 1 1) Includes return on base portfolio. Quarterly results are annualized. 2) Excludes the amortization of sales inducement assets. Consumer Insurance – Retirement – Base Yields and Spreads Base Yields 1 Trend in base yields reflects the reinvestment of cash flows at yields lower than the overall portfolio rate. Management remains focused on actions to reduce the cost of funds in order to support base spreads. In the first quarter, cost of funds continued to benefit from active management of crediting rates, disciplined new business pricing and the run-off of older business with crediting rates generally higher than the overall cost of funds. Cost of Funds 2 2.40% 2.28% 2.25% 2.23% 2.21% 2.09% 1.97% 1.93% 1.98% 1.95% 1.00% 1.50% 2.00% 2.50% 3.00% 1Q14 2Q14 3Q14 4Q14 1Q15 Fixed Annuities Group Retirement 2.85% 2.83% 2.81% 2.80% 2.78% 3.02% 3.03% 2.99% 2.98% 2.97% 2.00% 2.50% 3.00% 3.50% 1Q14 2Q14 3Q14 4Q14 1Q15 5.25% 5.11% 5.06% 5.03% 4.99% 5.11% 5.00% 4.92% 4.96% 4.92% 4.75% 4.95% 5.15% 5.35% 1Q14 2Q14 3Q14 4Q14 1Q15 |
Individual variable annuities represented 18% of total reserves at March 31, 2015 for AIG’s U.S. Life Insurance Companies. AIG significantly improved its industry ranking since 2009; remaining growth opportunity in variable annuities due to market share of only 7.7%. Disciplined pricing and de-risked benefits: VIX indexing of rider fees, volatility control funds, mandatory asset allocation to fixed accounts. Sales of index annuities with living benefits diversifies AIG’s guaranteed income offerings. * Source: LIMRA VA Sales report. VA industry sales data reported herein excludes Employer Plan sales and internal exchange sales. 1) Excludes $3.9 billion of AUM at VALIC with GMWB guarantees. 2) De-Risked Benefits: Features on contracts issued since 2010 (VIX indexing/volatility control fund in 2012). 3) Pre-2010 Partially De-Risked Benefits: Due to actual policyholder election of extension offers to-date. Consumer Insurance – Retirement – Individual Variable Annuities Industry Retail Variable Annuity Sales* Account Value by GMWB Guarantee at 3/31/15 1 – $32.4 Billion Unique Opportunity for AIG De-Risked Benefits Early Benefits Revised Benefits 2 3 6% 13% 81% 37 Full Year 2014 % Change Full Year 2013 Company ($ in millions) Rank Sales Rank Sales Jackson National 1 23,070 10% 1 20,931 Lincoln Financial Group 2 12,514 (9%) 2 13,772 Transamerica 3 9,923 20% 5 8,253 Prudential Financial 4 9,752 (13%) 3 11,170 AIG 5 9,072 11% 6 8,191 AXA Equitable 6 7,269 (2%) 7 7,426 Nationwide 7 6,088 7% 8 5,663 MetLife 8 5,184 (44%) 4 9,289 Ameriprise 9 4,671 (7%) 9 5,010 Pacific Life 10 4,291 (1%) 10 4,334 All Others 25,472 (2%) 25,897 Industry 117,306 (2%) 119,935 |
1) Includes the acquisition of Ageas Protect. Consumer Insurance – Life Financial Highlights Full Year First Quarter ($ in Millions) 2012 2013 2014 2015 Premiums and deposits $4,864 $4,862 $4,806 $1,223 Premiums 2,804 2,737 2,679 708 Policy fees 1,370 1,391 1,443 363 Net investment income 2,283 2,269 2,199 542 Total operating revenues 6,457 6,397 6,321 1,613 Benefits and expenses 5,721 5,591 5,741 1,442 Pre-tax operating income $736 $806 $580 $171 New Business Sales Full Year 2014 – $461 Million $1,000.7 Whole Life Term Life Health Other Universal Life U.S. Japan Decline in pre-tax operating income in 2014 primarily reflected an $104 million addition to reserves for IBNR death claims and lower net investment income. $1,003.0 38 22% 26% 20% 7% 25% 54% 46% $906.2 $910.4 $94.5 $92.6 $0 $200 $400 $600 $800 $1,000 $1,200 December 31, 2014 March 31, 2015 Domestic International Gross Life Insurance In-Force 1 End of Period, $ in Billions |
Consumer Insurance – Personal Insurance Financial Highlights Full Year First Quarter ($ in Millions) 2012 2013 2014 2015 Net premiums written $13,302 $12,700 $12,412 $2,915 Net premiums earned 13,103 12,377 11,970 2,799 Underwriting income (loss) (278) (187) 5 (89) Net investment income 477 455 394 63 Pre-tax operating income (loss) $199 $268 $399 ($26) Accident Year, as Adjusted Calendar Year 102.1 101.5 99.9 99.3 102.1 99.5 Personal Lines Americas EMEA Asia Pacific 103.2 100.8 39 31% 17% 52% 44% 56% 59.3 56.8 54.2 58.8 25.3 26.2 27.3 17.5 18.5 18.5 17.1 56.5 57.4 53.8 56.4 27.2 25.3 26.2 27.2 27.3 17.5 18.5 18.5 17.1 0 20 40 60 80 100 120 2012 2013 2014 1Q15 2012 2013 2014 1Q15 Loss Ratio Acquisition Ratio GOE Ratio Net Premiums Written FY 2014 – $12.4 Billion Combined Ratios Accident and Health |
Appendix – Non-GAAP Measures 40 |
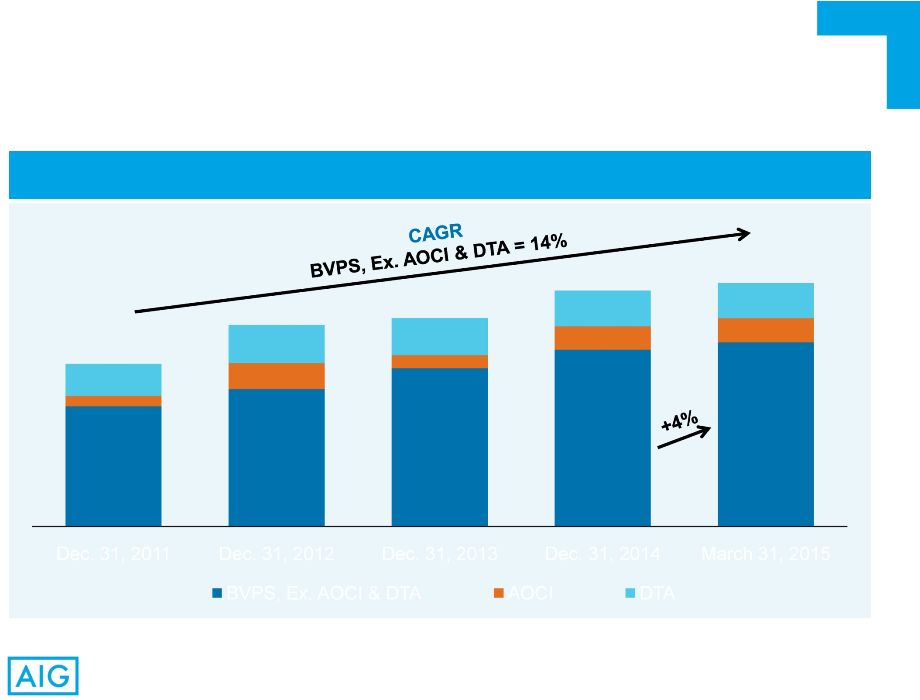
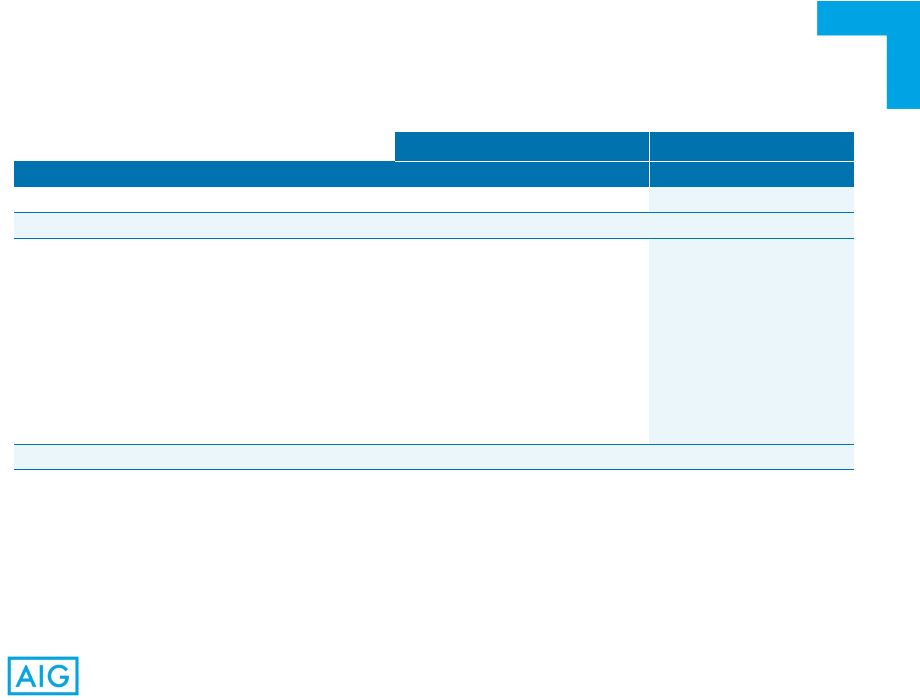
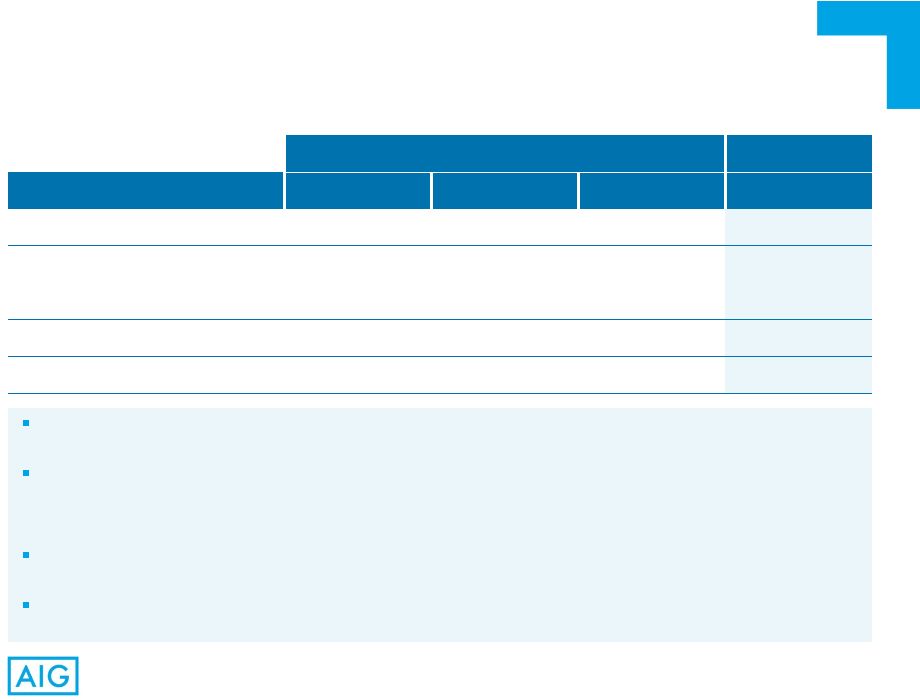
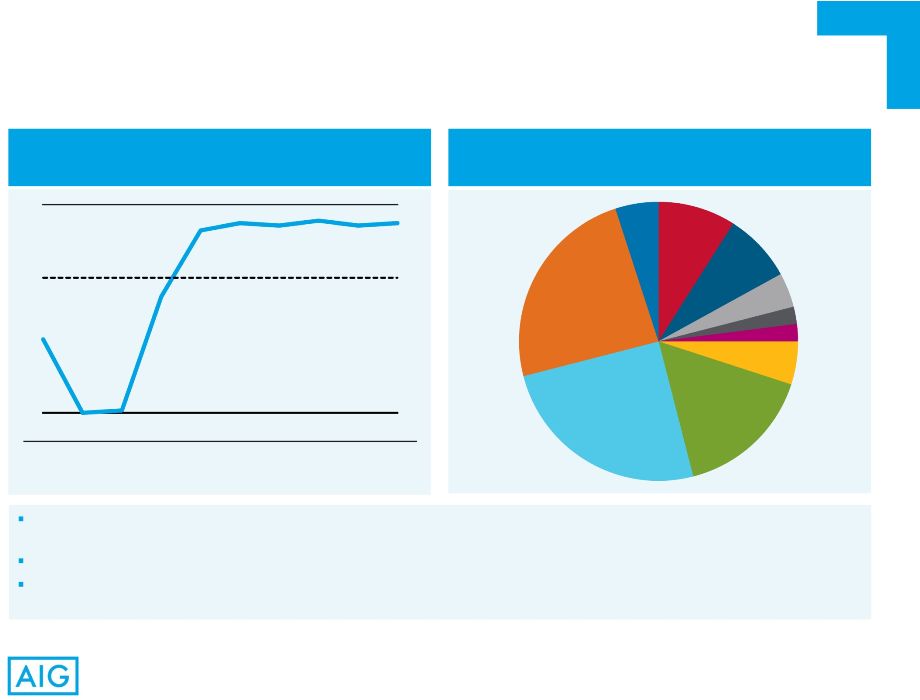
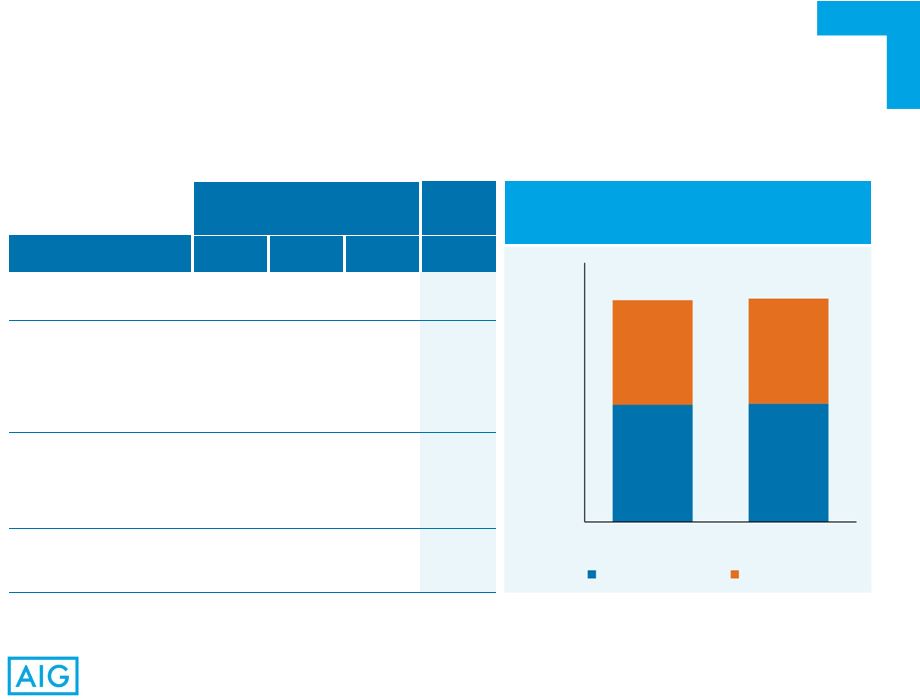
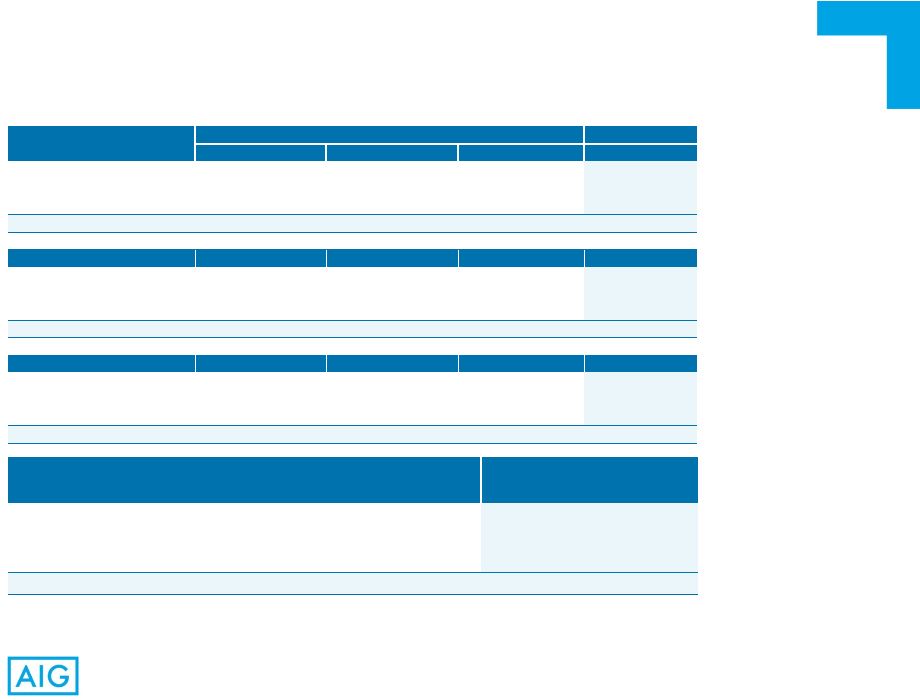
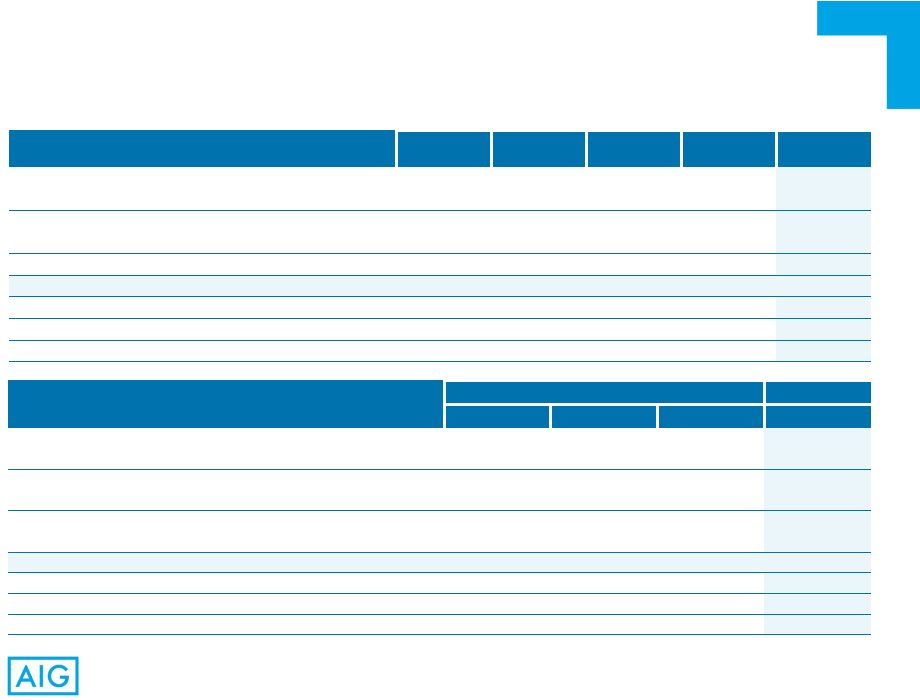
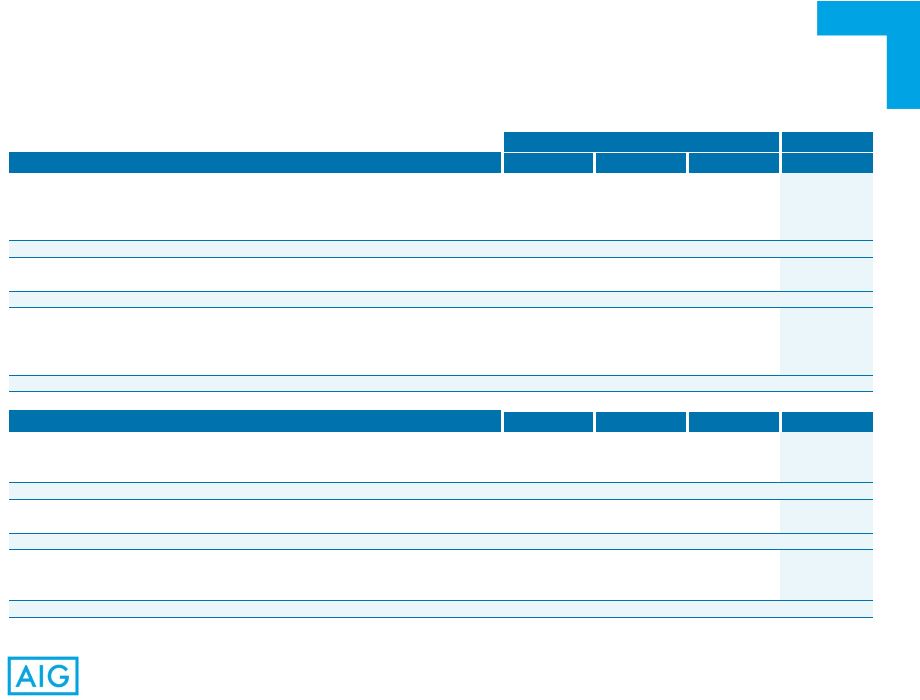
Glossary of Non-GAAP Financial Measures AIG – income and loss from divested businesses, including: • gain on the sale of International Lease Finance Corporation (ILFC); and • certain post-acquisition transaction expenses incurred by AerCap Holdings N.V. (AerCap) in connection with its acquisition of ILFC and the difference between expensing AerCap’s maintenance rights assets over the remaining lease term as compared to the remaining economic life of the related aircraft and related tax effects; – legacy tax adjustments primarily related to certain changes in uncertain tax positions and other tax adjustments; and – legal reserves and settlements related to legacy crisis matters, which include favorable and unfavorable settlements related to events leading up to and resulting from our September 2008 liquidity crisis and legal fees incurred as the plaintiff in connection with such legal matters. 41 We use the following operating performance measures because we believe they enhance the understanding of the underlying profitability of continuing operations and trends of our business segments. We believe they also allow for more meaningful comparisons with our insurance competitors. When we use these measures, reconciliations to the most comparable GAAP measure are provided, on a consolidated basis. Operating revenue excludes Net realized capital gains (losses), Aircraft leasing revenues, income from legal settlements (included in Other income for GAAP purposes) and changes in fair values of fixed maturity securities designated to hedge living benefit liabilities, net of interest expense (included in Net investment income for GAAP purposes). After-tax operating income attributable to AIG is derived by excluding the following items from net income attributable to AIG: – deferred income tax valuation allowance releases and charges; – changes in fair value of fixed maturity securities designated to hedge living benefit liabilities (net of interest expense); – changes in benefit reserves and deferred policy acquisition costs (DAC), value of business acquired (VOBA), and sales inducement assets (SIA) related to net realized capital gains and losses; – other income and expense — net, related to Corporate and Other run-off insurance lines; – loss on extinguishment of debt; – net realized capital gains and losses; – non-qualifying derivative hedging activities, excluding net realized capital gains and losses; – income or loss from discontinued operations; Return on Equity – After-tax Operating Income Excluding AOCI and Return on Equity – After-tax Operating Income Excluding AOCI and DTA are used to show the rate of return on shareholders’ equity. We believe these measures are useful to investors because they eliminate the effect of non-cash items that can fluctuate significantly from period to period, including changes in fair value of our available for sale securities portfolio, foreign currency translation adjustments and U.S. tax attribute deferred tax assets. Deferred tax assets represent U.S. tax attributes related to net operating loss carryforwards and foreign tax credits. Amounts are estimates based on projections of full year attribute utilization. Return on Equity – After-tax Operating Income Excluding AOCI is derived by dividing actual or annualized after-tax operating income attributable to AIG by average AIG shareholders’ equity, excluding average AOCI. Return on Equity – After-tax Operating Income Excluding AOCI and DTA is derived by dividing actual or annualized after-tax operating income attributable to AIG, by average AIG shareholders’ equity, excluding average AOCI and DTA. Book Value Per Share Excluding Accumulated Other Comprehensive Income (AOCI) and Book Value Per Share Excluding AOCI and Deferred Tax Assets (DTA) are used to show the amount of our net worth on a per-share basis. We believe these measures are useful to investors because they eliminate the effect of non-cash items that can fluctuate significantly from period to period, including changes in fair value of our available for sale securities portfolio, foreign currency translation adjustments and U.S. tax attribute deferred tax assets. Deferred tax assets represent U.S. tax attributes related to net operating loss carryforwards and foreign tax credits. Amounts are estimates based on projections of full year attribute utilization. Book Value Per Share Excluding AOCI is derived by dividing Total AIG shareholders’ equity, excluding AOCI, by Total common shares outstanding. Book Value Per Share Excluding AOCI and DTA is derived by dividing Total AIG shareholders’ equity, excluding AOCI and DTA, by Total common shares outstanding. |
42 Pre-tax operating income: includes both underwriting income and loss and net investment income, but excludes net realized capital gains and losses, other income and expense — net and legal settlements related to legacy crisis matters described above. Underwriting income and loss is derived by reducing net premiums earned by losses and loss adjustment expenses incurred, acquisition expenses and general operating expenses. Ratios: We, along with most property and casualty insurance companies, use the loss ratio, the expense ratio and the combined ratio as measures of underwriting performance. These ratios are relative measurements that describe, for every $100 of net premiums earned, the amount of losses and loss adjustment expenses, and the amount of other underwriting expenses that would be incurred. A combined ratio of less than 100 indicates underwriting income and a combined ratio of over 100 indicates an underwriting loss. The underwriting environment varies across countries and products, as does the degree of litigation activity, all of which affect such ratios. In addition, investment returns, local taxes, cost of capital, regulation, product type and competition can have an effect on pricing and consequently on profitability as reflected in underwriting income and associated ratios. Accident year loss and combined ratios, as adjusted: both the accident year loss and combined ratios, as adjusted, exclude catastrophe losses and related reinstatement premiums, prior year development, net of premium adjustments, and the impact of reserve discounting. Catastrophe losses are generally weather or seismic events having a net impact in excess of $10 million each. Normalized Return on Equity, Excluding AOCI and DTA further adjusts Return on Equity – After-tax Operating Income, excluding AOCI and DTA for the effects of certain volatile or market related items. Normalized Return on Equity, Excluding AOCI and DTA is derived by excluding the following tax adjusted effects from Return on Equity – After-tax Operating Income, Excluding AOCI and DTA: Glossary of Non-GAAP Financial Measures (continued) AIG Commercial Insurance: Property Casualty and Mortgage Guaranty; Consumer Insurance: Personal Insurance General operating expenses, operating basis, is derived by making the following adjustments to general operating and other expenses: include (i) loss adjustment expenses, reported as policyholder benefits and losses incurred and (ii) investment expenses reported as net investment income, and exclude (i) advisory fee expenses, (ii) non-deferrable insurance commissions, (iii) direct marketing and acquisition expenses, net of deferrals, (iv) legal reserves related to legacy crisis matters and (v) other expense related to retroactive reinsurance agreement. We use general operating expenses, operating basis, because we believe it provides a more meaningful indication of our ordinary course of business operating costs. – Catastrophe losses compared to expectations – Alternative investment returns compared to expectations – DIB/GCM returns compared to expectations – Fair value changes on PICC investments – DAC unlockings – Net reserve discount change – Life insurance IBNR death claim charge – Prior year loss reserve development |
43 Glossary of Non-GAAP Financial Measures (continued) Corporate and Other net gain or loss on sale of divested businesses, including: gain on the sale of ILFC and certain post-acquisition transaction expenses incurred by AerCap in connection with its acquisition of ILFC and the difference between expensing AerCap’s maintenance rights assets over the remaining lease term as compared to the remaining economic life of the related aircraft and our share of AerCap’s income taxes Certain legal reserves (settlements) related to legacy crisis matters described above Results from discontinued operations are excluded from all of these measures. Commercial Insurance: Institutional Markets; Consumer Insurance: Retirement and Life Pre-tax operating income is derived by excluding the following items from pre-tax income: changes in fair values of fixed maturity securities designated to hedge living benefit liabilities (net of interest expense); net realized capital gains and losses; changes in benefit reserves and DAC, VOBA and SIA related to net realized capital gains and losses; legal settlements related to legacy crisis matters described above. Premiums and deposits: includes direct and assumed amounts received and earned on traditional life insurance policies, group benefit policies and life-contingent payout annuities, as well as deposits received on universal life, investment-type annuity contracts and mutual funds. Pre-tax operating income and loss is derived by excluding the following items from pre-tax income and loss: loss on extinguishment of debt net realized capital gains and losses changes in benefit reserves and DAC, VOBA and SIA related to net realized capital gains and losses income and loss from divested businesses, including Aircraft Leasing |
44 Non-GAAP Reconciliation – Operating Revenues and General Operating Expenses Full Year First Quarter Total Operating Revenues (In Millions) 2012 2013 2014 2015 Total operating revenues $65,379 $61,524 $61,001 $14,590 Reconciling Items: Changes in fair values of fixed maturity securities designated to living benefit liabilities, net of interest expense 37 (161) 260 44 Net realized capital gains 1,086 1,939 739 1,341 Income (loss) from divested businesses 4,502 4,420 1,602 (15) Legal settlements related to legacy crisis matters 210 1,152 804 15 Total revenues $71,214 $68,874 $64,406 $15,975 General operating expenses, Operating basis ($ in Millions) 1Q14 2Q14 3Q14 4Q14 1Q15 Total general operating expenses, Operating basis $2,879 $3,052 $2,993 $3,016 $2,784 Loss adjustment expenses, reported as policyholder benefits and losses incurred (407) (418) (408) (434) (423) Advisory fee expenses 311 337 338 329 332 Non-deferrable insurance commissions 127 119 130 146 128 Direct marketing and acquisition expenses, net of deferrals 116 146 105 203 140 Investment expenses reported as net investment income (25) (28) (24) (11) (20) Total general operating and other expenses included in pre-tax operating income 3,001 3,208 3,134 3,249 2,941 Legal reserves related to legacy crisis matters 23 506 17 - 8 Total general operating and other expenses, GAAP basis $3,024 $3,714 $3,151 $3,249 $2,949 |
45 Non-GAAP Reconciliation – Premiums and Deposits Retirement ($ in Millions) Full Year First Quarter 2012 2013 2014 2015 Premiums and Deposits $16,159 $23,788 $24,077 $5,522 Deposits (16,314) (23,749) (23,957) (5,650) Other 275 149 167 174 Premiums $120 $188 $287 $46 Life 2012 2013 2014 2015 Premiums and Deposits $4,864 $4,862 $4,806 $1,223 Deposits (1,531) (1,541) (1,532) (378) Other (529) (584) (595) (137) Premiums $2,804 $2,737 $2,679 $708 Institutional Markets 2012 2013 2014 2015 Premiums and Deposits $774 $991 $3,797 $146 Deposits (289) (354) (3,344) (45) Other (27) (27) (21) (5) Premiums $458 $610 $432 $96 Consumer Premiums and Deposits ($ in Millions) Full Year 2014 Total Retirement Premiums and Deposits $24,077 Total Life Premiums and Deposits 4,806 Net Premiums Written for Personal Insurance 12,412 Total Premiums and Deposits $41,295 |
Non-GAAP Reconciliation – Pre-tax and After-tax Operating Income Full Year First Quarter Pre-tax and After-tax Operating Income (In Millions, Except Per Share Data) 2012 2013 2014 2015 Pre-tax income from continuing operations $2,891 $9,368 $10,501 $3,776 Adjustments to arrive at Pre-tax operating income: Changes in fair values of fixed maturity securities designated to hedge living benefit liabilities, net of interest expense (37) 161 (260) (44) Changes in benefit reserves and DAC, VOBA and SIA related to net realized capital gains (losses) 1,213 1,608 217 54 Other (income) expense – net – 72 – – Loss on extinguishment of debt 32 651 2,282 68 Net realized capital (gains) losses (1,086) (1,939) (739) (1,341) (Income) loss from divested businesses, including gain on sale of ILFC 6,411 177 (2,169) 21 Legal settlements related to legacy crisis matters (210) (1,152) (804) (15) Legal reserves related to legacy crisis matters 754 444 546 8 Non-qualifying derivative hedging gains, excluding net realized capital gains (30) – – – Pre-tax operating income $9,938 $9,390 $9,574 $2,527 Net income attributable to AIG $3,438 $9,085 $7,529 $2,468 Adjustments to arrive at After-tax operating income (amounts net of tax): Uncertain tax positions and other tax adjustments 543 791 59 (42) Deferred income tax valuation allowance releases (1,911) (3,237) (181) 93 Changes in fair values of fixed maturity securities designated to hedge living benefit liabilities, net of interest expense (24) 105 (169) (29) Changes in benefit reserves and DAC, VOBA and SIA related to net realized capital gains (losses) 789 1,148 141 35 Other (income) expense – net – 47 – – Loss on extinguishment of debt 21 423 1,483 44 Net realized capital (gains) losses (687) (1,285) (470) (874) (Income) loss from discontinued businesses (1) (84) 50 (1) (Income) loss from divested businesses, including gain on sale of ILFC 4,039 117 (1,462) 2 Legal reserves (settlements) related to legacy crisis matters 353 (460) (350) (5) Non-qualifying derivative hedging gains, excluding net realized capital gains (18) – – – After-tax operating income $6,542 $6,650 $6,630 $1,691 After-tax operating income per diluted share $3.88 $4.49 $4.58 $1.22 46 |
Non-GAAP Reconciliation – Book Value Per Share and Return On Equity Book Value Per Common Share ($ in Millions, Except Per Share Data) Dec. 31, 2011 Dec. 31, 2012 Dec. 31, 2013 Dec. 31, 2014 Mar. 31, 2015 Total AIG shareholders’ equity (a) $101,538 $98,002 $100,470 $106,898 $107,979 Less: Accumulated other comprehensive income (AOCI) (6,481) (12,574) (6,360) (10,617) (10,657) Total AIG shareholders’ equity, excluding AOCI (b) 95,057 85,428 94,110 96,281 97,322 Less: Deferred tax assets (DTA)* (20,007) (18,549) (17,797) (16,158) (15,566) Total AIG shareholders’ equity, excluding AOCI and DTA (c) $75,050 $66,879 $76,313 $80,123 $81,756 Total common shares outstanding (d) 1,896.8 1,476.3 1,464.1 1,375.9 1,347.1 Book value per share (a÷d) $53.53 $66.38 $68.62 $77.69 $80.16 Book value per share, excluding AOCI (b÷d) $50.11 $57.87 $64.28 $69.98 $72.25 Book value per share, excluding AOCI and DTA (c÷d) $39.57 $45.30 $52.12 $58.23 $60.69 Return On Equity (ROE) Computations ($ in Millions) Twelve Months Ended First Quarter Dec. 31, 2012 Dec. 31, 2013 Dec. 31, 2014 2015 Actual or annualized net income attributable to AIG (a) $3,438 $9,085 $7,529 $9,872 Actual or annualized after-tax operating income (b) $6,542 $6,650 $6,630 $6,764 Average AIG shareholders’ equity (c) 101,873 98,850 105,589 107,439 Less: Average AOCI (9,718) (8,865) (9,781) (10,637) Average AIG shareholders’ equity, excluding average AOCI (d) 92,155 89,985 95,808 96,802 Less: Average DTA (19,250) (18,150) (16,611) (15,862) Average AIG shareholders’ equity, excluding average AOCI and DTA (e) $72,905 $71,835 $79,197 $80,940 ROE (a÷c) 3.4% 9.2% 7.1% 9.2% ROE – after-tax operating income, excluding AOCI (b÷d) 7.1% 7.4% 6.9% 7.0% ROE – after-tax operating income, excluding AOCI and DTA (b÷e) 9.0% 9.3% 8.4% 8.4% 47 |
Full Year First Quarter Property Casualty Accident Year Combined Ratio, As Adjusted 2012 2013 2014 2015 Loss ratio 80.5 71.9 71.6 68.1 Catastrophe losses and reinstatement premiums (10.9) (3.4) (2.9) (1.4) Prior year development net of premium adjustments (1.2) (1.5) (2.8) (0.4) Net reserve discount benefit (change) 0.5 (1.6) (0.3) (1.9) Accident year loss ratio, as adjusted 68.9 65.4 65.6 64.4 Acquisition ratio 16.6 16.1 15.7 16.2 General operating expense ratio 13.8 13.6 12.9 12.8 Expense ratio 30.4 29.7 28.6 29.0 Combined ratio 110.9 101.6 100.2 97.1 Catastrophe losses and reinstatement premiums (10.9) (3.4) (2.9) (1.4) Prior year development net of premium adjustments (1.2) (1.5) (2.8) (0.4) Net reserve discount benefit (charge) 0.5 (1.6) (0.3) (1.9) Accident year combined ratio, as adjusted 99.3 95.1 94.2 93.4 Non-GAAP Reconciliation – Accident Year Combined Ratio, as Adjusted Personal Insurance Accident Year Combined Ratio, As Adjusted 2012 2013 2014 2015 Loss ratio 59.3 56.8 54.2 58.8 Catastrophe losses and reinstatement premiums (3.0) (0.7) (1.1) (2.2) Prior year development net of premium adjustments 0.2 1.3 0.7 (0.2) Accident year loss ratio, as adjusted 56.5 57.4 53.8 56.4 Acquisition ratio 25.3 26.2 27.2 27.3 General operating expense ratio 17.5 18.5 18.5 17.1 Expense ratio 42.8 44.7 45.7 44.4 Combined ratio 102.1 101.5 99.9 103.2 Catastrophe losses and reinstatement premiums (3.0) (0.7) (1.1) (2.2) Prior year development net of premium adjustments 0.2 1.3 0.7 (0.2) Accident year combined ratio, as adjusted 99.3 102.1 99.5 100.8 48 |
American International Group, Inc. (AIG) is a leading global insurance organization serving customers in more than 100 countries and jurisdictions. AIG companies serve commercial, institutional, and individual customers through one of the most extensive worldwide property-casualty networks of any insurer. In addition, AIG companies are leading providers of life insurance and retirement services in the United States. AIG common stock is listed on the New York Stock Exchange and the Tokyo Stock Exchange. Additional information about AIG can be found at www.aig.com | YouTube: www.youtube.com/aig | Twitter: @AIG_LatestNews | LinkedIn: http://www.linkedin.com/company/aig AIG is the marketing name for the worldwide property-casualty, life and retirement, and general insurance operations of American International Group, Inc. For additional information, please visit our website at www.aig.com. All products and services are written or provided by subsidiaries or affiliates of American International Group, Inc. Products or services may not be available in all countries, and coverage is subject to actual policy language. Non-insurance products and services may be provided by independent third parties. Certain property-casualty coverages may be provided by a surplus lines insurer. Surplus lines insurers do not generally participate in state guaranty funds, and insureds are therefore not protected by such funds. |