Exhibit 14
| UPDATE OF THE | ||
| Economic | ||
| and Financial Document | ||
| 2020 | ||
| Submitted by the Prime Minister | ||
| Giuseppe Conte | ||
| and the Minister of the Economy and Finance | ||
| Roberto Gualtieri | ||
 | Approved by the Cabinet on 5 October 2020 |
introduction
In recent months, the covid-19 pandemic has severely affected our country from a health point of view as well as in the economic and social system. The economic indicators show even too briefly the enormous difficulties that Italian families, workers and companies have had to endure.
The difficult context in which the Government found itself to operate has required to adopt a strategy based on different levels. In the first few months, the containment of the spread of contagion and the protection of health required the adoption of progressively more stringent precautionary measures, which have changed the lives of Italians in a sudden way. These measures have had a heavy repercussion on the economic system that has experienced, in a few months, the worst fall of the gross domestic product in Republican history.
The crisis has produced and is producing markedly heterogeneous economic, social and health effects from the point of view of territories, economic sectors, income levels, gender and generations. Several provinces of Lombardy and other Northern areas have been the epicenter of the spread of the contagion to which they paid a particularly hard price in terms of human lives; tourism and transport, trade and restaurants, sport, entertainment and the event sector and, more generally, sectors requiring human gathering have suffered above average turnovers falls and are still affected by the economic effects of the pandemic and persistent uncertainty; low-income households have been severely affected as well as women for whom it has been even heavier and unfair than usual to reconcile work and childcare needs; the latter faced a particularly complicated second semester of the school year which, among other things, showed significant digital inequalities within the population.
To address this situation, the Government has adopted major economic interventions, totaling 100 billion in terms of the impact on the general government net borrowing in 2020 (over 6 percent of GDP), to which must be added the unprecedented amount of public guarantees on liquidity.
These resources financed measures to limit the effects of the pandemic on household incomes, employment levels and the maintenance of the production system, along with providing the healthcare system the resources needed to contain the pandemic. In international comparison, the combination of healthcare policy and economic policy measures has proved to be, nowadays, among the best, succeeding in ensuring an effective fight against the spread of the virus and, at the same time, the greatest possible protection of incomes and production capacity. For example, and in particular, in the face of an estimated fall in GDP of 9 percent in 2020, employment is projected to fall by less than 2 percent. Overall, the measures introduced by the Government have significantly limited the increase in poverty and inequalities.
| Ministry of Economy and Finance | III |
UPDATE OF THE Economic and Financial Document 2020
Due to the collapse in gross domestic product, the consequent fall in tax revenues and expansionary fiscal policy, the public debt-to-GDP ratio is projected to increase up to 158 percent. Nevertheless, the Italian Republic has continued to finance itself on the capital markets at historically low prices, because of the solidity of our fundamentals but also thanks to the response of the European institutions. The monetary policy put in place by the European Central Bank, the new approach to budgetary and State aid rules and the decision to finally introduce common budgetary instruments financed with European bonds have proved essential for Italy and the euro area overall. The Government made a non-marginal contribution to this change of European strategy, which was decidedly different from that adopted in the last decade.
Starting in May, the economy began to recover, surprising most of the forecasters upwards. For the third quarter, it is now estimated a higher rebound than that assumed in the Stability Programme. The latest available indicators show, in fact, a growth trend in the summer months for industrial production, the construction sector and the turnover of services. Although future prospects continue to be characterised by considerable uncertainty, which suffers from the unpredictability of the evolution of the pandemic in Italy and abroad, as well as the effective availability of effective vaccines and possible therapies, economic policy must gradually move from the phase of protection of the economic and social system to that of the revamp of growth in the short term as well as in the medium and long term.
The next budget law and funds from the Recovery and Resilience Facility (RRF) will have a total value of about 2 percent of GDP in 2021. Economic growth will significantly benefit, reaching 6 percent. Over the next two years, the expansion of fiscal policy will gradually slow down to a primary surplus of 0.1 percentage points and a net borrowing over GDP of 3 percent. The level of GDP recorded in the year preceding the pandemic will therefore be recovered in 2022. Over the next three years, the public debt-to-GDP ratio will be placed on a significant and credible downward path.
The macroeconomic and public finance scenario outlined in this Update to the Stability Programme incorporates the substantial European resources that will be made available to our country by the Next Generation EU (NGEU), in particular, by the RRF. This is undoubtedly an unrepeatable opportunity for our country, which will allow us to overcome the unprecedented crisis triggered by the pandemic and a prolonged period of stagnation that has been going on for over twenty years. The resources deployed by the European Union will be used to achieve the objectives of innovation and environmental and social sustainability that characterise the programme of the new European Commission, fully consistent with the approach that the Government has taken since its settlement.
As soon as the agreement is finalised within the European institutions, the Government will present the National Recovery and Resilience Plan (NRRP). The NRRP’s interventions will help to boost public and private investment and implement important reforms within a plan of relaunch and transition to a more innovative and environmentally sustainable economy and more socially inclusive. This will make it possible to invest in the future to provide new job opportunities
| IV | Ministry of Economy and Finance |
introduction
to young people and, more generally, to create conditions that make the country more modern, fair and sustainable.
In addition to actions aimed at accelerating the ecological and digital transition and increasing the competitiveness and resilience of Italian companies, particular attention will be paid to territorial cohesion, through tax cuts, infrastructure investments and strengthening the enabling factors for growth. Particular efforts and resources will also be directed towards investment in education and research, with the aim of making a significant leap in the amount of resources and the quality of policies, and the strengthening and modernisation of the healthcare system.
A crucial role in the NRRP will be played by public investment, which will be significantly increased in the coming years with the aim of bringing them back to levels both above those prior to the 2008 crisis and above the European average. The increased availability of financial resources, combined with the improvement of design, implementation and expenditure ability by the general government, will be fundamental to achieve a qualitative leap in infrastructure, material and intangible, of the country. Improving the ability of administrations to make investments in ex-ante fixed times and ways is an essential and strategic objective as, together with other structural reforms, it will ensure a higher rate of growth for the country even when European resources will be exhausted.
The economic policy strategy also includes a broad programme of reforms to address bottlenecks in different sectors – from justice to public administration – and to increase the potential growth of our economy. Some of these actions will be financed with the European resources of the RRF, which will stimulate their rapid implementation.
With the resources of the public budget, the Government also intends to introduce over the next three years a reform of the tax system aimed at simplification and transparency, improving fairness and efficiency of the tax burden and reducing the fiscal pressure. The reform will be designed in a manner consistent with the enabling law on the single grant, also to promote participation of women in the labour market and increase population growth.
In the taxation field, a new fund will be introduced, to be financed with the higher revenues linked to the increase in tax compliance that will then be returned, in whole or in part, to taxpayers in the form of a reduction of the tax levy. The Government intends to establish a tax pact with Italian citizens that rewards the tax and contribution loyalty of companies and workers.
To show consistency between public finance trends and the resources made available by the RRF, this Update presents a broader horizon than usual, reaching up 2026. The NRRP and its resources will have a significant positive impact on the growth forecasts of the Italian economy and on the projections regarding the public debt to GDP ratio. Indeed, the scenario shows significant economic growth, which is steadily higher than in the last twenty years, which will allow the debt ratio to be reduced to its pre-covid level over a decade. This perspective is made reliable by the trend of the deficit in the unchanged legislation scenario over the
| Ministry of Economy and Finance | V |
UPDATE OF THE Economic and Financial Document 2020
next three years and by the absence of safeguard clauses, which, for the first time in several years, give us a realistic picture of the state of public finances.
We therefore have the opportunity to relaunch our country’s growth in terms of environmental and social sustainability, as well as to dissolve structural knots, social and territorial disparities that have been dragging on for a long time. This requires a change of pace and mentality on the part of the institutions and the components of the Italian economy and society. All together, we are called to a great challenge of responsibility in the selection of projects, which must be assessed in their capacity to relaunch in a structural way the growth and employment of this country, to heal its territorial and social fractures, to make it more innovative, stronger and fairer. This is a unique and unrepeatable opportunity, not only to overcome the consequences of the pandemic, but also to improve and relaunch our country and make it the protagonist of the challenges of the future.
Roberto Gualtieri
Minister for Economy and Finance |
| VI | Ministry of Economy and Finance |
INDEX
| I. | OVERALL FRAMEWORK AND fiscal POLICY |
| I.1 | Recent trends in the economy |
| I.2 | Macroeconomic scenario under unchanged legislation 2020-2023 |
| I.3 | Public finance forecast: scenario under unchanged legislation |
| I.4 | Macroeconomic framework and public finance under policy scenario |
| II. | MACROECONOMIC FRAMEWORK |
| II.1 | The international economy |
| II.2 | Italian economy: recent trends |
| II.3 | Italian economy: prospects |
| II.4 | Policy scenario |
| III. | NET BORROWING AND PUBLIC DEBT |
| III.1 | Summary data and forecasts under unchanged legislation |
| III.2 | Public finance: policy scenario |
| III.3 | The evolution of the debt-to-GDP ratio |
| III.4 | The debt rule and other relevant factors |
| III.5 | Medium-term public debt projection scenarios |
| III.6 | Main public finance measures adopted |
| III.7 | Valorisation of public property |
| IV. | THE REFORMS AND THE RECOMMENDATIONS OF THE COUNCIL OF THE EUROPEAN UNION |
| IV.1 | The National Recovery and Resilience Plan |
| IV.2 | Council Recommendations to the Country |
| IV.3 | Main actions in line with the Country-Specific Recommendations for 2020 |
ANNEXES
Explanatory note on multi-year laws on non-permanent capital expenditure
Policy report on fiscal expenditure
Report on the results achieved in the field of measures to fight tax and social security evasion - year 2020
| Ministero dell’economia e delle finanze | VII |
UPDATE OF THE ECONOMIC AND FINANCIAL DOCUMENT 2020
LIST OF TABLES
| Table I.1 | Synthetic macroeconomic framework under unchanged legislation |
| Table I.2 | Provisional summary framework of Recovery Plan Resources utilisation |
| Table I.3 | Macroeconomic framework based on the policy scenario |
| Table I.4 | Public finance indicators |
| Table II 1 | International exogenous variables |
| Table II.2 | Macroeconomic framework under unchanged legislation |
| Table II.3 | Effects on the GDP of the policy scenario with respect to the unchanged legislation scenario (impact on growth rates) |
| Table II.4 | Policy scenario macroeconomic framework |
| Table III.1.a | General government account at unchanged legislation |
| Table III.1.b | General government account at unchanged legislation |
| Table III.1.c | General government account at unchanged legislation |
| Table III.2 | Summary of public finance under the policy scenario |
| Table III.3 | Cyclically adjusted public finance |
| Table III.4 | Significant deviations |
| Table III.5 | Flexibility granted to Italy in the Stability Pact |
| Table III.6 | One-off measures under unchanged legislation |
| Table III.7 | General government debt by sub-sector |
| Table III.8 | Compliance with the debt rule: forward looking and cyclically adjusted debt |
| Table III.9 | Parameters affecting dynamic of debt-to GDP ratio |
| Table III.10 | Cumulative effects of the last measures approved in 2020 on the general government net borrowing |
| Table III.11 | Cumulative net effects of the last measures approved in 2020 on the general government net borrowing by sub-sector |
| Table III.12 | Net effects of the last measures approved in 2020 on the general government net borrowing |
| Table IV.1 | Country’s specific recommendations for 2019 and 2020 |
| Ministero dell’economia e delle finanze | VIII |
UPDATE OF THE ECONOMIC AND FINANCIAL DOCUMENT 2020
FIGURES
| Figure I.1 | Gross domestic product and industrial production |
| Figure I.2 | Confidence climate of Italian businesses |
| Figure I.3 | Recorded cases of Coronavirus infections in Italy |
| Figure I.4 | Real GDP forecast under unchanged legislation and under policy scenario |
| Figure I.5 | Deficit and public debt as ratio to GDP – policy scenario 2020-2023 |
| Figure I.6 | Debt-to-GDP ratio path under policy scenario to 2026 and extrapolation to 2031, maintaining the 2026 structural primary balance unchanged |
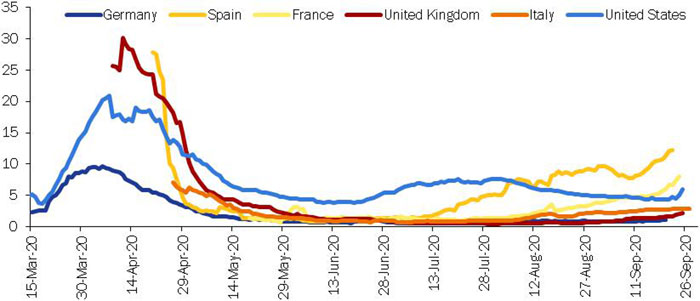
| Figure II.1 | Number of Covid-19 recorded cases by region and world deaths (weekly data, updated at 21 September) |
| Figure II.2 | Positivity rate at Covid-19 (%, share of positive tests on the number of performed tests, rolling 7 days average, data updated at 29 September) |
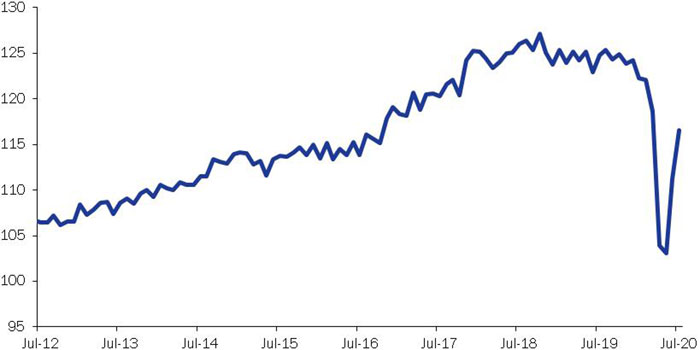
| Figure II.3 | Trend of the world trade (volume, data, index, 2010=100) |
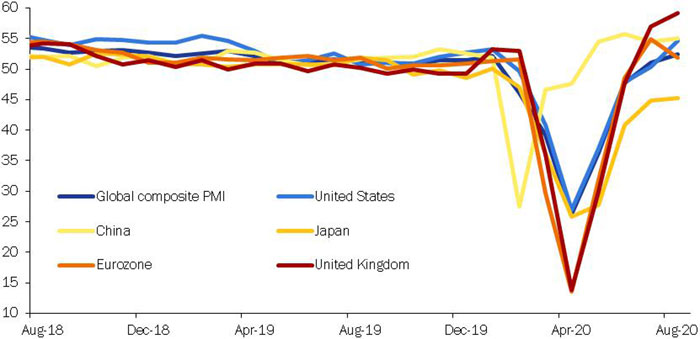
| Figure II.4 | Global composite PMI and by Country |
| Figure II.5 | Price of Brent and Futures |
| Figure II.6 | Contributions to GDP growth |
| Figure II.7 | Unemployment rate and participation rate |
| Figure II.8 | Loans to the private sector |
| Figure II.9 | Real GDP forecast under unchanged legislation scenario |
| Figure II.10 | Coronavirus patients in Italian hospitals (number of presences) |
| Figure III.1 | Trend of the debt-to-GDP ratio, gross and net of Euro Area supports |
| Figure III.2 | GDP and debt-to-GDP ratio projections, 2020-2031 |
BOX INDEX
| Chapter II | Recent initiatives of the Italian Government in response to the covid-19 health emergency |
| The revision of the forecasts for 2020 and 2021 | |
| A risk (or sensitivity) analysis of exogenous variables | |
| Chapter III | Medium to long-term trends in the Italian pension system and public expenditure related to ageing |
| The activation of the general escape clause of the Stability and Growth Pact | |
| Estimating potential GDP at the time of the pandemic | |
| Assessment of revenues arising from the fight against tax evasion |
| Ministero dell’economia e delle finanze | IX |
UPDATE OF THE ECONOMIC AND FINANCIAL DOCUMENT 2020
Ministero dell’economia e delle finanze
| X |
I. overall framework and FISCAL policy
I.1 recent trends in the economy
The measures of social distancing and closure of productive sectors implemented from mid-March to early May in response to the covid-19 epidemic have caused an unprecedented fall in economic activity. Since May, economic indicators have recovered, thanks to the gradual easing of measures to prevent infection and a series of powerful economic policy measures to support employment, incomes and the liquidity of households and businesses. Overall, these interventions amounted to 100 billion (6.1 percentage points of GDP) in terms of the expected impact on the general government net borrowing.
Although economic activity is recovering, it remains well below the 2019 levels. Some restrictions remain in force, for example in relation to major sporting and artistic events; schools and universities have only recently restarted teaching on site. In addition, the virus has continued to spread globally, making precautionary measures necessary in all major countries of the world, resulting in a fall in international trade. Despite a strong recovery from May onwards, Italian exports continue to suffer from the global crisis, as well as the presence of foreign tourists remains much lower than in normal times.
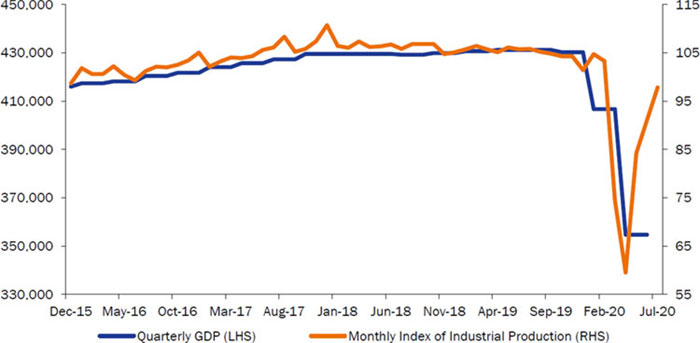
According to Istat’s latest estimates, GDP fell by 5.5 percent in the first quarter and 13.0 percent in the second quarter in quarter-on-quarter terms. The current Istat figure for the first quarter is equal to the Stability Programme forecast, while the fall in the second quarter is higher (in the Stability Programme it was expected to be -10.5 percent).
| FIGURE I.1: gross domestic product and industrial production |
|
| Source: Istat. |
MINISTRY OF ECONOMY AND FINANCE
| 1 |
UPDATE OF THE Economic and Financial Document 2020 |
For the third quarter, it is now estimated a significant rebound, higher than assumed in the Stability Programme (9.6 percent), which would bring the level of GDP estimated for this period slightly above the forecast in the Stability Programme. The latest available indicators show, in fact, a growth trend in the summer months.
As regards July, the index of industrial production increased by 7.4 percent over the previous month, resulting in an acquired growth of 25 percentage points in the quarter. In the same month, also the production of the construction sector continued to recover (+3.5 percent on June, with a carry-over on the third quarter of 41 percentage points). In addition, data on digital invoices indicate a marked recovery of service turnover compared to previous months1. On the demand side, with regard to consumption, retail sales in July show a slight setback, but this follows the sharp increase in May and June; instead, the registrations of new cars increase compared to the previous month on a seasonally adjusted basis. There are also positive indications from exports, with a monthly growth of 5.7 percent in nominal terms and a y-o-y contraction that falls to -7.3 percent, from -12.1 percent in June.
The indicators available so far for August are also positive. According to the Istat survey, business confidence has increased in all sectors of activity: the synthetic business confidence index in August reached a level of 81.4, still well below 98.2 in January, but well above the minimum in May, 53.8 (the survey was not published in April). In August, electricity production and consumption, road traffic and car registrations also rise.
| FIGURE I.2: confidence climate of Italian businesses |
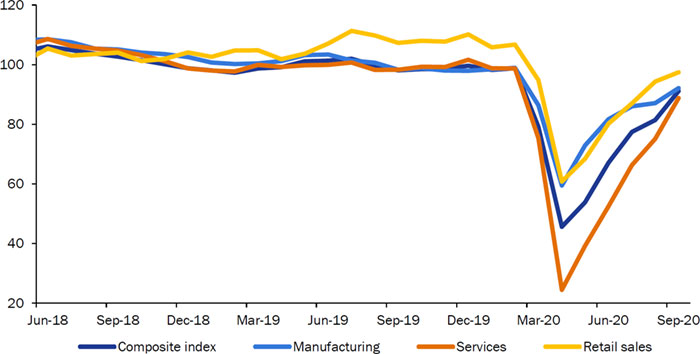 |
| Source: Istat and MEF estimates for April 2020, in which the survey was not published. |
1 To be precise, since the historical series of monthly data starts in January 2019, it is not possible to seasonally adjust the series. The data show that the y-o-y contraction in the taxable amount of e-invoicing (corrected for working days) shrank considerably in July compared to June, which is likely to result in a cyclical increase in turnover and value added.
| 2 | MINISTRY OF ECONOMY AND FINANCE
|
I. overall framework and fiscal policy |
Economic developments in September should have benefited from the resumption of work on site and the reopening of schools and universities. As covid-19 infections resume, citizens’ behaviour appears to be more cautious, with possible repercussions on consumption expenditure. However, the monthly Istat survey shows a further increase in consumer and business confidence. The sentiment rises in all productive sectors; in particular, the confidence of manufacturing companies producing capital goods and of companies active in building and specialised works is rising. There is also a marked increase in confidence in services, in particular in tourism. Overall, all this indicates that the rebound of GDP in the third quarter could also exceed that underlying the new quarterly forecast.
Regarding the foreign trade balance, in the first seven months of the year, the trade surplus rose by EUR 3 billion compared with the same period in 2019, to 32.7 billion, while the current account surplus fell slightly, mainly due to a higher deficit in services2. The latter was affected by the fall of the presence and expenditure of foreign tourists in Italy3.
Inflation trend reflected the weakness of demand and the fall in oil and commodity prices during the most acute global crisis period. In the last two months (August and September), the consumer price index has fallen by 0.5 percentage points compared to a year earlier, approaching the historical low previously recorded in January 20154.
| FIGURE I.3: recorded cases OF CORONAVIRUS Infections in Italy |
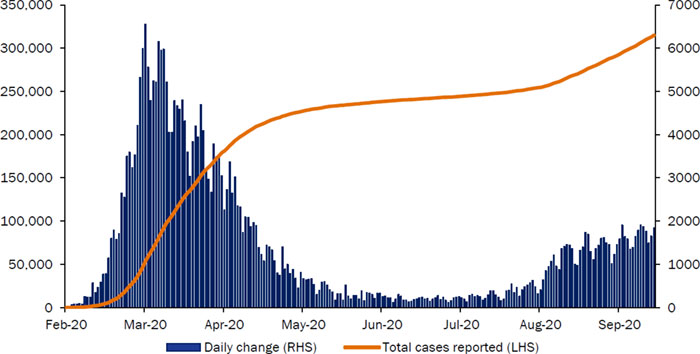 |
| Source: Refinitiv. |
2 The current account surplus in the first seven months of the year amounted to 20.6 billion, down from 25.4 billion in the same period of 2019. However, the July figure improved compared to the corresponding month of 2019 (9.3 billion versus 8.7 billion) thanks to the commodity component (with a surplus of 9.8 billion versus 8.0 billion in 2019).
3 For example, in July the surplus for the ‘travel’ component of the services balance recorded a surplus of 1.1 billion, compared with 3.0 billion in July 2019. Credits (i.e. foreign spending in Italy) fell from 6.0 billion in July 2019 to 2.4 billion in July 2020.
4 Inflation measured on the basis of the consumer price index for the whole nation, including tobacco, marked a minimum of -0.6 percent in January 2015.
MINISTRY OF ECONOMY AND FINANCE
| 3 |
UPDATE OF THE Economic and Financial Document 2020 |
In addition to the mentioned cyclical factors, a further downward pressure in prices has been added since June, due to the significant appreciation of the euro exchange rate of almost 8 percentage points vis-à-vis the dollar compared to the average trend during the first five months of the year. On average for the first eight months of the year, the average inflation rate according to the consumer price index for the whole nation was -0.1 percent. The trend of the GDP deflator was more favourable, as it grew, on average for the first two quarters, by 1.4 percent in annual terms.
On the labour market side, the fall in worked hours in industry and market services (-26.5 percent in the second quarter compared to the fourth quarter of 2019) was even dipper than that of value added (-20.4 percent). However, thanks also to the measures taken by the Government, such as the introduction of the Extended Supplementary Income Scheme (Cassa Integrazione Guadagni in Deroga), the number of employees fell much less than labour input (-2.4 percent in the second quarter compared to the fourth quarter of 2019) and recovered part of the lost ground already in the third quarter. The Istat monthly labour force survey shows that employment increased in both July and August, with month-on-month increases of 0.4 percent in both months and an acquired growth of 0.5 percentage points in the quarter.
I.2 macroeconomic scenario under unchanged legislation 2020-2023
The official forecast of real GDP in 2020 is lowered to -9.0 percent (-9.1 percent on quarterly data), from -8.0 percent of the Stability Programme forecast (-8.1 percent on quarterly data). The main reason for the downward revision is the sharpest contraction of GDP in the second quarter, explained by the length of the period of partial closure of production activities in Italy and by the higher than assumed in April spread of the epidemic on global scale. In addition, a much more cautious forecast of GDP growth in the fourth quarter (now indicated at 0.4 percent, compared with 3.8 percent foreseen in the Stability Programme) was adopted.
Caution about the increase in GDP in the fourth quarter reflects, on the one hand, the strong rebound estimated for the summer quarter and, on the other hand, the recent resurgence of covid-19 infections, in both absolute terms and as a ratio of daily swab tests. Compared to the minimum achieved in the second half of July, the number of hospitalized covid-19 patients in Italian hospitals and deaths also rose. The recovery of new infections in Italy is moderate, but outside our country, the pandemic continues to expand and in some European countries social distancing measures have been reintroduced, albeit less drastic compared to last spring. All this could slow down the recovery of Italian exports observed in recent months.
The availability of increasingly reliable rapid tests and the high number of daily swabs will make it possible to monitor the epidemic more and more effectively. However, to be able to detect and circumscribe new local outbreaks, it is necessary to contain the number of new infections. The forecast for the next two quarters therefore takes into account the need to maintain prudential rules of
| 4 | MINISTRY OF ECONOMY AND FINANCE
|
I. overall framework and fiscal policy |
behaviour and the high probability that inflows of foreign tourists will remain far below pre-crisis levels.
Meanwhile, the development of covid-19 vaccines by numerous pharmaceutical companies is continuing and major advances are being made in the development of monoclonal antibodies therapies. The European Commission has already signed two agreements on the supply of vaccines and is discussing four more ones with as many pharmaceutical companies5. The production of some vaccines is already in progress while third stage clinical trials are being carried out. At the end of this phase, vaccines will have to be approved by the European Medicines Agency (EMA), which assesses their efficacy and safety.
The basic assumption adopted for the macroeconomic forecast remains unchanged with respect to the Stability Programme, i.e. that the distribution of one or more vaccines begins by the first quarter of 2021 and that in mid-year the availability of new therapies and vaccines is such that the Government can relax most, if not all, restrictive measures. As a result, the recovery of the economy is expected to regain momentum during 2021, also giving rise to a significant carry-over effect on 2022.
GDP growth rates in the new forecast under unchanged legislation are 5.1 percent for 2021, 3.0 percent for 2022 and 1.8 percent in 2023. These increases seem to be high if compared to the results of the last twenty years, but it should be borne in mind that the starting point is an unprecedented fall in GDP. Moreover, in this scenario, quarterly GDP would not return to end-2019 levels until the second quarter of 2023; indeed, on year average, the level of real GDP in 2023 would be higher than in 2019 by only 0.3 percentage points.
TABLE I.1: Synthetic MACROECONOMIC framework under unchanged legislation (1) (percentage changes unless otherwise indicated) | |||||
| 2019 | 2020 | 2021 | 2022 | 2023 | |
| GDP | 0.3 | -9.0 | 5.1 | 3.0 | 1.8 |
| GDP deflator | 0.7 | 1.1 | 0.7 | 1.1 | 1.0 |
| Consumption deflator | 0.5 | 0.0 | 0.6 | 1.1 | 1.0 |
| Nominal GDP | 1.1 | -8.0 | 5.8 | 4.2 | 2.8 |
| FTE Employment (2) | 0.2 | -9.5 | 5.0 | 2.6 | 1.7 |
| LF Employment (3) | 0.6 | -1.9 | -0.2 | 0.9 | 0.9 |
| Unemployment rate | 10.0 | 9.5 | 10.7 | 10.3 | 9.8 |
| Current account balance (% of GDP) | 3.0 | 2.4 | 2.7 | 2.8 | 2.8 |
| (1) Any inaccuracies result from rounding. | |||||
| (2) Employment expressed in terms of full time equivalent units (FTE). | |||||
| (3) Number of persons employed based on the Continuing Labour Forces Survey (LFS). | |||||
Compared to the Stability Programme forecast, the update of the exogenous variables in the forecast only marginally affects the estimate of real GDP for 2020
5 Coronavirus: the Commission signs second contract to ensure access to a potential vaccine, Press release, Brussels, 18 September 2020. The agreement signed by the European Commission and AstraZeneca states the possibility for the EU to acquire up to 300 million doses of the anti-covid-19 vaccine, with an option on an additional 100 million doses. The agreement between the Commission and Sanofi-GSK provides for further 300 million one. The Commission is negotiating further agreements with other vaccine manufacturers, Johnson & Johnson, CureVac, Moderna and BioNTech.
MINISTRY OF ECONOMY AND FINANCE
| 5 |
UPDATE OF THE Economic and Financial Document 2020 |
(0.1 percentage points). The effect on the forecast for 2021 is however significant and of negative sign (-1.2 percentage points) due to a lowering of the projection of growth of the imports of the countries of destination of Italian exports, as well as the strengthening of the exchange rate of the euro and the recovery of the oil price. However, the expected growth for 2021 rises from 4.7 percent of the Stability Programme to 5.1 percent in view of the huge measures of support and stimulus to the economy introduced in May with the decree-law ‘Relaunch’ and in August with the decree-law ’Support and Relaunch’. Simulations carried out with the ITEM econometric model indicate that the impact of the two decrees on GDP growth is evaluated at 0.8 percentage points in 2020 and 2.5 p.p. in 2021. It should be recalled that the D.L. Relaunch also included the repeal of the VAT increases planned for 2021 and 2022, which - again according to estimates obtained with the ITEM model - alone improves the growth by 0.3 p.p. in 2021, 0.71 p.p. in 2022 and 0.23 p.p. in 2023.
Focusing on the main components of aggregate demand, the fall in GDP this year affects all components with the exception of the general government consumption (although it should be noted that the Istat data are decreasing in the first half of the year). The fall in household consumption would be in line with that of GDP, while gross fixed capital formation would fall much more strongly. Exports of goods and services are expected to drop more than imports on average in the year, which would result in a negative net contribution to the growth of foreign trade.
Over the next three years, the recovery of the economy will be supported both by domestic demand and by foreign trade and, to a lesser extent, by the rise in inventories. The expected increases in household consumption are consistent with a gradual decline in the savings rate in the three-year period 2021-2023 after the marked increase estimated for this year. The expected recovery in investment, foreseen in the unchanged legislation scenario, is characterised by higher growth rates over the next three years than in consumption, but their recovery in 2021 would be lower and would gain more momentum (relating to the overall performance of the economy) over the following two years. The projection of growth in exports follows broadly the expected evolution of international trade, while the trend of imports is consistent with that of domestic demand and production. In line with the recovery in exports of goods and services, a rise of the current account surplus is expected, being the first signals, as mentioned, already pointed out by the figures for July 2020.
Regarding inflation, a moderate recovery is expected after the average flat trend estimated for this year. The forecast is mainly explained by the cyclical rebound and the ongoing recovery of commodity and oil prices.
Finally, with regard to employment, labour units are expected to grow only slightly less than GDP, resulting in a moderate increase in productivity. The number of employees will increase significantly less and the resumption of working hours will mainly take place through the reabsorption of the workers for whom in 2020 the companies have benefited from the Supplementary Income Schemes.
| 6 | MINISTRY OF ECONOMY AND FINANCE
|
I. overall framework and fiscal policy |
The 2020-2021 macroeconomic forecast under unchanged legislation was endorsed by the Parliamentary Budget Office (PBO) on 21 September 2020.6 Endorsement of the 2022-2023 forecast is not required at this stage.
I.3 public finance forecast: scenario under Unchanged legislation
The forecasts updated based on the new macroeconomic framework, previously outlined, call for a general government net borrowing at 10.8 percent of GDP in 2020, with a marked increase from the 1.6 percent estimate of 2019. The increase in the deficit would be the result of a deterioration in the primary balance equivalent to more than 9 percentage points of GDP (from + 1.8 percent to -7.3 percent of GDP) and an increase in interest expenditure from 3.4 percent of GDP in 2019 to 3.5 percent in 2020 - an increase only due to the very strong fall in GDP, since in nominal terms interest payments are estimated to decrease by almost 2 billion compared to last year.
In turn, the deterioration in the primary balance is due to both cyclical factors and discretionary fiscal policy measures. As mentioned above, the expected ex-ante impact of all support measures introduced in response to the pandemic crisis was 6.1 percentage points of GDP. However, the new estimate of net borrowing is approximately 1.3 p.p. of GDP lower than the level deducible from the estimate of the Stability Programme by considering the downward revision of the estimate of GDP and the amounts of interventions carried out in May and August. This is due not only to a lesser use of some measures, but also to a better than expected revenue performance also due to a number of technical factors (e.g. the share of taxpayers who preferred to continue to make payments on the basis of the ‘historic’ rather than ‘forecast’ method).
Looking forward, the deficit based on current legislation is projected to fall to 5.7 percent of GDP in 2021 and then to 4.1 percent in 2022 and 3.3 percent in 2023. The primary balance would significantly improve in 2021 to -2.4 percent of GDP, then it would further converge towards the balance over the following two years, reaching -0.1 percent of GDP in 2023.
Due to the low level of current and expected government bond yields (according to the methodology usually used in official projections), interest expenditure would slightly decrease in absolute terms in 2021-2022 and then slightly increase in 2023. In relation to GDP, it would fall from 3.5 percent this year, to 3.3 percent in 2021 and 3.2 percent in 2022 and 2023.
On the primary expenditure side, the general government account under unchanged legislation set out in more detail in paragraph III.1 of this document is characterised by an increase in wage expenditure in 2020-2021, followed by a slight decrease in 2022-2023, as well as a sharp rise in intermediate consumption this year and then a fall in 2021 confirmed in 2022-2023. Conversely, pension
6 Parliamentary Budget Office, Letter of validation of the macroeconomic scenario under unchanged legislation of the Update of the DEF 2020, www.upbilancio.it.
MINISTRY OF ECONOMY AND FINANCE
| 7 |
UPDATE OF THE Economic and Financial Document 2020 |
expenditure under unchanged legislation would continue to grow throughout the forecast period, at a rate of 2.6 percent in 2020, 2.3 percent in 2021 and 2022, and 2.4 percent in 2023. Concerning the investment expenditure, nominal growth of 8.4 percent this year is expected to be around 6.5 percent in 2021 and 2022, followed by a slight decrease in 2023 (-1.8 percent). Nevertheless, in 2023 the ratio of public investment to GDP would be 2.7 percent, a level that is 0.4 p.p. higher than in 2019.
On the revenue side, the forecast based on current legislation reflects the ceasing of the emergency measures introduced this year and the recovery in nominal GDP. In 2021-2023, tax and contribution revenues grow at a pace consistent with nominal GDP growth. The other revenues are conservatively projected as roughly stationary.
In structural terms (i.e. net of the cyclical component and budgetary impacts of temporary measures) the government balance, after having improved by 0.4 percentage points of GDP in 2019, would worsen by 4.5 p.p. this year, and then improve by 2.4 p.p. in 2021, 0.4 p.p. in 2022 and 0.5 p.p. in 2023.
Moving on to public debt, the updated projection is based on the new annual national accounts data published by Istat on 22 September, which resulted in a moderate upward revision of nominal GDP in the years 2018 and 2019. In light of these new data, the public debt-to-GDP ratio was 134.4 percent in 2018 and 134.6 percent in 2019. In 2020, the strong fiscal expansion, the unprecedented fall in nominal GDP and the impact of some financial operations will push the debt-to-GDP ratio to 158.0 percent7. For the coming years, the scenario under unchanged legislation foresees an average decline in the public debt-to-GDP ratio of almost two percentage points per year in 2021 and 2022, and then a more moderate reduction in 2023, when this ratio would fall to 154.1 percent. The reduction in the debt-to-GDP ratio, although significant in the first two years of the period, would not be sufficient to meet the debt reduction rule in any of its configurations8.
Adverse scenario of resurgence of the epidemic
In line with a similar exercise carried out in the Stability Programme2020, Chapter II of this Update illustrates not only the usual risk scenarios linked to the exogenous variables (euro exchange rate, oil price, BTP spread and financial conditions), but also a more unfavourable scenario regarding the current covid-19 epidemic. This alternative scenario has been formulated in terms of the evolution of the disease, the effectiveness of the new rapid diagnostic tools, medicines and vaccines, as well as the timing of the mass distribution of the vaccines.
In the risk scenario, unlike what was assumed in the baseline scenario under unchanged legislation, the recovery of infections observed from August would
7 Among the above-mentioned financial transactions are the uses of the assigned assets, the instrument provided for in the DL Relaunch of 19 May 2020 to strengthen the capitalisation of companies.
8 The Debt Reduction Rule was introduced in 2011 by the Six Pack, which amended, among other things, Regulation 1467/97 of the European Council containing the rules of the corrective arm of the Stability and Growth Pact.
| 8 | MINISTRY OF ECONOMY AND FINANCE
|
I. overall framework and fiscal policy |
increase significantly in the final months of 2020, also leading to a significant increase in hospitalisations. This would lead the Government to reintroduce precautionary measures, albeit less drastic than last spring. After the rebound of the summer period, the GDP would suffer another fall in the fourth quarter. Assuming the continuation of some restrictive measures in the first few months of next year, the GDP would continue to fall, even if to a much lower extent than in the first half of 2020 (also thanks to the know-how and protective instruments acquired in the meantime). The trend of the epidemic would improve in the spring months, but the mass distribution of vaccines would take place later than assumed in the baseline scenario. Economic activity would resume in the second quarter. Nevertheless, the return towards the pre-crisis situation would be slower than in the baseline scenario and in the last quarter of 2021 real GDP would be more than one percentage point lower the baseline.
The upsurge of the covid-19 crisis would be accompanied by similar if not worse developments in other countries. The Italian economy would therefore also be impacted by lower exports of goods and services. This effect is modeled separately based on the assessments for the global economy made by Oxford Economics. The overall impact of domestic and international factors related to the pandemic risk scenario is given in Table R3 of Chapter II of this document. Based on these impacts, the annual GDP fall in 2020 would widen from -9.0 percent of the baseline scenario to -10.5 percent. GDP growth in 2021 would stop at 1.8 percent, compared with 5.1 percent of the baseline. Conversely, following a recovery path (although partial and delayed), the GDP would then grow by 6.5 percent in 2022 (compared to 3.0 percent of the baseline) and by 2.3 percent in 2023 (compared to 1.8 percent).
From the point of view of public finance, it can be estimated that, ceteris paribus (e.g. given the level of government bond yields), the government deficit would be around 11.5 percent of GDP in 2020 and 7.8 percent of GDP in 2021. The subsequent rebound of GDP would result in a marked decline in the deficit in 2022 and 2023. However, the final point would be a ratio of the public deficit to GDP higher by about half a percentage point in 2023 and a decreasing public debt-to-GDP ratio, but at a level more than 4 percentage points higher than the baseline.
These assessments do not include the possible impact on the budget balance and on the debt of any additional interventions that might be needed in the scenario of strong resurgence of the epidemic in Italy. However, the policy scenario discussed in the following paragraph provides additional resources to support the economy in 2021.
I.4 macroeconomic framework and public finance under policy scenario
The policy scenario is built in the light of the important novelty of the European Recovery Plan, called Next Generation EU (NGEU), a package of tools for the relaunch and resilience of the economies of the European Union that will be equipped with 750 billion resources in the period 2021-2026.
As explained in more detail in the following Chapter IV, the Government has assumed the leading role for the drafting of the National Recovery and Resilience
MINISTRY OF ECONOMY AND FINANCE
| 9 |
UPDATE OF THE Economic and Financial Document 2020 |
Plan (NRRP) provided for by the decision of the European Council of last 21 July9 through the Interministerial Committee for European Affairs (Comitato Interministeriale per gli Affari Europei, CIAE). In turn, the CIAE has entrusted the carrying out of activities to its Subcommittee, the Technical Evaluation Committee (TEC). In August, the latter launched an intensive collection activity of proposals, for projects to be financed through the Recovery and Resilience Facility (RRF), which is the most relevant component of the NGEU. On 9 September, the CIAE approved and subsequently sent to Parliament the Guidelines for the definition of Italy’s NRRP.
Following the outcome of the parliamentary examination and taking into account the policy advice that Parliament will want to formulate, as well as the Guidelines for the compilation of NRRP in the meantime published by the European Commission, in October the Government will draw up a Scheme of the Italian NRRP. In the following months, the latter will be the subject of interlocutions with the European Commission, which in turn will provide further elements for the final drafting of the NRRP. The final version of the Plan is to be presented at the beginning of 2021 and in any case no later than the end of April as scheduled by the European Semester.
As it is known, the RRF provides for a package of grants and loans. Budgetary planning will incorporate both components and is therefore more complex than in the past. The exploitation of the grant component is particularly important as it makes it possible to significantly increase the tangible and intangible public investments, increase expenditure on research, education and training, and stimulate more private investment, without this leading to additional government borrowing.
The NRRP and the financial programming should therefore be fully consistent to each other. To this end, although this Update refers to the three-year period 2021-2023, the Government has also developed six-year macroeconomic and public finance projections, which will form the basis for assessing both the impacts of the investment programme and other NGEU-funded interventions, as well as for achieving public finance targets.
The main objectives of budgetary policy for 2021-2023 can be summarised as follows:
| • | In the short term, support workers and productive sectors most affected by the pandemic as long as the covid-19 crisis continues; |
| • | In line with public finance objectives, fully exploit the resources made available by the NGEU to implement a comprehensive programme of investments and reforms of unprecedented scope and depth and bring the Italian economy on a sustained and balanced growth path; |
| • | Strengthen interventions to support the recovery of the Southern regions and disadvantaged areas, to improve territorial cohesion and to prevent that the covid-19 crisis could accentuate disparities between the different areas of the country. |
9 This decision also approved the Multiannual Financial Framework (MFF) 2021-2027.
| 10 | MINISTRY OF ECONOMY AND FINANCE
|
I. overall framework and fiscal policy |
| • | Implement a comprehensive tax reform that improves the fairness, efficiency and transparency of the tax system by also reducing the tax burden on middle and low incomes, coordinating it with the introduction of a single and universal child allowance (unified family support scheme); |
| • | Ensure a qualitative improvement in public finance, shifting resources towards the most appropriate uses to ensure an improvement in the well-being of the citizens, and in the fairness and the productivity of the economy; |
| • | Assuming that the crisis is gradually overcome over the next two years, the government net borrowing should be reduced to levels compatible with a continuous and significant reduction in the public debt-to-GDP ratio. |
Starting from the public finance scenario under unchanged legislation, the 2021-2023 manoeuvre of the next Budget Law will aim to support the recovery of the economy with a further fiscal boost in 2021, which will be reduced in 2022 and then aim at a significant improvement in the budget balance in 2023. As a result, government net borrowing objectives are set at 7.0 percent in 2021, 4.7 percent in 2022 and 3.0 percent in 2023. For the following years, a further significant improvement in the budget balance is expected to ensure a reduction in the public debt-to-GDP ratio throughout the forecast years.
Net borrowing objectives are also based on the fall in the primary deficit, which is expected to fall from 7.3 percent of GDP this year to 3.7 percent in 2021 and 1.6 percent in 2022, and then turn into a slight surplus (0.1 percent of GDP) in 2023. Under the policy scenario, interest expenditure (calculated on the basis of the same assumption on the implicit cost of debt financing used in the unchanged legislation framework) would fall from 3.5 percent this year to 3.1 percent in 2023.
In terms of the main fields of the manoeuvre, it provides for the refinancing of the so-called unchanged policies not covered by existing legislation (peace missions, refinancing of certain investment funds, business crisis fund, etc.). Secondly, significant resources are provided for to support workers’ employment and incomes, particularly in the sectors most affected by the covid-19 emergency and with particular reference to the first programming year, the 2021. Thirdly, the financing of the cut of the tax wedge on employees (the so-called EUR 100 measure) is completed and the social contributions cut to the South already introduced by the decree-law of August is financed only for the second half of 2020.
A major component of the three-year planning is the introduction of a comprehensive tax reform, which the Government intends to implement based on an enabling law that will be an integral part of the NRRP and its intermediate objectives. The reform will be in line with the introduction of a single and universal child allowance.
A further, important component of budgetary policy for 2021-2023 will be, as already mentioned, the full use of NGEU grants and loans to increase public investment in a never seen magnitude and increase resources for research, training, digitalisation and the conversion of the economy in terms of environmental sustainability.
The 2021-2023 policy scenario assumes the full use of grants under the first phase of the European Recovery Plan, representing 70 percent of the total amount
MINISTRY OF ECONOMY AND FINANCE
| 11 |
UPDATE OF THE Economic and Financial Document 2020 |
estimated for Italy, and of a first part of the remaining 30 percent (limited to 2023). In addition, it assumes a partial recourse to RRF’s loans in deficit. The remaining part of the RRF and the other components of the NGEU will be used in the period 2024-2026, as illustrated in Table I.2 below. It should be reiterated that grants will increase expenditure on public investment, support for private investment and expenditure on research, innovation, digitalisation, training and education according to the ‘Missions’ identified by the NRRP for an equal amount. Loans will play the same role, but will not result in an equivalent increase in net borrowing as they can partly replace existing expenditure programmes (even current expenditure) and partly be offset by deficit-reducing measures. The share of loans that translates into higher deficit is determined for each year according to the net borrowing objectives shown below.
The budgetary policy scenario for 2021-2023 foresees, on the expenditure side, the launch of a programme to review and redevelop the current general government expenditure and the revision of some environmentally harmful subsidies; on the revenue side, the most significant component is the additional revenue deriving from the higher GDP growth generated by the investment programme previously described. This second-round fiscal effect, however, has been prudently included in the estimates only from 2022 onwards, also in order to take into account the time lags with which revenues respond to increases in economic activity.
| TABLE I.2: Provisional Summary framework of RECOVERY PLAN RESOURCES utilisation (billion at 2018 values)* | |||||||||
| Recovery and Resilience Facility | ReactEU | Total RRF and ReactEU | Rural Development | Just Transition Fund | Other programmes | Total NGEU | |||
| Subsidies | Loans | Total | |||||||
| 2021 | 10.0 | 11.0 | 21.0 | 4.0 | 25.0 | .. | .. | .. | .. |
| 2022 | 16.0 | 17.5 | 33.5 | 4.0 | 37.5 | .. | .. | .. | .. |
| 2023 | 26.0 | 15.0 | 41.0 | 2.0 | 43.0 | .. | .. | .. | .. |
| 2024 | 9.5 | 29.9 | 39.4 | 0.0 | 39.4 | .. | .. | .. | .. |
| 2025 | 3.9 | 26.7 | 30.6 | 0.0 | 30.6 | .. | .. | .. | .. |
| 2026 | 0.0 | 27.5 | 27.5 | 0.0 | 27.5 | .. | .. | .. | .. |
| Total | 65.4 | 127.6 | 193.0 | 10.0 | 203.0 | 0.85 | 0.54 | 0.60 | 205.0 |
| (*) Preliminary assessment. The amounts may vary as a result of ongoing negotiations. | |||||||||
Moreover, the Government will continue to pursue policies to combat fraud and tax evasion and, in general, to improve tax compliance, which in recent years have achieved remarkable and exceeding expectations results. In a conservative view, the policy-scenario projections do not include further increases in revenue from tax evasion fight activity. On the other hand, a new fund will be set up financed with the revenue actually generated by this activity, which will be earmarked for the financing of fiscal reform measures and the reduction of public debt.
The main areas of the manoeuvre for 2021-2023 and its impacts are summarised in Table II.3 (Chapter II). The table confirms that, excluding the Recovery Plan, the fiscal impulse will be high in 2021 and will then be reduced in order to allow a gradual reduction of the deficit. On the other hand, the Recovery Plan will have a positive and increasing impact on GDP over the three-year period, because of both the increased resources deployed and composition effects
| 12 | MINISTRY OF ECONOMY AND FINANCE
|
I. overall framework and fiscal policy |
(increasing the share of public investment on the share of used resources) and time lags in the impact on GDP.
The real GDP path consistent with these estimates predicts a growth rate of 6.0 percent in 2021, 3.8 percent in 2022 and 2.5 percent in 2023. Quarterly GDP in the policy scenario recovers the level of the last pre-crisis quarter (fourth in 2019) in the third quarter of 2022.
| TABLE I.3: MACROECONOMIC Framework based on the policy scenario (1) (percentage changes unless otherwise indicated) | |||||
| 2019 | 2020 | 2021 | 2022 | 2023 | |
| GDP | 0.3 | -9.0 | 6.0 | 3.8 | 2.5 |
| GDP deflator | 0.7 | 1.1 | 0.8 | 1.3 | 1.2 |
| Consumption deflator | 0.5 | 0.0 | 0.7 | 1.2 | 1.2 |
| Nominal GDP | 1.1 | -8.0 | 6.8 | 5.1 | 3.7 |
| FTE employment (2) | 0.2 | -9.5 | 5.4 | 3.4 | 2.2 |
| LF Employment (3) | 0.6 | -1.9 | 0.3 | 1.7 | 1.5 |
| Unemployment rate | 10.0 | 9.5 | 10.3 | 9.5 | 8.7 |
| Current account balance (% of GDP) | 3.0 | 2.4 | 2.5 | 2.3 | 2.2 |
| (1) Any inaccuracies result from rounding. | |||||
| (2) Employment expressed in terms of full time equivalent units (FTE). | |||||
| (3) Number of persons employed based on the Continuing Labour Forces Survey (LFS). | |||||
The highest growth compared to the unchanged legislation scenario is mainly driven by gross fixed capital formation. The latter, in turn, have a multiplier effect on production and increase the households’ disposable income, resulting in higher private sector investment and household consumption expenditure. Exports are slightly affected by the impact of domestic growth on costs and prices, but over time, they benefit from the enhanced competitiveness of the economy achieved through higher investment.
| Figure I.4: REAL gdp forecast under unchanged legislation and under policy scenario (billion, chain linked values) |
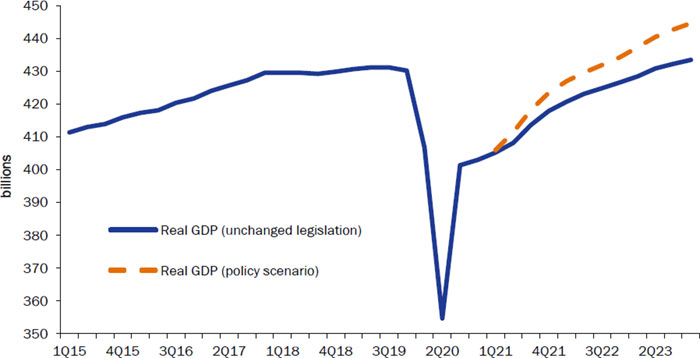 |
| Source: Istat and MEF computations. |
MINISTRY OF ECONOMY AND FINANCE
| 13 |
UPDATE OF THE Economic and Financial Document 2020 |
In view of these forecasts, it should be reiterated that, in the first part of the three-year period, the growth differential compared to the unchanged legislation scenario is ensured by the more expansive approach of fiscal policy, also motivated by the need to support incomes and employment at a time when the covid-19 epidemic will still adversely affect economic activity. In the second part of the period, however, the most significant boost to growth will come from the NRRP and in particular the grants component. Therefore, the forecasts are based to a significant extent on the success of the NRRP itself. Less growth fueled by the NRRP would also affect the performance of the public finance, even without jeopardising its sustainability.
On the other hand, the policy scenario forecast was set on the basis of conservative impact estimates. Furthermore, the forecast does not take into account neither the favourable impact on growth of the broad reforms programme, which will be an integral part of the NRRP, nor the favourable impact of the Recovery Plan on the average debt financing cost10. Overall, therefore, the forecast appears balanced although the level of economic uncertainty remains very high and there is a risk of implementation in relation to the NRRP (also considering that the relevant regulations still have to be approved).
In the light of the macroeconomic policy framework, although the trend of potential GDP is more favourable, the output gap closes more rapidly over the three-year forecast. Nevertheless, the structural balance significantly improves in each year. In particular, also thanks to the lower nominal deficit, the improvement in the structural balance is more marked in 2023 compared to the unchanged legislation scenario.
| FIGURE I.5: deficit and public debt As ratio to GDP – policy scenario 2020-2023 (%) |
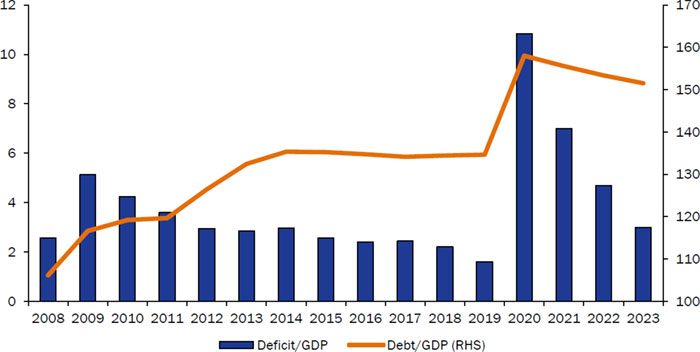 |
| Source: Istat and MEF computations. |
10 The decrease in the public debt financing cost would result both from the lower yield paid on loans under the RRF compared to government bonds, and from the reduction in the spread on government bonds induced by the success of the programme in terms of increasing potential growth and improving debt sustainability.
| 14 | MINISTRY OF ECONOMY AND FINANCE
|
I. overall framework and fiscal policy |
As regards the development of the general government debt-to-GDP ratio, the policy scenario foresees a significant decline. From 158.0 percent estimated for this year, in fact, it would fall to 151.5 percent in 2023, a reduction that is 2.6 percentage points higher than in the unchanged legislation scenario.
| table i.4: public finance Indicators (% of GDP) (1) | ||||||
| 2018 | 2019 | 2020 | 2021 | 2022 | 2023 | |
| POLICY SCENARIO | ||||||
| Net borrowing | -2.2 | -1.6 | -10.8 | -7.0 | -4.7 | -3.0 |
| Primary balance | 1.5 | 1.8 | -7.3 | -3.7 | -1.6 | 0.1 |
| Interest expenditure | 3.6 | 3.4 | 3.5 | 3.3 | 3.1 | 3.1 |
| Structural net borrowing (2) | -2.3 | -1.9 | -6.4 | -5.7 | -4.7 | -3.5 |
| Structural change | -0.5 | 0.4 | -4.5 | 0.7 | 0.9 | 1.2 |
| Public debt (gross of support) (3) | 134.4 | 134.6 | 158.0 | 155.6 | 153.4 | 151.5 |
| Public debt (net of support) (3) | 131.1 | 131.4 | 154.5 | 152.3 | 150.3 | 148.6 |
| TREND SCENARIO AT UNCHANGED LEGISLATION | ||||||
| Net borrowing | -2.2 | -1.6 | -10.8 | -5.7 | -4.1 | -3.3 |
| Primary balance | 1.5 | 1.8 | -7.3 | -2.4 | -0.9 | -0.1 |
| Interest expenditure | 3.6 | 3.4 | 3.5 | 3.3 | 3.2 | 3.2 |
| Structural net borrowing (2) | -2.4 | -2.0 | -6.6 | -4.2 | -3.8 | -3.2 |
| Structural change | -0.5 | 0.4 | -4.5 | 2.4 | 0.4 | 0.5 |
| Public debt (gross of support) (3) | 134.4 | 134.6 | 158.0 | 155.8 | 154.3 | 154.1 |
| Public debt (net of support) (3) | 131.1 | 131.4 | 154.5 | 152.5 | 151.2 | 151.1 |
| MEMO: DEF 2020, NEW POLICIES SCENARIO | ||||||
| Net borrowing | -2.2 | -1.6 | -10.4 | -5.7 | ||
| Primary balance | 1.5 | 1.7 | -6.8 | -2.0 | ||
| Interest expenditure | 3.7 | 3.4 | 3.7 | 3.7 | ||
| Public debt (gross of support) (4) | 134.8 | 134.8 | 155.7 | 152.7 | ||
| Public debt (net of support) (4) | 131.5 | 131.6 | 152.3 | 149.4 | ||
| Nominal GDP at unchanged legislation (absolute values x 1,000) | 1771,1 | 1789,7 | 1647,2 | 1742,0 | 1814,8 | 1865,2 |
| Nominal GDP under policy scenario (absolute values x 1,000) | 1771,1 | 1789,7 | 1647,2 | 1759,2 | 1848,9 | 1916,6 |
(1) Any inaccuracies result from rounding. (2) Net of one-off and cyclical component. (3) Gross or net of Italy’s shares of loans to EMU Member States, bilateral or through the EFSF, and the contribution to the capital of the ESM. At the end of 2019, the amount of these shares amounted to approximately 57.8 billion, of which 43.5 billion for bilateral loans and through the EFSF and 14.3 billion for the ESM programme (see Bank of Italy, ’Statistical Bulletin of Public Finance, Needs and Debt’ of 15 September 2020). The MEF’s liquidity stocks are expected to be reduced by 0.2 percent of GDP in 2020 and 0.1 percent of GDP in 2021; in addition, estimates take into account the repurchase of SACE, the uses of the assets allocated and the EIB and SURE guarantees. The scenario of the interest rates used for the estimates is based on the implicit forecasts arising from the forward rates on Italian government bonds during the period of compilation of this document. (4) Gross or net of Italy’s shares of loans to EMU Member States, bilateral or through the EFSF, and the contribution to ESM capital. Estimates consider a reduction in MEF’s liquidity stocks of 0.8 percent of GDP in 2020 and an increase of 0.4 percent of GDP in 2021. | ||||||
MINISTRY OF ECONOMY AND FINANCE
| 15 |
UPDATE OF THE Economic and Financial Document 2020 |
Objectives for 2024-2026 and debt sustainability
The longer-term objective is to bring again the general government debt below the pre-covid-19 level by the end of the decade through a further improvement in the primary balance and the maintenance of an economic growth trend significantly higher than that of the past decade. As already mentioned, although the forecast horizon of the Update of the Stability Programme is three years, in light of the fact that the NRRP and the resources made available by the European Recovery Plan cover the period 2021-2026, the Government has also drawn up a preliminary scenario for the period 2024-2026. This ensures consistency between the assumptions made by the NRRP, the 2021-2023 budget and the public debt-to-GDP reduction strategy.
The starting point for the construction of the 2020-2026 policy scenario was to extend the unchanged legislation macroeconomic framework and the related public finance projections to 2024-2026. It has been postulated that GDP growth converges towards the estimated potential growth rate with the “T+10” methodology traditionally adopted by the European Commission11. With this growth rate of 1.1 percent, the effective growth rate is set equal to 1.5 percent in 2024 (decreasing from 1.8 percent in 2023) and then 1.1 percent in 2025 and 2026.
In the light of the public finance estimates based on unchanged legislation, the so-called unchanged policies have been projected to reach balances under the no-policy change assumption. On this baseline, the assumptions for the NRRP have been included and its net impact on GDP is estimated. This impact is positive throughout the period, but slightly decreasing, as the differential of increased expenditure for public investment and other policies financed by the RRF peaks between 2023 and 2024 and therefore its marginal impact on GDP is reduced in the final two years of the forecast scenario (although distributed lags of impacts soften this effect).
In view of these results, the general government primary balance objectives have been set. The policy scenario primary surplus rose from 0.1 percent of GDP in 2023 to 0.6 percent in 2024, 1.7 percent in 2025 and 2.5 percent in 2026. These objectives make emerge the scale of the manoeuvre required to achieve them; the manoeuvre second-round effect on the budget are calculated too. Real GDP growth in the 2024-2026 policy scenario is equal to 1.8 percent in 2024, 1.5 percent in 2025 and 1.4 percent in 2026.
The primary surplus for the final year of the projection, given the estimated interest expenditure, corresponds to a general government net borrowing (deficit) of 0.5 percent of GDP. The scale of the manoeuvre required is just over 0.4 percent of GDP in 2024 and a further tenth of a percentage point of GDP in 2025. The fiscal tightening required to achieve the net borrowing objective of 0.5 percent of GDP in 2026 is therefore relatively low, confirming that the
11The estimate mentioned in the text starts from the macroeconomic framework under unchanged legislation for 2021-2023 of this Update; it extrapolates potential growth until 2031 and results in real growth in line with the mechanical closure of the output gap. For the years 2024-2026, the estimated growth is about 1.1 percent per year and in subsequent years, it decreases to 0.6 percent in 2030-2031.
| 16 | MINISTRY OF ECONOMY AND FINANCE
|
I. overall framework and fiscal policy |
proposed scenario is reliable, as it does not require a markedly restrictive fiscal policy, which in the past has proved either unsustainable or counterproductive for the country’s economic and social stability. It should also be noted that if some of the new policies were not to be introduced, the proposed manoeuvre for 2024-2025 would not be necessary.
A Debt Sustainability Analysis (DSA) extended until 2031 was also carried out in light of the 2021-2026 policy scenario. This analysis is normally conducted starting from the primary balance of the final three-year forecast year (in this case 2023). Starting from this balance, the structural primary balance (i.e. net of temporary measures and cyclical component) is calculated and projected over a ten-year horizon, by assuming that: i) the economy follows the path of potential growth; ii) the deflator converges towards the ECB’s target inflation rate; iii) and that the debt financing cost follows an evolution consistent with the forward yields calculated by recent market levels. These extrapolations are discussed in detail in Section III.5 of this Update.
In the modified DSA variant summarised here, it is assumed, instead, that the primary balance follows the policy-scenario path until 2026 and then remains at this level in structural terms in the following five years. Based on this assumption, by applying the rest of the DSA methodology, it is obtained the path of the debt-to-GDP ratio represented in Figure I.6. The debt ratio steadily declines and falls below the level recorded last year by 2031.
| FIGURE I.6: debt-to-GDP ratio path under policy scenario to 2026 and extrapolation to 2031, maintaining the 2026 structural primary balance unchanged |
Source: MEF computations. |
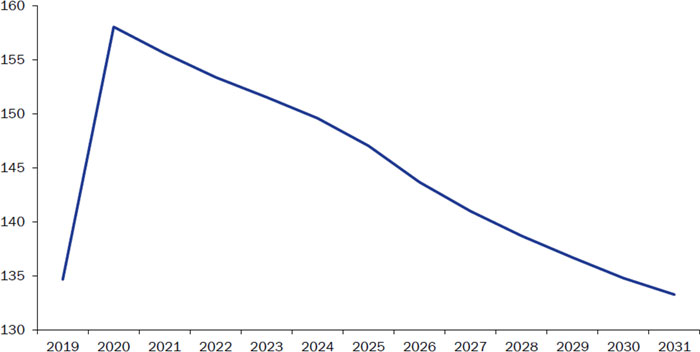
Reabsorbing an increase in the debt-to-GDP ratio such as that expected for this year (over 23 percentage points) over a decade would be a great result. However, it could be argued that in order to protect public finance from other risks that could emerge in the coming years, it would be appropriate to plan a quicker adjustment, also in view of the fact that the debt reduction rule would not be fully met during the forecast period. Given that the European fiscal rules
MINISTRY OF ECONOMY AND FINANCE
| 17 |
UPDATE OF THE Economic and Financial Document 2020 |
will be reconsidered again once the pandemic emergency has been overcome, it is clear that if the recovery of the economy in the coming years will exceed expectations, then it would be possible to consider a path of even greater improvement in the primary balance, which would, under the same conditions, speed up the decline of public debt-to-GDP ratio.
In any case, the projection shown here confirms that an effective use of the Recovery Plan and a wise but non-restrictive management of public finance will allow to attain a high degree of debt sustainability. In the next future, the Government’s efforts will focus on the preparation of a wide-ranging and effective NRRP. On a longer-term horizon, it will be important to keep a constant focus on improving public finance, whose resilience is crucial to respond to unexpected shocks such as that caused by the current pandemic.
Net balance to be financed
In accordance with the rules of the Law on Public Accounting and Finance on the mandatory contents of the Update of the Stability Programme, the net balance to be financed of the State budget in accrual terms may increase to EUR 196 billion in 2021, 157 billion in 2022 and EUR 138.5 billion in 2023. The corresponding net balance to be financed in cash terms may increase to EUR 279 billion in 2021, 208.5 billion in 2022 and EUR 198 billion in 2023. These amounts shall include the necessary financial resources, to be allocated in anticipation, to implement the NRRP.
| 18 | MINISTRY OF ECONOMY AND FINANCE
|
I. overall framework and fiscal policy |
Draft laws related to the budget decision
To complete the 2021-2023 budgetary manoeuvre, the Government declares the following as the draft laws linked to the budgetary decision:
| • | Draft Law in the field of university qualifications (so-called Draft Law ‘qualifying degrees’); |
| • | Draft Law of reorganisation of the sector of artistic, musical and choreutical high education (so-called Draft Law ‘AFAM’); |
| • | Draft Law with provisions relating to entertainment, cultural and creative industries and tourism; |
| • | Draft Law for the reorganisation of environmental legislation, the promotion of the green economy and the circular economy (Green Generation); |
| • | Draft Law on the reform of social safety nets; |
| • | Draft Law for updating and reorganising the legislation on health and safety at workplaces; |
| • | Draft Law on minimum wages and representation of the social parties in collective bargaining; |
| • | Draft Law on tax reform; |
| • | Draft Law on tax justice reform; |
| • | Draft Law to reorganise the game sector; |
| • | Draft Law on “Reordering the rules on prevention of corruption, publicity obligations, transparency and information release by general government”; |
| • | Draft Law on “Provisions on smart working in public offices”; |
| • | Draft Law on “Simplification of administrative procedures for the containment of hydrogeological risk” |
| • | Draft Law with regard to the support and exploitation of agriculture and fisheries; |
| • | Draft Law “Provisions for the implementation of differentiated autonomy referred to in Article 116, 3 paragraph, Cost.”; |
| • | Draft Law “Implementation of the forms of coordination between central and regional governments, including the end of the reduction of constitutional litigation”; |
| • | Draft Law on simplification and reorganisation in the fields of start-ups and innovative SMEs; |
| • | Draft Law on the companies’ statute; |
| • | Draft Law on comprehensive review of incentives in favour of firms; |
| • | Draft Law on provisions for the development of the supply chains and to encourage the aggregation between firms; |
| • | Draft Law on the reform of the framework law for craftsmanship; |
| • | Draft Law on the revision of the Consolidated Text of Law on Local Authorities. |
MINISTRY OF ECONOMY AND FINANCE
| 19 |
UPDATE OF THE Economic and Financial Document 2020 |
| 20 | MINISTRY OF ECONOMY AND FINANCE
|
II.1 The International Economy
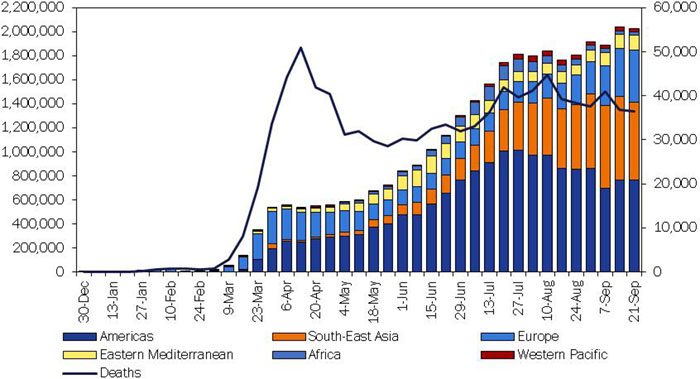
In the first half of 2020, the world economy faced the deepest setback since World War II, due to the spread of the covid-19 pandemic. Although with different durations, starting from March, the halt of non-essential activities and social distancing to contain the health emergency have been adopted in the various geo-economic areas.1 The economic activity of the major countries was gradually restarted in May thanks to the decline of the infection.
| Figure II.1: Number of covid-19 recorded cases by REGION AND world deaths (weekly data, updated at 21 September) |
|
| Source: World Health Organisation (WHO). |
1 As it was the first country where the epidemic occurred, the lockdown in China began on 23 January, ending on April 8. Remaining in the Asian area, the Japanese government adopted lockdown on April 16 throughout the country, while in India it was introduced on 25 March. In Europe, Italy started lockdown on 9 March, followed by Spain and France a few days later (14 and 17 March respectively); on 23 March the lockdown was declared by Germany and the United Kingdom. In the Americas, the United States introduced lockdown measure between 19 and 24 March, with different timing and intensity between the various States. Among the largest countries in Latin America, the lockdown began in the second half of March in Argentina, while Brazil did not introduce it at national level. (Source: For advanced countries, CER, Report n.1/2020, August 2020; for other countries, https://www.thinkglobalhealth.org/article/updated-timeline-coronavirus).
MINISTRY OF ECONOMY AND FINANCE
| 21 |
UPDATE OF THE Economic and Financial Document 2020
| Figure II.2: Positivity rate at covid-19 (%, share of positive tests on the number of performed tests, rolling 7 days average, data updated at 29 September) |
|
| Source: Our World in Data (OWD). |
Governments and central banks have introduced extraordinary fiscal and monetary policy measures to support workers’ incomes and the productive system, providing support on a much larger scale, and more quickly, than in the 2008 crisis. Despite these interventions, the lockdown led to a contraction of GDP and world trade by 3.5 percent and 2.7 percent q/q in the first quarter of the year, and an even sharper decline in the following quarter (by more than 5 percent and 12.5 percent respectively).
| Figure II.3: Trend OF THE WORLD trade (volume data, index, 2010=100) |
|
| Source: CPB. |
In the main advanced economies, the largest contraction in GDP occurred during the second quarter. In the United States and in Japan, the output decreased by about 8 percent q/q, while in the Eurozone there was a deeper drop (-11.8 percent q/q); the reduction in the United Kingdom was even more marked
| 22 | MINISTRY OF ECONOMY AND FINANCE
|
II. MACROECONOMIC FRAMEWORK
(-19.8 percent q/q). In contrast, China – having been the first country to be hit by covid-19 – reactivated the economy at the beginning of April, recording a y-o-y growth of 3.2 percent in the second quarter.
Following the restart of production, in May and June the recovery was more sustained than expected, although with a lower intensity and uneven trend in the various countries. The most recent business surveys show that the Global Composite Purchasing Managers’ Index (PMI),2 having reached its lowest level ever for the last ten years in April (equal to 26.2 points) has returned above the expansion threshold in August, reaching 52.4 points, the highest level since March 2019.
| Figure II.4: global COMPOSITE pmi and BY COUNTRY |
|
| Source: Markit, Refinitiv. |
As a result of social distancing measures, in the second quarter of the year the US economy contracted due to the sharp reduction in households consumption and investment, delayed by firms owing to uncertainty and weak demand. Industrial production reached its lowest level since the beginning of the year in April (-12.9 percent over the previous month), gradually recovering in the following months (+4.8 percent on average in June and July), but slowing down in August (+0.4 percent). The effects on the labour market have been significant, with the unemployment rate reaching the historic peak of the last fifty years (at 14.7 percent in April, from 4.4 percent in March) and then falling to 8.4 percent in August.
To contain the impact of the pandemic, federal spending has been expanded to finance programmes to support families, businesses, central and local levels of government. According to estimates provided by the Congressional Budget Office (CBO), such policies would result in additional expenditure and missed revenues for the 2020 federal budget of more than 2 trillion dollars (approximately 10
2 The purchasing managers index (PMI) is a spread index constructed in such a way that a value greater than 50.0 is consistent with an expansion of economic activity, in this case global.
MINISTRY OF ECONOMY AND FINANCE
| 23 |
UPDATE OF THE Economic and Financial Document 2020
percent of nominal GDP).3 These instruments have been accompanied by the FED’s financing programmes to assure lending to the economy and financial stability4. On the price side, core consumer inflation (excluding energy and food) gradually increased (to 1.7 percent in August from a minimum of 1.2 percent in May and June), remaining below the FED target. In this regard, the US Central Bank confirmed the new monetary policy strategy during its September meeting, announced at the end of August by Chair Jerome Powell, which foresees5 low policy rates (currently between 0.0 and 0.25 percent) until the economy returns to full employment and the inflation rate reaches at least 2 percent, being ready to tolerate moderately higher inflation for a reasonable period of time.
On the Asian continent, according to the International Monetary Fund, GDP6 is expected to contract by 1.6 percent, involving most countries, in relation to the need to contain infections, to dependence on global value chains, on the tourism sector and on foreign remittances.
Major countries show differentiated trends in view of the different phases of the pandemic. China gradually reopened its economic activities in the spring. Industrial production has been recovering since April, up to a y-o-y expansion of 5.6 percent in August (from 4.8 percent in the previous two months). On the other hand, consumers remain cautious, while increasing their purchases in August (+0.5 percent y/y for retail sales), for the first time since the beginning of the year. Investments in fixed assets remain slightly negative in the first eight months of 2020 (-0.3 percent), largely supported by public investment. Despite the recovery, the economy is suffering from lower foreign demand and a decline in international trade. Various interventions have been adopted by the Government and the Central Bank to support the economy, such as the granting of loans on more favourable terms, the lowering of the lending rates and the cut in the reserve ratios of the banks. The Chinese central bank carried out several liquidity injections into the market, the last one in September amounting to 600 million yuan of medium-term loans, as well as confirming the one-year MTF (Medium term facilities) rate (2.95 percent).
Japan was less affected by the pandemic than other countries, but, like the other countries, it adopted severe emergency measures in April and May. With the contraction in the second quarter, growth was negative for the third consecutive quarter. The decline in private consumption and in investment was associated with the strongly negative contribution of the foreign sector, influenced by lower imports from China, the main trading partner. After four months, industrial production grew again in June, strengthening at the beginning of the third quarter (+8.6 percent in July m/m), driven mainly by the car sector, then decelerated in August (1.7 percent). On the price side, core inflation (excluding food and energy)
3 Federal reserve, ‘Monetary Policy Report’, June 2020, https://www.federalreserve.gov/monetarypolicy/files/20200612_mprfullreport.pdf.
4 Federal Reserve, ‘Monetary Policy Report’, op. cit. and Board of Governors of the Federal Reserve System, https://www.federalreserve.gov/funding-credit-liquidity-and-loan-facilities.htm.
5 Jerome H. Powell, ‘New Economic Challenges and the Fed’s Monetary Policy Review’, Jackson Hole (via webcast), August 27, 2020, https://www.federalreserve.gov/newsevents/speech/files/powell20200827a.pdf
6 IMF, ’Speech on the Global and Asia Economic Outlook’, Tao Zhang, IMF Deputy Managing Director, July 10, 2020, https://www.imf.org/en/News/Articles/2020/07/10/sp071020-speech-on-the-global-and-asia-economic-outlook.
| 24 | MINISTRY OF ECONOMY AND FINANCE
|
II. MACROECONOMIC FRAMEWORK
stood at 0.4 percent y/y. The Bank of Japan remains cautious in further lowering policy rates (already negative or zero) to avoid side effects on the productive and banking system, while expressing a more positive assessment of the economic outlook. The measures to support the economy have been significant on the part of the Government in favour of both business and consumers, and this has been reiterated by the recently appointed Prime Minister.
At the same time, emerging economies – of which Brazil and India remain among the most affected by the pandemic after the United States – have also had to cope with the impact of the health crisis, having less financial capacity to support productive activities. Funding programmes have been set up to support the most fragile countries by major international organisations, including the IMF and the World Bank.
In this international context, the pandemic in the euro area had particularly negative economic impacts in April when the lowest point has been reached, while the economic information available from May onwards suggests a gradual recovery. Industrial activity recorded a deep decline between March and April, but the most recent figures record a rebound (12.2 percent in May, 9.5 percent in June and 4.1 percent in July), although the activity still remains below pre-covid levels. Qualitative surveys indicated a recovery in manufacturing and services in the summer months, with PMI indices returning to the expansion area; the September data reported a slight weakening of economic conditions as a result of the resurgence of the contagion rate in some European economies which have consequently adopted new restrictive measures. There is a higher resilience of the manufacturing sector than services, which appear to be weaker. The Economic Sentiment Indicator published by the European Commission continues to improve, albeit at a lower pace, and is gradually approaching the values of last March.
In the euro area labour market, the effects of the epidemic were mainly in terms of a sharp decrease in the number of hours worked (-4.1 percent in the first quarter and -12.8 percent in the second quarter), despite a relatively small impact on the number of employees. These developments have been influenced by wage integration instruments. Inflation remains weak as a result of moderation in energy prices – albeit declining – due to the easing of the positive trend in food (particularly unprocessed goods) and the weakness of services. Technical and seasonal factors weighed on the decrease in consumer inflation in August to -0.2 percent y/y (from 0.4 percent y/y of the previous month). The new preliminary figure for September indicates a further weakening of consumer inflation (at -0.3 percent y/y).
The European institutions reacted resolutely to the crisis arising from the health emergency. In May, the European Commission presented to the European Parliament a proposal for the creation of a new instrument called Next Generation EU. On 21 July, European leaders reached a historic agreement on the set of funds to be allocated for recovery totaling 750 billion, broken down into 360 billion in loans and 390 billion in grants. At the same time, European leaders agreed on the EU budget for the period 2021-2027, which will have resources of 1,074 billion. The budget will support, inter alia, investment in the digital and green transitions.
In her State of the Union speech to the European Parliament, President Ursula von der Leyen urged the governments of the Member States to seize the
MINISTRY OF ECONOMY AND FINANCE
| 25 |
UPDATE OF THE Economic and Financial Document 2020
opportunity represented by the Next Generation EU to implement structural reforms in the economy, finding an equilibrium between financial support and fiscal sustainability. With regard to resources, the President reiterated that 20 percent of the funds should be allocated to digital, while 37 percent of those funds will be used in the implementation of the Green Deal, adding that 30 percent of the 750 billion of the Recovery Fund will be financed through green bonds. With regard to the economic impact of the investments of the Next Generation EU, levels of the EU real GDP are projected to grow by around 1.75 percent in 2021 and 2022, rising to 2.25 percent by 2024.
As part of the safety net in support of workers, the Council of the European Union approved financial support of EUR 87.4 billion for 16 Member States in the form of EU loans granted under the SURE scheme, a temporary instrument agreed by the Eurogroup on 9 April 2020 and subsequently approved by EU leaders, to finance measures to contrast unemployment implemented by Member States during the covid-19 crisis.
In the field of European monetary policy, at its meeting on 4 June the Governing Council of the ECB strengthened of its expansionary monetary policy by extending the size and duration of the purchasing programme aimed at countering the effects of the pandemic. At its meeting on 10 September, the Council confirmed the Pandemic Emergency Purchase Programme (PEPP) for the purchase of public and private securities, maintaining the budget at 1,350 billion and reaffirming its intention to continue its net purchases until at least June 2021 and in any case until the critical phase related to coronavirus is considered to be over. In addition, the capital repaid on the securities due under the PEPP will be reinvested until at least the end of 2022. The existing Asset Purchase Programme (APP) will continue at least until the end of this year, at a pace of EUR 20 billion per month. Finally, policy interest rates remain unchanged. The Governing Council confirmed its intention to continue providing abundant liquidity through its refinancing operations; it also affirmed it would be ready to adapt all its instruments, where appropriate, to ensure that inflation continues to steadily approach the target, in line with the commitment to pursue a symmetrical approach to achieving price stability.
Regarding a possible change in the ECB’s strategy also in the light of the FED’s change of approach, President Lagarde recently stated that the process of reviewing the monetary policy strategy started last year has resumed its course, after its process had been delayed by the occurring pandemic. The review of the strategy will focus on three key issues: the definition of the inflation target; the relationship between inflation and the real economy; the transmission and effectiveness of monetary policy.
As regards the UK, relations with the EU concerning the Brexit are tightened after the British Government has published a new draft law to protect the integrity of the UK Single Market, in apparent violation of the agreement already signed with the EU. The initial reaction of the European authorities was to reiterate that the agreement cannot be renegotiated or amended by asking the British Government to withdraw the law by 30 September. Subsequently, the European Commission has initiated a formal infringement procedure against the United Kingdom which will have one month to reply to the letter. At the same time, despite the litigation, negotiations remain open for reaching an exit
| 26 | MINISTRY OF ECONOMY AND FINANCE
|
II. MACROECONOMIC FRAMEWORK
agreement by December. Meanwhile, the UK economy has contracted sharply in the second quarter (-19.8 percent on the previous quarter). As in continental Europe, the most recent indicators suggest a strong rebound of GDP in the third quarter. However, the short-term outlook has become complicated due to the recovery of infection and the related precautionary measures announced by the Government.
In light of these developments, the Bank of England (BoE) unanimously confirmed policy rates at 0.1 percent and the purchase of assets for £745 billion. The current trend will be maintained until steady progress is observed in the pursuit of the 2 percent inflation target (the most recent figure is 0.2 percent in August). The BoE also highlighted the risks of high levels of unemployment over a prolonged period and stated that it would consider introducing negative rates if the economic outlook made it necessary.
Regarding the financial markets, there has been a sharp increase in volatility in the early and most acute phase of the pandemic, due to fears related to the contraction of trade. Subsequently, the fiscal and, above all, monetary policy measures introduced between March and April mitigated the strong uncertainty arising from the health crisis. The pandemic has led to a significant strengthening of the pharmaceutical and high-tech sectors.7 In the summer months, the stock exchanges reported significantly positive results, in relation to the expectations of progress towards the detection of a vaccine and the displacement of the assumptions of new lockdowns in the autumn months, except for abrupt surges in sales of the same securities around mid-September.
The forecast is also influenced by oil and main raw materials prices, although forward contracts prices are used in this case. The oil price collapsed during the first phase of the pandemic, reaching historical lows at about $20 per barrel in the second half of April, from about $60 per barrel in late February. As a result of OPEC plus agreements8 and the global recovery in economic activity, prices have increased since May to around $40 per barrel. In contrast, the price of gold, after the minimum value since the beginning of the year reached in spring, increased in the following months, signaling uncertainty about the evolution of the international context.
7 G. Capelle-Blancard, A. Desroziers, ‘the stock market and the economy: Insights from the covid-19 crises, June 19, 2020, https://voxeu.org/article/stock-market-and-economy-insights-covid-19-crisis. https://voxeu.org/article/stock-market-and-economy-insights-covid-19-crisis
8 OPEC plus brings together the 14 members of OPEC (Algeria, Angola, Saudi Arabia, Ecuador, United Arab Emirates, Gabon, Equatorial Guinea, Iran, Iraq, Kuwait, Libya, Nigeria, Qatar, Venezuela) and non-OPEC producers (Azerbaijan, Bahrain, Brunei, Kazakhstan, Malaysia, Mexico, Oman, Russia, Sudan, South Sudan). The organisation was founded in December 2016, at the ministerial meeting between OPEC countries and some non-member countries, during which a Declaration of Cooperation was signed to reduce total oil production.
MINISTRY OF ECONOMY AND FINANCE
| 27 |
UPDATE OF THE Economic and Financial Document 2020
| Figure II.5: price of Brent AND FUTURES |
|
| Source: Bloomberg. |
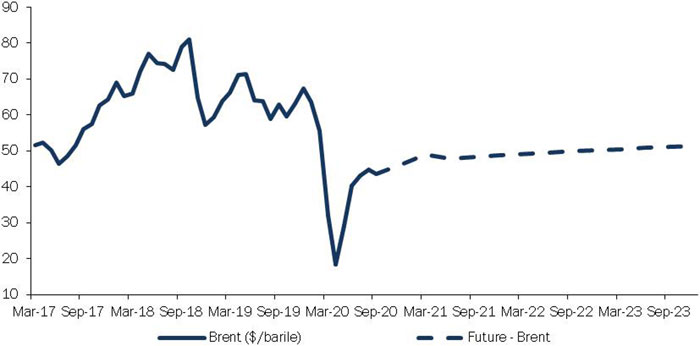
In the foreign exchange market, after having depreciated in the first half of the year, the euro appreciated on weighted average against the main currencies, with a stronger strengthening against the dollar starting in July, returning to levels close to those of May 2018. The strengthening of the euro impacts on the forecast of the Italian economy because, as usual, the current level towards the other major currencies is extrapolated throughout the forecast period.
As for the world trade, the path foreseen by Oxford Economics, whose projections underlie the macroeconomic outlook of this document, is now more unfavourable than that considered in the Stability Programme for the first two years of the forecast period, particularly for the current year. In contrast, the expected recovery has been revised upwards for the following two years.
| Table II.1: INTERNATIONAL EXOGENOUS variables | ||||||
| 2020 | 2021 | 2022-2023 | ||||
| SP 2020 | Update | SP 2020 | Update | SP 2020 | Update | |
World trade (Percentage changes) | -6.7 | -11.5 | 9.9 | 8.6 | 3.6 | 4.9 |
| Oil price (USD/barrel, futures, Brent) | 38.3 | 42.4 | 39.6 | 48.1 | 44.3 | 50.4 |
| USD/EUR exchange rate | 1.09 | 1.14 | 1.09 | 1.19 | 1.09 | 1.19 |
Overall, the risks to the global scenario are still tilted to the downside: the evolution of the epidemic in the world, which in many countries continues to appear dramatic, is accompanied by risks of geopolitical tensions, pre-existing the pandemic or heightened only recently. Trade relations between the United States and China, which profoundly affected the development of international trade during 2019, are still tense, despite the ratification of Phase 1 of the agreements. As has been said, the negotiation process for Brexit seems to suffer new setbacks, fueling tensions in view of the approaching date of the UK’s actual exit from the European Union. Lastly, in recent months there have been events that complicate the EU’s diplomatic relations with Russia and Turkey.
| 28 | MINISTRY OF ECONOMY AND FINANCE
|
II. MACROECONOMIC FRAMEWORK
As regards the prospects for the spread of the epidemic, i.e. the risk of a resurgence of infection in the autumn period and the speed with which a vaccine will be detected and made available on a global scale, experience gained during the first wave in terms of prevention and treatment of the disease should make it possible to avoid further lockdowns and take measures limited to single sites outbreaks.
Since these assumptions, the recent update of OECD forecasts9 predicts a decline in the world economy of 4.5 percent in 2020, with an upward revision of 1.5 pp compared to the less pessimistic scenario (a pandemic wave) of the previous assessment. In 2021, economy is expected to recover by5.0 percent (with a downward revision of 0.2 pp compared to the previous estimate), although in many areas GDP will remain below 2019, showing the ongoing effects of the pandemic.
Ii.2 Italian economy: recent Trends
The health emergency generated by the covid-19 epidemic is affecting the Italian economy, as well as that of every other country in the world, with an unprecedented impact compared to the crises of recent decades. After the spread of infection in China at the beginning of the year, since the second half of February Italy was the first European country hit by the pandemic wave. In March, the rapid worsening of the crisis required the adoption by the Government of measures aimed at limiting the spread of the virus by introducing restrictions on the movement of persons and the closure of non-essential commercial and productive activities.
The next phase of reopening began on 4 May, with the relaunch of manufacturing, construction and wholesale trade, followed by the reactivation of retail, tourist and personal services as from 18 May. The phase of reopening was gradual and differentiated between firms, influenced by the size of the companies and, above all, their ability to adapt working spaces to safety protocols, as well as by demand factors which, especially in the case of tourism services, resulted significantly below pre-crisis levels.
Production and aggregate demand
In the first half of 2020 the Italian economy was affected by a contraction in GDP never observed in the available historical series. GDP declined unprecedentedly in the first quarter (-5.5 percent q/q); -5.6 percent y/y), fully in line with the projections of the Stability Programme. The unfolding of the economic consequences of the closures of activities for the whole month of April exerted an even greater weight on the result for the second quarter, when GDP experienced an ever-returned contraction (-13.0 percent q/q), dropping 17.9
9 OECD, Interim Economic Outlook, ‘Coronavirus: Living with uncertainty’, September 16, 2020,
https://www.oecd-ilibrary.org/docserver/34ffc900-en.pdf?expires=1600260752&id=id&accname=oid029882&checksum=7D793D46E231212F0D8B5A80F0AB205E.
MINISTRY OF ECONOMY AND FINANCE
| 29 |
UPDATE OF THE Economic and Financial Document 2020
percentage points below the level of the previous year. The prolonged extension of the lockdown, longer than expected, coupled with the deterioration of the international macroeconomic framework, led to a GDP drop in the second quarter deeper than estimated in the Stability Programme (-10.5 percent q/q). However, in the absence of any resurgence of the virus in the second half of the year, the result of the second quarter can be considered as the lowest point, from which economic activity would begin a phase of gradual recovery.
The main driver of GDP dynamic in the first half of the year was domestic demand net of stockbuilding. The accumulation of stockbuilding in the first quarter, in fact, was followed by a slightly stronger reduction in the second quarter. Net foreign demand contributed significantly to the fall in GDP due to a drop in exports deeper than that of import.
| Figure II.6: Contributions to GDP growth (p.p. of GDP, LHS; var.% q/q, RHS) |
|
| Source: ISTAT. |
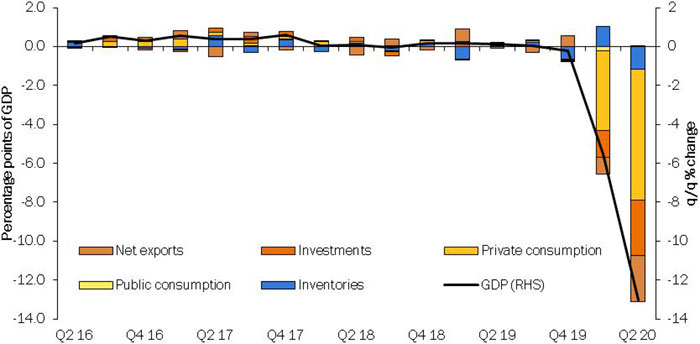
In the details of the components, in the first quarter final consumption experienced a sharp decline, which widened in the following quarter leading to a contraction of -13.4 percent on an annual basis. The reduction in consumption in the first part of the year was strongly influenced by the development of the health emergency: measures to restrict mobility, the prevalence of prudent consumption profiles and uncertainty linked to disposable income arising from developments in employment have been the main drivers of their dynamics. The reduction in consumption has been generalised to both goods and services. With regard to the consumption of goods, durable ones were affected by a greater decline than non-durable and semi-hardened ones. In this context, it should be noted that the scenario of high uncertainty has also led to a recomposition of household consumption expenditure toward basic necessities, such as food and safety devices to cope with the health emergency.
Specularly, in the first quarter of the year there was a remarkable increase in the propensity to save (13.3 percent q/q from 7.9 percent in the fourth quarter of 2019) due to a downturn in real disposable income of consumer households (-1.0 percent q/q) lower than the decrease in consumption.
| 30 | MINISTRY OF ECONOMY AND FINANCE
|
II. MACROECONOMIC FRAMEWORK
 | Recent initiatives of the Italian Government in response to the covid-19 health emergency The main decisions taken by the Government since the outbreak of the covid-19 epidemic and until mid-April are summarised in the Focus on page 4 of the Economic and Financial Document (DEF) – Section I – Stability Programme 2020. This Focus summarises the most important decisions announced since then. April 20th. A new Prime Minister Decree allocated a further budget appropriation, totaling EUR 900 million in the National Emergency Fund, earmarked to the purchase of personal protective equipment, medical equipment and emergency equipment, as well as the enhancement of hospital facilities, both temporary and permanent, for the care of patients suffering from Coronavirus. April 24th. The Council of Ministers approves the Stability Programme 2020 (Sect. I of the Document of Economy and Finance 2020) and the Report to the Parliament to ask the authorisation for increasing the net borrowing in 2020 and in the following years, and to revise the convergence path to the Medium Term Objective, necessary to finance the new policies announced in the Document which are aimed at strengthening the measures in response to the health emergency already adopted by the decree-law ‘Cura Italia’10. April 26th. A Prime Minister Decree introduces measures for the containment of the covid-19 emergency in the so-called “Phase Two”, which are in force since 4 May and for the following two weeks throughout the country. People are allowed to move within the same region for reasons of work, health, need or visit to relatives. For restaurants and food services, in addition to home delivery, it is allowed to take the meal to be consumed at home or at office. In view of the recovery of manufacturing, construction, property brokering and wholesale trade activities, scheduled from 4 May, preparatory operations, such as sanitation of environments and workers’ safety, are permitted. April 29th. A decree law11 introduces, inter alia, the system for tracking contacts and counting to prevent the spread of covid-19 (so-called “App Immuni”). May 9th. The Government approves a decree law12 that introduces urgent measures in relation to the carrying out of a blood serum-prevalence investigation on SARS-COV-2 conducted by the Ministry of Health and Istat which aims to define the proportion of people in the total population that has been infected. In addition, a Decree-Law on emergency measures relating to the prison regime, in respect of home detention or deferral of the execution of the sentence for reasons related to the health emergency by covid-19, is approved. May 13rd. The so-called “Relaunch” Decree is approved. It introduces urgent measures13 in the field of healthcare, supportive measure for jobs and the economy, and social policies related to the epidemiological emergency for which the use of additional net borrowing was requested in the Report of 24 April. In particular, the Decree provides for: strengthening the National Healthcare Service, both from an organisational point of view and in recruitment of staff; the refinancing of social safety nets, the Supplementary Income Scheme (Cassa Integrazione), the Solidarity Fund and other benefits introduced for some categories of workers following the lockdown period; the promotion of the smart working; the recognition of an extraordinary income support, the Emergency Income, to families in difficulty residing in Italy; measures to reduce business tax; the repeal of the VAT and excise increases provided for in the legislation in force for 2021 and 2022; the increase in the Guarantee Fund for SACE and the refinancing of the SME Guarantee Fund; further measures to strengthen companies’ assets. |
10 D.L. No. 18/2020, cv. by Law No. 27 of 24 April 2020.
11 D.L. No. 28/2020, cv. by L. No. 70 of 25 June 2020.
12 D.L. No. 30/2020, cv. by Law No. 72/2020.
13 D.L. No. 34 of 17 May, cv. by L. No. 77 of 17 July 2020.
MINISTRY OF ECONOMY AND FINANCE
| 31 |
UPDATE OF THE Economic and Financial Document 2020
May 15th. A decree law14 launches the so called “Phase two” by introducing the national regulatory framework within which decrees or ordinances, by the central, regional or local levels of government may regulate the movement of people and the operative ways to carry out economic, productive and social activities from 18 May to 31 July 2020. As a result of this decree, movements within each region are no longer subject to restrictions. Some commercial activities can be reopened from 18 May, including retail stores, personal care and restaurants and food services, as well as bathing establishments. June 11st. A Prime Minister Decree authorisies the gradual restart of activity from 15 June. The activities of gambling halls, betting rooms, wellness centers, Spas, cultural centres and social centres are permitted, provided that regions and autonomous provinces have previously ascertained the compatibility of these activities with the development of the epidemiological curve. The shows open to the public (cinema and theatres) can resume, although with some caution (use of masks and space), but activities that take place in dance halls, discos, clubs assimilated, both outdoors and indoors, remain suspended. Events and sports competitions can also resume, indoors or outdoors without the presence of the public, in compliance with the safety protocols issued by the respective sports federations. June 15th. A decree law15 prolongs the Ordinary Supplementary Income (extended and extraordinary) for 4 more weeks and postpones the deadlines for the submission of the applications for transforming undeclared work into regular employment and in the field of Emergency Income. July 14th. Extension to 31 July 2020 of the measures of the Prime Minister Decree of 11 June 2020. July 30th. The Government approves a decree extending, from 31 July to 15 October 2020, the provisions laid down in Decrees Laws No. 19 and 33 of 2020 that allow the adoption of specific measures to contain the epidemic (state of emergency and validity of the measures related to it)16. August 7th. The so-called “August” decree or decree “Relaunch 2”17 allocates new resources of EUR 25 billion in terms of net borrowing of 2020, supplementing the package of measures adopted by the Government in response to the epidemic. The measures provide, inter alia, for the extension of the Supplementary Income Scheme, both the ordinary and the extended one; the possibility until 31 December to extend fixed-term contracts without cause for a maximum period of 12 months; additional tax and contributory allowances for businesses and workers; supportive measures for businesses in the tourism and culture sectors and specific for those operating in the South; relief to small and micro-enterprises; the refinancing of the Guarantee Fund for Small and Medium Enterprises. In addition, with a Prime Minister Decree, the minimum precautionary measures to combat and contain the spread of the covid-19 virus are extended until 7 September 2020. September 3rd. Adoption of measures18 to ensure the regular start of the school year, remodulate and ensure local public transport and introduce support measures for the Pelagian Islands in view of the trend in migratory flows and the consequent health security measures necessary for the prevention of covid-19 infection. September 7th. Extension to 7 October of the precautionary measures to combat and control the spread of covid-19 virus contained in the Prime Minister Decree of 7 August 2020. |
14 D.L. No. 33/2020 cv. by L. No. 74 of 14 July 2020.
15 D.L. No. 52/2020, not converted into Law.
16 D.L. No. 83/2020, in the process of conversion into Law.
17 D.L. No. 104 of 14 August 2020.
18 D.L. No. 111/2020.
| 32 | MINISTRY OF ECONOMY AND FINANCE
|
II. MACROECONOMIC FRAMEWORK
September 10th. A decree19 introduces urgent provisions on cleaning and sanitising the premises used as an electoral seat, financed by the establishment of a fund for the Ministry of the Interior with a budget of 39 billion for 2020. The measure also provides for a derogation from the expenditure limits provided for by the legislation of the higher expenditure beared by municipalities for educational, school and auxiliary staff on fixed-term contracts, recruited to ensure the regular course of educational and school services. | |
| table R.1: Heatmap on sectors limitations to contain the covid-19 epidemic | |||||||||||||||||||||||||||||||||||||
| 27/ 1-02/ 2 | 03/ 2-09/ 2 | 10/ 2-16/ 2 | 17/ 2-23/ 2 | 24/ 2-01/ 3 | 02/ 3-08/ 3 | 09/ 3-15/ 3 | 16/ 3-22/ 3 | 23/ 3-29/ 3 | 30/ 3-05/ 4 | 06/ 4-12/ 4 | 13/ 4-19/ 4 | 20/ 4-26/ 4 | 27/ 4-03/ 5 | 04/ 5-10/ 5 | 11/ 5-17/ 5 | 18/ 5-24/ 5 | 25/ 5-31/ 5 | 01/ 6-07/ 6 | 08/ 6-14/ 6 | 15/ 6-21/ 6 | 22/ 6-28/ 6 | 29/ 6-05/ 7 | 06/ 7-12/ 7 | 13/ 7-19/ 7 | 20/ 7-26/ 7 | 27/ 7-02/ 8 | 03/ 8-09/ 8 | 10/ 8-16/ 8 | 17/ 8-23/ 8 | 24/ 8-30/ 8 | 31/ 8-06/ 9 | 07/ 9-13/ 9 | 14/ 9-20/ 9 | 21/ 9-27/ 9 | 28/ 9-04/ 10 | ||
| Port and airport transport | |||||||||||||||||||||||||||||||||||||
| Private transport (circulation between municipalities)** | |||||||||||||||||||||||||||||||||||||
| Public events | |||||||||||||||||||||||||||||||||||||
| Schools and Universities | |||||||||||||||||||||||||||||||||||||
| Museums and cinemas | |||||||||||||||||||||||||||||||||||||
| Public offices | |||||||||||||||||||||||||||||||||||||
| Sports activities and competitions | |||||||||||||||||||||||||||||||||||||
| Gyms, sports centers, etc. | |||||||||||||||||||||||||||||||||||||
| Shops* | |||||||||||||||||||||||||||||||||||||
Shops of basic necessities | |||||||||||||||||||||||||||||||||||||
| Restaurants and food service | |||||||||||||||||||||||||||||||||||||
| Non-essential productive activities* | |||||||||||||||||||||||||||||||||||||
| * Excluded from 10 April: stationery, bookstores, baby shops, forestry, wood industry. | ||
| ** from 18 May to 2 June: prohibition of mobility only between regions | ||
| No restrictions | ||
| Limited restrictions (quota entry, health checks) | ||
| Extended restrictions (limited entry, excluded public, restricted activities, etc.) | ||
| Total closure | ||
| Restrictions only in certain areas of the territory (so-called red zone) | ||
| Closure only in some areas of the territory (so-called red zone) | ||
| Source: MEF analysis on the press releases of the Presidency of the Council of Ministers. | ||
19 D.L. No. 117/2020.
MINISTRY OF ECONOMY AND FINANCE
| 33 |
UPDATE OF THE Economic and Financial Document 2020
This trend was confirmed in the second quarter, when the propensity to save experienced a further increase (18.6 percent q/q) in conjunction with a sharp reduction in real disposable income (-5.6 percent q/q). In this context, the income situation of Italian households has deteriorated especially among self-employed and permanent workers. Nevertheless, the balance sheet of households remains solid: household debt in the first quarter of 2020 stood at 61.9 percent of disposable income (unchanged compared to the fourth quarter of 2019), a level well below the average of the euro area (95.0 percent)20. Debt sustainability was also fostered by the ultra-expansive approach adopted by the ECB, which favoured the continuation of low interest rates.
The increased level of uncertainty about future prospects, coupled with the protracted phase of declining demand, made investment conditions unfavourable21, affecting the already weak dynamics of accumulation. Also for gross fixed capital formation, the fall in the second quarter was deeper than in the first quarter, resulting in a decrease of more than 22.0 percent compared to the level of one year before. The decline has affected all types of investment goods, being particularly marked for those in means of transport, which have lost more than 37.0 percent compared to last year, and for those in construction, whose reduction in the second quarter was about 27.0 percent on an annual basis.
This type of investment was affected not only by the production block but also by the development of the real estate market. Already in the first quarter, together with the increase in housing prices (1.7 percent y/y) – driven by those of newly built dwellings – there has been a noticeable decline in the volumes of sales, probably attributable to the restrictive measures of the movements, which have prevented the conclusion of the notarial deeds22. This trend continued in the second quarter, when, in the face of a further reduction in sales, there was an acceleration in house prices (3.4 percent y/y), the largest since the historical index series was available.
The decline in exports was larger than that of imports, in particular in April, as a result of bottlenecks in value chains and the weakening of global demand, factors that have affected trade dynamics even more deeply in the second quarter of the year, when the economic emergency spread to all major world economies. The peculiar nature of the pandemic crisis and the measures taken to face it have had a heterogeneous effect on the exports of the various sectors23: they were more pronounced for sectors that produce consumer goods, especially fashion, and investment goods, and less evident for agriculture and food.
However, after the sharp drops between March and April, in the following three months external trade figures show that there has been a cyclical recovery in trade flows, which has been more pronounced in the case of exports. The latter
20 “Bollettino Economico 3/2020”, Bank of Italy, 10 July 2020.
https://www.bancaditalia.it/pubblicazioni/bollettino-economico/2020-3/boleco-3-2020.pdf.
21 “Inflation and growth expectations survey – II quarter 2020”, Bank of Italy, 13 July 2020.
https://www.bancaditalia.it/pubblicazioni/indagine-inflazione/2020-indagine-inflazione/06/index.html.
22 “Housing prices – first quarter 2020”, ISTAT, July 3, 2020.
https://www.istat.it/it/files//2020/07/CS-abitazioni-prov-Q12020.pdf.
23 “Open (again) – An export start”, Export Report, Sace (CDP Group), September 10, 2020.
https://www.sacesimest.it/studi/dettaglio/open-again-rapporto-export-2020.
| 34 | MINISTRY OF ECONOMY AND FINANCE
|
II. MACROECONOMIC FRAMEWORK
in particular have recorded significant increases since May, still growing by 5.7 percent m/m in July.
The social distancing measures and the difficulty for many sectors to continue their activities using remote work has determined asymmetrical effects on the different economic sectors.
In fact, in the first two quarters of the year, manufacturing industry has shown a wide drop in value added (respectively: -8.5 percent q/q and –20.0 percent q/q) closely linked to the blocking of production activities.
In line with the trend in the value added of the sector, industrial production pointed out a significant decrease in the seasonally adjusted index in the first quarter (-8.8 percent q/q) followed by a further, deeper contraction in the second (-16.9 percent q/q). However, following the removal of containment measures, in May the seasonally adjusted industrial production index showed a strong rebound (41.5 percent m/m), higher than expected and followed by significant increases even in June (8.2 percent m/m) and July (7.4 percent m/m), allowing a marked reduction in the index decline on an annual basis (-8.0 percent) after the historical lows reached in April.
Among the production segments, the car industry has been hardly hit by the health emergency: in the first six months of the year, there was a marked decrease in the corresponding index of industrial production adjusted for the calendar effects (-39.6 percent y/y)24. After the slight cyclical downturns in January and February, in March and April there was an unprecedented drop in registrations that reached -97.5 percent y/y. However, the annual losses were quickly recovered thanks to the cyclical increases in the following months, which brought the level of registrations in August back in line with that of the previous year (-0.43 percent).
The construction sector fell significantly (-6.2 percent q/q in the first quarter); -23.0 percent q/q in the second). Decline in the value added of agriculture has been less pronounced.
The impact of the health emergency has been particularly severe on the services sector. Although this sector has reported relatively lower losses compared to manufacturing, it has experienced an unprecedented drop in value added (in the first quarter -4.7 percent q/q; in the second -11.3 percent q/q), widespread across the board.
Sectoral dynamics have been differentiated: the negative consequences of the pandemic crisis have mainly affected tourism, leisure and catering activities. Trade, transport and housing sectors experienced the greatest decrease in value-added (-9.7 percent q/q in the first quarter, followed by a decrease of -21.3 percent q/q in the second quarter) markedly conditioned by the limitations on travel and the social distancing measures necessary to contain the contagion. At the same time, other service activities decreased significantly (in the first quarter -8.2 percent q/q; in the second -7.1 percent), while the professional and support activities, after the small reduction in the first quarter (-1.7 percent q/q),
24 “Focus Italia Industrial Production – Automotive Sector”, ANFIA, June 2020.
https://www.anfia.it/data/portale-anfia/comunicazione_eventi/comunicati_stampa/2020/062020_ITALIA-Focus_produzione_industriale_settore_automotive.pdf
MINISTRY OF ECONOMY AND FINANCE
| 35 |
UPDATE OF THE Economic and Financial Document 2020
suffered a severe drop in the following quarter (-20.5 percent q/q). Real estate sector, information and communication services, insurance and public administration, defence, education, health and social services sectors have experienced minor short-term contractions.
Employment and unemployment rate
The large contraction of economic activity and measures to contain the virus impacted significantly on labour market. In this context, Government interventions, aimed at preserving employment levels and extending income support for different categories of workers, mitigated job losses that would otherwise have occurred.
According to the labour force survey, in the first quarter there was a reduction in the number of employees on a quarterly basis (-0.4 percent q/q, -101 thousand units), moderate if compared to the drop in GDP, and a slight growth on an annual basis (0.2 percent y/y). The consequences of the health emergency on the labour market have been more evident in the second quarter, when the decline in employment widened (-2.0 percent q/q, -470 thousand units; -3.6 percent y/y, -841 thousand units) as a result of a marked drop in fixed-term employment and a decrease in the number of self-employed. In both quarters, employment dynamic has been primarily affected by a significant reduction fixed-term positions25: after the moderate decrease in the first quarter (-2.0 percent y/y, -56 thousand units), in the second quarter there was a markedly stronger decrease (-21.6 percent y/y, -677 thousand units). The current crisis, engraving more acutely on sectors relying mostly on fixed-term jobs, has generated asymmetric consequences for workers, exposing fixed-term ones to higher vulnerability26.
The labour input measured by hours worked in the national accounts has fallen sharply in the first quarter (-7.5 percent q/q) and recordered an even deeper fall in the second (-15.2 percent q/q). In this context, since the reduction in hours worked has been greater than that of employment, during the first half of year there has also been a significant reduction in the number of hours worked per person employed .
Consistent with the phase of gradual reopening of activities, since May there has been an increase in average hours worked per employee on a monthly basis.
At the same time, social distancing measures have made job search activities complicated, contributing to the expansion of inactivity (in the first quarter 1.8 percent q/q; in the second 5.5 percent q/q, associated with a temporary reduction in the number of unemployed people (in the first quarter -7.1 percent q/q; in the second –12.4 percent q/q).This phenomenon can be attributed to the increase in transitions from the condition of “unemployed” to that of “who “does
25 “The impact of the health emergency on employment”, in “The labour market in the second quarter, an integrated reading”, ISTAT, 11 September 2020. https://www.istat.it/it/files//2020/09/Mercato-del-lavoro-II-trim_2020.pdf.
26 “Distributional risks associated with non-standard work: Stylised facts and policy considerations”, OECD (2020), 12 June 2020. https://read.oecd-ilibrary.org/view/?ref=134_134518-2bfush541w&title=Distributional-risks-associated-with-nonstandard-work-Stylised-facts-and-policy-considerations
| 36 | MINISTRY OF ECONOMY AND FINANCE
|
II. MACROECONOMIC FRAMEWORK
not seek and is not available to work” as well as transitions from the status of employed to inactive.
During the lockdown period the increase in inactivity, therefore, would have hidden traces of unemployment present but not expressed, given the impossibility of carrying out active job searches in an emergency context: in the first two quarters of the year, given the spread of the emergency and the travel restrictions, the number of individuals that justified inactivity with “other reasons” increased significantly, in 80 percent of cases related to the health emergency.
| Figure II.7: Unemployment rate and participation rate |
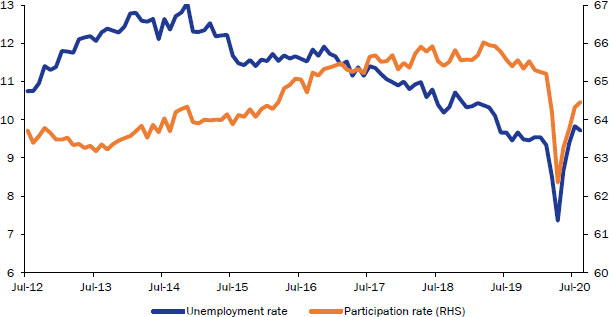 |
| Source: ISTAT. |
However, looking at the monthly dynamics of labour supply, since May there has been a rise of the unemployed people, which led to an increase in the unemployment rate (8.7 percent from 7.4 percent in April) and the fall in the inactivity rate (36.7 percent from 37.6 percent in April). This trend has been consolidating in the following months, bringing the unemployment rate to 9.7 percent in August (with a marginal decline compared to July) against a 35.5 percent rate of inactivity.
Wages per employee, after a virtually stable growth in the first quarter, increased significantly in the second quarter (2.5 percent q/q) likely due to the effects of the composition of the employment structure linked to the large use of the Supplementary Income Scheme (Cassa Integrazione Guadagni) by firms. This phenomenon, together with the fall in productivity, led to an increase in unit labour costs over the same period.
The blocking of production activities and the sharp contraction in demand caused by the evolution of the health emergency have brought downward pressure on price developments. During the most acute phase of the emergency, inflation dynamics were affected by opposing forces: the marked reduction in the prices of energy goods and certain services was accompanied by the acceleration of food prices, as a result of the recomposition of households’ consumer baskets to basic
MINISTRY OF ECONOMY AND FINANCE
| 37 |
UPDATE OF THE Economic and Financial Document 2020
necessities27. Since then, the pace of growth of food prices has lost momentum, while the drop in energy prices continued to have a deflationary effect. Net of the most volatile components, after the acceleration recorded between April and May on an annual basis, core inflation slowed down gradually too, turning negative in the provisional estimate of September.
The trend in the cost of energy goods has significantly influenced the import deflator, which has sharply fallen in the first two quarters of the year. This resulted in a moderate rise of the deflator of GDP, between the first and second quarter of the year (by 0.4 percent and 0.8 percent q/q, respectively), despite the presence of extremely low consumer inflation.
Foreign trade
In the first two months of the year, value exports maintained positive growth rates, increasing by an average of 4.6 percent on an annual basis. Since March – when the spread of covid-19 has taken on a global dimension – exports have begun to contract and, in the second quarter, have decreased by 27.8 percent.
In the first seven months of the year, exports in terms of value and volume decreased almost similarly (by 14.0 percent and 14.8 percent respectively), with a higher intensity towards the non-European area. However, Italy’s trade balance (approximately 32.7 billion, from 29.7 billion in the same period of 2019) remains among the highest in the European Union after Germany, Ireland and the Netherlands.
In terms of geographical composition, exports in value decreased by about 15.2 percent to non-EU markets, with a decrease of just under 10 percent to the United States, Italy’s third trading partner. Sales to Switzerland and the United Kingdom also reduced by 10.3 percent and 18.2 percent respectively. In the Asian area, exports fell by 13.6 percent to China and 6.2 percent to Japan, following the robust increase in 2019 (19.7 percent) as a result of the entry into force of the EU-Japan Free Trade Agreement. Compared to the energy-producing countries, exports have declined to a greater extent to OPEC countries (15.1 percent), followed by Russia (-11.4 percent). Trade with Turkey and the Mercosur countries were also severely weakened (-12.1 and -22.3 percent respectively).
In the European continent, exports to the EU fell by 12.9 percent, with lower sales to Germany and France (-9.9 and -15.2 percent), the country’s first two trading partners, plus a 21 percent decrease to Spain.
Considering sectoral performance, only two sectors recorded an increase in exports in value, food, beverages and tobacco (3.5 percent) and pharmaceuticals (by 10.9 percent). On the continent of Europe, sales of food, beverages and
27 The particular emergency situation made it difficult to accurately measure changes in the harmonised index of consumer prices: since the latter is determined by the weights that the different goods have within the reference basket in such a way as to measure only changes in prices and not even in consumer habits, unforeseen recompositions in the consumption profiles may not have been properly grasped by the existing weighting system, leading to the main risk of having at disposal a measure of inflation other than that based on actual household expenditure. See “Measurement of inflation in periods of economic tension”, in Economic Bulletin 3/2020, European Central Bank, 14 May 2020. https://www.bancaditalia.it/pubblicazioni/bollettino-eco-bce/2020/bol-eco-3-2020/bolleco-BCE-3-2020.pdf.
| 38 | MINISTRY OF ECONOMY AND FINANCE
|
II. MACROECONOMIC FRAMEWORK
tobacco have grown between 3 percent and 6 percent to France and Germany. In foreign markets, the sector has broadly positive sales growth rates to the United States, Japan and China (up 5.1 percent, 15.3 percent and 9.1 percent respectively).
For the pharmaceutical sector, France was the largest recipient of sales (an increase of around 31 percent), followed by Germany (8.5 percent) and Spain (13.6 percent). In overseas markets, robust increases were recorded also in the United States and Japan (10.1 and 11.3 percent). On the contrary, Switzerland (-3.6 percent) and the United Kingdom (-11.0 percent) were among the countries to which exports contracted.
As regards the other sectors, in relation to the weight of total exports, sales of machinery and textiles and clothing have been more affected by the impact of the pandemic, falling by 18.2 percent and 24.3 percent respectively. Following this, those of base metals and metal products decreased by 13.2 percent, together with a 22.3 percent decrease in means of transport. In this sector, there were less sales of cars (down 26.2 percent) in all major European and non-EU trading partners.
The most recent information on trade with non-European markets shows a decline of 11.7 percent y/y in August, driven by the decreases towards the main oil producers countries; at the same time, sales to China have grown. However, the September business surveys show more positive assessments of foreign orders and export prospects than in previous months. While there are still strong concerns about the short-term evolution of the pandemic, export performance in the second half of the year is expected to be more favourable than in the first half of the year, thanks to the strengthening of the recovery of the economy and trade on a global scale28.
Credit trend
The trend of loans to the private sector in the first half of 2020 was strongly influenced by the effects of the pandemic: the sharp increase in credit to the private sector (2.8 percent y/y in July) was driven mainly by the increase in loans to non-financial corporations, against the lower growth of loans to households.
As far as the latter are concerned, in fact, since March there has been a slowdown in loans, which in July increased by 1.72 percent y/y, at a rate of growth of about one percentage point lower than in early 2020. This trend has been influenced mainly by the sharp collapse of sale in the real estate market29 (in the second quarter of 2020 the decrease in sale for residential housing was -27.2 percent compared to the corresponding quarter of 2019), and by the contraction of consumer credit.
On the other hand, there was an opposite dynamic for loans to non-financial corporations: as of March, credit to companies has again expanded, after an entire
28 World trade, following the contraction of 12.3 per cent in April, has seen the rate of contraction in trade shrinking again in June, with a 7.9 percent m/m increase and around 5 percent in July. (Source: CPB, ‘World Trade Monitor’, 25 September 2020).
29 Data extracted from the 2T Report of 2020 of the Observatory of the Real Estate Market.
MINISTRY OF ECONOMY AND FINANCE
| 39 |
UPDATE OF THE Economic and Financial Document 2020
year of contraction in 2019 (by -7 percent on an annual basis), reaching a growth rate of 4.4 percent in July according to the latest Bank of Italy’s release. The increased demand of bank loans was driven by the growing liquidity needs of companies which, as a result of the blockade of production activities and the collapse in demand, have suffered a marked reduction in profits.
On the supply side, this increase was made possible by the increased ability of credit institutions to meet the demand for funds, thanks both to the unprecedented interventions of the ECB’s monetary policy, and to the measures put in place by the Government mainly with the decrees “Cura Italia” and “Liquidity”, subsequently enhanced by the provisions of the Decree “Relaunch” and the Decree “August”. The intervention of the ECB also favoured a very low interest rates, which, with regard to corporate loans, stood at 1.19 percent in July.
| Figure II.8: Loans to the private sector (var.% y/y) |
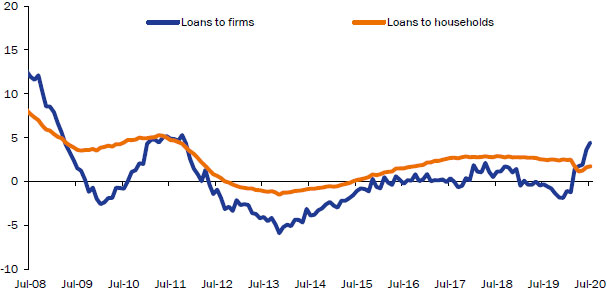 |
| Source: Bank of Italy. |
As regards the overall conditions of access to credit, according to the most recent Bank Lending Survey (BLS) of the Bank of Italy, in the second quarter of 2020 credit institutions reported that both credit standards and the general conditions applied to loans to companies had been relaxed reflecting their greater risk tolerance. On the other hand, during the same period there was a slight deterioration in business opinions, which may have been influenced by delays in the early stages of the granting of government-guaranteed loans. The worsening conditions for access to credit have been more marked for companies operating in the services and manufacturing sectors as well as for larger ones, while the judgement of small-enterprises has remained stable.
Looking ahead, Italian intermediaries will be able to face the repercussions of the economic crisis caused by the pandemic starting from a much stronger position than in the period following the global financial crisis of 2008. In relation to credit quality, the latest findings show that the dismissal of NPLs continued in July, with a fall of 15.2 percent on an annual basis, which also led to a reduction in the share of deteriorated exposures in total corporate loans (7.3 percent on average
| 40 | MINISTRY OF ECONOMY AND FINANCE
|
II. MACROECONOMIC FRAMEWORK
of the results for the first seven months of the year compared with 9.3 percent in the same period of 2019).
II.3 Italian economy: prospects
Trend scenario under unchanged legislation
In the first quarter of the year, GDP growth was in line with the estimate envisaged in the Stability Programme. In the second quarter growth figure was slightly different(-13.0 percent q/q from -10.5 percent q/q estimated in the SP), given that the duration of lockdown measures, needed to limit the spread of the virus around the country, was longer than expected in spring.
The short-term indicators for the last few months point to a strong recovery in the third quarter thanks to the gradual removal of lockdown measures. The rebound in economic activity which will also benefit from the statistical carry-over of the reopening in May and June, could be higher, in terms of percentage change, than the fall recorded in the second quarter of the year.
After the phase in which economic dynamics have been driven mainly by factors that have influenced production and thus the supply side, the greatest unknown for economic developments in the coming months and for the resilience of the recovery process is related to domestic and foreign demand. The crisis has had a negative impact on consumer and investment decisions of households and businesses, both because of the reduction in disposable income and liquidity, and because of the significant increase in levels of uncertainty.
The measures adopted by the Government, only partly considered in the official spring forecast, as at that time not yet approved, have intervened to an important extent to mitigate those negative effects and are now fully considered in the trend macroeconomic scenario. In particular, this scenario takes into account not only the decrees “Cura Italia” and “Liquidity” adopted in March and April and already considered in the SP 2020, but also the impact of the Decree “Relaunch” (DL No. 34 of 19 May 2020) and the Decree No. 104 of 14 August 2020.
The forecast for the current year is also based on the hypothesis of a relatively low GDP growth in the final part of the year when the increased attendance of indoor environments, the reopening of schools and of work in presence will require a particularly careful monitoring by the health authorities and a prudent behaviour of the citizens.
Overall, GDP is now expected to fall by -9.0 percent in 2020, from -8.0 percent in the SP.
The forecast is revised upwards for 2021, when GDP is expected to grow by 5.1 percent, compared to 4.7 percent of the SP. Despite the deterioration in the international context, a relevant role is played by the progress made in the scientific field for the management of the epidemic as well as the positive effects of the measures in the meantime adopted by the Government. Globally, as has already been mentioned, estimates of international trade growth are deteriorating: the different timing with which the epidemic is hitting different
MINISTRY OF ECONOMY AND FINANCE
| 41 |
UPDATE OF THE Economic and Financial Document 2020
countries – both in the form of first and second wave of infections – weakens the world economic environment and moves away the phase of full resumption of trade. In addition, exports from the euro area countries are affected by an appreciation of the euro, especially against the dollar, which has been recorded since the summer months and has been stronger in recent weeks. On the other hand, the progress made by scientific research in the treatment of infection and in the management of outbreaks reduces obstacles to the regular pursuit of economic activity. Moreover, the fiscal policy measures adopted by the Government in the meantime have an expansionary impact on the growth pattern in the coming year. Positive effects, in particular on private consumption, will come from the abolition of VAT increases in 2021 and 2022 provided for by the decree “Relaunch”.
Over the last two years of the forecast horizon, GDP is estimated to remain on a moderate growth path of 3.0 percent and 1.8 percent in 2022 and 2023 respectively. As a result of this path, GDP is expected to recover pre-crisis levels in the second quarter of the last forecast year.
| Figure II.9: real GDP forecast under unchanged legislation scenario (euro million) |
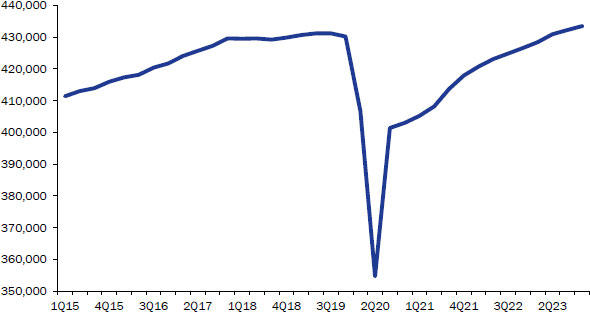 |
| Source: Istat and MEF elaboration. |
Overall, the risks to the forecast remain tilted to the downside, but slightly less unbalanced than when the SP was approved. In particular, on the epidemiological point of view, although coexistence with the virus will continue for a significant number of months, the likelihood of a new wave of infections requiring new drastic and generalised lockdown measures is now less likely. Since the beginning of the epidemic, in fact, important steps have been made both with the strengthening of the tracing, testing and tracking of new cases and the identification of effective treatments against the disease. Both of these improvements reduce the risk of the healthcare system going back into distress, a condition that required the adoption of the March and April lockdown measures. Nevertheless, as in the SP, this Note contains a risk scenario based on the
| 42 | MINISTRY OF ECONOMY AND FINANCE
|
II. MACROECONOMIC FRAMEWORK
assumption that the epidemic could be worse than assumed in the baseline scenario.
On the macroeconomic point of view, the renewed cohesion at European level, which made possible the adoption of the Next Generation EU, coupled with the accommodating monetary policy of the ECB, creates a strong and unprecedented intervention network with great impact on the stabilisation of financial markets.
| Figure II.10: Coronavirus patients in Italian hospitals (number of presences) |
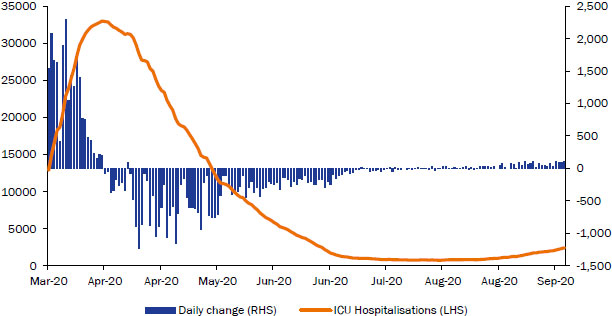 |
| Source: Refinitiv. |
In the details of the forecast, the expected fall in GDP for the current year is mainly determined by the negative contribution of domestic demand net of inventories/stockbuilding, which is estimated to subtract 7.4 percentage points from economic growth. The decline in household consumption is expected substantially in line with that of GDP (-8.9 percent): despite the removal of restrictive measures since May, the increase in the level of uncertainty and the reduction of disposable income will hinder the full recovery of deferred consumption and will overall result in a marked reduction in purchases by households compared to last year. After the historical lows achieved by the consumer confidence indexing the spring months, data show a gradual recovery of all components, but still not sufficient to restore the levels recorded before the crisis (in September the consumer confidence index stood at 103.4, still below the 111.1 points reached in January).
As expected in the spring estimates and confirmed by the results of the first half of the year, the reduction in disposable income is expected to be lower than that of private consumption, which confirms the forecast of a strong increase in the propensity to save, which is estimated to be just over 13 percent. In the following year, the recovery in consumption, which, compared to the SP scenario, benefits from the repealing of the VAT hikes, is equal to 4.9 percent, before recording a moderate but weaker increase in the following two years. Disposable income would return to positive territory as early as 2021, driven by the recovery of compensation of employees and the improvement of the labour market. The
MINISTRY OF ECONOMY AND FINANCE
| 43 |
UPDATE OF THE Economic and Financial Document 2020
saving rate would therefore gradually reach the level of 2019 at the end of the period.
The expected fall in investment in 2020 (-13.0 percent) was particularly marked percent for the reasons already explained in detail. The decline should affect all types of investment goods and be relatively more marked for means of transport. The trend scenario assumes that the impact of the crisis on the propensity to invest of companies will continue over time, making the recovery of next year (7.4 percent) only partial and then followed by a moderate expansion in the following two years.
Net exports are expected to contribute negatively to GDP growth for -1.5 percentage points in 2020. This figure is linked not only to the fall in exports of goods, but also to the decline in exports’ service (i.e. tourist inflows). Both flows are expected to recover from 2021 and for the rest of the forecast horizon, ensuring a positive contribution to growth in 2021 and 2022 and zero in 2023. The current balance of payments surplus is falling from 3.0 percent of GDP in 2019 to 2.4 percent of GDP this year, then gradually catching up to 2.7 percent in 2021 and 2.8 percent in the last two years of forecast.
On the supply side, manufacturing industry registers the sharpest decline in the current year (around -14 percent), followed by the construction sector. Both sectors showed a good reactivity in the aftermath of the removal of the lockdown to productive activities. Both sectors showed robust recoveries of their macroeconomic indicators in the summer months, pointing to a strong rebound in the third quarter. However, the rebound will not be enough to compensate for the heavy drops recorded in the first half of the year.
The reduction in the value added of services will be less marked this year, although the sector has been heavily affected by social distance measures and partly continues to be more affected by the limitations of the security protocols. Nevertheless, the lower annual fall in the value added of services reflects to a large extent the result of the first half of the year. For the second half of the year, cyclical indicators show an expansionary dynamic and confidence surveys are moderately positive, especially those conducted by Istat rather than the PMI indexes.
All production sectors are expected to recover partially since 2021, with a return to the levels of the fourth quarter of 2019 in the last year of the forecast.
As for prices, the forecast remains broadly confirmed for the GDP deflator in 2020 compared to the estimate produced in the SP, resulting only one tenth of a point higher (at 1.1 percent) due to the disappearance of the deflationary assumption for consumer prices which, in the new scenario, are unchanged compared to the previous year. The forecast of an appreciable decrease in the deflator of imports affected by the low cost of energy goods remains confirmed. Looking ahead, in 2021 the gradual recovery of oil prices together with a rebound in demand will exert upward pressure on import and consumer prices. The worsening of the terms of trade with external countries would lead to a deceleration of the GDP deflator (to 0.7 percent). As has already been pointed out, unlike the spring forecast, the outlook of this Note takes into account the repeal of VAT hikes and therefore no longer discounts the price increase previously associated with the higher tax burden from that year. The growth of the deflator of GDP and consumption in the period 2022 to 2023 is around 1 percent.
| 44 | MINISTRY OF ECONOMY AND FINANCE
|
II. MACROECONOMIC FRAMEWORK
With regard to the labour market, in the face of a relatively small fall in employment due to the scale of the crisis, a reduction in terms of full time equivalent units (FTE) is expected to be slightly higher than that of GDP, coupled with a marked decline in hours worked. This dynamic is deeply affected by the measures to protect employment adopted by the Government, mainly the unprecedented extension of the possibility of recourse to the Wage Supplementary Fund and the prohibition of dismissal, which in the trend scenario is assumed in force according to the provisions introduced by DL 104/2020. Thanks to such measures, the maintenance of permanent employment counterbalances, albeit partially, the reduction in fixed-term and independent employees already emerged in the first half of the current year and which is estimated to lead to an average reduction in overall employment (labour force survey) of 1.9 percent on an annual basis. Against the background of a participation rate which, after the heavy fall recorded in the months of lockdown, is estimated to recover slightly in the second half of 2020, the unemployment rate is forecast to be 9.5 percent.
In the course of next year, employment expressed in terms of FTE is expected to increase by 5.0 percent. The recovery of hours worked per person employed, after suffering a fall of 10.6 percent in 2020 as a result of the massive use of the Wage Supplementary Fund, is expected to bounce by just 4.8 percent. This projection is based on the assumption that at the early stage of the recovery, during which activity levels will recover only in part as a result of the crisis and the limitations of the security measures for the containment of infection will persist for a few months, a higher incidence of part-time forms of employment will prevail. Moreover, the disappearance of the measures to strengthen social shock absorbers from the beginning of 2021 assumed in the current legislative scenario, leads to a slight decrease in the total number of employees on an annual basis (-0.2 percent). At the same time, even as a result of a recovery in labour market participation, the unemployment rate increases to 10.7 percent, and then returns to levels close to those of 2019 at the end of the forecast period. In terms of productivity, this dynamic results in positive changes in each year of the estimation horizon.
The trend macroeconomic forecast was validated by the Parliamentary Budget Office in its note of 21 September 2020, at the end of the interlocutions process provided for in the Memorandum of Understanding PBO-MEF of 15 September 2014.
MINISTRY OF ECONOMY AND FINANCE
| 45 |
UPDATE OF THE Economic and Financial Document 2020
| The revision of the forecasts for 2020 and 202130
In line with previous documents, this focus presents an analysis of the main factors underlying the revision of the macroeconomic forecasts for 2020-2021 compared to the SP 2020.
First, the update considers new information on the evolution of the Italian economy in the current year compared to the April document, with reference to both quarterly national accounting data, now available for the first two quarters of the year, and the new perspectives of the international context. The values showed in the table are seasonally and working days adjusted.
The main factors underlying the revision of the macroeconomic forecast for 2020-2021 are set out in Table R.1.
The first two columns show the growth estimates of GDP and its components in the SP and this Update, while the third column reports the differential between the two (Delta 2020). Overall, there is a downward revision of the forecasts for GDP growth of one percentage point compared to the SP. The main determinants of the revision are: forecast errors affecting the first two quarters of 2020 (delta a); the impact of the change in exogenous variables (delta b); the revision of estimates for the second half of the year (delta c). The downward revision is therefore linked to the greater contraction of economic activity in the first part of the year. The duration of the lockdown measures was in fact longer than expected in the spring estimates hypothesis. In the second half of the year the GDP growth estimate is more positive than in the SP also due to the measures implemented by the Government in the following months.
The revision of the 2020 GDP growth forecast is only marginally influenced by the different prospects of the international framework. The growth rate of the GDP deflator and private consumption deflator has been revised upwards in the light of Istat data releases for the first half of the year.
The subsequent columns show the difference between the current forecast and the April one as for 2021. In this case the delta (column delta 2021) of the GDP growth forecast is 0.3 percentage points.
The upward revision of the estimate of GDP growth considers both the effects of recent Government interventions (including the repealing of the VAT hikes) and progress in facing the epidemic. The new scenario is based on the hypothesis of a controlled management of the covid-19 outbreaks but does not assume a lockdown at national level. In addition, the forecast for the second half of 2021 looks at progress in the development and production of covid-19 vaccines and assumes that a large-scale distribution can be started as early as spring 2021, leading to a gradual return to normal habits and therefore to an increase in economic activity since around mid-year.
On the other hand, the new assumptions concerning the international context have a negative impact on next year’s GDP growth (Table R2). The slowdown in world trade is more marked and is caused by a more significant and prolonged pandemic impact than expected in April31. Estimates of the development of foreign demand (weighted by the geographical composition of Italian exports) for 2020 were revised slightly downward, from -9.5 percent to -9.9 percent, while an increase of 8.9 percent in 2021 (from 11 percent in April) is estimated. Consequently, the impact of world demand on Italian exports, and on GDP, is negative in both 2020 and 2021. |
30 This box refers to quarterly economic national accounts (adjusted for working days) issued by ISTAT on 31 August. Quarterly series consistent with annual national accounts data released on 22 September were published on 2October.
31 It is recalled that source of the projections for the evolution at global level of GDP and international trade is Oxford Economics.
| 46 | MINISTRY OF ECONOMY AND FINANCE
|
II. MACROECONOMIC FRAMEWORK
| TABLE R1: Main macroeconomic framework variables (seasonally and working day adjusted data) | |||||||||||
| Forecast 2020 | of which: revision of carry-over effect in 2020 | of which: acquired growth in the first half of 2020 | of which: Exogenous impact compared to SP | of which: revision of the outlook for the second half of the year | Forecast 2021 | ||||||
Update 2020 | SP 2020 | Delta 2020 | Delta (a) | Delta (b) | Delta (c) | Delta (d) | Update 2020 | SP 2020 | Delta 2021 | ||
| MACRO ITALY | |||||||||||
| GDP | -9.1 | -8.1 | -1.0 | 0.0 | -1.6 | -0.1 | 0.7 | 5.1 | 4.7 | 0.3 | |
| Private Consumption | -8.9 | -7.2 | -1.8 | 0.0 | -2.6 | 0.0 | 0.8 | 4.9 | 4.0 | 0.8 | |
| General government expenditure | 2.0 | 0.7 | 1.3 | 0.0 | -2.2 | 0.0 | 3.5 | 0.2 | 0.3 | -0.1 | |
| Gross fixed investment | -13.1 | -12.3 | -0.8 | -0.1 | -3.3 | 0.0 | 2.5 | 7.5 | 4.3 | 3.3 | |
| Machinery, equipment and miscellaneous | -10.4 | -14.6 | 4.2 | 0.0 | 3.4 | 0.0 | 0.7 | 5.5 | 4.1 | 1.4 | |
| Construction | -13.6 | -9.0 | -4.7 | 0.4 | -8.6 | 0.0 | 3.5 | 8.0 | 4.7 | 3.3 | |
| Exports of goods and services | -17.6 | -14.5 | -3.1 | -0.6 | -4.8 | -0.5 | 2.8 | 9.5 | 13.5 | -4.0 | |
| Imports of goods and services | -13.6 | -12.9 | -0.8 | -0.5 | -2.4 | 0.5 | 1.7 | 8.3 | 10.0 | -1.7 | |
| Deflators | |||||||||||
| GDP deflator | 1.1 | 1.0 | 0.2 | 0.0 | 0.1 | 0.0 | 0.1 | 0.7 | 1.4 | -0.7 | |
| Private Consumption deflator | 0.0 | -0.2 | 0.2 | 0.0 | 0.4 | 0.2 | -0.4 | 0.6 | 1.7 | -1.1 | |
| The nominal effective exchange rate also has a negative impact on the forecast of export growth due to the appreciation of the euro. A technical assumption has been adopted for the projection of currency figures which implies that the exchange rate remains unchanged over time and is equal to the average for the last 10 working days ending on 31 August. The actual nominal exchange rate update compared to September shows an appreciation of the euro against the other currencies of 1.9 percent in 2020 and 1.4 percent in 2021. The macroeconomic impact on GDP growth was negative by 0.1 percentage point in 2020 and 0.3 percentage points in 2021. The oil price, which rises in comparison with the SP, has a negative impact on consumer prices and domestic demand. From the lows in the second half of April, the price of oil gradually increased during the summer months. The current projection based on futures contracts predicts slightly higher oil price levels even in 202132.
In contrast to the SP, there is a significant reduction in government bond yields, in particular in 2021, accompanied by a downsizing of the spread towards the Bund, which has a positive impact on domestic demand through the credit and wealth channel.
|
| TABLE R2: Effects on GDP forecasts of the exogenous variables compared to the SP 2020 scenario (impact on growth rates) | ||||
| 2020 | 2021 | |||
| 1. World Trade | 0.0 | -0.6 | ||
| 2. Nominal effective exchange rate | -0.1 | -0.3 | ||
| 3. Oil price | -0.1 | -0.4 | ||
| 4. Interest rate assumptions | 0.0 | 0.2 | ||
| Total | -0.1 | -1.2 | ||
Note for Total: any inaccuracies result from rounding Source: MEF elaboration | ||||
32 Reference is made to the average future quotations in the last ten working days ending on 31 August 2020.
MINISTRY OF ECONOMY AND FINANCE
| 47 |
UPDATE OF THE Economic and Financial Document 2020
| A risk (or sensitivity) analysis of exogenous variables
Although the degree of uncertainty about the extent of the output contraction and the profile of the subsequent recovery is now mitigated compared to the most acute stage of the health emergency, risk factors remain with regard to the evolution of the epidemic and that of the economic and financial aggregates of the international scenario. It is appropriate to take account of these risk elements inherent in the forecasts of the baseline framework, by making an assessment of their impact on the economy in the event that they materialise. Therefore, with regard to both a less favourable trend in the containment of the virus in Italy and the dynamics of the exogenous variables of the international reference framework (world trade, exchange rates, oil prices and financial market conditions), alternative assumptions are considered here compared to those adopted in the baseline scenario. Using the ITEM econometric model, five different scenarios have been simulated, each of which refers specifically to one of these factors.
The first scenario incorporates risk elements related to the evolution of the health emergency. In particular, there is a resurgence of covid-19 infections in Italy, which would affect the months of October, November and December of the current year and January 2021. While it does not result in a second complete lockdown of non-essential activities, a marked increase in infections and hospital admissions would necessitate the restriction of certain forms of mobility and the limitation of a number of activities. In addition, the scenario would include a slower return to normal than in the trend scenario during 2021, also due to possible delays in the availability of a vaccine on a global scale.
The second risk scenario refers to the development of world trade and was designed by assuming, in 2020, a fall in world demand (weighted for trade with Italy) more pronounced than that assumed in the baseline scenario (equal to -11.5 percent and -9.9 percent respectively) and a less sustained recovery in 2021, with a growth rate of world demand of 5.9 percent, compared to 8.9 percent of the trend scenario33. It is plausible to assume that this weaker profile of global demand is largely attributable to an evolution of the epidemic at an international level less favourable than expected in the baseline scenario.
With regard to exchange rate developments, the trend macroeconomic framework reflects the technical assumption of keeping exchange rates unchanged throughout the forecast horizon at the levels corresponding to the average of the most recent daily quotations (with reference to the last ten working days ending on 31 August 2020). In the third alternative scenario, on the other hand, exchange rates are set equal to forward rates for the whole forecast horizon. This implies, in 2021, a more pronounced appreciation of the euro against the dollar (4.3 percent) compared to that envisaged in the trend scenario (4.0 percent) and, in 2022 and 2023, a slight appreciation (0.3 percent and 0.1 percent respectively), against the unchanged value of the euro vis-à-vis the dollar in the baseline scenario. In this context, the appreciation of the nominal effective exchange rate would be approximately 2.2 percent higher than in the baseline scenario (1.4 percent). In 2021, In 2022 and 2023, the appreciation of the euro (as annual change in the nominal effective exchange rate) would be 1.7 percent and 1.3 percent respectively, compared to a virtually unchanged exchange rate in the trend scenario.
Another risk factor comes from oil prices. The unchanged legislation forecast is based on the prices of future oil contracts and includes an increase in oil price in 2021, which would amount to USD 48.1 per barrel, compared with USD 42.4 in 2020, and a slight increase in prices in 2022 and 2023, which would amount to USD 49.7 and USD 51.0 per barrel respectively. In the fourth alternative scenario, crude oil price levels are assumed to be |
33 In quantifying the impact on global demand of this risk scenario, recent calculations carried out by Oxford Economics were made using their global model, extending to around 80 countries simultaneously.
| 48 | MINISTRY OF ECONOMY AND FINANCE
|
II. MACROECONOMIC FRAMEWORK
higher than those in the trend outlook, of USD 10 in the first half of 2021 and USD 20 in the second half of that year. Since 2022, the expected increase compared to the trend scenario in USD 25 per barrel.
Finally, in the fifth scenario, a risk element is envisaged with regard to the financial conditions of the economy, with less favourable assumptions than those of the baseline scenario. In particular, the ten-year BTP rate of return is considered to be 100 basis points higher in 2021 and the following two years than the corresponding level of the baseline scenario. In this scenario, the higher levels of the BTP-Bund spread would result in stricter conditions applied by banks to customers, with higher interest rates on loans to the private sector.
The results of the sensitivity analyses of the trend macroeconomic framework are set out in Table R1. The hypothesis of a resurgence of virus infections in Italy, concentrated in autumn 2020 and early 2021, together with a lower speed in 2021 in the re-establishment of complete normality, would increase the contraction of output in 2020 by 1.3 percentage points and would significantly slow down the recovery in 2021 with product lower GDP growth, by 2.4 percentage points, than in the baseline scenario. Only since 2022 would there be a return to normality with rates of change in GDP higher than assumed in the trend forecast.
The less favourable trend in world trade, mainly driven by greater difficulties in containing the epidemic at international level, would lead to a sharper drop in output in 2020 compared to the trend macroeconomic framework (by 0.2 percentage points) and a smaller recovery in 2021 (with a 0.9 percentage points lower GDP growth rate ). In the following years, the output growth rates would be higher than in the trend scenario.
An appreciation of the euro, greater than expected in the trend scenario, would also reduce GDP growth in 2021, 2022 and 2023, by 0.1, 0.4 and 0.6 percentage points respectively.
Higher levels of crude oil prices than in the baseline would lead to a fall in the rate of GDP expansion of 0.3 percentage points in 2021 and of 0.8 percentage points and 0.5 percentage points in 2022 and 2023 respectively.
Finally, with regard to the assumption of the worsening of financial conditions, it would also have negative effects on the rate of GDP growth. The latter would be 0.1 percentage points lower in 2021 than in the trend scenario (and, in 2022 and 2023, 0.4 percentage points and 0.6 percentage points respectively). | |
| TABLE R1: RISK SCENARIO EFFECTS ON GDP (impact on growth rates) | |||||
| 2020 | 2021 | 2022 | 2023 | ||
| 1. Marked resurgence of covid-19 epidemic in Italy | -1.3 | -2.4 | 3.0 | 0.2 | |
| 2. Downward revision of world trade because of the pandemic | -0.2 | -0.9 | 0.5 | 0.3 | |
| 3. Appreciation of the nominal effective exchange rate | 0.0 | -0.1 | -0.4 | -0.6 | |
| 4. Higher oil price increase | 0.0 | -0.3 | -0.8 | -0.5 | |
| 5. 100 bp increase in the BTP spread | 0.0 | -0.1 | -0.4 | -0.6 | |
MINISTRY OF ECONOMY AND FINANCE
| 49 |
UPDATE OF THE Economic and Financial Document 2020
| TABLE II.2: MACROECONOMIC framework under unchanged legislation (percentage changes, unless otherwise indicated) | |||||
| 2019 | 2020 | 2021 | 2022 | 2023 | |
| INTERNATIONAL EXOGENOUS VARIABLES | |||||
| World trade | 1.1 | -11.5 | 8.6 | 5.7 | 4.0 |
| Oil price (Brent, USD/barrel, futures) | 64.3 | 42.4 | 48.1 | 49.7 | 51.0 |
| USD/EUR exchange rate | 1.119 | 1.140 | 1.185 | 1.185 | 1.185 |
| ITALY MACRO DATA (VOLUMES) | |||||
| GDP | 0.3 | -9.0 | 5.1 | 3.0 | 1.8 |
| Imports | -0.6 | -13.8 | 8.3 | 4.7 | 3.6 |
| National final consumption | 0.3 | -6.4 | 3.7 | 2.1 | 1.4 |
| Household consumption and NPISH | 0.4 | -8.9 | 4.9 | 2.8 | 1.8 |
| Government expenditure | -0.2 | 2.0 | 0.2 | 0.0 | -0.2 |
| Investments | 1.6 | -13.0 | 7.4 | 4.8 | 2.9 |
| — machinery, equipment and intangible assets | 0.9 | -10.4 | 5.5 | 4.9 | 3.0 |
| — means of transport | 1.0 | -26.3 | 19.5 | 7.9 | 3.5 |
| — construction | 2.5 | -13.6 | 8.0 | 4.1 | 2.6 |
| Exports | 1.0 | -17.4 | 9.5 | 5.6 | 3.5 |
| Memo: current account balance % GDP | 3.0 | 2.4 | 2.7 | 2.8 | 2.8 |
| CONTRIBUTIONS TO GDP GROWTH (1) | |||||
| Net exports | 0.5 | -1.5 | 0.4 | 0.4 | 0.0 |
| Inventories | -0.7 | 0.0 | 0.3 | 0.1 | 0.1 |
| Domestic demand net of inventories | 0.5 | -7.4 | 4.3 | 2.5 | 1.6 |
| PRICES | |||||
| Import deflator | -0.2 | -3.5 | 1.1 | 1.1 | 1.3 |
| Export deflator | 0.5 | -0.4 | 0.7 | 1.0 | 1.1 |
| GDP deflator | 0.7 | 1.1 | 0.7 | 1.1 | 1.0 |
| Nominal GDP | 1.1 | -8.0 | 5.8 | 4.2 | 2.8 |
| Consumption deflator | 0.5 | 0.0 | 0.6 | 1.1 | 1.0 |
| LABOUR | |||||
| Labour cost | 1.5 | 1.4 | 1.1 | 0.9 | 0.9 |
| Productivity (measured on GDP) | 0.2 | 0.6 | 0.1 | 0.4 | 0.1 |
| ULC (measured on GDP) | 1.3 | 0.8 | 1.0 | 0.4 | 0.8 |
| Employment (FTE) | 0.2 | -9.5 | 5.0 | 2.6 | 1.7 |
| Unemployment rate | 10.0 | 9.5 | 10.7 | 10.3 | 9.8 |
| Employment rate (15-64 years) | 59.0 | 58.1 | 58.2 | 58.8 | 59.9 |
| Memo: Nominal GDP (absolute values in million) | 1,789,747 | 1,647,239 | 1,742,031 | 1,814,803 | 1,865,194 |
| (1) Any inaccuracies result from rounding. |
| (2) Source: ISTAT. |
| Note: The macroeconomic framework for international exogenous variables has been developed on the basis of the information available on 31 August 2020. |
| GDP and components in volume (chain linked values reference year 2010), data not corrected for working days. |
| 50 | MINISTRY OF ECONOMY AND FINANCE
|
II. MACROECONOMIC FRAMEWORK
Ii.4 policy scenario
The macro-economic policy framework incorporates the effects on the economy of the measures that the Government intends to present to Parliament in the 2021 draft budget law. Together with these measures, the fiscal policy framework takes into account the extraordinary interventions for the support and relaunch of the economy that the Government intends to agree with the European Commission through the presentation of the National Recovery and Resilience Plan in the framework of procedures for access to funds allocated by the NGEU.
The fiscal policy for 2021-2023 is described in Chapters I and III of this document. The policy scenario forecasts are based on simulations carried out with the European Commission’s QUEST model, calibrated for Italy, with regard to the macroeconomic impacts of the NGEU; the effects of the other components of the 2021-2023 manoeuvre have been estimated using the quarterly Treasury econometric model (ITEM).
The table below shows the impact on GDP of the fiscal measures grouped by type of intervention. Compared to the unchanged legislation scenario, the GDP growth rate is projected higher by 0.9 percentage points in 2021, 0.8 percentage points in 2022 and 0.7 percentage points in 2023.
The contribution to growth represented by the interventions to be carried out through the use of NGEU resources (Table I.2 of Chapter I) is relatively moderate in the first year, and then increases until it has an impact of 0.8 percent on GDP in the last year of the forecast horizon. The simulations on which these estimates are based have been elaborated considering the mix of grants, loans and financing measures necessary to achieve the net borrowing targets identified for each year.
| Table II.3: EFFECTS ON the GDP of the policy scenario with respect to the unchanged legislation scenario (impact on growth rates) | |||
| 2021 | 2022 | 2023 | |
| Unchanged policies | 0.1 | 0.1 | 0.1 |
| Taxation measures | 0.2 | 0.2 | 0.1 |
| Other new policies | 0.3 | 0.1 | 0.0 |
| Fiscal tightening | 0.0 | 0.0 | -0.3 |
| Manoeuvre impact (*) | 0.6 | 0.4 | -0.1 |
| Next Generation EU (*) | 0.3 | 0.4 | 0.8 |
| Manoeuvre with Next Generation EU impact(*) | 0.9 | 0.8 | 0.7 |
| (*) Any inaccuracies result from rounding. | |||
The real GDP path consistent with these estimates assumes a growth rate of 6.0 percent in 2021, 3.8 percent in 2022 and 2.5 percent in 2023. Quarterly GDP in the policy framework recovers the level of the last pre-crisis quarter (Q4 of 2019) in the third quarter of 2022. The higher growth compared to the unchanged legislation framework is mainly driven by gross fixed capital formation. The latter, in turn, has a multiplier effect on production and increase the disposable income of households, resulting in higher private sector investment and household consumption expenditure. Exports are slightly affected by the impact of domestic growth on costs and prices, but over time they benefit from the enhanced competitiveness of the economy achieved through the rise in investment.
MINISTRY OF ECONOMY AND FINANCE
| 51 |
UPDATE OF THE Economic and Financial Document 2020
| TABLE II.4: policy scenario MACROECONOMIC framework (percentage changes, unless otherwise indicated) | |||||
| 2019 | 2020 | 2021 | 2022 | 2023 | |
| INTERNATIONAL EXOGENOUS VARIABLES | |||||
| International trade | 1.1 | -11.5 | 8.6 | 5.7 | 4.0 |
| Oil price (Brent, USD/barrel, futures) | 64.3 | 42.4 | 48.1 | 49.7 | 51.0 |
| USD/EUR exchange rate | 1.119 | 1.140 | 1.185 | 1.185 | 1.185 |
| ITALY MACRO DATA (VOLUMES) | |||||
| GDP | 0.3 | -9.0 | 6.0 | 3.8 | 2.5 |
| Imports | -0.6 | -13.8 | 8.8 | 6.0 | 3.8 |
| National final consumption | 0.3 | -6.4 | 4.4 | 2.8 | 1.7 |
| Household consumption and NPISH | 0.4 | -8.9 | 5.5 | 3.7 | 2.3 |
| Government expenditure | -0.2 | 2.0 | 1.2 | -0.2 | -0.4 |
| Investments | 1.6 | -13.0 | 10.6 | 8.5 | 5.9 |
| - machinery, equipment and intangible assets | 0.9 | -10.4 | 9.9 | 9.2 | 6.2 |
| - means of transport | 1.0 | -26.3 | 19.0 | 10.3 | 4.8 |
| - construction | 2.5 | -13.6 | 10.3 | 7.4 | 5.7 |
| Exports | 1.0 | -17.4 | 9.6 | 5.7 | 3.5 |
| Memo: current account balance. % GDP | 3.0 | 2.4 | 2.5 | 2.3 | 2.2 |
| CONTRIBUTIONS TO GDP GROWTH (1) | |||||
| Net exports | 0.5 | -1.5 | 0.3 | 0.0 | 0.0 |
| Inventories | -0.7 | 0.0 | 0.2 | 0.0 | 0.0 |
| Domestic demand net of inventories | 0.5 | -7.4 | 5.4 | 3.8 | 2.4 |
| PRICES | |||||
| Import deflator | -0.2 | -3.5 | 1.1 | 1.1 | 1.3 |
| Export deflator | 0.5 | -0.4 | 0.6 | 1.1 | 1.2 |
| GDP deflator | 0.7 | 1.1 | 0.8 | 1.3 | 1.2 |
| Nominal GDP | 1.1 | -8.0 | 6.8 | 5.1 | 3.7 |
| Consumption deflator | 0.5 | 0.0 | 0.7 | 1.2 | 1.2 |
| Planned inflation | 0.5 | ||||
| LABOUR | |||||
| Labour cost | 1.5 | 1.4 | 1.4 | 1.2 | 1.2 |
| Productivity (measured on GDP) | 0.2 | 0.6 | 0.5 | 0.4 | 0.2 |
| ULC (measured on GDP) | 1.3 | 0.8 | 0.8 | 0.8 | 0.9 |
| Employment (FTE) | 0.2 | -9.5 | 5.4 | 3.4 | 2.2 |
| Unemployment rate | 10.0 | 9.5 | 10.3 | 9.5 | 8.7 |
| Employment rate (15-64 years) | 59.0 | 58.1 | 58.4 | 59.6 | 61.1 |
| Memo: Nominal GDP (absolute values in million) | 1,789,747 | 1,647,239 | 1,759,223 | 1,848,881 | 1,916,551 |
| (1) Any inaccuracies result from rounding. |
| (2) Source: ISTAT. |
| Note: The macroeconomic framework for international exogenous has been developed on the basis of the information available on 31 August 2020. |
| GDP and components in volume (chain linked values reference year 2010), data not corrected for working days. |
Higher GDP growth also leads to an increase in labour input. The latter is slightly weaker than that of value added as the aggregate productivity of the economy is expected to improve. In turn, the expansion in labour units is reflected
| 52 | MINISTRY OF ECONOMY AND FINANCE
|
II. MACROECONOMIC FRAMEWORK
in a greater number of people employed in the policy scenario and a more marked decline in the unemployment rate over the three-year period. The unemployment rate would fall to a lower level than in 2019 already in 2022. However, this forecast is subject to a considerable margin of uncertainty given the sharp fall in labour participation recorded during the crisis, which is expected to get back gradually but could instead reverse course more quickly also thanks to the active labour policies adopted by the Government.
Finally, it should be noted that, compared to the unchanged legislation trend, the policy framework foresees a slightly more sustained momentum of inflation and a moderate reduction in the current account surplus, which is due to higher imports stimulated by the faster expansion of gross fixed capital formation and household consumption.
MINISTRY OF ECONOMY AND FINANCE
| 53 |
UPDATE OF THE Economic and Financial Document 2020
| 54 | MINISTRY OF ECONOMY AND FINANCE
|
III. NET borrowing AND PUBLIC DEBT
III.1 Summary data and forecasts under unchanged legislation
In 2019 there was a significant improvement in public finance. This is fully confirmed by the recent update of ISTAT’s final estimates1, according to which the general government net borrowing fell to 1.6 percent of GDP in 2019, from 2.2 percent of GDP in the previous year. The improvement is due both to the strengthening of the primary surplus, which rose from 1.4 percent to 1.8 percent of GDP, and to the reduction in interest expenditure, which fell from 3.6 percent to 3.4 percent of GDP. The new data also confirm the positive trend in tax revenue, whose 2019 final estimate shows an increase of about 12 billion compared to 2018 and is at a higher level of more than 10 billion compared to the forecast of Update of September 20192.
On the other hand, the public finance framework under unchanged legislation for the years 2020-2023 is affected by the serious health emergency caused by the covid-19 epidemic, which has resulted in a decline in real GDP for the current year estimated at 9 percent (about 1 percentage point more than the forecast of the April Stability Programme). The macroeconomic framework, underlying this document, foresees the return to growth as already in 2021 and to reach the level of real GDP recorded in 2019 at the end of the forecast horizon.
The trends under the unchanged legislation scenario also take into account the results of public finance monitoring and the impact of the measures adopted by the Government after the Stability Programme 20203, to complete the package to counter the health emergency. Among these measures there are, in particular, the Decree ‘Relaunch’ on urgent measures in the fields of health, support for labour and economy, as well as social policies related to the epidemic emergency4, and the Decree ‘Support and Relaunch’ laying down further urgent measures to prolong and strengthen previous interventions5. These measures aimed at supporting employment, safeguarding household incomes and living conditions and broadening social protection, in order to avoid to levy the burden of the emergency on the most vulnerable subjects. The Decree ‘Relaunch’ also
1 Istat, National Economic Accounts, 22 September 2020.
2 The revisions of the historical series carried out by ISTAT for the years 2017-2019, due to the consolidation of the basic information compared to those available in April 2020, leave the incidence of the deficit unchanged over the three years. The primary surplus on GDP was revised from 1.5 percent to 1.4 percent in 2018 and from 1.7 percent to 1.8 percent in 2019. Interest expenditure on GDP are revised from 3.7 percent to 3.6 percent in 2018. See ISTAT, ‘National Economic Accounts’, 22 September 2020.
3 Adopted by the Council of Ministers on 24 April 2020.
4 D.L. No. 34 of 19 May 2020, cv. by Law No. 77/2020.
5 D.L. No. 104 of 14 August 2020.
MINISTRY OF ECONOMY AND FINANCE
| 55 |
UPDATE OF THE Economic and Financial Document 2020
abolished the increases in VAT and excise duties provided for in the legislation in force for 2021 and the following years.
Overall, the two decrees lead to a deterioration of the nominal deficit by around 4.9 percentage points of GDP for 2020, 1.8 percentage points in 2021, 2.0 percentage points in 2022 and 2.2 percentage points in 2023. The strengthening of the measures made necessary the presentation by the Government of a further Report to Parliament provided for by the Law No. 243 of 20126 to request authorisation to make the third temporary budget deviation, of about 25 billion for 2020, additional to what had already been requested in March and April. Overall, the impact of the package adopted by the Government to cope with the covid-19 emergency on net borrowing reached 100 billion, equal to 6.1 percentage points of GDP7.
The estimate of net borrowing under unchanged legislation in 2020, foreseen equal to 7.1 percent in April, rises to 10.8 percent of GDP, a level that deviates only slightly from the estimate under the new policies scenario8 of 10.4 percent of GDP. The update of the estimation takes into account the more favourable indications, which can be deduced from the monitoring data, regarding the evolution of revenue and expenditure, which will have to be verified in the coming months. The primary deficit in relation to GDP is now estimated at -7.3 percent (-3.5 percent under the unchanged legislation of the DEF in April), while the incidence of interest expenditure on GDP has revised down from 3.7 percent to 3.5 percent.
A marked reduction in net borrowing under unchanged legislation is expected over the three-year period, which will fall to -5.7 percent of GDP in 2021, to -4.1 percent of GDP in 2022 and to -3.3 percent of GDP in 2023. The primary deficit will be gradually reabsorbed, at -2.4 percent of GDP in 2021, -0.9 percent in 2022 and -0.1 percent in 2023, due to the revenue dynamics, which is stronger than the primary expenditure one. On the one hand, these developments are affected by the vanishing impact of discretionary fiscal measures introduced in response to the health emergency, the nature of which is mainly temporary, with the exception of the above-mentioned elimination of VAT and excise increases, which is of a structural nature; on the other hand, by the return to growth, as assumed in the macroeconomic framework. The incidence of interest expenditure on GDP, which will fall to 3.3 percent in 2021, will fall by one tenth of a point in 2022 and will remain stable to 3.2 percent in 2023.
On the revenue side, tax revenue is expected to fall by 8.1 percent in 2020 also due to in the deferrals of payment deadlines, and in some cases the elimination9 of tax duties of households and businesses. Therefore, a rebound of 8.1 percent is expected in 2021 and a return to an average growth of 2.7 percent in 2022-2023. Direct taxes in 2020 will fall by 4.7 percent and then rise by 5.3 percent in 2021 and grow to an annual average of 2.9 percent in subsequent years.
6 Report to Parliament of 22 July 2020.
7 For more details on the measures see paragraph III.5 Main public finance measures adopted in 2020.
8 Inclusive of the impact of the decrees Cura Italia and Liquidità already adopted and of the announced decree Rilancio.
9 These include, for example, the case of commercial IRAP, for which are cancelled the balance for 2019 and the first instalment of advance payments for 2020.
| 56 | MINISTRY OF ECONOMY AND FINANCE
|
III. NET borrowing AND PUBLIC DEBT
Increases in PIT withholdings on permanent employees (in particular on civil servants) continue to compensate for the reduction in the withholdings of self-employed and fixed-term workers, most affected by the decline in employment on the labour market.
Indirect taxes will fall by 11.5 percent in 2020. Among the most significant contractions there are those recorded by VAT on domestic transactions, due to the fall in consumption; Revenue from games as a result of the suspension of activities during the lockdown period; and the registration tax because of the observed fall in real estate sales. In 2021, a rebound of 10.9 percent is expected, while the hypothesis for the following two years is an average annual growth rate of about 2.6 percent. As already explained, the trend no longer considers VAT and excise increases, which have been definitively repealed from the existing legislation. Despite this, the ratio of tax revenue to GDP expected in 2021 and 2022 (29.5 percent and 29.2 percent respectively) is higher than the forecast of the Update to the DEF 2019 (29.3 percent and 29 percent respectively), confirming a certain resilience of tax revenues to the current health and economic and social crisis.
Social security contributions are expected to fall by 7 percent in 2020 and then to grow at a sustained average annual rate of 4 percent in the following three years. The dynamics reflects the deterioration in labour market conditions in the current year and the expected return to growth since 2021. In relation to GDP, social security contributions will reach 13.7 percent in 2020, maintaining an average level of 13.6 percent over the next three years.
The fiscal pressure under unchanged legislation is foreseen to rise by one tenth of a percentage point in 2020 to 42.5 percent. Considering the whole period, it will grow by about 0.1 percentage points, reaching 42.6 percent in 2023. Net of the EUR 100 measures10 the fiscal pressure would rise from 41.8 percent in 2020 to 41.9 percent in 202311.
Public expenditure projections estimate a growth in primary expenditure, i.e. total expenditure net of interest, of 11.7 percent for the current year, a decrease of 3.5 percent in 2021 and a slight increase of 0.4 percent on average over the period 2022-2023. In 2020, the share of primary expenditure on GDP will rise to 55 percent, while in the coming years it will decrease again: in view of the expected growth in nominal GDP, it will move from 50.1 percent in 2021 to 47.3 percent in 2023.
Current primary expenditure as ratio to GDP will rise to 50.4 percent in 2020, before falling to 43.3 percent at the end of the period. The component of cash social transfers is the most dynamic, with a growth of 13.6 percent in 2020. They will fall by 5 percent in 2021 and then follow an average annual growth rate of 1.5 percent over the period 2022-2023. As ratio to GDP, expenditure on cash social transfers will increase to 24.9 percent, but will then return to a decreasing path, standing at 21.5 percent in 2023. Within social benefits, pension expenditure forecasts continue to discount the significant increase in the number of persons
10 From July 2020, the benefit of EUR 80 per month is increased to EUR 100 for individuals with gross total income not exceeding EUR 28,000 by Decree-Law No. 3 adopted in February 2020.
11 The increase in the fiscal pressure under unchanged legislation is calculated without taking into account the confirmation of the further deduction for employees provided for in Legislative Decree No. 3/2020. The stabilisation of this intervention on the tax wedge will be provided for by the next Budget Law.
MINISTRY OF ECONOMY AND FINANCE
| 57 |
UPDATE OF THE Economic and Financial Document 2020
entering early retirement schemes due to the recent regulatory changes introduced by the 2019 Budget Law and other implementing measures12, including “Quota 100”13. According to the unchanged legislation scenario, a pension expenditure growth lower than the economic growth will help to reduce the ratio of this expenditure to GDP, from 17.1 percent in 2020 to 16.2 percent in 2023. Nevertheless, expenditure on pensions under unchanged legislation in 2023 will be 0.8 percentage points higher as ratio to GDP compared to 2019.
Other non-pension transfers are expected to grow by 48.7 percent in the current year, supported by the refinancing of social safety nets to mitigate the economic and social effects of the crisis, of poverty-fighting policies and of additional recognised welfare benefits. These transfers are also affected by the extension of the supplementary remuneration treatment through a tax credit increased from EUR 80 to EUR 100 by Decree-Law No. 3 of 2020.
The compensation of public employees will grow at a rate of 2.4 percent and 2.6 percent for each of the years 2020 and 2021. The dynamics are mainly related to the increase in employment in the general government. The expected fall in the next two years, by 0.8 percent and 0.3 percent in 2022 and 2023, will lead to a decrease in the incidence of compensation of public employees on GDP from 10.8 percent in 2020 to 9.6 percent of GDP in 2023, slightly lower than in 2019.
Intermediate consumption as ratio to GDP is expected to grow to 9.6 percent in 2020 and gradually decline in subsequent years up to 8.3 percent in 2023.
The evolution of gross fixed capital formation in 2020 shows a nominal growth of 8.4 percent, higher than the forecasts of the April Stability Programme, which placed it at 2.7 percent, as a result of the further measures to support the economy adopted in recent months. Investment growth will be sustained in 2021 and 2022, at an average rate of 6.5 percent, while in 2023 a reduction of 1.8 percent is expected, consequent to a reduction in the resources allocated by the latest economic support measures. As ratio to GDP, investment will be at an average level of 2.7 percent over the forecast period 2020-2023, higher than before the crisis due to the health emergency.
12 L. No. 145/2018 and D.L. No. 4/2019 cv. by Law No. 26/2019.
13 Under the new early retirement scheme, which was introduced experimentally in the three-year period 2019-2021, it is possible to retire before the old age requirement is met, with at least 38 years of contributions and a minimum age of 62.
| 58 | MINISTRY OF ECONOMY AND FINANCE
|
III. NET borrowing AND PUBLIC DEBT
| Table III.1a: General government account at unchanged legislation (in millions) | |||||
| 2019 | 2020 | 2021 | 2022 | 2023 | |
| EXPENDITURE | |||||
| Compensation of employees | 173,054 | 177,248 | 181,896 | 180,370 | 179,752 |
| Intermediate consumption | 147,364 | 158,876 | 154,106 | 154,138 | 154,178 |
| Social benefits | 361,203 | 410,500 | 389,880 | 394,650 | 401,710 |
| of which: Pensions | 274,860 | 282,140 | 288,600 | 295,270 | 302,210 |
| Other social benefits | 86,343 | 128,360 | 101,280 | 99,380 | 99,500 |
| Other current expenditure | 66,713 | 83,263 | 73,084 | 75,027 | 72,836 |
| Total current expenditure net of interest | 748,334 | 829,887 | 798,966 | 804,185 | 808,476 |
| Interest expenditure | 60,386 | 58,411 | 57,705 | 57,583 | 58,800 |
| Total current expenditure | 808,720 | 888,298 | 856,671 | 861,768 | 867,276 |
| of which: Health expenditure | 115,448 | 120,864 | 121,952 | 122,020 | 122,515 |
| Total capital expenditure | 61,860 | 75,445 | 74,622 | 72,000 | 72,883 |
| Gross fixed capital formation | 41,156 | 44,608 | 47,474 | 50,565 | 49,679 |
| Capital contributions | 14,327 | 20,531 | 21,775 | 17,292 | 16,258 |
| Other transfers | 6,377 | 10,306 | 5,373 | 4,143 | 6,946 |
| Total final expenditure net of interest | 810,194 | 905,332 | 873,588 | 876,185 | 881,359 |
| Total final expenditure | 870,580 | 963,743 | 931,292 | 933,767 | 940,158 |
| REVENUE | |||||
| Total tax revenue | 516,633 | 474,925 | 513,216 | 529,567 | 541,757 |
| Direct taxes | 257,284 | 245,254 | 258,370 | 267,148 | 273,491 |
| Indirect taxes | 258,112 | 228,551 | 253,501 | 261,058 | 266,895 |
| Capital taxes | 1,237 | 1,120 | 1,345 | 1,361 | 1,371 |
| Social contributions | 241,952 | 224,934 | 236,027 | 246,710 | 252,943 |
| Actual contributions | 237,752 | 220,604 | 231,623 | 242,242 | 248,477 |
| Imputed contributions | 4,200 | 4,330 | 4,404 | 4,468 | 4,466 |
| Other current revenue | 80,606 | 79,189 | 80,331 | 79,894 | 80,960 |
| Total current revenue | 837,954 | 777,928 | 828,229 | 854,810 | 874,289 |
| Non tax capital revenue | 2,739 | 6,680 | 2,622 | 2,897 | 3,122 |
| Total final revenue | 841,930 | 785,727 | 832,196 | 859,068 | 878,782 |
| Memo: Tax pressure | 42.4 | 42.5 | 43.0 | 42.8 | 42.6 |
| Tax pressure net of € 100 measure | 41.8 | 41.8 | 42.2 | 42.0 | 41.9 |
| BALANCES | |||||
| Primary balance | 31,736 | -119,605 | -41,392 | -17,116 | -2,576 |
| as % of GDP | 1.8 | -7.3 | -2.4 | -0.9 | -0.1 |
| Current balance | 29,234 | -110,370 | -28,442 | -6,957 | 7,014 |
| as % of GDP | 1.6 | -6.7 | -1.6 | -0.4 | 0.4 |
| Net borrowing | -28,650 | -178,015 | -99,097 | -74,699 | -61,376 |
| as % of GDP | -1.6 | -10.8 | -5.7 | -4.1 | -3.3 |
| Trend nominal GDP (x 1,000) | 1,789.7 | 1,647.2 | 1,742.0 | 1,814.8 | 1,865.2 |
| Note: Any inaccuracies result from rounding. | |||||
MINISTRY OF ECONOMY AND FINANCE
| 59 |
UPDATE OF THE Economic and Financial Document 2020
| Table III.1b: General government account at unchanged legislation (percentage of GDP) | |||||
| 2019 | 2020 | 2021 | 2022 | 2023 | |
| EXPENDITURE | |||||
| Compensation of employees | 9.7 | 10.8 | 10.4 | 9.9 | 9.6 |
| Intermediate consumption | 8.2 | 9.6 | 8.8 | 8.5 | 8.3 |
| Social benefits | 20.2 | 24.9 | 22.4 | 21.7 | 21.5 |
| of which: Pensions | 15.4 | 17.1 | 16.6 | 16.3 | 16.2 |
| Other social benefits | 4.8 | 7.8 | 5.8 | 5.5 | 5.3 |
| Other current expenditure | 3.7 | 5.1 | 4.2 | 4.1 | 3.9 |
| Total current expenditure net of interest | 41.8 | 50.4 | 45.9 | 44.3 | 43.3 |
| Interest expenditure | 3.4 | 3.5 | 3.3 | 3.2 | 3.2 |
| Total current expenditure | 45.2 | 53.9 | 49.2 | 47.5 | 46.5 |
| of which: Health expenditure | 6.5 | 7.3 | 7.0 | 6.7 | 6.6 |
| Total capital expenditure | 3.5 | 4.6 | 4.3 | 4.0 | 3.9 |
| Gross fixed capital formation | 2.3 | 2.7 | 2.7 | 2.8 | 2.7 |
| Capital contributions | 0.8 | 1.2 | 1.2 | 1.0 | 0.9 |
| Other transfers | 0.4 | 0.6 | 0.3 | 0.2 | 0.4 |
| Total final expenditure net of interest | 45.3 | 55.0 | 50.1 | 48.3 | 47.3 |
| Total final expenditure | 48.6 | 58.5 | 53.5 | 51.5 | 50.4 |
| REVENUE | |||||
| Total tax revenue | 28.9 | 28.8 | 29.5 | 29.2 | 29.0 |
| Direct taxes | 14.4 | 14.9 | 14.8 | 14.7 | 14.7 |
| Indirect taxes | 14.4 | 13.9 | 14.6 | 14.4 | 14.3 |
| Capital taxes | 0.1 | 0.1 | 0.1 | 0.1 | 0.1 |
| Social contributions | 13.5 | 13.7 | 13.5 | 13.6 | 13.6 |
| Actual contributions | 13.3 | 13.4 | 13.3 | 13.3 | 13.3 |
| Imputed contributions | 0.2 | 0.3 | 0.3 | 0.2 | 0.2 |
| Other current revenue | 4.5 | 4.8 | 4.6 | 4.4 | 4.3 |
| Total current revenue | 46.8 | 47.2 | 47.5 | 47.1 | 46.9 |
| Non tax capital revenue | 0.2 | 0.4 | 0.2 | 0.2 | 0.2 |
| Total final revenue | 47.0 | 47.7 | 47.8 | 47.3 | 47.1 |
| Memo: Tax pressure | 42.4 | 42.5 | 43.0 | 42.8 | 42.6 |
| BALANCES | |||||
| Primary balance | 1.8 | -7.3 | -2.4 | -0.9 | -0.1 |
| Current balance | 1.6 | -6.7 | -1.6 | -0.4 | 0.4 |
| Net borrowing | -1.6 | -10.8 | -5.7 | -4.1 | -3.3 |
| Note: GDP ratios are forecasts of the unchanged legislation scenario. Any inaccuracies result from rounding. | |||||
| 60 | MINISTRY OF ECONOMY AND FINANCE
|
III. NET borrowing AND PUBLIC DEBT
| Table III.1c: general covernment account at unchanged legislation (percentage changes) | ||||
| 2020 | 2021 | 2022 | 2023 | |
| EXPENDITURE | ||||
| Compensation of employees | 2.4 | 2.6 | -0.8 | -0.3 |
| Intermediate consumption | 7.8 | -3.0 | 0.0 | 0.0 |
| Social benefits | 13.6 | -5.0 | 1.2 | 1.8 |
| of which: Pensions | 2.6 | 2.3 | 2.3 | 2.4 |
| Other social benefits | 48.7 | -21.1 | -1.9 | 0.1 |
| Other current expenditure | 24.8 | -12.2 | 2.7 | -2.9 |
| Total current expenditure net of interest | 10.9 | -3.7 | 0.7 | 0.5 |
| Interest expenditure | -3.3 | -1.2 | -0.2 | 2.1 |
| Total current expenditure | 9.8 | -3.6 | 0.6 | 0.6 |
| of which: Health expenditure | 4.7 | 0.9 | 0.1 | 0.4 |
| Total capital expenditure | 22.0 | -1.1 | -3.5 | 1.2 |
| Gross fixed capital formation | 8.4 | 6.4 | 6.5 | -1.8 |
| Capital contributions | 43.3 | 6.1 | -20.6 | -6.0 |
| Other transfers | 61.6 | -47.9 | -22.9 | 67.7 |
| Total final expenditure net of interest | 11.7 | -3.5 | 0.3 | 0.6 |
| Total final expenditure | 10.7 | -3.4 | 0.3 | 0.7 |
| REVENUE | ||||
| Total tax revenue | -8.1 | 8.1 | 3.2 | 2.3 |
| Direct taxes | -4.7 | 5.3 | 3.4 | 2.4 |
| Indirect taxes | -11.5 | 10.9 | 3.0 | 2.2 |
| Capital taxes | -9.5 | 20.1 | 1.2 | 0.7 |
| Social contributions | -7.0 | 4.9 | 4.5 | 2.5 |
| Actual contributions | -7.2 | 5.0 | 4.6 | 2.6 |
| Imputed contributions | 3.1 | 1.7 | 1.5 | 0.0 |
| Other current revenue | -1.8 | 1.4 | -0.5 | 1.3 |
| Total current revenue | -7.2 | 6.5 | 3.2 | 2.3 |
| Non tax capital revenue | 143.9 | -60.7 | 10.5 | 7.8 |
| Total final revenue | -6.7 | 5.9 | 3.2 | 2.3 |
 | Medium to long-term trends in the Italian pension system and public expenditure related to ageing The outbreak of covid-19 infection and the containment measures that have been taken to counter its spread have profoundly impacted social relations and, in general, the economy. In this context of strong uncertainty, the formulation of macroeconomic forecasts and expenditure is a very complex exercise, especially where the horizon is for several decades. Nevertheless, in line with the approach adopted by the European Commission and the Working Group on Ageing in the context of the work to update the forecasts on expenditure related to ageing for the 2021 Report, the medium and long-term forecasts presented in this Focus have been developed according to the approach adopted in the past, assuming |
MINISTRY OF ECONOMY AND FINANCE
| 61 |
UPDATE OF THE Economic and Financial Document 2020
that the effects of the health emergency have a short-term and temporary impact and do not modify the structural parameters underlying the macroeconomic and demographic reference scenarios.14 On the basis of this approach, medium- to long-term trends in the Italian pension system are developed under the unchanged legislation scenario and under the assumption of the national base scenario.15 The long-term forecast (up to 2070) of pension expenditure as ratio to GDP is based on the demographic parameters underlying the median scenario developed by Istat16, with base 2018, while, with as for the macroeconomic framework, it assumes a real GDP growth rate of around 1.2 percent per annum over the forecast horizon17. The forecast of pension expenditure18 as ratio to GDP, shown in Figure 1, reflects the effects of the measures contained in the reform measures adopted. Reference is made, in particular, to the application of the contribution-based system (Law No. 335/1995) and to the rules introduced both in 2004 and in 2010 and, subsequently, to the measures of Law No. 214/2011 which, by raising access requirements for old-age and early retirement, have significantly improved the sustainability of the pension system in the medium to long term, ensuring greater equality between generations. The reform process also provided for the extension from 2012 of the contribution-based system to all workers. Finally, as of 2013, all age requirements (including those for access to social allowance) and contributory requirements for access to early retirement irrespective of age are periodically indexed to changes in life expectancy as measured by Istat. In addition, at the same frequency and similar procedure, the conversion coefficients will be adjusted according to the probability of survival. Both adjustments are made every three years from 2013 to 2019, and every two years thereafter, according to a procedure which is entirely within the scope of administrative action and which ensures the certainty of the dates set for future revisions19. |
14 However, given that the uncertainty about the economic consequences of the covid-19 epidemic remains very strong, in line with similar analysis planned in Europe for the next 2021 Ageing Report, further assessments on medium and long-term trends in the Italian pension and social health system have been conducted by building adverse macroeconomic scenarios, which are alternative to the reference one. These scenarios assume that the duration and intensity of the epidemic and recession will produce macro-economic effects that spread over the medium and long term respectively, without, however, assigning to any of them a greater or lesser likelihood of realisation. See, in this regard, Focus 5.2 of the 2020 Report of the State General Accounting Department (RGS) No. 21 on: The medium-long-term trends of the pension and social and health system (http://www.rgs.mef.gov.it/VERSIONE-I/attivita_istituzionali/monitoraggio/spesa_pensionistica/).
15 The medium-to-long-term trend of pension expenditure as ratio to GDP is presented in accordance with Article 1(5) of Law No. 335 of 1995. National Accounting data on pension expenditure and GDP are computed in accordance with the new European System of National and Regional Accounts (Sec 2010).
16 As the population forecasts produced by Istat (base year 2018, October 2019) cover a time horizon extending until 2065, the value of the demographic parameters for the final five-year period of the forecast horizon has been extrapolated on the basis of trends in the previous decade. Overall, the demographic parameters of the baseline national scenario, updated with the new Istat population forecast, are specified as follows: i) the fertility rate increased slightly from 1.29 in 2018 to 1.61 in 2070 (1.59 in 2065), with an almost linear progression; ii) the life expectancy in 2070 reached 86.5 years for men and 90.6 years for women, with an increase of 5.6 and 5.4 years respectively compared to 2018 (in 2065, the values are 86.1 and 90.2 respectively); and iii) the net migratory flow is at an yearly average level of 162 thousand unities (165 thousand up to 2065) with a slightly decreasing path. See Istat (2019), http://demo.istat.it.e Ministry of Economy and Finance – RGS (2020), Medium-long-term trends in the pension and social health system, Report No. 21 http://www.rgs.mef.gov.it/VERSIONE-I/attivita_istituzionali/monitoraggio/spesa_pensionistica/).
17 For the period 2020-2023, growth assumptions are consistent with those outlined in this document in the context of the macroeconomic scenario under unchanged legislation. The employment rate in the 15-64 age group, on the other hand, increased by about 8 percentage points in 2070 compared to the 2018 value. The unemployment rate is gradually declining to a value of 5.5 percent in 2062.
18 The forecasts under unchanged legislation scenario and the assessments represented below have been developed on the assumption that the institution of the financial advance for pension guarantee (the market APE) is qualified and classified in National Accounting as a loan and not as a direct money transfer to households.
19 The adjustment of retirement requirements with effect from 2016 (4 further months), in compliance with the provisions of the legislation (Article 12(12)-bis, of Decree-Law No. 78 of 31 May 2010, converted with
| 62 | MINISTRY OF ECONOMY AND FINANCE
|
III. NET borrowing AND PUBLIC DEBT
| Figure R1: Public expenditure for pensions as a percentage of GDP (national baseline scenario) | |
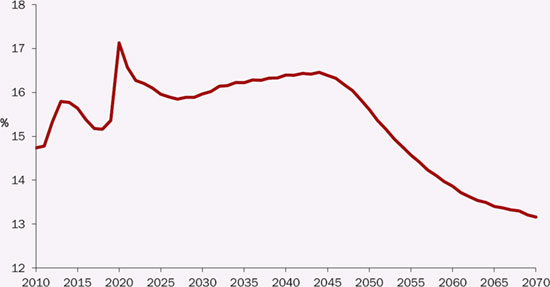 |
The forecast takes into account the regulatory interventions contained in Law No. 145/2018 (Budget Law 2019) and the measures provided for by Decree Law No. 4/2019, converted by Law No. 26/2019 which introduced easier requirements20 for access to early retirement by allowing, in particular, the early retirement to persons who accrue, in a joint way, the age and contribution requirements of 62 years of age and 38 years of contributions by 31 December 202121 and, establishing the increase of the life expectancy for the period 201922. The forecasts for the year 2020 and subsequent also take into account the interventions contained in the 2020-2022 Budget Law (Law No. 160/2019)23. |
amendments by Law No. 122 of 30 July 2010) was adopted at least twelve months before the start of the adjustment by director general’s decree of 16 December 2014, published in Official Journal (OJ) on 30 December 2014; and that of the conversion coefficients by director general’s decree of 22 June 2015, published in OJ on 6 July 2015. The adjustment of the requirements from 2019 (5 further months) was adopted by director general’s decree of 5 December 2017, published in OJ on 12 December 2017; and that of the conversion coefficients by director general’s decree of 15 May 2018, published in OJ No. 131 of 8 June 2018. The forecasts set out here refer to the regulatory framework in force at the time of the preparation of the Update of DEF 2020 and, therefore, also take into account the effects of the Decree of 5 November 2019 (OJ No. 267 of 14 November 2019) which, starting in 2021, does not establish any further increases in the requirements for access to retirement according to the dynamics of life expectancy. In addition, account is also taken of the adjustment of the conversion coefficients with effect from 2021, which entered into force by direct decree of 1 June 2020, published in OJ 147 of 11 June 2020.
20 Implementation of the provisions of Law No. 145/2018 (Budget Law 2019) in terms of relative financial planning. Budget Law No. 145/2018 in paragraph 256 established the “Fund for the revision of the early pension system and to encourage the recruitment of young workers” whose budget is 7000 million per year from 2024. The higher costs resulting from the provisions in the field of social security of Legislative Decree No. 4/2019 converted by Law No. 26/2019 have been financial coverage by means of the substantial zeroing of the authorisation of expenditure in question until 2023. In the following years, there remain in force in the aforementioned authorisation of expenditure increasing amounts up to a level of 3.8 billion annually since 2028. These remaining appropriations, which have not yet been defined by law, are not allocated to specific structural measures in the field of pensions.
21However, there is provision for a postponement of the first useful start of pension benefits from the date of maturity of three months for the private sector and six months for the public sector.
22 In any case, a postponement of the first useful start of pension benefits from the date on which the requirements of three months have accrued is planned since 2019.
23 In the field of pensions, the provisions of Law No. 160/2019 provide for a partial and contained revision of the indexation system and the extension of access to early retirement for women who have 35 years of contributions and 58 years of age, if employed, and 59 years of age, if they are self-employed, in 2019. There are also specific measures to facilitate retirement for particular sectors (in particular publishing). Law No. 160/2019,
MINISTRY OF ECONOMY AND FINANCE
| 63 |
UPDATE OF THE Economic and Financial Document 2020
Following the growth of the three-year period 2008-2010, due exclusively to the acute phase of the recession, the ratio of pension expenditure to GDP in the following years is affected by the further contraction phase in GDP. Since 2015, with a more favourable business cycle and the gradual continuation of the process of raising minimum requirements for access to retirement, the ratio of pension expenditure to GDP has fallen for about three years to 15.2 percent in 2018. From 2019 to 2022, the ratio of pension expenditure to GDP rose, first abruptly, to a peak of 17.1 percent in the current year, and then declined in the following two years, however, at a level of 16.3 percent, more than 1 percentage point of GDP above the 2018 figure. Expenditure as ratio to GDP is growing significantly due to the sharp contraction in GDP levels due to the impact of the health emergency that has hit Italy since last February. However, this trend is also conditioned by the application of the social security measures contained in Decree Law No. 4/2019 converted by L. No. 26/2019 (so-called Quota 100), which, by favouring early retirement, lead to a substantial increase in the number of pensions in the years 2019-2021 in relation to the number of employees. Subsequently, there is a four-year period of slight decline, at the end of which expenditure in relation to GDP stood at 15.9 percent in the period 2026-2029, also due to a partial recovery in employment levels. Thereafter, the ratio of pension expenditure to GDP is rising again to 16.5 percent in 2044. This dynamic is mainly due to the increase in the ratio between the number of pensions and the number of employees induced by the demographic transition, only partially offset by the increase in the minimum requirements for access to retirement. This increase exceeds the containment of pension amounts due to the gradual application of the system of contributions over the entire working life. Since 2045, the ratio has declined rapidly to 15.6 percent in 2050 and to 13.2 percent in 2070. The rapid reduction in the ratio of pension expenditure to GDP in the last phase of the forecast period is determined by the general application of the contribution-based system, which follows the stabilisation and subsequent reversal of the ratio between the number of pensions and the number of employees. This trend is affected by both the progressive exit of the baby boom generations and the effects of automatic adaptation of minimum retirement requirements in line with life expectancy. In view of the forecasts of the pension system described above, based on the national scenario and useful for assessing medium-term trends, the forecasts up to 2070 of all age-related expenditures (pensions, health, long-term care, social safety nets and education), which are used to assess the sustainability of public finances in Europe, are drawn up on the basis of the scenario recently defined and agreed by the Economic Policy Committee, Working Group on Ageing (EPC-WGA) of the European Council for next 2021 forecast round. As is well known, the three-year forecasting exercise in the EPC-WGA baseline scenario, which incorporates Eurostat24 demographic projections with base year 2019, is aimed at supporting in a coordinated and homogeneous way the analysis of the sustainability of public finance of the various European countries as part of the verification of compliance with the fiscal rules of the Stability and Growth Pact and the processes for formulating the Specific Recommendations issued by the Council for the European Semester. |
together with the Update of the DEF 2019, also revised the forecasts of charges resulting from Articles 14 and 15 of Legislative Decree No. 4/2019, converted by Law No. 26/2019.
24 The Eurostat demographic assumptions, based on 2019, provide for Italy: i) a net flow of immigrants of about 213 average units per year, with a strongly growing profile until 2025 and linearly decreasing thereafter; ii) a level of life expectancy in 2070 equal to 87 years for men and 90.9 years for women; iii) a total fertility rate in 2070 of 1.52.
| 64 | MINISTRY OF ECONOMY AND FINANCE
|
III. NET borrowing AND PUBLIC DEBT
Based on the scenario defined in the EPC-WGA framework for next 2021 round, which assumes, over the foreseeable horizon, a growth rate of real GDP of 1.1 percent per year25, the total age-related public expenditure in relation to GDP increases by about 1.8 percentage points in the period from 2018 to 2030 and by 2.8 percentage points in the period from 2018 to 2042, a year in which the total public expenditure related to ageing reached a peak of 29.6 percent of GDP (Table. R1). This increase is attributable to pension and health expenditure as a whole for around 2 percentage points in the period 2018 to 2030, and around 3.1 percentage points in the period 2018-2042. In fact, with 2018 as a reference year, pension expenditure increases by around 1.5 percentage points in 2030 and 1.9 percentage points in 2042, reaching the highest incidence on GDP of 17.2 percent in 2036. Health expenditure, on the other hand, increases by about 0.5 percentage points of GDP in 2030 and by 1.1 percentage points in 204226.
|
| Table R1: age-related public expenditure projections (pensions, health, LTC, school and social safety nets) as a percentage of GDP – 2021 EPC-WGA baseline scenario | ||||||||||||||
| 2010 | 2015 | 2020 | 2025 | 2030 | 2035 | 2040 | 2045 | 2050 | 2055 | 2060 | 2065 | 2070 | ||
| Pensions | 14.7 | 15.6 | 17.1 | 16.0 | 16.7 | 17.2 | 17.1 | 16.8 | 15.8 | 14.7 | 13.9 | 13.6 | 13.5 | |
| Healthcare | 7.0 | 6.6 | 7.3 | 6.7 | 6.9 | 7.2 | 7.5 | 7.7 | 7.9 | 8.0 | 8.0 | 8.0 | 7.9 | |
| of which: LTC | 0.7 | 0.7 | 0.8 | 0.7 | 0.7 | 0.8 | 0.8 | 0.9 | 1.0 | 1.1 | 1.1 | 1.1 | 1.1 | |
| LTC incl. social assistance | 1.0 | 1.0 | 1.1 | 1.1 | 1.1 | 1.2 | 1.3 | 1.4 | 1.5 | 1.6 | 1.7 | 1.7 | 1.6 | |
| Education | 3.9 | 3.6 | 3.8 | 3.4 | 3.1 | 3.0 | 3.0 | 3.0 | 3.1 | 3.1 | 3.0 | 3.0 | 3.0 | |
| Social safety nets | 0.7 | 0.9 | 2.2 | 0.8 | 0.7 | 0.7 | 0.7 | 0.6 | 0.6 | 0.6 | 0.6 | 0.6 | 0.6 | |
| Total | 27.4 | 27.8 | 31.6 | 27.9 | 28.6 | 29.2 | 29.5 | 29.5 | 28.8 | 27.9 | 27.2 | 26.8 | 26.6 | |
Compared to the maximum levels expected in 2042, the overall incidence of age-related public expenditure relative to GDP is progressively decreasing by 3 percentage points in 2070, thanks to the contribution of pension expenditure which falls by 3.6 percentage points of GDP from 17.1 percent in 2042 to 13.5 percent in 2070. The rapid decline in the ratio of pension expenditure to GDP in the final phase of the forecast period is determined by the general application of the contribution-based system which follows the stabilisation and subsequent reversal of the ratio between the number of pensions and the number of employees. This trend is due both to the automatic adaptation of the minimum retirement requirements according to life expectancy and to the progressive exit of the baby boom generations. Figure R2 presents the forecast of pension expenditure in relation to GDP under unchanged legislation, according to the EPC-WGA Baseline scenario, comparing it with those that would have taken place on the basis of the schemes prior to the main reform actions. Compared to the immediately preceding legislation, the measures contained in Legislative Decree No. 4/2019 converted to Law No. 26/2019, in the Budget Law for 2019 (Law No. 145/2018) and in the Budget Law 2020 (Law No. 160/2019), included in the current legislation |
25 For the period 2020-2023, growth assumptions have been adopted in line with the indications of the trend macroeconomic framework defined for the Update Note to the DEF 2020. For the following period, the structural assumptions of the EPC-WGA scenario adopted for the 2021 Forecast Round were transposed. The employment differences in 2023, comparing the baseline EPC-WGA scenario with the short-term macroeconomic scenario of the Update of the Stability Programme 2020 were progressively zeroed over the next 10 years. As far as productivity dynamics are concerned, the assumptions in the baseline EPC-WGA scenario have been broadly confirmed since 2024.
26On the other hand, over the period 2018-2042, LTC expenditure increased by 0.3 percentage points of GDP, compared with a reduction in education expenditure by 0.5 points and a decrease in expenditure on social shock absorbers by 0.1 percentage points of GDP.
MINISTRY OF ECONOMY AND FINANCE
| 65 |
UPDATE OF THE Economic and Financial Document 2020
scenario, produce, in the period 2019-2035, an increase in the ratio of pension expenditure to GDP equal on average to about 0.2 annual points, with a progressively decreasing profile starting from the first years of forecast, where the most concentrated ratio is. As a result of the overall reform process implemented since 2004, the average retirement age (taking into account both the retirement age and the requirements for early retirement) increases from 60-61 years during the period 2006 to 2010 to 63.3 in2018, to 67 in 2040 and then to around 68 in 2050. Cumulatively, the lower share of expenditure in relation to GDP resulting from the overall reform process launched in 2004 amounts to around 60 percentage points of GDP in 2060.
|
| Figure R2: Public expenditure FOR pensions as a percentage of GDP under different legislation scenarios (EPC-WGA 2021 scenario) | |
Note: In the short term, the EPC-WGA baseline scenario incorporates the indications of the unchanged legislation scenario of the Update of the Stability Programme. Source: Long-term forecasting model of the State General Accounting Department. |
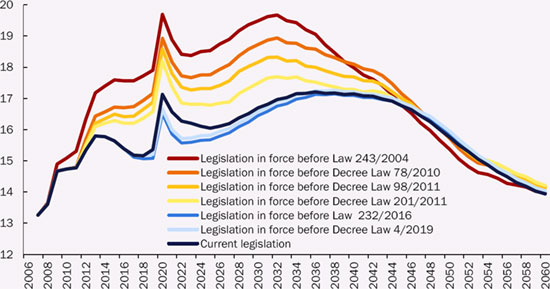
III.2 PUBLIC FINANCE: policy scenario
Budget planning for the coming years
The manoeuvre for the three-year period 2021-2023 is defined in light of the very important novelty of Next Generation EU (NGEU), the package of instruments for the recovery and resilience of the economies of the European Union, equipped with 750 billion for the period 2021-2026, which will strengthen the budget of the European Union with new funding collected on the financial markets. The Fund for Recovery and Resilience (so called Recovery and Resilience Facility, RRF) is one of the pillars of the package, with 672.5 billion in grants and loans aimed to support Member States financially in the early years of the recovery.
In the recent debate within the European institutions, it was confirmed that there was a favourable stance on the desirability of an expansionary fiscal policy in 2021, which seems necessary in order to continue to support economic recovery through policies of stimulus, hopefully selective and temporary. Only when
| 66 | MINISTRY OF ECONOMY AND FINANCE
|
III. NET borrowing AND PUBLIC DEBT
economic conditions return to normal will it be appropriate to return to prudent fiscal policies with a medium-term horizon. Finally, overcoming the recession will make it possible to take measures to improve the fundamentals of the economy and to positively impact the potential output, such as those launched with the European Green New Deal for sustainable growth and digital transition.
The policy framework defined in this document outlines an expansive fiscal policy in the short term, with respect to the unchanged legislation scenario, given the current developments of the epidemic emergency and the hypothesis of a gradual return to normal in the course of 2021, consistent with the guidelines of the European institutions.
Therefore, the Government intends to adopt, with the next Budget Law 2021-2023, fiscal interventions, new policies for the support and development of firms and measures to safeguard employment and to revamp public and private investments, which are an integral part of the National Recovery and Resilience Plan (NRRP) which will be examined by the Italian Parliament and the European institutions. NGEU funds will also allow the use of resources allocated, and in case not still used during the current year, with the measures taken in response to the pandemic crisis. The public finance manoeuvre for 2021-2023 also provides for the financing of unchanged policies not covered by current legislation for about two tenths of a point of GDP, including peace missions, refinancing of some investment funds, business crisis fund, etc., and the renewal of some policies close to expire.
With a view to stimulating fiscal policy growth, but taking into account the need to reverse Italy’s debt-to-GDP ratio over the medium term, the Government sets the nominal net borrowing objective at 7.0 percent of GDP for 2021 and 4.7 percent of GDP in 2022 and decides to bring this policy objective back to the 3.0 percent threshold in 2023. The impact of the manoeuvre on net borrowing, which can be assessed by comparing the policy objectives with the deficit forecasts under unchanged legislation, will be expansive over the next two years, and will be 1.3 percentage points of GDP in 2021 and 0.6 percentage points of GDP in 2022 respectively. In 2023, instead, there will be a fiscal restriction of approximately 0.3 percentage points compared to the unchanged legislation scenario.
The policy path outlined envisages a slight decline in interest expenditure, which will reach 3.1 percent at the end of the forecast period, and the gradual decline in the primary deficit, until a primary surplus of about 0.1 percentage points of GDP in 2023.
Taking into account the estimated output gap that closes more rapidly over the three-year forecast, although the dynamics of potential GDP is more favourable, this would lead to an improvement in the structural balance in 2021 (approximately 0.8 percentage points). For the two-year period 2022-2023 there is a growing structural improvement, with a final level of the structural balance of 3.5 percent of GDP in 2023. The Government confirms its commitment to reach the MTO in the following years.
The resources for financing the interventions provided for in the budgetary manoeuvre for 2021-2023 will be provided by the following areas of action:
| • | the re-ordering of some investment funds and the launching of a programme to review and retrain the general government expenditure ; |
| • | the revision of some environmentally harmful subsidies; |
MINISTRY OF ECONOMY AND FINANCE
| 67 |
UPDATE OF THE Economic and Financial Document 2020
| • | increases in revenue from improved compliance, also related to the incentive for the use of electronic payment instruments; |
| • | additional revenue from the higher growth generated by the investment programme described; this second-round fiscal effect is conservatively included in the estimates only from 2022, also in order to take into account the time lags with which revenues respond to growth in the economic activity; |
| • | use of the resources provided by the NGEU package, including those from the React-EU, Rural Development and RRF funds. For the latter it is envisaged the full use of the grants available for our country, and a use of the loans compatible with the achievement of the budget targets. It is stressed that subsidies provide a fiscal stimulus but are at the same time neutral from the point of view of budget balances. |
The new policy objective for 2021 is higher than the level of net borrowing authorised by Parliament with the approval of the latest Report pursuant to L. No. 243/2022 of 22 July27. In the Stability Programme 2020 (SP), in fact, the policy path for the three-year period 2021-2023 has not been updated, but a simplified framework has been provided for the years 2020 and 2021, in line with the information requested by the European Commission. The deficit forecast for 2021 of April, including the new policies adopted is 5.7 percent28, while the higher deficit for 2021 authorised at the end of July is about 0.4 percentage points of GDP. Therefore, the new policy objective of 7.0 percent of GDP is higher than the authorised deficit.
Similarly, the new target for 2022 is higher than the previous target, which can be computed starting from the objective of -1.4 percent of GDP of the Update of the DEF 2019 and adding to this estimate the additional overall net borrowing authorised by Parliament throughout the current year.
As represented in the Report that the Government is preparing to send to Parliament, the changes made to the deficit convergence path are motivated by the stimulus measures necessary to support economic recovery, including through the use of financial instruments introduced at European level in response to the epidemic crisis. In the above described context, the Italian Government confirms that the objective of improving the structural balance in the medium term remains a priority.
27 It is recalled that through the Report, the Government requested a recourse to new net borrowing of 25 billion in 2020, 6.1 billion in 2021, 1 billion in 2022, 6.2 billion in 2023, 5 billion in 2024, 3.3 billion in 2025 and 1.7 billion from 2026.
28 In April, in addition to the forecasts under unchanged legislation for 2020 and 2021, also the forecasts inclusive of the expected impact of the announced new policies were provided, which would be introduced by the Relaunch decree in May.
| 68 | MINISTRY OF ECONOMY AND FINANCE
|
III. NET borrowing AND PUBLIC DEBT
| table III.2: Summary of PUBLIC FINANCe under the policy scenario (as a percentage of GDP) (1) | ||||||
| 2019 | 2020 | 2021 | 2022 | 2023 | ||
| NET BORROWING | (Update of the SP) | -1.6 | -10.8 | -7.0 | -4.7 | -3.0 |
| (SP 2020) | -1.6 | -10.4 | -5.7 | - | - | |
| INTEREST EXPENDITURE | (Update of the SP) | 3.4 | 3.5 | 3.3 | 3.1 | 3.1 |
| (SP 2020) | 3.4 | 3.7 | 3.7 | - | - | |
| PRIMARY BALANCE | (Update of the SP) | 1.8 | -7.3 | -3.7 | -1.6 | 0.1 |
| (SP 2020) | 1.7 | -6.8 | -2.0 | - | - | |
| STRUCTURAL NET BORROWING (2) | (Update of the SP) | -1.9 | -6.4 | -5.7 | -4.7 | -3.5 |
| (SP 2020) | - | - | - | - | - | |
| Debt (gross of support)(3) | (Update of the DEF) | 134.6 | 158.0 | 155.6 | 153.4 | 151.5 |
| (DEF 2020) | 134.8 | 155.7 | 152.7 | |||
| Debt (net of support) (3) | (Update of the SP) | 131.4 | 154.5 | 152.3 | 150.3 | 148.6 |
| (SP 2020) | 131.6 | 152.3 | 149.4 | |||
| PUBLIC SECTOR BALANCE | (Update of the SP) | -2.2 | -11.8 | -8.2 | -5.1 | -3.3 |
| (SP 2020) | - | - | - | - | - | |
| STATE SECTOR BALANCE | (Update of the SP) | -2.3 | -11.8 | -8.3 | -5.2 | -3.4 |
| (SP 2020) | - | - | - | - | - | |
1) The forecasts of the Stability Programme 2020 refer to the scenario with new policies announced by the Government and not yet adopted at the time of presentation of the document, including the financial impact of the decrees Cura Italia, Liquidity and Relaunch. 2) Net of one-off measures and cyclical components. 3) Gross or net of Italy’s shares of loans to EMU Member States, whether bilateral or through the EFSF, and the contribution to the capital of the ESM. At the end of 2019, the amount of these allowances amounted to approximately 57.8 billion, of which 43.5 billion for bilateral loans and through the EFSF and 14.3 billion for the ESM programme. | ||||||
Results achieved in terms of structural balance and expenditure rule
2019 at the end of the year
The Stability and Growth Pact (SGP) requires countries that have not yet reached the medium-term budgetary objective (MTO) to plan an improvement in budgetary position in structural terms to ensure convergence; this is preferably through the control of public primary expenditure, as indicated by the expenditure rule29.
Overall, Italy’s budgetary outcomes in 2019 essentially complied with the rules of the preventive arm of the SGP, as also confirmed in the assessment of the 2020 Stability Programme (SP) carried out by the Commission and published on 20 May30. The new estimates for 2019, certified by ISTAT in its release of 22 September and by the new Macroeconomic Framework, confirm31 this result. It has also to be recalled that, in its assessment of SP 2020, the Commission definitively accepted the Italian Government’s request to benefit from a temporary deviation to the fiscal adjustment required in 2019 so as to cover exceptional expenditure
29 Together with the achievement of the medium-term budgetary objective, there is also the constraint posed by the expenditure rule.
30 European Commission, Assessment of the 2020 Stability Programme for Italy, https://ec.europa.eu/info/sites/info/files/economy-finance/it_assessment_of_2020_sp.pdf.
31 The revision of the output gap estimates also covers the years 2018 and 2019. It is recalled that, for factors related to the official methodology of estimating the potential product, the size of the estimated output gap used to correct the nominal balance for the so-called cyclical adjustment is subject to change/revision not only for the forecast years but also for the previous years.
MINISTRY OF ECONOMY AND FINANCE
| 69 |
UPDATE OF THE Economic and Financial Document 2020
of 0.18 percent of GDP32. In 2019 the structural adjustment required by the European fiscal framework was therefore 0.42 percentage points of GDP.
Based on the new consolidated data and using the structural correction updated with the latest government output gap forecast, the structural deficit is estimated to fall from 2.3 percent in 2018 to 1.9 percent of GDP in 2019 in the policy scenario. The structural balance achieved in 2019 thus improved by 0.42 percentage points. According to the annual criterion there was, therefore, full compliance, while the biennial criterion signals a not significant deviation. The figures for 2019 also confirm compliance with the expenditure rule on an annual basis, while the deviation is significant when considering the average for the years 2018 and 201933.
The 2020 emergency and the new European reference context
The epidemic emergency that broke out in the first months of 2020 forced the Government to halt the promising tendency towards a reduction of the budget deficit, which had occurred in 2019. Indeed, the Government had to meet the exceptional expenditure required to cope with the pandemic and to mitigate the recessionary effects of the consequent economic crisis.
As it has already been mentioned, since March 2020 the Government has asked Parliament three times for the authorisation to temporarily depart from the convergence path towards to the medium-term budgetary objective (MTO). The authorisations were granted precisely because of the exceptional events that the Country faced, as provided for in Article 6 of Law No. 243/201234.
The measures implemented by Italy are among the largest at European level, and have allowed to safeguard the production capacity of the country and to contain the economic and social effects caused by the pandemic. The total resources allocated during 2020 to respond to the emergency amount to EUR 100 billion in terms of higher deficit, equivalent to 6.1 percentage points of GDP. The Government estimates that the deficit for the current year will be at 10.8 percent of GDP.
32 As reported by the Ministry of Economy, the extraordinary interventions that benefit from the clause amount to 0.11 percentage points for road maintenance and 0.07 percentage points for hydrogeological risks.
33 In the country-specific recommendations adopted in July 2018, the Commission and the Council also asked to ensure that the nominal growth rate of primary public expenditure net of: - interest expenditure, expenditure related to Union programmes entirely covered by revenue from Union funds and non-discretionary changes in expenditure on unemployment benefits - did not exceed 0.1 percent in 2019, corresponding to a structural adjustment of 0.6 percentage points of GDP. As a result of the flexibility clause which reduced the required fiscal adjustment, the relevant expenditure aggregate should have increased in nominal terms to a limit of 0.5 percent. See, Council of the European Union, Council Recommendation of 13 July 2018 on Italy’s National Reform Programme 2018 and delivering an opinion of the Council on Italy’s Stability Programme 2018 https://eur-lex.europa.eu/legal-content/IT/TXT/PDF/?uri=CELEX:32018H0910(11)&from=EN
34 The first authorisation was requested by the Government on March 5, 2020, with subsequent integration on March 11, and allowed the issuing of the first decree law that allocated significant resources to deal with the emergency (D.L. No. 18/2020, so-called “Cura Italia”). The second authorisation was submitted on 24 April 2020. Voted by an absolute majority, it allowed the Government to approve D.L. No. 34/2020 (so-called “Relaunch”).The effects on public finances of these deviations were already incorporated into DEF 2020. Finally, on 22 July the Government submitted its third report to the Parliament, through which it requested authorisation to increase debt in order to finance the measures detailed in Legislative Decree No. 104/2020.
| 70 | MINISTRY OF ECONOMY AND FINANCE
|
III. NET borrowing AND PUBLIC DEBT
The above public finance decisions ought to be considered in line with the modified European reference framework. In March the Commission and the Council agreed on the need to activate the general escape clause contained in the Treaty. This allowed Member States to temporarily deviate from their path towards the MTO, provided that the medium-term fiscal sustainability was not compromised. The Commission has repeatedly stressed that the clause does not suspend the application of the SGP or the European Semester procedures for fiscal surveillance. For the purpose of monitoring the relevant variables, the measures adopted in 2020 to support the healthcare system and the economy will be classified as structural measures rather than one-offs, thus hinging on the structural budget balance35.
In its evaluation of the SP 202036, the Commission considered the measures adopted by Italy in line with the guidelines set out in its Communication for a coordinated economic response to the covid-19 outbreak37. Although the judgement is based on the measures approved by the Government until April, these have been considered timely, temporary and aimed at mitigating the shock induced by the pandemic. In the document, the Commission concludes that the full implementation of the measures adopted so far, to be followed – when economic conditions allow – by a re-orientation of fiscal policies towards prudent medium-term budgetary positions will contribute to preserving the sustainability of public finances.
On 20 May the Commission published its report in accordance with Article 126(3) of the Treaty on the Functioning of the European Union (TFEU)38. The report was prepared to analyse the conformity of the budgetary planning of Italy and all European countries with the deficit and debt criteria laid down in the Treaty39. For Italy, as for most European countries, the deficit objective of 2020 reported in the SP 2020 is well above the 3 percent of GDP threshold value set by the Treaty and, although exceptional, is not to be considered temporary. This is
35 For more details see Focus: “The General Escape Clause of the Stability and Growth Pact", contained in the Economics and Finance Document 2020.For an update see the Focus “Activation of the General Safeguard Clause of the Stability and Growth Pact” to follow.
36 European Commission, Assessment of the 2020 Stability Programme for Italy, https://ec.europa.eu/info/sites/info/files/economy-finance/it_assessment_of_2020_sp.pdf
37 European Commission, ‘Communication from the Commission to the European Parliament, the European Council, the Council, the European Central Bank, the European Investment Bank and the Eurogroup, coordinated economic response to the covid-19 Outbreak’, 13 March 2020, https://ec.europa.eu/info/sites/info/files/communication-coordinated-economic-response-covid19-march-2020_en.pdf
38 European Commission, ‘Report prepared pursuant to Article 126(3) of the Treaty on the Functioning of the European Union’, COM(2020) 535/final, https://eur-lex.europa.eu/legal-content/IT/TXT/PDF/?uri=CELEX:52020DC0535&from=IT
39 The Commission has carried out an in-depth analysis of the budgetary planning of all euro area Member States except Romania, which is subject to the corrective arm. On 20 May 2020, the Commission published reports pursuant to Article 126(3) of the Treaty for Austria, Belgium, Bulgaria, Croatia, Cyprus, the Czech Republic, Denmark, Estonia, Finland, France, Germany, Greece, Ireland, Italy, Latvia, Lithuania, Luxembourg, Malta, the Netherlands, Poland, Portugal, Slovakia, Slovenia, Spain, Sweden and the United Kingdom. For these countries, the Commission verified compliance with the deficit criterion for the year 2020. In the case of France, Belgium, Cyprus, Greece, Italy and Spain, compliance with the debt reduction criterion for the year 2019 was also assessed on the basis of consolidated fiscal data.
MINISTRY OF ECONOMY AND FINANCE
| 71 |
UPDATE OF THE Economic and Financial Document 2020
prima facie evidence of the existence of an excessive deficit. On the other hand, the pandemic and the deep recession caused by containment measures are a mitigating factor when assessing the compliance with the deficit criterion in 2020. Another mitigating factor is Italy’s progress in the implementation of policies in line with the country-specific recommendations of July 2019. On the contrary, the relevant factors that the Government put forward for justifying its non-compliance with the debt rule, although presented in the Commission’s report40, could not be formally taken into account in the formulation of the decision on the existence of an excessive deficit41. In conclusion, the analysis suggests that the deficit criterion as defined in the Treaty and Regulation (EC) No. 1467/1997 is not met42.
Nevertheless, in its communication on country-specific recommendations43, the Commission concluded that, at this juncture, a decision on whether to place a Member State under excessive deficit procedure (EDP) should not be taken. In fact, the outbreak of the pandemic has produced macroeconomic and fiscal impacts difficult to quantify, also because it is still in progress. This uncertainty prevented the establishment of a credible path for fiscal policy. The situation in each Member State would have been revised on the basis of the autumn forecasts and the Draft Budgetary Plans (DBP).The recommendations remained to shape fiscal planning in support of the economy, while ensuring the sustainability of public debt and correcting the excessive deficit whenever possible.
40 Ministry of Economy and Finance, Relevant Factors Influencing Public Debt Developments in Italy, http://www.dt.mef.gov.it/modules/documenti_it/analisi_progammazione/documenti_programmatici/ITA_Relevant_Factors_May_2020_FIN_PUB.pdf
41 As required by Article 2(4) of Regulation (EC) No. 1467/97, the relevant factors cannot be taken into account as the government debt-to-GDP ratio exceeds the reference value of 60 percent and the net debt does not meet the double condition that (i) the government deficit remains close to the 3 percent reference value and (ii) the above threshold is temporary.
42 In its latest report, the European Fiscal Board (EFB) intervened by considering the legislation already present in the Treaties. European Fiscal Board, Assessment of the fiscal stance appropriate for the euro area in 2021, 1 July 2020, https://ec.europa.eu/info/publications/assessment-fiscal-stance-appropriate-euro-area_en. The EFB recalls that Regulation EC No. 1467/97 in Article 2(1) states that a deficit exceeding 3 percent of GDP is considered exceptional in the event of a serious economic downturn. Furthermore, the excess over the reference value is considered temporary if the Commission’s budgetary forecasts indicates that the deficit will fall below the reference value after the end of the severe economic downturn. With regard to the assessment and decision on the existence of an excessive deficit within the meaning of Article 126(3) of the Treaty, Article 2(2) states that the Commission and the Council may exceptionally consider exceeding the reference value resulting from a severe economic recession if this overrun results from a negative growth in the volume of GDP or from an accumulated loss of output during a prolonged period of very low annual GDP volume growth compared to potential. As the European Fiscal Council points out, it is therefore crucial to understand when to mark the end of the serious economic recession in order to restore normal judgment on compliance with the SGP rules. Lastly, it is important the EFB’s observation that the activation of the general clause was justified by an economic recession at European level, while the requirements of the SGP are defined and applied country by country. The EFB concludes that the flexibility of the general clause should be applied taking into account the country-specific characteristics of each country.
43 European Commission, Communication from the Commission to the European Parliament, the European Council, the Council, the European Central Bank, the European Economic and Social Committee, the Committee of the Regions and the European Investment Bank, 2020 European Semester: Country-specific recommendations, https://ec.europa.eu/info/sites/info/files/2020-european-semester-csr-comm-recommendation-communication_en.pdf
| 72 | MINISTRY OF ECONOMY AND FINANCE
|
III. NET borrowing AND PUBLIC DEBT
The most recent recommendations44 to Italy adopted by the Council on 22 July on a proposal from the Commission move in this direction. In its fiscal planning for 2020 and 2021, Italy is encouraged to take all the necessary measures to stimulate economic recovery, strengthen the capacity of the health system while improving the coordination between national and regional authorities.
| | The activation of the general escape clause of the Stability and Growth Pact On 20 March 2020, the Commission put forward a proposal45 to activate the general safeguard clause of the Stability and Growth Pact (SGP)46 in order to ensure the necessary fiscal coordination to cope with the severe economic recession caused by the outbreak of the covid-19 pandemic47. A few days later, on 23 March, the Finance Ministers of the Member States publicly supported the Commission’s assessment and expressed their support for the activation of the clause. According to the Council, the use of the clause ensures the budgetary flexibility needed to adopt policies in support of the health and economic system, through discretionary stimulus measures that must be timely, temporary and focused on dealing with the emergency48. The activation of the clause does not suspend the SGP procedures but allows a temporary deviation from the fiscal adjustment path towards the medium-term budgetary objective, facilitating the adoption of coordinated measures at European level. In its Communication on the Annual Sustainable Growth Strategy 2021 of 17 September, the Commission urges to maintain the general safeguard clause49. Member States should pursue targeted and temporary support policies in 2021, while preserving medium-term fiscal sustainability. The Commission also calls for a gradual shift from emergency responses to measures to support economic recovery. During the discussions held at Eurogroup and ECOFIN on 11 and 12 September, Member States shared the Commission’s vision. The Commission was thus able to give its guidelines on the appropriate fiscal policy orientation for 202150. In the letters sent by the Executive |
44 Council of the European Union, Recommendation for a Council Recommendation on the 2020 National Reform Programme of Italy and delivering a Council opinion on the 2020 Stability Programme of Italy, https://data.consilium.europa.eu/doc/document/ST-8431-2020-COR-1/en/pdf.
45 European Commission, COMMUNICATION FROM THE COMMISSION TO THE COUNCIL on the activation of the general escape clause of the Stability and Growth Pact, 20.3.2020 COM(2020) 123 final: https://ec.europa.eu/info/sites/info/files/economy-finance/2_en_act_part1_v3-adopted_text.pdf.
46 As referred to in Articles 5(1), 6(3), 9(1) and 10(3) of Regulation (EC) No. 1466/97 and 3(5) and 5(2) of Regulation (EC) No. 1467/97.
47 The general escape clause was introduced during the review of the Six-Pack fiscal discipline in 2011. Regulation No.1466/97 governing the preventive arm of the SGP states that in periods of severe economic downturn for the euro area or the Union as a whole, Member States may be allowed to deviate temporarily from the adjustment path to the medium-term budgetary objective, provided that this does not jeopardise fiscal sustainability. Regulation No. 1467/97, which disciplines the corrective arm of the SGP, stipulates that in the event of a severe economic recession in the euro area or in the Union as a whole, the Council may decide, on the basis of a Commission’s recommendation, to adopt a review of the deficit adjustment path below the 3 percent threshold for a Member State which is already in excessive deficit proceedings.
48 European Council, press release 23 March 2020, https://www.consilium.europa.eu/it/press/press-releases/2020/03/23/statement-of-eu-ministers-of-finance-on-the-stability-and-growth-pact-in-light-of-the-covid-19-crisis/.
49 European Commission, Communication from the Commission to the European Parliament, the European Council, the Council, the European Central Bank, the European Economic and Social Committee, the Committee of the Regions and the European Investment Bank, “Annual Sustainable Growth Strategy 2021”, https://eur-lex.europa.eu/legal-content/IT/TXT/PDF/?uri=CELEX:52020DC0575&from=en, p. 9.
50 The Commission’s letters to each Member State on the preparation of DBP 2021 are available at: https://ec.europa.eu/info/business-economy-euro/economic-and-fiscal-policy-coordination/eu-economic-overnance-monitoring-prevention-correction/stability-and-growth-pact/applying-rules-stability-and-growth-pact_en
MINISTRY OF ECONOMY AND FINANCE
| 73 |
UPDATE OF THE Economic and Financial Document 2020
Vice-President of the Commission Dombrovskis and Commissioner Gentiloni on 19 September to the Ministers of Economy, the Commission takes stocks of the persistent uncertainty about the development of the pandemic and the socio-economic consequences confirming that the priority rest in supporting the economy. The general escape clause will therefore remain active in 2021. In spring 2021, on the basis of the Commission’s updated forecasts, the situation will be reassessed and an initial assessment of the application of the clause will be made. |
The Commission provided fiscal policy guidance for 2021 and the years to follow in the context of the presentation of the Recovery Plans51. First, it has been ensured that the general escape clause will remain active also in 2021. It is recommended a gradual transition from temporary emergency measures to measures that facilitate the reallocation of resources and ensure adequate support to economic recovery; in addition, support to the economy will have to be tailored upon the specific conditions of each country. Finally, Member States are once again called upon, as soon as economic conditions permit, to orientate fiscal policy towards prudent fiscal positions over the medium term.
Under the new European policy coordination, Member States can send a first draft of their National Recovery and Resilience Plans from 15 October onwards. The plans will contain the pillars of the reforms that the Government intends to implement and a first planning of interventions for 2021. The presentation of the NRRPs draft should preferably take place jointly with the submission of DBPs. In assessing the budget planning presented in the DBPs, the Commission will pay particular attention to the quality of expenditure. The final version of the NRRPs is due by April 2021.
In the more general context of the European Semester, the country-specific recommendations adopted in 2020 will continue to be valid with the exception of the fiscal recommendations. These, presumably, will contain further fiscal policy guidelines on how to exit from the general escape clause with a view to restoring the binding aspects of fiscal surveillance52.
It is not yet clear whether we will converge towards the “old” system of rules linked to the Stability and Growth Pact or whether, in the meantime, the fiscal framework will be revised. Nevertheless, the forthcoming fiscal recommendation is expected to draw some light on how to achieve a prudent fiscal position in the medium term. Given that, the Italian Government has already embraced this approach within the new policy scenario of public finance, establishing a descending profile of the debt-to-GDP ratio.
In this context, the calculation of the change in the structural balance and in the expenditure aggregate relevant to the expenditure rule will be carried out
51 Commission guidance for Italy on fiscal policy orientations for 2021, https://ec.europa.eu/info/sites/info/files/economy-finance/it_0.pdf
52 As the PBO points out in its Report on Budget Planning 2020 in July 2020, the Commission and Council have clarified in their official communications that once the general escape clause expires, Member States will have to resume their structural adjustment path towards the MTO as indicated by the SGP. In particular, Member States will have to achieve a budget deficit below the 3 percent of GDP.
| 74 | MINISTRY OF ECONOMY AND FINANCE
|
III. NET borrowing AND PUBLIC DEBT
anyway. In addition to the forecasts of the above-mentioned policy scenario, the estimates here presented rely on the output gap projections developed according to the consolidated methodology of the production function53.
The quantification of the fiscal balances starting from 2020 according to the metric in force
Tables III.3 and III.4 illustrate the updated estimates of the variables relevant for fiscal surveillance.
The structural deficit in 2020 is estimated to worsen by about 4.5 percent of GDP, reaching 6.4 percent of GDP. The primary structural deficit would amount to 2.8 percent of GDP. This is the result of several factors. In 2020, the cyclical component of the balance equals 4.6 percentage points due to a largely negative output gap. Albeit significant, the cyclical correction only partially offsets the deterioration in the nominal deficit relative to GDP, which is estimated at around 9.2 percentage points. The deficit, in fact, should increase from -1.6 percent in 2019 to -10.8 percent of GDP in 2020, also due to the emergency measures adopted to deal with the pandemic and its side effects on the economy54.
In 2021 the cyclical correction is smaller due to the partial closure of the output gap. However, the structural deficit improves by 0.7 percentage points to 5.7 percent of GDP, as the deficit is set at 7 percent in the policy scenario.
The change in structural balances continues to follow the pattern expected in the Stability Program 2020, which contained an initial estimate for the period 2020-2021. In particular, there is a marked expansion of the deficit in the current year, followed by a first reduction in the following year.
In the year 2021 the structural balance improvement with respect to 2020 is smaller than what envisaged in the scenario based on unchanged legislation, due to the supportive measures currently planned for next year. It should be borne in mind that these measures, although classified as structural, are essentially temporary in nature and do not prolong their effects on subsequent years. In any case, although there is no need to converge towards the medium-term budgetary objective over the period 2020-2021 being in effect the general escape clause, the change in the structural balance is substantive and in line with the SGP requirements.
It is fair to draw the attention on the high degree of uncertainty embedded in the estimates of the underlying macroeconomic scenario and the output gap projections. It is therefore reasonable the intent of the Commission to prioritise a qualitative assessment of compliance until the end of 2021.
For the two-year period following 2021 public finance projections are substantially compliant with the rules of the SGP55. The years 2022 and 2023 are
53 See focus “Estimating potential GDP at the time of the pandemic”.
54 As already mentioned, the expenditure component incurred to deal with the pandemic emergency is classified as structural (although it is temporary) and contributes significantly to the final balance.
55 As shown in Table III.4, as early as 2021 the public finance path would be in line with the tax adjustment to the MTO required by the cyclical conditions matrix, at least in the annual criterion; while in 2022 it would be consistent with both the annual and biennial criteria. As regards the expenditure rule, in 2021 Italy would respect the annual expenditure limit, while in 2022 it would be fully consistent with the requirements of the European
MINISTRY OF ECONOMY AND FINANCE
| 75 |
UPDATE OF THE Economic and Financial Document 2020
characterised by limited emergency interventions linked to the epidemic and, on the other hand, by the full display of the economic effects on growth of investments financed with the funds allocated at European level. As explained above, these interventions will affect budgetary balance - and therefore the adjustment path towards the MTO and the compliance with the expenditure rule- only for the component financed by loans. In addition, the output gap almost closes in 2022 (-0.2 percent of potential GDP) and it records a positive actual-potential product differential in 2023.
In 2022, the correction of the structural balance will be 0.9 percentage points of GDP. At the end of 2023, the convergence of the nominal deficit towards the SGP reference threshold of 3 percent of GDP will allow the structural deficit to fall to 3.5 percent of GDP, with an improvement of as much as 1.2 percentage points, despite the ‘unfavourable’ correction for the cyclical component.
In terms of expenditure rule, a negative rate of growth is expected in nominal terms in both years 2022-2023, confirming the full compliance with both the annual and biennial criteria.
| TABLE III.3: cyclically- adjusted PUBLIC FINANCe (as a percentage of GDP) | ||||||
| 2018 | 2019 | 2020 | 2021 | 2022 | 2023 | |
| 1. Growth rate of GDP at constant prices | 0.9 | 0.3 | -9.0 | 6.0 | 3.8 | 2.5 |
| 2. Net borrowing | -2.2 | -1.6 | -10.8 | -7.0 | -4.7 | -3.0 |
| 3. Interest expenditure | 3.6 | 3.4 | 3.5 | 3.3 | 3.1 | 3.1 |
| 4. One-off measures (1) | 0.1 | 0.1 | 0.2 | 0.2 | 0.2 | 0.1 |
| Of which: Revenue measures | 0.2 | 0.1 | 0.2 | 0.2 | 0.2 | 0.0 |
| Expenditure measures | -0.1 | -0.1 | 0.0 | 0.0 | 0.0 | 0.0 |
| 5. Potential GDP growth rate | -0.2 | -0.1 | -0.2 | -0.1 | 1.0 | 1.3 |
| Factor contribution to potential growth: | ||||||
| Labour | -0.6 | -0.7 | -0.6 | -0.8 | 0.2 | 0.4 |
| Capital | 0.0 | 0.0 | -0.2 | 0.0 | 0.1 | 0.2 |
| Total factor productivity | 0.4 | 0.6 | 0.7 | 0.7 | 0.7 | 0.6 |
| 6. Output gap | -0.1 | 0.4 | -8.5 | -2.9 | -0.2 | 0.9 |
| 7. Cyclical component of the budget balance | 0.0 | 0.2 | -4.6 | -1.6 | -0.1 | 0.5 |
| 8. Cyclically-adjusted balance | -2.2 | -1.8 | -6.2 | -5.4 | -4.6 | -3.5 |
| 9. Cyclically-adjusted primary surplus | 1.5 | 1.6 | -2.7 | -2.1 | -1.4 | -0.4 |
| 10. Structural balance (2) | -2.3 | -1.9 | -6.4 | -5.7 | -4.7 | -3.5 |
| 11. Structural primary surplus (2) | 1.4 | 1.5 | -2.8 | -2.4 | -1.6 | -0.5 |
| 12. Change in structural balance | -0.5 | 0.4 | -4.5 | 0.7 | 0.9 | 1.2 |
| 13. Change in structural primary surplus | -0.6 | 0.1 | -4.4 | 0.5 | 0.7 | 1.1 |
| Note: Any inaccuracies result from rounding. | ||||||
| (1) The positive sign indicates one-off deficit reducing measures. | ||||||
| (2) Cyclically-adjusted and net of one-off and other temporary measures. | ||||||
framework. It is interesting to note that the rule-relevant expenditure aggregate increases in real terms by 10 percent in 2020, while it decreases by almost 4 percentage points in 2021.This would signal fiscal consolidation as the expenditure growth rate is lower than the average potential growth rate (of 0.2 in the Commission’s estimates). If, however, the expenditure measures adopted in 2020 to deal with the pandemic were not taken into account in the relevant expenditure aggregate, expenditure would be increased in 2021 thanks to interventions aimed at supporting growth.
| 76 | MINISTRY OF ECONOMY AND FINANCE
|
III. NET borrowing AND PUBLIC DEBT
| TABLE III.4: SIGNIFICANT DEVIATIONS | ||||||
| Convergence of the structural balance towards the MTO | 2018* | 2019 | 2020 | 2021 | ||
Policy scenario | Unchanged legislation | |||||
| Net borrowing | -2.19 | -1.60 | -10.81 | -7.00 | -5.69 | |
| Medium-Term Objective (MTO) | 0.00 | 0.00 | 0.50 | 0.50 | 0.50 | |
| Structural balance | -2.27 | -1.85 | -6.38 | -5.65 | -4.19 | |
| Annual change in the structural balance | -0.09 | 0.42 | -4.52 | 0.72 | 2.37 | |
| Required change in the structural balance | 0.30 | 0.43 | -0.20 | 0.50 | 0.25 | |
| Deviation of the structural balance from the required annual change (<0,5 p.p.) | -0.39 | 0.00 | -4.32 | 0.22 | 2.12 | |
| Average change in the structural balance (over two years) | 0.17 | -2.05 | -1.90 | -1.08 | ||
| Average variation required | 0.36 | 0.11 | 0.15 | 0.03 | ||
| Deviation of the structural balance from the required average change (<0,25 p.p.) | -0.20 | -2.16 | -2.05 | -1.11 | ||
| Expenditure rule | 2018 | 2019 | 2020 | 2021 | ||
| Policy scenario | Unchanged legislation | |||||
| Growth rate of reference expenditure aggregate (**) (%) | 1.85 | 1.45 | 11.20 | -2.93 | -5.46 | |
| Benchmark based on prevailing cyclic conditions (**) (%) | 0.50 | 0.50 | 1.70 | 0.16 | 0.72 | |
| Deviation of the expenditure aggregate from the required annual change (<0,5 p.p.) | -0.66 | -0.42 | -4.64 | 1.58 | 3.18 | |
| Deviation of the expenditure aggregate from the average change required over 2 years (<0,25 p.p.) | -0.48 | -0.54 | -2.53 | -1.53 | -0.75 | |
(*) In 2018 the required variation was 0.3 due to the use of margin of discretion. The variation and deviation data are frozen in accordance with the procedure used by the European Commission. (**) In nominal terms as of 2018. | ||||||
| TABLE III.5: FLEXIBILITY GRANTED TO ITALY IN THE STABILITY PACT | |||||
| 2017 | 2018 | 2019 | 2020 | 2021 | |
| Output gap (% of potential GDP) | -1.20 | -0.08 | 0.35 | -8.47 | -2.89 |
| Cyclic conditions | Normal | Normal | Normal | Exceptionally negative | Negative |
| Estimated adjustment on the basis of cyclical conditions and debt level (p.p. of GDP) | 0.60 | 0.60 | 0.60 | 0.00 | 0.50 |
| Flexibility granted (p.p. of GDP) of which: | 0.39 | 0.00 | 0.18 | 0.20 | 0.00 |
| for the activation of the flexibility clauses: | |||||
| structural reforms | 0.00 | 0.00 | 0.00 | 0.00 | 0.00 |
| investments | 0.00 | 0.00 | 0.00 | 0.00 | 0.00 |
| for activation of unusual event clauses: | |||||
| refugees | 0.16 | 0.00 | 0.00 | 0.00 | 0.00 |
| costs of safeguarding and securing the territory | 0.19 | 0.00 | 0.18 | 0.20 | 0.00 |
| Estimated modified adjustment for flexibility and unusual event clauses (p.p. of GDP) | 0.21 | 0.60 | 0.43 | -0.20 | 0.50 |
| Margin of discretion | 0.30 | ||||
| Note: Any inaccuracies result from rounding. In accordance with the calculation procedures established by the European Commission, for 2017 the calculation of the flexibility granted takes into account the structural balance at t-1, the distance from the MTO and the clauses granted over the last three years, being more favourable than the simple sum of the clauses granted for the same year. | |||||
MINISTRY OF ECONOMY AND FINANCE
| 77 |
UPDATE OF THE Economic and Financial Document 2020
| | Estimating potential GDP at the time of the pandemic
The estimate of potential GDP of the European Commission of Spring 2020
As early as on the occasion of the publication of the Spring 2020 Forecast, several international institutions and major private forecasters had observed that the economic crisis prompted by the covid-19 pandemic would have a more severe impact on GDP than the recession caused by the US financial collapse of 2007 and the resulting international spreads between 2009 and 2012. The greater intensity of the recession compared to previous episodes is closely linked to the enforced supply restriction measures that “forcibly” engendered a contraction in industrial production and service delivery. The assessment of the intensity and duration of the impact of the crisis on demand and the possible permanent effects on trend growth is a different matter. Certainly, the policy response has played a decisive role in these aspects, as – contrary to past episodes of recession – it was enacted in a quick and decisive manner. Intervention was aimed at containing the short-term fall in economic activity and avoiding the occurrence of hysteresis effects (which would result in the extension of adverse outcomes on economic growth). It must also be borne in mind that, at least in the case of the European Union, the policies of the coming years intend to vigorously sustain recovery in a context of profound reconversion of the economy. Potential output projections (and consequent output gap estimates) by the European Commission play a very important role for macroeconomic and fiscal surveillance. It is therefore important to have available estimates which, while taking into account the deep fall in 2020 and the partial rebound expected for 2021, provide a “balanced” medium-term growth perspective. When estimating potential GDP, starting from the short-term forecasts in the Spring Forecast of last May 2020, the Commission realised that the preliminary projections produced by the statistical filters built into the Commonly-Agreed Methodology56 indicated that the output gap was too small when considering the intensity of the recession, and provided an overly pessimistic view of medium-term growth prospects. In the light of the above considerations, the Commission deemed it appropriate to operate a few adjustments aimed at widening the cyclical component estimated by the statistical filters while bringing the potential GDP trend component back to a path not too far from its pre-crisis projection. The innovations introduced concern57: the estimation of the trend of hours worked per employee; the construction for the year 2020 of the capacity utilisation composite indicator (CUBS) for the estimation of the trend of the Total Factor Productivity (TFP); the estimate of the potential unemployment rate (equivalent to the NAWRU in the European methodology). On the first point, in order to limit the impact on the trend (obtained through the Hodrick-Prescott filter) of the raw data of hours worked per employee for 2020, it was proposed to replace it with the value obtained from the interpolation of the data for 2019 and 2021. On the second point, it was suggested to add an observation to the CUBS series in 2020, to have the Bayesian filter that extracts the trend of TFP lean towards a cyclical interpretation |
56 For further information see: Havik K. et al. (2014), "The Production Function Methodology for Calculating Potential Growth Rates & Output Gaps", European Economy, Economic Papers No. 535, http://ec.europa.eu/economy_finance/publications/economic_paper/2014/pdf/ecp535_en.pdf;http://ec.europa.eu/economy_finance/publications/economic_paper/2014/pdf/ecp535_en.pdf. See also Section III.1 of the “Nota metodologica sui criteri di formulazione delle previsioni tendenziali”, annexed to the SP 2020, http://www.rgs.mef.gov.it/_Documenti/VERSIONE-I/Attivit--i/Contabilit_e_finanza_pubblica/DEF/2020/NotaMetodologica-2020-cop.pdf.
57 The described changes were illustrated during a meeting of the Output Gap Working Group (OGWG), which is responsible, jointly with the European Commission, for the development of the methodology of estimation of potential output and its projection.
| 78 | MINISTRY OF ECONOMY AND FINANCE
|
III. NET borrowing AND PUBLIC DEBT
of the 2020 crisis. Since the composite indicator is derived from surveys, in the Spring Forecast session the figure for 2020 had to be computed in alternative ways58. The Commission proceeded by multiplying the difference observed in the raw TFP series between 2019 and 2020 by an elasticity parameter common to all European countries, constructed from the data observed for the 2009 crisis. On the third point, for all those cases where the relationship between unemployment and real unit labour costs in the Phillips curve would otherwise be lost, it was proposed to introduce a dummy for 2020. For Italy, the variable employed in the Phillips curve is not the real, but the nominal unit labour cost, so this adjustment was not implemented. The effects of these temporary fixes introduced by the European Commission on the estimate of the output gap for Italy are illustrated in Figure R1. The curves showing the Commission’s estimates for Italy, produced under the Autumn 2019 Forecast (AF19, before the covid-19 crisis), the Spring 2020 Forecast (SF20, the new forecasts in the light of the crisis) and an estimate – MEF source – of the variables that the Commission would have obtained in Spring Forecast had it not introduced the temporary changes described above (‘SF20 No Adj’). As regards output gap estimates, Figure R1 shows that the intervention has led to an almost total containment of the revision for the years before 2020 and, on the other hand, to more negative output gap values for 2020 and 2021. In parallel, the changes made lead to a much less pronounced decline in the projected potential growth rate of the economy59. |
| Figure R1: estimates of output gap and potential OUTPUT FOR Italy, EU forecasts | ||
| Output gap | Potential product | |
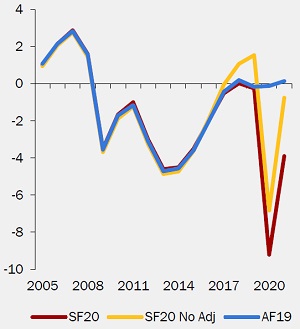 | 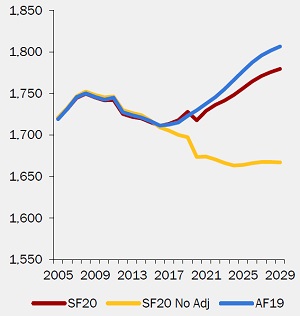 | |
| Source: European Commission and MEF. | ||
58 The practice followed by the Commission when producing the Spring Forecasts is that monthly information related to the winter months (three observations) is not considered and the CUBS indicator is not updated to the current year (time t of the projections). On the contrary, for the Autumn Forecasts, when nine monthly observations are available, an average of the observed values is used.
59 The particularly negative projection of potential output in the “SF2020 No Adj” scenario is due to the reaction of the statistical filters to the information of 2020, in particular to the strong contractions of productivity and hours worked per employee, which are not fully reabsorbed in the following year. Since the Spring 2020 Forecast horizon closes in 2021, the extrapolation of statistical filters, in the absence of an ad hoc initialisation (such as the one developed by the Commission), would have interpreted the temporary fall as structural.
MINISTRY OF ECONOMY AND FINANCE
| 79 |
UPDATE OF THE Economic and Financial Document 2020
In essence, the Commission’s intervention prevented potential output estimates from showing a permanent fall in the level of GDP and/or in the growth rate of the economy. Given the functioning of the methodology, future estimates of the Commission’s potential GDP will continue to be influenced by the growth forecasts for the years following 2020; A consolidated assessment of the magnitude of the output gap and of the pattern of potential GDP resulting from the current crisis period will only be available in a few years’ time, when the estimates will be produced retrospectively, using only historical data. The Commission considers that it is not possible (nor desirable) to continue to sterilize the impact of the current crisis on estimates of the potential product. In any case, the next forecast round (Autumn 2020 Forecast) will provide a first test and all the issues will be evaluated and discussed at the level of technical committees. The updated growth forecasts for 2020 and for the following years will be included and, compared to the Spring Forecasts, an additional forecast year – 2022 – will be available60. It cannot be excluded that, having carefully considered the different available options, ad hoc adjustments will be made again.
The estimate of potential GDP of the 2020 Update of the Stability Programme The Italian delegation to the Output Gap Working Group (OGWG) will participate in the discussions on possible ad hoc arrangements for the forthcoming Autumn 2020 Forecast. With that in mind, regarding the estimates of potential product and output gaps used in this document, it was decided to proceed as follows. First of all, the estimation of hours worked per employee was carried out according to the usual procedure, without any interpolation. Compared to the Commission’s forecast horizon, which last spring reached the year 2021, the time span of Italian planning documents is two years longer (for this Update, the last year is 2023). This allows the Hodrick-Prescott filter (used to estimate the trend of hours worked per employee) to be proportionally less influenced by the single data point of 2020, which is extremely negative. With regard to the estimation of the TFP trend and the imputation of a CUBS value for the year 2020, there is a new problem compared to the Spring Forecast round. At that time, the Commission’s intervention was aimed at obtaining a value for 202061 regardless of survey data, which for all European countries in May were available only for a few months. At this juncture, while working on the estimates for this Update, Italy’s condition regarding business and consumer surveys for 2020 is unique compared to its European partners. In April 2020, the month in which the epidemic and economic crisis hit with greater intensity, the surveys in Italy were suspended. As explained in previous documents62, the CUBS is obtained from the combination of a quarterly indicator (the capacity utilization in the manufacturing sector), collected in the first month of the quarter, and two monthly indicators (the confidence indicator of the construction and services sectors). This implies that the first indicator has a missing value for the second quarter of 2020, while concerning the other two indicators, only the data point for the month of April is missing. For the construction of the CUBS used for the estimation of the TFP trend in this Update, the missing data in the above indicators have been obtained from the variations in the same series observed by Spain and France, as these two countries were the closest to Italy with regard to the effects of the pandemic on the economy. The following formula was adopted: |
60 The addition of further observation at the end of the period can significantly affect the extrapolation of statistical filters.
61 The Commonly-Agreed Methodology operates on an annual basis.
62 See the Focus "Stima del prodotto potenziale e dell’output gap: una metodologia alternativa a quella concordata a livello europeo", contained in the 2018 Stability Programme, https://www.mef.gov.it/documenti-pubblicazioni/doc-finanza-pubblica/index.html#cont10.
| 80 | MINISTRY OF ECONOMY AND FINANCE
|
III. NET borrowing AND PUBLIC DEBT
| XIT,t= XIT,t–1+ | (XFR,t− XFR,t − 1) + (XES,t − XES,t − 1) | |
| 2 |
The proposed change in the construction of the CUBS indicator has a limited effect on the results: in 2031, potential GDP reached a level of 0.6 percent higher than estimated without any imputation of missing values63. Much more important is the impact on potential output estimation of the Government fiscal plans shown in this document, even in the medium term. The comparison between the current projection of potential output over a period of 10 years and that corresponding to the forecasts contained in Update of the DEF 2019 (the last made before the crisis) shows that, after a decline corresponding to the crisis, output returns to its previously estimated levels and then surpasses them (Figure R2). The comparison between the lines corresponding respectively to the Trend (unchanged legislation) and to the Policy scenario highlights the contribution to potential GDP of the policy plan. The main contribution to the increase in potential is provided by the impulse given to investments, which raises the level of capital. As already noted for the macroeconomic estimates, this assessment incorporates a conservative approach: these estimates embody only the physical increase in capital, while the impact on productivity linked to many of the investments financed through the relaunch plan coordinated at the European level is not factored in. It should also be borne in mind that the stimulus to investment does not stop in 2023 but, rather, it is set to continue until 2026. Overall, therefore, since the forecast framework ends in 2023, the impact on potential growth is underestimated. |
| Figure R2: estimates of output gaps and potential OUTPUT FOR ITALY, MEF forecasts | ||
| Output gap | Potential product | |
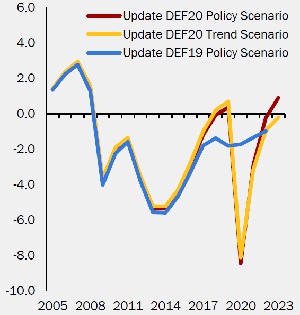 | 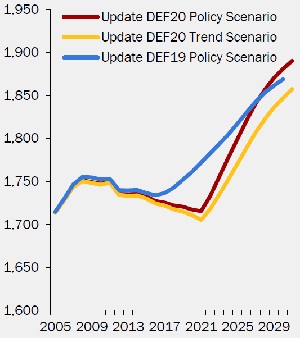 | |
| Source: MEF. | ||
63 The alternative construction is, in essence, carried out by computing the CUBS on the basis of the available values of the survey indices; for example, the confidence indicator for services uses an average of 8 observations instead of 9.
MINISTRY OF ECONOMY AND FINANCE
| 81 |
UPDATE OF THE Economic and Financial Document 2020
| table III.6: ONE-off measures under unchanged legislation (millions) | ||||||
| FINAL DATA | FORECASTS | |||||
| 2018 | 2019 | 2020 | 2021 | 2022 | 2023 | |
| Total one-off measures | 2,167 | 1,044 | 2,944 | 3,995 | 3,355 | 1,183 |
| as % of GDP | 0.1 | 0.1 | 0.2 | 0.2 | 0.2 | 0.0 |
| - (a) Revenue | 3,147 | 2,523 | 3,131 | 3,215 | 2,965 | 843 |
| as % of GDP | 0.2 | 0.1 | 0.2 | 0.2 | 0.2 | 0.0 |
| - Various substitute taxes | 1,360 | 1,867 | 1,977 | 1,186 | 697 | 130 |
| - Aligning of balance sheet values to IAS principles | 308 | 221 | 430 | 430 | 430 | 430 |
| EU Solidarity Fund for Amatrice earthquake | 0 | 0 | 0 | 0 | 0 | 0 |
| - Banking resolution fund | 0 | 0 | 0 | 0 | 0 | 0 |
| - Foreign capital emergence (voluntary disclosure) | 264 | 38 | 1 | 0 | 0 | 0 |
| - Facilitated settlement of tax arrears (1) | 1,215 | 397 | 723 | 1,599 | 1,838 | 1,191 |
| (b) Expenditure | -1,900 | -2,260 | -1,604 | -340 | -340 | -340 |
| as % of GDP | -0.1 | -0.1 | -0.1 | 0.0 | 0.0 | 0.0 |
| - Measures for natural disasters: | -1.900 | -1.803 | -1.174 | -340 | -340 | -340 |
| - Paid dividends | 0 | 0 | 0 | 0 | 0 | 0 |
| - Banking resolution fund | 0 | 0 | 0 | 0 | 0 | 0 |
| - Reclassification of MPS operation | 0 | 0 | 0 | 0 | 0 | 0 |
| - Veneto banks | 0 | 0 | 0 | 0 | 0 | 0 |
| Carige loan reclassification | 0 | -457 | 0 | 0 | 0 | 0 |
| Banca Popolare di Bari loan reclassification | 0 | 0 | -430 | 0 | 0 | 0 |
| - (c) Disposals of real estate | 920 | 781 | 1,417 | 1,120 | 730 | 680 |
| as % of GDP | 0.1 | 0.0 | 0.1 | 0.1 | 0.0 | 0.0 |
| Breakdown by sub-sectors | ||||||
| - Central Government | 1,297 | 313 | 2,341 | 3,315 | 2,675 | 553 |
| - Local Governments | 665 | 625 | 500 | 510 | 550 | 500 |
| - Social Security Funds | 205 | 106 | 103 | 170 | 130 | 130 |
1) Including the measures of D.L. No.193/2016, D.L. No. 148/2017 and D.L. No. 119/2018 and 124/2019. Note: The positive sign indicates one-off measures reducing nominal net indebtedness. | ||||||
III.3 The evolution of the debt-to-gdp ratio
The recent estimates released by ISTAT64 and by the Bank of Italy65 confirm the reduction in the public debt-to-GDP ratio since 2015 and the substantial stationarity of the ratio in 2019 compared to 2018. The estimate for 2019 move to 134.6 percent, from 134.4 percent in 2018. Both values are revised downwards compared to the latest estimates in April, where the ratio was 134.8 percent in both years.
As already explained in the previous chapters, nominal GDP growth in 2019 was 1.1 percent, slightly below the growth in the government debt stock of 1.2 percent.
In 2020, the debt-to-GDP ratio will rise by around 23.4 percentage points on an annual basis. In fact, the new debt-to-GDP forecast for 2020 is 158.0 percent
64 Istat, ‘National Economic Accounts’, September 22, 2020.
65 Bank of Italy, ‘Statistical Bulletin Public finance, borrowing requirement and debt’, 15 September 2020.
| 82 | MINISTRY OF ECONOMY AND FINANCE
|
III. NET borrowing AND PUBLIC DEBT
and is almost 2.3 percentage points higher than that indicated in the April Stability Programme in the new policies scenario. This scenario included, as already explained in the previous paragraphs, the financial and macroeconomic impact of the exceptional measures in response to the epidemic and economic and social emergency adopted by the Government until the publication of the document (mainly the decrees ‘Cura Italia’ and ‘Liquidity’), and the expected impact of the policies announced and subsequently introduced by the decree ‘Relaunch’ of 19 May.
The forecast for the debt-to-GDP ratio in 2020 updated in this document also reflects, in addition to the mentioned decrees, the impact of the decree of 14 August (‘Support and Relaunch’), equal to about 1.5 percentage points of GDP for the current year in terms of net borrowing, implying a revision of the stock of government debt. This revision has an impact of 0.9 percentage points on the variation in the debt-to-GDP ratio forecast compared to that presented in April. The remaining 2.3 percentage points are due to the downward revision of the nominal GDP forecast.
The increase in the debt-to-GDP ratio in 2020 is driven by several factors. First, the urgent measures approved by the Government to deal with the health emergency of coronavirus have resulted in an impact of around 100 billion on net borrowing (and nearly 118 billion on borrowing requirements). This implies a reduction in the primary surplus compared to 2019, reaching a primary deficit of 7.3 percent of GDP, and a weighting of the stock-flow component for the part relating to the difference between the assessment of the impact of measures on balances with the accrual and cash criterion.
Moreover, the decline in GDP leads to a cyclical deterioration of the budget balance adding to the expansive effect of the measures. Finally, a sharp increase in the so-called snow-ball effect is expected, resulting from interest expenditure which stays at a level of 3.5 percent of GDP in 2020, while nominal (and real) GDP in the year undergoes an exceptional fall due to the recession.
The expected recovery in economic growth and the reduction of the primary deficit, together with the expected low yields, would lead to a decline in the debt ratio over the next three years.
The policy scenario framework confirms the reversal of the trend in the debt-to-GDP ratio in 2021, with an estimated objective of 155.6 percent. This reduction stems from the decline in the borrowing requirement of the public sector (by about 3.7 percentage points of GDP compared to 2020) and from the strong growth of nominal GDP (+ 6.8 percent) which in the policy scenario reflects the expansive impact of the investment and reforms programme that the Government intends to adopt, benefiting from the resources made available from the package of instruments for the recovery and resilience of the European Union economies. The estimate also incorporates the hypothesis of a reduction in Treasury liquidity stocks by 0.1 percent of GDP.
The debt-to-GDP ratio is foreseen to be 153.4 percent in 2022. The improvement respect to 2021 (approximately 2.2 percentage points of GDP) is due to the decline in the borrowing requirement of the public sector by around 3.1 percentage points of GDP, with a robust nominal growth estimated to exceed 5 percent.
A further decline in the debt-to-GDP ratio is expected in 2023 up to 151.5 percent. The rate of decline will be slightly lower than in the previous year, as a
MINISTRY OF ECONOMY AND FINANCE
| 83 |
UPDATE OF THE Economic and Financial Document 2020
result of nominal growth of 3.7 percent and a more moderate decline in the borrowing requirement of the public sector, by around 1.8 percentage points of GDP, consistent with the convergence of the net borrowing ratio to the 3 percent target.
Net of Italy’s shares of loans to EMU Member States, bilateral or through the EFSF, and the contribution to the capital of ESM, the 2019 final estimate of the debt-to-GDP ratio is 131.4 percent, while the forecast stands at 148.6 percent in 2023.
| table III.7 General government debt by sub-sector (1) (million and as a percentage of GDP) | |||||
| 2019 | 2020 | 2021 | 2022 | 2023 | |
| Gross of Euro Area financial support (2) | |||||
| General government | 2,409,841 | 2,602,976 | 2,736,965 | 2,835,438 | 2,903,739 |
| as % of GDP | 134,6 | 158,0 | 155,6 | 153,4 | 151,5 |
| Central government (3) | 2,334,486 | 2,528,036 | 2,664,518 | 2,765,472 | 2,836,350 |
| Local government (3) | 123,455 | 123,039 | 120,547 | 118,065 | 115,488 |
| Social security funds (3) | 98 | 98 | 98 | 98 | 98 |
| Net of Euro Area financial support (2) | |||||
| General government | 2,351,994 | 2,545,262 | 2,679,643 | 2,778,616 | 2,847,418 |
| as % of GDP | 131.4 | 154.5 | 152.3 | 150.3 | 148.6 |
| Central government (3) | 2,276,639 | 2,470,323 | 2,607,196 | 2,708,650 | 2,780,029 |
| Local government (3) | 123,455 | 123,039 | 120,547 | 118,065 | 115,488 |
| Social security funds (3) | 98 | 98 | 98 | 98 | 98 |
(1) Note: Any inaccuracies result from rounding. (2) Gross or net of Italy’s shares of loans to EMU Member States, bilateral or through the EFSF, and the contribution to the capital of the ESM. At the end of 2019, the amount of these shares amounted to approximately 57.8 billion, of which 43.5 billion for bilateral loans and through the EFSF and 14.3 billion for the ESM programme (see Bank of Italy, 'Statistical Bulletin of Public Finance, Borrowing Requirements and Debt of 15 September 2020). The MEF’s liquidity stocks are expected to be reduced by 0.2 percent of GDP in 2020 and 0.1 percent of GDP in 2021, in addition, estimates take into account the repurchase of SACE, the uses of the assets allocated and the EIB and SURE guarantees. The interest rate scenario used for the estimates is based on the implicit forecasts arising from the forward rates on Italian government bonds during the period covered by this document. (3) Gross of liabilities vis-à-vis other sub-sectors. (4) Including the effects of the Italian contribution in support of the Euro Area: Greek Loan Facility (GLF), EFSF and ESM. | |||||
| Figure III.1: Trend of the debt-to-gdp ratio gross and net of Euro area supports |
|
| Source: Istat and Bank of Italy. Since 2020, forecasts of the policy scenario. |
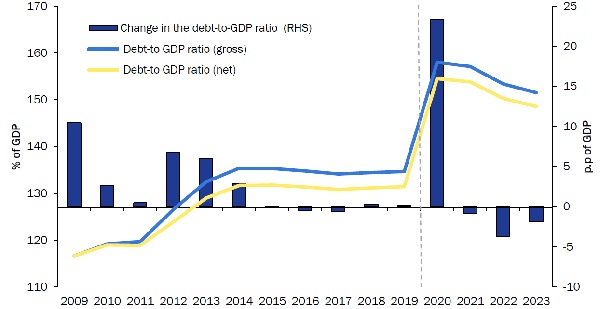
| 84 | MINISTRY OF ECONOMY AND FINANCE
|
III. NET borrowing AND PUBLIC DEBT
III.4 The debt rule and other relevant factors
According to the European fiscal discipline introduced by the Six Pack and transposed into Italian law by L. No. 243/2012, Member States of the euro area with a public debt-to-GDP ratio higher than 60 percent are asked to undertake a gradual reduction process that will lead in twenty years to reach the sustainability threshold as defined by the SGP66. If the reduction of public debt does not occur at satisfactory pace, the Member State shall be subject to an in-depth assessment by the Commission. In that occasion, the Commission assesses whether there are relevant factors to justify the temporary deviation from the reduction path and then report back to the Council in the multilateral fiscal surveillance context67.
As stated in paragraph III.2, on 20 May 2020, the Commission published a report pursuant to Article68 126(3) of the Treaty, due to Italy’s non-compliance with the 2019 debt rule and the planned breach in 2020 of the deficit threshold of 3 percent of GDP. While the deficit criterion for the year 2020 is not met, the Commission states that it does not have sufficient evidence to lead to the conclusion that the debt criterion set out in the Treaty and European Regulation No. 1467/1997 is not met.
The latest ISTAT and Bank of Italy communications69 have not substantially revised the debt-to-GDP ratio for 2019 (the ratio moved from 134.8 to 134.6 percent of GDP). As already mentioned in the SP 2020, Italy does not comply with the debt rule for 2019 in any of the three configurations defined by the SGP.
For the current year, the Government’s forecasts indicate a further significant, albeit inevitable, rise in public debt. This is due to the combined effect of the fall in GDP and the measures, mainly on the expenditure side, taken to deal with the pandemic crisis (see paragraph III.3 for a breakdown of their effects).The first estimate published in the SP of April was revised from 155.7 to 158 percent, mainly due to the higher expenditures included in the Decree ‘Support and Relaunch’ of 14 August.
In 2021, the Government foreshadowed a downward set-up, linked to the rebound of economic growth, which in the policy scenario will bring the debt-to-GDP ratio to 155.6 percent of GDP. Subsequently, in the Government’s
66 The debt rule stipulates that the debt portion in excess of the reference value of 60 percent of GDP is reduced on an annual basis by 1/20 by the average of three years prior to the current one (retrospective criterion) or in the two years following the reference (prospective criterion), and that the breach of the benchmark is not due to adverse conditions of the economic cycle. For more details, see the Focus on “The Debt Rule and the Report on Relevant Factors” in the DEF 2019.
67 European legislation provides that the Commission may refrain from opening an excessive deficit procedure taking into account the existence of relevant factors such as: medium-term economic conditions, adherence to the rules of the Stability and Growth Pact, the dynamics and sustainability of public debt over the medium term. In addition, each Member State may propose to the Council and the Commission specific relevant factors justifying deviation from compliance.
68 European Commission, Report of the Commission on Italy, prepared in accordance with Article 126(3) of the Treaty on the Functioning of the European Union, COM/2020/535 final.
69 Istat, National Economic Accounts, 22 September 2020,
https://www.istat.it/it/files/2020/09/ContiNazionali_settembre_2020.pdf
MINISTRY OF ECONOMY AND FINANCE
| 85 |
UPDATE OF THE Economic and Financial Document 2020
projections, the ratio will decline to 153.4 percent in 2022 and to 151.5 percent in 2023.
To sum up, debt developments are strongly affected by the serious economic crisis triggered by the health emergency. Italy will therefore not be able to comply with the numerical debt reduction rule in 2020 and 2021.
As shown in Table III.8, the backward looking criterion would require the debt recorded in 2020 to be reduced in the last three years, including the current year, by 1/20th a year. Compared to this benchmark, debt will be nearly 31 percentage points of GDP higher in 2020 and almost 21 percentage points higher in 2021. With respect to the forward looking criterion, the debt-to-GDP ratio would be expected to approach the 60 percent threshold over the next two years at a rate of 5 percentage points per year. On the contrary, following the current debt path, the distance with the debt foreseen by the rule in 2022 is 12.3 percentage points, while in 2023 this distance shortens to 5.2 percentage points.
The debt criterion is also not met in the cyclically-adjusted configuration. In this case, the numerator is correct for the cyclical component of net indebtedness over the last three years, and the denominator is corrected for the cyclical fluctuations: the rule would provide for a debt-to-GDP ratio of 142.3 percent in 2020, 15 points away from the benchmark represented by the debt level in line with the retrospective criterion.
| TABLE III.8: COMPLIANCE WITH THE DEBT RULE, FORWARD LOOKING AND CYCLICALLY-ADJUSTED criterion | ||||||
| Policy scenario | Unchanged legislation | |||||
| 2019 | 2020 | 2021 | 2019 | 2020 | 2021 | |
| Debt in year t+ 2 (% of GDP) | 155.6 | 153.4 | 151.5 | 155.8 | 154.3 | 154.1 |
| Gap compared to backward looking benchmark (% of GDP) | 7.4 | 30.8 | 20.8 | 7.4 | 30.8 | 21.0 |
| Gap compared to forward looking benchmark (% of GDP) | 20.8 | 12.3 | 5.2 | 21.0 | 13.1 | 7.5 |
Cyclically-adjusted debt gap (% of GDP) | 11.4 | 15.0 | 10.6 | 12.1 | 15.8 | 10.2 |
The next assessment of the compliance with the SGP rules is expected to take place in spring 2021. According to the usual fiscal monitoring procedures, the Commission will make an initial assessment on the basis of the outturn data for 2020, as notified by the European statistical institutes. Although the general escape clause applies, the Commission could nevertheless open a dialogue with the Member States formally not in line with the SGP framework. In addition to deviating from the public debt reduction path, Italy will be above the 3 percent deficit-to-GDP threshold. Likely, the Commission will ask Italy – and other Member States as well – to explain the relevant factors70 to justify this deviation from the European discipline.
70 Indeed, the Commission may refrain from recommending to the Council the opening of an excessive deficit procedure on the basis of the existence of relevant factors such as: medium-term economic conditions,
| 86 | MINISTRY OF ECONOMY AND FINANCE
|
III. NET borrowing AND PUBLIC DEBT
As mentioned above, the change in structural balance planned for 2021 will be broadly in line with the fiscal adjustment required by the matrix of cyclical conditions. Interlocution with the European institutions should therefore focus on debt dynamics.
In this respect, the unprecedented GDP fall in 2020 is at the root of the new rise in the debt ratio. Given the absolute priority of supporting the recovery in the years 2020 and 2021, fiscal policy cannot aim directly and simultaneously at reducing debt. However, the measures taken act indirectly, preventing both a further and deeper fall in output and the prolongation of the economic recession. After 2021, compliance with the debt reduction targets, in any configuration, would entail an unbearable cost in terms of squeezing domestic demand. The issue on the table is the consolidation of the debt-to-GDP reduction trend.
In the SP 2020, the Government engaged itself to restore the debt-to-GDP ratio to the euro area average over the next decade, through a strategy based on the achievement of primary budget surpluses in a context of revitalised public and private investment. This approach is now confirmed and strengthened, and will be reflected in the DBP projections to be sent to the European Commission. The budgetary policy will gradually move towards a cautious fiscal position. A key role will be played by the Next Generation EU’s resources for investment from early 2021 and by the joint reforms to be implemented. Reviving economic growth will bring returns that cannot be fully incorporated – for prudential reasons – in public finance estimates. The nature of investment expenditure, which is largely innovative and has a strong impact on productivity, should bring greater benefits in terms of productivity growth than what currently incorporated in the official projections.
The estimates of public debt provided in the SP 2020 ends in 2021 (like the underlying macroeconomic framework) and were unable to indicate a trend for the following years. The new estimates presented in the Update indicate a gradual process of debt-to-GDP reduction and sustainability of public finance over the medium term.
These projections will have to be re-evaluated during the elaboration of the SP 2021 when there will be a better understanding of the recovery taking place and the Commission will share the new guidelines regarding the fiscal stance to be taken for the years ahead.
III.5 MEDIUM-TERM PUBLIC DEBT PROJECTION SCENARIOS
This paragraph describes and compares projections that prolong the debt-to-GDP ratio beyond the three-year planning horizon. The first projection, whose results have already been summarised in Chapter I, is constructed by extending to 2031 the values of the variables present in the public finance and policy scenario
adherence to the SGP rules, the dynamic and sustainability of public debt over the medium term. For an update on the dialogue between the Commission and Italy on the basis of Article 126.3, see paragraph III.4 of Update of the DEF 2019, p.64. The Commission’s analyses and exchanges with the Italian Government can be consulted in chronological order at the following link: https://ec.europa.eu/info/business-economy-euro/economic-and-fiscal-policy-coordination/eu-economic-governance-monitoring-prevention-correction/stability-and-growth-pact/corrective-arm-excessive-deficit-procedure/closed-excessive-deficit-procedures/italy_en.
MINISTRY OF ECONOMY AND FINANCE
| 87 |
UPDATE OF THE Economic and Financial Document 2020
which reaches 2026. The second projection draws from the traditional planning horizon, which ends in 2023, and projects the debt dynamic using the methodology of the European Commission. In both simulations, the values presented for the years 2020-2023 are in line with the policy scenario of this Update of the Document of Economy and Finance.
As regards the first simulation, called “DSA 2027-2031”, for the period from 2024 to 2026, the GDP growth and the underlying macroeconomic variables are affected by the interventions financed with the National Recovery and Resilience Plan (NRRP) in the context of the Next Generation EU, as described in Chapter I. At the same time, the path followed by the budget balance is consistent with the Government’s stated public finance objectives for the three-year period: compared to 2023, further improvement is observed in the primary balance in both nominal and structural terms71. Essentially, the simulation starts from 2027 incorporating the policy scenario values extended until 2026.
For the projection of the budget balance after 2026, the approach follows the “T+ 10” methodology developed by the European Commission and the assumptions underlying the baseline scenario of the Debt Sustainability Monitor72. The growth rate of the potential output is projected according to the production function model, by extrapolating the variables relative to each input with statistical techniques (that is the case of the Total Factor Productivity, which in 2031 reaches a growth rate of about 0.7 percent) or assuming that they converge towards structural parameters in the eight years following the closure of the forecast horizon (that is the case of the Non-Accelerating Wage Rate of Unemployment, NAWRU, which converges at 9.36 percent in 2031)73. The output gap closes linearly three years after 2026 (it is equal to 0 in 2029).
Starting from the year 2027, the structural primary balance to GDP is maintained at the 2026 value (last forecast year) with the exception of two expenditure components: i) revenue associated with the proprietary income of the general government (the so-called Property Income) and ii) expenditure related to ageing (Age Related Expenditures), estimated by the General Accounting Department in accordance with the most recent long-term scenario of the Ageing Working Group of the European Commission74. These components tend to vary over time.
Over the projection period, annual interest expenditure, which, in addition to the primary surplus of the general government, determine the projection of the
71 Between 2023 and 2026, the nominal and structural primary balances improved by 2.4 and 2.3 percentage points of GDP respectively.
72 For more details on the “T+ 10” methodology, see “Nota metodologica sui criteri di formulazione delle previsioni tendenziali”, annexed to DEF 2020, Section III.4. For a review of debt sustainability analyses by the European Commission, see Debt Sustainability Monitor 2019, https://ec.europa.eu/info/publications/debt-sustainability-monitor-2019_en. https://ec.europa.eu/info/publications/debt-sustainability-monitor-2019_en
73 The anchor of the NAWRU is estimated according to the methodology agreed at European level within the Output Gap Working Group. The value currently allocated (9.4 percent) implicitly incorporates a very conservative assumption of labour market performance, as the scenario “DSA 2027-2031” closes at the end of 2026 with a much lower unemployment rate (7.8). The gradual rise in the unemployment rate in the period 2027 to 2031 reduces the growth rate of potential output.
74 For methodological details, see: “Medium-long-term trends in the pension and social health system – Report n. 21”, edited by the General Accounting Department,
http://www.rgs.mef.gov.it/VERSIONE-I/attivita_istituzionali/monitoraggio/spesa_pensionistica/.
| 88 | MINISTRY OF ECONOMY AND FINANCE
|
III. NET borrowing AND PUBLIC DEBT
deficit, are estimated through the SAPE Model of the Treasury75. The debt-to-GDP ratio is extended by assuming that the composition and maturity structure of the debt underlying the last year of the forecast horizon (i.e. 2026) stay constant. After that year, the refinancing component is kept constant while the yield curve is modelled until 2031 using the SAPE model. Furthermore, the debt-to-GDP ratio is extended by adding to the deficit the so-called ‘stock-flow adjustments’, which include, for the three-year period covered by the present document, the cash/competence gaps foreseen in the official public finance framework, including the proceeds from privatisations and, throughout the projection, financial operations linked to the management of public securities.
The growth rate of the GDP deflator and the inflation rate calculated on the consumer price index for households of workers and employees (FOI) converge to 2 percent in 2029, when the output gap closes.
The simulation confirms that, thanks to a gradual reduction of the deficit, the policy scenario is consistent with a profile of public debt not only sustainable, but oriented towards a definite reduction. For the first years of the simulation, coinciding with the official forecasts of the present document, the impact of the crisis linked to the covid-19 pandemic is evident. As from 2023, net borrowing reaches 3 percent and in 2026 it falls to 0.5 percent of GDP. Thus, the debt-to-GDP ratio is projected to fall by 14.4 percentage points by 2026 from 158 percent of GDP in 2020. Over the following years, public debt continues to sharply decline, reaching 133.2 percent of GDP in 2031, 1.4 percentage points below the 2019 value.
As highlighted by the alternative simulation, taking into account the planned manoeuvre for 2024-2026 and the positive impact of the Recovery Plan on growth is of utmost importance for the alternative scenario, which shows the evolution of the debt-to-GDP ratio when the “T+10” CE methodology is applied directly from 2024, instead of using a macro-economic and public finance scenario inclusive of the effects of the Recovery Plan until 2026. In this case, there would be a more unfavourable GDP growth profile (see Figure III.2a for a comparison of the two scenarios, “DSA 2024-2031” and “DSA 2027-2031”) and a still sustainable but not as rapidly declining debt-to-GDP ratio profile (see Figure III.2b).
The different debt-to-GDP ratio profiles can be commented from several points of view.
As already explained (see the Focus on "Estimating potential GDP at the time of the pandemic"), the scenario "DSA 2024-2031" is characterised by a growth rate higher than in the trend scenario based on unchanged legislation, but this only partially captures the effects of the NRRP. Indeed, the medium-term potential product projections incorporate the Plan only up to 2023. This produces a projection of the level of GDP significantly below the scenario “DSA 2027-2031” 76.
75 For a description of the SAPE model, see: Bernaschi, Morea, Sarno, Tesseri, Verani, Vergni, “An Integrated Approach to Cost-Risk Analysis in Public Debt Management”,
http://www.dt.mef.gov.it/modules/documenti_it/debito_pubblico/presentazioni_studi_relazioni/ebook/Ebook_150720_1.pdf.
76 It is important to recall that, in order to be consistent with the European fiscal surveillance framework, the computation of the structural balance and the profile of the relevant expenditure aggregate presented in Chapter III were carried out using the estimates underlying the scenario “DSA 2024-2031”.
MINISTRY OF ECONOMY AND FINANCE
| 89 |
UPDATE OF THE Economic and Financial Document 2020
| FIGURE III.2: GDP and debt-to-gdp ratio projections, 2020-2031 |
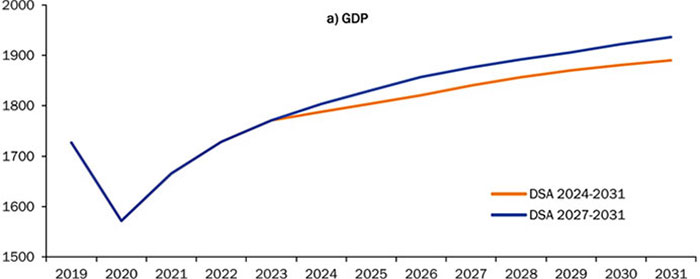
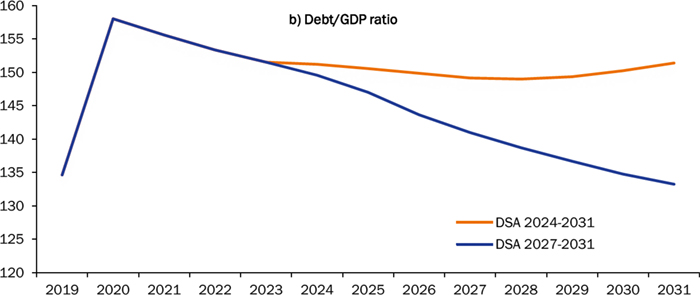
| Source: MEF. |
The level of the primary balance in the two scenarios since 2024 is equally important in explaining the different path of the debt-to-GDP ratio. The scenario “DSA 2027-2031” follows the policy profile described in Chapter I, marked in 2024-2026 by a significant improvement in both nominal and structural terms: the primary balance rises from 0.1 percent of GDP in 2023 to 2.5 percent in 2026. In the scenario “DSA 2024-2031” reference is made to the financial position as of 2023, without considering the expected adjustment path for the following years. In 2024, the correction for the cyclical component of the nominal balance is “unfavourable”, given a positive output gap of 0.9 percent. This leads to an immediate deterioration of the balance by about half a point of GDP77. Both simulations take into account the higher expenditure related to ageing and the proprietary income of the general government, which gradually affect the balance from the first year following the forecast horizon, respectively 2024 and 202778.
77 A similar correction is made in the scenario “DSA 2027-2031”, but it affects results to a lesser extent, as it takes place later (in 2027) and operates on a more favourable primary balance.
78 At the end of the projection period, in 2031, the impact on net borrowing is around half a percentage point of GDP.
| 90 | MINISTRY OF ECONOMY AND FINANCE
|
III. NET borrowing AND PUBLIC DEBT
Overall, the primary balance in 2031 is -1.0 percent of GDP for the “DSA 2024-2031” scenario and 1.4 percent for the “DSA 2027-2031” scenario.
Table III.9 shows the evolution of the parameters used in calculating the debt-to-GDP ratio over the projection horizon in both scenarios.
| TABLE III.9: PARAMETERS AFFECTING DYNAMIC OF DEBT-TO-GDP RATIO (percentages) | ||||||||||
| 2020 | 2021 | 2022 | 2023 | 2024 | 2025 | 2026 | Average 2027-2030 | 2031 | ||
| Nominal GDP growth rate | DSA 2027-2031 | -8.0 | 6.8 | 5.1 | 3.7 | 3.1 | 2.8 | 2.8 | 2.7 | 2.7 |
| DSA 2024-2031 | -8.0 | 6.8 | 5.1 | 3.7 | 2.4 | 2.7 | 2.9 | 2.8 | 2.5 | |
| Real GDP growth rate | DSA 2027-2031 | -9.0 | 6.0 | 3.8 | 2.5 | 1.8 | 1.5 | 1.4 | 0.9 | 0.7 |
| DSA 2024-2031 | -9.0 | 6.0 | 3.8 | 2.5 | 1.0 | 0.9 | 0.9 | 0.8 | 0.5 | |
| Net borrowing | DSA 2027-2031 | -10.8 | -7.0 | -4.7 | -3.0 | -2.4 | -1.3 | -0.5 | -1.2 | -1.7 |
| DSA 2024-2031 | -10.8 | -7.0 | -4.7 | -3.0 | -3.1 | -3.2 | -3.5 | -3.9 | -4.5 | |
| Primary surplus | DSA 2027-2031 | -7.3 | -3.7 | -1.6 | 0.1 | 0.6 | 1.7 | 2.5 | 1.8 | 1.4 |
| DSA 2024-2031 | -7.3 | -3.7 | -1.6 | 0.1 | 0.0 | -0.1 | -0.3 | -0.6 | -1.0 | |
| Nominal Implicit Interest Rate | DSA 2027-2031 | 2.4 | 2.2 | 2.1 | 2.1 | 2.1 | 2.1 | 2.1 | 2.2 | 2.3 |
| DSA 2024-2031 | 2.4 | 2.2 | 2.1 | 2.1 | 2.1 | 2.1 | 2.1 | 2.2 | 2.4 | |
| Public debt/GDP | DSA 2027-2031 | 158.0 | 155.6 | 153.4 | 151.5 | 149.6 | 147.0 | 143.7 | 137.8 | 133.2 |
| DSA 2024-2031 | 158.0 | 155.6 | 153.4 | 151.5 | 151.2 | 150.6 | 149.9 | 149.4 | 151.4 | |
| Source: MEF. | ||||||||||
III.6 Main public finance measures adopted
Since last April, in line with the actions already undertaken since the beginning of the year, other urgent measures79 have been taken to deal with the health emergency and the economic social consequences due to the spread of covid-19.
These measures (Table III.10), taking into account the Parliament authorisations, in April and July, to increase net borrowing,, lead to an increase in general government deficit of about 80.2 billion in 2020, 31.4 billion in 2021, 35.5 billion in 2022 and 41.5 billion in 2023. The borrowing requirement is expected to deteriorate by 99.2 billion in 2020, 32 billion in 2021, 35.3 billion in 2022 and 37.8 billion in 2023. The net balance to be financed of the State budget increases by 185.6 billion in 2020, 33 billion in 2021, 35.6 billion in 2022 and 40.4 billion in 2023.
The different effect on balances depends on the nature of the interventions and the different accounting criteria of transactions on the State budget,
79 This is D.L. No. 23/2020 on “Emergency measures in the field of access to credit and tax obligations for enterprises, special powers in the strategic sectors, as well as interventions in the field of health and work, extension of administrative and procedural periods”, converted with amendments by Law No. 40 of 5 June 2020 of Legislative Decree No. 34/2020 on “Emergency measures in the field of health, support for work and the economy, as well as social policies related to the emergency crisis by covid-19”,
Please note that the interventions provided by Legislative Decree No. 23/2020 and Legislative Decree No. 34/2020 in the version presented to the Chambers have already been discussed in the Document of Economics and Finance 2020.
MINISTRY OF ECONOMY AND FINANCE
| 91 |
UPDATE OF THE Economic and Financial Document 2020
borrowing requirement and on the consolidated account of the general government.
| Table III.10 - CUMULATivE EFFECTS OF THE last measures approved IN 2020 ON THE general government net borrowing (values in million; including induced effects) | ||||
| 2020 | 2021 | 2022 | 2023 | |
| D.L. No. 23/2020 (converted by Law No. 40/2020) | -11 | 0 | 0 | 0 |
| D.L. No. 34/2020 (converted by Law No. 77/2020) | -55,289 | -26,082 | -34,705 | -35,366 |
| D.L. No. 104/2020 | -24,896 | -5,274 | -769 | -6,128 |
| NET BORROWING | -80,196 | -31,357 | -35,474 | -41,494 |
| As % of GDP | -4.9 | -1.8 | -2.0 | -2.2 |
| BORROWING REQUIREMENT | -99,202 | -31,948 | -35,264 | -37,830 |
| As % of GDP | -6.0 | -1.8 | -1.9 | -2.0 |
| NET BALANCE TO BE FINANCED | -185,634 | -32,985 | -35,578 | -40,368 |
| As % of GDP | -11.3 | -1.9 | -2.0 | -2.2 |
| Note: GDP ratios are calculated on the forecasts of the unchanged legislation scenario. Any inaccuracies result from rounding. | ||||
Overall, taking into account also the effects of the decree adopted in March80, about 100 billion in terms of net borrowing against budgetary allocation of more than 210 billion earmarked in 2020 for cope with the covid-19 emergency.
On government subsectors, it prevails the worsening of the balance of central government and local government over the covered period (Table III.11). For social security institutions, in relation to the temporary nature of the measures taken to protect labour, the deficit is mainly limited to the year 2020 and in a more limited way to the 2021 financial year.
| Table III.11— CUMULATIVE NET EFFECTS OF THE LAST MEASURES APPROVED IN 2020 ON THE GENERAL GOVERNMENT NET BORROWING BY SUB_SECTOR (values in million; including inducing effects) | ||||
| 2020 | 2021 | 2022 | 2023 | |
| CENTRAL GOVERNMENT | -32,761 | -27,308 | -31,548 | -37,972 |
| net revenue change | -5,490 | -17,585 | -27,096 | -29,369 |
| net change in expenditure | -27,271 | -9,723 | -4,452 | -8,603 |
| LOCAL GOVERNMENTS | -20,600 | -2,471 | -4,362 | -3,113 |
| net revenue change | -4,940 | 683 | 55 | -60 |
| net change in expenditure | -15,660 | -3,154 | -4,417 | -3,053 |
| SOCIAL SECURITY FUNDS | -26,835 | -1,578 | 436 | -409 |
| net revenue change | -3,629 | 101 | 917 | 71 |
| net change in expenditure | -23,206 | -1,679 | -481 | -481 |
| EFFECTS OF NET BORROWING | -80,196 | -31,357 | -35,474 | -41,494 |
| Note: the positive sign indicates an improvement in the balance, while the negative sign indicates a worsening. Any inaccuracies result from rounding. | ||||
80 D.L. No. 18/2020 converted with amendments by Law No. 27 of 24 April 2020, for which a special Report had been submitted to Parliament for the use of net borrowing.
| 92 | MINISTRY OF ECONOMY AND FINANCE
|
III. NET borrowing AND PUBLIC DEBT
The measures cover a number of policy areas (Table III.12). Firstly, resources to protect workers are around 26.6 billion in 2020, 2.9 billion in 2021 and 0.7 billion in 2023. Specifically, for workers who have ceased their job activity as a result of the health emergency, special provisions are introduced to allow the use of social safety nets, through the Ordinary Supplementary Income Scheme (CIG) and ordinary and alternative solidarity funds. The ordinary wage integration is also granted to companies that are already in Extraordinary CIG. In support of employees who are not covered by the ordinary CIG and who do not enjoy the protection of solidarity funds, an additional wage supplementary treatment is envisaged. Overall, some 16.6 billion in 2020 and 1.2 billion in 2021 are envisaged for these measures. It is also provided for a one-off allowance totalling 5.4 billion in 2020 for self-employed workers, tourism workers, farm workers with special requirements, professionals, workers registered under the entertainment pension fund, and domestic workers. In order to encourage the employment of fixed-term and permanent workers for some productive sectors or employed in disadvantaged areas of the country, social security contributions are exempted (a total of 2.6 billion in 2020 and 0.8 billion in 2021). Specific measures are introduced to allow childcare as a result of the closure of childcare services and schools and to protect workers during periods spent in quarantine (about 1.4 billion in 2020).
Other measures include support for business continuity and relaunch (approximately 21.2 billion in 2020, 8 billion in 2021, 3.1 billion in 2022 and 3.5 billion in 2023). For this purpose it is recognised the disbursement of grants to subjects who have suffered a reduction in turnover, firms operating in the food services sector and to merchants operating in the historic centres (approximately 7.4 billion in 2020). The IRAP 2019 balance and the first instalment of 2020 (3.9 billion in 2020) are cancelled and it is introduced an exemption from the single municipal tax and tax and fee of public land for certain types of property intended for particular productive and recreational activities (approximately 0.6 billion in 2020) is introduced.
Specific tax allowances are aimed at supporting: energy efficiency and seismic adjustment of buildings, the installation of photovoltaic systems and the construction of infrastructure for the charging of electric vehicles (overall 0.96 billion in 2021 and 2.9 billion annually in 2022 and 2023), expenses incurred for the sanitisation of workplaces and for the payment of rents for non-housing properties (1.7 billion in 2020 and 2.0 billion in 2021) and those for the acquisition of tourist services by households with an ISEE up to EUR 40,000 (1.7 billion in 2020 and 0.7 billion in 2021 ).
Other measures are aimed at encouraging the capital strengthening of medium-sized enterprises through the facilitation of capital injections (2 billion in 2021) and the support of institutions and actors operating in the tourism and culture sector (1 billion in 2020 and 0.2 billion in 2021). Since 2021, the so-called safeguard clauses providing for automatic increases in VAT rates and excise duties on fuels have been definitively abolished (19.8 billion in 2021, 26.7 billion in 2022 and 27.0 billion in 2023).
In the healthcare sector, resources for 5.4 billion in 2020, 1.2 billion in 2021, 1.9 billion in 2022 and 1.4 billion in 2023 are provided. In detail, the level of state funding to the needs of the national healthcare service is increased in order to strengthen territorial asCIGtance networks, both public and subsidised to finance
MINISTRY OF ECONOMY AND FINANCE
| 93 |
UPDATE OF THE Economic and Financial Document 2020
| Table III.12 – NET EFFECTS OF THE last measures approved IN 2020 ON THE General government net borrowing (values in million euros) | ||||
| 2020 | 2021 | 2022 | 2023 | |
| Work protection | -26,598 | -2,910 | -2 | -665 |
| Ordinary and Extraordinary Supplementary Income Schemes and other wage integration measures | -16,580 | -1,225 | 0 | 0 |
| One-off allowances for self-employed, seasonal and fixed-term workers | -5,392 | 1 | 0 | 0 |
| Exemption of social security and welfare contributions (including South decontribution) | -2,639 | -793 | 417 | -247 |
| Parental leave, vouchers and safeguards for period spent in quarantine | -1,360 | 0 | 0 | 0 |
| Allowances for sports workers | -297 | 0 | 0 | 0 |
| Income of last resort | -245 | 0 | 0 | 0 |
| Surfacing of employment relationships | -76 | -340 | -340 | -340 |
| New skills fund to finance training hours and relocation of workers | 0 | -500 | 0 | 0 |
| Solidarity Fund for the Air Transport and Airport System Sector | 0 | -54 | -79 | -79 |
| Other allowances | -10 | 0 | 0 | 0 |
| Interventions in favour of enterprises | -21,203 | -7,973 | -3,120 | -3,465 |
| Measures to ensure the continuity of enterprises | -19,657 | -5,462 | 85 | -217 |
| Non-repayable contributions to persons who have suffered reductions in turnover | -7,347 | 0 | 0 | 0 |
| Repeal of IRAP balance 2019 and first instalment 2020 | -3,952 | 0 | 0 | 0 |
| Tax allowances for sanitisation and commercial real estate rents | -1,743 | -2,000 | 0 | 0 |
| Holidays tax credit | -1,677 | -734 | 315 | 0 |
| IMU and Tosap/COSAP exemptions | -626 | -30 | -30 | 0 |
| Strengthening of medium-sized enterprises | 0 | -2,000 | 0 | 0 |
| Other measures for business continuity | -4,312 | -698 | -199 | -217 |
| Interventions for relaunch and development | -1,546 | -2,512 | -3,205 | -3,248 |
| Interventions for the relaunch of tourism and culture | -1,040 | -201 | -1 | -2 |
| Tax allowances for energy efficiency, seismic adjustment, installation of photovoltaic systems and infrastructure charging electric vehicles | -23 | -957 | -2,962 | -2,930 |
| Tax concessions for RIPs | -17 | -105 | -181 | -270 |
| IPCEI Fund | 0 | -950 | 0 | 0 |
| Other interventions for relaunch and development | -468 | -299 | -61 | -46 |
| Liquidity support measures | -11,140 | 4,601 | 1,729 | -3,269 |
| SME and ISMEA credit guarantee | -4,449 | 0 | 0 | -3,300 |
| Optional remodulation of payment of suspended taxes | -3,748 | 1,874 | 1,874 | 0 |
| Extension second ISA advance payment | -2,200 | 2,200 | 0 | 0 |
| Suspension of deadlines for tax obligations | -486 | 205 | 0 | 0 |
| Reduction of excise duty on natural gas and electricity | -247 | 341 | -135 | 41 |
| First house mortgage guarantee | -100 | 0 | 0 | 0 |
| Moratorium on loan repayments in favour of SMEs | 330 | 0 | 0 | 0 |
| Other liquidity support measures | -240 | -18 | -10 | -10 |
| Note: the positive sign indicates an improvement in the balance, while the negative sign indicates a worsening. Any inaccuracies result from rounding. | ||||
| 94 | MINISTRY OF ECONOMY AND FINANCE
|
III. NET borrowing AND PUBLIC DEBT
| Table iii.12 (continued):— NET EFFECTS OF THE last measures approved IN 2020 ON THE General government net borrowing (values in million euros) | ||||
| 2020 | 2021 | 2022 | 2023 | |
| Interventions for local and regional governments | -10,943 | -1,601 | -1,506 | -990 |
| Funds to guarantee the fundamental functions of local and regional authorities and for the recovering of the revenue losses related to the covid-19 outbreak | -9,870 | 0 | 0 | 0 |
| State contributions for territorial authorities for securing buildings, infrastructures and territories, suspension of loans and other interventions | -414 | -1,601 | -1,556 | -1,040 |
| Reintegrated Municipal Solidarity Fund following the food emergency | -400 | 0 | 0 | 0 |
| Other interventions for local and regional governments | -258 | 0 | 50 | 50 |
| Healthcare | -5,355 | -1,176 | -1,890 | -1,392 |
| Strengthening hospital and territorial health networks and home care | -2,724 | 0 | 0 | 0 |
| Extraordinary purchase of sanitary equipment and materials | -1,704 | 0 | 0 | 0 |
| Interventions on healthcare workers | -584 | -56 | -69 | -69 |
| Incentives for the production and purchase of medical and personal protection devices | -257 | -318 | -318 | -318 |
| Resources for vaccination testing | -80 | -300 | 0 | 0 |
| Increased level of State funding of the national healthcare standard requirements | 0 | -500 | -1,500 | -1,000 |
| Other healthcare measures | -5 | -2 | -4 | -5 |
| Interventions for improving the public services | -3,216 | -1,314 | -1,090 | -770 |
| Interventions in favour of education and university systems | -1,779 | -1,231 | -999 | -693 |
| Interventions to support local public transport | -900 | 0 | 0 | 0 |
| Interventions in the field of public order and security | -198 | -1 | -1 | -1 |
| Other interventions for improving the public services | -339 | -83 | -90 | -76 |
| Interventions for the social sector | -1,759 | -400 | -400 | -400 |
| Emergency income scheme | -966 | 0 | 0 | 0 |
| Judgment of the Constitutional Court on civil invalidity treatment | -178 | -400 | -400 | -400 |
| Other social measures | -615 | 0 | 0 | 0 |
| Interest due to higher emissions of public debt bonds | -410 | -1,858 | -2,654 | -3,494 |
| Repeal of VAT and excise safeguard clauses | 0 | -19,821 | -26,733 | -27,004 |
| Other measures | 92 | -297 | -96 | -300 |
| Coverages | 336 | 1,393 | 288 | 256 |
| EFFECTS ON NET BORROWING | -80,196 | -31,357 | -35.474 | -41,494 |
| Note: the positive sign indicates an improvement in the balance, while the negative sign indicates a worsening. Any inaccuracies result from rounding. | ||||
the recruitment of doctors and healthcare staff, to increase the number of fellowships of specializing doctors and to adopt tools for the reduction of waiting lists. Resources are allocated to the Department of Civil Protection and the Extraordinary Commissioner for the covid-19 Emergency for the purchase of medical and personal protection devices and germicidal substances, the increase in beds in hospitals and to provide compensation for the requisition in use or in property of private individual goods.
In order to support the liquidity of businesses and households, specific measures totalling 11 billion were introduced in 2020. In particular, the central guarantee fund for small and medium-sized enterprises is refinanced and new
MINISTRY OF ECONOMY AND FINANCE
| 95 |
UPDATE OF THE Economic and Financial Document 2020
resources are allocated for guarantees granted by ISMEA (approximately 4.5 billion in 2020). Additional optional instalment arrangements for the payment of suspended taxes (approximately 3.7 billion in 2020) are introduced and the deadlines for suspending payments from payment records and investigations (approximately 0.5 billion in 2020) are extended to 15 October 2020. Moreover, it is extended to 30 April 2021 the deadline for the payment of the second or single instalment of the advances of the PIT and of the IRAP, due for the tax period following the one ongoing on 31 December 2019 for taxpayers subject to the application of the ISA and for taxpayers applying flat-rate schemes (2.2 billion in 2020).
In favour of the territorial governments, resources are provided totalling around 10.9 billion in 2020, 1.6 billion in 2021, 1.5 billion in 2022 and 1 billion in 2023. In detail, the Funds for the exercise of the fundamental functions of local authorities, Regions and Autonomous Provinces are set up and extended in order to allow the regular management of the functions of the local authorities even after the loss of revenue due to the covid-19 emergency, including the lost revenue from the residence tax (approximately 9.9 billion in 2020). For local authorities, the allocations provided for by the 2019 and 2020 budget laws for securing buildings and the territory, the safety and maintenance of schools, energy efficiency and sustainable territorial development, are modified to increase the spending resources for the years 2021 to 2024; it is provided for an increase in the resources earmarked for the financing of final and executive planning, as well as for interventions relating to small works, provided for in the 2020 Budget Law. Special Autonomous loans are suspended and resources are provided for municipalities in distress with structural deficits attributable to socio-economic characteristics. These measures amount to around 0.4 billion in 2020, 1.6 billion in 2021 and 2022 and 1 billion in 2023. In addition, the municipal solidarity fund has been reinstated in connection with the interventions of food solidarity for those in need provided in recent months by the municipalities (0.4 billion in 2020).
As part of the strengthening of public administration services, the resources for universities, institutions of high artistic, musical, and choreutical training, research institutions, officially recognised schools and those to ensure the safe recovery of school activity and ensure a regular working of the 2020/2021 school year (approximately 1.8 billion in 2020, 1.2 billion in 2021, 1 billion in 2022 and 0.7 billion in 2023). The Armed Forces, the Police Forces and the National Fire Department, employed in the countering of the spread of the covid-19 are reinforced (a total of about 0.2 billion in 2020) and more resources are provided to support the local public transport sector to compensate for the reduction in ticket revenues due to the reduction in passenger numbers (0.9 billion in 2020).
In the social sphere (1.8 billion in 2020 and 0.4 billion since 2021) it is noteworthy, in particular, the introduction of the emergency income (more than 0.9 billion in 2020), i.e. exceptional income support for households in a situation of economic need which, in the emergency period due to the covid-19, did not have access to other asCIGtance measures and the extension, since 20 July 2020, also to eighteen-year-old persons of benefits in the area of civil disability treatment, in implementation of the judgment of the Constitutional Court No. 152/2020 (0,18 billion in2020 and 0.4 billion since 2021).
| 96 | MINISTRY OF ECONOMY AND FINANCE
|
III. NET borrowing AND PUBLIC DEBT
Finally, among the other measures adopted, with negligible effects on general government net borrowing, there are the provisions to achieve the acceleration of investments and infrastructures, to promote the diffusion of digital administration and to implement simplification measures in the field of the business activity, the environment and the green economy to address the economic consequences of the epidemic by covid-1981.
| | Assessment of revenues arising from the fight against tax evasion
The assessment of the revenues resulting from the activity to fight tax evasion in relation to the corresponding budget forecasts for the current year is carried out in the Update of DEF in accordance to Article 1, p. 434, first and second sentences, of the 2014 Law of Stability, as amended by Article 1, p. 1069, of the 2018 Budget Law.
The increased resources are assessed by comparing the revenues resulting from the tax evasion fight activities of the current year, both with the forecasts in the budget under unchanged legislation and with the amounts actually collected in the previous year. The assessment shall verify that the following three conditions are jointly met: (i) that the revenues from tax evasion activities are higher than the forecasts in the budget under unchanged legislation (for 2020, 2021 and 2022 respectively); (ii) that the revenues are higher than those actually collected in the previous financial year (2019); (iii) that the above-mentioned higher revenues are permanent.
The positive outcome of these conditions implies, when preparing the draft Budget Law, the inclusion in the estimates of revenue and, at the same time, in the Fund for the reduction of the fiscal pressure of the higher permanent resources deriving from the activity of fighting tax evasion.
For the purposes of the assessment, the title of tax revenue includes the management and forecast data of the State taxes resulting from the investigation and control activities, whereas the title of non-tax revenue includes the interest and sanctions. From a managerial point of view, the focus is on the payments resulting from the 2019 General Report of State Finance and those acquired until the end of August 2020; the forecasts point of view considers the cash estimates under unchanged legislation as set out in the State Budget revenue estimates for 2020, 2021 and 2022, as well as the updated estimates of the expected receipts in 2020.
For the elaboration of the projection of revenues the change recorded in the period January-August 2020 is compared to the same period of 2019. This change was applied to the individual items of revenue arising from the inspection and control activities received in 2019.
The following table below shows the main taxes (PIT, CIT, VAT) and the minor taxes overall (including revenue from conciliation); for each item are reported: the receipts made in 2019, resulting from the General Report of State Finance (column a); the estimation of revenue realised in 2020 (column b); the budget forecasts for 2019 (column c), 2020 (column d), 2021 (column c) and 2022 (column f); the difference between the estimated revenues expected in 2020 and those made in 2019; the difference between the estimated revenues for 2020 and the forecasts in the budget for the three-year period 2020-2022. |
81D.L. No. 76/2020 on “Emergency measures for simplification and digital innovation”, converted with amendments by Law No. 120 of 11 September 2020.
MINISTRY OF ECONOMY AND FINANCE
| 97 |
UPDATE OF THE Economic and Financial Document 2020
| Table R1: Revenues FROM ACTIVITIES TO fight tax EVASION (in billions of euros) | ||||||||||
2019 (Final of Account) | Estimated 2020 receipts | Budget | Budget projections inclusive of budget changes | Differences | ||||||
Receipts receipts | Receipts forecast | Receipts forecast | Receipts forecast | |||||||
| (a) | (b) | (c) | (d) | (e) | (f) | (b-a) | (b-d) | (b-e) | (b-f) | |
| 2019 | 2020 | 2019 | 2020 | 2021 | 2022 | |||||
| PIT | 4.01 | 2.16 | 3.09 | 1.42 | 3.36 | 3.43 | -1.85 | 0.74 | -1.21 | -1.27 |
| CIT | 2.59 | 0.98 | 2.36 | 0.58 | 1.77 | 1.84 | -1.61 | 0.40 | -0.79 | -0.86 |
| VAT | 6.05 | 3.91 | 4.00 | 2.25 | 4.28 | 4.20 | -2.14 | 1.66 | -0.37 | -0.29 |
| Other minor taxes | 0.48 | 0.36 | 0.99 | 0.18 | 0.61 | 0.60 | -0.12 | 0.18 | -0.25 | -0.25 |
Total tax rolls | 13.13 | 7.40 | 10.43 | 4.43 | 10.02 | 10.07 | -5.72 | 2.97 | -2.62 | -2.67 |
Total non-tax rolls | 2.51 | 1.44 | 2.76 | 1.44 | 2.46 | 2.45 | -1.07 | 0.00 | -1.02 | -1.01 |
| Total | 15.64 | 8.85 | 13.20 | 5.87 | 12.48 | 12.52 | -6.79 | 2.97 | -3.63 | -3.67 |
Unlike previous years, it is immediately observed that the estimated revenues expected for 2020 are significantly lower than the revenues made in 2019, for around EUR 6.8 billion. This trend reflects the effects of the suspension of the inspection and control activity by the Tax Administration during the emergency situation linked to the pandemic shock. The forecasts for 2020 have also been revised downwards; therefore, the higher revenues compared to the forecasts, in addition to being an insufficient requirement on the baCIG of the provision of the norm, cannot help this year to feed the Fund for the reduction of the fiscal pressure. When preparing the draft Budget Law 2021, therefore, no additional resources will be entered in the aforementioned Fund for the reduction of the fiscal pressure. |
III.7 valorisation of public PROPERTY
As part of the government’s economic strategy, the activity of valorisation of public assets is essentially aimed at creating value and achieving a positive impact on the economy through the driving role played by the activity of valorisation and efficient use of public assets, bearing in mind, however, the objective of improving public finance balances.
With regard to shareholdings held by the State, it is essential to provide support for growth and development processes, not neglecting to ensure the objectives of efficiency recovery that will positively reflect on the valorisation of the holdings held and to improve the quality of services and products. Special attention should be paid to incentives for investments in territories and sectors considered strategic (e.g. energy, green economy, infrastructure).
With regard to public real estate, it is essential to strengthen the valorisation policies – which must be articulated according to the nature of the assets and the type of instrument – and to increase the efficiency of the assets used. To this end, all institutional levels must be involved at central and local level.
| 98 | MINISTRY OF ECONOMY AND FINANCE
|
III. NET borrowing AND PUBLIC DEBT
Alongside the continuation of the direct enhancements, the State Property Agency is committed to the implementation of initiatives, both to regenerate the buildings used by the State Administrations, and to re-order non-instrumental goods, which correspond to the European strategies for the green and digital transition and to the guidelines for the definition of the National Recovery and Resilience Plan.
For the assets not instrumental to the exercise of the institutional functions, the initiatives concern the valorisation for economic and social purposes of real estate of the State and of the public bodies with particular reference to assets of cultural and landscape interest, functional to the realisation of projects of territory development through the public-private partnership.
In particular, the Agency is working, in collaboration with MiBACT, ENIT, Defense Services S.p.A. and other relevant institutional actors, on the launch of the project called ‘Valore Paese Italia’ (lit. ‘Country Italy Value’), aimed at bringing together under a single brand thematic networks united by the objective of valorisation of unused public buildings, according to the principle of sustainable tourism linked to culture, sport, training, environment and sustainable mobility.
MINISTRY OF ECONOMY AND FINANCE
| 99 |
UPDATE OF THE Economic and Financial Document 2020
| 100 | MINISTRY OF ECONOMY AND FINANCE
|
IV. The REFORMS And the recommendations of the Council of the European Union
Introduction
In mid-September the Guidelines of the Recovery and Resilience National Plan (NRRP) were presented, with which the Government submitted to Parliament the ‘Challenges’ and ‘Missions’ around which the investments and economic policy actions of the next three years will be concentrated. The missions, divided into homogeneous Clusters, will be accompanied by structural reforms to enhance their effectiveness and will also be aligned with the Council Recommendations (CSRs) for 2019-2020. From these Guidelines the NRRP Scheme will be defined; it will offer the basis for discussion, in detail in its lines of action and criteria, with the European Commission itself from mid-October and will lead to the final version of the NRRP in early 2021, aligning with the European Semester together with the next National Reform Programme.
The Guidelines presented by the Government are fully aligned with the priorities that the European Commission has indicated to the Member States in its guidance for the drafting of Recovery and Resilience Plans (Green Transition, Digital and Technological Transition, Fairness and Macroeconomic Stability), as well as with the seven objectives (‘European flagships’) included in the recently published Annual Sustainable Growth Strategy. This chapter provides a summary of the RRP Guidelines and updates the recent National Reform Programme (NRP) by describing the measures taken during the summer period that are relevant for the CSRs and for the economic policy response to the crisis.
IV.1 THE NATIONAL RECOVERY AND RESILIENCE PLAN
In response to the serious economic and social crisis caused by the pandemic, the European Commission proposed in May 2020 the Next Generation EU, a comprehensive plan that was endorsed by the European Council in July. The key recovery instrument defined under this strategy, the Recovery and Resilience Facility (RRF), provides EUR 672.5 billion of loans and grants to help Member States to emerge stronger and more resilient from the current crisis. The related guidelines have recently been defined in the Annual Sustainable Growth Strategy 2021, which places the four dimensions of environmental sustainability, productivity, fairness and macroeconomic stability as guiding principles underpinning the National Recovery and Resilience Plans (NRRPs) that Member States will need to define in order to have access to the resources deployed by the EU.The Commission encouraged Member States to submit their National Plans in the following areas: promoting clean technologies and the use of renewables; improving the energy efficiency of public and private buildings; developing clean technologies for sustainable, accessible and smart transport; spreading rapid broadband services to all regions and households, including fibre and 5G networks;
MINISTRY OF ECONOMY AND FINANCE
| 101 |
UPDATE OF THE Economic and Financial Document 2020
favouring the digitalisation of Public Administration and services, including judicial and healthcare systems; strengthening industrial data cloud capacities and developing the most powerful, cutting edge and sustainable processors; adapting education systems to the enhancement of digital skills.
In order to be approved by the European Commission, the NRRP and all the projects that are part of the Plan need to be aligned with the guidelines of the RRF and therefore, they have to be part of a coherent package of investments and reforms related to them. In addition, projects and reform initiatives will have to be aligned with CSRs (see the next paragraph for details) and with the policy challenges and priorities identified in the European Semester, in particular those related to the green and digital transition. The reforms will also have to contribute to the correction of macroeconomic imbalances, especially for countries such as Italy whose imbalances have been considered excessive under the Macroeconomic Imbalalance Procedure. Finally, the contents and objectives of the RRP should be consistent with the information provided in the NRP, in the Energy and Climate Plan (NECP), in the Plans presented under the Just Transition Fund and the Partnership Agreements and other EU operational programmes.
The implementing regulations of the NGEU initiative should enter into force in early 2021 and only starting from that moment will Member States be able to officially submit RRPs. However, the Government, in order to initiate an informal dialogue with the Commission in October and accelerate wherever possible the launch of the Plan, has drawn up a proposal for guidelines (approved by the Interministerial Committee for European Affairs of 9 September1) which is now being examined by the Parliament, and is preparing a ‘NRRP Scheme’ which will be discussed with the European Commission and Parliament. As already noted in the National Reform Programme 2020, NGEU represents a great step forward for Europe and an unrepeatable opportunity for our Country to relaunch investment and implement important reforms and for this reason all available energies will be dedicated to it in the coming months, including through the participation and contribution of economic and social forces and territorial institutions.
The NRRP Guidelines drawn up by the Government are consistent with the Relaunch Plan presented by the Prime Minister and discussed during the national consultation ‘Project the Relaunch’ and are based on a balanced assessment of the strengths and weaknesses of the Italian economy and society. Strong and stable GDP growth is essential to ensure the sustainability of the Country’s public debt and social situation. In turn, growth requires higher public investment and increased system competitiveness to attract both domestic and foreign private investment.
The overall strategy of reform and economic policy of the NRRP aims to address the main challenges that the Country is facing. These are defined as improving Italy’s resilience, reducing the social and economic impact of the pandemic crisis, supporting the green and digital transition, raising the growth potential of the economy and creating jobs.
Missions are in turn divided into clusters (or sets) of homogeneous projects. The strategy also includes cross-cutting reform initiatives to accompany the actions. The Plan sets long-term quantitative targets, such as doubling the growth rate of the Italian economy, bringing public investment above 3 percent of GDP,
1Http://www.politicheeuropee.gov.it/it/comunicazione/notizie/linee-guida-pnrr/
| 102 | MINISTRY OF ECONOMY AND FINANCE
|
IV. The ReFORMS And the recommendations of the Council of the European Union
increasing the employment rate by 10 percentage points, bringing R&D ratio to GDP above the EU average and, last but not least, ensuring the sustainability and resilience of public finances.
These macroeconomic objectives are complemented by social objectives consisting of reducing territorial income gaps, increasing healthy life expectancy, improving the level of education, including reducing school dropouts, promoting sustainable agri-food supply chains to reduce waste. The six missions of the NRRP, consistent with the European ones, represent the structural ‘thematic’ areas of intervention, crossed by horizontal issues related to digitisation, the Country’s infrastructure and the improvement of education. They are:
| 1. | Digitisation, innovation and competitiveness of the production system.In particular, action will be taken on the digitisation of PA, education, health and taxation, so as to make services to citizens and businesses more efficient and timely. It will also be necessary to upgrade technological infrastructure throughout the Country, with the completion of the national fibre-optic telecommunications network and interventions for the development of 5G networks. Investments that will encourage innovation in strategic sectors such as telecommunications, transport, aerospace and agri-food will also be promoted. In order to increase the competitiveness and resilience of Italian companies, digital transformation processes will be encouraged and financial instruments will be strengthened to support and improve the competitiveness of companies, especially SMEs. Finally, special attention should be paid to promoting the cultural industry and tourism. |
| 2. | Green revolution and ecological transition.The Government will promote the implementation of a comprehensive investment programme, in order to meet the new more ambitious objectives of the European Green Deal of achieving climate neutrality by 2050. Investments should aim at decarbonising the energy sector, accelerating the transition to sustainable and smart mobility of people and goods, improving air quality, strengthening renewable sources, improving the energy efficiency of buildings, promoting the circular economy and measures to increase resilience to climate change. |
| 3. | Mobility infrastructure. In addition to investments to improve intermodality, greater efficiency of authorisation processes is needed. The Government aims at the high-speed HS-HC rail network for passengers and goods, with the completion of the TEN-T corridors. Other interventions will concern the road and motorway network, in particular bridges and viaducts. Information technology will also be introduced in this area. Many of these actions have already been indicated in the annex to the Economic and Financial Document 2020 ’Italia Veloce’. |
| 4. | Education, training, research and culture.The aim will be to improve the quality of education and training systems in terms of extending services to raise educational outcomes. Support for the right to education will contribute to this, as well as infrastructure interventions to raise the quality of learning environments. Digitisation will also play an important role in improving learning. There will also be specific policies to strengthen the skills of graduates and PhDs, as well as in STEM disciplines (Science, Technology, Engineering and Mathematics), which will have to be promoted among future generations from the earliest age. The school and university infrastructures will be renewed and innovation ecosystems will be created, |
MINISTRY OF ECONOMY AND FINANCE
| 103 |
UPDATE OF THE Economic and Financial Document 2020
| places of contamination of advanced learning, research, public-private laboratories and third sector to strengthen the social and economic impact of research activities. |
| 5. | Social, gender and territorial equity.The aim will be to implement a strategy to support employment transitions through the implementation of a National Plan for new skills, with the aim of improving the workers and unemployed people’s skills and responding to new needs, strengthening lifelong learning policies and women’s re-skilling and up-skilling. Active labour market policies and integration between territorial services should also be strengthened. At the same time, the aim will be to protect workers’ incomes and promote the quality of work, including through the improvement of health and safety conditions in the workplace. In addition, the fight against gender inequalities in employment and in social life will be stepped up and youth employment will be strengthened. It will be important to introduce measures to combat undeclared work and to improve the protection of health and safety in the workplace. In addition, social and family support policies will be integrated into a coherent framework to improve social cohesion, intergenerational solidarity and work-life balance. Particular attention will be paid to female empowerment (in terms of training, employability and self-entrepreneurship), gender pay gap and child policies, through the increase of nurseries and the mapping of services throughout the national territory, in line with the provisions of the Family Act, already presented in the NRP. The objective of cohesion and territorial equity will be pursued in accordance with the South Plan 2030, providing for a territorial distribution of the resources of the NRRP that contributes, in a complementary and additional way, to reducing the infrastructural, economic and social gaps between the different areas of the Country. |
| 6. | Healthcare. The aim will be to strengthen the resilience and timeliness of the healthcare system, through the digitisation of medical care to citizens, the dissemination of the electronic health file and telemedicine, as well as a specific investment in chronic and home care. Support for medical, immunological and pharmaceutical research will also offer an important contribution. |
In order to achieve the missions, Public Administrations, local authorities and potential co-investors will have to make proposals which will be selected according to objective criteria. Special conditions are laid down for the selection of projects, in addition to those already mentioned at the beginning of the paragraph. For example, links and coherence with reforms and support policies will need to be clearly explained as well as timing and implementation modalities, identifying milestones and final targets and the implementing authority. In fact, periodically, with reference to individual projects, the implementing authority will have to report the actual expenditure, the progress in terms of procedures and of achievement of proposed targets.
The Government will support businesses and families by implementing policies and background reforms. These are broadbased policies that will act on some aspects identified as priorities for Italy. It will first intervene on the design capacity of public administrations through an effective process of planning and realisation of works eliminating waste and inefficiencies, including through a revision of some provisions of the Procurement Code. A reform of public
| 104 | MINISTRY OF ECONOMY AND FINANCE
|
IV. The ReFORMS And the recommendations of the Council of the European Union
concessions will also be introduced to ensure greater transparency and a proper balance between public and private interest, as well as the continuous improvement of service for users. In summary, the Public Administration is a key element for the modernisation of the country and for improving the citizens’ life and the business environment. Measures will be taken on the valorisation of organisational performance and the regulation of smart working, administrative and regulatory simplification and the reform of State-owned companies.
The resources dedicated to research and development (R&D) will be increased and actions will be taken to improve the results produced by the research. The participation of Italian companies in European and international collaborative projects and partnerships on technological innovation projects will be encouraged, tax credits for innovative and green investments will be promoted and more private investment will be channeled towards technological innovation. Another element necessary to accompany the measures of the NRRP is the tax reform, aimed at reducing disparities between citizens and making the system more efficient, through the reduction of the tax wedge on labour, the overall revision of taxation towards greater equity and the fight against evasion. With the revision of the system of environmental incentives, those to support families and parenthood, and the participation in the labour market, the tax system will be aligned with the environmental and social objectives that the country follows at European and international level.
The competitiveness of businesses and the propensity to invest in the Country are also adversely affected by the complexity and slowness of justice that requires procedural and legal interventions, as well as the strengthening of human resources and instrumental and technological equipment. Finally, in order for the Relaunch Plan to develop its effects in terms of increased employment, it will be accompanied by a constant effort to improve the labour market in terms of skills and active policies.
The amount of RRF’s resources is 672.5 billion, of which 312.5 billion is made up of grants and 360 billion from loans. Two operational phases are planned, the first of which will cover an amount of 70 percent of the total and will consist of projects to be submitted by 2022 at the latest. At this stage, the share of subsidies received by each country will be based mainly on GDP per capita and on unemployment rate. On the other hand, the amount of loans depends on the level of the Gross National Income (GNI) and will not exceed the 6.8 percent of this variable according to 2018 data over the whole programme. In the second phase of the programme, the remaining 30 percent of grants will be allocated according to a formula reflecting the fall in Member States’ GDP in 2020 and the overall change in 2020-2021. The resources of the RRF that should be allocated to Italy are therefore estimated at 193 billion, 65.4 billion of which in grants and up to 127.6 billion in loans. This document outlines an initial hypothesis for the multiannual use of funds compatible with the sustainability of public finances and the feasibility of investments.
MINISTRY OF ECONOMY AND FINANCE
| 105 |
UPDATE OF THE Economic and Financial Document 2020
IV.2 council recommendations TO THE country
In May 2020, the European Commission published the Spring Package containing Country-Specific Recommendations in the context of a significantly modified European Semester to take account of the consequences of the covid-19 pandemic. The proposal for recommendations was then approved by the Council on 1 July2.
The Semester has been ‘refocused’ to reflect the new socio-economic reality resulting from the health emergency and encourage Member States to implement appropriate measures to strengthen the resilience of their economies. In the new context, is taken account of the fact that Member States will have to focus both on the immediate measures to be taken to combat and reduce the socio-economic consequences of the pandemic and on measures to restart economic activity safely.
Urgent priorities have therefore been identified in health investment, income support for workers affected by the crisis, liquidity of businesses (particularly small and medium-sized enterprises) and measures to support a symmetrical recovery and safeguard the integrity of the Single Market.
In line with the priorities defined for the EU as a whole, the specific Recommendations addressed to Italy require the country to adopt, in 2020 and 2021, measures aimed at:
| • | Take all necessary measures to effectively address the pandemic, sustain the economy and support the ensuing recovery. When economic conditions allow, pursue fiscal policies aimed at achieving prudent medium-term fiscal positions and ensuring debt sustainability while enhancing investment. |
| • | Provide adequate income replacement and access to social protection by mitigating the impact of the crisis on employment through active policies and skills improvement, including digital skills. |
| • | Ensure effective implementation of measures to provide liquidity to the real economy, in particular small and medium-sized enterprises. Front-load mature public investment projects and promote private investment to foster the economic recovery, in particular on the green and digital transition. |
| • | Improve the efficiency of the judicial system and the effectiveness of the Public Administration. |
As mentioned above, the Recommendations adopted in 2020 reflect the new reality of the covid-19 crisis. However, in addition to giving an immediate response to the socio-economic consequences of the pandemic, the Commission has also highlighted the need to maintain a high focus on correcting macroeconomic imbalances and promoting green transition and digital transformation. To this end, the challenge facing the Member States is to add new priorities to those monitored through the 2019 Recommendations, which the Commission considers still relevant for the policy response to Italy’s macroeconomic imbalances.
2Https://ec.europa.eu/info/sites/info/files/2020-european-semester-csr-comm-recommendation-italy_it.pdf
| 106 | MINISTRY OF ECONOMY AND FINANCE
|
IV. The ReFORMS And the recommendations of the Council of the European Union
In view of the budgetary measures that have been taken to increase the capacity of the health system, to contain the pandemic and provide support to people, businesses and sectors that have been hit hardest, it is underlined that the government’s action continues to balance emergency actions with prudent fiscal policies and accompanied by a clear desire to ensure the future debt sustainability. These factors ha a decisive impact on Italy’s macroeconomic imbalances, identified by the Commission3 mainly in terms of high public debt and low productivity growth.
This latter aspect is addressed in the Recommendations on the labour market and education. This year, the Commission focuses on social protection systems and employment protection, but once again it recalls the importance of Active Labour Market Policies and the improvement of skills, in particular digital skills. Progress in education and training continues to be a major challenge for Italy and strong actions in this area appear essential to promote recovery.
These are, moreover, policies that remain largely consistent with the country’s requirements in the 2019 Recommendations, with the aim of improving productivity dynamics and making the labour market more inclusive especially for young people and women and thereby correcting macroeconomic imbalances.
Infrastructure weaknesses and the need to invest in research and innovation continue to be a priority for Italy, with a particular emphasis on green and digital investment as reflected in the 2020 Recommendations. A great deal can be done in these areas through the new instruments launched at Community level and for this reason the Recovery and Resilience National Plan (NRRP) is an unprecedented possibility that cannot be missed.
Attractiveness and investment require a favourable environment for businesses and citizens, for this reason the importance of accompanying reforms to economic and productive recovery based on the digitisation and efficiency of the Public Administration, including the judicial system, is reaffirmed. The process of transformation requires a constant commitment from the Government with clear objectives, missions and detailed and chronologically marked actions. The NRRP is precisely defined in this sense through key areas of intervention to correct the vulnerabilities of the country and to allow to emerge from a prolonged phase of stagnation exacerbated by the current crisis.
3Https://ec.europa.eu/info/sites/info/files/2020-european_semester_country-report-italy_it.pdf
MINISTRY OF ECONOMY AND FINANCE
| 107 |
UPDATE OF THE Economic and Financial Document 2020
| table IV.1 – Country’s specific Recommendations for 2019 and 2020 | ||
| Policy area | Recommendations 2020 | Recommendations 2019 |
| Public Finance and Spending Review | CSR 1 In line with the general escape clause, take all necessary measures to effectively address the pandemic sustain the economy and support the ensuing recovery.[...] | CSR 1 – Ensure a nominal reduction of net primary government expenditure of 0.1 percent in 2020, corresponding to an annual structural adjustment of 0.6 percent of GDP.[...] |
| Privatisation and public debt | CSR 1 – [...] When economic conditions allowt, pursue fiscal policies aimed at achieving prudent medium-term fiscal positions and ensuring debt sustainability while enhancing investment [...] | CSR 1 – [...] Use windfall gains to accelerate the reduction of the general government debt ratio.[...] |
| Health system | CSR 1 – [...] Strengthen the resilience and capacity of the healthcare system, in yìthe areas of healthcare workers, critical medical products and infrastructure; enhance coordination between national and regional authorities. | |
| Tax policy | CSR 1 – [...] shift tazation away from labour, including by reducing tax expenditures and reforming the outdated cadastral values. Fight tax evasion, especially in the form of omitted invoicing, including by strengthening the compulsory of e-payments including thorouh lower legal thresholds for cash payments.[...] | |
| Poverty | CSR 1 – [...] Implement fully past pension reforms to reduce the share of old-age pensions in public spending and create space for other social and growth-enhancing expenditure. | |
| Work, social policies and family | CSR 2 – Provide adequate income replacement and access to social protection, notably for atypical workers; mitigate the employment impact of the crisis, including through flexible working arrangements and active support to employment.[...] | CSR 2 – Step up efforts to tackle undeclared work. Ensure that active labour market policies and social policies are effectively integrated and reach out notably to young people and vulnerable groups. Support women’s participation in the labour market through a comprehensive strategy, including through access to quality childcare and long-term care.[...] |
| Education and Research | CSR 2 – [...] Strengthen distance learning and skills, including digital ones. | CSR 2 – [...] Improve educational outcomes, also through adequate and targeted investment, and foster upskilling, includingr by strengthening digital skills. |
| Competition and competitiveness | CSR 3 – Ensure effective implementation of measures to provide liquidity to the real economy, including to small and medium-sized enterprises, innovative firms and the self-employed, and avoid late payments; front-load mature public investment projects and promote private investment to foste the economic recovery.[...] | CSR 3 – [...] Address restrictions to competition, particularly in the retail sector and in business services, also through a new annual competition law. |
| Infrastructure and investment | CSR 3 – [...] Focus investment on the green and digital transition, in particular on clean and efficient production and use of energy, research and innovation, sustainable public transport, waste and water management as well as reinforced digital infrastructure to ensure the provision of essential services. | CSR 3 – Focus investment-related economic policy on research and innovation and on the quality of infrastructure, taking account regional disparities.[...] |
| Civil justice | CSR 4 – Improve the efficiency of the judicial system.[...] | CSR 4 – Reduce the length of civil trials to all instances by enforcing and streamlining procedural rules, including those under consideration by the legislator.[...] |
| Criminal justice and corruption | CSR 4 – [...] Improve the effectiveness of the fight against corruption by reforming procedural rules to reduce length of criminal trials. | |
| Reform of the PA | CSR 4 – [...] Improve the effectiveness of public administration. | CSR 3 – [...] Improve the effectiveness of public administration, including by investing in the skills of public employees, by accelerating digitalisation and by increasing the efficiency and quality of local public services.[...] |
| Financial services and banking system | CSR 5 – Foster bank balance sheet restructuring, in particular for small and medium-sized banks, by improving efficiency and asset quality, continuing the reduction of non-performing loans, and diversifying funding. Improve non-bank financing for smaller and innovative firms. | |
| 108 | MINISTRY OF ECONOMY AND FINANCE
|
IV. The ReFORMS And the recommendations of the Council of the European Union
IV.3 main actions in line with the COUNTRY SPECIFIC recommendations for 2020
The government is engaged in the demanding task of defining the reforms that will contribute to the recovery of the Country system, also thanks to the resources made available by the European Union.
In the aftermath of the approval of the NRP 2020, some important measures were defined and completed and others were approved. Concluded measures comprise those included in the so-called ‘Relaunch Decree4, partly already anticipated in the NRP 20205, which has completed its parliamentary process. The government then focused on improving administrative action to counter the economic consequences of the health crisis and to relaunch public and private investment through the simplification of procedures. To this end, the so-called ’Simplification’ Decree law6, which intervenes in a number of areas, has been developed and approved: public contracts and construction; administrative procedures and responsibilities of civil servants; digital administration; business, environment and green economy.
Finally, in order to continue to support our economy in the transition to a definitive recovery of activities, the Government has extended many emergency measures to support businesses, workers and households (D.L. No. 104/2020 launched by the Government at the beginning of August). This is also to ensure an effective restart of the country in the autumn period that will see the reopening of schools, public offices and new needs for the health prevention system. To this end, a further budgetary deviation was authorised by Parliament in the summer7.
Tax policy measures – CSR 1
The government continued its action on fiscal policy aimed at protecting citizens and businesses burdened by the difficulties caused by the health crisis. To this end, the first step was to reduce taxes and postpone tax deadlines. The deadlines for tax and contribution payments suspended in the emergency phase were rescheduled under Decree Law No. 104/2020 so as to reduce significantly in 2020 the burden which would otherwise have encumbered taxpayers still in difficulty8.
Moreover, particular attention has been given to the territorial authorities, due to the considerable reduction in revenues incurred during the period of
4D.L. No. 34/2020, converted by Law No. 77/2020.
5Paragraph’I.3 – Measures taken for the covid-19 emergency’
6D.L. No. 76/2020, containing urgent measures for simplification and digital innovation, converted by Law No. 120/2020.
7Resolutions No. 6/00124 of the Senate and 6/00123 of the Chamber of Deputies, adopted by an absolute majority on 29 July 2020.
8In detail, the payments suspended in March, April and May were further postponed.The payments of the second or single instalment of the IRAP advance for the ‘ISA taxpayers’ (i.e. those benefiting from the Synthetic Reliability Index) and for flat-rate taxpayers whose turnover fell by at least 33 percent in the first half of the year, were postponed to 30 April 2021. The final date for the suspension of payment deadlines from tax collection notices and tax revenue enforcement notices was also postponed from 31 August to 15 October 2020. For the restaurant and bar activities, seriously damaged by the epidemiological emergency, the exemption from the payment of the tax for the occupation of public spaces and areas (Tosap) and of the fee for the occupation of public spaces and areas (COSAP) was extended to 31 December 2020.
MINISTRY OF ECONOMY AND FINANCE
| 109 |
UPDATE OF THE Economic and Financial Document 2020
closure, against the important support offered to the territories. Deadlines for the approval of the balance sheets and budgets of local authorities and NHS have been deferred, and certain provisions have been postponed and disapplied in the framework of the multiannual financial rebalancing procedure.The deadline for the granting of liquidity advances by local authorities was extended until 9 October 2020, to facilitate the payment of the stock of debts to companies at 31 December 2019, with benefits for the entire national economic system.
In order to encourage local investment, the contributions allocated to municipalities for small works were increased in 2021 and those for the safety of buildings and territory were strengthened.
Healthcare system – CSR 1
The epidemic crisis by covid-19 highlighted how important the sector is for the country and how many margins for improvement and enhancement can be implemented both in terms of structures and medical tools, as well as in terms of research and health personnel. Already through the decree ‘Relaunch’ actions have been taken by implementing rules for the financing and strengthening of the NHS, Civil Protection and other public entities involved in the emergency. Among the measures, it is worth to mention those relating to the increase in the number of specialised training contracts for doctors, the adoption of guidelines for the prevention, monitoring and management of Assisted Health Residences (RSA) and the public competition in the institutions and companies of the NHS, to ensure the essential levels of assistance (LEA).
Subsequently, in August the National Emergency Fund was increased, aimed also at the research and purchase of vaccines from industries in the sector9. Finally, the decree provides that the Regions may increase for 2020 the amounts already allocated in D.L. No. 18/2020 for the remuneration of overtime work of health workers. A decisive step to support the health system was also made thanks to the collaboration with the European Investment Bank (EIB), which granted a loan of two billion to partially cover the costs of the ‘Relaunch’ decree for the health sector and included in the emergency plans prepared by the Regions in response to the pandemic.
Labour market, social policies and family support – CSR 2
The Government’s effort to support workers’ conditions was massive. Nevertheless, the recurring cyclical decreases in employment occurred in the first half of 2020 led to a significant drop compared to the same period of 2019 (-1.5 percent, equal to -349,000 employed). The reduction in employment has involved both gender components, albeit by disadvantaging women. The decline in employment in the first half of 2020 affected, among other things, fixed-term employees (-11.1 percent), the self-employed (-2.7 percent) and, in terms of age, 15-34-old employed (-3.6 percent). The employment rate fell by 0.7 p.p with a reduction in the unemployment rate by 1.5 points to 8.7 percent, as a result of a
9With the acquisition of capital on market terms, where appropriate.
| 110 | MINISTRY OF ECONOMY AND FINANCE
|
IV. The ReFORMS And the recommendations of the Council of the European Union
significant increase in inactivity (+1.9 p.p.). The youth unemployment rate decreased by 2.2 p.p. as a result of an increase in the inactivity rate of 2.5 p.p..
In order to quantify the effort to support employment, it is recalled that on 10 September benefits totalling EUR 22.6 billion were paid by INPS to 13.9 million beneficiaries. 6.4 million of these latter were workers benefiting from the Wage Supplementary Scheme (’CIG’, i.e. 3.4 million with direct payment from INPS) for an authorised amount of 2.8 billion hours. These are figures without a precedent in the Country’s history.
In the light of the above-described evidences, the D.L. ’Support and Recovery’ of 14 August has extended and further strengthened some of the measures to support workers adopted through previous measures In addition, important employment subsidies for under-utilised areas and further new sector-specific allowances have been provided.
In particular, the length of the covid-19 specific derogating10 CIG scheme was extended up to 18 weeks, to be used between 13 July and 31 December 2020. During this period, the use of the first 9 weeks will not entail costs, while for the second 9 weeks an additional contribution by employers is foreseen depending on turnover losses occurred by them in the first half of 2020. For employers not requiring the extension of CIG benefits, the exemption from social security contributions will be recognised up to four months until 31 December 2020. Procedures related to individual dismissals for justified objective reasons shall not be initiated and procedures initiated after 23 February 2020 remain suspended for employers who have not fully benefitted from CIG benefits or the social security contribution exemption11. The blocking shall not apply to winding-up businesses or in case of agreements with Trade Unions. In addition, until 31 December 2020, firms employing permanent workers or converting fixed-term contracts into open-ended ones12 are extempted from the payment of social security contributions up to six months after the recruitment. The same contribution exemption is provided for fixed-term hiring in the tourism sector up to three months.
As for the South, from 1 October to 31 December 2020, a 30-per-cent reduction on employers’ social security contributions for firms located in Southern and Island under-utilised areas is provided. Further measures concerned the renewal of fixed-term employment contracts even in the absence of a specific reason, the extension of the Emergency Income (i.e. REM) scheme and the two-month extension of unemployment benefits (i.e. NASpI) as well the monthly unemployment benefit for atypical workers hired with non-standard employment contracts (i.e. DIS-COLL).
The adopted exceptional employment support measures can be included into those eligible for the new European instrument for temporary Support to mitigate Unemployment Risks in an Emergency (SURE) for which the EU Council granted Italy 27.4 billion loans on 25 September.
10 From the ordinary rules.
11 Without prejudice to the case when the worker employed in firms operating in the context of procurement procedures is hired again by the new taking over contractors.
12 Excluding productive units in the agricultural sector, the households as employers and employment apprenticeship relationships.
MINISTRY OF ECONOMY AND FINANCE
| 111 |
UPDATE OF THE Economic and Financial Document 2020
Particularly important were the measures aimed at promoting work-life balance and supporting working parents with children both through direct economic grants from the State and through extraordinary leaves. In the context of the resumption of work performed at firm’s headquarters (i.e. ‘in the presence’) and also with the aim to provide further support to working parents, € 150 million have also been allocated to support Municipalities for the strengthening of summer centres, local socio-educational services and centres with an educational and recreational function, as well for measures to fight against the educational poverty phenomenon.
As for the social sphere, it has also been planned to extend, since 20 July 2020, the incremental civil disability benefits to 18-year-old young disable persons13.
Education and University – CSR 2
In the March-June 2020 period, the health emergency imposed the continuation of the school year through distance learning. Since September, the resumption of school attendance in school buildings (i.e. ‘the presence’) has required new funds for the adaptation of the teaching activity in the 2020-2021 school year and for the signing of community agreements, also with cultural, sport and Third Sector institutions, in order to expand school time. Additional resources have been allocated to increase the temporary contracts of teachers and administrative and technical staff (ATA), to ensure the resumption of school activity.
The ’Simplifications’ decree law introduced significant innovations in the academic field. The reform law of the university system has been amended, providing that, on the basis of programme agreements with the Ministry of Education and University (MIUR), all Universities can introduce different functional and organisational models, also with reference to the arragements of composition and constitution of governing bodies, as well the organisation of teaching and research issues14.
Liquidity and capitalisation support measures – CSR 3
Among the initiatives that have enabled the real economy to reduce the economic risk related to containment measures, liquidity support measures are particularly important. As at 23 September, moratorium on loans covered a total of 323 billion (2.9 million applications). In more detail, applications from non-financial corporations accounted for 45 percent of the total, for a corresponding amount of loans of 216 billion. As regards SMEs, the requests under Article 56 of the ’Cura Italia’ Decree law (more than EUR 1.4 million) concerned loans and credit lines for 179 billion euros, while the 52 thousand accessions to the
13 Implementing the Constitutional Court judgment No. 152/2020.
14 The following provisions have been introduced: i) a transitory framework for professors and researchers’ interuniversity mobility in addition to provisions relating to assignments of teaching functions; ii) the renewal of research grants and the transition of ’‘Type B’’ fixed-term researchers into associate professors’ status already after the first year of contract.
| 112 | MINISTRY OF ECONOMY AND FINANCE
|
IV. The ReFORMS And the recommendations of the Council of the European Union
moratorium promoted by the ABI involved 13 billion in financing to SMEs. Household applications related to loans amounted to around 97 billion. The banks received about 214 thousand applications to suspend mortgage instalments on the first house (access to the so called.‘Gasparrini Fund’), for an average amount of about EUR 94 thousand. The ABI and Assofin moratoriums aimed at families have raised 478 accessions, for about 20 billion loans.
The Ministry of Economic Development and Central Mediocredit (MCC) reported that a total of around 1.10 million requests have been presented for guarantees by intermediaries to the Guarantee Fund for the period from 17 March to 22 September 2020, for financing in favour of companies, craftsmen, self-employed and professionals, for a total amount of more than 83.2 billion. Of these, about 900 thousand are related to loans up to EUR 30,000, with a coverage percentage of 100 percent, for a financed amount of approximately 17.6 billion.
On the other hand, for a total of 576 operations, the total volumes of guarantees under ’Garanzia Italia’, SACE’s instrument to support Italian companies affected by the covid-19 emergency, amounted to around 13.5 billion.
In the light of the extraordinary take-up of the measure, the SMEs Guarantee Fund was refinanced for the three-year period 2023-2025, while the moratorium on loans and mortgages was extended through 31 January 2021 (or 31 March 2021 for tourism companies).
With regard to liquidity support, other measures have also been introduced to support businesses operating in the recreational, entertainment and catering sectors as well as for shops in historic centres. Purchases made using electronic forms of payment under the ‘Cashless Plan’ were also encouraged15.
Further measures to strengthen the capital and recapitalisation of companies, as well as to promote the process of investment in business continuity, have been taken. With regard to capital strengthening and recapitalisation, measures have been introduced for the subscription of capital increases and capital strengthening of state-owned companies. The instrument for alternative Individual Savings Plans has been strengthened, increasing the annual investment threshold from EUR 150,000 to 300,000 for long-term investments. A number of financial support instruments for companies have also been refinanced such as the so called ’Nuova Sabatini’, the development contracts, the ‘Fund for the safeguarding of employment levels and the continuation of business activity’, the innovation vouchers, the IPCEI Fund for the support of companies participating in the realisation of important projects of European interest and the ‘Rotative Fund for the Internationalisation of Fair Organisations and innovative startups’.
In addition to these general measures, a number of sectoral measures were added during the summer to support operators most affected by the crisis, including culture, transport, agriculture and fisheries, textiles, fashion and accessories sectors.
15 With an appropriation of 1.75 billion for 2021 and 3 billion for 2022 for the reimbursement of part of the purchases made under these methods of payment.
MINISTRY OF ECONOMY AND FINANCE
| 113 |
UPDATE OF THE Economic and Financial Document 2020
Public investment – CSR 3
Before the emergency, public investment showed some signs of recovery after a long period of reduction. The entire structure of the NRRP is based on relaunching public investment and tangible and intangible infrastructure. Preparatory to the plan, a package of measures has been launched to simplify administrative procedures accompanied by the allocation of the necessary resources. The NRRP will be linked in a synergistic way to this long-term programming, ensuring the objectives of territorial rebalancing.
The ‘Support and Relaunch’ decree provides for an increase in the resources earmarked for the financing of the final and executive design, as well as for the interventions relating to small works, provided for in the Budget Law for 2020.
In this context, the ‘Simplifications’ Decree contains a series of provisions aimed primarily at encouraging public investment during the post-emergency period, laying down a derogation from the Code of Public Contracts. Among the most innovative measures it is worth to mention: i) in case of procedures relating to the award of public contracts below the Community threshold, the contractor shall be awarded or definitively identified within a period of two months with direct award (for amounts less than EUR 75 thousand) or within 4 months by negotiated procedure without notice16; ii) in case of contracts of an amount equal to or above the Community threshold, where the opening of the procedure is adopted by 31 July 2021, the contracting authority shall entrust it by means of the ‘open’ or ‘restricted’ procedure or, subject to the justification of the existence of the conditions laid down by law, through the ‘competitive procedure with negotiation’; iii) a precautionary suspension may be decided by the court only in the event of ‘serious infringements’17; iv) the ‘Fund for the continuation of public works’ of an amount equal to or above the Community threshold has been set up, in order to prevent that temporary and insufficient annual financial resources may hinder the regular and timely implementation of the work being carried out. Finally, the deadlines for suspending the application of the ban of the so-called ‘Integrated contract’ have been extended until 31 December 2021.
Moreover, as regards public contracts and construction, the decree provides: i) the revision, expansion and extension of the rules of the Commissioners provided for in the Decree ‘Sblocca Cantieri’ (lit. ‘unlock building sites’); ii) the amendment of the Consolidated Text on Construction, to simplify procedures and ensure the recovery and qualification of existing building assets and the development of urban regeneration processes; iii) the assumption by the Prefect of local authorities competences in respect of the building abuses to be demolished, if the Municipality in whose territory there is an abusive building work has not initiated the demolition procedures, within 180 days of the investigation of the abuse; iv) the acceleration and simplification of public reconstruction in areas affected by seismic events.
Other amendments to the Code of Public Contracts are related to: i) interventions in the field of rapid mass transport systems, for which the Ministry
16 It is established that where the initiation of the procedure is adopted by 31 July 2021.
17 In addition, the economic interest of the contractor or its possible submission to insolvency or crisis proceedings cannot be considered to prevail over the interest in carrying out the public works.
| 114 | MINISTRY OF ECONOMY AND FINANCE
|
IV. The ReFORMS And the recommendations of the Council of the European Union
of Infrastructure and Transport (MIT) may authorise the use of any tender reductions or resources released in the course of work18; ii) the introduction of new information requirements relating to the Unique Project Code (CUP), under the responsibility of the Public Administrations that finance or implement investment projects19; iii) The extension to 2021 and 2022 of the transitional provision introduced by the Decree ‘Sblocca Cantieri’ with regard to the approval of variants to final projects approved by the CIPE relating to strategic infrastructure20.
Support to the South and to territorial cohesion — CSR 3
A number of actions have been undertaken to support the Southern regions and to develop under-utilised areas. Previous mention has been made of the 30 percent social security contributions reduction for employees in the South. This important measure is accompanied by other measures aimed at stimulating investment and reducing territorial disparities. Among these: i) for the so called ‘Stay in the South’ incentive21, the threshold for the maximum funding payable has been increased to EUR 60,000, while for startups the share of funding payable in the form of non-refundable contribution has been increased to 50 percent; ii) the Fund to support economic activities and disadvantaged populations in the municipalities of internal areas was refinanced with EUR 300 million while the relative National Strategy has been refinanced with an additional EUR 110 million.
The ‘Simplifications’ decree devotes a specific part of the measures to the South through: i) strengthening the powers of Extraordinary Commissioners to identify the priority areas of Special Economic Zones (ZES) among those identified within the Strategic Development Plan, and in the approval of appropriate protocols and conventions with the local and state administrations involved; ii) the introduction of a fast-track for the assessment/administrative procedures related to operations financed by the European Structural Funds. The same decree also provided for measures to support investments in the South by private entities. This is done, in particular, with the introduction of a ‘special and simplified authorisation procedure’ for companies, universities and research bodies intending to undertake experimentation projects aimed at technological innovation and digital transformation.
In addition, only for the South, changes have been made to one of the main measures to support investment by firms, the so-called ‘New Sabatini’: i) the threshold within which the State contribution on operating subsidies is paid in a
18In the case of funding approved by the Interministerial Committee for Economic Planning (CIPE) without the simultaneous approval of the projects.
19To this end, an annual share of EUR 900,000 of the Fund for the financing of technical units supporting the programming, evaluation and monitoring of public investment is allocated to the financing of the activities of the Public Investment Monitoring System (MIP).
20In D.L. No. 32/2019 the provision was valid for the years 2019-2020.The variants to be made to the final projects in question may be approved directly by the contracting entity, if they do not exceed the value of the approved project by 50 percent.Otherwise, they shall be approved by the CIPE.
21According to the original version of the decree, firms can benefit from a grant to cover working capital requirements of i) EUR 15,000 for self-employed and self-employed activities carried out individually; ii) EUR 10,000 for each member of the beneficiary firm when constituted as company, up to a maximum amount of EUR 40,000.
MINISTRY OF ECONOMY AND FINANCE
| 115 |
UPDATE OF THE Economic and Financial Document 2020
single solution rather than in several allowances was raised from EUR 100,000 to EUR 200,000; ii) the government contributions for innovative investments ‘Industry 4.0’ by micro and small enterprises in the South was raised from 30 percent to 100 percent22.
Moreover, in order to direct public investment to the reduction of regional disparities, in line with the provisions of the 2020 Budget Law, a DPCM (Decree of the Prime Minister) is being approved, which regulates the implementation and monitoring of the so-called ‘34 percent clause’. The clause had already been ‘strengthened’ by the 2020 Budget Law making it binding ex-ante for administrations.
In addition, for the southern area of Italy and the areas affected by the seismic events of 2016 and 2017, the amount of tax credit for R&D investments has been increased to EUR 318 million.
Infrastructure and transport – CSR 3
Simplifications have interested also the harbour system, where the authorisation procedures to realise infrastructures in the harbour areas, the drainages, and the re-perimeter of the sites of national interest that requires remediation have been streamlined. The law provides for the allocation of resources as of 2020 to finance the activities strictly related to the digitization of the Country’s logistics with reference to ports, interports, railways, road haulage, also to ensure the achievement of the sustainability objectives in the goods transportation sector, as well as for the completion of investments, with particular attention to issues of Southern Italy.
With regard to road and motorways infrastructure safety, a comprehensive review of the dynamic monitoring system for the safety of bridges and viaducts and similar works on roads and motorways is planned23, as well as its integration with safety guidelines
With regard to the airport sector, as compensation for the losses suffered during the pandemic, the duration of the current concessions is extended by two years.
Environment and energy – CSR 3
In line with the Government’s objective of concentrating investments on environmental transformation and the Green economy, a substantial part of the ‘Simplifications’ decree is dedicated to facilitating authorisation procedures and simplifying the regulatory framework in support of the Green New Deal.
In particular: i) the existing deadlines for the screening stage of the environmental impact assessment (EIA) and the release of the single
22This provision simplifies and makes more effective the measure for southern enterprises provided for in the Budget Law for 2020. A MISE ministerial decree, in agreement with the MEF, will define a dedicated instrument (cd.‘Sabatini Sud’) which lays down specific operational arrangements and the provision of a single contribution at the end of the investment programme, as well as the possibility of using the European Funds.
23 Introduced by art. 14 of Decree Law No. 109/2018.
| 116 | MINISTRY OF ECONOMY AND FINANCE
|
IV. The ReFORMS And the recommendations of the Council of the European Union
environmental measure have been reduced and a specific framework has been created for the environmental assessment of the projects necessary for the implementation of the National Integrated Energy and Climate Plan (NECP); ii) a specific procedure has been established to speed up and simplify environmental and landscape permits for existing road, motorway, rail and water infrastructure operations falling within the scope of the EIA; iii) the Environmental Code has been amended to broaden and simplify certain interventions on sites that requires remediation, including sites of national interest24.
A number of interventions have been put in place in order to further speed-up actions for the development of renewable energies and sustainable mobility: i) the simplification and rationalisation of administrative procedures for the construction of renewable energy installations; ii) the introduction of accelerating mechanisms for the upgrading or reconstruction of obsolete installations; iii) intervention on the discipline of checks and penalties in the field of incentives, in order to ensure certainty and stability for long-term investments25.
The procedural simplifications in the field of energy also extend to the infrastructures forming part of the national electricity transmission network and the national natural gas transport network, which may also be authorised in the course of approval of the first ten-year development plan for the respective networks in which they have been incorporated26.
In addition, the Ministry of Economic Development (MISE) will adopt national guidelines to simplify the authorisation procedures for the construction and operation of the electricity distribution network infrastructure, through the adoption of a single authorisation covering all related works and infrastructures essential to the operation of the infrastructure. Also for the renewal of plants for the production and storage of energy, the decree introduces simplified procedural modalities.
As part of the actions included in the European Green New Deal, the Ministry of Agricultural, Food and Forestry Policies (MIPAAF) is entitled with the task of drawing up an extraordinary programme on the contribution of the agricultural, agri-food, forestry and fisheries system to the ecological transition and the achievement of the objectives of the Community strategies on Green Deal, Farm to fork and biodiversity, including the maintenance of forest and rural areas, in line with the UN’s 2030 Sustainable Development Goals.
Finally, the decree defines specific economically viable projects for which state guarantees can be provided. These guarantees27 will be granted by SACE S.p.A. according to the limit set annually by the Budget Law.
24Provided that they do not undermine or interfere with the execution and completion of the remediation or pose risks to the health of workers.
25With regard to renewable energies, the ‘Simplifications’ Decree allows: a) to finalise intergovernmental agreements in which Italy is an active participant in the transfer to other EU Member States of a share of its renewable energy surplus from FER; b) smaller municipalities with less than 20,000 inhabitants to take advantage of the mechanism of exchange on the spot so-called ‘altrove’, to provide support to the most disadvantaged sections of society.
26They may undergo public debate in accordance with the procedures laid down in internal and European legislation.
27On the obligations of SACE S.p.A. arising from the guarantees, the State guarantee on first request and without recourse is automatically granted. The operation will be registered by SACE S.p.A. with separate management.
MINISTRY OF ECONOMY AND FINANCE
| 117 |
UPDATE OF THE Economic and Financial Document 2020
Among the actions supporting sustainable mobility, the decree regulates the construction of charging infrastructures for electric vehicles in special parking areas. In order to facilitate the use of electric vehicles, the Authority of Sector (ARERA) will have to set the tariffs for the supply of electricity for the recharging of vehicles. Moreover, according to the ‘Relaunch’ decree, as converted into law, additional incentives from EUR 1,500 to 2,000 for the purchase of electric and hybrid vehicles for the period August-December 2020 have been provided.
Justice – CSR 4
With regard to the judiciary, numerous provisions have been introduced concerning the telematic process and web-hearings in the civil process. These measures are provisional until 31 October 2020 and are intended as an extension of existing measures covering the period from 12 May to 30 June. With regard to the criminal trial, participation in criminal hearings of defendants in pre-trial detention and convicted persons will be assured through video conferencing or remote connections. Provisions have also been introduced to deal with the electronic filing of applications and acts at the offices of the Prosecutor during the preliminary investigations by the defenders and the judicial police. In addition to these emergency measures, the NRRP will contain a more organic redevelopment of the judiciary.
Meanwhile, in August a bill for the reform of the Superior Council of the Magistrate (CSM) and the judiciary was passed28.
Public Administration – CSR 4
‘Simplifications’ Decree introduces significant innovations to the discipline of administrative proceedings and responsability of public officials. In order to ensure greater certainty and speed to administrative action, the general law on administrative procedure is amended, through corrections and adjustments to certain institutions governed by the law and identified on the basis of the problems of application emerged over time.
In order to facilitate a reduction in time, a ‘extraordinary Conference of Services’ procedure is foreseen, which can be used until 31 December 2021 to allow Public Administrations to proceed through electronic transmission of the documents necessary for the administrative procedure.
28The draft law prohibits within the CSM the formation of groups among its members so that each member can perform his/her duties in complete independence and impartiality.The reform then provides for a new electoral law for the elected members of the CSM, which will return to be 30 (20 ‘togati’ i.e. magistrates elected by other magistrates, and 10 ‘laity’ i.e. elected by the Parliament).There are also new provisions for the composition of committees to be formed by draw:magistrates who will be part of the disciplinary section of the CSM may not be part of other committees;the appointments for the other top posts in the judiciary will have to be made in accordance with the order in which the posts have become vacant and therefore not many appointments can be approved at the same time.It is also expected that magistrates who decide to enter politics will no longer be able to exercise their duties as magistrates, while magistrates who apply to Parliament (European or national) or for positions in regional councils and juntas or autonomous provinces will not be able to do so in the provinces where they serve or where they have done so in the previous two years.Finally, the members of the CSM chosen by Parliament will not be able to have governmental or regional roles in the previous two years.
| 118 | MINISTRY OF ECONOMY AND FINANCE
|
IV. The ReFORMS And the recommendations of the Council of the European Union
The decree also amends the Statutes of businesses by providing that, where State legislation introduces a new burden that is not compensated by a reduction of charges of equal value, that burden is classified as tax deductible29.
The adoption of a ‘Simplification Agenda for the period 2020-2023’ has been also provided. The Agenda covers guidelines and the programme of simplification measures for recovery following the covid-19 emergency, as well as the timetable for their implementation30.
As regards the audit by the Court of Auditors over the state public administrations under way, a special simplified procedure is introduced to detect serious irregularities and delays in the payment of contributions to support and revitalise the national economy. Moreover, the rules on the offence of abuse of office are amended, where the objective element of the case is limited to the violation of specific rules of conduct expressly provided by a law.
In order to strengthen the digitisation of the Public Administration, the ‘Simplifications’ Decree envisages various actions for the development and strengthening of the technological infrastructures of the PA such as: i) the National Digital Data Platform31, aimed at achieving interoperability of information systems and databases of Public Administrations and public service managers; ii)the creation of a highly reliable infrastructure distributed throughout the country, designed to rationalise and consolidate the Centres for the Processing of Information (EDCs) of the Public Administration32.
Digitising the PA will also allow the deployment of public services on the network and facilitate access by citizens and businesses through the following measures:
| • | It is expected that the Administrations – from 28 February 2021 – only use digital identities and the electronic identity card (CIE) for access to their online services and start processes of digital transformation in order to offer their services also through the mobile application ‘IO’33. For the storage services of computer documents, public and private parties must comply with the Guidelines of the Code of the Digital Administration. In addition, faster tools for the issue of Advanced Alectronic Signatures (AES) and, in the field of anti-money laundering, simplified recognition procedures for the use of payment cards and similar devices are provided. |
| • | The operating mode of the platform for the digital notification of acts of the PA has been indicated. With the launch of the platform, citizens will be able |
29 The rule concerns only regulatory burdens introduced by legislative acts falling within the competence of the State and not by general administrative measures.
30I t extends, inter alia, the scope of unified and standardised modules.
31 Art.50-ter of the Code of the Digital Administration (Legislative Decree No. 82 of 2005) has institutionalised the project of the National Data Digital Platform.
32 CED means the site that hosts a computer system for the provision of services internal to the public administrations and services provided externally by the same.
33The‘Simplification’ Decree provides that municipalities with a population of less than 5,000 inhabitants comply with the provisions relating to digital citizenship and access to digital services of the PA from the date scheduled for the cessation of the state of emergency by covid-19.In addition, municipalities must ensure the interoperability of electronic means of payment of travel documents, including by entering into agreements with private entities, in order to establish specific digital platforms aimed at simplifying the way revenues from traffic from local public transport services under municipal competence are collected, and to counter their escape.
MINISTRY OF ECONOMY AND FINANCE
| 119 |
UPDATE OF THE Economic and Financial Document 2020
to receive notifications of acts and measures of the PA via electronic communication rather than on paper registered letter.
| • | In terms of accessibility to IT and telematic services for disabled people, the decree extends requirements for the PA also to private individuals, with a turnover exceedings 500 million offering services to the public through websites or mobile applications. It also provides for the establishment of a single national computerised platform of plates associated with circulation permits of holders of disabled markings that will become valid throughout the national territory. |
| • | There is no exclusivity in the municipalities of the function of issuing the certification of personal data, which can be carried out by the Ministry of the Interior via telematics. It is also stipulated that the National Register of the Resident Population (ANPR) shall assign a unique code to each citizen in order to ensure personal circularity and interoperability with other databases. |
• In order to make technological innovation initiatives as homogeneous as possible, a new code of technological conduct on the design, development and implementation of projects, systems and digital services of public administrations is introduced within the Code of Digital Administration34.
34It introduces an obligation for public service dealers to make available to the providing Administration all data acquired and generated in the provision of IT services to users.
| 120 | MINISTRY OF ECONOMY AND FINANCE
|
The Update of the
ECONOMIC AND FINANCIAL DOCUMENT 2020
is available on-line
at the internet address listed below:
www.mef.gov.it www.dt.tesoro.it/ www.rgs.mef.gov.it
ISSN: 2240-0702