Exhibit 22
INDEX
| I | DEBT MANAGEMENT OBJECTIVES FOR 2019 | 1 |
| | | |
| I.1 | The Treasury’s objectives and international debt management practices | 1 |
| I.2 | 2019 Objectives: The institutional framework of reference | 4 |
| I.3 | Curbing the cost of debt while paying attention to the cost/risk profile | 8 |
| I.4 | Monitoring and managing the Cash Account to stabilise the balance | 17 |
| | | |
| II. | THE ITALIAN GOVERNMENT SECURITIES MARKET: PERFORMANCE IN THE INTERNATIONAL CONTEXT | 21 |
| | | |
| II.1 | Monetary policies and effects on the Euro area money market | 21 |
| II.2 | Euro area bond markets | 24 |
| II.3 | Trends in the Italian government securities market | 28 |
| | | |
| III. | PUBLIC DEBT MANAGEMENT IN 2019 | 47 |
| | | |
| III.1 | Outstanding General Government debt | 47 |
| III.2 | Government securities activities | 48 |
| III.3 | Derivatives portfolio management | 76 |
| III.4 | Debt management results in relation to objectives | 78 |
III.5
| The Treasury’s cash management | 90 |
| ANNEXES | 99 |
| | |
| Annex 1: | The Treasury's involvement in international discussions on debt management | 99 |
| Annex 2: | The Department of the Treasury's Public Debt Directorate: organisational structure | 101 |
| Annex 3: | SAPE (Issuance Portfolio Analysis Software) | 104 |
Annex 4:
| Derivatives used by the Treasury: role, types and collateralisation system | 106 |
| | | |
| STATISTICAL ANNEX | 111 |
| ITALIAN MINISTRY OF ECONOMY AND FINANCE | I |
INDEX OF TABLES
| Table I.1: | Domestic government securities | 5 |
| Table I.2 | Objectives for the end of 2019: percentage composition of the debt portfolio | 6 |
| Table III.1: | Issues1, maturities and funding Government borrowing requirements (€ million) | 49 |
| Table III.2: | Government securities issued, net of exchange transactions (€ million) | 50 |
| Table III.3: | Allocations of nominal BTPs made through syndicated issue in 2019: geographical distribution | 56 |
| Table III.4: | Allocations of nominal BTPs made through syndicated issue in 2019: distribution by type of investor | 56 |
| Table III.5: | Electronic exchange on 20/03/2019 (€ million) | 74 |
| Table III.6: | Exchange via marginal auction on 21/06/2019 (€ million) | 74 |
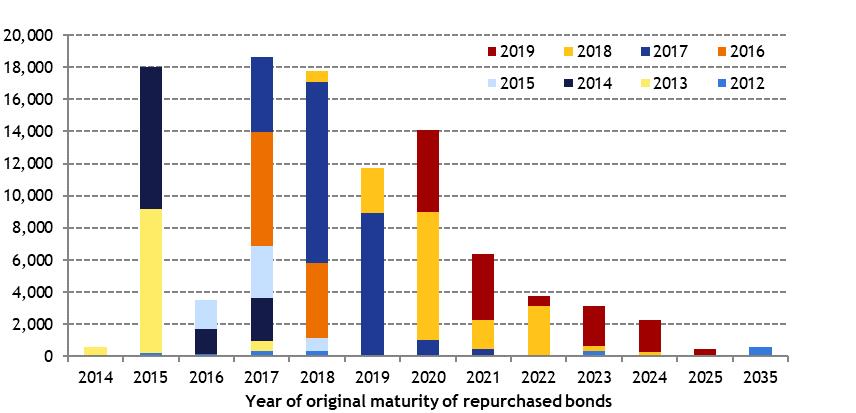
| Table III.7: | Summary of buybacks funded by the Cash Account (nominal amounts in € million) | 75 |
| Table III.8: | Composition of 2017-2019 issues, in absolute and percentage terms, excluding exchanges* | 78 |
| Table III.9: | Composition of 2017-2019 issues, in absolute and percentage terms, including exchanges* | 80 |
| Table III.10: | Average life of the stock of government securities | 82 |
| Table III.11: | Duration and ARP trend during the 2017-2019 period, relating to the stock of government securities before derivatives (in years) | 82 |
| Table III.12: | Duration and ARP trend during the 2017-2019 period, relating to the stock of government securities after derivatives (in years) | 83 |
| Table III.13: | Market value trend of the stock of government securities (€ million) | 85 |
| Table III.14: | Derivatives portfolio - 2018 and 2019 (€ million) | 86 |
Table III.15:
| Cash Account and investments of the treasury's liquidity at the end of each month - 2019 (€ million) | 97 |
| Gross issues at nominal value – securities up to two years (€ million) | 112 |
| Gross issues at nominal value – securities exceeding two years (€ million) | 114 |
| Gross issues at nominal value – re-opening of off-the-run securities (€ million) | 115 |
| Compounded gross yields at issuance of government bonds (weighted monthly average) | 116 |
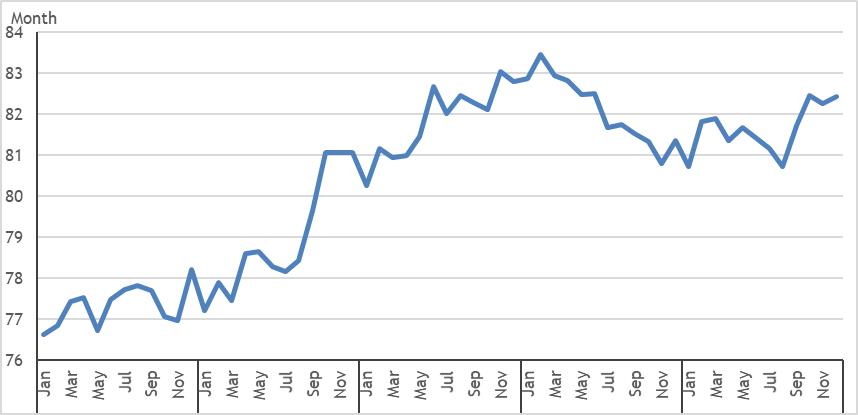
| Weighted average residual life of government bonds (months) | 117 |
| Compounded gross yields at issuance of government bonds – re-opening of off-the-run securities (weighted monthly average) | 118 |
| II | ITALIAN MINISTRY OF ECONOMY AND FINANCE |
I. DEBT MANAGEMENT OBJECTIVES FOR 2019 |
INDEX OF CHARTS AND FIGURES
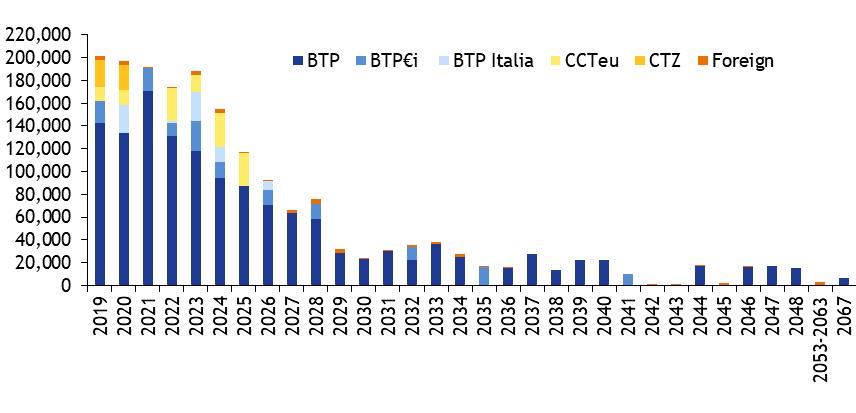
| Chart I.1: | Annual maturity profile of medium/long-term securities outstanding as at 31.12.2018 (€ million) | 9 |
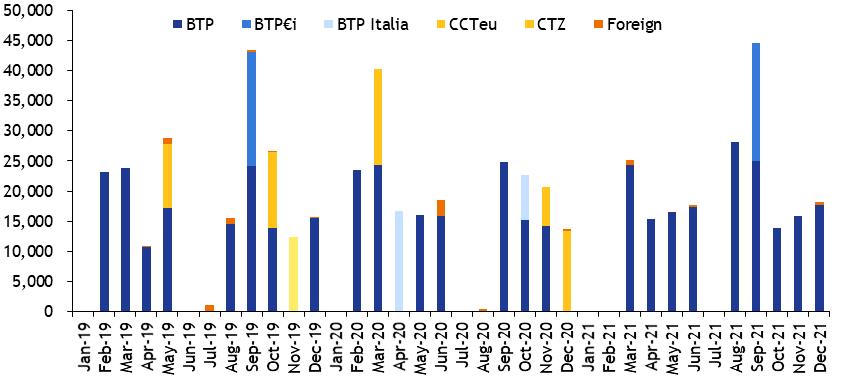
| Chart I.2 | Monthly maturity profile of medium/long-term securities outstanding as at 31.12.2018 (€ million) | 10 |
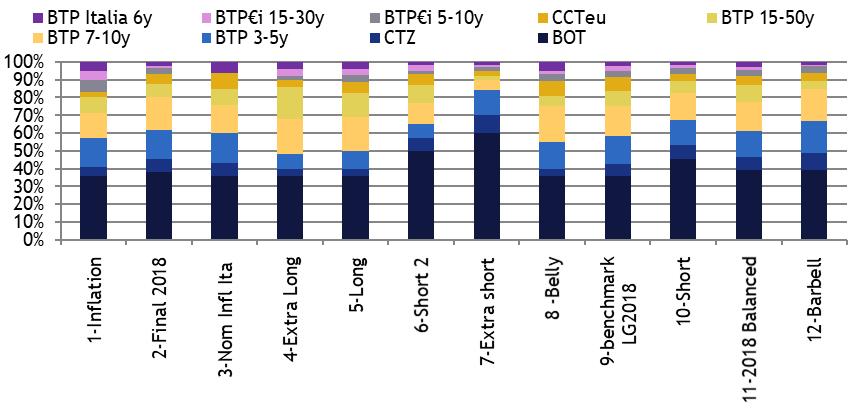
| Chart I.3: | Composition of the alternative issuance portfolios analysed for 2019 (€ million) | 13 |
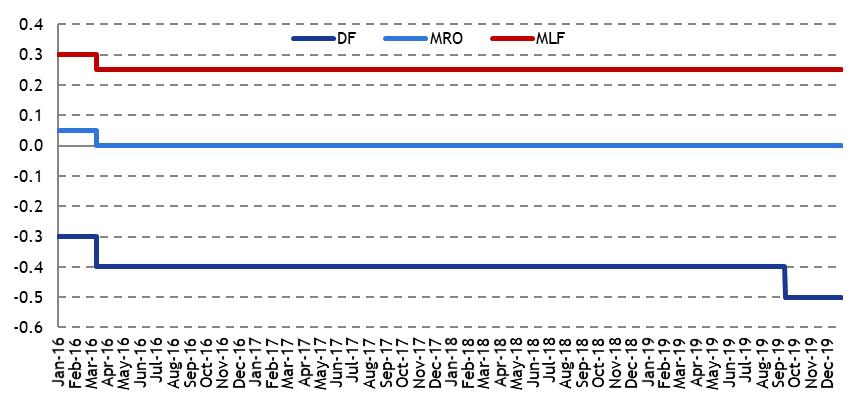
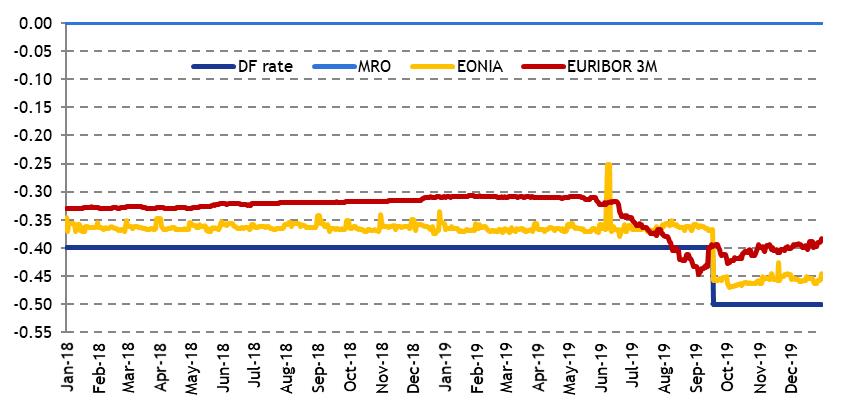
| Chart II.1: | Monetary policy interest rate corridor, 2016-2019 (percentage values) | 23 |
| Chart II.2: | Performance of the main money market rates, 2018-2019 (percentage values) | 24 |
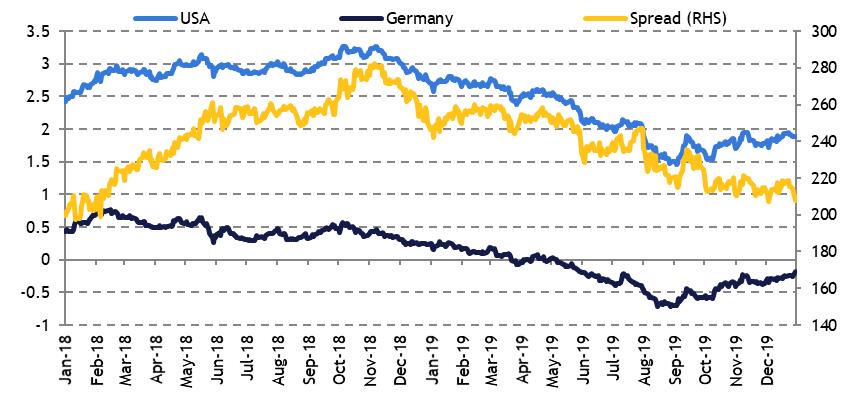
| Chart II.3: | Trend of German and US government bond yields - 10-year maturity (percentage values and spread in basis points) | 25 |
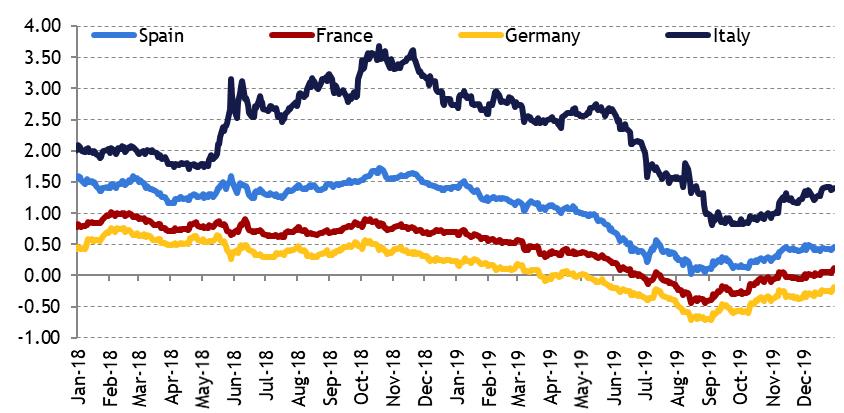
| Chart II.4: | Trend of european government bond yields - 10-year maturity (percentage values) | 26 |
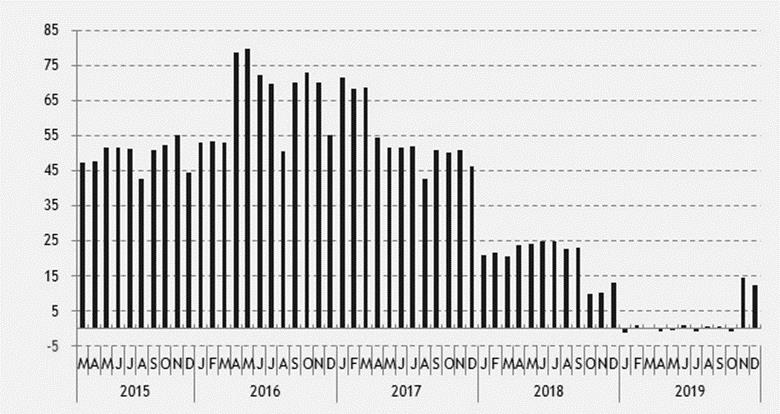
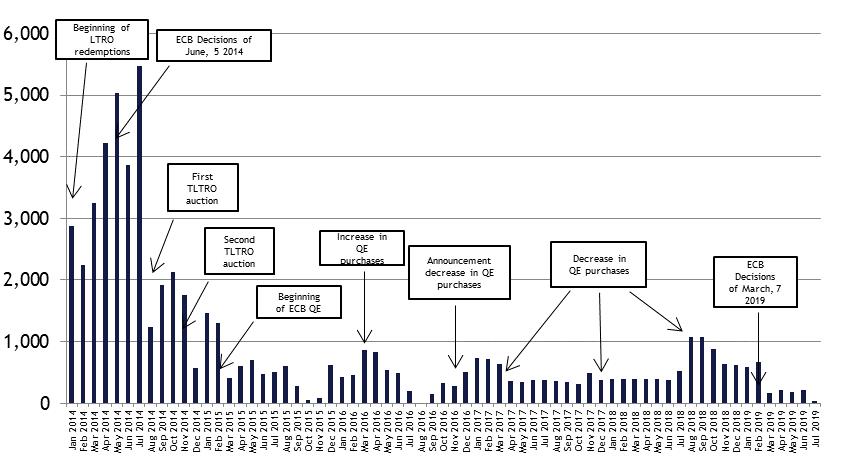
| Figure 1: | Net purchases under the APP programmes (€ billion) | 27 |
| Figure 2: | Volume and average life of the stock of Italian government securities purchased by the ECB | 28 |
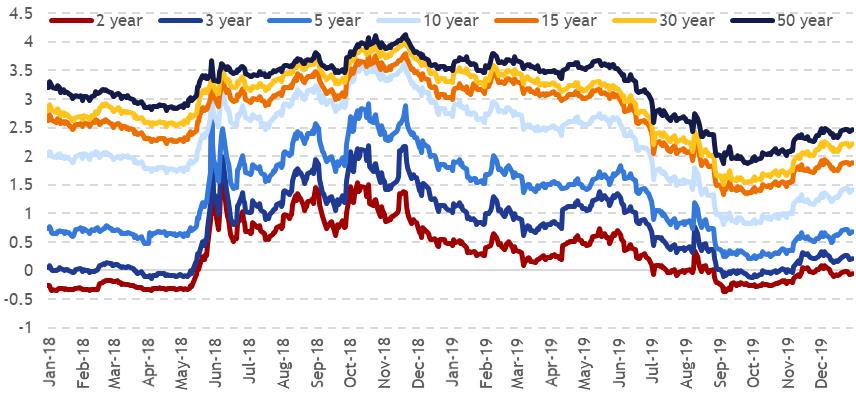
| Chart II.5: | Market yields on 2-, 3-, 5-, 10-, 15-, 30- and 50-year government securities (percentage values) | 29 |
| Chart II.6: | Government securities yield spread, 10-year vs. 2-year (basis points) | 29 |
| Chart II.7: | Government securities yield spread, 30-year vs. 10-year (basis points) | 30 |
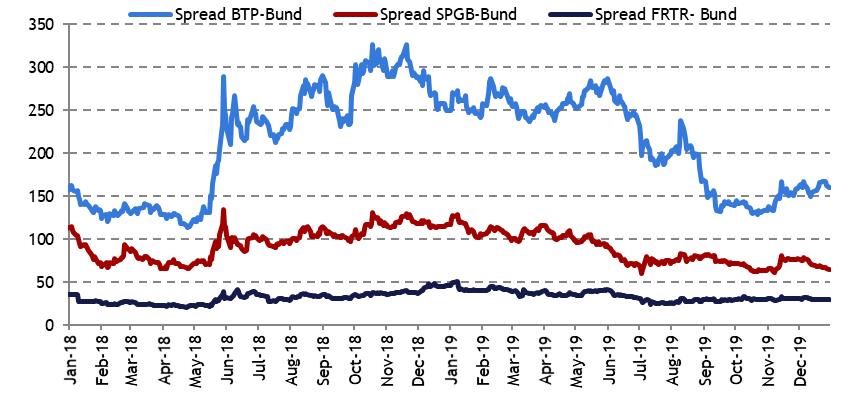
| Chart II.8: | Yield spread: BTP-Bund, OAT-Bund and Bonos-Bund, 10-year benchmark (basis points) | 30 |
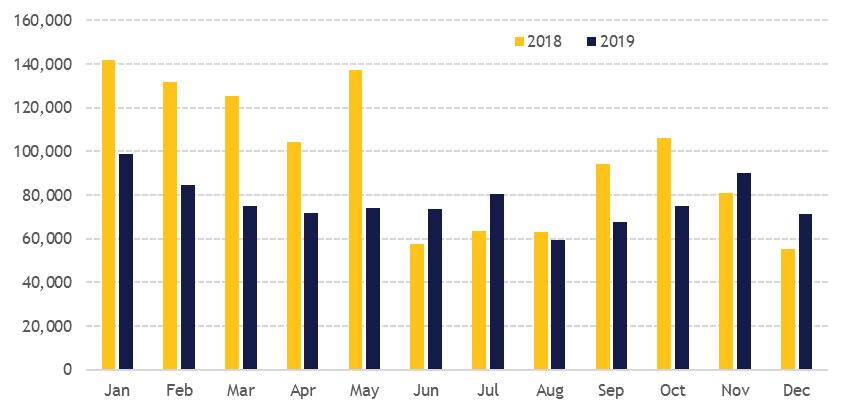
| Chart II.9: | Monthly volumes traded on the MTS platform (€ million; double-counted) | 32 |
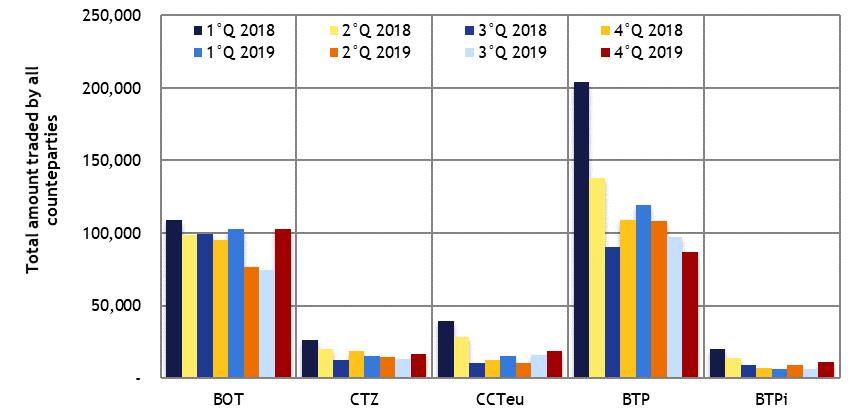
| Chart II.10: | Quarterly volumes traded on the MTS platform, by segment (€ million; double-counted) | 33 |
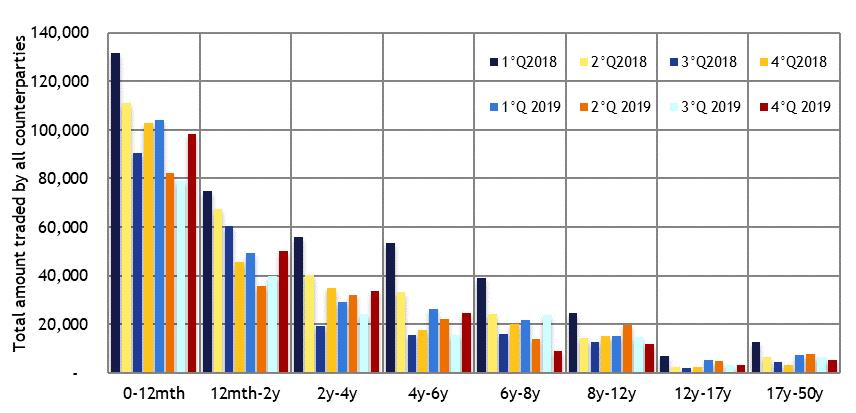
| Chart II.11: | Quarterly volumes traded on the MTS platform, by maturity (€ million; double-counted) | 34 |
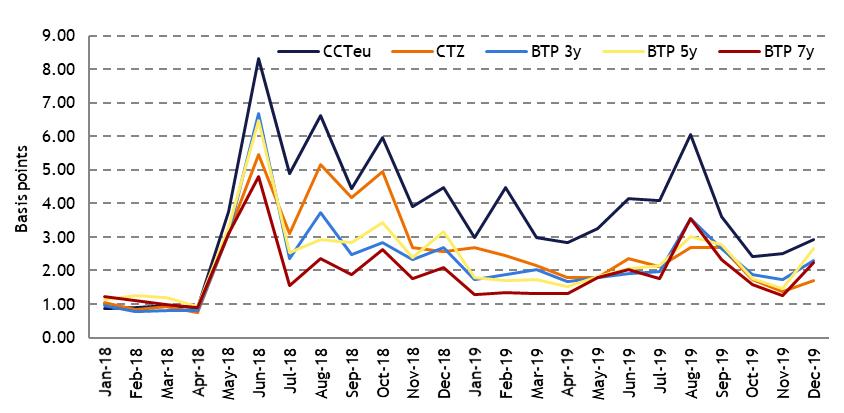
| Chart II.12a: | Bid-ask spread (in basis points) for CTZs, CCTeus, 3-, 5- and 7-year benchmark BTPs, as recorded on the MTS platform - monthly averages | 35 |
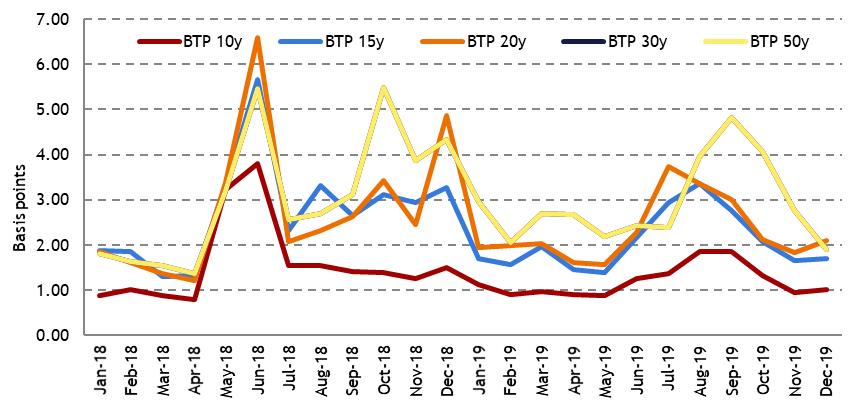
| Chart II.12b: | Bid-ask spread (in basis points) for 10-, 15-, 20-, 30- and 50-year benchmark BTPs, as recorded on the MTS platform - monthly averages | 35 |
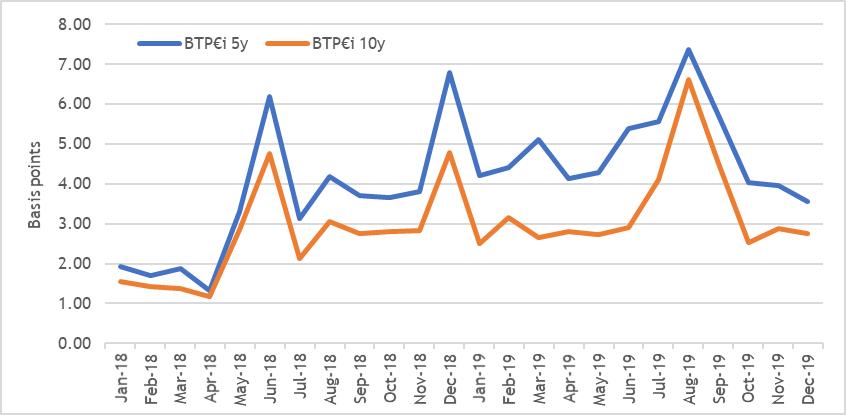
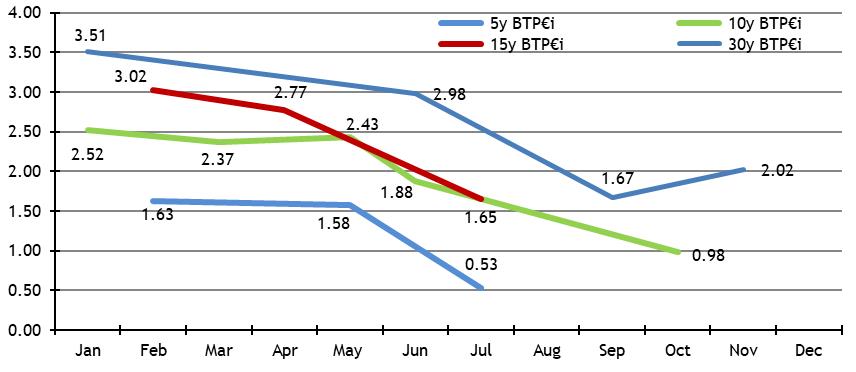
| Chart II.12c: | Bid-ask spread (in basis points) for 5- and 10-year benchmark BTP€is, as recorded on the MTS platform - monthly averages | 36 |
Chart II.12d:
| Daily slope on 10-year benchmark BTP (logarithmic scale), as recorded on the MTS platform | 37 |
Chart II.13:
| Annual volumes traded on the MTS platform in 2018 and 2019, by contract maturity (€ million) | 38 |
| ITALIAN MINISTRY OF ECONOMY AND FINANCE | III |
| Chart II.14: | Monthly volumes traded on the MTS platform in 2019, by contract maturity (€ million) | 38 |
| Chart II.15: | Monthly special repo volumes traded on the MTS platform (€ million) | 39 |
| Chart II.16: | Annual volumes traded by Specialists on the MTS platform (%) | 40 |
| Chart II.17: | Monthly volumes traded by Specialists on platforms other than the MTS (€ million) | 41 |
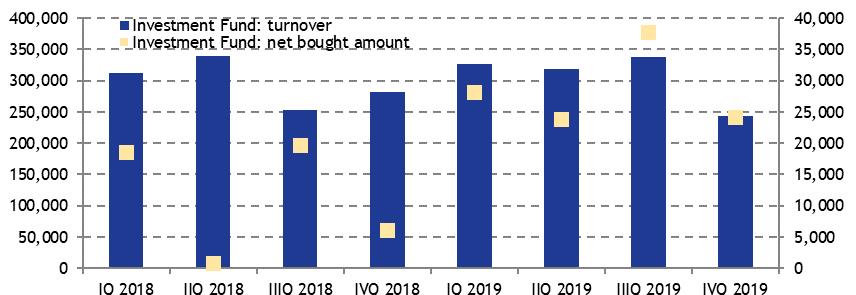
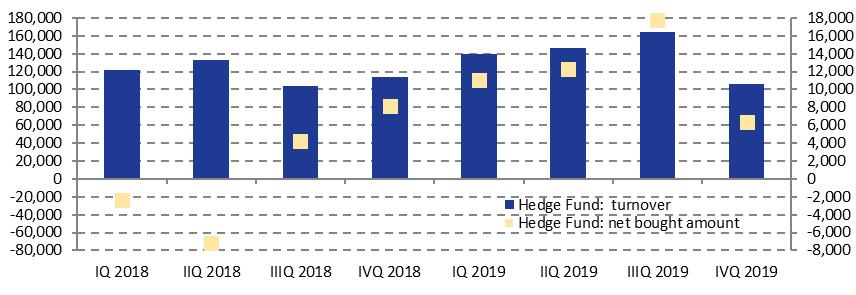
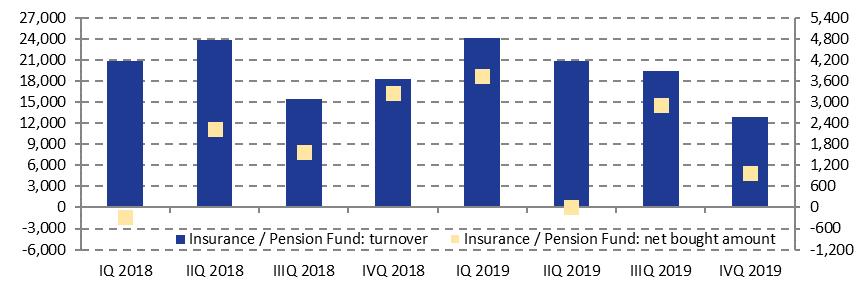
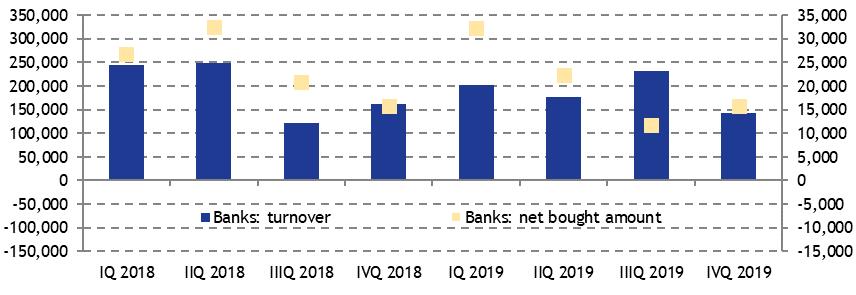
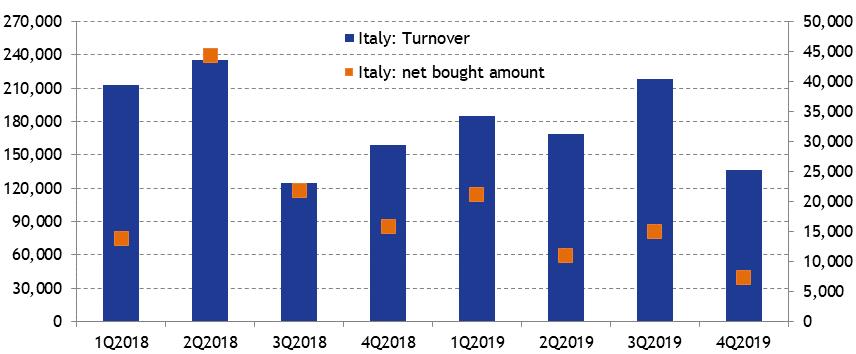
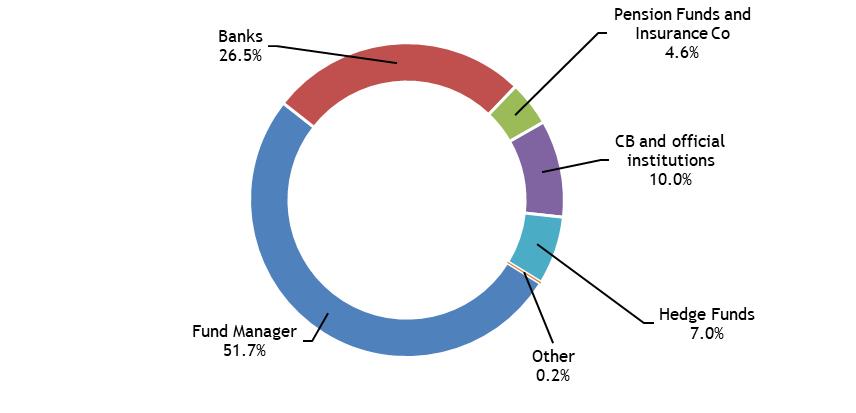
| Chart II.18: | Quarterly volumes traded by specialists, by type of counterparty - fund managers, banks, pension funds and insurance companies, hedge funds (€ million) | 43 |
| Chart II.19: | Quarterly volumes traded by Specialists according to counterparty residence (€ million) | 44 |
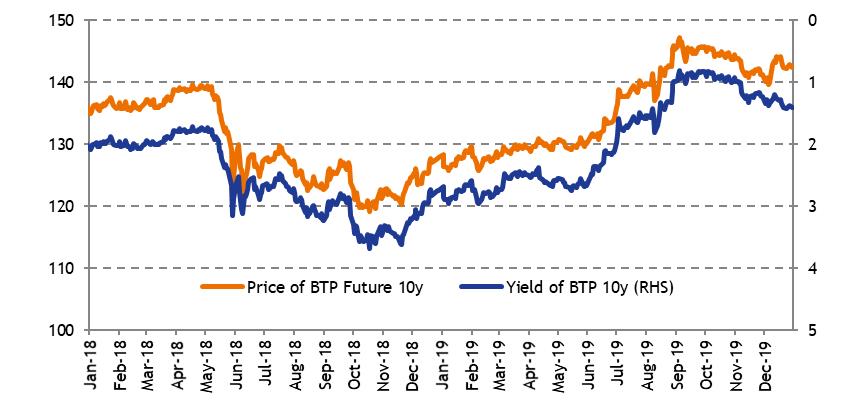
| Chart II.20: | Prices of the BTP Future and yield of the 10-year benchmark BTP (right-hand scale inverted, in %) | 45 |
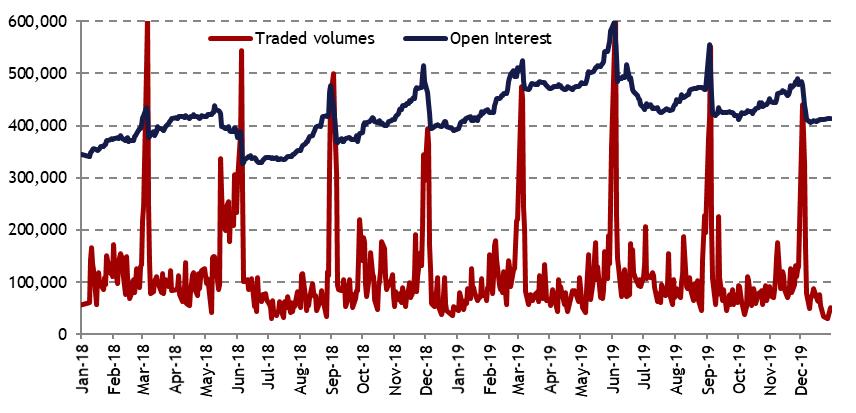
| Chart II.21: | Volumes of lots traded and open interest for the 10-year BTP Future contract traded on the eurex market | 46 |
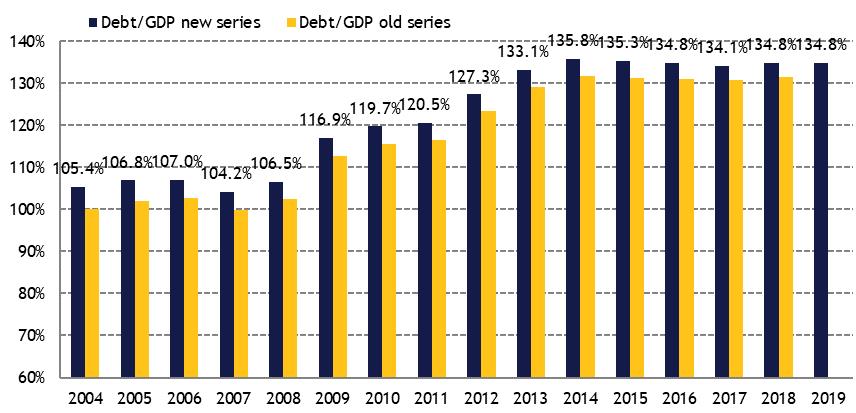
| Chart III.1: | Debt-to-GDP ratio trend 2005-2019 | 48 |
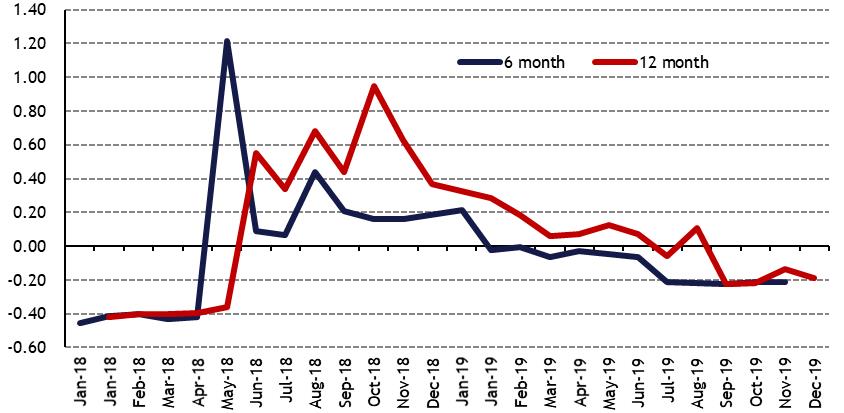
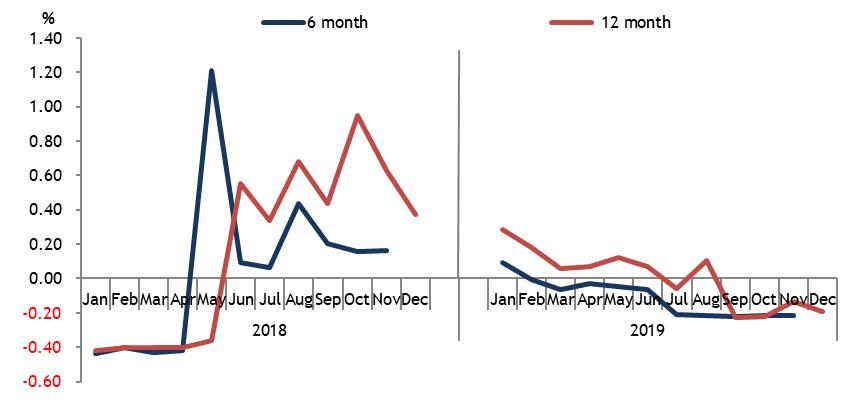
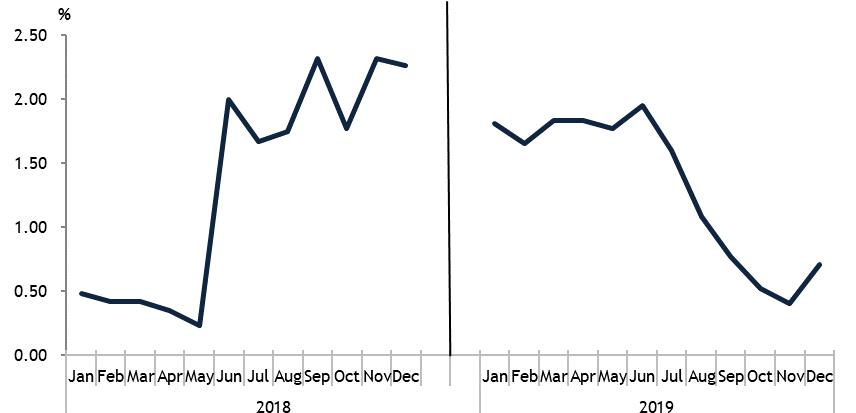
| Chart III.2: | Gross compound yields at issuance for 6-month and 12-month BOTs, 2018-2019 (percentage points) | 51 |
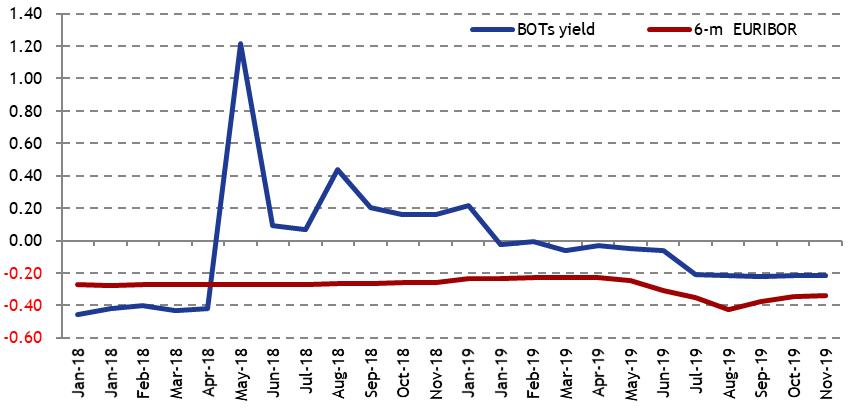
| Chart III.3: | Yield at issuance for 6-month BOTs and comparison with the Euribor rate - 2018-19 (percentage rates) | 52 |
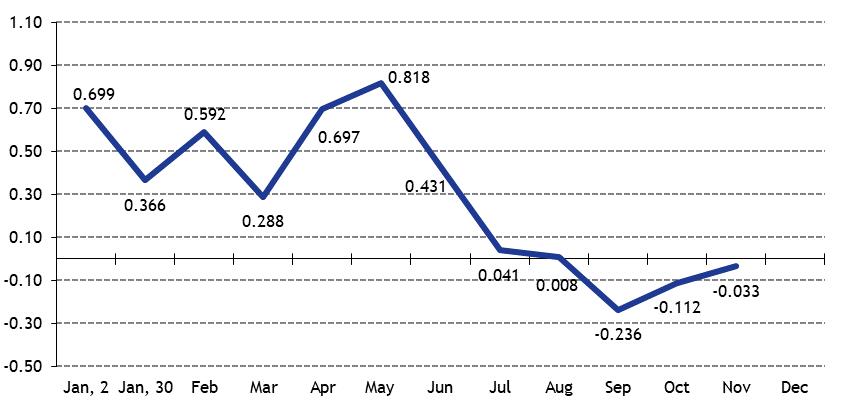
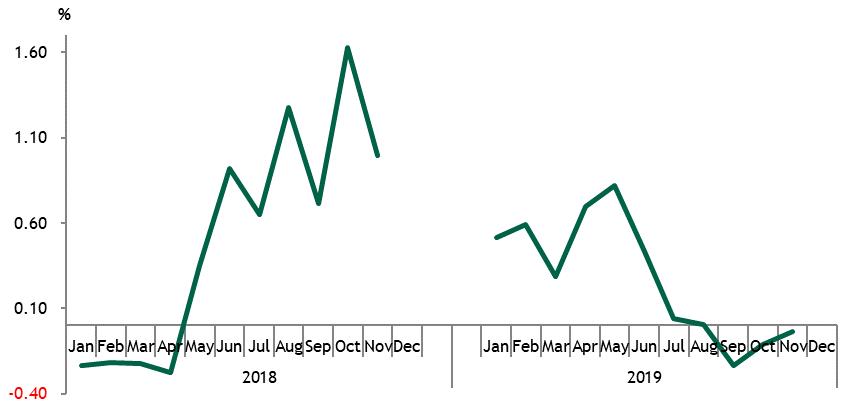
| Chart III.4: | Yield at issuance for CTZs (percentage rates) in 2019 | 54 |
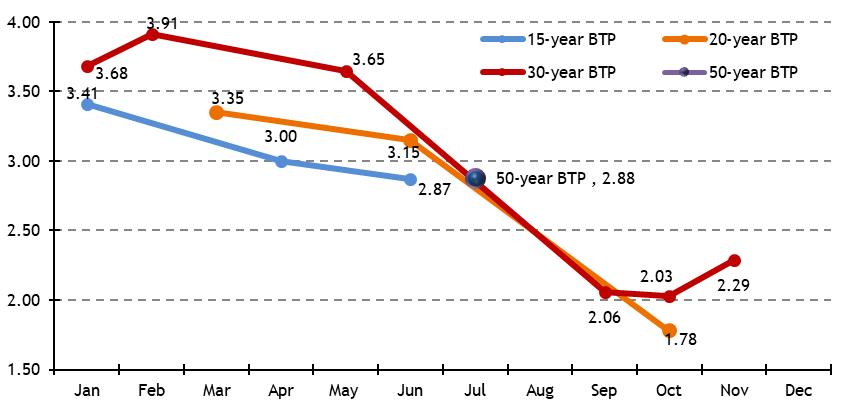
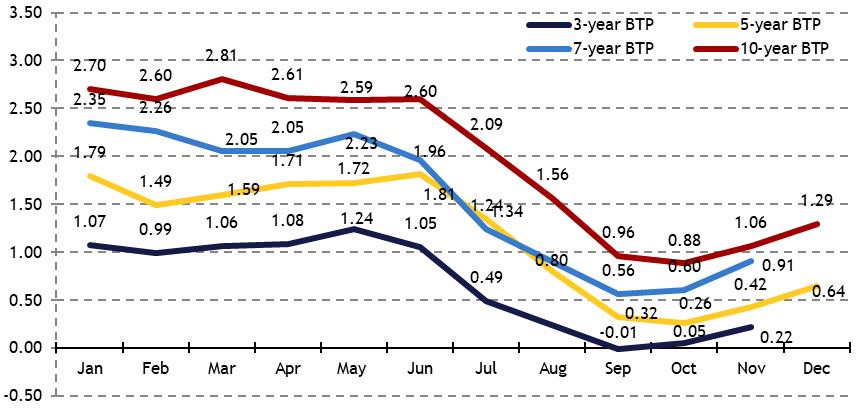
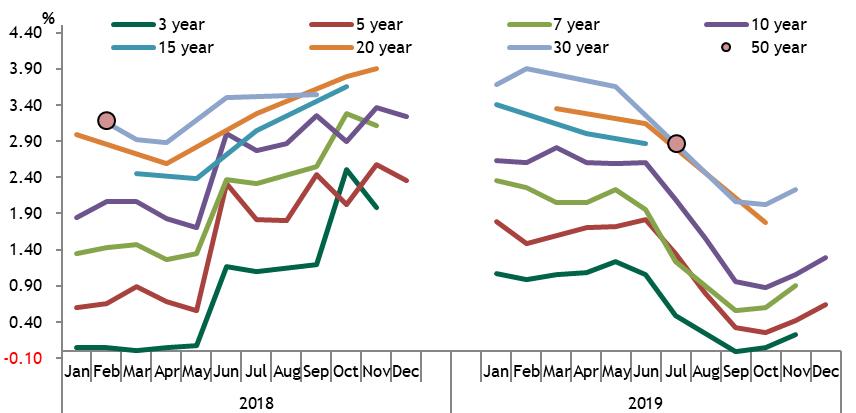
| Chart III.5: | Yield at issuance of long-term BTPs in 2019 (percentage rates) | 57 |
| Chart III.6: | Yield at issuance of BTPs with a maturity of between 3 and 10 years in 2019 (percentage rates) | 60 |
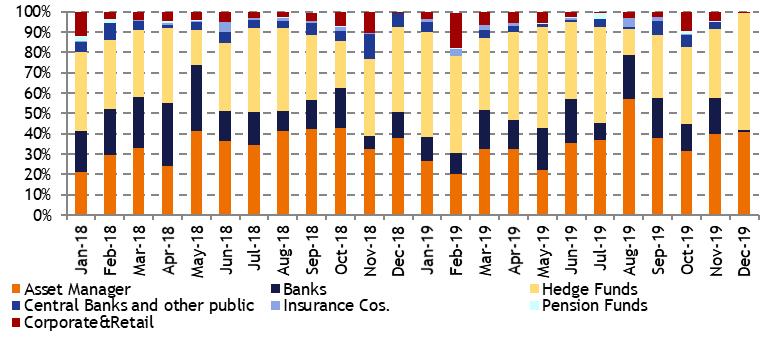
| Figure 3: | Orders taken to nominal BTP auctions by government Bond Specialists: composition by type of investor - 2019 | 61 |
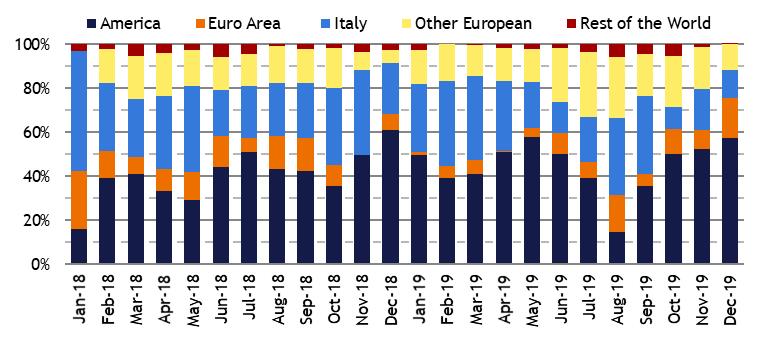
| Figure 4: | Orders taken to nominal BTP auctions by government Bond Specialists: composition by geographical area - 2018-2019 | 62 |
| Chart III.7: | The new 10-year BTP€i 15/05/2030: geographical distribution | 63 |
| Chart III.8: | The new 10-year BTP€i 15/05/2030: distribution by type of investor | 63 |
| Chart III.9: | Real yields at issuance for BTP€Is In 2019 (percentage rates) | 65 |
| Chart III.10: | 10-year break-even inflation (BEI), 2018-2019 (basis points) | 65 |
| Chart III.11: | Results of the placement of the BTP Italia maturing on 28 october 2027, for € 6,750 million | 66 |
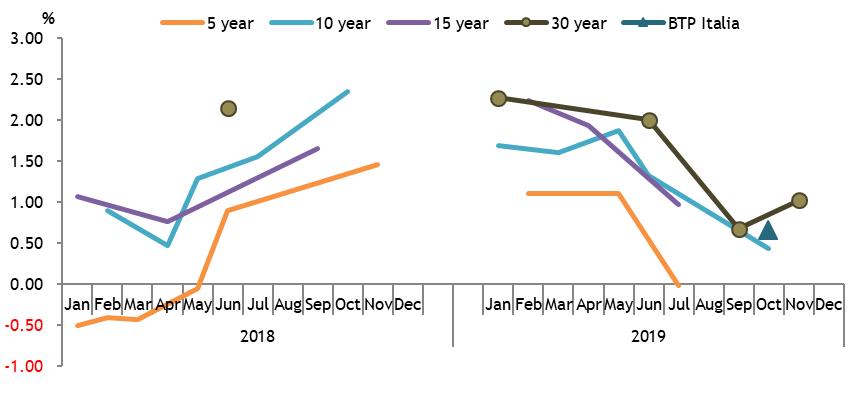
| Chart III.12: | Yields at issuance of CCTeus in 2019 (percentage rates) | 68 |
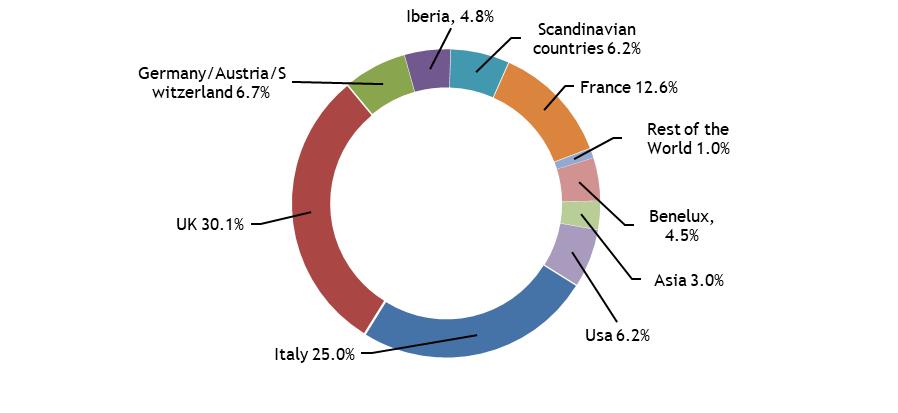
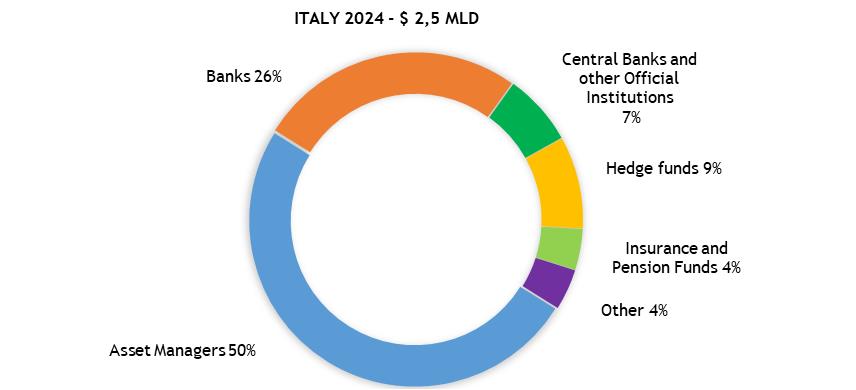
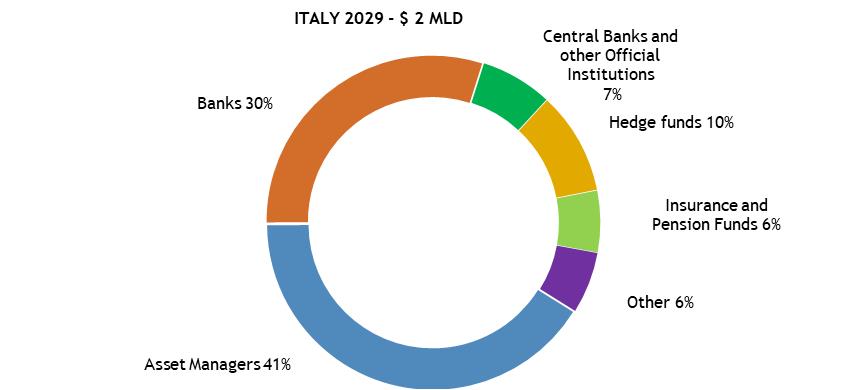
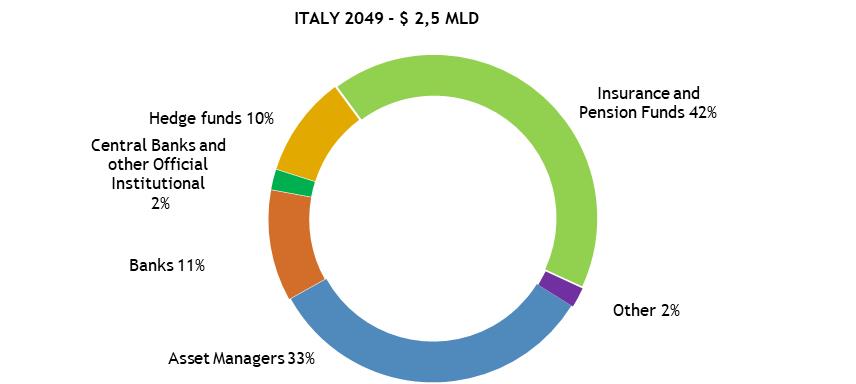
| Chart III.13: | Geographical distribution of the usd issue | 70 |
| Chart III.14: | Distribution of the USD issue by type of investor | 71 |
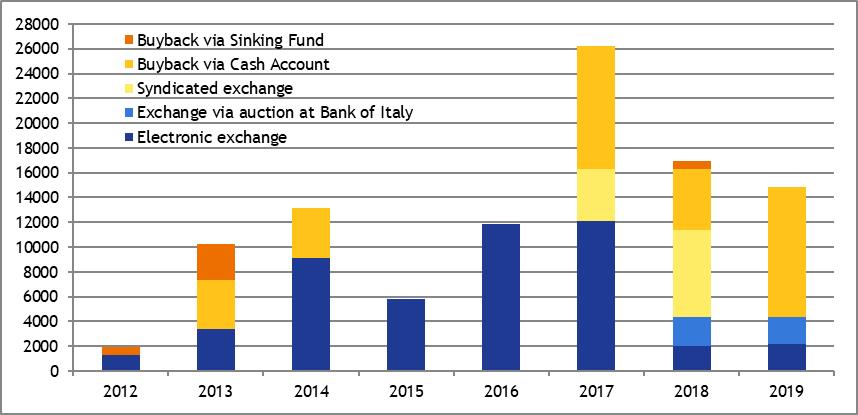
| Chart III.15: | Buyback amount as part of extraordinary transactions - 2012-2019 (nominal amounts in € million) | 73 |
| Chart III.16: | Effects on government Bonds repurchased in extraordinary transactions between 2012 and 2019 (nominal amounts in € million) | 75 |
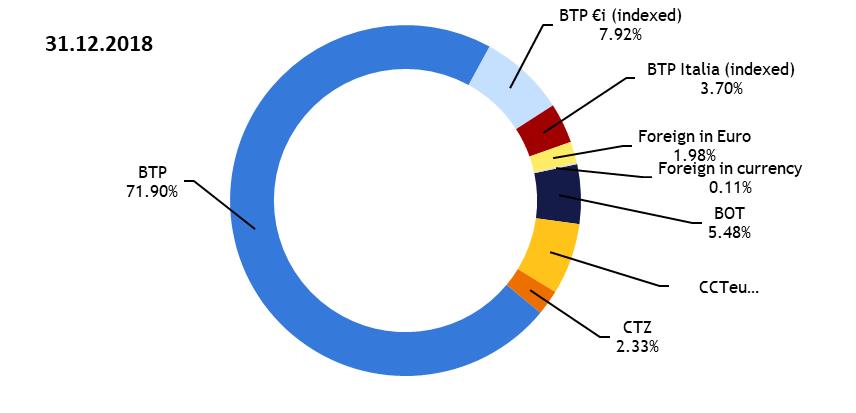
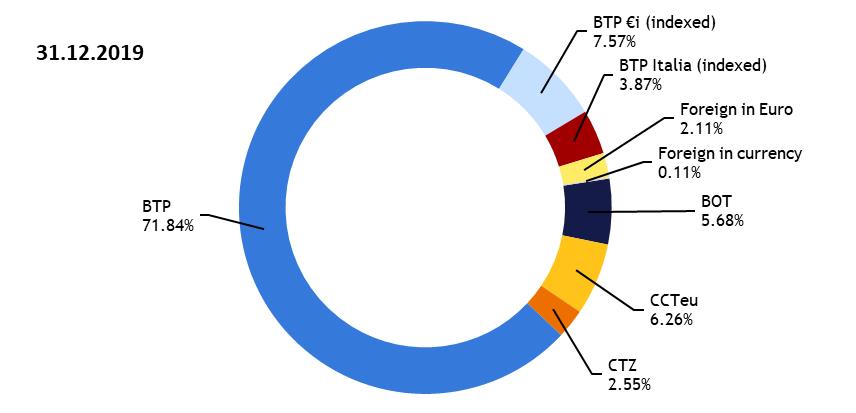
| Chart III.17: | Composition of the stock of government securities at 31 december 2018 and at 31 december 2019 | 81 |
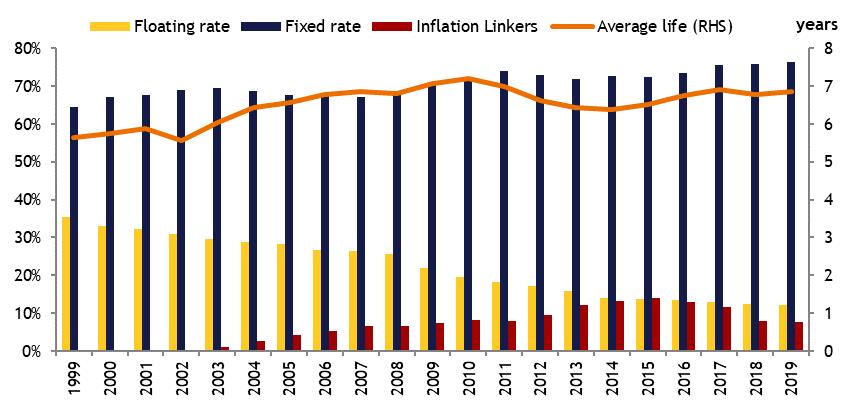
| Chart III.18: | Evolution of the structure and average life of debt (in years) | 82 |
Chart III.19:
| Maturities by residual life, 2017-2019 | 83 |
| IV | ITALIAN MINISTRY OF ECONOMY AND FINANCE |
I. DEBT MANAGEMENT OBJECTIVES FOR 2019 |
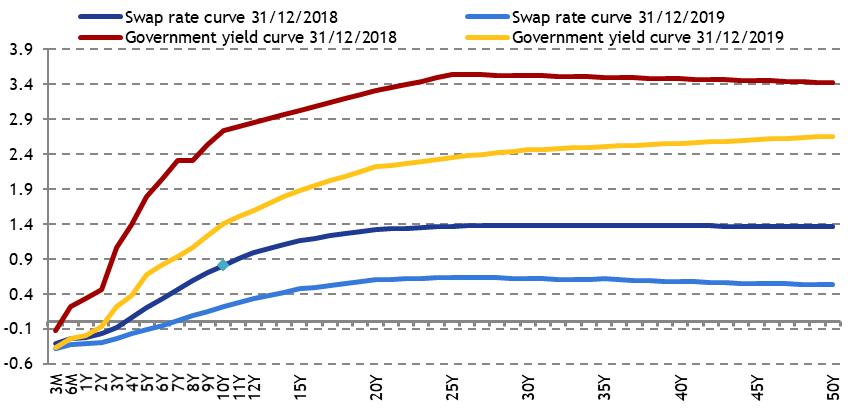
| Chart III.20: | Euro swap curve and italian government securities yield curve at 31/12/2018 and 31/12/2019 | 85 |
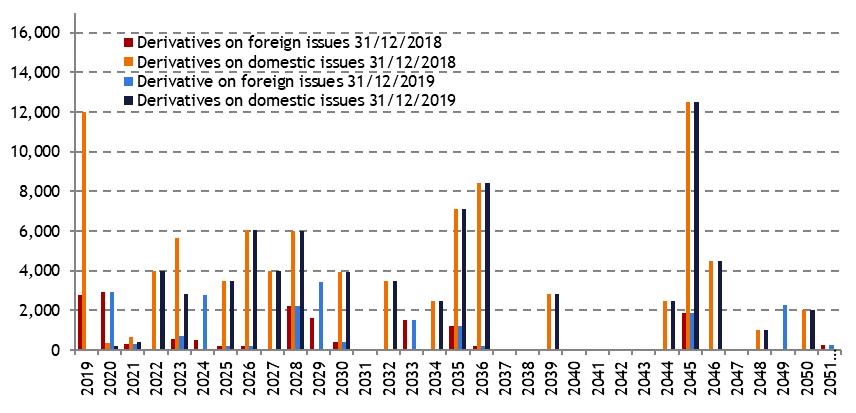
| Chart III.21: | Comparison between the prospective trend of the notional amount for the existing derivatives portfolio, as at 31/12/2018 and 31/12/2019 respectively, assuming that all swaptions are exercised (€ million) | 88 |
| Chart III.22: | Comparison between the maturity structure of the existing derivatives portfolio, as at 31/12/2018 and 31/12/2019 respectively, assuming that all swaptions are exercised (€ million) | 88 |
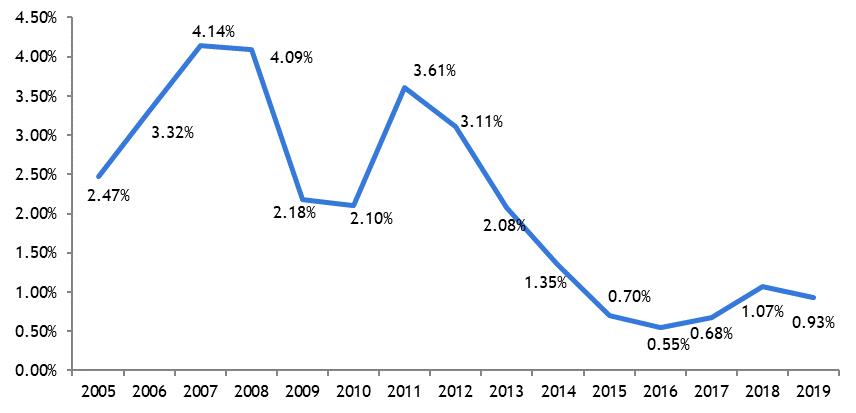
| Chart III.23: | Average cost at issuance of government securities - 2005-2019 (percentage rates) | 89 |
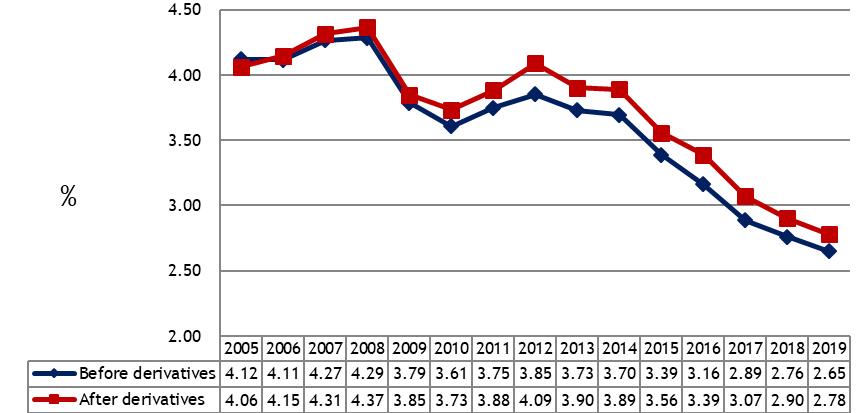
| Chart III.24: | Average cost of the stock of government securities, before and after derivatives - 2005-2019 (percentage rates) | 90 |
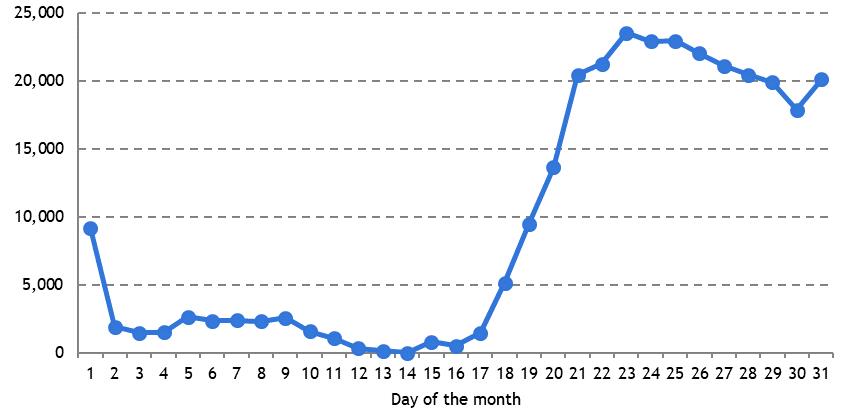
| Chart III.25: | Average intra-monthly changes in the treasury’s available cash - differences compared with the monthly minimum - 2019 (€ million) | 92 |
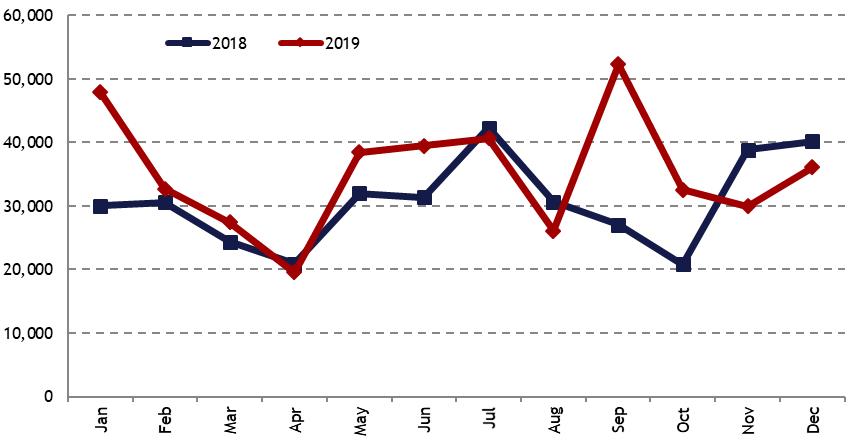
| Chart III.26: | Difference between the maximum and minimum monthly balance of the Treasury’s Cash Account (€ million) | 93 |
| Chart III.27: | Average investment at daily OPTES auctions (€ million) | 94 |
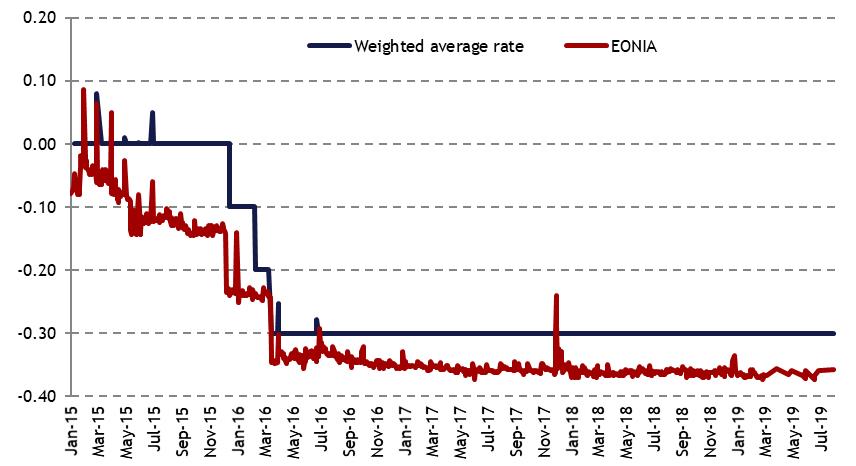
| Chart III.28: | Trend in overnight rates on the money market and weighted average rate at OPTES auctions - 2015-19 (percentage rates) | 95 |
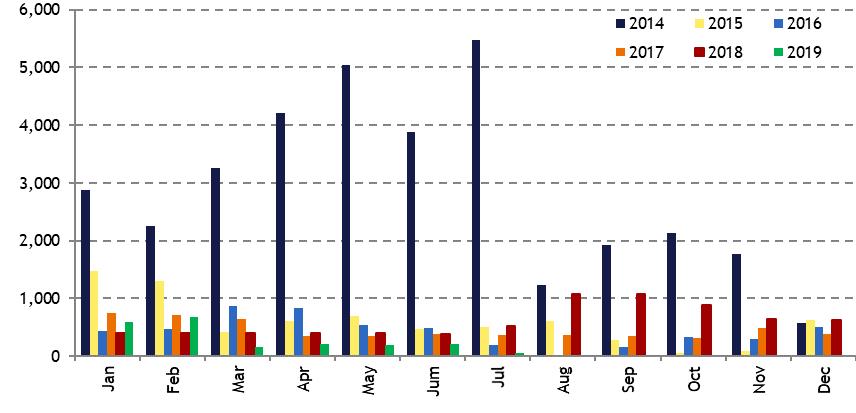
| Chart III.29: | Average monthly investment at daily OPTES auctions - 2014-2019 (€ million) | 96 |
Chart III.30:
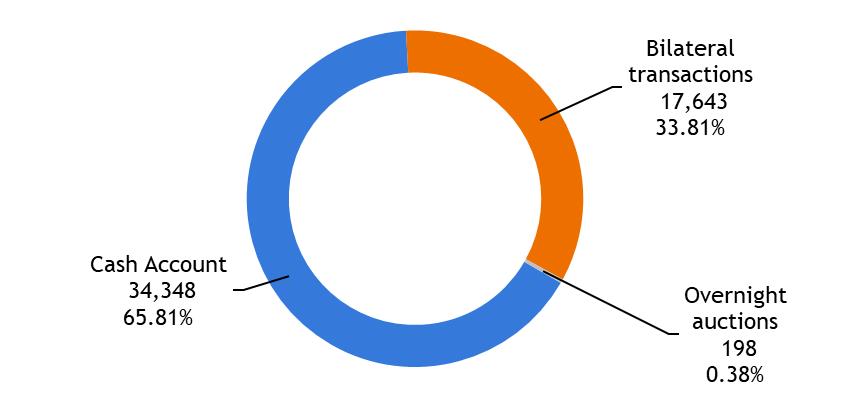
| Breakdown of the treasury’s liquidity - average values for 2019 (€ million) | 96 |
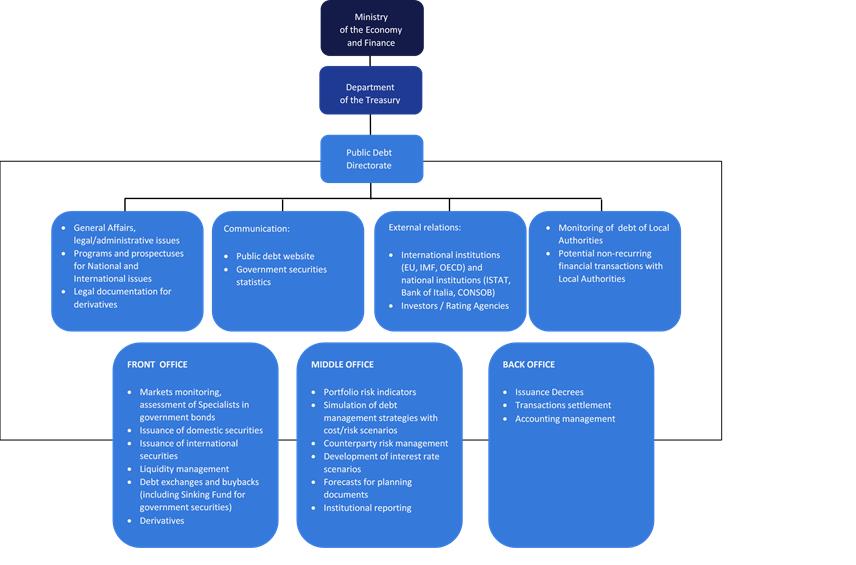
| The organisation of the Public Debt Directorate | 101 |
| BOT: Compounded gross yields at issuance | 119 |
| CTZ: Compounded gross yields at issuance | 119 |
| BTP: Compounded gross yields at issuance | 120 |
| BTP Italia and BTP€i: expected yields | 120 |
| CCTeu: Compounded gross yield at issuance | 121 |
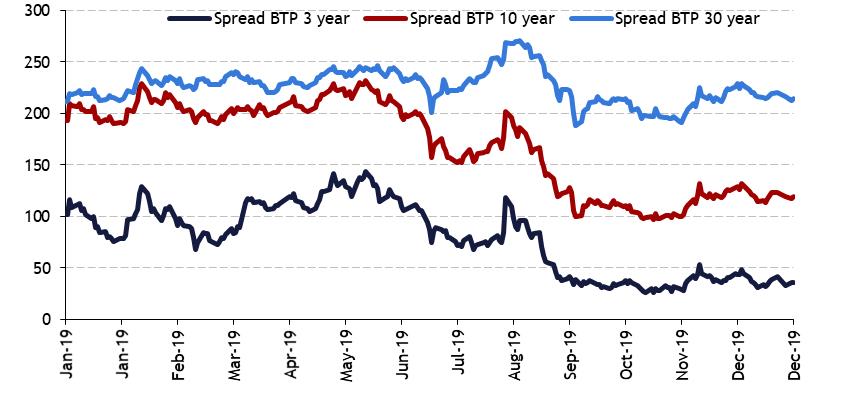
| Euro area 10-year benchmark spreads over Bund (basis points) | 121 |
| Asset SWAP spread (basis points) | 122 |
| Monthly trend of weighted average residual life of Government Bonds (months) | 122 |
| ITALIAN MINISTRY OF ECONOMY AND FINANCE | V
|
| VI | ITALIAN MINISTRY OF ECONOMY AND FINANCE |
| I. | DEBT MANAGEMENT OBJECTIVES FOR 2019 |
| I.1 | THE TREASURY’S OBJECTIVES AND INTERNATIONAL DEBT MANAGEMENT PRACTICES |
Debt management objectives and risks: international practices
As already mentioned in previous editions of this report, the Italian Treasury’s public debt management is in line with international best practices and fully complies with the recommendations of the main multilateral financial institutions as well as with the approaches adopted by other Debt Management Offices (DMOs) in advanced countries.
International best practices have developed over time1, thanks to a continuous sharing and analysis of the practical experiences gathered by the various DMOs in their respective economic and legal contexts. Firstly, these experiences highlight an inverse relationship between costs and risks (refinancing risk and interest rate risk) in the structure of a debt portfolio. They also define the following main objectives for public debt management:
• covering the Central Government's funding needs;
• minimising funding costs, subject to maintaining acceptable levels of risk over a medium- to long-term horizon2;
• maintaining access to domestic and international markets in the long term.
The main types of risk faced by DMOs refer to market risk, which includes interest rate risk and exchange rate risk, refinancing risk, liquidity risk and credit risk, in addition to the operational risk. Many of these risks involve rapid increases in the cost of debt jeopardising debt sustainability, albeit in different ways.
A public debt portfolio may be more or less exposed to each of these risks, depending on its actual composition. In other words, we must consider the ratio between short-term and medium/long-term debt and between fixed-rate and floating-rate debt, as well as between the amount of domestic debt and foreign
___
1 By way of example, the first 2-volume edition of the OECD’s Green Book on Government Debt Management was published in 1983. Other updates followed in 1993, 2002 and 2005. The various editions of the ‘Guidelines for Public Debt Management’, jointly drawn up by the World Bank and the International Monetary Fund, also continue to be a main reference, the last of which was prepared in 2014 and published in 2015 (please see the text available from:
http://www.worldbank.org/content/dam/Worldbank/document/Debt/Revised%20Guidelines%20for%20Public%20Debt%20Management%202014_v2.pdf).
2 The most recent edition of the International Monetary Fund and World Bank guidelines on the management of the public debt states (p. 17 of the text referred to by the link above): “The main objective of public debt management is to ensure that the government’s financing needs and its payment obligations are met at the lowest possible cost over the medium to long run, consistent with a prudent degree of risk” [...] “Governments should try to minimize expected debt servicing costs […], subject to an acceptable level of risk, over a medium- to long-term horizon.”
| ITALIAN MINISTRY OF ECONOMY AND FINANCE | 1 |
currency debt. Another important element that an issuing country must take into consideration when assessing the aforementioned risks is its ability to maintain, at the higher possible extent, a broad, liquid and deep market for the placement and trade of government securities.
International best practices recommend avoiding public debt portfolio structures that are too heavily weighted towards short-term and floating-rate instruments. Such structures may increase a country's economic and financial vulnerability3.
In fact, despite reducing interest expenditure in the short term, these structures make it more volatile, while also increase the market risks inherent in the debt portfolio (specifically, refinancing risk and interest rate risk) and, consequently, in the government budget4. On the other hand, under normal financial market conditions and regardless of the issuer’s creditworthiness, interest expenditure is higher for longer-term maturities, although longer maturities offer the benefit of effectively reducing the refinancing risk and interest rate risk.
Therefore, with regard to the rate type and debt maturity, the most prudent choice is generally more costly, while the less expensive option involves greater risks.
However, DMOs are required to pursue both objectives: reducing the cost of debt at the same time as curbing market risks. Therefore, in practice, public debt managers must forego maximising both of these objectives and must instead focus on managing their relative trade-off.
In other words, out of all the feasible options, they must select the cost-risk combination deemed satisfactory5 in relation to both portfolio characteristics and overall strategies. This trade-off is therefore not the same for all DMOs, but rather is handled differently by public debt managers in each country, based on the characteristics of their respective portfolios, reference market and fiscal policies. Italy has taken a particularly prudent approach to this trade-off due to the size of its debt (among the highest in the world in absolute terms); this approach does not allow for opportunistic tactics, but instead imposes a need to prioritise continuity, predictability and long-term strategies.
It goes without saying that the DMO’s task of minimising the cost of debt while maintaining an acceptable level of risk cannot be deemed to have been completed upon each issuance and in relation to the market conditions at the time of
___
3 Considerations in this regard can be found in the Guide to the Debt Management Performance Assessment (DeMPA) Tool, World Bank 2009.
4 However, it should be noted that this risk assessment approach may only be considered optimal if focusing exclusively on government liabilities (and therefore on debt). Indeed, a different and broader point of view could also include government assets. Under this approach, debt management could thus aim to achieve a liability structure consistent with the risks inherent to assets (following a so-called ‘ALM’ - ‘Asset Liability Management’ approach). This may lead to choices that - in principle - could differ even quite significantly from those made by taking into account the debt composition alone. However, many countries, including Italy, have come across significant hurdles in implementing such an approach, due to both the practical difficulty of calculating the financial risk exposure of the government’s substantial assets - especially non-financial assets - and, in many cases, the fact that there is incomplete knowledge of the size and characteristics of said assets. Further information can be found in the World Bank Policy Research Working Paper ‘How Do Countries Use an Asset and Liability Management Approach?A Survey on Sovereign Balance Sheet Management’.
5 In this regard, the International Monetary Fund and World Bank guidelines note that "Minimizing cost, while ignoring risk, should not be an objective. Transactions that appear to lower debt servicing costs often embody significant risks for the government and can limit its capacity to repay lenders. Managing cost and risk therefore involves a trade-off”.
| 2 | ITALIAN MINISTRY OF ECONOMY AND FINANCE |
I. DEBT MANAGEMENT OBJECTIVES FOR 2019 |
placement. Indeed, the structure of public debt, consisting of a wide and diversified portfolio of financial instruments with different characteristics and maturities, requires continuous, dynamic management even after issuance, in line with market developments.
Public debt management objectives and results must therefore be pursued and assessed over a sufficiently long period and must take into consideration the entire portfolio.
The Treasury's involvement in international discussions on debt management
When identifying and setting its objectives, the Treasury benefits from ongoing international cooperation with the relevant foreign and supranational institutions, as well as from close contact with institutional investors, both in Italy and abroad, and with rating agencies.
LEARN MORE | | The Treasury's contribution to international dialogue on debt management As in the previous edition, this Report includes a number of annexes that illustrate general issues concerning debt management (not specifically relating to the year of reference for the Report). The first of these annexes provides details of international discussions on debt management in which the Treasury regularly participates. These include the ESDM (European Sovereign Debt Markets) Subcommittee of the EU Economic and Financial Committee, several working groups organised by supranational institutions such as the OECD, the IMF and the World Bank, and the International Retail Debt Management Conference. This annex also illustrates the role of the Treasury in setting up and managing the Public Debt Management Network (as the only government institution alongside the OECD and the World Bank). • See Annex 1 on page.99 |
The process of defining debt management objectives within the Treasury’s organisational model
The Second Directorate at the Department of the Treasury is in charge of public debt management6.
The Directorate has front, middle and back office functions, as is typically the case for other DMOs in advanced countries and financial intermediaries. It also has other offices in charge of legal documentation, communication and statistics as well as relations with external institutions, in addition to IT activities and all the other legal-administrative and accounting roles common to ministerial organisations.
The middle office deals with identifying and monitoring annual debt management objectives, which includes the following activities: a) analysis to define the cost/risk profile for operations and to identify the most appropriate
___
6 The section of the Department of the Treasury’s website dedicated to public debt (http://www.dt.tesoro.it/en/debito_pubblico/index.html) provides continuously updated information and documents on all activities relating to public debt management.
| ITALIAN MINISTRY OF ECONOMY AND FINANCE | 3 |
issuance and hedging strategies; b) multi-annual forecasts on interest expenditure and the general government debt level for policy documents and institutional reporting purposes7; c) monitoring of counterparty risk, which determines certain constraints that must be met when managing the derivatives portfolio and transactions invest liquidity.
LEARN MORE | | Directorate II - Public Debt: organisational structure The Department of the Treasury's ‘Second Directorate’ is made up of eleven offices. Annex 2 provides a summary of the Directorate’s responsibilities, grouped by role. This annex also includes a detailed explanation of the various activities and how they are shared out among the different offices. Finally, there is a brief description of how these offices interact with the work carried out by other Directorates and other entities. • See Annex 2 on page 101 |
I.2 2019 OBJECTIVES: THE INSTITUTIONAL FRAMEWORK OF REFERENCE
General government’s total debt is made up of the consolidated gross liabilities of Central Government, local authorities and public social security institutions. It includes outstanding government securities, i.e. the securities issued by the government on both the domestic and foreign market.
As was also the case in previous years8, this Report refers to outstanding government securities, which are subject to the special legislation represented by Italy's ‘Consolidated Law on Public Debt’9 ('TUDP’). As at 31 December 2019, government securities represented approximately 83.4% of total public debt.
The main characteristics of outstanding government securities - maturity, type of remuneration and issuance procedure and frequency - are summarised in Table I.1.
___
7 In particular, the Economic and Financial Document (‘DEF’) pursuant to Italian Law no. 39 of 7 April 2011 (specifically, the Public Debt Directorate contributes to both Section I, "Italy’s Stability Programme", and Section II, "Analyses and Trends in Public Finances"), the DEF Update, the Draft Budgetary Plan (‘DBP’) as required by EU Regulation no 473/2013, the Annex to the so-called ‘Quarterly Cash Report’ (referred to by Art. 14 of Italian Law no. 196/2009 as the ‘Report on the General Government’s Consolidated Cash Account’), the Report to Parliament on the sinking fund for government securities (an annex to the General Financial Statement of the Italian State) as referred to by Art. 44, paragraph 3, of Italian Presidential Decree no. 398/2003, and the half-yearly Report to the Court of Auditors on public debt management pursuant to the Italian Ministerial Decree dated 10/11/1995.
8 All editions of the Public Debt Report are available at http://www.dt.tesoro.it/en/debito_pubblico/presentazioni_studi_relazioni/
9 Consolidated Law on Public Debt ('Testo Unico del Debito Pubblico’ – ‘TUDP’, Italian Presidential Decree no. 398 of 30 December 2003).
| 4 | ITALIAN MINISTRY OF ECONOMY AND FINANCE |
I. DEBT MANAGEMENT OBJECTIVES FOR 2019 |
| TABLE I.1: DOMESTIC GOVERNMENT SECURITIES |
| | BOT | CTZ | CCT/CCTeu | BTP | BTP€i | BTP Italia |
| | Treasury Bills | Zero-Coupon Treasury Bonds | Treasury Credit Certificates | Long-term Treasury Bonds | Long-term Treasury Bonds indexed to European inflation | Long-term Treasury Bonds indexed to Italian inflation |
| Maturity | 3, 6, 12 months and less than 12 months (flexible BOTs) | 24 months | 5, 7 years | 3, 5, 7, 10, 15, 20, 30 and 50 years | 5, 10, 15, 30 years | 4, 6, 8 years |
| Remuneration | Issue discount | Issue discount | Half-yearly variable coupons indexed to the 6-month BOT auction rate or the 6-month Euribor, possible issue discount | Half-yearly fixed coupons, possible issue discount | Half-yearly coupons indexed to European inflation (HICP index net of tobacco), possible issue discount and revaluation of principal at maturity | Half-yearly coupons indexed to Italian inflation (‘FOI’ index net of tobacco), half-yearly revaluation of principal and loyalty premium* at maturity |
| Issuance procedure | Competitive, yield-based auction | Marginal auction with discretionary determination of the price and quantity issued | Marginal auction with discretionary determination of the price and quantity issued | Marginal auction ** with discretionary determination of the price and quantity issued | Marginal auction ** with discretionary determination of the price and quantity issued | Through the MOT (Borsa Italiana), the electronic market dedicated to retail trading |
| Issuance frequency | Monthly | Monthly | Monthly | Monthly and based on market conditions for 15- and 30-year BTPs | Monthly | Once/twice a year |
*) For individual savers and similar investors who purchase the security at issuance during the first phase of the placement period. **) The first tranches of new long-term BTPs (over 10 years) or BTP€is may be offered on the market through placement syndicate. |
The part of public debt represented by government securities was managed in accordance with: (i) the Italian Ministry of Economy and Finance’s general Directive for administrative procedures and management for 2019; and (ii) the "Framework Decree" for 201910, which defined the reference objectives for administrative action regarding financial transactions for the management of public debt. The provisions contained in these decrees were then converted into the operational "Public debt management guidelines"11 for 2019 (hereinafter, "Guidelines").
___
10 The Italian Ministry of Economy and Finance’s general Directive for administrative procedures and management - 2019: http://www.mef.gov.it/ministero/oiv/direttivo_generale.html
Italian Decree of 2 January 2019, published in the ‘Gazzetta Ufficiale’ (Official Journal of the Italian Republic) no. 11 on 14 January 2019:
http://www.dt.mef.gov.it/export/sites/sitodt/modules/documenti_en/debito_pubblico/normativa_spalla_destra/2019_Framework_Decree_-_Directives_for_conducting_financial_transactions_xD_M_02.01.2019x.pdf
11 The Public Debt Management Guidelines are published on the Department of the Treasury's website - Directorate of Public Debt, as part of the Ministry of Economy and Finance, at http://www.dt.mef.gov.it/en/debito_pubblico/presentazioni_studi_relazioni/archivio_presentazioni/elem_0007.html
| ITALIAN MINISTRY OF ECONOMY AND FINANCE | 5 |
The general Directive turned the policy priority into two strategic objectives: (i) to curb the cost of debt, with a particular focus on the cost/risk profile; and (ii) to monitor and manage the cash account12, with the aim of efficiently managing its balance.
As was the case in previous years, the Framework Decree for 2019 provided guidance for the work of the Public Debt Directorate as well as a number of specific objectives. In particular, Art. 2 states that debt should be "in accordance with the limit established annually by the law approving the State budget", equal to the amount to cover the securities maturing during the year and the Central Government’s borrowing requirements, being sure to "... reconcile the need to meet market demand with that of containing the overall borrowing cost in a medium-long term horizon, having considered the need to protect against the refinancing risk and exposure to interest rate fluctuations".
The same article also sets objectives in terms of the percentage composition of debt at the end of 2019, broken down as follows:
| TABLE I.2 OBJECTIVES FOR THE END OF 2019: PERCENTAGE COMPOSITION OF THE DEBT PORTFOLIO |
| Type of security | Min. | Max. | Differences compared to 2018 |
| BOT (short-term) | 3% | 8% | up from the 2%-8% range |
| BTP (fixed-rate, nominal) | 65% | 78% | -- |
| CCT/CCTeu | 5% | 10% | - |
| CTZ | - | 4% | -- |
| BTP€i and BTP Italia (“real” securities) | -- | 15% | - |
| Securities issued on foreign markets | -- | 5% | -- |
| Source: ‘Framework Decree’ for 2019 |
In order to pursue the objectives of "curbing the overall debt cost, protecting against market risks and refinancing risks and ensuring the proper functioning of the secondary market for government securities”, Art. 3 authorises the use of public debt management transactions13, also through derivative financial instruments, exchanges or buy-back of government securities.
In order to mitigate the credit risk stemming from derivatives, Art. 4 requires counterparties to have a high level of creditworthiness, according to the rating given by the main rating agencies, also providing for possible agreements with the counterparties for mutual guarantees (collateralisation)14.
Lastly, Art. 6 states that the aim of cash account management15 must be "the efficient movement of cash balances, in relation to the government securities issuance, prevailing market conditions and the constraints imposed by monetary policy provisions".
___
12 Information about the nature of the cash account and the context of the related operations is provided in Par. I.IV below.
13 Art. 3 of the ‘TUDP’ (Italian Consolidated Law on Public Debt) authorises the use of transactions on a consensual basis that restructure certain features of the existing debt portfolio.
14 For more information about these mutual guarantee agreements, please see Chap. III.3 ‘Derivatives portfolio management’).
15 Regulations regarding the Treasury’s cash movements and the selection of the counterparties participating in the relative transactions are based on the Italian Ministerial Decree dated 25 October 2011.
| 6 | ITALIAN MINISTRY OF ECONOMY AND FINANCE |
I. DEBT MANAGEMENT OBJECTIVES FOR 2019 |
In terms of debt composition at the end of 2019, the assigned debt management objectives therefore aimed at a slight increase in short-term debt, keeping the 2018 portfolio stable with regard to medium- and long-term maturities. The aim of this was to ensure that requirements are met at costs that are as aligned as possible with market trends, and to consolidate the results already achieved in terms of exposure to interest rate risk and refinancing risk, with the goal of continuing the results achieved in recent years 16 in terms of the average life of government securities.
Based on the outstanding securities portfolio at the end of 2018, € 201 billion worth of securities were scheduled to mature in 2019 (excluding BOTs), of which € 3.7 billion referring to the foreign programme. This figure was therefore € 17 billion higher than the volume of securities maturing in 2018 that were outstanding at the end of 2017.
Considering that Central Government cash needs were expected to be around € 50 billion, again higher than in 2018, an increase in the volumes of short and medium/long-term securities offered to the market was therefore to be expected for 2019.
The Treasury therefore set the following objectives as part of the 2019 Guidelines:
1) to ensure that borrowing requirements are met at costs as aligned as possible with market trends;
2) to consolidate the results already achieved in terms of exposure to the main risks, in particular the interest rate risk and refinancing risk;
3) to contribute to a gradual improvement in liquidity conditions on the secondary market, especially for those segments and sectors that had shown the most difficulties in this regard during the second half of 2018;
4) to make the Treasury’s cash management even more efficient, also through more diversified instruments.
The Treasury’s strategy was therefore set to develop along the following lines:
1) ensure predictable and regular issues for all the main segments of domestic securities;
2) adjust the volumes offered to the market in order to give greater weighting to sectors with better liquidity on the secondary market and greater depth of demand;
3) use liability management tools (such as exchanges and buybacks), in line with the approach followed in 2018, with a frequency and intensity in line with market trends, with the aim of reducing dislocations on specific securities, improving liquidity on the secondary market and managing the redemption profile for future years;
4) diversify the investor base also through foreign currency issues in Global format as well as EMTNs, in particular in USD;
5) possibly use innovative tools, also specifically dedicated to retail investors, after in-depth assessments, feasibility analyses and market surveys.
___
16 The average life of the stock of government securities rose from 6.38 to 6.52 years in 2015 and reached 6.76 years in 2016 and 6.90 years in 2017, before falling slightly to 6.78 years in 2018.
| ITALIAN MINISTRY OF ECONOMY AND FINANCE | 7 |
| I.3 | CURBING THE COST OF DEBT WHILE PAYING ATTENTION TO THE COST/RISK PROFILE |
The cost-risk trade-off: Italy's specific features
As in previous years, public debt management in Italy focuses on two main risks: the interest rate risk and the refinancing risk.
With regard to the first of these risks, the management objective is to minimise the impacts on interest expenditu17 caused by fluctuations of the interest rates at which the debt is placed.
With regard to the refinancing risk, the management objective is to distribute the maturities of securities more evenly over time in order to facilitate the placement of new issues. In fact, by offering volumes that are in line with the market’s ability to absorb debt, undesired rises in financing costs can be avoided.
When it comes to these risks, the Treasury's objectives are in line with the practices followed by other DMOs. However, in Italy’s case, it is necessary to take an even more prudent approach in order to consider two specific aspects, both of which are linked to the country’s particularly high level of debt.
The first aspect is the fact that a significant component of the interest rate level at issuance for Italian government securities is the credit risk premium requested by investors18. This premium is not very closely linked to the economic cycle and affects Italy in a more significant way than in countries with lower levels of debt or whose creditworthiness is perceived as being higher. In fact, for these countries, changes to debt interest rates are more in line with the economic cycle, making it easier to manage the interest rate risk based on the debt-to-GDP ratio. For Italy, on the other hand, the medium-term risk premium tends to be correlated with the perception of debt sustainability rather than with economic performance. To support debt sustainability, debt composition must therefore be as resilient as possible to deal with any future unfavourable developments regarding refinancing conditions (yields, demand structure, etc.).
The second aspect relates to the greater importance of having interest expenditure that is as stable and predictable as possible for the management of the Italian state budget. This helps to avoid the need to increase taxation should government-security yields be affected by possible shocks, and makes it easier to manage public finance commitments stemming from European requirements, mainly based on deficit control and debt dynamics.
The two aforementioned aspects therefore significantly contribute to guiding Italy's debt management strategy with regard to keeping refinancing and interest rate risks under control.
___
17 In order to manage public finances correctly, it is necessary, where possible, to reduce costs and to plan outgoings with as much certainty as possible. This avoids unwanted and unexpected increases in the deficit and/or fiscal pressure, perhaps also significantly and in a short amount of time, as a result of costs or expenses not being duly planned for. Correct management of public finances therefore guarantees a framework of financial stability, which in turn allows for effective debt management.
18 Following the introduction of the single currency, there was a significant reduction in the perception and valorisation of the credit risk for highly indebted euro area countries; however, these re-emerged with the global financial crisis of 2007-2008, and, above all, with the subsequent sovereign debt crisis, after which the credit spreads between highly indebted countries and other countries failed to return to pre-crisis levels.
| 8 | ITALIAN MINISTRY OF ECONOMY AND FINANCE |
I. DEBT MANAGEMENT OBJECTIVES FOR 2019 |
Refinancing risk metrics and management tools
The average life of the stock of government securities is the benchmark metric used to measure refinancing risk: this is calculated as the average of the maturities of all outstanding securities, weighted according to the nominal value19 of each security. At the end of 2018, the average life of government securities had gone down again, albeit only slightly, to 6.78 years after three consecutive years of increases (6.52 in 2015, 6.76 in 2016 and 6.90 in 2017).
Given the annual profile of maturities at the end of 2018 (Chart I.1), as well as the monthly profile up to 2021 (Chart I.2), the objective was to keep the same approach taken in 2018, by reducing dislocations on specific securities through buyback and exchange transactions, in order to improve liquidity on the secondary market and manage the redemption profile for future years.
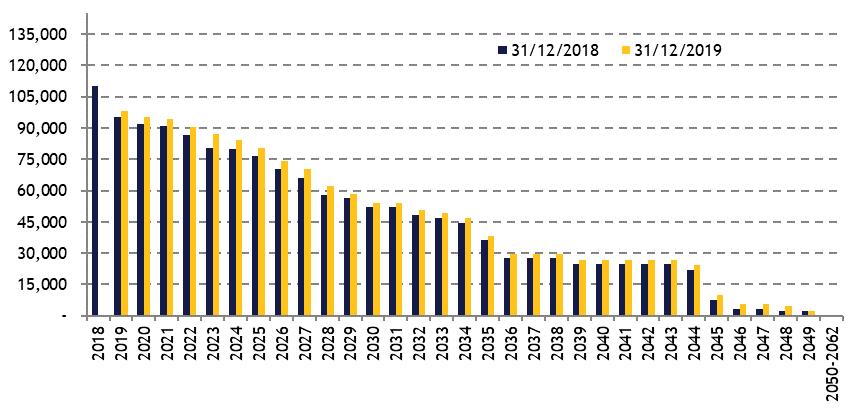
| CHART I.1: ANNUAL MATURITY PROFILE OF MEDIUM/LONG-TERM SECURITIES OUTSTANDING AS AT 31.12.2018 (€ MILLION) |
|
| Source: MEF |
___
19 For "nominal value", the definition adopted in EC Regulation no. 479/2009 of 25 May 2009 is used: “…. The nominal value of a liability outstanding at the end of the year is the face value. The nominal value of an index-linked liability corresponds to its face value adjusted by the index-related change in the value of the principal accrued to the end of the year. Liabilities denominated in a foreign currency […] shall be converted into the national currency on the basis of the representative market exchange rate prevailing on the last working day of each year. Liabilities denominated in a foreign currency and exchanged through contractual agreements to the national currency shall be converted into the national currency at the rate agreed on in those contracts”.
| ITALIAN MINISTRY OF ECONOMY AND FINANCE | 9 |
| CHART I.2: MONTHLY MATURITY PROFILE OF MEDIUM/LONG-TERM SECURITIES OUTSTANDING AS AT 31.12.2018 (€ MILLION) |
|
| Source: MEF |
Interest rate risk metrics and the SAPE model and software used by the Italian Treasury
Art. 2, paragraph 2, of the 2019 'Framework Decree’ states the need to curb the overall cost of debt, taking into consideration both the need to protect against the refinancing risk and the exposure to the risk of interest rate fluctuations.
The three main indicators used to quantify the interest rate risk are (i) financial duration, equal to the weighted average payment time for both principal and interest; (ii) the average refixing period, i.e. the average time taken by the debt portfolio to "integrate" interest rate changes, and, lastly, (iii) Cost-at-Risk, which quantifies the maximum additional cost in terms of interest expenditure in the event of adverse interest rate scenarios, along with the probability of actually having to bear this additional cost, deriving in turn from the probability that these adverse scenarios shall occur20. Cost-at-Risk (CaR) analysis is therefore used to identify, with a given probability, an expected cost level that may not be exceeded, as well as all the compositions of the securities issuances whose cost-risk combinations are classed as being efficient, i.e. are such as to become dominant - for a given level of cost or risk - over any other hypothetical composition of the issuance portfolio.
In this way, it is possible to test the characteristics of a series of hypothetical issuance portfolios, estimating both the cost in terms of interest expenditure and the interest rate risk (Cost-at-Risk) for each over a given amount of time in the future, calculated with different possible scenarios as to how the interest and inflation rates will evolve.
From a technical point of view, the tool used for this analysis is an in-house developed model which the Public Debt Directorate has been using for a number of
___
20 Please see the focus point on "The main quantitative indicators of interest rate risk" on page 22 of the 2014 Annual Public Debt Report, available at the address already provided in note 8 of this Chapter.
| 10 | ITALIAN MINISTRY OF ECONOMY AND FINANCE |
I. DEBT MANAGEMENT OBJECTIVES FOR 2019 |
years, called ‘SAPE’ (‘Software di Analisi dei Portafogli di Emissione’ - Issuance Portfolio Analysis Software).
LEARN MORE | | The SAPE model and software used by the Italian Treasury The acronym ‘SAPE’ refers to a set of specially designed models and software that the Italian Treasury has been using for many years to select issuance portfolios which not only meet funding needs and comply with applicable regulatory constraints, but are also able to provide a satisfactory cost-risk trade-off with efficient results. These models and software were created, in collaboration with the Treasury, by experts from prestigious research institutions such as the “M.Picone” Institute for Calculation Applications (‘IAC’) - the Italian National Research Council (‘CNR’) and the Cambridge Judge Business School at the University of Cambridge, as well as by SOGEI, the Italian Treasury's IT solutions provider for the public administration. The models and software are updated continuously. A detailed description of the implications of the model and how it works can be found in the recently published paper, available at the following link: http://www.dt.mef.gov.it/en/debito_pubblico/Public_Debt_Management_Network/ebook/index.html A summary of how the model was developed is provided in the following annex: • See Annex 3 on page.104 |
The outstanding debt database used by SAPE at the end of 2018 was made up of domestic securities, derivatives and securities in USD. With regard to the latter, the Treasury’s policy is to issue any securities in a foreign currency at generally better (or at least equal) cost conditions21 than those available for equivalent domestic instruments. Therefore, when estimating the refinancing costs of future redemptions for securities in USD, data on domestic securities were used, with no new derivative transactions expected to manage the rate risk.
The role of the issuance strategy in managing the interest rate risk-cost trade-off in 2019
For debt managers, especially ones handling a large amount of debt, it is essential to identify a cost-risk combination that minimises costs without increasing risk. This may also be interpreted as promoting a medium- and long-term perspective, which not only aims at reducing costs as much as possible in the present, but also creates the conditions for a lasting and gradual reduction in borrowing costs (which also depend on investors' perception of credit risk).
For this reason, improvements in refinancing and interest rate risk metrics should always be evaluated by also taking into account the higher costs involved with this strategy. In fact, as already mentioned, the market demands higher remuneration for securities with longer maturities. This trade-off must therefore be taken into consideration when planning the issuance portfolio, i.e. estimating the marginal cost required by the market to improve the aforementioned risk metrics.
To do this, when drawing up the "2019 Guidelines", the Public Debt Directorate identified a set of hypothetical issuance portfolios for domestic securities, modelled
___
21 Including costs to hedge against exchange rate risks.
| ITALIAN MINISTRY OF ECONOMY AND FINANCE | 11 |
based on their actual feasibility and in order to test their sensitivity to certain market elements using the tools described in the previous paragraph.
As a precondition, all portfolios must make it possible to fund:
1) the redemptions of medium- and long-term securities scheduled for 2019 (amounting to approximately € 201 billion),
2) outstanding BOTs (amounting to approximately € 107 billion), together with the so-called ‘BOT rollover’ during the year, i.e. the BOT issues necessary to cover the redemptions of the BOTs issued in the same year,
3) Central Government cash requirements, which, at the time, were estimated to be around € 50 billion22,
4) as well as ensuring that the Treasury has sufficient liquidity available to cater for all cash needs.
It goes without saying that the portfolio initially used for the analysis reflected the composition of domestic issues in 2018, characterised in gross terms by approximately 38% of BOT issuances (almost equally divided between annual and 6-months maturities), just under 7% of CTZs, around 6% of CCTeus and almost 7% of index-linked securities (including BTP€i and BTP Italia). Nominal BTPs therefore represented a considerable 42% of the total, of which approximately 17% were represented by securities with the shortest durations (3 and 5 years), more than 18% by 7- and 10-year maturities and, lastly, around 7% relating to the segment with the longest duration.
This portfolio was used as a basis to make a number of changes to the composition of the various instruments, also altering the maturities within each category. In a first hypothesis, in order to verify and highlight the impact that an increase in debt exposure to inflation would have had on cost and risk, the component of securities linked to inflation (both European and Italian) was increased significantly, consequently reducing the share of nominal BTPs, CCTs and CTZs, while keeping basically the same amount of BOTs.
On the flip side, another simulation was carried out, removing the share of securities linked to European inflation.
Other simulations focused on the weightings given to the various segments of the curve, each time increasing the presence on the medium- and long-term stretch at the expense of the shorter-term stretch or vice versa, estimating the cost increase involved with extending the duration and average life of the debt, or the increase in risk involved with reducing short-term costs.
Finally, attention was paid to adjusting issuances based on so-called ‘barbell’ strategies, balancing short- and long-term components and reducing the presence along the middle stretch of the curve.
___
22 This figure formed the basis for public finance forecasts for 2019, included in the 2018 ‘DEF Update’ and remaining unchanged in the subsequent DBP (Draft Budgetary Plan).
| 12 | ITALIAN MINISTRY OF ECONOMY AND FINANCE |
I. DEBT MANAGEMENT OBJECTIVES FOR 2019 |
| CHART I.3: COMPOSITION OF THE ALTERNATIVE ISSUANCE PORTFOLIOS ANALYSED FOR 2019 (€ MILLION) |
|
| Source: MEF |
For each issuance portfolio, an analysis was carried out over a thirty-year horizon, examining the relative effects during the four-year period between 2019 and 2022. Italian yield curves (generated by applying the SAPE model scenarios), zero coupon inflation swap curves for securities indexed to Italian and European inflation and the half-yearly Euribor were applied to the various issuance portfolios.
With regard to cost, the expected trend in average monthly interest expenditure for the four-year period in question was used. With regard to risk, two metrics were adopted: (1) the difference between the trend in average monthly interest expenditure in the four-year period, which leaves only a 5% chance that this may be higher than the expected trend referred to above (Relative Cost-at-Risk), and (2) the standard deviation of the average monthly increase in interest expenditure.
Among all the portfolios analysed, the one that showed feasibility and an effective improvement in the cost-risk trade-off was portfolio 12 (the barbell strategy), which leaned more, in relative terms, towards issuances along the 3-year stretch and along the longest section (10 years and above).
The role of derivative transactions in managing the interest rate risk-cost trade-off for 2019
It is clear that an effective management strategy cannot be limited to incorporating newly issued securities into the portfolio, passively leaving the subsequent changes in the risk composition to the outcome of placement auctions and redemptions. It must instead allow for the debt portfolio’s cost and interest rate risks to be managed on an ongoing basis, even after issuance of the securities held therein. For this purpose, like many other sovereign issuers, the Italian Treasury uses derivatives, as well as exchange and buyback transactions.
| ITALIAN MINISTRY OF ECONOMY AND FINANCE | 13 |
LEARN MORE | | The role and type of derivative transactions used by the Treasury In principle, the derivatives sector is considerably vast, encompassing transactions that have very different structures and purposes and refer to almost all areas of finance and the economy. Sovereign issuers such as the Italian Treasury only use a few types of derivative transactions for specific risk management objectives underlying its debt portfolio, with particular regard to interest rate and exchange rate risks. The annex cited below describes the role played by derivatives in managing Italy’s public debt and the types of transactions that are used. • See Annex 4 on page 106 |
| | | |
In authorising the use of derivatives, the Framework Decree stated that they should contribute to achieving the general management objectives of curbing overall borrowing costs, protecting against market risks and refinancing risks and ensuring the proper functioning of the secondary market for government securities.
Management of the derivatives portfolio must also take into account two main aspects: (i) the availability of collateralisation agreements for any new derivative positions, which can also be used to reduce the cost of cross-currency swaps to act as a hedge for any new foreign currency issuances, and (ii) existing constraints for some types of derivatives.
With regard to the first aspect, the system of mutual guarantee agreements regarding derivative transactions (the so-called ‘Credit Support Annex’ or ‘CSA’) provided for by the secondary legislation23 introduced in December 2017 was implemented24 in 2018. This system may be applied to both selected existing contracts (therefore supporting the management of existing positions) and, above all, cross-currency swaps to hedge against the exchange rate risk stemming from any new foreign currency issuances. Therefore, in 2019, all the technical requirements were met for the Treasury to return to markets other than the euro and to expand its investor base.
With regard to the second aspect, in September 2014 Eurostat issued rules on how to record the market value of derivatives, only applicable to swaps arising from the restructuring of pre-existing swaps or to swaptions being exercised. In fact, for these specific cases, it was established that these transactions affect debt stock levels (although purely from an accounting point of view, since they do not entail recourse to the capital market). In 2019, derivative transactions were therefore meant to complement issuances, also taking into account more general public finance objectives, in light of the accounting impacts of European legislation, while continuing to contribute to increasing the average refixing period and debt duration25.
___
23 Italian Ministerial Decree of 20 December 2017, as already referred to above.
24 In this regard, please see pages 77-80 of the 2018 Public Debt Report.
25 Pursuant to Italy's 2005 Finance Law (Italian Law no. 311 of 30 December 2004), certain derivative contracts were concluded relating to public entities’ loan receivables, transferred to the Treasury from the books of the ‘Cassa Depositi e Prestiti’ after the latter became a limited liability company (Article 5 of Italian Legislative Decree no. 269 of 2003 - "attached" to the 2004 Finance Law - as converted, with amendments, by Italian Law no. 326 of 2003). The notional amount of these contracts is less than 1% of the Treasury’s entire derivatives portfolio, as
| 14 | ITALIAN MINISTRY OF ECONOMY AND FINANCE |
I. DEBT MANAGEMENT OBJECTIVES FOR 2019 |
Therefore, to sum up, management of the derivatives portfolio in 2019 was set to focus on (i) hedging the exchange rate risk for any issuances in a foreign currency and implementing the related collateral guarantees; (ii) restructuring the transactions already present in the derivatives portfolio, for which critical issues arose following the aforementioned statistical and accounting changes; and (iii) managing the collateral already in place.
Measures to achieve debt issuance and management objectives for 2019
In relation to the set objectives, the Italian Treasury’s strategy for 2019 was structured as follows, covering the two phases of debt management:
Policies at issuance of domestic and foreign securities
The Guidelines defined the issuance policy for 2019 taking into consideration the above mentioned objectives in terms of average life, duration and the average refixing period, as well as the results of the cost-risk trade-off analysis.
Given the higher volumes to be offered to the market compared with the previous year, and in line with market conditions, the guidelines stated that issuance choices in 2019 should therefore aim:
1) to adjust BOT issuances in order to ensure a stock at the end of 2019 which would include the refinancing of redemptions, while also increasing net issuances for the annual security, taking market conditions into account;
2) to keep CTZ issued amounts in line with redemptions and with previous years. Given the positive demand trend recorded in the last months of 2018, achieving slightly positive net issuances was also a possibility;
3) for 3- and 5-year BTPs, to adjust the amounts to be issued in the two segments, keeping a similar overall amount than in the previous year, but with a tendency to overweight the three-year segment compared with the five-year one;
4) to keep largely positive net issuances of 7-year BTPs, with gross issuances also lower than in previous years, so as to ensure an increase in the share of seven-year BTPs within the stock of government securities at the end of the year, thereby consolidating the average life of the debt; given the benchmark role of the 10-year BTP, to continue to offer this maturity through regular monthly auctions. Despite a significant volume expiring in 2019 (over € 48 billion), net issuances could have been marginally negative;
5) for longer-term nominal maturities, to provide liquidity on all available instruments (15, 20, 30 and 50 years) by resorting to both the reopening of outstanding securities and the issuance of new ones, deciding which of the available maturities to offer to the market on a case-by-case basis. With regard to long-term securities, the plan was to keep overall issuance levels similar to those of last year, thereby achieving positive net issuances (given scheduled redemption of over € 23 billion on the 15-year security). In the presence of favourable market conditions, it
___
shown in detail in Table III.14 (Chapter III). These contracts do not form part of debt management and are therefore not addressed in this Report.
| ITALIAN MINISTRY OF ECONOMY AND FINANCE | 15 |
was also planned to use a placement syndicate for a new security with a 15-year and/or 30-year maturity;
6) to issue CCTeus for a lower absolute amount than in the previous year, given the decline in maturing volumes, continuing with exchanges and buybacks where necessary to keep the sector tensions, that had already arisen in 2018, under control. Net issuances were nonetheless expected to be positive, thus keeping the share stable with respect to the overall stock of outstanding securities;
7) to continue to ensure a constant presence for the various maturities of BTP€is, with the monthly volumes on offer remaining practically in line with redemptions. The conditions for launching a new security on the 10-year and longer-term segments were also to be examined;
8) to ensure at least one issuance of the BTP Italia, keeping maximum flexibility regarding the most appropriate maturity, in any case between 4 and 8 years. As was the case in the last two years, the guidelines stated that the Treasury would have considered the possibility of carrying out exchange or buyback transactions on securities with a particularly high outstanding amount, in order to contribute to the management of the redemption profile for the coming years. The lack of scheduled redemptions for the BTP Italia was expected to result in positive net issuances and, therefore, to a slight increase in the share of this security within the overall stock;
9) to assess the possibility of returning to the USD market26 for the most popular maturity among investors, depending on market conditions. Compared to previous years, in 2019, the Italian Treasury could in fact benefit from both the recent enlargement of the Global Programme Lead Managers list (which now included all Primary dealers), and the operational availability of mutual guarantee agreements on derivatives (‘Credit Support Annex’, ‘CSA’). Lastly, the guidelines provided for the possibility to resume recourse to the issuance of securities under the MTN program, in euro /foreign currency, to meet the demand for private placements among primary institutional investors, subject to minimum requirements being met27 regarding the issue format.
Post-issuance debt management operations
As already mentioned, the Italian Treasury may also use extraordinary exchange and buyback transactions regarding government securities and derivative transactions in order to achieve the aforementioned objectives for the existing debt portfolio.
Exchanges and buybacks are public debt management tools used to curb the refinancing risk, modify the redemption profile and support the liquidity and efficiency of the government securities market.
Unlike ordinary issuance activity, these transactions do not follow a predefined timetable, but rather depend on both the Treasury's specific requirements and market conditions. Only Primary dealers are allowed to participate in these extraordinary transactions.
___
26 The last issuance in the Global format took place in September 2010
27 Maturity of at least three years, minimum amount of at least € 200 million and a minimum negotiable amount of at least € 500,000
| 16 | ITALIAN MINISTRY OF ECONOMY AND FINANCE |
I. DEBT MANAGEMENT OBJECTIVES FOR 2019 |
Exchange transactions generally consist of one security being issued against the simultaneous buyback of one or more outstanding securities. They therefore exchange government securities with a different maturity, which may help to mitigate the refinancing risk. For these transactions, the Treasury may make use of the Bank of Italy’s auction system or electronic trading system.
Buybacks, on the other hand, are transactions which the Treasury can use to reimburse outstanding government securities, both partially and in advance. The financial resources used for this purpose may be drawn from deposits in the cash account or taken from the sinking fund for government securities. Buybacks can be performed through Bank of Italy auctions or through bilateral transactions.
As was the case in recent years, the 2019 Guidelines stated that the frequency of these extraordinary transactions was to be guided by specific market situations, always taking into account the aforementioned purposes of these instruments. The Guidelines also specified that, in 2018, these transactions had contributed to restoring an adequate gradient to the yield curve and to partially restoring orderly trading in the CCTeu sector. As was the case in 2018, exchange and buyback transactions were also allowed to be carried out through syndication and would also have been aimed at facilitating the process of reducing the stock of outstanding nominal debt.
Finally, the Guidelines stated that new derivative transactions would consist of possible restructuring of the existing portfolio, as part of active management aimed at transforming its financial profile and/or impacts in terms of debt (as was also the case in previous years). Furthermore, new cross-currency swaps, backed by collateralisation agreements, would have to be completed for the purpose of hedging against the exchange rate risk involved with any new issuances in a foreign currency.
| I.4 | MONITORING AND MANAGING THE CASH ACCOUNT TO STABILISE THE BALANCE |
The cash account for Treasury services
In collaboration with the Bank of Italy, the Italian Treasury manages its liquidity based on its expected cash flows and the relative balances. This management - known as ‘OPTES’ operations - also meets the ECB requirement of facilitating monetary policy through an efficient forecasting of the cash balances held by public institutions with the euro area’s national central banks.
In Italy, this liquidity is mainly held in the Cash Account, i.e. the account held by the Treasury with the Bank of Italy, where its incoming cash flows and payments are recorded. The balance of this account is essentially the sum of all the accounts held by the Treasury28. In compliance with EU legislation, which forbids central
___
28 For further details, please refer to Italian Ministerial Decree no. 51961 of 26 June 2015 concerning the identification of government deposits held with the Bank of Italy, implementing Article 5, paragraph 5, of Italian Presidential Decree no. 398/2003.
| ITALIAN MINISTRY OF ECONOMY AND FINANCE | 17 |
banks from granting any form of funding to member states’ governments, the account may not be overdrawn.
The balance of the Cash Account is characterised by strong volatility, due to both the large number of entities that move funds with the Treasury and a number of significant cyclical cash flows (normally monthly). In particular, with regard to incoming cash flows, tax revenues have a strong impact and are concentrated over a few days in the second half of the month, while payments include pensions which mainly go out on the first working day of the month. Issuances and - to an even greater extent - redemptions of government securities can also cause significant fluctuations in the Cash Account.
Bearing in mind these critical issues, 2019 once again saw the Treasury adopt measures aimed at managing the liquidity of the cash account in such a way as to achieve “efficient movement of the cash balances, in relation to the issuance strategy for government securities, at the prevailing market conditions and within the limits imposed by monetary policy provisions”, as was the case in previous years.
OPTES operations
Cash management consists of daily operations aimed at ensuring an adequate level of cash with regard to the multiple movements on the Treasury's system. These operations are closely linked to public debt management, representing the tool connecting the issuances of securities with the daily fluctuations of the Cash Account. As mentioned above, cash management forms part of the so-called ‘OPTES’ operations, which consist of monitoring the Treasury’s balances and cash flows and completing money market transactions.
Monitoring is based on information being continuously exchanged between the Bank of Italy and the MEF (State General Accounting Department and Department of the Treasury - Public Debt Directorate), including forecasts and final data on all amounts going in and out of the Treasury’s accounts, as well as the resulting estimate as to the balance of the Cash Account. These information exchanges are updated several times throughout the course of each working day in order to estimate the end-of-day account balance; the liquidity estimates made by the MEF and the Bank of Italy also include more long-term scenarios, which are shared on a weekly basis and are based on a forecast period in line with monetary policy requirements.
Cash management tools, on the other hand, refer to money market operations, using daily auctions and, where appropriate, bilateral transactions under which the Treasury is generally an investor of its own liquidity. The Treasury’s available cash is therefore made up of the liquidity in the Cash Account and the investments made with financial intermediaries through the Treasury’s daily OPTES operations.
The regulatory context for cash management in 2019
Cash management principles were established in the MEF's general Directive for administrative procedures and management and in the Framework Decree, as well as in the 2019 Public Debt Management Guidelines. In particular, the general
| 18 | ITALIAN MINISTRY OF ECONOMY AND FINANCE |
I. DEBT MANAGEMENT OBJECTIVES FOR 2019 |
guidelines stated that the focus should be on improving the model to process daily cash forecasts for the cash account and that the monitoring and management of said account must be geared towards stabilising the balance. The Framework Decree stated that management of the cash account must aim at efficient cash movements, in line with the government security issuance strategy and the prevailing market conditions, at the same time as complying with the constraints imposed by monetary policy provisions. Lastly, the Public Debt Management Guidelines set the objective of maintaining a constant presence in the money market for short- and very short-term maturities, through daily OPTES operations, mainly characterised by auctions to invest liquidity, with overnight duration, in line with cash requirements and market conditions. These guidelines also provided for the possibility to introduce other liquidity investment tools through bilateral transactions with a maturity of more than one day, for the purpose of improving the diversification and profitability of cash management, with a view to curbing counterparty risks.
With regard to legislation governing the movement and management of the cash deposited in the cash account, reference continues to be made to the Framework Decree, which substantially refers to the Italian Ministerial Decree dated 25 October 201129. In April 2019, the ECB altered the procedure to pay interest on government deposits held with the central banks. These provisions, to be applied at a later date or only potentially, did not have any practical effects in 201930.
Cash management activities were therefore duly carried out as normal, through daily auctions and using bilateral transactions with maturities longer than overnight, with the aim of limiting the effects of monetary policy decisions that may penalise government deposits in a context of negative rates. More precisely, any liquidity that does not exceed the threshold of 0.04% of GDP (for Italy, equal to € 706 million for 2019), shall be subject to the EONIA rate, with the Deposit Facility rate applying to any liquidity in excess of this threshold, if negative. In 2019, the level applied was initially equal to -0.40%, which then further reduced to -0.50% in September following the decisions of the ECB's Governing Council.
In conclusion, cash management has not only had to adapt to changes in European legislation, but has also had to deal with a money market that has often been difficult to interpret, with interest rates that have been negative for several years now.
___
29 For further details on the Italian Ministerial Decree in question, please refer to the following link: http://www.dt.mef.gov.it/it/debito_pubblico/gestione_liquidita/normativa_comunicati/.
30 There are essentially two important changes, which commenced on 1 October 2019 but shall only become applicable in 2022 or depending on possible changes to the Deposit Facility rate:
1) for government deposits up to a maximum balance equal to either € 200 million or 0.04% of GDP, whichever is higher, the EONIA (Euro OverNight Index Average) rate shall continue to be applied until 3 January 2022, which is when the new €STR (€uro Short-Term Rate) shall come into force;
2) the previous ECB guidelines, which came into force in 2014, stated that zero interest was to be paid on any liquidity in excess of the threshold, in the case of a positive or zero deposit facility rate applied by the ECB, or at negative rates in the event of a negative DF rate. The new ECB guidelines state that, should the DF rate be higher than the rate applied to the sums within the threshold, then interest shall be paid on all government deposits at the same rate applied to said sums (i.e. EONIA or €STR).
For more information, please refer to ECB Guideline ECB/2019/7: (https://eur-lex.europa.eu/legal-content/IT/TXT/PDF/?uri=CELEX:32019O0007&from=IT) and ECB Decision ECB/2019/8 (https://eur-lex.europa.eu/legal-content/IT/TXT/PDF/?uri=CELEX:32019D0008&from=EN).
| ITALIAN MINISTRY OF ECONOMY AND FINANCE | 19 |
| 20 | ITALIAN MINISTRY OF ECONOMY AND FINANCE |
| II. | THE ITALIAN GOVERNMENT SECURITIES MARKET: PERFORMANCE IN THE INTERNATIONAL CONTEXT |
| II.1 | MONETARY POLICIES AND EFFECTS ON THE EURO AREA MONEY MARKET |
Monetary policies in the euro area and the USA
Towards the end of 2018, global economic activity slowed and world trade contracted, due to various sources of uncertainty. These included: ongoing trade tensions (despite some signs of easing), China's economy slowing down more than expected and the effects of the process for the United Kingdom to leave the European Union (Brexit). All of these factors had an impact on the global economy, also affecting the euro area’s economic growth prospects for 2019, with the year therefore not getting off to the best of starts. In fact, growth forecasts for 2019 were revised downwards, due to both weaker foreign demand and some country and sector-specific factors. In particular, ongoing uncertainties relating to geopolitical factors and the threat of protectionism weighed on economic sentiment. At the same time, supportive financing conditions, favourable labour market dynamics and rising wage growth continued to underpin the euro area expansion and gradually
rising inflation pressures. This underlying strength of the economy confirmed the ECB's Governing Council's belief that inflation would continue to converge steadily at levels below but close to 2% in the medium term. On this basis, during its meeting held on 7 March 2019, the Council announced measures able to maintain expansionary conditions for longer: the ECB would keep its key rates unchanged for all of 2019 at least and, at the same time, it announced a new series of targeted longer-term refinancing operations1, with the relative price conditions being defined over the following months, taking into account economic developments.
At the end of the first half of the year, economic activity in the euro area was still weak and subject to downside risks, with inflation remaining low and, in any case, lower than expected. During its meeting in July, the ECB's Governing Council therefore announced that the ECB would be keeping its key interest rates at or below current levels, at least until the end of the first half of 2020, and defined the details of targeted longer-term refinancing operations (TLTRO3) that had been announced at the meeting held in March that year. These decisions were aimed at ensuring that inflation would continue to converge towards the medium-term target value. Should this not be sufficient, the Governing Council stated that it would use all of its available instruments, in the manner deemed most appropriate, to steer inflation steadily towards the target level. As growth prospects were struggling to increase, during its monetary policy meeting held on 12 September 20192, the ECB's
___
1 https://www.ecb.europa.eu/press/pr/date/2019/html/ecb.mp190307~7d8a9d2665.en.html
2 https://www.ecb.europa.eu/press/pr/date/2019/html/ecb.mp190912~08de50b4d2.it.html
| ITALIAN MINISTRY OF ECONOMY AND FINANCE | 21 |
Governing Council took several decisions aimed at pursuing the objective of price stability. To sum up, at this meeting, the Council:
1) reduced the interest rate on deposits with the ECB by 10 basis points, from -0.40% to -0.50%. No changes were made, on the other hand, to the interest rates on the main refinancing operations (MRO) and on the marginal lending facility (MLF), at 0% and 0.25% respectively;
2) announced that net purchases would restart under the Governing Council’s asset purchase programme (APP), at a monthly pace of € 20 billion as from 1 November;
3) reiterated that reinvestments of principal payments from maturing securities purchased under the APP would continue, in full, for an extended period of time;
4) defined the modalities of the new series of targeted longer-term refinancing operations (TLTRO III), stating that they would be changed to preserve favourable bank lending conditions, ensure the smooth transmission of monetary policy and further support the accommodative stance of monetary policy. It stated that the interest rate for each operation would now be set at the level of the average rate applied in the Eurosystem’s main refinancing operations over the life of the respective TLTRO. Banks whose net lending exceeded a benchmark would benefit from a lower interest rate, equal to the average interest rate applied to deposits with the central bank over the life of the operation. It would also possible to extend the maturity of operations from two to three years;
5) in order to support the bank-based transmission of monetary policy, it introduced a two-tier system for reserve remuneration3, in which part of banks’ holdings of excess liquidity would be exempt from payment of the negative interest rate on deposits held with the central bank. This strategy began to be implemented on 30 October 2019.
The year ended with modest inflation prospects, which is why the Council reaffirmed the need to maintain a highly accommodating monetary policy stance for an extended period of time, in order to support underlying inflationary pressures and overall inflation dynamics over the medium term.
During 2019, the United States once again saw economic growth continue at a fairly steady rate (real growth of around 2% on a quarterly basis), with unemployment rates slowly but continuously falling, at around 3.5%. However, signs of a slowdown were in sight, due to the exceptionally long recovery phase of the US economic cycle and as a result of the fiscal support from the US Administration, which certainly could not be considered as structural, let alone sustainable in the long term. In addition, there were the aforementioned uncertainties relating to the ongoing geopolitical tensions with China. In this context, the FED put a stop to a long cycle of rate hikes, with rates remaining unchanged until June 2019. It then began an initial cycle of reductions, which were initially limited and then gradually accelerated towards the end of 2019, altering the rates from 2.25% to 1.5%. The acceleration of expansionary monetary policy during the last months of 2019 was not only the result of the growth outlook becoming gradually less sustained, but was also aimed at mitigating some money market tensions that emerged in September
___
3 See https://www.ecb.europa.eu/ecb/legal/pdf/celex_32019d0031_it_txt.pdf
| 22 | ITALIAN MINISTRY OF ECONOMY AND FINANCE |
II. THE ITALIAN GOVERNMENT SECURITIES MARKET: PERFORMANCE IN THE INTERNATIONAL CONTEXT |
and affected the repo market, where rates increased by over 60 basis points. In order to deal with this problem, the FED also took action to pour vast amounts of liquidity into the system through reverse repo operations.
The euro area money market
At the start of 2019, the ECB's key rates were anchored at the level of the previous year, and remained unchanged until September, when the ECB introduced the rather broad set of monetary policy measures described above, including a reduction in interest rates on the deposit facility (DF), while no changes were made to the MRO and MLF rates (see Chart II.1).
| CHART II.1: MONETARY POLICY INTEREST RATE CORRIDOR, 2016-2019 (PERCENTAGE VALUES) |
|
| Source: Based on Bloomberg data |
This decision inevitably also affected the main interbank market rates4: the EONIA rate (Euro OverNight Index Average) and the EURIBOR rates (EURo Inter Bank Offered Rate), which are known to record movements that are perfectly linked to the key ECB rates.
The same thing also happened after the decision taken in mid-September 2019 to reduce these rates, while maintaining the average spread between them and the deposit facility rate. In fact, from 2018 until the day before the minimum ECB rate was adjusted, the average EONIA rate had been -0.36%, while the average 3M EURIBOR rate stood at -0.32%. Since the new ECB deposit facility rate came into force until the end of the year, the average EONIA rate decreased to -0.46%, while the average 3M EURIBOR rate was equal to -0.40%. This effect can be clearly seen in Chart II.2 below.
The apparent anomaly that can be seen in the chart, whereby the EURIBOR rate appears lower than the EONIA rate at the beginning of the third quarter, is attributable to the fact that the market discounted in advance the ECB's subsequent
___
4 Benchmark rates, which play a fundamental role in the financial system, are currently undergoing an update process; please refer to the specific Focus section on pages 27-28 of the 2018 Public Debt Report for further details.
| ITALIAN MINISTRY OF ECONOMY AND FINANCE | 23 |
reduction of the deposit facility rate, on account of the continuing weakening of economic growth both worldwide and in the euro area. Subsequently, when the rate was actually cut, the EONIA rate also decreased, bringing it closer to the new level of the minimum ECB rate and thus correcting the trend reversal between the two interbank market curves recorded in the summer.
| CHART II.2: PERFORMANCE OF THE MAIN MONEY MARKET RATES, 2018-2019 (PERCENTAGE VALUES) |
|
| Source: Based on Bloomberg data |
II.2 EURO AREA BOND MARKETS
There was some degree of continuity between 2018 and 2019 with regard to the factors driving the evolution of financial markets over the course of the year, especially in relation to the international and national political risks that fuelled uncertainty and volatility on more than one occasion. The prolonged trade war between the USA and China, with the two countries seemingly being open to talks and to find solutions one moment, to only defer agreements and contribute to escalating tensions the next, undoubtedly affected macroeconomic dynamics, especially in terms of operators finding it difficult to identify a stable context in which to develop and implement their economic decisions. This also had inevitable effects on the European economy, where several countries, including Italy, recorded a very low growth rate in the first three quarters of 2019. Yield rates on the bond markets were therefore expected to remain low for a long period of time, unlike the prevailing consensus towards the end of 2018, which prompted domestic and international investors to seek strategies that could improve the profitability of their portfolios. Against this macroeconomic backdrop, the euro area's government securities market prices recorded an upward trend similar to the US yield curve, whose rates fell by around 70 basis points in 2019. Even the euro area’s “core” countries witnessed a drop in yields for most of 2019, with rates at zero even for very long maturities and the German 10-year yield remaining in negative territory, recording a minimum of -0.716 (see Chart II.3). Government bond yields in the euro area’s other main countries showed a parallel trend to that of German securities
| 24 | ITALIAN MINISTRY OF ECONOMY AND FINANCE |
II. THE ITALIAN GOVERNMENT SECURITIES MARKET: PERFORMANCE IN THE INTERNATIONAL CONTEXT |
during 2019 (see Chart II.4). In this context, Italy's political landscape underwent rapid change during the summer, when the government fell and a new government was formed with a different majority, which was more in line with EU rules in terms of fiscal and budgetary policy.
At the same time as the new government was formed (from the second half of August), the government bond market saw the yield spread with the main EU countries (primarily Germany) reduce at a notably quicker rate, following an initial phase recorded in June, when the risk of Italy having to enter the excessive deficit procedure (EDP) ceased to exist.
In this context, debt management allowed the average cost at issuance to be reduced, which was equal to 0.93% in 2019, as was also the case for the average cost of debt, calculated as the ratio between the interest and the general government’s debt stock, which continued to decline down to 2.58%. This result must also be interpreted in relation to the composition of debt, which, at the end of 2019, presented an average life of 6.87 years in relation to the stock of government securities, which is only slightly higher than the figure at the end of 2018, equal to 6.78 years. This was thanks to the various issuances on the longer section of the yield curve, completed both through auctions and through the syndicated placement of three new nominal benchmark securities (15, 20 and 30 years), the reopening of the 50-year bond and the new 10-year BTP linked to European inflation. Indeed, a long average life not only has a tendency to mitigate the risk of refinancing, by diluting over time the volumes to place on the market to cover maturing debt, but also shows the issuer’s lower exposure to sudden increases in interest rates.
CHART II.3: TREND OF GERMAN AND US GOVERNMENT BOND YIELDS - 10-YEAR MATURITY (PERCENTAGE
VALUES AND SPREAD IN BASIS POINTS) |
|
| Source: Based on Bloomberg data |
| ITALIAN MINISTRY OF ECONOMY AND FINANCE | 25 |
| CHART II.4: TREND OF EUROPEAN GOVERNMENT BOND YIELDS - 10-YEAR MATURITY (PERCENTAGE VALUES) |
|
| Source: Based on Bloomberg data |
| FOCUS | | Details on how the Public Sector Purchase Programme (PSPP) evolved during 2019 As part of the Asset Purchase Programme (APP), the Public Sector Purchase Programme (PSPP), which began on 9 March 2015, involves net acquisitions of securities issued by central governments and public agencies of euro area countries, as well as those issued by supranational institutions5. The monetary policy decisions taken by the Governing Council on 14 June 2018 stated that, starting from January 2019, the Eurosystem would no longer make net purchases under the Public Sector Purchase Programme, but would continue to reinvest the principal repaid by the maturing securities held in its portfolio. Details of how the PSPP evolved over 2019 are provided below, on the basis of the monetary policy decisions that were made as part of this programme. In fact, despite the fact that 2019 had started with the ECB’s public sector purchase programme coming to an end, the European Central Bank implemented various support measures over the course of the year, some of which also related to the scope of the public sector purchase programme; these measures were introduced due to the worsening macroeconomic context, characterised by a slowdown in the euro area’s economic growth rate and a shift away from the target inflation rate. With the monetary policy decisions made on 12 March 20196, the ECB indicated the time frames it would follow to reinvest the principal repaid by the maturing securities held in its portfolio. In particular, it stated its intention to continue reinvesting, in full, the principal payments from maturing securities for an extended period of time past the date when it would start raising the key ECB interest rates, and, in any case, for as long as necessary to maintain favourable liquidity conditions and an ample degree of monetary accommodation. |
___
5 For further details on the changes made to the PSPP each year, please refer to the relative focus section in previous years’ Public Debt Reports.
6 https://www.ecb.europa.eu/press/pr/date/2019/html/ecb.mp190307~7d8a9d2665.en.html
| 26 | ITALIAN MINISTRY OF ECONOMY AND FINANCE |
II. THE ITALIAN GOVERNMENT SECURITIES MARKET: PERFORMANCE IN THE INTERNATIONAL CONTEXT |
| | Already in June, faced with a worsening macroeconomic context and a shift away from the target inflation rate, the ECB President, during his opening speech at the ECB's annual forum, underlined the possibility for the ECB to also reactivate the APP in net terms, among the other instruments available, in order to achieve monetary policy objectives. However, the decision to begin purchasing both public and private sector bonds again, in net terms, was only made during the meeting held on 12 September 20197, when the reactivation of the APP was announced, at a monthly pace of € 20 billion starting from 1 November 2019. With regard to duration, the Governing Council announced that the programme would run for as long as necessary to reinforce the accommodative impact of its policy rates, and that it would end shortly before it started raising the key ECB interest rates. This was the first time such an announcement had been made, especially in terms of the time frame defined for the duration; in fact, for the first time, the programme was not tied to any precise time limit, but rather to the ECB achieving its monetary policy objectives. In this regard, the programme became “open-ended” for the first time, i.e. with an unlimited duration. The monthly volume of net purchases would be equal to the lowest amount defined since the beginning of the programme. Figure 1 below shows the net monthly purchase trend from the beginning of the programme (March 2015) until December 2019: |
| | FIGURE 1: NET PURCHASES UNDER THE APP PROGRAMMES (€ billion) |
| | |
| | Source: based on ECB data |
| | As already stated, from January to October 2019, the only activities carried out by the ECB on the government securities market, as part of the PSPP, involved the reinvestment of maturing securities. Considering the different volume of government securities maturing each month, the monthly net purchase amount was therefore negative in some months and positive in others. Overall, during the period in question, the volume of Italian government securities purchased was slightly negative, amounting to € -2.525 billion. During November and December 2019, on the other hand, there was a recovery in net purchases by the ECB, with the amount of securities purchased by the ECB amounting to € 959 million. Furthermore, as shown in the figure below, from the beginning of the programme until the end of 2019, the total volume of Italian securities purchased by the ECB amounted to € |
| ITALIAN MINISTRY OF ECONOMY AND FINANCE | 27 |
| | 363.788 billion8, which was slightly lower than the figure at the end of 2018 due to the slightly negative volume of purchases in 2019. Finally, the average life of the stock of Italian securities held by the ECB at 31 December 2019 was equal to 7.17 years. |
| | FIGURE 2: VOLUME AND AVERAGE LIFE OF THE STOCK OF ITALIAN GOVERNMENT SECURITIES PURCHASED BY THE ECB |
| | | Years |
| | |
| II.3 | TRENDS IN THE ITALIAN GOVERNMENT SECURITIES MARKET |
Evolution of the yield curve
As already mentioned, during 2019, yield dynamics for Italian government securities (Chart II.5) were largely influenced by internal factors, in particular the new government being formed over the summer.
Market sentiment towards Italian debt began to gradually improve as the measures to correct public finances were prepared in June, avoiding the European Commission having to launch an excessive deficit procedure against Italy. The change became more marked in the height of the summer when the new government was formed, as the latter immediately proved to be much more inclined towards institutional dialogue at EU level. This led the yield on the ten-year BTP to reach a minimum of around 0.80% in September.
___
7 https://www.ecb.europa.eu/press/pr/date/2019/html/ecb.mp190912~08de50b4d2.en.html
8 These amounts are expressed in terms of their equivalent value
| 28 | ITALIAN MINISTRY OF ECONOMY AND FINANCE |
II. THE ITALIAN GOVERNMENT SECURITIES MARKET: PERFORMANCE IN THE INTERNATIONAL CONTEXT |
| CHART II.5: MARKET YIELDS ON 2-, 3-, 5-, 10-, 15-, 30- AND 50-YEAR GOVERNMENT SECURITIES (PERCENTAGE VALUES) |
|
| Source: Based on Bloomberg data |
The slope of Italy's forward yield structure recorded a gradual and substantial decline along the 2-10 year section (see Chart II.6), passing from approximately 240 basis points at the start of 2019 to reach a low of around 110 basis points at the end of September, before then closing the year at around 150 basis points. It should be noted that this decline in the slope was not unfavourable, considering the disproportionate reduction in the 10-year maturity yield.
| CHART II.6: GOVERNMENT SECURITIES YIELD SPREAD, 10-YEAR VS. 2-YEAR (BASIS POINTS) |
|
| Source: Based on Bloomberg data |
The particularly positive performance of the 10-year point on the yield curve also caused the slope in the 10 to 30-year section to increase accordingly, in a context that nonetheless saw very long-term yields fall by approximately 100 basis points in absolute terms.
| ITALIAN MINISTRY OF ECONOMY AND FINANCE | 29 |
| CHART II.7: GOVERNMENT SECURITIES YIELD SPREAD, 30-YEAR VS. 10-YEAR (BASIS POINTS) |
|
| Source: Based on Bloomberg data |
The spread between Italian and German government securities (Chart II.8), as mentioned above, followed the trend of the absolute return rates for Italian securities. During the first part of the year, the yield rates for Italian securities remained practically stable, as did the spread, while the latter then began to narrow from the end of May onwards, reaching approximately 130 basis points in the autumn, before closing the year at around 150 basis points.
| CHART II.8: YIELD SPREAD: BTP-BUND, OAT-BUND AND BONOS-BUND, 10-YEAR BENCHMARK (BASIS POINTS) |
|
| Source: Based on Bloomberg data |
| 30 | ITALIAN MINISTRY OF ECONOMY AND FINANCE |
II. THE ITALIAN GOVERNMENT SECURITIES MARKET: PERFORMANCE IN THE INTERNATIONAL CONTEXT |
Secondary market performance
General introduction
The secondary market for Italian government securities performed more or less in line with previous years, without any particular distinctive or different features to report. The evolution of the market during 2019 was of course influenced by the national and international political events referred to in the previous sections of this report, as well as by the features of the Italian market. The latter include (i) the role of market making; (ii) the primary dealership system9, which, in 2019, saw the number of operators on the Italian market drop from 18 down to 16; (iii) the functioning of the futures market which, over time, has taken on a leading role for effective market making among primary dealers; (iv) the contribution of the repo and strips markets; and (v) the interrelationships with the primary market (regularity and continuity of issues compared with benchmark securities along several points of the curve).
During 2019, a progressive decrease in the volumes traded on the reference market for BTP securities, the MTS platform, became increasingly clear, and not only with regard to Italian government securities; this was not only to the benefit of other electronic platforms, especially business-to-customer platforms, but also, and above all, went in favour of transactions involving alternative instruments such as futures, which are mainly used by primary dealers to "neutralise" long government bond positions, in order to minimise the impact on their own budgets. The introduction of new European regulations (CID 2013, CRR 2013, MiFiDII, MifiR, CSDR, EMIR, etc.) significantly strengthened the solvency and sustainability of banks and intermediaries, although this also limited their profitability and, with regard to primary dealers, it also limited their ability to absorb market risks, making their work increasingly broker-oriented. For this reason, wholesale government securities markets saw volumes fall on average, to the benefit of trades in the futures segment.
The Brexit risk did not affect the financial system or the trading markets. The Italian government took swift action by passing a decree law that would immediately come into full force should the United Kingdom leave the EU without a deal. This legislative instrument introduced a transitional arrangement by which UK-based operators would still be able to continue operating on the bond markets.
The interdealer wholesale market and the contribution of government bond specialists
Only dealers and market makers operate on the ‘MTS Italia’ regulated platform (the so-called ‘interdealer market’), and this is where the Treasury currently monitors and evaluates the activities of government bond specialists on the wholesale secondary market. This platform therefore represents a point of reference to analyse how this market segment is developing.
___
9 Established by dealers specialising in government securities
| ITALIAN MINISTRY OF ECONOMY AND FINANCE | 31 |
The cash market
The volumes traded on the MTS platform recorded a trend that was clearly affected by general market conditions and the perceived credit risk for Italy. In fact, overall volumes were low and decreased as spreads widened, while they recovered slightly during the months when BTPs recorded good performance in terms of falling yields and spreads.
More generally, an average of 20% less volumes were traded each month during 2019 compared with the previous year, with this figure reaching a low of -50% in May. This trend has been ongoing for several years. In fact, the overall volumes traded in 2019 were over 33% less than in 2016. However, it should be noted that, once the phase of political uncertainty was over and the new Conte government had taken office with a different parliamentary majority behind it, the last months of the year saw a certain degree of stability in terms of volumes traded, compared not only with the previous months but also with the same months in 2018.
On a quarterly basis, the greater decline compared with 2018 (around 30% on average) was recorded in the first two quarters, while this reduction was much more contained in the third and fourth quarters (-6% and -2.5%, respectively).
| CHART II.9: MONTHLY VOLUMES TRADED ON THE MTS PLATFORM (€ MILLION; DOUBLE-COUNTED) |
|
| Source: Based on MTS data |
With regard to the breakdown of volumes traded by segment, 2019 was substantially in line with 2018, with the exception of BOTs, which recorded an increase in trades as a percentage of the total, equal to 39% of total volumes traded compared with 34% in the previous year. All other segments saw a decrease in their weighting on the total. The BTP€i segment undoubtedly remains a niche market, representing just 3.5% of total volumes. The CTZ and CCTeu segments have market shares of around 7%, only marginally lower than in 2018. Last but not least, the nominal BTP sector is the most significant, which accounts for just under 50% of total volumes. In absolute terms, the trend is of course very similar to that of total volumes. In fact, there was a drop in transactions for all segments, which was particularly marked in the BTP€i and CCTeu segments (over 30%), but also involved
| 32 | ITALIAN MINISTRY OF ECONOMY AND FINANCE |
II. THE ITALIAN GOVERNMENT SECURITIES MARKET: PERFORMANCE IN THE INTERNATIONAL CONTEXT |
nominal BTPs and CTZs (around 23% for both), as well as BOTs (10%). However, while the last quarter saw the BOT segment record trading volumes that were in line with the first quarter and with the quarters of previous years, there was a constant decline in the BTP segment, reaching the lowest level of the last five years.
| CHART II.10: QUARTERLY VOLUMES TRADED ON THE MTS PLATFORM, BY SEGMENT (€ MILLION; DOUBLE-COUNTED) |
|
| Source: Based on MTS data |
The various sections along the maturity curve recorded different trends regarding the volumes traded. In particular, the short-term part of the curve appears to be quite penalised, probably due to the effect of its greater weighting on the total number of trades. More specifically, the most affected section appears to be the 1-2-year segment (which also includes CTZs in addition to short-term BTPs and CCTeus), with reductions of around 30% compared to 2018. The 4–6-year and 6-8-year segments were also greatly affected, decreasing by 26% and 31% respectively. These maturities were heavily penalised in 2019, mainly due to the fact that investors lacked a valid hedging instrument. In fact, although the 5-year future contract may be traded on the Eurex market, the two more liquid instruments are those for the 3-year and 10-year maturities.
On the long part of the curve, on the other hand, the 10-year segment recorded a relatively limited reduction at around 7%, while the very long part of the curve even saw an increase in volumes traded, especially along the 12-17-year segment (up 24%). The segment made up of securities with a maturity of over 17 years also recorded higher volumes in 2019 than the 12-17-year segment, especially as this includes three benchmark BTPs at the 20-, 30- and 50-year points, which are regularly proposed again on the primary market.
| ITALIAN MINISTRY OF ECONOMY AND FINANCE | 33 |
| CHART II.11: QUARTERLY VOLUMES TRADED ON THE MTS PLATFORM, BY MATURITY (€ MILLION; DOUBLE-COUNTED) |
|
| Source: Based on MTS data |
Secondary market liquidity is not only monitored by analysing the volumes traded, but is above all assessed using a simple indicator known as the bid-ask spread, i.e. the difference between the purchase price (bid) and sale price (ask) for each security on the market. The lower the bid-ask spread of a given security, the greater the liquidity of said security.
The charts below show the trends recorded by this indicator for all segments and for all the benchmark points along the yield curve: as Italy's political tensions eased, the liquidity improvements that had already begun towards the end of 2018 became even stronger during the first months of 2019. However, tensions within the Italian government began to re-emerge and the latter showed a rather critical approach vis-à-vis European partners, once again triggering an aversion towards Italian sovereign risk. This led to a new drop in liquidity, which can clearly be seen through the increase in bid-ask spread levels along all points of the curve.
However, as shown by Charts II.12.a, 12.b and 12.c, during the first quarter of 2019 the 10-year BTP was the only segment to return to pre-May 2018 liquidity levels; in fact, the bid-ask for this segment did not subsequently show any excessive deterioration, despite the new tensions arising during the summer. For the other segments, however, not only did the bid-ask spread fail to fully return to pre-May 2018 levels (not only during the first quarter), but this indicator actually also significantly widened from May 2019 onwards, especially for longer-term segments and CCTeus.
| 34 | ITALIAN MINISTRY OF ECONOMY AND FINANCE |
II. THE ITALIAN GOVERNMENT SECURITIES MARKET: PERFORMANCE IN THE INTERNATIONAL CONTEXT |
| CHART II.12A: BID-ASK SPREAD (IN BASIS POINTS) FOR CTZS, CCTEUS, 3-, 5- AND 7-YEAR BENCHMARK BTPS, AS RECORDED ON THE MTS PLATFORM - MONTHLY AVERAGES |
|
| Source: Based on MTS data |
| CHART II.12B: BID-ASK SPREAD (IN BASIS POINTS) FOR 10-, 15-, 20-, 30- AND 50-YEAR BENCHMARK BTPS, AS RECORDED ON THE MTS PLATFORM - MONTHLY AVERAGES |
|
| Source: Based on MTS data |
It should be noted that the inflation segment recorded particularly weak performance. In fact, in August (when political uncertainty was at its worst and the credit risk premium being demanded by investors was at its highest), this segment had even higher bid-ask spread levels than those recorded in May 2018. The lower level of liquidity in the European inflation-linked BTP segment compared with Italy's other government securities is explained by the fact that these securities not only involve an intrinsically higher credit risk than nominal securities, but they were also affected by the lack of demand for this type of asset, which was very limited in 2019 due to modest inflation expectations. It was only in September that the situation began to improve, thanks also to the new measures adopted by the ECB, which encouraged more favourable market conditions and allowed for a new index-linked security with a 10-year maturity to be issued, through syndicated placement.
| ITALIAN MINISTRY OF ECONOMY AND FINANCE | 35 |
| CHART II.12C: BID-ASK SPREAD (IN BASIS POINTS) FOR 5- AND 10-YEAR BENCHMARK BTP€IS, AS RECORDED ON THE MTS PLATFORM - MONTHLY AVERAGES |
|
| Source: Based on MTS data |
To measure secondary market liquidity, it is also possible to use less common but more sophisticated indicators, which take into account the size of the bid-ask spread, and also other aspects, such as price changes stemming from major transactions or analysis of the depth of pricing on both sides of the order book, for each security10.
One such indicator is the ‘slope’, which measures the ratio between the absolute difference between the best and the worst price of a given security at a given moment and the difference between the total volume of all prices in the order book for the security in question and the volume of the best price11.
When shown in a chart, this ratio generates a straight line for each side of the order book (bid and ask), highlighting buy and sell price trends depending on the quantity demanded or supplied by market makers. This indicator therefore measures the marginal price increase/decrease that the dealer will demand in order to trade an additional unit compared with the quantity quoted at the best price. This means that, the higher the indicator (the steeper the slope of the line), the lower the level of liquidity for the security in question. In order to get the most comprehensive picture possible and to calculate the slope for a given security on a given day of trading, the slope is calculated across many moments on the same day, and these figures are then used as a basis to calculate the average and create the daily slope figure.
___
10 The order book collects all trading orders for a given security that are present on the market at a certain moment in time, and divides them into buy and sell orders, arranged in descending and ascending order, respectively.
11 This measure is conceptually very similar to the ‘price impact’, although the slope is calculated based on buy or sell orders, while the price impact is based on both proposed prices and trading activities. In fact, the price impact measures the relationship that exists between a buy or sell order and the corresponding change in listing price. However, literature on this subject confirms that calculating this metric is rather complex, as it not only requires an extremely large amount of intraday data, but also includes subjective assessments, including: the threshold beyond which the impact of trading on pricing is to be assessed; defining the time lag during which the price change due to trading must occur; etc.
| 36 | ITALIAN MINISTRY OF ECONOMY AND FINANCE |
II. THE ITALIAN GOVERNMENT SECURITIES MARKET: PERFORMANCE IN THE INTERNATIONAL CONTEXT |
| CHART II.12D: DAILY SLOPE ON 10-YEAR BENCHMARK BTP (LOGARITHMIC SCALE), AS RECORDED ON THE MTS PLATFORM |
|
| Source: Based on MTS data |
This indicator reveals that liquidity deteriorated much less extensively than in 2018, but that this phenomenon was more persistent throughout the June-September 2019 period; it also highlights how, even in the months that followed, liquidity reached more favourable levels but did not fully return to the levels at the beginning of 2018.
The repo market
The government securities repo market plays a major role in supporting orderly
trading on the cash market. In fact, an efficient repo market allows operators (especially market makers) to ensure a continuous market presence in terms of bid and ask for all securities, even if they do not hold certain securities in their own portfolios. Over the past few years, the EU legislator has intervened on several occasions and in different areas to reassess how intermediaries and financial markets are regulated and supervised. Many aspects of these legislative changes affected the repo market12, making it more costly to use. However, although spot volumes were down in 2019, repo market volumes instead recorded a slight increase, around 25% higher than those traded in 2018. It is useful to remember that, in this market, market makers only play a marginal, albeit important, role, as liquidity in this sector is facilitated by the fact that there is a much wider range of operators compared with the dealers operating in the cash market.
___
12 The most recent measure that attracted operators’ attention, due to its potentially negative effects on the repo market, involved the future implementation of the NSFR (Net Stable Funding Ratio); the latter represents a new liquidity requirement that is designed to force banks to limit any liquidity imbalance between funding sources and how these sources are used to provide financing. In particular, for the purposes of this Report, operators are interested in the regulatory asymmetry which would arise, unless changes are made to the structure imposed by the relative regulations, regarding how collateralised loan or repo activities and collateralised financing or reverse repo activities would be respectively used to calculate the ASF (Available stable funding), without however being included in the calculation of the RSF (Required stable funding) (or vice versa), for transactions with a duration of less than six months.
| ITALIAN MINISTRY OF ECONOMY AND FINANCE | 37 |
| CHART II.13: ANNUAL VOLUMES TRADED ON THE MTS PLATFORM IN 2018 AND 2019, BY CONTRACT MATURITY (€ MILLION) |
|
| Source: Based on MTS data |
| CHART II.14: MONTHLY VOLUMES TRADED ON THE MTS PLATFORM IN 2019, BY CONTRACT MATURITY (€ MILLION) |
|
| Source: Based on MTS data |
There were no particular cases of ‘specialness’13, except perhaps sporadically, thanks to the securities lending mechanism14 supplied by the Bank of Italy as part of the Public Sector Purchase Programme, through which the central bank temporarily provides securities for which dealers hold temporary short positions. Repo market trading was therefore substantially carried out in an orderly manner, without any particular problems or moments of acute stress.
___
13 Specialness is when the repo yield for a given security exceeds the general collateral rate.
14 For further information on securities lending, please refer to the following link on the ECB website https://www.ecb.europa.eu/mopo/implement/omt/lending/html/index.en.html
| 38 | ITALIAN MINISTRY OF ECONOMY AND FINANCE |
II. THE ITALIAN GOVERNMENT SECURITIES MARKET: PERFORMANCE IN THE INTERNATIONAL CONTEXT |
As also mentioned in previous years’ reports, there is now a consolidated process of fast-money investors playing an increasingly significant role in the repo market, who are simultaneously particularly active on the futures market.15
In fact, as Charts II.21 and II.15 clearly show, in May/June, not only did the future contract open interest rise, but special repo volumes also increased, especially with regard to foreign investors16.
| CHART II.15: MONTHLY SPECIAL REPO VOLUMES TRADED ON THE MTS PLATFORM (€ MILLION) |
|
| Source: Based on MTS data |
Activities of government bond specialists on the platform used to appraise them
The MTS trading platform has been selected to evaluate specialist dealers17, with the latter playing a dominant role in terms of traded volumes; in fact, in 2019, they represented more than 90% of total trades, despite the number of specialist dealers dropping to 16 in recent years. The remaining trades, equal to around 10%, were mainly completed by the other market makers (non-specialist18, while a residual amount of less than 1% was traded by non-market maker dealers (‘price takers’).
___
15 In fact, above all around the time when futures contracts expire (in March, June, September and December of each year), it is not uncommon to note critical issues with the cheapest-to-deliver (CtD) security, tending to become increasingly ‘special’, i.e. with particularly misaligned rates compared with those of general collateral. This phenomenon tends to become especially exacerbated during times of stress, when fast-money investors tend to prefer strategies characterised by short futures positions and long positions for the CtD security in the repo market; the CtD security therefore tends to be more in-demand, thus recording increasingly lower repo rates that are further and further away from general collateral rates.
16 This combined effect is also linked to futures operations connected with the rolling of contracts with a quarterly expiry.
17 It should be remembered that this is an interdealer platform, meaning trades are made between intermediaries and not with end investors.
18 Pursuant to Art. 1, paragraph 5-quater, of the TUF (Italian Consolidated Law on Financial Intermediation), “Market Makers” are defined as entities that are willing to trade on their own behalf, in and/or outside of trading venues, on an ongoing basis, by buying and selling financial instruments as a direct counterparty, at the prices that they set themselves. In order to apply to be included in the ‘List of Specialist Operators’ pursuant to Art. 23, paragraph 1, of Italian Ministerial Decree no. 216 of 2009, an entity must be classed as a Market Maker.
| ITALIAN MINISTRY OF ECONOMY AND FINANCE | 39 |
| CHART II.16: ANNUAL VOLUMES TRADED BY SPECIALISTS ON THE MTS PLATFORM (%) |
|
| Source: Based on MTS data |
Government bond specialists’ trading with end investors
Traded volumes
Specialists (Primary Dealers) play an extremely important role, not only by ensuring liquidity on the interdealer market, but also by distributing the securities purchased on the primary market to end investors. This is why it is of crucial importance for the DMO to analyse traded volumes and purchases/sales broken down by investor type and geographic area, in order to better understand who end investors are and what they are looking for in a given market context. This important monitoring and analysis is carried out using the information collected via the EMAR19. The EMAR is a highly standardised reporting model shared at EU level, which is filled in by the Specialists themselves; the latter use this report to systematically record all the activities they perform20 with any counterparty, including their end customers.
As was the case in the previous year, 2019 once again saw an increase in trading activity in terms of the volumes traded outside of the MTS, equal to 5% (both on
___
19 European Market Activity Report. This report replaced the previous “HRF” - “Harmonized Reporting Format”, but only in terms of its name as its content remained substantially the same.
20 This report also includes transactions completed both on trading platforms and on a bilateral basis, both electronically and vocally. Since 2014, this report has included all the information on individual trades completed by Specialists (trade-by-trade report), providing indication, for each trade, of the security, the quantity, the country in which the counterparty is based, the type of counterparty and the platform or trading method used. From 1 January 2020, this report also began to include trades on Italian government securities issued under foreign legislation (MTN). Also starting from 1 January 2020, the report's format was enhanced with information on the settlement date, allowing for analysis on certain types of operations carried out by Specialists (for example, trades with the non-standard settlement of two working days, such as simultaneous trades or trades with a settlement of over seven days, also known as forward transactions).
| 40 | ITALIAN MINISTRY OF ECONOMY AND FINANCE |
II. THE ITALIAN GOVERNMENT SECURITIES MARKET: PERFORMANCE IN THE INTERNATIONAL CONTEXT |
other electronic platforms and elsewhere). This increase should, however, be interpreted in a context where MTS trades fell by approximately 30%, as already mentioned. Therefore it can be argued that part of the activity carried out on the selected platform has moved to other electronic platforms, which are more business-to-customer in nature, in line with how the primary dealer model has also been evolving over recent years. Dynamics in 2019 cannot be compared with those of 2018, especially due to the fact that the moments of greatest risk aversion happened at different times in the two years under review.
| CHART II.17: MONTHLY VOLUMES TRADED BY SPECIALISTS ON PLATFORMS OTHER THAN THE MTS (€ MILLION) |
|
| Source: Based on EMAR data |
Trades broken down by type of counterparty
As mentioned above, the information gathered through the EMARs, especially from 2014 onwards (when the trade-by-trade format was introduced), plays a very significant role indeed, as it allows for in-depth analysis into current dynamics among government bond investors. By aggregating the information contained in these reports, it is possible to monitor trends by sector, by geographical area and by type of investor, as well as the liquidity present on the various trading platforms.
With regard to the evolution of demand by type of investor, the charts below show the trend of absolute volumes and net amounts (purchases minus sales) traded with Specialists belonging to the main categories of investors - banks, investment funds, pension funds, insurance companies and hedge funds.
Chart II.17 highlights some very interesting trends from 2019. Investment funds and banks still represent the main investors in government securities, in terms of both absolute volumes and net purchase flows. Firstly, there was a return to investment funds providing important support, in terms of both absolute volumes (around 47% of total trades) and in terms of net purchases (just over 45%); these dynamics could already be seen in the years running up to 2018, but then halted. Net purchases made by investment funds more than doubled compared with 2018
| ITALIAN MINISTRY OF ECONOMY AND FINANCE | 41 |
(while absolute volumes grew by only 3% in the same period). The volumes traded by banks, representing another key investor category, fell by 3%, contributing just over 33% to total net purchases, down significantly from 63%. Another interesting aspect when looking at the banking sector is geographical distribution. In fact, foreign banks recorded not only an increase in overall transactions (+6%), but, above all, a significant rise in net purchases (+60%), representing over 70% of the net purchases made by the banking sector. Although the majority of these purchases were made during the first half of the year, it should nonetheless be noted that foreign banks did not reduce their exposure to Italy during the more volatile third quarter. Italian banks, on the other hand, maintained a more consistent profile over the course of the year, albeit with much lower values. It is likely that this trend is attributable to new regulations forcing banks to increasingly diversify their portfolios, not only in terms of the types of assets but also with regard to limiting risk concentration towards a specific country.
The investor category represented by pension funds and insurance companies made no substantial changes to its investment policies with regard to Italian government securities. In fact, 2019 once again saw these investors make a relatively modest contribution, both to the total number of transactions and in terms of net purchases, accounting for approximately 3% of the total in both cases.
Finally, hedge funds continued to strengthen their position in terms of total trading. The volumes traded by this particular category of investor increased from approximately 18% to over 21%, while their annual contribution to total net purchases grew from around 2% to around 20%. In 2019, hedge fund investors maintained a fairly steady investment profile compared with the previous year, even during more turbulent times, when these investors actually increased their exposure towards Italy.
| 42 | ITALIAN MINISTRY OF ECONOMY AND FINANCE |
II. THE ITALIAN GOVERNMENT SECURITIES MARKET: PERFORMANCE IN THE INTERNATIONAL CONTEXT |
| CHART II.18: QUARTERLY VOLUMES TRADED BY SPECIALISTS, BY TYPE OF COUNTERPARTY - FUND MANAGERS, BANKS, PENSION FUNDS AND INSURANCE COMPANIES, HEDGE FUNDS (€ MILLION) |
|
| Source: Based on EMAR data |
| ITALIAN MINISTRY OF ECONOMY AND FINANCE | 43 |
Trades broken down by counterparties’ geographical areas
In terms of the evolution of demand by geographical area in 2019, broken down between Italian and foreign investors, saw some trends continue that ha been ongoing for a number of years: the share of total transactions carried out by Italian counterparties continues to decrease at a moderate but constant rate, and, in 2019, this remained unchanged at 3%. In 2019, Italian investors did not make the same contribution to net purchases as they had done in 2018, when this had acted as an important stabilising factor, especially during times of crisis; on the other hand, this was actually not necessary in 2019, given the greater presence of foreign investors. In fact, net purchases made by Italian investors reached the exceptional value of around € 100 billion in 2018 (this had not been recorded since 2014), whereas, in 2019, this figure came back in line with the average recorded in the years leading up to 2018, amounting to just over € 50 billion.
As already touched on, foreign end investors represented the main share of total trades completed in 2019. More specifically, volume amounts grew by a further 7% in 2019 (after around +10% was recorded in 2018). With regard to the trend in net purchases, 2019 certainly marked a record year, with the total amount reaching almost € 200 billion, after a net outflow of over € 50 billion was recorded during the previous year.
| CHART II.19: QUARTERLY VOLUMES TRADED BY SPECIALISTS ACCORDING TO COUNTERPARTY RESIDENCE (€ MILLION) |
|
| Source: Based on EMAR data |
| 44 | ITALIAN MINISTRY OF ECONOMY AND FINANCE |
II. THE ITALIAN GOVERNMENT SECURITIES MARKET: PERFORMANCE IN THE INTERNATIONAL CONTEXT |
Evolution of the BTP Futures market
The evolution of future contract prices on ten-year Italian government securities21 (this maturity is by far more liquid compared with contracts on three-year and five-year maturities) was perfectly in line with the performance of the ten-year benchmark BTPs (see Chart II.20). However, there were some discrepancies during 2019, due to both the change of the benchmark BTP and the roll of future contract for the various quarterly expiry dates.
| CHART II.20: PRICES OF THE BTP FUTURE AND YIELD OF THE 10-YEAR BENCHMARK BTP (RIGHT-HAND SCALE INVERTED, IN %) |
|
| Source: Based on Bloomberg data |
In 2019, the volumes traded for the 10-year future contract remained substantially in line with 2018, recording a slight decrease of 5%. However, a significant increase was recorded in open interest levels22, of around 20% (see Chart II.21).
___
21 BTP Futures contracts are traded on the Eurex platform
22 Open interest represents the number of outstanding futures contracts that are traded on the market (i.e. that have not yet been settled). It can therefore be defined as the sum of all long or short positions opened on 10-year BTPs via a futures contract in a certain moment in time. Steep increases normally indicate a large number of operators tending to move in the same direction.
| ITALIAN MINISTRY OF ECONOMY AND FINANCE | 45 |
| CHART II.21: VOLUMES OF LOTS TRADED AND OPEN INTEREST FOR THE 10-YEAR BTP FUTURE CONTRACT TRADED ON THE EUREX MARKET |
|
| Source: Based on Bloomberg data |
A very important aspect to be noted with respect to 2018 is the fact that the highest levels of open interest were recorded for the contract expiring in June 2019, coinciding with when the BTP-Bund spread was at its widest point during the year. However, compared to 2018 (when the spread reached its first peak in May/June), 2019 saw open interest levels continue to grow up until the rolling of contract23, while in 2018 open interest had recorded a sudden decline. This seems to indicate that, in 2019, operators used the future to manage risk on existing BTP positions (despite the difficult conditions), and not to build merely speculative downward activity.
___
23 The rolling of a future contract refers to when an operator closes the contract that is about to expire, moving its position to a future contract that expires at a later date.
| 46 | ITALIAN MINISTRY OF ECONOMY AND FINANCE |
| III. | PUBLIC DEBT MANAGEMENT IN 2019 |
| III.1 | OUTSTANDING GENERAL GOVERNMENT DEBT |
In relation to the obligations provided for by European Union Treaties, the definition of public debt - with regard to the entities included - refers to the general government sector, divided into three subsectors: central government, local governments and social security institutions1. The amount to be taken into consideration, on the other hand, is the gross debt, i.e. the sum of all liabilities without any assets being deducted; this amount is also consolidated, as it does not include any liabilities of one subsector held by another (it therefore only records the exposure of the general government as a whole vis-à-vis external parties).
Calculation of this aggregate is based on the sectorial and methodological criteria referred to, primarily, in Regulation of the European Parliament and of the Council no. 549 of 2013 on the European system of national and regional accounts (ESA 2010) and, more specifically, in Council Regulation no. 479/2009 on the excessive deficit procedure (EDP), as amended by Regulations no. 679/2010 and no. 220/2014.
In August 2019, Eurostat updated its manual on government deficit and debt, stating that accrued, capitalised and uncollected interests shall contribute to new nominal debt, also within the meaning of debt at face value as specified by the aforementioned regulations. This meant a change to the accounting method used for the postal savings certificates (‘buoni postali fruttiferi’ or ‘BPF’) that became part of the government’s directly held debt at the end of 2003 (when the ‘Cassa Depositi e Prestiti’ was privatised).
The previous method was completely transparent, treating the issue value as the face value of the debt, corresponding to the amount stated on the paper postal savings certificates. Accrued and uncollected interests were recorded as interest expenditure on an accrual basis, just like other forms of interest.
Although this was a new interpretation of a previous situation that was well-known to all, Eurostat decided to apply the new rule retroactively, resulting in the entire time series being reviewed.
This change has led the overall level of debt to increase by 3-3.5% of GDP in recent years (see Chart III.1). However, if we go back in time, the effect of this was significantly higher (for example, over 5% in 2004). This is because the postal savings certificates in question are gradually being extinguished, as they are very long-term securities (twenty-year or thirty-year) that were issued prior to April 2001. The reduction is also rather slow as these postal savings certificates have very high rates, in line with the long-term rates in place at the time of their issue, as well as
___
1 In the EU member states with a federal structure, there is also a fourth subsector referring to all the state governments.
| ITALIAN MINISTRY OF ECONOMY AND FINANCE | 47 |
a step-up structure to encourage them to be held until maturity, despite them being reimbursable at any time, with no penalty.
| CHART III.1: DEBT-TO-GDP RATIO TREND 2005-2019 |
|
| Source: based on ISTAT data |
For the aforementioned reasons, the new valuation did not have any effect on the annual deficit, neither from an accrual basis point of view nor in terms of cash.
With regard to the evolution of debt in absolute terms, the annual increase in 2019 amounted to € 28,899 million, down significantly compared with the previous year (€ 51,389 million). It is even more noteworthy that this change was slightly lower than the net debt calculated on an accrual basis, which amounted to € 29,301 million. The opposite occurred in 2018, as had also been the case in previous years2.
III.2 GOVERNMENT SECURITIES ACTIVITIES
Maturities and redemptions of government securities
In 2019, government securities worth € 355,736 million matured, up by almost € 21 billion compared with the € 334,973 million of the previous year, corresponding to an increase of 6.2%. Taking into account also the repurchases made as part of the buyback and exchange transactions completed during the year, the overall redemption volume reached € 370,915 million. Foreign securities represented only 1.1% of the total redemption amount.
With regard to short-term maturities, redemptions of BOTs amounted to € 154,363 million, compared with the € 150,801 million that matured in 2018; this slight increase is due to the modest positive net issues both in the second half of
___
2 There is a difference between net debt and the annual change in debt due to the different methodologies used to record them: in the first case, the ‘accrual basis’ criteria set out in the European System of Accounts (ESA) are applied, while the actual cash balance is what substantially applies for debt.
| 48 | ITALIAN MINISTRY OF ECONOMY AND FINANCE |
III. PUBLIC DEBT MANAGEMENT IN 2019 |
the previous year for the entire segment and in the first half of 2019 regarding the 6-month security.
Maturing medium/long-term securities amounted to € 201,373 million, significantly higher (+ 9.2%) compared with the € 184,404 million that matured in 2018. However, the overall total of redemptions was even higher, mainly due to the buyback and exchange transactions completed in 2019, which increased this value to € 216,552 million, up 7.7% compared with the € 201,046 million recorded in 2018. As in previous years, the value recorded in the state budget was, however, slightly lower (€ 215,665 million), as amounts allocated to the sinking fund for government securities were used (€ 887 million).
Net issues and funding government borrowing requirements
In 2019, the Italian government’s borrowing requirement amounted to € 41,500 million. This amount was covered by the balance between net issues recorded in the state budget 3 and other treasury movements (- € 10,213 million), and by the slight reduction in the Treasury's cash at the end of the year, for € 2,175 million.
TABLE III.1: ISSUES1, MATURITIES AND FUNDING GOVERNMENT BORROWING REQUIREMENTS (€ MILLION) |
| | 2019 |
| Nominal issues | 414,200 |
| Nominal redemptions | 370,915 |
| Issues valued as net proceeds (a) | 419,866 |
| Redemptions valued as net proceeds (b) | 370,328 |
| Net issues (c) = (a) - (b) | 49,538 |
| Other forms of funding provided by the Treasury (f) = -(d) + (e) - (c) | -10,213 |
| Total funds (c) + (f) | 39,325 |
| Change in the Treasury cash account 31-12-2019 vs. 31-12-2018 (e) | -2,175 |
| Government cash balance (d) | -41,500 |
1 Calculated for the full year using criteria based on the settlement date and not the auction date. |
| Source: MEF |
Issuance management
2019 was a rather burdensome year in terms of maturing securities (over € 20.5 billion more than in 2018), although the Italian government’s borrowing requirement was also slightly lower than in the previous year. As always, the borrowing requirement was more substantial in the first half of the year, but a more concentrated distribution of maturities in the second half of the year partially balanced the need to resort to the market.
The time profile of the issues shown in Table III.2, however, highlights how issuance activity was nonetheless more intense during the first six months of the
___
3 Net issues are calculated as the difference between issues and redemptions, respectively valued as follows: issues are valued based on net proceeds, excluding BOTs which are valued at their nominal value (price 100) as the difference compared to 100 is paid in advance by the Treasury; redemptions are valued at their nominal value, with the exception of securities bought back as part of exchange transactions which are recorded based on the relative net proceeds, as is also the case for CTZs where the interest component is already included in the government’s borrowing requirement.
| ITALIAN MINISTRY OF ECONOMY AND FINANCE | 49 |
year, taking advantage of the higher demand that is typically concentrated in this period.
| TABLE III.2: GOVERNMENT SECURITIES ISSUED, NET OF EXCHANGE TRANSACTIONS (€ MILLION) |
| | Total 2018 | 1Q 2019 | 2Q 2019 | 3Q 2019 | 4Q 2019 | Total 2019 |
| Short-term totals (BOTs) | 151,653 | 47,625 | 39,358 | 41,700 | 32,156 | 160,839 |
| Medium/long-term totals | 238,192 | 76,554 | 65,779 | 47,684 | 59,174 | 249,191 |
| of which: | | | | | | |
| CTZs | 29,169 | 9,934 | 10,013 | 6,198 | 5,013 | 31,156 |
| BTPs | 158,622 | 56,875 | 49,066 | 36,204 | 33,127 | 175,273 |
| BTP€is | 16,666 | 3,858 | 3,650 | 1,703 | 4,660 | 13,871 |
| BTP Italias | 9,873 | 0 | 0 | 0 | 6,750 | 6,750 |
| CCTeus | 23,863 | 5,688 | 3,050 | 3,580 | 2,454 | 14,771 |
| Foreign securities | 0 | 200 | 0 | 0 | 7,171 | 7,371 |
| TOTAL | 389,845 | 124,179 | 105,137 | 89,384 | 91,330 | 410,030 |
| Source: MEF | | | | | | |
Despite the rather variable market context, investors’ demand for Italian government securities was high on average, allowing the Treasury to complete record issues in terms of size, especially in the long-term segment, which recorded quite a significant number of syndicated transactions that were particularly well-received by the market (unlike in 2018, when only the 20-year BTP was launched, expiring on 1 September 2038).
The limited size of off-the-run securities offered at auction is a further sign of the generally favourable context; in 2019, these amounted to only € 4,325 million (1.1% of total issues), divided between € 2,954 million of nominal BTPs and € 1,371 million of CCTeus.
The fact that issues were once again made on the foreign market is also particularly significant, especially the important return to the USD market (from which the Italian Republic had been absent since the 2010 issue); there were also a couple of private placements as part of the EMTN programme, one in yen and the other in euro.
Domestic securities
BOTs
In 2019, gross issues of BOTs amounted to € 160,839 million, approximately € 9.2 billion higher than in the previous year, partly due to more maturities (€ 154,363 million versus € 150,801 million in 2018) and partly due to the positive net issue value of € 6,476 million.
Once again, cash needs did not arise that would otherwise make it appropriate to resort to maturities of less than six months; as a result, only securities with annual and 6-month maturities were issued, in practically equal proportions (see Tables III.8 and III.9). At the end of the year, the stock of securities with annual maturities amounted to approximately € 80,029 million, while the stock of securities with 6-month maturities amounted to € 33,900 million.
| 50 | ITALIAN MINISTRY OF ECONOMY AND FINANCE |
III. PUBLIC DEBT MANAGEMENT IN 2019 |
With regard to auction yields (Chart III.2), 2019 was characterised by a downward trend, which was only intermittently interrupted in mid-August, when the auction was held at the same time as when the government fell. It should be noted that, from February onwards, the 6-month security remained constantly negative, with a significant accentuation in the second half of the year. The first time the BOT with an annual maturity recorded a negative value, on the other hand, was in July, with the aforementioned rebound in August; this security then remained below -0.13% until the end of the year, hitting a minimum in the mid-September auction (-0.226%).
In any case, it is clear that this segment was more stable overall than in 2018; in fact, although a certain degree of volatility was still present in 2019, it did not reach the extremes of the previous year.
| CHART III.2: GROSS COMPOUND YIELDS AT ISSUANCE FOR 6-MONTH AND 12-MONTH BOTS, 2018-2019 (PERCENTAGE POINTS) |
|
| Source: MEF |
During the year, the overall average allocation rate for BOTs was slightly negative (-0.041%), reflecting the negative average yield on the 6-month security (-0.091%) and the only slightly positive yield for the 12-month security (0.010%).
After the turmoil experienced in the previous year, 2019 saw the gap closing between the yield at issuance for the 6-month BOT and the Euribor with the same duration, as well as a fairly synchronised trend for the two rates (see Chart III.3). After January got off to a start that was still at the levels recorded in the last months of 2018 (around 45 basis points), the relative differential subsequently closed in a very significant way, remaining below 20 basis points for almost all of the year. However, as can be seen in Chart III.3, a full recovery was not made, as the yield of the 6-month BOT remained constantly higher than the Euribor rate, while the opposite had been recorded in the first months of 2018.
| ITALIAN MINISTRY OF ECONOMY AND FINANCE | 51 |
| CHART III.3: YIELD AT ISSUANCE FOR 6-MONTH BOTS AND COMPARISON WITH THE EURIBOR RATE - 2018-19 (PERCENTAGE RATES) |
|
| Source: MEF, Bloomberg |
The average bid-to-cover ratios for the year were equal to 1.57 for the 6-month BOT and 1.56 for the 12-month BOT, slightly lower than in 2018 (when they were equal to 1.61 and 1.66, respectively). However, these ratios were much more stable than in the previous year, especially for the 12-month security, which fluctuated between a low of 1.44 in August to a high of 1.65 in the February and October auctions. For the 6-month BOT, on the other hand, the fluctuations were slightly more marked, with a minimum of 1.33 recorded at the auction at the end of December 2018 (settled, as always, at the beginning of January) and a maximum of 1.89 recorded in April.
These fluctuations were essentially due to market sentiment at the time, also characterised by a certain degree of seasonality, with liquidity tending to diminish over the summer and towards the end of the year. This was also due to the fact that the volumes offered were kept within a rather narrow range: between 6 and 6.5 billion for the 6-month BOT and between 6 and 7 billion for the 12-month BOT.
Based on the information collected from Specialists in government securities through the harmonised data collection model defined at European level (EMAR 4), the composition of demand at auction was characterised by an unusual prevalence of foreign investors in 2019, equal to an average of 64% of demand, reaching a peak of 90% in May. European investors prevailed, on average equal to 54%, but US investors also played a significant role (16%), with an interesting, albeit minority, presence of investors from other regions around the world (around 7.6%). However, there were notable fluctuations in terms of investors’ participation: the presence of European investors reached its peak in October, although these investors were also increasingly present in the three-month period between May and July; US investors, on the other hand, were particularly active between August and September, while investors from other regions showed the most interest in August,
___
4 See Chapter II above
| 52 | ITALIAN MINISTRY OF ECONOMY AND FINANCE |
III. PUBLIC DEBT MANAGEMENT IN 2019 |
maintaining a fairly regular presence throughout the year until October, before disappearing completely in November and December.
With regard to the types of investors, the most stable component was represented by investment funds (42.5%), followed by banks (around 26%) and hedge funds, which on average had a share of approximately 13%, but were particularly present in August and even more so in September.
CTZs
Net issues were also positive for CTZs in 2019. In fact, the volume of maturities was similar to that of the previous year (€ 23,223 million versus € 23,733 in 2018), with € 31,156 million worth of these securities being issued; however, outstanding CTZs only increased by € 5,548 million, given that there were several buyback transactions involving CTZs, 5for a total amount of € 2,385 million. This made it possible to satisfy the good level of demand recorded for this segment, limiting the increase in the stock of this instrument in line with the objective stated in the Guidelines.
As planned, two new lines were opened during the year:
| - | at the end of April, the security maturing on 29 June 2021, offered at auction for € 3,500 million, followed by the reopening reserved for Specialists in government securities (€ 1,050 million); at the end of September, with the last tranche issued, the outstanding value of this CTZ was equal to approximately € 16.2 billion; |
| - | at the end of October, the security maturing on 29 November 2021, initially offered and subscribed for € 3 billion, reaching an outstanding value of approximately € 5 billion at the end of the year. |
The amounts placed in the reopening auctions for off-the-run securities (the two mentioned above plus those for the CTZ maturing on 27/11/2020, which was launched in October 2018 and completed its issuance cycle with approximately € 16.3 billion of outstanding securities) recorded a minimum in September (€ 1,500 million) and a maximum in May (€ 2,500 million).
Fluctuations in bid-to-cover ratios were fairly moderate, ranging from a low of 1.46 in May to a high of 1.99 in September. The average was 1.66, which was slightly lower than the 1.75 recorded in 2018, when, however, there had been greater fluctuations.
There was also an unusual prevalence of foreign investors making up demand for CTZs in the run up to auctions, albeit somewhat less marked than for the BOT segment. In fact, Italian investors represented an average of 45.9%, being fairly regularly distributed over time, with the exception of October and November (Italian investors played a significantly predominant role in October, while the opposite was true in November). The second most important component of demand was made up of European investors (with an average of 38.5%), followed by US investors (14.6%). Demand from other regions was only present in April, while demand from US investors remained fairly constant, except for the months of August and September when it was practically at zero.
___
5 See ‘Extraordinary transactions’ below, pages 72-75
| ITALIAN MINISTRY OF ECONOMY AND FINANCE | 53 |
With regard to the types of investors, investment funds clearly represented the most significant category, with an average of 42%; this figure would have been even higher if it hadn’t been for the significant outflow that instead characterised the month of August. Hedge funds also played an important role, with an average presence of 20.5%, as did banks (17.6%).
There was a marked variability in the yields at issuance for CTZs (see Chart III.4), with extensive fluctuations and with no defined trend until June, ranging between a minimum in March (0.288%) and the absolute maximum for the year recorded in May (0.818%). However, a clear downward trend began in July, leading to negative values being recorded from September onwards. Moreover, in the September auction, the year's lowest value was recorded (-0.236%).
| CHART III.4: YIELD AT ISSUANCE FOR CTZS (PERCENTAGE RATES) IN 2019 |
|
| Source: MEF |
BTPs
In 2019, gross issues of BTPs (net of placements made as part of exchange transactions) amounted to € 175,273 million, up significantly (+ € 16,651 million) compared with the previous year. This 10.5% increase was consistent with the increased need to resort to the market, largely due to the greater volume of securities maturing.
Furthermore, as part of exchange transactions, € 4,170 million of BTPs were issued against slightly higher buybacks (€ 4,982 million) (in the same exchanges and in the buybacks), meaning that the weight of nominal BTPs on the total outstanding amount of government securities remained substantially stable, reporting a very modest decrease of 0.05%: in fact, this amounted to 71.84% versus 71.89% in 2018.
Issuance activity in this segment was particularly intense for longer-term maturities, with three new lines being opened at 15, 20 and 30 years, all launched through syndicated placements, which encountered exceptionally high demand. The only reopening of the BTP maturing on 1 March 2067 was also carried out with the same placement method, which is particularly effective in favourable market
| 54 | ITALIAN MINISTRY OF ECONOMY AND FINANCE |
III. PUBLIC DEBT MANAGEMENT IN 2019 |
conditions, making it possible to reach a significantly higher issue amount than what would otherwise be obtained at auction.
The first of these syndicated issues, carried out already in mid-January, concerned the 15-year maturity and, following demand amounting to approximately € 35.6 billion from around 320 investors, it ended with the allocation of a record € 10 billion worth of the BTP maturing on 1 March 2035 and a nominal annual rate of 3.35% (as always, paid in two half-yearly instalments). As the auction price was slightly below par value, the actual corresponding yield was 3.41%.
The second syndicated issue, carried out three weeks later, encountered even greater demand (around € 41.5 billion) for the BTP maturing on 1 September 2049 and an annual nominal rate of 3.85%; this security was then placed for € 8 billion with an actual yield of 3.91%. In this case, a record number of investors participated: around 450.
In mid-June, on the other hand, a new 20-year security was issued, with a BTP maturing on 1 March 2040 being offered, placed for € 6 billion compared with an order book of around € 23.5 billion - a sign of the high level of demand coming from around 230 institutional investors. The nominal annual rate was set at 3.10%, while the actual yield was equal to 3.149%.
Finally, the fourth syndicated transaction involving long-term nominal BTPs was carried out in July, when substantial demand for this maturity became strikingly clear. It was therefore decided not to reopen the 50-year BTP maturing on 1 March 2067 at auction, given that such an auction would not have allowed for the best conditions for neither the issuer nor investors (considering the risks inherent with a tool with such a long duration). With an order book involving over 200 institutional investors, which exceeded € 17.6 billion, a € 3 billion tranche was therefore issued, with an actual yield of 2.88%. The outstanding value of this security has now therefore reached € 9,633 million.
Placements made by establishing a syndicate of banks (in which all Specialists in government securities participate, and with the Treasury selecting the group of lead managers from among them for each transaction) offer the possibility to obtain detailed and precise information regarding demand, as well as allowing allocations to be selected that can favour the sound future performance of the security on the secondary market. As there were no less than four issues of this kind in the first part of 2019, it is particularly interesting to compare their distribution both in geographical terms (Table III.3) and by type of investor (Table III.4).
| ITALIAN MINISTRY OF ECONOMY AND FINANCE | 55 |
| TABLE III.3: ALLOCATIONS OF NOMINAL BTPS MADE THROUGH SYNDICATED ISSUE IN 2019: GEOGRAPHICAL DISTRIBUTION |
| | BTP 01/03/2035 | BTP 01/09/2049 | BTP 01/03/2040 | BTP 01/03/2067 |
| | (€ 10 billion) | (€ 8 billion) | (€ 6 billion) | (€ 3 billion) |
| Italy | 36.3% | 26.4% | 36.0% | 15.8% |
| UK | 24.9% | 29.5% | 36.6% | 21.8% |
| Germany / Austria / Switzerland | 21.3% | 18.9% | 8.9% | 38.6% |
| Iberia | 5.1% | 3.8% | 6.0% | 2.4% |
| Scandinavia | 5.1% | 5.6% | 4.6% | 4.3% |
| France | 3.6% | 3.8% | 2.1% | 4.9% |
| Benelux | 1.3% | - | - | - |
| Other European countries | 0.6% | 4.2% | 1.8% | 2.2% |
| USA | - | 6.4% | 2% | 8.3% |
| Rest of the world | 1.8% | 1.4% | 2.1% | 1.7% |
| Source: placement syndicates |
The geographical distribution of demand shows a greater tendency among Italian investors to opt for shorter maturities (15 and 20 years), while this decreases as the duration of the security increases. The amount assigned to UK investors is still significant, albeit lower on average than in previous years, while the presence of investors in the Germanic area is clearly growing, singularly high in the tranche of the 50-year security. It is also interesting to note the increased level of interest from non-European investors, especially from the United States, in the two transactions completed in the middle of the year.
| TABLE III.4: ALLOCATIONS OF NOMINAL BTPS MADE THROUGH SYNDICATED ISSUE IN 2019: DISTRIBUTION BY TYPE OF INVESTOR |
| | BTP 01/03/2035 | BTP 01/09/2049 | BTP 01/03/2040 | BTP 01/03/2067 |
| | (€ 10 billion) | (€ 8 billion) | (€ 6 billion) | (€ 3 billion) |
| Investment funds | 54.5% | 45.2% | 49.0% | 30.5% |
| Banks | 20.6% | 25.8% | 29.9% | 21.4% |
| Insurance companies and pension funds | 10.1% | 10.2% | 6.0% | 31.9% |
| Central banks and government institutions | 5.5% | 7.4% | 3.1% | 3.3% |
| Hedge funds | 7.3% | 10.9% | 11.9% | 12.9% |
| Non-financial entities | 2.0% | 0.5% | 0.1% | - |
| Source: placement syndicates |
The breakdown by type of investor is very interesting due to the considerable presence of investors with a stable and long-term investment profile, particularly insurance companies and pension funds, whose weight was extraordinarily significant for the longer-term placement. Central banks and government institutions, on the other hand, were more present in the two transactions at the beginning of the year, when there was also a presence, albeit modest, of non-financial entities (companies and private banking providers). This evolution also shows how the first months of the year were characterised by a greater tendency towards new strategic investments, common to all categories of investors.
| 56 | ITALIAN MINISTRY OF ECONOMY AND FINANCE |
III. PUBLIC DEBT MANAGEMENT IN 2019 |
The number of syndicated issues of longer-term BTPs and, above all, the high amounts placed, contributed significantly to increasing the weight of the ultra-long segment, with regular auctions also contributing.
In particular, for the 15-year maturity, the auction offer consisted only of the two issues of € 1,500 million in mid-April and mid-June, for which the € 300 million openings reserved for Specialists in government securities were also fully subscribed. It should be noted that the June auction went ahead despite the syndicated issue of the new 20-year BTP - a sign of very robust demand at that time, which was successfully exploited to the full. By the end of the year, the outstanding amount of the BTP maturing on 1 March 2035 had reached € 10.6 billion.
In the 20-year segment, the launch of the new security was preceded by a last auction, held in March, of the BTP maturing on 1 September 2038, of which € 1,500 million were assigned (including also the reopening to Specialists), bringing the outstanding amount of said security to just under € 15 billion. The new BTP maturing on 1 March 2040 was then reopened at auction in mid-October, offered together with a long-term off-the-run BTP; at the end of the year, the outstanding amount of this security amounted to just under € 7 billion.
Also for the 30-year maturity, before the BTP maturing on 1 September 2049 was launched in February, a last auction of the previous benchmark was held, of which approximately € 1,500 million were placed, bringing the outstanding amount to almost € 16.4 billion. The new security maturing in 2049 was offered again at auction four times - in May, September, October and November - reaching a volume of over € 13.3 billion at the end of the year.
Yield trends for issues in the ultra-long segment (see Chart III.5) were affected by the same dynamics that characterised all the maturities of Italian government securities, with a substantial reduction starting from June, an acceleration after the new government was formed, and a modest, partial rebound at the end of the year.
| CHART III.5: YIELD AT ISSUANCE OF LONG-TERM BTPS IN 2019 (PERCENTAGE RATES) |
|
| Source: MEF |
| ITALIAN MINISTRY OF ECONOMY AND FINANCE | 57 |
For the 30-year segment, together with the on-the-run 20-year security, an off-the-run tranche was also offered in November (the BTP maturing in March 2047), € 638.6 million of which was allocated.
In fact, the other rare occasions (three in total) when nominal off-the-run BTPs were offered referred to former 10-year bonds, settled at the beginning of January, at the beginning and in the middle of June, with a residual maturity of 9, 6 and 7 years respectively.
BTPs with a duration of up to 10 years were issued, as usual, in the regular auctions at the beginning of the month (5-year and 10-year) and mid-month (3-year and 7-year).
The two shorter-term securities (3-year and 5-year) were issued in similar proportions, with the 5-year BTP being slightly predominant (€ 33,686 million) over the 3-year BTP (€ 32,430 million), apparently going against the expected proportions between the two securities that had been stated in the Guidelines. However, it should not be forgotten that, as the 3-year security is issued in the mid-month cycle, it is subject to the cancellations of some auctions which often occur in the middle of August and December. 2019 was no exception: while there were twelve 5-year BTP auctions (held at the end of the month, with settlement at the beginning of the following month), there were only ten 3-year BTP auctions. Taking this into account, it should be noted that the offer for each auction was actually higher for the 3-year security than for the 5-year security, so much so that the average amount allocated was equal to € 3,242 million for the 3-year BTP and € 2,639 million for the 5-year BTP.
Both the 3-year and the 5-year segments saw the issuing cycle for their previous benchmarks being concluded: respectively, the BTP maturing on 15/10/2021, which closed with a final outstanding value of approximately € 16.8 billion, and the BTP maturing on 01/10/2023, which reached a volume of just under € 17.5 billion.
As planned in the Guidelines, two new securities were then opened for both maturities.
The first 3-year BTP 15/03/2019-15/07/2022, with a nominal rate of 1%, was opened in mid-March and was offered again until July, after reaching a final size of just over € 17 billion. In August, taking into account the ample liquidity available and the reduced market activity, the mid-month auction was cancelled, and the BTP 16/09/2019-15/01/2023 was launched in mid-September, with a nominal rate of 0.05%; this security was then offered until November, since the mid-month auction was also cancelled in December, for the same reasons behind the decision to cancel the summer auction. At the end of the year, the relative outstanding amount was equal to € 9,663 million.
The analysis of bid-to-cover ratios for the auctions of these two securities shows a higher average for the 3-year BTP compared with the 5-year BTP (1.57 vs. 1.41), as well as lower variability: the difference between the maximum and minimum was equal to 0.31 for the 3-year BTP and 0.49 for the 5-year BTP. For both securities, there was quite a weak correlation between the amount offered and the
| 58 | ITALIAN MINISTRY OF ECONOMY AND FINANCE |
III. PUBLIC DEBT MANAGEMENT IN 2019 |
bid-to-cover ratio, while the weight of demand for the specific instrument remained dominant.6
The foregoing illustrates how, on average, there was more demand for the 3-year security. This phenomenon was probably also influenced by the fact that, on the futures market, 3-year BTP contracts are much more liquid than the 5-year ones.
The coupon rates for the new securities were obviously affected by market performance at the time of their launch, which is why they were so different between the first half and the second half of the year. In any case, for both the 3-year and the 5-year maturities, the new coupons were much lower than those of the previous benchmarks (2.30% and 2.45%, respectively), opened in the second half of 2018.
The 3-year BTP maturing in July 2022, launched in March, has an annual nominal rate of 1%, while the one maturing in January 2023 was offered for the first time in September with a nominal rate of 0.05% and, in the first auction, it even recorded slightly negative yield at issuance as it was allocated at an above-par price (see Chart III.5)
There was a similar situation for the 5-year maturity: while the BTP 01/07/2024, launched at the auction at the end of March, had an annual nominal rate of 1.75%, the following one, launched at the end of September and maturing on 1 February 2025, recorded a rate of 0.35%.
In the middle section of the yield curve, between 7 and 10 years, the volume of issues was in line with the forecast stated in the Guidelines, with a decrease in 7-year BTPs (albeit quite marginal) and a moderate increase in 10-year securities.
With regard to the 7-year segment, in the first three months of the year, the BTP with maturity in November 2025 continued to be reopened and, in mid-April, the BTP maturing on 15 July 2026 was launched, with an annual coupon rate of 2.10%. This security was duly offered at auction every month until October (except in August), reaching an outstanding value of almost € 16.8 billion; it was only in the mid-November auction that a new benchmark with this maturity was launched, the BTP 15/11/2019 - 15/01/2027. As the auction in mid-December was not held, the outstanding volume at the end of the year was limited to € 3,251 million.
The bid-to-cover ratio at auction for 7-year BTPs was equal to 1.5 on average, with a minimum of 1.28 recorded in November and a maximum of 1.92 in June. Despite the latter case showing the highest value coinciding with the smallest offer size during the year, there was actually very little correlation between the quantity issued and the level of the bid-to-cover ratio in the other auctions.
Also for the 10-year maturity, after the previous benchmark maturing in December 2028 and with a coupon of 2.80% had reached an outstanding value of approximately € 19.2 billion, two new securities were opened: at the end of February (with settlement on 1 March), the BTP maturing on 1 August 2029 and with an annual nominal rate of 3%; at the end of August, (with settlement on 1 September), the BTP 01/09/2019-01/04/2030 with a nominal rate of 1.35%. The first of these two securities closed its issuance cycle with an outstanding amount of
___
6 For a detailed analysis of the results of all the issues during the year, please refer to the "Treasury issues in 2019" report on the public debt website:
http://www.dt.mef.gov.it/en/debito_pubblico/dati_statistici/le_emissioni_del_tesoro/
| ITALIAN MINISTRY OF ECONOMY AND FINANCE | 59 |
just under € 20.3 billion, while the second reached a total amount of approximately € 13.3 billion at the end of the year.
As the 10-year maturity is the most significant for the market, the issues of BTPs with this duration were the most significant overall, perfectly in line with the plans announced in the Guidelines. The uniform nature of the quantities offered in each auction should also be noted: in fact, with the exception of the two auctions that concluded the cycle for the December 2028 BTP, characterised by slightly lower amounts, the first tranches of both the new securities were based on an offer of € 4 billion, while the subsequent ones fluctuated within a fairly narrow range: between € 2,750 million and € 3,250 million. The bid-to-cover ratios were therefore were also contained within a limited range (0.31), between the maximum reached at the auction settled at the beginning of January (1.53) and the minimum reached at the auction at the end of November, settled at beginning of the following month (1.22).
Chart III.6 presents the auction yields for all BTPs with a maturity of up to 10 years, which show notably parallel trends for 3-year, 7-year and 10-year securities, while the 5-year maturity, albeit aligned with the underlying trend, is slightly dissonant: in particular, in July, the 7-year BTP was placed at a lower yield than that of the 5-year BTP issued two weeks earlier.
A generalised decline from July onwards is nonetheless very clear, which reached the lowest points of the year between September and October before increasing slightly towards the end of the year. It is remarkable that the 3-year security reached its minimum at the same time as the substantial first tranche of the new BTP maturing in January 2023 (€ 4 billion), recording the slightly negative value of -0.01%.
| CHART III.6: YIELD AT ISSUANCE OF BTPS WITH A MATURITY OF BETWEEN 3 AND 10 YEARS IN 2019 (PERCENTAGE RATES) |
|
| Source: MEF |
| 60 | ITALIAN MINISTRY OF ECONOMY AND FINANCE |
III. PUBLIC DEBT MANAGEMENT IN 2019 |
| FOCUS | | Characteristics of auction demand for nominal BTPs: analysis by type of investor and geographical area The Treasury monitors cash flows from the day after auction announcement until the day before settlement, based on the data provided by Specialists in government securities. Data reports are provided in accordance with the harmonised template adopted by the ESDM (European Sovereign Debt Markets) Subcommittee. These data are particularly meaningful for nominal BTPs and are a good proxy for auction demand among end investors. Generally speaking, in the days indicated, these flows refer to purchases. However, should the market be in a turmoil, some investor types or geographical areas may record more sales (presented in the charts with negative values). In this case, the information provided by Specialists in the aforementioned reports represents a less precise indicator of demand at auction. With regard to the breakdown by type of investor, Figure 3 shows a considerable reduction in the banking component (presumably due to the reduction in foreign credit institutions more than offsetting the increase in domestic banks), as was also the case in 2018. In addition to banks, the other two main components of demand in BTP auctions are represented by investment funds and hedge funds. Investment funds participated to the same extent as in 2018, while the presence of hedge funds increased significantly compared with 2018, and even more so compared with 2017, in line with the trend being seen across all of Europe's government bond markets. With regard to investors with a long-term investment horizon, insurance companies participated to a greater extent, while the presence of pension funds was rather insignificant. Another phenomenon recorded in 2019 was the lesser degree of participation among official institutions or central banks. In this regard, it should be remembered that the latter category does not include purchases made by Eurosystem central banks, as these are not included in the harmonised reports prepared by Specialists. |
| | | FIGURE 3: ORDERS TAKEN TO NOMINAL BTP AUCTIONS BY GOVERNMENT BOND SPECIALISTS: COMPOSITION BY TYPE OF INVESTOR - 2019 |
| | | |
| | | |
| ITALIAN MINISTRY OF ECONOMY AND FINANCE | 61 |
| | | FIGURE 4: ORDERS TAKEN TO NOMINAL BTP AUCTIONS BY GOVERNMENT BOND SPECIALISTS: COMPOSITION BY GEOGRAPHICAL AREA - 2018-2019 |
| | | |
| | | |
BTP€is
In 2019, a total of € 13,781 million worth of BTPs indexed to European inflation were issued, which was therefore less than the previous year (€ 16,666 million) and fairly in line with the volumes recorded in 2017 (€ 13,549 million).
Another similarity with 2017 can also be seen in the breakdown between the different maturities with which securities in this segment were issued: both in 2019 and two years earlier, a new 10-year benchmark was launched, which contributed to the greater weight of the 10-year maturity (representing more than half of the BTP€i issues). Distribution across the other maturities, however, was much more uniform than in the two previous years (see Table III.9); compared with the recent past, it is notable that a larger share is held by the longest security (originally with a 30-year maturity, but now with a residual life of 22 years), which is a result of the higher level of demand in this segment, as can also be seen for nominal BTPs.
The syndicated issue of the new 10-year BTP€i 15/05/2019-15/05/2030, with an actual coupon rate of 0.40% (paid, as always, in two half-yearly instalments), was held at the beginning of October and was particularly well-received by the market: in fact, orders came in from 165 investors for a total of € 22.1 billion, with the final allocation amount being set at € 4 billion.
With regard to geographical distribution, there was a preponderance of foreign investors, to whom three quarters of the issue were allocated, with the usual prevalence of the United Kingdom (30.1%) followed by the French share which was higher than it had been for several years, at 12.6%. The Germanic, Scandinavian and US components were also significant, with the Asian component also playing an important role, albeit to a lesser extent than European investors (see Chart III.7).
| 62 | ITALIAN MINISTRY OF ECONOMY AND FINANCE |
III. PUBLIC DEBT MANAGEMENT IN 2019 |
| CHART III.7: THE NEW 10-YEAR BTP€I 15/05/2030: GEOGRAPHICAL DISTRIBUTION |
|
| Source: MEF |
With regard to composition by type of investor, more than half of the issue was allocated to investment funds (51.7%) and the share assigned to central banks and government institutions was also significant (10%). As always, an important share, albeit not a majority, went to banks (26.6%). Chart III.8 provides the full details of the transaction.
| CHART III.8: THE NEW 10-YEAR BTP€I 15/05/2030: DISTRIBUTION BY TYPE OF INVESTOR |
|
| Source: MEF |
Before this new security was launched, a number of tranches of the previous benchmark were offered at auction along the same section of the yield curve for this segment (maturing on 15 May 2028). In particular, the latter security was offered at the end of January, March, May and June; however, it was only at the March auction that the issue of BTP€is was limited to the 10-year maturity, while in all other cases it was combined with another security in this segment, in a
| ITALIAN MINISTRY OF ECONOMY AND FINANCE | 63 |
comprehensive offer range. By the end of its issuance cycle, the 2028 BTP€i had reached a nominal outstanding amount (i.e. not considering the inflationary revaluation component) of just under € 15.9 billion.
With regard to the other maturities in this segment, issues only took place at the month-end auctions: the 5-year BTP€i maturing in May 2023 was issued in February, May and July, offered jointly with another security; the 15-year BTP€i maturing in September 2032 was issued in February, April and July, offered without being combined with other maturities in April only; the “old” 30-year BTP€i maturing in 2041 was issued in January, June, September and November, offered separately in the two autumn auctions and together with another BTP€i in the first half of the year.
The auction amounts remained quite low, with total bids never exceeding € 1,250 million, although there was an incredibly regular presence on the primary market.
Bid-to-cover ratios at auction fluctuated between a minimum of 1.33 for the 15-year security in April and a maximum of 4.39 for the 5-year security in July. This segment therefore saw a rather high inverse correlation between the amounts placed and the bid-to-cover ratios, with the extremely variable nature of this indicator making average data quite insignificant.
Net of revaluations, the 5-year BTP€i reached an outstanding amount of € 7,363 million at the end of 2019, the 15-year security reached just over € 14 billion and the security maturing in September 2041 reached almost € 11.2 billion. As the new 10-year security was launched towards the end of the year, it was not re-offered at auction and remained at the € 4 billion mark of its original issue.
There was more demand for securities indexed to European inflation 7 in the first seven months of the year, with levels dropping during the rest of the year, with the exception of the 10-year maturity, which is what allowed for the remarkable success of the syndicated issue.
A preponderant share of European investors (over 53%) took part in the auctions, followed by a significant presence of US investors (around 27%), with Italian investors representing around 15%. With regard to the types of investors, the most significant component was represented by investment funds (around 37%), although hedge funds also played an important role (28%), followed by banks and insurance companies (11% and 10%, respectively). There was also an interesting level of demand among central banks and other public institutions, albeit not particularly high in terms of quantity (about 5%).
Over the course of 2019, real yields for securities in this segment showed a much steadier downward trend that the one seen for nominal securities, with the only exception being at the end of November, when there was a certain rebound in the market context, characterised by the typically low levels of liquidity at year-end (see Chart III.9).
___
7 More precisely to the HICP (Harmonised Index of Consumer Prices in the euro area)
| 64 | ITALIAN MINISTRY OF ECONOMY AND FINANCE |
III. PUBLIC DEBT MANAGEMENT IN 2019 |
| CHART III.9: REAL YIELDS AT ISSUANCE FOR BTP€IS IN 2019 (PERCENTAGE RATES) |
|
| Source: MEF |
Expected inflation, which, together with the real rate, determines the overall yield at issuance for index-linked instruments, was rather low at the beginning of the year and lower than the level recorded throughout 2018 (see Chart III.10 relating to 10-year break-even inflation8). An upward trend was then recorded until April, followed by a stable couple of months, and there was then a clear downward trend until September, when a very low minimum was reached (significantly lower even than the values at the beginning of the year). During the last months of the year, there was a gradual and constant recovery, allowing for a return to February-March levels.
For the 5-year security, the break-even inflation rate started the year with values at around 0.70%, standing at around 0.95% between April and June before dropping to around 0.40% in September, and closed the year at just below 0.80%.
| CHART III.10: 10-YEAR BREAK-EVEN INFLATION (BEI), 2018-2019 (BASIS POINTS) |
|
| Source: Bloomberg |
___
8 BEI (Break-Even Inflation) is the inflation rate (European or Italian) that must be hypothesised to allow the yield at maturity of an index-linked security to match that of a fixed-coupon bond (e.g. a nominal BTP) with a similar residual life. The purpose of this is to make investors indifferent as regards to the type of security to subscribe. High BEI rates generate securities with low (real) coupons.
| ITALIAN MINISTRY OF ECONOMY AND FINANCE | 65 |
BTPs Italia
As in the previous year, there were no BTPs Italia redemptions in 2019. However, the Guidelines had stated the intention to proceed with at least one issue in order to ensure continuity for a programme mainly aimed at retail investors. It was decided to fulfil this commitment in October and, in order to offer a sufficiently attractive real rate for individual savers, the maturity was set at 8 years.
This time around it was decided to limit the subscription period to three days (instead of the usual four): 21 and 22 October for the first phase, dedicated to retail and similar investors, when demand was guaranteed to be fully satisfied; 23 October for the second phase, reserved for institutional investors, for whom the Treasury reserved the right to ration the relative allocation. As always, during the first phase, investors were able to choose the channel through which to send their orders, also by directly accessing the MOT online; a premium of 0.40% was also provided for, should investors hold the security until maturity. Moreover, the Treasury safeguarded the negotiability of the security, selecting not only two Specialists as dealers for the transaction (Banca IMI and Unicredit), but also two Italian co-dealer banks (Banca Akros and Banca Sella), specifically appointed to ensure its constant listing on the MOT in the months after issue.
The issue was well-received by the market, as can be seen in Chart III.11: in the first two days, over 47,000 retail orders were received for almost € 3 billion. Orders from institutional investors reached € 4,754 million in the two opening hours of the transaction (from 9am until 11am); this amount was rationed to € 3,763 million in order to close the overall placement at € 6,750 million. It is interesting to note the number of contracts signed during the first phase, as this highlights a significant number of small investors. In fact, over 81% of retail demand was equal to or less than € 50,000, with over 51% at € 20,000.
| CHART III.11: RESULTS OF THE PLACEMENT OF THE BTP ITALIA MATURING ON 28 OCTOBER 2027, FOR € 6,750 MILLION |
|
| Source: MEF |
As is normally the case, the presence of Italian investors (almost total in the first phase) was also dominant during the institutional phase, representing 76% of
| 66 | ITALIAN MINISTRY OF ECONOMY AND FINANCE |
III. PUBLIC DEBT MANAGEMENT IN 2019 |
demand. Around 8% was allocated to UK investors and a similar percentage was distributed across different areas of continental Europe. The Middle Eastern component (around 5%) and US component (around 3%) also played an interesting, albeit smaller, role.
With regard to the breakdown by type of institutional investor, banks represented the largest component (55%), followed by investment funds (around 23%), central banks and other public institutions (9%) and hedge funds (8%), while the remaining 5% was allocated to insurance companies and pension funds.
Market rates rose between the guaranteed minimum real rate and the close of the transaction, leading the final real coupon to be raised by 5 basis points, up to 0.65%.
This issue increased the value of outstanding BTPs Italia at the end of the year, although this type of instrument was repurchased in certain buyback and exchange transactions.
CCTeus
In 2019, gross issues of CCTeus (€ 14,771 million) slightly exceeded the maturing securities, which amounted to € 12,430 million. However, considering that this category of securities was repeatedly subject to exchange and buyback transactions9, net issues in 2019 were actually negative for € 3,290 million.
The floating-rate segment did not enjoy particularly strong demand, also due to the fact that only one security matured during the year, in mid-November, thereby eliminating the incentive to renew portfolio positions, which is particularly important for a niche instrument such as the CCTeu.
In order to attract a wider range of buyers, after closing the issuance cycle for the security maturing in September 2025 at the auction held at the end of December 2018 (settled on 2 January 2019), the duration of the CCTeu opened at the auction settled at the beginning of February was shortened, down to 6 years from the original 7 (this instrument had been characterised by its 7-year duration since 2015). The new security matured on 15 January 2025 and the spread on the six-monthly Euribor was set at 1.85%. This was the only new line opened during the year, regularly offered for relatively low amounts. It was only in the auction at the end of October that the on-the-run security was replaced by an off-the-run security (the one maturing in April 2025 - the most in demand on the market). Only on one another occasion - at the end of July - the two securities were offered jointly.
The composition of demand was characterised by considerable variability, both in geographical terms and regarding the different types of investors. With regard to the geographical breakdown, despite the domestic component having the most significant share (around 48% on average), purchases by Italian investors were actually only very significant in the first two months of the year and, to a slightly lesser extent, in August and October, leaving a lot of space for European investors (26%) and US investors (21%), with the residual share coming from other geographical areas.
With regard to the types of investor, despite some fluctuations during the year, investment funds and banks were the two categories present with the most continuity, on average representing approximately 36% and 31%, respectively.
___
9 See ‘Extraordinary transactions’ below, pages 72-75
| ITALIAN MINISTRY OF ECONOMY AND FINANCE | 67 |
Hedge funds also had a constant and significant presence (around 24%), while there was only a sporadic presence of central banks (not from the euro area) and private entities (corporate and retail).
Yields at issuance showed a similar trend to medium-term BTPs, reaching a maximum of 1.95% in the auction at the end of May (settled at the beginning of June) and a minimum of 0.52% in the auction at the end of September (settled at the beginning of October). An even lower yield (0.40%) was recorded a month later, when the off-the-run security maturing in April 2025 was offered as an alternative (see Chart III.12).
| CHART III.12: YIELDS AT ISSUANCE OF CCTEUS IN 2019 (PERCENTAGE RATES) |
|
| Source: MEF |
Considering also the off-the-run securities, the average of the CCTeu bid-to-cover ratios was equal to 1.89, while this value was slightly lower if taking only the on-the-run security into account (1.82). The minimum (1.29) was recorded upon the launch of the new security, when the offered amount of € 2,750 million was actually more than double that offered in all other auctions issuing new tranches of the on-the-run CCTeu, where the maximum amount of the subscribable range was between € 750 million and € 1,250 million. However, for these auctions, the variability of the bid-to-cover ratios did not show any significant correlation with the size of the offer. The highest value of 2.35 was, however, recorded at the € 750 million auction settled in June, which was also the auction that recorded the highest yield.
Foreign securities
In 2019, it was once again possible to issue securities on the foreign market, not only thanks to the re-emergence of strong demand in the form of private placements in EMTN format, but also, and above all, due to the return to the USD bond market, in Global format, after being absent for nine years.
It is important to underline that private placements are sought by institutional investors who request the issuance of securities with specific characteristics, which are otherwise impossible (or very difficult) to find by accessing the issuer's ordinary offer. This does not mean that the Treasury can satisfy all requests of this type, as it must avoid complex structures or possible conflicts with the issuance of the other instruments offered to the market.
| 68 | ITALIAN MINISTRY OF ECONOMY AND FINANCE |
III. PUBLIC DEBT MANAGEMENT IN 2019 |
It should also be noted that, for several years, and up to 2019, this type of request had only been accepted exclusively for euro-denominated securities, given that the lack of a collateralisation system for currency swaps had made it too expensive to hedge the exchange rate risk from 2011 onwards. However, in 2018, mutual guarantee agreements were signed with numerous counterparties, selected from among the Specialists in government securities, making it possible to complete cross currency swaps for issuances in foreign currencies.
This allowed a four-year bond of Yen 25 billion to be issued in March, corresponding to € 200 million, with a cross-currency swap being used to hedge the exchange rate risk, at equivalent financial conditions to those for a domestic issuance with the same duration. This issue made it possible to satisfy specific demand from an institutional investor and also to take advantage of the low rates characterising this market.
However, the most significant new development was undoubtedly the placement of a substantial multi-tranche USD issue in October, carried out over three maturities (5, 10 and 30 years), which allowed Italy to rebuild its curve also in this currency.
This issue was well-received by the market, confirming an important level of demand for Italian securities denominated in US currency, not only in America and Asia, but also in the euro area, due to the need to diversify investment portfolios also in terms of currency.
Overall, a total of $ 7 billion was issued against orders for $ 18.2 billion. The 5-year and 30-year securities were placed for $ 2.5 billion, while the 10-year tranche was placed for $ 2 billion.
More specifically, the 5-year security, settled on 17 October 2019 and maturing on 17 October 2024, pays an annual coupon equal to 2.375% every six months. Its placement price was equal to 99.719%, corresponding to a gross yield at issuance of 2.435% in USD.
The ten-year bond, maturing on 17 October 2029, has an annual coupon of 2.875%, also paid in two half-yearly instalments. It was placed at a price of 99.089%, corresponding to a gross yield at issuance of 2.981% in USD.
Finally, the new 30-year security, with repayment set for 17 October 2049, has an annual rate of 4%, also paid every six months. As the placement price is discounted (99.619%), the corresponding gross yield at issuance is set at 4.022% in USD.
Chart III.13 highlights how Asian demand was particularly strong for the 30-year security, with US investors representing only 24%, slightly lower than for the other two maturities (29% and 30%). 36% was allocated to residents in Europe, the Middle East and Africa (EMEA), 11% of which represented by Italian investors.
The 5-year and 10-year securities had a very similar geographic distribution in terms of large areas; however, within the EMEA category, the 5-year security saw a more substantial share held by Italian investors, reaching 32% compared with just 17% for the 10-year security. Asian investors, on the other hand, had a rather marginal presence, reaching 2% and 3% respectively.
| ITALIAN MINISTRY OF ECONOMY AND FINANCE | 69 |
| CHART III.13: GEOGRAPHICAL DISTRIBUTION OF THE USD ISSUE |
|
| Source: MEF |
| 70 | ITALIAN MINISTRY OF ECONOMY AND FINANCE |
III. PUBLIC DEBT MANAGEMENT IN 2019 |
More specifically, 167 investors requested the 5-year bond, with total demand exceeding $ 6.7 billion. The 10-year security received orders from 194 investors for over $ 6.3 billion; finally, demand for the 30-year security amounted to over $ 5.2 billion from 173 investors.
| CHART III.14: DISTRIBUTION OF THE USD ISSUE BY TYPE OF INVESTOR |
|
| Source: MEF |
| ITALIAN MINISTRY OF ECONOMY AND FINANCE | 71 |
With regard to the type of investors (see Chart III.14), insurance companies and pension funds showed interest in the 30-year security (42% was subscribed by this type of investor), while their share was modest for both the 10-year security (6%) and the 5-year security (4%). Investment funds, on the other hand, were dominant for the 10-year maturity, with half of the issue being allocated to them, and they also played a very significant role for the shorter maturity (41%). Central banks and other public entities subscribed only a marginal share of the 30-year security (2%), while their presence was more significant for the other two maturities (7%). Banks subscribed significant shares of the 5-year and 10-year securities, playing a less significant role in the issuance of the 30-year security. Hedge funds had a rather consistent presence.
For all three securities, hedging was carried out through cross-currency swaps, which neutralised exposure to the exchange rate risk (see Paragraph III.3).
Lastly, to complete the issuances on the international market, a security indexed to European inflation, maturing on 1 September 2039, for an amount of € 800 million and with a real coupon of 0.913% was privately placed in December, as part of the EMTN programme. Through its private placement programme, the Treasury was thus able to intercept the demand of an institutional investor, which in any case could not be satisfied through the domestic channel, also obtaining a reduction in the overall cost of borrowing (arbitrage).
Extraordinary transactions
As indicated in the Guidelines, the Treasury once again used extraordinary exchange and buyback transactions in 2019, aimed at achieving multiple objectives, such as managing the refinancing risk and modifying the maturity profile, as well as supporting liquidity and the efficiency of the government bond market. As is well known, these transactions do not follow a predefined calendar, making these instruments extremely flexible, in terms of both execution and timing.
Over the last eight years, the average annual government bond buyback amount amounted to € 12.6 billion. The lowest buyback amount was recorded in 2012, when the Treasury only completed one extraordinary transaction, withdrawing just under € 2 billion worth of government securities from the market; the maximum amount, on the other hand, was recorded in 2017, when the Treasury bought back just over € 26 billion. The chart below shows the quantities repurchased as part of exchange and buyback transactions carried out between 2012 and 2019, broken down by the type of transaction completed by the Treasury.
| 72 | ITALIAN MINISTRY OF ECONOMY AND FINANCE |
III. PUBLIC DEBT MANAGEMENT IN 2019 |
| CHART III.15: BUYBACK AMOUNT AS PART OF EXTRAORDINARY TRANSACTIONS - 2012-2019 (NOMINAL AMOUNTS IN € MILLION) |
|
| Source: MEF |
As can be seen in the chart above, the Treasury repurchased just under € 15 billion in 2019, carrying out seven extraordinary transactions. The goals being pursued changed during the year.
In the first half of the year, the Treasury carried out two exchange transactions, in March and June. The electronic trading system was used for the first transaction, allowing the Treasury to complete the exchange directly on the regulated secondary wholesale market. The main purpose of this was to support the CCTeu segment, balancing the sale pressure experienced by this segment during the period in question. In fact, as had already occurred during certain periods in 2018, floating-rate securities continued to experience more or less long periods of high volatility, characterised by intermittent demand from sector operators, especially in Italy, and few exchanges on the secondary market. The transaction also involved the BTP segment. With regard to the latter, the Treasury repurchased securities with short maturities and large outstanding amounts.
The second exchange transaction was instead carried out using the Bank of Italy auction system. For this transaction, buyback securities belonging to different segments were chosen: two nominal fixed-rate securities, one floating-rate security and two inflation-linked securities. In particular, this transaction involved the Treasury once again repurchasing the BTP Italia April 2020 (already repurchased during the previous year, but through a syndicate). This transaction aimed to contain the significant outstanding amount of BTPs Italia and, in general, to reduce maturities in 2020. The other securities were selected due to their particularly weak performance, as was the case for the CCTeu, or to limit specific problems being experienced by certain securities or curve segments (such as the 3-year segment, whose securities fall into the ‘basket’ for the short futures contract).
Tables III.5 and III.6 below provide a summary of the exchange transactions.
| ITALIAN MINISTRY OF ECONOMY AND FINANCE | 73 |
| TABLE III.5: ELECTRONIC EXCHANGE ON 20/03/2019 (€ MILLION) |
| Auction date | 20/03/2019 | |
| Settlement date | 22/03/2019 | |
| Issued security | BTP 01/03/2030 | |
| Assigned amount | 2,000 | |
| Weighted average auction price | 107.498 | |
| Accrued interest (days) | 21 | |
| Repurchased securities | Issue date - maturity | Coupon | Buyback price | Nominal buyback amount |
| BTP | 04/01/10 – 01/03/20 | 4.25% | 103.991 | 418.722 |
| BTP | 15/10/18 – 15/10/21 | 2.30% | 104.030 | 516.721 |
| CCTeu | 29/04/16 – 15/07/23 | 0.464%(*) | 96.960 | 460.065 |
| CTZeu | 01/11/16 – 15/02/24 | 0.519%(*) | 95.830 | 426.335 |
| CTZeu | 02/05/17 – 15/10/24 | 0.833%(*) | 96.080 | 335.495 |
| | | Total repurchased | 2,157.338 |
| (*) Annualised coupon rate for the six-month period at the time of the exchange |
| Source: MEF |
| TABLE III.6: EXCHANGE VIA MARGINAL AUCTION ON 21/06/2019 (€ MILLION) |
| Auction date | 21/06/2019 | |
| Settlement date | 25/06/2019 | |
| Issued security | BTP 01/02/2028 | |
| Assigned amount | 2,169.7 | |
| Auction price | 101.48 | |
| Accrued interest (days) | 144 | |
| Repurchased securities | Issue date - maturity | Coupon | Buyback price | Nominal buyback amount |
| BTP | 04/01/10 – 01/03/20 | 4.25% | 102.985 | 564.626 |
| BTP Italia | 23/04/2014 – 23/04/2020 | 1.65%(*) | 101.345 | 600.694 |
| BTP€i | 25/05/16 – 15/05/22 | 0.10%(*) | 99.29 | 236.912 |
| BTP | 03/09/18 – 01/10/23 | 2.45% | 105.30 | 310.798 |
| CCTeu | 02/05/18 – 15/09/25 | 0.318% (**) | 92.10 | 487.565 |
| | | Total repurchased | 2,200.595 |
(*) Real coupon (**) Annualised coupon rate for the six-month period at the time of the exchange |
| Source: MEF |
With regard to the buyback amount of the securities involved in the two exchanges (€ 4,358 million compared with approximately € 4,170 million of securities issued), nominal or real-rate BTPs represented 61% of the total, while the remaining 39% was represented by CCTeus.
During the second half of the year, the Treasury completed five buybacks: one in October and November and three in December, only using the amounts available in its cash account for each transaction. To carry out these transactions, the Treasury used the Bank of Italy auction system, with the exception of the last two transactions which were carried out using the bilateral method, with one or more Specialists in government securities that were appropriately selected on a case-by-case basis. Table III.7 below provides a summary of these transactions.
| 74 | ITALIAN MINISTRY OF ECONOMY AND FINANCE |
III. PUBLIC DEBT MANAGEMENT IN 2019 |
| TABLE III.7: SUMMARY OF BUYBACKS FUNDED BY THE CASH ACCOUNT (NOMINAL AMOUNTS IN € MILLION) |
Transaction date | Settlement date | Purchased securities | Amount purchased | Type of transaction |
| Type | Maturity year |
| 17/10/2019 | 24/10/2019 | BTP, BTP It, CCTeu and CTZ | 2020 | 3,000 | Bank of Italy competitive auction |
| 08/11/2019 | 12/11/2019 | BTP, CCTeu and CTZ | 2020-2021-2022-2023 | 2,000 | Bank of Italy competitive auction |
| 06/12/2019 | 10/12/2019 | BTP, CCTeu and CTZ | 2021-2023-2024 | 4,023 | Bank of Italy competitive auction |
| 17/12/2019 | 19/12/2019 | BTP and CTZ | 2021 | 500 | Bilateral transaction |
| 18/12/2019 | 20/12/2019 | BTP and CTZ | 2020-2021 | 1,000 | Bilateral transaction |
| Total | | | | 10,523 | |
| Source: MEF | | | | | |
CCTeus and CTZs represented approximately 60% of the total amount repurchased in these transactions (€ 10,523 million), while the remaining 40% referred to the buyback of nominal and inflation-linked BTPs. The securities to be repurchased were selected by taking into account a number of objectives: continuous support for the CCTeu segment and reducing the amounts maturing in the 2020-21 two-year period; however, among these, securities were selected with prices that were discounted and misaligned vis-à-vis the yield curve.
Chart III.16 shows the effects that the exchange and buyback transactions in 2019 have had on reducing the quantities to be repaid over the coming years.
| CHART III.16: EFFECTS ON GOVERNMENT BONDS REPURCHASED IN EXTRAORDINARY TRANSACTIONS BETWEEN 2012 AND 2019 (NOMINAL AMOUNTS IN € MILLION) |
|
| Source: MEF |
Transactions completed in a given year generally involve the securities maturing in the immediately following years, in line with the Guidelines and the objectives described in Chapter I. In 2019, extraordinary transactions mainly involved securities maturing in 2020 and 2021.
| ITALIAN MINISTRY OF ECONOMY AND FINANCE | 75 |
III.3 DERIVATIVES PORTFOLIO MANAGEMENT
Portfolio management
The most significant foreign issue during the year was undoubtedly the multi-tranche transaction in USD in October, which was accompanied by the parallel completion of collateralised cross-currency swaps10 with some counterparties, appropriately selected with the aim of minimising execution costs, at the same time as guaranteeing competitiveness and full operations on large notional amounts without market repercussions.
It should be noted that these derivatives transactions are carried out at the same time as the issue, i.e. by the settlement date of the securities, and they therefore involve an initial and final exchange of notional amounts. In fact, during the initial exchange, the Treasury converts the net proceeds in the currency of the bonds into net proceeds in euro; upon expiry of the contract, the Treasury instead pays the swap counterparty the notional amount in euro, as agreed in the derivative contract, and receives the amount in the bond currency necessary to redeem the securities to investors.
More specifically, the 5-year Global bond was hedged through a cross-currency swap with a notional amount of $ 2.5 billion, completed according to a two-phase procedure: a significant portion, equal to 80% of the total hedge, was completed in the days running up to the new security being priced, while the remaining 20% was completed afterwards, after the notional amount was increased from the $ 2 billion originally planned for this maturity, to the $ 2.5 billion actually issued. As part of this 5-year transaction (17 October 2019 - 17 October 2024), the Treasury receives a fixed rate of 2.375% on a notional amount of $ 2.5 billion every six months (perfectly recreating the flow of the security) and pays a fixed rate in euro of less than 0.4% on a notional amount of € 2.3 billion.
The 10-year security was hedged using a single-solution cross-currency swap. For the 10-year swap, settled on 17 October 2019 and expiring on 17 October 2029, the interest flows that the Treasury receives every six months are calculated on a notional amount of $ 2 billion and at a rate of 2.875%, while those paid are calculated on a fixed rate marginally above 1% and on a notional amount of € 1.8 billion.
Finally, the 30-year bond was accompanied by a hedge involving cross-currency swaps with two different counterparties: one hedged an amount equal to $ 1.5 billion, while the other hedged the remaining $ 1 billion. All swaps started on 17 October 2019 and will expire on 17 October 2049 and have the same fixed rate in USD, equal to 4% (the security's coupon), on which the interest flow paid to the Treasury is calculated as per the derivative contract.
The hedge in place with the first of the two counterparties, for a total of $ 1.5 billion, was completed in two phases: one before and one in the days immediately after pricing. After receiving the interest flows in USD, the Treasury pays a fixed
___
10 For further information on the mutual guarantee agreements that support cross-currency swaps or other derivatives transactions, please refer to the dedicated paragraph in Annex 4 to this Report.
| 76 | ITALIAN MINISTRY OF ECONOMY AND FINANCE |
III. PUBLIC DEBT MANAGEMENT IN 2019 |
rate every six months of slightly more than 2.1% per annum, on a notional amount of € 1.36 billion.
The second set of cross-currency swaps for $ 1 billion, as a hedge for the remaining part of the 30-year security, was completed with another counterparty. Also in this case, the Treasury receives six-monthly flows in USD and pays out interest flows in euro, on a six-monthly basis, calculated on a fixed rate of slightly below 2.1% and on a notional amount of approximately € 907 million.
With reference to the private placement in yen carried out in March, a foreign exchange swap was concluded with the same counterparty that dealt with the issue (also subject to a Credit Support Annex -CSA). More specifically, the Treasury receives a flow of interest equal to the interest on the security every six months from the counterparty, calculated on the notional amount of JPY 25 billion, and it pays a fixed rate of 1.24% on the notional amount of € 200 million. The swap also includes an initial and final exchange of the notional amounts, scheduled for 29 March 2019 and 29 March 2023, respectively.
With regard to the management of liabilities, in 2019, the Treasury continued its usual activities from previous years, mainly aimed at restructuring existing derivatives portfolio positions in order to reduce the relative financial expenses and/or debt. More specifically, in 2019, the Treasury unwound two interest rate swaps in its portfolio, held with the same counterparty.
For the first swap, with a notional amount of € 2.8 billion and a 4-year maturity, the Treasury received a very low fixed rate and paid a floating rate indexed to the 6-month Euribor. This transaction recorded a positive mark-to-market for the Treasury at the time of closing.
The second swap involved, with a notional amount decreasing over time11 and expiring in 2024, had fixed cash flows to pay and the flows received were proportionate to the 3-month Euribor. The mark-to-market for this transaction was negative for the Treasury.
The financial context, characterised by very low interest rates, facilitated this restructuring process: since the two transactions had opposite market values, with the positive value being dominant, this allowed the Treasury to generate a certain amount of proceeds as a result of the simultaneous unwinding of the two interest rate swaps. The overall notional amount of the derivatives portfolio therefore fell by over € 3.2 billion, while limited benefits were obtained in terms of interest expenses, which recorded a reduction of over € 6 million in 2019, thanks to the cancellation of the future interest flows of the two transactions.
___
11 This referred to an existing derivative on an asset pursuant to the Italian Finance Law for 2005 (see Table III.14 below)
| ITALIAN MINISTRY OF ECONOMY AND FINANCE | 77 |
III.4 DEBT MANAGEMENT RESULTS IN RELATION TO OBJECTIVES
Final composition of the year's gross issues
As already mentioned, in 2019, the opportunity was taken to issue more longer-term securities (with a maturity of more than 10 years), which were very significant not only in the context of nominal BTPs (€ 40,550 million, only € 400 million less than the record in 2016), but also in the segment of domestic securities indexed to European inflation (BTP€i) and in the foreign securities segment, which saw a global issue of $ 2.5 billion in addition to the private placement of € 800 million completed as part of the EMTN programme.
With regard to gross issuance composition, the importance of the long-term segment is therefore evident, and even exceeded the expectations stated in the Guidelines. This therefore contributed to achieving the strategic objective of extending the average life and duration of debt, even in the presence of moderately positive net issues in both the BOT and CTZ segments, whose weight on total issuances marginally increased. Table III.8 shows the composition of the issues made over the last three years, both in absolute and percentage terms, excluding exchanges.
| TABLE III.8: COMPOSITION OF 2017-2019 ISSUES, IN ABSOLUTE AND PERCENTAGE TERMS, EXCLUDING EXCHANGES* | |
| | 2017 issuances | % of total | 2018 issuances | % of total | 2019 issuances | % of total | |
| Flexible BOT | 0 | 0% | 0 | 0% | 0 | 0% | |
| 3-month BOT | 0 | 0% | 0 | 0% | 0 | 0% | |
| 6-month BOT | 75,000 | 18.13% | 75,303 | 19.32% | 80,810 | 19.71% | |
| 12-month BOT | 76,601 | 18.52% | 76,350 | 19.58% | 80,029 | 19.52% | |
| Commercial Paper | 0 | 0% | 0 | 0% | 0 | 0% | |
| Total short-term securities | 151,601 | 36.65% | 151,653 | 38.90% | 160,839 | 39.23% | |
| CTZ | 28,660 | 6.93% | 29,169 | 7.48% | 31,156 | 7.60% | |
| CCTeu | 31,023 | 7.50% | 23,863 | 6.12% | 14,771 | 3.60% | |
| 3-year BTP | 35,148 | 8.50% | 31,500 | 8.08% | 32,430 | 7.91% | |
| 5-year BTP | 36,404 | 8.80% | 31,675 | 8.12% | 33,686 | 8.22% | |
| 7-year BTP | 29,762 | 7.19% | 30,717 | 7.88% | 29,552 | 7.21% | |
| 10-year BTP | 37,902 | 9.16% | 36,145 | 9.27% | 39,054 | 9.52% | |
| 15-year BTP | 11,634 | 2.81% | 5,471 | 1.40% | 13,600 | 3.32% | |
| 20-year BTP | 7,513 | 1.82% | 13,464 | 3.45% | 8,470 | 2.07% | |
| 30-year BTP | 14,041 | 3.39% | 8,768 | 2.25% | 15,480 | 3.78% | |
| 50-year BTP | 750 | 0.18% | 883 | 0.23% | 3,000 | 0.73% | |
| 5-year BTP€i | 2,895 | 0.70% | 7,782 | 2.00% | 2,149 | 0.52% | |
| 10-year BTP€i | 7,856 | 1.90% | 5,645 | 1.45% | 7,369 | 1.80% | |
| 15-year BTP€i | 2,326 | 0.56% | 2,745 | 0.70% | 2,334 | 0.57% | |
| 30-year BTP€i | 472 | 0.11% | 494 | 0.13% | 2,018 | 0.49% | |
| BTP Italia | 15,697 | 3.79% | 9,873 | 2.53% | 6,750 | 1.65% | |
| Foreign | 0 | 0.00% | 0 | 0.00% | 7,371 | 1.80% | |
| Total medium/long-term securities | 262,084 | 63.35% | 238,192 | 61.10% | 249,191 | 60.77% | |
| TOTAL | 413,684 | | 389,845 | | 410,030 | | |
| * Off-the-run securities have been included in the category with the nearest residual life - Source: MEF | |
| 78 | ITALIAN MINISTRY OF ECONOMY AND FINANCE |
III. PUBLIC DEBT MANAGEMENT IN 2019 |
More in detail, it should be noted that the percentage weight of 3-year and 5-year BTPs on total issues remained substantially the same as the previous year (16.13% in 2019 compared with 16.20% in 2018), even though, as mentioned in Paragraph III.2, the 5-year security had a slightly greater weightthan the 3-year security, contrary to the expectations stated in the Guidelines. However, this allowed for the reduction in the average life of debt to be mitigated, deriving from more CTZs being issued than expected.
With regard to inflation-linked securities (BTP€i and BTP Italia), issuance volumes in 2019 were lower than in the previous two years. In particular, the total amount of domestic securities indexed to European inflation was significantly lower than in 2018 (€ 13,871 million compared with € 16,666 million), but marginally higher than the € 13,550 million of 2017. All of this is consistent with the plans stated in the Guidelines, given that inflation was expected to be low already at the end of 2018 - and this type of instrument is clearly very sensitive to inflation expectations. Considering the significant September maturity, net BTP€i issues were therefore negative and the withdrawal of € 250 million worth of a security in this segment as part of an exchange transaction also contributed to this, albeit modestly.
There were no maturing BTPs Italia, on the other hand, so there was a positive balance of net issues despite there being only one issue.
However, with regard to domestic securities, the most notable change concerned CCTeus, which saw a very marked reduction in issues and a significant drop in the weight compared with the previous two years, even more so when considering gross issues including exchanges (see Table III.10).
If we compare Tables III.8 and III.9, the volume of off-the-run securities issued in exchange transactions was significantly lower than in the previous two years (€ 4,170 million compared with € 11,132 million in 2018 and € 13,375 million in 2017), and only increased the weight of BTPs with a residual life of close to 10 and 15 years.
For the first time since 2014, there were also issues on the foreign market.
| ITALIAN MINISTRY OF ECONOMY AND FINANCE | 79 |
| TABLE III.9: COMPOSITION OF 2017-2019 ISSUES, IN ABSOLUTE AND PERCENTAGE TERMS, INCLUDING EXCHANGES* | |
| | 2017 issuances | % of total | 2018 issuances | % of total | 2019 issuances | % of total | |
| Flexible BOT | 0 | 0% | 0 | 0% | 0 | 0% | |
| 3-month BOT | 0 | 0% | 0 | 0% | 0 | 0% | |
| 6-month BOT | 75,000 | 18.70% | 75,303 | 18.78% | 80,810 | 19.51% | |
| 12-month BOT | 76,601 | 19.10% | 76,350 | 19.04% | 80,029 | 19.32% | |
| Commercial Paper | 0 | 0% | 0 | 0% | 0 | 0% | |
| Total short-term securities | 151,601 | 37.81% | 151,653 | 36.61% | 160,839 | 38.83% | |
| CTZ | 28,660 | 7.15% | 29,169 | 7.27% | 31,156 | 7.52% | |
| CCTeu | 31,923 | 7.96% | 23,863 | 5.95% | 14,771 | 3.57% | |
| 3-year BTP | 35,898 | 8.95% | 34,700 | 8.65% | 32,430 | 7.83% | |
| 5-year BTP | 36,404 | 9.08% | 33,675 | 8.40% | 33,686 | 8.13% | |
| 7-year BTP | 30,612 | 7.63% | 30,717 | 7.66% | 29,552 | 7.13% | |
| 10-year BTP | 40,652 | 10.14% | 37,596 | 9.38% | 41,224 | 9.95% | |
| 15-year BTP | 17,759 | 4.43% | 8,868 | 2.21% | 15,600 | 3.77% | |
| 20-year BTP | 9,513 | 2.37% | 14,548 | 3.63% | 8,470 | 2.04% | |
| 30-year BTP | 14,041 | 3.50% | 8,768 | 2.19% | 15,480 | 3.74% | |
| 50-year BTP | 750 | 0.19% | 883 | 0.22% | 3,000 | 0.72% | |
| 5-year BTP€i | 2,895 | 0.72% | 7,782 | 1.94% | 2,149 | 0.52% | |
| 10-year BTP€i | 7,856 | 1.96% | 5,645 | 1.41% | 7,369 | 1.78% | |
| 15-year BTP€i | 2,326 | 0.58% | 2,745 | 0.68% | 2,334 | 0.56% | |
| 30-year BTP€i | 472 | 0.12% | 494 | 0.12% | 2,018 | 0.49% | |
| BTP Italia | 15,697 | 3.91% | 9,873 | 2.46% | 6,750 | 1.63% | |
| Foreign | 0 | 0.00% | 0 | 0.00% | 7,371 | 1.78% | |
| Total medium/long-term securities | 275,459 | 68.70% | 249,324 | 62.18% | 253,361 | 61.17% | |
| TOTAL | 427,059 | | 400,977 | | 414,200 | | |
| * Off-the-run securities have been included in the category with the nearest residual life - Source: MEF | |
Composition of the stock of securities at the end of the year
Changes to the composition of debt were quite limited, given the substantial continuity of the issuance policy compared with previous years. Between 2018 and 2019, the most significant change concerned the BTP€i segment, whose weight on the stock of securities dropped from 7.92% to 7.57%.
CCTeus also saw a significant reduction, with their weight on total outstanding debt falling by 0.32%, from 6.58% down to 6.26%. Conversely, there was a 0.22% increase in CTZs and BOTs.
All other changes may be considered marginal, including those regarding foreign securities, which recorded an increase of only 0.13%, as the redemptions in this segment (€ 3,948 million) mitigated the impact of the albeit significant amount of new issues in this segment.
Chart III.17 clearly shows the absolute preponderance of nominal BTPs, with a substantially stable share of just under 72%.
| 80 | ITALIAN MINISTRY OF ECONOMY AND FINANCE |
III. PUBLIC DEBT MANAGEMENT IN 2019 |
| CHART III.17: COMPOSITION OF THE STOCK OF GOVERNMENT SECURITIES AT 31 DECEMBER 2018 AND AT 31 DECEMBER 2019 |
|
| Source: MEF |
Exposure to refinancing and interest rate risks
There was a slight increase in the average life of debt, from 6.78 years in 2018 to 6.87 years in 2019 (Chart III.17). This increase is due to two opposing phenomena: on the one hand, the significant impulse to extend average life provided by the large volume of long-term securities placed; on the other hand, the increase in the weight of BOTs and CTZs, combined with the natural shortening of average life, due to the existing stock at the end of 2018 that was not subject to redemptions in 2019.
| ITALIAN MINISTRY OF ECONOMY AND FINANCE | 81 |
| CHART III.18: EVOLUTION OF THE STRUCTURE AND AVERAGE LIFE OF DEBT (IN YEARS) |
|
| Source: MEF |
Recent trends in average residual life are shown in Table III.10. Average residual life is only an indicator of the refinancing risk, while analysing the inherent risk in a debt portfolio also requires other aspects to be taken into consideration; it is therefore useful to adopt other types of synthetic indicators of the stock's exposure to market risks, such as the duration and ARP (Average Refixing Period), reported in Table III.11.
| TABLE III.10: AVERAGE LIFE OF THE STOCK OF GOVERNMENT SECURITIES |
| | 31/12/2017 | 31/12/2018 | 31/12/2019 |
| Domestic securities | 6.78 | 6.67 | 6.74 |
| Foreign securities | 11.88 | 11.77 | 12.48 |
| Stock of government securities | 6.90 | 6.78 | 6.87 |
| Source: MEF | | | |
| TABLE III.11: DURATION AND ARP TREND DURING THE 2017-2019 PERIOD, RELATING TO THE STOCK OF GOVERNMENT SECURITIES BEFORE DERIVATIVES (IN YEARS) |
| | Duration | ARP |
| | 31/12/2017 | 31/12/2018 | 31/12/2019 | 31/12/2017 | 31/12/2018 | 31/12/2019 |
| Domestic securities before derivatives | 5.47 | 5.26 | 5.70 | 5.74 | 5.65 | 5.78 |
| Foreign securities before derivatives | 6.96 | 6.99 | 8.42 | 6.49 | 6.46 | 7.56 |
| Stock of government securities before derivatives | 5.50 | 5.30 | 5.76 | 5.76 | 5.67 | 5.82 |
| Source: MEF | | | | | | |
In particular, the Average Refixing Period (measuring the average time taken by the debt stock to incorporate changes in rates), came back to growth after the slight decline recorded in 2018. This was thanks to the significant issuance of long-term fixed-rate securities, which was stronger in the foreign segment, where the return to the USD market regarded a large section of the medium/long-term curve,
| 82 | ITALIAN MINISTRY OF ECONOMY AND FINANCE |
III. PUBLIC DEBT MANAGEMENT IN 2019 |
up to the 30-year maturity. Duration, on the other hand, is weighted using current flow values and is therefore also affected by changes in market rates; the increase in duration was even more significant than for the other two indicators. In fact, the yield curve for Italian government bonds dropped by an average of around one percentage point at the end of 2019 compared with the previous year, as can be clearly seen in Chart III.19 below.
| CHART III.19: MATURITIES BY RESIDUAL LIFE, 2017-2019 |
|
| NB: the stock of inflation-linked securities takes into account the revaluation of the capital matured at the end of each year and foreign currency securities are valued after foreign exchange swaps |
| Source: MEF |
As shown in Table III.12 below, the lenghtening effect of the derivatives portfolio was confirmed in 2019: in fact, the total duration of debt went from 5.76 years pre-swaps to 6.22 years post-swaps, with an increase of nearly six months (similar to previous years).
Likewise, the derivatives portfolio also contributed to lengthening the Average Refixing Period of the debt: at the end of 2019, the overall post-swap ARP was still 6.22 years, almost five months higher than the corresponding pre-swap value of 5.82 years.
| TABLE III.12: DURATION AND ARP TREND DURING THE 2017-2019 PERIOD, RELATING TO THE STOCK OF GOVERNMENT SECURITIES AFTER DERIVATIVES (IN YEARS) |
| | Duration | ARP |
| | 31/12/2017 | 31/12/2018 | 31/12/2019 | 31/12/2017 | 31/12/2018 | 31/12/2019 |
| Domestic securities after derivatives | 5.99 | 5.76 | 6.17 | 6.23 | 6.09 | 6.19 |
| Foreign securities after derivatives | 7.05 | 6.99 | 8.62 | 6.96 | 6.82 | 7.90 |
| Stock of government securities after derivatives | 6.01 | 5.79 | 6.22 | 6.25 | 6.11 | 6.22 |
| Source: MEF | | | | | | |
| ITALIAN MINISTRY OF ECONOMY AND FINANCE | 83 |
Market value trend of the stock of government securities and of the derivatives portfolio
The well-known inverse relationship between interest rates and market values implies, from a structural point of view, that, with all other conditions being equal12, if market rates are lower than the previous ones, all fixed-rate financial instruments previously settled at higher rates shall have a negative market value for the payer and a positive market value for the recipient. This is regardless of the contractual nature of the instrument, i.e. regardless of whether the fixed rate is paid on the securities issued or is determined in different instruments, such as derivatives.
During 2019, the euro market continued to record decreasing interest rates, despite the fact that the starting levels were already at historical lows. The credit component included in government yields (i.e. the premium required by the market for the credit risk) also showed a reduction compared to the end of the previous year along the whole curve, with the only exception being the extra-long segment. Government yields therefore declined to a greater extent than the reduction in euro interest rates. This resulted in the current value of any fixed-rate payer position taken on previously13 becoming negative. Consequently, given the interest rate structure of the related portfolios:
1. As there was around a € 12 billion reduction in the notional amount of the derivatives portfolio compared with the previous year, the mark-to-market was negative for € 34.3 billion at 31 December 2019, compared with € 29.8 billion at 31 December 2018. Taking into consideration only the derivatives referring to debt14 (see Table III.14), including almost all of the nominal amount reduction, the market value was negative for € 34.27 billion at the end of 2019, compared with € 29.64 billion at the end of 2018;
2. The market value of the stock of government securities (excluding the derivatives portfolio effect) increased by approximately € 180 billion during the same period, from € 2,065.3 billion in 2018 to € 2,245.2 billion at end of 2019. The nominal value of the stock of government securities, as shown in Table III.14, also increased, albeit to a much lesser extent (around € 45 billion). As a result, the difference between the market value and the nominal value of the stock of government securities more than doubled compared with the previous year, increasing by approximately € 135 billion. In fact, this difference was approximately equal to € 240 billion at the end of 2019, compared with around € 106 billion at the end of 2018. The increase of around € 180 billion (in absolute terms) in the market
___
12 The phenomena described herein relate to the market interest rate component, while changes in the
interest rate component that remunerates the credit risk are independent from market rate variations (in terms of both size and direction); therefore, in the event of very significant and/or long-lasting changes in credit spreads, this latter interest rate component may amplify or mitigate the effects of the changes to market rates (depending on the direction in which the credit spread is moving).
13 As can be seen, the mere existence of a negative (or positive) mark-to-market does not represent a loss or a profit for the issuer, let alone an indication as to the suitability of the decision to "fix" the rate or not. The formation and trend of the mark-to-market are instead connected to the relationship between the portfolio
characteristics (fixed gradually over time on the basis of the well-known cost-risk trade-off, which the DMO addresses in relation to the portfolio characteristics, the market’s absorption capacity and the fiscal objectives at the time) and the following - exogenous - trend in market rates. For a DMO, the decision to "fix" the debt interest rate is consistent with the objectives to mitigate risks for the public budget and the intention is not to take a position to "beat the market".
14 In this case, derivatives contracts entered into with reference to loans granted pursuant to the Italian Finance Law for 2005 are excluded.
| 84 | ITALIAN MINISTRY OF ECONOMY AND FINANCE |
III. PUBLIC DEBT MANAGEMENT IN 2019 |
value of government securities is therefore attributable to two factors that both acted in the same direction: on the one hand, the increase of approximately € 45 billion in the nominal stock of securities; on the other hand, the more significant increase, of approximately € 135 billion, of the relative market value, as a result of the decline in government yields, due to the reduction of both components (credit and market).
| TABLE III.13: MARKET VALUE TREND OF THE STOCK OF GOVERNMENT SECURITIES (€ MILLION) |
| | MTM | Nominal value | MTM - Nominal value |
| 31/12/2019 | 2,245,197 | 2,004,766 | 240,431 |
| 31/12/2018 | 2,065,258 | 1,959,429 | 105,829 |
| Change | 179,939 | 45,337 | 134,602 |
| Source: MEF | | | |
The market value trend for the two portfolios (derivatives and securities) reflects, net of stock variations, the performance of the reference interest rate curves: the swap curve for the derivatives portfolio and the government yield curve for the stock of government securities. These curves may move in different directions and/or with different changes and inclinations, thereby generating effects that may differ from one year to the next. The following shows the euro swap curve and the Italian government securities yield curve, with reference to 31/12/2018 and 31/12/2019 (Chart III.20).
| CHART III.20: EURO SWAP CURVE AND ITALIAN GOVERNMENT SECURITIES YIELD CURVE AT 31/12/2018 AND 31/12/2019 |
|
| Source: Bloomberg |
Table III.14 below shows the notional amounts and the market values of the segments into which the derivatives portfolio may be broken down15. With regard to debt derivatives, cross-currency swaps refer to issues denominated in foreign currencies, while hedging IRSs refer to issues of MTN programme securities
___
15 For all segments of the derivatives portfolio mentioned in this paragraph, a detailed description is provided in Annex 4 to this Report.
| ITALIAN MINISTRY OF ECONOMY AND FINANCE | 85 |
denominated in euro. In addition, the “duration IRS” category includes all the positions attributable to the strategy of protecting against the risk of interest rates rising. The “ex-ISPA IRS” segment includes all derivatives contracts associated with the liabilities of the company Infrastrutture S.p.A., which were transferred to the Treasury in accordance with the Italian Financial Law for 2007. Receiver swaptions not linked to pre-existing IRSs are included in the “Swaption” category.
Finally, the values relating to derivatives on assets and the overall portfolio are reported.
| TABLE III.14: DERIVATIVES PORTFOLIO - 2018 AND 2019 (€ MILLION) |
| Debt derivatives |
| | 31/12/2018 | 31/12/2019 |
| Instrument | Notional amount | as % | MTM | as % | Notional amount | as % | MTM | as % |
| ex-ISPA IRS | 3,500 | 3.18% | -1,343 | 4.53% | 3,500 | 3.56% | -1,651 | 4.82% |
| CCS (Cross-Currency Swap) | 4,981 | 4.53% | 79 | -0.27% | 10,826 | 11.01% | 260 | -0.76% |
| Hedging IRS (Interest Rate Swap) | 8,327 | 7.57% | 792 | -2.67% | 6,177 | 6.28% | 1,072 | -3.13% |
| Duration IRS (Interest Rate Swap) | 90,752 | 82.55% | -27,621 | 93.18% | 75,658 | 76.93% | -31,976 | 93.32% |
| Swaption | 2,380 | 2.16% | -1,549 | 5.23% | 2,190 | 2.23% | -1,970 | 5.75% |
| Total debt derivatives | 109,940 | 100.00% | -29,642 | 100.00% | 98,351 | 100.00% | -34,266 | 100.00% |
| Outstanding government securities | 1,959,429 | 2,004,766 |
| Debt derivatives/government securities | 5.61% | 4.91% |
| | | |
| Derivatives on assets (Italian financial law for 2005) |
| Instrument | Notional amount | | MTM | | Notional amount | | MTM | |
| IRS (Interest Rate Swap) | 1,358 | | -154 | | 677 | | -77 | |
| | | | | | | | | |
| Total derivatives portfolio |
| Instrument | Notional amount | as % | MTM | as % | Notional amount | as % | MTM | as % |
| Debt derivatives | 109,940 | 98.78% | -29,642 | 99.48% | 98,351 | 99.32% | -34,266 | 99.81% |
| Derivatives on assets | 1,358 | 1.22% | -154 | 0.52% | 677 | 0.68% | -67 | 0.19% |
| Total derivatives | 111,298 | 100% | -29,796 | 100% | 99,028 | 100% | -34,333 | 100% |
| | | | | | | | | |
| Mutual guarantee agreements on derivative financial instruments (*) | | | | | | | | |
The amounts indicated refer to the net amount of the guarantee posted at the end of each year
|
| Cash margin (1) | 1,050 | 2,249
|
| (1) Provision of a mutual guarantee pursuant to Italian Ministerial Decree No. 103382 of 20 December 2017. Please refer to the ‘Laws and regulations on government debt - Rules on derivative transactions’ section on the MEF website, available from http://www.dt.mef.gov.it/modules/documenti_en/debito_pubblico/normativa_spalla_destra/D.M._20.12.2017_-_Bilateral_collateral_with_reference_to_derivates.pdf |
| |
| NB: The MtM reported in this table is calculated by MEF for its own management purposes and it therefore does not match the figures published by the Bank of Italy in the ‘Financial Accounts Series’. As the latter are strictly for statistical purposes, part of the MtM therein is reclassified as debt, in accordance with the provisions of the new Eurostat Manual on Government Deficit and Debt issued after the European System of National and Regional Accounts (ESA 2010) came into force. |
More in detail, seven new exchange risk hedging transactions (CCS) were carried out in 2019. The first was in March 2019 for a notional amount of around € 200 million, to hedge an EMTN issue denominated in Japanese yen with a duration of 4 years. The others, for an overall notional amount of just under € 6.4 billion,
| 86 | ITALIAN MINISTRY OF ECONOMY AND FINANCE |
III. PUBLIC DEBT MANAGEMENT IN 2019 |
were made in relation to the issue of three securities as part of the Global Bond programme, which allowed the Italian Treasury to return to the USD market in October, for maturities of 5, 10 and 30 years. The increase in the notional amount of CCSs, due to the hedging of these new issues, was only slightly offset by another four transactions maturing that had hedged the same number of issues denominated in foreign currencies (in particular, two in Czech koruna and two in Japanese yen). In addition to the aforementioned securities, three IRSs to hedge foreign issues denominated in euro also expired, for a total notional amount of approximately € 2.1 billion.
With regard to IRSs and macro-hedging swaptions for the risk of rising interest rates, three swaps expired in 2019 for a total notional amount of € 12 billion, and a fourth swap with a notional amount of € 2,834 million was also closed early, together with another transaction included among asset derivatives. In addition, both macro-hedging components (IRSs and swaptions) recorded slight changes in the notional amount due to payments relating to the rescheduling of the premium differential, deriving from the restructuring carried out in previous years16.
Lastly, during 2019, collateralisation of the derivatives portfolio continued, with reference to both previous transactions (as already described last year) and new transactions. In fact, at the beginning of the year, the process was completed that led to the signing of the mutual guarantee framework agreements (so-called ‘CSA’) with all Specialists in government securities. Five of these were then activated during the year, allowing the cross-currency swaps described above to be subject to the mutual guarantee. At the end of 2019, the total net amount of the guarantee paid to counterparties was equal to € 2,249 million.
With regard to derivative instruments referring to debt (excluding positions undertaken, pursuant to the Italian Finance Law for 2005, on loans granted), the following two charts show the evolution of the notional amount year by year, starting from 31/12/2018 and from 31/12/2019 respectively, until the last maturity of the portfolio (2062), assuming that all the swaptions present in the portfolio are exercised.
In 2019, there were many maturities in terms of notional amounts, while these maturities are more evenly distributed from 2020 onwards. In the 2035-2036 two-year period, a considerable notional amount will expire, while the last group of significant maturities will be in 2045. After 2050, the last year when an IRS will expire with a considerable notional amount (€ 2 billion), only one position will remain, related to an EMTN-programme security with a notional amount of € 250 million, set to expire in 2062.
___
16 For a more detailed description, please refer to the 2016 Public Debt Report, p. 87, and the 2017 Public Debt Report, p. 85.
| ITALIAN MINISTRY OF ECONOMY AND FINANCE | 87 |
| CHART III.21: COMPARISON BETWEEN THE PROSPECTIVE TREND OF THE NOTIONAL AMOUNT FOR THE EXISTING DERIVATIVES PORTFOLIO, AS AT 31/12/2018 AND 31/12/2019 RESPECTIVELY, ASSUMING THAT ALL SWAPTIONS ARE EXERCISED (€ MILLION) |
|
| Source: MEF |
| CHART III.22: COMPARISON BETWEEN THE MATURITY STRUCTURE OF THE EXISTING DERIVATIVES PORTFOLIO, AS AT 31/12/2018 AND 31/12/2019 RESPECTIVELY, ASSUMING THAT ALL SWAPTIONS ARE EXERCISED (€ MILLION) |
|
| Source: MEF |
Debt cost
In 2019, the weighted average rate at issuance fell back below 1% and stood at 0.93%, down by 14 basis points compared with 1.07% in 2018. This result is particularly remarkable given the higher incidence of long-term issues compared with the previous year. This trend is almost specular compared with 2018, when the lowest yields at issuance were recorded in the first part of the year, while in 2019 yields at issuance recorded a decidedly more favourable trend for the issuer in the second half.
| 88 | ITALIAN MINISTRY OF ECONOMY AND FINANCE |
III. PUBLIC DEBT MANAGEMENT IN 2019 |
| CHART III.23: AVERAGE COST AT ISSUANCE OF GOVERNMENT SECURITIES - 2005-2019 (PERCENTAGE RATES) |
|
| Source: MEF |
On a cash basis, the average cost of debt, calculated as the ratio between cash interest17 paid on government securities in year t on the stock of government securities in year t-1, was equal to 2.65% in 2019, compared with 2.76% in 2018. Despite the difficult context described in this Report, there was therefore a reduction of 0.11%.
Including also all derivatives transactions, the total cash cost in 2019 fell to 2.78%, compared with 2.90% in 2018, therefore representing a reduction of 0.12%. In line with this, the impact of the derivatives portfolio also decreased: 0.13%, compared with 0.14% in the previous year18.
At the end of 2019, the average rate paid on derivatives transactions to manage the duration of the domestic debt stock was equal to 3.495%19; as at the same date, the stock of outstanding securities with coupons exceeding 3.495% amounted to approximately € 689 billion, thus confirming that the average rate paid on the portion of debt hedged by interest rate derivatives is well within the limits of the historical cost of Italy’s fixed-rate debt.
Lastly, it should be noted that the public finance forecasts included in policy documents, as well as in the state budget, take into account the effect of derivatives with simulation hypotheses that are completely in line with the rest of the estimates. Similarly, all final figures also include the effects of the amounts collected or paid out as a result of derivatives transactions.
___
17 It is not possible to calculate a similar ratio for expenditure on an accrual basis (ESA 2010), as the latter, by definition, excludes flows from derivatives transactions.
18 Please note that the difference in costs between the debt portfolio before derivatives and that after derivatives represents the marginal cost borne by the Treasury to obtain a longer duration (therefore greater hedging of the risk of rising interest rates) compared to the duration resulting from issuing bonds only.
19 A further decrease compared to the 4.08% in 2018, 4.14% in 2017, 4.19% in 2016 and 4.35% in 2015. This reduction is due to two factors:
• the effects of the restructuring carried out over the years;
• the natural maturity of certain transactions.
| ITALIAN MINISTRY OF ECONOMY AND FINANCE | 89 |
| CHART III.24: AVERAGE COST OF THE STOCK OF GOVERNMENT SECURITIES, BEFORE AND AFTER DERIVATIVES - 2005-2019 (PERCENTAGE RATES) |
|
| Source: MEF |
III.5 THE TREASURY’S CASH MANAGEMENT
The Treasury's cash management activities are closely related to its issuance activities. The purpose of cash management is to ensure an adequate level of liquidity to deal with the Treasury's many daily movements, as well as to appropriately remunerate the cash balances, based on market conditions and current risk levels.
The same conditions applied to cash management activities in 2019 as in recent years, characterised by abundant liquidity and extremely negative rates. As is well known, the expansionary monetary policies adopted by the ECB over the last five years have benefited the government bond market on the one hand, in terms of lower yields and increased demand, but, on the other, they have led to a number of critical cash management issues. In fact, in a context characterised by minimum demand for liquidity and negative returns, the Treasury found itself having to move considerable funds.
During 2019, these conditions were further accentuated, in particular by the decisions made by the ECB on 7 March20 and 12 September21, with which the Governing Council adopted a far-reaching package of monetary easing measures aimed at reducing the risk of inflation moving away from the 2% target level. As already mentioned in Chapter II, the Governing Council intervened by introducing the new series of TLTRO III refinancing operations. The ECB deposit facility (DF) was reduced by 10 basis points, taking it from -0.40% to -0.50%, the APP (Asset Purchase Programme) began again and the two-tier system was also introduced (a two-level remuneration system for bank reserves exceeding the compulsory reserve), which led to an inflow of funds to intermediaries. For these reasons, cash management in 2019 was once again substantially geared towards cutting costs, deriving from the
___
20 https://www.ecb.europa.eu/press/pr/date/2019/html/ecb.mp190307~7d8a9d2665.en.html
21 https://www.ecb.europa.eu/press/pr/date/2019/html/ecb.mp190912~08de50b4d2.en.html
| 90 | ITALIAN MINISTRY OF ECONOMY AND FINANCE |
III. PUBLIC DEBT MANAGEMENT IN 2019 |
balances held in the Bank of Italy being severely penalised and from a market governed by firmly negative monetary rates.
The Treasury normally uses ‘OPTES’ operations for part of its cash management activities, involving active management of the Treasury's cash account. Thanks to the Bank of Italy and the MEF exchanging information on cash flows, OPTES operations aim, inter alia, to improve account balance forecasts, making it easier to manage debt and money market transactions. As is normally the case, funding and lending are carried out through daily auctions and bilateral trading with counterparties, run directly by the MEF or by the Bank of Italy on behalf of the latter.
As the below analysis shows, 2019 was characterised by marginal use of OPTES operations, due to the excess liquidity in the system and, consistently, to the strong contraction in demand from market agents.
Monitoring the cash account and daily and monthly cash balance trends
As outlined in Chapter I, monitoring is carried out by information being continuously exchanged between the State General Accounting Department, the Department of the Treasury and the Bank of Italy. The information shared refers to all incoming and outgoing transactions carried out on the State Treasury's accounts, with data being exchanged with regard to both estimates and final balances.
The main purpose of sharing this information is to forecast the end-of-day balance, estimated on the basis of continuous updates provided by the Bank of Italy (six times a day) which are then validated by the MEF. These institutions also share longer-term forecast scenarios covering a period of between 30 and 60 days, with weekly updates being provided. This latter exchange of information is particularly important for monetary policy purposes, as the Treasury sends its estimates regarding use of cash and government deposit balances for the period in question to the Bank of Italy, which in turn sends them to the ECB. The difficulties involved with this forecasting process stem from the large number of operators and the substantial cash flows running through the account. The average daily difference between the expected balance and the actual balance of the cash account is used as an indicator of the ability to make forecasts (and therefore of management efficiency). In 2019, this indicator stood at around 1.7%22, down compared to 2018, confirming a satisfactory level of accuracy with regard to cash forecasts, despite the difficult context.
More wide-ranging estimates, covering a period of between thirty and sixty days, are instead shared by the aforementioned institutions on a weekly basis, facilitating monetary policy operations. More specifically, the Treasury sends its estimates regarding use of cash and government deposit balances for the period in question to the Bank of Italy, which in turn sends them to the ECB. As shown in Chart III.25, this forecasting objective is difficult to pursue due to the strong intra-
___
22 This value is calculated as the average of the percentage variations (in absolute terms) between the
estimated balance of the Cash Account at 6 p.m. on day t-1 and the actual balance recorded at 9 a.m. on day t. This percentage therefore measures the average forecasting error made each day.
| ITALIAN MINISTRY OF ECONOMY AND FINANCE | 91 |
month volatility of the account, the levels and cyclicality of which were confirmed as being similar to previous years23.
| CHART III.25: AVERAGE INTRA-MONTHLY CHANGES IN THE TREASURY’S AVAILABLE CASH - DIFFERENCES COMPARED WITH THE MONTHLY MINIMUM - 2019 (€ MILLION) |
|
| Source: MEF |
As the above chart shows, balances are close to the minimum in the first part of the month and decrease to reach the lowest level towards the middle of the month, due to the substantial payments that need to be made (e.g. payment of social security allowances). This trend is then reversed in the second part of the month, with a peak in the last ten days mainly due to the collection of tax revenues.
These sudden fluctuations complicate cash management activities, as the Treasury must also hold substantial amounts of cash for significant redemptions of maturing government securities, which are not always simultaneously offset by similar issuances, especially not for medium/long-term bonds. In fact, it is market practice for securities other than BOTs to normally be distributed in several tranches over a number of months, while redemptions are made through a single payment on the maturity date. The fluctuations shown in the above chart are therefore also attributable to securities being issued and, above all, to those maturing, which may sometimes contribute to the significant decline at the beginning and in the middle of the month.
The cash account’s volatility is not only recorded on an intra-monthly basis, but also indicates significant discrepancies from one month to the next. In this regard, the chart below shows the differences between the account’s maximum and minimum monthly balances over the last two years.
___
23 In this regard, please refer to section IV.4 in the Public Debt Reports for 2014-18.
| 92 | ITALIAN MINISTRY OF ECONOMY AND FINANCE |
III. PUBLIC DEBT MANAGEMENT IN 2019 |
| CHART III.26: DIFFERENCE BETWEEN THE MAXIMUM AND MINIMUM MONTHLY BALANCE OF THE TREASURY’S CASH ACCOUNT (€ MILLION) |
|
| Source: MEF |
Chart III.26 shows that, in 2019, volatility was in line with the previous year, except for the significant divergence in September. The differences highlighted are largely attributable to the different distribution of maturing government securities, but must also be interpreted in the light of the difficult market context; as already mentioned in the previous chapters, this difficult context prompted the Treasury to meet in advance part of its annual financing requirements in order to mitigate the risks deriving from any further unfavourable political and economic developments, which would otherwise have a negative impact on the cost of funding.
The significant daily and monthly fluctuations are therefore mainly due to the volatility and misalignment recorded with regard to cash flows.
The Treasury’s cash management activities therefore involved investing enough cash in the money market to reduce daily net fluctuations, at the same time as allowing the Treasury to hold an adequate supply of liquidity, in order to be able to prudently cope with redemptions and significant payments, even in changing market conditions.
Furthermore, the difficulty involved with investing excess liquidity in the short term has made it essential to pay particular attention to planning longer-term bilateral transactions, so as to limit use of the cash account held with the Bank of Italy as much as possible, as this is clearly one of the most expensive tools available.
Cash management operations and the market context
As already mentioned, the Treasury's market context in 2019 was heavily influenced by the ECB's monetary policy decisions. In fact, the abundance of available cash on the market and the consequent shortfall in demand among banks led to more cash being available in the Treasury's cash account held with the Bank of Italy (in line with previous years), given the fewer possibilities of holding the equivalent amount with the banking sector at a lower cost.
| ITALIAN MINISTRY OF ECONOMY AND FINANCE | 93 |
Average investments at OPTES auctions, which had decreased following the ECB's decisions in June 2014 and then reduced further after the programme was introduced to purchase government securities, had shown a slight recovery, particularly in the second half of 2018, as a result of the ECB gradually reducing its purchases. However, this increase abruptly came to an end when the Governing Council announced a number of expansionary measures at its meeting on 7 March 2019, introducing a new series of TLTRO operations and confirming that the capital repaid as part of the APP programme would be fully reinvested for as long as necessary. These decisions therefore reduced demand for liquidity at the Treasury's auctions once again; given the low level of participation, the Treasury deemed it appropriate to suspend its overnight auctions to invest liquidity, from August until the end of the year, thereby focusing its cash management activities on longer-term bilateral trading.
| CHART III.27: AVERAGE INVESTMENT AT DAILY OPTES AUCTIONS (€ MILLION) |
|
| Source: MEF |
Chart III.28 below compares the weighted average rate recorded at OPTES auctions and the EONIA rate (Euro OverNight Index Average) for the years 2015-19. As is normally the case, the gradual reduction in the ECB's official rates led to a gradual decline in money market yields.
| 94 | ITALIAN MINISTRY OF ECONOMY AND FINANCE |
III. PUBLIC DEBT MANAGEMENT IN 2019 |
| CHART III.28: TREND IN OVERNIGHT RATES ON THE MONEY MARKET AND WEIGHTED AVERAGE RATE AT OPTES AUCTIONS - 2015-19 (PERCENTAGE RATES) |
|
| Source: MEF, Bloomberg |
The spread between the EONIA rate and the weighted average return rate at auctions is attributable to the level of the minimum rate accepted by the Treasury for the transactions in question. Throughout 2019, the weighted average rate remained a few basis points above the EONIA rate, flattening out at the minimum accepted rate.
Investing the Treasury's liquidity
During 2019, the cash management tools used by the Treasury to invest its excess liquidity in the cash account were overnight auctions and medium/long-term bilateral transactions.
OPTES investment auctions were held daily until the beginning of August 2019, with the average daily amount invested in the overnight maturity sharply declining compared with the previous year: € 279 million in 2019 versus € 601 million in 2018. The low number of counterparties actively taking part in the auctions was also confirmed. As already mentioned, these conditions, mainly due to the high level of liquidity present in the system, prompted the Treasury to suspend these auctions in August until the end of the year.
This scenario can be clearly seen in Chart III.29, which highlights how, on a monthly basis, average investments at OPTES auctions drastically reduced starting from the second half of 2014, increased in the second half of 2018 and at the beginning of 2019, and then gradually reduced until the Treasury decided to suspend them in August.
| ITALIAN MINISTRY OF ECONOMY AND FINANCE | 95 |
| CHART III.29: AVERAGE MONTHLY INVESTMENT AT DAILY OPTES AUCTIONS - 2014-2019 (€ MILLION) |
|
| Source: MEF |
During 2019, also following the suspension of the OPTES auctions, the Treasury therefore deemed it appropriate to focus its cash management activities on medium/long-term bilateral transactions. This meant that the average stock of bilateral transactions increased, amounting to € 17.6 billion, compared with approximately € 13.7 billion in the previous year. Compared with 2018, the average duration of the aforementioned transactions remained substantially the same, standing at 24 days in 2019 versus 26 days in 2018. This change in operations allowed the Treasury to continue investing excess liquidity on the market, improving the degree of competition between operators and limiting the impact of negative rates on cash balances.
Once again in 2019, given the abundant level of liquidity available, the Treasury did not need to resort to OPTES funding operations.
| CHART III.30: BREAKDOWN OF THE TREASURY’S LIQUIDITY - AVERAGE VALUES FOR 2019 (€ MILLION) |
|
| Source: MEF |
| 96 | ITALIAN MINISTRY OF ECONOMY AND FINANCE |
III. PUBLIC DEBT MANAGEMENT IN 2019 |
Chart III.30 shows the breakdown of the Treasury's liquidity, with indication of the different types of investment, based on the allocations recorded over the course of the year. As can be seen, investments in overnight auctions were almost at zero, which is why the Treasury was prompted to suspend them. 34% of liquidity was invested in longer-term bilateral transactions, with the remaining share being deposited in the Cash account, the average balance of which was close to 66% of the total.
Table III.15 shows the Treasury's total cash at the end of each month in 2019, broken down into market transactions and the cash account.
| TABLE III.15: CASH ACCOUNT AND INVESTMENTS OF THE TREASURY'S LIQUIDITY AT THE END OF EACH MONTH - 2019 (€ MILLION) |
| Reference month | Balance of the cash account held with the Bank of Italy | OPTES liquidity operations (auctions + bilateral transactions) | The Treasury’s total available cash |
| January | 61,666 | 16,990 | 78,656 |
| February | 49,881 | 18,990 | 68,871 |
| March | 28,658 | 17,640 | 46,298 |
| April | 38,883 | 18,990 | 57,873 |
| May | 30,499 | 15,990 | 46,489 |
| June | 47,812 | 18,990 | 66,802 |
| July | 77,785 | 15,990 | 93,775 |
| August | 69,493 | 19,000 | 88,493 |
| September | 15,748 | 29,000 | 44,748 |
| October | 22,783 | 32,400 | 55,183 |
| November | 24,722 | 30,400 | 55,122 |
| December | 11,459 | 21,000 | 32,459 |
| Source: MEF |
This table shows substantial cash account balances, with values being on average higher than those recorded during the previous year. As is normally the case, this liquidity 'buffer’ was kept in place in order to cope with the significant redemptions of government securities, involving significant volumes, especially in the months of May, September and October; however, this buffer was also needed by the Treasury to bring forward part of its funding activity, in order to mitigate the risks deriving from a potential cost increase, linked to the economic and political context at the time.
Conclusions
In 2019, cash management activities were particularly complex, due to tightening money market conditions. At least during the first half of the year, the Treasury continued to guarantee its daily presence on the market through OPTES operations, in order to minimise the impact of negative rates on its available cash. During the second half of the year, it continued to pursue the objectives of stabilising its available funds and containing the cost of liquidity, by increasing bilateral transactions with qualified counterparties and ensuring average durations of around one month.
It should nonetheless be noted that, despite the growing difficulties involved with cash management, the effect of quantitative easing measures and the low level
| ITALIAN MINISTRY OF ECONOMY AND FINANCE | 97 |
of interest rates along the entire yield curve were altogether favourable for Italy's public debt management.
| 98 | ITALIAN MINISTRY OF ECONOMY AND FINANCE |
ANNEXES
ANNEX 1
The Treasury's involvement in international discussions on debt management
Please find below a list of the main ways in which the Treasury is involved in international discussions on public debt management issues:
| • | Regular liaison with European DMOs is ensured as part of the special subcommittee (European Sovereign Debt Markets - ESDM) of the EU Economic and Financial Committee (EFC); the EFC has an advisory role vis-à-vis the European Commission and the Council of the European Union and is appointed to define actions for the coordination of Member States’ economic and financial policies. |
| • | Regular participation in the working groups organised by supranational institutions such as the OECD, the IMF and the World Bank. The Treasury is also involved in the OECD’s ‘Working Party on Public Debt Management’ (WPDM)1, which constitutes a stable platform to compare the public debt management policies and techniques of the organisation's member countries, as well as in the ‘Government Borrowers’ Forum’ organised annually by the World Bank for the 40 participating countries to share their practical experiences. The Treasury’s standing with regard to public debt management is implicitly recognised by the ‘Public Debt Management Network’2, a joint initiative promoted by the OECD, the World Bank and the Italian Department of the Treasury (the only government institution alongside these two multilateral institutions), the aim of which is to share knowledge, information and research on public debt management issues. |
| • | Another key opportunity for institutional coordination is the Treasury's participation in Eurostat statistical working groups and its contribution to drawing up the six-monthly notifications as part of the Excessive Deficit Procedure (EDP), especially in relation to entries being correctly recorded that are directly linked to public debt, in accordance with the harmonised European System of Accounts (ESA). By overseeing these accounting aspects, the Treasury is able to keep all relevant profiles under control, also moving beyond general |
___
1 The WPDM began to meet as an OECD working group of public debt management experts in 1979. Italy's Treasury has continuously contributed to the annual work of the WPDM since 1985 and is part of the Steering Group established in 2003. Currently, the DMOs of all 36 OECD countries contribute to the work of the WPDM, as do the International Monetary Fund, the World Bank and the European Commission, as observers.
2 Please refer to www.publicdebtnet.org
| ITALIAN MINISTRY OF ECONOMY AND FINANCE | 99 |
considerations of a purely financial nature and with a direct impact on the state budget.
| • | Finally, the Treasury attends the annual ‘International Retail Debt Management Conference’, made up of the DMOs of a limited number of countries; this conference is specifically dedicated to the operational issues involved with the placement of government securities among non-institutional investors and, every two years, it is supported by the World Bank to include emerging countries in its comparisons. |
| 100 | ITALIAN MINISTRY OF ECONOMY AND FINANCE |
ANNEX 2
The Department of the Treasury's Public Debt Directorate: organisational structure
The Department of the Treasury's ‘Second Directorate’, dedicated to public debt management, is made up eleven offices. This Directorate carries out its tasks by working closely together with other institutional structures, such as the other directorates within the Department of the Treasury, the State General Accounting Department and the Bank of Italy. The various responsibilities of the Public Debt Directorate are shown in the chart below, grouped according to function.
| THE ORGANISATION OF THE PUBLIC DEBT DIRECTORATE |
|
The Directorate has a front, middle and back office, as is typically the case for financial market operators and other Debt Management Offices (DMOs) managing public debt in advanced countries.
The Front Office covers all activities in direct contact with the market. These primarily involve all issuance activities that define primary market operations, regarding both the domestic and foreign market; said issuance activities take into account funding requirements, from market analysis to the decisions as to which type of securities to offer and the relative placement procedures and time frames.
| ITALIAN MINISTRY OF ECONOMY AND FINANCE | 101 |
Front Office activities also include the very short-term management of liquidity and extraordinary debt exchange and buyback transactions, as well as derivative transactions.
Front Office activities also entail monitoring the various aspects of the government securities secondary market, as well as selecting and assessing dealers specialising in government securities.
The Middle Office is responsible for risk management3, carrying out all the necessary analyses, including legal and market analysis activities, to define the cost-risk profile that must drive and/or restrict Front Office operations. The various issuance portfolios identified, with their respective cost and risk combinations, (which, for many years4, have been based on a specific software that allows for ‘Cost-at-Risk’ analysis based on a probabilistic model), are used by the Front Office to define the most appropriate issuance and hedging strategies. Risk management activities also include the monitoring of counterparty risk, determining the constraints that must be respected in terms of both derivative portfolio management and liquidity investment operations.
Middle Office activities also include multi-annual forecasts on interest expenditure and general government debt to be used for policy documents and institutional reporting purposes5.
The work carried out by the Back Office includes preparing issuance decrees and the more strict accounting activities relating to procedures to ensure timely payments.
All debt management activities are underpinned by the work to prepare the relative legal documentation for loans and derivatives, as well the drafting of prospectuses, both for international issuance programmes (Global, MTN) and for other securities placed with methods other than auctions. Likewise, since the Public Debt Directorate falls within the administrative context of the Department of the Treasury, it also carries out all the other legal-administrative and accounting tasks common to ministerial organisations.
The Public Debt Directorate also carries out other tasks of crucial importance. These include the very important activities that may be classed under “communications”, focusing on real-time information regarding issuances, as well as statistics about the structure, dynamics and composition of debt represented by government securities and the relative market. The main channel for these activities is the public debt website. These activities also include the statistics stemming from the monitoring of the debt and derivatives exposure of local authorities.
___
3 For a more detailed assessment of best practices regarding Sovereign Debt Portfolio Risk Management, please refer to the International Monetary Fund's Working Paper “A Primer on Managing Sovereign Debt-Portfolio Risks”, produced in partnership with dozens of DMOs, including the Italian Treasury.
4 See the information contained in Annex 3 below.
5 In particular, the Economic and Financial Document (‘DEF’) provided for by Italian Law no. 39 of 7 April 2011 (in relation to which Directorate II contributes to Section I “Italy's Stability Programme” and Section II “Analyses and Trends in Public Finances”), the DEF Update, the Draft Budgetary Plan (‘DPB’) as required by EU Regulation no. 473/2013, the Annex to the so-called ‘Quarterly Cash Report’ (referred to by Art. 14 of Italian Law no. 196/2009 as the ‘Report on the General Government’s Consolidated Cash Account’), the Report to Parliament on the sinking fund for government securities (an annex to the General Financial Statement of the Italian State) as referred to by Art. 44, paragraph 3, of Italian Presidential Decree no. 398/2003, and the half-yearly Report to the Court of Auditors on public debt management pursuant to the Italian Ministerial Decree dated 10/11/1995.
| 102 | ITALIAN MINISTRY OF ECONOMY AND FINANCE |
In addition to this monitoring, the Directorate is also responsible for any extraordinary operations relating to local authorities’ debt, as governed by specific regulations.
The role of liaising with external institutions, in particular at international level, is also of great importance; this includes: contributing to the coordination of public debt managers in Europe as part of a dedicated subcommittee (European Sovereign Debt Markets - ESDM) of the EU Economic and Financial Committee; taking part in Eurostat statistical working groups and contributing to preparing the six-monthly notifications as part of the Excessive Debt Procedure (EDP); participating in the various working groups of supranational institutions, such as the OECD and the IMF; the network between the Italian Treasury, the OECD and the World Bank regarding public debt management issues; relations with institutional investors and rating agencies6.
Finally, across-the-board IT services refer to all offices, since almost all the Directorate's work processes are computerised; some are shared by all government departments, with the same applications for the Department of the Treasury or for the entire Ministry, and others are specific to public debt, featuring dedicated tools and applications7. The latter are structured on the basis of the Directorate's specific needs8 and use both internal information and data flows from the Bank of Italy, from Monte Titoli S.p.A. - the company that guarantees the centralised management of government securities - or from the company that manages the electronic government securities market (MTS S.p.A.).
___
6 For more detailed information on when and how the Italian Treasury takes part in international discussions in this regard, please refer to Annex 1 of this Report.
7 Databases and applications are designed and maintained in collaboration with the Department of the Treasury's IT Coordination department and with SOGEI, the supplier of digital architecture and support services. Società Generale d’Informatica S.P.A. (‘SOGEI’) is an Information Technology company that is 100% owned by the Italian Ministry of Economy and Finance.
8 For example, please refer to the particularly significant aspects involved with developing and managing ‘SAPE’, the Issuance Portfolio Analysis Software, as illustrated in Annex 3 below.
| ITALIAN MINISTRY OF ECONOMY AND FINANCE | 103 |
ANNEX 3
SAPE (Issuance Portfolio Analysis Software)
The mathematical models and corresponding software (SAPE - Issuance Portfolio Analysis Software) used by the Treasury to support its management choices regarding the public debt portfolio are the result of a research project, made possible thanks to the FIRB 2003 funding received from the Italian Ministry of Education, University and Research (D.D. 2186-Ric 12/12/2003), and issued by the Institute for Calculation Applications of the Italian National Research Council (‘CNR’) (which heads up a group that also includes other academic institutions, such as Bocconi University, the University of Milan and Tor Vergata University of Rome); this funding was granted as part of the strategic programme entitled "Humanities, economics and social sciences", project objective "Public debt management". In the early 2000s, this project launched the modelling and software development work that led the Department of the Treasury to adopt a tool that could support it in making decisions regarding public debt management; by using stochastic simulation techniques, this tool could analyse the cost and risk profile of government securities portfolios.
Over the years, this model underwent various development phases, managed in collaboration with the Department of the Treasury and the various bodies involved, currently made up of the “M. Picone” Institute for Calculation Applications (‘IAC’) of the Italian National Research Council (‘CNR’) and the Cambridge Judge Business School at the University of Cambridge, as well as SOGEI, the Italian Treasury's IT solutions provider for the public administration.
The mathematical models and corresponding software are subject to continuous updates in order to take into account ongoing developments of the reference techniques. This allows for the various databases to be integrated in an increasingly comprehensive way, as well as taking into account the various management activities that may affect future scenarios. Since the end of 2017, the outstanding debt database used by SAPE has been made up of domestic securities, derivatives and securities in USD.
The main objective of the portfolio analysis is to measure debt servicing costs on an annual accrual basis, in accordance with ESA 2010 rules. The choice between different possible issuance portfolios must be weighted by taking into account both the cost, in terms of interest expenditure, and the interest rate risk for each individual portfolio compared with a representative sample of how interest rates may evolve.
For each possible issuance portfolio, it is possible to simulate the cost function distribution with respect to all the scenarios regarding how interest rates may evolve. This distribution simulation provides all the necessary information about costs (i.e. where the distribution is positioned) and risks (the scale of the distribution) for the portfolio in question. SAPE calculates different summary cost indicators (average cost, CaR - Cost at Risk-, maximum cost, etc.) and risk indicators (standard cost deviation, relative CaR, ES - Expected Shortfall - etc.), allowing for the possible issuance portfolios to be studied in as much detail as possible.
| 104 | ITALIAN MINISTRY OF ECONOMY AND FINANCE |
After choosing the cost and risk functions, a consolidated portfolio selection technique involves building an “efficiency frontier”. This “frontier” is identified by first drawing a Cartesian graph in which each portfolio is represented by a point whose coordinates record its respective risk and cost, thereby providing a summary of their overall dynamic evolution. Portfolios are classed as “efficient” when each fixed risk value corresponds to the lowest cost. Selecting one of the best portfolios, i.e. those that can be classed as efficient, is based on (i) the debt manager's risk aversion or risk appetite, in line with the Public Debt Management Guidelines regarding the strategy for the issuance and management of government securities (these guidelines indicate, inter alia, the approach to be adopted in order to fulfil the Treasury's strategic requirements regarding how to manage the main risks), and (ii) how practical/feasible each individual portfolio is with respect to investors’ needs and the evolution of market conditions. The efficiency frontier is normally created by observing the cost and risk variables at the end of the prediction interval.
This model shows how the cost distribution evolves over time for each individual portfolio. This allows for accurate checks into the evolution of the selected costs and risks, making it possible for the decision maker to choose the portfolio whose temporal evolution profile best matches the policy and strategy choices in question.
The model underwent initial significant development when mutual guarantee agreements were introduced for derivative instruments9; this development allowed for the estimate of effects in terms of Credit Value Adjustment and, as a result, in terms of the guarantees to be established/received as part of the Credit Support Annexes, to be included in the simulations.
The SAPE software’s central element is the module that generates the scenarios regarding how interest rates will evolve. This module interacts with the cost and risk calculation module in a completely transparent way and also offers the possibility to use a range of stochastic models to generate medium/long-term scenarios for interest rates and inflation rates; above all, this is useful in order to assess the expected performance, in terms of cost-risk analysis, of the various strategies relating to public debt issuance policies. More generally speaking, by generating scenarios, expected exposure can be quantified with respect to yield-curve volatility. Joint estimate models for the forward interest rate structure include government and break-even inflation (BEI) curves and swap curves (Euro and USD).
A five-year forecast period is generally used for cost-risk analyses on issuance portfolios. The scenarios generated by the model’s stochastic simulation are in line with historical data in terms of the statistical properties of the yield curves, particularly in terms of the variance calculated for the different maturities and covariance between nominal rates and BEI and between nominal and swap rates.
___
9 For further information in this regard, please refer to Annex 4 below.
| ITALIAN MINISTRY OF ECONOMY AND FINANCE | 105 |
ANNEX 4
Derivatives used by the Treasury: role, types and collateralisation system
Introduction
In principle, the derivatives sector is considerably vast, encompassing transactions that have very different structures and purposes, used in almost all areas of finance and the economy. Sovereign issuers such as the Italian Treasury only use a few types of derivatives, for specific risk management objectives underlying its debt portfolio, with particular regard to interest rate and exchange rate risks. Please find below a description of (i) the role played by derivatives in managing Italy’s public debt; (ii) the types of transactions that are used; and, (iii) the collateralisation system.
The role of derivative transactions used by the Treasury
As highlighted at the beginning of this Report10, the objective of curbing debt costs at the same time as maintaining an acceptable level of risk inherent in the existing debt structure, imposed upon DMOs by international best practices, does not end upon issuance and in relation to the market conditions at the time. This objective is instead achieved in a dynamic way, through ongoing actions that regard the entire portfolio and continue even after issuance.
In addition to debt exchange and buyback transactions, DMOs may also use derivatives to mitigate these risks after issuance.
Any mismatch between the structure of the portfolio resulting from the outcome of capital market placements and the management objectives considered preferable11 can thus be rectified with the use of derivatives, increasing the DMO’s compliance with policy objectives and partly separating the achievement of these objectives from the performance recorded at the time of placement.
Furthermore, while issuance activity is managed with continuity and predictability, in order to create the technical prerequisites of the necessary investment liquidity for potential buyers, derivative transactions, on the other hand, do not have a pre-defined timetable. In fact, derivative contracts may be signed at any time, when market conditions allow for DMOs’ specific needs to be met; in this way, they contribute to removing a certain degree of rigidity from DMOs’ management activities.
___
10 For an indispensable, more in-depth examination of the objectives pursued by public debt managers, also using derivative instruments, please refer to Chap. I.1 above, as well as the documents mentioned therein.
11 A document drawn up jointly by best practice experts from the OECD, the IMF and the World Bank in 2008 highlighted the practice adopted in this regard by many sovereign debt managers, emphasising the fact that: "the implementation of the debt strategy may include the use of derivatives to separate funding decisions from the optimal portfolio composition decision, reduce the cost of borrowing, and manage risks in the portfolio (in particular, interest rate refixing risk and refinancing risk)". - OECD (2008) “Use of Derivatives for Debt Management and Domestic Debt Market Development: Key Conclusions”, available at http://www.oecd.org/fr/finances/dette-publique/39354012.pdf.
| 106 | ITALIAN MINISTRY OF ECONOMY AND FINANCE |
In authorising the use of derivatives on an annual basis, the Framework Decree states that they should contribute to achieving the general management objectives of curbing overall borrowing costs and protecting against market risks and refinancing risks, based on the information available and market conditions.
From an operational point of view, management of the derivatives portfolio must also take into account two main aspects: (i) the guarantee agreements that assist these transactions, and (ii) the existing constraints for certain types.
With regard to the first aspect, please refer to the specific paragraph below on the objectives and characteristics of mutual guarantee agreements (collateralisation).
With regard to the second aspect, in September 2014, Eurostat issued new rules on how to record the market value of derivatives, only applicable to swaps arising from the restructuring of pre-existing swaps or to swaptions being exercised. In fact, for these specific cases, it was established that these transactions shall affect debt stock levels from an accounting point of view (despite them not entailing actual recourse to the capital market).
The types of derivative contracts used by the Treasury
Please find below the functional characteristics of the three types of derivative transactions used to manage the Treasury's debt portfolio.
| − | Cross-currency swaps (‘CCS’) are used to synthetically convert liabilities generated by bond issues denominated in a foreign currency into euro-denominated liabilities, with no alterations to the foreign-currency-denominated security purchased by the investor. These instruments therefore eliminate the exchange rate risk for the Treasury and make it possible to directly compare the funding costs obtained on international markets with the cost of domestic debt. As outlined in this Report, the international issuance programme allows for the institutional investor base for Italian public debt to be diversified and to obtain competitive cost conditions compared with those for domestic debt. |
| − | Interest rate swaps (‘IRS’) involve an exchange of flows involving a fixed rate being paid versus a floating rate being received, usually on long-term maturities. With a view to managing the debt portfolio in a comprehensive way, this type of derivative extends the financial duration of debt and acts as a precaution against expected interest rate increases. As already mentioned, this choice is in line with the need to manage the portfolio’s cost-risk trade-off and, in particular, with the specific characteristics of Italian public debt management, as described in Chapter I of this Report. |
| − | Finally, receiver swaptions12 are derivative contracts that act in a similar way to IRS, in that they extend the financial duration of debt and mitigate interest rate risk, but they also provide cash benefits deriving from the sale of an option. Options sold by the Treasury give the counterparty the right to enter into an |
___
12 A receiver swaption is an option that is sold/purchased to/by a counterparty that entitles the purchaser to enter into a swap contract at a future date, whereby the purchaser will pay a floating rate and receive a fixed rate on a given notional amount.
| ITALIAN MINISTRY OF ECONOMY AND FINANCE | 107 |
interest rate swap agreement, at a future date, under pre-defined conditions, as long as a lump sum (premium) is paid to the Treasury when the contract is signed. The IRS generated by sold receiver swaptions being exercised, like those that have not been sold as an option, are generally medium/long-term swaps, whereby the Treasury pays a fixed rate and receives a floating rate starting from a given date if the counterparty exercises its option. Swaptions are exercised if the market conditions are favourable for the Treasury's counterparty as at the date of the option being exercised (i.e. interest rates have fallen below the market expectations at the time the relative contract was signed); any IRS generated by the option being exercised shall nonetheless act as medium/long-term insurance for the Treasury.
Collateralisation agreements - objectives and characteristics
Collateralisation agreements were introduced for the derivative transactions carried out by the Italian government with two objectives in mind.
The first objective was to align with standard practices in the derivatives market. In fact, for all financial instruments, the market value of the transaction (Mark to Market) may significantly vary in terms of size and whether it is positive or negative, depending on market trends. For government bonds and securities, these variations affect, inter alia, the credit risk borne by the security holder13, and therefore how they are accounted for and the relative allocations to provisions. For derivatives (for example, interest rate derivatives), on the other hand, changes in the transaction value may generate potential credit exposure for the party (the government or counterparty for a derivative) for whom the instrument has a positive value at a given moment in time. This means that, over time, either of the two parties may become, alternatively, the potential creditor/debtor of a sum, which may change significantly in terms of its size and whether it has a positive or negative value; however, said sum shall only become 'real’ if one of the two counterparties goes bankrupt or if the transaction is closed before its natural expiry (by definition, the market value at the transaction date is equal to zero).
While the interbank derivatives market has always been a collateralised market, sovereigns’ use of guarantee schemes to manage the credit exposure associated with derivative contracts has only been examined relatively recently. On the one hand, the 2008 crisis revealed the risks involved with governments being exposed vis-à-vis the banking sector without guarantees. On the other hand, the subsequent and consequent tightening of regulatory constraints on banks gradually made it more expensive for the latter to maintain significant, unsecured exposure vis-à-vis governments, and, beyond certain limits, this even became unsustainable without capitalisation measures. Governments therefore also began using the market standard of mutual guarantee mechanisms as part of their ongoing operations.
The second objective regards the regulatory constraints on banks: given these obligations, the creation of a collateralisation system gives the Italian government the possibility to implement new hedges at sustainable costs (for example, hedges
___
13 By contrast, the issuer, by definition, is not exposed to any credit risk.
| 108 | ITALIAN MINISTRY OF ECONOMY AND FINANCE |
against exchange rate risk in the case of securities denominated in a foreign currency being issued).
It should also be noted that, by freeing up the resources that banking regulations require to be allocated to such exposure, the presence of collateral can indirectly allow the Italian government to strengthen the support of these counterparties for Italy's public debt, on both the primary and secondary market.
Guarantee agreements (‘Credit Support Annexes’ or ‘CSA’) are regulated by Italian Ministerial Decree no. 103382 of 20 December 2017 ("Guarantee Decree") and, indeed, are annexes to the ISDA Master Agreement ('ISDA MA’) in place with each counterparty.
The Public Debt Directorate has drawn up a model governed by Italian law, in line with the regulations governing each ISDA MA signed by the Italian government and all the relative confirmations. When drawing up the contracts to be signed, the Directorate in question based its choices, on the one hand, on public finance constraints, pursuant to Art. 6, paragraph 3, of the "Guarantee Decree", and, on the other, on its own organisational requirements, which led to a bespoke CSA being drafted. The contractual specifications defined in the CSA refer to margining frequency, the minimum amount and the rounding of margins.
The resources necessary to pay the guarantees are allocated to a specific expenditure item, established by Italy’s 2019 Budget Law and called "Expenses deriving from guarantee transactions on derivatives exposure"; from this expenditure item, the guarantees are transferred to a special accounting system specifically set up for this purpose. Pursuant to Art. 5 of said Decree, the guarantee must be made up of cash in euro.
CSAs may be distinguished between those connected with previous derivative transactions and those relating to new transactions. The initial phase focused on pre-existing derivative instruments with a number of counterparties, which resulted in the latter having significant credit exposure vis-à-vis the Italian government, above a threshold set at € 4 billion (as per the joint provision of Art. 6, paragraph 1, letter b), of the "Guarantee Decree" and Art. 4, paragraph 4, of the 2018 "Framework Decree"). As at 31 December 2017, there were only very few counterparties that met the requirements to sign a guarantee agreement for derivative positions already in the Italian government’s portfolio.
A collateral structure was therefore defined, aimed at limiting the outgoing amounts for the Italian government. For each agreement, full collateralisation is not required upon signing, as the annual guarantee amounts to be paid to the counterparty are defined within a narrow ‘corridor’, which tends to expand as time goes by. According to estimates, the Italian Treasury will have to pay limited and almost constant amounts over a considerable number of years; said amounts will gradually tend to hedge the counterparty’s entire credit exposure vis-à-vis the Treasury. The expenditure commitments are therefore not only very limited compared with the overall exposure of the individual portfolios, but are also set over a significant period of time, starting from when the agreement in question is signed. The margin to pay shall only be less than the expected amount, with a subsequent reduction in outgoing cash flows for margining purposes, if there are substantial increases in the interest rate swap curve, leading to a reduction in the overall mark-to-market of the collateralised portfolio. Time frames for the
| ITALIAN MINISTRY OF ECONOMY AND FINANCE | 109 |
aforementioned ‘corridor’ to be applied to the cash flows is based on the need to mediate between the sustainability of the guarantee from the point of view of public finances (which makes it essential, at least in the early years, to limit said time frames) and the need to provide counterparties with a guarantee on their overall exposure vis-à-vis the Italian government within a reasonable number of years.
The work to prepare the guarantee agreement required a significant amount of time, which was necessary in order to carry out the legal analysis and the strictly financial analysis, with the latter aimed at defining, with each counterparty, the appropriate amount of the benefit to be paid to the Treasury, pursuant to Art. 6, paragraph 2, of the Guarantee Decree. All CSAs therefore only became operational in the second half of 2018 and only with regard to pre-existing transactions with the banks that met the relative requirements.
The second phase, on the other hand, involved signing CSA agreements with all dealers specialising in government securities, with reference to any new transactions14. This phase was completed in the second half of 2018, with a residual part being completed at the beginning of 2019. These agreements referred exclusively to derivative transactions carried out after the relative agreement was signed. These agreements were signed pursuant to Art. 6, paragraph 1, lett. a), of the "Guarantee Decree" with the same format being used for each individual counterparty, thereby meeting uniformity requirements with a view to treating all counterparties equally.
___
14 Primarily, derivative contracts aimed at hedging new issuances in a foreign currency.
| 110 | ITALIAN MINISTRY OF ECONOMY AND FINANCE |
STATISTICAL ANNEX
INFORMATION SOURCES ABOUT PUBLIC DEBT AVAILABLE AT THE TREASURY’S WEBSITE
The Treasury’s website hosts a dedicated area about public Debt (http://www.dt.tesoro.it/en/debito_pubblico/index.html), featuring a wide range of both qualitative and quantitative information about each one of the operational issues included in this Report.
Information available in this area provides details about (but is not limited to) issuance timetable and official communications, auction results, securities’ features and relevant legal framework, Specialist’s assessment and extraordinary transactions, available cash as well as documents of a more general nature, as the several releases of this Report or the annual Guidelines for the public Debt management.
The area also includes a data-rich statistical Section (http://www.dt.tesoro.it/en/debito_pubblico/dati_statistici/) providing quantitative information about all public Debt topics, namely featured in the Quarterly Bulletin, including trends recorded in the government securities’ portfolio composition, coupons, yields at issuance and average life, risks indicators and derivatives portfolio.
The dataset is steadily updated according to operations, while also keeping past data series available.
The following pages complete the information already provided in this Report by featuring selected Charts and Tables about some of the information available in the website.
| ITALIAN MINISTRY OF ECONOMY AND FINANCE | 111 |
TABLES AND CHARTS
| GROSS ISSUES AT NOMINAL VALUE – SECURITIES UP TO TWO YEARS (€ MILLION) |
| | BOT | CTZ |
| | flexible | 3 month | 6 month | 12 month | 24 month |
| Jan-16 | - | - | 13.100 | 7.000 | 3.138 |
| Feb-16 | - | - | 6.875 | 6.500 | - |
| Mar-16 | - | - | 6.600 | 6.600 | 3.428 |
| Apr-16 | - | - | 6.600 | 6.075 | - |
| May-16 | - | - | 6.000 | 6.500 | 2.500 |
| Jun-16 | - | - | 6.406 | 6.500 | - |
| Jul-16 | - | - | 6.488 | 6.500 | 2.875 |
| Aug-16 | - | - | 6.000 | 6.600 | - |
| Sep-16 | - | - | 6.600 | 6.750 | 2.500 |
| Oct-16 | - | - | 6.000 | 6.250 | - |
| Nov-16 | - | - | 6.000 | 6.000 | 4.550 |
| Dec-16 | - | - | - | 4.750 | - |
| Jan-17 | - | - | 13.000 | 7.700 | 2.500 |
| Feb-17 | - | - | 6.150 | 6.548 | 2.875 |
| Mar-17 | - | - | 6.500 | 6.500 | 2.875 |
| Apr-17 | - | - | 6.600 | 6.000 | 2.300 |
| May-17 | - | - | 6.000 | 7.150 | 3.554 |
| Jun-17 | - | - | 6.750 | 6.500 | 2.500 |
| Jul-17 | - | - | 6.500 | 6.750 | 2.300 |
| Aug-17 | - | - | 6.000 | 6.692 | 2.300 |
| Sep-17 | - | - | 6.000 | 6.500 | 1.556 |
| Oct-17 | - | - | 6.000 | 6.000 | 3.900 |
| Nov-17 | - | - | 5.500 | 5.510 | 2.000 |
| Dec-17 | - | - | - | 4.750 | - |
| Jan-18 | - | - | 6.500 | 7.500 | 4.501 |
| Feb-18 | - | - | 6.500 | 6.500 | 2.300 |
| Mar-18 | - | - | 6.000 | 6.500 | 3.830 |
| Apr-18 | - | - | 6.000 | 6.000 | 2.300 |
| May-18 | - | - | 6.000 | 6.500 | 1.750 |
| Jun-18 | - | - | 6.050 | 6.600 | 2.013 |
| Jul-18 | - | - | 7.150 | 6.600 | 2.051 |
| Aug-18 | - | - | 6.450 | 6.000 | 2.013 |
| Sep-18 | - | - | 6.103 | 6.600 | 2.013 |
| Oct-18 | - | - | 6.050 | 6.000 | 3.900 |
| Nov-18 | - | - | 6.000 | 5.500 | 2.500 |
| Dec-18 | - | - | 6500 | 6.050 | - |
| Jan-19 | - | - | 14.300 | 7.700 | 5.046 |
| Feb-19 | - | - | 6.000 | 6.500 | 2.588 |
| Mar-19 | - | - | 6.600 | 6.525 | 2.300 |
| Apr-19 | - | - | 6.600 | 6.102 | 4.550 |
| May-19 | - | - | 6.810 | 6.500 | 2.875 |
| Jun-19 | - | - | 6.600 | 6.747 | 2.588 |
| Jul-19 | - | - | 6.500 | 7.150 | 2.300 |
| Aug-19 | - | - | 6.600 | 7.150 | 2.300 |
| Sep-19 | - | - | 7.150 | 7.150 | 1.598 |
| Oct-19 | - | - | 7.150 | 6.600 | 3.000 |
| Nov-19 | - | - | 6.500 | 5.834 | 2.013 |
| Dec-19 | - | - | 6.072 | - | - |
| 112 | ITALIAN MINISTRY OF ECONOMY AND FINANCE |
| ITALIAN MINISTRY OF ECONOMY AND FINANCE | 113 |
| GROSS ISSUES AT NOMINAL VALUE – SECURITIES EXCEEDING TWO YEARS (€ MILLION) |
| | CCTeu | BTP €i | BTP | BTP Italia |
| | 5-7 year | 5 year | 10 year | 4-6-8 year | 30 year | 3 year | 5 year | 7 year | 10 year | 15 year | 20 year | 30 year | 50 year | 4-6-8 year |
| Jan-16 | 1.637 | - | 550 | - | - | 2.001 | 2.394 | 3.450 | 2.588 | 2.013 | - | - | - | - |
| Feb-16 | 2.013 | - | - | 946 | - | 2.240 | 2.588 | 2.875 | 3.450 | - | - | 9.000 | - | - |
| Mar-16 | 2.300 | - | - | - | 293 | 2.108 | 2.588 | 5.200 | 5.200 | 1.725 | - | - | - | - |
| Apr-16 | 1.725 | - | 863 | - | - | 3.501 | 4.214 | 2.821 | 3.047 | - | 6.500 | 1.374 | - | 8.014 |
| May-16 | 3.771 | 3.000 | - | - | - | 2.548 | 2.293 | 2.723 | 2.501 | 1.500 | - | - | - | - |
| Jun-16 | 2.300 | - | - | 805 | - | 2.000 | 2.502 | 3.000 | 3.002 | - | - | 1.259 | - | - |
| Jul-16 | 2.013 | 1.150 | - | - | - | 2.069 | 2.875 | 2.504 | 2.875 | 1.251 | 1.750 | - | - | - |
| Aug-16 | 2.300 | - | - | - | - | - | 2.300 | - | 5.850 | - | - | - | - | - |
| Sep-16 | 1847 | - | - | 939 | - | 2.000 | 3.231 | 4.000 | 3.365 | - | 1.250 | - | - | - |
| Oct-16 | 2.300 | - | 669 | - | - | 4.000 | 4.001 | 2.506 | 2.875 | 2.065 | - | - | 5.000 | 5.220 |
| Nov-16 | 3.250 | 792 | - | - | 414 | 2.750 | 2.750 | 2.250 | 2.500 | - | - | 1.312 | - | - |
| Dec-16 | 3.400 | - | - | - | - | - | 2.013 | - | 1.725 | - | - | - | - | - |
| Jan-17 | 2.013 | - | - | 1.105 | | 3.001 | 2.500 | 2.750 | 1.725 | 6.000 | 1.500 | - | - | - |
| Feb-17 | 2.588 | 828 | - | - | - | 3.163 | 3.163 | 2.875 | 5.200 | - | - | 1.516 | - | - |
| Mar-17 | 2.196 | - | 3.000 | - | - | 2.750 | 5.200 | 3.500 | 2.300 | 1.387 | - | - | - | - |
| Apr-17 | 2.661 | 738 | - | 512 | - | 5.850 | 2.251 | 2.875 | 2.500 | - | 2.400 | | 750 | - |
| May-17 | 4.550 | - | 984 | - | 472 | 2.819 | 2.875 | 2.588 | 3.163 | - | - | 1.251 | - | 8.590 |
| Jun-17 | 2.013 | 539 | - | - | - | 2.875 | 3.450 | 3.450 | 3.163 | - | - | 6.500 | - | - |
| Jul-17 | 1.725 | - | 1.438 | - | - | 2.838 | 2.875 | 2.695 | 5.047 | 1.471 | - | - | - | - |
| Aug-17 | 1.725 | - | - | - | - | - | 4.891 | - | 2.588 | - | - | - | - | - |
| Sep-17 | 2.013 | 791 | - | 709 | - | 2.501 | 3.450 | 4.001 | 2.875 | - | 1.500 | - | - | - |
| Oct-17 | 1.725 | - | 1.438 | - | - | 5.200 | 2.875 | 2.300 | 2.300 | - | - | 1.713 | - | - |
| Nov-17 | 4.550 | - | - | - | - | 2.002 | 2.875 | 2.729 | 2.875 | 1.577 | - | | - | 7.107 |
| Dec-17 | 2.013 | - | - | - | - | - | - | - | 2.013 | - | - | - | - | - |
| Jan-18 | 2.001 | 914 | | 836 | - | 3.000 | 2.414 | 3.431 | 1.500 | - | 9.000 | - | - | - |
| Feb-18 | 2.300 | 1.008 | 1.292 | - | - | 2.875 | 1.798 | 3.090 | 5.463 | - | - | 2.250 | 883 | - |
| Mar-18 | 1.973 | 3.250 | | - | - | 2.875 | 5.200 | 5.200 | 2.300 | 1.290 | - | - | - | - |
| Apr-18 | 2.300 | - | 1.334 | 708 | - | 5.200 | 2.875 | 2.875 | 3.450 | - | 1.464 | 1.575 | - | - |
| May-18 | 3.502 | - | 604 | - | - | 3.116 | 2.750 | 2.875 | 3.000 | 1.552 | - | - | - | 7.709 |
| Jun-18 | 2.300 | 964 | 1.270 | - | 494 | 2.300 | 2.013 | 2.467 | 2.158 | - | - | 1.045 | | - |
| Jul-18 | 2.300 | - | - | - | - | 2.300 | 2.000 | 2.300 | 2.688 | 1.500 | 1.500 | - | - | - |
| Aug-18 | 1.725 | - | - | - | - | - | 2.300 | - | 4.999 | - | - | - | - | - |
| Sep-18 | 755 | - | - | 1.200 | - | 2.526 | 3.750 | 4.856 | 2.250 | - | - | 1.800 | - | - |
| Oct-18 | 1.250 | - | 1.146 | - | - | 4.550 | 2.000 | 1.725 | 2.000 | 1.130 | - | - | - | - |
| Nov-18 | 1.060 | 1.000 | - | - | - | 2.758 | 2.276 | 1.898 | 2.750 | - | 1.500 | - | - | 2.164 |
| Dec-18 | 702 | - | - | - | - | - | 2300 | - | 2.588 | - | - | | - | - |
| Jan-19 | 863 | - | 845 | - | 486 | 3.450 | 2.300 | 2.588 | 1.738 | 10.000 | - | 1.500 | - | - |
| Feb-19 | 3.575 | 977 | - | 481 | - | 2.251 | 3.163 | 2.588 | 2.875 | - | - | 8.000 | - | - |
| Mar-19 | 1.250 | - | 1.070 | - | - | 5.200 | 2.000 | 2.875 | 4.000 | - | 1.500 | - | - | - |
| Apr-19 | 1.150 | - | - | 1.045 | - | 2.875 | 4.224 | 4.875 | 3.163 | 1.800 | - | - | - | - |
| May-19 | 1.150 | 728 | 709 | - | - | 2.750 | 2.875 | 2.500 | 3.450 | - | - | 1.755 | - | - |
| Jun-19 | 750 | - | 745 | - | 422 | 3.163 | 1.886 | 1.735 | 2.750 | 1.800 | 6.000 | - | - | - |
| Jul-19 | 1.150 | 444 | - | 808 | - | 3.079 | 2.588 | 2.500 | 3.163 | - | - | - | 3.000 | - |
| Aug-19 | 1.280 | - | - | - | - | - | 3.163 | - | 3.738 | - | - | - | - | - |
| Sep-19 | 1.150 | - | - | - | 450 | 4.001 | 2.588 | 2.588 | 4.000 | - | - | 1.800 | - | - |
| Oct-19 | 841 | - | 4.000 | - | - | 3.163 | 3.776 | 2.588 | 3.129 | - | 970 | 830 | - | 6.750 |
| Nov-19 | 863 | - | - | - | 660 | 2.500 | 2.875 | 3.251 | 3.450 | - | - | 957 | - | - |
| Dec-19 | 750 | - | - | - | - | - | 2250 | - | 2.750 | - | - | - | - | - |
| Note: Not including securities placed under exchange transactions |
| 114 | ITALIAN MINISTRY OF ECONOMY AND FINANCE |
| GROSS ISSUES AT NOMINAL VALUE – RE-OPENING OF OFF-THE-RUN SECURITIES (€ MILLION) |
| | CCT | BTP€i | BTP |
| | 7 year infl. | 2 - 10year | 11 - 15 year | 16 - 30 year | 2 - 5 year | 6 - 10 year | 11 - 15 year | 16 - 30 year |
| Jan-16 | - | 600 | - | - | - | - | - | - |
| Feb-16 | - | - | - | - | - | - | 1.150 | - |
| Mar-16 | - | 570 | - | - | - | - | - | - |
| Apr-16 | - | - | - | - | - | - | 707 | - |
| May-16 | - | - | - | - | - | - | 1.000 | - |
| Jun-16 | - | - | - | - | - | - | - | 742 |
| Jul-16 | - | - | - | - | - | - | - | - |
| Aug-16 | - | - | - | - | - | - | - | - |
| Sep-16 | - | - | - | - | - | - | - | 750 |
| Oct-16 | - | 832 | - | - | - | - | - | - |
| Nov-16 | - | - | - | - | - | - | - | 605 |
| Dec-16 | 1150 | - | - | - | - | - | - | - |
| Jan-17 | - | - | - | - | - | 1.005 | - | - |
| Feb-17 | - | 536 | - | - | 1.150 | - | - | 1.184 |
| Mar-17 | 1.254 | - | - | - | - | 1.150 | - | 1.562 |
| Apr-17 | - | - | - | - | 1.000 | - | 1.200 | - |
| May-17 | - | - | - | - | - | - | - | 1.499 |
| Jun-17 | - | 461 | - | - | - | - | - | - |
| Jul-17 | - | - | - | - | - | - | - | 929 |
| Aug-17 | - | - | - | - | - | - | - | - |
| Sep-17 | - | - | - | - | - | - | - | - |
| Oct-17 | - | - | - | - | - | - | - | - |
| Nov-17 | - | - | - | - | - | - | - | - |
| Dec-17 | - | - | - | - | - | - | - | - |
| Jan-18 | - | - | - | - | - | 1.000 | - | - |
| Feb-18 | - | - | - | - | - | - | - | - |
| Mar-18 | - | - | - | - | - | - | - | 960 |
| Apr-18 | - | - | - | - | - | - | - | - |
| May-18 | - | 647 | - | - | - | - | - | - |
| Jun-18 | - | - | - | - | - | - | - | 468 |
| Jul-18 | - | - | - | - | - | - | - | - |
| Aug-18 | - | - | - | - | - | - | - | - |
| Sep-18 | 996 | - | - | - | - | - | - | - |
| Oct-18 | - | - | - | - | - | - | - | 670 |
| Nov-18 | - | - | - | - | - | - | - | - |
| Dec-18 | 700 | - | - | - | - | - | - | - |
| Jan-19 | - | - | - | - | - | 849 | - | - |
| Feb-19 | - | - | - | - | - | - | - | - |
| Mar-19 | - | - | - | - | - | - | 2.000 | - |
| Apr-19 | - | - | - | - | - | - | - | - |
| May-19 | - | - | - | - | - | - | - | - |
| Jun-19 | - | - | - | - | - | 3.636 | - | - |
| Jul-19 | - | - | - | - | - | - | - | - |
| Aug-19 | 508 | - | - | - | - | - | - | - |
| Sep-19 | - | - | - | - | - | - | - | - |
| Oct-19 | - | - | - | - | - | - | - | - |
| Nov-19 | - | - | - | - | - | - | - | 639 |
| Dec-19 | - | - | - | - | - | - | - | - |
| Note: Not including securities placed under exchange transactions |
| ITALIAN MINISTRY OF ECONOMY AND FINANCE | 115 |
| COMPOUNDED GROSS YIELDS AT ISSUANCE OF GOVERNMENT BONDS (WEIGHTED MONTHLY AVERAGE) |
| | BOT | CTZ | CCTeu | BTP€i (*) | BTP | BTP Italia (*) |
| | 6 | 12 | 24 | 5-7 | 5 | 10 | 15 | 30 | 3 | 5 | 7 | 10 | 15 | 20 | 30 | 50 | 4-6-8 |
| | month | month | month | year | year | year | year | year | year | year | year | year | year | year | year | year | year |
| Jan-16 | -0,059 | -0,074 | -0,113 | 0,42 | - | 1,35 | - | - | 0,02 | 0,57 | 0,99 | 1,59 | 2,03 | - | | - | - |
| Feb-16 | -0,042 | -0,032 | - | 0,47 | - | - | 1,95 | - | 0,11 | 0,42 | 1,05 | 1,44 | - | - | 2,76 | - | - |
| Mar-16 | -0,050 | -0,068 | -0,063 | 0,58 | - | - | - | 2,33 | -0,05 | 0,44 | 0,79 | 1,50 | 1,84 | - | - | - | - |
| Apr-16 | -0,172 | -0,081 | - | 0,44 | - | 1,34 | - | - | 0,05 | 0,34 | 0,82 | 1,24 | - | 2,30 | 2,49 | - | 1,14 |
| May-16 | -0,262 | -0,140 | -0,137 | 0,59 | 0,71 | - | - | - | 0,04 | 0,49 | 0,87 | 1,51 | 1,99 | - | - | - | - |
| Jun-16 | -0,150 | -0,122 | - | 0,53 | - | - | 1,79 | - | 0,08 | 0,40 | 0,83 | 1,42 | - | - | 2,49 | - | - |
| Jul-16 | -0,185 | -0,176 | -0,150 | 0,57 | 0,45 | - | - | - | -0,04 | 0,33 | 0,63 | 1,35 | 1,57 | 1,88 | - | - | - |
| Aug-16 | -0,236 | -0,190 | - | 0,38 | - | - | - | - | - | 0,26 | - | 1,24 | - | - | - | - | - |
| Sep-16 | -0,257 | -0,175 | -0,216 | 0,32 | - | - | 1,50 | - | -0,02 | 0,19 | 0,69 | 1,14 | - | 1,91 | - | - | - |
| Oct-16 | -0,295 | -0,238 | - | 0,33 | - | 1,08 | - | - | 0,03 | 0,28 | 0,83 | 1,21 | 1,77 | - | - | 2,85 | 1,13 |
| Nov-16 | -0,199 | -0,217 | -0,283 | 0,59 | 1,12 | - | - | 3,09 | 0,30 | 0,57 | 1,37 | 1,60 | - | - | 3,14 | - | - |
| Dec-16 | - | -0,196 | - | 0,99 | - | - | - | - | - | 0,91 | - | 1,97 | - | - | - | - | - |
| Jan-17 | -0,301 | -0,250 | -0,071 | 0,58 | - | - | 2,52 | - | 0,06 | 0,54 | 1,15 | 1,77 | 2,53 | 2,53 | - | - | - |
| Feb-17 | -0,294 | -0,247 | 0,029 | 0,73 | 1,14 | - | - | - | 0,25 | 0,92 | 1,59 | 2,37 | - | - | 3,43 | - | - |
| Mar-17 | -0,294 | -0,226 | -0,085 | 0,79 | - | 2,50 | - | - | 0,37 | 1,11 | 1,90 | 2,28 | 2,87 | - | - | - | - |
| Apr-17 | -0,326 | -0,239 | -0,075 | 0,70 | 0,93 | - | 2,45 | - | 0,47 | 1,04 | 1,69 | 2,25 | - | 2,84 | - | 3,44 | - |
| May-17 | -0,358 | -0,304 | -0,078 | 0,93 | - | 2,23 | - | 3,08 | 0,37 | 1,04 | 1,65 | 2,29 | - | - | 3,32 | - | 1,16 |
| Jun-17 | -0,372 | -0,351 | -0,167 | 0,92 | 0,64 | - | - | - | 0,15 | 0,88 | 1,35 | 2,15 | - | - | 3,54 | - | - |
| Jul-17 | -0,362 | -0,352 | -0,160 | 0,83 | - | 2,26 | - | - | 0,23 | 0,81 | 1,57 | 2,16 | 2,77 | - | - | - | - |
| Aug-17 | -0,356 | -0,337 | -0,139 | 0,77 | - | - | - | - | - | 0,88 | - | 2,16 | - | - | - | - | - |
| Sep-17 | -0,382 | -0,326 | -0,220 | 0,81 | 0,69 | - | 2,52 | - | 0,05 | 0,84 | 1,52 | 2,09 | - | 2,74 | - | - | - |
| Oct-17 | -0,400 | -0,334 | -0,167 | 0,75 | - | 2,14 | - | - | 0,15 | 0,83 | 1,53 | 2,19 | - | - | 3,33 | - | - |
| Nov-17 | -0,436 | -0,395 | -0,337 | 0,60 | - | - | - | - | -0,02 | 0,58 | 1,21 | 1,86 | 2,38 | - | - | - | 0,93 |
| Dec-17 | - | -0,407 | - | 0,46 | - | - | - | - | - | - | - | 1,73 | - | - | - | - | - |
| Jan-18 | -0,437 | -0,420 | -0,237 | 0,48 | 0,52 | - | 2,33 | - | 0,04 | 0,60 | 1,35 | 1,86 | - | 2,99 | - | - | - |
| Feb-18 | -0,403 | -0,401 | -0,216 | 0,42 | 0,62 | 2,19 | - | - | 0,05 | 0,66 | 1,43 | 2,06 | - | - | 3,16 | 3,19 | - |
| Mar-18 | -0,430 | -0,403 | -0,225 | 0,42 | 0,75 | - | - | - | 0,00 | 0,89 | 1,47 | 2,06 | 2,45 | - | - | - | - |
| Apr-18 | -0,421 | -0,399 | -0,275 | 0,35 | - | 1,82 | 2,12 | - | 0,05 | 0,68 | 1,27 | 1,83 | - | 2,59 | 2,88 | - | - |
| May-18 | 1,213 | -0,361 | 0,350 | 0,23 | - | 2,51 | - | - | 0,07 | 0,56 | 1,34 | 1,70 | 2,38 | - | - | - | 1,77 |
| Jun-18 | 0,092 | 0,550 | 0,917 | 2,00 | 2,00 | - | - | 3,58 | 1,16 | 2,32 | 2,37 | 3,00 | - | - | 3,54 | - | - |
| Jul-18 | 0,066 | 0,337 | 0,647 | 1,67 | - | 2,79 | - | - | 1,10 | 1,82 | 2,31 | 2,77 | 3,04 | 3,28 | - | - | - |
| Aug-18 | 0,438 | 0,679 | 1,277 | 1,75 | - | - | - | - | - | 1,80 | - | 2,87 | - | - | - | - | - |
| Sep-18 | 0,206 | 0,436 | 0,715 | 2,31 | - | - | 2,89 | - | 1,20 | 2,44 | 2,55 | 3,25 | - | - | 3,55 | - | - |
| Oct-18 | 0,159 | 0,949 | 1,626 | 1,77 | - | 3,40 | - | - | 2,51 | 2,03 | 3,28 | 2,90 | 3,66 | - | - | - | - |
| Nov-18 | 0,163 | 0,630 | 0,995 | 2,32 | 2,18 | - | - | - | 1,98 | 2,58 | 3,12 | 3,36 | - | 3,90 | - | - | 2,55 |
| Dec-18 | - | 0,370 | - | 2,31 | - | - | - | - | - | 2,35 | - | 3,24 | - | - | - | - | - |
| Jan-19 | 0,095 | 0,285 | 0,518 | 1,81 | - | 1,69 | - | 2,27 | 1,07 | 1,79 | 2,35 | 2,70 | 3,41 | - | 3,68 | - | - |
| Feb-19 | -0,007 | 0,181 | 0,592 | 1,65 | 1,10 | - | 2,24 | - | 0,99 | 1,49 | 2,26 | 2,60 | - | - | 3,91 | - | - |
| Mar-19 | -0,062 | 0,060 | 0,288 | 1,83 | - | 1,60 | - | - | 1,06 | 1,59 | 2,05 | 2,81 | - | 3,35 | - | - | - |
| Apr-19 | -0,028 | 0,070 | 0,697 | 1,83 | - | - | 1,93 | - | 1,08 | 1,71 | 2,05 | 2,61 | 3,00 | - | - | - | - |
| May-19 | -0,048 | 0,122 | 0,818 | 1,77 | 1,10 | 1,87 | - | - | 1,24 | 1,72 | 2,23 | 2,59 | - | - | 3,65 | - | - |
| Jun-19 | -0,063 | 0,069 | 0,431 | 1,95 | - | 1,32 | - | 2,00 | 1,05 | 1,81 | 1,96 | 2,60 | 2,87 | 3,15 | - | - | - |
| Jul-19 | -0,210 | -0,061 | 0,041 | 1,60 | ,-0,02 | - | 0,97 | - | 0,49 | 1,34 | 1,24 | 2,09 | - | - | - | 2,88 | - |
| Aug-19 | -0,217 | 0,107 | 0,008 | 1,06 | - | - | - | - | - | 0,80 | - | 1,56 | - | - | - | - | - |
| Sep-19 | -0,224 | -0,226 | -0,236 | 0,77 | - | - | - | 0,67 | -0,01 | 0,32 | 0,56 | 0,96 | - | - | - | 2,06 | - |
| Oct-19 | -0,213 | -0,219 | -0,112 | 0,52 | - | 0,44 | - | - | 0,05 | 0,26 | 0,60 | 0,88 | - | 1,78 | 2,03 | - | 0,65 |
| Nov-19 | -0,215 | -0,135 | -0,033 | - | - | - | - | 1,02 | 0,22 | 0,42 | 0,91 | 1,06 | - | - | 2,29 | - | - |
| Dec-19 | - | -0,191 | - | 0,71 | - | - | - | - | - | 0,64 | - | 1,29 | - | - | - | - | - |
| Note: Not including securities placed under exchange transactions |
| 116 | ITALIAN MINISTRY OF ECONOMY AND FINANCE |
| WEIGHTED AVERAGE RESIDUAL LIFE OF GOVERNMENT BONDS (MONTHS) |
| | BOT | CCT | CCTeu | CTZ | BTP | Foreign (*) | TOTAL (*) |
| nominal | nominal | nominal |
| Jan-16 | 5,07 | 7,95 | 44,97 | 10,44 | 89,92 | 98,20 | 30,71 | 135,32 | 77,21 |
| Feb-16 | 5,17 | 7,00 | 44,74 | 9,48 | 90,84 | 97,90 | 29,76 | 133,60 | 77,91 |
| Mar-16 | 5,15 | 5,98 | 44,63 | 9,42 | 90,07 | 97,45 | 30,92 | 132,41 | 77,47 |
| Apr-16 | 5,11 | 5,00 | 44,22 | 10,89 | 91,16 | 96,49 | 34,96 | 131,45 | 78,60 |
| May-16 | 5,06 | 3,98 | 44,75 | 10,54 | 91,45 | 95,11 | 33,94 | 133,80 | 78,65 |
| Jun-16 | 5,09 | 2,99 | 44,64 | 9,57 | 90,84 | 94,66 | 33,52 | 133,38 | 78,30 |
| Jul-16 | 5,10 | 7,00 | 44,32 | 9,24 | 90,00 | 93,46 | 32,51 | 140,33 | 78,17 |
| Aug-16 | 5,07 | 5,98 | 44,08 | 11,61 | 90,88 | 92,44 | 31,50 | 139,34 | 79,00 |
| Sep-16 | 5,15 | 5,00 | 43,73 | 11,13 | 91,40 | 98,36 | 30,51 | 145,94 | 79,66 |
| Oct-16 | 5,14 | 3,98 | 43,43 | 10,11 | 92,28 | 97,46 | 39,29 | 144,50 | 81,07 |
| Nov-16 | 5,13 | 2,99 | 43,69 | 11,04 | 92,57 | 96,92 | 38,30 | 145,71 | 81,06 |
| Dec-16 | 4,92 | 1,97 | 43,64 | 10,02 | 92,63 | 95,90 | 37,28 | 144,82 | 81,06 |
| Jan-17 | 5,08 | 0,95 | 43,27 | 9,82 | 92,10 | 95,57 | 36,29 | 144,29 | 80,27 |
| Feb-17 | 5,16 | 0,03 | 43,17 | 13,05 | 93,18 | 94,55 | 35,36 | 143,43 | 81,17 |
| Mar-17 | 5,17 | - | 43,05 | 12,73 | 92,60 | 94,37 | 34,35 | 143,60 | 80,95 |
| Apr-17 | 5,14 | - | 42,83 | 12,23 | 91,91 | 93,53 | 41,14 | 142,74 | 81,00 |
| May-17 | 5,16 | - | 43,31 | 12,28 | 93,09 | 93,42 | 43,51 | 142,48 | 81,47 |
| Jun-17 | 5,18 | - | 45,98 | 11,95 | 94,34 | 92,37 | 44,58 | 147,28 | 82,69 |
| Jul-17 | 5,19 | - | 45,60 | 11,47 | 93,63 | 91,70 | 43,56 | 146,32 | 82,02 |
| Aug-17 | 5,17 | - | 45,09 | 14,60 | 94,08 | 90,68 | 42,54 | 145,33 | 82,46 |
| Sep-17 | 5,20 | - | 44,68 | 13,87 | 93,07 | 99,87 | 41,55 | 145,06 | 82,30 |
| Oct-17 | 5,16 | - | 48,84 | 13,87 | 92,26 | 99,12 | 40,51 | 144,33 | 82,10 |
| Nov-17 | 5,08 | - | 49,58 | 13,36 | 92,72 | 98,28 | 53,92 | 143,50 | 83,04 |
| Dec-17 | 4,86 | - | 49,66 | 12,34 | 92,16 | 97,26 | 52,90 | 142,59 | 82,81 |
| Jan-18 | 5,05 | - | 49,20 | 12,28 | 93,01 | 96,42 | 51,88 | 144,09 | 82,88 |
| Feb-18 | 5,15 | - | 48,91 | 11,78 | 94,24 | 95,42 | 50,96 | 143,17 | 83,46 |
| Mar-18 | 5,14 | - | 48,41 | 14,88 | 93,24 | 93,71 | 49,95 | 145,36 | 82,95 |
| Apr-18 | 5,11 | - | 52,46 | 14,48 | 92,46 | 93,33 | 48,96 | 145,41 | 82,82 |
| May-18 | 5,11 | - | 52,39 | 13,80 | 92,28 | 92,23 | 52,90 | 145,34 | 82,49 |
| Jun-18 | 5,18 | - | 52,11 | 13,17 | 92,70 | 91,69 | 51,91 | 144,42 | 82,50 |
| Jul-18 | 5,21 | - | 51,67 | 12,49 | 91,82 | 90,89 | 50,89 | 143,52 | 81,67 |
| Aug-18 | 5,18 | - | 51,12 | 11,78 | 92,43 | 89,87 | 49,88 | 142,49 | 81,75 |
| Sep-18 | 5,20 | - | 50,64 | 11,07 | 91,62 | 96,53 | 48,89 | 141,83 | 81,53 |
| Oct-18 | 5,14 | - | 49,92 | 11,09 | 91,58 | 95,66 | 49,58 | 141,99 | 81,34 |
| Nov-18 | 5,07 | - | 53,14 | 10,70 | 90,63 | 94,40 | 48,50 | 141,97 | 80,80 |
| Dec-18 | 4,93 | - | 52,57 | 12,37 | 90,75 | 93,38 | 47,48 | 141,20 | 81,37 |
| Jan-19 | 5,11 | | 51,74 | 12,40 | 90,56 | 93,10 | 46,46 | 140,17 | 80,73 |
| Feb-19 | 5,18 | | 51,35 | 11,94 | 92,53 | 92,14 | 45,54 | 139,24 | 81,83 |
| Mar-19 | 5,16 | | 50,44 | 11,30 | 93,14 | 91,25 | 44,52 | 137,44 | 81,89 |
| Apr-19 | 5,13 | | 49,62 | 11,50 | 92,82 | 90,74 | 43,54 | 137,00 | 81,37 |
| May-19 | 5,11 | | 48,76 | 13,39 | 93,16 | 89,61 | 42,52 | 139,56 | 81,72 |
| Jun-19 | 5,18 | | 47,78 | 12,95 | 92,87 | 89,31 | 41,80 | 138,84 | 81,44 |
| Jul-19 | 5,24 | | 46,92 | 12,37 | 92,71 | 88,53 | 40,79 | 141,83 | 81,17 |
| Aug-19 | 5,22 | | 46,09 | 11,76 | 92,63 | 87,51 | 39,77 | 144,51 | 80,73 |
| Sep-19 | 5,27 | | 45,25 | 11,04 | 93,40 | 98,43 | 38,78 | 144,23 | 81,72 |
| Oct-19 | 5,22 | | 44,46 | 13,47 | 93,43 | 98,20 | 43,27 | 149,82 | 82,43 |
| Nov-19 | 5,14 | | 47,96 | 12,93 | 92,65 | 98,03 | 42,27 | 148,80 | 82,27 |
| Dec-19 | 5,00 | | 47,04 | 11,75 | 92,74 | 97,01 | 41,25 | 149,77 | 82,42 |
| Note: Not including securities placed under exchange transactions |
| ITALIAN MINISTRY OF ECONOMY AND FINANCE | 117 |
| COMPOUNDED GROSS YIELDS AT ISSUANCE OF GOVERNMENT BONDS – RE-OPENING OF OFF-THE-RUN SECURITIES (weighted monthly average) |
| | CCT | BTP€i(*) | BTP |
| | 7 year infl. | 2 – 10 year | 11 – 15 year | 16 - 30 year | 2 - 5 year | 6 - 10 year | 11 - 15 year | 16 - 30 year |
| Jan-16 | - | 1,54 | - | - | - | - | - | - |
| Feb-16 | - | - | - | - | - | - | 2,08 | - |
| Mar-16 | - | 1,27 | - | - | - | - | | - |
| Apr-16 | - | - | - | - | - | - | 1,71 | - |
| May-16 | - | - | - | - | - | - | 1,9 | - |
| Jun-16 | - | - | - | - | - | - | - | 2,44 |
| Jul-16 | - | - | - | - | - | - | - | - |
| Aug-16 | - | - | - | - | - | - | - | - |
| Sep-16 | - | - | - | - | - | - | - | 2,28 |
| Oct-16 | - | 1,34 | - | - | - | - | - | - |
| Nov-16 | - | - | - | - | - | - | - | 3,05 |
| Dec-16 | 0,67 | - | - | - | - | - | - | - |
| Jan-17 | - | - | - | - | - | 1,71 | - | - |
| Feb-17 | - | 2,2 | - | - | 0,37 | - | - | 3,31 |
| Mar-17 | 0,53 | - | - | - | - | 2,05 | - | 3,42 |
| Apr-17 | - | - | - | - | 0,4 | - | 2,53 | - |
| May-17 | - | - | - | - | - | - | - | 3,38 |
| Jun-17 | - | 1,72 | - | - | - | - | - | - |
| Jul-17 | - | - | - | - | - | - | - | 2,93 |
| Aug-17 | - | - | - | - | - | - | - | - |
| Sep-17 | - | - | - | - | - | - | - | - |
| Oct-17 | - | - | - | - | - | - | - | - |
| Nov-17 | - | - | - | - | - | - | - | - |
| Dec-17 | - | - | - | - | - | - | - | - |
| Jan-18 | - | - | - | - | - | 1,83 | - | - |
| Feb-18 | - | - | - | - | - | - | - | - |
| Mar-18 | - | - | - | - | - | - | - | 2,92 |
| Apr-18 | - | - | - | - | - | - | - | - |
| May-18 | - | 1,08 | - | - | - | - | - | - |
| Jun-18 | - | - | - | - | - | - | - | 3,42 |
| Jul-18 | - | - | - | - | - | - | - | - |
| Aug-18 | - | - | - | - | - | - | - | - |
| Sep-18 | 2,32 | - | - | - | - | - | - | - |
| Oct-18 | - | - | - | - | - | - | - | 3,79 |
| Nov-18 | - | - | - | - | - | - | - | - |
| Dec-18 | 2,22 | - | - | - | - | - | - | - |
| Jan-19 | - | - | - | - | - | 2,50 | - | - |
| Feb-19 | - | - | - | - | - | - | - | - |
| Mar-19 | - | - | - | - | - | - | - | - |
| Apr-19 | - | - | - | - | - | - | - | - |
| May-19 | - | - | - | - | - | - | - | - |
| Jun-19 | - | - | - | - | - | 1,94 | - | - |
| Jul-19 | - | - | - | - | - | - | - | - |
| Aug-19 | 1,11 | - | - | - | - | - | - | - |
| Sep-19 | - | - | - | - | - | - | - | - |
| Oct-19 | - | - | - | - | - | - | - | - |
| Nov-19 | 0,40 | - | - | - | - | - | - | - |
| Dec-19 | - | - | - | - | - | - | - | - |
Note: Not including securities placed under exchange transactions (*) Gross yield including inflation expectation at issuance time |
| 118 | ITALIAN MINISTRY OF ECONOMY AND FINANCE |
| BOT: COMPOUNDED GROSS YIELDS AT ISSUANCE |
|
| CTZ: COMPOUNDED GROSS YIELDS AT ISSUANCE |
|
| ITALIAN MINISTRY OF ECONOMY AND FINANCE | 119 |
| BTP: COMPOUNDED GROSS YIELDS AT ISSUANCE |
|
| BTP ITALIA AND BTP€I: EXPECTED YIELDS |
|
| 120 | ITALIAN MINISTRY OF ECONOMY AND FINANCE |
| CCTEU: COMPOUNDED GROSS YIELD AT ISSUANCE |
|
| EURO AREA 10-YEAR BENCHMARK SPREADS OVER BUND (BASIS POINTS) |
|
| ITALIAN MINISTRY OF ECONOMY AND FINANCE | 121 |
| ASSET SWAP SPREAD (BASIS POINTS) |
|
| MONTHLY TREND OF WEIGHTED AVERAGE RESIDUAL LIFE OF GOVERNMENT BONDS (MONTHS) |
|
| 122 | ITALIAN MINISTRY OF ECONOMY AND FINANCE |