 1 2nd Quarter 2012 Highlights and Operating Review Exhibit 99.1 |
 2 Safe Harbor and Non-GAAP Financial Measures Non-GAAP financial measures provide insight into selected financial information and should be evaluated in the context in which they are presented. These non-GAAP financial measures have limitations as analytical tools, and should not be considered in isolation from, or as a substitute for, financial information presented in compliance with GAAP, and non-GAAP financial measures as reported by us may not be comparable to similarly titled amounts reported by other companies. The non-GAAP financial measures should be considered in conjunction with the consolidated financial statements, including the related notes, and Management’s Discussion and Analysis of Financial Condition and Results of Operations included in our Annual Reports on Form 10-K and Quarterly Reports on Form 10-Q as filed with the SEC. We do not use these non-GAAP financial measures for any purpose other than the reasons stated above. This presentation includes certain financial measures computed using non-Generally Accepted Accounting Principles (“non- GAAP”) components as defined by the SEC. Certain profitability, earnings per share and cash flow information in this presentation exclude special items which have been identified in our earnings releases as we believe that by reporting such information, both management and investors are provided with meaningful supplemental information to understand and analyze our underlying trends and other aspects of our financial performance. The statements in this presentation that use such words as “believe,” “expect,” “intend,” “anticipate,” “contemplate,” “estimate,” “plan,” “project,” “should,” “may,” “will,” or similar expressions are forward-looking statements. They are subject to a number of factors that could cause our actual results to differ materially from what is indicated here. These factors include general economic conditions, the level of customer demand particularly for capital projects in the markets we serve, changes in supplier sales strategies or financial viability, risks associated with the sale of nonconforming products and services, political, economic or currency risks related to foreign operations, inventory obsolescence, copper price fluctuation customer viability, risks associated with accounts receivable, the impact of regulation and regulatory, investigative and legal proceedings and legal compliance risks and risks associated with integration of acquired companies. These uncertainties may cause our actual results to be materially different than those expressed in any forward looking statements. We do not undertake to update any forward looking statements. Please see our Securities and Exchange Commission (“SEC”) filings for more information |
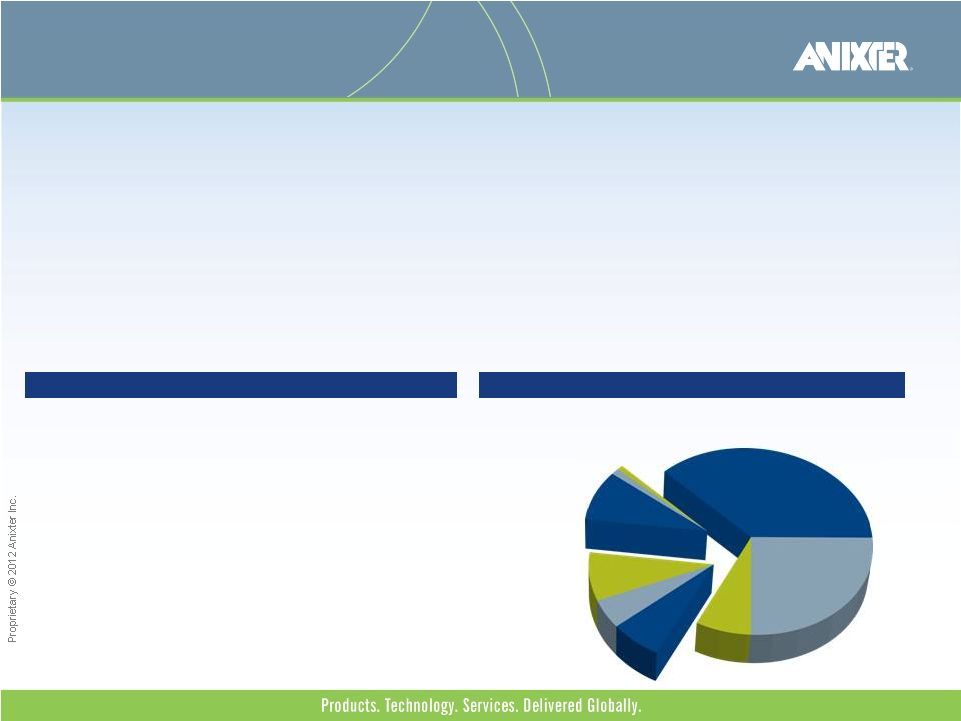 3 2011 REVENUE: $6.1 Billion Anixter Overview • Employ over 2,500 technical salespeople • Located in over 260 cities and 50 countries • Transact in 35 currencies • Speak over 30 languages • Serve over 100,000 customers • Carry over $1 billion and 450,000 SKUs in inventory • Operate 225 warehouses with over 7 million square feet • AXE is a leading global value-added industrial distributor of communications and security products, electrical and electronic wire and cable, and fasteners and other small components • Founded in 1957, Anixter employs over 8,200 people and had 2011 revenues of $6.1 billion • AXE’s success is built on customizing solutions to optimize the supply chain for our customers through our technical expertise and our global operational consistency and distribution network Unmatched Global Distribution Network ECS 33% W&C 37% W&C 10% Europe 19% Emerging Markets 11% OEM 9% ECS 81% ECS 53% OEM 41% North America 70% OEM 10% W&C 26% |
 4 • Sales increased in 2Q12 for the 10th consecutive quarter – Sales of $1.58 billion increased by 1% from 2Q11 – Excluding the unfavorable impact from copper pricing and foreign exchange, organic sales increased by 4% – North America organic sales increased by 5% • Generated $124 million in cash flow from operations in 2Q12 versus $18 million in 2Q11, primarily due to a reduction in working capital • Returned over $150 million to shareholders through special dividend of $4.50 per share, paid May 31, 2012 • Announced the acquisition of Jorvex, a Peruvian wire and cable distributor, July 9, 2012 • Announced 1 million share buyback, July 27, 2012 Recent Highlights |
 5 Core Operating Principles Leverage global Leverage global footprint footprint Deliver a compelling Deliver a compelling value proposition value proposition Strengthen Strengthen customer loyalty customer loyalty Execute with Execute with excellence excellence |
 6 Anixter's Competitive Advantage One Anixter One IT platform One management team Global reach World-class supply chain Subject matter experts Superior technical knowledge |
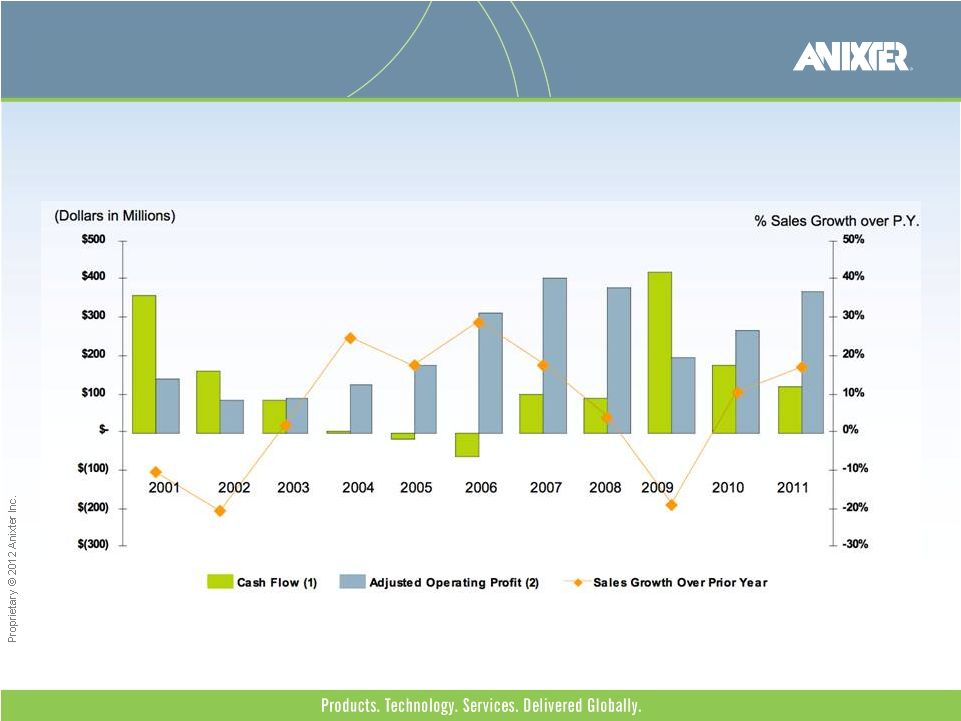 7 Earnings and Cash Flow Relationship to Sales Changes Fiscal Year (1) Net cash provided by (used in) operating activities less capital expenditures. (2) Adjusted operating profit from continuing operations excludes special items outlined in the Company’s Earnings Releases for the applicable periods. See Appendix for details. Flexible/Scalable Business Model |
  8 • Consistent sales and profitability growth • Platform for sustainable growth • Effective working capital management • Significant free cash flow • Disciplined and strategic approach to capital allocation Focused on value creation for shareholders Positioned to Create Value |
 9 GAAP 2Q12 2Q11 Change Net Sales $1,577.0 $1,565.3 0.7% Operating Margin 5.7% 5.9% (20) basis points Net Income from Continuing Operations $44.0 $48.4 (8.9)% Earnings Per Diluted Share $1.28 $1.33 (3.8)% Weighted Average Diluted Shares Outstanding 34.3 36.3 (5.6)% Operating Cash Flow $123.9 $18.3 NM NM – Not meaningful information Second Quarter 2012 Financial Results $ in Millions except EPS |
 10 2Q12 Forex and Copper Impacts $ in Millions 2Q12 GAAP Sales Foreign Exchange Impact Copper Impact Adjusted Sales 2Q11 GAAP Sales Organic Sales Growth North America $1,128.8 $9.3 $15.6 $1,153.7 $1,099.4 4.9% Europe $273.8 $17.3 $1.5 $292.6 $290.4 0.7% Emerging Markets $174.4 $7.8 NA $182.2 $175.5 3.8% Total $1,577.0 $34.4 $17.1 $1,628.5 $1,565.3 4.0% |
 11 GAAP 1H12 1H11 Change Net Sales $3,099.7 $3,036.1 2.1% Operating Margin 5.7% 5.6% 10 basis points Net Income from Continuing Operations $99.6 $89.3 11.6% Earnings Per Diluted Share $2.90 $2.47 17.4% Weighted Average Diluted Shares Outstanding 34.3 36.2 (5.2)% Operating Cash Flow $59.2 $12.8 NM NM – Not meaningful information First Half 2012 Financial Results $ in Millions except EPS |
 12 1H12 Forex and Copper Impacts $ in Millions 1H12 GAAP Sales Foreign Exchange Impact Copper Impact Adjusted Sales 1H11 GAAP Sales Organic Sales Growth North America $2,197.9 $12.6 $28.7 $2,239.2 $2,128.1 5.2% Europe $561.4 $24.4 $3.0 $588.8 $576.0 2.2% Emerging Markets $340.4 $9.6 NA $350.0 $332.0 5.4% Total $3,099.7 $46.6 $31.7 $3,178.0 $3,036.1 4.7% |
 13 Operating Income by Segment $ in Millions Operating Income - GAAP 2Q12 2Q11 Change North America $79.5 $79.2 0.3% Europe $0.8 $4.6 (82.8)% Emerging Markets $9.6 $8.2 18.6% Total $89.9 $92.0 (2.3)% |
 14 GAAP 2Q11 3Q11 4Q11 1Q12 2Q12 North America 7.2% 7.5% 7.0% 7.1% 7.0% Europe 1.6% 2.0% 1.9% 1.3% 0.3% Emerging Markets 4.6% 5.7% 7.5% 4.5% 5.6% Total 5.9% 6.3% 6.1% 5.7% 5.7% YOY Basis Point Change 90 100 40 40 (20) Operating Income $92.0 M $101.7 M $91.6 M $86.7 M $89.9 M Operating Income Dollar Growth $25.5 M $30.9 M $13.1 M $9.2 M $(2.1) M Operating Margin Progression |
 15 GAAP 2Q12 2Q11 Interest Expense $(14.8) M $(12.8) M Other, Net $(5.5) M $(1.6) M Effective Tax Rate 36.7% 37.6% Weighted Average Basic Shares Outstanding 33.5 M 34.8 M Weighted Average Diluted Shares Outstanding 34.3 M 36.3 M Income Statement Details |
 16 2Q12 4Q11 % Change Cash Impact Cash/Short-term Investments $152.0 M $106.1 M 43.3% Accounts Receivable $1,222.8 M $1,151.0 M 6.2% Inventories $1,079.9 M $1,070.7 M 0.9% Accounts Payable $748.9 M $706.5 M 6.0% + Total Working Capital $1,505.4 M $1,376.0 M 9.4% Working Capital Details |
 17 2Q11 3Q11 4Q11 1Q12 2Q12 Working Capital ($ in Millions) $1,596.8 $1,420.2 $1,376.0 $1,487.0 $1,505.4 Working Capital as a % of Annualized Sales 25.5% 22.0% 22.9% 24.4% 23.9% Working Capital Trends |
 18 • Organic growth – Support existing markets – Expand into new markets • Deleveraging – Further strengthen balance sheet and improve liquidity – Continue to enhance flexibility • Strategic acquisitions – Enhance geographic segment position – EPS accretive • Opportunistic return of value to shareholders – Share repurchases – Special dividends Capital Allocation Priorities |
 19 2007 2008 2009 2010 2011 1H12 Share Repurchases* $241.8 $104.6 $34.9 $41.2 $107.5 - Special Dividends - - - $113.7 - $150.6 Total $241.8 $104.6 $34.9 $154.9 $107.5 $150.6 Consistent Return of Capital to Shareholders $ in Millions *Announced a 1 million share repurchase authorization on July 27, 2012. |
 20 FY11 Long Term Goal Organic Sales Growth* 10.4% 8-10% 5-Year Average FY11 Long Term Goal Operating Leverage 10.9% 11.0% Mid- to high-single digits Working Capital as a % of Sales 24.6% 22.4% 21-22% Debt-to-Capital Ratio 46.7% 44.7% 45-50% * Organic Sales Growth excludes acquisition impact, copper impact, and changes in foreign currency. Long-Term Financial Goals |
 21 Outlook for the Second Half of 2012 Tailwinds • Security business • Emerging markets • Additional parts with OEM Supply customers • Electrical wire and cable projects • Low interest rates Potential Headwinds • Copper pricing • Foreign exchange • European economic volatility • Global uncertainty Organic sales growth: 4-5% Operating profit leverage: Mid- to high-single digits 2H12 Performance Outlook |
 22 Appendix Appendix I Adjusted Gross Profit and Operating Profit Appendix II Acronyms and Definitions Appendix III Non – GAAP Earnings Per Share Appendix IV Non – GAAP Trailing Twelve Months Results Appendix V Other Supporting Schedules |
 23 Appendix I – Adjusted Gross Profit and Operating Profit (1) All periods restated for 2011 divestiture of Aerospace. Adjustments to operating profit are further described in the Company’s earnings releases and SEC filings for the applicable periods. FY'01 FY'02 FY'03 FY'04 FY'05 FY'06 FY'07 FY'08 FY'09 FY'10 1H '11 FY'11 1H '12 Sales 5,661.5 $ 5,891.0 $ 4,779.6 $ 5,274.5 $ 3,036.1 $ 6,146.9 $ 3,099.7 $ Gross profit 1,344.4 $ 1,353.9 $ 1,077.1 $ 1,207.6 $ 696.7 $ 1,407.4 $ 707.1 $ Inventory adjustment - 2.0 4.2 - - - - Gross profit, adjusted 1,344.4 $ 1,355.9 $ 1,081.3 $ 1,207.6 $ 696.7 $ 1,407.4 $ 707.1 $ Gross profit margin, adjusted 23.7% 23.0% 22.6% 22.9% 22.9% 22.9% 22.8% Gross profit margin, reported 23.7% 23.0% 22.5% 22.9% 22.9% 22.9% 22.8% Operating profit 102.0 $ 87.2 $ 88.1 $ 127.7 $ 175.4 $ 317.3 $ 402.7 $ 341.5 $ 84.8 $ 267.2 $ 169.5 $ 362.8 $ 176.6 $ Restructuring 31.7 - - 5.2 - - - 8.1 5.7 - 5.3 5.3 - Europe goodwill impairment - - - 1.8 - - - - 100.0 - - - - Receivable losses from customer bankruptcies - - - - - - - 24.1 - - - - - Inventory adjustment - - - (10.2) - - - 2.0 4.2 - - - - Stock-based compensation modification - - - - - - - 4.2 - - - - - Sales tax related settlement - - - - - (2.2) - - - - - - - Amortization of Goodwill 9.0 - - - - - - - - - - - - Total adjustments 40.7 - - (3.2) - (2.2) - 38.4 109.9 - 5.3 5.3 - Operating profit, adjusted 142.7 $ 87.2 $ 88.1 $ 124.5 $ 175.4 $ 315.1 $ 402.7 $ 379.9 $ 194.7 $ 267.2 $ 174.8 $ 368.1 $ 176.6 $ Adjusted operating profit margin 7.1% 6.4% 4.1% 5.1% 5.8% 6.0% 5.7% Operating profit leverage (1) 14.6% 11.6% 2.7% Gross profit pull through (1) 57.4% 50.5% 16.3% Adjustment to gross profit Adjustments to operating profit |
 24 Acronyms Appendix II – Acronyms and Definitions • ECS – Enterprise Cabling and Security Solutions • W&C – Electrical and Electronic Wire and Cable • OEM – Original Equipment Manufacturer • EPS – Diluted earnings per share, continuing operations • EBITDA – Earnings before interest, taxes, depreciation, and amortization • TTM – Trailing twelve months • Cap ex – Capital expenditures • Forex – Foreign exchange • Q - Quarter • 1H – First half • 2H – Second half • FY – Fiscal year • YOY – Year-over-year • FCF – Free Cash Flow • SKU – Stock keeping unit • AXE – Anixter International Inc. • GAAP – Generally Accepted Accounting Principles • Total operating margin is defined as operating income as a percentage of total sales • Operating profit leverage is defined as the change in operating profit over the change in sales • Gross profit margin is defined as gross profit as a percentage of total sales • Cash flow is defined as net cash provided by (used in) operating activities less capital expenditures • Cash flow from operations is defined as total cash provided from operating activities • Working capital is defined as total current assets less total current liabilities • Free cash flow is defined as adjusted EBITDA less capital expenditures, cash paid for taxes, cash paid for interest plus the change in working capital Definitions |
 25 2009 In the six months ended July 3, 2009, the Company reported a net loss from continuing operations of $72.9 million (a loss of $2.06 per diluted share). During this period, the Company recorded an impairment charge of $100.0 million ($2.85 per diluted share), severance charge of $5.7 million ($3.9 million net of tax, or $0.11 per diluted share) and losses due to the cancellation of interest rate swaps of $2.1 million ($1.5 million net of tax, or $0.04 per diluted share). These items decreased net income from continuing operations for the six months ended July 3, 2009 by a combined $105.4 million ($2.90 per diluted share). For the full year 2009, the Company reported a net loss from continuing operations of $44.1 million (a loss of $1.17 per diluted share). In addition to the items above, during the remainder of 2009, the Company recorded foreign exchange related losses in Venezuela of $18.0 million ($9.0 million net of tax, or $0.24 per diluted share) and a loss on the early retirement of debt of $1.1 million ($0.07 net of tax, or $0.02 per diluted share), which were partially offset by the tax benefits of $4.8 million ($0.13 per diluted share). Combined, all of these items decreased 2009 net income from continuing operations by $110.2 million ($3.06 per diluted share). After adjusting for these items, net income from continuing operations would have been $32.5 million and $66.1 million in the 6 and 12 months of fiscal 2009, respectively ($0.84 and $1.89 per diluted share, respectively). 2010 In the six months ended July 2, 2010, the Company reported net income from continuing operations of $34.8 million ($0.98 per diluted share). During this period, the Company recorded a pre-tax loss on the early retirement of debt of $29.7 million ($18.4 million net of tax, or $0.51 per diluted share) and a foreign exchange gain in Venezuela of $2.1 million ($0.8 million net of tax, or $0.02 per diluted share). These items decreased 2010 net income from continuing operations by a combined $17.6 million ($0.49 per diluted share). For the full year 2010, the Company reported net income from continuing operations of $109.5 million ($3.08 per diluted share). In addition to the items above, during the remainder of 2010, the Company recorded additional pre-tax losses on the early retirement of debt of $2.2 million ($1.4 million net of tax, or $0.04 per diluted share) and recorded a reversal of prior years foreign taxes of $1.3 million ($0.03 per diluted share). Combined, all of these items decreased 2010 net income from continuing operations by $17.7 million ($0.50 per diluted share). After adjusting for these items, net income from continuing operations would have been $52.4 million and $127.2 million in the 6 and 12 months of fiscal 2010, respectively ($1.47 and $3.58 per diluted share, respectively). Appendix III – Non-GAAP Earnings Per Share |
 26 2011 In the 6 and 12 months ended 2011, the Company reported net income from continuing operations of $89.3 million and $200.7 million, respectively ($2.47 and $5.71 per diluted share, respectively). In the first half of 2011, the Company recorded a European restructuring charge of $5.3 million ($3.3 million net of tax, or $0.09 per diluted share). In addition to the restructuring charge, the Company recorded a tax valuation allowance adjustment of $10.8 million ($0.31 per diluted share) during the second half of the year. Combined, all of these items increased 2011 net income from continuing operations by a combined $7.5 million ($0.22 per diluted share). After adjusting for these items, net income from continuing operations would have been $92.6 million and $193.2 million in the 6 and 12 months of fiscal 2011, respectively ($2.56 and $5.49 per diluted share, respectively). 2012 In the first half of 2012, the Company reported net income from continuing operations of $99.6 million ($2.90 per diluted share). During this period, the Company recorded a charge for the interest and penalties associated with prior year income tax liabilities of $1.7 million ($1.1 million net of tax, or $0.03 per diluted share), an income tax benefit of $9.7 million ($0.28 per diluted share) primarily related to the reversal of deferred income tax valuation allowances in certain foreign jurisdictions and incremental interest of $3.2 million ($2.1 million net of tax, or $0.06 per diluted share) associated with a bond offering completed in 2012. These items increased net income from continuing operations by a net amount of $6.5 million ($0.19 per diluted share). After adjusting for these items, net income from continuing operations would have been $93.1 million ($2.71 per diluted share). Appendix III – Non-GAAP Earnings Per Share (cont.) |
 27 In the trailing twelve months ending June 29, 2012, the Company recorded a charge for the interest and penalties associated with 2011 income tax liabilities of $1.7 million ($1.1 million net of tax, or $0.03 per diluted share), income tax benefits of $20.5 million ($0.59 per diluted share) primarily related to the reversal of deferred income tax valuation allowances in certain foreign jurisdictions and incremental interest of $3.2 million ($2.1 million net of tax, or $0.06 per diluted share) associated with a bond offering completed in 2012. These items increased net income from continuing operations by a net amount of $17.3 million ($0.50 per diluted share). In the trailing twelve months ending July 1, 2011, the $5.3 million restructuring charge decreased operating income by $5.3 and net income from continuing operations by $3.3 million, or $0.09 per diluted share. The Company also repurchased a portion of its debt which resulted in the recognition of a pre-tax loss of $2.2 million ($1.4 million, net of tax, or $0.04 per diluted share) and recorded a tax benefit of $1.3 million for the reversal of prior year foreign taxes ($0.03 per diluted share). After adjusting for these items, net income from continuing operations over the trailing twelve months ending June 29, 2012 would have been $193.7 million, or $5.64 per diluted share, which compares to adjusted net income from continuing operations of $167.4 million, or $4.67 per diluted share, in the corresponding prior year period (an increase of 21% per diluted share). Appendix IV – Non-GAAP Trailing Twelve Months Results |
  28 Appendix V - 2011 Segment and End Market Sales Growth (Actual and Organic) Twelve Months Twelve Months Ended Ended Twelve Months (In millions) December 2011 Acquisition Foreign Exchange Copper December 2011 Ended Actual Organic (as reported) Impact Impact Impact (as adjusted) December 2010 Growth Growth North America Enterprise Cabling and Security 2,301.6 $ (120.1) $ (11.4) $ - $ 2,170.1 $ 2,060.7 $ 11.7% 5.3% Wire & Cable 1,579.6 - (21.9) (93.4) 1,464.3 1,288.6 22.6% 13.6% OEM Supply 421.3 - (0.2) - 421.1 351.9 19.7% 19.7% Total North America 4,302.5 $ (120.1) $ (33.5) $ (93.4) $ 4,055.5 $ 3,701.2 $ 16.2% 9.6% Europe Enterprise Cabling and Security 380.8 $ - $ (18.6) $ - $ 362.2 $ 367.0 $ 3.7% -1.4% Wire & Cable 299.7 - (10.3) (10.9) 278.5 275.6 8.8% 1.1% OEM Supply 469.5 - (19.1) - 450.4 365.8 28.3% 23.1% Total Europe 1,150.0 $ - $ �� (48.0) $ (10.9) $ 1,091.1 $ 1,008.4 $ 14.0% 8.2% Emerging Markets Enterprise Cabling and Security 563.5 $ - $ (14.3) $ - $ 549.2 $ 484.9 $ 16.2% 13.2% Wire & Cable 70.2 - (0.5) - 69.7 38.3 83.1% 81.8% OEM Supply 60.7 (1.1) - 59.6 41.7 45.8% 43.2% Total Emerging Markets 694.4 $ - $ (15.9) $ - $ 678.5 $ 564.9 $ 22.9% 20.1% Anixter International Enterprise Cabling and Security 3,245.9 $ (120.1) $ (44.3) $ - $ 3,081.5 $ 2,912.6 $ 11.4% 5.8% Wire & Cable 1,949.5 - (32.7) (104.3) 1,812.5 1,602.5 21.7% 13.1% OEM Supply 951.5 - (20.4) - 931.1 759.4 25.3% 22.6% Total Anixter International 6,146.9 $ (120.1) $ (97.4) $ (104.3) $ 5,825.1 $ 5,274.5 $ 16.5% 10.4% Adjustments for: YTD 2011 Sales Growth |