Exhibit 99.1
|
Exhibit 99.1
ANIXTER
3Q 2014 INVESTOR PRESENTATION
Products. Technology. Services. Delivered Globally.
|
SAFE HARBOR STATEMENTNCIAL
The statements in this presentation other than historical facts are forward-looking statements made in reliance upon the safe harbor of the Private Securities Litigation Reform Act of 1995. These forward-looking statements are subject to a number of factors that could cause our actual results to differ materially from what is indicated here. These factors include but are not limited to general economic conditions, the level of customer demand particularly for capital projects in the markets we serve, changes in supplier sales strategies or financial viability, risks associated with the sale of nonconforming products and services, political, economic or currency risks related to foreign operations, inventory obsolescence, copper price fluctuations, customer viability, risks associated with accounts receivable, the impact of regulation and regulatory, investigative and legal proceedings and legal compliance risks and risks associated with integration of acquired companies. These uncertainties may cause our actual results to be materially different than those expressed in any forward looking statements. We do not undertake to update any forward looking statements.
Please see our Securities and Exchange Commission (“SEC”) filings for more information.
This presentation includes certain financial measures computed using non-Generally Accepted Accounting Principles (“non-GAAP”) components as defined by the SEC. Certain sales, profitability, earnings per share and other non -GAAP financial measures in this presentation exclude special items which have been identified in our earnings releases as we believe that by reporting such information, both management and investors are provided with meaningful supplemental information to understand and analyze our underlying trends and other aspects of our financial performance.
Non-GAAP financial measures provide insight into selected financial information and should be evaluated in the context in which they are presented. These non -GAAP financial measures have limitations as analytical tools, and should not be considered in isolation from, or as a substitute for, financial information presented in compliance with GAAP, and non-GAAP financial measures as reported by us may not be comparable to similarly titled amounts reported by other companies. The non-GAAP financial measures should be considered in conjunction with the consolidated financial statements, including the related notes, and Management’s Discussion and Analysis of Financial Condition and Results of Operations included in our Annual Reports on Form 10-K and Quarterly Reports on Form 10-Q as filed with the SEC. We do not use these non-GAAP financial measures for any purpose other than the reasons stated above.
Proprietary and Confidential. © 2014 Anixter Inc. 2
|
I. Anixter Overview Pp. 4— 14
II. Tri-Ed Acquisition Pp. 15 — 22
III. 2Q 2014 Review Pp. 23 — 37
IV. 2H 2014 Outlook Pp. 38 — 43
V. Appendix Pp. 44 — 45
VI. Investor Contacts P. 46
Proprietary and Confidential. © 2014 Anixter Inc.
3 |
|
|
ANIXTER: A COMPELLING VALUE PROPOSITION
Leading position in large, diverse and fragmented businesses Differentiated by our global capabilities, customized supply chain solutions and technical expertise Globally scalable business model creates value for stakeholders Strategies and people in place to achieve our long-term growth goals
Financial strength and capital efficiency
Anixter reduces cost and complexity in the supply chain, lowering our customers’ risk, creating value for our stakeholders
Proprietary and Confidential. © 2014 Anixter Inc.
4 |
|
|
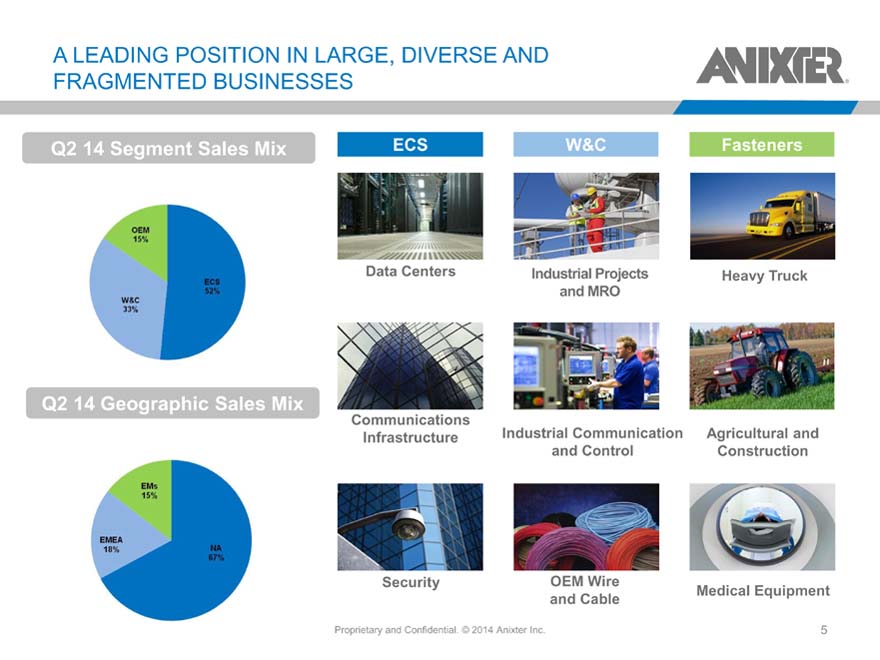
A LEADING POSITION IN LARGE, DIVERSE AND FRAGMENTED BUSINESSES
Q2 14 Segment Sales Mix
Q2 14 Geographic Sales Mix
ECS W&C Fasteners
Data Centers Industrial Projects Heavy Truck
and MRO
Communications
Infrastructure Industrial Communication Agricultural and
and Control Construction
Security OEM Wire
and Cable Medical Equipment
Proprietary and Confidential. © 2014 Anixter Inc.
5 |
|
|
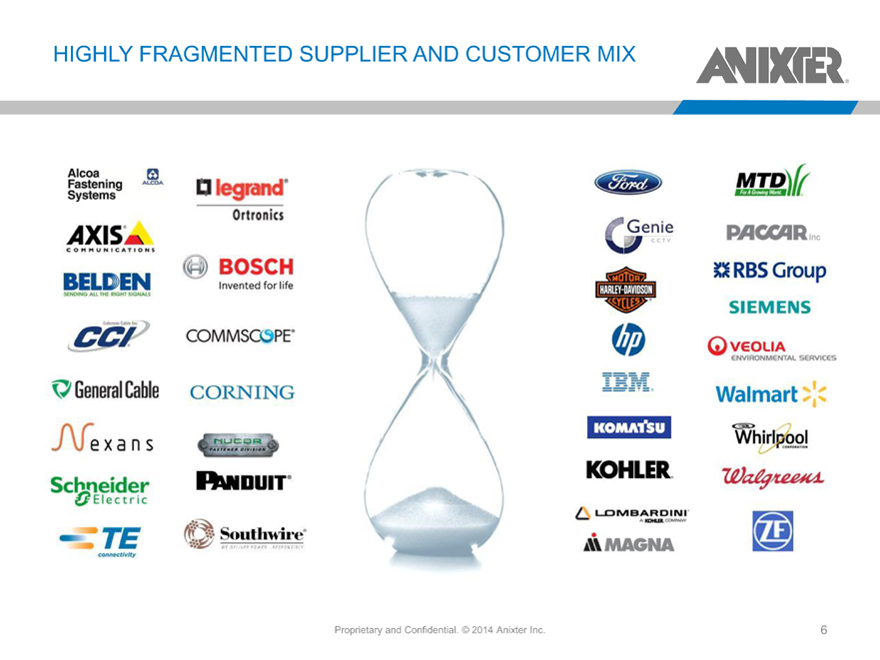
HIGHLY FRAGMENTED SUPPLIER AND CUSTOMER MIX
Proprietary and Confidential. © 2014 Anixter Inc.
6 |
|
|
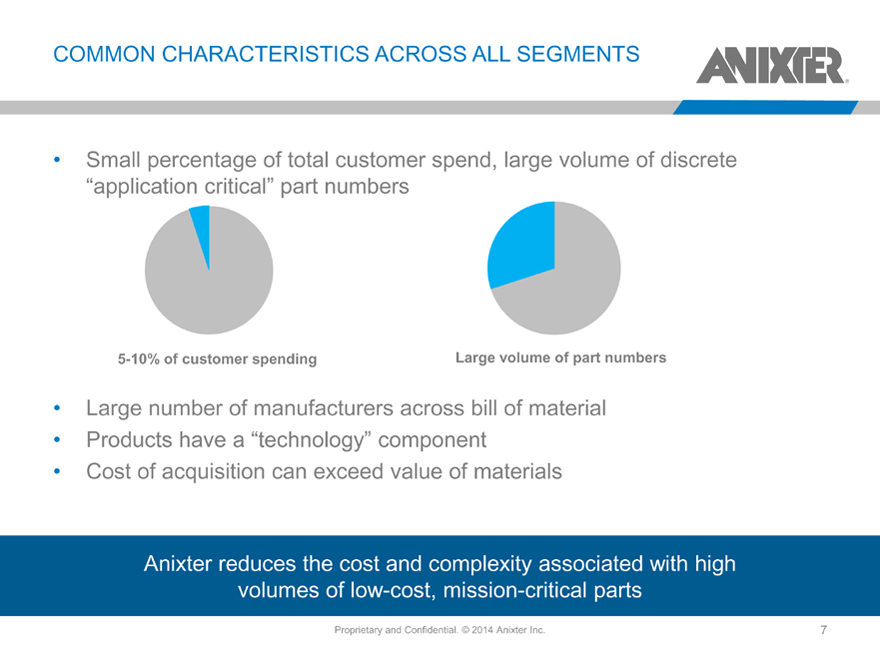
COMMON CHARACTERISTICS ACROSS ALL SEGMENTS
Small percentage of total customer spend, large volume of discrete
“application critical” part numbers
5-10% of customer spending Large volume of part numbers
Large number of manufacturers across bill of material
Products have a “technology” component
Cost of acquisition can exceed value of materials
Anixter reduces the cost and complexity associated with high volumes of low-cost, mission-critical parts
Proprietary and Confidential. © 2014 Anixter Inc.
7 |
|
|
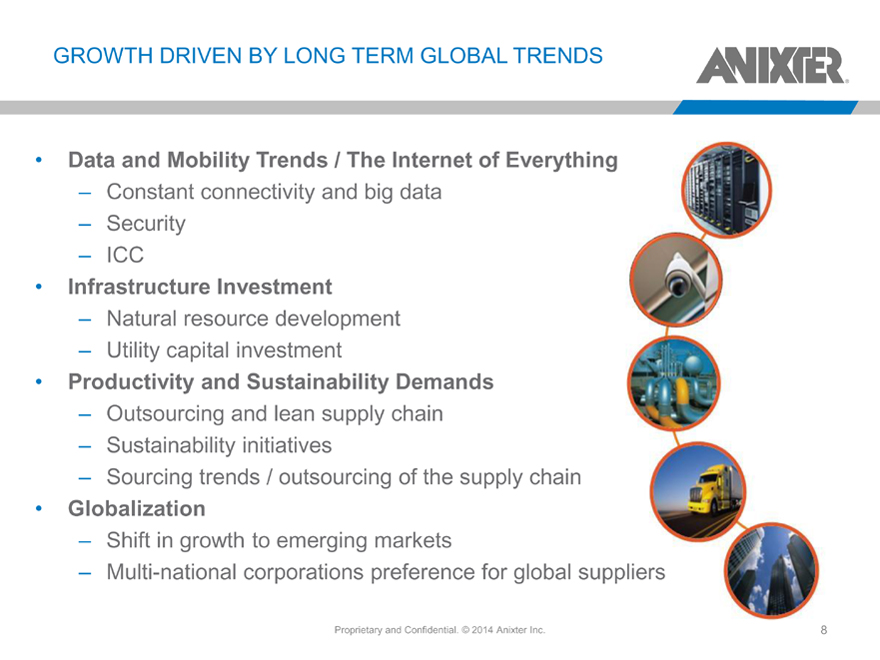
GROWTH DRIVEN BY LONG TERM GLOBAL TRENDS
Data and Mobility Trends / The Internet of Everything
– Constant connectivity and big data
– Security
– ICC
Infrastructure Investment
– Natural resource development
– Utility capital investment
Productivity and Sustainability Demands
– Outsourcing and lean supply chain
– Sustainability initiatives
– Sourcing trends / outsourcing of the supply chain
Globalization
– Shift in growth to emerging markets
– Multi-national corporations preference for global suppliers
Proprietary and Confidential. © 2014 Anixter Inc.
8 |
|
|
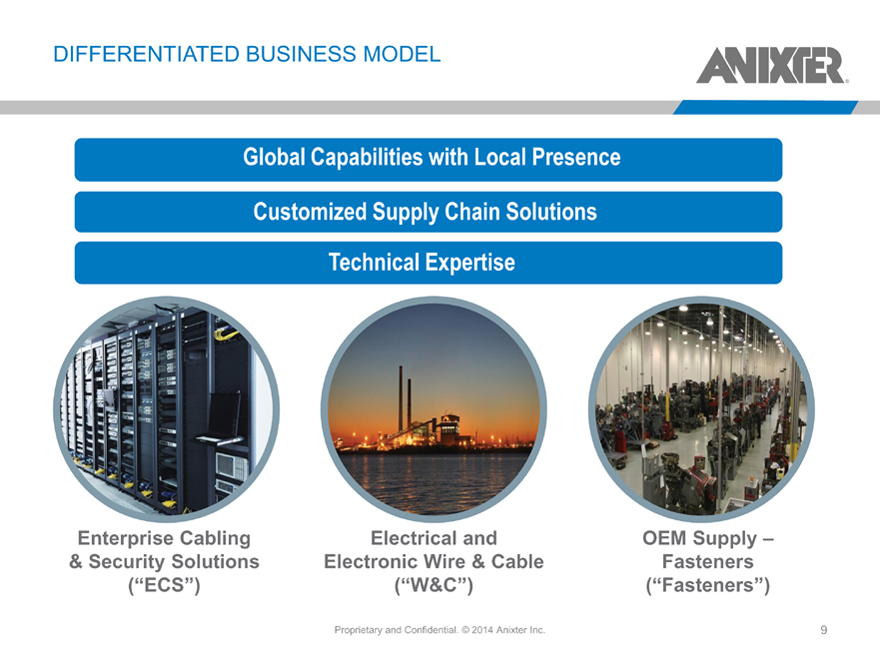
DIFFERENTIATED BUSINESS MODEL
Global Capabilities with Local Presence
Customized Supply Chain Solutions Technical Expertise
Enterprise Cabling
& Security Solutions
(“ECS”)
Electrical and Electronic Wire & Cable
(“W&C”)
OEM Supply – Fasteners
(“Fasteners”)
Proprietary and Confidential. © 2014 Anixter Inc.
9
|
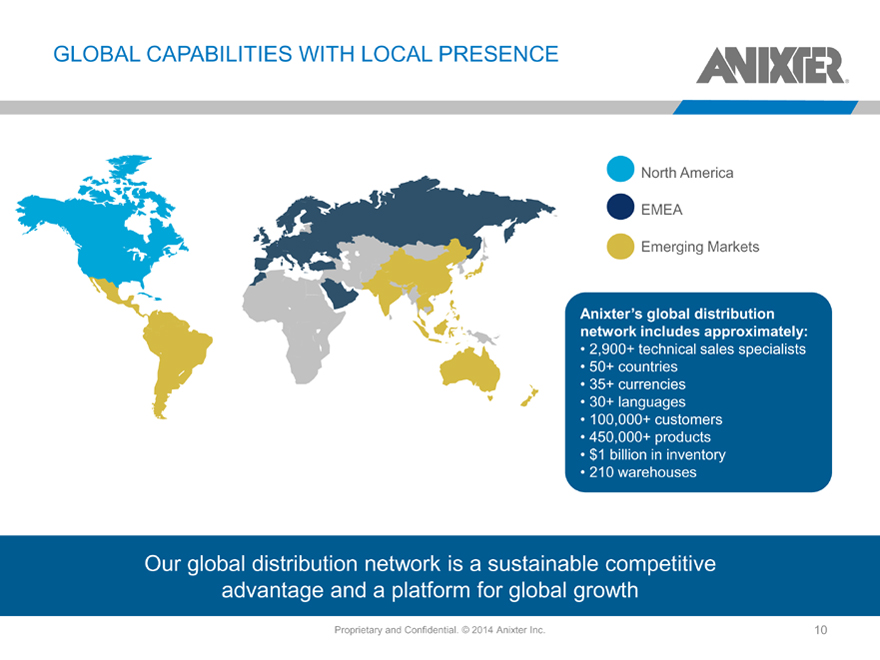
GLOBAL CAPABILITIES WITH LOCAL PRESENCE
North America EMEA
Emerging Markets
Anixter ’s global distribution
network includes approximately:
2,900+ technical sales specialists
50+ countries
35+ currencies
30+ languages
100,000+ customers
450,000+ products
$1 billion in inventory
210 warehouses
Our global distribution network is a sustainable competitive advantage and a platform for global growth
Proprietary and Confidential. © 2014 Anixter Inc.
10
|
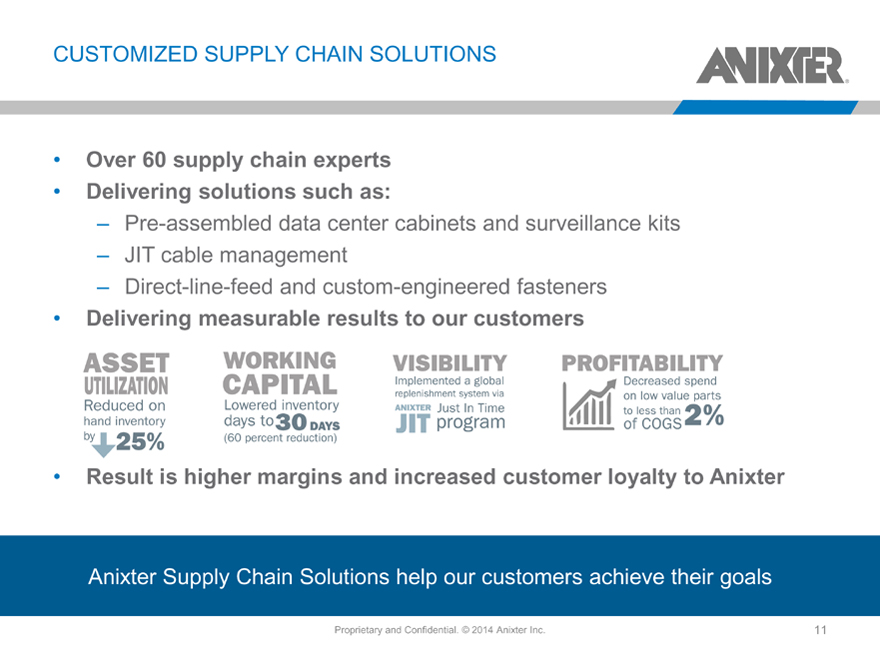
CUSTOMIZED SUPPLY CHAIN SOLUTIONS
Over 60 supply chain experts Delivering solutions such as:
– Pre-assembled data center cabinets and surveillance kits
– JIT cable management
– Direct-line-feed and custom-engineered fasteners
Delivering measurable results to our customers
Result is higher margins and increased customer loyalty to Anixter
Anixter Supply Chain Solutions help our customers achieve their goals
Proprietary and Confidential. © 2014 Anixter Inc.
11
|
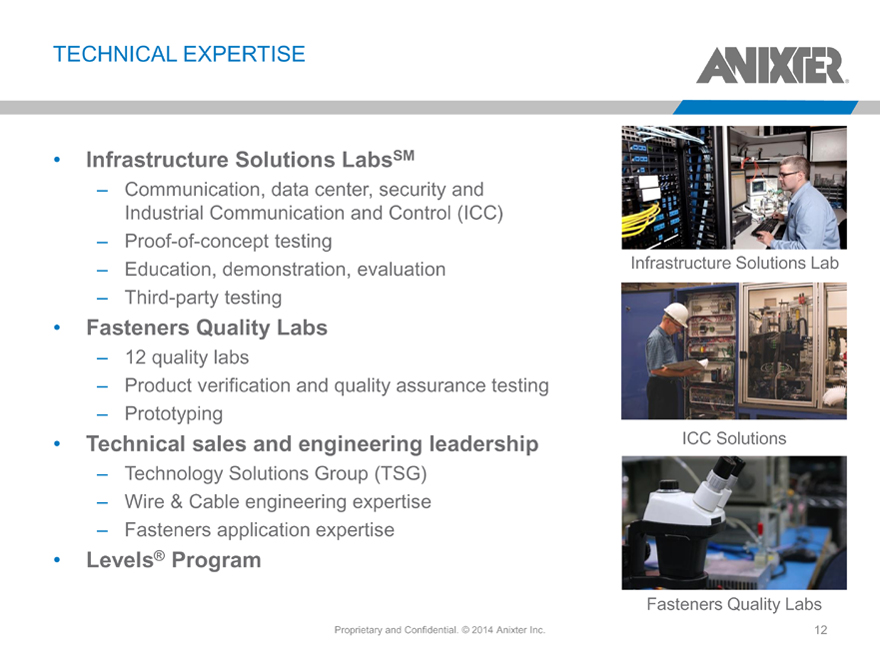
TECHNICAL EXPERTISE
Infrastructure Solutions LabsSM
– Communication, data center, security and Industrial Communication and Control (ICC)
– Proof-of-concept testing
– Education, demonstration, evaluation
– Third-party testing
Fasteners Quality Labs
– 12 quality labs
– Product verification and quality assurance testing
– Prototyping
Technical sales and engineering leadership
– Technology Solutions Group (TSG)
– Wire & Cable engineering expertise
– Fasteners application expertise
Levels® Program
Infrastructure Solutions Lab
ICC Solutions
Fasteners Quality Labs
Proprietary and Confidential. © 2014 Anixter Inc.
12
|
DEMONSTRATED ABILITY TO DRIVE FREE CASH FLOW
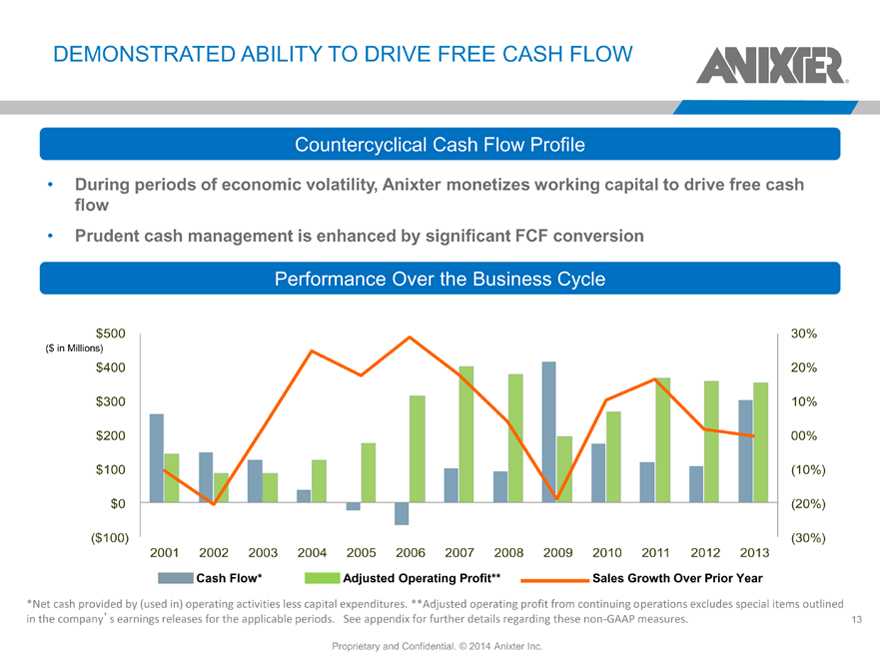
Countercyclical Cash Flow Profile
During periods of economic volatility, Anixter monetizes working capital to drive free cash flow Prudent cash management is enhanced by significant FCF conversion
Performance Over the Business Cycle
$500 30%
($ in Millions)
$400 20%
$300 10%
$200 00%
$100 (10%)
$0 (20%)
($100) (30%)
2001 2002 2003 2004 2005 2006 2007 2008 2009 2010 2011 2012 2013
Cash Flow* Adjusted Operating Profit** Sales Growth Over Prior Year
*Net cash provided by (used in) operating activities less capital expenditures. **Adjusted operating profit from continuing operations excludes special items outlined in the company’s earnings releases for the applicable periods. See appendix for further details regarding these non-GAAP measures.
Proprietary and Confidential. © 2014 Anixter Inc.
13
|
DISCIPLINED AND PRUDENT CAPITAL ALLOCATION
Organic growth
– Support mature markets
– Accelerate growth in newer markets
Strategic acquisitions
– Enhance geographic segment position
– Expand product lines and service offerings
Opportunistic return of value to shareholders
– Share repurchases
– Special dividends
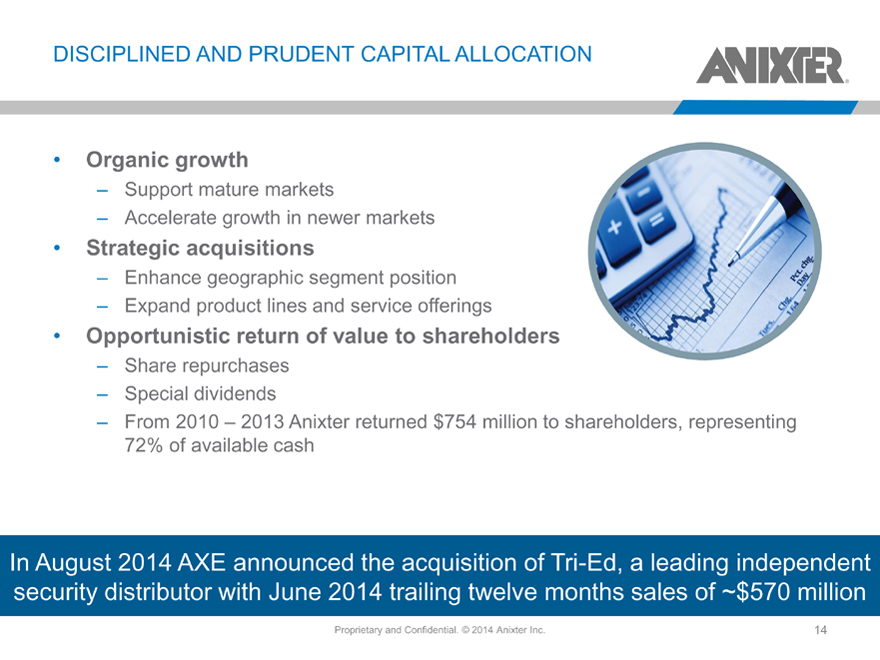
– From 2010 – 2013 Anixter returned $754 million to shareholders, representing 72% of available cash
In August 2014 AXE announced the acquisition of Tri-Ed, a leading independent security distributor with June 2014 trailing twelve months sales of ~$570 million
Proprietary and Confidential. © 2014 Anixter Inc.
14
|
Tri-Ed Acquisition
Proprietary and Confidential. © 2014 Anixter Inc.
15
|
TRI-ED ACQUISITION: STRATEGIC RATIONALE
We continually evaluate opportunities, highly selective in pursuing transactions
Focus on strategic fit, appropriate valuation and risk profile
Expand geographic reach and accelerate growth into target markets
Extend product line and service offerings
Tri-Ed will accelerate our security growth initiative, create a leading global security business, and provide a platform for sustainable profitable growth
Complements our existing enterprise-focused security business
Creates opportunities in the intrusion detection and fire/life safety businesses
Enables expansion with mid-sized integrators
Extensive branch network provides access to the residential end market
Acquisition Highlights
Acquisition multiple of approximately 11.5x (excluding synergies)
Accretive in the first full year of operation, excluding one-time costs
Anixter’s acquisition strategy focuses on opportunities that complement our existing capabilities and help further geographic expansion in targeted regions 16
16
|
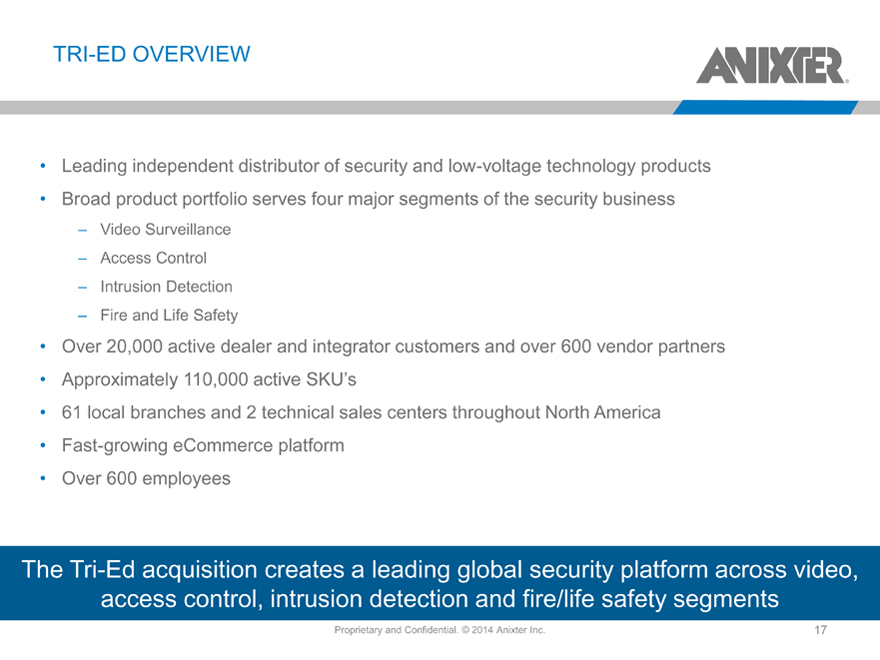
TRI-ED OVERVIEW
Leading independent distributor of security and low-voltage technology products
Broad product portfolio serves four major segments of the security business
– Video Surveillance
– Access Control
– Intrusion Detection
– Fire and Life Safety
Over 20,000 active dealer and integrator customers and over 600 vendor partners
Approximately 110,000 active SKU’s
61 local branches and 2 technical sales centers throughout North America Fast-growing eCommerce platform Over 600 employees
The Tri-Ed acquisition creates a leading global security platform across video, access control, intrusion detection and fire/life safety segments
Proprietary and Confidential. © 2014 Anixter Inc.
17
|
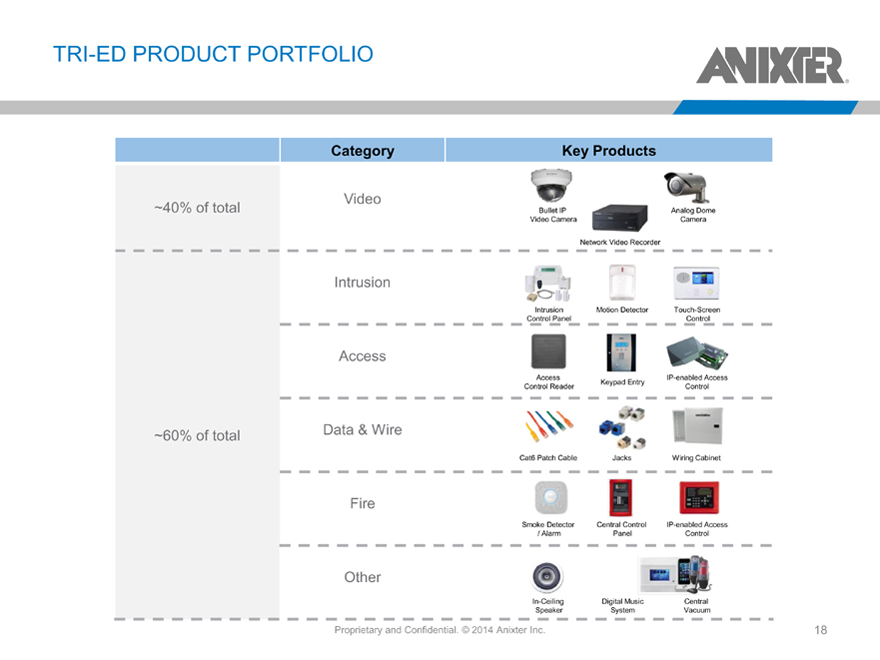
TRI-ED PRODUCT PORTFOLIO
Category Key Products
Video
~40% of total Bullet IP Analog Dome
Video Camera Camera
Network Video Recorder
Intrusion
Intrusion Motion Detector Touch-Screen
Control Panel Control
Access
Access IP-enabled Access
Keypad Entry
Control Reader Control
~60% of total Data & Wire
Cat6 Patch Cable Jacks Wiring Cabinet
Fire
Smoke Detector Central Control IP-enabled Access
/ Alarm Panel Control
Other
In-Ceiling Digital Music Central
Speaker System Vacuum
Proprietary and Confidential. © 2014 Anixter Inc.
18
|
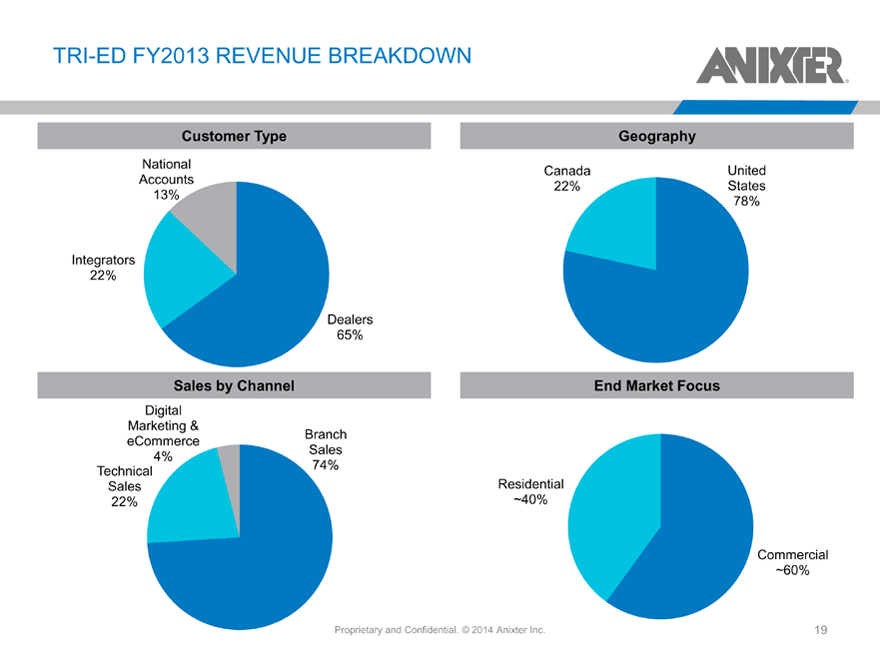
TRI-ED FY2013 REVENUE BREAKDOWN
Customer Type
National
Accounts
13%
Integrators
22%
Dealers
65%
Geography
Canada United
22% States
78%
Sales by Channel
Digital
Marketing &
eCommerce Branch
4% Sales
Technical 74%
Sales
22%
End Market Focus
Residential
~40%
Commercial
~60%
Proprietary and Confidential. © 2014 Anixter Inc.
19
|
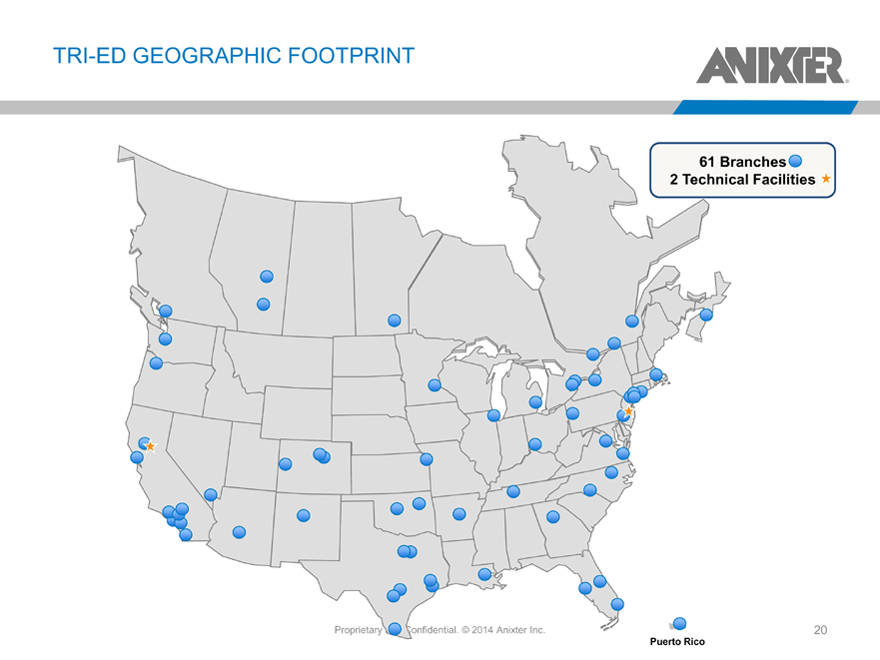
TRI-ED GEOGRAPHIC FOOTPRINT
61 Branches
2 |
| Technical Facilities |
Proprietary and Confidential. © 2014 Anixter Inc.
Puerto Rico
20
|
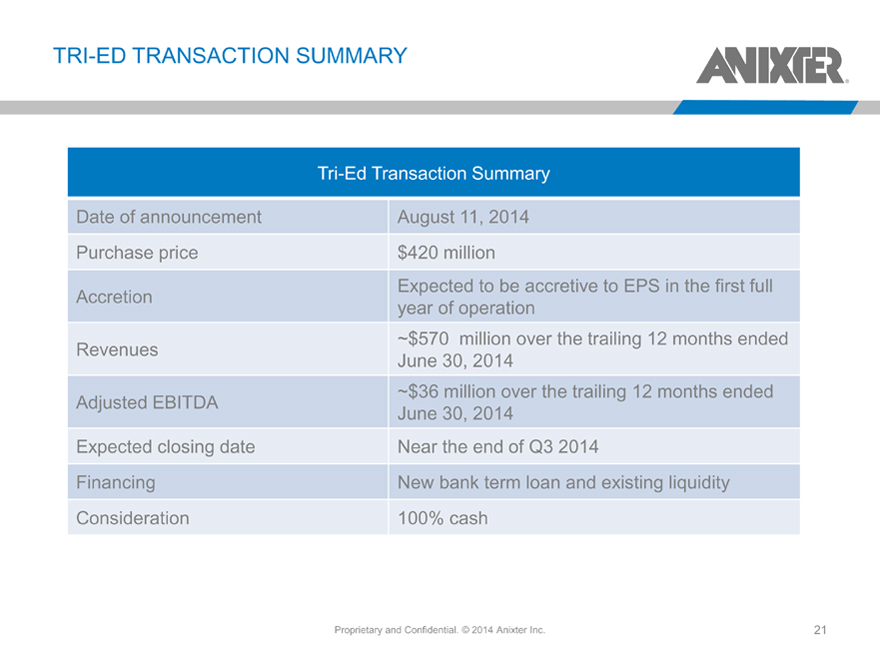
TRI-ED TRANSACTION SUMMARY
Tri-Ed Transaction Summary
Date of announcement August 11, 2014
Purchase price $420 million
Accretion Expected to be accretive to EPS in the first full
year of operation
Revenues ~$570 million over the trailing 12 months ended
June 30, 2014
~$36 million over the trailing 12 months ended
Adjusted EBITDA June 30, 2014
Expected closing date Near the end of Q3 2014
Financing New bank term loan and existing liquidity
Consideration 100% cash
Proprietary and Confidential. © 2014 Anixter Inc.
21
|
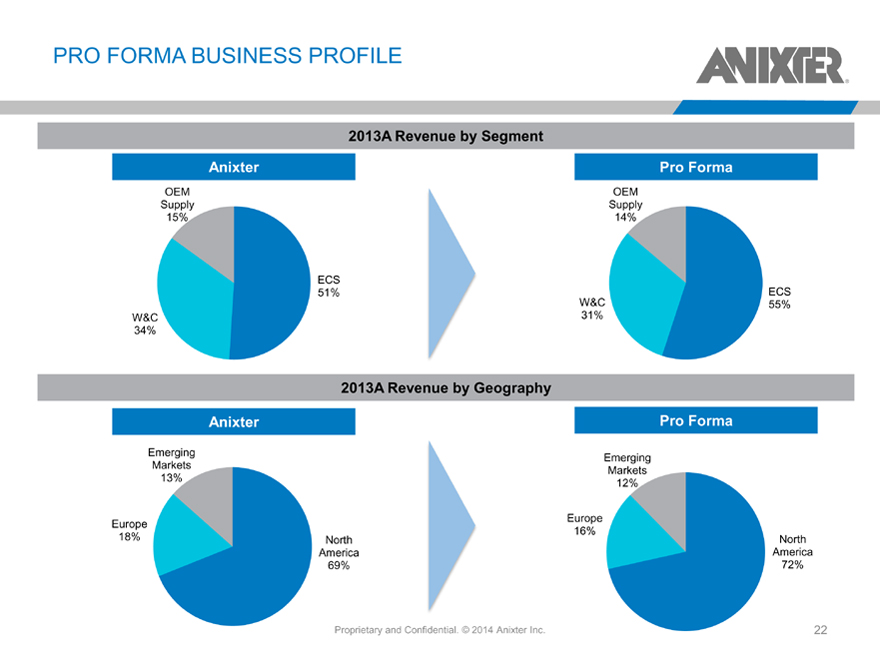
PRO FORMA BUSINESS PROFILE
2013A Revenue by Segment
Anixter
OEM
Supply
15%
ECS
51%
W&C
34%
Pro Forma
OEM
Supply
14%
ECS
W&C 55%
31%
2013A Revenue by Geography
Anixter
Emerging
Markets
13%
Europe
18% North
America
69%
Pro Forma
Emerging
Markets
12%
Europe
16%
North
America
72%
Proprietary and Confidential. © 2014 Anixter Inc.
22
|
2Q 2014 Review
Proprietary and Confidential. © 2014 Anixter Inc.
23
|
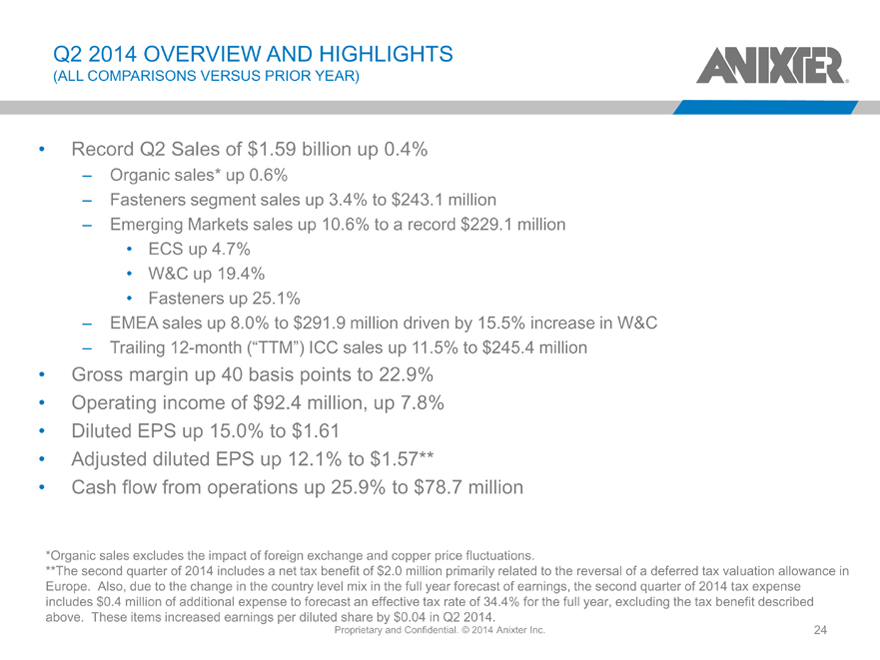
Q2 2014 OVERVIEW AND HIGHLIGHTS
(ALL COMPARISONS VERSUS PRIOR YEAR)
Record Q2 Sales of $1.59 billion up 0.4%
– Organic sales* up 0.6%
– Fasteners segment sales up 3.4% to $243.1 million
– Emerging Markets sales up 10.6% to a record $229.1 million
ECS up 4.7%
W&C up 19.4%
Fasteners up 25.1%
– EMEA sales up 8.0% to $291.9 million driven by 15.5% increase in W&C
– Trailing 12-month (“TTM”) ICC sales up 11.5% to $245.4 million
Gross margin up 40 basis points to 22.9% Operating income of $92.4 million, up 7.8% Diluted EPS up 15.0% to $1.61 Adjusted diluted EPS up 12.1% to $1.57**
Cash flow from operations up 25.9% to $78.7 million
*Organic sales excludes the impact of foreign exchange and copper price fluctuations.
**The second quarter of 2014 includes a net tax benefit of $2.0 million primarily related to the reversal of a deferred tax val uation allowance in Europe. Also, due to the change in the country level mix in the full year forecast of earnings, the second quarter of 2014 t ax expense includes $0.4 million of additional expense to forecast an effective tax rate of 34.4% for the full year, excluding the tax b enefit described above. These items increased earnings per diluted share by $0.04 in Q2 2014.
Proprietary and Confidential. © 2014 Anixter Inc.
24
|
ENTERPRISE CABLING AND SECURITY SOLUTIONS REVIEW
Q2 2014 ECS sales of $817.4 million
– Up 0.4% versus Q2 2013 (organic* sales up 0.8%)
– Up 7.5% versus Q1 2014
– 63 billing days in the current quarter versus 64 in Q2 2013 and 65 in Q1 2014
Overall the global data infrastructure market is gradually improving
– Operating margin of 5.4% up 20 bps YOY, up 70 bps sequentially
– North American market trends improving, reflected in the 8.0% organic* sequential revenue growth
– Emerging Markets region remains strong, up 6.6% on an organic* basis
– Security sales decreased 2%, accounting for approximately 26% of ECS
– Operating leverage of 60.4% reflecting improved margins and excellent expense control
Q2 2014 ECS Sales Mix
$138 North America
$83 Europe
$596
Emerging
Markets
$ Millions
ECS Quarterly Sales ($ millions)
and YOY Growth
$ 850 3.0%
$ 825 2.0%
1.0%
$ 800 0.0%
$ 775 -1.0%
$ 750 -2.0%
-3.0%
$ 725 -4.0%
$ 700 -5.0%
2Q12 3Q12 4Q12 1Q13 2Q13 3Q13 4Q13 1Q 14 2Q14
* |
| Organic sales excludes the impact of foreign exchange |
Proprietary and Confidential. © 2014 Anixter Inc.
25
|
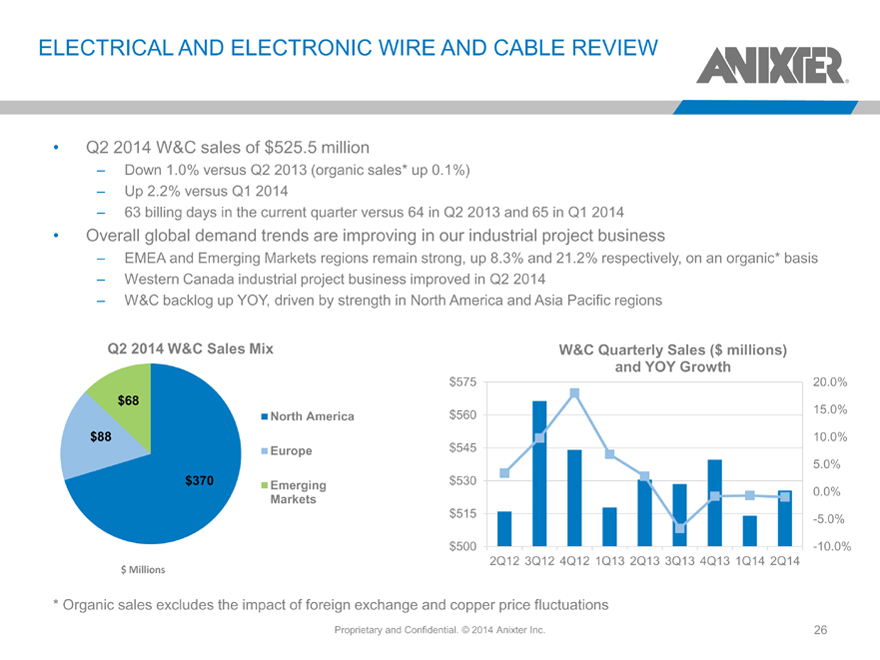
ELECTRICAL AND ELECTRONIC WIRE AND CABLE REVIEW
Q2 2014 W&C sales of $525.5 million
– Down 1.0% versus Q2 2013 (organic sales* up 0.1%)
– Up 2.2% versus Q1 2014
– 63 billing days in the current quarter versus 64 in Q2 2013 and 65 in Q1 2014
Overall global demand trends are improving in our industrial project business
– EMEA and Emerging Markets regions remain strong, up 8.3% and 21.2% respectively, on an organic* basis
– Western Canada industrial project business improved in Q2 2014
– W&C backlog up YOY, driven by strength in North America and Asia Pacific regions
Q2 2014 W&C Sales Mix
$68
North America
$88
Europe
$370 Emerging
Markets
$ Millions
W&C Quarterly Sales ($ millions)
and YOY Growth
$ 575 20.0%
$ 560 15.0%
10.0%
$ 545
5.0%
$ 530
0.0%
$ 515 -5.0%
$ 500 -10.0%
2Q12 3Q12 4Q12 1Q13 2Q13 3Q13 4Q13 1Q14 2Q14
* |
| Organic sales excludes the impact of foreign exchange and copper price fluctuations |
Proprietary and Confidential. © 2014 Anixter Inc.
26
|
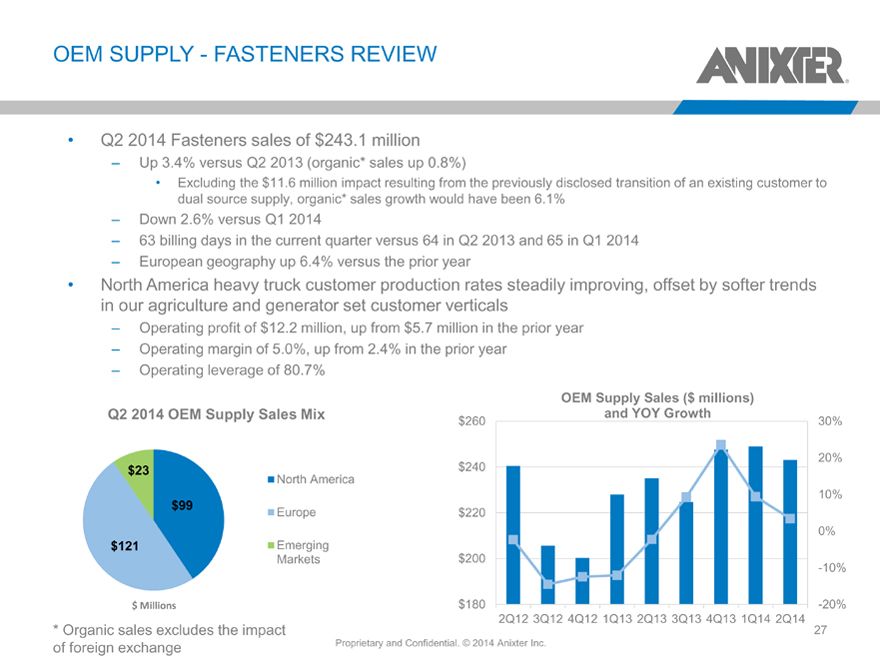
OEM SUPPLY—FASTENERS REVIEW
Q2 2014 Fasteners sales of $243.1 million
– Up 3.4% versus Q2 2013 (organic* sales up 0.8%)
Excluding the $11.6 million impact resulting from the previously disclosed transition of an existing customer to dual source supply, organic* sales growth would have been 6.1%
– Down 2.6% versus Q1 2014
– 63 billing days in the current quarter versus 64 in Q2 2013 and 65 in Q1 2014
– European geography up 6.4% versus the prior year
North America heavy truck customer production rates steadily improving, offset by softer trends in our agriculture and generator set customer verticals
– Operating profit of $12.2 million, up from $5.7 million in the prior year
– Operating margin of 5.0%, up from 2.4% in the prior year
– Operating leverage of 80.7%
Q2 2014 OEM Supply Sales Mix
$23
North America
$99 Europe
$121 Emerging
Markets
$ Millions
OEM Supply Sales ($ millions)
and YOY Growth
$ 260 30%
20%
$ 240
10%
$ 220
0%
$ 200
-10%
$ 180 -20%
2Q12 3Q12 4Q12 1Q13 2Q13 3Q13 4Q13 1Q14 2Q14
* |
| Organic sales excludes the impact of foreign exchange |
Proprietary and Confidential. © 2014 Anixter Inc.
27
|
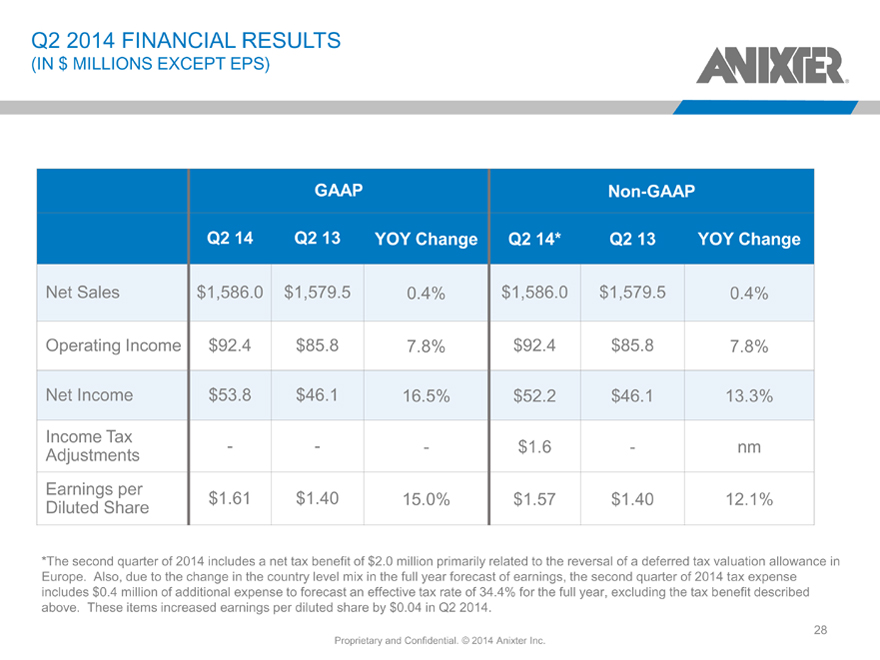
Q2 2014 FINANCIAL RESULTS
(IN $ MILLIONS EXCEPT EPS)
GAAP Non-GAAP
Q2 14 Q2 13 YOY Change Q2 14* Q2 13 YOY Change
Net Sales $1,586.0 $1,579.5 0.4% $1,586.0 $1,579.5 0.4%
Operating Income $92.4 $85.8 7.8% $92.4 $85.8 7.8%
Net Income $53.8 $46.1 16.5% $52.2 $46.1 13.3%
Income Tax
Adjustments ——— $1.6 — nm
Earnings per
Diluted Share $1.61 $1.40 15.0% $1.57 $1.40 12.1%
*The second quarter of 2014 includes a net tax benefit of $2.0 million primarily related to the reversal of a deferred tax val uation allowance in Europe. Also, due to the change in the country level mix in the full year forecast of earnings, the second quarter of 2014 t ax expense includes $0.4 million of additional expense to forecast an effective tax rate of 34.4% for the full year, excluding the tax b enefit described above. These items increased earnings per diluted share by $0.04 in Q2 2014.
Proprietary and Confidential. © 2014 Anixter Inc.
28
|
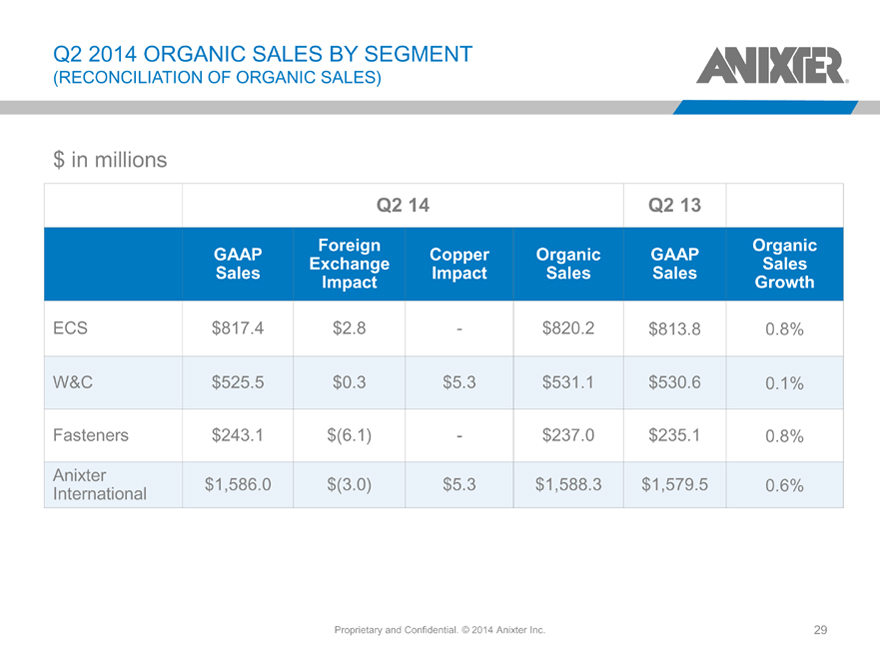
Q2 2014 ORGANIC SALES BY SEGMENT
(RECONCILIATION OF ORGANIC SALES)
$ in millions
Q2 14 Q2 13
Foreign Organic
GAAP Copper Organic GAAP
Exchange Sales
Sales Impact Sales Sales
Impact Growth
ECS $817.4 $2.8 — $820.2 $813.8 0.8%
W&C $525.5 $0.3 $ 5.3 $531.1 $530.6 0.1%
Fasteners $243.1 $(6.1) — $237.0 $235.1 0.8%
Anixter
International $1,586.0 $(3.0) $ 5.3 $1,588.3 $1,579.5 0.6%
Proprietary and Confidential. © 2014 Anixter Inc.
29
|
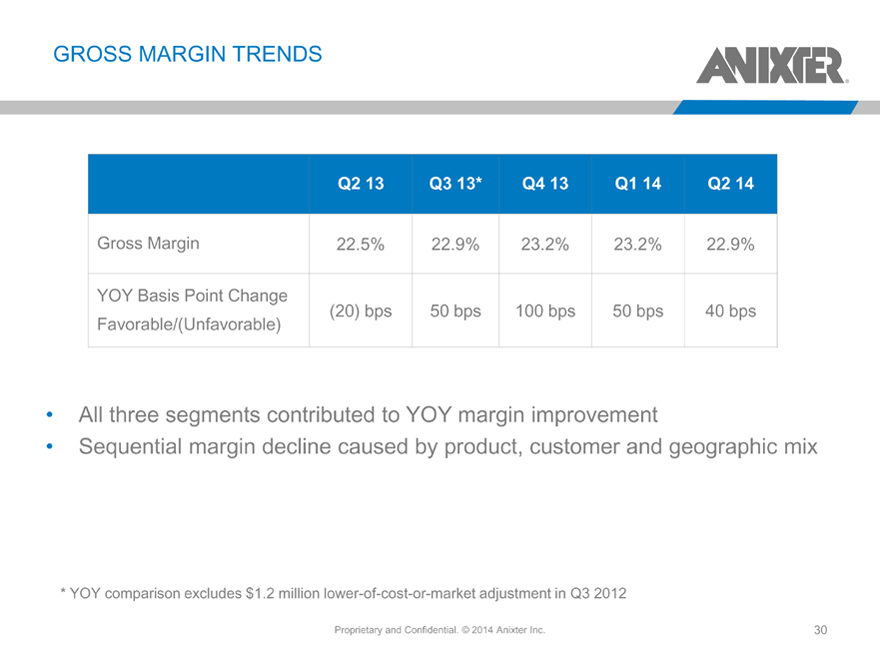
GROSS MARGIN TRENDS
Q2 13 Q3 13* Q4 13 Q1 14 Q2 14
Gross Margin 22.5% 22.9% 23.2% 23.2% 22.9%
YOY Basis Point Change
(20) |
| bps 50 bps 100 bps 50 bps 40 bps |
Favorable/(Unfavorable)
All three segments contributed to YOY margin improvement
Sequential margin decline caused by product, customer and geographic mix
* |
| YOY comparison excludes $1.2 million lower-of-cost-or-market adjustment in Q3 2012 |
Proprietary and Confidential. © 2014 Anixter Inc.
30
|
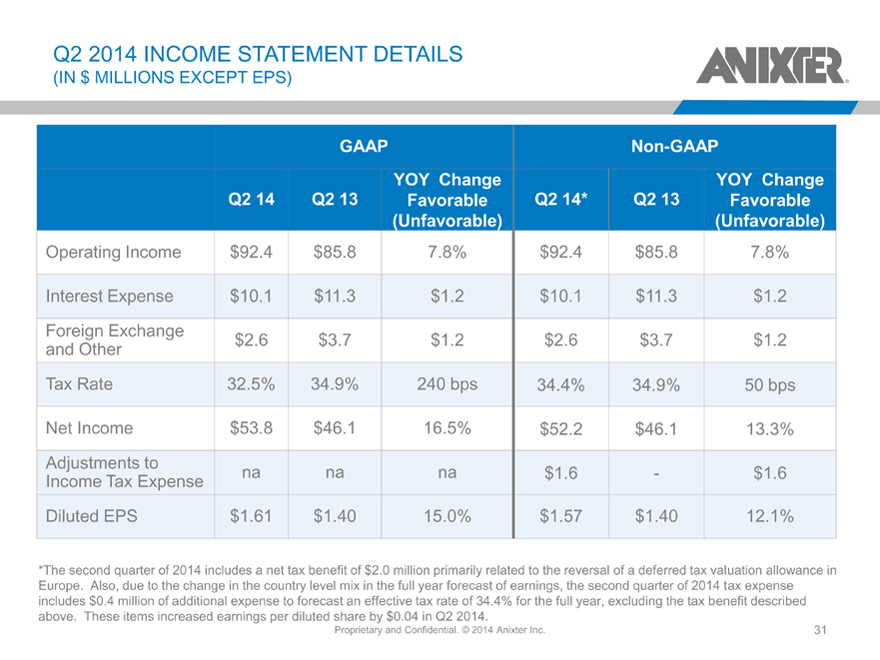
Q2 2014 INCOME STATEMENT DETAILS
(IN $ MILLIONS EXCEPT EPS)
GAAP Non-GAAP
YOY Change YOY Change
Q2 14 Q2 13 Favorable Q2 14* Q2 13 Favorable
(Unfavorable) (Unfavorable)
Operating Income $92.4 $85.8 7.8% $92.4 $85.8 7.8%
Interest Expense $10.1 $11.3 $ 1.2 $10.1 $11.3 $1.2
Foreign Exchange
and Other $2.6 $3.7 $ 1.2 $2.6 $3.7 $1.2
Tax Rate 32.5% 34.9% 240 bps 34.4% 34.9% 50 bps
Net Income $53.8 $46.1 16.5% $52.2 $46.1 13.3%
Adjustments to
Income Tax Expense na na na $1.6 — $1.6
Diluted EPS $1.61 $1.40 15.0% $1.57 $1.40 12.1%
*The second quarter of 2014 includes a net tax benefit of $2.0 million primarily related to the reversal of a deferred tax valuation allowance in Europe. Also, due to the change in the country level mix in the full year forecast of earnings, the second quarter of 2014 tax expense includes $0.4 million of additional expense to forecast an effective tax rate of 34.4% for the full year, excluding the tax benefit described above. These items increased earnings per diluted share by $0.04 in Q2 2014.
Proprietary and Confidential. © 2014 Anixter Inc.
31
|
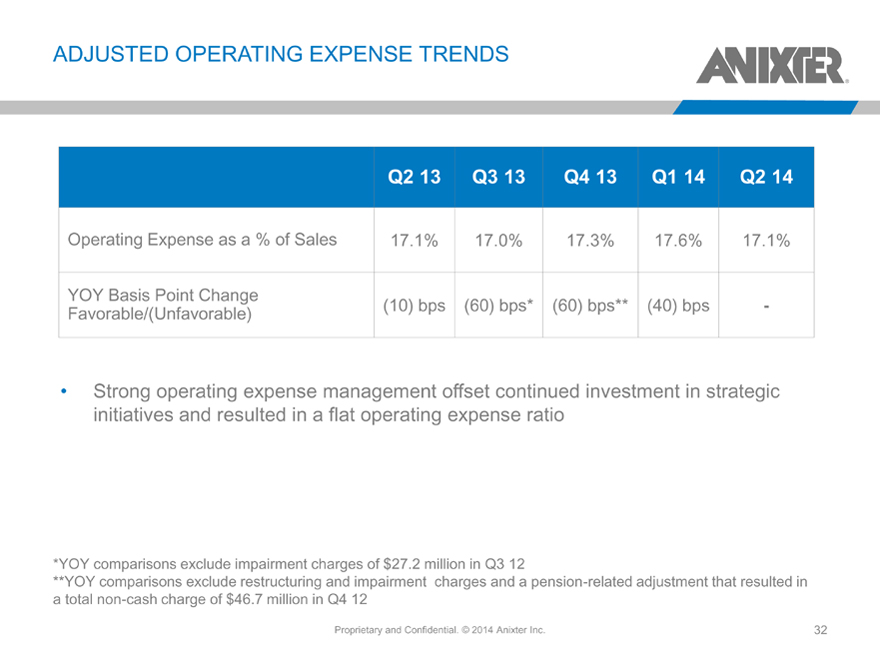
ADJUSTED OPERATING EXPENSE TRENDS
Q2 13 Q3 13 Q4 13 Q1 14 Q2 14
Operating Expense as a % of Sales 17.1% 17.0% 17.3% 17.6% 17.1%
YOY Basis Point Change
Favorable/(Unfavorable) (10) bps (60) bps* (60) bps** (40) bps -
Strong operating expense management offset continued investment in strategic initiatives and resulted in a flat operating expense ratio
*YOY comparisons exclude impairment charges of $27.2 million in Q3 12
**YOY comparisons exclude restructuring and impairment charges and a pension -related adjustment that resulted in a total non-cash charge of $46.7 million in Q4 12
Proprietary and Confidential. © 2014 Anixter Inc.
32
|
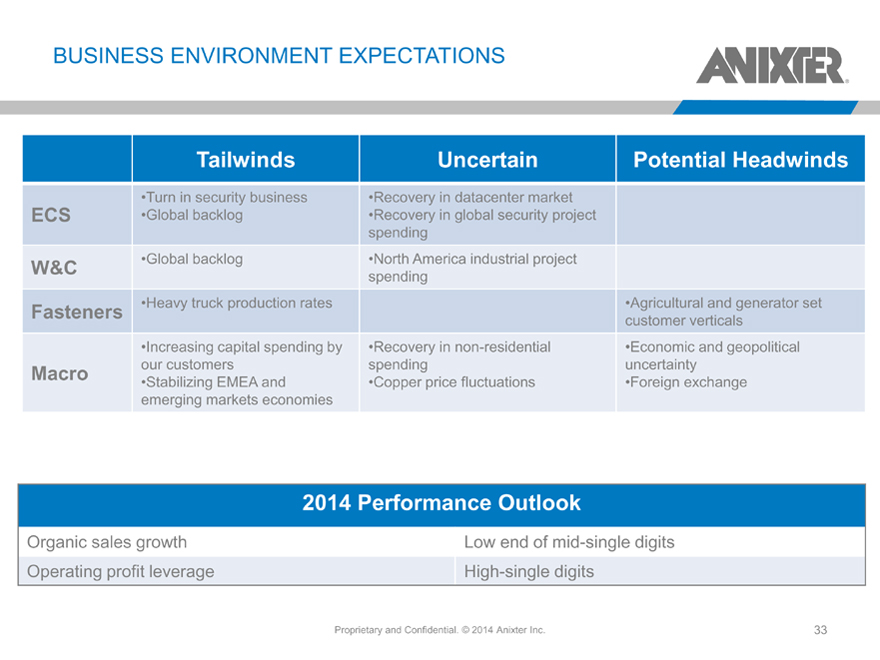
BUSINESS ENVIRONMENT EXPECTATIONS
Tailwinds Uncertain Potential Headwinds
Turn in security business Recovery in datacenter market
ECS Global backlog Recovery in global security project
spending
W&C Global backlog North America industrial project
spending
Fasteners Heavy truck production rates Agricultural and generator set
customer verticals
Increasing capital spending by Recovery in non -residential Economic and geopolitical
Macro our customers spending uncertainty
Stabilizing EMEA and Copper price fluctuations Foreign exchange
emerging markets economies
2014 Performance Outlook
Organic sales growth Low end of mid-single digits
Operating profit leverage High-single digits
Proprietary and Confidential. © 2014 Anixter Inc.
33
|
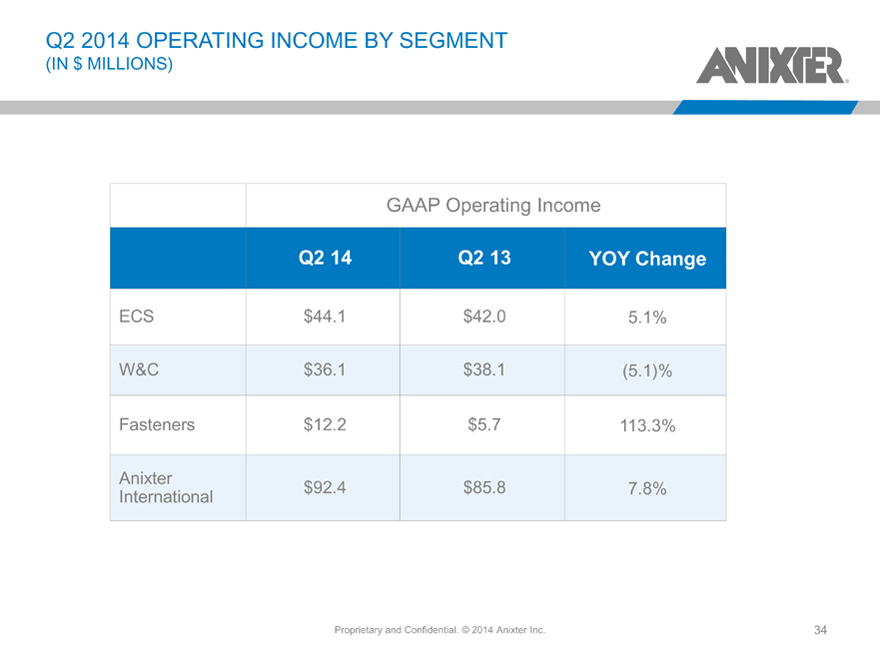
Q2 2014 OPERATING INCOME BY SEGMENT
(IN $ MILLIONS)
GAAP Operating Income
Q2 14 Q2 13 YOY Change
ECS $ 44.1 $42.0 5.1%
W&C $ 36.1 $38.1 (5.1)%
Fasteners $ 12.2 $5.7 113.3%
Anixter
International $ 92.4 $85.8 7.8%
Proprietary and Confidential. © 2014 Anixter Inc.
34
|
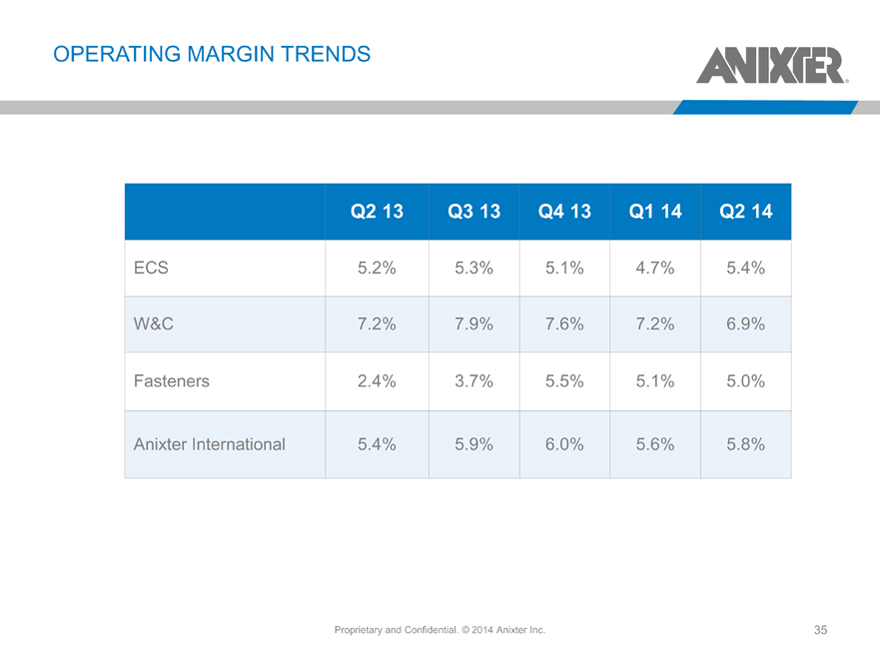
OPERATING MARGIN TRENDS
Q2 13 Q3 13 Q4 13 Q1 14 Q2 14
ECS 5.2% 5.3% 5.1% 4.7% 5.4%
W&C 7.2% 7.9% 7.6% 7.2% 6.9%
Fasteners 2.4% 3.7% 5.5% 5.1% 5.0%
Anixter International 5.4% 5.9% 6.0% 5.6% 5.8%
Proprietary and Confidential. © 2014 Anixter Inc.
35
|
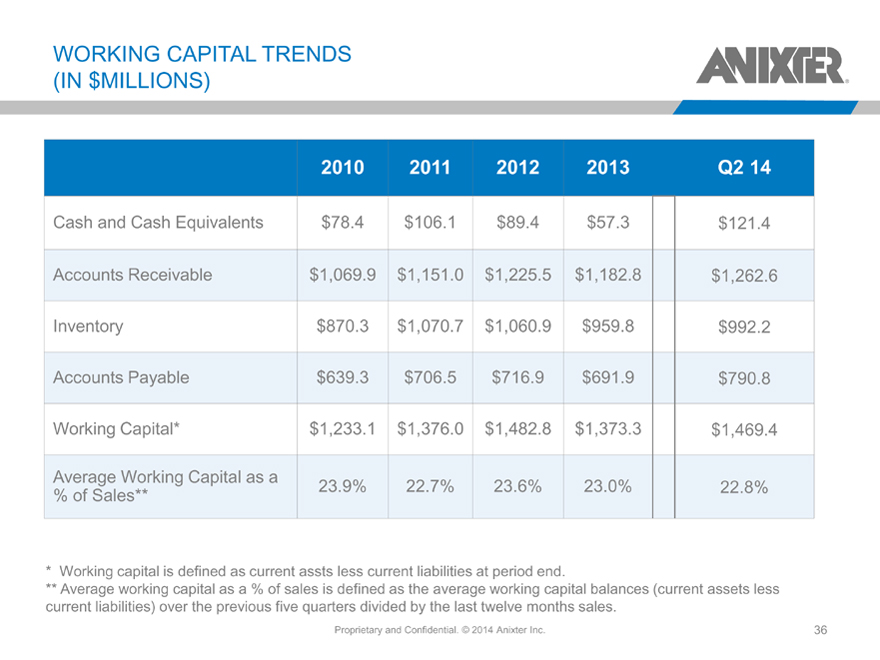
WORKING CAPITAL TRENDS (IN $MILLIONS)
2010 2011 2012 2013 Q2 14
Cash and Cash Equivalents $78.4 $106.1 $89.4 $57.3 $121.4
Accounts Receivable $1,069.9 $1,151.0 $1,225.5 $1,182.8 $1,262.6
Inventory $870.3 $1,070.7 $1,060.9 $959.8 $992.2
Accounts Payable $639.3 $706.5 $716.9 $691.9 $790.8
Working Capital* $1,233.1 $1,376.0 $1,482.8 $1,373.3 $1,469.4
Average Working Capital as a
% of Sales** 23.9% 22.7% 23.6% 23.0% 22.8%
* |
| Working capital is defined as current assts less current liabilities at period end. |
** Average working capital as a % of sales is defined as the average working capital balances (current assets less current liabilities) over the previous five quarters divided by the last twelve months sales.
Proprietary and Confidential. © 2014 Anixter Inc.
36
|
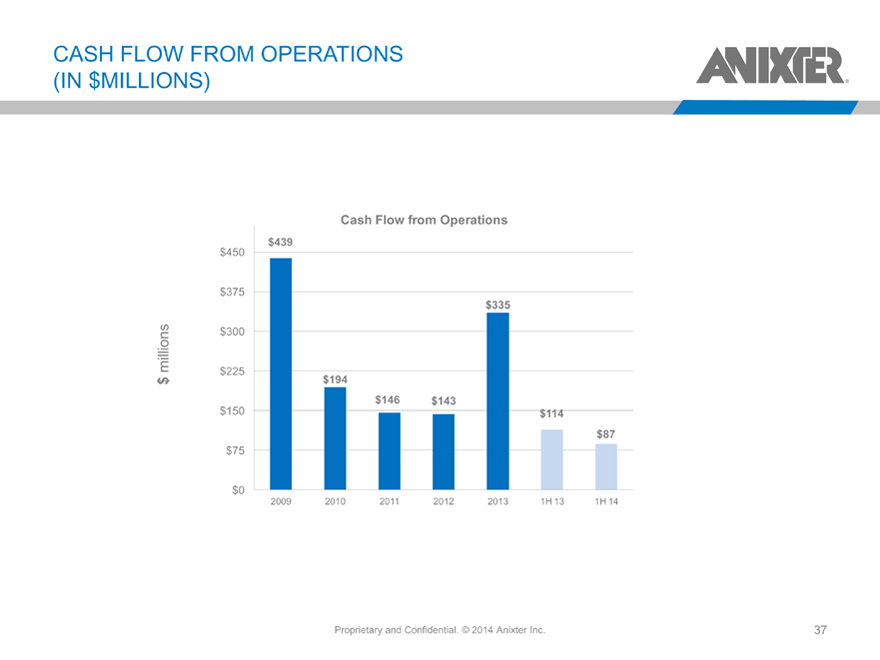
CASH FLOW FROM OPERATIONS (IN $MILLIONS)
Cash Flow from Operations
$439
$450
$375
$335
$300
millions $225
$ $194
$146 $143
$150 $114
$87
$75
$0
2009 2010 2011 2012 2013 1H 13 1H 14
Proprietary and Confidential. © 2014 Anixter Inc.
37
|
2H 2014 Outlook
Proprietary and Confidential. © 2014 Anixter Inc.
38
|
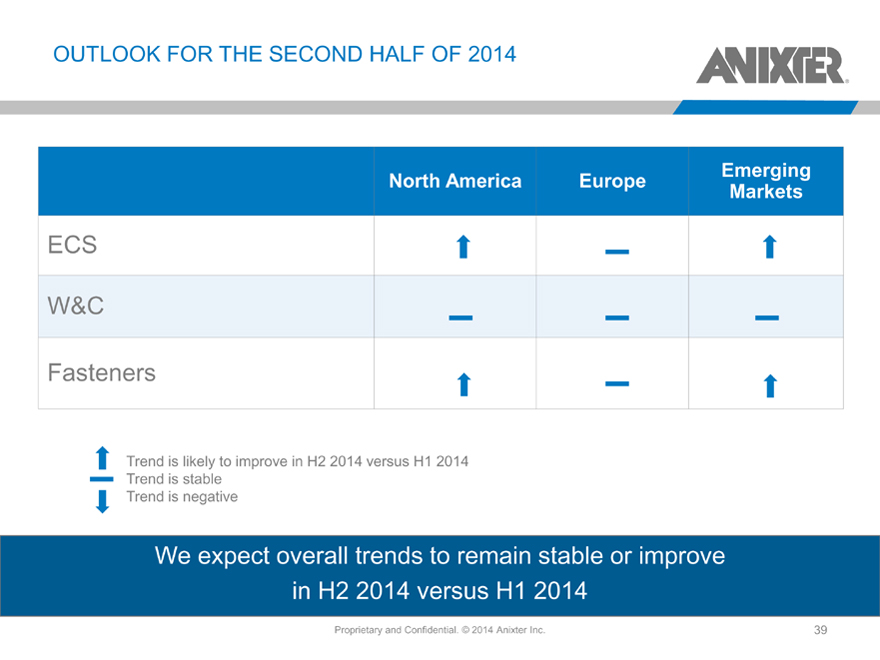
OUTLOOK FOR THE SECOND HALF OF 2014
Emerging
North America Europe Markets
ECS
W&C
Fasteners
Trend is likely to improve in H2 2014 versus H1 2014 Trend is stable Trend is negative
We expect overall trends to remain stable or improve in H2 2014 versus H1 2014
Proprietary and Confidential. © 2014 Anixter Inc.
39
|
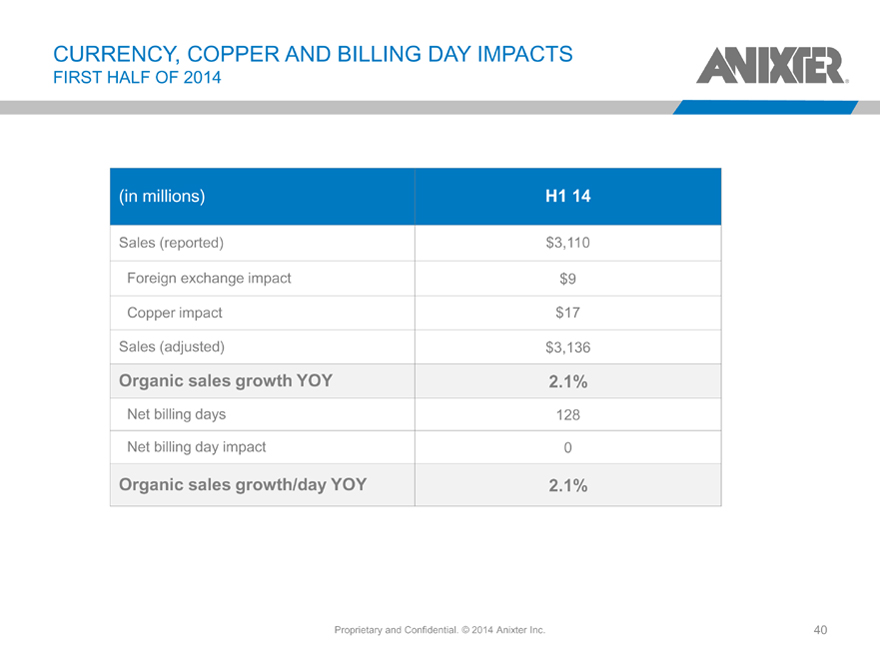
CURRENCY, COPPER AND BILLING DAY IMPACTS
FIRST HALF OF 2014
(in millions) H1 14
Sales (reported) $3,110
Foreign exchange impact $9
Copper impact $17
Sales (adjusted) $3,136
Organic sales growth YOY 2.1%
Net billing days 128
Net billing day impact 0
Organic sales growth/day YOY 2.1%
Proprietary and Confidential. © 2014 Anixter Inc.
40
|
OUTLOOK FOR THE SECOND HALF OF 2014
To help level-set and provide clarity, we are providing further insight into our estimates of the impacts of foreign exchange, copper and net billing days on second half 2014 organic growth metrics We are not setting a precedent and do not intend to provide EPS guidance Will continue to provide directional guidance on organic revenue growth and operating profit leverage The impact of FX, copper and billing days is projected to have a much different impact on the second half compared to the first half
Proprietary and Confidential. © 2014 Anixter Inc.
41
|
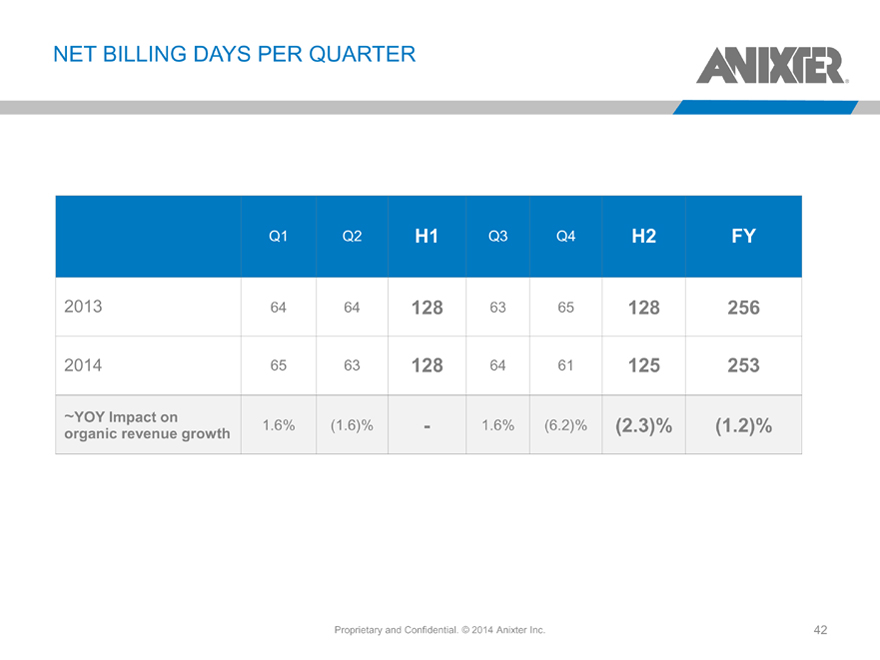
NET BILLING DAYS PER QUARTER
Q1 Q2 H1 Q3 Q4 H2 FY
2013 64 64 128 63 65 128 256
2014 65 63 128 64 61 125 253
~YOY Impact on 1.6% (1.6)% — 1.6% (6.2)% (2.3)% (1.2)%
organic revenue growth
Proprietary and Confidential. © 2014 Anixter Inc.
42
|
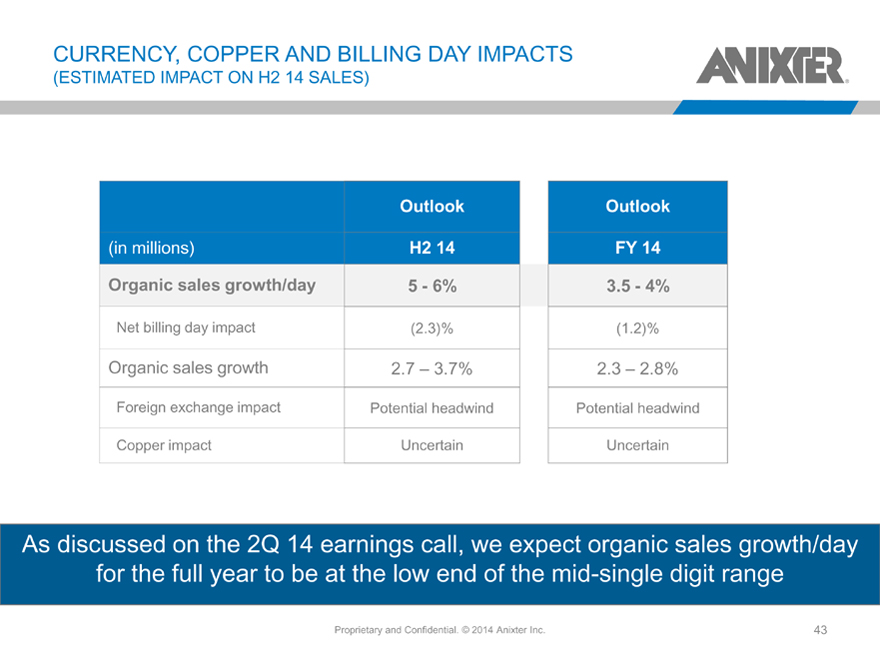
CURRENCY, COPPER AND BILLING DAY IMPACTS
(ESTIMATED IMPACT ON H2 14 SALES)
Outlook Outlook
(in millions) H2 14 FY 14
Organic sales growth/day 5—6% 3.5—4%
Net billing day impact (2.3)% (1.2)%
Organic sales growth 2.7 – 3.7% 2.3 – 2.8%
Foreign exchange impact Potential headwind Potential headwind
Copper impact Uncertain Uncertain
As discussed on the 2Q 14 earnings call, we expect organic sales growth/day for the full year to be at the low end of the mid-single digit range
Proprietary and Confidential. © 2014 Anixter Inc.
43
|
Appendix
Proprietary and Confidential. © 2014 Anixter Inc.
44
|
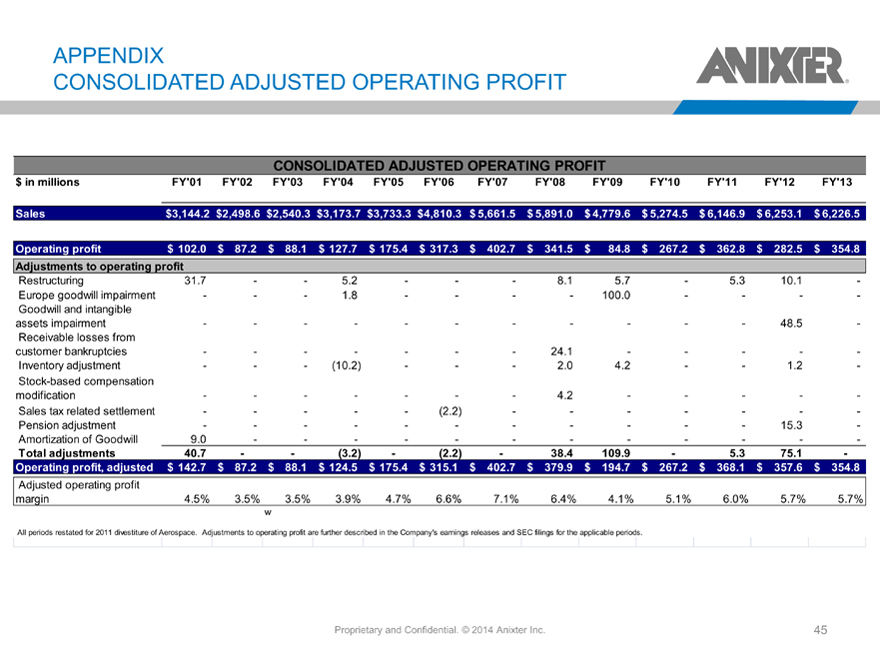
APPENDIX
CONSOLIDATED ADJUSTED OPERATING PROFIT
CONSOLIDATED ADJUSTED OPERATING PROFIT
$ in millions FY’01 FY’02 FY’03 FY’04 FY’05 FY’06 FY’07 FY’08 FY’09 FY’10 FY’11 FY’12 FY’13
Sales $3,144.2 $2,498.6 $2,540.3 $3,173.7 $3,733.3 $4,810.3 $ 5,661.5 $ 5,891.0 $ 4,779.6 $ 5,274.5 $ 6,146.9 $ 6,253.1 $ 6,226.5
Operating profit $ 102.0 $ 87.2 $ 88.1 $ 127.7 $ 175.4 $ 317.3 $ 402.7 $ 341.5 $ 84.8 $ 267.2 $ 362.8 $ 282.5 $ 354.8
Adjustments to operating profit
Restructuring 31.7 — — 5.2 ——— 8.1 5.7 — 5.3 10.1 -
Europe goodwill impairment —— — 1.8 ———— 100.0 ——— -
Goodwill and intangible
assets impairment —— —————— ——— 48.5 -
Receivable losses from
customer bankruptcies —— ————— 24.1 ———— -
Inventory adjustment —— — (10.2) ——— 2.0 4.2 —— 1.2 -
Stock-based compensation
modification —— ————— 4.2 ———— -
Sales tax related settlement —— ——— (2.2) —— ———— -
Pension adjustment —— —————— ——— 15.3 -
Amortization of Goodwill 9.0 — —————— ———— -
Total adjustments 40.7 — — (3.2) — (2.2) — 38.4 109.9 — 5.3 75.1 -
Operating profit, adjusted $ 142.7 $ 87.2 $ 88.1 $ 124.5 $ 175.4 $ 315.1 $ 402.7 $ 379.9 $ 194.7 $ 267.2 $ 368.1 $ 357.6 $ 354.8
Adjusted operating profit
margin 4.5% 3.5% 3.5% 3.9% 4.7% 6.6% 7.1% 6.4% 4.1% 5.1% 6.0% 5.7% 5.7%
All periods restated for 2011 divestiture of Aerospace. Adjustments to operating profit are further described in the Company’s earnings releases and SEC filings for the applicable periods.
Proprietary and Confidential. © 2014 Anixter Inc.
45
|
Investor Contacts:
Ted Dosch EVP and CFO
Ted.dosch@anixter.com
224-521-4291
Lisa Micou Meers, CFA VP of Investor Relations
Lisa.meers@anixter.com
224-521-8895
46
