 1 ANIXTER ANNOUNCES ACQUISITION OF HD SUPPLY’S POWER SOLUTIONS BUSINESS JULY 15, 2015 Products. Technology. Services. Delivered Globally. Exhibit 99.2 |
 SAFE HARBOR AND NON-GAAP FINANCIAL MEASURES 2 Safe Harbor Statement Statements in this presentation regarding the proposed transaction, the expected timetable for completing the transaction, and any other statements about our managements’ future expectations, beliefs, goals, plans or prospects constitute forward looking statements within the meaning of the Private Securities Litigation Reform Act of 1995. Any statements that are not statements of historical fact should also be considered to be forward looking statements. There are a number of important factors that could cause actual events to differ materially from those indicated by such forward looking statements, including: the ability to consummate the transaction; the risk that regulatory approvals required for the contemplated transaction are not obtained or are obtained subject to conditions that are not anticipated; the risk that the financing required to fund the transaction is not obtained; the risk that the other conditions to the closing of the transaction are not satisfied; potential adverse reactions or changes to business or employee relationships, including those resulting from the announcement or completion of the transaction; uncertainties as to the timing of the closing; any changes in general economic and/or industry specific conditions; and the other factors described in our Annual Report on Form 10-K for the year ended January 2, 2015 and our most recent Quarterly Reports on Form 10-Q each filed with the Securities and Exchange Commission. We expressly disclaim any intention or obligation to update any forward looking statements as a result of developments occurring after the date of this presentation. Non-GAAP Financial Measures This presentation includes certain financial measures computed using non-GAAP components as defined by the SEC. Non-GAAP financial measures provide insight into selected financial information and should be evaluated in the context in which they are presented. These non- GAAP financial measures have limitations as analytical tools, and should not be considered in isolation from, or as a substitute for, financial information presented in compliance with GAAP. Non-GAAP financial measures may not be comparable to similarly titled amounts reported by other companies. Management does not use these non-GAAP financial measures for any purpose other than the reasons stated above. EBITDA is defined as net income from continuing operations before interest, income taxes, depreciation and amortization. Adjusted EBITDA is defined as EBITDA before foreign exchange and other non-operating expense and non-cash stock-based compensation, excluding the other special items from reported financial results, as defined above. Adjusted EBITDA is presented because we believe it is a useful indicator of our performance and our ability to meet debt service requirements. It is not, however, intended as an alternative measure of operating results or cash flow from operations as determined in accordance with generally accepted accounting principles. |
 AGENDA • Strategic Rationale • Power Solutions Overview • Transaction Summary 3 |
 COMPELLING STRATEGIC RATIONALE • Transforms Anixter into a leading North American electrical and utility distribution platform • Strengthens Anixter’s product offering, providing a broader product portfolio, new supplier relationships and new customer verticals • Offers significant revenue and cost synergy potential • Delivers attractive financial returns 4 1 1 2 2 3 3 4 4 Acquisition positions Anixter to deliver significant shareholder value and drive sustainable long-term growth |
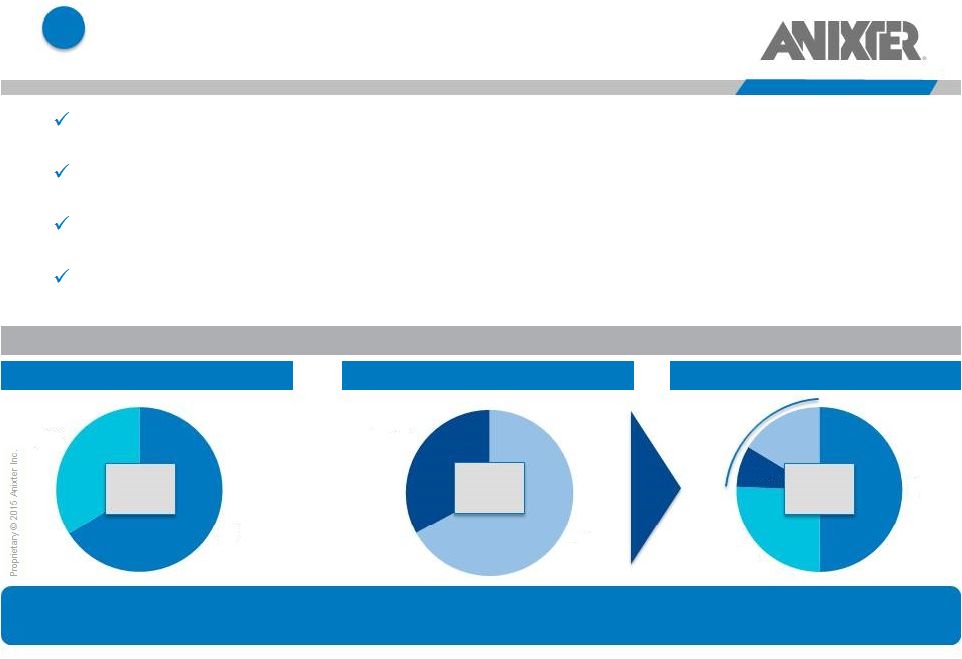 TRANSFORMS ANIXTER INTO A LEADING NORTH AMERICAN ELECTRICAL AND UTILITY DISTRIBUTION PLATFORM Provides immediate, industry-leading scale in electrical and utility markets Significantly expands electrical and utility product portfolio and supplier relationships Enhances W&C segment competitive position Increases exposure to markets with attractive growth prospects 5 Power Solutions advances our strategic imperatives SIMPLER STRUCTURE. SHARPER FOCUS Revenue Mix * Anixter Pro Forma for Tri-Ed Power Solutions Pro Forma Power Solutions 24% *Anixter fiscal year ending January 2, 2015 and Power Solutions fiscal year ending February 1, 2015 1 1 ECS 66% W&C 34% Utility 67% Electrical 33% ECS 50% W&C 26% Electrical Utility $1.9bn $7.8bn $5.9bn |
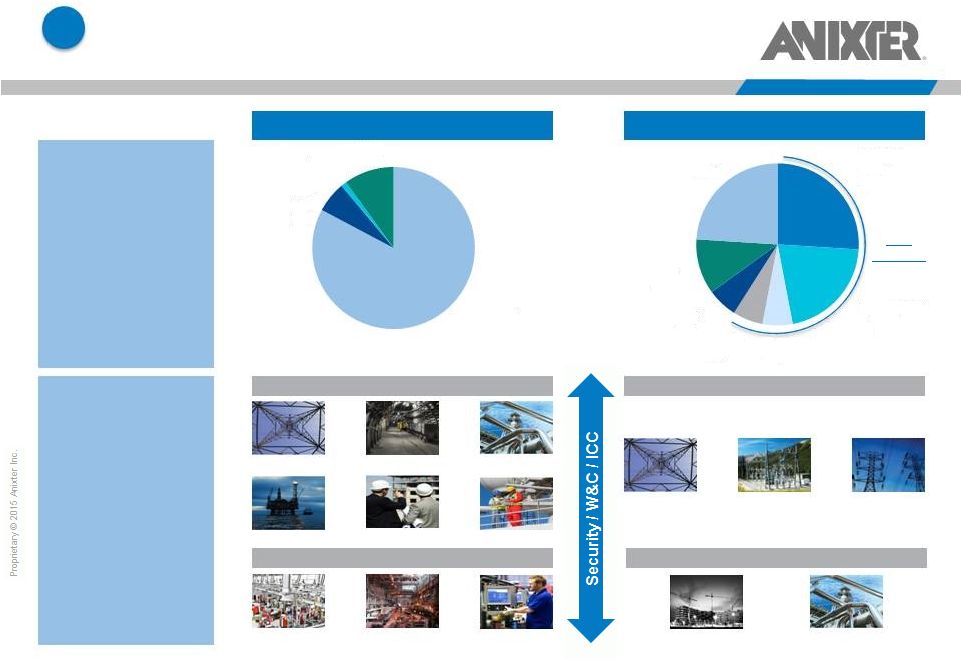 STRENGTHENS ANIXTER'S PRODUCT OFFERING – BROADER PRODUCT PORTFOLIO AND NEW CUSTOMER VERTICALS Anixter North America W&C Power Solutions 2 2 Broader Product Portfolio Complementary Customer Additions Oil and Gas Industrial Complex OEM Generation EPC Panel Shop New Products Utility / “High Voltage” Electrical / “Low Voltage” 6 Industrial Residential / Non- Residential Construction Generation Distribution Transmission Note: Select customer verticals Industrial OEM Natural Resources Contractors Manufacturing Wire & Cable 83% MRO 6% Gear, Controls and Enclosures 1% Other 10% Pole Line Equip. & Hardware 26% Gear, Controls & Power Equip. 21% Lighting & Fixtures 6% Automation 6% MRO 6% Other 11% Wire & Cable 24% |
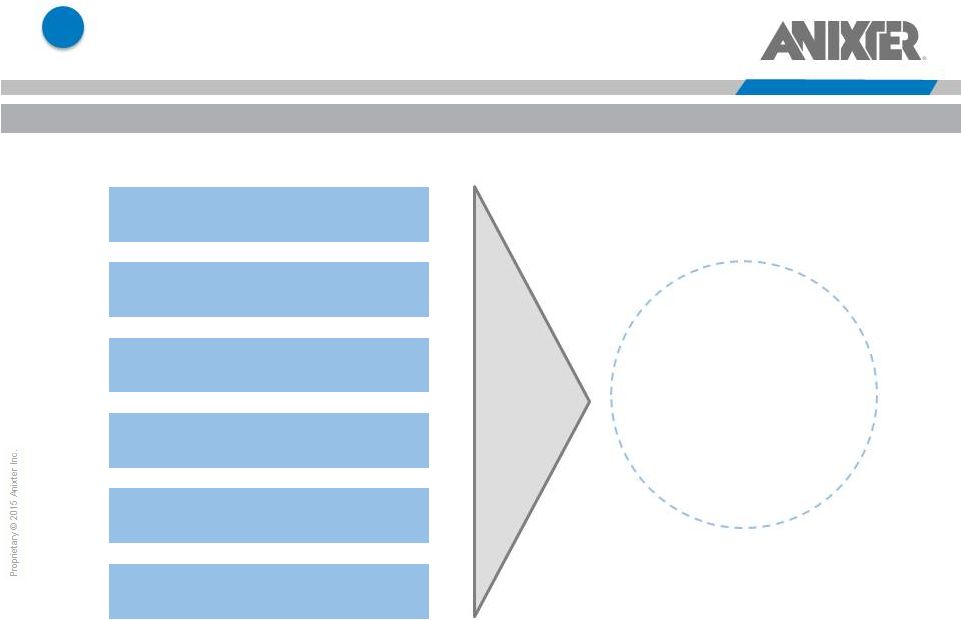 OFFERS SIGNIFICANT REVENUE AND COST SYNERGY POTENTIAL Enhanced Geographic Reach Increased Customer Penetration Leveraged Purchasing Scale Other Expense Savings Expanded Service Offerings Expanded Product Offerings Revenue and Cost Savings Opportunities 3 3 7 Expected to Result in ~$25 million in EBITDA Synergies by Year 3 |
 DELIVERS ATTRACTIVE FINANCIAL RETURNS Purchase price: $825 million subject to working capital and other adjustments Expected to be EPS accretive in year 1 Anticipated ~$25 million in run-rate EBITDA synergies by year 3 Future tax benefit with a net present value of approximately $70 million ROIC greater than Anixter’s cost of capital by year 2 Implied 10.4x 2014 Adj. EBITDA purchase multiple – 10.1x 2015 Adj. EBITDA – 7.8x 2015 Adj. EBITDA including run-rate synergies – 7.1x 2015 Adj. EBITDA including run-rate synergies and tax benefit Outstanding Power Solutions management team will continue to drive value in the business 8 4 4 Financially compelling and highly strategic opportunity |
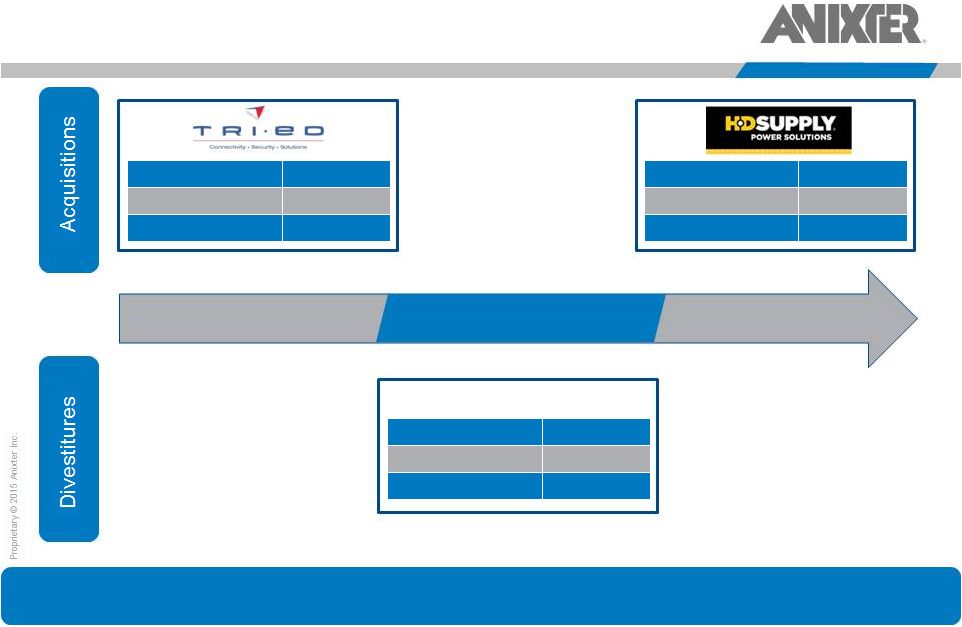 THREE STRATEGIC STEPS IN THE LAST 12 MONTHS Closed: 6/1/2015 2014 Adj. EBITDA: $47 million Sale Price: $380 million OEM Supply – Fasteners Closed: 9/17/2014 Adj. EBITDA*: $36 million Purchase Price: $420 million Expected Close: Q3 2015 2014 Adj. EBITDA**: $79 million Purchase Price: $825 million 2014 Q2 2015 Q3 2015 Seasoned executive team with significant acquisition integration and carve out divestiture experience 9 *Tri-Ed Adjusted EBITDA for the trailing twelve months ended June 30, 2014 **HD Supply Power Solutions adjusted EBITDA from HD Supply SEC filings |
 SIMPLER STRUCTURE. SHARPER FOCUS Completed Sale of Fasteners Segment in 2Q 2015 Reduces complexity Lessens EMEA exposure by ~30% Increases North American exposure by ~10% Improves financial profile Simpler Structure Acquired Tri-Ed in 4Q 2014 Brings security to $1.8 billion run rate business Complements existing enterprise-focused security business Enhances video, access control, intrusion and fire/life safety offering Provides access to residential end market Creates opportunity to expand Tri-Ed business outside North America Announced Acquisition of Power Solutions in 3Q 2015 Expands and complements existing W&C portfolio Increases presence in attractive Utility market Enhances access to small/mid-size projects and MRO markets Provides cross-selling opportunities Sharper Focus on Core Segments 10 |
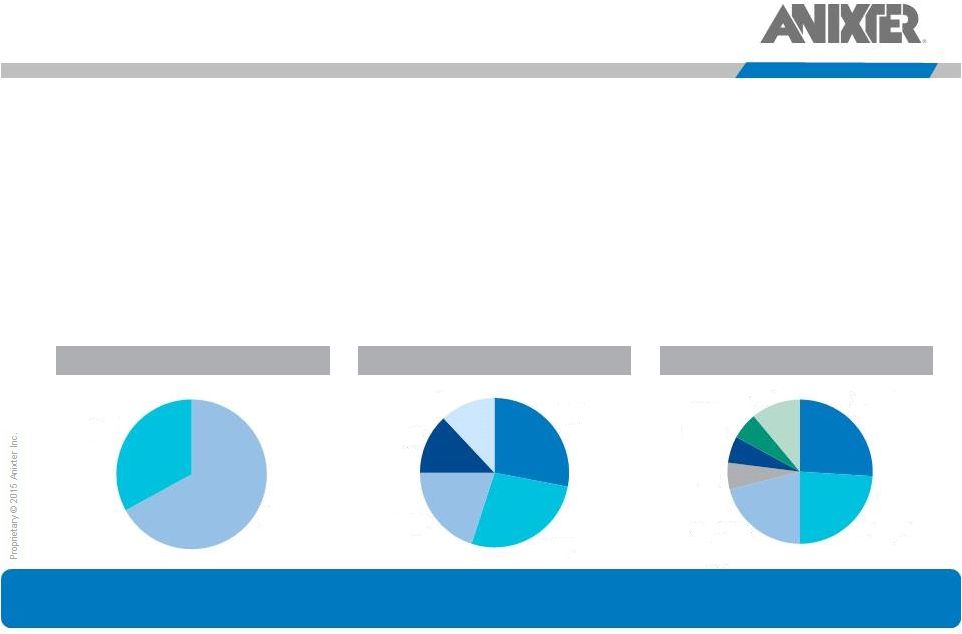 POWER SOLUTIONS OVERVIEW • Leading North American electric utility distributor, serving the $45 billion Utility and Electrical Market • Distributes electrical transmission and distribution products, power plant MRO supplies and smart-grid products • Serves a diverse base of ~13,000 customers, including Utility Infrastructure (Public Power, Investor Owned Utilities “IOUs”) and Electrical (Non-Residential and Residential Construction and Industrial) • Provides ~200,000 SKUs and an extensive suite of value-added services • ~1,800 associates with a 700+ person sales organization • ~130 branches in 30 US states and 4 Canadian provinces, ~500 vehicle delivery fleet • Revenue of $1.9 billion and adjusted EBITDA of $79 million for fiscal year 2014 – Reported EBITDA does not fully reflect the incremental costs required to support the Power Solutions business Power Solutions has a leading position in attractive growth markets Revenue by Customer Type Revenue by Geography Revenue by Product 11 Note: Revenue analysis for the fiscal year ending February 1, 2015 Utility 67% Electrical 33% Central 28% Southeast 27% Northeast 20% West 13% Canada 12% Pole Line Equip. & Hardware 26% Wire & Cable 24% Gear, Controls & Power 21% MRO 6% Lighting & Fixtures 6% Automation 6% Other 11% Equip. |
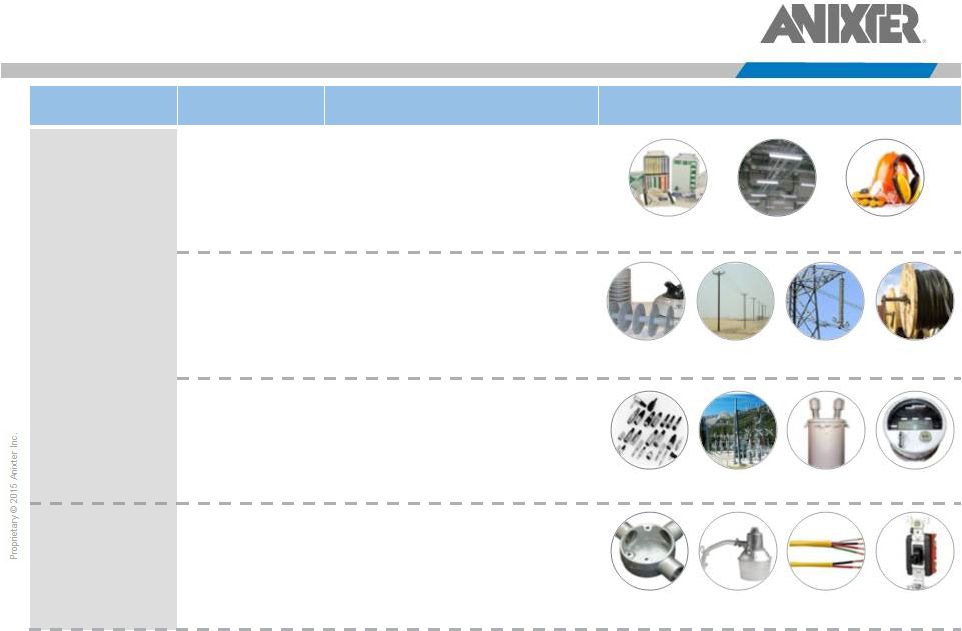 Segment Category Customers Key Products Utility “High Voltage” 67% of Sales Generation • Electrical utilities, mostly IOUs and generation plant operators Transmission • Electrical utilities, mostly IOUs and supply chain management team and/or electrical contractors Distribution • Electrical utilities, including IOUs and public power companies, such as municipalities and electrical cooperatives and/or electrical contractors Electrical “Low Voltage” 33% of Sales Point of Use • Electrical contractors performing work on behalf of industrial, non- residential or residential developers • MRO and sub-components for finished product OEMs POWER SOLUTIONS PRODUCT PORTFOLIO 12 Line Hardware Steel Structures Wire and Cable Substations Transformers Smart Meters Fixtures, Lighting and Lamps Wire and Wiring Devices Breakers, Gear and Controls Switches, Insulators, Arrestors and Connectors Conduit, Boxes and Fittings Fuses, Breakers and Connectors MRO Products Lighting Safety Equipment |
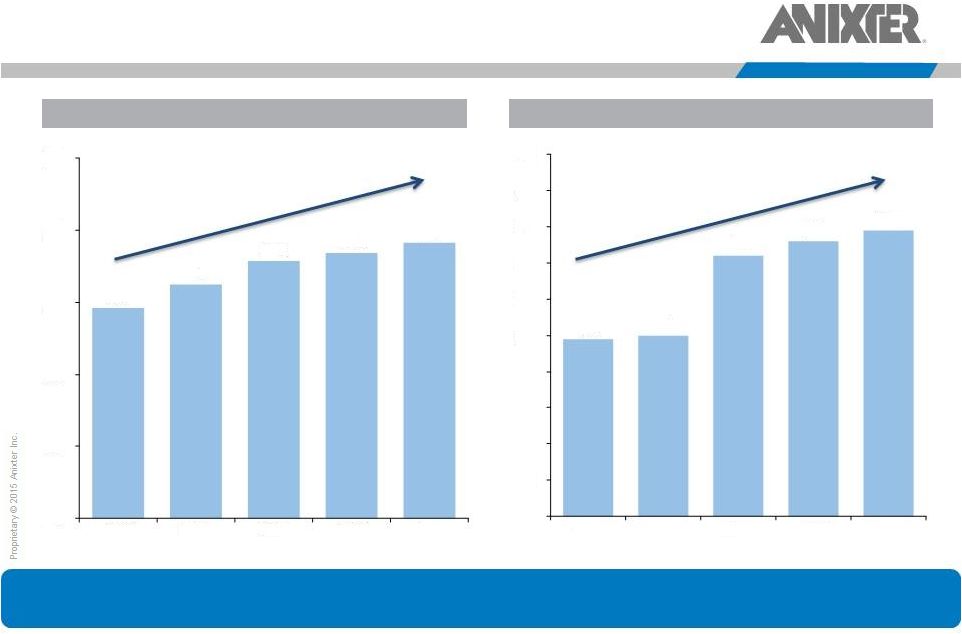 POWER SOLUTIONS FINANCIAL PROFILE 13 Power Solutions delivered strong growth and significantly enhanced profitability over the past several years Revenue Adjusted EBITDA ($ in billions) CAGR: ~7% ($ in millions) CAGR: ~13% Note: HD Supply Power Solutions’ fiscal year is a 52- or 53-week period ending on the Sunday nearest January 31 Source: HD Supply Power Solutions financials from HD Supply SEC filings $1.5 $1.6 $1.8 $1.8 $1.9 $0.0 $0.5 $1.0 $1.5 $2.0 $2.5 2010 2011 2012 2013 2014 $49 $50 $72 $76 $79 $0 $10 $20 $30 $40 $50 $60 $70 $80 $90 $100 2010 2011 2012 2013 2014 |
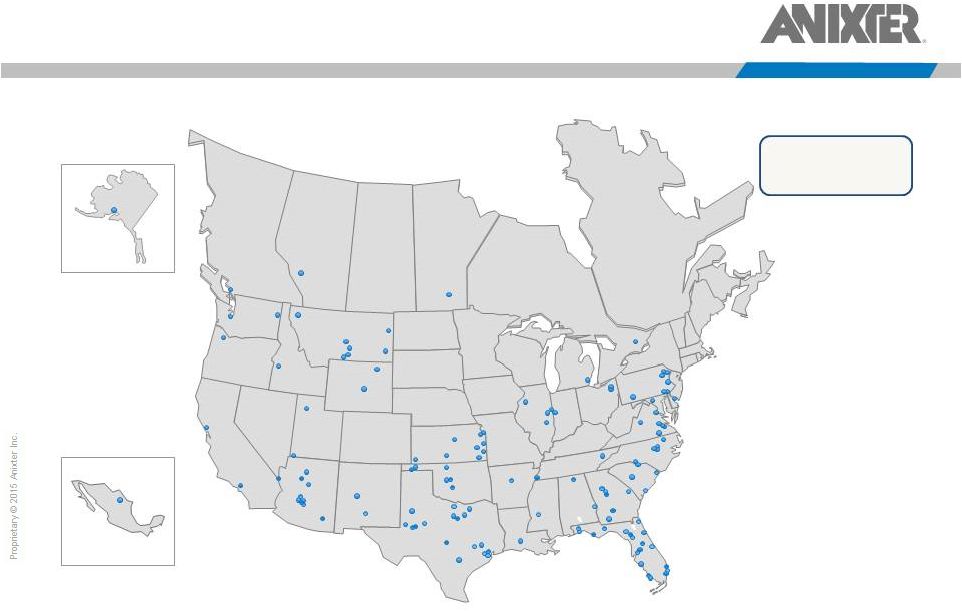 POWER SOLUTIONS GEOGRAPHIC FOOTPRINT ~130 Branches Mexico 14 |
 TRANSACTION SUMMARY Purchase Price $825 million subject to working capital and other adjustments Tax Benefit Future tax benefits with estimated net present value of approximately $70 million from acquired U.S. intangible assets Consideration 100% cash Synergies Estimated run-rate EBITDA synergies of approximately $25 million by Year 3 Financial Impact • Expected to be accretive to EPS in the first full year of operation * • Estimated pro forma net debt / LTM Q1 2015 Adjusted EBITDA of ~3.6x ** (excluding synergies) Financing • Combination of new borrowings and available cash from sale of Fastener segment Timing and Closing Conditions • Customary regulatory approvals and closing conditions • Expected to close near the end of Q3 2015 15 *Exclusive of transaction and one-time integration expenses and incremental amortization of intangible assets **LTM adjusted EBITDA is pro forma for 6 months of Tri-Ed and 12 months of Power Solutions. Adjusted EBITDA excludes FX and other, stock compensation and unusual items identified in the earnings releases |