UNITED STATES
SECURITIES AND EXCHANGE COMMISSION
Washington, D.C. 20549
FORM N-CSR
CERTIFIED SHAREHOLDER REPORT
OF
REGISTERED MANAGEMENT INVESTMENT COMPANIES
Investment Company Act file number: 811-01027
Name of Registrant: Vanguard World Fund
Address of Registrant:
P.O. Box 2600
Valley Forge, PA 19482
Name and address of agent for service:
Heidi Stam, Esquire
P.O. Box 876
Valley Forge, PA 19482
Registrant’s telephone number, including area code: (610) 669-1000
Date of fiscal year end: August 31
Date of reporting period: September 1, 2013 – August 31, 2014
Item 1: Reports to Shareholders
Annual Report | August 31, 2014
Vanguard U.S. Growth Fund
The mission continues
On May 1, 1975, Vanguard began operations, a fledgling company based on the simple but revolutionary idea that a mutual fund company should be managed solely in the interest of its investors.
Four decades later, that revolutionary spirit continues to animate the enterprise. Vanguard remains on a mission to give investors the best chance of investment success.
As we mark our 40th anniversary, we thank you for entrusting your assets to Vanguard and giving us the opportunity to help you reach your financial goals in the decades to come.
| |
| Contents | |
| Your Fund’s Total Returns. | 1 |
| Chairman’s Letter. | 2 |
| Advisors' Report. | 9 |
| Fund Profile. | 14 |
| Performance Summary. | 16 |
| Financial Statements. | 18 |
| Your Fund’s After-Tax Returns. | 33 |
| About Your Fund’s Expenses. | 34 |
| Trustees Approve Advisory Arrangements. | 36 |
| Glossary. | 38 |
Please note: The opinions expressed in this report are just that—informed opinions. They should not be considered promises or advice.
Also, please keep in mind that the information and opinions cover the period through the date on the front of this report. Of course, the
risks of investing in your fund are spelled out in the prospectus.
See the Glossary for definitions of investment terms used in this report.
About the cover: Since our founding, Vanguard has drawn inspiration from the enterprise and valor demonstrated by British
naval hero Horatio Nelson and his command at the Battle of the Nile in 1798. The photograph displays a replica of a merchant
ship from the same era as Nelson’s flagship, the HMS Vanguard.
Your Fund’s Total Returns
Fiscal Year Ended August 31, 2014
| |
| | Total |
| | Returns |
| Vanguard U.S. Growth Fund | |
| Investor Shares | 26.29% |
| Admiral™ Shares | 26.44 |
| Russell 1000 Growth Index | 26.29 |
| Large-Cap Growth Funds Average | 25.10 |
Large-Cap Growth Funds Average: Derived from data provided by Lipper, a Thomson Reuters Company.
Admiral Shares carry lower expenses and are available to investors who meet certain account-balance requirements.
Your Fund’s Performance at a Glance
August 31, 2013, Through August 31, 2014
| | | | |
| | | | Distributions Per Share |
| | Starting | Ending | | |
| | Share | Share | Income | Capital |
| | Price | Price | Dividends | Gains |
| Vanguard U.S. Growth Fund | | | | |
| Investor Shares | $24.67 | $31.03 | $0.111 | $0.000 |
| Admiral Shares | 63.91 | 80.37 | 0.390 | 0.000 |
1

Chairman’s Letter
Dear Shareholder,
For the 12 months ended August 31, 2014, Vanguard U.S. Growth Fund delivered its best fiscal-year result in 14 years, returning about 26%.
The fund was in line with its benchmark, the Russell 1000 Growth Index, and ahead of the average return of its large-capitalization peers.
The fund invests in the stocks of large companies with the potential for above-average sales and profit growth. Increased demand for large-caps during the period helped it surpass the broader U.S. stock market, which consists of both large- and small-cap stocks.
Please note that in May 2014, the Delaware Investments Fund Advisers team responsible for managing a portion of the fund formed a new firm named Jackson Square Partners, LLC. The portfolio managers remain the same, and we don’t expect the change to affect the fund’s investment philosophy or strategy.
If you hold shares of the fund in a taxable account, you may wish to review the information on the fund’s after-tax returns that appears later in this report. Please note that as of August 31, 2014, U.S. Growth Fund had realized long-term capital gains of $2.10 per share, accounting for about 5% of fund assets. These gains will be distributed in December.
2
Stocks cleared several hurdles to chart a series of new highs
Despite an assortment of challenges, the broad U.S. stock market recorded an impressive return of about 25% for the 12 months ended August 31. U.S. stocks registered positive results in 10 of those 12 months, and a late-July swoon was followed by an August flurry of record highs.
Investors applauded mostly solid corporate earnings, generally upbeat economic news, and the Federal Reserve’s continued accommodative policies. Still, turmoil in the Middle East and Ukraine, economic worries in Europe and China, and uncertainty about the Fed’s next moves pressured the market at times.
International stocks returned about 18%. Emerging markets, after sliding earlier in the period, rebounded to lead the way. The developed markets of the Pacific region and Europe trailed but still notched double-digit returns.
Defying analysts’ expectations, bond prices rose over the year
The broad U.S. taxable bond market returned 5.66%, rallying from the drubbing it took a year ago when investors fretted over the future of the Fed’s bond-buying program.
The Fed began reducing its purchases in January and has consistently cut them further since, with the goal of ending the program in October. Interest rates have
| | | |
| Market Barometer | | | |
| |
| | | Average Annual Total Returns |
| | Periods Ended August 31, 2014 |
| | One | Three | Five |
| | Year | Years | Years |
| Stocks | | | |
| Russell 1000 Index (Large-caps) | 25.36% | 20.80% | 17.24% |
| Russell 2000 Index (Small-caps) | 17.68 | 19.00 | 17.03 |
| Russell 3000 Index (Broad U.S. market) | 24.74 | 20.65 | 17.22 |
| FTSE All-World ex US Index (International) | 18.04 | 9.48 | 8.44 |
| |
| Bonds | | | |
| Barclays U.S. Aggregate Bond Index (Broad taxable market) | 5.66% | 2.91% | 4.48% |
| Barclays Municipal Bond Index (Broad tax-exempt market) | 10.14 | 4.88 | 5.39 |
| Citigroup Three-Month U.S. Treasury Bill Index | 0.04 | 0.04 | 0.07 |
| |
| CPI | | | |
| Consumer Price Index | 1.70% | 1.64% | 1.96% |
3
not risen as forecast, however. The yield of the 10-year U.S. Treasury note ended August at 2.34%, down from 2.76% a year earlier. (Bond prices and yields move in opposite directions.)
Municipal bonds returned 10.14% as investors searched for tax-exempt income amid a limited supply of new issues. International bond markets (as measured by the Barclays Global Aggregate Index ex USD) returned 6.52%.
Following such a strong advance, it’s worth remembering that the current low yields imply lower future returns: As yields drop, the scope for further declines—and increases in prices—diminishes.
The Fed’s target of 0%–0.25% for short-term interest rates continued to restrict returns for money market funds and savings accounts.
The fund posted gains in all industry sectors
As I mentioned earlier, the U.S. Growth Fund’s result was bolstered by the strong performance of large-company stocks, particularly in the second half of the year. That period was marked by geopolitical tensions, low bond yields, and increased concern about small-caps’ rising valuations.
In general, larger companies produce steadier earnings and higher yields. Their stocks also tend to be less volatile than those of small companies, which can grow faster but can also be more risky.
Expense Ratios
Your Fund Compared With Its Peer Group
| | | |
| | Investor | Admiral | Peer Group |
| | Shares | Shares | Average |
| U.S. Growth Fund | 0.45% | 0.31% | 1.22% |
The fund expense ratios shown are from the prospectus dated April 22, 2014, and represent estimated costs for the current fiscal year. For thefiscal year ended August 31, 2014, the expense ratios were 0.44% for Investor Shares and 0.30% for Admiral Shares. The peer-group expenseratio is derived from data provided by Lipper, a Thomson Reuters Company, and captures information through year-end 2013.Peer group: Large-Cap Growth Funds.4
The underperformance of small-caps this fiscal year stands in contrast to recent years, when large-cap stocks lagged. The lead position alternates over time; that’s one of the reasons Vanguard suggests broad diversification as the best course. For more on the performance of small- and large-cap stocks, please see the text box on page 6.
Although value stocks generally outperformed growth, the distinction was more pronounced in the small-cap area.
For the 12 months, the U.S. Growth Fund delivered double-digit gains in each of the nine industry sectors in which it has sizable investments. Information technology, health care, and consumer discretionary stocks contributed most.
Information technology, which is the fund’s largest sector and makes up about a third of its holdings on average, returned about 27%. Some of the nation’s largest hardware, software, and internet companies thrived. Global demand for the internet and smartphones translated to revenues and profits for firms willing to invest in plans and resources to reach a wider clientele. Despite the fund’s strong showing in this sector, poor stock choices restrained results relative to the benchmark index.
| |
| Total Returns | |
| Ten Years Ended August 31, 2014 | |
| | Average |
| | Annual Return |
| U.S. Growth Fund Investor Shares | 8.53% |
| Russell 1000 Growth Index | 9.20 |
| Large-Cap Growth Funds Average | 8.01 |
| Large-Cap Growth Funds Average: Derived from data provided by Lipper, a Thomson Reuters Company. |
The figures shown represent past performance, which is not a guarantee of future results. (Current performance may be lower or higher than the performance data cited. For performance data current to the most recent month-end, visit our website at vanguard.com/performance.) Note, too, that both investment returns and principal value can fluctuate widely, so an investor’s shares, when sold, could be worth more or less than their original cost.5
Health care returned more than 50%. Led by pharmaceutical and biotech companies, it turned in the best absolute performance of all the sectors held by the fund. Top contributors included firms that received takeover bids and those that had gained approval for wider use of their prescription
medications. Outstanding stock selection boosted the fund’s results compared with the benchmark.
Consumer discretionary stocks, which had struggled earlier this year, stood out as well. Internet and catalog retailers,
|
| Small-cap stocks versus large-caps: A case for diversification |
| |
| At times, particularly over the past dozen years, small-capitalization stocks have outpaced their |
| large-cap counterparts. This performance edge may appear compelling, but before making any |
| drastic decisions to tilt your portfolio heavily toward small-caps, consider two points. |
| |
| First, there’s no guarantee that small caps’ performance advantage will persist. As shown in |
| the chart below, these stocks had an extended period of underperformance in the 1990s, and |
| that could happen again. |
| |
| Second, investing in small companies’ stocks involves additional risks. These firms generally |
| have less business diversification, fewer financial resources, and less management depth than |
| larger enterprises. As a result, their stocks can be highly volatile. |
| |
| Investors with a heavy allocation to only one segment of the market can end up with greater |
| volatility and less diversification. A better alternative can be a market-cap-weighted equity |
| portfolio of stocks of all capitalizations that offers more diversification over the long term. |
| |
| Small-cap performance relative to large-caps |
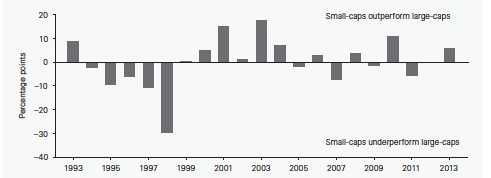
| Chart compares the annual returns of the Russell 2000 Index, a small-cap benchmark, with those of the Russell 1000 Index, a large-cap benchmark. Source: Vanguard. |
|
6
specialty retailers, and resorts produced strong results thanks to increased consumer spending. But the fund’s heavier allocation to the sector as a whole, combined with poor stock selection, weighed on its relative performance.
Consumer staples, one of the fund’s smaller holdings, produced its strongest sector performance relative to the benchmark. Stock selection among packaged food company stocks helped push the fund’s result to nearly twice that of its benchmark counterpart.
Although the fund’s energy and financial holdings each returned more than 16%, they trailed the benchmark. In each case, the advisors missed opportunities and the gap in results was as much about the companies the fund didn’t hold as those it did.
For more about the advisors’ strategy and the fund’s positioning during the 12 months, please see the Advisors’ Report that follows this letter.
The fund’s long-term performance shows steady signs of improvement
For the ten years ended August 31, 2014, the U.S. Growth Fund produced an average annual return of 8.53% for Investor Shares. This performance lagged that of the benchmark but beat the average return of peers.
The fund, which marked its 55th anniversary in January, has struggled over the decade. It trailed its benchmark for seven of the past ten years and the average return of its peers for four years.
Despite the disappointments earlier in the decade, the fund has begun to deliver more satisfying results over the past four years. Some of the improvements coincide with changes that have taken place in its management. As you may be aware, the fund restructured its advisory arrangement and added two portfolio managers in 2010. This year, Vanguard Growth Equity Fund merged into the U.S. Growth Fund, increasing the fund’s size and adding two more managers to the team.
Although it’s too early to know the long-term effects of these changes, so far the fund’s results have been consistent with our expectation that it is well-positioned to deliver competitive long-term returns.
High costs don’t add up to strong fund performance
The old adage “you get what you pay for” doesn’t apply to mutual funds. In fact, the reverse is true: Research suggests that higher costs are consistent with weaker returns. (See, for example, Shopping for Alpha: You Get What You Don’t Pay For at vanguard.com/research.)
Wouldn’t paying the highest fees allow you to purchase the services of the greatest talents and therefore get the best returns? As it turns out, the data don’t support that argument. The explanation is simple: Every dollar paid for management fees is a dollar less earning potential return. Keeping expenses down can help narrow the gap between what the markets return and what investors actually earn.
7
That’s why Vanguard always seeks to minimize costs. Indexing, of course, is the purest expression of low-cost investing. In our actively managed funds, which are run by world-class advisors, we work to keep fees low. It’s a strategy that reflects decades of experience and research, boiled down to one tenet: The less you pay, the more you keep.
As always, thank you for investing with Vanguard.
Sincerely,

F. William McNabb III
Chairman and Chief Executive Officer
September 11, 2014
8
Advisors’ Report
For the 12 months ended August 31, 2014, Vanguard U.S. Growth Fund returned about 26%. This result matched that of the benchmark index and surpassed the average return of large-capitalization growth funds. Your fund is managed by five independent advisors, a strategy that enhances the fund’s diversification by providing exposure to distinct yet complementary investment approaches. It is not uncommon for different advisors to have different views about individual securities or the broader investment environment.
The table on page 13 presents the advisors, the percentage and amount of fund assets that each manages, and brief descriptions of their investment strategies. Each advisor has also prepared a discussion of the investment environment during the fiscal year and of how the portfolio’s positioning reflects this assessment. These reports were prepared on September 17, 2014.
Wellington Management Company, LLP
Portfolio Manager:
Andrew J. Shilling, CFA,
Senior Vice President
We aim for our portion of the fund to outperform growth benchmarks and, in the longer term, the broader market. We employ proprietary fundamental research and a rigorous valuation discipline to invest in large-capitalization companies with attractive growth characteristics. Our investment approach is based on identifying companies with a clear competitive advantage that will enable them to sustain above-average growth. We take a long-term perspective, because we believe that investors often underestimate the potential for growth.
Over the past 12 months, our portfolio benefited from strong security selection in health care and consumer staples. Stock picks were weaker in the energy sector. Sector allocation, a result of bottom-up stock selection decisions, detracted from relative performance, primarily because of a large overweight allocation to consumer discretionary. A marginal cash position in an upward-trending market also weighed on relative results.
Notable selections in health care included biotechnology company Gilead Sciences and specialty pharmaceutical firm Allergan, each of which returned more than 75%. In our weakest-performing sector, energy, oil-focused exploration and production company Cobalt International Energy and independent exploration and production company Anadarko Petroleum detracted from relative returns. We eliminated our position in Anadarko.
At the fiscal year’s close, we remain most overweight in the consumer discretionary sector, having added to our holdings in Home Depot and established a new position in Ross Stores. We further reduced our exposure to energy, which is now our largest underweight.
We continue to find attractively valued stocks with the characteristics we seek. Although we anticipate moderate growth globally, we are cautiously optimistic about the outlook for the U.S. economy
9
and equity markets and are monitoring policy decisions and economic trends. We remain true to our process, seeking to invest in companies with high cash-flow returns on investment, strong balance sheets, experienced and proven management, and the ability to sustain above-average growth. We are confident that the portfolio is well-positioned as we look forward to the coming year.
Jackson Square Partners, LLC
Portfolio Managers:
Jeffrey S. Van Harte, CFA,
Chairman and Chief Investment Officer
Christopher J. Bonavico, CFA,
Equity Analyst
Christopher M. Ericksen, CFA,
Equity Analyst
Daniel J. Prislin, CFA,
Equity Analyst
Our portfolio’s strong relative performance in health care and consumer staples was partially offset by weak relative performance in financial services and materials and processing. The top contributors were holdings in Allergan, Adobe Systems, and EOG Resources. The largest individual detractors were Kinder Morgan and Teradata and an underweight allocation to Apple. We decided to sell our positions in Teradata and Apple.
Shifts in market sentiment during the 12 months suggest to us that many investors are struggling with accurately predicting the pace of global economic recovery. They appear to be assessing factors that threaten economic fundamentals, such as central bank actions and fiscal policy debates. In such an uncertain macroeconomic environment, we believe that the quality of a company’s business model, competitive position, and management may prove to be of utmost importance.
We remain consistent in our long-term investment philosophy. We want to own what we view as strong secular-growth companies with solid business models and competitive positions that we believe can grow market share and have the potential to deliver shareholder value in a variety of market environments.
William Blair & Company, L.L.C.
Portfolio Managers:
James Golan, CFA,
Partner
David Ricci, CFA,
Partner
The domestic equity market advanced considerably during the fiscal year, supported by positive economic data, continued corporate earnings growth, and accommodative monetary policy. The Russell 1000 Growth Index returned 26.29% for the 12 months ended August 31, 2014.
The portfolio’s performance was driven by stock selection. Health care was an area of strength; Gilead Sciences was the standout, and positions in Allergan and Covidien also added value. Other top contributors included Keurig Green
10
Mountain (consumer staples) and Google (information technology). On the downside, our largest detractors included Citrix (information technology), Citigroup (financials), Stericycle (industrials), and Pandora Media (information technology).
Investors’ preference toward lower-valuation stocks, which persisted from March to May, was a modest drag on performance.
Looking forward, economic indicators appear to support continued business cycle expansion. The near-term risk of monetary policy tightening is mitigated by a lack of inflation and by the slow and steady pace of U.S. economic expansion. We remain focused on identifying high-quality companies whose stocks trade at attractive valuations relative to the expected growth and consistency of the businesses. We believe the portfolio is well suited to withstand a variety of market scenarios and add value over the long term.
Jennison Associates LLC
Portfolio Managers:
Kathleen A. McCarragher,
Managing Director
Blair A. Boyer, Managing Director
Jennison began managing a portion of the U.S. Growth Fund in February 2014. The early months were challenging, as the market took a sharp rotational shift away from risk assets. A correction in many higher-valuation stocks hurt our portfolio initially but also established a valuation base and set the stage for a refocus on fundamentals. As earnings reports largely confirmed the fundamental strength of our companies, performance rebounded.
Over the fiscal year, technology positions lagged their counterparts in the benchmark index, as declines in high-multiple stocks FireEye and Splunk moderated advances in Apple and LinkedIn. FireEye’s behavioral analysis technology and real-time threat detection and prevention platform have identified malware missed by other security products. Splunk’s software allows businesses to mine and make sense of burgeoning amounts of digital data. Apple’s strength reflected expanding global acceptance of its platform, especially in China, where iPhone sales surged. Online professional network LinkedIn’s revenue growth accelerated and its margins expanded.
In consumer discretionary, online apparel retailer ASOS’s investment in operations and new markets limited near-term margin expansion. In consumer staples, Whole Foods’ earnings and revenue fell short of expectations, reflecting intensifying competition in the organic and natural foods market.
Health care holdings were solid contributors to returns. Sales of Gilead Sciences’ new hepatitis C treatment were robust. Shire and Allergan rose on takeover bids.
Industrial positions also performed well. Canadian Pacific Railway’s strength reflected solid rail volumes and accelerating revenue growth prospects.
11
Baillie Gifford Overseas Ltd.
Portfolio Manager:
Ian Tabberer, Investment Manager
Despite financial headlines preoccupied with “events” related to the Federal Reserve’s policy, equity markets enjoyed another very strong year. We believe that the steady domestic economic recovery creates a fertile opportunity for investors and an environment in which quality growth companies can prosper. Although we continue to monitor economic developments, our primary focus remains on fundamental company analysis, and our portfolio is built on stock-specific attractions.
We remain encouraged by the operating performance of a wide range of portfolio holdings, and our ongoing program of management meetings further underlines our confidence. For example, companies as diverse as biotechnology firm Seattle Genetics, motorcycle manufacturer Harley Davidson, and mortgage provider First Republic Bank all possess excellent long-term prospects, even if that is not always reflected in their short-term share price performance.
We believe that the companies that should fare best are those with strong management, durable competitive advantages, financial flexibility, and idiosyncratic, sustainable long-term growth prospects. Our enthusiasm for opportunities in the United States has resulted in a domestic bias to the portfolio, with a healthy representation in quality financial stocks and well-managed health care companies. Activity over the last 12 months has tended toward purchases of U.S. stocks, such as health insurer WellPoint and aggregates producer Vulcan Materials.
12
| | | |
| Vanguard U.S. Growth Fund Investment Advisors | |
| |
| | Fund Assets Managed | |
| Investment Advisor | % | $ Million | Investment Strategy |
| Wellington Management | 36 | 2,148 | Employs proprietary fundamental research and a |
| Company, LLP | | | rigorous valuation discipline in an effort to invest in |
| | | | high-quality, large-cap, sustainable-growth companies. |
| | | | The investment approach is based on the belief that |
| | | | stock prices often overreact to short-term trends, and |
| | | | that bottom-up, intensive research focused on |
| | | | longer-term fundamentals can be used to identify |
| | | | stocks that will outperform the market over time. |
| Jackson Square Partners, LLC | 36 | 2,124 | Uses a bottom-up approach, seeking companies that |
| | | | have large end-market potential, dominant business |
| | | | models, and strong free cash flow generation that is |
| | | | attractively priced compared with the intrinsic value of |
| | | | the securities. |
| William Blair & Company, L.L.C. | 13 | 745 | Uses a fundamental investment approach in pursuit of |
| | | | superior long-term investment results from |
| | | | growth-oriented companies with leadership positions |
| | | | and strong market presence. |
| Jennison Associates LLC | 6 | 380 | Uses a research-driven, fundamental investment |
| | | | approach that relies on in-depth company knowledge |
| | | | gleaned through meetings with management, |
| | | | customers, and suppliers. |
| Baillie Gifford Overseas Ltd. | 6 | 374 | Uses a fundamental approach to identify quality growth |
| | | | companies. The firm considers the sustainability of |
| | | | earnings growth to be a critical factor in evaluating a |
| | | | company’s prospects. The firm looks for companies |
| | | | with attractive industry backgrounds, strong |
| | | | competitive positions within those industries, |
| | | | high-quality earnings, and a favorable attitude toward |
| | | | shareholders. |
| Cash Investments | 3 | 135 | These short-term reserves are invested by Vanguard in |
| | | | equity index products to simulate investment in stocks. |
| | | | Each advisor may also maintain a modest cash |
| | | | position. |
13
U.S. Growth Fund
Fund Profile
As of August 31, 2014
| | |
| Share-Class Characteristics | |
| | Investor | Admiral |
| | Shares | Shares |
| Ticker Symbol | VWUSX | VWUAX |
| Expense Ratio1 | 0.45% | 0.31% |
| 30-Day SEC Yield | 0.49% | 0.63% |
| | | |
| Portfolio Characteristics | | |
| | | | DJ |
| | | | U.S. |
| | | Russell | Total |
| | | 1000 | Market |
| | | Growth | FA |
| | Fund | Index | Index |
| Number of Stocks | 167 | 675 | 3,709 |
| Median Market Cap | $53.6B | $58.6B | $48.0B |
| Price/Earnings Ratio | 28.7x | 23.1x | 20.7x |
| Price/Book Ratio | 4.7x | 5.2x | 2.7x |
| Return on Equity | 22.0% | 23.7% | 17.8% |
| Earnings Growth | | | |
| Rate | 20.9% | 17.5% | 15.3% |
| Dividend Yield | 0.9% | 1.5% | 1.8% |
| Foreign Holdings | 4.1% | 0.0% | 0.0% |
| Turnover Rate | 36% | — | — |
| Short-Term Reserves | 1.1% | — | — |
| | |
| Volatility Measures | | |
| | | DJ |
| | | U.S. Total |
| | Russell 1000 | Market |
| | Growth Index | FA Index |
| R-Squared | 0.96 | 0.91 |
| Beta | 1.16 | 1.13 |
| These measures show the degree and timing of the fund’s fluctuations compared with the indexes over 36 months. |
|
| | |
| Ten Largest Holdings (% of total net assets) |
| Google Inc. | Internet Software & | |
| | Services | 4.5% |
| Apple Inc. | Computer Hardware | 3.2 |
| MasterCard Inc. | Data Processing & | |
| | Outsourced Services | 3.1 |
| Microsoft Corp. | Systems Software | 2.9 |
| Celgene Corp. | Biotechnology | 2.7 |
| Priceline Group Inc. | Internet Retail | 2.6 |
| Visa Inc. | Data Processing & | |
| | Outsourced Services | 2.3 |
| Gilead Sciences Inc. | Biotechnology | 2.1 |
| QUALCOMM Inc. | Communications | |
| | Equipment | 2.0 |
| Allergan Inc. | Pharmaceuticals | 1.9 |
| Top Ten | | 27.3% |
| The holdings listed exclude any temporary cash investments and equity index products. |
|
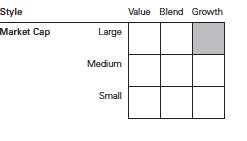
Investment Focus
1 The expense ratios shown are from the prospectus dated April 22, 2014, and represent estimated costs for the current fiscal year. For the fiscal
year ended August 31, 2014, the expense ratios were 0.44% for Investor Shares and 0.30% for Admiral Shares.
14
U.S. Growth Fund
Sector Diversification (% of equity exposure)
| | | |
| | | | DJ |
| | | | U.S. |
| | | Russell | Total |
| | | 1000 | Market |
| | | Growth | FA |
| | Fund | Index | Index |
| Consumer Discretionary 21.0% | 18.4% | 12.6% |
| Consumer Staples | 6.5 | 10.2 | 8.1 |
| Energy | 6.1 | 6.1 | 9.7 |
| Financials | 7.7 | 5.1 | 17.3 |
| Health Care | 14.9 | 13.4 | 13.3 |
| Industrials | 6.7 | 12.0 | 11.2 |
| Information Technology 33.1 | 28.2 | 18.6 |
| Materials | 2.8 | 4.2 | 3.9 |
| Other | 0.5 | 0.0 | 0.0 |
| Telecommunication | | | |
| Services | 0.6 | 2.3 | 2.2 |
| Utilities | 0.1 | 0.1 | 3.1 |
15
U.S. Growth Fund
Performance Summary
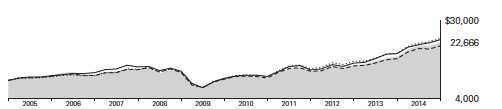
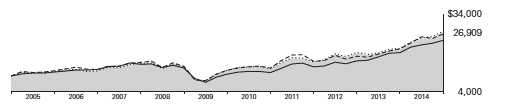
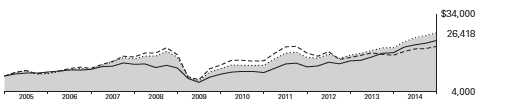
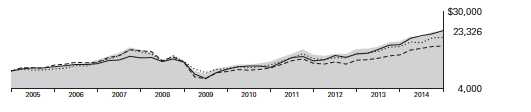
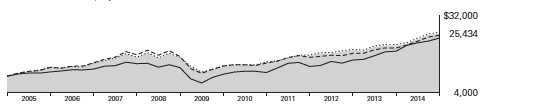
All of the returns in this report represent past performance, which is not a guarantee of future results that may be achieved by the fund. (Current performance may be lower or higher than the performance data cited. For performance data current to the most recent month-end, visit our website at vanguard.com/performance.) Note, too, that both investment returns and principal value can fluctuate widely, so an investor’s shares, when sold, could be worth more or less than their original cost. The returns shown do not reflect taxes that a shareholder would pay on fund distributions or on the sale of fund shares.
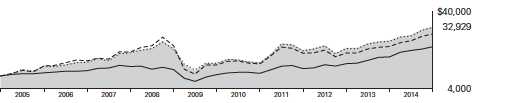
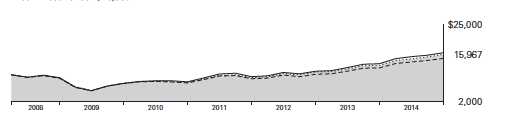
Cumulative Performance: August 31, 2004, Through August 31, 2014
Initial Investment of $10,000
| | | | | |
| | | | Average Annual Total Returns | |
| | | Periods Ended August 31, 2014 | |
| | | | | | Final Value |
| | | One | Five | Ten | of a $10,000 |
| | | Year | Years | Years | Investment |
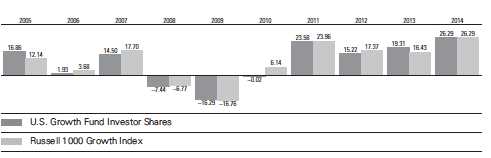
| | U.S. Growth Fund*Investor Shares | 26.29% | 16.49% | 8.53% | $22,666 |
| •••••••• | Russell 1000 Growth Index | 26.29 | 17.82 | 9.20 | 24,114 |
| – – – – | Large-Cap Growth Funds Average | 25.10 | 15.80 | 8.01 | 21,606 |
| | Dow Jones U.S. Total Stock Market | | | | |
| | Float Adjusted Index | 24.68 | 17.29 | 9.00 | 23,678 |
| Large-Cap Growth Funds Average: Derived from data provided by Lipper, a Thomson Reuters Company. |
| | | | |
| | | | | Final Value |
| | One | Five | Ten | of a $50,000 |
| | Year | Years | Years | Investment |
| U.S. Growth Fund Admiral Shares | 26.44% | 16.66% | 8.73% | $115,418 |
| Russell 1000 Growth Index | 26.29 | 17.82 | 9.20 | 120,570 |
| Dow Jones U.S. Total Stock Market Float | | | | |
| Adjusted Index | 24.68 | 17.29 | 9.00 | 118,391 |
See Financial Highlights for dividend and capital gains information.
16
U.S. Growth Fund
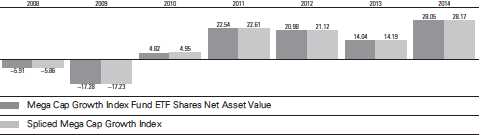
Fiscal-Year Total Returns (%): August 31, 2004, Through August 31, 2014
Average Annual Total Returns: Periods Ended June 30, 2014
This table presents returns through the latest calendar quarter—rather than through the end of the fiscal period.
Securities and Exchange Commission rules require that we provide this information.
| | | | |
| | Inception | One | Five | Ten |
| | Date | Year | Years | Years |
| Investor Shares | 1/6/1959 | 29.11% | 18.16% | 7.35% |
| Admiral Shares | 8/13/2001 | 29.27 | 18.34 | 7.55 |
17
U.S. Growth Fund
Financial Statements
Statement of Net Assets
As of August 31, 2014
The fund reports a complete list of its holdings in regulatory filings four times in each fiscal year, at the quarter-ends. For the second and fourth fiscal quarters, the lists appear in the fund’s semiannual and annual reports to shareholders. For the first and third fiscal quarters, the fund files the lists with the Securities and Exchange Commission on Form N-Q. Shareholders can look up the fund’s Forms N-Q on the SEC’s website at sec.gov. Forms N-Q may also be reviewed and copied at the SEC’s Public Reference Room (see the back cover of this report for further information).
| | | |
| | | | Market |
| | | | Value |
| | | Shares | ($000) |
| Common Stocks (96.8%)1 | | |
| Consumer Discretionary (20.6%) | |
| * | Priceline Group Inc. | 122,652 | 152,617 |
| | Home Depot Inc. | 1,042,775 | 97,499 |
| * | Liberty Interactive Corp. | | |
| | Class A | 2,948,241 | 87,032 |
| | L Brands Inc. | 1,189,525 | 75,951 |
| | NIKE Inc. Class B | 716,618 | 56,290 |
| | Harley-Davidson Inc. | 746,319 | 47,436 |
| * | Discovery | | |
| | Communications Inc. | 1,023,737 | 43,990 |
| * | Netflix Inc. | 78,140 | 37,323 |
| | Lowe’s Cos. Inc. | 705,585 | 37,050 |
| * | AutoZone Inc. | 66,805 | 35,997 |
| * | O’Reilly Automotive Inc. | 222,671 | 34,732 |
| | Lennar Corp. Class A | 877,670 | 34,387 |
| * | TripAdvisor Inc. | 333,952 | 33,091 |
| | DR Horton Inc. | 1,523,975 | 33,040 |
| | Starwood Hotels & | | |
| | Resorts Worldwide Inc. | 368,000 | 31,111 |
| * | Sally Beauty Holdings Inc. | 1,077,645 | 30,045 |
| | Comcast Corp. Class A | 544,610 | 29,807 |
| * | Amazon.com Inc. | 86,341 | 29,273 |
| | Ross Stores Inc. | 370,604 | 27,951 |
| | Wynn Resorts Ltd. | 139,140 | 26,837 |
| | Dunkin’ Brands Group Inc. | 596,775 | 25,984 |
| | Walt Disney Co. | 288,900 | 25,966 |
| | Wyndham Worldwide Corp. | 282,120 | 22,835 |
| | Harman International | | |
| | Industries Inc. | 183,850 | 21,157 |
| | Las Vegas Sands Corp. | 270,905 | 18,018 |
| | Ralph Lauren Corp. Class A | 104,225 | 17,635 |
| | BorgWarner Inc. | 273,100 | 16,984 |
| | PVH Corp. | 132,370 | 15,453 |
| * | Dollar General Corp. | 219,000 | 14,014 |
| * | Discovery Communications | | |
| | Inc. Class A | 282,001 | 12,329 |
| | Michael Kors Holdings Ltd. | 120,729 | 9,673 |
| | Inditex SA ADR | 532,174 | 7,733 |
| | TJX Cos. Inc. | 128,478 | 7,659 |
| | | |
| | | | Market |
| | | | Value |
| | | Shares | ($000) |
| | Tesla Motors Inc. | 24,195 | 6,525 |
| | Starbucks Corp. | 70,231 | 5,465 |
| | Burberry Group plc | 147,777 | 3,491 |
| | CarMax Inc. | 58,429 | 3,062 |
| | | | 1,215,442 |
| Consumer Staples (6.3%) | | |
| | Walgreen Co. | 1,470,787 | 89,012 |
| | Keurig Green Mountain Inc. | 453,986 | 60,525 |
| | Mondelez International Inc. | | |
| | Class A | 892,160 | 32,287 |
| | CVS Caremark Corp. | 399,570 | 31,746 |
| | Mead Johnson | | |
| | Nutrition Co. | 320,320 | 30,623 |
| * | Monster Beverage Corp. | 343,451 | 30,364 |
| | Anheuser-Busch | | |
| | InBev NV ADR | 231,515 | 25,879 |
| | Colgate-Palmolive Co. | 281,516 | 18,223 |
| | Whole Foods Market Inc. | 358,580 | 14,035 |
| | Estee Lauder Cos. Inc. | | |
| | Class A | 130,000 | 9,988 |
| | Brown-Forman Corp. | | |
| | Class B | 89,220 | 8,267 |
| | Kraft Foods Group Inc. | 136,697 | 8,051 |
| | Costco Wholesale Corp. | 62,320 | 7,546 |
| | Altria Group Inc. | 113,050 | 4,870 |
| | | | 371,416 |
| Energy (5.8%) | | |
| | EOG Resources Inc. | 959,609 | 105,442 |
| | Williams Cos. Inc. | 1,203,450 | 71,533 |
| | Kinder Morgan Inc. | 1,017,050 | 40,946 |
| | Schlumberger Ltd. | 340,322 | 37,313 |
| * | Continental Resources Inc. | 141,520 | 22,826 |
| | Pioneer Natural | | |
| | Resources Co. | 103,809 | 21,660 |
| | Noble Energy Inc. | 219,600 | 15,842 |
| | Apache Corp. | 136,754 | 13,926 |
| * | Cobalt International | | |
| | Energy Inc. | 662,380 | 10,167 |
| | Ultra Petroleum Corp. | 91,491 | 2,427 |
| | | | 342,082 |
18
U.S. Growth Fund
| | | |
| | | | Market |
| | | | Value |
| | | Shares | ($000) |
| Financials (7.3%) | | |
| | Crown Castle | | |
| | International Corp. | 1,202,836 | 95,637 |
| | Intercontinental | | |
| | Exchange Inc. | 293,200 | 55,415 |
| | BlackRock Inc. | 96,575 | 31,921 |
| | TD Ameritrade | | |
| | Holding Corp. | 873,945 | 28,936 |
| | American Express Co. | 289,990 | 25,969 |
| * | Markel Corp. | 34,210 | 22,572 |
| * | Affiliated Managers | | |
| | Group Inc. | 104,800 | 22,129 |
| | American Tower | | |
| | Corporation | 212,555 | 20,958 |
| | First Republic Bank | 381,993 | 18,679 |
| | Citigroup Inc. | 317,900 | 16,420 |
| | JPMorgan Chase & Co. | 247,100 | 14,690 |
| | Berkshire Hathaway Inc. | | |
| | Class B | 106,874 | 14,668 |
| | US Bancorp | 297,149 | 12,563 |
| | M&T Bank Corp. | 98,824 | 12,218 |
| | Fairfax Financial | | |
| | Holdings Ltd. | 24,720 | 11,391 |
| | Progressive Corp. | 449,259 | 11,240 |
| | Morgan Stanley | 238,483 | 8,182 |
| | Goldman Sachs Group Inc. | 32,392 | 5,802 |
| | Waddell & Reed | | |
| | Financial Inc. Class A | 23,885 | 1,302 |
| | | | 430,692 |
| Health Care (14.5%) | | |
| * | Celgene Corp. | 1,667,839 | 158,478 |
| * | Gilead Sciences Inc. | 1,131,612 | 121,739 |
| | Allergan Inc. | 671,156 | 109,855 |
| | Novo Nordisk A/S ADR | 1,485,939 | 68,294 |
| * | Biogen Idec Inc. | 158,428 | 54,347 |
| | Bristol-Myers Squibb Co. | 1,060,041 | 53,691 |
| | Perrigo Co. plc | 267,550 | 39,795 |
| * | Actavis plc | 143,085 | 32,477 |
| * | Vertex Pharmaceuticals Inc. | 296,908 | 27,782 |
| | Merck & Co. Inc. | 458,139 | 27,539 |
| * | Regeneron | | |
| | Pharmaceuticals Inc. | 75,920 | 26,611 |
| * | IDEXX Laboratories Inc. | 209,669 | 25,993 |
| | Johnson & Johnson | 240,356 | 24,932 |
| * | IMS Health Holdings Inc. | 730,865 | 20,391 |
| | WellPoint Inc. | 158,624 | 18,481 |
| | Zoetis Inc. | 306,100 | 10,848 |
| | BioMarin | | |
| | Pharmaceutical Inc. | 128,091 | 9,123 |
| | Alexion | | |
| | Pharmaceuticals Inc. | 50,139 | 8,488 |
| | Illumina Inc. | 33,519 | 6,012 |
| | McKesson Corp. | 28,640 | 5,586 |
| | Genomic Health Inc. | 129,995 | 3,863 |
| | Seattle Genetics Inc. | 43,030 | 1,894 |
| | | | 856,219 |
| | | |
| | | | Market |
| | | | Value |
| | | Shares | ($000) |
| Industrials (6.4%) | | |
| | Equifax Inc. | 627,255 | 49,403 |
| | Precision Castparts Corp. | 154,013 | 37,588 |
| | Union Pacific Corp. | 297,100 | 31,276 |
| | Nielsen NV | 601,780 | 28,278 |
| * | IHS Inc. Class A | 190,301 | 27,112 |
| | AMETEK Inc. | 480,825 | 25,455 |
| | TransDigm Group Inc. | 130,770 | 24,584 |
| | Safran SA ADR | 1,332,840 | 21,725 |
| | Kansas City Southern | 173,595 | 20,026 |
| * | Hertz Global Holdings Inc. | 640,920 | 18,939 |
| | United Parcel Service Inc. | | |
| | Class B | 191,695 | 18,658 |
| * | Stericycle Inc. | 153,900 | 18,291 |
| | Watsco Inc. | 150,600 | 13,929 |
| | Canadian Pacific | | |
| | Railway Ltd. | 51,282 | 10,287 |
| | JB Hunt Transport | | |
| | Services Inc. | 133,650 | 10,097 |
| | Boeing Co. | 57,673 | 7,313 |
| | NOW Inc. | 173,790 | 5,740 |
| | Danaher Corp. | 73,558 | 5,635 |
| | Rockwell Automation Inc. | 31,189 | 3,637 |
| | | | 377,973 |
| Information Technology (32.4%) | |
| | Apple Inc. | 1,823,203 | 186,878 |
| | MasterCard Inc. Class A | 2,396,532 | 181,681 |
| | Microsoft Corp. | 3,736,855 | 169,765 |
| * | Google Inc. Class C | 247,777 | 141,629 |
| | Visa Inc. Class A | 633,545 | 134,641 |
| * | Google Inc. Class A | 208,553 | 121,453 |
| | QUALCOMM Inc. | 1,563,560 | 118,987 |
| * | Adobe Systems Inc. | 1,431,920 | 102,955 |
| * | eBay Inc. | 1,729,009 | 95,960 |
| | Intuit Inc. | 1,093,275 | 90,939 |
| * | Equinix Inc. | 324,100 | 70,738 |
| * | Facebook Inc. Class A | 877,399 | 65,647 |
| * | Baidu Inc. ADR | 300,425 | 64,447 |
| * | Cognizant Technology | | |
| | Solutions Corp. Class A | 1,147,990 | 52,498 |
| * | Yelp Inc. Class A | 455,875 | 37,573 |
| * | salesforce.com inc | 627,004 | 37,050 |
| * | Alliance Data | | |
| | Systems Corp. | 130,595 | 34,561 |
| * | FleetCor Technologies Inc. | 224,329 | 32,234 |
| * | Red Hat Inc. | 462,570 | 28,180 |
| | Texas Instruments Inc. | 360,300 | 17,359 |
| * | Gartner Inc. | 227,700 | 16,984 |
| * | ServiceNow Inc. | 260,105 | 15,900 |
| * | VeriFone Systems Inc. | 401,609 | 14,024 |
| * | Akamai Technologies Inc. | 214,600 | 12,966 |
| | LinkedIn Corp. Class A | 51,156 | 11,548 |
| * | Pandora Media Inc. | 385,600 | 10,427 |
| | Oracle Corp. | 224,959 | 9,343 |
| | Twitter Inc. | 135,746 | 6,753 |
| | VMware Inc. Class A | 64,194 | 6,328 |
19
U.S. Growth Fund
| | | |
| | | | Market |
| | | | Value |
| | | Shares | ($000) |
| | F5 Networks Inc. | 38,189 | 4,743 |
| | Workday Inc. Class A | 51,026 | 4,647 |
| | Splunk Inc. | 74,554 | 4,022 |
| | Linear Technology Corp. | 84,547 | 3,814 |
| | FireEye Inc. | 66,974 | 2,086 |
| | Altera Corp. | 57,256 | 2,023 |
| | Xilinx Inc. | 39,826 | 1,683 |
| | | | 1,912,466 |
| Materials (2.6%) | | |
| | Monsanto Co. | 417,914 | 48,332 |
| | Syngenta AG ADR | 425,925 | 30,713 |
| | Eagle Materials Inc. | 245,470 | 25,016 |
| | Sherwin-Williams Co. | 112,505 | 24,539 |
| | Praxair Inc. | 106,540 | 14,015 |
| | Martin Marietta | | |
| | Materials Inc. | 75,330 | 9,865 |
| | Vulcan Materials Co. | 60,780 | 3,852 |
| | | | 156,332 |
| Other (0.4%) | | |
| *,2 | Uber Technologies PP | NA | 21,854 |
| 3 | Vanguard Growth ETF | 3,100 | 316 |
| | | | 22,170 |
| Telecommunication Services (0.5%) | |
| * | SBA Communications Corp. | |
| | Class A | 270,499 | 29,834 |
| Total Common Stocks | | |
| (Cost $3,891,242) | | 5,714,626 |
| Preferred Stocks (0.1%) | | |
| *,2 | Cloudera, Inc. Pfd. | | |
| | (Cost $4,369) | NA | 6,818 |
| Temporary Cash Investments (3.3%)1 | |
| Money Market Fund (2.7%) | | |
| 4,5 | Vanguard Market | | |
| | Liquidity Fund, | | |
| | 0.113% | 158,064,772 | 158,065 |
| | |
| | Face | Market |
| | Amount | Value |
| | ($000) | ($000) |
| Repurchase Agreement (0.5%) | |
| Bank of America Securities, | |
| LLC 0.050%, 9/2/14 | | |
| (Dated 8/29/14, | | |
| Repurchase Value | | |
| $32,600,000, collateralized | |
| by Federal Home Loan | | |
| Mortgage Corp. 0.000%, | |
| 12/17/29–5/4/37, with a | | |
| value of $33,252,000) | 32,600 | 32,600 |
| |
| U.S. Government and Agency Obligations (0.1%) |
| 6,7 Federal Home Loan | | |
| Bank Discount | | |
| Notes, 0.080%, 9/24/14 7,000 | 6,999 |
| Total Temporary Cash Investments | |
| (Cost $197,665) | | 197,664 |
| Total Investments (100.2%) | | |
| (Cost $4,093,276) | | 5,919,108 |
| Other Assets and Liabilities (-0.2%) | |
| Other Assets | | 14,105 |
| Liabilities5 | | (27,580) |
| | | (13,475) |
| Net Assets (100%) | | 5,905,633 |
20
U.S. Growth Fund
| |
| At August 31, 2014, net assets consisted of: |
| | Amount |
| | ($000) |
| Paid-in Capital | 3,743,856 |
| Undistributed Net Investment Income | 15,219 |
| Accumulated Net Realized Gains | 317,042 |
| Unrealized Appreciation (Depreciation) | |
| Investment Securities | 1,825,832 |
| Futures Contracts | 3,684 |
| Net Assets | 5,905,633 |
| |
| |
| Investor Shares—Net Assets | |
| Applicable to 130,135,780 outstanding | |
| $.001 par value shares of beneficial | |
| interest (unlimited authorization) | 4,037,871 |
| Net Asset Value Per Share— | |
| Investor Shares | $31.03 |
| |
| |
| Admiral Shares—Net Assets | |
| Applicable to 23,239,371 outstanding | |
| $.001 par value shares of beneficial | |
| interest (unlimited authorization) | 1,867,762 |
| Net Asset Value Per Share— | |
| Admiral Shares | $80.37 |
See Note A in Notes to Financial Statements.
* Non-income-producing security.
1 The fund invests a portion of its cash reserves in equity markets through the use of index futures contracts. After giving effect to futures
investments, the fund’s effective common stock and temporary cash investment positions represent 99.0% and 1.1%, respectively, of
net assets.
2 Restricted security represents 0.5% of net assets. Shares not applicable for these private placements.
3 Considered an affiliated company of the fund as the issuer is another member of The Vanguard Group.
4 Affiliated money market fund available only to Vanguard funds and certain trusts and accounts managed by Vanguard. Rate shown is
the 7-day yield.
5 Includes $47,000 of collateral received for securities on loan.
6 The issuer operates under a congressional charter; its securities are generally neither guaranteed by the U.S. Treasury nor backed by
the full faith and credit of the U.S. government.
7 Securities with a value of $6,500,000 have been segregated as initial margin for open futures contracts.
ADR—American Depositary Receipt.
See accompanying Notes, which are an integral part of the Financial Statements.
21
U.S. Growth Fund
Statement of Operations
| |
| | Year Ended |
| | August 31, 2014 |
| | ($000) |
| Investment Income | |
| Income | |
| Dividends1,2 | 53,391 |
| Interest1 | 208 |
| Securities Lending | 48 |
| Total Income | 53,647 |
| Expenses | |
| Investment Advisory Fees—Note B | |
| Basic Fee | 9,145 |
| Performance Adjustment | (584) |
| The Vanguard Group—Note C | |
| Management and Administrative—Investor Shares | 9,759 |
| Management and Administrative—Admiral Shares | 1,829 |
| Marketing and Distribution—Investor Shares | 520 |
| Marketing and Distribution—Admiral Shares | 193 |
| Custodian Fees | 59 |
| Auditing Fees | 34 |
| Shareholders’ Reports—Investor Shares | 101 |
| Shareholders’ Reports—Admiral Shares | 11 |
| Trustees’ Fees and Expenses | 12 |
| Total Expenses | 21,079 |
| Expenses Paid Indirectly | (95) |
| Net Expenses | 20,984 |
| Net Investment Income | 32,663 |
| Realized Net Gain (Loss) | |
| Investment Securities Sold1 | 449,967 |
| Futures Contracts | 20,957 |
| Foreign Currencies | 3 |
| Realized Net Gain (Loss) | 470,927 |
| Change in Unrealized Appreciation (Depreciation) | |
| Investment Securities | 627,817 |
| Futures Contracts | 6,215 |
| Change in Unrealized Appreciation (Depreciation) | 634,032 |
| Net Increase (Decrease) in Net Assets Resulting from Operations | 1,137,622 |
1 Dividend income, interest income, and realized net gain (loss) from affiliated companies of the fund were $4,000, $196,000, and$0, respectively.2 Dividends are net of foreign withholding taxes of $610,000.See accompanying Notes, which are an integral part of the Financial Statements.
22
U.S. Growth Fund
Statement of Changes in Net Assets
| | |
| | Year Ended August 31, |
| | 2014 | 2013 |
| | ($000) | ($000) |
| Increase (Decrease) in Net Assets | | |
| Operations | | |
| Net Investment Income | 32,663 | 25,716 |
| Realized Net Gain (Loss) | 470,927 | 354,950 |
| Change in Unrealized Appreciation (Depreciation) | 634,032 | 341,747 |
| Net Increase (Decrease) in Net Assets Resulting from Operations | 1,137,622 | 722,413 |
| Distributions | | |
| Net Investment Income | | |
| Investor Shares | (13,264) | (15,893) |
| Admiral Shares | (7,331) | (6,323) |
| Realized Capital Gain | | |
| Investor Shares | — | — |
| Admiral Shares | — | — |
| Total Distributions | (20,595) | (22,216) |
| Capital Share Transactions | | |
| Investor Shares | 107,698 | (371,753) |
| Admiral Shares | 403,334 | 104,599 |
| Net Increase (Decrease) from Capital Share Transactions | 511,032 | (267,154) |
| Total Increase (Decrease) | 1,628,059 | 433,043 |
| Net Assets | | |
| Beginning of Period | 4,277,574 | 3,844,531 |
| End of Period1 | 5,905,633 | 4,277,574 |
1 Net Assets—End of Period includes undistributed (overdistributed) net investment income of $15,219,000 and $4,793,000.See accompanying Notes, which are an integral part of the Financial Statements.
23
U.S. Growth Fund
Financial Highlights
| | | | | |
| Investor Shares | | | | | |
| |
| For a Share Outstanding | Year Ended August 31, |
| Throughout Each Period | 2014 | 2013 | 2012 | 2011 | 2010 |
| Net Asset Value, Beginning of Period | $24.67 | $20.79 | $18.12 | $14.75 | $14.83 |
| Investment Operations | | | | | |
| Net Investment Income | .168 | .134 | .068 | .1081 | .105 |
| Net Realized and Unrealized Gain (Loss) | | | | | |
| on Investments | 6.303 | 3.861 | 2.679 | 3.370 | (.099) |
| Total from Investment Operations | 6.471 | 3.995 | 2.747 | 3.478 | .006 |
| Distributions | | | | | |
| Dividends from Net Investment Income | (.111) | (.115) | (.077) | (.108) | (.086) |
| Distributions from Realized Capital Gains | — | — | — | — | — |
| Total Distributions | (.111) | (.115) | (.077) | (.108) | (.086) |
| Net Asset Value, End of Period | $31.03 | $24.67 | $20.79 | $18.12 | $14.75 |
| |
| Total Return2 | 26.29% | 19.31% | 15.22% | 23.58% | -0.02% |
| |
| Ratios/Supplemental Data | | | | | |
| Net Assets, End of Period (Millions) | $4,038 | $3,137 | $2,975 | $2,893 | $2,796 |
| Ratio of Total Expenses to | | | | | |
| Average Net Assets3 | 0.44% | 0.45% | 0.45% | 0.44% | 0.45% |
| Ratio of Net Investment Income to | | | | | |
| Average Net Assets | 0.59% | 0.59% | 0.35% | 0.61%1 | 0.66% |
| Portfolio Turnover Rate | 36% | 38% | 43% | 89% | 74% |
1 Net investment income per share and the ratio of net investment income to average net assets include $.016 and 0.09%, respectively,resulting from a special dividend from VeriSign Inc. in December 2010.2 Total returns do not include account service fees that may have applied in the periods shown. Fund prospectuses provide information aboutany applicable account service fees.3 Includes performance-based investment advisory fee increases (decreases) of (0.01%), (0.01%), (0.01%), (0.01%), and (0.03%).See accompanying Notes, which are an integral part of the Financial Statements.
24
U.S. Growth Fund
Financial Highlights
| | | | | |
| Admiral Shares | | | | | |
| |
| For a Share Outstanding | Year Ended August 31, |
| Throughout Each Period | 2014 | 2013 | 2012 | 2011 | 2010 |
| Net Asset Value, Beginning of Period | $63.91 | $53.85 | $46.94 | $38.20 | $38.41 |
| Investment Operations | | | | | |
| Net Investment Income | . 557 | .440 | . 258 | .3451 | .338 |
| Net Realized and Unrealized Gain (Loss) | | | | | |
| on Investments | 16.293 | 10.002 | 6.924 | 8.734 | (.256) |
| Total from Investment Operations | 16.850 | 10.442 | 7.182 | 9.079 | .082 |
| Distributions | | | | | |
| Dividends from Net Investment Income | (.390) | (.382) | (. 272) | (. 339) | (. 292) |
| Distributions from Realized Capital Gains | — | — | — | — | — |
| Total Distributions | (.390) | (.382) | (. 272) | (. 339) | (. 292) |
| Net Asset Value, End of Period | $80.37 | $63.91 | $53.85 | $46.94 | $38.20 |
| |
| Total Return | 26.44% | 19.51% | 15.38% | 23.77% | 0.13% |
| |
| Ratios/Supplemental Data | | | | | |
| Net Assets, End of Period (Millions) | $1,868 | $1,141 | $869 | $678 | $737 |
| Ratio of Total Expenses to | | | | | |
| Average Net Assets2 | 0.30% | 0.31% | 0.31% | 0.30% | 0.29% |
| Ratio of Net Investment Income to | | | | | |
| Average Net Assets | 0.73% | 0.73% | 0.49% | 0.75%1 | 0.82% |
| Portfolio Turnover Rate | 36% | 38% | 43% | 89% | 74% |
1 Net investment income per share and the ratio of net investment income to average net assets include $.041 and 0.09%, respectively,resulting from a special dividend from VeriSign Inc. in December 2010.2 Includes performance-based investment advisory fee increases (decreases) of (0.01%), (0.01%), (0.01%), (0.01%), and (0.03%).See accompanying Notes, which are an integral part of the Financial Statements.
25
U.S. Growth Fund
Notes to Financial Statements
Vanguard U.S. Growth Fund is registered under the Investment Company Act of 1940 as an open-end investment company, or mutual fund. The fund offers two classes of shares: Investor Shares and Admiral Shares. Investor Shares are available to any investor who meets the fund’s minimum purchase requirements. Admiral Shares are designed for investors who meet certain administrative, service, and account-size criteria.
A. The following significant accounting policies conform to generally accepted accounting principles for U.S. investment companies. The fund consistently follows such policies in preparing its financial statements.
1. Security Valuation: Securities are valued as of the close of trading on the New York Stock Exchange (generally 4 p.m., Eastern time) on the valuation date. Equity securities are valued at the latest quoted sales prices or official closing prices taken from the primary market in which each security trades; such securities not traded on the valuation date are valued at the mean of the latest quoted bid and asked prices. Securities for which market quotations are not readily available, or whose values have been materially affected by events occurring before the fund’s pricing time but after the close of the securities’ primary markets, are valued by methods deemed by the board of trustees to represent fair value. Investments in Vanguard Market Liquidity Fund are valued at that fund’s net asset value. Temporary cash investments acquired over 60 days to maturity are valued using the latest bid prices or using valuations based on a matrix system (which considers such factors as security prices, yields, maturities, and ratings), both as furnished by independent pricing services. Other temporary cash investments are valued at amortized cost, which approximates market value.
2. Foreign Currency: Securities and other assets and liabilities denominated in foreign currencies are translated into U.S. dollars using exchange rates obtained from an independent third party as of the fund’s pricing time on the valuation date. Realized gains (losses) and unrealized appreciation (depreciation) on investment securities include the effects of changes in exchange rates since the securities were purchased, combined with the effects of changes in security prices. Fluctuations in the value of other assets and liabilities resulting from changes in exchange rates are recorded as unrealized foreign currency gains (losses) until the assets or liabilities are settled in cash, at which time they are recorded as realized foreign currency gains (losses).
3. Futures Contracts: The fund uses index futures contracts to a limited extent, with the objective of maintaining full exposure to the stock market while maintaining liquidity. The fund may purchase or sell futures contracts to achieve a desired level of investment, whether to accommodate portfolio turnover or cash flows from capital share transactions. The primary risks associated with the use of futures contracts are imperfect correlation between changes in market values of stocks held by the fund and the prices of futures contracts, and the possibility of an illiquid market. Counterparty risk involving futures is mitigated because a regulated clearinghouse is the counterparty instead of the clearing broker. To further mitigate counterparty risk, the fund trades futures contracts on an exchange, monitors the financial strength of its clearing brokers and clearinghouse, and has entered into clearing agreements with its clearing brokers. The clearinghouse imposes initial margin requirements to secure the fund’s performance and requires daily settlement of variation margin representing changes in the market value of each contract.
Futures contracts are valued at their quoted daily settlement prices. The aggregate settlement values of the contracts are not recorded in the Statement of Net Assets. Fluctuations in the value of the contracts are recorded in the Statement of Net Assets as an asset (liability) and in the Statement of Operations as unrealized appreciation (depreciation) until the contracts are closed, when they are recorded as realized futures gains (losses).
26
U.S. Growth Fund
During the year ended August 31, 2014, the fund’s average investments in long and short futures contracts represented 3% and 0% of net assets, respectively, based on the average of aggregate settlement values at each quarter-end during the period.
4. Repurchase Agreements: The fund enters into repurchase agreements with institutional counterparties. Securities pledged as collateral to the fund under repurchase agreements are held by a custodian bank until the agreements mature. Each agreement requires that the market value of the collateral be sufficient to cover payments of interest and principal. The fund further mitigates its counterparty risk by entering into repurchase agreements only with a diverse group of prequalified counterparties, monitoring their financial strength, and entering into master repurchase agreements with its counterparties. The master repurchase agreements provide that, in the event of a counterparty’s default (including bankruptcy), the fund may terminate any repurchase agreements with that counterparty, determine the net amount owed, and sell or retain the collateral up to the net amount owed to the fund. Such action may be subject to legal proceedings, which may delay or limit the disposition of collateral.
5. Federal Income Taxes: The fund intends to continue to qualify as a regulated investment company and distribute all of its taxable income. Management has analyzed the fund’s tax positions taken for all open federal income tax years (August 31, 2011–2014), and has concluded that no provision for federal income tax is required in the fund’s financial statements.
6. Distributions: Distributions to shareholders are recorded on the ex-dividend date.
7. Securities Lending: To earn additional income, the fund lends its securities to qualified institutional borrowers. Security loans are required to be secured at all times by collateral in an amount at least equal to the market value of securities loaned. Daily market fluctuations could cause the value of loaned securities to be more or less than the value of the collateral received. When this occurs, the collateral is adjusted and settled on the next business day. The fund further mitigates its counterparty risk by entering into securities lending transactions only with a diverse group of prequalified counterparties, monitoring their financial strength, and entering into master securities lending agreements with its counterparties. The master securities lending agreements provide that, in the event of a counterparty’s default (including bankruptcy), the fund may terminate any loans with that borrower, determine the net amount owed, and sell or retain the collateral up to the net amount owed to the fund; however, such actions may be subject to legal proceedings. While collateral mitigates counterparty risk, in the absence of a default the fund may experience delays and costs in recovering the securities loaned. The fund invests cash collateral received in Vanguard Market Liquidity Fund, and records a liability in the Statement of Net Assets for the return of the collateral, during the period the securities are on loan. Securities lending income represents fees charged to borrowers plus income earned on invested cash collateral, less expenses associated with the loan.
8. Credit Facility: The fund and certain other funds managed by The Vanguard Group participate in a $2.89 billion committed credit facility provided by a syndicate of lenders pursuant to a credit agreement that may be renewed annually; each fund is individually liable for its borrowings, if any, under the credit facility. Borrowings may be utilized for temporary and emergency purposes, and are subject to the fund’s regulatory and contractual borrowing restrictions. The participating funds are charged administrative fees and an annual commitment fee of 0.06% of the undrawn amount of the facility; these fees are allocated to the funds based on a method approved by the fund’s board of trustees and included in Management and Administrative expenses on the fund’s Statement of Operations. Any borrowings under this facility bear interest at a rate equal to the higher of the federal funds rate or LIBOR reference rate plus an agreed-upon spread.
27
U.S. Growth Fund
The fund had no borrowings outstanding at August 31, 2014, or at any time during the period then ended.
9. Other: Dividend income is recorded on the ex-dividend date. Interest income includes income distributions received from Vanguard Market Liquidity Fund and is accrued daily. Premiums and discounts on debt securities purchased are amortized and accreted, respectively, to interest income over the lives of the respective securities. Security transactions are accounted for on the date securities are bought or sold. Costs used to determine realized gains (losses) on the sale of investment securities are those of the specific securities sold.
Each class of shares has equal rights as to assets and earnings, except that each class separately bears certain class-specific expenses related to maintenance of shareholder accounts (included in Management and Administrative expenses) and shareholder reporting. Marketing and distribution expenses are allocated to each class of shares based on a method approved by the board of trustees. Income, other non-class-specific expenses, and gains and losses on investments are allocated to each class of shares based on its relative net assets.
B. Wellington Management Company, LLP, Jackson Square Partners, LLC, William Blair & Company, L.L.C., and beginning in February 2014, Jennison Associates LLC and Baillie Gifford Overseas Ltd. each provide investment advisory services to a portion of the fund for a fee calculated at an annual percentage rate of average net assets managed by the advisor. The basic fee of Wellington Management Company, LLP, and Jackson Square Partners, LLC are subject to quarterly adjustments based on performance for the preceding three years relative to the Russell 1000 Growth Index. The basic fee of William Blair & Company, L.L.C., is subject to quarterly adjustments based on performance for the preceding five years relative to the Russell 1000 Growth Index. In accordance with the advisory contracts entered into with Jennison Associates LLC and Baillie Gifford Overseas Ltd., beginning March 1, 2015, the investment advisory fees will be subject to quarterly adjustments based on performance since February 28, 2014, relative to the Russell 1000 Growth Index and the S&P 500 Index, respectively.
The Vanguard Group manages the cash reserves of the fund on an at-cost basis.
For the year ended August 31, 2014, the aggregate investment advisory fee represented an effective annual basic rate of 0.18% of the fund’s average net assets, before a decrease of $584,000 (0.01%) based on performance.
C. The Vanguard Group furnishes at cost corporate management, administrative, marketing, and distribution services. The costs of such services are allocated to the fund based on methods approved by the board of trustees. The fund has committed to provide up to 0.40% of its net assets in capital contributions to Vanguard. At August 31, 2014, the fund had contributed capital of $579,000 to Vanguard (included in Other Assets), representing 0.01% of the fund’s net assets and 0.23% of Vanguard’s capitalization. The fund’s trustees and officers are also directors and officers of Vanguard.
D. The fund has asked its investment advisors to direct certain security trades, subject to obtaining the best price and execution, to brokers who have agreed to rebate to the fund part of the commissions generated. Such rebates are used solely to reduce the fund’s management and administrative expenses. For the year ended August 31, 2014, these arrangements reduced the fund’s expenses by $95,000 (an annual rate of 0.00% of average net assets).
28
U.S. Growth Fund
E. Various inputs may be used to determine the value of the fund’s investments. These inputs are summarized in three broad levels for financial statement purposes. The inputs or methodologies used to value securities are not necessarily an indication of the risk associated with investing in those securities.
Level 1—Quoted prices in active markets for identical securities.
Level 2—Other significant observable inputs (including quoted prices for similar securities, interest rates, prepayment speeds, credit risk, etc.).
Level 3—Significant unobservable inputs (including the fund’s own assumptions used to determine the fair value of investments).
The following table summarizes the market value of the fund’s investments as of August 31, 2014, based on the inputs used to value them:
| | | |
| | Level 1 | Level 2 | Level 3 |
| Investments | ($000) | ($000) | ($000) |
| Common Stocks | 5,689,281 | 3,491 | 21,854 |
| Preferred Stocks | — | — | 6,818 |
| Temporary Cash Investments | 158,065 | 39,599 | — |
| Futures Contracts—Assets1 | 337 | — | — |
| Total | 5,847,683 | 43,090 | 28,672 |
| 1 Represents variation margin on the last day of the reporting period. |
F. At August 31, 2014, the aggregate settlement value of open futures contracts and the related unrealized appreciation (depreciation) were:
| | | | |
| | | | ($000) |
| | | | Aggregate | |
| | | Number of | Settlement | Unrealized |
| | | Long (Short) | Value | Appreciation |
| Futures Contracts | Expiration | Contracts | Long (Short) | (Depreciation) |
| S&P 500 Index | September 2014 | 132 | 66,046 | 2,569 |
| E-mini S&P 500 Index | September 2014 | 545 | 54,538 | 754 |
| E-mini S&P Mid-Cap 400 Index | September 2014 | 94 | 13,509 | 361 |
| | | | | 3,684 |
Unrealized appreciation (depreciation) on open futures contracts is required to be treated as realized gain (loss) for tax purposes.
G. Distributions are determined on a tax basis and may differ from net investment income and realized capital gains for financial reporting purposes. Differences may be permanent or temporary. Permanent differences are reclassified among capital accounts in the financial statements to reflect their tax character. Temporary differences arise when certain items of income, expense, gain, or loss are recognized in different periods for financial statement and tax purposes. These differences will reverse at some time in the future. Differences in classification may also result from the treatment of short-term gains as ordinary income for tax purposes.
29
U.S. Growth Fund
The fund used a tax accounting practice to treat a portion of the price of capital shares redeemed during the year as distributions from net investment income and realized capital gains. Accordingly, the fund has reclassified $1,691,000 from undistributed net investment income, and $16,400,000 from accumulated net realized gains, to paid-in capital.
The fund used capital loss carryforwards of $139,278,000, including $16,085,000 acquired in connection with the acquisition of Vanguard Growth Equity Fund in February 2014 (see note J), to offset taxable capital gains realized during the year ended August 31, 2014, reducing the amount of capital gains that would otherwise be available to distribute to shareholders. For tax purposes, at August 31, 2014, the fund had $26,405,000 of ordinary income and 321,705,000 of long-term capital gains available for distribution.
At August 31, 2014, the cost of investment securities for tax purposes was $4,093,572,000. Net unrealized appreciation of investment securities for tax purposes was $1,825,536,000, consisting of unrealized gains of $1,851,553,000 on securities that had risen in value since their purchase and $26,017,000 in unrealized losses on securities that had fallen in value since their purchase.
H. During the year ended August 31, 2014, the fund purchased $1,826,537,000 of investment securities, including $530,377,000 of securities acquired in connection with acquisition of Vanguard Growth Equity Fund, and sold $2,068,712,000 of investment securities, other than temporary cash investments.
| | | | |
| I. Capital share transactions for each class of shares were: | | | |
| | Year Ended August 31, |
| | | 2014 | | | 2013 |
| | Amount | Shares | Amount | Shares |
| | ($000) | (000) | ($000) | (000) |
| Investor Shares | | | | |
| Issued | 198,913 | 6,949 | 169,396 | 7,593 |
| Issued in Connection with Acquisition of | | | | |
| Vanguard Growth Equity Fund | 799,108 | 27,203 | — | — |
| Issued in Lieu of Cash Distributions | 13,072 | 475 | 15,668 | 744 |
| Redeemed | (903,395) | (31,625) | (556,817) | (24,331) |
| Net Increase (Decrease)—Investor Shares | 107,698 | 3,002 | (371,753) | (15,994) |
| Admiral Shares | | | | |
| Issued | 621,315 | 8,329 | 282,037 | 4,731 |
| Issued in Lieu of Cash Distributions | 6,850 | 96 | 5,877 | 108 |
| Redeemed | (224,831) | (3,034) | (183,315) | (3,130) |
| Net Increase (Decrease)—Admiral Shares | 403,334 | 5,391 | 104,599 | 1,709 |
J. On February 21, 2014, the fund acquired all the net assets of Vanguard Growth Equity Fund pursuant to a plan of reorganization approved by the funds’ board of trustees on September 26, 2013. The purpose of the transaction was to combine two funds with comparable investment objectives. The acquisition was accomplished by a tax-free exchange of 27,203,000 of the U.S. Growth Fund’s capital shares for the 48,088,000 shares of Growth Equity Fund outstanding on February 21, 2014. Investor shares of Growth Equity Fund were exchanged for Investor shares of U.S. Growth Fund.
30
U.S. Growth Fund
Growth Equity Fund’s net assets of $799,108,000, including $212,286,000 of unrealized appreciation, were combined with U.S. Growth Fund’s net assets of $4,939,397,000, resulting in combined net assets of $5,738,505,000 on February 21, 2014.
Assuming that the acquisition had been completed on September 1, 2013, the beginning of the fund’s reporting period, the fund’s pro forma results of operations for the year ended August 31, 2014, would be:
| |
| | ($000) |
| Net Investment Income | 34,930 |
| Realized Net Gain (Loss) | 522,769 |
| Change in Unrealized Appreciation (Depreciation) | 701,051 |
| Net Increase (Decrease) in Net Assets Resulting from Operations | 1,258,750 |
Because the combined funds have been managed as a single integrated fund since the acquisition was completed, it is not practical to separate the results of operations of Vanguard Growth Equity Fund that have been included in the fund’s statement of operations since February 21, 2014.
K. Management has determined that no material events or transactions occurred subsequent to August 31, 2014, that would require recognition or disclosure in these financial statements.
31
Report of Independent Registered
Public Accounting Firm
To the Board of Trustees of Vanguard World Fund and the Shareholders of Vanguard U.S. Growth Fund:
In our opinion, the accompanying statement of net assets and the related statements of operations and of changes in net assets and the financial highlights present fairly, in all material respects, the financial position of Vanguard U.S. Growth Fund (constituting a separate portfolio of Vanguard World Fund, hereafter referred to as the “Fund”) at August 31, 2014, the results of its operations for the year then ended, the changes in its net assets for each of the two years in the period then ended, and the financial highlights for each of the five years in the period then ended, in conformity with accounting principles generally accepted in the United States of America. These financial statements and financial highlights (hereafter referred to as “financial statements”) are the responsibility of the Fund’s management. Our responsibility is to express an opinion on these financial statements based on our audits. We conducted our audits of these financial statements in accordance with the standards of the Public Company Accounting Oversight Board (United States). Those standards require that we plan and perform the audit to obtain reasonable assurance about whether the financial statements are free of material misstatement. An audit includes examining, on a test basis, evidence supporting the amounts and disclosures in the financial statements, assessing the accounting principles used and significant estimates made by management, and evaluating the overall financial statement presentation. We believe that our audits, which included confirmation of securities at August 31, 2014 by correspondence with the custodians and brokers and by agreement to the underlying ownership records of the transfer agent, provide a reasonable basis for our opinion.
/s/PricewaterhouseCoopers LLP
Philadelphia, Pennsylvania
October 10, 2014

Special 2014 tax information (unaudited) for Vanguard U.S. Growth Fund
This information for the fiscal year ended August 31, 2014, is included pursuant to provisions of the Internal Revenue Code.
The fund distributed $16,400,000 as capital gain dividends (from net long-term capital gains) to shareholders during the fiscal year.
The fund distributed $20,595,000 of qualified dividend income to shareholders during the fiscal year.
For corporate shareholders, 100% of investment income (dividend income plus short-term gains, if any) qualifies for the dividends-received deduction.
32
Your Fund’s After-Tax Returns
This table presents returns for your fund both before and after taxes. The after-tax returns are shown in two ways: (1) assuming that an investor owned the fund during the entire period and paid taxes on the fund’s distributions, and (2) assuming that an investor paid taxes on the fund’s distributions and sold all shares at the end of each period.
Calculations are based on the highest individual federal income tax and capital gains tax rates in effect at the times of the distributions and the hypothetical sales. State and local taxes were not considered. After-tax returns reflect any qualified dividend income, using actual prior-year figures and estimates for 2014. (In the example, returns after the sale of fund shares may be higher than those assuming no sale. This occurs when the sale would have produced a capital loss. The calculation assumes that the investor received a tax deduction for the loss.)
The table shows returns for Investor Shares only; returns for other share classes will differ. Please note that your actual after-tax returns will depend on your tax situation and may differ from those shown. Also note that if you own the fund in a tax-deferred account, such as an individual retirement account or a 401(k) plan, this information does not apply to you. Such accounts are not subject to current taxes.
Finally, keep in mind that a fund’s performance—whether before or after taxes—does not guarantee future results.
Average Annual Total Returns: U.S. Growth Fund Investor Shares
Periods Ended August 31, 2014
| | | |
| | One | Five | Ten |
| | Year | Years | Years |
| Returns Before Taxes | 26.29% | 16.49% | 8.53% |
| Returns After Taxes on Distributions | 26.17 | 16.39 | 8.44 |
| Returns After Taxes on Distributions and Sale of Fund Shares | 14.96 | 13.36 | 6.98 |
33
About Your Fund’s Expenses
As a shareholder of the fund, you incur ongoing costs, which include costs for portfolio management, administrative services, and shareholder reports (like this one), among others. Operating expenses, which are deducted from a fund’s gross income, directly reduce the investment return of the fund.
A fund’s expenses are expressed as a percentage of its average net assets. This figure is known as the expense ratio. The following examples are intended to help you understand the ongoing costs (in dollars) of investing in your fund and to compare these costs with those of other mutual funds. The examples are based on an investment of $1,000 made at the beginning of the period shown and held for the entire period.
The accompanying table illustrates your fund’s costs in two ways:
• Based on actual fund return. This section helps you to estimate the actual expenses that you paid over the period. The ”Ending Account Value“ shown is derived from the fund‘s actual return, and the third column shows the dollar amount that would have been paid by an investor who started with $1,000 in the fund. You may use the information here, together with the amount you invested, to estimate the expenses that you paid over the period.
To do so, simply divide your account value by $1,000 (for example, an $8,600 account value divided by $1,000 = 8.6), then multiply the result by the number given for your fund under the heading ”Expenses Paid During Period.“
• Based on hypothetical 5% yearly return. This section is intended to help you compare your fund‘s costs with those of other mutual funds. It assumes that the fund had a yearly return of 5% before expenses, but that the expense ratio is unchanged. In this case—because the return used is not the fund’s actual return—the results do not apply to your investment. The example is useful in making comparisons because the Securities and Exchange Commission requires all mutual funds to calculate expenses based on a 5% return. You can assess your fund’s costs by comparing this hypothetical example with the hypothetical examples that appear in shareholder reports of other funds.
Note that the expenses shown in the table are meant to highlight and help you compare ongoing costs only and do not reflect transaction costs incurred by the fund for buying and selling securities. Further, the expenses do not include any purchase, redemption, or account service fees described in the fund prospectus. If such fees were applied to your account, your costs would be higher. Your fund does not carry a “sales load.”
The calculations assume no shares were bought or sold during the period. Your actual costs may have been higher or lower, depending on the amount of your investment and the timing of any purchases or redemptions.
You can find more information about the fund’s expenses, including annual expense ratios, in the Financial Statements section of this report. For additional information on operating expenses and other shareholder costs, please refer to your fund’s current prospectus.
34
| | | |
| Six Months Ended August 31, 2014 | | | |
| | Beginning | Ending | Expenses |
| | Account Value | Account Value | Paid During |
| U.S. Growth Fund | 2/28/2014 | 8/31/2014 | Period |
| Based on Actual Fund Return | | | |
| Investor Shares | $1,000.00 | $1,042.32 | $2.32 |
| Admiral Shares | 1,000.00 | 1,043.22 | 1.60 |
| Based on Hypothetical 5% Yearly Return | | | |
| Investor Shares | $1,000.00 | $1,022.94 | $2.29 |
| Admiral Shares | 1,000.00 | 1,023.64 | 1.58 |
The calculations are based on expenses incurred in the most recent six-month period. The fund’s annualized six-month expense ratios for thatperiod are 0.45% for Investor Shares and 0.31% for Admiral Shares. The dollar amounts shown as “Expenses Paid” are equal to theannualized expense ratio multiplied by the average account value over the period, multiplied by the number of days in the most recentsix-month period, then divided by the number of days in the most recent 12-month period.35
Trustees Approve Advisory Arrangements
The board of trustees of Vanguard U.S. Growth Fund approved a new advisory agreement with Jackson Square Partners, LLC (Jackson Square), for the reasons described below. The board had previously renewed the fund’s investment advisory arrangements with Baillie Gifford Overseas Ltd. (Baillie Gifford), Jennison Associates LLC (Jennison), Wellington Management Company, LLP (Wellington Management), and William Blair & Company, L.L.C. (William Blair). Please see the fund’s semiannual report dated February 28, 2014, for more information about the board’s approval of the arrangements with Baillie Gifford, Jennison, Wellington Management, and William Blair.
In April 2014, the Focus Growth team of Delaware Investments Fund Advisers (Delaware Investments) completed its spinoff to create a new advisor, Jackson Square, which is jointly owned by the Focus Growth team and an affiliate of Delaware Investments. This new corporate structure triggered the automatic termination of the former advisory agreement with Delaware Investments, as required by law. The new agreement is identical in all material respects to the former agreement with Delaware Investments (which was previously renewed by the board), except for the date of the agreement.
The board decided to approve the agreement with Jackson Square upon an evaluation of the advisor’s investment staff, portfolio management process, and performance. The trustees considered the factors discussed below, among others. However, no single factor determined whether the board approved the arrangement. Rather, it was the totality of the circumstances that drove the board’s decision.
Nature, extent, and quality of services
The board considered the quality of the fund’s investment management services over both the short and long term, and took into account the organizational depth and stability of each advisor. The board noted that Jackson Square invests primarily in common stocks of large-capitalization, growth-oriented companies that it believes have long-term capital appreciation potential and expect to grow faster than the U.S. economy. Jackson Square uses a bottom-up approach, seeking companies that have large-end market potential, dominant business models, and strong free cash flow generation that is attractively priced compared to the intrinsic value of securities. Members of Jackson Square’s management team have managed a portion of the fund since 2010.
The board concluded that the advisor’s experience, stability, depth, and performance, among other factors, warranted approval of the advisory arrangement.
Investment performance
The board considered the short- and long-term performance of the fund and the advisor, including any periods of outperformance or underperformance relative to a benchmark index and peer group. The board concluded that the performance was such that the advisory arrangement should continue. Information about the fund’s most recent performance can be found in the Performance Summary section of this report.
Cost
The board concluded that the fund’s expense ratio was below the average expense ratio charged by funds in its peer group and that the fund’s advisory fee rate was also well below its peer-group average. Information about the fund’s expenses appears in the About Your Fund’s Expenses section of this report as well as in the Financial Statements section, which also includes information about the fund’s advisory fee rate.
36
The board did not consider the profitability of Jackson Square in determining whether to approve the advisory fee, because Jackson Square is independent of Vanguard, and the advisory fee is the result of arm’s-length negotiations.
The benefit of economies of scale
The board concluded that the fund’s shareholders benefit from economies of scale because of breakpoints in the advisory fee schedule. The breakpoints reduce the effective rate of the fee as the fund’s assets managed by the advisor increase.
The board will consider whether to renew the advisory arrangement again after a one-year period.
37
Glossary
30-Day SEC Yield. A fund’s 30-day SEC yield is derived using a formula specified by the U.S. Securities and Exchange Commission. Under the formula, data related to the fund’s security holdings in the previous 30 days are used to calculate the fund’s hypothetical net income for that period, which is then annualized and divided by the fund’s estimated average net assets over the calculation period. For the purposes of this calculation, a security’s income is based on its current market yield to maturity (for bonds), its actual income (for asset-backed securities), or its projected dividend yield (for stocks). Because the SEC yield represents hypothetical annualized income, it will differ—at times significantly—from the fund’s actual experience. As a result, the fund’s income distributions may be higher or lower than implied by the SEC yield.
Beta. A measure of the magnitude of a fund’s past share-price fluctuations in relation to the ups and downs of a given market index. The index is assigned a beta of 1.00. Compared with a given index, a fund with a beta of 1.20 typically would have seen its share price rise or fall by 12% when the index rose or fell by 10%. For this report, beta is based on returns over the past 36 months for both the fund and the index. Note that a fund’s beta should be reviewed in conjunction with its R-squared (see definition). The lower the R-squared, the less correlation there is between the fund and the index, and the less reliable beta is as an indicator of volatility.
Dividend Yield. Dividend income earned by stocks, expressed as a percentage of the aggregate market value (or of net asset value, for a fund). The yield is determined by dividing the amount of the annual dividends by the aggregate value (or net asset value) at the end of the period. For a fund, the dividend yield is based solely on stock holdings and does not include any income produced by other investments.
Earnings Growth Rate. The average annual rate of growth in earnings over the past five years for the stocks now in a fund.
Equity Exposure. A measure that reflects a fund’s investments in stocks and stock futures. Any holdings in short-term reserves are excluded.
Expense Ratio. A fund’s total annual operating expenses expressed as a percentage of the fund’s average net assets. The expense ratio includes management and administrative expenses, but does not include the transaction costs of buying and selling portfolio securities.
Foreign Holdings. The percentage of a fund represented by securities or depositary receipts of companies based outside the United States.
Inception Date. The date on which the assets of a fund (or one of its share classes) are first invested in accordance with the fund’s investment objective. For funds with a subscription period, the inception date is the day after that period ends. Investment performance is measured from the inception date.
Median Market Cap. An indicator of the size of companies in which a fund invests; the midpoint of market capitalization (market price x shares outstanding) of a fund’s stocks, weighted by the proportion of the fund’s assets invested in each stock. Stocks representing half of the fund’s assets have market capitalizations above the median, and the rest are below it.
Price/Book Ratio. The share price of a stock divided by its net worth, or book value, per share. For a fund, the weighted average price/book ratio of the stocks it holds.
38
Price/Earnings Ratio. The ratio of a stock’s current price to its per-share earnings over the past year. For a fund, the weighted average P/E of the stocks it holds. P/E is an indicator of market expectations about corporate prospects; the higher the P/E, the greater the expectations for a company’s future growth.
R-Squared. A measure of how much of a fund’s past returns can be explained by the returns from the market in general, as measured by a given index. If a fund’s total returns were precisely synchronized with an index’s returns, its R-squared would be 1.00. If the fund’s returns bore no relationship to the index’s returns, its R-squared would be 0. For this report, R-squared is based on returns over the past 36 months for both the fund and the index.
Return on Equity. The annual average rate of return generated by a company during the past five years for each dollar of shareholder’s equity (net income divided by shareholder’s equity). For a fund, the weighted average return on equity for the companies whose stocks it holds.
Short-Term Reserves. The percentage of a fund invested in highly liquid, short-term securities that can be readily converted to cash.
Turnover Rate. An indication of the fund’s trading activity. Funds with high turnover rates incur higher transaction costs and may be more likely to distribute capital gains (which may be taxable to investors). The turnover rate excludes in-kind transactions, which have minimal impact on costs.
39
The People Who Govern Your Fund
The trustees of your mutual fund are there to see that the fund is operated and managed in your best interests since, as a shareholder, you are a part owner of the fund. Your fund’s trustees also serve on the board of directors of The Vanguard Group, Inc., which is owned by the Vanguard funds and provides services to them on an at-cost basis.
A majority of Vanguard’s board members are independent, meaning that they have no affiliation with Vanguard or the funds they oversee, apart from the sizable personal investments they have made as private individuals. The independent board members have distinguished backgrounds in business, academia, and public service. Each of the trustees and executive officers oversees 177 Vanguard funds.
The following table provides information for each trustee and executive officer of the fund. More information about the trustees is in the Statement of Additional Information, which can be obtained, without charge, by contacting Vanguard at 800-662-7447, or online at vanguard.com.
| |
| InterestedTrustee1 | and Delphi Automotive LLP (automotive components); |
| | Senior Advisor at New Mountain Capital. |
| F. William McNabb III | |
| Born 1957. Trustee Since July 2009. Chairman of the | Amy Gutmann |
| Board. Principal Occupation(s) During the Past Five | Born 1949. Trustee Since June 2006. Principal |
| Years: Chairman of the Board of The Vanguard Group, | Occupation(s) During the Past Five Years: President of |
| Inc., and of each of the investment companies served | the University of Pennsylvania; Christopher H. Browne |
| by The Vanguard Group, since January 2010; Director | Distinguished Professor of Political Science, School of |
| of The Vanguard Group since 2008; Chief Executive | Arts and Sciences, and Professor of Communication, |
| Officer and President of The Vanguard Group, and of | Annenberg School for Communication, with secondary |
| each of the investment companies served by The | faculty appointments in the Department of Philosophy, |
| Vanguard Group, since 2008; Director of Vanguard | School of Arts and Sciences, and at the Graduate |
| Marketing Corporation; Managing Director of The | School of Education, University of Pennsylvania; |
| Vanguard Group (1995–2008). | Trustee of the National Constitution Center; Chair |
| | of the Presidential Commission for the Study of |
| | Bioethical Issues. |
| IndependentTrustees | |
| | JoAnn Heffernan Heisen |
| Emerson U. Fullwood | Born 1950. Trustee Since July 1998. Principal |
| Born 1948. Trustee Since January 2008. Principal | Occupation(s) During the Past Five Years: Corporate |
| Occupation(s) During the Past Five Years: Executive | Vice President and Chief Global Diversity Officer |
| Chief Staff and Marketing Officer for North America | (retired 2008) and Member of the Executive |
| and Corporate Vice President (retired 2008) of Xerox | Committee (1997–2008) of Johnson & Johnson |
| Corporation (document management products and | (pharmaceuticals/medical devices/consumer |
| services); Executive in Residence and 2009–2010 | products); Director of Skytop Lodge Corporation |
| Distinguished Minett Professor at the Rochester | (hotels), the University Medical Center at Princeton, |
| Institute of Technology; Director of SPX Corporation | the Robert Wood Johnson Foundation, and the Center |
| (multi-industry manufacturing), the United Way of | for Talent Innovation; Member of the Advisory Board |
| Rochester, Amerigroup Corporation (managed health | of the Maxwell School of Citizenship and Public Affairs |
| care), the University of Rochester Medical Center, | at Syracuse University. |
| Monroe Community College Foundation, and North | |
| Carolina A&T University. | F. Joseph Loughrey |
| | Born 1949. Trustee Since October 2009. Principal |
| Rajiv L. Gupta | Occupation(s) During the Past Five Years: President |
| Born 1945. Trustee Since December 2001.2 | and Chief Operating Officer (retired 2009) of Cummins |
| Principal Occupation(s) During the Past Five Years: | Inc. (industrial machinery); Chairman of the Board |
| Chairman and Chief Executive Officer (retired 2009) | of Hillenbrand, Inc. (specialized consumer services), |
| and President (2006–2008) of Rohm and Haas Co. | and of Oxfam America; Director of SKF AB (industrial |
| (chemicals); Director of Tyco International, Ltd. | machinery), Hyster-Yale Materials Handling, Inc. |
| (diversified manufacturing and services), Hewlett- | (forklift trucks), the Lumina Foundation for Education, |
| Packard Co. (electronic computer manufacturing), | |
| | |
| and the V Foundation for Cancer Research; Member | Executive Officers | |
| of the Advisory Council for the College of Arts and | | |
| Letters and of the Advisory Board to the Kellogg | Glenn Booraem | |
| Institute for International Studies, both at the | Born 1967. Controller Since July 2010. Principal |
| University of Notre Dame. | Occupation(s) During the Past Five Years: Principal |
| | of The Vanguard Group, Inc.; Controller of each of |
| Mark Loughridge | the investment companies served by The Vanguard |
| Born 1953. Trustee Since March 2012. Principal | Group; Assistant Controller of each of the investment |
| Occupation(s) During the Past Five Years: Senior Vice | companies served by The Vanguard Group (2001–2010). |
| President and Chief Financial Officer (retired 2013) | | |
| at IBM (information technology services); Fiduciary | Thomas J. Higgins | |
| Member of IBM’s Retirement Plan Committee (2004– | Born 1957. Chief Financial Officer Since September |
| 2013); Member of the Council on Chicago Booth. | 2008. Principal Occupation(s) During the Past Five |
| | Years: Principal of The Vanguard Group, Inc.; Chief |
| Scott C. Malpass | Financial Officer of each of the investment companies |
| Born 1962. Trustee Since March 2012. Principal | served by The Vanguard Group; Treasurer of each of |
| Occupation(s) During the Past Five Years: Chief | the investment companies served by The Vanguard |
| Investment Officer and Vice President at the University | Group (1998–2008). | |
| of Notre Dame; Assistant Professor of Finance at the | | |
| Mendoza College of Business at Notre Dame; Member | Kathryn J. Hyatt | |
| of the Notre Dame 403(b) Investment Committee; | Born 1955. Treasurer Since November 2008. Principal |
| Board Member of TIFF Advisory Services, Inc. | Occupation(s) During the Past Five Years: Principal of |
| (investment advisor); Member of the Investment | The Vanguard Group, Inc.; Treasurer of each of the |
| Advisory Committees of the Financial Industry | investment companies served by The Vanguard |
| Regulatory Authority (FINRA) and of Major League | Group; Assistant Treasurer of each of the investment |
| Baseball. | companies served by The Vanguard Group (1988–2008). |
| |
| André F. Perold | Heidi Stam | |
| Born 1952. Trustee Since December 2004. Principal | Born 1956. Secretary Since July 2005. Principal |
| Occupation(s) During the Past Five Years: George | Occupation(s) During the Past Five Years: Managing |
| Gund Professor of Finance and Banking, Emeritus | Director of The Vanguard Group, Inc.; General Counsel |
| at the Harvard Business School (retired 2011); | of The Vanguard Group; Secretary of The Vanguard |
| Chief Investment Officer and Managing Partner of | Group and of each of the investment companies |
| HighVista Strategies LLC (private investment firm); | served by The Vanguard Group; Director and Senior |
| Director of Rand Merchant Bank; Overseer of the | Vice President of Vanguard Marketing Corporation. |
| Museum of Fine Arts Boston. | | |
| | Vanguard Senior ManagementTeam |
| Alfred M. Rankin, Jr. | | |
| Born 1941. Trustee Since January 1993. Principal | Mortimer J. Buckley | Chris D. McIsaac |
| Occupation(s) During the Past Five Years: Chairman, | Kathleen C. Gubanich | Michael S. Miller |
| President, and Chief Executive Officer of NACCO | Paul A. Heller | James M. Norris |
| Industries, Inc. (housewares/lignite), and of Hyster- | Martha G. King | Glenn W. Reed |
| Yale Materials Handling, Inc. (forklift trucks); Chairman | John T. Marcante | |
| of the Board of University Hospitals of Cleveland. | | |
| |
| Peter F. Volanakis | Chairman Emeritus and Senior Advisor |
| Born 1955. Trustee Since July 2009. Principal | | |
| Occupation(s) During the Past Five Years: President | John J. Brennan | |
| and Chief Operating Officer (retired 2010) of Corning | Chairman, 1996–2009 | |
| Incorporated (communications equipment); Trustee of | Chief Executive Officer and President, 1996–2008 |
| Colby-Sawyer College; Member of the Advisory Board | | |
| of the Norris Cotton Cancer Center and of the Advisory | Founder | |
| Board of the Parthenon Group (strategy consulting). | | |
| | John C. Bogle | |
| | Chairman and Chief Executive Officer, 1974–1996 |
1 Mr. McNabb is considered an “interested person,” as defined in the Investment Company Act of 1940, because he is an officer of the
Vanguard funds.
2 December 2002 for Vanguard Equity Income Fund, the Vanguard Municipal Bond Funds, and the Vanguard State Tax-Exempt Funds.
| 
|
| | P.O. Box 2600 |
| | Valley Forge, PA 19482-2600 |
| |
| |
| |
| Connect with Vanguard® > vanguard.com | |
| |
| |
| |
| Fund Information > 800-662-7447 | CFA® is a trademark owned by CFA Institute. |
| Direct Investor Account Services > 800-662-2739 | |
| Institutional Investor Services > 800-523-1036 | |
| Text Telephone for People | |
| With Hearing Impairment > 800-749-7273 | |
| |
| This material may be used in conjunction | |
| with the offering of shares of any Vanguard | |
| fund only if preceded or accompanied by | |
| the fund’s current prospectus. | |
| |
| All comparative mutual fund data are from Lipper, a | |
| Thomson Reuters Company, or Morningstar, Inc., unless | |
| otherwise noted. | |
| |
| You can obtain a free copy of Vanguard’s proxy voting | |
| guidelines by visiting vanguard.com/proxyreporting or by | |
| calling Vanguard at 800-662-2739. The guidelines are | |
| also available from the SEC’s website, sec.gov. In | |
| addition, you may obtain a free report on how your fund | |
| voted the proxies for securities it owned during the 12 | |
| months ended June 30. To get the report, visit either | |
| vanguard.com/proxyreporting or sec.gov. | |
| |
| You can review and copy information about your fund at | |
| the SEC’s Public Reference Room in Washington, D.C. To | |
| find out more about this public service, call the SEC at | |
| 202-551-8090. Information about your fund is also | |
| available on the SEC’s website, and you can receive | |
| copies of this information, for a fee, by sending a | |
| request in either of two ways: via e-mail addressed to | |
| publicinfo@sec.gov or via regular mail addressed to the | |
| Public Reference Section, Securities and Exchange | |
| Commission, Washington, DC 20549-1520. | |
| |
| | © 2014 The Vanguard Group, Inc. |
| | All rights reserved. |
| | Vanguard Marketing Corporation, Distributor. |
| |
| | Q230 102014 |

Annual Report | August 31, 2014
Vanguard International Growth Fund
The mission continues
On May 1, 1975, Vanguard began operations, a fledgling company based on the simple but revolutionary idea that a mutual fund company should be managed solely in the interest of its investors.
Four decades later, that revolutionary spirit continues to animate the enterprise. Vanguard remains on a mission to give investors the best chance of investment success.
As we mark our 40th anniversary, we thank you for entrusting your assets to Vanguard and giving us the opportunity to help you reach your financial goals in the decades to come.
| |
| Contents | |
| Your Fund’s Total Returns. | 1 |
| Chairman’s Letter. | 2 |
| Advisors’ Report. | 7 |
| Fund Profile. | 11 |
| Performance Summary. | 13 |
| Financial Statements. | 15 |
| Your Fund’s After-Tax Returns. | 32 |
| About Your Fund’s Expenses. | 33 |
| Glossary. | 35 |
Please note: The opinions expressed in this report are just that—informed opinions. They should not be considered promises or advice.
Also, please keep in mind that the information and opinions cover the period through the date on the front of this report. Of course, the
risks of investing in your fund are spelled out in the prospectus.
See the Glossary for definitions of investment terms used in this report.
About the cover: Since our founding, Vanguard has drawn inspiration from the enterprise and valor demonstrated by British
naval hero Horatio Nelson and his command at the Battle of the Nile in 1798. The photograph displays a replica of a merchant
ship from the same era as Nelson’s flagship, the HMS Vanguard.
Your Fund’s Total Returns
| |
| Fiscal Year Ended August 31, 2014 | |
| | Total |
| | Returns |
| Vanguard International Growth Fund | |
| Investor Shares | 18.26% |
| Admiral™ Shares | 18.42 |
| MSCI All Country World Index ex USA | 17.75 |
| International Funds Average | 15.73 |
International Funds Average: Derived from data provided by Lipper, a Thomson Reuters Company.
Admiral Shares carry lower expenses and are available to investors who meet certain account-balance requirements.
Your Fund’s Performance at a Glance
August 31, 2013, Through August 31, 2014
| | | | |
| | | | Distributions Per Share |
| | Starting | Ending | | |
| | Share | Share | Income | Capital |
| | Price | Price | Dividends | Gains |
| Vanguard International Growth Fund | | | | |
| Investor Shares | $20.42 | $23.79 | $0.336 | $0.000 |
| Admiral Shares | 64.98 | 75.70 | 1.170 | 0.000 |
1

Chairman’s Letter
Dear Shareholder,
The broad international stock market notched another strong year, although its momentum generally slowed notably in the second half. For the fiscal year ended August 31, 2014, Vanguard International Growth Fund returned more than 18%, outpacing its comparative standards.
Your advisors’ selections in emerging markets—especially China—and in Japan provided a notable boost over the benchmark, more than offsetting some disappointments in Europe.
If you invest in the fund through a taxable account, you may wish to review information about the fund’s after-tax performance provided later in this report.
Stocks cleared several hurdles to chart a series of new highs
Many stock markets around the world again posted robust gains for the 12 months ended August 31. Overall, international stocks returned about 18%. Emerging markets, after sliding earlier in the period, rebounded to lead the way, returning more than 22%. The developed markets of the Pacific region and Europe trailed but still notched double-digit returns.
Despite an assortment of challenges, the broad U.S. stock market recorded an even more impressive return of about 25%. U.S. stocks registered positive results in all but two months, and a late-July swoon was followed by an August flurry of record highs.
2
Investors applauded mostly solid corporate earnings, generally upbeat economic news, and the Federal Reserve’s continued accommodative policies. Still, turmoil in the Middle East and Ukraine, economic worries in Europe and China, and uncertainty about the Fed’s next moves pressured global stocks at various times.
Defying analysts’ expectations, bond prices rose over the year
Bond markets also rallied, led by inter-national bonds, which returned 6.52% for the 12 months (as measured by the Barclays Global Aggregate Index ex USD).
The broad U.S. taxable bond market was not far behind with a return of 5.66%, following the drubbing it took a year ago when investors fretted over the future of the Fed’s bond-buying program.
The Fed began reducing its purchases in January and has consistently cut them since, with the announced goal of ending the program in October. Interest rates have not risen as forecast, however. The yield of the 10-year U.S. Treasury note ended August at 2.34%, down from 2.76% a year earlier. (Bond prices and yields move in opposite directions.)
| | | |
| Market Barometer | | | |
| |
| | | Average Annual Total Returns |
| | Periods Ended August 31, 2014 |
| | One | Three | Five |
| | Year | Years | Years |
| Stocks | | | |
| Russell 1000 Index (Large-caps) | 25.36% | 20.80% | 17.24% |
| Russell 2000 Index (Small-caps) | 17.68 | 19.00 | 17.03 |
| Russell 3000 Index (Broad U.S. market) | 24.74 | 20.65 | 17.22 |
| FTSE All-World ex US Index (International) | 18.04 | 9.48 | 8.44 |
| |
| Bonds | | | |
| Barclays U.S. Aggregate Bond Index (Broad taxable market) | 5.66% | 2.91% | 4.48% |
| Barclays Municipal Bond Index (Broad tax-exempt market) | 10.14 | 4.88 | 5.39 |
| Citigroup Three-Month U.S. Treasury Bill Index | 0.04 | 0.04 | 0.07 |
| |
| CPI | | | |
| Consumer Price Index | 1.70% | 1.64% | 1.96% |
3
Municipal bonds returned 10.14% as investors searched for tax-exempt income amid a limited supply of new issues.
Following such a strong advance for bonds, it’s worth remembering that the current low yields imply lower future returns: As yields drop, the scope for further declines—and increases in prices—diminishes.
The Fed’s target of 0%–0.25% for short-term interest rates continued to restrict returns for money market funds and savings accounts.
As developed markets lost steam, emerging markets accelerated
Investors seeking an example of the potential benefits of global diversification need look no further than the fiscal year that just ended. In the first half, the broad U.S. and developed European stock markets returned about 16% and 19%, respectively, while emerging markets and developed Pacific markets posted mid-single-digit gains.
In the second half, the broad U.S. market joined the Pacific Rim in tacking on modest gains of about 7%, while Europe retreated on mounting fears of deflation and an economic slump. Emerging markets, meanwhile, surged with a second-half return of more than 17%. Of course, you shouldn’t draw conclusions based on a short period, but the shift serves as a useful reminder that global markets don’t always move in lockstep.
Expense Ratios
Your Fund Compared With Its Peer Group
| | | |
| | Investor | Admiral | Peer Group |
| | Shares | Shares | Average |
| International Growth Fund | 0.48% | 0.35% | 1.36% |
The fund expense ratios shown are from the prospectus dated December 23, 2013, and represent estimated costs for the current fiscal year.For the fiscal year ended August 31, 2014, the fund’s expense ratios were 0.47% for Investor Shares and 0.34% for Admiral Shares. Thepeer-group expense ratio is derived from data provided by Lipper, a Thomson Reuters Company, and captures information through year-end2013.Peer group: International Funds.4
These broad-market dynamics played out in your fund, which—along with its benchmark and peers—achieved most of its gains in the first six months. Europe, which continued to represent more than half of fund assets, later struggled with little or no economic growth. The European Central Bank’s interest rate cuts, including an unprecedented negative interest rate for banks’ overnight deposits of reserves, couldn’t allay investor concerns. (Additional stimulative measures were announced after the close of the reporting period.) In a reversal from the previous fiscal year, the fund’s full-year results in France, Germany, and the United Kingdom lagged those of the benchmark’s constituents.
In contrast, emerging markets were a bright spot in the second half, as a “soft landing” for China’s economy seemed more likely and a pro-business prime minister was elected in India. The advisors’ selections within emerging markets returned about 13 percentage points more than their counterparts in the benchmark. Japan was also a source of outperformance.
The fund’s returns in all industry sectors in aggregate were positive, except in the tiny utilities sector. Information technology stocks in the emerging markets were standouts, returning more than 48%, while health care stocks were among the best performers in the developed markets.
| |
| Total Returns | |
| Ten Years Ended August 31, 2014 | |
| | Average |
| | Annual Return |
| International Growth Fund Investor Shares | 8.74% |
| Spliced International Index | 6.40 |
| International Funds Average | 6.77 |
For a benchmark description, see the Glossary.International Funds Average: Derived from data provided by Lipper, a Thomson Reuters Company.The figures shown represent past performance, which is not a guarantee of future results. (Current performance may be
lower or higher than the performance data cited. For performance data current to the most recent month-end, visit our
website at vanguard.com/performance.) Note, too, that both investment returns and principal value can fluctuate widely, so
an investor’s shares, when sold, could be worth more or less than their original cost.5
A word on foreign currency effects: Changes in the relative strength or weakness of foreign currencies relative to the U.S. dollar didn’t have a significant impact for U.S.-based investors, except in Japan, where the yen’s weakness cut the return of U.S. investors about in half compared with local currency returns.
For more about the advisors’ strategies and the fund’s positioning during the 12 months, see the Advisors’ Report that follows this letter. Please note that, effective October 3, Charles Anniss replaced Greg Aldridge as the portfolio manager for the portion of the fund’s assets overseen by M&G Investment Management Limited.
Discipline and focus produced admirable long-term results
The fund’s long-term performance continued to impress. For the ten years ended August 31, 2014, the average annual return of Investor Shares was 8.74%, about 2 percentage points ahead of its comparative standards.
During a decade marked by myriad challenges in both developed and emerging markets, your fund’s advisors have distinguished themselves with their disciplined strategies. And Vanguard’s low costs have helped shareholders keep more of their returns.
High costs don’t equal strong fund performance
The old adage “you get what you pay for” doesn’t apply to mutual funds. In fact, the reverse is true: Research suggests that higher costs are consistent with weaker returns. (See, for example, Shopping for Alpha: You Get What You Don’t Pay For at vanguard.com/research.)
Wouldn’t paying the highest fees allow you to purchase the services of the greatest talents and therefore get you the best returns? As it turns out, the data don’t support that argument. The explanation is simple: Every dollar paid for management fees is a dollar less earning potential return. Keeping expenses down can help narrow the gap between what the markets return and what investors actually earn.
That’s why Vanguard always seeks to minimize costs. Indexing, of course, is the purest form of low-cost investing. And we negotiate low fees for the International Growth Fund and our other actively managed funds, which are run by world-class advisors. It’s a strategy that reflects decades of experience and research, boiled down to one tenet: The less you pay, the more you keep.
As always, thank you for entrusting your assets to Vanguard.
Sincerely,

F. William McNabb III
Chairman and Chief Executive Officer
September 15, 2014
6
Advisors’ Report
For the fiscal year ended August 31, 2014, Vanguard International Growth Fund returned more than 18%, outpacing its benchmark index and the average return of peer funds. Your fund is managed by three independent advisors, a strategy that enhances the fund’s diversification by providing exposure to distinct yet complementary investment approaches. It’s not uncommon for different advisors to have different views about individual securities or the broader investment environment.
The advisors, the amount and percentage of fund assets each manages, and brief descriptions of their investment strategies are presented in the table below. The advisors have also prepared a discussion of
the investment environment that existed during the fiscal year and of how the portfolio’s positioning reflects this assessment. These comments were prepared on September 11, 2014.
Baillie Gifford Overseas Ltd.
Portfolio Managers:
James K. Anderson,
Head of Global Equities
Kave Sigaroudinia,
Head of EAFE Alpha Research
We remain as enthusiastic as ever about our holdings and the strategic positioning of our portion of the portfolio, which is driven by some enduring and powerful
Vanguard International Growth Fund Investment Advisors
| | | |
| | Fund Assets Managed | |
| Investment Advisor | % | $ Million | | Investment Strategy |
| Baillie Gifford Overseas Ltd. | 51 | 11,963 | The advisor seeks stocks that can generate |
| | | | above-average growth in earnings and cash flow, |
| | | | producing a bottom-up, stock-driven approach to |
| | | | country and asset allocation. An in-depth view on each |
| | | | company is measured against the consensus view, |
| | | | leading to discrepancies and potential opportunities to |
| | | | add value. |
| Schroder Investment | 35 | 8,097 | Equity analysts located around the world and an |
| Management North America Inc. | | | international team of global sector specialists help to |
| | | | identify reasonably priced companies with strong |
| | | | growth prospects and a sustainable competitive |
| | | | advantage. |
| M&G Investment Management | 13 | 3,126 | The advisor constructs a portfolio using a long-term, |
| Limited | | | bottom-up investment approach focusing on identifying |
| | | | underappreciated companies—particularly those with |
| | | | scarce assets—with the ability to deliver high returns |
| | | | and growth potential. |
| Cash Investments | 1 | 205 | These short-term reserves are invested by Vanguard in |
| | | | equity index products to simulate investment in stocks. |
| | | | Each advisor may also maintain a modest cash |
| | | | position. |
7
global trends. We believe we are in an unusual period where many large sectors are changing rapidly and some special businesses are being created.
Although market sentiment continues to swing quite markedly, we disagree with those who are predicting dramatic economic developments. The tapering of the Federal Reserve’s bond-buying program is a signal that the U.S. economy is broadening. We believe Europe is more likely to grow rather than relapse, and we are increasingly enthusiastic about China’s leadership, which is pursuing a more balanced, sustainable growth path driven by homegrown innovation.
We try to ignore short-term headlines; the long-term opportunities for our companies are more important. This was epitomized by recent events surrounding Fiat, a positive contributor over the past year. The completion of its Chrysler purchase and the beginnings of Maserati’s renaissance were well-received, but CEO Sergio Marchionne’s subsequent long-term growth plan was met with skepticism by the market. However, we think management deserves huge credit for its achievements. The company can accomplish much more through a revival of Alfa Romeo, a radical removal of unprofitable capacity, and further steps forward in America. We added to our Fiat holding and opened a position in EXOR, the family-run holding company with stakes in Fiat and several other companies.
The strongest contributions to our performance have come from two groups: Asian internet titans Tencent, Baidu, and NAVER, which are growing rapidly and making considerable progress in monetizing mobile users, and several economically sensitive European stocks, such as Banco Popular, UniCredit, and Banco Santander, which have benefited from clearer signs of economic reform in southern Europe. These gains more than offset weakness in some of our holdings that are sensitive to commodity prices, such as agribusiness Syngenta, and those selling luxury goods, such as Kering and Richemont.
Over the last year, we continued to invest in companies where change is driving growth, and we believe the potential returns can make a significant difference to the portfolio. We have invested in diverse businesses benefiting from the increasing reach of the internet, including Ocado, a pure online food retailer in the United Kingdom, and M3, a Japanese provider of online marketing support for pharmaceutical companies.
We also opened positions in Volvo, the Swedish truck manufacturer, and Yaskawa Electric, which makes equipment for factory automation. These positions were funded by the sale of two long-term tech holdings, Samsung Electronics and Kyocera, businesses that we feel are increasingly mature.
Schroder Investment Management North America Inc.
Portfolio Manager:
Simon Webber, CFA
International equity markets were strong, climbing a classic wall of worry around global growth prospects and geopolitical risk in Ukraine and the Middle East.
8
Our returns in Europe, while good in absolute terms, lagged the very strong performance of stocks in its periphery. Germany-listed sportswear manufacturer adidas performed poorly, as a combination of a weak golf market, the downturn in Russia, and competition with Nike took a toll on profitability.
The European Central Bank-driven recovery in peripheral sovereign bond markets led to large inflows of capital into these stock markets and, in our opinion, pushed up valuations to unattractive levels, so we have generally avoided domestic stocks in these countries. Our holdings in Europe remain more focused on quality businesses with a global footprint, such as electrical equipment supplier Schneider and optical lens manufacturer Essilor. The more recent weakening of the euro has already begun to help these exporters, and we expect this to continue to be a supportive trend well into 2015.
Some of our best performers were Japanese companies, such as Suzuki Motor and Astellas Pharma. Suzuki owns a majority stake in Maruti Suzuki, which has an almost 50% share of the Indian auto market, a market that we believe can triple in size over the next decade. Strong local and international confidence in the new government in India, led by Prime Minister Narendra Modi, has unleashed a positive economic cycle. This has also benefited our other Indian holdings such as Tata Motors, HDFC Bank, Axis Bank, and Zee Entertainment.
One of the most powerful structural trends we see ahead is the growth in mobile services and connectivity of more devices to the internet. This will benefit industries including software, telecoms, and network equipment and is supportive of the growth trends for several of our holdings, such as semiconductor company TSMC, mobile operator Vodafone, software company SAP, and mobile equipment supplier Nokia
As China continues its transition to a more modest and balanced growth path, our interest there remains focused on companies that are in a position to take advantage of increases in services and consumption. Life insurance is a good example of a business that we believe has the opportunity to grow market penetration for 10 to 20 years. We have added China Pacific Insurance to our Asian-exposed insurance holdings of AIA and Prudential.
M&G Investment Management Limited
Portfolio Manager:
Greg Aldridge
International equity markets rose, but the road was far from smooth. The autumn of 2013 was dominated by the question of “tapering”: When would the Federal Reserve begin winding down its asset-buying program, and by how much? The Fed ended the speculation in December, announcing that asset-buying would be reduced by $10 billion per month starting in January, leading many equity markets to finish 2013 on a high.
9
The ebullience was short-lived, however. In January, emerging market currency turmoil and renewed concerns over the health of the Chinese economy drove a mood of risk aversion. Later, accommodative policy from the world’s major central banks helped to enliven investors, although optimism was reined in by ongoing geopolitical tensions, especially in the Middle East and Ukraine.
Some of our stock selections weighed on returns, notably in the information technology and consumer discretionary sectors. Germany-listed sportswear manufacturer adidas disappointed, in part because of investor anxiety over the company’s Russian exposure given the ongoing tensions with Ukraine; a slump in demand for golf supplies in North America also hurt revenues. German banking and retail IT provider Wincor Nixdorf also suffered, as decelerated sales in Russia and Turkey contributed to results that failed to meet investor expectations and pushed down its share price.
Another notable laggard was French steel pipe maker Vallourec, which makes high-quality pipes and connectors for modern oil wells. One of its largest customers, Brazilian oil company Petroleo Brasileiro (Petrobras), faced political and financial pressures to cut costs and shrink inventory, leading to reduced demand for Vallourec’s products. Vallourec reported a drop in anticipated profits as a result, and investors reacted badly to the news.
On the positive side, we were pleased to see Brazil generally returning to investor favor toward the end of the period, Vallourec’s difficulties notwithstanding. Some of our Brazilian holdings were particularly supportive of performance, namely Petrobras and lender Banco do Brasil. Astellas Pharma, a Japanese pharmaceutical firm, also buoyed returns after investors were cheered by reports of robust sales growth for a number of its products. Our best performer was U.K.-based specialist chemicals producer AZ Electronic Materials. The firm’s share price soared on news that German chemical and pharmaceutical company Merck KGaA had agreed to buy the business at a significant premium; the transaction was completed, and we no longer hold the stock.
As active stockpickers, we continued to selectively purchase companies with compelling scarce assets, structural growth drivers, and the potential for sustainably high returns as they became available at attractive valuations. For example, we established positions in Taiwanese chip maker MediaTek, Thai banking group Kasikornbank, and Samsonite, the globally renowned luggage brand. Conversely, we sold out of a number of holdings in favor of more attractively valued companies with stronger growth prospects. These included German fragrances and flavors manufacturer Symrise, Hong Kong-based clothing retailer Esprit, and AP Moller-Maersk, a Danish diversified shipping company.
10
International Growth Fund
Fund Profile
As of August 31, 2014
| | |
| Share-Class Characteristics | |
| | Investor | Admiral |
| | Shares | Shares |
| Ticker Symbol | VWIGX | VWILX |
| Expense Ratio1 | 0.48% | 0.35% |
| | |
| Portfolio Characteristics | | |
| | | MSCI AC |
| | | World Index |
| | Fund | ex USA |
| Number of Stocks | 183 | 1,817 |
| Median Market Cap | $33.5B | $34.7B |
| Price/Earnings Ratio | 20.3x | 17.3x |
| Price/Book Ratio | 2.1x | 1.7x |
| Return on Equity | 16.7% | 14.9% |
| Earnings Growth | | |
| Rate | 16.1% | 11.3% |
| Dividend Yield | 2.3% | 3.0% |
| Turnover Rate | 21% | — |
| Short-Term Reserves | 0.8% | — |
| | |
| Sector Diversification (% of equity exposure) |
| | | MSCI AC |
| | | World Index |
| | Fund | ex USA |
| Consumer Discretionary | 18.2% | 10.5% |
| Consumer Staples | 5.9 | 9.8 |
| Energy | 4.0 | 9.4 |
| Financials | 24.9 | 27.1 |
| Health Care | 7.5 | 8.2 |
| Industrials | 13.6 | 10.8 |
| Information Technology | 15.1 | 6.9 |
| Materials | 6.2 | 8.4 |
| Telecommunication Services | 4.3 | 5.3 |
| Utilities | 0.3 | 3.6 |
| |
| Volatility Measures | |
| | MSCI AC |
| | World |
| | Index |
| | ex USA |
| R-Squared | 0.95 |
| Beta | 1.08 |
| These measures show the degree and timing of the fund’s fluctuations compared with the indexes over 36 months. |
|
| | |
| Ten Largest Holdings (% of total net assets) |
| Baidu Inc. | Internet Software & | |
| | Services | 2.8% |
| Tencent Holdings Ltd. | Internet Software & | |
| | Services | 2.7 |
| AIA Group Ltd. | Life & Health | |
| | Insurance | 2.5 |
| SoftBank Corp. | Wireless | |
| | Telecommunication | |
| | Services | 2.1 |
| SMC Corp. | Industrial Machinery | 1.7 |
| Inditex SA | Apparel Retail | 1.7 |
| Banco Popular Espanol | | |
| SA | Diversified Banks | 1.6 |
| Amazon.com Inc. | Internet Retail | 1.6 |
| Fiat SPA | Automobile | |
| | Manufacturers | 1.5 |
| UniCredit SPA | Diversified Banks | 1.5 |
| Top Ten | | 19.7% |
| The holdings listed exclude any temporary cash investments and equity index products. |
|
Allocation by Region (% of equity exposure)

1 The expense ratios shown are from the prospectus dated December 23, 2013, and represent estimated costs for the current fiscal year. For the
fiscal year ended August 31, 2014, the expense ratios were 0.47% for Investor Shares and 0.34% for Admiral Shares.
11
International Growth Fund
Market Diversification (% of equity exposure)
| | |
| | | MSCI AC |
| | | World |
| | | Index |
| | Fund | ex USA |
| Europe | | |
| United Kingdom | 14.9% | 15.2% |
| Switzerland | 7.7 | 6.4 |
| France | 7.3 | 6.9 |
| Sweden | 6.4 | 2.1 |
| Germany | 5.8 | 6.2 |
| Spain | 5.0 | 2.5 |
| Italy | 3.4 | 1.7 |
| Denmark | 1.7 | 1.0 |
| Norway | 1.7 | 0.6 |
| Other | 1.5 | 4.1 |
| Subtotal | 55.4% | 46.7% |
| Pacific | | |
| Japan | 12.4% | 14.3% |
| Hong Kong | 4.2 | 2.1 |
| South Korea | 2.2 | 3.4 |
| Australia | 1.5 | 5.7 |
| Other | 0.4 | 1.2 |
| Subtotal | 20.7% | 26.7% |
| Emerging Markets | | |
| China | 8.4% | 4.2% |
| India | 2.6 | 1.5 |
| Brazil | 2.0 | 2.6 |
| Taiwan | 1.2 | 2.7 |
| Other | 4.4 | 7.4 |
| Subtotal | 18.6% | 18.4% |
| North America | | |
| United States | 2.2% | 0.0% |
| Canada | 2.0 | 7.8 |
| Subtotal | 4.2% | 7.8% |
| Middle East | | |
| Israel | 1.1% | 0.4% |
12
International Growth Fund
Performance Summary
All of the returns in this report represent past performance, which is not a guarantee of future results that may be achieved by the fund. (Current performance may be lower or higher than the performance data cited. For performance data current to the most recent month-end, visit our website at vanguard.com/performance.) Note, too, that both investment returns and principal value can fluctuate widely, so an investor’s shares, when sold, could be worth more or less than their original cost. The returns shown do not reflect taxes that a shareholder would pay on fund distributions or on the sale of fund shares.
Cumulative Performance: August 31, 2004, Through August 31, 2014
Initial Investment of $10,000
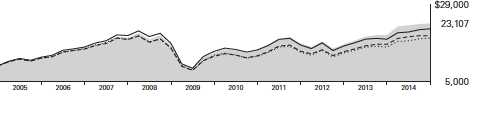
| | | | | |
| | | | Average Annual Total Returns | |
| | | Periods Ended August 31, 2014 | |
| | | | | | Final Value |
| | | One | Five | Ten | of a $10,000 |
| | | Year | Years | Years | Investment |
| | International Growth Fund*Investor | | | | |
| | Shares | 18.26% | 10.52% | 8.74% | $23,107 |
| •••••••• | Spliced International Index | 17.75 | 6.98 | 6.40 | 18,596 |
| – – – – | International Funds Average | 15.73 | 8.28 | 6.77 | 19,251 |
| | MSCI All Country World Index ex | | | | |
| | USA | 17.75 | 8.17 | 7.93 | 21,460 |
For a benchmark description, see the Glossary.
International Funds Average: Derived from data provided by Lipper, a Thomson Reuters Company. |
|
| | | | |
| | | | | Final Value |
| | One | Five | Ten | of a $50,000 |
| | Year | Years | Years | Investment |
| International Growth Fund Admiral Shares | 18.42% | 10.66% | 8.92% | $117,478 |
| Spliced International Index | 17.75 | 6.98 | 6.40 | 92,979 |
| MSCI All Country World Index ex USA | 17.75 | 8.17 | 7.93 | 107,298 |
See Financial Highlights for dividend and capital gains information.
13
International Growth Fund
Fiscal-Year Total Returns (%): August 31, 2004, Through August 31, 2014
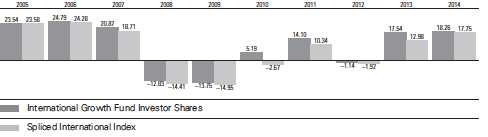
For a benchmark description, see the Glossary.
Average Annual Total Returns: Periods Ended June 30, 2014
This table presents returns through the latest calendar quarter—rather than through the end of the fiscal period.
Securities and Exchange Commission rules require that we provide this information.
| | | | |
| | Inception | One | Five | Ten |
| | Date | Year | Years | Years |
| Investor Shares | 9/30/1981 | 24.76% | 13.36% | 8.50% |
| Admiral Shares | 8/13/2001 | 24.91 | 13.52 | 8.68 |
14
International Growth Fund
Financial Statements
Statement of Net Assets
As of August 31, 2014
The fund reports a complete list of its holdings in regulatory filings four times in each fiscal year, at the quarter-ends. For the second and fourth fiscal quarters, the lists appear in the fund’s semiannual and annual reports to shareholders. For the first and third fiscal quarters, the fund files the lists with the Securities and Exchange Commission on Form N-Q. Shareholders can look up the fund’s Forms N-Q on the SEC’s website at sec.gov. Forms N-Q may also be reviewed and copied at the SEC’s Public Reference Room (see the back cover of this report for further information).
| | | |
| | | | Market |
| | | | Value |
| | | Shares | ($000) |
| Common Stocks (98.0%)1 | | |
| Australia (1.4%) | | |
| ^ | Fortescue Metals | | |
| | Group Ltd. | 37,171,012 | 145,196 |
| | James Hardie | | |
| | Industries plc | 6,196,069 | 74,261 |
| | Brambles Ltd. | 5,946,464 | 52,824 |
| | Cochlear Ltd. | 743,560 | 50,410 |
| | | | 322,691 |
| Brazil (1.9%) | | |
| | Vale SA Class B ADR | 6,764,400 | 78,805 |
| | Raia Drogasil SA | 7,377,749 | 71,850 |
| | Petroleo Brasileiro SA | | |
| | Preference Shares | 6,451,000 | 67,291 |
| | BM&FBovespa SA | 11,108,800 | 66,995 |
| | AMBEV SA | 8,514,800 | 62,002 |
| | Vale SA | | |
| | Preference Shares | 4,500,000 | 52,207 |
| | Banco do Brasil SA | 3,100,000 | 48,456 |
| | Itau Unibanco | | |
| | Holding SA ADR | 520,224 | 9,364 |
| | | | 456,970 |
| Canada (2.0%) | | |
| | Toronto-Dominion Bank | 5,017,326 | 264,179 |
| | Suncor Energy Inc. | 2,714,834 | 111,435 |
| | Bank of Nova Scotia | 1,019,000 | 67,515 |
| | Sherritt International Corp. | 2,615,219 | 10,270 |
| * | Dominion Diamond Corp. | 732,000 | 9,917 |
| | | | 463,316 |
| Chile (0.3%) | | |
| | Sociedad Quimica y | | |
| | Minera de Chile SA ADR | 2,334,900 | 63,930 |
| |
| China (8.3%) | | |
| * | Baidu Inc. ADR | 3,075,200 | 659,692 |
| * | Tencent Holdings Ltd. | 39,273,900 | 639,217 |
| | CNOOC Ltd. | 68,337,000 | 137,140 |
| | | |
| | | | Market |
| | | | Value |
| | | Shares | ($000) |
| | New Oriental | | |
| | Education & Technology | | |
| | Group Inc. ADR | 3,663,200 | 83,558 |
| | Beijing Enterprises | | |
| | Holdings Ltd. | 7,987,000 | 68,818 |
| | China Pacific Insurance | | |
| | Group Co. Ltd. | 16,965,800 | 63,730 |
| * | JD.com Inc. ADR | 1,930,100 | 61,609 |
| ^ | Mindray Medical | | |
| | International Ltd. ADR | 1,530,000 | 47,797 |
| | China Construction | | |
| | Bank Corp. | 61,965,000 | 46,038 |
| | Shandong Weigao | | |
| | Group Medical | | |
| | Polymer Co. Ltd. | 44,588,000 | 45,098 |
| * | Youku Tudou Inc. ADR | 2,077,149 | 41,127 |
| | Belle International | | |
| | Holdings Ltd. | 23,826,000 | 30,462 |
| | Yingde Gases | | |
| | Group Co. Ltd. | 8,335,000 | 8,914 |
| * | Chaoda Modern | | |
| | Agriculture | | |
| | Holdings Ltd. | 17,258,719 | 337 |
| | | | 1,933,537 |
| Denmark (1.7%) | | |
| | Novo Nordisk A/S Class B | 4,218,199 | 193,471 |
| | Novozymes A/S | 3,172,000 | 147,436 |
| | Chr Hansen Holding A/S | 1,508,200 | 61,307 |
| | | | 402,214 |
| Finland (0.8%) | | |
| | Nokia Oyj | 21,469,645 | 180,312 |
| |
| France (7.1%) | | |
| | Kering | 1,182,302 | 250,648 |
| | Schneider Electric SE | 2,940,873 | 248,795 |
| | L’Oreal SA | 1,259,107 | 208,540 |
| | Essilor International SA | 1,649,043 | 174,969 |
| | Sanofi | 1,523,217 | 166,934 |
15
International Growth Fund
| | | |
| | | | Market |
| | | | Value |
| | | Shares | ($000) |
| | BNP Paribas SA | 1,394,790 | 94,251 |
| | Societe Generale SA | 1,510,000 | 76,589 |
| | Safran SA | 1,119,706 | 73,418 |
| | Publicis Groupe SA | 979,909 | 73,040 |
| | Airbus Group NV | 1,125,000 | 69,225 |
| | Total SA | 1,038,000 | 68,496 |
| | Suez Environnement Co. | 3,467,210 | 63,949 |
| | Vallourec SA | 1,160,000 | 51,839 |
| | Arkema SA | 585,606 | 43,979 |
| | | | 1,664,672 |
| Germany (5.7%) | | |
| | SAP SE | 2,888,767 | 225,164 |
| | HeidelbergCement AG | 2,765,705 | 209,362 |
| | Continental AG | 593,840 | 127,095 |
| | GEA Group AG | 2,581,263 | 117,153 |
| | adidas AG | 1,544,726 | 116,154 |
| | Volkswagen AG | 483,893 | 108,721 |
| | Porsche Automobil | | |
| | Holding SE Preference | | |
| | Shares | 1,173,456 | 107,095 |
| | Fresenius Medical Care | | |
| | AG & Co. KGaA | 1,140,000 | 80,323 |
| | Bayerische Motoren | | |
| | Werke AG | 609,190 | 71,097 |
| | MTU Aero Engines AG | 634,000 | 55,445 |
| | Wincor Nixdorf AG | 887,000 | 47,257 |
| ^,* | Aixtron SE | 3,130,112 | 41,044 |
| ^,* | SMA Solar | | |
| | Technology AG | 719,595 | 23,116 |
| | | | 1,329,026 |
| Hong Kong (4.2%) | | |
| | AIA Group Ltd. | 108,414,400 | 591,203 |
| | Jardine Matheson | | |
| | Holdings Ltd. | 3,035,947 | 182,896 |
| | Hong Kong Exchanges | | |
| | and Clearing Ltd. | 4,582,630 | 105,276 |
| | Techtronic Industries Co. | 17,539,782 | 53,497 |
| | Hang Lung | | |
| | Properties Ltd. | 13,062,000 | 43,157 |
| | | | 976,029 |
| India (2.6%) | | |
| | Idea Cellular Ltd. | 66,782,421 | 178,497 |
| | Housing Development | | |
| | Finance Corp. | 7,692,900 | 136,549 |
| | Tata Motors Ltd. | 12,052,773 | 104,582 |
| | HDFC Bank Ltd. | 5,446,764 | 76,017 |
| | Zee Entertainment | | |
| | Enterprises Ltd. | 14,692,788 | 66,378 |
| * | Axis Bank Ltd. | 5,756,680 | 37,687 |
| | | | 599,710 |
| | | |
| | | | Market |
| | | | Value |
| | | Shares | ($000) |
| Indonesia (0.3%) | | |
| | Bank Mandiri Persero | | |
| | Tbk PT | 77,192,500 | 68,875 |
| |
| Ireland (0.3%) | | |
| | Kerry Group plc Class A | 1,004,400 | 75,558 |
| |
| Israel (1.1%) | | |
| * | Check Point Software | | |
| | Technologies Ltd. | 3,594,808 | 255,303 |
| |
| Italy (3.3%) | | |
| * | Fiat SPA | 36,834,156 | 360,242 |
| | UniCredit SPA | 45,247,520 | 350,919 |
| * | Telecom Italia SPA | | |
| | (Registered) | 49,084,622 | 56,623 |
| | Exor SPA | 304,691 | 12,135 |
| | | | 779,919 |
| Japan (12.1%) | | |
| | SoftBank Corp. | 6,785,600 | 490,295 |
| | SMC Corp. | 1,516,400 | 397,021 |
| | Rakuten Inc. | 19,991,600 | 258,978 |
| | Sumitomo Mitsui | | |
| | Financial Group Inc. | 5,074,000 | 205,239 |
| | Bridgestone Corp. | 5,774,300 | 198,323 |
| | Astellas Pharma Inc. | 12,797,640 | 184,543 |
| | Suzuki Motor Corp. | 4,510,800 | 146,749 |
| | Hitachi Ltd. | 16,562,000 | 125,512 |
| | Nissan Motor Co. Ltd. | 11,737,600 | 112,746 |
| | FANUC Corp. | 555,700 | 93,147 |
| | Sekisui Chemical Co. Ltd. | 7,736,000 | 91,555 |
| | M3 Inc. | 5,051,100 | 88,372 |
| | Toyota Motor Corp. | 1,444,983 | 82,449 |
| | Yaskawa Electric Corp. | 5,132,000 | 66,091 |
| | MISUMI Group Inc. | 2,040,010 | 63,515 |
| | East Japan Railway Co. | 801,300 | 62,295 |
| | SBI Holdings Inc. | 4,470,400 | 53,025 |
| | Canon Inc. | 1,337,922 | 43,661 |
| | Sysmex Corp. | 956,392 | 37,064 |
| ^ | Gree Inc. | 2,486,758 | 19,508 |
| | | | 2,820,088 |
| Mexico (0.5%) | | |
| | Grupo Financiero | | |
| | Banorte SAB de CV | 17,409,063 | 122,546 |
| |
| Netherlands (0.0%) | | |
| ^ | TNT Express NV | 13,616 | 102 |
16
International Growth Fund
| | | |
| | | | Market |
| | | | Value |
| | | Shares | ($000) |
| Norway (1.7%) | | |
| ^ | Statoil ASA | 6,877,228 | 193,455 |
| | DNB ASA | 6,242,107 | 116,817 |
| | Schibsted ASA | 1,760,994 | 89,815 |
| | | | 400,087 |
| Peru (0.8%) | | |
| | Credicorp Ltd. | 1,191,679 | 184,794 |
| |
| Portugal (0.2%) | | |
| | Jeronimo Martins | | |
| | SGPS SA | 3,627,182 | 49,196 |
| |
| Russia (0.4%) | | |
| | Magnit OJSC GDR | 1,205,245 | 70,196 |
| * | Mail.ru Group Ltd. GDR | 1,266,000 | 34,033 |
| | | | 104,229 |
| Singapore (0.4%) | | |
| | DBS Group Holdings Ltd. | 3,811,555 | 54,637 |
| | Singapore Exchange Ltd. | 6,541,000 | 38,109 |
| | | | 92,746 |
| South Africa (0.3%) | | |
| | Sasol Ltd. | 680,000 | 39,520 |
| | MTN Group Ltd. | 1,625,000 | 36,758 |
| | | | 76,278 |
| South Korea (2.1%) | | |
| | NAVER Corp. | 268,246 | 203,691 |
| ^ | Celltrion Inc. | 1,804,466 | 74,182 |
| | Hyundai Motor Co. | 284,257 | 65,345 |
| | Samsung Electronics | | |
| | Co. Ltd. | 51,500 | 62,706 |
| | Hankook Tire Co. Ltd. | 1,000,000 | 51,905 |
| | Shinhan Financial | | |
| | Group Co. Ltd. | 771,836 | 39,985 |
| | | | 497,814 |
| Spain (4.9%) | | |
| * | Inditex SA | 13,416,925 | 388,695 |
| * | Banco Popular | | |
| | Espanol SA | 59,271,003 | 370,254 |
| * | Banco Santander SA | 27,573,835 | 274,721 |
| | Distribuidora | | |
| | Internacional de | | |
| | Alimentacion SA | 12,745,795 | 107,223 |
| | | | 1,140,893 |
| Sweden (6.4%) | | |
| | Investment AB Kinnevik | 8,455,840 | 343,139 |
| | Atlas Copco AB Class A | 11,455,649 | 334,257 |
| | Svenska Handelsbanken | | |
| | AB Class A | 6,023,752 | 282,834 |
| | Alfa Laval AB | 5,199,985 | 118,930 |
| | Sandvik AB | 8,283,298 | 103,406 |
| ^ | Elekta AB Class B | 8,638,260 | 98,748 |
| | Volvo AB Class B | 6,810,975 | 81,432 |
| | | |
| | | | Market |
| | | | Value |
| | | Shares | ($000) |
| | Telefonaktiebolaget | | |
| | LM Ericsson Class B | 5,581,000 | 69,548 |
| | Svenska Cellulosa AB | | |
| | SCA Class B | 2,482,342 | 59,718 |
| | | | 1,492,012 |
| Switzerland (7.6%) | | |
| | Roche Holding AG | 1,151,030 | 336,168 |
| | Syngenta AG | 872,284 | 313,293 |
| | Nestle SA | 3,602,991 | 279,478 |
| | Credit Suisse Group AG | 6,271,672 | 176,936 |
| * | Cie Financiere | | |
| | Richemont SA | 1,826,264 | 174,460 |
| | Geberit AG | 318,595 | 108,218 |
| | Novartis AG | 992,000 | 89,128 |
| | Zurich Insurance | | |
| | Group AG | 245,000 | 73,966 |
| | ABB Ltd. | 3,154,459 | 71,746 |
| | Holcim Ltd. | 726,000 | 57,784 |
| | Swatch Group AG (Bearer) | 96,145 | 52,190 |
| | Adecco SA | 626,754 | 47,542 |
| | | | 1,780,909 |
| Taiwan (1.2%) | | |
| | Taiwan Semiconductor | | |
| | Manufacturing Co. Ltd. | 55,471,508 | 231,831 |
| | MediaTek Inc. | 2,300,000 | 38,439 |
| | | | 270,270 |
| Thailand (0.8%) | | |
| | Kasikornbank PCL | | |
| | (Foreign) | 25,807,956 | 182,635 |
| |
| Turkey (0.9%) | | |
| | Turkiye Garanti | | |
| | Bankasi AS | 37,457,981 | 146,704 |
| | BIM Birlesik | | |
| | Magazalar AS | 3,001,780 | 70,533 |
| | | | 217,237 |
| United Kingdom (14.4%) | | |
| | Prudential plc | 13,900,946 | 335,085 |
| | ARM Holdings plc | 18,738,626 | 302,830 |
| | Standard Chartered plc | 13,307,732 | 268,238 |
| | Rolls-Royce Holdings plc | 15,096,643 | 256,174 |
| | Vodafone Group plc | 57,649,021 | 198,135 |
| * | Aggreko plc | 6,818,283 | 192,810 |
| | HSBC Holdings plc | 17,320,211 | 187,219 |
| ^ | Royal Dutch Shell plc | | |
| | Class A | 3,774,853 | 152,527 |
| | BHP Billiton plc | 4,543,796 | 143,228 |
| | BG Group plc | 6,561,427 | 130,794 |
| | Diageo plc | 3,979,379 | 117,434 |
| | WPP plc | 4,927,226 | 103,403 |
| | Meggitt plc | 12,650,582 | 99,006 |
| | Barclays plc | 23,014,283 | 85,840 |
17
International Growth Fund
| | | |
| | | | Market |
| | | | Value |
| | | Shares | ($000) |
| | Unilever plc | 1,898,000 | 83,722 |
| | Inchcape plc | 6,932,854 | 77,784 |
| | Burberry Group plc | 3,217,639 | 76,010 |
| | Carnival plc | 1,831,000 | 68,583 |
| | G4S plc | 14,892,000 | 65,581 |
| | Ultra Electronics | | |
| | Holdings plc | 2,128,000 | 63,168 |
| ^,* | Ocado Group plc | 10,696,869 | 58,335 |
| | AstraZeneca plc | 750,634 | 57,280 |
| * | ASOS plc | 1,191,500 | 56,178 |
| | British American | | |
| | Tobacco plc | 932,415 | 55,128 |
| | Intertek Group plc | 980,000 | 45,571 |
| | Spectris plc | 1,340,000 | 43,366 |
| | Reckitt Benckiser | | |
| | Group plc | 299,848 | 26,167 |
| | BT Group plc | 3,346,444 | 21,516 |
| | | | 3,371,112 |
| United States (2.3%) | | |
| * | Amazon.com Inc. | 1,071,200 | 363,180 |
| | MercadoLibre Inc. | 1,215,300 | 139,686 |
| | Samsonite | | |
| | International SA | 16,626,000 | 57,397 |
| | | | 560,263 |
| Total Common Stocks | | |
| (Cost $17,910,903) | | 22,935,273 |
| Preferred Stock (0.0%) | | |
| | Zee Entertainment | | |
| | Enterprises Ltd. Pfd., | | |
| | 6.000% (Cost $3,163) | 238,220,682 | 3,224 |
| Temporary Cash Investments (2.8%)1 | |
| Money Market Fund (2.7%) | | |
| 2,3 | Vanguard Market | | |
| | Liquidity Fund, | | |
| | 0.113% | 632,180,321 | 632,180 |
| | |
| | Face | Market |
| | Amount | Value |
| | ($000) | ($000) |
| U.S. Government and Agency Obligations (0.1%) |
| 4,5,6 Federal Home Loan | | |
| Bank Discount Notes, | | |
| 0.080%, 10/8/14 | 9,600 | 9,599 |
| 4,5,6 Federal Home Loan Bank | | |
| Discount Notes, | | |
| 0.090%, 10/10/14 | 5,000 | 5,000 |
| 4,6 Federal Home Loan Bank | | |
| Discount Notes, | | |
| 0.070%, 10/17/14 | 600 | 600 |
| | | 15,199 |
| Total Temporary Cash Investments | |
| (Cost $647,379) | | 647,379 |
| Total Investments (100.8%) | | |
| (Cost $18,561,445) | | 23,585,876 |
| Other Assets and Liabilities (-0.8%) | |
| Other Assets | | 363,655 |
| Liabilities3 | | (558,168) |
| | | (194,513) |
| Net Assets (100%) | | 23,391,363 |
18
International Growth Fund
| |
| At August 31, 2014, net assets consisted of: |
| | Amount |
| | ($000) |
| Paid-in Capital | 18,278,064 |
| Undistributed Net Investment Income | 407,022 |
| Accumulated Net Realized Losses | (314,734) |
| Unrealized Appreciation (Depreciation) | |
| Investment Securities | 5,024,431 |
| Futures Contracts | 945 |
| Forward Currency Contracts | (5,339) |
| Foreign Currencies | 974 |
| Net Assets | 23,391,363 |
| |
| |
| Investor Shares—Net Assets | |
| Applicable to 377,338,552 outstanding | |
| $.001 par value shares of beneficial | |
| interest (unlimited authorization) | 8,975,978 |
| Net Asset Value Per Share— | |
| Investor Shares | $23.79 |
| |
| |
| Admiral Shares—Net Assets | |
| Applicable to 190,417,886 outstanding | |
| $.001 par value shares of beneficial | |
| interest (unlimited authorization) | 14,415,385 |
| Net Asset Value Per Share— | |
| Admiral Shares | $75.70 |
See Note A in Notes to Financial Statements.
^ Includes partial security positions on loan to broker-dealers. The total value of securities on loan is $235,661,000.
* Non-income-producing security.
1 The fund invests a portion of its cash reserves in equity markets through the use of index futures contracts. After giving effect to futures
investments, the fund’s effective common stock and temporary cash investment positions represent 99.0% and 1.8%, respectively, of
net assets.
2 Affiliated money market fund available only to Vanguard funds and certain trusts and accounts managed by Vanguard. Rate shown is
the 7-day yield.
3 Includes $249,212,000 of collateral received for securities on loan.
4 The issuer operates under a congressional charter; its securities are generally neither guaranteed by the U.S. Treasury nor backed by
the full faith and credit of the U.S. government.
5 Securities with a value of $10,499,000 have been segregated as initial margin for open futures contracts.
6 Securities with a value of $3,119,000 have been segregated as collateral for open forward currency contracts.
ADR—American Depositary Receipt.
GDR—Global Depositary Receipt.
See accompanying Notes, which are an integral part of the Financial Statements.
19
International Growth Fund
Statement of Operations
| |
| | Year Ended |
| | August 31, 2014 |
| | ($000) |
| Investment Income | |
| Income | |
| Dividends1 | 551,496 |
| Interest2 | 737 |
| Securities Lending | 22,208 |
| Total Income | 574,441 |
| Expenses | |
| Investment Advisory Fees—Note B | |
| Basic Fee | 32,729 |
| Performance Adjustment | 6,472 |
| The Vanguard Group—Note C | |
| Management and Administrative—Investor Shares | 24,789 |
| Management and Administrative—Admiral Shares | 17,601 |
| Marketing and Distribution—Investor Shares | 1,607 |
| Marketing and Distribution—Admiral Shares | 2,186 |
| Custodian Fees | 3,951 |
| Auditing Fees | 44 |
| Shareholders’ Reports—Investor Shares | 143 |
| Shareholders’ Reports—Admiral Shares | 93 |
| Trustees’ Fees and Expenses | 46 |
| Total Expenses | 89,661 |
| Net Investment Income | 484,780 |
| Realized Net Gain (Loss) | |
| Investment Securities Sold | 1,251,268 |
| Futures Contracts | 59,885 |
| Foreign Currencies and Forward Currency Contracts | 8,615 |
| Realized Net Gain (Loss) | 1,319,768 |
| Change in Unrealized Appreciation (Depreciation) | |
| Investment Securities | 1,804,274 |
| Futures Contracts | (3,965) |
| Foreign Currencies and Forward Currency Contracts | 3,156 |
| Change in Unrealized Appreciation (Depreciation) | 1,803,465 |
| Net Increase (Decrease) in Net Assets Resulting from Operations | 3,608,013 |
1 Dividends are net of foreign withholding taxes of $21,061,000.
2 Interest income from an affiliated company of the fund was $714,000. |
|
See accompanying Notes, which are an integral part of the Financial Statements.
20
International Growth Fund
Statement of Changes in Net Assets
| | |
| | Year Ended August 31, |
| | 2014 | 2013 |
| | ($000) | ($000) |
| Increase (Decrease) in Net Assets | | |
| Operations | | |
| Net Investment Income | 484,780 | 331,611 |
| Realized Net Gain (Loss) | 1,319,768 | 718,176 |
| Change in Unrealized Appreciation (Depreciation) | 1,803,465 | 1,858,380 |
| Net Increase (Decrease) in Net Assets Resulting from Operations | 3,608,013 | 2,908,167 |
| Distributions | | |
| Net Investment Income | | |
| Investor Shares | (139,508) | (167,941) |
| Admiral Shares | (202,880) | (166,372) |
| Realized Capital Gain | | |
| Investor Shares | — | — |
| Admiral Shares | — | — |
| Total Distributions | (342,388) | (334,313) |
| Capital Share Transactions | | |
| Investor Shares | (1,529,987) | (1,400,123) |
| Admiral Shares | 2,043,639 | 1,800,455 |
| Net Increase (Decrease) from Capital Share Transactions | 513,652 | 400,332 |
| Total Increase (Decrease) | 3,779,277 | 2,974,186 |
| Net Assets | | |
| Beginning of Period | 19,612,086 | 16,637,900 |
| End of Period1 | 23,391,363 | 19,612,086 |
| 1 Net Assets—End of Period includes undistributed (overdistributed) net investment income of $407,022,000 and $239,172,000. |
See accompanying Notes, which are an integral part of the Financial Statements.
21
International Growth Fund
Financial Highlights
| | | | | |
| Investor Shares | | | | | |
| |
| For a Share Outstanding | Year Ended August 31, |
| Throughout Each Period | 2014 | 2013 | 2012 | 2011 | 2010 |
| Net Asset Value, Beginning of Period | $20.42 | $17.69 | $18.27 | $16.27 | $15.73 |
| Investment Operations | | | | | |
| Net Investment Income | . 4711 | .336 | .361 | .351 | .291 |
| Net Realized and Unrealized Gain (Loss) | | | | | |
| on Investments | 3.235 | 2.741 | (.607) | 1.954 | .535 |
| Total from Investment Operations | 3.706 | 3.077 | (.246) | 2.305 | .826 |
| Distributions | | | | | |
| Dividends from Net Investment Income | (.336) | (.347) | (. 334) | (. 305) | (. 286) |
| Distributions from Realized Capital Gains | — | — | — | — | — |
| Total Distributions | (.336) | (.347) | (. 334) | (. 305) | (. 286) |
| Net Asset Value, End of Period | $23.79 | $20.42 | $17.69 | $18.27 | $16.27 |
| |
| Total Return2 | 18.26% | 17.54% | -1.14% | 14.10% | 5.19% |
| |
| Ratios/Supplemental Data | | | | | |
| Net Assets, End of Period (Millions) | $8,976 | $9,056 | $9,115 | $10,878 | $10,493 |
| Ratio of Total Expenses to Average Net Assets3 | 0.47% | 0.48% | 0.49% | 0.47% | 0.49% |
| Ratio of Net Investment Income to | | | | | |
| Average Net Assets | 2.08%1 | 1.71% | 2.04% | 1.85% | 1.74% |
| Portfolio Turnover Rate | 21% | 31% | 30% | 43% | 44% |
1 Net investment income per share and the ratio of net investment income to average net assets include $.080 and 0.35%, respectively,resulting from income received from Vodafone Group plc in the form of cash and shares in Verizon Communications Inc. in February 2014.2 Total returns do not include transaction or account service fees that may have applied in the periods shown. Fund prospectuses provideinformation about any applicable transaction and account service fees.3 Includes performance-based investment advisory fee increases (decreases) of 0.03%, 0.03%, 0.04%, 0.03%, and 0.03%.See accompanying Notes, which are an integral part of the Financial Statements.
22
International Growth Fund
Financial Highlights
| | | | | |
| Admiral Shares | | | | | |
| |
| For a Share Outstanding | Year Ended August 31, |
| Throughout Each Period | 2014 | 2013 | 2012 | 2011 | 2010 |
| Net Asset Value, Beginning of Period | $64.98 | $56.31 | $58.17 | $51.81 | $50.08 |
| Investment Operations | | | | | |
| Net Investment Income | 1.6131 | 1.157 | 1.229 | 1.192 | 1.009 |
| Net Realized and Unrealized Gain (Loss) | | | | | |
| on Investments | 10.277 | 8.697 | (1.945) | 6.209 | 1.708 |
| Total from Investment Operations | 11.890 | 9.854 | (.716) | 7.401 | 2.717 |
| Distributions | | | | | |
| Dividends from Net Investment Income | (1.170) | (1.184) | (1.144) | (1.041) | (.987) |
| Distributions from Realized Capital Gains | — | — | — | — | — |
| Total Distributions | (1.170) | (1.184) | (1.144) | (1.041) | (.987) |
| Net Asset Value, End of Period | $75.70 | $64.98 | $56.31 | $58.17 | $51.81 |
| |
| Total Return2 | 18.42% | 17.66% | -1.01% | 14.21% | 5.36% |
| |
| Ratios/Supplemental Data | | | | | |
| Net Assets, End of Period (Millions) | $14,415 | $10,556 | $7,523 | $6,487 | $4,353 |
| Ratio of Total Expenses to Average Net Assets3 | 0.34% | 0.35% | 0.36% | 0.34% | 0.33% |
| Ratio of Net Investment Income to | | | | | |
| Average Net Assets | 2.21%1 | 1.84% | 2.17% | 1.98% | 1.90% |
| Portfolio Turnover Rate | 21% | 31% | 30% | 43% | 44% |
1 Net investment income per share and the ratio of net investment income to average net assets include $.255 and 0.35%, respectively,resulting from income received from Vodafone Group plc in the form of cash and shares in Verizon Communications Inc. in February 2014.2 Total returns do not include transaction fees that may have applied in the periods shown. Fund prospectuses provide information about anyapplicable transaction fees.3 Includes performance-based investment advisory fee increases (decreases) of 0.03%, 0.03%, 0.04%, 0.03%, and 0.03%.See accompanying Notes, which are an integral part of the Financial Statements.
23
International Growth Fund
Notes to Financial Statements
Vanguard International Growth Fund is registered under the Investment Company Act of 1940 as an open-end investment company, or mutual fund. The fund invests in securities of foreign issuers, which may subject it to investment risks not normally associated with investing in securities of U.S. corporations. The fund offers two classes of shares: Investor Shares and Admiral Shares. Investor Shares are available to any investor who meets the fund’s minimum purchase requirements. Admiral Shares are designed for investors who meet certain administrative, service, and account-size criteria.
A. The following significant accounting policies conform to generally accepted accounting principles for U.S. investment companies. The fund consistently follows such policies in preparing its financial statements.
1. Security Valuation: Securities are valued as of the close of trading on the New York Stock Exchange (generally 4 p.m., Eastern time) on the valuation date. Equity securities are valued at the latest quoted sales prices or official closing prices taken from the primary market in which each security trades; such securities not traded on the valuation date are valued at the mean of the latest quoted bid and asked prices. Securities for which market quotations are not readily available, or whose values have been affected by events occurring before the fund’s pricing time but after the close of the securities’ primary markets, are valued at their fair values calculated according to procedures adopted by the board of trustees. These procedures include obtaining quotations from an independent pricing service, monitoring news to identify significant market- or security-specific events, and evaluating changes in the values of foreign market proxies (for example, ADRs, futures contracts, or exchange-traded funds), between the time the foreign markets close and the fund’s pricing time. When fair-value pricing is employed, the prices of securities used by a fund to calculate its net asset value may differ from quoted or published prices for the same securities. Investments in Vanguard Market Liquidity Fund are valued at that fund’s net asset value. Temporary cash investments acquired over 60 days to maturity are valued using the latest bid prices or using valuations based on a matrix system (which considers such factors as security prices, yields, maturities, and ratings), both as furnished by independent pricing services. Other temporary cash investments are valued at amortized cost, which approximates market value.
2. Foreign Currency: Securities and other assets and liabilities denominated in foreign currencies are translated into U.S. dollars using exchange rates obtained from an independent third party as of the fund’s pricing time on the valuation date. Realized gains (losses) and unrealized appreciation (depreciation) on investment securities include the effects of changes in exchange rates since the securities were purchased, combined with the effects of changes in security prices. Fluctuations in the value of other assets and liabilities resulting from changes in exchange rates are recorded as unrealized foreign currency gains (losses) until the assets or liabilities are settled in cash, at which time they are recorded as realized foreign currency gains (losses).
3. Futures and Forward Currency Contracts: The fund uses index futures contracts to a limited extent, with the objective of maintaining full exposure to the stock market while maintaining liquidity. The fund may purchase or sell futures contracts to achieve a desired level of investment, whether to accommodate portfolio turnover or cash flows from capital share transactions. The primary risks associated with the use of futures contracts are imperfect correlation between changes in market values of stocks held by the fund and the prices of futures contracts, and the possibility of an illiquid market. Counterparty risk involving futures is mitigated because a regulated clearinghouse is the counterparty instead of the clearing broker. To further mitigate counterparty risk, the fund trades futures contracts on an exchange, monitors the financial strength of its clearing brokers
24
International Growth Fund
and clearinghouse, and has entered into clearing agreements with its clearing brokers. The clearinghouse imposes initial margin requirements to secure the fund’s performance and requires daily settlement of variation margin representing changes in the market value of each contract.
The fund enters into forward currency contracts to provide the appropriate currency exposure related to any open futures contracts or to protect the value of securities and related receivables and payables against changes in foreign exchange rates. The fund’s risks in using these contracts include movement in the values of the foreign currencies relative to the U.S. dollar and the ability of the counterparties to fulfill their obligations under the contracts. The fund mitigates its counterparty risk by entering into forward currency contracts only with a diverse group of prequalified counterparties, monitoring their financial strength, entering into master netting arrangements with its counterparties, and requiring its counterparties to transfer collateral as security for their performance. The master netting arrangements provide that, in the event of a counterparty’s default (including bankruptcy), the fund may terminate the forward currency contracts, determine the net amount owed by either party in accordance with its master netting arrangements, and sell or retain any collateral held up to the net amount owed to the fund under the master netting arrangements. The forward currency contracts contain provisions whereby a counterparty may terminate open contracts if the fund’s net assets decline below a certain level, triggering a payment by the fund if the fund is in a net liability position at the time of the termination. The payment amount would be reduced by any collateral the fund has pledged. Any assets pledged as collateral for open contracts are noted in the Statement of Net Assets. The value of collateral received or pledged is compared daily to the value of the forward currency contracts exposure with each counterparty, and any difference, if in excess of a specified minimum transfer amount, is adjusted and settled within two business days.
Futures contracts are valued at their quoted daily settlement prices. Forward currency contracts are valued at their quoted daily prices obtained from an independent third party, adjusted for currency risk based on the expiration date of each contract. The aggregate settlement values and notional amounts of the contracts are not recorded in the Statement of Net Assets. Fluctuations in the value of the contracts are recorded in the Statement of Net Assets as an asset (liability) and in the Statement of Operations as unrealized appreciation (depreciation) until the contracts are closed, when they are recorded as realized gains (losses) on futures or forward currency contracts.
During the year ended August 31, 2014, the fund’s average investments in long and short futures contracts represented 2% and 0% of net assets, respectively, based on the average of aggregate settlement values at each quarter-end during the period. The fund’s average investment in forward currency contracts represented 2% of net assets, based on the average of notional amounts at each quarter-end during the period.
4. Federal Income Taxes: The fund intends to continue to qualify as a regulated investment company and distribute all of its taxable income. Management has analyzed the fund’s tax positions taken for all open federal income tax years (August 31, 2011–2014), and has concluded that no provision for federal income tax is required in the fund’s financial statements.
5. Distributions: Distributions to shareholders are recorded on the ex-dividend date.
6. Securities Lending: To earn additional income, the fund lends its securities to qualified institutional borrowers. Security loans are required to be secured at all times by collateral in an amount at least equal to the market value of securities loaned. Daily market fluctuations could cause the value of loaned securities to be more or less than the value of the collateral received. When this occurs, the collateral is adjusted and settled on the next business day. The fund further mitigates its counterparty risk by entering into securities lending transactions only with a diverse group of prequalified
25
International Growth Fund
counterparties, monitoring their financial strength, and entering into master securities lending agreements with its counterparties. The master securities lending agreements provide that, in the event of a counterparty’s default (including bankruptcy), the fund may terminate any loans with that borrower, determine the net amount owed, and sell or retain the collateral up to the net amount owed to the fund; however, such actions may be subject to legal proceedings. While collateral mitigates counterparty risk, in the absence of a default the fund may experience delays and costs in recovering the securities loaned. The fund invests cash collateral received in Vanguard Market Liquidity Fund, and records a liability in the Statement of Net Assets for the return of the collateral, during the period the securities are on loan. Securities lending income represents fees charged to borrowers plus income earned on invested cash collateral, less expenses associated with the loan.
7. Credit Facility: The fund and certain other funds managed by The Vanguard Group participate in a $2.89 billion committed credit facility provided by a syndicate of lenders pursuant to a credit agreement that may be renewed annually; each fund is individually liable for its borrowings, if any, under the credit facility. Borrowings may be utilized for temporary and emergency purposes, and are subject to the fund’s regulatory and contractual borrowing restrictions. The participating funds are charged administrative fees and an annual commitment fee of 0.06% of the undrawn amount of the facility; these fees are allocated to the funds based on a method approved by the fund’s board of trustees and included in Management and Administrative expenses on the fund’s Statement of Operations. Any borrowings under this facility bear interest at a rate equal to the higher of the federal funds rate or LIBOR reference rate plus an agreed-upon spread.
The fund had no borrowings outstanding at August 31, 2014, or at any time during the period then ended.
8. Other: Dividend income is recorded on the ex-dividend date. Interest income includes income distributions received from Vanguard Market Liquidity Fund and is accrued daily. Premiums and discounts on debt securities purchased are amortized and accreted, respectively, to interest income over the lives of the respective securities. Security transactions are accounted for on the date securities are bought or sold. Costs used to determine realized gains (losses) on the sale of investment securities are those of the specific securities sold.
Each class of shares has equal rights as to assets and earnings, except that each class separately bears certain class-specific expenses related to maintenance of shareholder accounts (included in Management and Administrative expenses) and shareholder reporting. Marketing and distribution expenses are allocated to each class of shares based on a method approved by the board of trustees. Income, other non-class-specific expenses, and gains and losses on investments are allocated to each class of shares based on its relative net assets.
B. Baillie Gifford Overseas Ltd., Schroder Investment Management North America Inc., and M&G Investment Management Limited each provide investment advisory services to a portion of the fund for a fee calculated at an annual percentage rate of average net assets managed by the advisor. The basic fees of Baillie Gifford Overseas Ltd., Schroder Investment Management North America Inc., and M&G Investment Management Limited are subject to quarterly adjustments based on performance for the preceding three years relative to the MSCI All Country World Index ex USA.
The Vanguard Group manages the cash reserves of the fund on an at-cost basis.
26
International Growth Fund
For the year ended August 31, 2014, the aggregate investment advisory fee represented an effective annual basic rate of 0.15% of the fund’s average net assets, before an increase of $6,472,000 (0.03%) based on performance.
C. The Vanguard Group furnishes at cost corporate management, administrative, marketing, and distribution services. The costs of such services are allocated to the fund based on methods approved by the board of trustees. The fund has committed to provide up to 0.40% of its net assets in capital contributions to Vanguard. At August 31, 2014, the fund had contributed capital of $2,352,000 to Vanguard (included in Other Assets), representing 0.01% of the fund’s net assets and 0.94% of Vanguard’s capitalization. The fund’s trustees and officers are also directors and officers of Vanguard.
D. Various inputs may be used to determine the value of the fund’s investments. These inputs are summarized in three broad levels for financial statement purposes. The inputs or methodologies used to value securities are not necessarily an indication of the risk associated with investing in those securities.
Level 1—Quoted prices in active markets for identical securities.
Level 2—Other significant observable inputs (including quoted prices for similar securities, interest rates, prepayment speeds, credit risk, etc.).
Level 3—Significant unobservable inputs (including the fund’s own assumptions used to determine the fair value of investments).
The following table summarizes the market value of the fund’s investments as of August 31, 2014, based on the inputs used to value them:
| | | |
| | Level 1 | Level 2 | Level 3 |
| Investments | ($000) | ($000) | ($000) |
| Common Stocks—North and South America | 1,794,422 | 57,397 | — |
| Common Stocks—Other | 1,149,086 | 19,934,368 | — |
| Preferred Stocks | — | 3,224 | — |
| Temporary Cash Investments | 632,180 | 15,199 | — |
| Futures Contracts—Assets1 | 581 | — | — |
| Futures Contracts—Liabilities1 | (195) | — | — |
| Forward Currency Contracts—Assets | — | 667 | — |
| Forward Currency Contracts—Liabilities | — | (6,006) | — |
| Total | 3,576,074 | 20,004,849 | — |
| 1 Represents variation margin on the last day of the reporting period. |
Securities in certain countries may transfer between Level 1 and Level 2 due to differences in stock market closure times that may result from transitions between standard and daylight saving time in those countries and the United States. Based on values on the date of transfer, securities valued at $304,979,000 based on Level 2 inputs were transferred from Level 1 during the fiscal year. Additionally, based on values on the date of transfer, securities valued at $246,502,000 based on Level 1 inputs were transferred from Level 2 during the fiscal year.
27
International Growth Fund
E. At August 31, 2014, the fair values of derivatives were reflected in the Statement of Net Assets as follows:
| | | |
| | | Foreign | |
| | Equity | Exchange | |
| | Contracts | Contracts | Total |
| Statement of Net Assets Caption | ($000) | ($000) | ($000) |
| Other Assets | 581 | 667 | 1,248 |
| Liabilities | (195) | (6,006) | (6,201) |
Realized net gain (loss) and the change in unrealized appreciation (depreciation) on derivatives for the year ended August 31, 2014, were:
| | | |
| | | Foreign | |
| | Equity | Exchange | |
| | Contracts | Contracts | Total |
| Realized Net Gain (Loss) on Derivatives | ($000) | ($000) | ($000) |
| Futures Contracts | 59,885 | — | 59,885 |
| Forward Currency Contracts | — | 8,648 | 8,648 |
| Realized Net Gain (Loss) on Derivatives | 59,885 | 8,648 | 68,533 |
| |
| Change in Unrealized Appreciation (Depreciation) on Derivatives | | | |
| Futures Contracts | (3,965) | — | (3,965) |
| Forward Currency Contracts | — | 1,953 | 1,953 |
| Change in Unrealized Appreciation (Depreciation) on Derivatives | (3,965) | 1,953 | (2,012) |
At August 31, 2014, the aggregate settlement value of open futures contracts and the related unrealized appreciation (depreciation) were:
| | | | |
| | | | ($000) |
| | | | Aggregate | |
| | | Number of | Settlement | Unrealized |
| | | Long (Short) | Value | Appreciation |
| Futures Contracts | Expiration | Contracts | Long (Short) | (Depreciation) |
| FTSE 100 Index | September 2014 | 601 | 68,080 | 647 |
| Dow Jones EURO STOXX 50 Index | September 2014 | 1,612 | 67,194 | (1,863) |
| Topix Index | September 2014 | 414 | 50,953 | 1,183 |
| S&P ASX 200 Index | September 2014 | 219 | 28,687 | 978 |
| | | | | 945 |
Unrealized appreciation (depreciation) on open FTSE 100 Index and Dow Jones EURO STOXX 50 Index futures contracts is required to be treated as realized gain (loss) for tax purposes.
28
International Growth Fund
At August 31, 2014, the fund had open forward currency contracts to receive and deliver currencies as follows. Unrealized appreciation (depreciation) on open forward currency contracts is treated as realized gain (loss) for tax purposes.
| | | | | | |
| | | | | | | Unrealized |
| | Contract | | | | | Appreciation |
| | Settlement | Contract Amount (000) | (Depreciation) |
| Counterparty | Date | | Receive | | Deliver | ($000) |
| Bank of America NA | 9/24/14 | EUR | 47,513 | USD | 64,534 | (2,096) |
| Bank of America NA | 9/24/14 | GBP | 37,286 | USD | 63,157 | (1,268) |
| BNP Paribas | 9/17/14 | JPY | 6,068,910 | USD | 59,643 | (1,305) |
| BNP Paribas | 9/24/14 | GBP | 16,309 | USD | 27,904 | (833) |
| Bank of America NA | 9/23/14 | AUD | 28,087 | USD | 26,056 | 135 |
| UBS AG | 9/24/14 | EUR | 9,085 | USD | 12,297 | (359) |
| BNP Paribas | 9/23/14 | AUD | 9,079 | USD | 8,481 | (15) |
| BNP Paribas | 9/24/14 | EUR | 2,066 | USD | 2,810 | (95) |
| Bank of America NA | 9/17/14 | USD | 9,329 | JPY | 949,620 | 201 |
| Credit Suisse International | 9/24/14 | USD | 8,307 | GBP | 4,880 | 206 |
| Morgan Stanley Capital Services LLC | 9/24/14 | USD | 7,877 | EUR | 5,970 | 31 |
| Morgan Stanley Capital Services LLC | 9/24/14 | USD | 7,547 | GBP | 4,553 | (10) |
| UBS AG | 9/23/14 | USD | 7,095 | AUD | 7,636 | (25) |
| Morgan Stanley Capital Services LLC | 9/24/14 | USD | 6,162 | GBP | 3,656 | 93 |
| UBS AG | 9/23/14 | USD | 189 | AUD | 202 | 1 |
| | | | | | | (5,339) |
AUD—Australian dollar.
EUR—Euro.
GBP—British pound.
JPY—Japanese yen.
USD—U.S. dollar.
F. Distributions are determined on a tax basis and may differ from net investment income and realized capital gains for financial reporting purposes. Differences may be permanent or temporary. Permanent differences are reclassified among capital accounts in the financial statements to reflect their tax character. Temporary differences arise when certain items of income, expense, gain, or loss are recognized in different periods for financial statement and tax purposes. These differences will reverse at some time in the future. Differences in classification may also result from the treatment of short-term gains as ordinary income for tax purposes.
During the year ended August 31, 2014, the fund realized net foreign currency losses of $33,000, which decreased distributable net income for tax purposes; accordingly, such losses have been reclassified from accumulated net realized losses to undistributed net investment income. Certain of the fund’s investments are in securities considered to be passive foreign investment companies, for which any unrealized appreciation and/or realized gains are required to be included in distributable net income for tax purposes. During the year ended August 31, 2014, the fund realized gains on the
29
International Growth Fund
sale of passive foreign investment companies of $25,491,000, which have been included in current and prior periods’ taxable income; accordingly, such gains have been reclassified from accumulated net realized losses to undistributed net investment income.
For tax purposes, at August 31, 2014, the fund had $449,445,000 of ordinary income available for distribution. The fund used capital loss carryforwards of $1,291,495,000 to offset taxable capital gains realized during the year ended August 31, 2014. At August 31, 2014, the fund had available capital losses totaling $322,464,000 to offset future net capital gains through August 31, 2018.
At August 31, 2014, the cost of investment securities for tax purposes was $18,561,619,000. Net unrealized appreciation of investment securities for tax purposes was $5,024,257,000, consisting of unrealized gains of $5,823,843,000 on securities that had risen in value since their purchase and $799,586,000 in unrealized losses on securities that had fallen in value since their purchase.
G. During the year ended August 31, 2014, the fund purchased $5,434,113,000 of investment securities and sold $4,494,193,000 of investment securities, other than temporary cash investments.
| | | | |
| H. Capital share transactions for each class of shares were: | | | |
| | Year Ended August 31, |
| | | 2014 | | | 2013 |
| | Amount | Shares | Amount | Shares |
| | ($000) | (000) | ($000) | (000) |
| Investor Shares | | | | |
| Issued | 785,767 | 34,263 | 825,829 | 41,705 |
| Issued in Lieu of Cash Distributions | 136,274 | 6,114 | 164,255 | 8,645 |
| Redeemed | (2,452,028) | (106,599) | (2,390,207) | (122,058) |
| Net Increase (Decrease)—Investor Shares | (1,529,987) | (66,222) | (1,400,123) | (71,708) |
| Admiral Shares | | | | |
| Issued | 2,923,386 | 39,888 | 2,677,380 | 42,829 |
| Issued in Lieu of Cash Distributions | 189,998 | 2,681 | 155,794 | 2,578 |
| Redeemed | (1,069,745) | (14,599) | (1,032,719) | (16,564) |
| Net Increase (Decrease)—Admiral Shares | 2,043,639 | 27,970 | 1,800,455 | 28,843 |
I. Management has determined that no material events or transactions occurred subsequent to August 31, 2014, that would require recognition or disclosure in these financial statements.
30
Report of Independent Registered
Public Accounting Firm
To the Board of Trustees of Vanguard World Fund and the Shareholders of Vanguard International Growth Fund:
In our opinion, the accompanying statement of net assets and the related statements of operations and of changes in net assets and the financial highlights present fairly, in all material respects, the financial position of Vanguard International Growth Fund (constituting a separate portfolio of Vanguard World Fund, hereafter referred to as the “Fund”) at August 31, 2014, the results of its operations for the year then ended, the changes in its net assets for each of the two years in the period then ended, and the financial highlights for each of the five years in the period then ended, in conformity with accounting principles generally accepted in the United States of America. These financial statements and financial highlights (hereafter referred to as “financial statements”) are the responsibility of the Fund’s management. Our responsibility is to express an opinion on these financial statements based on our audits. We conducted our audits of these financial statements in accordance with the standards of the Public Company Accounting Oversight Board (United States). Those standards require that we plan and perform the audit to obtain reasonable assurance about whether the financial statements are free of material misstatement. An audit includes examining, on a test basis, evidence supporting the amounts and disclosures in the financial statements, assessing the accounting principles used and significant estimates made by management, and evaluating the overall financial statement presentation. We believe that our audits, which included confirmation of securities at August 31, 2014 by correspondence with the custodian and brokers and by agreement to the underlying ownership records of the transfer agent, provide a reasonable basis for our opinion.
/s/PricewaterhouseCoopers LLP
Philadelphia, Pennsylvania
October 10, 2014

Special 2014 tax information (unaudited) for Vanguard International Growth Fund
This information for the fiscal year ended August 31, 2014, is included pursuant to provisions of the Internal Revenue Code.
The fund distributed $302,157,000 of qualified dividend income to shareholders during the fiscal year.
The fund designates to shareholders foreign source income of $429,921,000 and foreign taxes paid of $20,743,000. Shareholders will receive more detailed information with their Form 1099-DIV in January 2015 to determine the calendar-year amounts to be included on their 2014 tax returns.
31
Your Fund’s After-Tax Returns
This table presents returns for your fund both before and after taxes. The after-tax returns are shown in two ways: (1) assuming that an investor owned the fund during the entire period and paid taxes on the fund’s distributions, and (2) assuming that an investor paid taxes on the fund’s distributions and sold all shares at the end of each period.
Calculations are based on the highest individual federal income tax and capital gains tax rates in effect at the times of the distributions and the hypothetical sales. State and local taxes were not considered. After-tax returns reflect any qualified dividend income, using actual prior-year figures and estimates for 2014. (In the example, returns after the sale of fund shares may be higher than those assuming no sale. This occurs when the sale would have produced a capital loss. The calculation assumes that the investor received a tax deduction for the loss.)
The table shows returns for Investor Shares only; returns for other share classes will differ. Please note that your actual after-tax returns will depend on your tax situation and may differ from those shown. Also note that if you own the fund in a tax-deferred account, such as an individual retirement account or a 401(k) plan, this information does not apply to you. Such accounts are not subject to current taxes.
Finally, keep in mind that a fund’s performance—whether before or after taxes—does not guarantee future results.
Average Annual Total Returns: International Growth Fund Investor Shares
Periods Ended August 31, 2014
| | | |
| | One | Five | Ten |
| | Year | Years | Years |
| Returns Before Taxes | 18.26% | 10.52% | 8.74% |
| Returns After Taxes on Distributions | 17.86 | 10.22 | 7.87 |
| Returns After Taxes on Distributions and Sale of Fund Shares | 10.66 | 8.42 | 7.14 |
32
About Your Fund’s Expenses
As a shareholder of the fund, you incur ongoing costs, which include costs for portfolio management, administrative services, and shareholder reports (like this one), among others. Operating expenses, which are deducted from a fund’s gross income, directly reduce the investment return of the fund.
A fund’s expenses are expressed as a percentage of its average net assets. This figure is known as the expense ratio. The following examples are intended to help you understand the ongoing costs (in dollars) of investing in your fund and to compare these costs with those of other mutual funds. The examples are based on an investment of $1,000 made at the beginning of the period shown and held for the entire period.
The accompanying table illustrates your fund’s costs in two ways:
• Based on actual fund return. This section helps you to estimate the actual expenses that you paid over the period. The ”Ending Account Value“ shown is derived from the fund‘s actual return, and the third column shows the dollar amount that would have been paid by an investor who started with $1,000 in the fund. You may use the information here, together with the amount you invested, to estimate the expenses that you paid over the period.
To do so, simply divide your account value by $1,000 (for example, an $8,600 account value divided by $1,000 = 8.6), then multiply the result by the number given for your fund under the heading ”Expenses Paid During Period.“
• Based on hypothetical 5% yearly return. This section is intended to help you compare your fund‘s costs with those of other mutual funds. It assumes that the fund had a yearly return of 5% before expenses, but that the expense ratio is unchanged. In this case—because the return used is not the fund’s actual return—the results do not apply to your investment. The example is useful in making comparisons because the Securities and Exchange Commission requires all mutual funds to calculate expenses based on a 5% return. You can assess your fund’s costs by comparing this hypothetical example with the hypothetical examples that appear in shareholder reports of other funds.
Note that the expenses shown in the table are meant to highlight and help you compare ongoing costs only and do not reflect transaction costs incurred by the fund for buying and selling securities. Further, the expenses do not include any purchase, redemption, or account service fees described in the fund prospectus. If such fees were applied to your account, your costs would be higher. Your fund does not carry a “sales load.”
The calculations assume no shares were bought or sold during the period. Your actual costs may have been higher or lower, depending on the amount of your investment and the timing of any purchases or redemptions.
You can find more information about the fund’s expenses, including annual expense ratios, in the Financial Statements section of this report. For additional information on operating expenses and other shareholder costs, please refer to your fund’s current prospectus.
33
| | | |
| Six Months Ended August 31, 2014 | | | |
| | Beginning | Ending | Expenses |
| | Account Value | Account Value | Paid During |
| International Growth Fund | 2/28/2014 | 8/31/2014 | Period |
| Based on Actual Fund Return | | | |
| Investor Shares | $1,000.00 | $1,025.43 | $2.40 |
| Admiral Shares | 1,000.00 | 1,025.75 | 1.74 |
| Based on Hypothetical 5% Yearly Return | | | |
| Investor Shares | $1,000.00 | $1,022.84 | $2.40 |
| Admiral Shares | 1,000.00 | 1,023.49 | 1.73 |
The calculations are based on expenses incurred in the most recent six-month period. The fund’s annualized six-month expense ratios for thatperiod are 0.47% for Investor Shares and 0.34% for Admiral Shares. The dollar amounts shown as “Expenses Paid” are equal to theannualized expense ratio multiplied by the average account value over the period, multiplied by the number of days in the most recentsix-month period, then divided by the number of days in the most recent 12-month period.34
Glossary
Beta. A measure of the magnitude of a fund’s past share-price fluctuations in relation to the ups and downs of a given market index. The index is assigned a beta of 1.00. Compared with a given index, a fund with a beta of 1.20 typically would have seen its share price rise or fall by 12% when the index rose or fell by 10%. For this report, beta is based on returns over the past 36 months for both the fund and the index. Note that a fund’s beta should be reviewed in conjunction with its R-squared (see definition). The lower the R-squared, the less correlation there is between the fund and the index, and the less reliable beta is as an indicator of volatility.
Dividend Yield. Dividend income earned by stocks, expressed as a percentage of the aggregate market value (or of net asset value, for a fund). The yield is determined by dividing the amount of the annual dividends by the aggregate value (or net asset value) at the end of the period. For a fund, the dividend yield is based solely on stock holdings and does not include any income produced by other investments.
Earnings Growth Rate. The average annual rate of growth in earnings over the past five years for the stocks now in a fund.
Equity Exposure. A measure that reflects a fund’s investments in stocks and stock futures. Any holdings in short-term reserves are excluded.
Expense Ratio. A fund’s total annual operating expenses expressed as a percentage of the fund’s average net assets. The expense ratio includes management and administrative expenses, but does not include the transaction costs of buying and selling portfolio securities.
Inception Date. The date on which the assets of a fund (or one of its share classes) are first invested in accordance with the fund’s investment objective. For funds with a subscription period, the inception date is the day after that period ends. Investment performance is measured from the inception date.
Median Market Cap. An indicator of the size of companies in which a fund invests; the midpoint of market capitalization (market price x shares outstanding) of a fund’s stocks, weighted by the proportion of the fund’s assets invested in each stock. Stocks representing half of the fund’s assets have market capitalizations above the median, and the rest are below it.
Price/Book Ratio. The share price of a stock divided by its net worth, or book value, per share. For a fund, the weighted average price/book ratio of the stocks it holds.
Price/Earnings Ratio. The ratio of a stock’s current price to its per-share earnings over the past year. For a fund, the weighted average P/E of the stocks it holds. P/E is an indicator of market expectations about corporate prospects; the higher the P/E, the greater the expectations for a company’s future growth.
R-Squared. A measure of how much of a fund’s past returns can be explained by the returns from the market in general, as measured by a given index. If a fund’s total returns were precisely synchronized with an index’s returns, its R-squared would be 1.00. If the fund’s returns bore no relationship to the index’s returns, its R-squared would be 0. For this report, R-squared is based on returns over the past 36 months for both the fund and the index.
35
Return on Equity. The annual average rate of return generated by a company during the past five years for each dollar of shareholder’s equity (net income divided by shareholder’s equity). For a fund, the weighted average return on equity for the companies whose stocks it holds.
Short-Term Reserves. The percentage of a fund invested in highly liquid, short-term securities that can be readily converted to cash.
Turnover Rate. An indication of the fund’s trading activity. Funds with high turnover rates incur higher transaction costs and may be more likely to distribute capital gains (which may be taxable to investors). The turnover rate excludes in-kind transactions, which have minimal impact on costs.
Benchmark Information
Spliced International Index: MSCI EAFE Index through May 31, 2010; MSCI All Country World Index ex USA thereafter.
36
This page intentionally left blank.
This page intentionally left blank.
This page intentionally left blank.
The People Who Govern Your Fund
The trustees of your mutual fund are there to see that the fund is operated and managed in your best interests since, as a shareholder, you are a part owner of the fund. Your fund’s trustees also serve on the board of directors of The Vanguard Group, Inc., which is owned by the Vanguard funds and provides services to them on an at-cost basis.
A majority of Vanguard’s board members are independent, meaning that they have no affiliation with Vanguard or the funds they oversee, apart from the sizable personal investments they have made as private individuals. The independent board members have distinguished backgrounds in business, academia, and public service. Each of the trustees and executive officers oversees 177 Vanguard funds.
The following table provides information for each trustee and executive officer of the fund. More information about the trustees is in the Statement of Additional Information, which can be obtained, without charge, by contacting Vanguard at 800-662-7447, or online at vanguard.com.
| |
| InterestedTrustee1 | and Delphi Automotive LLP (automotive components); |
| | Senior Advisor at New Mountain Capital. |
| F. William McNabb III | |
| Born 1957. Trustee Since July 2009. Chairman of the | Amy Gutmann |
| Board. Principal Occupation(s) During the Past Five | Born 1949. Trustee Since June 2006. Principal |
| Years: Chairman of the Board of The Vanguard Group, | Occupation(s) During the Past Five Years: President of |
| Inc., and of each of the investment companies served | the University of Pennsylvania; Christopher H. Browne |
| by The Vanguard Group, since January 2010; Director | Distinguished Professor of Political Science, School of |
| of The Vanguard Group since 2008; Chief Executive | Arts and Sciences, and Professor of Communication, |
| Officer and President of The Vanguard Group, and of | Annenberg School for Communication, with secondary |
| each of the investment companies served by The | faculty appointments in the Department of Philosophy, |
| Vanguard Group, since 2008; Director of Vanguard | School of Arts and Sciences, and at the Graduate |
| Marketing Corporation; Managing Director of The | School of Education, University of Pennsylvania; |
| Vanguard Group (1995–2008). | Trustee of the National Constitution Center; Chair |
| | of the Presidential Commission for the Study of |
| | Bioethical Issues. |
| IndependentTrustees | |
| | JoAnn Heffernan Heisen |
| Emerson U. Fullwood | Born 1950. Trustee Since July 1998. Principal |
| Born 1948. Trustee Since January 2008. Principal | Occupation(s) During the Past Five Years: Corporate |
| Occupation(s) During the Past Five Years: Executive | Vice President and Chief Global Diversity Officer |
| Chief Staff and Marketing Officer for North America | (retired 2008) and Member of the Executive |
| and Corporate Vice President (retired 2008) of Xerox | Committee (1997–2008) of Johnson & Johnson |
| Corporation (document management products and | (pharmaceuticals/medical devices/consumer |
| services); Executive in Residence and 2009–2010 | products); Director of Skytop Lodge Corporation |
| Distinguished Minett Professor at the Rochester | (hotels), the University Medical Center at Princeton, |
| Institute of Technology; Director of SPX Corporation | the Robert Wood Johnson Foundation, and the Center |
| (multi-industry manufacturing), the United Way of | for Talent Innovation; Member of the Advisory Board |
| Rochester, Amerigroup Corporation (managed health | of the Maxwell School of Citizenship and Public Affairs |
| care), the University of Rochester Medical Center, | at Syracuse University. |
| Monroe Community College Foundation, and North | |
| Carolina A&T University. | F. Joseph Loughrey |
| | Born 1949. Trustee Since October 2009. Principal |
| Rajiv L. Gupta | Occupation(s) During the Past Five Years: President |
| Born 1945. Trustee Since December 2001.2 | and Chief Operating Officer (retired 2009) of Cummins |
| Principal Occupation(s) During the Past Five Years: | Inc. (industrial machinery); Chairman of the Board |
| Chairman and Chief Executive Officer (retired 2009) | of Hillenbrand, Inc. (specialized consumer services), |
| and President (2006–2008) of Rohm and Haas Co. | and of Oxfam America; Director of SKF AB (industrial |
| (chemicals); Director of Tyco International, Ltd. | machinery), Hyster-Yale Materials Handling, Inc. |
| (diversified manufacturing and services), Hewlett- | (forklift trucks), the Lumina Foundation for Education, |
| Packard Co. (electronic computer manufacturing), | |
| | |
| and the V Foundation for Cancer Research; Member | Executive Officers | |
| of the Advisory Council for the College of Arts and | | |
| Letters and of the Advisory Board to the Kellogg | Glenn Booraem | |
| Institute for International Studies, both at the | Born 1967. Controller Since July 2010. Principal |
| University of Notre Dame. | Occupation(s) During the Past Five Years: Principal |
| | of The Vanguard Group, Inc.; Controller of each of |
| Mark Loughridge | the investment companies served by The Vanguard |
| Born 1953. Trustee Since March 2012. Principal | Group; Assistant Controller of each of the investment |
| Occupation(s) During the Past Five Years: Senior Vice | companies served by The Vanguard Group (2001–2010). |
| President and Chief Financial Officer (retired 2013) | | |
| at IBM (information technology services); Fiduciary | Thomas J. Higgins | |
| Member of IBM’s Retirement Plan Committee (2004– | Born 1957. Chief Financial Officer Since September |
| 2013); Member of the Council on Chicago Booth. | 2008. Principal Occupation(s) During the Past Five |
| | Years: Principal of The Vanguard Group, Inc.; Chief |
| Scott C. Malpass | Financial Officer of each of the investment companies |
| Born 1962. Trustee Since March 2012. Principal | served by The Vanguard Group; Treasurer of each of |
| Occupation(s) During the Past Five Years: Chief | the investment companies served by The Vanguard |
| Investment Officer and Vice President at the University | Group (1998–2008). | |
| of Notre Dame; Assistant Professor of Finance at the | | |
| Mendoza College of Business at Notre Dame; Member | Kathryn J. Hyatt | |
| of the Notre Dame 403(b) Investment Committee; | Born 1955. Treasurer Since November 2008. Principal |
| Board Member of TIFF Advisory Services, Inc. | Occupation(s) During the Past Five Years: Principal of |
| (investment advisor); Member of the Investment | The Vanguard Group, Inc.; Treasurer of each of the |
| Advisory Committees of the Financial Industry | investment companies served by The Vanguard |
| Regulatory Authority (FINRA) and of Major League | Group; Assistant Treasurer of each of the investment |
| Baseball. | companies served by The Vanguard Group (1988–2008). |
| |
| André F. Perold | Heidi Stam | |
| Born 1952. Trustee Since December 2004. Principal | Born 1956. Secretary Since July 2005. Principal |
| Occupation(s) During the Past Five Years: George | Occupation(s) During the Past Five Years: Managing |
| Gund Professor of Finance and Banking, Emeritus | Director of The Vanguard Group, Inc.; General Counsel |
| at the Harvard Business School (retired 2011); | of The Vanguard Group; Secretary of The Vanguard |
| Chief Investment Officer and Managing Partner of | Group and of each of the investment companies |
| HighVista Strategies LLC (private investment firm); | served by The Vanguard Group; Director and Senior |
| Director of Rand Merchant Bank; Overseer of the | Vice President of Vanguard Marketing Corporation. |
| Museum of Fine Arts Boston. | | |
| | Vanguard Senior ManagementTeam |
| Alfred M. Rankin, Jr. | | |
| Born 1941. Trustee Since January 1993. Principal | Mortimer J. Buckley | Chris D. McIsaac |
| Occupation(s) During the Past Five Years: Chairman, | Kathleen C. Gubanich | Michael S. Miller |
| President, and Chief Executive Officer of NACCO | Paul A. Heller | James M. Norris |
| Industries, Inc. (housewares/lignite), and of Hyster- | Martha G. King | Glenn W. Reed |
| Yale Materials Handling, Inc. (forklift trucks); Chairman | John T. Marcante | |
| of the Board of University Hospitals of Cleveland. | | |
| |
| Peter F. Volanakis | Chairman Emeritus and Senior Advisor |
| Born 1955. Trustee Since July 2009. Principal | | |
| Occupation(s) During the Past Five Years: President | John J. Brennan | |
| and Chief Operating Officer (retired 2010) of Corning | Chairman, 1996–2009 | |
| Incorporated (communications equipment); Trustee of | Chief Executive Officer and President, 1996–2008 |
| Colby-Sawyer College; Member of the Advisory Board | | |
| of the Norris Cotton Cancer Center and of the Advisory | Founder | |
| Board of the Parthenon Group (strategy consulting). | | |
| | John C. Bogle | |
| | Chairman and Chief Executive Officer, 1974–1996 |
1 Mr. McNabb is considered an “interested person,” as defined in the Investment Company Act of 1940, because he is an officer of the
Vanguard funds.
2 December 2002 for Vanguard Equity Income Fund, the Vanguard Municipal Bond Funds, and the Vanguard State Tax-Exempt Funds.
| 
|
| | P.O. Box 2600 |
| | Valley Forge, PA 19482-2600 |
| |
| |
| |
| Connect with Vanguard® > vanguard.com | |
| |
| |
| |
Fund Information > 800-662-7447 | CFA® is a trademark owned by CFA Institute. |
Direct Investor Account Services > 800-662-2739 | |
Institutional Investor Services > 800-523-1036 | |
Text Telephone for People | |
With Hearing Impairment > 800-749-7273 | |
| |
This material may be used in conjunction | |
with the offering of shares of any Vanguard | |
fund only if preceded or accompanied by | |
the fund’s current prospectus. | |
| |
All comparative mutual fund data are from Lipper, a | |
Thomson Reuters Company, or Morningstar, Inc., unless | |
otherwise noted. | |
| |
You can obtain a free copy of Vanguard’s proxy voting | |
guidelines by visiting vanguard.com/proxyreporting or by | |
calling Vanguard at 800-662-2739. The guidelines are | |
also available from the SEC’s website, sec.gov. In | |
addition, you may obtain a free report on how your fund | |
voted the proxies for securities it owned during the 12 | |
months ended June 30. To get the report, visit either | |
vanguard.com/proxyreporting or sec.gov. | |
| |
You can review and copy information about your fund at | |
the SEC’s Public Reference Room in Washington, D.C. To | |
find out more about this public service, call the SEC at | |
202-551-8090. Information about your fund is also | |
available on the SEC’s website, and you can receive | |
copies of this information, for a fee, by sending a | |
request in either of two ways: via e-mail addressed to | |
publicinfo@sec.gov or via regular mail addressed to the | |
Public Reference Section, Securities and Exchange | |
Commission, Washington, DC 20549-1520. | |
| |
| | © 2014 The Vanguard Group, Inc. |
| | All rights reserved. |
| | Vanguard Marketing Corporation, Distributor. |
| |
| | Q810 102014 |
Annual Report | August 31, 2014
Vanguard FTSE Social Index Fund
The mission continues
On May 1, 1975, Vanguard began operations, a fledgling company based on the simple but revolutionary idea that a mutual fund company should be managed solely in the interest of its investors.
Four decades later, that revolutionary spirit continues to animate the enterprise. Vanguard remains on a mission to give investors the best chance of investment success.
As we mark our 40th anniversary, we thank you for entrusting your assets to Vanguard and giving us the opportunity to help you reach your financial goals in the decades to come.
| |
| Contents | |
| Your Fund’s Total Returns. | 1 |
| Chairman’s Letter. | 2 |
| Fund Profile. | 8 |
| Performance Summary. | 9 |
| Financial Statements. | 11 |
| Your Fund’s After-Tax Returns. | 24 |
| About Your Fund’s Expenses. | 25 |
| Trustees Approve Advisory Arrangement. | 27 |
| Glossary. | 28 |
Please note: The opinions expressed in this report are just that—informed opinions. They should not be considered promises or advice.
Also, please keep in mind that the information and opinions cover the period through the date on the front of this report. Of course, the
risks of investing in your fund are spelled out in the prospectus.
See the Glossary for definitions of investment terms used in this report.
About the cover: Since our founding, Vanguard has drawn inspiration from the enterprise and valor demonstrated by British
naval hero Horatio Nelson and his command at the Battle of the Nile in 1798. The photograph displays a replica of a merchant
ship from the same era as Nelson’s flagship, the HMS Vanguard.
Your Fund’s Total Returns
| |
| Fiscal Year Ended August 31, 2014 | |
| | Total |
| | Returns |
| Vanguard FTSE Social Index Fund | |
| Investor Shares | 25.58% |
| Institutional Shares | 25.68 |
| FTSE4Good US Select Index | 25.86 |
| Large-Cap Growth Funds Average | 25.10 |
Large-Cap Growth Funds Average: Derived from data provided by Lipper, a Thomson Reuters Company.Institutional Shares are available to certain institutional investors who meet specific administrative, service, and account-size criteria.Your Fund’s Performance at a Glance
August 31, 2013, Through August 31, 2014
| | | | |
| | | | Distributions Per Share |
| | Starting | Ending | | |
| | Share | Share | Income | Capital |
| | Price | Price | Dividends | Gains |
| Vanguard FTSE Social Index Fund | | | | |
| Investor Shares | $10.28 | $12.74 | $0.149 | $0.000 |
| Institutional Shares | 10.29 | 12.75 | 0.160 | 0.000 |
1

Chairman’s Letter
Dear Shareholder,
Vanguard FTSE Social Index Fund’s socially conscious mandate means its returns sometimes part ways with those of the broad market. The fund seeks to track a benchmark index of companies screened for certain social, human rights, and environmental criteria. The fund’s impressive return over the fiscal year reflected the overall market’s strong rise.
For the 12 months ended August 31, 2014, the fund returned nearly 26%. It achieved its objective of closely tracking its benchmark, the FTSE4Good US Select Index. The fund slightly eclipsed the average return of its large-capitalization growth fund peers and the return of the broad U.S. market.
If you hold shares of the fund in a taxable account, you may wish to review the information on the fund’s after-tax returns that appears later in this report.
Stocks cleared hurdles en route to new highs
Despite an assortment of challenges, the broad U.S. stock market recorded an impressive return of about 25% for the year ended August 31. U.S. stocks registered positive results in ten of those 12 months, and a July swoon was followed by an August flurry of record highs.
2
Investors applauded mostly solid corporate earnings, generally upbeat economic news, and the Federal Reserve’s continued accommodative policies. Still, turmoil in the Middle East and Ukraine, economic worries in Europe and China, and uncertainty about the Fed’s next moves pressured the market at times.
International stocks returned about 18%. Emerging markets, after sliding earlier in the period, rebounded to lead the way. The developed markets of the Pacific region and Europe trailed but still notched double-digit returns.
Defying analysts’ expectations, bond prices rose over the year
The broad U.S. taxable bond market returned 5.66%, rallying from its decline a year ago when investors fretted over the future of the Fed’s bond-buying program.
The Fed began reducing its purchases in January and has consistently cut them further since, with the goal of ending the program in October. Interest rates have not risen as many expected however. The yield of the 10-year U.S. Treasury note ended August at 2.34%, down from 2.76% a year earlier. (Bond prices and yields move in opposite directions.)
| | | |
| Market Barometer | | | |
| |
| | | Average Annual Total Returns |
| | Periods Ended August 31, 2014 |
| | One | Three | Five |
| | Year | Years | Years |
| Stocks | | | |
| Russell 1000 Index (Large-caps) | 25.36% | 20.80% | 17.24% |
| Russell 2000 Index (Small-caps) | 17.68 | 19.00 | 17.03 |
| Russell 3000 Index (Broad U.S. market) | 24.74 | 20.65 | 17.22 |
| FTSE All-World ex US Index (International) | 18.04 | 9.48 | 8.44 |
| |
| Bonds | | | |
| Barclays U.S. Aggregate Bond Index (Broad taxable market) | 5.66% | 2.91% | 4.48% |
| Barclays Municipal Bond Index (Broad tax-exempt market) | 10.14 | 4.88 | 5.39 |
| Citigroup Three-Month U.S. Treasury Bill Index | 0.04 | 0.04 | 0.07 |
| |
| CPI | | | |
| Consumer Price Index | 1.70% | 1.64% | 1.96% |
3
Municipal bonds returned 10.14% as investors searched for tax-exempt income amid a limited supply of new issues. International bond markets (as measured by the Barclays Global Aggregate Index ex USD) returned 6.52%.
Following such a strong advance, it’s worth remembering that the current low yields imply lower future returns: As yields drop, the scope for further declines—and increases in prices—diminishes.
The Fed’s target of 0%–0.25% for short-term interest rates continued to restrict returns for money market funds and savings accounts.
Health care, financials, and tech fueled the fund’s performance
Vanguard launched the FTSE Social Index Fund 14 years ago in recognition that some shareholders’ investment choices incorporate their social and personal beliefs. Its benchmark, the FTSE4Good US Select Index, avoids companies with controversies or violations related to the environment, labor standards, or health and safety, and excludes companies that are involved with tobacco, alcohol, adult entertainment, weapons, gambling, or nuclear power.
The screening process causes the index to have smaller allocations to sectors such as industrials, oil and gas, basic materials, and utilities, and greater exposure to financials and health care than the broad market.
Expense Ratios
Your Fund Compared With Its Peer Group
| | | |
| | Investor | Institutional | Peer Group |
| | Shares | Shares | Average |
| FTSE Social Index Fund | 0.28% | 0.16% | 1.22% |
The fund expense ratios shown are from the prospectus dated December 23, 2013, and represent estimated costs for the current fiscal year.For the fiscal year ended August 31, 2014, the fund’s expense ratios were 0.27% for Investor Shares and 0.16% for Institutional Shares. Thepeer-group expense ratio is derived from data provided by Lipper, a Thomson Reuters Company, and captures information through year-end2013.Peer group: Large-Cap Growth Funds.4
Although this socially conscious approach may generate returns that depart from the broad market, that wasn’t the case during the fiscal year. Index backbones health care, financials, and technology were the fund’s three largest sectors on average and also its strongest contributors, responsible for more than 17 percentage points of its return.
Health care companies boosted results as investors anticipated increased spending to coincide with the aging population and the expanded number of insured under the Affordable Care Act. Significant returns came from pharmaceuticals and biotechnology, where mergers and acquisitions, new drug development, and overseas opportunities combined with larger positive industry trends. Health care services and medical equipment firms also stood out.
The financial sector, the index’s largest at more than 27% of holdings on average over the period, was another major source of strength. Low interest rates and favorable capital markets have helped heal the scars of the 2008–2009 financial crisis. Banks, consumer finance and credit services firms, insurers, investment banks and brokerages, and real estate companies all received support from the economic recovery and healthy investment environment.
| |
| Total Returns | |
| Ten Years Ended August 31, 2014 | |
| | Average |
| | Annual Return |
| FTSE Social Index Fund Investor Shares | 7.07% |
| Spliced Social Index | 7.29 |
| Large-Cap Growth Funds Average | 8.01 |
For a benchmark description, see the Glossary.Large-Cap Growth Funds Average: Derived from data provided by Lipper, a Thomson Reuters Company.The figures shown represent past performance, which is not a guarantee of future results. (Current performance may be
lower or higher than the performance data cited. For performance data current to the most recent month-end, visit our
website at vanguard.com/performance.) Note, too, that both investment returns and principal value can fluctuate widely, so
an investor’s shares, when sold, could be worth more or less than their original cost.5
Technology companies occupied a less prominent position in the index and the fund, but the sector was the third-largest and most robust-performing, with a return of about 40%. Technology products and services continue to extend their global reach as they become more accessible and affordable. At the higher end of the market, consumers and corporations expanded their budgets and updated and replaced their equipment. Internet, software, hardware, semiconductor, electronics, and telecommunication firms excelled.
All ten index sectors delivered double-digit returns, and nine finished with results over 20%. The lightly held industrial, oil and gas, basic materials, and utilities sectors recorded returns of about 24%, to 27%, but their relative absence was offset by results in other areas.
The fund has tightly tracked its index over the long term
Vanguard FTSE Social Index Fund has successfully tracked its benchmark over the long term. For the decade ended August 31, 2014, the fund’s Investor Shares posted an average annual return of 7.07%, compared with the 7.29% return of the Spliced Social Index. This difference is consistent with the costs of managing a real-world portfolio.
The fund has, however, lagged the 8.01% average annual return of its large-cap growth peers and the 8.83% return of the broad U.S. market as represented by the Russell 3000 Index. The fund’s mandate and allocation divergences produced by the benchmark’s social criteria screening explain this shortfall. In other periods, of course, these sector biases may prove an advantage.
Vanguard Equity Investment Group, the fund’s advisor, is responsible for the tracking success. The knowledge and skill of the team, whose sophisticated portfolio management techniques reflect more than 30 years of indexing experience, have kept the fund on point. Its efforts have been aided by the fund’s low expenses, which let you pocket more of the returns.
High costs don’t equal strong fund performance
The old adage “you get what you pay for” simply doesn’t apply to mutual funds. In fact, the reverse is true: Research suggests that higher costs are consistent with weaker returns. (See, for example, Shopping for Alpha: You Get What You Don’t Pay For at vanguard.com/research.)
Shouldn’t paying the highest fees allow you to purchase the services of the greatest talents and therefore get you the best returns? As it turns out, the data don’t really support that argument. The explanation is simple: Every dollar paid for management fees is a dollar less earning potential return. Keeping expenses down can help narrow the gap between what the markets return and what investors actually earn.
6
That’s why Vanguard seeks to minimize costs on all our funds. Indexing, of course, is the purest expression of low-cost investing. In our actively managed funds, which are run by some of the most prominent advisory firms in the investment industry, we work to keep fees low. It’s a strategy that reflects decades of experience and research, boiled down to one tenet: The less you pay, the more you keep.
As always, thank you for entrusting your assets to Vanguard.
Sincerely,

F. William McNabb III
Chairman and Chief Executive Officer
September 11, 2014
7
FTSE Social Index Fund
Fund Profile
As of August 31, 2014
| | |
| Share-Class Characteristics | |
| | Investor | Institutional |
| | Shares | Shares |
| Ticker Symbol | VFTSX | VFTNX |
| Expense Ratio1 | 0.28% | 0.16% |
| 30-Day SEC Yield | 1.53% | 1.64% |
| | | |
| Portfolio Characteristics | | |
| | | | DJ |
| | | | U.S. |
| | | FTSE | Total |
| | | 4Good | Market |
| | | US Select | FA |
| | Fund | Index | Index |
| Number of Stocks | 375 | 376 | 3,709 |
| Median Market Cap | $55.8B | $55.8B | $48.0B |
| Price/Earnings Ratio | 20.5x | 20.5x | 20.7x |
| Price/Book Ratio | 2.5x | 2.5x | 2.7x |
| Return on Equity | 17.0% | 17.0% | 17.8% |
| Earnings Growth | | | |
| Rate | 16.8% | 16.8% | 15.3% |
| Dividend Yield | 1.8% | 1.8% | 1.8% |
| Foreign Holdings | 0.0% | 0.0% | 0.0% |
| Turnover Rate | 14% | — | — |
| Short-Term Reserves | 0.2% | — | — |
| | | |
| Sector Diversification (% of equity exposure) |
| | | | DJ |
| | | | U.S. |
| | | FTSE | Total |
| | | 4Good | Market |
| | | US Select | FA |
| | Fund | Index | Index |
| Basic Materials | 1.9% | 1.9% | 3.1% |
| Consumer Goods | 11.8 | 11.9 | 9.8 |
| Consumer Services | 10.3 | 10.3 | 13.3 |
| Financials | 27.0 | 26.9 | 18.3 |
| Health Care | 21.4 | 21.4 | 12.5 |
| Industrials | 6.5 | 6.5 | 12.6 |
| Oil & Gas | 4.2 | 4.2 | 9.5 |
| Technology | 15.2 | 15.2 | 15.5 |
| Telecommunications | 0.2 | 0.2 | 2.2 |
| Utilities | 1.5 | 1.5 | 3.2 |
| | |
| Volatility Measures | | |
| | FTSE | DJ |
| | 4Good | U.S. Total |
| | US Select | Market |
| | Index | FA Index |
| R-Squared | 1.00 | 0.97 |
| Beta | 1.00 | 0.98 |
These measures show the degree and timing of the fund’s fluctuations compared with the indexes over 36 months.
| | |
| Ten Largest Holdings (% of total net assets) |
| Google Inc. | Internet | 3.3% |
| Johnson & Johnson | Pharmaceuticals | 2.8 |
| Wells Fargo & Co. | Banks | 2.7 |
| Procter & Gamble Co. | Nondurable | |
| | Household Products | 2.3 |
| JPMorgan Chase & Co. | Banks | 2.2 |
| Pfizer Inc. | Pharmaceuticals | 1.9 |
| Intel Corp. | Semiconductors | 1.7 |
| Merck & Co. Inc. | Pharmaceuticals | 1.7 |
| Bank of America Corp. | Banks | 1.7 |
| Citigroup Inc. | Banks | 1.6 |
| Top Ten | | 21.9% |
| The holdings listed exclude any temporary cash investments and equity index products. |
|
Investment Focus
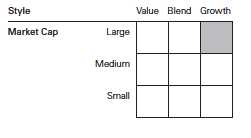
1 The expense ratios shown are from the prospectus dated December 23, 2013, and represent estimated costs for the current fiscal year. For the
fiscal year ended August 31, 2014, the expense ratios were 0.27% for Investor Shares and 0.16% for Institutional Shares.
8
FTSE Social Index Fund
Performance Summary
All of the returns in this report represent past performance, which is not a guarantee of future results that may be achieved by the fund. (Current performance may be lower or higher than the performance data cited. For performance data current to the most recent month-end, visit our website at vanguard.com/performance.) Note, too, that both investment returns and principal value can fluctuate widely, so an investor’s shares, when sold, could be worth more or less than their original cost. The returns shown do not reflect taxes that a shareholder would pay on fund distributions or on the sale of fund shares.
Cumulative Performance: August 31, 2004, Through August 31, 2014
Initial Investment of $10,000
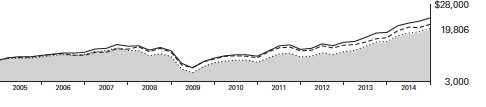
| | | | | |
| | | Average Annual Total Returns | |
| | | Periods Ended August 31, 2014 | |
| | | | | | Final Value |
| | | One | Five | Ten | of a $10,000 |
| | | Year | Years | Years | Investment |
| | FTSE Social Index Fund*Investor | | | | |
| | Shares | 25.58% | 16.89% | 7.07% | $19,806 |
| •••••••• | Spliced Social Index | 25.86 | 17.19 | 7.29 | 20,220 |
| – – – – | Large-Cap Growth Funds Average | 25.10 | 15.80 | 8.01 | 21,606 |
| | Dow Jones U.S. Total Stock Market | | | | |
| | Float Adjusted Index | 24.68 | 17.29 | 9.00 | 23,678 |
For a benchmark description, see the Glossary.
Large-Cap Growth Funds Average: Derived from data provided by Lipper, a Thomson Reuters Company. |
|
| | | | |
| | | | | Final Value |
| | One | Five | Ten | of a $5,000,000 |
| | Year | Years | Years | Investment |
| |
| FTSE Social Index Fund Institutional Shares | 25.68% | 17.05% | 7.21% | $10,026,353 |
| |
| Spliced Social Index | 25.86 | 17.19 | 7.29 | 10,109,759 |
| Dow Jones U.S. Total Stock Market Float | | | | |
| Adjusted Index | 24.68 | 17.29 | 9.00 | 11,839,057 |
See Financial Highlights for dividend and capital gains information.
9
FTSE Social Index Fund
Fiscal-Year Total Returns (%): August 31, 2004, Through August 31, 2014
For a benchmark description, see the Glossary.
Average Annual Total Returns: Periods Ended June 30, 2014
This table presents returns through the latest calendar quarter—rather than through the end of the fiscal period.
Securities and Exchange Commission rules require that we provide this information.
| | | | |
| | Inception | One | Five | Ten |
| | Date | Year | Years | Years |
| Investor Shares | 5/31/2000 | 25.13% | 19.63% | 6.31% |
| Institutional Shares | 1/14/2003 | 25.23 | 19.79 | 6.46 |
10
FTSE Social Index Fund
Financial Statements
Statement of Net Assets
As of August 31, 2014
The fund reports a complete list of its holdings in regulatory filings four times in each fiscal year, at the quarter-ends. For the second and fourth fiscal quarters, the lists appear in the fund’s semiannual and annual reports to shareholders. For the first and third fiscal quarters, the fund files the lists with the Securities and Exchange Commission on Form N-Q. Shareholders can look up the fund’s Forms N-Q on the SEC’s website at sec.gov. Forms N-Q may also be reviewed and copied at the SEC’s Public Reference Room (see the back cover of this report for further information).
| | | |
| | | | Market |
| | | | Value• |
| | | Shares | ($000) |
| Common Stocks (99.9%) | | |
| Basic Materials (1.9%) | | |
| | Praxair Inc. | 36,384 | 4,786 |
| | Ecolab Inc. | 33,316 | 3,825 |
| | Air Products & | | |
| | Chemicals Inc. | 25,971 | 3,459 |
| | Alcoa Inc. | 143,576 | 2,385 |
| | Mosaic Co. | 41,744 | 1,994 |
| | Sigma-Aldrich Corp. | 14,615 | 1,520 |
| | CONSOL Energy Inc. | 27,983 | 1,127 |
| | FMC Corp. | 16,475 | 1,090 |
| | Ashland Inc. | 9,519 | 1,021 |
| | International Flavors & | | |
| | Fragrances Inc. | 10,039 | 1,020 |
| | Airgas Inc. | 6,828 | 754 |
| | Avery Dennison Corp. | 11,668 | 561 |
| | Cliffs Natural Resources Inc. | 18,465 | 278 |
| * | Rayonier Advanced | | |
| | Materials Inc. | 5,238 | 174 |
| | | | 23,994 |
| Consumer Goods (11.8%) | | |
| | Procter & Gamble Co. | 333,966 | 27,756 |
| | PepsiCo Inc. | 187,086 | 17,304 |
| | Ford Motor Co. | 473,155 | 8,238 |
| | Colgate-Palmolive Co. | 114,048 | 7,382 |
| | General Motors Co. | 160,251 | 5,577 |
| | NIKE Inc. Class B | 70,552 | 5,542 |
| | Kimberly-Clark Corp. | 46,299 | 5,000 |
| | Kraft Foods Group Inc. | 72,385 | 4,263 |
| | General Mills Inc. | 75,481 | 4,029 |
| | Johnson Controls Inc. | 81,572 | 3,981 |
| | VF Corp. | 41,700 | 2,674 |
| | Delphi Automotive plc | 37,328 | 2,597 |
| | Mead Johnson Nutrition Co. | 25,090 | 2,399 |
| | Estee Lauder Cos. Inc. | | |
| | Class A | 27,541 | 2,116 |
| | Keurig Green Mountain Inc. | 15,556 | 2,074 |
| | Kellogg Co. | 30,380 | 1,974 |
| | Hershey Co. | 19,989 | 1,827 |
| | | |
| | | | Market |
| | | | Value• |
| | | Shares | ($000) |
| * | Michael Kors Holdings Ltd. | 22,652 | 1,815 |
| | BorgWarner Inc. | 28,192 | 1,753 |
| | Stanley Black & Decker Inc. | 19,059 | 1,744 |
| | Harley-Davidson Inc. | 26,743 | 1,700 |
| | ConAgra Foods Inc. | 51,784 | 1,667 |
| | Genuine Parts Co. | 18,898 | 1,658 |
| | Bunge Ltd. | 18,098 | 1,532 |
| | Dr Pepper Snapple | | |
| | Group Inc. | 24,278 | 1,528 |
| | Coca-Cola Enterprises Inc. | 30,901 | 1,476 |
| | Whirlpool Corp. | 9,520 | 1,457 |
| | Mattel Inc. | 41,695 | 1,438 |
| | Clorox Co. | 15,973 | 1,415 |
| * | Electronic Arts Inc. | 36,106 | 1,366 |
| * | TRW Automotive Holdings | | |
| | Corp. | 13,446 | 1,295 |
| | Ralph Lauren Corp. Class A | 7,616 | 1,289 |
| | JM Smucker Co. | 12,234 | 1,255 |
| | Coach Inc. | 33,777 | 1,244 |
| | Autoliv Inc. | 11,508 | 1,193 |
| | Church & Dwight Co. Inc. | 16,917 | 1,154 |
| | Newell Rubbermaid Inc. | 33,952 | 1,138 |
| | PVH Corp. | 9,575 | 1,118 |
| * | Mohawk Industries Inc. | 7,505 | 1,096 |
| | McCormick & Co. Inc. | 14,595 | 1,017 |
| | Campbell Soup Co. | 22,344 | 1,001 |
| | Harman International | | |
| | Industries Inc. | 8,409 | 968 |
| | Energizer Holdings Inc. | 7,595 | 923 |
| | Hormel Foods Corp. | 16,912 | 857 |
| | Lennar Corp. Class A | 21,160 | 829 |
| | Avon Products Inc. | 53,175 | 747 |
| | PulteGroup Inc. | 37,907 | 729 |
| * | Toll Brothers Inc. | 19,941 | 710 |
| ^ | Herbalife Ltd. | 12,129 | 618 |
| | Leggett & Platt Inc. | 17,229 | 605 |
| * | Lululemon Athletica Inc. | 12,795 | 511 |
| | | | 145,579 |
11
FTSE Social Index Fund
| | | |
| | | | Market |
| | | | Value• |
| | | Shares | ($000) |
| Consumer Services (10.3%) | | |
| | Walt Disney Co. | 212,772 | 19,124 |
| | Home Depot Inc. | 168,079 | 15,715 |
| | Time Warner Inc. | 105,022 | 8,090 |
| * | Priceline Group Inc. | 6,410 | 7,976 |
| | Starbucks Corp. | 88,868 | 6,915 |
| | Lowe’s Cos. Inc. | 125,252 | 6,577 |
| | McKesson Corp. | 28,398 | 5,538 |
| | TJX Cos. Inc. | 86,421 | 5,152 |
| | Viacom Inc. Class B | 46,613 | 3,783 |
| | Cardinal Health Inc. | 41,866 | 3,086 |
| | Macy’s Inc. | 45,192 | 2,815 |
| * | Chipotle Mexican Grill Inc. | | |
| | Class A | 3,819 | 2,592 |
| | Omnicom Group Inc. | 31,809 | 2,291 |
| * | Dollar General Corp. | 35,409 | 2,266 |
| * | AutoZone Inc. | 4,072 | 2,194 |
| | AmerisourceBergen Corp. | | |
| | Class A | 27,677 | 2,142 |
| * | O’Reilly Automotive Inc. | 13,043 | 2,034 |
| | Ross Stores Inc. | 26,129 | 1,971 |
| | Nielsen NV | 37,016 | 1,739 |
| | L Brands Inc. | 26,928 | 1,719 |
| * | Hertz Global Holdings Inc. | 55,052 | 1,627 |
| * | Bed Bath & Beyond Inc. | 25,022 | 1,608 |
| * | Discovery Communications | | |
| | Inc. | 35,772 | 1,537 |
| | Gap Inc. | 31,517 | 1,454 |
| * | CarMax Inc. | 27,031 | 1,416 |
| | Kohl’s Corp. | 23,782 | 1,398 |
| * | Dollar Tree Inc. | 25,589 | 1,372 |
| * | IHS Inc. Class A | 8,303 | 1,183 |
| | H&R Block Inc. | 33,287 | 1,116 |
| | Best Buy Co. Inc. | 34,021 | 1,085 |
| | Foot Locker Inc. | 18,105 | 1,016 |
| | Interpublic Group of Cos. | | |
| | Inc. | 51,851 | 1,013 |
| | Gannett Co. Inc. | 28,131 | 950 |
| | Staples Inc. | 80,232 | 937 |
| | PetSmart Inc. | 12,264 | 878 |
| | Tractor Supply Co. | 12,889 | 863 |
| | Scripps Networks | | |
| | Interactive Inc. Class A | 10,019 | 799 |
| * | Discovery Communications | | |
| | Inc. Class A | 17,920 | 783 |
| | Darden Restaurants Inc. | 16,182 | 766 |
| | Dun & Bradstreet Corp. | 4,570 | 536 |
| * | Urban Outfitters Inc. | 13,339 | 531 |
| * | Time Inc. | 13,815 | 324 |
| * | AutoNation Inc. | 4,130 | 224 |
| | | | 127,135 |
| Financials (26.9%) | | |
| | Wells Fargo & Co. | 641,438 | 32,996 |
| | JPMorgan Chase & Co. | 462,213 | 27,479 |
| | Bank of America Corp. | 1,298,179 | 20,888 |
| | |
| | | Market |
| | | Value• |
| | Shares | ($000) |
| Citigroup Inc. | 373,962 | 19,315 |
| Visa Inc. Class A | 61,351 | 13,038 |
| American Express Co. | 113,787 | 10,190 |
| American International | | |
| Group Inc. | 178,060 | 9,982 |
| US Bancorp | 224,199 | 9,479 |
| MasterCard Inc. Class A | 124,710 | 9,454 |
| MetLife Inc. | 111,639 | 6,111 |
| Morgan Stanley | 172,590 | 5,922 |
| PNC Financial Services | | |
| Group Inc. | 65,264 | 5,531 |
| Bank of New York Mellon | | |
| Corp. | 139,329 | 5,459 |
| Capital One Financial Corp. | 63,285 | 5,193 |
| Prudential Financial Inc. | 57,032 | 5,116 |
| American Tower | | |
| Corporation | 48,719 | 4,804 |
| ACE Ltd. | 41,615 | 4,425 |
| Travelers Cos. Inc. | 42,642 | 4,039 |
| Charles Schwab Corp. | 135,443 | 3,861 |
| State Street Corp. | 53,447 | 3,850 |
| Discover Financial Services | 57,789 | 3,604 |
| Marsh & McLennan Cos. | | |
| Inc. | 67,721 | 3,596 |
| BB&T Corp. | 88,410 | 3,300 |
| Aflac Inc. | 53,600 | 3,282 |
| Allstate Corp. | 53,320 | 3,279 |
| Aon plc | 36,456 | 3,177 |
| Public Storage | 17,611 | 3,085 |
| Ameriprise Financial Inc. | 23,656 | 2,975 |
| CME Group Inc. | 38,713 | 2,963 |
| Equity Residential | 43,731 | 2,907 |
| Franklin Resources Inc. | 50,080 | 2,831 |
| Chubb Corp. | 30,160 | 2,773 |
| McGraw Hill Financial Inc. | 33,641 | 2,729 |
| Intercontinental Exchange | | |
| Inc. | 14,058 | 2,657 |
| Health Care REIT Inc. | 37,676 | 2,546 |
| SunTrust Banks Inc. | 65,981 | 2,513 |
| T. Rowe Price Group Inc. | 31,010 | 2,512 |
| Prologis Inc. | 61,275 | 2,509 |
| Moody’s Corp. | 26,442 | 2,474 |
| AvalonBay Communities Inc. | 15,860 | 2,444 |
| HCP Inc. | 56,278 | 2,439 |
| Ventas Inc. | 36,167 | 2,379 |
| Boston Properties Inc. | 18,627 | 2,262 |
| Weyerhaeuser Co. | 64,198 | 2,180 |
| Fifth Third Bancorp | 105,004 | 2,143 |
| Host Hotels & Resorts Inc. | 92,980 | 2,122 |
| Hartford Financial Services | | |
| Group Inc. | 55,006 | 2,038 |
| Northern Trust Corp. | 29,149 | 2,021 |
| Principal Financial | | |
| Group Inc. | 36,240 | 1,967 |
| Lincoln National Corp. | 32,537 | 1,791 |
12
FTSE Social Index Fund
| | | |
| | | | Market |
| | | | Value• |
| | | Shares | ($000) |
| | M&T Bank Corp. | 14,062 | 1,738 |
| | Regions Financial Corp. | 169,199 | 1,717 |
| | Progressive Corp. | 67,139 | 1,680 |
| | Loews Corp. | 37,675 | 1,648 |
| | General Growth Properties | | |
| | Inc. | 61,929 | 1,522 |
| | KeyCorp | 107,973 | 1,470 |
| | Annaly Capital | | |
| | Management Inc. | 116,311 | 1,384 |
| | Realty Income Corp. | 27,087 | 1,211 |
| | Equifax Inc. | 14,923 | 1,175 |
| | Kimco Realty Corp. | 49,863 | 1,171 |
| | Western Union Co. | 66,383 | 1,160 |
| | Unum Group | 31,803 | 1,153 |
| | XL Group plc Class A | 33,464 | 1,144 |
| | CIT Group Inc. | 23,750 | 1,139 |
| | Comerica Inc. | 22,449 | 1,130 |
| | Macerich Co. | 17,287 | 1,129 |
| * | CBRE Group Inc. Class A | 34,474 | 1,096 |
| | Digital Realty Trust Inc. | 16,558 | 1,080 |
| * | Markel Corp. | 1,580 | 1,042 |
| | American Capital Agency | | |
| | Corp. | 43,774 | 1,035 |
| | Huntington Bancshares | | |
| | Inc. | 101,435 | 999 |
| | Navient Corp. | 52,705 | 946 |
| | Willis Group Holdings plc | 21,884 | 918 |
| | Arthur J Gallagher & Co. | 19,162 | 905 |
| | Plum Creek Timber Co. Inc. | 21,771 | 885 |
| * | Alleghany Corp. | 2,027 | 874 |
| | TD Ameritrade Holding Corp. | 26,359 | 873 |
| * | Genworth Financial Inc. | | |
| | Class A | 60,826 | 863 |
| | Torchmark Corp. | 15,519 | 847 |
| | Cincinnati Financial Corp. | 17,511 | 842 |
| | Duke Realty Corp. | 40,320 | 750 |
| | Zions Bancorporation | 24,890 | 725 |
| | PartnerRe Ltd. | 6,233 | 696 |
| | Regency Centers Corp. | 11,343 | 648 |
| | Liberty Property Trust | 18,274 | 647 |
| | Legg Mason Inc. | 13,092 | 646 |
| | WR Berkley Corp. | 12,814 | 620 |
| | Axis Capital Holdings Ltd. | 12,489 | 602 |
| | Assurant Inc. | 8,844 | 590 |
| | People’s United Financial | | |
| | Inc. | 37,742 | 564 |
| | Rayonier Inc. | 15,414 | 528 |
| | Commerce Bancshares Inc. | 11,019 | 508 |
| | RenaissanceRe Holdings | | |
| | Ltd. | 4,729 | 484 |
| | SLM Corp. | 51,905 | 460 |
| | Weingarten Realty Investors | 13,367 | 457 |
| * | Liberty Ventures Class A | 8,718 | 332 |
| * | Liberty TripAdvisor Holdings | | |
| | Inc. Class A | 8,718 | 312 |
| | | | 330,975 |
| | | |
| | | | Market |
| | | | Value• |
| | | Shares | ($000) |
| Health Care (21.4%) | | |
| | Johnson & Johnson | 337,471 | 35,006 |
| | Pfizer Inc. | 784,112 | 23,045 |
| | Merck & Co. Inc. | 354,360 | 21,301 |
| | Amgen Inc. | 92,922 | 12,951 |
| | AbbVie Inc. | 196,134 | 10,842 |
| | UnitedHealth Group Inc. | 121,580 | 10,539 |
| | Bristol-Myers Squibb Co. | 202,794 | 10,272 |
| * | Biogen Idec Inc. | 29,036 | 9,961 |
| * | Celgene Corp. | 98,370 | 9,347 |
| | Eli Lilly & Co. | 124,068 | 7,886 |
| | Medtronic Inc. | 122,597 | 7,828 |
| | Abbott Laboratories | 184,574 | 7,796 |
| * | Actavis plc | 32,283 | 7,328 |
| * | Express Scripts Holding Co. | 91,683 | 6,778 |
| | Allergan Inc. | 36,574 | 5,986 |
| | Thermo Fisher Scientific Inc. | 48,810 | 5,867 |
| | Baxter International Inc. | 66,514 | 4,987 |
| | Covidien plc | 55,652 | 4,832 |
| * | Alexion Pharmaceuticals Inc. | 24,320 | 4,117 |
| | WellPoint Inc. | 34,731 | 4,046 |
| | Aetna Inc. | 43,986 | 3,613 |
| * | Regeneron Pharmaceuticals | | |
| | Inc. | 9,513 | 3,334 |
| | Cigna Corp. | 33,043 | 3,126 |
| | Stryker Corp. | 34,765 | 2,896 |
| * | HCA Holdings Inc. | 40,618 | 2,836 |
| | Becton Dickinson and Co. | 23,876 | 2,798 |
| * | Vertex Pharmaceuticals Inc. | 28,954 | 2,709 |
| | Humana Inc. | 18,929 | 2,437 |
| | St. Jude Medical Inc. | 34,868 | 2,287 |
| | Perrigo Co. plc | 15,185 | 2,259 |
| * | Mylan Inc. | 45,754 | 2,224 |
| * | Intuitive Surgical Inc. | 4,681 | 2,200 |
| * | Boston Scientific Corp. | 162,653 | 2,062 |
| | Zimmer Holdings Inc. | 20,645 | 2,050 |
| * | DaVita HealthCare Partners | | |
| | Inc. | 26,290 | 1,963 |
| | CR Bard Inc. | 9,354 | 1,388 |
| * | Edwards Lifesciences Corp. | 12,949 | 1,285 |
| | Universal Health Services | | |
| | Inc. Class B | 11,181 | 1,280 |
| * | Henry Schein Inc. | 10,546 | 1,262 |
| * | CareFusion Corp. | 25,530 | 1,172 |
| | Quest Diagnostics Inc. | 17,828 | 1,127 |
| * | Laboratory Corp. of America | | |
| | Holdings | 10,432 | 1,119 |
| * | Hospira Inc. | 20,559 | 1,105 |
| * | Varian Medical Systems Inc. | 12,747 | 1,084 |
| * | Waters Corp. | 9,986 | 1,033 |
| | DENTSPLY International Inc. | 17,585 | 839 |
| | Patterson Cos. Inc. | 10,230 | 412 |
| | | | 262,615 |
13
FTSE Social Index Fund
| | | |
| | | | Market |
| | | | Value |
| | | Shares | ($000) |
| Industrials (6.5%) | | |
| | Union Pacific Corp. | 111,828 | 11,77 |
| | FedEx Corp. | 34,174 | 5,054 |
| | Automatic Data Processing | | |
| | Inc. | 59,179 | 4,940 |
| | Norfolk Southern Corp. | 37,968 | 4,063 |
| | Illinois Tool Works Inc. | 45,710 | 4,032 |
| | CSX Corp. | 123,855 | 3,82 |
| | Deere & Co. | 43,054 | 3,620 |
| | PACCAR Inc. | 43,531 | 2,734 |
| | Waste Management Inc. | 57,321 | 2,692 |
| | Agilent Technologies Inc. | 40,641 | 2,323 |
| | Sherwin-Williams Co. | 10,099 | 2,203 |
| | Ingersoll-Rand plc | 33,223 | 2,000 |
| | Rockwell Automation Inc. | 17,074 | 1,991 |
| | Xerox Corp. | 143,423 | 1,98 |
| * | Fiserv Inc. | 30,628 | 1,97 |
| | WW Grainger Inc. | 7,261 | 1,788 |
| | Pentair plc | 24,038 | 1,636 |
| | Kansas City Southern | 13,495 | 1,55 |
| | CH Robinson Worldwide Inc. | 18,161 | 1,240 |
| * | Trimble Navigation Ltd. | 31,855 | 1,060 |
| | Vulcan Materials Co. | 16,060 | 1,01 |
| | Expeditors International of | | |
| | Washington Inc. | 24,163 | 99 |
| | Sealed Air Corp. | 26,354 | 951 |
| | MeadWestvaco Corp. | 20,437 | 87 |
| | Fortune Brands Home & | | |
| | Security Inc. | 20,262 | 87 |
| | JB Hunt Transport Services | | |
| | Inc. | 11,383 | 860 |
| | Xylem Inc. | 22,796 | 849 |
| | Cintas Corp. | 12,439 | 823 |
| | Robert Half International Inc. | 16,216 | 814 |
| * | Flextronics International Ltd. | 73,504 | 811 |
| | ADT Corp. | 21,364 | 787 |
| * | Arrow Electronics Inc. | 12,383 | 77 |
| | Manpowergroup Inc. | 9,797 | 760 |
| | Avnet Inc. | 16,932 | 754 |
| | MDU Resources Group Inc. | 23,549 | 73 |
| | Iron Mountain Inc. | 20,465 | 736 |
| | Broadridge Financial | | |
| | Solutions Inc. | 14,845 | 632 |
| * | Owens-Illinois Inc. | 20,222 | 623 |
| | Allegion plc | 11,908 | 612 |
| | Ryder System Inc. | 6,505 | 588 |
| | Bemis Co. Inc. | 12,407 | 505 |
| | Jabil Circuit Inc. | 23,079 | 49 |
| | | | 79,371 |
| Oil & Gas (4.2%) | | |
| | Occidental Petroleum Corp. | 96,554 | 10,016 |
| | Anadarko Petroleum Corp. | 61,608 | 6,943 |
| | Williams Cos. Inc. | 90,761 | 5,395 |
| | Devon Energy Corp. | 49,648 | 3,744 |
| | Marathon Oil Corp. | 83,009 | 3,461 |
| | | |
| | | | Market |
| | | | Value• |
| | | Shares | ($000) |
| | Kinder Morgan Inc. | 81,396 | 3,277 |
| | Noble Energy Inc. | 44,015 | 3,175 |
| | Chesapeake Energy Corp. | 81,671 | 2,221 |
| | EQT Corp. | 18,639 | 1,846 |
| * | FMC Technologies Inc. | 29,134 | 1,802 |
| * | Southwestern Energy Co. | 43,104 | 1,775 |
| | Range Resources Corp. | 20,044 | 1,575 |
| | Ensco plc Class A | 28,738 | 1,451 |
| | Noble Corp. plc | 30,896 | 879 |
| | QEP Resources Inc. | 22,066 | 785 |
| * | Newfield Exploration Co. | 16,736 | 750 |
| | Denbury Resources Inc. | 43,257 | 745 |
| * | WPX Energy Inc. | 24,905 | 663 |
| | Rowan Cos. plc Class A | 15,217 | 461 |
| * | Seventy Seven Energy Inc. | 5,612 | 132 |
| * | Paragon Offshore plc | 10,198 | 95 |
| | | | 51,191 |
| Technology (15.2%) | | |
| | Intel Corp. | 613,750 | 21,432 |
| * | Google Inc. Class A | 34,813 | 20,274 |
| * | Google Inc. Class C | 34,683 | 19,825 |
| | Oracle Corp. | 425,445 | 17,669 |
| | QUALCOMM Inc. | 207,577 | 15,797 |
| | Hewlett-Packard Co. | 234,470 | 8,910 |
| | EMC Corp. | 251,533 | 7,428 |
| | Texas Instruments Inc. | 133,251 | 6,420 |
| * | Adobe Systems Inc. | 61,644 | 4,432 |
| * | Micron Technology Inc. | 131,344 | 4,282 |
| * | salesforce.com inc | 68,640 | 4,056 |
| | Applied Materials Inc. | 147,470 | 3,407 |
| * | Cognizant Technology | | |
| | Solutions Corp. Class A | 74,188 | 3,393 |
| | Corning Inc. | 160,763 | 3,353 |
| | Western Digital Corp. | 27,579 | 2,841 |
| | SanDisk Corp. | 27,795 | 2,723 |
| | Intuit Inc. | 32,346 | 2,691 |
| | Broadcom Corp. Class A | 65,213 | 2,568 |
| | Avago Technologies Ltd. | | |
| | Class A | 30,667 | 2,517 |
| | Seagate Technology plc | 38,417 | 2,404 |
| * | NXP Semiconductor NV | 30,669 | 2,101 |
| * | Cerner Corp. | 36,201 | 2,087 |
| | Symantec Corp. | 85,423 | 2,074 |
| | KLA-Tencor Corp. | 20,399 | 1,559 |
| * | Autodesk Inc. | 27,860 | 1,494 |
| | Lam Research Corp. | 19,937 | 1,434 |
| * | Citrix Systems Inc. | 20,161 | 1,416 |
| * | Red Hat Inc. | 23,238 | 1,416 |
| | Xilinx Inc. | 32,700 | 1,382 |
| | Altera Corp. | 38,555 | 1,363 |
| | Juniper Networks Inc. | 58,253 | 1,351 |
| * | Equinix Inc. | 6,068 | 1,324 |
| * | Check Point Software | | |
| | Technologies Ltd. | 18,374 | 1,305 |
| | NVIDIA Corp. | 65,777 | 1,279 |
14
FTSE Social Index Fund
| | | |
| | | | Market |
| | | | Value• |
| | | Shares | ($000) |
| * | Akamai Technologies Inc. | 20,898 | 1,263 |
| * | F5 Networks Inc. | 9,358 | 1,162 |
| | CA Inc. | 41,113 | 1,161 |
| | Maxim Integrated Products | | |
| | Inc. | 34,900 | 1,078 |
| * | VeriSign Inc. | 16,286 | 929 |
| * | VMware Inc. Class A | 9,103 | 897 |
| * | Teradata Corp. | 19,482 | 890 |
| * | Synopsys Inc. | 18,938 | 775 |
| | DST Systems Inc. | 4,388 | 407 |
| | | | 186,569 |
| Telecommunications (0.2%) | | |
| | Windstream Holdings Inc. | 74,158 | 838 |
| | Frontier Communications | | |
| | Corp. | 120,912 | 822 |
| * | Sprint Corp. | 101,702 | 571 |
| | | | 2,231 |
| Utilities (1.5%) | | |
| | Spectra Energy Corp. | 81,789 | 3,407 |
| | Consolidated Edison Inc. | 35,694 | 2,066 |
| | ONEOK Inc. | 25,501 | 1,790 |
| | Northeast Utilities | 38,363 | 1,761 |
| | NiSource Inc. | 38,533 | 1,529 |
| | CenterPoint Energy Inc. | 52,401 | 1,302 |
| | Wisconsin Energy Corp. | 27,870 | 1,263 |
| | American Water Works Co. | | |
| | Inc. | 21,978 | 1,112 |
| | CMS Energy Corp. | 33,083 | 1,010 |
| | Pepco Holdings Inc. | 30,905 | 852 |
| | Alliant Energy Corp. | 13,481 | 789 |
| | Questar Corp. | 21,461 | 505 |
| | TECO Energy Inc. | 26,581 | 481 |
| | ONE Gas Inc. | 6,450 | 241 |
| | | | 18,108 |
| Total Common Stocks | | |
| (Cost $894,634) | | 1,227,768 |
| Temporary Cash Investment (0.3%) | |
| Money Market Fund (0.3%) | | |
| 1,2 | Vanguard Market | | |
| | Liquidity Fund, | | |
| | 0.113% (Cost $3,085) | 3,084,715 | 3,085 |
| Total Investments (100.2%) | | |
| (Cost $897,719) | | 1,230,853 |
| |
| | Market |
| | Value• |
| | ($000) |
| Other Assets and Liabilities (-0.2%) | |
| Other Assets | 4,289 |
| Liabilities2 | (6,386) |
| | (2,097) |
| Net Assets (100%) | 1,228,756 |
At August 31, 2014, net assets consisted of:
| |
| | Amount |
| | ($000) |
| Paid-in Capital | 889,436 |
| Undistributed Net Investment Income | 9,835 |
| Accumulated Net Realized Losses | (3,649) |
| Unrealized Appreciation (Depreciation) | 333,134 |
| Net Assets | 1,228,756 |
| |
| |
| Investor Shares—Net Assets | |
| Applicable to 62,786,644 outstanding | |
| $.001 par value shares of beneficial | |
| interest (unlimited authorization) | 799,733 |
| Net Asset Value Per Share— | |
| Investor Shares | $12.74 |
| |
| |
| Institutional Shares—Net Assets | |
| Applicable to 33,645,736 outstanding | |
| $.001 par value shares of beneficial | |
| interest (unlimited authorization) | 429,023 |
| Net Asset Value Per Share— | |
| Institutional Shares | $12.75 |
• See Note A in Notes to Financial Statements.
* Non-income-producing security.
^ Includes partial security positions on loan to broker-dealers. The total value of securities on loan is $153,000.
1 Affiliated money market fund available only to Vanguard funds and certain trusts and accounts managed by Vanguard. Rate shown is the
7-day yield.
2 Includes $159,000 of collateral received for securities on loan.
REIT—Real Estate Investment Trust.
See accompanying Notes, which are an integral part of the Financial Statements.
15
FTSE Social Index Fund
Statement of Operations
| |
| | Year Ended |
| | August 31, 2014 |
| | ($000) |
| Investment Income | |
| Income | |
| Dividends | 18,361 |
| Interest1 | 3 |
| Securities Lending | 12 |
| Total Income | 18,376 |
| Expenses | |
| The Vanguard Group—Note B | |
| Investment Advisory Services | 165 |
| Management and Administrative—Investor Shares | 1,505 |
| Management and Administrative—Institutional Shares | 376 |
| Marketing and Distribution—Investor Shares | 136 |
| Marketing and Distribution—Institutional Shares | 78 |
| Custodian Fees | 74 |
| Auditing Fees | 32 |
| Shareholders’ Reports—Investor Shares | 13 |
| Shareholders’ Reports—Institutional Shares | 13 |
| Trustees’ Fees and Expenses | 1 |
| Total Expenses | 2,393 |
| Net Investment Income | 15,983 |
| Realized Net Gain (Loss) on Investment Securities Sold | 34,417 |
| Change in Unrealized Appreciation (Depreciation) of Investment Securities | 177,518 |
| Net Increase (Decrease) in Net Assets Resulting from Operations | 227,918 |
| 1 Interest income from an affiliated company of the fund was $3,000. |
See accompanying Notes, which are an integral part of the Financial Statements.
16
FTSE Social Index Fund
Statement of Changes in Net Assets
| | |
| | Year Ended August 31, |
| | 2014 | 2013 |
| | ($000) | ($000) |
| Increase (Decrease) in Net Assets | | |
| Operations | | |
| Net Investment Income | 15,983 | 11,977 |
| Realized Net Gain (Loss) | 34,417 | 40,848 |
| Change in Unrealized Appreciation (Depreciation) | 177,518 | 104,445 |
| Net Increase (Decrease) in Net Assets Resulting from Operations | 227,918 | 157,270 |
| Distributions | | |
| Net Investment Income | | |
| Investor Shares | (8,211) | (6,443) |
| Institutional Shares | (4,672) | (3,902) |
| Realized Capital Gain | | |
| Investor Shares | — | — |
| Institutional Shares | — | — |
| Total Distributions | (12,883) | (10,345) |
| Capital Share Transactions | | |
| Investor Shares | 103,700 | 78,528 |
| Institutional Shares | 80,439 | 23,215 |
| Net Increase (Decrease) from Capital Share Transactions | 184,139 | 101,743 |
| Total Increase (Decrease) | 399,174 | 248,668 |
| Net Assets | | |
| Beginning of Period | 829,582 | 580,914 |
| End of Period1 | 1,228,756 | 829,582 |
1 Net Assets—End of Period includes undistributed (overdistributed) net investment income of $9,835,000 and $6,735,000.See accompanying Notes, which are an integral part of the Financial Statements.
17
FTSE Social Index Fund
Financial Highlights
| | | | | |
| Investor Shares | | | | | |
| |
| For a Share Outstanding | Year Ended August 31, |
| Throughout Each Period | 2014 | 2013 | 2012 | 2011 | 2010 |
| Net Asset Value, Beginning of Period | $10.28 | $8.30 | $7.31 | $6.27 | $6.20 |
| Investment Operations | | | | | |
| Net Investment Income | .167 | .153 | .117 | .084 | .061 |
| Net Realized and Unrealized Gain (Loss) | | | | | |
| on Investments | 2.442 | 1.969 | .962 | 1.016 | .077 |
| Total from Investment Operations | 2.609 | 2.122 | 1.079 | 1.100 | .138 |
| Distributions | | | | | |
| Dividends from Net Investment Income | (.149) | (.142) | (. 089) | (. 060) | (. 068) |
| Distributions from Realized Capital Gains | — | — | — | — | — |
| Total Distributions | (.149) | (.142) | (. 089) | (. 060) | (. 068) |
| Net Asset Value, End of Period | $12.74 | $10.28 | $8.30 | $7.31 | $6.27 |
| |
| Total Return1 | 25.58% | 25.90% | 14.94% | 17.52% | 2.18% |
| |
| Ratios/Supplemental Data | | | | | |
| Net Assets, End of Period (Millions) | $800 | $553 | $379 | $344 | $306 |
| Ratio of Total Expenses to Average Net Assets | 0.27% | 0.28% | 0.29% | 0.29% | 0.29% |
| Ratio of Net Investment Income to | | | | | |
| Average Net Assets | 1.51% | 1.63% | 1.50% | 1.10% | 0.91% |
| Portfolio Turnover Rate | 14% | 29% | 45% | 11% | 35% |
1 Total returns do not include account service fees that may have applied in the periods shown. Fund prospectuses provide information aboutany applicable account service fees.See accompanying Notes, which are an integral part of the Financial Statements.
18
FTSE Social Index Fund
Financial Highlights
| | | | | |
| Institutional Shares | | | | | |
| |
| For a Share Outstanding | Year Ended August 31, |
| Throughout Each Period | 2014 | 2013 | 2012 | 2011 | 2010 |
| Net Asset Value, Beginning of Period | $10.29 | $8.31 | $7.32 | $6.27 | $6.20 |
| Investment Operations | | | | | |
| Net Investment Income | .180 | .163 | .128 | .095 | .070 |
| Net Realized and Unrealized Gain (Loss) | | | | | |
| on Investments | 2.440 | 1.971 | .960 | 1.025 | .075 |
| Total from Investment Operations | 2.620 | 2.134 | 1.088 | 1.120 | .145 |
| Distributions | | | | | |
| Dividends from Net Investment Income | (.160) | (.154) | (. 098) | (.070) | (.075) |
| Distributions from Realized Capital Gains | — | — | — | — | — |
| Total Distributions | (.160) | (.154) | (. 098) | (.070) | (.075) |
| Net Asset Value, End of Period | $12.75 | $10.29 | $8.31 | $7.32 | $6.27 |
| |
| Total Return | 25.68% | 26.05% | 15.06% | 17.84% | 2.29% |
| |
| Ratios/Supplemental Data | | | | | |
| Net Assets, End of Period (Millions) | $429 | $276 | $202 | $155 | $128 |
| Ratio of Total Expenses to Average Net Assets | 0.16% | 0.16% | 0.16% | 0.16% | 0.16% |
| Ratio of Net Investment Income to | | | | | |
| Average Net Assets | 1.62% | 1.75% | 1.63% | 1.23% | 1.04% |
| Portfolio Turnover Rate | 14% | 29% | 45% | 11% | 35% |
See accompanying Notes, which are an integral part of the Financial Statements.
19
FTSE Social Index Fund
Notes to Financial Statements
Vanguard FTSE Social Index Fund is registered under the Investment Company Act of 1940 as an open-end investment company, or mutual fund. The fund offers two classes of shares: Investor Shares and Institutional Shares. Investor Shares are available to any investor who meets the fund’s minimum purchase requirements. Institutional Shares are designed for investors who meet certain administrative, service, and account-size criteria.
A. The following significant accounting policies conform to generally accepted accounting principles for U.S. investment companies. The fund consistently follows such policies in preparing its financial statements.
1. Security Valuation: Securities are valued as of the close of trading on the New York Stock Exchange (generally 4 p.m., Eastern time) on the valuation date. Equity securities are valued at the latest quoted sales prices or official closing prices taken from the primary market in which each security trades; such securities not traded on the valuation date are valued at the mean of the latest quoted bid and asked prices. Securities for which market quotations are not readily available, or whose values have been materially affected by events occurring before the fund’s pricing time but after the close of the securities’ primary markets, are valued by methods deemed by the board of trustees to represent fair value. Investments in Vanguard Market Liquidity Fund are valued at that fund’s net asset value.
2. Federal Income Taxes: The fund intends to continue to qualify as a regulated investment company and distribute all of its taxable income. Management has analyzed the fund’s tax positions taken for all open federal income tax years (August 31, 2011–2014), and has concluded that no provision for federal income tax is required in the fund’s financial statements.
3. Distributions: Distributions to shareholders are recorded on the ex-dividend date.
4. Securities Lending: To earn additional income, the fund lends its securities to qualified institutional borrowers. Security loans are required to be secured at all times by collateral in an amount at least equal to the market value of securities loaned. Daily market fluctuations could cause the value of loaned securities to be more or less than the value of the collateral received. When this occurs, the collateral is adjusted and settled on the next business day. The fund further mitigates its counterparty risk by entering into securities lending transactions only with a diverse group of prequalified counterparties, monitoring their financial strength, and entering into master securities lending agreements with its counterparties. The master securities lending agreements provide that, in the event of a counterparty’s default (including bankruptcy), the fund may terminate any loans with that borrower, determine the net amount owed, and sell or retain the collateral up to the net amount owed to the fund; however, such actions may be subject to legal proceedings. While collateral mitigates counterparty risk, in the absence of a default the fund may experience delays and costs in recovering the securities loaned. The fund invests cash collateral received in Vanguard Market Liquidity Fund, and records a liability in the Statement of Net Assets for the return of the collateral, during the period the securities are on loan. Securities lending income represents fees charged to borrowers plus income earned on invested cash collateral, less expenses associated with the loan.
5. Credit Facility: The fund and certain other funds managed by The Vanguard Group participate in a $2.89 billion committed credit facility provided by a syndicate of lenders pursuant to a credit agreement that may be renewed annually; each fund is individually liable for its borrowings, if any, under the credit facility. Borrowings may be utilized for temporary and emergency purposes, and are subject to the fund’s regulatory and contractual borrowing restrictions. The participating funds are charged administrative fees and an annual commitment fee of 0.06% of the undrawn amount
20
FTSE Social Index Fund
of the facility; these fees are allocated to the funds based on a method approved by the fund’s board of trustees and included in Management and Administrative expenses on the fund’s Statement of Operations. Any borrowings under this facility bear interest at a rate equal to the higher of the federal funds rate or LIBOR reference rate plus an agreed-upon spread.
The fund had no borrowings outstanding at August 31, 2014, or at any time during the period then ended.
6. Other: Dividend income is recorded on the ex-dividend date. Interest income includes income distributions received from Vanguard Market Liquidity Fund and is accrued daily. Security transactions are accounted for on the date securities are bought or sold. Costs used to determine realized gains (losses) on the sale of investment securities are those of the specific securities sold.
Each class of shares has equal rights as to assets and earnings, except that each class separately bears certain class-specific expenses related to maintenance of shareholder accounts (included in Management and Administrative expenses) and shareholder reporting. Marketing and distribution expenses are allocated to each class of shares based on a method approved by the board of trustees. Income, other non-class-specific expenses, and gains and losses on investments are allocated to each class of shares based on its relative net assets.
B. The Vanguard Group furnishes at cost investment advisory, corporate management, administrative, marketing, and distribution services. The costs of such services are allocated to the fund based on methods approved by the board of trustees. The fund has committed to provide up to 0.40% of its net assets in capital contributions to Vanguard. At August 31, 2014, the fund had contributed capital of $118,000 to Vanguard (included in Other Assets), representing 0.01% of the fund’s net assets and 0.05% of Vanguard’s capitalization. The fund’s trustees and officers are also directors and officers of Vanguard.
C. Various inputs may be used to determine the value of the fund’s investments. These inputs are summarized in three broad levels for financial statement purposes. The inputs or methodologies used to value securities are not necessarily an indication of the risk associated with investing in those securities.
Level 1—Quoted prices in active markets for identical securities.
Level 2—Other significant observable inputs (including quoted prices for similar securities, interest rates, prepayment speeds, credit risk, etc.).
Level 3—Significant unobservable inputs (including the fund’s own assumptions used to determine the fair value of investments).
At August 31, 2014, 100% of the market value of the fund’s investments was determined based on Level 1 inputs.
D. Distributions are determined on a tax basis and may differ from net investment income and realized capital gains for financial reporting purposes. Differences may be permanent or temporary. Permanent differences are reclassified among capital accounts in the financial statements to reflect their tax character. Temporary differences arise when certain items of income, expense, gain, or loss are recognized in different periods for financial statement and tax purposes. These differences will reverse at some time in the future. Differences in classification may also result from the treatment of short-term gains as ordinary income for tax purposes.
21
FTSE Social Index Fund
During the year ended August 31, 2014, the fund realized $29,670,000 of net capital gains resulting from in-kind redemptions—in which shareholders exchanged fund shares for securities held by the fund rather than for cash. Because such gains are not taxable to the fund, and are not distributed to shareholders, they have been reclassified from accumulated net realized losses to paid-in capital.
For tax purposes, at August 31, 2014, the fund had $10,676,000 of ordinary income available for distribution. The fund used capital loss carryforwards of $4,739,000 to offset taxable capital gains realized during the year ended August 31, 2014. At August 31, 2014, the fund had available capital losses totaling $3,592,000 to offset future net capital gains through August 31, 2019.
At August 31, 2014, the cost of investment securities for tax purposes was $897,755,000. Net unrealized appreciation of investment securities for tax purposes was $333,098,000, consisting of unrealized gains of $355,081,000 on securities that had risen in value since their purchase and $21,983,000 in unrealized losses on securities that had fallen in value since their purchase.
E. During the year ended August 31, 2014, the fund purchased $411,871,000 of investment securities and sold $224,204,000 of investment securities, other than temporary cash investments. Purchases and sales include $80,456,000 and $80,094,000, respectively, in connection with in-kind purchases and redemptions of the fund’s capital shares.
| | | | |
| F. Capital share transactions for each class of shares were: | | | |
| | Year Ended August 31, |
| | | 2014 | | 2013 |
| | Amount | Shares | Amount | Shares |
| | ($000) | (000) | ($000) | (000) |
| Investor Shares | | | | |
| Issued | 300,900 | 26,084 | 167,216 | 17,268 |
| Issued in Lieu of Cash Distributions | 7,650 | 685 | 5,980 | 696 |
| Redeemed | (204,850) | (17,767) | (94,668) | (9,890) |
| Net Increase (Decrease)—Investor Shares | 103,700 | 9,002 | 78,528 | 8,074 |
| Institutional Shares | | | | |
| Issued | 136,554 | 11,664 | 103,413 | 10,702 |
| Issued in Lieu of Cash Distributions | 4,672 | 418 | 2,885 | 336 |
| Redeemed | (60,787) | (5,293) | (83,083) | (8,450) |
| Net Increase (Decrease) —Institutional Shares | 80,439 | 6,789 | 23,215 | 2,588 |
G. Management has determined that no material events or transactions occurred subsequent to August 31, 2014, that would require recognition or disclosure in these financial statements.
22
Report of Independent Registered Public Accounting Firm
To the Board of Trustees of Vanguard World Fund and the Shareholders of Vanguard FTSE Social Index Fund:
In our opinion, the accompanying statement of net assets and the related statements of operations and of changes in net assets and the financial highlights present fairly, in all material respects, the financial position of Vanguard FTSE Social Index Fund (constituting a separate portfolio of Vanguard World Fund, hereafter referred to as the “Fund”) at August 31, 2014, the results of its operations for the year then ended, the changes in its net assets for each of the two years in the period then ended, and the financial highlights for each of the five years in the period then ended, in conformity with accounting principles generally accepted in the United States of America. These financial statements and financial highlights (hereafter referred to as “financial statements”) are the responsibility of the Fund’s management. Our responsibility is to express an opinion on these financial statements based on our audits. We conducted our audits of these financial statements in accordance with the standards of the Public Company Accounting Oversight Board (United States). Those standards require that we plan and perform the audit to obtain reasonable assurance about whether the financial statements are free of material misstatement. An audit includes examining, on a test basis, evidence supporting the amounts and disclosures in the financial statements, assessing the accounting principles used and significant estimates made by management, and evaluating the overall financial statement presentation. We believe that our audits, which included confirmation of securities at August 31, 2014 by correspondence with the custodian and by agreement to the underlying ownership records of the transfer agent, provide a reasonable basis for our opinion.
/s/PricewaterhouseCoopers LLP
Philadelphia, Pennsylvania
October 10, 2014

Special 2014 tax information (unaudited) for Vanguard FTSE Social Index Fund
This information for the fiscal year ended August 31, 2014, is included pursuant to provisions of the Internal Revenue Code.
The fund distributed $12,883,000 of qualified dividend income to shareholders during the fiscal year.
For corporate shareholders, 100% of investment income (dividend income plus short-term gains, if any) qualifies for the dividends-received deduction.
23
Your Fund’s After-Tax Returns
This table presents returns for your fund both before and after taxes. The after-tax returns are shown in two ways: (1) assuming that an investor owned the fund during the entire period and paid taxes on the fund’s distributions, and (2) assuming that an investor paid taxes on the fund’s distributions and sold all shares at the end of each period.
Calculations are based on the highest individual federal income tax and capital gains tax rates in effect at the times of the distributions and the hypothetical sales. State and local taxes were not considered. After-tax returns reflect any qualified dividend income, using actual prior-year figures and estimates for 2014. (In the example, returns after the sale of fund shares may be higher than those assuming no sale. This occurs when the sale would have produced a capital loss. The calculation assumes that the investor received a tax deduction for the loss.)
The table shows returns for Investor Shares only; returns for other share classes will differ. Please note that your actual after-tax returns will depend on your tax situation and may differ from those shown. Also note that if you own the fund in a tax-deferred account, such as an individual retirement account or a 401(k) plan, this information does not apply to you. Such accounts are not subject to current taxes.
Finally, keep in mind that a fund’s performance—whether before or after taxes—does not guarantee future results.
Average Annual Total Returns: FTSE Social Index Fund Investor Shares
Periods Ended August 31, 2014
| | | |
| | One | Five | Ten |
| | Year | Years | Years |
| Returns Before Taxes | 25.58% | 16.89% | 7.07% |
| Returns After Taxes on Distributions | 25.19 | 16.66 | 6.84 |
| Returns After Taxes on Distributions and Sale of Fund Shares | 14.74 | 13.70 | 5.73 |
24
About Your Fund’s Expenses
As a shareholder of the fund, you incur ongoing costs, which include costs for portfolio management, administrative services, and shareholder reports (like this one), among others. Operating expenses, which are deducted from a fund’s gross income, directly reduce the investment return of the fund.
A fund’s expenses are expressed as a percentage of its average net assets. This figure is known as the expense ratio. The following examples are intended to help you understand the ongoing costs (in dollars) of investing in your fund and to compare these costs with those of other mutual funds. The examples are based on an investment of $1,000 made at the beginning of the period shown and held for the entire period.
The accompanying table illustrates your fund’s costs in two ways:
• Based on actual fund return. This section helps you to estimate the actual expenses that you paid over the period. The ”Ending Account Value“ shown is derived from the fund‘s actual return, and the third column shows the dollar amount that would have been paid by an investor who started with $1,000 in the fund. You may use the information here, together with the amount you invested, to estimate the expenses that you paid over the period.
To do so, simply divide your account value by $1,000 (for example, an $8,600 account value divided by $1,000 = 8.6), then multiply the result by the number given for your fund under the heading ”Expenses Paid During Period.“
• Based on hypothetical 5% yearly return. This section is intended to help you compare your fund‘s costs with those of other mutual funds. It assumes that the fund had a yearly return of 5% before expenses, but that the expense ratio is unchanged. In this case—because the return used is not the fund’s actual return—the results do not apply to your investment. The example is useful in making comparisons because the Securities and Exchange Commission requires all mutual funds to calculate expenses based on a 5% return. You can assess your fund’s costs by comparing this hypothetical example with the hypothetical examples that appear in shareholder reports of other funds.
Note that the expenses shown in the table are meant to highlight and help you compare ongoing costs only and do not reflect transaction costs incurred by the fund for buying and selling securities. Further, the expenses do not include any purchase, redemption, or account service fees described in the fund prospectus. If such fees were applied to your account, your costs would be higher. Your fund does not carry a “sales load.”
The calculations assume no shares were bought or sold during the period. Your actual costs may have been higher or lower, depending on the amount of your investment and the timing of any purchases or redemptions.
You can find more information about the fund’s expenses, including annual expense ratios, in the Financial Statements section of this report. For additional information on operating expenses and other shareholder costs, please refer to your fund’s current prospectus.
25
| | | |
| Six Months Ended August 31, 2014 | | | |
| | Beginning | Ending | Expenses |
| | Account Value | Account Value | Paid During |
| FTSE Social Index Fund | 2/28/2014 | 8/31/2014 | Period |
| Based on Actual Fund Return | | | |
| Investor Shares | $1,000.00 | $1,076.01 | $1.36 |
| Institutional Shares | 1,000.00 | 1,075.95 | 0.84 |
| Based on Hypothetical 5% Yearly Return | | | |
| Investor Shares | $1,000.00 | $1,023.89 | $1.33 |
| Institutional Shares | 1,000.00 | 1,024.40 | 0.82 |
The calculations are based on expenses incurred in the most recent six-month period. The fund’s annualized six-month expense ratios for thatperiod are 0.26% for Investor Shares and 0.16% for Institutional Shares. The dollar amounts shown as “Expenses Paid” are equal to theannualized expense ratio multiplied by the average account value over the period, multiplied by the number of days in the most recentsix-month period, then divided by the number of days in the most recent 12-month period.26
Trustees Approve Advisory Arrangement
The board of trustees of Vanguard FTSE Social Index Fund has renewed the fund’s investment advisory arrangement with The Vanguard Group, Inc. (Vanguard). Vanguard’s Equity Investment Group—through its Equity Index Group—serves as the investment advisor to the fund. The board determined that continuing the fund’s internalized management structure was in the best interests of the fund and its shareholders.
The board based its decision upon an evaluation of the advisor’s investment staff, portfolio management process, and performance. The trustees considered the factors discussed below, among others. However, no single factor determined whether the board approved the arrangement. Rather, it was the totality of the circumstances that drove the board’s decision.
Nature, extent, and quality of services
The board considered the quality of the fund’s investment management services over both the short and long term, and took into account the organizational depth and stability of the advisor. The board noted that Vanguard has been managing investments for more than three decades. The Equity Index Group adheres to a sound, disciplined investment management process; the team has considerable experience, stability, and depth.
The board concluded that Vanguard’s experience, stability, depth, and performance, among other factors, warranted continuation of the advisory arrangement.
Investment performance
The board considered the short- and long-term performance of the fund, including any periods of outperformance or underperformance relative to a target index and peer group. The board concluded that the performance was such that the advisory arrangement should continue. Information about the fund’s most recent performance can be found in the Performance Summary section of this report.
Cost
The board concluded that the fund’s expense ratio was well below the average expense ratio charged by funds in its peer group and that the fund’s advisory fee rate was also well below its peer-group average. Information about the fund’s expenses appears in the About Your Fund’s Expenses section of this report as well as in the Financial Statements section.
The board does not conduct a profitability analysis of Vanguard, because of Vanguard’s unique “at-cost” structure. Unlike most other mutual fund management companies, Vanguard is owned by the funds it oversees, and produces “profits” only in the form of reduced expenses for fund shareholders.
The benefit of economies of scale
The board concluded that the fund’s at-cost arrangement with Vanguard ensures that the fund will realize economies of scale as it grows, with the cost to shareholders declining as fund assets increase.
The board will consider whether to renew the advisory arrangement again after a one-year period.
27
Glossary
30-Day SEC Yield. A fund’s 30-day SEC yield is derived using a formula specified by the U.S. Securities and Exchange Commission. Under the formula, data related to the fund’s security holdings in the previous 30 days are used to calculate the fund’s hypothetical net income for that period, which is then annualized and divided by the fund’s estimated average net assets over the calculation period. For the purposes of this calculation, a security’s income is based on its current market yield to maturity (for bonds), its actual income (for asset-backed securities), or its projected dividend yield (for stocks). Because the SEC yield represents hypothetical annualized income, it will differ—at times significantly—from the fund’s actual experience. As a result, the fund’s income distributions may be higher or lower than implied by the SEC yield.
Beta. A measure of the magnitude of a fund’s past share-price fluctuations in relation to the ups and downs of a given market index. The index is assigned a beta of 1.00. Compared with a given index, a fund with a beta of 1.20 typically would have seen its share price rise or fall by 12% when the index rose or fell by 10%. For this report, beta is based on returns over the past 36 months for both the fund and the index. Note that a fund’s beta should be reviewed in conjunction with its R-squared (see definition). The lower the R-squared, the less correlation there is between the fund and the index, and the less reliable beta is as an indicator of volatility.
Dividend Yield. Dividend income earned by stocks, expressed as a percentage of the aggregate market value (or of net asset value, for a fund). The yield is determined by dividing the amount of the annual dividends by the aggregate value (or net asset value) at the end of the period. For a fund, the dividend yield is based solely on stock holdings and does not include any income produced by other investments.
Earnings Growth Rate. The average annual rate of growth in earnings over the past five years for the stocks now in a fund.
Equity Exposure. A measure that reflects a fund’s investments in stocks and stock futures. Any holdings in short-term reserves are excluded.
Expense Ratio. A fund’s total annual operating expenses expressed as a percentage of the fund’s average net assets. The expense ratio includes management and administrative expenses, but does not include the transaction costs of buying and selling portfolio securities.
Foreign Holdings. The percentage of a fund represented by securities or depositary receipts of companies based outside the United States.
Inception Date. The date on which the assets of a fund (or one of its share classes) are first invested in accordance with the fund’s investment objective. For funds with a subscription period, the inception date is the day after that period ends. Investment performance is measured from the inception date.
Median Market Cap. An indicator of the size of companies in which a fund invests; the midpoint of market capitalization (market price x shares outstanding) of a fund’s stocks, weighted by the proportion of the fund’s assets invested in each stock. Stocks representing half of the fund’s assets have market capitalizations above the median, and the rest are below it.
Price/Book Ratio. The share price of a stock divided by its net worth, or book value, per share. For a fund, the weighted average price/book ratio of the stocks it holds.
28
Price/Earnings Ratio. The ratio of a stock’s current price to its per-share earnings over the past year. For a fund, the weighted average P/E of the stocks it holds. P/E is an indicator of market expectations about corporate prospects; the higher the P/E, the greater the expectations for a company’s future growth.
R-Squared. A measure of how much of a fund’s past returns can be explained by the returns from the market in general, as measured by a given index. If a fund’s total returns were precisely synchronized with an index’s returns, its R-squared would be 1.00. If the fund’s returns bore no relationship to the index’s returns, its R-squared would be 0. For this report, R-squared is based on returns over the past 36 months for both the fund and the index.
Return on Equity. The annual average rate of return generated by a company during the past five years for each dollar of shareholder’s equity (net income divided by shareholder’s equity). For a fund, the weighted average return on equity for the companies whose stocks it holds.
Short-Term Reserves. The percentage of a fund invested in highly liquid, short-term securities that can be readily converted to cash.
Turnover Rate. An indication of the fund’s trading activity. Funds with high turnover rates incur higher transaction costs and may be more likely to distribute capital gains (which may be taxable to investors). The turnover rate excludes in-kind transactions, which have minimal impact on costs.
Benchmark Information
Spliced Social Index: Calvert Social Index through December 16, 2005; FTSE4Good US Select Index thereafter.
29
This page intentionally left blank.
This page intentionally left blank.
The People Who Govern Your Fund
The trustees of your mutual fund are there to see that the fund is operated and managed in your best interests since, as a shareholder, you are a part owner of the fund. Your fund’s trustees also serve on the board of directors of The Vanguard Group, Inc., which is owned by the Vanguard funds and provides services to them on an at-cost basis.
A majority of Vanguard’s board members are independent, meaning that they have no affiliation with Vanguard or the funds they oversee, apart from the sizable personal investments they have made as private individuals. The independent board members have distinguished backgrounds in business, academia, and public service. Each of the trustees and executive officers oversees 177 Vanguard funds.
The following table provides information for each trustee and executive officer of the fund. More information about the trustees is in the Statement of Additional Information, which can be obtained, without charge, by contacting Vanguard at 800-662-7447, or online at vanguard.com.
| |
| InterestedTrustee1 | and Delphi Automotive LLP (automotive components); |
| | Senior Advisor at New Mountain Capital. |
| F. William McNabb III | |
| Born 1957. Trustee Since July 2009. Chairman of the | Amy Gutmann |
| Board. Principal Occupation(s) During the Past Five | Born 1949. Trustee Since June 2006. Principal |
| Years: Chairman of the Board of The Vanguard Group, | Occupation(s) During the Past Five Years: President of |
| Inc., and of each of the investment companies served | the University of Pennsylvania; Christopher H. Browne |
| by The Vanguard Group, since January 2010; Director | Distinguished Professor of Political Science, School of |
| of The Vanguard Group since 2008; Chief Executive | Arts and Sciences, and Professor of Communication, |
| Officer and President of The Vanguard Group, and of | Annenberg School for Communication, with secondary |
| each of the investment companies served by The | faculty appointments in the Department of Philosophy, |
| Vanguard Group, since 2008; Director of Vanguard | School of Arts and Sciences, and at the Graduate |
| Marketing Corporation; Managing Director of The | School of Education, University of Pennsylvania; |
| Vanguard Group (1995–2008). | Trustee of the National Constitution Center; Chair |
| | of the Presidential Commission for the Study of |
| | Bioethical Issues. |
| IndependentTrustees | |
| | JoAnn Heffernan Heisen |
| Emerson U. Fullwood | Born 1950. Trustee Since July 1998. Principal |
| Born 1948. Trustee Since January 2008. Principal | Occupation(s) During the Past Five Years: Corporate |
| Occupation(s) During the Past Five Years: Executive | Vice President and Chief Global Diversity Officer |
| Chief Staff and Marketing Officer for North America | (retired 2008) and Member of the Executive |
| and Corporate Vice President (retired 2008) of Xerox | Committee (1997–2008) of Johnson & Johnson |
| Corporation (document management products and | (pharmaceuticals/medical devices/consumer |
| services); Executive in Residence and 2009–2010 | products); Director of Skytop Lodge Corporation |
| Distinguished Minett Professor at the Rochester | (hotels), the University Medical Center at Princeton, |
| Institute of Technology; Director of SPX Corporation | the Robert Wood Johnson Foundation, and the Center |
| (multi-industry manufacturing), the United Way of | for Talent Innovation; Member of the Advisory Board |
| Rochester, Amerigroup Corporation (managed health | of the Maxwell School of Citizenship and Public Affairs |
| care), the University of Rochester Medical Center, | at Syracuse University. |
| Monroe Community College Foundation, and North | |
| Carolina A&T University. | F. Joseph Loughrey |
| | Born 1949. Trustee Since October 2009. Principal |
| Rajiv L. Gupta | Occupation(s) During the Past Five Years: President |
| Born 1945. Trustee Since December 2001.2 | and Chief Operating Officer (retired 2009) of Cummins |
| Principal Occupation(s) During the Past Five Years: | Inc. (industrial machinery); Chairman of the Board |
| Chairman and Chief Executive Officer (retired 2009) | of Hillenbrand, Inc. (specialized consumer services), |
| and President (2006–2008) of Rohm and Haas Co. | and of Oxfam America; Director of SKF AB (industrial |
| (chemicals); Director of Tyco International, Ltd. | machinery), Hyster-Yale Materials Handling, Inc. |
| (diversified manufacturing and services), Hewlett- | (forklift trucks), the Lumina Foundation for Education, |
| Packard Co. (electronic computer manufacturing), | |
| | |
| and the V Foundation for Cancer Research; Member | Executive Officers | |
| of the Advisory Council for the College of Arts and | | |
| Letters and of the Advisory Board to the Kellogg | Glenn Booraem | |
| Institute for International Studies, both at the | Born 1967. Controller Since July 2010. Principal |
| University of Notre Dame. | Occupation(s) During the Past Five Years: Principal |
| | of The Vanguard Group, Inc.; Controller of each of |
| Mark Loughridge | the investment companies served by The Vanguard |
| Born 1953. Trustee Since March 2012. Principal | Group; Assistant Controller of each of the investment |
| Occupation(s) During the Past Five Years: Senior Vice | companies served by The Vanguard Group (2001–2010). |
| President and Chief Financial Officer (retired 2013) | | |
| at IBM (information technology services); Fiduciary | Thomas J. Higgins | |
| Member of IBM’s Retirement Plan Committee (2004– | Born 1957. Chief Financial Officer Since September |
| 2013); Member of the Council on Chicago Booth. | 2008. Principal Occupation(s) During the Past Five |
| | Years: Principal of The Vanguard Group, Inc.; Chief |
| Scott C. Malpass | Financial Officer of each of the investment companies |
| Born 1962. Trustee Since March 2012. Principal | served by The Vanguard Group; Treasurer of each of |
| Occupation(s) During the Past Five Years: Chief | the investment companies served by The Vanguard |
| Investment Officer and Vice President at the University | Group (1998–2008). | |
| of Notre Dame; Assistant Professor of Finance at the | | |
| Mendoza College of Business at Notre Dame; Member | Kathryn J. Hyatt | |
| of the Notre Dame 403(b) Investment Committee; | Born 1955. Treasurer Since November 2008. Principal |
| Board Member of TIFF Advisory Services, Inc. | Occupation(s) During the Past Five Years: Principal of |
| (investment advisor); Member of the Investment | The Vanguard Group, Inc.; Treasurer of each of the |
| Advisory Committees of the Financial Industry | investment companies served by The Vanguard |
| Regulatory Authority (FINRA) and of Major League | Group; Assistant Treasurer of each of the investment |
| Baseball. | companies served by The Vanguard Group (1988–2008). |
| |
| André F. Perold | Heidi Stam | |
| Born 1952. Trustee Since December 2004. Principal | Born 1956. Secretary Since July 2005. Principal |
| Occupation(s) During the Past Five Years: George | Occupation(s) During the Past Five Years: Managing |
| Gund Professor of Finance and Banking, Emeritus | Director of The Vanguard Group, Inc.; General Counsel |
| at the Harvard Business School (retired 2011); | of The Vanguard Group; Secretary of The Vanguard |
| Chief Investment Officer and Managing Partner of | Group and of each of the investment companies |
| HighVista Strategies LLC (private investment firm); | served by The Vanguard Group; Director and Senior |
| Director of Rand Merchant Bank; Overseer of the | Vice President of Vanguard Marketing Corporation. |
| Museum of Fine Arts Boston. | | |
| | Vanguard Senior ManagementTeam |
| Alfred M. Rankin, Jr. | | |
| Born 1941. Trustee Since January 1993. Principal | Mortimer J. Buckley | Chris D. McIsaac |
| Occupation(s) During the Past Five Years: Chairman, | Kathleen C. Gubanich | Michael S. Miller |
| President, and Chief Executive Officer of NACCO | Paul A. Heller | James M. Norris |
| Industries, Inc. (housewares/lignite), and of Hyster- | Martha G. King | Glenn W. Reed |
| Yale Materials Handling, Inc. (forklift trucks); Chairman | John T. Marcante | |
| of the Board of University Hospitals of Cleveland. | | |
| |
| Peter F. Volanakis | Chairman Emeritus and Senior Advisor |
| Born 1955. Trustee Since July 2009. Principal | | |
| Occupation(s) During the Past Five Years: President | John J. Brennan | |
| and Chief Operating Officer (retired 2010) of Corning | Chairman, 1996–2009 | |
| Incorporated (communications equipment); Trustee of | Chief Executive Officer and President, 1996–2008 |
| Colby-Sawyer College; Member of the Advisory Board | | |
| of the Norris Cotton Cancer Center and of the Advisory | Founder | |
| Board of the Parthenon Group (strategy consulting). | | |
| | John C. Bogle | |
| | Chairman and Chief Executive Officer, 1974–1996 |
1 Mr. McNabb is considered an “interested person,” as defined in the Investment Company Act of 1940, because he is an officer of the
Vanguard funds.
2 December 2002 for Vanguard Equity Income Fund, the Vanguard Municipal Bond Funds, and the Vanguard State Tax-Exempt Funds.
| 
|
| |
| | P.O. Box 2600 |
| | Valley Forge, PA 19482-2600 |
| |
| |
| |
| Connect with Vanguard® > vanguard.com | |
| |
| |
| |
| Fund Information > 800-662-7447 | All rights in a FTSE index (the “Index”) vest in FTSE |
| Direct Investor Account Services > 800-662-2739 | International Limited (“FTSE”). “FTSE®” is a trademark |
| | of London Stock Exchange Group companies and is |
| Institutional Investor Services > 800-523-1036 | used by FTSE under licence. The Vanguard fund (the |
| Text Telephone for People | “Product”) has been developed solely by Vanguard. The |
| With Hearing Impairment > 800-749-7273 | Index is calculated by FTSE or its agent. FTSE and its |
| | licensors are not connected to and do not sponsor, |
| This material may be used in conjunction | advise, recommend, endorse, or promote the Product |
| with the offering of shares of any Vanguard | and do not accept any liability whatsoever to any |
| fund only if preceded or accompanied by | person arising out of (a) the use of, reliance on, or any |
| the fund’s current prospectus. | error in the Index or (b) investment in or operation of |
| the Product. FTSE makes no claim, prediction, warranty, |
| All comparative mutual fund data are from Lipper, a | or representation either as to the results to be obtained |
| Thomson Reuters Company, or Morningstar, Inc., unless | from the Product or the suitability of the Index for the |
| otherwise noted. | purpose to which it is being put by Vanguard. |
| |
| You can obtain a free copy of Vanguard’s proxy voting | |
| guidelines by visiting vanguard.com/proxyreporting or by | |
| calling Vanguard at 800-662-2739. The guidelines are | |
| also available from the SEC’s website, sec.gov. In | |
| addition, you may obtain a free report on how your fund | |
| voted the proxies for securities it owned during the 12 | |
| months ended June 30. To get the report, visit either | |
| vanguard.com/proxyreporting or sec.gov. | |
| |
| You can review and copy information about your fund at | |
| the SEC’s Public Reference Room in Washington, D.C. To | |
| find out more about this public service, call the SEC at | |
| 202-551-8090. Information about your fund is also | |
| available on the SEC’s website, and you can receive | |
| copies of this information, for a fee, by sending a | |
| request in either of two ways: via e-mail addressed to | |
| publicinfo@sec.gov or via regular mail addressed to the | |
| Public Reference Section, Securities and Exchange | |
| Commission, Washington, DC 20549-1520. | |
| |
| | © 2014 The Vanguard Group, Inc. |
| | All rights reserved. |
| | Vanguard Marketing Corporation, Distributor. |
| |
| | Q2130 102014 |

Annual Report | August 31, 2014
Vanguard U.S. Sector Index Funds
Vanguard Consumer Discretionary Index Fund
Vanguard Consumer Staples Index Fund
Vanguard Energy Index Fund
Vanguard Financials Index Fund
Vanguard Health Care Index Fund
Vanguard Industrials Index Fund
Vanguard Information Technology Index Fund
Vanguard Materials Index Fund
Vanguard Telecommunication Services Index Fund
Vanguard Utilities Index Fund
Vanguard’s Principles for Investing Success
On May 1, 1975, Vanguard began operations, a fledgling company based on the simple but revolutionary idea that a mutual fund company should be managed solely in the interest of its investors.
Four decades later, that revolutionary spirit continues to animate the enterprise. Vanguard remains on a mission to give investors the best chance of investment success.
As we mark our 40th anniversary, we thank you for entrusting your assets to Vanguard and giving us the opportunity to help you reach your financial goals in the decades to come.
| |
| Contents | |
| |
| Your Fund’s Total Returns | 1 |
| Chairman’s Letter | 2 |
| Consumer Discretionary Index Fund | 6 |
| Consumer Staples Index Fund | 17 |
| Energy Index Fund | 27 |
| Financials Index Fund | 37 |
| Health Care Index Fund | 49 |
| Industrials Index Fund | 60 |
| Information Technology Index Fund | 71 |
| Materials Index Fund | 82 |
| Telecommunication Services Index Fund | 92 |
| Utilities Index Fund | 102 |
| Your Fund’s After-Tax Returns | 112 |
| About Your Fund’s Expenses | 114 |
| Trustees Approve Advisory Arrangements | 116 |
| Glossary | 117 |

Please note: The opinions expressed in this report are just that—informed opinions. They should not be considered promises or advice. Also, please keep in mind that the information and
opinions cover the period through the date on the front of this report. Of course, the risks of investing in your fund are spelled out in the prospectus.
See the Glossary for definitions of investment terms used in this report.
About the cover: Since our founding, Vanguard has drawn inspiration from the enterprise and valor demonstrated by British naval hero Horatio Nelson and his command
at the Battle of the Nile in 1798. The photograph displays a replica of a merchant ship from the same era as Nelson’s flagship, the HMS Vanguard.
Your Fund’s Total Returns
Fiscal Year Ended August 31, 2014
| |
| Admiral™ Shares1 and ETF Shares2 | |
| |
| | Total |
| | Returns |
| Vanguard Consumer Discretionary | |
| Index Fund | 20.77% |
| Vanguard Consumer Discretionary ETF | |
| Market Price | 20.68 |
| Net Asset Value | 20.75 |
| MSCI US IMI/Consumer Discretionary 25/50 | 20.85 |
| Consumer Services Funds Average3 | 18.00 |
| |
| Vanguard Consumer Staples Index Fund | 17.41% |
| Vanguard Consumer Staples ETF | |
| Market Price | 17.43 |
| Net Asset Value | 17.42 |
| MSCI US IMI/Consumer Staples 25/50 | 17.57 |
| Consumer Goods Funds Average3 | 19.12 |
| |
| Vanguard Energy Index Fund | 24.32% |
| Vanguard Energy ETF | |
| Market Price | 24.30 |
| Net Asset Value | 24.31 |
| MSCI US IMI/Energy 25/50 | 24.44 |
| Natural Resources Funds Average3 | 24.58 |
| |
| Vanguard Financials Index Fund | 21.19% |
| Vanguard Financials ETF | |
| Market Price | 21.31 |
| Net Asset Value | 21.20 |
| MSCI US IMI/Financials 25/50 | 21.32 |
| Financial Services Funds Average3 | 18.37 |
| |
| Vanguard Health Care Index Fund | 31.77% |
| Vanguard Health Care ETF | |
| Market Price | 31.82 |
| Net Asset Value | 31.76 |
| MSCI US IMI/Health Care 25/50 | 31.90 |
| Health/Biotechnology Funds Average3 | 34.41 |
| |
| Vanguard Industrials Index Fund | 24.84% |
| Vanguard Industrials ETF | |
| Market Price | 24.84 |
| Net Asset Value | 24.83 |
| MSCI US IMI/Industrials 25/50 | 24.99 |
| Industrials Funds Average3 | 22.51 |
| |
| | Total |
| | Returns |
| Vanguard Information Technology | |
| Index Fund | 32.05% |
| Vanguard Information Technology ETF | |
| Market Price | 31.98 |
| Net Asset Value | 32.04 |
| MSCI US IMI/Information Technology 25/50 | 32.17 |
| Science and Technology Funds Average3 | 28.20 |
| |
| Vanguard Materials Index Fund | 27.18% |
| Vanguard Materials ETF | |
| Market Price | 27.17 |
| Net Asset Value | 27.17 |
| MSCI US IMI/Materials 25/50 | 27.31 |
| Basic Materials Funds Average3 | 19.08 |
| |
| Vanguard Telecommunication Services | |
| Index Fund | 17.13% |
| Vanguard Telecommunication Services ETF | |
| Market Price | 17.11 |
| Net Asset Value | 17.08 |
| MSCI US IMI/Telecommunication | |
| Services 25/50 | 17.00 |
| Telecommunication Funds Average3 | 18.89 |
| |
| Vanguard Utilities Index Fund | 20.58% |
| Vanguard Utilities ETF | |
| Market Price | 20.55 |
| Net Asset Value | 20.55 |
| MSCI US IMI/Utilities 25/50 | 20.74 |
| Utility Funds Average3 | 22.89 |
| |
| MSCI US IMI/2500 | 24.94% |
1 Admiral Shares carry lower expenses and are available to investors who meet certain account-balance requirements.2 The Vanguard ETF ® Shares shown are traded on the NYSE Arca exchange and are available only through brokers. The table provides ETF returns based on both the NYSE Arca market price and the net asset valuefor a share. U.S. Pat. No. 6,879,964; 7,337,138; 7,720,749; 7,925,573; 8,090,646; and 8,417,623.3 Derived from data provided by Lipper, a Thomson Reuters Company.For the ETF Shares, the market price is determined by the midpoint of the bid-offer spread as of the closing time of the New York Stock Exchange (generally 4 p.m., Eastern time). The net asset value is alsodetermined as of the NYSE closing time. For more information about how the ETF Shares’ market prices have compared with their net asset value, visit vanguard.com, select your ETF, and then select the Price andPerformance tab. The ETF premium/discount analysis there shows the percentages of days on which the ETF Shares’ market price was above or below the NAV.Note: MSCI US IMI/2500 is the MSCI ® US Investable Market 2500 Index.1

Chairman’s Letter
Dear Shareholder,
The Vanguard U.S. Sector Index Funds notched another strong fiscal year, as a broad-based rally lifted the stocks of all industry sectors.
For the 12 months ended August 31, 2014, returns for the ten funds in this report ranged from about 32% to about 17%.
Each fund tightly tracked its target index. Five surpassed the average return of their industry peer group.
If you hold fund shares in a taxable account, you may wish to review the after-tax returns that appear later in this report.
Stocks cleared hurdles en route to new highs
Despite an assortment of challenges, the broad U.S. stock market returned about 25% for the 12 months. U.S. stocks registered positive results in all but two months, and a late-July swoon was followed by an August flurry of record highs.
Investors applauded mostly solid corporate earnings, generally upbeat economic news, and the Federal Reserve’s continued accommodative policies. Still, turmoil in the Middle East and Ukraine, economic worries in Europe and China, and uncertainty about the Fed’s next moves pressured stocks at different times.
International stocks returned about 18%. Emerging markets, after sliding earlier in the period, rebounded to lead the way. The developed markets of the Pacific region and Europe trailed but still notched double-digit returns.
Defying analysts’ expectations, bond prices rose over the year
The broad U.S. taxable bond market returned 5.66%, rallying from the drubbing it took a year ago when investors fretted over the future of the Fed’s bond-buying program.
The Fed began reducing its purchases in January and has consistently cut them further since, with the goal of ending the program in October. Interest rates have not risen as forecast, however. The yield of the 10-year U.S. Treasury note ended August at 2.34%, down from 2.76% a year earlier. (Bond prices and yields move in opposite directions.)
Municipal bonds returned 10.14% as investors searched for tax-exempt income amid a limited supply of new issues. International bond markets (as measured by the Barclays Global Aggregate Index ex USD) returned 6.52%.
| | | |
| Market Barometer | | | |
| | | Average Annual Total Returns |
| | Periods Ended August 31, 2014 |
| | One Year | Three Years | Five Years |
| Stocks | | | |
| Russell 1000 Index (Large-caps) | 25.36% | 20.80% | 17.24% |
| Russell 2000 Index (Small-caps) | 17.68 | 19.00 | 17.03 |
| Russell 3000 Index (Broad U.S. market) | 24.74 | 20.65 | 17.22 |
| FTSE All-World Index ex USA (International) | 18.04 | 9.48 | 8.44 |
| |
| Bonds | | | |
| Barclays U.S. Aggregate Bond Index (Broad taxable market) | 5.66% | 2.91% | 4.48% |
| Barclays Municipal Bond Index (Broad tax-exempt market) | 10.14 | 4.88 | 5.39 |
| Citigroup Three-Month U.S. Treasury Bill Index | 0.04 | 0.04 | 0.07 |
| |
| CPI | | | |
| Consumer Price Index | 1.70% | 1.64% | 1.96% |
2
Following such a strong advance for bonds, it’s worth remembering that the current low yields imply lower future returns: As yields drop, the scope for further declines—and increases in prices—diminishes.
The Fed’s target of 0%–0.25% for short-term interest rates continued to restrict returns for money market funds and savings accounts.
Each of the ten industry sectors produced double-digit returns
Every sector played a role in the stock market’s advance over the 12 months. Four sectors—information technology, health care, materials, and industrials—exceeded the broad U.S. market’s return. Even the sectors with smaller gains posted impressive results.
Two typically growth-oriented industries—information technology and health care—stood out most, returning more than 30% each. Technology stocks benefited from investors’ continuing shift toward mobile and cloud computing. Makers of hardware—computers, tablets, and smartphones—and companies that specialize in computer storage and peripherals contributed most to the tech fund’s return.
In health care, nearly every segment performed well, with pharmaceutical and biotechnology companies contributing most. Mergers and acquisitions, new drug development, opportunities overseas, and the aging population’s need for increased care helped. Health care providers and medical equipment and supply firms also excelled.
The materials and industrial sectors produced strong results, too, although their performance waned in the period’s second half. Chemical manufacturers and metals and mining firms led in materials, boosted by increased sales and streamlining efforts. In industrials, conglomerates benefited from stronger demand for aerospace and defense equipment and construction machinery as the U.S. manufacturing sector showed signs of improvement.
The six remaining sectors—energy, financials, consumer discretionary, utilities, consumer staples, and telecommunication services—trailed the broad U.S. market but still delivered solid returns.
In energy, integrated oil and gas companies and those that focus on exploration and production were key contributors as global demand for oil remained steady.
Financial stocks also climbed notably. The economic recovery and strong investment environment supported virtually all types of large financial companies, including real estate investment trusts (REITs), banks, and asset managers.
A note on expense ratios
The Fund Profiles that follow this letter display fund expense ratios from the most recent prospectus. These figures include the funds’ actual operating expenses. The figures for the Financials Index Fund also include “acquired fund fees and expenses,” which result from the fund’s holdings in business development companies (BDCs).
Although the Securities and Exchange Commission requires that BDC costs be included in a fund’s expense ratio, these fees are not incurred by the fund. They have no impact on a fund’s total return or on its tracking error relative to an index. A footnote to the Expense Ratio entry in the Fund Profile reports the fund’s actual expenses for the period, a more relevant tally of operating costs incurred by shareholders.
| | | |
| Expense Ratios | | | |
| Your Fund Compared With Its Peer Group | | | |
| |
| | Admiral | ETF | Peer Group |
| | Shares | Shares | Average |
| Consumer Discretionary Index Fund | 0.14% | 0.14% | 1.04% |
| Consumer Staples Index Fund | 0.14 | 0.14 | 1.14 |
| Energy Index Fund | 0.14 | 0.14 | 1.32 |
| Financials Index Fund | 0.19 | 0.19 | 1.29 |
| Health Care Index Fund | 0.14 | 0.14 | 1.30 |
| Industrials Index Fund | 0.14 | 0.14 | 0.99 |
| Information Technology Index Fund | 0.14 | 0.14 | 1.47 |
| Materials Index Fund | 0.14 | 0.14 | 0.88 |
| Telecommunication Services Index Fund | 0.14 | 0.14 | 1.30 |
| Utilities Index Fund | 0.14 | 0.14 | 1.13 |
The fund expense ratios shown are from the prospectus dated December 23, 2013, and represent estimated costs for the current fiscalyear. For the fiscal year ended August 31, 2014, the fund expense ratios were: for the Consumer Discretionary Index Fund, 0.12% forAdmiral Shares and 0.12% for ETF Shares; for the Consumer Staples Index Fund, 0.12% for Admiral Shares and 0.12% for ETF Shares;for the Energy Index Fund, 0.12% for Admiral Shares and 0.12% for ETF Shares; for the Financials Index Fund, 0.12% for Admiral Sharesand 0.12% for ETF Shares; for the Health Care Index Fund, 0.12% for Admiral Shares and 0.12% for ETF Shares; for the Industrials IndexFund, 0.12% for Admiral Shares and 0.12% for ETF Shares; for the Information Technology Index Fund, 0.12% for Admiral Shares and0.12% for ETF Shares; for the Materials Index Fund, 0.12% for Admiral Shares and 0.12% for ETF Shares; for the TelecommunicationServices Index Fund, 0.12% for Admiral Shares and 0.12% for ETF Shares; for the Utilities Index Fund, 0.12% for Admiral Shares and0.12% for ETF Shares. Peer-group expense ratios are derived from data provided by Lipper, a Thomson Reuters Company, and captureinformation through year-end 2013.Peer groups are: for the Consumer Discretionary Index Fund, Consumer Services Funds; for the Consumer Staples Index Fund, ConsumerGoods Funds; for the Energy Index Fund, Natural Resources Funds; for the Financials Index Fund, Financial Services Funds; for the HealthCare Index Fund, Health/Biotechnology Funds; for the Industrials Index Fund, Industrials Funds; for the Information Technology Index Fund,Science and Technology Funds; for the Materials Index Fund, Basic Materials Funds; for the Telecommunication Services Index Fund,Telecommunication Funds; for the Utilities Index Fund, Utility Funds.3
| |
| Total Returns | |
| Ten Years Ended August 31, 2014 | |
| | Average |
| | Annual Return |
| Consumer Discretionary Index Fund Admiral Shares (Returns since inception: 7/14/2005) | 9.36% |
| Spliced US IMI/Consumer Discretionary 25/50 | 9.51 |
| Consumer Services Funds Average | 8.06 |
| Consumer Services Funds Average: Derived from data provided by Lipper, a Thomson Reuters Company. | |
| |
| Consumer Staples Index Fund Admiral Shares | 10.68% |
| Spliced US IMI/Consumer Staples 25/50 | 10.74 |
| Consumer Goods Funds Average | 9.91 |
| Consumer Goods Funds Average: Derived from data provided by Lipper, a Thomson Reuters Company. | |
| |
| Energy Index Fund Admiral Shares (Returns since inception: 10/7/2004) | 12.15% |
| Spliced US IMI/Energy 25/50 | 11.99 |
| Natural Resources Funds Average | 10.95 |
| Natural Resources Funds Average: Derived from data provided by Lipper, a Thomson Reuters Company. | |
| |
| Financials Index Fund Admiral Shares | 1.60% |
| Spliced US IMI/Financials 25/50 | 1.68 |
| Financial Services Funds Average | 1.81 |
| Financial Services Funds Average: Derived from data provided by Lipper, a Thomson Reuters Company. | |
| |
| Health Care Index Fund Admiral Shares | 10.88% |
| Spliced US IMI/Health Care 25/50 | 11.09 |
| Health/Biotechnology Funds Average | 12.43 |
| Health/Biotechnology Funds Average: Derived from data provided by Lipper, a Thomson Reuters Company. | |
| |
| Industrials Index Fund Admiral Shares (Returns since inception: 5/8/2006) | 7.17% |
| Spliced US IMI/Industrials 25/50 | 7.33 |
| Industrials Funds Average | 5.99 |
| Industrials Funds Average: Derived from data provided by Lipper, a Thomson Reuters Company. | |
| |
| Information Technology Index Fund Admiral Shares | 10.39% |
| Spliced US IMI/Information Technology 25/50 | 10.60 |
| Science and Technology Funds Average | 10.16 |
| Science and Technology Funds Average: Derived from data provided by Lipper, a Thomson Reuters Company. | |
| |
| Materials Index Fund Admiral Shares | 10.19% |
| Spliced US IMI/Materials 25/50 | 10.33 |
| Basic Materials Funds Average | 7.95 |
| Basic Materials Funds Average: Derived from data provided by Lipper, a Thomson Reuters Company. | |
| |
| Telecommunication Services Index Fund Admiral Shares (Returns since inception: 3/11/2005) | 8.57% |
| Spliced US IMI/Telecommunication Services 25/50 | 7.92 |
| Telecommunication Funds Average | 5.58 |
| Telecommunication Funds Average: Derived from data provided by Lipper, a Thomson Reuters Company. | |
| |
| Utilities Index Fund Admiral Shares | 9.77 |
| Spliced US IMI/Utilities 25/50 | 9.99 |
| Utility Funds Average | 9.52 |
Utility Funds Average: Derived from data provided by Lipper, a Thomson Reuters Company.For a benchmark description, see the Glossary.The figures shown represent past performance, which is not a guarantee of future results. (Current performance
may be lower or higher than the performance data cited. For performance data current to the most recent month-
end, visit our website at vanguard.com/performance.) Note, too, that both investment returns and principal value
can fluctuate widely, so an investor’s shares, when sold, could be worth more or less than their original cost.
Increased confidence in the recovery also helped the consumer discretionary sector, which tends to be highly cyclical and economically sensitive. Media stocks, specialty and internet retailers, hotels, and restaurants all profited as consumers spent more.
Utilities and consumer staples, often viewed as defensive holdings when times are uncertain, can trail the broad market during major upswings. But their performance was not as far behind as you might expect. Utility stocks returned almost 21%, thanks in part to higher natural gas prices earlier in the period. The sector attracted investors looking for dividends at a time of low interest rates. Consumer staples, led by pharmacy chains and soft drink manufacturers, returned about 17%.
Telecom services likewise returned about 17%, led by the largest cellular network providers.
High costs don’t equal strong fund performance
The adage “You get what you pay for” doesn’t apply to mutual funds. In fact, the reverse is true: Research suggests that higher costs are consistent with weaker returns. (See, for example, Shopping for Alpha: You Get What You Don’t Pay For at vanguard.com/research.)
Wouldn’t paying the highest fees allow you to purchase the services of the greatest talents, and therefore get you the best returns? As it turns out, the data don’t support that argument. The explanation is simple: Every dollar paid for management fees is a dollar less earning potential return. Keeping expenses down can help narrow the gap between what the markets return and what investors actually earn.
4
That’s why Vanguard seeks to minimize costs for all our funds. Indexing, of course, is the purest form of low-cost investing. And we negotiate low fees for our actively managed funds, which are run by world-class advisors. It’s a strategy that reflects decades of experience and research, boiled down to one tenet: The less you pay, the more you keep.
As always, thank you for investing Vanguard.
Sincerely,

F. William McNabb III
Chairman and Chief Executive Officer
September 16, 2014
| | | | |
| Your Fund’s Performance at a Glance | | | | |
| August 31, 2013–August 31, 2014 | | | | |
| | | | Distributions Per Share |
| | Starting | Ending | Income | Capital |
| | Share Price | Share Price | Dividends | Gains |
| Consumer Discretionary Index Fund | | | | |
| Admiral Shares | $48.34 | $57.87 | $0.479 | $0.000 |
| ETF Shares | 93.38 | 111.79 | 0.913 | 0.000 |
| Consumer Staples Index Fund | | | | |
| Admiral Shares | $50.28 | $57.74 | $1.200 | $0.000 |
| ETF Shares | 101.97 | 117.12 | 2.428 | 0.000 |
| Energy Index Fund | | | | |
| Admiral Shares | $58.18 | $71.06 | $1.099 | $0.000 |
| ETF Shares | 116.47 | 142.26 | 2.194 | 0.000 |
| Financials Index Fund | | | | |
| Admiral Shares | $19.95 | $23.72 | $0.426 | $0.000 |
| ETF Shares | 39.80 | 47.32 | 0.850 | 0.000 |
| Health Care Index Fund | | | | |
| Admiral Shares | $44.99 | $58.61 | $0.569 | $0.000 |
| ETF Shares | 89.94 | 117.17 | 1.136 | 0.000 |
| Industrials Index Fund | | | | |
| Admiral Shares | $43.24 | $53.40 | $0.542 | $0.000 |
| ETF Shares | 84.17 | 103.95 | 1.060 | 0.000 |
| Information Technology Index Fund | | | | |
| Admiral Shares | $39.75 | $51.93 | $0.479 | $0.000 |
| ETF Shares | 77.63 | 101.41 | 0.944 | 0.000 |
| Materials Index Fund | | | | |
| Admiral Shares | $46.34 | $57.84 | $0.964 | $0.000 |
| ETF Shares | 90.94 | 113.50 | 1.899 | 0.000 |
| Telecommunication Services Index Fund | | | | |
| Admiral Shares | $40.02 | $45.07 | $1.653 | $0.000 |
| ETF Shares | 78.54 | 88.44 | 3.243 | 0.000 |
| Utilities Index Fund | | | | |
| Admiral Shares | $40.80 | $47.47 | $1.555 | $0.000 |
| ETF Shares | 81.32 | 94.61 | 3.098 | 0.000 |
5
Consumer Discretionary Index Fund
Fund Profile
As of August 31, 2014
| | |
| Share-Class Characteristics | |
| | Admiral | ETF |
| | Shares | Shares |
| Ticker Symbol | VCDAX | VCR |
| Expense Ratio1 | 0.14% | 0.14% |
| 30-Day SEC Yield | 1.20% | 1.20% |
| | | |
| Portfolio Characteristics | | |
| | | MSCI | |
| | | US IMI/ | |
| | | Consumer | MSCI |
| | | Discretionary | US IMI/ |
| | Fund | 25/50 | 2500 |
| Number of Stocks | 388 | 387 | 2,499 |
| Median Market Cap $32.4B | $32.4B | $48.7B |
| Price/Earnings Ratio | 23.2x | 23.2x | 20.7x |
| Price/Book Ratio | 4.2x | 4.2x | 2.7x |
| Return on Equity | 20.0% | 20.0% | 18.0% |
| Earnings Growth Rate 14.4% | 14.4% | 15.2% |
| Dividend Yield | 1.3% | 1.3% | 1.9% |
| Foreign Holdings | 0.0% | 0.0% | 0.0% |
| Turnover Rate | 7% | — | — |
| Short-Term Reserves | 0.0% | — | — |
| | |
| Volatility Measures | | |
| | MSCI US | |
| | IMI/Consumer | |
| | Discretionary | MSCI US |
| | 25/50 | IMI/2500 |
| R-Squared | 1.00 | 0.90 |
| Beta | 1.00 | 1.09 |
| These measures show the degree and timing of the fund’s fluctuations compared with the indexes over 36 months. |
|
| |
| Subindustry Diversification | |
| (% of equity exposure) | |
| |
| Advertising | 1.2% |
| Apparel Retail | 4.6 |
| Apparel, Accessories & Luxury Goods | 4.2 |
| Auto Parts & Equipment | 4.4 |
| Automobile Manufacturers | 4.9 |
| Automotive Retail | 2.7 |
| Broadcasting | 2.7 |
| Cable & Satellite | 10.9 |
| Casinos & Gaming | 2.4 |
| Department Stores | 1.9 |
| Footwear | 2.4 |
| General Merchandise Stores | 2.9 |
| Home Improvement Retail | 6.6 |
| Homebuilding | 1.6 |
| Homefurnishing Retail | 1.0 |
| Hotels, Resorts & Cruise Lines | 3.2 |
| Internet Retail | 9.4 |
| Leisure Products | 1.2 |
| Movies & Entertainment | 11.9 |
| Publishing | 1.0 |
| Restaurants | 9.3 |
| Specialty Stores | 2.8 |
| Other Consumer Discretionary | 6.8 |
| | |
| Ten Largest Holdings (% of total net assets) |
| |
| Walt Disney Co. | Movies & Entertainment | 5.3% |
| Comcast Corp. | Cable & Satellite | 5.1 |
| Amazon.com Inc. | Internet Retail | 4.8 |
| Home Depot Inc. | Home Improvement Retail | 4.6 |
| McDonald’s Corp. | Restaurants | 3.3 |
| Time Warner Inc. | Movies & Entertainment | 2.4 |
| Twenty-First | | |
| Century Fox Inc. | Movies & Entertainment | 2.4 |
| Priceline Group Inc. | Internet Retail | 2.3 |
| Ford Motor Co. | Automobile Manufacturers | 2.3 |
| Starbucks Corp. | Restaurants | 2.1 |
| Top Ten | | 34.6% |
| The holdings listed exclude any temporary cash investments and equity index products. |
|
1 The expense ratios shown are from the prospectus dated December 23, 2013, and represent estimated costs for the current fiscal year. For the fiscal year ended August 31, 2014, the expense ratios were 0.12% for
Admiral Shares and 0.12% for ETF Shares.
6
Consumer Discretionary Index Fund
Performance Summary
All of the returns in this report represent past performance, which is not a guarantee of future results that may be achieved by the fund. (Current performance may be lower or higher than the performance data cited. For performance data current to the most recent month-end, visit our website at vanguard.com/performance.) Note, too, that both investment returns and principal value can fluctuate widely, so an investor’s shares, when sold, could be worth more or less than their original cost. The returns shown do not reflect taxes that a shareholder would pay on fund distributions or on the sale of fund shares.
Cumulative Performance: August 31, 2004–August 31, 2014
Initial Investment of $10,000
| | | | |
| | | Average Annual Total Returns | Final Value |
| | Periods Ended August 31, 2014 | of a $10,000 |
| | One Year | Five Years | Ten Years | Investment |
| Consumer Discretionary Index Fund | | | | |
| ETF Shares Net Asset Value | 20.75% | 23.38% | 10.26% | $26,555 |
| Consumer Discretionary Index Fund | | | | |
| ETF Shares Market Price | 20.68 | 23.37 | 10.26 | 26,548 |
| Spliced US IMI/Consumer Discretionary 25/50 | 20.85 | 23.55 | 10.40 | 26,890 |
| Consumer Services Funds Average | 18.00 | 19.97 | 9.12 | 23,935 |
| MSCI US IMI/2500 | 24.94 | 17.33 | 9.05 | 23,791 |
For a benchmark description, see the Glossary.
Consumer Services Funds Average: Derived from data provided by Lipper, a Thomson Reuters Company. |
|
| | | | |
| | | | Since | Final Value |
| | | | Inception | of a $100,000 |
| | One Year | Five Years | (7/14/2005) | Investment |
| Consumer Discretionary Index Fund Admiral Shares | 20.77% | 23.38% | 9.36% | $226,317 |
| Spliced US IMI/Consumer Discretionary 25/50 | 20.85 | 23.55 | 9.51 | 229,238 |
| MSCI US IMI/2500 | 24.94 | 17.33 | 8.25 | 206,195 |
| “Since Inception” performance is calculated from the Admiral Shares’ inception date for both the fund and its comparative standards. |
See Financial Highlights for dividend and capital gains information.
7
Consumer Discretionary Index Fund
Fiscal-Year Total Returns (%): August 31, 2004–August 31, 2014
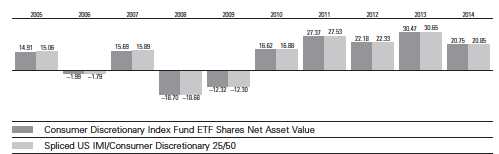
For a benchmark description, see the Glossary.
| | | |
| Cumulative Returns: ETF Shares, August 31, 2004–August 31, 2014 | | |
| |
| | One Year | Five Years | Ten Years |
| Consumer Discretionary Index Fund ETF Shares Market Price | 20.68% | 185.77% | 165.48% |
| Consumer Discretionary Index Fund ETF Shares Net Asset Value | 20.75 | 185.91 | 165.55 |
| Spliced US IMI/Consumer Discretionary 25/50 | 20.85 | 187.93 | 168.90 |
Average Annual Total Returns: Periods Ended June 30, 2014
This table presents total returns through the latest calendar quarter—rather than through the end of the fiscal
period. Securities and Exchange Commission rules require that we provide this information.
| | | | |
| | Inception Date | One Year | Five Years | Ten Years |
| ETF Shares | 1/26/2004 | | | |
| Market Price | | 20.99% | 26.17% | 9.47% |
| Net Asset Value | | 21.07 | 26.19 | 9.48 |
| Admiral Shares | 7/14/2005 | 21.10 | 26.19 | 9.261 |
1 Return since inception.
See Financial Highlights for dividend and capital gains information.
Consumer Discretionary Index Fund
Financial Statements
Statement of Net Assets
As of August 31, 2014
The fund reports a complete list of its holdings in regulatory filings four times in each fiscal year, at the quarter-ends. For the second and fourth fiscal quarters, the lists appear in the fund’s semiannual and annual reports to shareholders. For the first and third fiscal quarters, the fund files the lists with the Securities and Exchange Commission on Form N-Q. Shareholders can look up the fund’s Forms N-Q on the SEC’s website at sec.gov. Forms N-Q may also be reviewed and copied at the SEC’s Public Reference Room (see the back cover of this report for further information).
| | | |
| | | | Market |
| | | | Value• |
| | | Shares | ($000) |
| Common Stocks (99.9%) | | |
| Auto Components (4.6%) | | |
| | Johnson Controls Inc. | 328,702 | 16,044 |
| | Delphi Automotive plc | 150,164 | 10,448 |
| | BorgWarner Inc. | 113,147 | 7,037 |
| * | TRW Automotive Holdings | | |
| | Corp. | 54,715 | 5,268 |
| | Autoliv Inc. | 46,437 | 4,815 |
| | Lear Corp. | 38,249 | 3,868 |
| | Goodyear Tire & Rubber Co. 122,411 | 3,179 |
| * | Visteon Corp. | 22,746 | 2,302 |
| | Gentex Corp. | 71,766 | 2,121 |
| * | Tenneco Inc. | 29,800 | 1,910 |
| | Dana Holding Corp. | 77,639 | 1,803 |
| | Cooper Tire & Rubber Co. | 30,253 | 933 |
| * | Gentherm Inc. | 16,211 | 792 |
| * | Dorman Products Inc. | 15,332 | 687 |
| * | American Axle & | | |
| | Manufacturing Holdings | | |
| | Inc. | 33,622 | 609 |
| | Drew Industries Inc. | 11,180 | 496 |
| | Standard Motor Products | | |
| | Inc. | 10,107 | 380 |
| * | Tower International Inc. | 10,193 | 342 |
| * | Modine Manufacturing Co. | 22,595 | 321 |
| * | Federal-Mogul Holdings | | |
| | Corp. | 14,718 | 251 |
| | Superior Industries | | |
| | International Inc. | 11,043 | 215 |
| * | Stoneridge Inc. | 12,697 | 158 |
| * | Fox Factory Holding Corp. | 9,113 | 139 |
| | | | 64,118 |
| Automobiles (5.4%) | | |
| | Ford Motor Co. | 1,825,602 | 31,784 |
| | General Motors Co. | 634,871 | 22,093 |
| * | Tesla Motors Inc. | 42,984 | 11,593 |
| | Harley-Davidson Inc. | 107,988 | 6,864 |
| | Thor Industries Inc. | 23,705 | 1,273 |
| * | Winnebago Industries Inc. | 13,530 | 335 |
| | | | 73,942 |
| Distributors (0.9%) | | |
| | Genuine Parts Co. | 75,750 | 6,646 |
| * | LKQ Corp. | 148,636 | 4,221 |
| | Pool Corp. | 22,175 | 1,257 |
| | Core-Mark Holding Co. Inc. | 11,106 | 535 |
| | Weyco Group Inc. | 3,112 | 84 |
| | | | 12,743 |
| Diversified Consumer Services (1.3%) | |
| | H&R Block Inc. | 135,779 | 4,553 |
| | Service Corp. International | 104,747 | 2,322 |
| | Graham Holdings Co. | | |
| | Class B | 2,319 | 1,667 |
| * | Apollo Education Group Inc. | 49,903 | 1,386 |
| | DeVry Education Group Inc. | 28,235 | 1,212 |
| | Sotheby’s | 28,974 | 1,182 |
| * | Grand Canyon Education Inc. | 21,851 | 945 |
| | | |
| | | | Market |
| | | | Value• |
| | | Shares | ($000) |
| | Matthews International Corp. | | |
| | Class A | 14,599 | 674 |
| * | Bright Horizons Family | | |
| | Solutions Inc. | 16,269 | 662 |
| | Regis Corp. | 26,712 | 404 |
| * | Ascent Capital Group Inc. | | |
| | Class A | 6,043 | 377 |
| ^ | Weight Watchers | | |
| | International Inc. | 13,685 | 338 |
| | Capella Education Co. | 5,189 | 338 |
| * | LifeLock Inc. | 22,410 | 332 |
| * | Strayer Education Inc. | 5,394 | 327 |
| * | K12 Inc. | 17,146 | 323 |
| * | Steiner Leisure Ltd. | 7,058 | 300 |
| * | American Public Education | | |
| | Inc. | 8,691 | 264 |
| * | Chegg Inc. | 26,736 | 185 |
| * | Career Education Corp. | 30,161 | 165 |
| | Carriage Services Inc. | | |
| | Class A | 8,094 | 151 |
| | Universal Technical Institute | | |
| | Inc. | 10,320 | 115 |
| * | Bridgepoint Education Inc. | 7,560 | 95 |
| *,^ | ITT Educational Services Inc. | 8,305 | 70 |
| | | | 18,387 |
| Hotels, Restaurants & Leisure (15.2%) | |
| | McDonald’s Corp. | 489,150 | 45,843 |
| | Starbucks Corp. | 372,588 | 28,991 |
| | Yum! Brands Inc. | 218,448 | 15,822 |
| | Las Vegas Sands Corp. | 199,758 | 13,286 |
| * | Chipotle Mexican Grill Inc. | | |
| | Class A | 15,383 | 10,440 |
| | Starwood Hotels & | | |
| | Resorts Worldwide Inc. | 95,099 | 8,040 |
| | Marriott International Inc. | | |
| | Class A | 115,831 | 8,039 |
| | Wynn Resorts Ltd. | 40,111 | 7,737 |
| | Carnival Corp. | 190,659 | 7,222 |
| | Royal Caribbean Cruises Ltd. | 82,532 | 5,262 |
| | Wyndham Worldwide Corp. | 63,080 | 5,106 |
| * | MGM Resorts International | 193,352 | 4,731 |
| * | Hilton Worldwide Holdings | | |
| | Inc. | 145,403 | 3,682 |
| | Darden Restaurants Inc. | 65,351 | 3,092 |
| | Dunkin’ Brands Group Inc. | 52,204 | 2,273 |
| | Domino’s Pizza Inc. | 27,475 | 2,073 |
| | International Game | | |
| | Technology | 121,421 | 2,047 |
| * | Panera Bread Co. Class A | 12,916 | 1,937 |
| | Brinker International Inc. | 32,136 | 1,571 |
| * | Bally Technologies Inc. | 19,271 | 1,528 |
| * | Norwegian Cruise Line | | |
| | Holdings Ltd. | 45,838 | 1,527 |
| | Vail Resorts Inc. | 17,837 | 1,418 |
| * | Buffalo Wild Wings Inc. | 9,400 | 1,389 |
| * | Hyatt Hotels Corp. Class A | 20,877 | 1,275 |
| | Six Flags Entertainment | | |
| | Corp. | 32,724 | 1,194 |
| | | |
| | | | Market |
| | | | Value• |
| | | Shares | ($000) |
| | Jack in the Box Inc. | 19,748 | 1,174 |
| | Burger King Worldwide Inc. | 35,129 | 1,126 |
| | Wendy’s Co. | 134,100 | 1,093 |
| | Cheesecake Factory Inc. | 23,910 | 1,075 |
| | Cracker Barrel Old Country | | |
| | Store Inc. | 9,366 | 940 |
| * | Life Time Fitness Inc. | 19,628 | 905 |
| | Aramark | 34,221 | 886 |
| | Choice Hotels International | | |
| | Inc. | 16,108 | 872 |
| * | Marriott Vacations Worldwide | |
| | Corp. | 14,633 | 872 |
| | Texas Roadhouse Inc. | | |
| | Class A | 32,790 | 872 |
| * | Pinnacle Entertainment Inc. | 29,613 | 740 |
| | Extended Stay America Inc. | 30,265 | 722 |
| | DineEquity Inc. | 8,510 | 708 |
| | Churchill Downs Inc. | 6,634 | 625 |
| * | Bloomin’ Brands Inc. | 37,310 | 621 |
| * | Fiesta Restaurant Group Inc. | 12,590 | 618 |
| | Papa John’s International Inc. 15,118 | 599 |
| * | Belmond Ltd. Class A | 46,483 | 594 |
| * | Sonic Corp. | 26,518 | 560 |
| * | Krispy Kreme Doughnuts Inc. | 32,533 | 553 |
| | Bob Evans Farms Inc. | 12,213 | 530 |
| | SeaWorld Entertainment Inc. | 24,798 | 516 |
| * | Popeyes Louisiana Kitchen | | |
| | Inc. | 11,971 | 480 |
| * | BJ’s Restaurants Inc. | 12,220 | 455 |
| | International Speedway Corp. | |
| | Class A | 13,152 | 440 |
| | Interval Leisure Group Inc. | 19,868 | 430 |
| * | Diamond Resorts | | |
| | International Inc. | 16,744 | 419 |
| * | Multimedia Games Holding | | |
| | Co. Inc. | 13,976 | 389 |
| * | Caesars Entertainment Corp. | 28,619 | 385 |
| * | Boyd Gaming Corp. | 35,904 | 382 |
| * | Penn National Gaming Inc. | 33,335 | 376 |
| * | Red Robin Gourmet Burgers | | |
| | Inc. | 6,777 | 360 |
| * | Denny’s Corp. | 43,841 | 299 |
| | ClubCorp Holdings Inc. | 15,978 | 297 |
| * | Caesars Acquisition Co. | | |
| | Class A | 23,428 | 255 |
| * | Del Frisco’s Restaurant | | |
| | Group Inc. | 11,249 | 249 |
| * | Scientific Games Corp. | | |
| | Class A | 23,992 | 244 |
| * | Biglari Holdings Inc. | 655 | 235 |
| * | Chuy’s Holdings Inc. | 7,770 | 204 |
| | Ruth’s Hospitality Group Inc. | 17,167 | 191 |
| * | Ruby Tuesday Inc. | 30,387 | 188 |
| * | Noodles & Co. Class A | 9,104 | 178 |
| | Marcus Corp. | 7,544 | 137 |
| * | Bravo Brio Restaurant Group | | |
| | Inc. | 8,600 | 124 |
| | Speedway Motorsports Inc. | 6,371 | 119 |
9
Consumer Discretionary Index Fund
| | | |
| | | | Market |
| | | | Value• |
| | | Shares | ($000) |
| * | Potbelly Corp. | 7,187 | 87 |
| * | Isle of Capri Casinos Inc. | 10,391 | 86 |
| | Einstein Noah Restaurant | | |
| | Group Inc. | 5,077 | 72 |
| * | Ignite Restaurant Group Inc. | 4,596 | 34 |
| * | Biglari Holdings Inc Rights | | |
| | Exp. 09/12/2014 | 641 | 14 |
| | | | 209,855 |
| Household Durables (4.1%) | | |
| | Whirlpool Corp. | 38,515 | 5,894 |
| | Newell Rubbermaid Inc. | 137,420 | 4,606 |
| * | Mohawk Industries Inc. | 30,689 | 4,481 |
| | Harman International | | |
| | Industries Inc. | 33,744 | 3,883 |
| * | Jarden Corp. | 60,560 | 3,621 |
| | Lennar Corp. Class A | 85,436 | 3,347 |
| | PulteGroup Inc. | 169,101 | 3,250 |
| | DR Horton Inc. | 144,914 | 3,142 |
| | Garmin Ltd. | 57,571 | 3,128 |
| * | Toll Brothers Inc. | 83,594 | 2,975 |
| * | NVR Inc. | 2,094 | 2,457 |
| | Leggett & Platt Inc. | 68,445 | 2,402 |
| | Tupperware Brands Corp. | 24,999 | 1,831 |
| * | Tempur Sealy International | | |
| | Inc. | 29,863 | 1,748 |
| * | TRI Pointe Homes Inc. | 71,520 | 1,059 |
| | Ryland Group Inc. | 22,964 | 852 |
| * | Helen of Troy Ltd. | 14,039 | 817 |
| * | Meritage Homes Corp. | 18,186 | 751 |
| | KB Home | 40,422 | 717 |
| * | Standard Pacific Corp. | 75,909 | 635 |
| | MDC Holdings Inc. | 19,566 | 568 |
| | La-Z-Boy Inc. | 25,934 | 553 |
| * | iRobot Corp. | 13,470 | 437 |
| * | Universal Electronics Inc. | 7,549 | 413 |
| | Ethan Allen Interiors Inc. | 13,045 | 329 |
| * | Taylor Morrison Home | | |
| | Corp. Class A | 16,133 | 320 |
| * | Libbey Inc. | 10,588 | 292 |
| * | Cavco Industries Inc. | 3,980 | 284 |
| * | M/I Homes Inc. | 11,347 | 258 |
| * | Hovnanian Enterprises Inc. | | |
| | Class A | 55,427 | 233 |
| * | Beazer Homes USA Inc. | 11,881 | 224 |
| * | William Lyon Homes | | |
| | Class A | 8,235 | 210 |
| * | WCI Communities Inc. | 8,963 | 179 |
| | NACCO Industries Inc. | | |
| | Class A | 2,326 | 121 |
| | CSS Industries Inc. | 4,026 | 102 |
| * | LGI Homes Inc. | 5,119 | 98 |
| | | | 56,217 |
| Internet & Catalog Retail (10.0%) | |
| * | Amazon.com Inc. | 193,555 | 65,623 |
| * | Priceline Group Inc. | 25,951 | 32,291 |
| * | Netflix Inc. | 28,190 | 13,465 |
| * | Liberty Interactive Corp. | | |
| | Class A | 228,555 | 6,747 |
| * | TripAdvisor Inc. | 57,869 | 5,734 |
| | Expedia Inc. | 52,144 | 4,479 |
| * | Groupon Inc. Class A | 218,243 | 1,484 |
| * | HomeAway Inc. | 43,303 | 1,438 |
| * | Liberty Ventures Class A | 35,002 | 1,333 |
| * | Liberty TripAdvisor | | |
| | Holdings Inc. Class A | 35,002 | 1,252 |
| | HSN Inc. | 16,990 | 1,029 |
| * | Shutterfly Inc. | 18,839 | 961 |
| * | Orbitz Worldwide Inc. | 43,469 | 356 |
| * | FTD Cos. Inc. | 9,196 | 305 |
| | | |
| | | | Market |
| | | | Value• |
| | | Shares | ($000) |
| * | Lands’ End Inc. | 8,762 | 302 |
| * | RetailMeNot Inc. | 13,700 | 255 |
| | Nutrisystem Inc. | 12,476 | 204 |
| * | Blue Nile Inc. | 6,472 | 184 |
| * | Overstock.com Inc. | 8,531 | 151 |
| | PetMed Express Inc. | 9,548 | 134 |
| * | 1-800-Flowers.com Inc. | | |
| | Class A | 12,164 | 63 |
| | | | 137,790 |
| Leisure Products (1.2%) | | |
| | Mattel Inc. | 167,735 | 5,785 |
| | Polaris Industries Inc. | 30,991 | 4,505 |
| | Hasbro Inc. | 57,812 | 3,044 |
| | Brunswick Corp. | 45,647 | 1,963 |
| | Sturm Ruger & Co. Inc. | 9,508 | 479 |
| * | Smith & Wesson Holding | | |
| | Corp. | 27,009 | 299 |
| | Callaway Golf Co. | 38,734 | 295 |
| | Arctic Cat Inc. | 6,796 | 252 |
| * | LeapFrog Enterprises Inc. | 31,077 | 201 |
| * | Black Diamond Inc. | 10,941 | 93 |
| | | | 16,916 |
| Media (27.6%) | | |
| | Walt Disney Co. | 814,059 | 73,168 |
| | Comcast Corp. Class A | 981,669 | 53,727 |
| | Time Warner Inc. | 436,463 | 33,621 |
| | Twenty-First Century Fox | | |
| | Inc. Class A | 741,832 | 26,276 |
| | Time Warner Cable Inc. | 137,957 | 20,408 |
| * | DIRECTV | 236,041 | 20,406 |
| | Comcast Corp. | 300,140 | 16,388 |
| | Viacom Inc. Class B | 187,368 | 15,205 |
| | CBS Corp. Class B | 240,960 | 14,286 |
| * | Liberty Global plc | 263,927 | 11,066 |
| | Omnicom Group Inc. | 127,978 | 9,216 |
| * | DISH Network Corp. | | |
| | Class A | 109,180 | 7,076 |
| | Twenty-First Century Fox | | |
| | Inc. | 181,998 | 6,268 |
| * | Discovery Communications | | |
| | Inc. | 145,308 | 6,244 |
| * | Charter Communications | | |
| | Inc. Class A | 37,495 | 5,882 |
| * | Sirius XM Holdings Inc. | 1,492,793 | 5,419 |
| * | Liberty Media Corp. | 101,908 | 4,939 |
| * | Liberty Global plc Class A | 106,123 | 4,634 |
| | Interpublic Group of Cos. | | |
| | Inc. | 209,157 | 4,085 |
| | Gannett Co. Inc. | 111,542 | 3,766 |
| * | News Corp. Class A | 195,250 | 3,441 |
| | Scripps Networks | | |
| | Interactive Inc. Class A | 40,220 | 3,206 |
| * | Discovery Communications | | |
| | Inc. Class A | 73,068 | 3,194 |
| * | Liberty Media Corp. | | |
| | Class A | 46,304 | 2,280 |
| * | Madison Square Garden | | |
| | Co. Class A | 31,256 | 2,090 |
| | Lamar Advertising Co. | | |
| | Class A | 39,531 | 2,075 |
| * | AMC Networks Inc. | | |
| | Class A | 30,063 | 1,881 |
| | Cinemark Holdings Inc. | 51,196 | 1,807 |
| | Cablevision Systems Corp. | | |
| | Class A | 96,456 | 1,785 |
| * | Live Nation Entertainment | | |
| | Inc. | 69,166 | 1,519 |
| | John Wiley & Sons Inc. | | |
| | Class A | 23,174 | 1,389 |
| | | |
| | | | Market |
| | | | Value• |
| | | Shares | ($000) |
| | Lions Gate Entertainment | | |
| | Corp. | 41,978 | 1,360 |
| * | Starz | 41,853 | 1,310 |
| * | Time Inc. | 55,005 | 1,291 |
| | Sinclair Broadcast Group Inc. | | |
| | Class A | 33,662 | 978 |
| | Regal Entertainment Group | | |
| | Class A | 41,943 | 883 |
| | Meredith Corp. | 17,835 | 831 |
| | New York Times Co. Class A | 66,256 | 820 |
| * | News Corp. Class B | 45,852 | 791 |
| * | DreamWorks Animation SKG | | |
| | Inc. Class A | 34,020 | 743 |
| | Nexstar Broadcasting Group | | |
| | Inc. Class A | 15,061 | 687 |
| | Morningstar Inc. | 9,858 | 677 |
| | Scholastic Corp. | 12,989 | 455 |
| * | Loral Space & | | |
| | Communications Inc. | 6,058 | 454 |
| | National CineMedia Inc. | 29,891 | 436 |
| * | Carmike Cinemas Inc. | 10,710 | 363 |
| * | Media General Inc. | 19,485 | 300 |
| * | Cumulus Media Inc. Class A | 64,470 | 296 |
| * | EW Scripps Co. Class A | 15,536 | 295 |
| | AMC Entertainment | | |
| | Holdings Inc. | 10,632 | 252 |
| | World Wrestling | | |
| | Entertainment Inc. Class A | 15,119 | 220 |
| | New Media Investment | | |
| | Group Inc. | 12,230 | 214 |
| *,^ | SFX Entertainment Inc. | 23,930 | 169 |
| * | Journal Communications Inc. | | |
| | Class A | 16,028 | 159 |
| | Harte-Hanks Inc. | 22,521 | 158 |
| * | McClatchy Co. Class A | 30,252 | 136 |
| | Clear Channel Outdoor | | |
| | Holdings Inc. Class A | 17,570 | 122 |
| * | Sizmek Inc. | 10,956 | 96 |
| * | Entercom Communications | | |
| | Corp. Class A | 9,649 | 88 |
| * | ReachLocal Inc. | 3,978 | 21 |
| | | | 381,352 |
| Multiline Retail (4.8%) | | |
| | Target Corp. | 297,985 | 17,900 |
| | Macy’s Inc. | 179,292 | 11,168 |
| * | Dollar General Corp. | 153,352 | 9,813 |
| | Kohl’s Corp. | 103,171 | 6,065 |
| * | Dollar Tree Inc. | 102,570 | 5,500 |
| | Nordstrom Inc. | 70,216 | 4,862 |
| | Family Dollar Stores Inc. | 50,480 | 4,030 |
| * | JC Penney Co. Inc. | 149,502 | 1,615 |
| | Dillard’s Inc. Class A | 12,797 | 1,463 |
| | Big Lots Inc. | 28,597 | 1,326 |
| *,^ | Sears Holdings Corp. | 26,311 | 916 |
| * | Burlington Stores Inc. | 14,539 | 519 |
| * | Tuesday Morning Corp. | 21,350 | 375 |
| | Fred’s Inc. Class A | 18,039 | 257 |
| | | | 65,809 |
| Specialty Retail (18.2%) | | |
| | Home Depot Inc. | 676,684 | 63,270 |
| | Lowe’s Cos. Inc. | 500,729 | 26,293 |
| | TJX Cos. Inc. | 346,453 | 20,652 |
| * | AutoZone Inc. | 16,128 | 8,690 |
| * | O’Reilly Automotive Inc. | 52,555 | 8,198 |
| | Ross Stores Inc. | 105,037 | 7,922 |
| | L Brands Inc. | 122,423 | 7,817 |
| * | Bed Bath & Beyond Inc. | 100,872 | 6,482 |
| | Tiffany & Co. | 63,933 | 6,453 |
| * | CarMax Inc. | 108,993 | 5,711 |
10
Consumer Discretionary Index Fund
| | | |
| | | | Market |
| | | | Value• |
| | | Shares | ($000) |
| | Gap Inc. | 121,652 | 5,614 |
| | Advance Auto Parts Inc. | 36,132 | 4,929 |
| | Best Buy Co. Inc. | 146,614 | 4,676 |
| | Tractor Supply Co. | 68,537 | 4,589 |
| | Signet Jewelers Ltd. | 38,120 | 4,493 |
| | Foot Locker Inc. | 72,340 | 4,059 |
| | Staples Inc. | 320,783 | 3,747 |
| | PetSmart Inc. | 46,557 | 3,332 |
| * | Ulta Salon Cosmetics & | | |
| | Fragrance Inc. | 30,306 | 2,949 |
| | Williams-Sonoma Inc. | 44,250 | 2,910 |
| | GameStop Corp. Class A | 57,068 | 2,408 |
| * | Sally Beauty Holdings Inc. | 79,815 | 2,225 |
| | Dick’s Sporting Goods Inc. | 48,338 | 2,179 |
| * | Urban Outfitters Inc. | 54,438 | 2,166 |
| * | AutoNation Inc. | 38,298 | 2,078 |
| | GNC Holdings Inc. Class A | 44,994 | 1,708 |
| | Abercrombie & Fitch Co. | 35,971 | 1,504 |
| * | Cabela’s Inc. | 24,408 | 1,489 |
| | CST Brands Inc. | 37,389 | 1,303 |
| * | Restoration Hardware | | |
| | Holdings Inc. | 15,379 | 1,290 |
| * | Office Depot Inc. | 248,523 | 1,272 |
| * | Murphy USA Inc. | 23,117 | 1,259 |
| | American Eagle Outfitters | | |
| | Inc. | 86,418 | 1,217 |
| * | Ascena Retail Group Inc. | 67,251 | 1,169 |
| | DSW Inc. Class A | 37,068 | 1,147 |
| | Chico’s FAS Inc. | 72,016 | 1,138 |
| | Penske Automotive Group | | |
| | Inc. | 22,452 | 1,077 |
| | Men’s Wearhouse Inc. | 19,880 | 1,074 |
| | Lithia Motors Inc. Class A | 11,374 | 994 |
| * | ANN Inc. | 23,271 | 964 |
| * | Asbury Automotive Group | | |
| | Inc. | 13,700 | 955 |
| * | Genesco Inc. | 11,701 | 928 |
| * | Five Below Inc. | 21,309 | 864 |
| | Group 1 Automotive Inc. | 10,703 | 858 |
| | Aaron’s Inc. | 31,886 | 817 |
| * | Lumber Liquidators Holdings | | |
| | Inc. | 13,690 | 783 |
| | Monro Muffler Brake Inc. | 14,460 | 748 |
| | Guess? Inc. | 31,253 | 733 |
| | Rent-A-Center Inc. | 26,110 | 727 |
| | Finish Line Inc. Class A | 23,816 | 706 |
| | Buckle Inc. | 14,289 | 703 |
| * | Express Inc. | 40,408 | 701 |
| | Pier 1 Imports Inc. | 44,375 | 699 |
| | Children’s Place Inc. | 11,238 | 604 |
| * | Select Comfort Corp. | 26,980 | 604 |
| * | Conn’s Inc. | 13,338 | 598 |
| | Brown Shoe Co. Inc. | 19,886 | 593 |
| * | Vitamin Shoppe Inc. | 15,109 | 592 |
| * | Hibbett Sports Inc. | 12,752 | 579 |
| | | |
| | | | Market |
| | | | Value• |
| | | Shares | ($000) |
| * | Outerwall Inc. | 8,578 | 505 |
| * | Barnes & Noble Inc. | 19,159 | 457 |
| | Cato Corp. Class A | 13,023 | 451 |
| | Sonic Automotive Inc. | | |
| | Class A | 16,877 | 417 |
| * | Mattress Firm Holding Corp. | 6,714 | 385 |
| * | Zumiez Inc. | 11,028 | 357 |
| * | Francesca’s Holdings Corp. | 21,489 | 301 |
| | Stage Stores Inc. | 16,037 | 280 |
| * | Pep Boys-Manny Moe & Jack | 24,118 | 268 |
| | Haverty Furniture Cos. Inc. | 10,035 | 233 |
| * | MarineMax Inc. | 12,122 | 209 |
| * | Container Store Group Inc. | 9,449 | 200 |
| | Stein Mart Inc. | 15,006 | 187 |
| * | America’s Car-Mart Inc. | 3,904 | 165 |
| | Shoe Carnival Inc. | 7,662 | 165 |
| * | Tile Shop Holdings Inc. | 11,592 | 134 |
| * | Kirkland’s Inc. | 7,363 | 131 |
| * | Sears Hometown and Outlet | | |
| | Stores Inc. | 6,286 | 121 |
| | Destination Maternity Corp. | 6,213 | 120 |
| * | Aeropostale Inc. | 28,573 | 120 |
| * | Systemax Inc. | 7,798 | 114 |
| | Big 5 Sporting Goods Corp. | 9,346 | 95 |
| * | West Marine Inc. | 8,078 | 89 |
| | Winmark Corp. | 1,079 | 78 |
| * | New York & Co. Inc. | 17,819 | 61 |
| | bebe stores inc | 16,978 | 56 |
| * | hhgregg Inc. | 7,066 | 51 |
| * | Tilly’s Inc. Class A | 4,890 | 40 |
| | | | 252,029 |
| Textiles, Apparel & Luxury Goods (6.6%) | |
| | NIKE Inc. Class B | 346,586 | 27,224 |
| | VF Corp. | 170,334 | 10,922 |
| * | Michael Kors Holdings Ltd. | 96,060 | 7,696 |
| * | Under Armour Inc. Class A | 81,827 | 5,594 |
| | Ralph Lauren Corp. Class A | 30,650 | 5,186 |
| | Hanesbrands Inc. | 49,344 | 5,067 |
| | Coach Inc. | 135,610 | 4,994 |
| | PVH Corp. | 40,795 | 4,762 |
| * | Fossil Group Inc. | 23,904 | 2,421 |
| | Carter’s Inc. | 26,511 | 2,195 |
| * | Lululemon Athletica Inc. | 53,733 | 2,145 |
| * | Kate Spade & Co. | 62,690 | 2,027 |
| * | Deckers Outdoor Corp. | 17,151 | 1,582 |
| | Wolverine World Wide Inc. | 49,577 | 1,317 |
| * | Skechers U.S.A. Inc. Class A | 19,652 | 1,147 |
| * | Steven Madden Ltd. | 29,594 | 1,006 |
| * | Iconix Brand Group Inc. | 21,484 | 894 |
| * | G-III Apparel Group Ltd. | 9,875 | 815 |
| * | Crocs Inc. | 43,809 | 677 |
| * | Tumi Holdings Inc. | 25,125 | 565 |
| | Columbia Sportswear Co. | 6,720 | 512 |
| | Oxford Industries Inc. | 7,027 | 431 |
| | | |
| | | | Market |
| | | | Value• |
| | | Shares | ($000) |
| | Movado Group Inc. | 9,511 | 353 |
| * | Vince Holding Corp. | 8,171 | 297 |
| * | Unifi Inc. | 8,298 | 237 |
| * | Vera Bradley Inc. | 10,711 | 220 |
| * | Quiksilver Inc. | 63,577 | 185 |
| | | | 90,471 |
| Total Common Stocks | | |
| (Cost $1,157,032) | | 1,379,629 |
| Temporary Cash Investment (0.1%) | |
| Money Market Fund (0.1%) | | |
| 1,2 | Vanguard Market | | |
| | Liquidity Fund, 0.113% | | |
| | (Cost $908) | 908,002 | 908 |
| Total Investments (100.0%) | | |
| (Cost $1,157,940) | | 1,380,537 |
| Other Assets and Liabilities (0.0%) | |
| Other Assets | | 8,659 |
| Liabilities2 | | (8,336) |
| | | | 323 |
| Net Assets (100%) | | 1,380,860 |
| |
| At August 31, 2014, net assets consisted of: |
| | Amount |
| | ($000) |
| Paid-in Capital | 1,161,579 |
| Undistributed Net Investment Income | 10,406 |
| Accumulated Net Realized Losses | (13,722) |
| Unrealized Appreciation (Depreciation) | 222,597 |
| Net Assets | 1,380,860 |
| |
| |
| Admiral Shares—Net Assets | |
| Applicable to 1,432,705 outstanding | |
| $.001 par value shares of beneficial | |
| interest (unlimited authorization) | 82,906 |
| Net Asset Value Per Share— | |
| Admiral Shares | $57.87 |
| |
| |
| ETF Shares—Net Assets | |
| Applicable to 11,610,827 outstanding | |
| $.001 par value shares of beneficial | |
| interest (unlimited authorization) | 1,297,954 |
| Net Asset Value Per Share— | |
| ETF Shares | $111.79 |
• See Note A in Notes to Financial Statements.
* Non-income-producing security.
^ Includes partial security positions on loan to broker-dealers. The total value of securities on loan is $847,000.
1 Affiliated money market fund available only to Vanguard funds and certain trusts and accounts managed by Vanguard. Rate shown is the 7-day yield.
2 Includes $908,000 of collateral received for securities on loan.
See accompanying Notes, which are an integral part of the Financial Statements.
11
Consumer Discretionary Index Fund
Statement of Operations
| |
| | Year Ended |
| August 31, 2014 |
| | ($000) |
| Investment Income | |
| Income | |
| Dividends | 18,194 |
| Interest1 | 1 |
| Securities Lending | 196 |
| Total Income | 18,391 |
| Expenses | |
| The Vanguard Group—Note B | |
| Investment Advisory Services | 222 |
| Management and Administrative— | |
| Admiral Shares | 71 |
| Management and Administrative— | |
| ETF Shares | 909 |
| Marketing and Distribution— | |
| Admiral Shares | 13 |
| Marketing and Distribution— | |
| ETF Shares | 263 |
| Custodian Fees | 15 |
| Auditing Fees | 32 |
| Shareholders’ Reports—Admiral Shares | — |
| Shareholders’ Reports—ETF Shares | 66 |
| Trustees’ Fees and Expenses | 1 |
| Total Expenses | 1,592 |
| Net Investment Income | 16,799 |
| Realized Net Gain (Loss) on | |
| Investment Securities Sold | 209,902 |
| Change in Unrealized Appreciation | |
| (Depreciation) of Investment Securities | 703 |
| Net Increase (Decrease) in Net Assets | |
| Resulting from Operations | 227,404 |
Statement of Changes in Net Assets
| | |
| | Year Ended August 31, |
| | 2014 | 2013 |
| | ($000) | ($000) |
| Increase (Decrease) in Net Assets | | |
| Operations | | |
| Net Investment Income | 16,799 | 10,937 |
| Realized Net Gain (Loss) | 209,902 | 16,353 |
| Change in Unrealized Appreciation (Depreciation) | 703 | 162,618 |
| Net Increase (Decrease) in Net Assets Resulting from Operations | 227,404 | 189,908 |
| Distributions | | |
| Net Investment Income | | |
| Admiral Shares | (822) | (348) |
| ETF Shares | (11,421) | (8,873) |
| Realized Capital Gain | | |
| Admiral Shares | — | — |
| ETF Shares | — | — |
| Total Distributions | (12,243) | (9,221) |
| Capital Share Transactions | | |
| Admiral Shares | 7,048 | 35,667 |
| ETF Shares | 77,692 | 315,133 |
| Net Increase (Decrease) from Capital Share Transactions | 84,740 | 350,800 |
| Total Increase (Decrease) | 299,901 | 531,487 |
| Net Assets | | |
| Beginning of Period | 1,080,959 | 549,472 |
| End of Period2 | 1,380,860 | 1,080,959 |
1 Interest income from an affiliated company of the fund was $1,000.2 Net Assets—End of Period includes undistributed (overdistributed) net investment income of $10,406,000 and $5,850,000.See accompanying Notes, which are an integral part of the Financial Statements.12
Consumer Discretionary Index Fund
Financial Highlights
| | | | | |
| Admiral Shares | | | | | |
| |
| For a Share Outstanding | Year Ended August 31, |
| Throughout Each Period | 2014 | 2013 | 2012 | 2011 | 2010 |
| Net Asset Value, Beginning of Period | $48.34 | $37.62 | $31.22 | $24.76 | $21.43 |
| Investment Operations | | | | | |
| Net Investment Income | .648 | . 579 | .483 | .363 | . 307 |
| Net Realized and Unrealized Gain (Loss) | | | | | |
| on Investments | 9.361 | 10.741 | 6.356 | 6.414 | 3.251 |
| Total from Investment Operations | 10.009 | 11.320 | 6.839 | 6.777 | 3.558 |
| Distributions | | | | | |
| Dividends from Net Investment Income | (.479) | (. 600) | (. 439) | (.317) | (. 228) |
| Distributions from Realized Capital Gains | — | — | — | — | — |
| Total Distributions | (.479) | (. 600) | (. 439) | (.317) | (. 228) |
| Net Asset Value, End of Period | $57.87 | $48.34 | $37.62 | $31.22 | $24.76 |
| |
| Total Return1 | 20.77% | 30.45% | 22.17% | 27.36% | 16.62% |
| |
| Ratios/Supplemental Data | | | | | |
| Net Assets, End of Period (Millions) | $83 | $63 | $19 | $11.0 | $5.3 |
| Ratio of Total Expenses to Average Net Assets | 0.12% | 0.14% | 0.14% | 0.19% | 0.24% |
| Ratio of Net Investment Income to | | | | | |
| Average Net Assets | 1.26% | 1.44% | 1.48% | 1.25% | 1.28% |
| Portfolio Turnover Rate2 | 7% | 6% | 6% | 7% | 7% |
1 Total returns do not include transaction or account service fees that may have applied in the periods shown. Fund prospectuses provide
information about any applicable transaction and account service fees.
2 Excludes the value of portfolio securities received or delivered as a result of in-kind purchases or redemptions of the fund’s capital shares,
including ETF Creation Units.
| | | | | |
| ETF Shares | | | | | |
| |
| For a Share Outstanding | Year Ended August 31, |
| Throughout Each Period | 2014 | 2013 | 2012 | 2011 | 2010 |
| Net Asset Value, Beginning of Period | $93.38 | $72.65 | $60.29 | $47.80 | $41.37 |
| Investment Operations | | | | | |
| Net Investment Income | 1.251 | 1.111 | .936 | .698 | . 581 |
| Net Realized and Unrealized Gain (Loss) | | | | | |
| on Investments | 18.072 | 20.771 | 12.277 | 12.392 | 6.286 |
| Total from Investment Operations | 19.323 | 21.882 | 13.213 | 13.090 | 6.867 |
| Distributions | | | | | |
| Dividends from Net Investment Income | (.913) | (1.152) | (. 853) | (. 600) | (. 437) |
| Distributions from Realized Capital Gains | — | — | — | — | — |
| Total Distributions | (.913) | (1.152) | (. 853) | (. 600) | (. 437) |
| Net Asset Value, End of Period | $111.79 | $93.38 | $72.65 | $60.29 | $47.80 |
| |
| Total Return | 20.75% | 30.47% | 22.18% | 27.37% | 16.62% |
| |
| Ratios/Supplemental Data | | | | | |
| Net Assets, End of Period (Millions) | $1,298 | $1,018 | $531 | $332 | $234 |
| Ratio of Total Expenses to Average Net Assets | 0.12% | 0.14% | 0.14% | 0.19% | 0.24% |
| Ratio of Net Investment Income to | | | | | |
| Average Net Assets | 1.26% | 1.44% | 1.48% | 1.25% | 1.28% |
| Portfolio Turnover Rate1 | 7% | 6% | 6% | 7% | 7% |
| 1 Excludes the value of portfolio securities received or delivered as a result of in-kind purchases or redemptions of the fund’s capital shares, including ETF Creation Units. |
|
See accompanying Notes, which are an integral part of the Financial Statements.
13
Consumer Discretionary Index Fund
Notes to Financial Statements
Vanguard Consumer Discretionary Index Fund is registered under the Investment Company Act of 1940 as an open-end investment company, or mutual fund. The fund offers two classes of shares: Admiral Shares and ETF Shares. Admiral Shares are designed for investors who meet certain administrative, service, and account-size criteria. ETF Shares are listed for trading on NYSE Arca; they can be purchased and sold through a broker.
A. The following significant accounting policies conform to generally accepted accounting principles for U.S. investment companies. The fund consistently follows such policies in preparing its financial statements.
1. Security Valuation: Securities are valued as of the close of trading on the New York Stock Exchange (generally 4 p.m., Eastern time) on the valuation date. Equity securities are valued at the latest quoted sales prices or official closing prices taken from the primary market in which each security trades; such securities not traded on the valuation date are valued at the mean of the latest quoted bid and asked prices. Securities for which market quotations are not readily available, or whose values have been materially affected by events occurring before the fund’s pricing time but after the close of the securities’ primary markets, are valued by methods deemed by the board of trustees to represent fair value. Investments in Vanguard Market Liquidity Fund are valued at that fund’s net asset value.
2. Federal Income Taxes: The fund intends to continue to qualify as a regulated investment company and distribute all of its taxable income. Management has analyzed the fund’s tax positions taken for all open federal income tax years (August 31, 2011–2014), and has concluded that no provision for federal income tax is required in the fund’s financial statements.
3. Distributions: Distributions to shareholders are recorded on the ex-dividend date.
4. Securities Lending: To earn additional income, the fund lends its securities to qualified institutional borrowers. Security loans are required to be secured at all times by collateral in an amount at least equal to the market value of securities loaned. Daily market fluctuations could cause the value of loaned securities to be more or less than the value of the collateral received. When this occurs, the collateral is adjusted and settled on the next business day. The fund further mitigates its counterparty risk by entering into securities lending transactions only with a diverse group of prequalified counterparties, monitoring their financial strength, and entering into master securities lending agreements with its counterparties. The master securities lending agreements provide that, in the event of a counterparty’s default (including bankruptcy), the fund may terminate any loans with that borrower, determine the net amount owed, and sell or retain the collateral up to the net amount owed to the fund; however, such actions may be subject to legal proceedings. While collateral mitigates counterparty risk, in the absence of a default the fund may experience delays and costs in recovering the securities loaned. The fund invests cash collateral received in Vanguard Market Liquidity Fund, and records a liability in the Statement of Net Assets for the return of the collateral, during the period the securities are on loan. Securities lending income represents fees charged to borrowers plus income earned on invested cash collateral, less expenses associated with the loan.
5. Credit Facility: The fund and certain other funds managed by The Vanguard Group participate in a $2.89 billion committed credit facility provided by a syndicate of lenders pursuant to a credit agreement that may be renewed annually; each fund is individually liable for its borrowings, if any, under the credit facility. Borrowings may be utilized for temporary and emergency purposes, and are subject to the fund’s regulatory and contractual borrowing restrictions. The participating funds are charged administrative fees and an annual commitment fee of 0.06% of the undrawn amount of the facility; these fees are allocated to the funds based on a method approved by the fund’s board of trustees and included in Management and Administrative expenses on the fund’s Statement of Operations. Any borrowings under this facility bear interest at a rate equal to the higher of the federal funds rate or LIBOR reference rate plus an agreed-upon spread.
The fund had no borrowings outstanding at August 31, 2014, or at any time during the period then ended.
6. Other: Dividend income is recorded on the ex-dividend date. Interest income includes income distributions received from Vanguard Market Liquidity Fund and is accrued daily. Security transactions are accounted for on the date securities are bought or sold. Costs used to determine realized gains (losses) on the sale of investment securities are those of the specific securities sold.
14
Consumer Discretionary Index Fund
Each class of shares has equal rights as to assets and earnings, except that each class separately bears certain class-specific expenses related to maintenance of shareholder accounts (included in Management and Administrative expenses) and shareholder reporting. Marketing and distribution expenses are allocated to each class of shares based on a method approved by the board of trustees. Income, other non-class-specific expenses, and gains and losses on investments are allocated to each class of shares based on its relative net assets.
B. The Vanguard Group furnishes at cost investment advisory, corporate management, administrative, marketing, and distribution services. The costs of such services are allocated to the fund based on methods approved by the board of trustees. The fund has committed to provide up to 0.40% of its net assets in capital contributions to Vanguard. At August 31, 2014, the fund had contributed capital of $125,000 to Vanguard (included in Other Assets), representing 0.01% of the fund’s net assets and 0.05% of Vanguard’s capitalization. The fund’s trustees and officers are also directors and officers of Vanguard.
C. Various inputs may be used to determine the value of the fund’s investments. These inputs are summarized in three broad levels for financial statement purposes. The inputs or methodologies used to value securities are not necessarily an indication of the risk associated with investing in those securities.
Level 1—Quoted prices in active markets for identical securities.
Level 2—Other significant observable inputs (including quoted prices for similar securities, interest rates, prepayment speeds, credit risk, etc.).
Level 3—Significant unobservable inputs (including the fund’s own assumptions used to determine the fair value of investments).
At August 31, 2014, 100% of the market value of the fund’s investments was determined based on Level 1 inputs.
D. Distributions are determined on a tax basis and may differ from net investment income and realized capital gains for financial reporting purposes. Differences may be permanent or temporary. Permanent differences are reclassified among capital accounts in the financial statements to reflect their tax character. Temporary differences arise when certain items of income, expense, gain, or loss are recognized in different periods for financial statement and tax purposes. These differences will reverse at some time in the future. Differences in classification may also result from the treatment of short-term gains as ordinary income for tax purposes.
During the year ended August 31, 2014, the fund realized $208,694,000 of net capital gains resulting from in-kind redemptions—in which shareholders exchanged fund shares for securities held by the fund rather than for cash. Because such gains are not taxable to the fund, and are not distributed to shareholders, they have been reclassified from accumulated net realized losses to paid-in capital.
For tax purposes, at August 31, 2014, the fund had $10,799,000 of ordinary income available for distribution. The fund used capital loss carryforwards of $1,389,000 to offset taxable capital gains realized during the year ended August 31, 2014. At August 31, 2014, the fund had available capital losses totaling $13,722,000 to offset future net capital gains. Of this amount, $13,539,000 is subject to expiration dates; $216,000 may be used to offset future net capital gains through August 31, 2016, $4,557,000 through August 31, 2017, $7,273,000 through August 31, 2018, and $1,493,000 through August 31, 2019. Capital losses of $183,000 realized beginning in fiscal 2012 may be carried forward indefinitely under the Regulated Investment Company Modernization Act of 2010, but must be used before any expiring loss carryforwards.
At August 31, 2014, the cost of investment securities for tax purposes was $1,157,940,000. Net unrealized appreciation of investment securities for tax purposes was $222,597,000, consisting of unrealized gains of $252,518,000 on securities that had risen in value since their purchase and $29,921,000 in unrealized losses on securities that had fallen in value since their purchase.
E. During the year ended August 31, 2014, the fund purchased $626,600,000 of investment securities and sold $537,902,000 of investment securities, other than temporary cash investments. Purchases and sales include $517,794,000 and $451,556,000, respectively, in connection with in-kind purchases and redemptions of the fund’s capital shares.
15
Consumer Discretionary Index Fund
F. Capital share transactions for each class of shares were:
| | | | |
| | Year Ended August 31, |
| | | 2014 | | | 2013 |
| | Amount | Shares | Amount | Shares |
| | ($000) | (000) | ($000) | (000) |
| Admiral Shares | | | | |
| Issued | 55,198 | 1,022 | 51,053 | 1,148 |
| Issued in Lieu of Cash Distributions | 772 | 14 | 298 | 8 |
| Redeemed | (48,922) | (902) | (15,684) | (361) |
| Net Increase (Decrease) —Admiral Shares | 7,048 | 134 | 35,667 | 795 |
| ETF Shares | | | | |
| Issued | 529,357 | 5,007 | 354,303 | 4,101 |
| Issued in Lieu of Cash Distributions | — | — | — | — |
| Redeemed | (451,665) | (4,300) | (39,170) | (500) |
| Net Increase (Decrease)—ETF Shares | 77,692 | 707 | 315,133 | 3,601 |
G. Management has determined that no material events or transactions occurred subsequent to August 31, 2014, that would require recognition or disclosure in these financial statements.
16
Consumer Staples Index Fund
Fund Profile
As of August 31, 2014
| | |
| Share-Class Characteristics | |
| | Admiral | ETF |
| | Shares | Shares |
| Ticker Symbol | VCSAX | VDC |
| Expense Ratio1 | 0.14% | 0.14% |
| 30-Day SEC Yield | 2.45% | 2.45% |
| | | |
| Portfolio Characteristics | | |
| | | MSCI | |
| | | US IMI/ | |
| | | Consumer | MSCI |
| | | Staples | US IMI/ |
| | Fund | 25/50 | 2500 |
| Number of Stocks | 102 | 101 | 2,499 |
| Median Market Cap | $61.2B | $61.2B | $48.7B |
| Price/Earnings Ratio | 20.7x | 20.7x | 20.7x |
| Price/Book Ratio | 4.3x | 4.3x | 2.7x |
| Return on Equity | 21.6% | 21.6% | 18.0% |
| Earnings Growth Rate | 8.9% | 8.9% | 15.2% |
| Dividend Yield | 2.6% | 2.6% | 1.9% |
| Foreign Holdings | 0.0% | 0.0% | 0.0% |
| Turnover Rate | 5% | — | — |
| Short-Term Reserves | 0.1% | — | — |
| | |
| Volatility Measures | | |
| | MSCI US | |
| | IMI/Consumer | MSCI US |
| | Staples 25/50 | IMI/2500 |
| R-Squared | 1.00 | 0.51 |
| Beta | 1.00 | 0.59 |
| These measures show the degree and timing of the fund’s fluctuations compared with the indexes over 36 months. |
|
| |
| Subindustry Diversification | |
| (% of equity exposure) | |
| |
| Agricultural Products | 3.3% |
| Distillers & Vintners | 1.5 |
| Drug Retail | 8.0 |
| Food Distributors | 1.8 |
| Food Retail | 3.7 |
| Household Products | 19.6 |
| Hypermarkets & Super Centers | 9.3 |
| Packaged Foods & Meats | 17.7 |
| Personal Products | 2.3 |
| Soft Drinks | 18.0 |
| Tobacco | 14.0 |
| Other Consumer Staples | 0.8 |
| | |
| Ten Largest Holdings (% of total net assets) |
| |
| Procter & | | |
| Gamble Co. | Household Products | 11.9% |
| Coca-Cola Co. | Soft Drinks | 8.5 |
| PepsiCo Inc. | Soft Drinks | 7.2 |
| Philip Morris | | |
| International Inc. | Tobacco | 6.9 |
| Wal-Mart | Hypermarkets & | |
| Stores Inc. | Super Centers | 6.2 |
| CVS Caremark | | |
| Corp. | Drug Retail | 4.6 |
| Altria Group Inc. | Tobacco | 4.6 |
| Mondelez | | |
| International Inc. | Packaged Foods & Meats | 3.4 |
| Colgate-Palmolive | | |
| Co. | Household Products | 3.3 |
| Walgreen Co. | Drug Retail | 3.1 |
| Top Ten | | 59.7% |
| The holdings listed exclude any temporary cash investments and equity index products. |
|
1 The expense ratios shown are from the prospectus dated December 23, 2013, and represent estimated costs for the current fiscal year. For the fiscal year ended August 31, 2014, the expense ratios were 0.12% for
Admiral Shares and 0.12% for ETF Shares.
17
Consumer Staples Index Fund
Performance Summary
All of the returns in this report represent past performance, which is not a guarantee of future results that may be achieved by the fund. (Current performance may be lower or higher than the performance data cited. For performance data current to the most recent month-end, visit our website at vanguard.com/performance.) Note, too, that both investment returns and principal value can fluctuate widely, so an investor’s shares, when sold, could be worth more or less than their original cost. The returns shown do not reflect taxes that a shareholder would pay on fund distributions or on the sale of fund shares.
Cumulative Performance: August 31, 2004–August 31, 2014
Initial Investment of $10,000
| | | | |
| | | Average Annual Total Returns | Final Value |
| | Periods Ended August 31, 2014 | of a $10,000 |
| | One Year | Five Years | Ten Years | Investment |
| Consumer Staples Index Fund | | | | |
| ETF Shares Net Asset Value | 17.42% | 16.42% | 10.69% | $27,618 |
| Consumer Staples Index Fund | | | | |
| ETF Shares Market Price | 17.43 | 16.41 | 10.70 | 27,641 |
| Spliced US IMI/Consumer Staples 25/50 | 17.57 | 16.59 | 10.74 | 27,734 |
| Consumer Goods Funds Average | 19.12 | 15.70 | 9.91 | 25,728 |
| MSCI US IMI/2500 | 24.94 | 17.33 | 9.05 | 23,791 |
| For a benchmark description, see the Glossary. Consumer Goods Funds Average: Derived from data provided by Lipper, a Thomson Reuters Company. |
|
| | | | |
| | | | | Final Value |
| | | | | of a $100,000 |
| | One Year | Five Years | Ten Years | Investment |
| Consumer Staples Index Fund Admiral Shares | 17.41% | 16.43% | 10.68% | $275,748 |
| Spliced US IMI/Consumer Staples 25/50 | 17.57 | 16.59 | 10.74 | 277,344 |
| MSCI US IMI/2500 | 24.94 | 17.33 | 9.05 | 237,905 |
See Financial Highlights for dividend and capital gains information.
18
Consumer Staples Index Fund
Fiscal-Year Total Returns (%): August 31, 2004–August 31, 2014
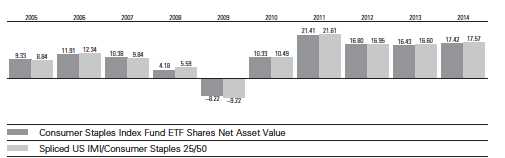
For a benchmark description, see the Glossary.
| | | |
| Cumulative Returns: ETF Shares, August 31, 2004–August 31, 2014 | | |
| |
| | One Year | Five Years | Ten Years |
| Consumer Staples Index Fund ETF Shares Market Price | 17.43% | 113.77% | 176.41% |
| Consumer Staples Index Fund ETF Shares Net Asset Value | 17.42 | 113.88 | 176.18 |
| Spliced US IMI/Consumer Staples 25/50 | 17.57 | 115.43 | 177.34 |
Average Annual Total Returns: Periods Ended June 30, 2014
This table presents total returns through the latest calendar quarter—rather than through the end of the fiscal
period. Securities and Exchange Commission rules require that we provide this information.
| | | | |
| | Inception Date | One Year | Five Years | Ten Years |
| ETF Shares | 1/26/2004 | | | |
| Market Price | | 16.27% | 17.91% | 10.18% |
| Net Asset Value | | 16.36 | 17.91 | 10.18 |
| Admiral Shares | 1/30/2004 | 16.37 | 17.92 | 10.17 |
See Financial Highlights for dividend and capital gains information.
19
Consumer Staples Index Fund
Financial Statements
Statement of Net Assets
As of August 31, 2014
The fund reports a complete list of its holdings in regulatory filings four times in each fiscal year, at the quarter-ends. For the second and fourth fiscal quarters, the lists appear in the fund’s semiannual and annual reports to shareholders. For the first and third fiscal quarters, the fund files the lists with the Securities and Exchange Commission on Form N-Q. Shareholders can look up the fund’s Forms N-Q on the SEC’s website at sec.gov. Forms N-Q may also be reviewed and copied at the SEC’s Public Reference Room (see the back cover of this report for further information).
| | | |
| | | | Market |
| | | | Value• |
| | | Shares | ($000) |
| Common Stocks (99.9%) | | |
| Beverages (20.3%) | | |
| | Coca-Cola Co. | 4,411,522 | 184,049 |
| | PepsiCo Inc. | 1,671,153 | 154,565 |
| * | Constellation Brands Inc. | | |
| | Class A | 207,290 | 18,053 |
| | Dr Pepper Snapple Group | | |
| | Inc. | 258,276 | 16,251 |
| * | Monster Beverage Corp. | 182,031 | 16,093 |
| | Coca-Cola Enterprises Inc. | 331,708 | 15,849 |
| | Brown-Forman Corp. | | |
| | Class B | 152,845 | 14,163 |
| | Molson Coors Brewing Co. | | |
| | Class B | 189,358 | 14,003 |
| * | Boston Beer Co. Inc. | | |
| | Class A | 14,623 | 3,231 |
| | Coca-Cola Bottling Co. | | |
| | Consolidated | 16,526 | 1,229 |
| | | | 437,486 |
| Food & Staples Retailing (22.7%) | |
| | Wal-Mart Stores Inc. | 1,756,514 | 132,617 |
| | CVS Caremark Corp. | 1,233,856 | 98,030 |
| | Walgreen Co. | 1,091,284 | 66,044 |
| | Costco Wholesale Corp. | 529,657 | 64,131 |
| | Kroger Co. | 592,516 | 30,206 |
| | Sysco Corp. | 712,732 | 26,963 |
| | Whole Foods Market Inc. | 453,861 | 17,764 |
| | Safeway Inc. | 306,925 | 10,675 |
| * | Rite Aid Corp. | 1,250,738 | 7,780 |
| * | Sprouts Farmers Market | | |
| | Inc. | 144,142 | 4,460 |
| * | United Natural Foods Inc. | 69,072 | 4,441 |
| | Casey’s General Stores | | |
| | Inc. | 56,316 | 4,037 |
| * | SUPERVALU Inc. | 370,557 | 3,539 |
| | Andersons Inc. | 51,378 | 3,533 |
| | PriceSmart Inc. | 31,964 | 2,865 |
| | SpartanNash Co. | 123,955 | 2,664 |
| * | Fresh Market Inc. | 66,061 | 2,203 |
| * | Pantry Inc. | 76,922 | 1,628 |
| * | Chefs’ Warehouse Inc. | 82,007 | 1,549 |
| | Weis Markets Inc. | 30,690 | 1,318 |
| | Ingles Markets Inc. Class A | 44,931 | 1,134 |
| | Village Super Market Inc. | | |
| | Class A | 34,002 | 780 |
| * | Natural Grocers by Vitamin | | |
| | Cottage Inc. | 41,845 | 772 |
| | Roundy’s Inc. | 194,113 | 726 |
| | | | 489,859 |
| Food Products (21.0%) | | |
| | Mondelez International Inc. | | |
| | Class A | 2,034,122 | 73,615 |
| | Kraft Foods Group Inc. | 720,168 | 42,418 |
| | General Mills Inc. | 761,636 | 40,656 |
| | Archer-Daniels-Midland Co. | 792,468 | 39,512 |
| | | |
| | | | Market |
| | | | Value• |
| | | Shares | ($000) |
| | Mead Johnson Nutrition | | |
| | Co. | 247,290 | 23,641 |
| | Kellogg Co. | 330,313 | 21,460 |
| | Keurig Green Mountain Inc. | 156,913 | 20,920 |
| | Hershey Co. | 189,788 | 17,350 |
| | ConAgra Foods Inc. | 519,819 | 16,738 |
| | Tyson Foods Inc. Class A | 414,301 | 15,768 |
| | Bunge Ltd. | 182,240 | 15,427 |
| | JM Smucker Co. | 135,029 | 13,854 |
| | Campbell Soup Co. | 256,021 | 11,475 |
| | McCormick & Co. Inc. | 149,534 | 10,421 |
| | Hormel Foods Corp. | 186,552 | 9,455 |
| * | WhiteWave Foods Co. | | |
| | Class A | 238,203 | 8,342 |
| | Ingredion Inc. | 99,343 | 7,924 |
| * | Hain Celestial Group Inc. | 65,792 | 6,471 |
| * | TreeHouse Foods Inc. | 60,558 | 4,997 |
| | Flowers Foods Inc. | 253,618 | 4,966 |
| * | Darling Ingredients Inc. | 235,981 | 4,550 |
| * | Pilgrim’s Pride Corp. | 137,716 | 4,114 |
| | Sanderson Farms Inc. | 35,935 | 3,353 |
| | Pinnacle Foods Inc. | 88,144 | 2,852 |
| * | Post Holdings Inc. | 76,036 | 2,811 |
| | Lancaster Colony Corp. | 31,775 | 2,809 |
| | Cal-Maine Foods Inc. | 32,993 | 2,610 |
| | B&G Foods Inc. | 84,299 | 2,546 |
| | J&J Snack Foods Corp. | 26,812 | 2,539 |
| | Dean Foods Co. | 146,057 | 2,363 |
| | Fresh Del Monte Produce | | |
| | Inc. | 73,390 | 2,344 |
| | Snyder’s-Lance Inc. | 84,229 | 2,296 |
| * | Chiquita Brands | | |
| | International Inc. | 125,672 | 1,747 |
| * | Boulder Brands Inc. | 127,462 | 1,716 |
| * | Diamond Foods Inc. | 60,201 | 1,660 |
| | Calavo Growers Inc. | 38,503 | 1,500 |
| | Tootsie Roll Industries Inc. | 47,006 | 1,328 |
| * | Annie’s Inc. | 39,022 | 1,244 |
| | Limoneira Co. | 37,918 | 919 |
| * | Seneca Foods Corp. | | |
| | Class A | 28,529 | 861 |
| | | | 451,572 |
| Household Products (19.6%) | | |
| | Procter & Gamble Co. | 3,075,171 | 255,577 |
| | Colgate-Palmolive Co. | 1,113,224 | 72,059 |
| | Kimberly-Clark Corp. | 458,889 | 49,560 |
| | Clorox Co. | 159,690 | 14,149 |
| | Church & Dwight Co. Inc. | 172,996 | 11,805 |
| | Energizer Holdings Inc. | 79,554 | 9,667 |
| | Spectrum Brands Holdings | | |
| | Inc. | 39,746 | 3,442 |
| * | Harbinger Group Inc. | 179,434 | 2,324 |
| | WD-40 Co. | 30,622 | 2,104 |
| * | Central Garden and Pet Co. | | |
| | Class A | 105,711 | 952 |
| * | Central Garden and Pet Co. | 79,668 | 702 |
| | | | 422,341 |
| | | |
| | | | Market |
| | | | Value• |
| | | Shares | ($000) |
| Other (0.0%) | | |
| * | Energy Transfer Partners LP | 120 | 7 |
| |
| Personal Products (2.3%) | | |
| | Estee Lauder Cos. Inc. | | |
| | Class A | 289,351 | 22,231 |
| | Avon Products Inc. | 558,058 | 7,835 |
| | Herbalife Ltd. | 117,535 | 5,992 |
| | Nu Skin Enterprises Inc. | | |
| | Class A | 78,673 | 3,518 |
| | Coty Inc. Class A | 118,586 | 2,039 |
| * | Revlon Inc. Class A | 45,759 | 1,554 |
| * | Medifast Inc. | 45,527 | 1,530 |
| | Inter Parfums Inc. | 49,159 | 1,497 |
| * | USANA Health Sciences | | |
| | Inc. | 20,036 | 1,463 |
| * | Elizabeth Arden Inc. | 65,146 | 1,114 |
| | | | 48,773 |
| Tobacco (14.0%) | | |
| | Philip Morris International | | |
| | Inc. | 1,726,802 | 147,780 |
| | Altria Group Inc. | 2,274,831 | 98,000 |
| | Lorillard Inc. | 466,938 | 27,876 |
| | Reynolds American Inc. | 406,565 | 23,772 |
| | Vector Group Ltd. | 114,169 | 2,727 |
| | Universal Corp. | 39,745 | 2,097 |
| | | | 302,252 |
| Total Common Stocks | | |
| (Cost $1,713,220) | | 2,152,290 |
| Temporary Cash Investment (0.1%) | |
| Money Market Fund (0.1%) | | |
| 1 | Vanguard Market | | |
| | Liquidity Fund, 0.113% | | |
| | (Cost $2,029) | 2,029,181 | 2,029 |
| Total Investments (100.0%) | | |
| (Cost $1,715,249) | | 2,154,319 |
| Other Assets and Liabilities (0.0%) | |
| Other Assets | | 22,802 |
| Liabilities | | (23,608) |
| | | | (806) |
| Net Assets (100%) | | 2,153,513 |
20
Consumer Staples Index Fund
| |
| At August 31, 2014, net assets consisted of: |
| | Amount |
| | ($000) |
| Paid-in Capital | 1,690,803 |
| Undistributed Net Investment Income | 29,359 |
| Accumulated Net Realized Losses | (5,719) |
| Unrealized Appreciation (Depreciation) | 439,070 |
| Net Assets | 2,153,513 |
| |
| |
| Admiral Shares—Net Assets | |
| Applicable to 3,770,891 outstanding | |
| $.001 par value shares of beneficial | |
| interest (unlimited authorization) | 217,749 |
| Net Asset Value Per Share— | |
| Admiral Shares | $57.74 |
| |
| |
| ETF Shares—Net Assets | |
| Applicable to 16,528,642 outstanding | |
| $.001 par value shares of beneficial | |
| interest (unlimited authorization) | 1,935,764 |
| Net Asset Value Per Share— | |
| ETF Shares | $117.12 |
• See Note A in Notes to Financial Statements.
* Non-income-producing security.
1 Affiliated money market fund available only to Vanguard funds and certain trusts and accounts managed by Vanguard. Rate shown is the 7-day yield.
See accompanying Notes, which are an integral part of the Financial Statements.
21
Consumer Staples Index Fund
Statement of Operations
| |
| | Year Ended |
| August 31, 2014 |
| | ($000) |
| Investment Income | |
| Income | |
| Dividends | 50,048 |
| Interest1 | 2 |
| Securities Lending | 55 |
| Total Income | 50,105 |
| Expenses | |
| The Vanguard Group—Note B | |
| Investment Advisory Services | 307 |
| Management and Administrative— | |
| Admiral Shares | 166 |
| Management and Administrative— | |
| ETF Shares | 1,256 |
| Marketing and Distribution— | |
| Admiral Shares | 35 |
| Marketing and Distribution— | |
| ETF Shares | 351 |
| Custodian Fees | 21 |
| Auditing Fees | 32 |
| Shareholders’ Reports—Admiral Shares | 1 |
| Shareholders’ Reports—ETF Shares | 105 |
| Trustees’ Fees and Expenses | 1 |
| Total Expenses | 2,275 |
| Net Investment Income | 47,830 |
| Realized Net Gain (Loss) on | |
| Investment Securities Sold | 105,124 |
| Change in Unrealized Appreciation | |
| (Depreciation) of Investment Securities | 140,426 |
| Net Increase (Decrease) in Net Assets | |
| Resulting from Operations | 293,380 |
Statement of Changes in Net Assets
| | |
| | Year Ended August 31, |
| | 2014 | 2013 |
| | ($000) | ($000) |
| Increase (Decrease) in Net Assets | | |
| Operations | | |
| Net Investment Income | 47,830 | 40,503 |
| Realized Net Gain (Loss) | 105,124 | 41,476 |
| Change in Unrealized Appreciation (Depreciation) | 140,426 | 122,556 |
| Net Increase (Decrease) in Net Assets Resulting from Operations | 293,380 | 204,535 |
| Distributions | | |
| Net Investment Income | | |
| Admiral Shares | (4,382) | (3,154) |
| ETF Shares | (37,204) | (33,224) |
| Realized Capital Gain | | |
| Admiral Shares | — | — |
| ETF Shares | — | — |
| Total Distributions | (41,586) | (36,378) |
| Capital Share Transactions | | |
| Admiral Shares | 15,610 | 55,049 |
| ETF Shares | 229,831 | 218,086 |
| Net Increase (Decrease) from Capital Share Transactions | 245,441 | 273,135 |
| Total Increase (Decrease) | 497,235 | 441,292 |
| Net Assets | | |
| Beginning of Period | 1,656,278 | 1,214,986 |
| End of Period2 | 2,153,513 | 1,656,278 |
1 Interest income from an affiliated company of the fund was $2,000.2 Net Assets—End of Period includes undistributed (overdistributed) net investment income of $29,359,000 and $23,115,000.See accompanying Notes, which are an integral part of the Financial Statements.22
Consumer Staples Index Fund
Financial Highlights
| | | | | |
| Admiral Shares | | | | | |
| |
| For a Share Outstanding | Year Ended August 31, |
| Throughout Each Period | 2014 | 2013 | 2012 | 2011 | 2010 |
| Net Asset Value, Beginning of Period | $50.28 | $44.44 | $38.94 | $32.92 | $30.62 |
| Investment Operations | | | | | |
| Net Investment Income | 1.281 | 1.287 | 1.077 | .956 | .8601 |
| Net Realized and Unrealized Gain (Loss) | | | | | |
| on Investments | 7.379 | 5.832 | 5.357 | 6.013 | 2.290 |
| Total from Investment Operations | 8.660 | 7.119 | 6.434 | 6.969 | 3.150 |
| Distributions | | | | | |
| Dividends from Net Investment Income | (1.200) | (1.279) | (. 934) | (. 949) | (.850) |
| Distributions from Realized Capital Gains | — | — | — | — | — |
| Total Distributions | (1.200) | (1.279) | (. 934) | (. 949) | (.850) |
| Net Asset Value, End of Period | $57.74 | $50.28 | $44.44 | $38.94 | $32.92 |
| |
| Total Return2 | 17.41% | 16.44% | 16.81% | 21.39% | 10.34% |
| |
| Ratios/Supplemental Data | | | | | |
| Net Assets, End of Period (Millions) | $218 | $175 | $105 | $57 | $30 |
| Ratio of Total Expenses to Average Net Assets | 0.12% | 0.14% | 0.14% | 0.19% | 0.24% |
| Ratio of Net Investment Income to | | | | | |
| Average Net Assets | 2.52% | 2.80% | 2.80% | 2.74% | 2.61% |
| Portfolio Turnover Rate3 | 5% | 10% | 7% | 7% | 7% |
1 Calculated based on average shares outstanding.2 Total returns do not include transaction or account service fees that may have applied in the periods shown. Fund prospectuses provideinformation about any applicable transaction and account service fees.3 Excludes the value of portfolio securities received or delivered as a result of in-kind purchases or redemptions of the fund’s capital shares,including ETF Creation Units.
| | | | | |
| ETF Shares | | | | | |
| |
| For a Share Outstanding | Year Ended August 31, |
| Throughout Each Period | 2014 | 2013 | 2012 | 2011 | 2010 |
| Net Asset Value, Beginning of Period | $101.97 | $90.12 | $78.96 | $66.72 | $62.07 |
| Investment Operations | | | | | |
| Net Investment Income | 2.602 | 2.606 | 2.180 | 1.933 | 1.7531 |
| Net Realized and Unrealized Gain (Loss) | | | | | |
| on Investments | 14.976 | 11.835 | 10.874 | 12.213 | 4.635 |
| Total from Investment Operations | 17.578 | 14.441 | 13.054 | 14.146 | 6.388 |
| Distributions | | | | | |
| Dividends from Net Investment Income | (2.428) | (2.591) | (1.894) | (1.906) | (1.738) |
| Distributions from Realized Capital Gains | — | — | — | — | — |
| Total Distributions | (2.428) | (2.591) | (1.894) | (1.906) | (1.738) |
| Net Asset Value, End of Period | $117.12 | $101.97 | $90.12 | $78.96 | $66.72 |
| |
| Total Return | 17.42% | 16.43% | 16.80% | 21.41% | 10.33% |
| |
| Ratios/Supplemental Data | | | | | |
| Net Assets, End of Period (Millions) | $1,936 | $1,481 | $1,110 | $782 | $547 |
| Ratio of Total Expenses to Average Net Assets | 0.12% | 0.14% | 0.14% | 0.19% | 0.24% |
| Ratio of Net Investment Income to | | | | | |
| Average Net Assets | 2.52% | 2.80% | 2.80% | 2.74% | 2.61% |
| Portfolio Turnover Rate2 | 5% | 10% | 7% | 7% | 7% |
1 Calculated based on average shares outstanding.2 Excludes the value of portfolio securities received or delivered as a result of in-kind purchases or redemptions of the fund’s capital shares,including ETF Creation Units.See accompanying Notes, which are an integral part of the Financial Statements.
23
Consumer Staples Index Fund
Notes to Financial Statements
Vanguard Consumer Staples Index Fund is registered under the Investment Company Act of 1940 as an open-end investment company, or mutual fund. The fund offers two classes of shares: Admiral Shares and ETF Shares. Admiral Shares are designed for investors who meet certain administrative, service, and account-size criteria. ETF Shares are listed for trading on NYSE Arca; they can be purchased and sold through a broker.
A. The following significant accounting policies conform to generally accepted accounting principles for U.S. investment companies. The fund consistently follows such policies in preparing its financial statements.
1. Security Valuation: Securities are valued as of the close of trading on the New York Stock Exchange (generally 4 p.m., Eastern time) on the valuation date. Equity securities are valued at the latest quoted sales prices or official closing prices taken from the primary market in which each security trades; such securities not traded on the valuation date are valued at the mean of the latest quoted bid and asked prices. Securities for which market quotations are not readily available, or whose values have been materially affected by events occurring before the fund’s pricing time but after the close of the securities’ primary markets, are valued by methods deemed by the board of trustees to represent fair value. Investments in Vanguard Market Liquidity Fund are valued at that fund’s net asset value.
2. Federal Income Taxes: The fund intends to continue to qualify as a regulated investment company and distribute all of its taxable income. Management has analyzed the fund’s tax positions taken for all open federal income tax years (August 31, 2011–2014), and has concluded that no provision for federal income tax is required in the fund’s financial statements.
3. Distributions: Distributions to shareholders are recorded on the ex-dividend date.
4. Securities Lending: To earn additional income, the fund lends its securities to qualified institutional borrowers. Security loans are required to be secured at all times by collateral in an amount at least equal to the market value of securities loaned. Daily market fluctuations could cause the value of loaned securities to be more or less than the value of the collateral received. When this occurs, the collateral is adjusted and settled on the next business day. The fund further mitigates its counterparty risk by entering into securities lending transactions only with a diverse group of prequalified counterparties, monitoring their financial strength, and entering into master securities lending agreements with its counterparties. The master securities lending agreements provide that, in the event of a counterparty’s default (including bankruptcy), the fund may terminate any loans with that borrower, determine the net amount owed, and sell or retain the collateral up to the net amount owed to the fund; however, such actions may be subject to legal proceedings. While collateral mitigates counterparty risk, in the absence of a default the fund may experience delays and costs in recovering the securities loaned. The fund invests cash collateral received in Vanguard Market Liquidity Fund, and records a liability in the Statement of Net Assets for the return of the collateral, during the period the securities are on loan. Securities lending income represents fees charged to borrowers plus income earned on invested cash collateral, less expenses associated with the loan.
5. Credit Facility: The fund and certain other funds managed by The Vanguard Group participate in a $2.89 billion committed credit facility provided by a syndicate of lenders pursuant to a credit agreement that may be renewed annually; each fund is individually liable for its borrowings, if any, under the credit facility. Borrowings may be utilized for temporary and emergency purposes, and are subject to the fund’s regulatory and contractual borrowing restrictions. The participating funds are charged administrative fees and an annual commitment fee of 0.06% of the undrawn amount of the facility; these fees are allocated to the funds based on a method approved by the fund’s board of trustees and included in Management and Administrative expenses on the fund’s Statement of Operations. Any borrowings under this facility bear interest at a rate equal to the higher of the federal funds rate or LIBOR reference rate plus an agreed-upon spread.
The fund had no borrowings outstanding at August 31, 2014, or at any time during the period then ended.
6. Other: Dividend income is recorded on the ex-dividend date. Interest income includes income distributions received from Vanguard Market Liquidity Fund and is accrued daily. Security transactions are accounted for on the date securities are bought or sold. Costs used to determine realized gains (losses) on the sale of investment securities are those of the specific securities sold.
24
Consumer Staples Index Fund
Each class of shares has equal rights as to assets and earnings, except that each class separately bears certain class-specific expenses related to maintenance of shareholder accounts (included in Management and Administrative expenses) and shareholder reporting. Marketing and distribution expenses are allocated to each class of shares based on a method approved by the board of trustees. Income, other non-class-specific expenses, and gains and losses on investments are allocated to each class of shares based on its relative net assets.
B. The Vanguard Group furnishes at cost investment advisory, corporate management, administrative, marketing, and distribution services. The costs of such services are allocated to the fund based on methods approved by the board of trustees. The fund has committed to provide up to 0.40% of its net assets in capital contributions to Vanguard. At August 31, 2014, the fund had contributed capital of $202,000 to Vanguard (included in Other Assets), representing 0.01% of the fund’s net assets and 0.08% of Vanguard’s capitalization. The fund’s trustees and officers are also directors and officers of Vanguard.
C. Various inputs may be used to determine the value of the fund’s investments. These inputs are summarized in three broad levels for financial statement purposes. The inputs or methodologies used to value securities are not necessarily an indication of the risk associated with investing in those securities.
Level 1—Quoted prices in active markets for identical securities.
Level 2—Other significant observable inputs (including quoted prices for similar securities, interest rates, prepayment speeds, credit risk, etc.).
Level 3—Significant unobservable inputs (including the fund’s own assumptions used to determine the fair value of investments).
At August 31, 2014, 100% of the market value of the fund’s investments was determined based on Level 1 inputs.
D. Distributions are determined on a tax basis and may differ from net investment income and realized capital gains for financial reporting purposes. Differences may be permanent or temporary. Permanent differences are reclassified among capital accounts in the financial statements to reflect their tax character. Temporary differences arise when certain items of income, expense, gain, or loss are recognized in different periods for financial statement and tax purposes. These differences will reverse at some time in the future. Differences in classification may also result from the treatment of short-term gains as ordinary income for tax purposes.
During the year ended August 31, 2014, the fund realized $97,612,000 of net capital gains resulting from in-kind redemptions—in which shareholders exchanged fund shares for securities held by the fund rather than for cash. Because such gains are not taxable to the fund, and are not distributed to shareholders, they have been reclassified from accumulated net realized losses to paid-in capital.
For tax purposes, at August 31, 2014, the fund had $30,241,000 of ordinary income available for distribution. The fund used capital loss carryforwards of $7,694,000 to offset taxable capital gains realized during the year ended August 31, 2014. At August 31, 2014, the fund had available capital losses totaling $5,537,000 to offset future net capital gains through August 31, 2018.
At August 31, 2014, the cost of investment securities for tax purposes was $1,715,431,000. Net unrealized appreciation of investment securities for tax purposes was $438,888,000, consisting of unrealized gains of $450,153,000 on securities that had risen in value since their purchase and $11,265,000 in unrealized losses on securities that had fallen in value since their purchase.
E. During the year ended August 31, 2014, the fund purchased $583,718,000 of investment securities and sold $332,647,000 of investment securities, other than temporary cash investments. Purchases and sales include $431,513,000 and $243,060,000, respectively, in connection with in-kind purchases and redemptions of the fund’s capital shares.
25
Consumer Staples Index Fund
F. Capital share transactions for each class of shares were:
| | | | |
| | | 2014 | | | 2013 |
| | Amount | Shares | Amount | Shares |
| | ($000) | (000) | ($000) | (000) |
| Admiral Shares | | | | |
| Issued | 69,898 | 1,286 | 95,838 | 1,984 |
| Issued in Lieu of Cash Distributions | 3,879 | 73 | 2,782 | 63 |
| Redeemed | (58,167) | (1,074) | (43,571) | (914) |
| Net Increase (Decrease) —Admiral Shares | 15,610 | 285 | 55,049 | 1,133 |
| ETF Shares | | | | |
| Issued | 476,843 | 4,205 | 340,208 | 3,502 |
| Issued in Lieu of Cash Distributions | — | — | — | — |
| Redeemed | (247,012) | (2,200) | (122,122) | (1,300) |
| Net Increase (Decrease)—ETF Shares | 229,831 | 2,005 | 218,086 | 2,202 |
G. Management has determined that no material events or transactions occurred subsequent to August 31, 2014, that would require recognition or disclosure in these financial statements.
26
Energy Index Fund
Fund Profile
As of August 31, 2014
| | |
| Share-Class Characteristics | |
| | Admiral | ETF |
| | Shares | Shares |
| Ticker Symbol | VENAX | VDE |
| Expense Ratio1 | 0.14% | 0.14% |
| 30-Day SEC Yield | 1.92% | 1.92% |
| | | |
| Portfolio Characteristics | | |
| | | MSCI | |
| | | US IMI/ | MSCI |
| | | Energy | US IMI/ |
| | Fund | 25/50 | 2500 |
| Number of Stocks | 163 | 162 | 2,499 |
| Median Market Cap | $57.1B | $57.1B | $48.7B |
| Price/Earnings Ratio | 19.3x | 19.3x | 20.7x |
| Price/Book Ratio | 2.2x | 2.2x | 2.7x |
| Return on Equity | 15.5% | 15.5% | 18.0% |
| Earnings Growth Rate | 8.1% | 8.1% | 15.2% |
| Dividend Yield | 2.0% | 2.0% | 1.9% |
| Foreign Holdings | 0.0% | 0.0% | 0.0% |
| Turnover Rate | 4% | — | — |
| Short-Term Reserves | 0.0% | — | — |
| | |
| Volatility Measures | | |
| | MSCI US | |
| | IMI/Energy | MSCI US |
| | 25/50 | IMI/2500 |
| R-Squared | 1.00 | 0.80 |
| Beta | 1.00 | 1.38 |
| These measures show the degree and timing of the fund’s fluctuations compared with the indexes over 36 months. |
|
| |
| Subindustry Diversification | |
| (% of equity exposure) | |
| |
| Coal & Consumable Fuels | 0.8% |
| Integrated Oil & Gas | 36.6 |
| Oil & Gas Drilling | 2.7 |
| Oil & Gas Equipment & Services | 17.8 |
| Oil & Gas Exploration & Production | 28.5 |
| Oil & Gas Refining & Marketing | 6.3 |
| Oil & Gas Storage & Transportation | 7.3 |
| | |
| Ten Largest Holdings (% of total net assets) |
| |
| Exxon Mobil Corp. | Integrated Oil & Gas | 19.9% |
| Chevron Corp. | Integrated Oil & Gas | 11.5 |
| Schlumberger Ltd. | Oil & Gas Equipment | |
| | & Services | 6.7 |
| ConocoPhillips | Oil & Gas Exploration | |
| | & Production | 4.7 |
| Occidental | | |
| Petroleum Corp. | Integrated Oil & Gas | 3.8 |
| EOG Resources | Oil & Gas Exploration | |
| Inc. | & Production | 2.8 |
| Halliburton Co. | Oil & Gas Equipment | |
| | & Services | 2.7 |
| Anadarko | Oil & Gas Exploration | |
| Petroleum Corp. | & Production | 2.7 |
| Phillips 66 | Oil & Gas Refining | |
| | & Marketing | 2.3 |
| Williams Cos. Inc. | Oil & Gas Storage | |
| | & Transportation | 1.9 |
| Top Ten | | 59.0% |
| The holdings listed exclude any temporary cash investments and equity index products. |
|
1 The expense ratios shown are from the prospectus dated December 23, 2013, and represent estimated costs for the current fiscal year. For the fiscal year ended August 31, 2014, the expense ratios were 0.12% for
Admiral Shares and 0.12% for ETF Shares.
27
Energy Index Fund
Performance Summary
All of the returns in this report represent past performance, which is not a guarantee of future results that may be achieved by the fund. (Current performance may be lower or higher than the performance data cited. For performance data current to the most recent month-end, visit our website at vanguard.com/performance.) Note, too, that both investment returns and principal value can fluctuate widely, so an investor’s shares, when sold, could be worth more or less than their original cost. The returns shown do not reflect taxes that a shareholder would pay on fund distributions or on the sale of fund shares.
Cumulative Performance: September 23, 2004–August 31, 2014
Initial Investment of $10,000
| | | | |
| | | Average Annual Total Returns | |
| | Periods Ended August 31, 2014 | |
| | | | Since | Final Value |
| | | | Inception | of a $10,000 |
| | One Year | Five Years | (9/23/2004) | Investment |
| Energy Index Fund | | | | |
| ETF Shares Net Asset Value | 24.31% | 15.56% | 12.74% | $32,929 |
| Energy Index Fund | | | | |
| ETF Shares Market Price | 24.30 | 15.53 | 12.74 | 32,929 |
| Spliced US IMI/Energy 25/50 | 24.44 | 15.34 | 12.61 | 32,535 |
| Natural Resources Funds Average | 24.58 | 14.31 | 11.52 | 29,549 |
| MSCI US IMI/2500 | 24.94 | 17.33 | 9.02 | 23,578 |
For a benchmark description, see the Glossary.
Natural Resources Funds Average: Derived from data provided by Lipper, a Thomson Reuters Company.
“Since Inception” performance is calculated from the ETF Shares’ inception date for both the fund and its comparative standards.
| | | | |
| | | | Since | Final Value |
| | | | Inception | of a $100,000 |
| | One Year | Five Years | (10/7/2004) | Investment |
| Energy Index Fund Admiral Shares | 24.32% | 15.56% | 12.15% | $311,025 |
| Spliced US IMI/Energy 25/50 | 24.44 | 15.34 | 11.99 | 306,824 |
| MSCI US IMI/2500 | 24.94 | 17.33 | 8.82 | 230,826 |
| “Since Inception” performance is calculated from the Admiral Shares’ inception date for both the fund and its comparative standards. |
See Financial Highlights for dividend and capital gains information.
28
Energy Index Fund
Fiscal-Year Total Returns (%): September 23, 2004–August 31, 2014
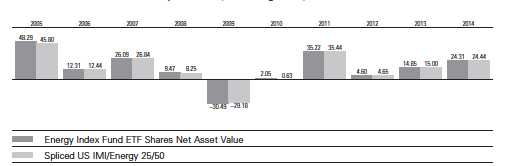
For a benchmark description, see the Glossary.
| | | |
| Cumulative Returns: ETF Shares, September 23, 2004–August 31, 2014 | | |
| | | | Since |
| | | | Inception |
| | One Year | Five Years | (9/23/2004) |
| Energy Index Fund ETF Shares Market Price | 24.30% | 105.81% | 229.29% |
| Energy Index Fund ETF Shares Net Asset Value | 24.31 | 106.07 | 229.29 |
| Spliced US IMI/Energy 25/50 | 24.44 | 104.09 | 225.35 |
| “Since Inception” performance is calculated from the ETF Shares’ inception date for both the fund and its comparative standards. |
Average Annual Total Returns: Periods Ended June 30, 2014
This table presents total returns through the latest calendar quarter—rather than through the end of the fiscal
period. Securities and Exchange Commission rules require that we provide this information.
| | | | |
| | | | | Since |
| | Inception Date | One Year | Five Years | Inception |
| ETF Shares | 9/23/2004 | | | |
| Market Price | | 30.34% | 17.40% | 13.12% |
| Net Asset Value | | 30.37 | 17.39 | 13.12 |
| Admiral Shares | 10/7/2004 | 30.37 | 17.39 | 12.51 |
See Financial Highlights for dividend and capital gains information.
29
Energy Index Fund
Financial Statements
Statement of Net Assets
As of August 31, 2014
The fund reports a complete list of its holdings in regulatory filings four times in each fiscal year, at the quarter-ends. For the second and fourth fiscal quarters, the lists appear in the fund’s semiannual and annual reports to shareholders. For the first and third fiscal quarters, the fund files the lists with the Securities and Exchange Commission on Form N-Q. Shareholders can look up the fund’s Forms N-Q on the SEC’s website at sec.gov. Forms N-Q may also be reviewed and copied at the SEC’s Public Reference Room (see the back cover of this report for further information).
| | | |
| | | | Market |
| | | | Value• |
| | | Shares | ($000) |
| Common Stocks (100.0%) | | |
| Energy Equipment & Services (20.6%) | |
| | Oil & Gas Drilling (2.8%) | | |
| | Ensco plc Class A | 440,904 | 22,257 |
| | Helmerich & Payne Inc. | 204,132 | 21,444 |
| | Nabors Industries Ltd. | 505,426 | 13,753 |
| | Noble Corp. plc | 479,063 | 13,634 |
| | Patterson-UTI Energy Inc. | 272,325 | 9,406 |
| | Rowan Cos. plc Class A | 234,407 | 7,107 |
| * | Atwood Oceanics Inc. | 115,082 | 5,686 |
| ^ | Diamond Offshore Drilling | | |
| | Inc. | 129,146 | 5,675 |
| * | Unit Corp. | 84,126 | 5,536 |
| * | Pioneer Energy Services | | |
| | Corp. | 118,330 | 1,820 |
| * | Paragon Offshore plc | 159,687 | 1,488 |
| * | Parker Drilling Co. | 226,811 | 1,424 |
| * | Hercules Offshore Inc. | 302,783 | 1,021 |
| * | Vantage Drilling Co. | 375,897 | 669 |
| |
| | Oil & Gas Equipment & Services (17.8%) |
| | Schlumberger Ltd. | 2,452,667 | 268,910 |
| | Halliburton Co. | 1,592,653 | 107,679 |
| | National Oilwell Varco Inc. | 808,049 | 69,840 |
| | Baker Hughes Inc. | 822,049 | 56,837 |
| * | Weatherford | | |
| | International plc | 1,447,705 | 34,296 |
| * | Cameron International | | |
| | Corp. | 385,161 | 28,629 |
| * | FMC Technologies Inc. | 443,721 | 27,440 |
| | Oceaneering International | | |
| | Inc. | 203,591 | 14,162 |
| | Core Laboratories NV | 84,614 | 13,368 |
| | Superior Energy Services | | |
| | Inc. | 295,071 | 10,575 |
| * | Dresser-Rand Group Inc. | 144,159 | 9,990 |
| * | Dril-Quip Inc. | 76,957 | 7,809 |
| * | Oil States International Inc. | 90,489 | 5,841 |
| | Exterran Holdings Inc. | 113,134 | 5,276 |
| * | Helix Energy Solutions | | |
| | Group Inc. | 188,951 | 5,162 |
| | Bristow Group Inc. | 66,969 | 4,887 |
| | Tidewater Inc. | 93,720 | 4,768 |
| | CARBO Ceramics Inc. | 39,236 | 4,221 |
| * | Forum Energy | | |
| | Technologies Inc. | 114,657 | 3,904 |
| * | McDermott International | | |
| | Inc. | 447,624 | 3,223 |
| * | SEACOR Holdings Inc. | 36,952 | 3,015 |
| | RPC Inc. | 123,797 | 2,819 |
| * | Hornbeck Offshore | | |
| | Services Inc. | 61,572 | 2,688 |
| * | C&J Energy Services Inc. | 83,589 | 2,398 |
| * | Newpark Resources Inc. | 159,797 | 1,970 |
| | Gulfmark Offshore Inc. | 48,301 | 1,942 |
| * | TETRA Technologies Inc. | 148,730 | 1,755 |
| * | Seventy Seven Energy Inc. | 71,546 | 1,679 |
| | | |
| | | | Market |
| | | | Value• |
| | | Shares | ($000) |
| * | Key Energy Services Inc. | 260,355 | 1,640 |
| * | Basic Energy Services Inc. | 65,156 | 1,578 |
| | Frank’s International NV | 72,335 | 1,458 |
| * | Matrix Service Co. | 49,598 | 1,399 |
| | Tesco Corp. | 64,307 | 1,365 |
| * | RigNet Inc. | 24,865 | 1,161 |
| * | Geospace Technologies | | |
| | Corp. | 24,837 | 1,021 |
| * | PHI Inc. | 22,554 | 964 |
| * | Era Group Inc. | 36,440 | 933 |
| * | ION Geophysical Corp. | 247,309 | 853 |
| * | Willbros Group Inc. | 75,495 | 826 |
| * | Natural Gas Services Group | |
| | Inc. | 23,444 | 696 |
| | Gulf Island Fabrication Inc. | 26,045 | 549 |
| *,^ | Nuverra Environmental | | |
| | Solutions Inc. | 29,514 | 399 |
| | | | 830,845 |
| Oil, Gas & Consumable Fuels (79.4%) | |
| | Coal & Consumable Fuels (0.8%) | |
| | CONSOL Energy Inc. | 433,918 | 17,478 |
| | Peabody Energy Corp. | 511,320 | 8,120 |
| * | Cloud Peak Energy Inc. | 114,894 | 1,805 |
| * | Alpha Natural Resources | | |
| | Inc. | 416,387 | 1,645 |
| | Arch Coal Inc. | 397,794 | 1,213 |
| * | Solazyme Inc. | 107,404 | 1,007 |
| |
| | Integrated Oil & Gas (36.5%) | |
| | Exxon Mobil Corp. | 8,098,643 | 805,491 |
| | Chevron Corp. | 3,590,099 | 464,738 |
| | Occidental Petroleum | | |
| | Corp. | 1,481,559 | 153,682 |
| | Hess Corp. | 533,441 | 53,931 |
| |
| | Oil & Gas Exploration & Production (28.5%) |
| | ConocoPhillips | 2,315,319 | 188,050 |
| | EOG Resources Inc. | 1,030,704 | 113,254 |
| | Anadarko Petroleum Corp. | 952,590 | 107,347 |
| | Apache Corp. | 727,338 | 74,065 |
| | Pioneer Natural Resources | | |
| | Co. | 269,789 | 56,291 |
| | Devon Energy Corp. | 730,969 | 55,130 |
| | Marathon Oil Corp. | 1,275,350 | 53,169 |
| | Noble Energy Inc. | 680,163 | 49,067 |
| * | Concho Resources Inc. | 210,806 | 29,943 |
| | EQT Corp. | 286,287 | 28,360 |
| * | Southwestern Energy Co. | 666,034 | 27,427 |
| | Chesapeake Energy Corp. | 1,005,281 | 27,344 |
| | Cabot Oil & Gas Corp. | 787,029 | 26,397 |
| | Range Resources Corp. | 309,218 | 24,301 |
| | Cimarex Energy Co. | 164,090 | 23,819 |
| * | Whiting Petroleum Corp. | 224,470 | 20,799 |
| | Murphy Oil Corp. | 321,687 | 20,096 |
| * | Continental Resources Inc. | 87,718 | 14,148 |
| * | Newfield Exploration Co. | 256,938 | 11,516 |
| | QEP Resources Inc. | 322,418 | 11,468 |
| | | |
| | | | Value• |
| | | Shares | ($000) |
| | Denbury Resources Inc. | 662,685 | 11,411 |
| | SM Energy Co. | 126,394 | 11,254 |
| | Energen Corp. | 137,160 | 11,039 |
| * | WPX Energy Inc. | 361,898 | 9,634 |
| * | Gulfport Energy Corp. | 160,988 | 9,418 |
| * | Oasis Petroleum Inc. | 190,731 | 9,382 |
| * | Cobalt International Energy | | |
| | Inc. | 544,045 | 8,351 |
| * | Kodiak Oil & Gas Corp. | 502,265 | 8,172 |
| * | Diamondback Energy Inc. | 89,530 | 7,731 |
| *,^ | Ultra Petroleum Corp. | 288,644 | 7,658 |
| | LinnCo LLC | 242,224 | 7,618 |
| * | Athlon Energy Inc. | 127,882 | 5,952 |
| * | Rosetta Resources Inc. | 115,817 | 5,791 |
| * | Antero Resources Corp. | 98,754 | 5,713 |
| * | Carrizo Oil & Gas Inc. | 81,475 | 5,110 |
| * | PDC Energy Inc. | 67,484 | 4,055 |
| * | Bonanza Creek Energy Inc. | 60,974 | 3,744 |
| * | Stone Energy Corp. | 104,512 | 3,678 |
| *,^ | SandRidge Energy Inc. | 697,628 | 3,656 |
| * | Gran Tierra Energy Inc. | 534,166 | 3,584 |
| * | Matador Resources Co. | 130,990 | 3,584 |
| * | Sanchez Energy Corp. | 98,628 | 3,273 |
| * | Laredo Petroleum Inc. | 135,381 | 3,200 |
| *,^ | Halcon Resources Corp. | 475,434 | 2,615 |
| | Energy XXI Bermuda Ltd. | 158,196 | 2,610 |
| * | Kosmos Energy Ltd. | 219,159 | 2,196 |
| * | Magnum Hunter Resources | | |
| | Corp. | 317,462 | 2,194 |
| * | Bill Barrett Corp. | 93,681 | 2,133 |
| | Comstock Resources Inc. | 85,699 | 2,089 |
| * | Penn Virginia Corp. | 123,611 | 1,857 |
| * | Northern Oil and Gas Inc. | 109,209 | 1,840 |
| * | EP Energy Corp. Class A | 92,401 | 1,786 |
| ^ | EXCO Resources Inc. | 308,434 | 1,490 |
| * | Goodrich Petroleum Corp. | 66,770 | 1,476 |
| * | Triangle Petroleum Corp. | 121,526 | 1,457 |
| * | Rex Energy Corp. | 91,848 | 1,403 |
| * | Clayton Williams Energy | | |
| | Inc. | 11,460 | 1,357 |
| * | Approach Resources Inc. | 70,500 | 1,261 |
| * | Contango Oil & Gas Co. | 30,875 | 1,223 |
| | W&T Offshore Inc. | 71,217 | 1,063 |
| * | Swift Energy Co. | 82,606 | 938 |
| * | VAALCO Energy Inc. | 101,026 | 924 |
| * | Emerald Oil Inc. | 99,014 | 847 |
| * | Resolute Energy Corp. | 94,504 | 759 |
| * | PetroQuest Energy Inc. | 99,474 | 663 |
| * | Ring Energy Inc. | 33,646 | 578 |
| * | Midstates Petroleum Co. | | |
| | Inc. | 66,280 | 468 |
| * | TransAtlantic Petroleum Ltd. | 41,984 | 461 |
| * | BPZ Resources Inc. | 186,641 | 457 |
| | Evolution Petroleum Corp. | 43,103 | 432 |
| * | Quicksilver Resources Inc. | 202,360 | 269 |
| * | Apco Oil and Gas | | |
| | International Inc. | 15,915 | 226 |
30
Energy Index Fund
| | | |
| | | | Market |
| | | | Value• |
| | | Shares | ($000) |
| | Oil & Gas Refining & Marketing (6.3%) |
| | Phillips 66 | 1,067,189 | 92,867 |
| | Valero Energy Corp. | 1,006,502 | 54,492 |
| | Marathon Petroleum Corp. | 544,268 | 49,534 |
| | HollyFrontier Corp. | 356,217 | 17,822 |
| | Tesoro Corp. | 244,090 | 15,802 |
| | World Fuel Services Corp. | 135,645 | 6,020 |
| | Western Refining Inc. | 105,322 | 4,901 |
| | PBF Energy Inc. Class A | 165,225 | 4,694 |
| | Delek US Holdings Inc. | 100,515 | 3,516 |
| | Green Plains Inc. | 51,804 | 2,315 |
| ^ | CVR Energy Inc. | 32,768 | 1,626 |
| *,^ | Clean Energy Fuels Corp. | 135,506 | 1,351 |
| | Alon USA Energy Inc. | 52,250 | 869 |
| |
| | Oil & Gas Storage & Transportation (7.3%) |
| | Williams Cos. Inc. | 1,323,964 | 78,696 |
| | Spectra Energy Corp. | 1,265,149 | 52,706 |
| | Kinder Morgan Inc. | 1,260,427 | 50,745 |
| * | Cheniere Energy Inc. | 426,265 | 34,212 |
| | ONEOK Inc. | 392,124 | 27,527 |
| * | Kinder Morgan | | |
| | Management LLC | 196,246 | 19,177 |
| | Targa Resources Corp. | 71,599 | 9,992 |
| ^ | Plains GP Holdings LP | | |
| | Class A | 255,946 | 7,899 |
| | SemGroup Corp. Class A | 80,344 | 7,049 |
| * | Enbridge Energy | | |
| | Management LLC | 94,310 | 3,378 |
| | EnLink Midstream LLC | 77,328 | 3,178 |
| | | | 3,211,549 |
| Total Common Stocks | | |
| (Cost $3,123,537) | | 4,042,394 |
| Temporary Cash Investment (0.2%) | |
| Money Market Fund (0.2%) | | |
| 1,2 | Vanguard Market | | |
| | Liquidity Fund, 0.113% | | |
| | (Cost $9,368) | 9,368,201 | 9,368 |
| Total Investments (100.2%) | | |
| (Cost $3,132,905) | | 4,051,762 |
| Other Assets and Liabilities (–0.2%) | |
| Other Assets | | 28,383 |
| Liabilities2 | | (37,939) |
| | | | (9,556) |
| Net Assets (100%) | | 4,042,206 |
| |
| At August 31, 2014, net assets consisted of: |
| | Amount |
| | ($000) |
| Paid-in Capital | 3,150,430 |
| Undistributed Net Investment Income | 46,636 |
| Accumulated Net Realized Losses | (73,717) |
| Unrealized Appreciation (Depreciation) | 918,857 |
| Net Assets | 4,042,206 |
| |
| |
| Admiral Shares—Net Assets | |
| Applicable to 8,092,711 outstanding | |
| $.001 par value shares of beneficial | |
| interest (unlimited authorization) | 575,091 |
| Net Asset Value Per Share— | |
| Admiral Shares | $71.06 |
| |
| |
| ETF Shares—Net Assets | |
| Applicable to 24,371,918 outstanding | |
| $.001 par value shares of beneficial | |
| interest (unlimited authorization) | 3,467,115 |
| Net Asset Value Per Share— | |
| ETF Shares | $142.26 |
• See Note A in Notes to Financial Statements.
* Non-income-producing security.
^ Includes partial security positions on loan to broker-dealers. The total value of securities on loan is $9,027,000.
1 Affiliated money market fund available only to Vanguard funds and certain trusts and accounts managed by Vanguard. Rate shown is the 7-day yield.
2 Includes $9,368,000 of collateral received for securities on loan.
See accompanying Notes, which are an integral part of the Financial Statements.
31
Energy Index Fund
Statement of Operations
| |
| | Year Ended |
| August 31, 2014 |
| | ($000) |
| Investment Income | |
| Income | |
| Dividends | 68,924 |
| Interest1 | 3 |
| Securities Lending | 348 |
| Total Income | 69,275 |
| Expenses | |
| The Vanguard Group—Note B | |
| Investment Advisory Services | 522 |
| Management and Administrative— | |
| Admiral Shares | 401 |
| Management and Administrative— | |
| ETF Shares | 2,252 |
| Marketing and Distribution— | |
| Admiral Shares | 106 |
| Marketing and Distribution— | |
| ETF Shares | 453 |
| Custodian Fees | 35 |
| Auditing Fees | 32 |
| Shareholders’ Reports—Admiral Shares | 6 |
| Shareholders’ Reports—ETF Shares | 149 |
| Trustees’ Fees and Expenses | 2 |
| Total Expenses | 3,958 |
| Net Investment Income | 65,317 |
| Realized Net Gain (Loss) on | |
| Investment Securities Sold | 145,782 |
| Change in Unrealized Appreciation | |
| (Depreciation) of Investment Securities | 485,296 |
| Net Increase (Decrease) in Net Assets | |
| Resulting from Operations | 696,395 |
Statement of Changes in Net Assets
| | |
| | Year Ended August 31, |
| | 2014 | 2013 |
| | ($000) | ($000) |
| Increase (Decrease) in Net Assets | | |
| Operations | | |
| Net Investment Income | 65,317 | 49,221 |
| Realized Net Gain (Loss) | 145,782 | 19,745 |
| Change in Unrealized Appreciation (Depreciation) | 485,296 | 264,452 |
| Net Increase (Decrease) in Net Assets Resulting from Operations | 696,395 | 333,418 |
| Distributions | | |
| Net Investment Income | | |
| Admiral Shares | (9,355) | (4,899) |
| ETF Shares | (44,452) | (36,201) |
| Realized Capital Gain | | |
| Admiral Shares | — | — |
| ETF Shares | — | — |
| Total Distributions | (53,807) | (41,100) |
| Capital Share Transactions | | |
| Admiral Shares | 20,148 | 156,997 |
| ETF Shares | 664,185 | 95,107 |
| Net Increase (Decrease) from Capital Share Transactions | 684,333 | 252,104 |
| Total Increase (Decrease) | 1,326,921 | 544,422 |
| Net Assets | | |
| Beginning of Period | 2,715,285 | 2,170,863 |
| End of Period2 | 4,042,206 | 2,715,285 |
1 Interest income from an affiliated company of the fund was $3,000.
2 Net Assets—End of Period includes undistributed (overdistributed) net investment income of $46,636,000 and $35,126,000.
See accompanying Notes, which are an integral part of the Financial Statements.
32
Energy Index Fund
Financial Highlights
| | | | | |
| Admiral Shares | | | | | |
| |
| For a Share Outstanding | Year Ended August 31, |
| Throughout Each Period | 2014 | 2013 | 2012 | 2011 | 2010 |
| Net Asset Value, Beginning of Period | $58.18 | $51.63 | $50.17 | $37.58 | $37.34 |
| Investment Operations | | | | | |
| Net Investment Income | 1.164 | 1.108 | .913 | .708 | .654 |
| Net Realized and Unrealized Gain (Loss) | | | | | |
| on Investments | 12.815 | 6.439 | 1.358 | 12.508 | .166 |
| Total from Investment Operations | 13.979 | 7.547 | 2.271 | 13.216 | . 820 |
| Distributions | | | | | |
| Dividends from Net Investment Income | (1.099) | (. 997) | (.811) | (. 626) | (. 580) |
| Distributions from Realized Capital Gains | — | — | — | — | — |
| Total Distributions | (1.099) | (. 997) | (.811) | (. 626) | (. 580) |
| Net Asset Value, End of Period | $71.06 | $58.18 | $51.63 | $50.17 | $37.58 |
| |
| Total Return1 | 24.32% | 14.86% | 4.61% | 35.21% | 2.05% |
| |
| Ratios/Supplemental Data | | | | | |
| Net Assets, End of Period (Millions) | $575 | $460 | $254 | $237 | $131 |
| Ratio of Total Expenses to Average Net Assets | 0.12% | 0.14% | 0.14% | 0.19% | 0.24% |
| Ratio of Net Investment Income to | | | | | |
| Average Net Assets | 1.98% | 2.02% | 1.81% | 1.48% | 1.71% |
| Portfolio Turnover Rate2 | 4% | 9% | 12% | 11% | 16% |
1 Total returns do not include transaction and account service fees that may have applied in the periods shown. Fund prospectuses provide
information about any applicable transaction and account service fees.
2 Excludes the value of portfolio securities received or delivered as a result of in-kind purchases or redemptions of the fund’s capital shares,
including ETF Creation Units.
| | | | | |
| ETF Shares | | | | | |
| |
| For a Share Outstanding | Year Ended August 31, |
| Throughout Each Period | 2014 | 2013 | 2012 | 2011 | 2010 |
| Net Asset Value, Beginning of Period | $116.47 | $103.35 | $100.41 | $75.20 | $74.74 |
| Investment Operations | | | | | |
| Net Investment Income | 2.329 | 2.215 | 1.827 | 1.417 | 1.312 |
| Net Realized and Unrealized Gain (Loss) | | | | | |
| on Investments | 25.655 | 12.899 | 2.731 | 25.040 | .341 |
| Total from Investment Operations | 27.984 | 15.114 | 4.558 | 26.457 | 1.653 |
| Distributions | | | | | |
| Dividends from Net Investment Income | (2.194) | (1.994) | (1.618) | (1.247) | (1.193) |
| Distributions from Realized Capital Gains | — | — | — | — | — |
| Total Distributions | (2.194) | (1.994) | (1.618) | (1.247) | (1.193) |
| Net Asset Value, End of Period | $142.26 | $116.47 | $103.35 | $100.41 | $75.20 |
| |
| Total Return | 24.31% | 14.85% | 4.60% | 35.22% | 2.05% |
| |
| Ratios/Supplemental Data | | | | | |
| Net Assets, End of Period (Millions) | $3,467 | $2,255 | $1,917 | $1,782 | $1,041 |
| Ratio of Total Expenses to Average Net Assets | 0.12% | 0.14% | 0.14% | 0.19% | 0.24% |
| Ratio of Net Investment Income to | | | | | |
| Average Net Assets | 1.98% | 2.02% | 1.81% | 1.48% | 1.71% |
| Portfolio Turnover Rate1 | 4% | 9% | 12% | 11% | 16% |
| 1 Excludes the value of portfolio securities received or delivered as a result of in-kind purchases or redemptions of the fund’s capital shares, including ETF Creation Units. |
|
See accompanying Notes, which are an integral part of the Financial Statements.
33
Energy Index Fund
Notes to Financial Statements
Vanguard Energy Index Fund is registered under the Investment Company Act of 1940 as an open-end investment company, or mutual fund. The fund offers two classes of shares: Admiral Shares and ETF Shares. Admiral Shares are designed for investors who meet certain administrative, service, and account-size criteria. ETF Shares are listed for trading on NYSE Arca; they can be purchased and sold through a broker.
A. The following significant accounting policies conform to generally accepted accounting principles for U.S. investment companies. The fund consistently follows such policies in preparing its financial statements.
1. Security Valuation: Securities are valued as of the close of trading on the New York Stock Exchange (generally 4 p.m., Eastern time) on the valuation date. Equity securities are valued at the latest quoted sales prices or official closing prices taken from the primary market in which each security trades; such securities not traded on the valuation date are valued at the mean of the latest quoted bid and asked prices. Securities for which market quotations are not readily available, or whose values have been materially affected by events occurring before the fund’s pricing time but after the close of the securities’ primary markets, are valued by methods deemed by the board of trustees to represent fair value. Investments in Vanguard Market Liquidity Fund are valued at that fund’s net asset value.
2. Federal Income Taxes: The fund intends to continue to qualify as a regulated investment company and distribute all of its taxable income. Management has analyzed the fund’s tax positions taken for all open federal income tax years (August 31, 2011–2014), and has concluded that no provision for federal income tax is required in the fund’s financial statements.
3. Distributions: Distributions to shareholders are recorded on the ex-dividend date.
4. Securities Lending: To earn additional income, the fund lends its securities to qualified institutional borrowers. Security loans are required to be secured at all times by collateral in an amount at least equal to the market value of securities loaned. Daily market fluctuations could cause the value of loaned securities to be more or less than the value of the collateral received. When this occurs, the collateral is adjusted and settled on the next business day. The fund further mitigates its counterparty risk by entering into securities lending transactions only with a diverse group of prequalified counterparties, monitoring their financial strength, and entering into master securities lending agreements with its counterparties. The master securities lending agreements provide that, in the event of a counterparty’s default (including bankruptcy), the fund may terminate any loans with that borrower, determine the net amount owed, and sell or retain the collateral up to the net amount owed to the fund; however, such actions may be subject to legal proceedings. While collateral mitigates counterparty risk, in the absence of a default the fund may experience delays and costs in recovering the securities loaned. The fund invests cash collateral received in Vanguard Market Liquidity Fund, and records a liability in the Statement of Net Assets for the return of the collateral, during the period the securities are on loan. Securities lending income represents fees charged to borrowers plus income earned on invested cash collateral, less expenses associated with the loan.
5. Credit Facility: The fund and certain other funds managed by The Vanguard Group participate in a $2.89 billion committed credit facility provided by a syndicate of lenders pursuant to a credit agreement that may be renewed annually; each fund is individually liable for its borrowings, if any, under the credit facility. Borrowings may be utilized for temporary and emergency purposes, and are subject to the fund’s regulatory and contractual borrowing restrictions. The participating funds are charged administrative fees and an annual commitment fee of 0.06% of the undrawn amount of the facility; these fees are allocated to the funds based on a method approved by the fund’s board of trustees and included in Management and Administrative expenses on the fund’s Statement of Operations. Any borrowings under this facility bear interest at a rate equal to the higher of the federal funds rate or LIBOR reference rate plus an agreed-upon spread.
The fund had no borrowings outstanding at August 31, 2014, or at any time during the period then ended.
6. Other: Dividend income is recorded on the ex-dividend date. Interest income includes income distributions received from Vanguard Market Liquidity Fund and is accrued daily. Security transactions are accounted for on the date securities are bought or sold. Costs used to determine realized gains (losses) on the sale of investment securities are those of the specific securities sold.
34
Energy Index Fund
Each class of shares has equal rights as to assets and earnings, except that each class separately bears certain class-specific expenses related to maintenance of shareholder accounts (included in Management and Administrative expenses) and shareholder reporting. Marketing and distribution expenses are allocated to each class of shares based on a method approved by the board of trustees. Income, other non-class-specific expenses, and gains and losses on investments are allocated to each class of shares based on its relative net assets.
B. The Vanguard Group furnishes at cost investment advisory, corporate management, administrative, marketing, and distribution services. The costs of such services are allocated to the fund based on methods approved by the board of trustees. The fund has committed to provide up to 0.40% of its net assets in capital contributions to Vanguard. At August 31, 2014, the fund had contributed capital of $399,000 to Vanguard (included in Other Assets), representing 0.01% of the fund’s net assets and 0.16% of Vanguard’s capitalization. The fund’s trustees and officers are also directors and officers of Vanguard.
C. Various inputs may be used to determine the value of the fund’s investments. These inputs are summarized in three broad levels for financial statement purposes. The inputs or methodologies used to value securities are not necessarily an indication of the risk associated with investing in those securities.
Level 1—Quoted prices in active markets for identical securities.
Level 2—Other significant observable inputs (including quoted prices for similar securities, interest rates, prepayment speeds, credit risk, etc.).
Level 3—Significant unobservable inputs (including the fund’s own assumptions used to determine the fair value of investments).
At August 31, 2014, 100% of the market value of the fund’s investments was determined based on Level 1 inputs.
D. Distributions are determined on a tax basis and may differ from net investment income and realized capital gains for financial reporting purposes. Differences may be permanent or temporary. Permanent differences are reclassified among capital accounts in the financial statements to reflect their tax character. Temporary differences arise when certain items of income, expense, gain, or loss are recognized in different periods for financial statement and tax purposes. These differences will reverse at some time in the future. Differences in classification may also result from the treatment of short-term gains as ordinary income for tax purposes.
During the year ended August 31, 2014, the fund realized $145,840,000 of net capital gains resulting from in-kind redemptions—in which shareholders exchanged fund shares for securities held by the fund rather than for cash. Because such gains are not taxable to the fund, and are not distributed to shareholders, they have been reclassified from accumulated net realized losses to paid-in capital.
For tax purposes, at August 31, 2014, the fund had $48,275,000 of ordinary income available for distribution. At August 31, 2014, the fund had available capital losses totaling $73,716,000 to offset future net capital gains. Of this amount, $68,284,000 is subject to expiration dates; $37,585,000 may be used to offset future net capital gains through August 31, 2018, and $30,699,000 through August 31, 2019. Capital losses of $5,432,000 realized beginning in fiscal 2012 may be carried forward indefinitely under the Regulated Investment Company Modernization Act of 2010, but must be used before any expiring loss carryforwards.
At August 31, 2014, the cost of investment securities for tax purposes was $3,132,905,000. Net unrealized appreciation of investment securities for tax purposes was $918,857,000, consisting of unrealized gains of $993,025,000 on securities that had risen in value since their purchase and $74,168,000 in unrealized losses on securities that had fallen in value since their purchase.
E. During the year ended August 31, 2014, the fund purchased $1,173,332,000 of investment securities and sold $476,932,000 of investment securities, other than temporary cash investments. Purchases and sales include $831,252,000 and $331,683,000, respectively, in connection with in-kind purchases and redemptions of the fund’s capital shares.
35
Energy Index Fund
F. Capital share transactions for each class of shares were:
| | | | |
| | | 2014 | | | 2013 |
| | Amount | Shares | Amount | Shares |
| | ($000) | (000) | ($000) | (000) |
| Admiral Shares | | | | |
| Issued | 202,436 | 3,067 | 223,171 | 4,202 |
| Issued in Lieu of Cash Distributions | 8,197 | 133 | 3,807 | 74 |
| Redeemed | (190,485) | (3,018) | (69,981) | (1,277) |
| Net Increase (Decrease) —Admiral Shares | 20,148 | 182 | 156,997 | 2,999 |
| ETF Shares | | | | |
| Issued | 995,909 | 7,611 | 159,376 | 1,409 |
| Issued in Lieu of Cash Distributions | — | — | — | — |
| Redeemed | (331,724) | (2,600) | (64,269) | (600) |
| Net Increase (Decrease)—ETF Shares | 664,185 | 5,011 | 95,107 | 809 |
G. Management has determined that no material events or transactions occurred subsequent to August 31, 2014, that would require recognition or disclosure in these financial statements.
36
Financials Index Fund
Fund Profile
As of August 31, 2014
| | |
| Share-Class Characteristics | |
| | Admiral | ETF |
| | Shares | Shares |
| Ticker Symbol | VFAIX | VFH |
| Expense Ratio1 | 0.19% | 0.19% |
| 30-Day SEC Yield | 2.09% | 2.09% |
| | | |
| Portfolio Characteristics | | |
| | | MSCI | |
| | | US IMI/ | MSCI |
| | | Financials | US IMI/ |
| | Fund | 25/50 | 2500 |
| Number of Stocks | 541 | 540 | 2,499 |
| Median Market Cap | $30.1B | $30.1B | $48.7B |
| Price/Earnings Ratio | 17.7x | 17.7x | 20.7x |
| Price/Book Ratio | 1.4x | 1.4x | 2.7x |
| Return on Equity | 9.9% | 9.9% | 18.0% |
| Earnings Growth Rate | 26.3% | 26.3% | 15.2% |
| Dividend Yield | 2.2% | 2.2% | 1.9% |
| Foreign Holdings | 0.0% | 0.0% | 0.0% |
| Turnover Rate | 5% | — | — |
| Short-Term Reserves | 0.0% | — | — |
| | |
| Volatility Measures | | |
| | MSCI US | |
| | IMI/Financials | MSCI US |
| | 25/50 | IMI/2500 |
| R-Squared | 1.00 | 0.88 |
| Beta | 1.00 | 1.22 |
| These measures show the degree and timing of the fund’s fluctuations compared with the indexes over 36 months. |
|
| |
| Subindustry Diversification | |
| (% of equity exposure) | |
| |
| Asset Management & Custody Banks | 7.3% |
| Consumer Finance | 5.3 |
| Diversified Banks | 23.9 |
| Diversified REITs | 1.9 |
| Health Care REITs | 2.3 |
| Hotel & Resort REITs | 1.3 |
| Insurance Brokers | 1.9 |
| Investment Banking & Brokerage | 5.3 |
| Life & Health Insurance | 5.1 |
| Mortgage REITs | 1.8 |
| Multi-line Insurance | 3.6 |
| Multi-Sector Holdings | 4.6 |
| Office REITs | 2.3 |
| Property & Casualty Insurance | 5.9 |
| Regional Banks | 9.3 |
| Reinsurance | 1.2 |
| Residential REITs | 2.9 |
| Retail REITs | 4.3 |
| Specialized Finance | 2.8 |
| Specialized REITs | 3.9 |
| Thrifts & Mortgage Finance | 1.3 |
| Other Financials | 1.8 |
| | |
| Ten Largest Holdings (% of total net assets) |
| |
| Wells Fargo & Co. | Diversified Banks | 6.9% |
| JPMorgan Chase | | |
| & Co. | Diversified Banks | 6.0 |
| Bank of America | | |
| Corp. | Diversified Banks | 4.5 |
| Citigroup Inc. | Diversified Banks | 4.2 |
| Berkshire | | |
| Hathaway Inc. | Multi-Sector Holdings | 4.1 |
| American | | |
| Express Co. | Consumer Finance | 2.3 |
| American | | |
| International | | |
| Group Inc. | Multi-line Insurance | 2.1 |
| US Bancorp | Diversified Banks | 2.1 |
| Goldman Sachs | Investment Banking | |
| Group Inc. | & Brokerage | 2.0 |
| Simon Property | | |
| Group Inc. | Retail REITs | 1.4 |
| Top Ten | | 35.6% |
| The holdings listed exclude any temporary cash investments and equity index products. |
|
1 The expense ratios shown are from the prospectus dated December 23, 2013, and represent estimated costs for the current fiscal year. For the fiscal year ended August 31, 2014, the expense ratios were 0.12% for
Admiral Shares and 0.12% for ETF Shares.
37
Financials Index Fund
Performance Summary
All of the returns in this report represent past performance, which is not a guarantee of future results that may be achieved by the fund. (Current performance may be lower or higher than the performance data cited. For performance data current to the most recent month-end, visit our website at vanguard.com/performance.) Note, too, that both investment returns and principal value can fluctuate widely, so an investor’s shares, when sold, could be worth more or less than their original cost. The returns shown do not reflect taxes that a shareholder would pay on fund distributions or on the sale of fund shares.
Cumulative Performance: August 31, 2004–August 31, 2014
Initial Investment of $10,000
| | | | |
| | | Average Annual Total Returns | Final Value |
| | Periods Ended August 31, 2014 | of a $10,000 |
| | One Year | Five Years | Ten Years | Investment |
| Financials Index Fund | | | | |
| ETF Shares Net Asset Value | 21.20% | 12.09% | 1.61% | $11,737 |
| Financials Index Fund | | | | |
| ETF Shares Market Price | 21.31 | 12.08 | 1.64 | 11,765 |
| Spliced US IMI/Financials 25/50 | 21.32 | 12.21 | 1.68 | 11,815 |
| Financial Services Funds Average | 18.37 | 11.43 | 1.81 | 11,869 |
| MSCI US IMI/2500 | 24.94 | 17.33 | 9.05 | 23,791 |
For a benchmark description, see the Glossary.
Financial Services Funds Average: Derived from data provided by Lipper, a Thomson Reuters Company.
| | | | |
| | | | | Final Value |
| | | | | of a $100,000 |
| | One Year | Five Years | Ten Years | Investment |
| Financials Index Fund Admiral Shares | 21.19% | 12.10% | 1.60% | $117,197 |
| Spliced US IMI/Financials 25/50 | 21.32 | 12.21 | 1.68 | 118,153 |
| MSCI US IMI/2500 | 24.94 | 17.33 | 9.05 | 237,905 |
See Financial Highlights for dividend and capital gains information
38
Financials Index Fund
Fiscal-Year Total Returns (%): August 31, 2004–August 31, 2014
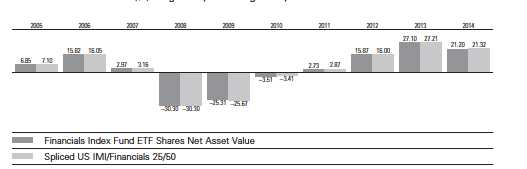
For a benchmark description, see the Glossary.
| | | |
| Cumulative Returns: ETF Shares, August 31, 2004–August 31, 2014 | | |
| |
| | One Year | Five Years | Ten Years |
| Financials Index Fund ETF Shares Market Price | 21.31% | 76.89% | 17.65% |
| Financials Index Fund ETF Shares Net Asset Value | 21.20 | 76.94 | 17.37 |
| Spliced US IMI/Financials 25/50 | 21.32 | 77.87 | 18.15 |
Average Annual Total Returns: Periods Ended June 30, 2014
This table presents total returns through the latest calendar quarter—rather than through the end of the fiscal
period. Securities and Exchange Commission rules require that we provide this information.
| | | | |
| | Inception Date | One Year | Five Years | Ten Years |
| ETF Shares | 1/26/2004 | | | |
| Market Price | | 18.42% | 16.17% | 1.58% |
| Net Asset Value | | 18.62 | 16.18 | 1.58 |
| Admiral Shares | 2/4/2004 | 18.62 | 16.16 | 1.57 |
See Financial Highlights for dividend and capital gains information.
39
Financials Index Fund
Financial Statements
Statement of Net Assets
As of August 31, 2014
The fund reports a complete list of its holdings in regulatory filings four times in each fiscal year, at the quarter-ends. For the second and fourth fiscal quarters, the lists appear in the fund’s semiannual and annual reports to shareholders. For the first and third fiscal quarters, the fund files the lists with the Securities and Exchange Commission on Form N-Q. Shareholders can look up the fund’s Forms N-Q on the SEC’s website at sec.gov. Forms N-Q may also be reviewed and copied at the SEC’s Public Reference Room (see the back cover of this report for further information).
| | | |
| | | | Market |
| | | | Value• |
| | | Shares | ($000) |
| Common Stocks (100.0%) | | |
| Banks (33.3%) | | |
| | Wells Fargo & Co. | 3,143,924 | 161,723 |
| | JPMorgan Chase & Co. | 2,378,493 | 141,401 |
| | Bank of America Corp. | 6,608,523 | 106,331 |
| | Citigroup Inc. | 1,909,093 | 98,605 |
| | US Bancorp | 1,140,033 | 48,201 |
| | PNC Financial Services | | |
| | Group Inc. | 335,835 | 28,462 |
| | BB&T Corp. | 451,346 | 16,849 |
| | SunTrust Banks Inc. | 336,206 | 12,803 |
| | Fifth Third Bancorp | 535,551 | 10,928 |
| | M&T Bank Corp. | 74,403 | 9,198 |
| | Regions Financial Corp. | 866,091 | 8,791 |
| | KeyCorp | 554,805 | 7,551 |
| | CIT Group Inc. | 121,415 | 5,823 |
| | Comerica Inc. | 114,366 | 5,757 |
| | Huntington Bancshares Inc. | 519,885 | 5,118 |
| | First Republic Bank | 82,147 | 4,017 |
| | Zions Bancorporation | 127,362 | 3,711 |
| * | Signature Bank | 29,706 | 3,519 |
| * | SVB Financial Group | 31,319 | 3,486 |
| | East West Bancorp Inc. | 90,523 | 3,154 |
| | Cullen/Frost Bankers Inc. | 34,453 | 2,708 |
| | PacWest Bancorp | 60,969 | 2,557 |
| | Prosperity Bancshares Inc. | 41,465 | 2,504 |
| | Commerce Bancshares Inc. | 54,263 | 2,503 |
| | Investors Bancorp Inc. | 225,290 | 2,390 |
| | City National Corp. | 31,148 | 2,364 |
| | Umpqua Holdings Corp. | 123,044 | 2,150 |
| | Synovus Financial Corp. | 87,211 | 2,106 |
| * | Popular Inc. | 64,896 | 2,009 |
| | First Niagara Financial | | |
| | Group Inc. | 222,042 | 1,932 |
| | BankUnited Inc. | 60,491 | 1,909 |
| | Associated Banc-Corp | 101,387 | 1,843 |
| | First Horizon National Corp. | 148,181 | 1,802 |
| | FirstMerit Corp. | 103,491 | 1,784 |
| | Hancock Holding Co. | 51,624 | 1,716 |
| | Webster Financial Corp. | 56,733 | 1,674 |
| | Bank of Hawaii Corp. | 27,964 | 1,623 |
| | TCF Financial Corp. | 98,537 | 1,557 |
| * | Texas Capital Bancshares | | |
| | Inc. | 26,844 | 1,449 |
| | Bank of the Ozarks Inc. | 45,032 | 1,439 |
| | UMB Financial Corp. | 24,163 | 1,395 |
| | Fulton Financial Corp. | 120,305 | 1,388 |
| | PrivateBancorp Inc. | 46,734 | 1,379 |
| | Wintrust Financial Corp. | 27,577 | 1,284 |
| | United Bankshares Inc. | 38,817 | 1,279 |
| | Glacier Bancorp Inc. | 46,715 | 1,272 |
| | Iberiabank Corp. | 19,355 | 1,263 |
| | Cathay General Bancorp | 47,281 | 1,231 |
| | FNB Corp. | 98,692 | 1,220 |
| | Susquehanna Bancshares | | |
| | Inc. | 117,809 | 1,216 |
| | Valley National Bancorp | 118,942 | 1,189 |
| * | Western Alliance Bancorp | 49,337 | 1,165 |
| | | |
| | | | Market |
| | | | Value• |
| | | Shares | ($000) |
| | BancorpSouth Inc. | 53,938 | 1,142 |
| | MB Financial Inc. | 39,947 | 1,130 |
| | BOK Financial Corp. | 15,198 | 1,024 |
| | Trustmark Corp. | 40,193 | 954 |
| | Old National Bancorp | 72,413 | 948 |
| | International Bancshares | | |
| | Corp. | 35,857 | 945 |
| | First Financial Bankshares | | |
| | Inc. | 32,119 | 944 |
| | First Citizens BancShares | | |
| | Inc. Class A | 4,043 | 929 |
| | CVB Financial Corp. | 59,556 | 926 |
| | Home BancShares Inc. | 30,644 | 912 |
| | Community Bank System | | |
| | Inc. | 25,516 | 902 |
| | South State Corp. | 15,156 | 888 |
| | Columbia Banking System | | |
| | Inc. | 32,240 | 839 |
| | Westamerica | | |
| | Bancorporation | 16,624 | 804 |
| | First Midwest Bancorp Inc. | 47,006 | 792 |
| | Pinnacle Financial Partners | | |
| | Inc. | 21,006 | 753 |
| | National Penn Bancshares | | |
| | Inc. | 74,164 | 742 |
| | BBCN Bancorp Inc. | 47,182 | 689 |
| | Union Bankshares Corp. | 28,014 | 662 |
| | NBT Bancorp Inc. | 27,570 | 662 |
| | Sterling Bancorp | 50,066 | 634 |
| | ViewPoint Financial Group | | |
| | Inc. | 23,841 | 621 |
| | Boston Private Financial | | |
| | Holdings Inc. | 50,215 | 610 |
| | First Financial Bancorp | 36,076 | 599 |
| | Chemical Financial Corp. | 20,382 | 578 |
| | Park National Corp. | 7,230 | 563 |
| | Independent Bank Corp. | 14,959 | 551 |
| | WesBanco Inc. | 17,456 | 542 |
| | Renasant Corp. | 18,635 | 539 |
| | National Bank Holdings | | |
| | Corp. Class A | 26,043 | 529 |
| | First Commonwealth | | |
| | Financial Corp. | 59,280 | 525 |
| * | Eagle Bancorp Inc. | 14,713 | 493 |
| | Banner Corp. | 12,236 | 482 |
| | S&T Bancorp Inc. | 18,646 | 465 |
| * | Capital Bank Financial Corp. | 18,706 | 458 |
| | OFG Bancorp | 28,748 | 457 |
| | First Merchants Corp. | 21,356 | 436 |
| | Wilshire Bancorp Inc. | 44,131 | 431 |
| | City Holding Co. | 9,804 | 419 |
| | Hanmi Financial Corp. | 19,838 | 408 |
| | Lakeland Financial Corp. | 10,178 | 396 |
| ^ | Southside Bancshares Inc. | 11,210 | 385 |
| | Tompkins Financial Corp. | 8,400 | 385 |
| | Sandy Spring Bancorp Inc. | 15,763 | 381 |
| | Simmons First National | | |
| | Corp. Class A | 9,072 | 362 |
| | | |
| | | | Market |
| | | | Value• |
| | | Shares | ($000) |
| | Ameris Bancorp | 15,177 | 347 |
| | Community Trust Bancorp | | |
| | Inc. | 9,775 | 347 |
| | Flushing Financial Corp. | 17,854 | 345 |
| * | First BanCorp | 65,544 | 341 |
| | Cardinal Financial Corp. | 18,920 | 338 |
| | State Bank Financial Corp. | 20,097 | 337 |
| | First Interstate BancSystem | | |
| | Inc. | 12,365 | 328 |
| | United Community Banks | | |
| | Inc. | 19,061 | 323 |
| | Washington Trust Bancorp | | |
| | Inc. | 8,884 | 313 |
| * | First NBC Bank Holding Co. | 9,375 | 301 |
| | Independent Bank Group | | |
| | Inc. | 5,716 | 289 |
| | Towne Bank | 19,731 | 289 |
| * | Customers Bancorp Inc. | 15,376 | 286 |
| | BancFirst Corp. | 4,340 | 276 |
| | First Busey Corp. | 47,308 | 272 |
| | CoBiz Financial Inc. | 22,811 | 263 |
| | Stock Yards Bancorp Inc. | 8,706 | 262 |
| | Lakeland Bancorp Inc. | 25,269 | 261 |
| | Central Pacific Financial | | |
| | Corp. | 14,425 | 254 |
| | Bryn Mawr Bank Corp. | 7,934 | 233 |
| | 1st Source Corp. | 7,600 | 228 |
| | Heartland Financial USA Inc. | 9,292 | 222 |
| * | Bancorp Inc. | 22,577 | 219 |
| | First Financial Corp. | 6,715 | 217 |
| | German American Bancorp | | |
| | Inc. | 7,913 | 214 |
| | MainSource Financial Group | | |
| | Inc. | 12,291 | 212 |
| | Arrow Financial Corp. | 7,774 | 207 |
| | Financial Institutions Inc. | 8,349 | 201 |
| | First Bancorp | 11,049 | 196 |
| | Enterprise Financial Services | | |
| | Corp. | 11,124 | 194 |
| | Univest Corp. of | | |
| | Pennsylvania | 10,157 | 194 |
| | Southwest Bancorp Inc. | 11,654 | 193 |
| | Great Southern Bancorp Inc. | 5,989 | 190 |
| | Trico Bancshares | 8,452 | 189 |
| * | HomeTrust Bancshares Inc. | 11,968 | 180 |
| | First of Long Island Corp. | 5,144 | 179 |
| | Camden National Corp. | 4,791 | 175 |
| | Hudson Valley Holding Corp. | 9,809 | 174 |
| | First Community Bancshares | | |
| | Inc. | 10,183 | 166 |
| * | TriState Capital Holdings Inc. | 15,585 | 149 |
| | Republic Bancorp Inc. | | |
| | Class A | 6,507 | 148 |
| | First Connecticut Bancorp | | |
| | Inc. | 9,204 | 141 |
| * | Sun Bancorp Inc. | 6,170 | 116 |
| | | | 780,873 |
40
Financials Index Fund
| | | |
| | | | Market |
| | | | Value• |
| | | Shares | ($000) |
| Capital Markets (12.6%) | | |
| | Goldman Sachs Group Inc. | 267,049 | 47,831 |
| | Morgan Stanley | 928,627 | 31,861 |
| | Bank of New York Mellon | | |
| | Corp. | 716,327 | 28,066 |
| | BlackRock Inc. | 83,821 | 27,705 |
| | Charles Schwab Corp. | 735,020 | 20,955 |
| | State Street Corp. | 271,421 | 19,550 |
| | Ameriprise Financial Inc. | 119,218 | 14,993 |
| | Franklin Resources Inc. | 256,188 | 14,480 |
| | T. Rowe Price Group Inc. | 164,897 | 13,356 |
| | Invesco Ltd. | 272,546 | 11,131 |
| | Northern Trust Corp. | 141,952 | 9,844 |
| * | Affiliated Managers Group | | |
| | Inc. | 34,730 | 7,333 |
| | TD Ameritrade Holding | | |
| | Corp. | 173,620 | 5,749 |
| | Raymond James Financial | | |
| | Inc. | 79,608 | 4,350 |
| * | E*TRADE Financial Corp. | 181,883 | 4,049 |
| | SEI Investments Co. | 90,689 | 3,437 |
| | Legg Mason Inc. | 65,998 | 3,255 |
| | Eaton Vance Corp. | 76,815 | 3,008 |
| | Waddell & Reed Financial | | |
| | Inc. Class A | 53,296 | 2,905 |
| | LPL Financial Holdings Inc. | 50,346 | 2,451 |
| * | NorthStar Asset | | |
| | Management Group Inc. | 113,774 | 2,104 |
| * | Stifel Financial Corp. | 39,215 | 1,878 |
| | Federated Investors Inc. | | |
| | Class B | 59,136 | 1,815 |
| | Janus Capital Group Inc. | 95,900 | 1,165 |
| | Financial Engines Inc. | 31,878 | 1,143 |
| | Evercore Partners Inc. | | |
| | Class A | 20,687 | 1,060 |
| | Virtus Investment Partners | | |
| | Inc. | 4,562 | 1,020 |
| | Artisan Partners Asset | | |
| | Management Inc. Class A | 18,386 | 1,020 |
| | BGC Partners Inc. Class A | 111,678 | 845 |
| | Greenhill & Co. Inc. | 16,770 | 822 |
| * | WisdomTree Investments | | |
| | Inc. | 66,736 | 790 |
| | HFF Inc. Class A | 20,951 | 629 |
| * | Walter Investment | | |
| | Management Corp. | 23,466 | 618 |
| * | KCG Holdings Inc. Class A | 51,005 | 597 |
| | Cohen & Steers Inc. | 12,537 | 547 |
| * | Piper Jaffray Cos. | 10,031 | 535 |
| * | ICG Group Inc. | 24,759 | 430 |
| * | Investment Technology | | |
| | Group Inc. | 22,737 | 387 |
| | Arlington Asset Investment | | |
| | Corp. Class A | 11,841 | 337 |
| | FXCM Inc. Class A | 20,192 | 293 |
| * | Cowen Group Inc. Class A | 65,069 | 266 |
| * | Safeguard Scientifics Inc. | 13,575 | 266 |
| | Westwood Holdings Group | | |
| | Inc. | 4,102 | 244 |
| | Diamond Hill Investment | | |
| | Group Inc. | 1,839 | 241 |
| | GAMCO Investors Inc. | 2,936 | 230 |
| * | Ladenburg Thalmann | | |
| | Financial Services Inc. | 64,215 | 230 |
| | GFI Group Inc. | 45,621 | 206 |
| * | INTL. FCStone Inc. | 9,454 | 181 |
| | Oppenheimer Holdings Inc. | | |
| | Class A | 6,693 | 162 |
| * | Marcus & Millichap Inc. | 4,594 | 139 |
| | | |
| | | | Market |
| | | | Value• |
| | | Shares | ($000) |
| | Pzena Investment | | |
| | Management Inc. Class A | 6,945 | 70 |
| | | | 296,579 |
| Consumer Finance (5.3%) | | |
| | American Express Co. | 598,832 | 53,625 |
| | Capital One Financial Corp. | 358,998 | 29,459 |
| | Discover Financial Services | 292,806 | 18,262 |
| * | Ally Financial Inc. | 195,930 | 4,820 |
| | Navient Corp. | 265,525 | 4,764 |
| * | Synchrony Financial | 104,413 | 2,693 |
| | SLM Corp. | 265,478 | 2,352 |
| * | Portfolio Recovery | | |
| | Associates Inc. | 31,310 | 1,779 |
| | Santander Consumer USA | | |
| | Holdings Inc. | 54,382 | 1,013 |
| * | First Cash Financial | | |
| | Services Inc. | 17,264 | 997 |
| | Cash America International | | |
| | Inc. | 17,586 | 785 |
| | Nelnet Inc. Class A | 16,385 | 720 |
| * | Credit Acceptance Corp. | 5,728 | 706 |
| * | Encore Capital Group Inc. | 15,272 | 678 |
| * | Springleaf Holdings Inc. | 18,017 | 600 |
| * | World Acceptance Corp. | 5,483 | 430 |
| * | Ezcorp Inc. Class A | 32,153 | 342 |
| * | Green Dot Corp. Class A | 16,448 | 311 |
| * | Regional Management | | |
| | Corp. | 7,433 | 126 |
| | | | 124,462 |
| Diversified Financial Services (7.3%) | |
| * | Berkshire Hathaway Inc. | | |
| | Class B | 705,662 | 96,852 |
| | CME Group Inc. | 200,614 | 15,357 |
| | McGraw Hill Financial Inc. | 171,134 | 13,884 |
| | Intercontinental Exchange | | |
| | Inc. | 72,347 | 13,673 |
| | Moody’s Corp. | 121,056 | 11,327 |
| | Leucadia National Corp. | 197,021 | 4,912 |
| | Voya Financial Inc. | 87,816 | 3,433 |
| | NASDAQ OMX Group Inc. | 74,501 | 3,238 |
| * | MSCI Inc. Class A | 69,511 | 3,207 |
| | CBOE Holdings Inc. | 54,426 | 2,886 |
| | MarketAxess Holdings Inc. | 23,726 | 1,398 |
| * | PHH Corp. | 34,066 | 816 |
| | Interactive Brokers Group Inc. | 30,916 | 725 |
| * | PICO Holdings Inc. | 14,237 | 315 |
| * | NewStar Financial Inc. | 13,938 | 161 |
| | Marlin Business Services | | |
| | Corp. | 5,553 | 110 |
| | | | 172,294 |
| Insurance (17.9%) | | |
| | American International | | |
| | Group Inc. | 863,746 | 48,422 |
| | MetLife Inc. | 601,322 | 32,916 |
| | Prudential Financial Inc. | 288,868 | 25,911 |
| | ACE Ltd. | 212,260 | 22,570 |
| | Travelers Cos. Inc. | 218,177 | 20,664 |
| | Marsh & McLennan Cos. | | |
| | Inc. | 344,921 | 18,315 |
| | Aflac Inc. | 285,191 | 17,465 |
| | Allstate Corp. | 272,494 | 16,756 |
| | Aon plc | 176,846 | 15,414 |
| | Chubb Corp. | 153,494 | 14,114 |
| | Hartford Financial Services | | |
| | Group Inc. | 282,741 | 10,476 |
| | Principal Financial Group | | |
| | Inc. | 186,007 | 10,098 |
| | Loews Corp. | 219,457 | 9,599 |
| | Lincoln National Corp. | 166,045 | 9,139 |
| | | |
| | | | Market |
| | | | Value• |
| | | Shares | ($000) |
| | Progressive Corp. | 355,925 | 8,905 |
| | Unum Group | 161,649 | 5,863 |
| | XL Group plc Class A | 170,494 | 5,827 |
| * | Markel Corp. | 8,819 | 5,819 |
| | Everest Re Group Ltd. | 28,878 | 4,731 |
| * | Arch Capital Group Ltd. | 84,438 | 4,693 |
| | Cincinnati Financial Corp. | 97,538 | 4,691 |
| | Arthur J Gallagher & Co. | 98,677 | 4,661 |
| | Torchmark Corp. | 83,828 | 4,573 |
| * | Alleghany Corp. | 10,339 | 4,457 |
| * | Genworth Financial Inc. | | |
| | Class A | 312,981 | 4,441 |
| * | FNF Group | 156,159 | 4,421 |
| | Willis Group Holdings plc | 101,657 | 4,267 |
| | Reinsurance Group of | | |
| | America Inc. Class A | 43,296 | 3,593 |
| | Protective Life Corp. | 49,310 | 3,422 |
| | WR Berkley Corp. | 68,569 | 3,315 |
| | PartnerRe Ltd. | 28,499 | 3,183 |
| | HCC Insurance Holdings Inc. | 62,712 | 3,144 |
| | Axis Capital Holdings Ltd. | 64,303 | 3,101 |
| | Assurant Inc. | 45,011 | 3,004 |
| | American Financial Group | | |
| | Inc. | 47,790 | 2,866 |
| | Assured Guaranty Ltd. | 108,730 | 2,626 |
| | RenaissanceRe Holdings | | |
| | Ltd. | 25,433 | 2,604 |
| | Brown & Brown Inc. | 77,623 | 2,532 |
| | White Mountains Insurance | | |
| | Group Ltd. | 3,880 | 2,461 |
| | Old Republic International | | |
| | Corp. | 155,240 | 2,383 |
| | CNO Financial Group Inc. | 131,421 | 2,346 |
| | Allied World Assurance Co. | | |
| | Holdings AG | 62,509 | 2,312 |
| | Validus Holdings Ltd. | 55,795 | 2,182 |
| | First American Financial | | |
| | Corp. | 66,669 | 1,890 |
| | StanCorp Financial Group Inc. | 27,456 | 1,799 |
| | ProAssurance Corp. | 38,059 | 1,758 |
| | Hanover Insurance Group | | |
| | Inc. | 27,544 | 1,748 |
| | Aspen Insurance Holdings | | |
| | Ltd. | 40,963 | 1,742 |
| | Primerica Inc. | 34,530 | 1,738 |
| | Endurance Specialty | | |
| | Holdings Ltd. | 27,832 | 1,616 |
| | Symetra Financial Corp. | 51,679 | 1,258 |
| | Erie Indemnity Co. Class A | 16,013 | 1,225 |
| | American Equity Investment | | |
| | Life Holding Co. | 44,557 | 1,102 |
| | Platinum Underwriters | | |
| | Holdings Ltd. | 17,589 | 1,099 |
| | RLI Corp. | 24,278 | 1,085 |
| * | Enstar Group Ltd. | 7,468 | 1,060 |
| | Kemper Corp. | 27,864 | 1,013 |
| * | Hilltop Holdings Inc. | 45,358 | 960 |
| * | MBIA Inc. | 90,445 | 943 |
| | AmTrust Financial Services | | |
| | Inc. | 21,125 | 930 |
| | Mercury General Corp. | 17,264 | 884 |
| | Argo Group International | | |
| | Holdings Ltd. | 16,629 | 875 |
| | Montpelier Re Holdings Ltd. | 26,822 | 844 |
| | Selective Insurance Group | | |
| | Inc. | 35,147 | 842 |
| * | FNFV Group | 52,047 | 780 |
| | Horace Mann Educators | | |
| | Corp. | 25,430 | 758 |
41
Financials Index Fund
| | | |
| | | | Market |
| | | | Value• |
| | | Shares | ($000) |
| * | Greenlight Capital Re Ltd. | | |
| | Class A | 19,314 | 661 |
| * | Third Point Reinsurance Ltd. | 35,668 | 546 |
| | Infinity Property & Casualty | | |
| | Corp. | 7,253 | 496 |
| | Safety Insurance Group Inc. | 8,187 | 452 |
| | AMERISAFE Inc. | 11,648 | 439 |
| * | Navigators Group Inc. | 6,670 | 429 |
| | Stewart Information | | |
| | Services Corp. | 13,007 | 419 |
| | Maiden Holdings Ltd. | 34,269 | 417 |
| | Employers Holdings Inc. | 19,323 | 414 |
| | United Fire Group Inc. | 13,575 | 398 |
| | National Western Life | | |
| | Insurance Co. Class A | 1,498 | 381 |
| | FBL Financial Group Inc. | | |
| | Class A | 7,005 | 328 |
| | HCI Group Inc. | 6,254 | 263 |
| * | eHealth Inc. | 10,421 | 256 |
| | State Auto Financial Corp. | 10,239 | 222 |
| | OneBeacon Insurance | | |
| | Group Ltd. Class A | 13,486 | 216 |
| * | Citizens Inc. Class A | 26,497 | 189 |
| | Meadowbrook Insurance | | |
| | Group Inc. | 29,688 | 184 |
| | Fidelity & Guaranty Life | 7,338 | 166 |
| * | Global Indemnity plc | 5,441 | 147 |
| | National Interstate Corp. | 4,895 | 137 |
| | Baldwin & Lyons Inc. | 5,291 | 137 |
| | Kansas City Life Insurance Co. | 2,373 | 110 |
| | EMC Insurance Group Inc. | 3,393 | 104 |
| | Donegal Group Inc. Class A | 5,916 | 93 |
| | Crawford & Co. Class A | 9,379 | 76 |
| | Crawford & Co. Class B | 6,733 | 61 |
| | | | 419,972 |
| Real Estate Investment Trusts (REITs) (21.3%) |
| | Simon Property Group Inc. | 195,083 | 33,170 |
| | American Tower | | |
| | Corporation | 248,484 | 24,501 |
| | Crown Castle International | | |
| | Corp. | 210,152 | 16,709 |
| | Public Storage | 92,029 | 16,122 |
| | Equity Residential | 215,740 | 14,340 |
| | Health Care REIT Inc. | 193,038 | 13,045 |
| | Prologis Inc. | 314,372 | 12,870 |
| | AvalonBay Communities Inc. | 81,435 | 12,549 |
| | HCP Inc. | 287,700 | 12,466 |
| | Ventas Inc. | 185,117 | 12,177 |
| | Boston Properties Inc. | 96,157 | 11,675 |
| | Weyerhaeuser Co. | 331,023 | 11,238 |
| | Vornado Realty Trust | 106,095 | 11,232 |
| | Host Hotels & Resorts Inc. | 476,044 | 10,863 |
| | General Growth Properties | | |
| | Inc. | 333,868 | 8,203 |
| | Essex Property Trust Inc. | 39,347 | 7,612 |
| | American Realty Capital | | |
| | Properties Inc. | 560,854 | 7,381 |
| | Annaly Capital | | |
| | Management Inc. | 596,878 | 7,103 |
| | SL Green Realty Corp. | 59,755 | 6,534 |
| | Realty Income Corp. | 139,229 | 6,226 |
| | Kimco Realty Corp. | 258,240 | 6,066 |
| | Macerich Co. | 88,274 | 5,763 |
| | Digital Realty Trust Inc. | 85,042 | 5,549 |
| | Federal Realty Investment | | |
| | Trust | 42,394 | 5,290 |
| | American Capital Agency | | |
| | Corp. | 223,424 | 5,284 |
| | UDR Inc. | 158,559 | 4,744 |
| | Plum Creek Timber Co. Inc. | 111,717 | 4,539 |
| | | |
| | | | Market |
| | | | Value• |
| | | Shares | ($000) |
| | Camden Property Trust | 53,973 | 4,039 |
| | Duke Realty Corp. | 206,358 | 3,838 |
| | WP Carey Inc. | 56,063 | 3,828 |
| | Extra Space Storage Inc. | 69,083 | 3,641 |
| | Alexandria Real Estate | | |
| | Equities Inc. | 44,992 | 3,557 |
| | DDR Corp. | 191,558 | 3,490 |
| | Mid-America Apartment | | |
| | Communities Inc. | 47,045 | 3,402 |
| | Starwood Property Trust Inc. | 139,268 | 3,322 |
| | Regency Centers Corp. | 57,943 | 3,311 |
| | Liberty Property Trust | 92,933 | 3,292 |
| | Kilroy Realty Corp. | 51,606 | 3,264 |
| | Apartment Investment & | | |
| | Management Co. Class A | 91,685 | 3,142 |
| | Taubman Centers Inc. | 39,681 | 3,022 |
| | Senior Housing Properties | | |
| | Trust | 128,186 | 2,991 |
| | Omega Healthcare Investors | | |
| | Inc. | 79,336 | 2,989 |
| | Spirit Realty Capital Inc. | 248,071 | 2,930 |
| | National Retail Properties | | |
| | Inc. | 77,544 | 2,880 |
| | Hospitality Properties Trust | 93,934 | 2,764 |
| | Rayonier Inc. | 79,323 | 2,718 |
| | BioMed Realty Trust Inc. | 120,769 | 2,711 |
| | American Campus | | |
| | Communities Inc. | 65,781 | 2,599 |
| | Corrections Corp. of America | 72,763 | 2,593 |
| | Weingarten Realty Investors | 72,658 | 2,486 |
| | Douglas Emmett Inc. | 86,124 | 2,461 |
| | Two Harbors Investment | | |
| | Corp. | 229,370 | 2,459 |
| | RLJ Lodging Trust | 82,206 | 2,451 |
| | Highwoods Properties Inc. | 56,478 | 2,403 |
| | LaSalle Hotel Properties | 65,360 | 2,389 |
| | Retail Properties of America | | |
| | Inc. | 148,251 | 2,345 |
| | Home Properties Inc. | 36,135 | 2,321 |
| | Equity Lifestyle Properties | | |
| | Inc. | 49,693 | 2,270 |
| | Chimera Investment Corp. | 644,553 | 2,133 |
| | Tanger Factory Outlet | | |
| | Centers Inc. | 60,510 | 2,112 |
| | NorthStar Realty Finance | | |
| | Corp. | 113,774 | 2,106 |
| | CBL & Associates | | |
| | Properties Inc. | 106,814 | 2,029 |
| | Columbia Property Trust Inc. | 78,365 | 2,012 |
| | MFA Financial Inc. | 229,765 | 1,939 |
| | Washington Prime Group | | |
| | Inc. | 97,321 | 1,900 |
| | EPR Properties | 33,257 | 1,893 |
| | Piedmont Office Realty | | |
| | Trust Inc. Class A | 96,764 | 1,886 |
| | Post Properties Inc. | 34,079 | 1,875 |
| | Healthcare Trust of America | | |
| | Inc. Class A | 148,971 | 1,855 |
| | Gaming and Leisure | | |
| | Properties Inc. | 55,592 | 1,851 |
| | Sunstone Hotel Investors | | |
| | Inc. | 126,508 | 1,843 |
| * | Equity Commonwealth | 66,886 | 1,798 |
| | Brandywine Realty Trust | 110,714 | 1,774 |
| | American Homes 4 Rent | | |
| | Class A | 97,600 | 1,745 |
| * | Strategic Hotels & Resorts | | |
| | Inc. | 144,197 | 1,713 |
| | Geo Group Inc. | 45,163 | 1,690 |
| | CubeSmart | 90,848 | 1,690 |
| | | |
| | | | Market |
| | | | Value• |
| | | Shares | ($000) |
| | Cousins Properties Inc. | 131,560 | 1,669 |
| | DiamondRock Hospitality | | |
| | Co. | 122,545 | 1,632 |
| | DCT Industrial Trust Inc. | 203,631 | 1,619 |
| | Sovran Self Storage Inc. | 20,365 | 1,574 |
| | Corporate Office Properties | | |
| | Trust | 54,795 | 1,555 |
| | Pebblebrook Hotel Trust | 40,073 | 1,552 |
| | Medical Properties Trust | | |
| | Inc. | 108,565 | 1,530 |
| | Colony Financial Inc. | 67,566 | 1,515 |
| | Healthcare Realty Trust Inc. | 60,241 | 1,504 |
| | Ryman Hospitality | | |
| | Properties Inc. | 28,503 | 1,418 |
| | Lexington Realty Trust | 129,308 | 1,407 |
| | Sun Communities Inc. | 25,375 | 1,361 |
| | Invesco Mortgage Capital | | |
| | Inc. | 77,182 | 1,360 |
| * | Kite Realty Group Trust | 52,280 | 1,345 |
| | Brixmor Property Group Inc. | 53,169 | 1,258 |
| | First Industrial Realty Trust | | |
| | Inc. | 69,129 | 1,258 |
| | EastGroup Properties Inc. | 19,319 | 1,253 |
| | Hatteras Financial Corp. | 60,962 | 1,213 |
| | Washington REIT | 41,878 | 1,163 |
| | Chambers Street Properties | 148,540 | 1,157 |
| | DuPont Fabros Technology | | |
| | Inc. | 40,997 | 1,154 |
| | National Health Investors Inc. | 17,690 | 1,141 |
| | Mack-Cali Realty Corp. | 52,781 | 1,116 |
| * | Newcastle Investment Corp. | 82,182 | 1,114 |
| | New Residential Investment | | |
| | Corp. | 174,686 | 1,095 |
| | Potlatch Corp. | 25,448 | 1,086 |
| | Acadia Realty Trust | 36,140 | 1,042 |
| | PennyMac Mortgage | | |
| | Investment Trust | 46,606 | 1,037 |
| | PS Business Parks Inc. | 12,668 | 1,033 |
| | Government Properties | | |
| | Income Trust | 42,962 | 1,032 |
| | Glimcher Realty Trust | 91,014 | 1,022 |
| | Redwood Trust Inc. | 51,716 | 1,002 |
| | Chesapeake Lodging Trust | 31,375 | 967 |
| | Equity One Inc. | 40,826 | 963 |
| | Hudson Pacific Properties | | |
| | Inc. | 35,775 | 961 |
| | CYS Investments Inc. | 101,445 | 957 |
| | ARMOUR Residential REIT | | |
| | Inc. | 224,473 | 950 |
| | Education Realty Trust Inc. | 85,640 | 933 |
| | Empire State Realty Trust | | |
| | Inc. | 55,417 | 911 |
| | Parkway Properties Inc. | 43,433 | 901 |
| | LTC Properties Inc. | 21,869 | 896 |
| | Retail Opportunity | | |
| | Investments Corp. | 55,535 | 880 |
| | Altisource Residential Corp. | 35,544 | 872 |
| | Hersha Hospitality Trust | | |
| | Class A | 127,297 | 864 |
| | Pennsylvania REIT | 42,763 | 862 |
| | Sabra Health Care REIT Inc. | 29,065 | 828 |
| | Ramco-Gershenson | | |
| | Properties Trust | 48,308 | 819 |
| | Blackstone Mortgage Trust | | |
| | Inc. Class A | 28,193 | 819 |
| | Capstead Mortgage Corp. | 60,065 | 794 |
| | STAG Industrial Inc. | 33,802 | 792 |
| | American Assets Trust Inc. | 22,532 | 790 |
| * | iStar Financial Inc. | 50,690 | 754 |
| | FelCor Lodging Trust Inc. | 70,556 | 730 |
42
Financials Index Fund
| | | |
| | | | Market |
| | | | Value• |
| | | Shares | ($000) |
| | Franklin Street Properties | | |
| | Corp. | 56,473 | 686 |
| * | Starwood Waypoint | | |
| | Residential Trust | 24,371 | 675 |
| | Select Income REIT | 24,111 | 673 |
| | American Capital Mortgage | | |
| | Investment Corp. | 32,562 | 670 |
| | Associated Estates Realty | | |
| | Corp. | 36,143 | 669 |
| | Ashford Hospitality Trust Inc. | 52,835 | 612 |
| | Inland Real Estate Corp. | 56,555 | 589 |
| | Summit Hotel Properties Inc. | 53,457 | 585 |
| | Alexander’s Inc. | 1,444 | 573 |
| | CyrusOne Inc. | 21,895 | 570 |
| | Investors Real Estate Trust | 66,593 | 568 |
| | Apollo Commercial Real | | |
| | Estate Finance Inc. | 29,120 | 490 |
| | First Potomac Realty Trust | 36,921 | 489 |
| | Excel Trust Inc. | 37,351 | 483 |
| | CoreSite Realty Corp. | 13,375 | 469 |
| | Aviv REIT Inc. | 15,843 | 464 |
| | Anworth Mortgage Asset | | |
| | Corp. | 86,993 | 451 |
| | New York Mortgage Trust | | |
| | Inc. | 55,750 | 445 |
| | Resource Capital Corp. | 79,843 | 430 |
| | RAIT Financial Trust | 51,396 | 416 |
| | Silver Bay Realty Trust Corp. | 23,408 | 390 |
| | Western Asset Mortgage | | |
| | Capital Corp. | 25,481 | 387 |
| | Saul Centers Inc. | 7,764 | 387 |
| | Rexford Industrial Realty Inc. | 25,637 | 378 |
| | Rouse Properties Inc. | 21,443 | 375 |
| * | American Residential | | |
| | Properties Inc. | 19,327 | 367 |
| | AG Mortgage Investment | | |
| | Trust Inc. | 17,806 | 356 |
| | Monmouth Real Estate | | |
| | Investment Corp. | 32,765 | 355 |
| | Apollo Residential Mortgage | | |
| | Inc. | 20,354 | 343 |
| | Universal Health Realty | | |
| | Income Trust | 7,581 | 335 |
| | Campus Crest Communities | | |
| | Inc. | 40,379 | 332 |
| | Winthrop Realty Trust | 21,401 | 327 |
| | Getty Realty Corp. | 16,917 | 317 |
| | Urstadt Biddle Properties Inc. | | |
| | Class A | 14,665 | 313 |
| | Dynex Capital Inc. | 32,829 | 287 |
| | Agree Realty Corp. | 9,437 | 279 |
| | Cedar Realty Trust Inc. | 42,189 | 273 |
| | AmREIT Inc. | 11,689 | 272 |
| | Ashford Hospitality Prime | | |
| | Inc. | 15,265 | 247 |
| | QTS Realty Trust Inc. | | |
| | Class A | 8,149 | 246 |
| * | CareTrust REIT Inc. | 12,515 | 219 |
| | Ares Commercial Real | | |
| | Estate Corp. | 17,313 | 218 |
| | | |
| | | | Market |
| | | | Value• |
| | | Shares | ($000) |
| | Whitestone REIT | 13,553 | 206 |
| | Arbor Realty Trust Inc. | 25,178 | 176 |
| | One Liberty Properties Inc. | 7,669 | 166 |
| | | | 499,021 |
| Real Estate Management & Development (1.0%) |
| * | CBRE Group Inc. Class A | 188,346 | 5,986 |
| * | Realogy Holdings Corp. | 92,364 | 3,766 |
| | Jones Lang LaSalle Inc. | 27,936 | 3,733 |
| * | Howard Hughes Corp. | 21,096 | 3,341 |
| * | Forest City Enterprises Inc. | | |
| | Class A | 95,913 | 1,995 |
| | Alexander & Baldwin Inc. | 29,079 | 1,189 |
| | Kennedy-Wilson Holdings | | |
| | Inc. | 42,536 | 1,111 |
| * | Altisource Portfolio | | |
| | Solutions SA | 9,922 | 992 |
| * | St. Joe Co. | 43,354 | 939 |
| * | Forestar Group Inc. | 21,770 | 435 |
| * | Tejon Ranch Co. | 9,754 | 274 |
| | RE/MAX Holdings Inc. | 7,222 | 219 |
| * | Tejon Ranch Co. Warrants | | |
| | Exp. 08/31/2016 | 1,227 | 2 |
| | | | 23,982 |
| Thrifts & Mortgage Finance (1.3%) | |
| | New York Community | | |
| | Bancorp Inc. | 278,771 | 4,446 |
| | Hudson City Bancorp Inc. | 298,277 | 2,944 |
| | People’s United Financial | | |
| | Inc. | 194,732 | 2,911 |
| * | Ocwen Financial Corp. | 72,143 | 2,016 |
| | Radian Group Inc. | 118,390 | 1,724 |
| * | MGIC Investment Corp. | 201,236 | 1,696 |
| | Washington Federal Inc. | 64,148 | 1,395 |
| | Capitol Federal Financial Inc. | 87,087 | 1,076 |
| | Home Loan Servicing | | |
| | Solutions Ltd. | 44,488 | 974 |
| | EverBank Financial Corp. | 50,123 | 946 |
| * | TFS Financial Corp. | 57,803 | 835 |
| | Astoria Financial Corp. | 55,791 | 729 |
| | Northwest Bancshares Inc. | 56,207 | 709 |
| * | BofI Holding Inc. | 7,504 | 578 |
| | Provident Financial Services | | |
| | Inc. | 33,759 | 574 |
| * | Essent Group Ltd. | 27,208 | 573 |
| * | Nationstar Mortgage | | |
| | Holdings Inc. | 14,215 | 498 |
| | Northfield Bancorp Inc. | 36,640 | 480 |
| | TrustCo Bank Corp. NY | 59,199 | 416 |
| | Brookline Bancorp Inc. | 44,337 | 406 |
| | WSFS Financial Corp. | 5,325 | 397 |
| | United Financial Bancorp | | |
| | Inc. | 31,682 | 393 |
| | Berkshire Hills Bancorp Inc. | 15,651 | 385 |
| | Oritani Financial Corp. | 24,324 | 365 |
| * | Beneficial Mutual Bancorp | | |
| | Inc. | 22,140 | 304 |
| | Dime Community | | |
| | Bancshares Inc. | 18,705 | 289 |
| | Waterstone Financial Inc. | 21,586 | 247 |
| | | |
| | | | Market |
| | | | Value• |
| | | Shares | ($000) |
| * | Flagstar Bancorp Inc. | 14,050 | 245 |
| | Federal Agricultural Mortgage | |
| | Corp. | 5,878 | 193 |
| * | Walker & Dunlop Inc. | 12,170 | 173 |
| * | PennyMac Financial Services | | |
| | Inc. Class A | 11,103 | 171 |
| | OceanFirst Financial Corp. | 8,728 | 143 |
| * | Stonegate Mortgage Corp. | 9,708 | 141 |
| | HomeStreet Inc. | 7,472 | 136 |
| | | | 29,508 |
| Total Common Stocks | | |
| (Cost $2,029,338) | | 2,346,691 |
| Temporary Cash Investment (0.0%) | |
| Money Market Fund (0.0%) | | |
| 1,2 | Vanguard Market | | |
| | Liquidity Fund, 0.113% | | |
| | (Cost $175) | 175,002 | 175 |
| Total Investments (100.0%) | | |
| (Cost $2,029,513) | | 2,346,866 |
| Other Assets and Liabilities (0.0%) | |
| Other Assets | | 10,544 |
| Liabilities2 | | (11,024) |
| | | | (480) |
| Net Assets (100%) | | 2,346,386 |
| |
| |
| At August 31, 2014, net assets consisted of: |
| | | | Amount |
| | | | ($000) |
| Paid-in Capital | | 2,212,531 |
| Undistributed Net Investment Income | 8,766 |
| Accumulated Net Realized Losses | (192,264) |
| Unrealized Appreciation (Depreciation) | 317,353 |
| Net Assets | | 2,346,386 |
| |
| |
| Admiral Shares—Net Assets | | |
| Applicable to 6,541,013 outstanding | |
| $.001 par value shares of beneficial | |
| interest (unlimited authorization) | 155,135 |
| Net Asset Value Per Share— | | |
| Admiral Shares | | $23.72 |
| |
| |
| ETF Shares—Net Assets | | |
| Applicable to 46,303,393 outstanding | |
| $.001 par value shares of beneficial | |
| interest (unlimited authorization) | 2,191,251 |
| Net Asset Value Per Share— | | |
| ETF Shares | | $47.32 |
• See Note A in Notes to Financial Statements.
* Non-income-producing security.
^ Includes partial security positions on loan to broker-dealers. The total value of securities on loan is $172,000.
1 Affiliated money market fund available only to Vanguard funds and certain trusts and accounts managed by Vanguard. Rate shown is the 7-day yield.
2 Includes $175,000 of collateral received for securities on loan.
REIT—Real Estate Investment Trust.
See accompanying Notes, which are an integral part of the Financial Statements.
43
Financials Index Fund
Statement of Operations
| |
| | Year Ended |
| August 31, 2014 |
| | ($000) |
| Investment Income | |
| Income | |
| Dividends | 42,358 |
| Interest1 | 1 |
| Securities Lending | 93 |
| Total Income | 42,452 |
| Expenses | |
| The Vanguard Group—Note B | |
| Investment Advisory Services | 322 |
| Management and Administrative— | |
| Admiral Shares | 117 |
| Management and Administrative— | |
| ETF Shares | 1,377 |
| Marketing and Distribution— | |
| Admiral Shares | 26 |
| Marketing and Distribution— | |
| ETF Shares | 379 |
| Custodian Fees | 56 |
| Auditing Fees | 33 |
| Shareholders’ Reports—Admiral Shares | 2 |
| Shareholders’ Reports—ETF Shares | 88 |
| Trustees’ Fees and Expenses | 1 |
| Total Expenses | 2,401 |
| Net Investment Income | 40,051 |
| Realized Net Gain (Loss) on | |
| Investment Securities Sold | 63,848 |
| Change in Unrealized Appreciation | |
| (Depreciation) of Investment Securities | 265,041 |
| Net Increase (Decrease) in Net Assets | |
| Resulting from Operations | 368,940 |
Statement of Changes in Net Assets
| | |
| | Year Ended August 31, |
| | 2014 | 2013 |
| | ($000) | ($000) |
| Increase (Decrease) in Net Assets | | |
| Operations | | |
| Net Investment Income | 40,051 | 27,926 |
| Realized Net Gain (Loss) | 63,848 | 36,571 |
| Change in Unrealized Appreciation (Depreciation) | 265,041 | 198,184 |
| Net Increase (Decrease) in Net Assets Resulting from Operations | 368,940 | 262,681 |
| Distributions | | |
| Net Investment Income | | |
| Admiral Shares | (2,781) | (2,215) |
| ETF Shares | (34,583) | (23,000) |
| Realized Capital Gain | | |
| Admiral Shares | — | — |
| ETF Shares | — | — |
| Total Distributions | (37,364) | (25,215) |
| Capital Share Transactions | | |
| Admiral Shares | (901) | 37,475 |
| ETF Shares | 420,150 | 479,646 |
| Net Increase (Decrease) from Capital Share Transactions | 419,249 | 517,121 |
| Total Increase (Decrease) | 750,825 | 754,587 |
| Net Assets | | |
| Beginning of Period | 1,595,561 | 840,974 |
| End of Period2 | 2,346,386 | 1,595,561 |
1 Interest income from an affiliated company of the fund was $1,000.
2 Net Assets—End of Period includes undistributed (overdistributed) net investment income of $8,766,000 and
See accompanying Notes, which are an integral part of the Financial Statements.
44
Financials Index Fund
Financial Highlights
| | | | | |
| Admiral Shares | | | | | |
| |
| For a Share Outstanding | Year Ended August 31, |
| Throughout Each Period | 2014 | 2013 | 2012 | 2011 | 2010 |
| Net Asset Value, Beginning of Period | $19.95 | $16.05 | $14.16 | $13.99 | $14.72 |
| Investment Operations | | | | | |
| Net Investment Income | .438 | .414 | . 320 | . 263 | . 209 |
| Net Realized and Unrealized Gain (Loss) | | | | | |
| on Investments | 3.758 | 3.888 | 1.874 | .150 | (.715) |
| Total from Investment Operations | 4.196 | 4.302 | 2.194 | .413 | (. 506) |
| Distributions | | | | | |
| Dividends from Net Investment Income | (. 426) | (. 402) | (. 304) | (. 243) | (. 224) |
| Distributions from Realized Capital Gains | — | — | — | — | — |
| Total Distributions | (. 426) | (. 402) | (. 304) | (. 243) | (. 224) |
| Net Asset Value, End of Period | $23.72 | $19.95 | $16.05 | $14.16 | $13.99 |
| |
| Total Return1 | 21.19% | 27.13% | 15.84% | 2.79% | –3.52% |
| |
| Ratios/Supplemental Data | | | | | |
| Net Assets, End of Period (Millions) | $155 | $132 | $73 | $62 | $65 |
| Ratio of Total Expenses to Average Net Assets | 0.12% | 0.14% | 0.14% | 0.19% | 0.24% |
| Ratio of Net Investment Income to | | | | | |
| Average Net Assets | 2.00% | 2.26% | 2.16% | 1.63% | 1.36% |
| Portfolio Turnover Rate2 | 5% | 9% | 7% | 10% | 11% |
1 Total returns do not include transaction or account service fees that may have applied in the periods shown. Fund prospectuses provide
information about any applicable transaction and account service fees.
2 Excludes the value of portfolio securities received or delivered as a result of in-kind purchases or redemptions of the fund’s capital shares,
including ETF Creation Units.
| | | | | |
| ETF Shares | | | | | |
| |
| For a Share Outstanding | Year Ended August 31, |
| Throughout Each Period | 2014 | 2013 | 2012 | 2011 | 2010 |
| Net Asset Value, Beginning of Period | $39.80 | $32.03 | $28.25 | $27.92 | $29.38 |
| Investment Operations | | | | | |
| Net Investment Income | . 876 | . 825 | .639 | . 526 | .417 |
| Net Realized and Unrealized Gain (Loss) | | | | | |
| on Investments | 7.494 | 7.747 | 3.747 | . 287 | (1.425) |
| Total from Investment Operations | 8.370 | 8.572 | 4.386 | .813 | (1.008) |
| Distributions | | | | | |
| Dividends from Net Investment Income | (.850) | (.802) | (. 606) | (.483) | (. 452) |
| Distributions from Realized Capital Gains | — | — | — | — | — |
| Total Distributions | (.850) | (.802) | (. 606) | (.483) | (. 452) |
| Net Asset Value, End of Period | $47.32 | $39.80 | $32.03 | $28.25 | $27.92 |
| |
| Total Return | 21.20% | 27.10% | 15.87% | 2.73% | –3.51% |
| |
| Ratios/Supplemental Data | | | | | |
| Net Assets, End of Period (Millions) | $2,191 | $1,464 | $768 | $544 | $464 |
| Ratio of Total Expenses to Average Net Assets | 0.12% | 0.14% | 0.14% | 0.19% | 0.24% |
| Ratio of Net Investment Income to | | | | | |
| Average Net Assets | 2.00% | 2.26% | 2.16% | 1.63% | 1.36% |
| Portfolio Turnover Rate1 | 5% | 9% | 7% | 10% | 11% |
| 1 Excludes the value of portfolio securities received or delivered as a result of in-kind purchases or redemptions of the fund’s capital shares, including ETF Creation Units. |
|
See accompanying Notes, which are an integral part of the Financial Statements.
45
Financials Index Fund
Notes to Financial Statements
Vanguard Financials Index Fund is registered under the Investment Company Act of 1940 as an open-end investment company, or mutual fund. The fund offers two classes of shares: Admiral Shares and ETF Shares. Admiral Shares are designed for investors who meet certain administrative, service, and account-size criteria. ETF Shares are listed for trading on NYSE Arca; they can be purchased and sold through a broker.
A. The following significant accounting policies conform to generally accepted accounting principles for U.S. investment companies. The fund consistently follows such policies in preparing its financial statements.
1. Security Valuation: Securities are valued as of the close of trading on the New York Stock Exchange (generally 4 p.m., Eastern time) on the valuation date. Equity securities are valued at the latest quoted sales prices or official closing prices taken from the primary market in which each security trades; such securities not traded on the valuation date are valued at the mean of the latest quoted bid and asked prices. Securities for which market quotations are not readily available, or whose values have been materially affected by events occurring before the fund’s pricing time but after the close of the securities’ primary markets, are valued by methods deemed by the board of trustees to represent fair value. Investments in Vanguard Market Liquidity Fund are valued at that fund’s net asset value.
2. Federal Income Taxes: The fund intends to continue to qualify as a regulated investment company and distribute all of its taxable income. Management has analyzed the fund’s tax positions taken for all open federal income tax years (August 31, 2011–2014), and has concluded that no provision for federal income tax is required in the fund’s financial statements.
3. Distributions: Distributions to shareholders are recorded on the ex-dividend date.
4. Securities Lending: To earn additional income, the fund lends its securities to qualified institutional borrowers. Security loans are required to be secured at all times by collateral in an amount at least equal to the market value of securities loaned. Daily market fluctuations could cause the value of loaned securities to be more or less than the value of the collateral received. When this occurs, the collateral is adjusted and settled on the next business day. The fund further mitigates its counterparty risk by entering into securities lending transactions only with a diverse group of prequalified counterparties, monitoring their financial strength, and entering into master securities lending agreements with its counterparties. The master securities lending agreements provide that, in the event of a counterparty’s default (including bankruptcy), the fund may terminate any loans with that borrower, determine the net amount owed, and sell or retain the collateral up to the net amount owed to the fund; however, such actions may be subject to legal proceedings. While collateral mitigates counterparty risk, in the absence of a default the fund may experience delays and costs in recovering the securities loaned. The fund invests cash collateral received in Vanguard Market Liquidity Fund, and records a liability in the Statement of Net Assets for the return of the collateral, during the period the securities are on loan. Securities lending income represents fees charged to borrowers plus income earned on invested cash collateral, less expenses associated with the loan.
5. Credit Facility: The fund and certain other funds managed by The Vanguard Group participate in a $2.89 billion committed credit facility provided by a syndicate of lenders pursuant to a credit agreement that may be renewed annually; each fund is individually liable for its borrowings, if any, under the credit facility. Borrowings may be utilized for temporary and emergency purposes, and are subject to the fund’s regulatory and contractual borrowing restrictions. The participating funds are charged administrative fees and an annual commitment fee of 0.06% of the undrawn amount of the facility; these fees are allocated to the funds based on a method approved by the fund’s board of trustees and included in Management and Administrative expenses on the fund’s Statement of Operations. Any borrowings under this facility bear interest at a rate equal to the higher of the federal funds rate or LIBOR reference rate plus an agreed-upon spread.
The fund had no borrowings outstanding at August 31, 2014, or at any time during the period then ended.
6. Other: Dividend income is recorded on the ex-dividend date. Interest income includes income distributions received from Vanguard Market Liquidity Fund and is accrued daily. Security transactions are accounted for on the date securities are bought or sold. Costs used to determine realized gains (losses) on the sale of investment securities are those of the specific securities sold.
Each class of shares has equal rights as to assets and earnings, except that each class separately bears certain class-specific expenses related to maintenance of shareholder accounts (included in Management and Administrative expenses) and shareholder reporting. Marketing and distribution expenses are allocated to each class of shares based on a method approved by the board of trustees. Income, other non-class-specific expenses, and gains and losses on investments are allocated to each class of shares based on its relative net assets.
46
Financials Index Fund
B. The Vanguard Group furnishes at cost investment advisory, corporate management, administrative, marketing, and distribution services. The costs of such services are allocated to the fund based on methods approved by the board of trustees. The fund has committed to provide up to 0.40% of its net assets in capital contributions to Vanguard. At August 31, 2014, the fund had contributed capital of $228,000 to Vanguard (included in Other Assets), representing 0.01% of the fund’s net assets and 0.09% of Vanguard’s capitalization. The fund’s trustees and officers are also directors and officers of Vanguard.
C. Various inputs may be used to determine the value of the fund’s investments. These inputs are summarized in three broad levels for financial statement purposes. The inputs or methodologies used to value securities are not necessarily an indication of the risk associated with investing in those securities.
Level 1—Quoted prices in active markets for identical securities.
Level 2—Other significant observable inputs (including quoted prices for similar securities, interest rates, prepayment speeds, credit risk, etc.).
Level 3—Significant unobservable inputs (including the fund’s own assumptions used to determine the fair value of investments).
At August 31, 2014, 100% of the market value of the fund’s investments was determined based on Level 1 inputs.
D. Distributions are determined on a tax basis and may differ from net investment income and realized capital gains for financial reporting purposes. Differences may be permanent or temporary. Permanent differences are reclassified among capital accounts in the financial statements to reflect their tax character. Temporary differences arise when certain items of income, expense, gain, or loss are recognized in different periods for financial statement and tax purposes. These differences will reverse at some time in the future. Differences in classification may also result from the treatment of short-term gains as ordinary income for tax purposes.
Certain of the fund’s investments are in securities considered to be passive foreign investment companies, for which any unrealized appreciation and/or realized gains are required to be included in distributable net income for tax purposes. During the year ended August 31, 2014, the fund realized gains on the sale of passive foreign investment companies of $10,000, which have been included in current and prior periods’ taxable income; accordingly, such gains have been reclassified from accumulated net realized losses to undistributed net investment income. Passive foreign investment companies held at August 31, 2014, had unrealized appreciation of $56,000, of which all has been distributed and is reflected in the balance of undistributed net investment income.
During the year ended August 31, 2014, the fund realized $32,035,000 of net capital gains resulting from in-kind redemptions—in which shareholders exchanged fund shares for securities held by the fund rather than for cash. Because such gains are not taxable to the fund, and are not distributed to shareholders, they have been reclassified from accumulated net realized losses to paid-in capital.
For tax purposes, at August 31, 2014, the fund had $9,669,000 of ordinary income available for distribution. The fund used capital loss carryforwards of $31,803,000 to offset taxable capital gains realized during the year ended August 31, 2014. At August 31, 2014, the fund had available capital losses totaling $192,264,000 to offset future net capital gains of $124,898,000 through August 31, 2018, and $67,366,000 through August 31, 2019.
At August 31, 2014, the cost of investment securities for tax purposes was $2,029,569,000. Net unrealized appreciation of investment securities for tax purposes was $317,297,000, consisting of unrealized gains of $370,642,000 on securities that had risen in value since their purchase and $53,345,000 in unrealized losses on securities that had fallen in value since their purchase.
E. During the year ended August 31, 2014, the fund purchased $623,266,000 of investment securities and sold $197,002,000 of investment securities, other than temporary cash investments. Purchases and sales include $494,830,000 and $90,600,000, respectively, in connection with in-kind purchases and redemptions of the fund’s capital shares.
47
Financials Index Fund
F. Capital share transactions for each class of shares were:
| | | | |
| | Amount | Shares | Amount | Shares |
| | ($000) | (000) | ($000) | (000) |
| Admiral Shares | | | | |
| Issued | 41,610 | 1,878 | 74,041 | 3,996 |
| Issued in Lieu of Cash Distributions | 2,528 | 114 | 1,987 | 111 |
| Redeemed | (45,039) | (2,045) | (38,553) | (2,053) |
| Net Increase (Decrease) —Admiral Shares | (901) | (53) | 37,475 | 2,054 |
| ETF Shares | | | | |
| Issued | 510,779 | 11,516 | 511,402 | 13,606 |
| Issued in Lieu of Cash Distributions | — | — | — | — |
| Redeemed | (90,629) | (2,000) | (31,756) | (800) |
| Net Increase (Decrease)—ETF Shares | 420,150 | 9,516 | 479,646 | 12,806 |
At August 31, 2014, one shareholder was the record or beneficial owner of 36% of the fund’s net assets. If the shareholder were to redeem its investment in the fund, the redemption might result in an increase in the fund’s expense ratio.
G. Management has determined that no material events or transactions occurred subsequent to August 31, 2014, that would require recognition or disclosure in these financial statements.
48
Health Care Index Fund
Fund Profile
As of August 31, 2014
| | |
| Share-Class Characteristics | |
| | Admiral | ETF |
| | Shares | Shares |
| Ticker Symbol | VHCIX | VHT |
| Expense Ratio1 | 0.14% | 0.14% |
| 30-Day SEC Yield | 1.24% | 1.24% |
| | | |
| Portfolio Characteristics | | |
| | | MSCI | |
| | | US IMI/ | |
| | | Health | MSCI |
| | | Care | US IMI/ |
| | Fund | 25/50 | 2500 |
| Number of Stocks | 308 | 305 | 2,499 |
| Median Market Cap | $63.8B | $63.8B | $48.7B |
| Price/Earnings Ratio | 27.8x | 28.2x | 20.7x |
| Price/Book Ratio | 4.0x | 4.0x | 2.7x |
| Return on Equity | 19.5% | 19.5% | 18.0% |
| Earnings Growth Rate | 9.3% | 9.3% | 15.2% |
| Dividend Yield | 1.4% | 1.4% | 1.9% |
| Foreign Holdings | 0.0% | 0.0% | 0.0% |
| Turnover Rate | 5% | — | — |
| Short-Term Reserves | 0.0% | — | — |
| | |
| Volatility Measures | | |
| | MSCI US | |
| | IMI/Health Care | MSCI US |
| | 25/50 | IMI/2500 |
| R-Squared | 1.00 | 0.71 |
| Beta | 1.00 | 0.75 |
| These measures show the degree and timing of the fund’s fluctuations compared with the indexes over 36 months. |
|
| |
| Subindustry Diversification | |
| (% of equity exposure) | |
| |
| Biotechnology | 22.1% |
| Health Care Distributors | 3.7 |
| Health Care Equipment | 14.8 |
| Health Care Facilities | 2.4 |
| Health Care Services | 4.1 |
| Health Care Supplies | 1.2 |
| Health Care Technology | 1.2 |
| Life Sciences Tools & Services | 4.7 |
| Managed Health Care | 7.1 |
| Pharmaceuticals | 38.7 |
| | |
| Ten Largest Holdings (% of total net assets) |
| |
| Johnson & Johnson | Pharmaceuticals | 10.1% |
| Pfizer Inc. | Pharmaceuticals | 6.4 |
| Merck & Co. Inc. | Pharmaceuticals | 6.0 |
| Gilead Sciences Inc. | Biotechnology | 5.7 |
| Amgen Inc. | Biotechnology | 3.6 |
| AbbVie Inc. | Pharmaceuticals | 3.0 |
| UnitedHealth Group Inc. | Managed | |
| | Health Care | 2.9 |
| Bristol-Myers Squibb Co. | Pharmaceuticals | 2.9 |
| Biogen Idec Inc. | Biotechnology | 2.8 |
| Celgene Corp. | Biotechnology | 2.6 |
| Top Ten | | 46.0% |
| The holdings listed exclude any temporary cash investments and equity index products. |
|
1 The expense ratios shown are from the prospectus dated December 23, 2013, and represent estimated costs for the current fiscal year. For the fiscal year ended August 31, 2014, the expense ratios were 0.12% for Admiral Shares and 0.12% for ETF Shares.
49
Health Care Index Fund
Performance Summary
All of the returns in this report represent past performance, which is not a guarantee of future results that may be achieved by the fund. (Current performance may be lower or higher than the performance data cited. For performance data current to the most recent month-end, visit our website at vanguard.com/performance.) Note, too, that both investment returns and principal value can fluctuate widely, so an investor’s shares, when sold, could be worth more or less than their original cost. The returns shown do not reflect taxes that a shareholder would pay on fund distributions or on the sale of fund shares.
Cumulative Performance: August 31, 2004–August 31, 2014
Initial Investment of $10,000
| | | | |
| | | Average Annual Total Returns | Final Value |
| | Periods Ended August 31, 2014 | of a $10,000 |
| | One Year | Five Years | Ten Years | Investment |
| Health Care Index Fund | | | | |
| ETF Shares Net Asset Value | 31.76% | 20.52% | 10.89% | $28,120 |
| Health Care Index Fund | | | | |
| ETF Shares Market Price | 31.82 | 20.52 | 10.91 | 28,161 |
| Spliced US IMI/Health Care 25/50 | 31.90 | 20.68 | 11.09 | 28,628 |
| Health/Biotechnology Funds Average | 34.41 | 22.55 | 12.43 | 32,261 |
| MSCI US IMI/2500 | 24.94 | 17.33 | 9.05 | 23,791 |
For a benchmark description, see the Glossary.
Health/Biotechnology Funds Average: Derived from data provided by Lipper, a Thomson Reuters Company. |
|
| | | | |
| | | | | Final Value |
| | | | | of a $100,000 |
| | One Year | Five Years | Ten Years | Investment |
| Health Care Index Fund Admiral Shares | 31.77% | 20.52% | 10.88% | $280,771 |
| Spliced US IMI/Health Care 25/50 | 31.90 | 20.68 | 11.09 | 286,277 |
| MSCI US IMI/2500 | 24.94 | 17.33 | 9.05 | 237,905 |
See Financial Highlights for dividend and capital gains information.
50
Health Care Index Fund
Fiscal-Year Total Returns (%): August 31, 2004–August 31, 2014
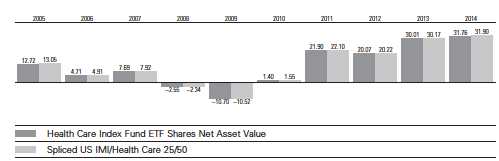
For a benchmark description, see the Glossary.
| | | |
| Cumulative Returns: ETF Shares, August 31, 2004–August 31, 2014 | | |
| |
| | One Year | Five Years | Ten Years |
| Health Care Index Fund ETF Shares Market Price | 31.82% | 154.27% | 181.61% |
| Health Care Index Fund ETF Shares Net Asset Value | 31.76 | 154.22 | 181.20 |
| Spliced US IMI/Health Care 25/50 | 31.90 | 155.94 | 186.28 |
Average Annual Total Returns: Periods Ended June 30, 2014
This table presents total returns through the latest calendar quarter—rather than through the end of the fiscal
period. Securities and Exchange Commission rules require that we provide this information.
| | | | |
| | Inception Date | One Year | Five Years | Ten Years |
| ETF Shares | 1/26/2004 | | | |
| Market Price | | 30.66% | 21.22% | 9.84% |
| Net Asset Value | | 30.76 | 21.22 | 9.84 |
| Admiral Shares | 2/5/2004 | 30.76 | 21.23 | 9.82 |
See Financial Highlights for dividend and capital gains information.
51
Health Care Index Fund
Financial Statements
Statement of Net Assets
As of August 31, 2014
The fund reports a complete list of its holdings in regulatory filings four times in each fiscal year, at the quarter-ends. For the second and fourth fiscal quarters, the lists appear in the fund’s semiannual and annual reports to shareholders. For the first and third fiscal quarters, the fund files the lists with the Securities and Exchange Commission on Form N-Q. Shareholders can look up the fund’s Forms N-Q on the SEC’s website at sec.gov. Forms N-Q may also be reviewed and copied at the SEC’s Public Reference Room (see the back cover of this report for further information).
| | | |
| | | | Market |
| | | | Value• |
| | | Shares | ($000) |
| Common Stocks (100.0%) | | |
| Biotechnology (22.1%) | | |
| * | Gilead Sciences Inc. | 1,971,883 | 212,135 |
| | Amgen Inc. | 972,116 | 135,494 |
| * | Biogen Idec Inc. | 304,575 | 104,481 |
| * | Celgene Corp. | 1,033,475 | 98,201 |
| * | Alexion Pharmaceuticals | | |
| | Inc. | 253,985 | 42,997 |
| * | Regeneron | | |
| | Pharmaceuticals Inc. | 101,575 | 35,604 |
| * | Vertex Pharmaceuticals Inc. | 303,313 | 28,381 |
| * | BioMarin Pharmaceutical | | |
| | Inc. | 187,438 | 13,349 |
| * | Incyte Corp. | 193,762 | 10,502 |
| * | Pharmacyclics Inc. | 81,956 | 10,194 |
| * | InterMune Inc. | 126,986 | 9,327 |
| * | Medivation Inc. | 98,355 | 8,976 |
| * | Puma Biotechnology Inc. | 32,876 | 8,565 |
| * | Alkermes plc | 185,652 | 8,304 |
| * | United Therapeutics Corp. | 61,133 | 7,203 |
| * | Cubist Pharmaceuticals Inc. | 96,699 | 6,675 |
| * | Seattle Genetics Inc. | 134,431 | 5,916 |
| * | Alnylam Pharmaceuticals | | |
| | Inc. | 82,525 | 5,750 |
| * | Intercept Pharmaceuticals | | |
| | Inc. | 17,600 | 5,099 |
| * | Isis Pharmaceuticals Inc. | 121,814 | 4,965 |
| * | NPS Pharmaceuticals Inc. | 129,731 | 3,915 |
| * | Cepheid | 89,633 | 3,588 |
| * | Myriad Genetics Inc. | 96,115 | 3,478 |
| *,^ | OPKO Health Inc. | 292,327 | 2,602 |
| * | ACADIA Pharmaceuticals | | |
| | Inc. | 101,684 | 2,438 |
| *,^ | Exact Sciences Corp. | 106,433 | 2,219 |
| *,^ | Keryx Biopharmaceuticals | | |
| | Inc. | 117,454 | 2,136 |
| *,^ | MannKind Corp. | 274,543 | 2,023 |
| * | Ironwood Pharmaceuticals | | |
| | Inc. Class A | 145,828 | 1,887 |
| * | Dyax Corp. | 174,437 | 1,781 |
| * | Acorda Therapeutics Inc. | 50,998 | 1,662 |
| * | Neurocrine Biosciences Inc. | 98,403 | 1,605 |
| ^ | PDL BioPharma Inc. | 151,014 | 1,524 |
| * | Novavax Inc. | 304,555 | 1,428 |
| * | Synageva BioPharma Corp. | 18,054 | 1,303 |
| * | Receptos Inc. | 24,264 | 1,241 |
| * | Celldex Therapeutics Inc. | 77,223 | 1,229 |
| * | Portola Pharmaceuticals Inc. | 39,819 | 1,111 |
| * | Intrexon Corp. | 51,102 | 1,036 |
| * | Achillion Pharmaceuticals | | |
| | Inc. | 88,424 | 1,023 |
| * | Emergent Biosolutions Inc. | 40,906 | 1,019 |
| * | Bluebird Bio Inc. | 25,186 | 1,008 |
| * | Agios Pharmaceuticals Inc. | 20,052 | 927 |
| * | Ligand Pharmaceuticals Inc. | 17,566 | 914 |
| *,^ | Merrimack Pharmaceuticals | | |
| | Inc. | 120,892 | 844 |
| | | |
| | | | Market |
| | | | Value• |
| | | Shares | ($000) |
| * | Chimerix Inc. | 30,814 | 787 |
| * | MiMedx Group Inc. | 109,639 | 772 |
| * | TESARO Inc. | 25,986 | 768 |
| * | Orexigen Therapeutics Inc. | 134,448 | 766 |
| * | Ophthotech Corp. | 19,341 | 754 |
| * | Repligen Corp. | 39,128 | 746 |
| * | PTC Therapeutics Inc. | 23,257 | 736 |
| * | Sangamo BioSciences Inc. | 50,805 | 727 |
| * | KYTHERA | | |
| | Biopharmaceuticals Inc. | 19,015 | 715 |
| * | Karyopharm Therapeutics | | |
| | Inc. | 18,664 | 672 |
| * | Halozyme Therapeutics Inc. | 64,149 | 609 |
| * | Genomic Health Inc. | 20,455 | 608 |
| * | Clovis Oncology Inc. | 12,186 | 580 |
| * | MacroGenics Inc. | 25,799 | 551 |
| *,^ | Insys Therapeutics Inc. | 15,448 | 546 |
| * | Raptor Pharmaceutical Corp. | 48,602 | 536 |
| * | NewLink Genetics Corp. | 18,921 | 522 |
| * | Acceleron Pharma Inc. | 18,240 | 490 |
| * | Epizyme Inc. | 13,235 | 456 |
| * | Sunesis Pharmaceuticals | | |
| | Inc. | 60,096 | 450 |
| *,^ | Foundation Medicine Inc. | 16,587 | 386 |
| * | Aegerion Pharmaceuticals | | |
| | Inc. | 12,183 | 372 |
| * | Enanta Pharmaceuticals Inc. | 8,400 | 352 |
| * | ARIAD Pharmaceuticals Inc. | 54,426 | 339 |
| * | Hyperion Therapeutics Inc. | 12,450 | 322 |
| * | Osiris Therapeutics Inc. | 22,149 | 316 |
| * | XOMA Corp. | 61,841 | 271 |
| * | ImmunoGen Inc. | 22,895 | 271 |
| * | Xencor Inc. | 23,814 | 255 |
| * | Durata Therapeutics Inc. | 15,923 | 251 |
| * | OncoMed Pharmaceuticals | | |
| | Inc. | 11,422 | 232 |
| * | Regulus Therapeutics Inc. | 27,602 | 190 |
| * | AMAG Pharmaceuticals Inc. | 7,301 | 165 |
| * | Prothena Corp. plc | 6,858 | 157 |
| * | Dynavax Technologies Corp. | 104,903 | 149 |
| * | Immunomedics Inc. | 39,496 | 132 |
| * | Infinity Pharmaceuticals Inc. | 8,903 | 101 |
| * | Spectrum Pharmaceuticals | | |
| | Inc. | 11,236 | 91 |
| * | Lexicon Pharmaceuticals Inc. | 51,437 | 78 |
| * | Arena Pharmaceuticals Inc. | 14,575 | 60 |
| * | Sarepta Therapeutics Inc. | 1,887 | 43 |
| *,^ | Exelixis Inc. | 10,237 | 42 |
| * | Synta Pharmaceuticals Corp. | 7,748 | 31 |
| * | Array BioPharma Inc. | 7,222 | 29 |
| * | Synergy Pharmaceuticals | | |
| | Inc. | 5,906 | 23 |
| * | Momenta Pharmaceuticals | | |
| | Inc. | 1,509 | 18 |
| *,^ | Organovo Holdings Inc. | 1,970 | 15 |
| * | Rigel Pharmaceuticals Inc. | 1,570 | 4 |
| * | Cubist Pharmaceuticals, | | |
| | Inc. CVR | 31,107 | 4 |
| | | |
| | | | Market |
| | | | Value• |
| | | Shares | ($000) |
| *,^ | Navidea | | |
| | Biopharmaceuticals Inc. | 2,690 | 4 |
| * | Dendreon Corp. | 1,905 | 3 |
| * | Protalix BioTherapeutics Inc. | 897 | 2 |
| | | | 823,558 |
| Health Care Equipment & Supplies (16.0%) |
| | Abbott Laboratories | 1,963,808 | 82,951 |
| | Medtronic Inc. | 1,282,820 | 81,908 |
| | Baxter International Inc. | 694,608 | 52,082 |
| | Covidien plc | 578,969 | 50,272 |
| | Stryker Corp. | 438,153 | 36,503 |
| | Becton Dickinson and Co. | 248,160 | 29,077 |
| | St. Jude Medical Inc. | 364,959 | 23,938 |
| * | Intuitive Surgical Inc. | 49,318 | 23,180 |
| | Zimmer Holdings Inc. | 215,514 | 21,403 |
| * | Boston Scientific Corp. | 1,597,127 | 20,252 |
| | CR Bard Inc. | 98,830 | 14,670 |
| * | Edwards Lifesciences Corp. | 136,624 | 13,561 |
| * | CareFusion Corp. | 266,283 | 12,225 |
| * | Varian Medical Systems Inc. | 133,523 | 11,352 |
| | Cooper Cos. Inc. | 61,518 | 10,029 |
| | ResMed Inc. | 180,541 | 9,578 |
| | DENTSPLY International | | |
| | Inc. | 182,097 | 8,687 |
| * | IDEXX Laboratories Inc. | 65,910 | 8,171 |
| * | Hologic Inc. | 283,930 | 7,061 |
| * | Sirona Dental Systems Inc. | 74,102 | 6,040 |
| | Teleflex Inc. | 53,182 | 5,822 |
| * | Align Technology Inc. | 89,119 | 4,853 |
| | STERIS Corp. | 75,900 | 4,272 |
| * | DexCom Inc. | 96,232 | 4,253 |
| | West Pharmaceutical | | |
| | Services Inc. | 90,835 | 3,945 |
| * | Alere Inc. | 100,793 | 3,573 |
| | Hill-Rom Holdings Inc. | 73,838 | 3,235 |
| * | Insulet Corp. | 71,244 | 2,573 |
| * | Haemonetics Corp. | 66,851 | 2,386 |
| * | NuVasive Inc. | 59,856 | 2,101 |
| * | Cyberonics Inc. | 34,704 | 1,992 |
| * | Neogen Corp. | 47,206 | 1,987 |
| * | Wright Medical Group Inc. | 60,946 | 1,819 |
| * | HeartWare International Inc. | 20,912 | 1,696 |
| * | Integra LifeSciences | | |
| | Holdings Corp. | 33,488 | 1,674 |
| | Cantel Medical Corp. | 45,429 | 1,657 |
| * | Spectranetics Corp. | 53,659 | 1,523 |
| * | Greatbatch Inc. | 32,033 | 1,460 |
| | CONMED Corp. | 35,509 | 1,403 |
| | Abaxis Inc. | 27,652 | 1,320 |
| * | ABIOMED Inc. | 49,179 | 1,281 |
| | Analogic Corp. | 16,199 | 1,170 |
| * | Natus Medical Inc. | 41,380 | 1,163 |
| * | Endologix Inc. | 82,888 | 1,145 |
| * | ICU Medical Inc. | 17,618 | 1,103 |
| | Meridian Bioscience Inc. | 54,324 | 1,063 |
| * | Tornier NV | 47,201 | 1,021 |
| * | Cardiovascular Systems Inc. | 35,799 | 1,020 |
| * | Globus Medical Inc. | 56,121 | 1,018 |
52
Health Care Index Fund
| | | |
| | | | Market |
| | | | Value• |
| | | Shares | ($000) |
| * | NxStage Medical Inc. | 76,036 | 998 |
| * | Quidel Corp. | 37,900 | 894 |
| * | Orthofix International NV | 24,989 | 847 |
| * | Accuray Inc. | 100,294 | 816 |
| * | Thoratec Corp. | 28,139 | 703 |
| * | Merit Medical Systems Inc. | 53,947 | 675 |
| | Atrion Corp. | 2,073 | 663 |
| * | Cynosure Inc. Class A | 26,060 | 587 |
| * | GenMark Diagnostics Inc. | 51,467 | 553 |
| * | AngioDynamics Inc. | 34,328 | 484 |
| * | OraSure Technologies Inc. | 55,996 | 466 |
| * | STAAR Surgical Co. | 40,287 | 464 |
| * | Symmetry Medical Inc. | 50,185 | 463 |
| * | Masimo Corp. | 19,808 | 445 |
| * | LDR Holding Corp. | 15,014 | 406 |
| * | Exactech Inc. | 13,762 | 329 |
| * | Tandem Diabetes Care Inc. | 14,678 | 208 |
| * | SurModics Inc. | 8,878 | 181 |
| | Invacare Corp. | 5,866 | 90 |
| * | Volcano Corp. | 6,455 | 80 |
| * | Wright Medical Group Inc. | | |
| | CVR | 14,554 | 23 |
| * | Antares Pharma Inc. | 7,667 | 18 |
| * | PhotoMedex Inc. | 1,426 | 12 |
| * | Unilife Corp. | 4,457 | 11 |
| | | | 596,884 |
| Health Care Providers & Services (17.3%) | |
| | UnitedHealth Group Inc. | 1,258,921 | 109,123 |
| * | Express Scripts Holding | | |
| | Co. | 995,792 | 73,619 |
| | McKesson Corp. | 296,163 | 57,761 |
| | WellPoint Inc. | 359,516 | 41,887 |
| | Aetna Inc. | 461,669 | 37,917 |
| | Cigna Corp. | 348,401 | 32,959 |
| | Cardinal Health Inc. | 436,911 | 32,200 |
| * | HCA Holdings Inc. | 392,416 | 27,398 |
| | Humana Inc. | 198,823 | 25,596 |
| | AmerisourceBergen Corp. | | |
| | Class A | 291,863 | 22,587 |
| * | DaVita HealthCare Partners | | |
| | Inc. | 220,044 | 16,433 |
| | Universal Health Services | | |
| | Inc. Class B | 117,560 | 13,454 |
| * | Henry Schein Inc. | 109,702 | 13,130 |
| | Quest Diagnostics Inc. | 185,590 | 11,731 |
| * | Laboratory Corp. of | | |
| | America Holdings | 108,978 | 11,686 |
| | Omnicare Inc. | 127,446 | 8,127 |
| * | Community Health | | |
| | Systems Inc. | 148,047 | 8,036 |
| * | Tenet Healthcare Corp. | 125,472 | 7,676 |
| * | MEDNAX Inc. | 128,961 | 7,383 |
| * | Brookdale Senior Living Inc. | 209,862 | 7,335 |
| * | Envision Healthcare | | |
| | Holdings Inc. | 152,437 | 5,573 |
| * | Centene Corp. | 70,427 | 5,502 |
| * | Team Health Holdings Inc. | 90,276 | 5,283 |
| * | Health Net Inc. | 103,035 | 4,863 |
| * | LifePoint Hospitals Inc. | 60,057 | 4,492 |
| | HealthSouth Corp. | 113,198 | 4,459 |
| * | VCA Inc. | 107,779 | 4,392 |
| | Patterson Cos. Inc. | 107,521 | 4,330 |
| * | WellCare Health Plans Inc. | 56,417 | 3,716 |
| * | Acadia Healthcare Co. Inc. | 60,197 | 3,083 |
| * | Amsurg Corp. | 52,838 | 2,842 |
| * | Air Methods Corp. | 47,767 | 2,802 |
| | Owens & Minor Inc. | 81,042 | 2,788 |
| | Chemed Corp. | 22,599 | 2,387 |
| | | |
| | | | Market |
| | | | Value• |
| | | Shares | ($000) |
| * | MWI Veterinary Supply Inc. | 16,609 | 2,359 |
| * | Magellan Health Inc. | 35,492 | 1,983 |
| * | Molina Healthcare Inc. | 38,764 | 1,854 |
| | Kindred Healthcare Inc. | 82,669 | 1,707 |
| | Select Medical Holdings | | |
| | Corp. | 116,683 | 1,636 |
| * | ExamWorks Group Inc. | 47,880 | 1,578 |
| * | Premier Inc. Class A | 41,665 | 1,316 |
| * | IPC The Hospitalist Co. Inc. | 22,346 | 1,080 |
| * | PharMerica Corp. | 38,764 | 965 |
| * | Bio-Reference Laboratories | | |
| | Inc. | 32,621 | 948 |
| | Ensign Group Inc. | 26,206 | 917 |
| * | Capital Senior Living Corp. | 35,949 | 822 |
| * | AMN Healthcare Services | | |
| | Inc. | 47,325 | 716 |
| | National Healthcare Corp. | 11,889 | 681 |
| * | CorVel Corp. | 14,902 | 610 |
| * | Healthways Inc. | 34,197 | 597 |
| | US Physical Therapy Inc. | 15,897 | 568 |
| * | Triple-S Management Corp. | | |
| | Class B | 29,591 | 566 |
| * | Surgical Care Affiliates Inc. | 17,379 | 517 |
| * | Universal American Corp. | 52,255 | 447 |
| * | LHC Group Inc. | 16,736 | 431 |
| * | Amedisys Inc. | 20,521 | 429 |
| * | BioScrip Inc. | 47,866 | 405 |
| * | Gentiva Health Services Inc. | 21,452 | 388 |
| * | Hanger Inc. | 10,456 | 234 |
| * | National Research Corp. | | |
| | Class A | 14,719 | 206 |
| | Landauer Inc. | 114 | 4 |
| | | | 646,514 |
| Health Care Technology (1.2%) | | |
| * | Cerner Corp. | 396,864 | 22,883 |
| * | athenahealth Inc. | 41,408 | 5,981 |
| * | HMS Holdings Corp. | 112,657 | 2,575 |
| * | IMS Health Holdings Inc. | 85,511 | 2,386 |
| * | Medidata Solutions Inc. | 46,877 | 2,182 |
| * | Allscripts Healthcare | | |
| | Solutions Inc. | 141,922 | 2,097 |
| * | MedAssets Inc. | 78,946 | 1,816 |
| * | Veeva Systems Inc. | | |
| | Class A | 49,872 | 1,495 |
| * | Omnicell Inc. | 47,045 | 1,324 |
| | Computer Programs & | | |
| | Systems Inc. | 13,900 | 854 |
| * | HealthStream Inc. | 28,857 | 749 |
| | Quality Systems Inc. | 8,908 | 139 |
| * | Vocera Communications Inc. | 558 | 5 |
| | | | 44,486 |
| Life Sciences Tools & Services (4.7%) | |
| | Thermo Fisher Scientific | | |
| | Inc. | 512,252 | 61,578 |
| * | Illumina Inc. | 164,900 | 29,576 |
| | Agilent Technologies Inc. | 428,188 | 24,475 |
| * | Waters Corp. | 108,928 | 11,266 |
| * | Mettler-Toledo International | | |
| | Inc. | 37,522 | 10,149 |
| | PerkinElmer Inc. | 145,401 | 6,521 |
| * | Covance Inc. | 73,732 | 6,112 |
| | Techne Corp. | 47,569 | 4,544 |
| * | Quintiles Transnational | | |
| | Holdings Inc. | 75,278 | 4,225 |
| * | PAREXEL International Corp. | 73,035 | 4,122 |
| * | Charles River Laboratories | | |
| | International Inc. | 62,205 | 3,676 |
| | | |
| | | | Market |
| | | | Value• |
| | | Shares | ($000) |
| * | Bio-Rad Laboratories Inc. | | |
| | Class A | 25,915 | 3,117 |
| * | Bruker Corp. | 150,973 | 3,029 |
| * | Luminex Corp. | 49,519 | 933 |
| * | Cambrex Corp. | 40,307 | 884 |
| * | Accelerate Diagnostics Inc. | 32,332 | 655 |
| * | Fluidigm Corp. | 20,674 | 563 |
| * | Affymetrix Inc. | 32,554 | 282 |
| * | Sequenom Inc. | 44,078 | 164 |
| | | | 175,871 |
| Pharmaceuticals (38.7%) | | |
| | Johnson & Johnson | 3,632,714 | 376,821 |
| | Pfizer Inc. | 8,180,601 | 240,428 |
| | Merck & Co. Inc. | 3,752,564 | 225,567 |
| | AbbVie Inc. | 2,041,752 | 112,868 |
| | Bristol-Myers Squibb Co. | 2,127,895 | 107,778 |
| | Eli Lilly & Co. | 1,293,753 | 82,231 |
| * | Actavis plc | 339,289 | 77,012 |
| | Allergan Inc. | 382,119 | 62,545 |
| | Perrigo Co. plc | 171,890 | 25,567 |
| * | Mylan Inc. | 479,937 | 23,325 |
| | Zoetis Inc. | 619,841 | 21,967 |
| * | Salix Pharmaceuticals Ltd. | 81,485 | 12,965 |
| * | Mallinckrodt plc | 145,982 | 11,896 |
| * | Endo International plc | 185,776 | 11,836 |
| * | Hospira Inc. | 214,632 | 11,534 |
| * | Jazz Pharmaceuticals plc | 68,774 | 11,205 |
| * | Pacira Pharmaceuticals Inc. | 43,533 | 4,713 |
| * | Akorn Inc. | 100,099 | 3,906 |
| * | Nektar Therapeutics | 163,125 | 2,326 |
| * | Prestige Brands Holdings | | |
| | Inc. | 66,623 | 2,306 |
| * | Impax Laboratories Inc. | 85,694 | 2,111 |
| ^ | Theravance Inc. | 59,446 | 1,401 |
| * | AVANIR Pharmaceuticals | | |
| | Inc. | 205,351 | 1,277 |
| * | Lannett Co. Inc. | 32,053 | 1,262 |
| * | Depomed Inc. | 74,490 | 1,143 |
| * | Medicines Co. | 40,676 | 1,042 |
| * | Theravance Biopharma Inc. | 31,369 | 921 |
| * | BioDelivery Sciences | | |
| | International Inc. | 56,390 | 902 |
| * | Sagent Pharmaceuticals Inc. | 27,398 | 762 |
| * | TherapeuticsMD Inc. | 129,490 | 719 |
| * | Repros Therapeutics Inc. | 30,616 | 671 |
| * | SciClone Pharmaceuticals | | |
| | Inc. | 61,038 | 419 |
| * | Auxilium Pharmaceuticals | | |
| | Inc. | 19,354 | 360 |
| * | Intra-Cellular Therapies Inc. | 24,911 | 354 |
| * | Relypsa Inc. | 13,144 | 332 |
| * | Cempra Inc. | 27,914 | 295 |
| * | Aratana Therapeutics Inc. | 25,312 | 294 |
| * | Aerie Pharmaceuticals Inc. | 11,091 | 182 |
| * | XenoPort Inc. | 13,962 | 71 |
| * | Ampio Pharmaceuticals Inc. | 12,994 | 61 |
| * | Horizon Pharma Inc. | 2,223 | 23 |
| * | Endocyte Inc. | 1,092 | 8 |
| * | AcelRx Pharmaceuticals Inc. | 927 | 7 |
| * | VIVUS Inc. | 1,113 | 5 |
| | | | 1,443,418 |
| Total Common Stocks | | |
| (Cost $2,746,225) | | 3,730,731 |
53
Health Care Index Fund
| | |
| | | Market |
| | | Value• |
| | Shares | ($000) |
| Temporary Cash Investment (0.1%) | |
| Money Market Fund (0.1%) | |
| 1,2 Vanguard Market | | |
| Liquidity Fund, 0.113% | |
| (Cost $5,965) | 5,965,201 | 5,965 |
| Total Investments (100.1%) | |
| (Cost $2,752,190) | | 3,736,696 |
| Other Assets and Liabilities (–0.1%) | |
| Other Assets | | 54,813 |
| Liabilities2 | | (59,691) |
| | | (4,878) |
| Net Assets (100%) | | 3,731,818 |
| |
| At August 31, 2014, net assets consisted of: |
| | Amount |
| | ($000) |
| Paid-in Capital | 2,729,248 |
| Undistributed Net Investment Income | 29,557 |
| Accumulated Net Realized Losses | (11,493) |
| Unrealized Appreciation (Depreciation) | 984,506 |
| Net Assets | 3,731,818 |
| |
| |
| Admiral Shares—Net Assets | |
| Applicable to 7,048,422 outstanding | |
| $.001 par value shares of beneficial | |
| interest (unlimited authorization) | 413,116 |
| Net Asset Value Per Share— | |
| Admiral Shares | $58.61 |
| |
| |
| ETF Shares—Net Assets | |
| Applicable to 28,323,648 outstanding | |
| $.001 par value shares of beneficial | |
| interest (unlimited authorization) | 3,318,702 |
| Net Asset Value Per Share— | |
| ETF Shares | $117.17 |
• See Note A in Notes to Financial Statements.
* Non-income-producing security.
^ Includes partial security positions on loan to broker-dealers. The total value of securities on loan is $5,533,000.
1 Affiliated money market fund available only to Vanguard funds and certain trusts and accounts managed by Vanguard. Rate shown is the 7-day yield.
2 Includes $5,965,000 of collateral received for securities on loan.
See accompanying Notes, which are an integral part of the Financial Statements.
54
Health Care Index Fund
Statement of Operations
| |
| | Year Ended |
| August 31, 2014 |
| | ($000) |
| Investment Income | |
| Income | |
| Dividends | 45,153 |
| Interest1 | 1 |
| Securities Lending | 631 |
| Total Income | 45,785 |
| Expenses | |
| The Vanguard Group—Note B | |
| Investment Advisory Services | 482 |
| Management and Administrative— | |
| Admiral Shares | 296 |
| Management and Administrative— | |
| ETF Shares | 2,041 |
| Marketing and Distribution— | |
| Admiral Shares | 45 |
| Marketing and Distribution— | |
| ETF Shares | 532 |
| Custodian Fees | 35 |
| Auditing Fees | 32 |
| Shareholders’ Reports—Admiral Shares | 1 |
| Shareholders’ Reports—ETF Shares | 152 |
| Trustees’ Fees and Expenses | 2 |
| Total Expenses | 3,618 |
| Net Investment Income | 42,167 |
| Realized Net Gain (Loss) | |
| Investment Securities Sold | 177,210 |
| Futures Contracts | 161 |
| Realized Net Gain (Loss) | 177,371 |
| Change in Unrealized Appreciation | |
| (Depreciation) of Investment Securities | 563,963 |
| Net Increase (Decrease) in Net Assets | |
| Resulting from Operations | 783,501 |
Statement of Changes in Net Assets
| | |
| | Year Ended August 31, |
| | 2014 | 2013 |
| | ($000) | ($000) |
| Increase (Decrease) in Net Assets | | |
| Operations | | |
| Net Investment Income | 42,167 | 25,751 |
| Realized Net Gain (Loss) | 177,371 | 9,411 |
| Change in Unrealized Appreciation (Depreciation) | 563,963 | 340,865 |
| Net Increase (Decrease) in Net Assets Resulting from Operations | 783,501 | 376,027 |
| Distributions | | |
| Net Investment Income | | |
| Admiral Shares | (3,382) | (1,915) |
| ETF Shares | (26,834) | (17,154) |
| Realized Capital Gain | | |
| Admiral Shares | — | — |
| ETF Shares | — | — |
| Total Distributions | (30,216) | (19,069) |
| Capital Share Transactions | | |
| Admiral Shares | 81,482 | 112,185 |
| ETF Shares | 732,487 | 703,392 |
| Net Increase (Decrease) from Capital Share Transactions | 813,969 | 815,577 |
| Total Increase (Decrease) | 1,567,254 | 1,172,535 |
| Net Assets | | |
| Beginning of Period | 2,164,564 | 992,029 |
| End of Period2 | 3,731,818 | 2,164,564 |
1 Interest income from an affiliated company of the fund was $1,000.
2 Net Assets—End of Period includes undistributed (overdistributed) net investment income of $29,557,000 and $17,606,000.
See accompanying Notes, which are an integral part of the Financial Statements.
55
Health Care Index Fund
Financial Highlights
| | | | | |
| Admiral Shares | | | | | |
| |
| For a Share Outstanding | Year Ended August 31, |
| Throughout Each Period | 2014 | 2013 | 2012 | 2011 | 2010 |
| Net Asset Value, Beginning of Period | $44.99 | $35.18 | $29.81 | $24.87 | $25.19 |
| Investment Operations | | | | | |
| Net Investment Income | .666 | .580 | .599 | .533 | .7291 |
| Net Realized and Unrealized Gain (Loss) | | | | | |
| on Investments | 13.523 | 9.831 | 5.298 | 4.888 | (.312) |
| Total from Investment Operations | 14.189 | 10.411 | 5.897 | 5.421 | .417 |
| Distributions | | | | | |
| Dividends from Net Investment Income | (. 569) | (.601) | (. 527) | (.481) | (.737) |
| Distributions from Realized Capital Gains | — | — | — | — | — |
| Total Distributions | (. 569) | (.601) | (. 527) | (.481) | (.737) |
| Net Asset Value, End of Period | $58.61 | $44.99 | $35.18 | $29.81 | $24.87 |
| |
| Total Return 2 | 31.77% | 30.00% | 20.08% | 21.90% | 1.41% |
| |
| Ratios/Supplemental Data | | | | | |
| Net Assets, End of Period (Millions) | $413 | $247 | $98 | $75 | $54 |
| Ratio of Total Expenses to Average Net Assets | 0.12% | 0.14% | 0.14% | 0.19% | 0.24% |
| Ratio of Net Investment Income to | | | | | |
| Average Net Assets | 1.40% | 1.69% | 1.92% | 1.74% | 2.74%1 |
| Portfolio Turnover Rate3 | 5% | 5% | 9% | 9% | 10% |
1 Net investment income per share and the ratio of net investment income to average net assets include $.30 and 1.17%, respectively,
resulting from a cash payment received in connection with the merger of Schering-Plough Corp. and Merck & Co., Inc., in November 2009.
2 Total returns do not include transaction or account service fees that may have applied in the periods shown. Fund prospectuses provide
information about any applicable transaction and account service fees.
3 Excludes the value of portfolio securities received or delivered as a result of in-kind purchases or redemptions of the fund’s capital shares,
including ETF Creation Units.
| | | | | |
| ETF Shares | | | | | |
| |
| For a Share Outstanding | Year Ended August 31, |
| Throughout Each Period | 2014 | 2013 | 2012 | 2011 | 2010 |
| Net Asset Value, Beginning of Period | $89.94 | $70.32 | $59.58 | $49.72 | $50.37 |
| Investment Operations | | | | | |
| Net Investment Income | 1.333 | 1.155 | 1.197 | 1.057 | 1.4831 |
| Net Realized and Unrealized Gain (Loss) | | | | | |
| on Investments | 27.033 | 19.663 | 10.592 | 9.782 | (. 646) |
| Total from Investment Operations | 28.366 | 20.818 | 11.789 | 10.839 | . 837 |
| Distributions | | | | | |
| Dividends from Net Investment Income | (1.136) | (1.198) | (1.049) | (. 979) | (1.487) |
| Distributions from Realized Capital Gains | — | — | — | — | — |
| Total Distributions | (1.136) | (1.198) | (1.049) | (. 979) | (1.487) |
| Net Asset Value, End of Period | $117.17 | $89.94 | $70.32 | $59.58 | $49.72 |
| |
| Total Return | 31.76% | 30.01% | 20.07% | 21.90% | 1.40% |
| |
| Ratios/Supplemental Data | | | | | |
| Net Assets, End of Period (Millions) | $3,319 | $1,918 | $894 | $692 | $558 |
| Ratio of Total Expenses to Average Net Assets | 0.12% | 0.14% | 0.14% | 0.19% | 0.24% |
| Ratio of Net Investment Income to | | | | | |
| Average Net Assets | 1.40% | 1.69% | 1.92% | 1.74% | 2.74%1 |
| Portfolio Turnover Rate2 | 5% | 5% | 9% | 9% | 10% |
1 Net investment income per share and the ratio of net investment income to average net assets include $.62 and 1.17%, respectively,resulting from a cash payment received in connection with the merger of Schering-Plough Corp. and Merck & Co., Inc., in November 2009.2 Excludes the value of portfolio securities received or delivered as a result of in-kind purchases or redemptions of the fund’s capital shares,including ETF Creation Units.See accompanying Notes, which are an integral part of the Financial Statements.
56
Health Care Index Fund
Notes to Financial Statements
Vanguard Health Care Index Fund is registered under the Investment Company Act of 1940 as an open-end investment company, or mutual fund. The fund offers two classes of shares: Admiral Shares and ETF Shares. Admiral Shares are designed for investors who meet certain administrative, service, and account-size criteria. ETF Shares are listed for trading on NYSE Arca; they can be purchased and sold through a broker.
A. The following significant accounting policies conform to generally accepted accounting principles for U.S. investment companies. The fund consistently follows such policies in preparing its financial statements.
1. Security Valuation: Securities are valued as of the close of trading on the New York Stock Exchange (generally 4 p.m., Eastern time) on the valuation date. Equity securities are valued at the latest quoted sales prices or official closing prices taken from the primary market in which each security trades; such securities not traded on the valuation date are valued at the mean of the latest quoted bid and asked prices. Securities for which market quotations are not readily available, or whose values have been materially affected by events occurring before the fund’s pricing time but after the close of the securities’ primary markets, are valued by methods deemed by the board of trustees to represent fair value. Investments in Vanguard Market Liquidity Fund are valued at that fund’s net asset value.
2. Futures Contracts: The fund uses index futures contracts to a limited extent, with the objectives of maintaining full exposure to the stock market, enhancing returns, maintaining liquidity, and minimizing transaction costs. The fund may purchase futures contracts to immediately invest incoming cash in the market, or sell futures in response to cash outflows, thereby simulating a fully invested position in the underlying index while maintaining a cash balance for liquidity. The fund may seek to enhance returns by using futures contracts instead of the underlying securities when futures are believed to be priced more attractively than the underlying securities. The primary risks associated with the use of futures contracts are imperfect correlation between changes in market values of stocks held by the fund and the prices of futures contracts, and the possibility of an illiquid market. Counterparty risk involving futures is mitigated because a regulated clearinghouse is the counterparty instead of the clearing broker. To further mitigate counterparty risk, the fund trades futures contracts on an exchange, monitors the financial strength of its clearing brokers and clearinghouse, and has entered into clearing agreements with its clearing brokers. The clearinghouse imposes initial margin requirements to secure the fund��s performance and requires daily settlement of variation margin representing changes in the market value of each contract.
Futures contracts are valued at their quoted daily settlement prices. The aggregate settlement values of the contracts are not recorded in the Statement of Net Assets. Fluctuations in the value of the contracts are recorded in the Statement of Net Assets as an asset (liability) and in the Statement of Operations as unrealized appreciation (depreciation) until the contracts are closed, when they are recorded as realized futures gains (losses).
During the year ended August 31, 2014, the fund’s average investments in long and short futures contracts represented less than 1% and 0% of net assets, respectively, based on the average of aggregate settlement values at each quarter-end during the period. The fund had no open futures contracts at August 31, 2014.
3. Federal Income Taxes: The fund intends to continue to qualify as a regulated investment company and distribute all of its taxable income. Management has analyzed the fund’s tax positions taken for all open federal income tax years (August 31, 2011–2014), and has concluded that no provision for federal income tax is required in the fund’s financial statements.
4. Distributions: Distributions to shareholders are recorded on the ex-dividend date.
5. Securities Lending: To earn additional income, the fund lends its securities to qualified institutional borrowers. Security loans are required to be secured at all times by collateral in an amount at least equal to the market value of securities loaned. Daily market fluctuations could cause the value of loaned securities to be more or less than the value of the collateral received. When this occurs, the collateral is adjusted and settled on the next business day. The fund further mitigates its counterparty risk by entering into securities lending transactions only with a diverse group of prequalified counterparties, monitoring their financial strength, and entering into master securities lending agreements with its counterparties. The master securities lending agreements provide that, in the event of a counterparty’s default (including bankruptcy), the fund may terminate any loans with that borrower, determine the net amount owed, and sell or retain the collateral up to the net amount owed to the fund; however, such actions may be subject to legal proceedings. While collateral mitigates counterparty risk, in the absence of a default the fund may experience delays and costs in recovering the securities loaned.
57
Health Care Index Fund
The fund invests cash collateral received in Vanguard Market Liquidity Fund, and records a liability in the Statement of Net Assets for the return of the collateral, during the period the securities are on loan. Securities lending income represents fees charged to borrowers plus income earned on invested cash collateral, less expenses associated with the loan.
6. Credit Facility: The fund and certain other funds managed by The Vanguard Group participate in a $2.89 billion committed credit facility provided by a syndicate of lenders pursuant to a credit agreement that may be renewed annually; each fund is individually liable for its borrowings, if any, under the credit facility. Borrowings may be utilized for temporary and emergency purposes, and are subject to the fund’s regulatory and contractual borrowing restrictions. The participating funds are charged administrative fees and an annual commitment fee of 0.06% of the undrawn amount of the facility; these fees are allocated to the funds based on a method approved by the fund’s board of trustees and included in Management and Administrative expenses on the fund’s Statement of Operations. Any borrowings under this facility bear interest at a rate equal to the higher of the federal funds rate or LIBOR reference rate plus an agreed-upon spread.
The fund had no borrowings outstanding at August 31, 2014, or at any time during the period then ended.
7. Other: Dividend income is recorded on the ex-dividend date. Interest income includes income distributions received from Vanguard Market Liquidity Fund and is accrued daily. Premiums and discounts on debt securities purchased are amortized and accreted, respectively, to interest income over the lives of the respective securities. Security transactions are accounted for on the date securities are bought or sold. Costs used to determine realized gains (losses) on the sale of investment securities are those of the specific securities sold.
Each class of shares has equal rights as to assets and earnings, except that each class separately bears certain class-specific expenses related to maintenance of shareholder accounts (included in Management and Administrative expenses) and shareholder reporting. Marketing and distribution expenses are allocated to each class of shares based on a method approved by the board of trustees Income, other non-class-specific expenses, and gains and losses on investments are allocated to each class of shares based on its relative net assets.
B. The Vanguard Group furnishes at cost investment advisory, corporate management, administrative, marketing, and distribution services. The costs of such services are allocated to the fund based on methods approved by the board of trustees. The fund has committed to provide up to 0.40% of its net assets in capital contributions to Vanguard. At August 31, 2014, the fund had contributed capital of $352,000 to Vanguard (included in Other Assets), representing 0.01% of the fund’s net assets and 0.14% of Vanguard’s capitalization. The fund’s trustees and officers are also directors and officers of Vanguard.
C. Various inputs may be used to determine the value of the fund’s investments. These inputs are summarized in three broad levels for financial statement purposes. The inputs or methodologies used to value securities are not necessarily an indication of the risk associated with investing in those securities.
Level 1—Quoted prices in active markets for identical securities.
Level 2—Other significant observable inputs (including quoted prices for similar securities, interest rates, prepayment speeds, credit risk, etc.).
Level 3—Significant unobservable inputs (including the fund’s own assumptions used to determine the fair value of investments).
The following table summarizes the market value of the fund’s investments as of August 31, 2014, based on the inputs used to value them:
| | | |
| | Level 1 | Level 2 | Level 3 |
| Investments | ($000) | ($000) | ($000) |
| Common Stocks | 3,730,727 | — | 4 |
| Temporary Cash Investments | 5,965 | — | — |
| Futures Contracts—Liabilities1 | (8) | — | — |
| Total | 3,736,684 | — | 4 |
| 1 Represents variation margin on the last day of the reporting period. |
58
Health Care Index Fund
D. Distributions are determined on a tax basis and may differ from net investment income and realized capital gains for financial reporting purposes. Differences may be permanent or temporary. Permanent differences are reclassified among capital accounts in the financial statements to reflect their tax character. Temporary differences arise when certain items of income, expense, gain, or loss are recognized in different periods for financial statement and tax purposes. These differences will reverse at some time in the future. Differences in classification may also result from the treatment of short-term gains as ordinary income for tax purposes.
During the year ended August 31, 2014, the fund realized $161,763,000 of net capital gains resulting from in-kind redemptions—in which shareholders exchanged fund shares for securities held by the fund rather than for cash. Because such gains are not taxable to the fund, and are not distributed to shareholders, they have been reclassified from accumulated net realized losses to paid-in capital.
For tax purposes, at August 31, 2014, the fund had $30,777,000 of ordinary income available for distribution. The fund used capital loss carryforwards of $16,830,000 to offset taxable capital gains realized during the year ended August 31, 2014. At August 31, 2014, the fund had available capital losses totaling $10,370,000 to offset future net capital gains through August 31, 2019.
At August 31, 2014, the cost of investment securities for tax purposes was $2,753,421,000. Net unrealized appreciation of investment securities for tax purposes was $983,275,000, consisting of unrealized gains of $987,819,000 on securities that had risen in value since their purchase and $4,544,000 in unrealized losses on securities that had fallen in value since their purchase.
E. During the year ended August 31, 2014, the fund purchased $1,333,568,000 of investment securities and sold $508,660,000 of investment securities, other than temporary cash investments. Purchases and sales include $1,029,067,000 and $344,579,000, respectively, in connection with in-kind purchases and redemptions of the fund’s capital shares.
F. Capital share transactions for each class of shares were:
| | | | |
| | Year Ended August 31, |
| | | 2014 | | | 2013 |
| | Amount | Shares | Amount | Shares |
| | ($000) | (000) | ($000) | (000) |
| Admiral Shares | | | | |
| Issued | 174,189 | 3,337 | 150,894 | 3,643 |
| Issued in Lieu of Cash Distributions | 3,071 | 62 | 1,689 | 47 |
| Redeemed | (95,778) | (1,836) | (40,398) | (985) |
| Net Increase (Decrease) —Admiral Shares | 81,482 | 1,563 | 112,185 | 2,705 |
| ETF Shares | | | | |
| Issued | 1,080,801 | 10,301 | 727,352 | 8,906 |
| Issued in Lieu of Cash Distributions | — | — | — | — |
| Redeemed | (348,314) | (3,300) | (23,960) | (300) |
| Net Increase (Decrease)—ETF Shares | 732,487 | 7,001 | 703,392 | 8,606 |
G. Management has determined that no material events or transactions occurred subsequent to August 31, 2014, that would require recognition or disclosure in these financial statements.
59
Industrials Index Fund
Fund Profile
As of August 31, 2014
| | |
| Share-Class Characteristics | |
| | Admiral | ETF |
| | Shares | Shares |
| Ticker Symbol | VINAX | VIS |
| Expense Ratio1 | 0.14% | 0.14% |
| 30-Day SEC Yield | 1.66% | 1.66% |
| | | |
| Portfolio Characteristics | | |
| | | MSCI | |
| | | US IMI/ | MSCI |
| | | Industrials | US IMI/ |
| | Fund | 25/50 | 2500 |
| Number of Stocks | 353 | 353 | 2,499 |
| Median Market Cap | $31.0B | $31.0B | $48.7B |
| Price/Earnings Ratio | 20.1x | 20.1x | 20.7x |
| Price/Book Ratio | 3.1x | 3.1x | 2.7x |
| Return on Equity | 18.7% | 18.7% | 18.0% |
| Earnings Growth Rate | 12.8% | 12.8% | 15.2% |
| Dividend Yield | 1.8% | 1.8% | 1.9% |
| Foreign Holdings | 0.0% | 0.0% | 0.0% |
| Turnover Rate | 5% | — | — |
| Short-Term Reserves | 0.0% | — | — |
| | |
| Volatility Measures | | |
| | MSCI US | |
| | IMI/Industrials | MSCI US |
| | 25/50 | IMI/2500 |
| -Squared | 1.00 | 0.89 |
| Beta | 1.00 | 1.16 |
| These measures show the degree and timing of the fund’s fluctuations compared with the indexes over 36 months. |
|
| |
| Subindustry Diversification | |
| (% of equity exposure) | |
| |
| Aerospace & Defense | 21.3% |
| Agriculture & Farm Machinery | 1.6 |
| Air Freight & Logistics | 5.5 |
| Airlines | 4.8 |
| Building Products | 2.0 |
| Construction & Engineering | 2.4 |
| Construction Machinery & Heavy Trucks | 6.7 |
| Diversified Support Services | 1.3 |
| Electrical Components & Equipment | 6.0 |
| Environmental & Facilities Services | 2.5 |
| Human Resource & Employment Services | 1.2 |
| Industrial Conglomerates | 17.0 |
| Industrial Machinery | 9.9 |
| Railroads | 7.2 |
| Research & Consulting Services | 2.4 |
| Security & Alarm Services | 1.1 |
| Trading Companies & Distributors | 3.1 |
| Trucking | 2.2 |
| Other Industrials | 1.8 |
| | |
| Ten Largest Holdings (% of total net assets) |
| |
| General Electric | | |
| Co. | Industrial Conglomerates | 10.5% |
| Union Pacific Corp. | Railroads | 3.9 |
| United | | |
| Technologies Corp. | Aerospace & Defense | 3.8 |
| 3M Co. | Industrial Conglomerates | 3.6 |
| Boeing Co. | Aerospace & Defense | 3.6 |
| Honeywell | | |
| International Inc. | Aerospace & Defense | 2.9 |
| United Parcel | | |
| Service Inc. | Air Freight & Logistics | 2.8 |
| Caterpillar Inc. | Construction Machinery | |
| | & Heavy Trucks | 2.6 |
| Danaher Corp. | Industrial Conglomerates | 1.9 |
| Lockheed Martin | | |
| Corp. | Aerospace & Defense | 1.9 |
| Top Ten | | 37.5% |
| The holdings listed exclude any temporary cash investments and equity index products. |
|
1 The expense ratios shown are from the prospectus dated December 23, 2013, and represent estimated costs for the current fiscal year. For the fiscal year ended August 31, 2014, the expense ratios were 0.12% for
Admiral Shares and 0.12% for ETF Shares.
60
Industrials Index Fund
Performance Summary
All of the returns in this report represent past performance, which is not a guarantee of future results that may be achieved by the fund. (Current performance may be lower or higher than the performance data cited. For performance data current to the most recent month-end, visit our website at vanguard.com/performance.) Note, too, that both investment returns and principal value can fluctuate widely, so an investor’s shares, when sold, could be worth more or less than their original cost. The returns shown do not reflect taxes that a shareholder would pay on fund distributions or on the sale of fund shares.
Cumulative Performance: September 23, 2004–August 31, 2014
Initial Investment of $10,000
| | | | |
| | | Average Annual Total Returns | |
| | Periods Ended August 31, 2014 | |
| | | | Since | Final Value |
| | | | Inception | of a $10,000 |
| | One Year | Five Years | (9/23/2004) | Investment |
| Industrials Index Fund | | | | |
| ETF Shares Net Asset Value | 24.83% | 19.32% | 9.47% | $24,571 |
| Industrials Index Fund | | | | |
| ETF Shares Market Price | 24.84 | 19.31 | 9.47 | 24,568 |
| Spliced US IMI/Industrials 25/50 | 24.99 | 19.51 | 9.45 | 24,527 |
| Industrials Funds Average | 22.51 | 16.21 | 8.98 | 23,510 |
| MSCI US IMI/2500 | 24.94 | 17.33 | 9.02 | 23,578 |
For a benchmark description, see the Glossary.
Industrials Funds Average: Derived from data provided by Lipper, a Thomson Reuters Company.
“Since Inception” performance is calculated from the ETF Shares’ inception date for both the fund and its comparative standards.
| | | | |
| | | | Since | Final Value |
| | | | Inception | of a $100,000 |
| | One Year | Five Years | (5/8/2006) | Investment |
| Industrials Index Fund Admiral Shares | 24.84% | 19.32% | 7.17% | $177,828 |
| Spliced US IMI/Industrials 25/50 | 24.99 | 19.51 | 7.33 | 180,025 |
| MSCI US IMI/2500 | 24.94 | 17.33 | 7.70 | 185,294 |
| “Since Inception” performance is calculated from the Admiral Shares’ inception date for both the fund and its comparative standards. |
See Financial Highlights for dividend and capital gains information.
61
Industrials Index Fund
Fiscal-Year Total Returns (%): September 23, 2004–August 31, 2014

For a benchmark description, see the Glossary.
| | | |
| Cumulative Returns: ETF Shares, September 23, 2004–August 31, 2014 | | |
| | | | Since |
| | | | Inception |
| | One Year | Five Years | (9/23/2004) |
| Industrials Index Fund ETF Shares Market Price | 24.84% | 141.75% | 145.68% |
| Industrials Index Fund ETF Shares Net Asset Value | 24.83 | 141.83 | 145.71 |
| Spliced US IMI/Industrials 25/50 | 24.99 | 143.75 | 145.27 |
| “Since Inception” performance is calculated from the ETF Shares’ inception date for both the fund and its comparative standards. |
Average Annual Total Returns: Periods Ended June 30, 2014
This table presents total returns through the latest calendar quarter—rather than through the end of the fiscal
period. Securities and Exchange Commission rules require that we provide this information.
| | | | |
| | | | | Since |
| | Inception Date | One Year | Five Years | Inception |
| ETF Shares | 9/23/2004 | | | |
| Market Price | | 29.09% | 22.48% | 9.67% |
| Net Asset Value | | 29.19 | 22.49 | 9.67 |
| Admiral Shares | 5/8/2006 | 29.22 | 22.49 | 7.36 |
See Financial Highlights for dividend and capital gains information.
62
Industrials Index Fund
Financial Statements
Statement of Net Assets
As of August 31, 2014
The fund reports a complete list of its holdings in regulatory filings four times in each fiscal year, at the quarter-ends. For the second and fourth fiscal quarters, the lists appear in the fund’s semiannual and annual reports to shareholders. For the first and third fiscal quarters, the fund files the lists with the Securities and Exchange Commission on Form N-Q. Shareholders can look up the fund’s Forms N-Q on the SEC’s website at sec.gov. Forms N-Q may also be reviewed and copied at the SEC’s Public Reference Room (see the back cover of this report for further information).
| | | |
| | | | Market |
| | | | Value• |
| | | Shares | ($000) |
| Common Stocks (100.0%) | | |
| Aerospace & Defense (21.3%) | | |
| | United Technologies Corp. | 687,282 | 74,213 |
| | Boeing Co. | 546,705 | 69,322 |
| | Honeywell International Inc. | 587,057 | 55,905 |
| | Lockheed Martin Corp. | 214,163 | 37,264 |
| | General Dynamics Corp. | 229,989 | 28,346 |
| | Precision Castparts Corp. | 114,242 | 27,882 |
| | Raytheon Co. | 246,896 | 23,786 |
| | Northrop Grumman Corp. | 160,538 | 20,424 |
| | Textron Inc. | 220,286 | 8,371 |
| | L-3 Communications | | |
| | Holdings Inc. | 67,655 | 7,439 |
| | TransDigm Group Inc. | 39,500 | 7,426 |
| | Rockwell Collins Inc. | 95,820 | 7,376 |
| * | B/E Aerospace Inc. | 82,851 | 7,021 |
| * | Spirit AeroSystems Holdings | | |
| | Inc. Class A | 111,250 | 4,266 |
| | Huntington Ingalls Industries | | |
| | Inc. | 38,500 | 3,931 |
| * | Hexcel Corp. | 78,315 | 3,226 |
| | Alliant Techsystems Inc. | 25,175 | 3,172 |
| * | Esterline Technologies Corp. | 25,099 | 2,942 |
| | Triumph Group Inc. | 41,531 | 2,881 |
| * | Teledyne Technologies Inc. | 28,330 | 2,750 |
| | Exelis Inc. | 148,815 | 2,558 |
| | Curtiss-Wright Corp. | 33,942 | 2,438 |
| * | Moog Inc. Class A | 32,758 | 2,323 |
| * | DigitalGlobe Inc. | 56,321 | 1,710 |
| * | Orbital Sciences Corp. | 47,591 | 1,274 |
| | HEICO Corp. Class A | 29,551 | 1,227 |
| | AAR Corp. | 31,096 | 861 |
| | HEICO Corp. | 15,786 | 818 |
| | Cubic Corp. | 17,891 | 799 |
| * | GenCorp Inc. | 38,499 | 710 |
| * | Astronics Corp. | 10,964 | 688 |
| * | Taser International Inc. | 40,726 | 638 |
| * | Aerovironment Inc. | 16,051 | 506 |
| * | Engility Holdings Inc. | 12,163 | 427 |
| | American Science & | | |
| | Engineering Inc. | 6,177 | 358 |
| *,^ | KEYW Holding Corp. | 23,206 | 275 |
| * | Kratos Defense & Security | | |
| | Solutions Inc. | 35,837 | 270 |
| | National Presto Industries Inc. | 3,792 | 248 |
| | | | 416,071 |
| Air Freight & Logistics (5.5%) | | |
| | United Parcel Service Inc. | | |
| | Class B | 557,298 | 54,242 |
| | FedEx Corp. | 221,551 | 32,763 |
| | CH Robinson Worldwide | | |
| | Inc. | 116,936 | 7,982 |
| | Expeditors International of | | |
| | Washington Inc. | 156,504 | 6,464 |
| * | XPO Logistics Inc. | 41,247 | 1,277 |
| * | Hub Group Inc. Class A | 28,902 | 1,257 |
| | Forward Air Corp. | 24,050 | 1,113 |
| * | UTi Worldwide Inc. | 73,986 | 679 |
| | | |
| | | | Market |
| | | | Value• |
| | | Shares | ($000) |
| * | Atlas Air Worldwide Holdings | | |
| | Inc. | 19,657 | 658 |
| | Park-Ohio Holdings Corp. | 6,318 | 367 |
| * | Echo Global Logistics Inc. | 13,847 | 359 |
| * | Air Transport Services Group | | |
| | Inc. | 40,212 | 329 |
| | | | 107,490 |
| Airlines (4.8%) | | |
| | Delta Air Lines Inc. | 669,372 | 26,494 |
| | American Airlines Group Inc. | 567,567 | 22,084 |
| | Southwest Airlines Co. | 545,979 | 17,477 |
| * | United Continental Holdings | | |
| | Inc. | 294,758 | 14,033 |
| | Alaska Air Group Inc. | 108,614 | 5,033 |
| * | Spirit Airlines Inc. | 57,413 | 4,041 |
| * | JetBlue Airways Corp. | 197,355 | 2,414 |
| | Allegiant Travel Co. Class A | 11,682 | 1,435 |
| * | Hawaiian Holdings Inc. | 34,963 | 545 |
| * | Republic Airways Holdings | | |
| | Inc. | 38,894 | 395 |
| | SkyWest Inc. | 40,187 | 361 |
| | | | 94,312 |
| Building Products (2.0%) | | |
| | Masco Corp. | 280,923 | 6,593 |
| | Fortune Brands Home & | | |
| | Security Inc. | 130,660 | 5,646 |
| | Allegion plc | 75,850 | 3,901 |
| | Lennox International Inc. | 36,794 | 3,082 |
| | AO Smith Corp. | 61,764 | 3,031 |
| | Owens Corning | 84,188 | 3,031 |
| * | Armstrong World Industries | | |
| | Inc. | 36,531 | 2,107 |
| * | USG Corp. | 70,196 | 2,034 |
| | Simpson Manufacturing Co. | | |
| | Inc. | 32,299 | 1,044 |
| * | Trex Co. Inc. | 24,989 | 940 |
| | Apogee Enterprises Inc. | 22,646 | 827 |
| * | Masonite International Corp. | 14,034 | 803 |
| | Universal Forest Products | | |
| | Inc. | 15,663 | 742 |
| | AAON Inc. | 34,631 | 646 |
| * | Nortek Inc. | 7,262 | 605 |
| | Quanex Building Products | | |
| | Corp. | 29,255 | 528 |
| * | NCI Building Systems Inc. | 23,109 | 461 |
| * | American Woodmark Corp. | 9,773 | 383 |
| | Griffon Corp. | 30,089 | 375 |
| * | Gibraltar Industries Inc. | 22,959 | 365 |
| | Insteel Industries Inc. | 13,658 | 321 |
| * | Builders FirstSource Inc. | 38,459 | 265 |
| * | Patrick Industries Inc. | 6,281 | 262 |
| * | Ply Gem Holdings Inc. | 15,445 | 182 |
| | | | 38,174 |
| Commercial Services & Supplies (6.0%) | |
| | Waste Management Inc. | 348,037 | 16,347 |
| | Tyco International Ltd. | 364,024 | 16,243 |
| | Republic Services Inc. | | |
| | Class A | 224,978 | 8,848 |
| | | |
| | | | Value• |
| | | Shares | ($000) |
| * | Stericycle Inc. | 67,092 | 7,974 |
| | Cintas Corp. | 80,361 | 5,315 |
| | ADT Corp. | 138,183 | 5,093 |
| | Iron Mountain Inc. | 128,612 | 4,627 |
| | Waste Connections Inc. | 92,703 | 4,548 |
| | Pitney Bowes Inc. | 159,979 | 4,329 |
| | KAR Auction Services Inc. | 110,112 | 3,321 |
| * | Copart Inc. | 89,673 | 3,087 |
| | RR Donnelley & Sons Co. | 156,744 | 2,770 |
| * | Clean Harbors Inc. | 45,678 | 2,765 |
| | Deluxe Corp. | 39,594 | 2,358 |
| | Covanta Holding Corp. | 92,151 | 1,934 |
| | Civeo Corp. | 75,380 | 1,915 |
| | Rollins Inc. | 51,614 | 1,536 |
| | Mobile Mini Inc. | 36,638 | 1,435 |
| | Healthcare Services Group | | |
| | Inc. | 52,428 | 1,433 |
| | Herman Miller Inc. | 46,416 | 1,380 |
| | MSA Safety Inc. | 24,829 | 1,375 |
| | HNI Corp. | 35,328 | 1,339 |
| | Tetra Tech Inc. | 51,017 | 1,301 |
| | United Stationers Inc. | 31,119 | 1,265 |
| | UniFirst Corp. | 11,909 | 1,155 |
| | Steelcase Inc. Class A | 71,432 | 1,121 |
| | ABM Industries Inc. | 41,637 | 1,108 |
| | Brady Corp. Class A | 38,175 | 1,016 |
| | Brink’s Co. | 36,109 | 989 |
| | Interface Inc. Class A | 52,564 | 895 |
| | G&K Services Inc. Class A | 15,647 | 875 |
| | McGrath RentCorp | 19,352 | 716 |
| | Knoll Inc. | 37,995 | 695 |
| * | ACCO Brands Corp. | 89,294 | 690 |
| | US Ecology Inc. | 16,025 | 685 |
| * | Team Inc. | 15,159 | 605 |
| | West Corp. | 19,753 | 586 |
| | Multi-Color Corp. | 10,306 | 478 |
| | Quad/Graphics Inc. | 18,588 | 417 |
| | Kimball International Inc. | | |
| | Class B | 22,723 | 361 |
| * | SP Plus Corp. | 16,374 | 355 |
| | Viad Corp. | 15,973 | 350 |
| | Ennis Inc. | 20,265 | 292 |
| * | InnerWorkings Inc. | 28,195 | 244 |
| * | Performant Financial Corp. | 24,674 | 237 |
| * | Heritage-Crystal Clean Inc. | 7,967 | 128 |
| | | | 116,536 |
| Construction & Engineering (2.4%) | |
| | Fluor Corp. | 125,589 | 9,280 |
| * | Quanta Services Inc. | 168,221 | 6,113 |
| * | Jacobs Engineering Group | | |
| | Inc. | 104,050 | 5,609 |
| | Chicago Bridge & Iron Co. | | |
| | NV | 76,327 | 4,841 |
| | URS Corp. | 54,690 | 3,313 |
| * | AECOM Technology Corp. | 70,021 | 2,650 |
| | KBR Inc. | 116,442 | 2,564 |
| | Foster Wheeler AG | 77,843 | 2,541 |
| | EMCOR Group Inc. | 52,544 | 2,270 |
| * | MasTec Inc. | 48,584 | 1,482 |
63
Industrials Index Fund
| | | |
| | | | Market |
| | | | Value• |
| | | Shares | ($000) |
| | Granite Construction Inc. | 29,032 | 1,024 |
| * | Tutor Perini Corp. | 30,565 | 913 |
| | Primoris Services Corp. | 30,397 | 883 |
| * | Dycom Industries Inc. | 26,672 | 832 |
| * | Aegion Corp. Class A | 29,813 | 735 |
| | Comfort Systems USA Inc. | 29,545 | 449 |
| * | MYR Group Inc. | 16,613 | 388 |
| * | Great Lakes Dredge & | | |
| | Dock Corp. | 43,943 | 335 |
| * | Northwest Pipe Co. | 7,907 | 292 |
| * | Pike Corp. | 23,798 | 284 |
| * | Furmanite Corp. | 29,041 | 264 |
| * | Orion Marine Group Inc. | 21,083 | 213 |
| * | Layne Christensen Co. | 14,050 | 160 |
| * | Ameresco Inc. Class A | 13,862 | 117 |
| | | | 47,552 |
| Electrical Equipment (6.2%) | | |
| | Emerson Electric Co. | 554,006 | 35,467 |
| | Eaton Corp. plc | 376,197 | 26,262 |
| | Rockwell Automation Inc. | 109,473 | 12,766 |
| | AMETEK Inc. | 192,962 | 10,215 |
| * | Sensata Technologies | | |
| | Holding NV | 126,094 | 6,200 |
| | Hubbell Inc. Class B | 41,070 | 4,965 |
| | Acuity Brands Inc. | 34,018 | 4,214 |
| | Babcock & Wilcox Co. | 86,690 | 2,518 |
| | Regal-Beloit Corp. | 35,405 | 2,516 |
| * | Generac Holdings Inc. | 54,014 | 2,513 |
| | EnerSys | 37,038 | 2,381 |
| * | SolarCity Corp. | 32,708 | 2,246 |
| * | Polypore International Inc. | 35,329 | 1,584 |
| | Franklin Electric Co. Inc. | 31,892 | 1,211 |
| | AZZ Inc. | 20,051 | 929 |
| * | GrafTech International Ltd. | 95,827 | 837 |
| | General Cable Corp. | 38,661 | 830 |
| * | Thermon Group Holdings | | |
| | Inc. | 25,015 | 679 |
| *,^ | Plug Power Inc. | 118,253 | 660 |
| | Encore Wire Corp. | 15,451 | 656 |
| | Powell Industries Inc. | 7,539 | 397 |
| * | Capstone Turbine Corp. | 258,195 | 323 |
| * | Power Solutions | | |
| | International Inc. | 3,738 | 256 |
| | Global Power Equipment | | |
| | Group Inc. | 12,693 | 214 |
| | Preformed Line Products | | |
| | Co. | 2,104 | 120 |
| * | Vicor Corp. | 14,148 | 116 |
| | | | 121,075 |
| Industrial Conglomerates (17.0%) | |
| | General Electric Co. | 7,913,585 | 205,595 |
| | 3M Co. | 490,518 | 70,635 |
| | Danaher Corp. | 496,844 | 38,063 |
| | Roper Industries Inc. | 78,451 | 11,811 |
| | Carlisle Cos. Inc. | 50,357 | 4,175 |
| | Raven Industries Inc. | 28,583 | 762 |
| | | | 331,041 |
| Machinery (18.2%) | | |
| | Caterpillar Inc. | 467,993 | 51,044 |
| | Illinois Tool Works Inc. | 309,319 | 27,285 |
| | Deere & Co. | 272,738 | 22,935 |
| | Cummins Inc. | 137,862 | 20,005 |
| | PACCAR Inc. | 279,296 | 17,543 |
| | Parker-Hannifin Corp. | 117,618 | 13,585 |
| | Ingersoll-Rand plc | 212,998 | 12,823 |
| | Dover Corp. | 131,387 | 11,545 |
| | Stanley Black & Decker Inc. | 116,649 | 10,673 |
| | Pentair plc | 153,486 | 10,448 |
| | Flowserve Corp. | 108,405 | 8,227 |
| | | |
| | | | Market |
| | | | Value• |
| | | Shares | ($000) |
| | Pall Corp. | 86,631 | 7,309 |
| | Wabtec Corp. | 75,664 | 6,307 |
| | Trinity Industries Inc. | 122,252 | 5,915 |
| | Snap-on Inc. | 45,838 | 5,728 |
| | Xylem Inc. | 145,673 | 5,428 |
| | Joy Global Inc. | 78,846 | 4,979 |
| | IDEX Corp. | 63,820 | 4,910 |
| * | WABCO Holdings Inc. | 45,971 | 4,744 |
| | Donaldson Co. Inc. | 109,686 | 4,591 |
| * | Colfax Corp. | 68,259 | 4,342 |
| | Lincoln Electric Holdings Inc. | 60,771 | 4,321 |
| | Nordson Corp. | 48,296 | 3,915 |
| * | Middleby Corp. | 45,314 | 3,907 |
| | Graco Inc. | 48,120 | 3,699 |
| | Allison Transmission | | |
| | Holdings Inc. | 118,362 | 3,631 |
| | ITT Corp. | 72,193 | 3,455 |
| | AGCO Corp. | 70,360 | 3,436 |
| | Oshkosh Corp. | 66,612 | 3,309 |
| | Terex Corp. | 87,580 | 3,276 |
| | Manitowoc Co. Inc. | 106,272 | 3,127 |
| | SPX Corp. | 29,390 | 3,058 |
| | Valmont Industries Inc. | 20,019 | 2,818 |
| | Toro Co. | 44,989 | 2,768 |
| | Kennametal Inc. | 61,745 | 2,767 |
| | Timken Co. | 57,608 | 2,609 |
| | Crane Co. | 36,599 | 2,547 |
| | Woodward Inc. | 47,954 | 2,505 |
| | CLARCOR Inc. | 39,588 | 2,502 |
| * | Rexnord Corp. | 67,675 | 1,977 |
| | Actuant Corp. Class A | 54,272 | 1,831 |
| | Hillenbrand Inc. | 49,499 | 1,655 |
| * | Chart Industries Inc. | 23,857 | 1,596 |
| | Harsco Corp. | 63,503 | 1,537 |
| | Greenbrier Cos. Inc. | 20,850 | 1,491 |
| * | Navistar International Corp. | 38,244 | 1,442 |
| | Watts Water Technologies | | |
| | Inc. Class A | 21,425 | 1,356 |
| | Mueller Industries Inc. | 44,450 | 1,300 |
| * | Proto Labs Inc. | 17,097 | 1,286 |
| | Barnes Group Inc. | 36,217 | 1,240 |
| * | EnPro Industries Inc. | 17,929 | 1,217 |
| | Mueller Water Products Inc. | | |
| | Class A | 125,519 | 1,159 |
| | RBC Bearings Inc. | 18,247 | 1,128 |
| * | TriMas Corp. | 35,350 | 1,121 |
| * | Meritor Inc. | 72,897 | 994 |
| | Tennant Co. | 13,794 | 961 |
| | CIRCOR International Inc. | 12,446 | 886 |
| | Albany International Corp. | 22,378 | 841 |
| | Lindsay Corp. | 10,149 | 789 |
| * | Wabash National Corp. | 53,826 | 761 |
| | ESCO Technologies Inc. | 20,799 | 749 |
| | Briggs & Stratton Corp. | 37,137 | 748 |
| | Standex International Corp. | 10,019 | 748 |
| | Federal Signal Corp. | 49,214 | 724 |
| | Altra Industrial Motion Corp. | 21,236 | 706 |
| | Sun Hydraulics Corp. | 17,589 | 704 |
| | John Bean Technologies | | |
| | Corp. | 22,734 | 660 |
| | Astec Industries Inc. | 15,261 | 634 |
| | Titan International Inc. | 42,087 | 610 |
| | American Railcar Industries | | |
| | Inc. | 7,545 | 601 |
| | Hyster-Yale Materials | | |
| | Handling Inc. | 6,978 | 538 |
| * | Blount International Inc. | 32,903 | 526 |
| | Gorman-Rupp Co. | 16,504 | 512 |
| | LB Foster Co. Class A | 7,694 | 404 |
| | Douglas Dynamics Inc. | 18,578 | 370 |
| | | |
| | | | Market |
| | | | Value• |
| | | Shares | ($000) |
| | Columbus McKinnon Corp. | 14,726 | 369 |
| | Kadant Inc. | 8,754 | 347 |
| | Alamo Group Inc. | 5,690 | 277 |
| | FreightCar America Inc. | 9,267 | 276 |
| | Global Brass & Copper | | |
| | Holdings Inc. | 16,280 | 252 |
| *,^ | ExOne Co. | 8,475 | 248 |
| | Twin Disc Inc. | 6,047 | 196 |
| | | | 355,783 |
| Marine (0.3%) | | |
| * | Kirby Corp. | 40,418 | 4,821 |
| | Matson Inc. | 33,704 | 910 |
| | | | 5,731 |
| Professional Services (3.6%) | | |
| | Nielsen NV | 239,189 | 11,240 |
| * | IHS Inc. Class A | 53,633 | 7,641 |
| * | Verisk Analytics Inc. Class A | 118,297 | 7,594 |
| | Equifax Inc. | 96,178 | 7,575 |
| | Towers Watson & Co. | | |
| | Class A | 55,629 | 6,099 |
| | Robert Half International | | |
| | Inc. | 108,410 | 5,443 |
| | Manpowergroup Inc. | 62,789 | 4,871 |
| | Dun & Bradstreet Corp. | 29,268 | 3,436 |
| | Corporate Executive Board | | |
| | Co. | 26,399 | 1,740 |
| * | Advisory Board Co. | 28,372 | 1,407 |
| * | FTI Consulting Inc. | 31,924 | 1,184 |
| * | Korn/Ferry International | 38,912 | 1,177 |
| * | On Assignment Inc. | 38,185 | 1,129 |
| * | Huron Consulting Group Inc. | 18,284 | 1,106 |
| * | WageWorks Inc. | 25,968 | 1,071 |
| * | TrueBlue Inc. | 32,272 | 876 |
| | Exponent Inc. | 10,196 | 745 |
| | Acacia Research Corp. | 39,205 | 697 |
| * | Navigant Consulting Inc. | 38,540 | 628 |
| * | RPX Corp. | 35,082 | 533 |
| | Insperity Inc. | 18,024 | 532 |
| * | ICF International Inc. | 13,964 | 472 |
| | Resources Connection Inc. | 30,649 | 469 |
| | Kforce Inc. | 22,628 | 454 |
| | Kelly Services Inc. Class A | 22,694 | 379 |
| * | GP Strategies Corp. | 12,010 | 303 |
| * | CBIZ Inc. | 34,616 | 298 |
| * | Mistras Group Inc. | 13,375 | 287 |
| | Heidrick & Struggles | | |
| | International Inc. | 12,640 | 274 |
| * | Franklin Covey Co. | 9,916 | 189 |
| | CDI Corp. | 11,156 | 169 |
| * | Pendrell Corp. | 91,776 | 141 |
| | | | 70,159 |
| Road & Rail (9.4%) | | |
| | Union Pacific Corp. | 715,362 | 75,306 |
| | Norfolk Southern Corp. | 244,080 | 26,117 |
| | CSX Corp. | 794,056 | 24,544 |
| * | Hertz Global Holdings Inc. | 354,276 | 10,469 |
| | Kansas City Southern | 86,817 | 10,015 |
| * | Avis Budget Group Inc. | 83,175 | 5,615 |
| | JB Hunt Transport Services | | |
| | Inc. | 73,991 | 5,590 |
| * | Genesee & Wyoming Inc. | | |
| | Class A | 41,070 | 4,038 |
| | Ryder System Inc. | 42,220 | 3,814 |
| * | Old Dominion Freight Line | | |
| | Inc. | 51,117 | 3,408 |
| | Landstar System Inc. | 35,731 | 2,425 |
| | Con-way Inc. | 44,698 | 2,291 |
| | AMERCO | 6,163 | 1,712 |
| * | Swift Transportation Co. | 69,483 | 1,472 |
64
Industrials Index Fund
| | | |
| | | | Market |
| | | | Value• |
| | | Shares | ($000) |
| | Knight Transportation Inc. | 47,636 | 1,208 |
| | Werner Enterprises Inc. | 37,186 | 926 |
| * | Saia Inc. | 19,223 | 913 |
| | Heartland Express Inc. | 37,887 | 888 |
| | ArcBest Corp. | 19,293 | 693 |
| * | Roadrunner Transportation | | |
| | Systems Inc. | 22,126 | 557 |
| | Marten Transport Ltd. | 19,613 | 388 |
| | Celadon Group Inc. | 17,358 | 363 |
| * | YRC Worldwide Inc. | 13,562 | 315 |
| * | Quality Distribution Inc. | 21,153 | 297 |
| * | Patriot Transportation | | |
| | Holding Inc. | 4,840 | 168 |
| | | | 183,532 |
| Trading Companies & Distributors (3.1%) | |
| | WW Grainger Inc. | 48,603 | 11,966 |
| | Fastenal Co. | 222,187 | 10,061 |
| * | United Rentals Inc. | 76,764 | 9,031 |
| | MSC Industrial Direct Co. | | |
| | Inc. Class A | 37,965 | 3,422 |
| * | WESCO International Inc. | 35,071 | 2,946 |
| | Air Lease Corp. Class A | 76,610 | 2,904 |
| * | NOW Inc. | 84,843 | 2,802 |
| * | HD Supply Holdings Inc. | 83,078 | 2,307 |
| | GATX Corp. | 34,314 | 2,274 |
| * | MRC Global Inc. | 80,022 | 1,986 |
| | Watsco Inc. | 20,027 | 1,852 |
| | Applied Industrial | | |
| | Technologies Inc. | 31,314 | 1,525 |
| | TAL International Group Inc. | 25,348 | 1,120 |
| * | Beacon Roofing Supply Inc. | 38,677 | 1,103 |
| | H&E Equipment Services Inc. | 24,893 | 1,018 |
| | Aircastle Ltd. | 50,718 | 970 |
| * | Rush Enterprises Inc. | | |
| | Class A | 22,709 | 833 |
| | Kaman Corp. | 18,996 | 772 |
| * | DXP Enterprises Inc. | 8,373 | 671 |
| | Aceto Corp. | 21,168 | 407 |
| * | CAI International Inc. | 13,975 | 271 |
| * | Stock Building Supply | | |
| | Holdings Inc. | 11,341 | 193 |
| * | Titan Machinery Inc. | 14,026 | 173 |
| | | | 60,607 |
| | |
| | | Market |
| | | Value• |
| | Shares | ($000) |
| Transportation Infrastructure (0.2%) | |
| Macquarie Infrastructure | | |
| Co. LLC | 50,078 | 3,612 |
| * Wesco Aircraft Holdings Inc. | 53,102 | 974 |
| | | 4,586 |
| Total Common Stocks | | |
| (Cost $1,765,410) | | 1,952,649 |
| Temporary Cash Investment (0.0%) | |
| Money Market Fund (0.0%) | | |
| 1,2 Vanguard Market | | |
| Liquidity Fund, 0.113% | | |
| (Cost $442) | 442,300 | 442 |
| Total Investments (100.0%) | | |
| (Cost $1,765,852) | | 1,953,091 |
| Other Assets and Liabilities (0.0%) | |
| Other Assets | | 16,720 |
| Liabilities2 | | (16,152) |
| | | 568 |
| Net Assets (100%) | | 1,953,659 |
| |
| At August 31, 2014, net assets consisted of: |
| | Amount |
| | ($000) |
| Paid-in Capital | 1,769,050 |
| Undistributed Net Investment Income | 19,247 |
| Accumulated Net Realized Losses | (21,877) |
| Unrealized Appreciation (Depreciation) | 187,239 |
| Net Assets | 1,953,659 |
| |
| |
| Admiral Shares—Net Assets | |
| Applicable to 1,324,279 outstanding | |
| $.001 par value shares of beneficial | |
| interest (unlimited authorization) | 70,722 |
| Net Asset Value Per Share— | |
| Admiral Shares | $53.40 |
| |
| |
| ETF Shares—Net Assets | |
| Applicable to 18,114,450 outstanding | |
| $.001 par value shares of beneficial | |
| interest (unlimited authorization) | 1,882,937 |
| Net Asset Value Per Share— | |
| ETF Shares | $103.95 |
• See Note A in Notes to Financial Statements.
* Non-income-producing security.
^ Includes partial security positions on loan to broker-dealers. The total value of securities on loan is $418,000.
1 Affiliated money market fund available only to Vanguard funds and certain trusts and accounts managed by Vanguard. Rate shown is the 7-day yield.
2 Includes $442,000 of collateral received for securities on loan.
See accompanying Notes, which are an integral part of the Financial Statements.
65
Industrials Index Fund
Statement of Operations
| |
| | Year Ended |
| August 31, 2014 |
| | ($000) |
| Investment Income | |
| Income | |
| Dividends | 29,598 |
| Interest1 | 2 |
| Securities Lending | 118 |
| Total Income | 29,718 |
| Expenses | |
| The Vanguard Group—Note B | |
| Investment Advisory Services | 263 |
| Management and Administrative— | |
| Admiral Shares | 42 |
| Management and Administrative— | |
| ETF Shares | 1,186 |
| Marketing and Distribution— | |
| Admiral Shares | 8 |
| Marketing and Distribution— | |
| ETF Shares | 310 |
| Custodian Fees | 59 |
| Auditing Fees | 32 |
| Shareholders’ Reports—Admiral Shares | — |
| Shareholders’ Reports—ETF Shares | 67 |
| Trustees’ Fees and Expenses | 1 |
| Total Expenses | 1,968 |
| Net Investment Income | 27,750 |
| Realized Net Gain (Loss) on | |
| Investment Securities Sold | 192,518 |
| Change in Unrealized Appreciation | |
| (Depreciation) of Investment Securities | 93,349 |
| Net Increase (Decrease) in Net Assets | |
| Resulting from Operations | 313,617 |
Statement of Changes in Net Assets
| | |
| | Year Ended August 31, |
| | 2014 | 2013 |
| | ($000) | ($000) |
| Increase (Decrease) in Net Assets | | |
| Operations | | |
| Net Investment Income | 27,750 | 14,080 |
| Realized Net Gain (Loss) | 192,518 | 20,861 |
| Change in Unrealized Appreciation (Depreciation) | 93,349 | 116,282 |
| Net Increase (Decrease) in Net Assets Resulting from Operations | 313,617 | 151,223 |
| Distributions | | |
| Net Investment Income | | |
| Admiral Shares | (288) | (276) |
| ETF Shares | (15,915) | (12,372) |
| Realized Capital Gain | | |
| Admiral Shares | — | — |
| ETF Shares | — | — |
| Total Distributions | (16,203) | (12,648) |
| Capital Share Transactions | | |
| Admiral Shares | 44,859 | 1,287 |
| ETF Shares | 489,396 | 485,940 |
| Net Increase (Decrease) from Capital Share Transactions | 534,255 | 487,227 |
| Total Increase (Decrease) | 831,669 | 625,802 |
| Net Assets | | |
| Beginning of Period | 1,121,990 | 496,188 |
| End of Period2 | 1,953,659 | 1,121,990 |
1 Interest income from an affiliated company of the fund was $2,000.
2 Net Assets—End of Period includes undistributed (overdistributed) net investment income of $19,247,000 and $7,592,000.
See accompanying Notes, which are an integral part of the Financial Statements.
66
Industrials Index Fund
Financial Highlights
| | | | | |
| Admiral Shares | | | | | |
| |
| For a Share Outstanding | Year Ended August 31, |
| Throughout Each Period | 2014 | 2013 | 2012 | 2011 | 2010 |
| Net Asset Value, Beginning of Period | $43.24 | $34.84 | $30.89 | $26.57 | $23.85 |
| Investment Operations | | | | | |
| Net Investment Income | .780 | .7801 | .699 | .511 | .4461 |
| Net Realized and Unrealized Gain (Loss) | | | | | |
| on Investments | 9.922 | 8.382 | 3.878 | 4.248 | 2.619 |
| Total from Investment Operations | 10.702 | 9.162 | 4.577 | 4.759 | 3.065 |
| Distributions | | | | | |
| Dividends from Net Investment Income | (. 542) | (.762) | (. 627) | (. 439) | (. 345) |
| Distributions from Realized Capital Gains | — | — | — | — | — |
| Total Distributions | (. 542) | (.762) | (. 627) | (. 439) | (. 345) |
| Net Asset Value, End of Period | $53.40 | $43.24 | $34.84 | $30.89 | $26.57 |
| |
| Total Return 2 | 24.84% | 26.70% | 15.03% | 17.79% | 12.85% |
| |
| Ratios/Supplemental Data | | | | | |
| Net Assets, End of Period (Millions) | $71 | $18 | $14 | $14 | $7 |
| Ratio of Total Expenses to Average Net Assets | 0.12% | 0.14% | 0.14% | 0.19% | 0.24% |
| Ratio of Net Investment Income to | | | | | |
| Average Net Assets | 1.69% | 1.97% | 1.99% | 1.66% | 1.69% |
| Portfolio Turnover Rate3 | 5% | 6% | 6% | 5% | 10% |
1 Calculated based on average shares outstanding.
2 Total returns do not include transaction or account service fees that may have applied in the periods shown. Fund prospectuses provide
information about any applicable transaction and account service fees.
3 Excludes the value of portfolio securities received or delivered as a result of in-kind purchases or redemptions of the fund’s capital shares,
including ETF Creation Units.
| | | | | |
| ETF Shares | | | | | |
| |
| For a Share Outstanding | Year Ended August 31, |
| Throughout Each Period | 2014 | 2013 | 2012 | 2011 | 2010 |
| Net Asset Value, Beginning of Period | $84.17 | $67.82 | $60.12 | $51.71 | $46.45 |
| Investment Operations | | | | | |
| Net Investment Income | 1.508 | 1.5171 | 1.360 | .992 | .9101 |
| Net Realized and Unrealized Gain (Loss) | | | | | |
| on Investments | 19.332 | 16.321 | 7.557 | 8.269 | 5.065 |
| Total from Investment Operations | 20.840 | 17.838 | 8.917 | 9.261 | 5.975 |
| Distributions | | | | | |
| Dividends from Net Investment Income | (1.060) | (1.488) | (1.217) | (.851) | (.715) |
| Distributions from Realized Capital Gains | — | — | — | — | — |
| Total Distributions | (1.060) | (1.488) | (1.217) | (.851) | (.715) |
| Net Asset Value, End of Period | $103.95 | $84.17 | $67.82 | $60.12 | $51.71 |
| |
| Total Return | 24.83% | 26.69% | 15.04% | 17.79% | 12.85% |
| |
| Ratios/Supplemental Data | | | | | |
| Net Assets, End of Period (Millions) | $1,883 | $1,104 | $482 | $451 | $295 |
| Ratio of Total Expenses to Average Net Assets | 0.12% | 0.14% | 0.14% | 0.19% | 0.24% |
| Ratio of Net Investment Income to | | | | | |
| Average Net Assets | 1.69% | 1.97% | 1.99% | 1.66% | 1.69% |
| Portfolio Turnover Rate2 | 5% | 6% | 6% | 5% | 10% |
1 Calculated based on average shares outstanding.2 Excludes the value of portfolio securities received or delivered as a result of in-kind purchases or redemptions of the fund’s capital shares,including ETF Creation Units.See accompanying Notes, which are an integral part of the Financial Statements.
67
Industrials Index Fund
Notes to Financial Statements
Vanguard Industrials Index Fund is registered under the Investment Company Act of 1940 as an open-end investment company, or mutual fund. The fund offers two classes of shares: Admiral Shares and ETF Shares. Admiral Shares are designed for investors who meet certain administrative, service, and account-size criteria. ETF Shares are listed for trading on NYSE Arca; they can be purchased and sold through a broker.
A. The following significant accounting policies conform to generally accepted accounting principles for U.S. investment companies. The fund consistently follows such policies in preparing its financial statements.
1. Security Valuation: Securities are valued as of the close of trading on the New York Stock Exchange (generally 4 p.m., Eastern time) on the valuation date. Equity securities are valued at the latest quoted sales prices or official closing prices taken from the primary market in which each security trades; such securities not traded on the valuation date are valued at the mean of the latest quoted bid and asked prices. Securities for which market quotations are not readily available, or whose values have been materially affected by events occurring before the fund’s pricing time but after the close of the securities’ primary markets, are valued by methods deemed by the board of trustees to represent fair value. Investments in Vanguard Market Liquidity Fund are valued at that fund’s net asset value.
2. Federal Income Taxes: The fund intends to continue to qualify as a regulated investment company and distribute all of its taxable income. Management has analyzed the fund’s tax positions taken for all open federal income tax years (August 31, 2011–2014), and has concluded that no provision for federal income tax is required in the fund’s financial statements.
3. Distributions: Distributions to shareholders are recorded on the ex-dividend date.
4. Securities Lending: To earn additional income, the fund lends its securities to qualified institutional borrowers. Security loans are required to be secured at all times by collateral in an amount at least equal to the market value of securities loaned. Daily market fluctuations could cause the value of loaned securities to be more or less than the value of the collateral received. When this occurs, the collateral is adjusted and settled on the next business day. The fund further mitigates its counterparty risk by entering into securities lending transactions only with a diverse group of prequalified counterparties, monitoring their financial strength, and entering into master securities lending agreements with its counterparties. The master securities lending agreements provide that, in the event of a counterparty’s default (including bankruptcy), the fund may terminate any loans with that borrower, determine the net amount owed, and sell or retain the collateral up to the net amount owed to the fund; however, such actions may be subject to legal proceedings. While collateral mitigates counterparty risk, in the absence of a default the fund may experience delays and costs in recovering the securities loaned. The fund invests cash collateral received in Vanguard Market Liquidity Fund, and records a liability in the Statement of Net Assets for the return of the collateral, during the period the securities are on loan. Securities lending income represents fees charged to borrowers plus income earned on invested cash collateral, less expenses associated with the loan.
5. Credit Facility: The fund and certain other funds managed by The Vanguard Group participate in a $2.89 billion committed credit facility provided by a syndicate of lenders pursuant to a credit agreement that may be renewed annually; each fund is individually liable for its borrowings, if any, under the credit facility. Borrowings may be utilized for temporary and emergency purposes, and are subject to the fund’s regulatory and contractual borrowing restrictions. The participating funds are charged administrative fees and an annual commitment fee of 0.06% of the undrawn amount of the facility; these fees are allocated to the funds based on a method approved by the fund’s board of trustees and included in Management and Administrative expenses on the fund’s Statement of Operations. Any borrowings under this facility bear interest at a rate equal to the higher of the federal funds rate or LIBOR reference rate plus an agreed-upon spread.
The fund had no borrowings outstanding at August 31, 2014, or at any time during the period then ended.
6. Other: Dividend income is recorded on the ex-dividend date. Interest income includes income distributions received from Vanguard Market Liquidity Fund and is accrued daily. Security transactions are accounted for on the date securities are bought or sold. Costs used to determine realized gains (losses) on the sale of investment securities are those of the specific securities sold.
Each class of shares has equal rights as to assets and earnings, except that each class separately bears certain class-specific expenses related to maintenance of shareholder accounts (included in Management and Administrative expenses) and shareholder reporting. Marketing and distribution expenses are allocated to each class of shares based on a method approved by the board of trustees. Income, other non-class-specific expenses, and gains and losses on investments are allocated to each class of shares based on its relative net assets.
68
Industrials Index Fund
B. The Vanguard Group furnishes at cost investment advisory, corporate management, administrative, marketing, and distribution services. The costs of such services are allocated to the fund based on methods approved by the board of trustees. The fund has committed to provide up to 0.40% of its net assets in capital contributions to Vanguard. At August 31, 2014, the fund had contributed capital of $179,000 to Vanguard (included in Other Assets), representing 0.01% of the fund’s net assets and 0.07% of Vanguard’s capitalization. The fund’s trustees and officers are also directors and officers of Vanguard.
C. Various inputs may be used to determine the value of the fund’s investments. These inputs are summarized in three broad levels for financial statement purposes. The inputs or methodologies used to value securities are not necessarily an indication of the risk associated with investing in those securities.
Level 1—Quoted prices in active markets for identical securities.
Level 2—Other significant observable inputs (including quoted prices for similar securities, interest rates, prepayment speeds, credit risk, etc.).
Level 3—Significant unobservable inputs (including the fund’s own assumptions used to determine the fair value of investments).
At August 31, 2014, 100% of the market value of the fund’s investments was determined based on Level 1 inputs.
D. Distributions are determined on a tax basis and may differ from net investment income and realized capital gains for financial reporting purposes. Differences may be permanent or temporary. Permanent differences are reclassified among capital accounts in the financial statements to reflect their tax character. Temporary differences arise when certain items of income, expense, gain, or loss are recognized in different periods for financial statement and tax purposes. These differences will reverse at some time in the future. Differences in classification may also result from the treatment of short-term gains as ordinary income for tax purposes.
Certain of the fund’s investments are in securities considered to be passive foreign investment companies, for which any unrealized appreciation and/or realized gains are required to be included in distributable net income for tax purposes. During the year ended August 31, 2014, the fund realized gains on the sale of passive foreign investment companies of $108,000, which have been included in current and prior periods’ taxable income; accordingly, such gains have been reclassified from accumulated net realized losses to undistributed net investment income. Passive foreign investment companies held at August 31, 2014, had unrealized appreciation of $117,000.
During the year ended August 31, 2014, the fund realized $191,866,000 of net capital gains resulting from in-kind redemptions—in which shareholders exchanged fund shares for securities held by the fund rather than for cash. Because such gains are not taxable to the fund, and are not distributed to shareholders, they have been reclassified from accumulated net realized losses to paid-in capital.
For tax purposes, at August 31, 2014, the fund had $19,857,000 of ordinary income available for distribution. The fund used capital loss carryforwards of $761,000 to offset taxable gains realized during the year ended August 31, 2014. At August 31, 2014, the fund had available capital losses totaling $21,875,000 to offset future net capital gains. Of this amount, $21,658,000 is subject to expiration dates; $3,382,000 may be used to offset future net capital gains through August 31, 2017, $13,144,000 through August 31, 2018, and $5,132,000 through August 31, 2019. Capital losses of $217,000 realized beginning in fiscal 2012 may be carried forward indefinitely under the Regulated Investment Company Modernization Act of 2010, but must be used before any expiring loss carryforwards.
At August 31, 2014, the cost of investment securities for tax purposes was $1,765,971,000. Net unrealized appreciation of investment securities for tax purposes was $187,120,000, consisting of unrealized gains of $216,676,000 on securities that had risen in value since their purchase and $29,556,000 in unrealized losses on securities that had fallen in value since their purchase.
E. During the year ended August 31, 2014, the fund purchased $1,174,556,000 of investment securities and sold $628,236,000 of investment securities, other than temporary cash investments. Purchases and sales include $1,042,159,000 and $551,591,000, respectively, in connection with in-kind purchases and redemptions of the fund’s capital shares.
69
Industrials Index Fund
F. Capital share transactions for each class of shares were:
| | | | |
| | Year Ended August 31, |
| | | 2014 | | | 2013 |
| | Amount | Shares | Amount | Shares |
| | ($000) | (000) | ($000) | (000) |
| Admiral Shares | | | | |
| Issued | 63,885 | 1,275 | 7,400 | 182 |
| Issued in Lieu of Cash Distributions | 266 | 5 | 228 | 6 |
| Redeemed | (19,292) | (376) | (6,341) | (161) |
| Net Increase (Decrease) —Admiral Shares | 44,859 | 904 | 1,287 | 27 |
| ETF Shares | | | | |
| Issued | 1,042,334 | 10,600 | 555,138 | 6,900 |
| Issued in Lieu of Cash Distributions | — | — | — | — |
| Redeemed | (552,938) | (5,600) | (69,198) | (900) |
| Net Increase (Decrease)—ETF Shares | 489,396 | 5,000 | 485,940 | 6,000 |
At August 31, 2014, one shareholder was the record or beneficial owner of 42% of the fund’s net assets. If the shareholder were to redeem its investment in the fund, the redemption might result in an increase in the fund’s expense ratio.
G. Management has determined that no material events or transactions occurred subsequent to August 31, 2014, that would require recognition or disclosure in these financial statements.
70
Information Technology Index Fund
Fund Profile
As of August 31, 2014
| | |
| Share-Class Characteristics | |
| | Admiral | ETF |
| | Shares | Shares |
| Ticker Symbol | VITAX | VGT |
| Expense Ratio1 | 0.14% | 0.14% |
| 30-Day SEC Yield | 1.24% | 1.24% |
| | | |
| Portfolio Characteristics | | |
| | | MSCI | |
| | | US IMI/ | |
| | | Information | MSCI |
| | | Technology | US IMI/ |
| | Fund | 25/50 | 2500 |
| Number of Stocks | 411 | 411 | 2,499 |
| Median Market Cap $128.5B | $128.5B | $48.7B |
| Price/Earnings Ratio | 21.3x | 21.3x | 20.7x |
| Price/Book Ratio | 4.0x | 4.0x | 2.7x |
| Return on Equity | 25.4% | 25.4% | 18.0% |
| Earnings Growth Rate | 21.8% | 21.8% | 15.2% |
| Dividend Yield | 1.3% | 1.3% | 1.9% |
| Foreign Holdings | 0.0% | 0.0% | 0.0% |
| Turnover Rate | 6% | — | — |
| Short-Term Reserves | 0.0% | — | — |
| | |
| Volatility Measures | | |
| | MSCI US | |
| | IMI/Information | |
| | Technology | MSCI US |
| | 25/50 | IMI/2500 |
| R-Squared | 1.00 | 0.79 |
| Beta | 1.00 | 1.00 |
| These measures show the degree and timing of the fund’s fluctuations compared with the indexes over 36 months. |
|
| |
| Subindustry Diversification | |
| (% of equity exposure) | |
| |
| Application Software | 5.6% |
| Communications Equipment | 8.3 |
| Data Processing & Outsourced Services | 9.3 |
| Electronic Components | 1.5 |
| Electronic Manufacturing Services | 1.4 |
| Internet Software & Services | 17.2 |
| IT Consulting & Other Services | 7.1 |
| Semiconductor Equipment | 1.9 |
| Semiconductors | 11.3 |
| Systems Software | 14.0 |
| Technology Hardware, Storage & Peripherals | 20.3 |
| Other Information Technology | 2.1 |
| | |
| Ten Largest Holdings (% of total net assets) |
| |
| Apple Inc. | Computer Hardware | 14.8% |
| Microsoft Corp. | Systems Software | 8.5 |
| Google Inc. | Internet Software | |
| | & Services | 7.8 |
| International | | |
| Business | IT Consulting & | |
| Machines Corp. | Other Services | 4.4 |
| Intel Corp. | Semiconductors | 4.2 |
| Facebook Inc. | Internet Software | |
| | & Services | 3.6 |
| Oracle Corp. | Systems Software | 3.5 |
| QUALCOMM Inc. | Communications | |
| | Equipment | 3.1 |
| Cisco Systems Inc. | Communications | |
| | Equipment | 3.1 |
| Visa Inc. | Data Processing | |
| | & Outsourced Services | 2.5 |
| Top Ten Total | | 55.5% |
| The holdings listed exclude any temporary cash investments and equity index products. |
|
1 The expense ratios shown are from the prospectus dated December 23, 2013, and represent estimated costs for the current fiscal year. For the fiscal year ended August 31, 2014, the expense ratios were 0.12% for
Admiral Shares and 0.12% for ETF Shares.
71
Information Technology Index Fund
Performance Summary
All of the returns in this report represent past performance, which is not a guarantee of future results that may be achieved by the fund. (Current performance may be lower or higher than the performance data cited. For performance data current to the most recent month-end, visit our website at vanguard.com/performance.) Note, too, that both investment returns and principal value can fluctuate widely, so an investor’s shares, when sold, could be worth more or less than their original cost. The returns shown do not reflect taxes that a shareholder would pay on fund distributions or on the sale of fund shares.
Cumulative Performance: August 31, 2004–August 31, 2014
Initial Investment of $10,000
| | | | |
| | | Average Annual Total Returns | Final Value |
| | Periods Ended August 31, 2014 | of a $10,000 |
| | One Year | Five Years | Ten Years | Investment |
| Information Technology Index Fund | | | | |
| ETF Shares Net Asset Value | 32.04% | 17.27% | 10.41% | $26,909 |
| Information Technology Index Fund | | | | |
| ETF Shares Market Price | 31.98 | 17.24 | 10.41 | 26,928 |
| Spliced US IMI/Information Technology 25/50 | 32.17 | 17.46 | 10.60 | 27,381 |
| Science and Technology Funds Average | 28.20 | 16.56 | 10.16 | 26,316 |
| MSCI US IMI/2500 | 24.94 | 17.33 | 9.05 | 23,791 |
For a benchmark description, see the Glossary.
Science and Technology Funds Average: Derived from data provided by Lipper, a Thomson Reuters Company.
| | | | |
| | | | | Final Value |
| | | | | of a $100,000 |
| | One Year | Five Years | Ten Years | Investment |
| Information Technology Index Fund Admiral Shares | 32.05% | 17.27% | 10.39% | $268,663 |
| Spliced US IMI/Information Technology 25/50 | 32.17 | 17.46 | 10.60 | 273,805 |
| MSCI US IMI/2500 | 24.94 | 17.33 | 9.05 | 237,905 |
See Financial Highlights for dividend and capital gains information.
72
Information Technology Index Fund
Fiscal-Year Total Returns (%): August 31, 2004–August 31, 2014
For a benchmark description, see the Glossary.
| | | |
| Cumulative Returns: ETF Shares, August 31, 2004–August 31, 2014 | | |
| |
| | One Year | Five Years | Ten Years |
| Information Technology Index Fund ETF Shares Market Price | 31.98% | 121.55% | 169.28% |
| Information Technology Index Fund ETF Shares Net Asset Value | 32.04 | 121.78 | 169.09 |
| Spliced US IMI/Information Technology 25/50 | 32.17 | 123.57 | 173.81 |
Average Annual Total Returns: Periods Ended June 30, 2014
This table presents total returns through the latest calendar quarter—rather than through the end of the fiscal
period. Securities and Exchange Commission rules require that we provide this information.
| | | | |
| | Inception Date | One Year | Five Years | Ten Years |
| ETF Shares | 1/26/2004 | | | |
| Market Price | | 32.15% | 18.83% | 8.32% |
| Net Asset Value | | 32.14 | 18.83 | 8.32 |
| Admiral Shares | 3/25/2004 | 32.15 | 18.83 | 8.30 |
See Financial Highlights for dividend and capital gains information.
73
Information Technology Index Fund
Financial Statements
Statement of Net Assets
As of August 31, 2014
The fund reports a complete list of its holdings in regulatory filings four times in each fiscal year, at the quarter-ends. For the second and fourth fiscal quarters, the lists appear in the fund’s semiannual and annual reports to shareholders. For the first and third fiscal quarters, the fund files the lists with the Securities and Exchange Commission on Form N-Q. Shareholders can look up the fund’s Forms N-Q on the SEC’s website at sec.gov. Forms N-Q may also be reviewed and copied at the SEC’s Public Reference Room (see the back cover of this report for further information).
| | | |
| | | | Market |
| | | | Value• |
| | | Shares | ($000) |
| Common Stocks (100.0%) | | |
| Communications Equipment (8.3%) | |
| | QUALCOMM Inc. | 2,470,064 | 187,972 |
| | Cisco Systems Inc. | 7,496,692 | 187,342 |
| | Motorola Solutions Inc. | 334,808 | 19,888 |
| | Juniper Networks Inc. | 624,116 | 14,473 |
| * | F5 Networks Inc. | 110,744 | 13,753 |
| | Harris Corp. | 155,779 | 11,121 |
| | Brocade Communications | | |
| | Systems Inc. | 641,021 | 6,763 |
| * | Palo Alto Networks Inc. | 78,990 | 6,713 |
| * | ARRIS Group Inc. | 180,278 | 5,518 |
| * | Riverbed Technology Inc. | 224,670 | 4,233 |
| * | JDS Uniphase Corp. | 341,090 | 3,940 |
| * | ViaSat Inc. | 64,001 | 3,644 |
| * | Ciena Corp. | 153,405 | 3,174 |
| * | Aruba Networks Inc. | 148,441 | 3,169 |
| * | EchoStar Corp. Class A | 62,653 | 3,160 |
| * | CommScope Holding Co. | | |
| | Inc. | 122,433 | 3,154 |
| | Plantronics Inc. | 62,822 | 2,999 |
| * | Finisar Corp. | 140,478 | 2,853 |
| * | Polycom Inc. | 200,037 | 2,650 |
| | InterDigital Inc. | 59,052 | 2,620 |
| | ADTRAN Inc. | 82,779 | 1,911 |
| * | Infinera Corp. | 178,865 | 1,892 |
| * | NETGEAR Inc. | 53,252 | 1,769 |
| * | Ubiquiti Networks Inc. | 32,139 | 1,458 |
| * | Ruckus Wireless Inc. | 88,985 | 1,238 |
| * | Sonus Networks Inc. | 326,821 | 1,232 |
| * | CalAmp Corp. | 49,485 | 954 |
| * | Harmonic Inc. | 143,905 | 945 |
| | Comtech | | |
| | Telecommunications Corp. | 23,479 | 893 |
| * | Mitel Networks Corp. | 86,029 | 862 |
| * | Ixia | 77,839 | 749 |
| * | Extreme Networks Inc. | 139,694 | 745 |
| * | ShoreTel Inc. | 89,622 | 600 |
| * | Emulex Corp. | 106,627 | 584 |
| * | Calix Inc. | 54,965 | 577 |
| | Black Box Corp. | 23,026 | 545 |
| | Oplink Communications Inc. | 26,945 | 521 |
| * | Applied Optoelectronics Inc. | 17,410 | 370 |
| * | Digi International Inc. | 37,445 | 312 |
| | Alliance Fiber Optic | | |
| | Products Inc. | 18,875 | 280 |
| * | ParkerVision Inc. | 138,558 | 172 |
| | | | 507,748 |
| | | |
| | | | Market |
| | | | Value• |
| | | Shares | ($000) |
| * | Ingram Micro Inc. | 227,350 | 6,554 |
| * | Zebra Technologies Corp. | 74,192 | 5,789 |
| | Jabil Circuit Inc. | 267,713 | 5,777 |
| | FEI Co. | 61,775 | 5,191 |
| * | Cognex Corp. | 121,632 | 5,106 |
| | National Instruments Corp. | 148,771 | 4,932 |
| | Belden Inc. | 64,276 | 4,697 |
| | CDW Corp. | 125,905 | 4,160 |
| * | Knowles Corp. | 124,406 | 4,095 |
| * | Tech Data Corp. | 55,570 | 3,751 |
| | Anixter International Inc. | 40,968 | 3,656 |
| * | Dolby Laboratories Inc. | | |
| | Class A | 73,350 | 3,417 |
| * | IPG Photonics Corp. | 49,341 | 3,389 |
| | Vishay Intertechnology Inc. | 197,730 | 3,164 |
| | Littelfuse Inc. | 33,337 | 3,064 |
| * | SYNNEX Corp. | 43,299 | 3,020 |
| *,^ | InvenSense Inc. | 110,480 | 2,856 |
| * | Sanmina Corp. | 120,853 | 2,838 |
| * | Itron Inc. | 57,287 | 2,419 |
| * | Coherent Inc. | 36,315 | 2,341 |
| * | Universal Display Corp. | 61,038 | 2,120 |
| * | Plexus Corp. | 49,603 | 2,043 |
| * | Measurement Specialties | | |
| | Inc. | 23,378 | 2,006 |
| * | Benchmark Electronics Inc. | 78,480 | 1,933 |
| * | OSI Systems Inc. | 27,623 | 1,927 |
| | Methode Electronics Inc. | 55,124 | 1,859 |
| * | ScanSource Inc. | 41,729 | 1,609 |
| | MTS Systems Corp. | 22,379 | 1,591 |
| * | Insight Enterprises Inc. | 60,554 | 1,589 |
| * | Rogers Corp. | 26,143 | 1,573 |
| * | FARO Technologies Inc. | 25,186 | 1,461 |
| * | II-VI Inc. | 77,844 | 1,087 |
| * | Newport Corp. | 57,191 | 1,079 |
| | Badger Meter Inc. | 20,009 | 1,042 |
| | AVX Corp. | 73,710 | 1,016 |
| * | Rofin-Sinar Technologies | | |
| | Inc. | 41,165 | 986 |
| * | Checkpoint Systems Inc. | 60,527 | 838 |
| | Park Electrochemical Corp. | 28,976 | 815 |
| | CTS Corp. | 44,368 | 787 |
| * | Fabrinet | 43,649 | 707 |
| | Daktronics Inc. | 53,593 | 705 |
| * | DTS Inc. | 26,085 | 623 |
| * | RealD Inc. | 64,716 | 602 |
| * | TTM Technologies Inc. | 78,286 | 599 |
| * | GSI Group Inc. | 44,724 | 573 |
| * | Mercury Systems Inc. | 48,437 | 541 |
| * | Maxwell Technologies Inc. | 41,149 | 423 |
| | Electro Rent Corp. | 26,040 | 394 |
| | PC Connection Inc. | 15,287 | 347 |
| * | Kemet Corp. | 65,515 | 330 |
| | Electro Scientific Industries | | |
| | Inc. | 39,321 | 292 |
| * | Control4 Corp. | 16,485 | 245 |
| * | Multi-Fineline Electronix | | |
| | Inc. | 13,996 | 142 |
| | | | 262,496 |
| | | |
| | | | Market |
| | | | Value• |
| | | Shares | ($000) |
| Internet Software & Services (17.2%) | |
| * | Google Inc. Class A | 412,189 | 240,042 |
| * | Google Inc. Class C | 419,499 | 239,786 |
| * | Facebook Inc. Class A | 2,917,398 | 218,280 |
| * | eBay Inc. | 1,669,331 | 92,648 |
| * | Yahoo! Inc. | 1,399,653 | 53,901 |
| * | LinkedIn Corp. Class A | 154,077 | 34,783 |
| * | Twitter Inc. | 474,360 | 23,599 |
| * | Equinix Inc. | 72,877 | 15,906 |
| * | Akamai Technologies Inc. | 260,483 | 15,738 |
| * | VeriSign Inc. | 182,682 | 10,427 |
| | IAC/InterActiveCorp | 112,971 | 7,862 |
| * | Yelp Inc. Class A | 89,451 | 7,373 |
| * | Pandora Media Inc. | 255,565 | 6,910 |
| * | CoStar Group Inc. | 46,469 | 6,726 |
| * | Rackspace Hosting Inc. | 177,760 | 6,150 |
| * | Zillow Inc. Class A | 41,723 | 5,986 |
| | MercadoLibre Inc. | 48,388 | 5,562 |
| * | AOL Inc. | 117,222 | 5,066 |
| | j2 Global Inc. | 66,587 | 3,559 |
| * | Dealertrack Technologies | | |
| | Inc. | 74,542 | 3,336 |
| * | Cornerstone OnDemand | | |
| | Inc. | 70,374 | 2,635 |
| * | Conversant Inc. | 93,483 | 2,575 |
| * | Trulia Inc. | 40,322 | 2,485 |
| * | Demandware Inc. | 43,847 | 2,330 |
| * | WebMD Health Corp. | 48,151 | 2,328 |
| * | Vistaprint NV | 43,739 | 2,112 |
| * | Envestnet Inc. | 41,872 | 1,927 |
| * | comScore Inc. | 45,421 | 1,740 |
| | NIC Inc. | 90,305 | 1,692 |
| * | LogMeIn Inc. | 33,669 | 1,424 |
| * | Constant Contact Inc. | 44,731 | 1,394 |
| * | Web.com Group Inc. | 71,137 | 1,348 |
| * | SPS Commerce Inc. | 23,585 | 1,319 |
| * | Gogo Inc. | 76,076 | 1,288 |
| * | Shutterstock Inc. | 17,993 | 1,274 |
| * | Bankrate Inc. | 82,327 | 1,156 |
| * | Endurance International | | |
| | Group Holdings Inc. | 77,861 | 1,048 |
| * | LivePerson Inc. | 75,150 | 970 |
| * | Blucora Inc. | 58,620 | 913 |
| * | Move Inc. | 54,506 | 867 |
| * | Perficient Inc. | 48,292 | 832 |
| * | Global Eagle Entertainment | | |
| | Inc. | 61,519 | 776 |
| *,^ | Textura Corp. | 26,775 | 772 |
| * | Monster Worldwide Inc. | 133,574 | 771 |
| * | Marketo Inc. | 25,805 | 756 |
| * | Xoom Corp. | 32,982 | 754 |
| * | Stamps.com Inc. | 21,185 | 713 |
| * | SciQuest Inc. | 39,324 | 628 |
| * | Digital River Inc. | 41,037 | 627 |
| | EarthLink Holdings Corp. | 149,208 | 616 |
| * | Liquidity Services Inc. | 40,060 | 610 |
| * | Bazaarvoice Inc. | 71,827 | 524 |
| * | Cvent Inc. | 20,705 | 520 |
| * | Benefitfocus Inc. | 14,949 | 494 |
74
Information Technology Index Fund
| | | |
| | | | Market |
| | | | Value• |
| | | Shares | ($000) |
| * | Angie’s List Inc. | 63,867 | 490 |
| * | Dice Holdings Inc. | 55,376 | 470 |
| * | Internap Network Services | | |
| | Corp. | 67,169 | 459 |
| * | ChannelAdvisor Corp. | 28,327 | 459 |
| * | Intralinks Holdings Inc. | 57,219 | 450 |
| * | E2open Inc. | 29,327 | 443 |
| * | XO Group Inc. | 37,074 | 434 |
| | Marchex Inc. Class B | 47,576 | 408 |
| *,^ | Rocket Fuel Inc. | 17,665 | 288 |
| * | RealNetworks Inc. | 33,628 | 259 |
| * | Brightcove Inc. | 39,906 | 243 |
| * | Marin Software Inc. | 28,903 | 241 |
| * | QuinStreet Inc. | 47,642 | 228 |
| * | Travelzoo Inc. | 10,859 | 185 |
| * | Millennial Media Inc. | 54,345 | 129 |
| | | | 1,051,044 |
| IT Services (16.3%) | | |
| | International Business | | |
| | Machines Corp. | 1,407,195 | 270,604 |
| | Visa Inc. Class A | 730,835 | 155,317 |
| | MasterCard Inc. Class A | 1,479,947 | 112,195 |
| | Accenture plc Class A | 926,360 | 75,091 |
| | Automatic Data Processing | | |
| | Inc. | 705,440 | 58,890 |
| * | Cognizant Technology | | |
| | Solutions Corp. Class A | 890,341 | 40,715 |
| | Fidelity National | | |
| | Information Services Inc. | 421,117 | 23,898 |
| * | Fiserv Inc. | 364,674 | 23,510 |
| | Xerox Corp. | 1,622,861 | 22,412 |
| * | Alliance Data Systems | | |
| | Corp. | 79,327 | 20,993 |
| | Paychex Inc. | 478,991 | 19,950 |
| * | FleetCor Technologies Inc. | 109,141 | 15,682 |
| | Western Union Co. | 788,665 | 13,778 |
| | Computer Sciences Corp. | 211,973 | 12,674 |
| * | Teradata Corp. | 230,735 | 10,538 |
| * | Gartner Inc. | 132,037 | 9,849 |
| | Total System Services Inc. | 248,594 | 7,821 |
| | Global Payments Inc. | 105,037 | 7,638 |
| | Broadridge Financial | | |
| | Solutions Inc. | 176,526 | 7,509 |
| | Jack Henry & Associates | | |
| | Inc. | 123,676 | 7,150 |
| * | Vantiv Inc. Class A | 213,819 | 6,688 |
| * | WEX Inc. | 56,706 | 6,445 |
| * | VeriFone Systems Inc. | 163,791 | 5,720 |
| | DST Systems Inc. | 52,741 | 4,895 |
| | MAXIMUS Inc. | 99,063 | 4,081 |
| * | Euronet Worldwide Inc. | 70,336 | 3,749 |
| * | CoreLogic Inc. | 126,601 | 3,579 |
| | Leidos Holdings Inc. | 93,650 | 3,526 |
| | Science Applications | | |
| | International Corp. | 64,412 | 2,971 |
| | Convergys Corp. | 147,200 | 2,826 |
| * | NeuStar Inc. Class A | 89,355 | 2,635 |
| * | Sapient Corp. | 173,932 | 2,524 |
| | Heartland Payment | | |
| | Systems Inc. | 52,348 | 2,501 |
| * | Cardtronics Inc. | 64,909 | 2,304 |
| | EVERTEC Inc. | 97,201 | 2,239 |
| * | CACI International Inc. | | |
| | Class A | 30,781 | 2,220 |
| * | Syntel Inc. | 24,474 | 2,187 |
| * | EPAM Systems Inc. | 55,262 | 2,081 |
| | Booz Allen Hamilton | | |
| | Holding Corp. Class A | 93,588 | 2,076 |
| * | Acxiom Corp. | 111,549 | 2,069 |
| * | iGATE Corp. | 51,450 | 1,925 |
| * | Unisys Corp. | 74,615 | 1,747 |
| | | |
| | | | Market |
| | | | Value• |
| | | Shares | ($000) |
| * | Blackhawk Network | | |
| | Holdings Inc. Class B | 59,072 | 1,623 |
| | CSG Systems | | |
| | International Inc. | 49,992 | 1,386 |
| * | Virtusa Corp. | 40,528 | 1,380 |
| * | ExlService Holdings Inc. | 45,789 | 1,249 |
| * | Sykes Enterprises Inc. | 57,900 | 1,212 |
| | ManTech International | | |
| | Corp. Class A | 34,765 | 1,007 |
| * | TeleTech Holdings Inc. | 29,259 | 786 |
| * | Global Cash Access | | |
| | Holdings Inc. | 95,576 | 746 |
| | Cass Information Systems | | |
| | Inc. | 13,370 | 627 |
| | Forrester Research Inc. | 15,936 | 619 |
| * | MoneyGram International | | |
| | Inc. | 43,593 | 613 |
| * | Ciber Inc. | 106,296 | 406 |
| * | ServiceSource International | | |
| | Inc. | 100,385 | 381 |
| | Computer Task Group Inc. | 21,544 | 275 |
| * | Higher One Holdings Inc. | 44,722 | 173 |
| | | | 999,685 |
| Semiconductors & Semiconductor | |
| Equipment (13.2%) | | |
| | Intel Corp. | 7,284,865 | 254,387 |
| | Texas Instruments Inc. | 1,579,526 | 76,102 |
| * | Micron Technology Inc. | 1,566,438 | 51,066 |
| | Applied Materials Inc. | 1,781,610 | 41,164 |
| | Broadcom Corp. Class A | 782,998 | 30,834 |
| | Avago Technologies Ltd. | | |
| | Class A | 365,541 | 30,007 |
| | Analog Devices Inc. | 459,748 | 23,502 |
| | KLA-Tencor Corp. | 242,668 | 18,545 |
| | Lam Research Corp. | 237,228 | 17,059 |
| | Xilinx Inc. | 393,409 | 16,622 |
| | Altera Corp. | 458,420 | 16,201 |
| | NVIDIA Corp. | 816,469 | 15,880 |
| | Skyworks Solutions Inc. | 277,372 | 15,716 |
| | Linear Technology Corp. | 346,885 | 15,648 |
| | Microchip Technology Inc. | 293,149 | 14,314 |
| | Maxim Integrated Products | | |
| | Inc. | 413,665 | 12,778 |
| * | SunEdison Inc. | 372,264 | 8,201 |
| * | Cree Inc. | 178,862 | 8,149 |
| | Marvell Technology Group | | |
| | Ltd. | 557,435 | 7,754 |
| * | First Solar Inc. | 109,745 | 7,647 |
| * | ON Semiconductor Corp. | 649,161 | 6,336 |
| | Teradyne Inc. | 286,037 | 5,889 |
| * | Atmel Corp. | 615,961 | 5,457 |
| * | RF Micro Devices Inc. | 417,136 | 5,202 |
| * | TriQuint Semiconductor | | |
| | Inc. | 238,274 | 4,924 |
| * | Synaptics Inc. | 52,626 | 4,321 |
| * | Cavium Inc. | 76,868 | 4,318 |
| * | International Rectifier Corp. | 104,082 | 4,101 |
| * | Advanced Micro Devices | | |
| | Inc. | 947,917 | 3,953 |
| * | Microsemi Corp. | 138,343 | 3,685 |
| *,^ | GT Advanced Technologies | | |
| | Inc. | 201,358 | 3,586 |
| * | Integrated Device | | |
| | Technology Inc. | 208,159 | 3,424 |
| * | Freescale Semiconductor | | |
| | Ltd. | 156,301 | 3,290 |
| * | Fairchild Semiconductor | | |
| | International Inc. Class A | 182,241 | 3,198 |
| | Intersil Corp. Class A | 186,699 | 2,809 |
| * | Silicon Laboratories Inc. | 59,356 | 2,691 |
| | MKS Instruments Inc. | 78,068 | 2,650 |
| | | |
| | | | Market |
| | | | Value• |
| | | Shares | ($000) |
| | Power Integrations Inc. | 44,279 | 2,647 |
| * | Semtech Corp. | 100,309 | 2,614 |
| * | SunPower Corp. Class A | 67,013 | 2,561 |
| | Monolithic Power Systems | | |
| | Inc. | 53,184 | 2,541 |
| * | Entegris Inc. | 202,696 | 2,461 |
| | Cypress Semiconductor | | |
| | Corp. | 219,306 | 2,423 |
| * | Mellanox Technologies Ltd. | 54,987 | 2,298 |
| * | OmniVision Technologies | | |
| | Inc. | 81,832 | 2,218 |
| * | Cirrus Logic Inc. | 90,961 | 2,199 |
| * | Amkor Technology Inc. | 207,748 | 2,161 |
| * | PMC-Sierra Inc. | 284,113 | 2,097 |
| | Tessera Technologies Inc. | 69,872 | 2,066 |
| * | Veeco Instruments Inc. | 58,282 | 2,061 |
| * | Rambus Inc. | 157,522 | 1,955 |
| * | Spansion Inc. Class A | 78,980 | 1,761 |
| * | Kulicke & Soffa Industries | | |
| | Inc. | 111,651 | 1,640 |
| * | Cabot Microelectronics | | |
| | Corp. | 35,759 | 1,534 |
| * | Diodes Inc. | 54,668 | 1,391 |
| * | Lattice Semiconductor | | |
| | Corp. | 169,964 | 1,276 |
| | Brooks Automation Inc. | 97,275 | 1,103 |
| * | Advanced Energy | | |
| | Industries Inc. | 56,982 | 1,097 |
| * | Ultratech Inc. | 40,993 | 1,060 |
| *,^ | Ambarella Inc. | 30,791 | 1,055 |
| * | Applied Micro Circuits | | |
| | Corp. | 108,394 | 918 |
| | Micrel Inc. | 70,479 | 883 |
| * | Photronics Inc. | 90,104 | 796 |
| * | PDF Solutions Inc. | 37,510 | 749 |
| * | Xcerra Corp. | 66,955 | 700 |
| | Integrated Silicon Solution | | |
| | Inc. | 43,626 | 647 |
| * | Exar Corp. | 58,846 | 587 |
| * | Silicon Image Inc. | 113,326 | 573 |
| * | Magnachip Semiconductor | | |
| | Corp. | 45,864 | 566 |
| * | FormFactor Inc. | 79,490 | 560 |
| * | Nanometrics Inc. | 32,689 | 547 |
| * | Inphi Corp. | 35,208 | 530 |
| * | CEVA Inc. | 32,258 | 489 |
| * | M/A-COM Technology | | |
| | Solutions Holdings Inc. | 20,595 | 488 |
| * | Rudolph Technologies Inc. | 48,149 | 466 |
| | IXYS Corp. | 36,538 | 438 |
| * | NVE Corp. | 6,309 | 435 |
| * | Entropic Communications | | |
| | Inc. | 134,350 | 353 |
| * | Audience Inc. | 21,178 | 182 |
| | | | 806,536 |
| Software (20.3%) | | |
| | Microsoft Corp. | 11,484,155 | 521,725 |
| | Oracle Corp. | 5,220,267 | 216,798 |
| * | salesforce.com inc | 853,599 | 50,439 |
| * | Adobe Systems Inc. | 691,965 | 49,752 |
| | Intuit Inc. | 395,130 | 32,867 |
| | Symantec Corp. | 1,012,192 | 24,576 |
| * | Autodesk Inc. | 332,925 | 17,858 |
| * | Electronic Arts Inc. | 460,356 | 17,420 |
| | Activision Blizzard Inc. | 732,431 | 17,241 |
| * | Red Hat Inc. | 277,011 | 16,876 |
| * | Citrix Systems Inc. | 239,760 | 16,846 |
| | CA Inc. | 486,092 | 13,727 |
| * | Workday Inc. Class A | 139,212 | 12,678 |
| * | VMware Inc. Class A | 124,149 | 12,239 |
| * | ServiceNow Inc. | 189,765 | 11,600 |
75
Information Technology Index Fund
| | | |
| | | | Market |
| | | | Value• |
| | | Shares | ($000) |
| * | ANSYS Inc. | 135,817 | 11,042 |
| * | Synopsys Inc. | 226,292 | 9,255 |
| * | Splunk Inc. | 164,382 | 8,868 |
| * | Cadence Design Systems | | |
| | Inc. | 425,066 | 7,498 |
| | FactSet Research Systems | | |
| | Inc. | 58,823 | 7,494 |
| * | Concur Technologies Inc. | 70,993 | 7,126 |
| * | MICROS Systems Inc. | 103,962 | 7,066 |
| * | PTC Inc. | 173,588 | 6,716 |
| * | Nuance Communications | | |
| | Inc. | 373,403 | 6,352 |
| | Solera Holdings Inc. | 101,451 | 6,184 |
| * | Ultimate Software Group | | |
| | Inc. | 39,635 | 5,826 |
| * | Aspen Technology Inc. | 134,683 | 5,534 |
| * | Informatica Corp. | 161,611 | 5,504 |
| * | Fortinet Inc. | 204,267 | 5,272 |
| * | TIBCO Software Inc. | 228,225 | 4,756 |
| * | SS&C Technologies | | |
| | Holdings Inc. | 103,904 | 4,703 |
| * | Guidewire Software Inc. | 98,919 | 4,506 |
| * | NetSuite Inc. | 49,716 | 4,357 |
| * | Verint Systems Inc. | 86,326 | 4,328 |
| * | SolarWinds Inc. | 99,914 | 4,275 |
| * | Tyler Technologies Inc. | 45,745 | 4,074 |
| * | Qlik Technologies Inc. | 130,214 | 3,676 |
| * | Tableau Software Inc. | | |
| | Class A | 55,568 | 3,639 |
| * | CommVault Systems Inc. | 65,971 | 3,638 |
| * | Take-Two Interactive | | |
| | Software Inc. | 145,258 | 3,415 |
| * | ACI Worldwide Inc. | 168,368 | 3,278 |
| * | Manhattan Associates Inc. | 111,658 | 3,225 |
| * | Rovi Corp. | 138,582 | 3,205 |
| | Mentor Graphics Corp. | 142,364 | 3,105 |
| | Compuware Corp. | 318,655 | 2,979 |
| | Fair Isaac Corp. | 50,938 | 2,963 |
| * | FireEye Inc. | 94,936 | 2,956 |
| * | Zynga Inc. Class A | 960,148 | 2,780 |
| * | NetScout Systems Inc. | 57,326 | 2,641 |
| | Blackbaud Inc. | 67,392 | 2,621 |
| * | TiVo Inc. | 168,044 | 2,368 |
| * | Synchronoss Technologies | | |
| | Inc. | 47,831 | 2,113 |
| | Advent Software Inc. | 64,361 | 2,079 |
| * | MicroStrategy Inc. Class A | 13,278 | 1,845 |
| * | Proofpoint Inc. | 43,308 | 1,727 |
| | Monotype Imaging | | |
| | Holdings Inc. | 57,044 | 1,677 |
| * | Bottomline Technologies | | |
| | de Inc. | 57,088 | 1,608 |
| * | Progress Software Corp. | 67,813 | 1,571 |
| * | Ellie Mae Inc. | 38,329 | 1,372 |
| * | RealPage Inc. | 79,725 | 1,285 |
| | Pegasystems Inc. | 50,181 | 1,114 |
| | | |
| | | | Market |
| | | | Value• |
| | | Shares | ($000) |
| * | Interactive Intelligence | | |
| | Group Inc. | 23,569 | 1,009 |
| * | Infoblox Inc. | 74,693 | 1,005 |
| * | BroadSoft Inc. | 41,482 | 990 |
| *,^ | VirnetX Holding Corp. | 63,647 | 939 |
| * | PROS Holdings Inc. | 35,046 | 897 |
| * | Imperva Inc. | 28,603 | 833 |
| * | Net 1 UEPS Technologies | | |
| | Inc. | 62,416 | 765 |
| * | Comverse Inc. | 30,801 | 760 |
| * | EnerNOC Inc. | 37,137 | 729 |
| * | Tangoe Inc. | 50,259 | 700 |
| ^ | Ebix Inc. | 44,895 | 693 |
| | Epiq Systems Inc. | 44,296 | 644 |
| * | VASCO Data Security | | |
| | International Inc. | 43,202 | 638 |
| * | Qualys Inc. | 26,031 | 633 |
| * | ePlus Inc. | 8,991 | 526 |
| * | Jive Software Inc. | 56,199 | 392 |
| * | Seachange International Inc. | 48,006 | 364 |
| * | Silver Spring Networks Inc. | 31,409 | 326 |
| * | Actuate Corp. | 65,678 | 292 |
| * | Telenav Inc. | 36,622 | 252 |
| * | Rosetta Stone Inc. | 28,393 | 248 |
| * | Rally Software | | |
| | Development Corp. | 21,452 | 248 |
| * | Mavenir Systems Inc. | 21,076 | 237 |
| * | Gigamon Inc. | 15,920 | 173 |
| * | Vringo Inc. | 110,661 | 112 |
| | | | 1,240,663 |
| Technology Hardware, Storage | | |
| & Peripherals (20.4%) | | |
| | Apple Inc. | 8,824,447 | 904,506 |
| | Hewlett-Packard Co. | 2,773,363 | 105,388 |
| | EMC Corp. | 2,996,119 | 88,475 |
| | Western Digital Corp. | 326,727 | 33,656 |
| | SanDisk Corp. | 331,066 | 32,431 |
| | Seagate Technology plc | 477,865 | 29,905 |
| | NetApp Inc. | 484,716 | 20,436 |
| * | NCR Corp. | 245,247 | 8,378 |
| *,^ | 3D Systems Corp. | 153,545 | 8,216 |
| | Lexmark International Inc. | | |
| | Class A | 87,299 | 4,414 |
| | Diebold Inc. | 89,229 | 3,388 |
| * | Electronics For Imaging Inc. | 68,494 | 3,016 |
| * | Cray Inc. | 56,130 | 1,583 |
| * | Super Micro Computer Inc. | 51,021 | 1,250 |
| * | QLogic Corp. | 127,097 | 1,150 |
| * | Eastman Kodak Co. | 26,983 | 624 |
| * | Silicon Graphics | | |
| | International Corp. | 47,446 | 465 |
| * | Quantum Corp. | 327,286 | 409 |
| | | | 1,247,690 |
| Total Common Stocks | | |
| (Cost $4,411,373) | | 6,115,862 |
| | |
| | | Market |
| | | Value• |
| | Shares | ($000) |
| Temporary Cash Investment (0.1%) | |
| Money Market Fund (0.1%) | |
| 1,2 Vanguard Market | | |
| Liquidity Fund, 0.113% | |
| (Cost $4,037) | 4,036,700 | 4,037 |
| Total Investments (100.1%) | |
| (Cost $4,415,410) | | 6,119,899 |
| Other Assets and Liabilities (–0.1%) | |
| Other Assets | | 94,715 |
| Liabilities2 | | (98,195) |
| | | (3,480) |
| Net Assets (100%) | | 6,116,419 |
At August 31, 2014, net assets consisted of:
| |
| | Amount |
| | ($000) |
| Paid-in Capital | 4,418,430 |
| Undistributed Net Investment Income | 50,064 |
| Accumulated Net Realized Losses | (56,564) |
| Unrealized Appreciation (Depreciation) | 1,704,489 |
| Net Assets | 6,116,419 |
| |
| |
| Admiral Shares—Net Assets | |
| Applicable to 4,636,837 outstanding | |
| $.001 par value shares of beneficial | |
| interest (unlimited authorization) | 240,784 |
| Net Asset Value Per Share— | |
| Admiral Shares | $51.93 |
| |
| |
| ETF Shares—Net Assets | |
| Applicable to 57,942,244 outstanding | |
| $.001 par value shares of beneficial | |
| interest (unlimited authorization) | 5,875,635 |
| Net Asset Value Per Share— | |
| ETF Shares | $101.41 |
• See Note A in Notes to Financial Statements.
* Non-income-producing security.
^ Includes partial security positions on loan to broker-dealers. The total value of securities on loan is $3,935,000.
1 Affiliated money market fund available only to Vanguard funds and certain trusts and accounts managed by Vanguard. Rate shown is the 7-day yield.
2 Includes $4,037,000 of collateral received for securities on loan.
See accompanying Notes, which are an integral part of the Financial Statements.
76
Information Technology Index Fund
Statement of Operations
| |
| | Year Ended |
| August 31, 2014 |
| | ($000) |
| Investment Income | |
| Income | |
| Dividends | 73,954 |
| Interest1 | 4 |
| Securities Lending | 526 |
| Total Income | 74,484 |
| Expenses | |
| The Vanguard Group—Note B | |
| Investment Advisory Services | 882 |
| Management and Administrative— | |
| Admiral Shares | 152 |
| Management and Administrative— | |
| ETF Shares | 3,656 |
| Marketing and Distribution— | |
| Admiral Shares | 40 |
| Marketing and Distribution— | |
| ETF Shares | 936 |
| Custodian Fees | 46 |
| Auditing Fees | 32 |
| Shareholders’ Reports—Admiral Shares | 4 |
| Shareholders’ Reports—ETF Shares | 215 |
| Trustees’ Fees and Expenses | 3 |
| Total Expenses | 5,966 |
| Net Investment Income | 68,518 |
| Realized Net Gain (Loss) on | |
| Investment Securities Sold | 216,537 |
| Change in Unrealized Appreciation | |
| (Depreciation) of Investment Securities | 1,053,464 |
| Net Increase (Decrease) in Net Assets | |
| Resulting from Operations | 1,338,519 |
Statement of Changes in Net Assets
| | |
| | Year Ended August 31, |
| | 2014 | 2013 |
| | ($000) | ($000) |
| Increase (Decrease) in Net Assets | | |
| Operations | | |
| Net Investment Income | 68,518 | 45,155 |
| Realized Net Gain (Loss) | 216,537 | 31,212 |
| Change in Unrealized Appreciation (Depreciation) | 1,053,464 | 176,618 |
| Net Increase (Decrease) in Net Assets Resulting from Operations | 1,338,519 | 252,985 |
| Distributions | | |
| Net Investment Income | | |
| Admiral Shares | (1,907) | (1,728) |
| ETF Shares | (46,579) | (30,105) |
| Realized Capital Gain | | |
| Admiral Shares | — | — |
| ETF Shares | — | — |
| Total Distributions | (48,486) | (31,833) |
| Capital Share Transactions | | |
| Admiral Shares | 37,646 | 45,761 |
| ETF Shares | 1,139,818 | 750,980 |
| Net Increase (Decrease) from Capital Share Transactions | 1,177,464 | 796,741 |
| Total Increase (Decrease) | 2,467,497 | 1,017,893 |
| Net Assets | | |
| Beginning of Period | 3,648,922 | 2,631,029 |
| End of Period2 | 6,116,419 | 3,648,922 |
1 Interest income from an affiliated company of the fund was $4,000.
2 Net Assets—End of Period includes undistributed (overdistributed) net investment income of $50,064,000 and $30,032,000.
See accompanying Notes, which are an integral part of the Financial Statements.
77
Information Technology Index Fund
Financial Highlights
| | | | | |
| Admiral Shares | | | | | |
| |
| For a Share Outstanding | Year Ended August 31, |
| Throughout Each Period | 2014 | 2013 | 2012 | 2011 | 2010 |
| Net Asset Value, Beginning of Period | $39.75 | $37.17 | $30.30 | $25.30 | $24.39 |
| Investment Operations | | | | | |
| Net Investment Income | .580 | .521 | . 320 | . 238 | .146 |
| Net Realized and Unrealized Gain (Loss) | | | | | |
| on Investments | 12.079 | 2.493 | 6.797 | 4.947 | .882 |
| Total from Investment Operations | 12.659 | 3.014 | 7.117 | 5.185 | 1.028 |
| Distributions | | | | | |
| Dividends from Net Investment Income | (.479) | (. 434) | (.247) | (.185) | (.118) |
| Distributions from Realized Capital Gains | — | — | — | — | — |
| Total Distributions | (.479) | (. 434) | (.247) | (.185) | (.118) |
| Net Asset Value, End of Period | $51.93 | $39.75 | $37.17 | $30.30 | $25.30 |
| |
| Total Return1 | 32.05% | 8.24% | 23.63% | 20.46% | 4.17% |
| |
| Ratios/Supplemental Data | | | | | |
| Net Assets, End of Period (Millions) | $241 | $152 | $95 | $60 | $46 |
| Ratio of Total Expenses to Average Net Assets | 0.12% | 0.14% | 0.14% | 0.19% | 0.24% |
| Ratio of Net Investment Income to | | | | | |
| Average Net Assets | 1.38% | 1.53% | 1.01% | 0.79% | 0.69% |
| Portfolio Turnover Rate2 | 6% | 6% | 6% | 6% | 9% |
1 Total returns do not include transaction or account service fees that may have applied in the periods shown. Fund prospectuses provide
information about any applicable transaction and account service fees.
2 Excludes the value of portfolio securities received or delivered as a result of in-kind purchases or redemptions of the fund’s capital shares,
including ETF Creation Units.
| | | | | |
| ETF Shares | | | | | |
| |
| For a Share Outstanding | Year Ended August 31, |
| Throughout Each Period | 2014 | 2013 | 2012 | 2011 | 2010 |
| Net Asset Value, Beginning of Period | $77.63 | $72.58 | $59.17 | $49.40 | $47.64 |
| Investment Operations | | | | | |
| Net Investment Income | 1.135 | 1.011 | .628 | .464 | . 296 |
| Net Realized and Unrealized Gain (Loss) | | | | | |
| on Investments | 23.589 | 4.872 | 13.267 | 9.668 | 1.714 |
| Total from Investment Operations | 24.724 | 5.883 | 13.895 | 10.132 | 2.010 |
| Distributions | | | | | |
| Dividends from Net Investment Income | (. 944) | (. 833) | (. 485) | (. 362) | (. 250) |
| Distributions from Realized Capital Gains | — | — | — | — | — |
| Total Distributions | (. 944) | (. 833) | (. 485) | (. 362) | (. 250) |
| Net Asset Value, End of Period | $101.41 | $77.63 | $72.58 | $59.17 | $49.40 |
| |
| Total Return | 32.04% | 8.23% | 23.65% | 20.48% | 4.17% |
| |
| Ratios/Supplemental Data | | | | | |
| Net Assets, End of Period (Millions) | $5,876 | $3,497 | $2,536 | $1,730 | $1,137 |
| Ratio of Total Expenses to Average Net Assets | 0.12% | 0.14% | 0.14% | 0.19% | 0.24% |
| Ratio of Net Investment Income to | | | | | |
| Average Net Assets | 1.38% | 1.53% | 1.01% | 0.79% | 0.69% |
| Portfolio Turnover Rate1 | 6% | 6% | 6% | 6% | 9% |
| 1 Excludes the value of portfolio securities received or delivered as a result of in-kind purchases or redemptions of the fund’s capital shares, including ETF Creation Units. |
|
See accompanying Notes, which are an integral part of the Financial Statements.
78
Information Technology Index Fund
Notes to Financial Statements
Vanguard Information Technology Index Fund is registered under the Investment Company Act of 1940 as an open-end investment company, or mutual fund. The fund offers two classes of shares: Admiral Shares and ETF Shares. Admiral Shares are designed for investors who meet certain administrative, service, and account-size criteria. ETF Shares are listed for trading on NYSE Arca; they can be purchased and sold through a broker.
A. The following significant accounting policies conform to generally accepted accounting principles for U.S. investment companies. The fund consistently follows such policies in preparing its financial statements.
1. Security Valuation: Securities are valued as of the close of trading on the New York Stock Exchange (generally 4 p.m., Eastern time) on the valuation date. Equity securities are valued at the latest quoted sales prices or official closing prices taken from the primary market in which each security trades; such securities not traded on the valuation date are valued at the mean of the latest quoted bid and asked prices. Securities for which market quotations are not readily available, or whose values have been materially affected by events occurring before the fund’s pricing time but after the close of the securities’ primary markets, are valued by methods deemed by the board of trustees to represent fair value. Investments in Vanguard Market Liquidity Fund are valued at that fund’s net asset value.
2. Federal Income Taxes: The fund intends to continue to qualify as a regulated investment company and distribute all of its taxable income. Management has analyzed the fund’s tax positions taken for all open federal income tax years (August 31, 2011–2014), and has concluded that no provision for federal income tax is required in the fund’s financial statements.
3. Distributions: Distributions to shareholders are recorded on the ex-dividend date.
4. Securities Lending: To earn additional income, the fund lends its securities to qualified institutional borrowers. Security loans are required to be secured at all times by collateral in an amount at least equal to the market value of securities loaned. Daily market fluctuations could cause the value of loaned securities to be more or less than the value of the collateral received. When this occurs, the collateral is adjusted and settled on the next business day. The fund further mitigates its counterparty risk by entering into securities lending transactions only with a diverse group of prequalified counterparties, monitoring their financial strength, and entering into master securities lending agreements with its counterparties. The master securities lending agreements provide that, in the event of a counterparty’s default (including bankruptcy), the fund may terminate any loans with that borrower, determine the net amount owed, and sell or retain the collateral up to the net amount owed to the fund; however, such actions may be subject to legal proceedings. While collateral mitigates counterparty risk, in the absence of a default the fund may experience delays and costs in recovering the securities loaned. The fund invests cash collateral received in Vanguard Market Liquidity Fund, and records a liability in the Statement of Net Assets for the return of the collateral, during the period the securities are on loan. Securities lending income represents fees charged to borrowers plus income earned on invested cash collateral, less expenses associated with the loan.
5. Credit Facility: The fund and certain other funds managed by The Vanguard Group participate in a $2.89 billion committed credit facility provided by a syndicate of lenders pursuant to a credit agreement that may be renewed annually; each fund is individually liable for its borrowings, if any, under the credit facility. Borrowings may be utilized for temporary and emergency purposes, and are subject to the fund’s regulatory and contractual borrowing restrictions. The participating funds are charged administrative fees and an annual commitment fee of 0.06% of the undrawn amount of the facility; these fees are allocated to the funds based on a method approved by the fund’s board of trustees and included in Management and Administrative expenses on the fund’s Statement of Operations. Any borrowings under this facility bear interest at a rate equal to the higher of the federal funds rate or LIBOR reference rate plus an agreed-upon spread.
The fund had no borrowings outstanding at August 31, 2014, or at any time during the period then ended.
6. Other: Dividend income is recorded on the ex-dividend date. Interest income includes income distributions received from Vanguard Market Liquidity Fund and is accrued daily. Security transactions are accounted for on the date securities are bought or sold. Costs used to determine realized gains (losses) on the sale of investment securities are those of the specific securities sold.
79
Information Technology Index Fund
Each class of shares has equal rights as to assets and earnings, except that each class separately bears certain class-specific expenses related to maintenance of shareholder accounts (included in Management and Administrative expenses) and shareholder reporting. Marketing and distribution expenses are allocated to each class of shares based on a method approved by the board of trustees. Income, other non-class-specific expenses, and gains and losses on investments are allocated to each class of shares based on its relative net assets.
B. The Vanguard Group furnishes at cost investment advisory, corporate management, administrative, marketing, and distribution services. The costs of such services are allocated to the fund based on methods approved by the board of trustees. The fund has committed to provide up to 0.40% of its net assets in capital contributions to Vanguard. At August 31, 2014, the fund had contributed capital of $588,000 to Vanguard (included in Other Assets), representing 0.01% of the fund’s net assets and 0.24% of Vanguard’s capitalization. The fund’s trustees and officers are also directors and officers of Vanguard.
C. Various inputs may be used to determine the value of the fund’s investments. These inputs are summarized in three broad levels for financial statement purposes. The inputs or methodologies used to value securities are not necessarily an indication of the risk associated with investing in those securities.
Level 1—Quoted prices in active markets for identical securities.
Level 2—Other significant observable inputs (including quoted prices for similar securities, interest
rates, prepayment speeds, credit risk, etc.).
Level 3—Significant unobservable inputs (including the fund’s own assumptions used to determine
the fair value of investments).
At August 31, 2014, 100% of the market value of the fund’s investments was determined based on Level 1 inputs.
D. Distributions are determined on a tax basis and may differ from net investment income and realized capital gains for financial reporting purposes. Differences may be permanent or temporary. Permanent differences are reclassified among capital accounts in the financial statements to reflect their tax character. Temporary differences arise when certain items of income, expense, gain, or loss are recognized in different periods for financial statement and tax purposes. These differences will reverse at some time in the future. Differences in classification may also result from the treatment of short-term gains as ordinary income for tax purposes.
During the year ended August 31, 2014, the fund realized $210,457,000 of net capital gains resulting from in-kind redemptions—in which shareholders exchanged fund shares for securities held by the fund rather than for cash. Because such gains are not taxable to the fund, and are not distributed to shareholders, they have been reclassified from accumulated net realized losses to paid-in capital.
For tax purposes, at August 31, 2014, the fund had $51,585,000 of ordinary income available for distribution. The fund used capital loss carryforwards of $6,080,000 to offset taxable capital gains realized during the year ended August 31, 2014. At August 31, 2014, the fund had available capital losses totaling $56,558,000 to offset future net capital gains. Of this amount, $55,219,000 is subject to expiration dates; $612,000 may be used to offset future net capital gains through August 31, 2015, 218,000 through August 31, 2016, $14,013,000 through August 31, 2017, $20,048,000 through August 31, 2018, and $20,328,000 through August 31, 2019. Capital losses of $1,339,000 realized beginning in fiscal 2012 may be carried forward indefinitely under the Regulated Investment Company Modernization Act of 2010, but must be used before any expiring loss carryforwards. Capital loss carryforwards of $188,000 expired on August 31, 2014; accordingly, such losses have been reclassified from accumulated net realized losses to paid-in capital.
At August 31, 2014, the cost of investment securities for tax purposes was $4,415,415,000. Net unrealized appreciation of investment securities for tax purposes was $1,704,484,000, consisting of unrealized gains of $1,743,546,000 on securities that had risen in value since their purchase and 39,062,000 in unrealized losses on securities that had fallen in value since their purchase.
E. During the year ended August 31, 2014, the fund purchased $1,907,549,000 of investment securities and sold $708,457,000 of investment securities, other than temporary cash investments. Purchases and sales include $1,538,412,000 and $402,748,000, respectively, in connection with in-kind purchases and redemptions of the fund’s capital shares.
80
Information Technology Index Fund
F. Capital share transactions for each class of shares were:
| | | | |
| | Year Ended August 31, |
| | | 2014 | | | 2013 |
| | Amount | Shares | Amount | Shares |
| | ($000) | (000) | ($000) | (000) |
| Admiral Shares | | | | |
| Issued | 74,157 | 1,605 | 92,628 | 2,538 |
| Issued in Lieu of Cash Distributions | 1,800 | 41 | 1,656 | 46 |
| Redeemed | (38,311) | (835) | (48,523) | (1,313) |
| Net Increase (Decrease) —Admiral Shares | 37,646 | 811 | 45,761 | 1,271 |
| ETF Shares | | | | |
| Issued | 1,543,974 | 17,400 | 808,844 | 10,901 |
| Issued in Lieu of Cash Distributions | — | — | — | — |
| Redeemed | (404,156) | (4,500) | (57,864) | (800) |
| Net Increase (Decrease)—ETF Shares | 1,139,818 | 12,900 | 750,980 | 10,101 |
At August 31, 2014, one shareholder was the record or beneficial owner of 29% of the fund’s net assets. If the shareholder were to redeem its investment in the fund, the redemption might result in an increase in the fund’s expense ratio.
G. Management has determined that no material events or transactions occurred subsequent to August 31, 2014, that would require recognition or disclosure in these financial statements.
81
Materials Index Fund
Fund Profile
As of August 31, 2014
| | |
| Share-Class Characteristics | |
| | Admiral | ETF |
| | Shares | Shares |
| Ticker Symbol | VMIAX | VAW |
| Expense Ratio1 | 0.14% | 0.14% |
| 30-Day SEC Yield | 1.74% | 1.74% |
| | | |
| Portfolio Characteristics | | |
| | | MSCI | |
| | | US IMI/ | MSCI |
| | | Materials | US IMI/ |
| | Fund | 25/50 | 2500 |
| Number of Stocks | 132 | 132 | 2,499 |
| Median Market Cap | $21.0B | $21.0B | $48.7B |
| Price/Earnings Ratio | 24.4x | 24.4x | 20.7x |
| Price/Book Ratio | 3.0x | 3.0x | 2.7x |
| Return on Equity | 18.1% | 18.1% | 18.0% |
| Earnings Growth Rate | 16.4% | 16.4% | 15.2% |
| Dividend Yield | 1.8% | 1.8% | 1.9% |
| Foreign Holdings | 0.0% | 0.0% | 0.0% |
| Turnover Rate | 4% | — | —- |
| Short-Term Reserves | 0.0% | — | — |
| | |
| Volatility Measures | | |
| | MSCI US | |
| | IMI/Materials | MSCI US |
| | 25/50 | IMI/2500 |
| R-Squared | 1.00 | 0.83 |
| Beta | 1.00 | 1.43 |
| These measures show the degree and timing of the fund’s fluctuations compared with the indexes over 36 months. |
|
| |
| Subindustry Diversification | |
| (% of equity exposure) | |
| |
| Aluminum | 2.6% |
| Commodity Chemicals | 7.8 |
| Construction Materials | 2.5 |
| Diversified Chemicals | 18.1 |
| Diversified Metals & Mining | 5.7 |
| Fertilizers & Agricultural Chemicals | 11.0 |
| Gold | 2.3 |
| Industrial Gases | 8.7 |
| Metal & Glass Containers | 3.7 |
| Paper Packaging | 5.3 |
| Paper Products | 3.7 |
| Specialty Chemicals | 21.4 |
| Steel | 6.3 |
| Other Materials | 0.9 |
| | |
| Ten Largest Holdings (% of total net assets) |
| |
| Dow Chemical Co. | Diversified Chemicals | 7.5% |
| EI du Pont de | | |
| Nemours & Co. | Diversified Chemicals | 7.1 |
| Monsanto Co. | Fertilizers & | |
| | Agricultural Chemicals | 7.1 |
| LyondellBasell | | |
| Industries NV | Commodity Chemicals | 6.0 |
| Praxair Inc. | Industrial Gases | 4.5 |
| Freeport- | Diversified Metals | |
| McMoRan Inc. | & Mining | 4.4 |
| Ecolab Inc. | Specialty Chemicals | 3.6 |
| PPG Industries Inc. | Specialty Chemicals | 3.3 |
| Air Products & | | |
| Chemicals Inc. | Industrial Gases | 3.3 |
| International | | |
| Paper Co. | Paper Products | 2.3 |
| Top Ten Total | | 49.1% |
| The holdings listed exclude any temporary cash investments and equity index products. |
|
1 The expense ratios shown are from the prospectus dated December 23, 2013, and represent estimated costs for the current fiscal year. For the fiscal year ended August 31, 2014, the expense ratios were 0.12% for
Admiral Shares and 0.12% for ETF Shares.
82
Materials Index Fund
Performance Summary
All of the returns in this report represent past performance, which is not a guarantee of future results that may be achieved by the fund. (Current performance may be lower or higher than the performance data cited. For performance data current to the most recent month-end, visit our website at vanguard.com/performance.) Note, too, that both investment returns and principal value can fluctuate widely, so an investor’s shares, when sold, could be worth more or less than their original cost. The returns shown do not reflect taxes that a shareholder would pay on fund distributions or on the sale of fund shares.
Cumulative Performance: August 31, 2004–August 31, 2014
Initial Investment of $10,000
| | | | |
| | | Average Annual Total Returns | Final Value |
| | Periods Ended August 31, 2014 | of a $10,000 |
| | One Year | Five Years | Ten Years | Investment |
| Materials Index Fund | | | | |
| ETF Shares Net Asset Value | 27.17% | 15.67% | 10.20% | $26,418 |
| Materials Index Fund | | | | |
| ETF Shares Market Price | 27.17 | 15.66 | 10.21 | 26,434 |
| Spliced US IMI/Materials 25/50 | 27.31 | 15.84 | 10.33 | 26,724 |
| Basic Materials Funds Average | 19.08 | 8.58 | 7.95 | 21,487 |
| MSCI US IMI/2500 | 24.94 | 17.33 | 9.05 | 23,791 |
For a benchmark description, see the Glossary.
Basic Materials Funds Average: Derived from data provided by Lipper, a Thomson Reuters Company. |
|
| | | | |
| | | | | Final Value |
| | | | | of a $100,000 |
| | One Year | Five Years | Ten Years | Investment |
| Materials Index Fund Admiral Shares | 27.18% | 15.68% | 10.19% | $263,827 |
| Spliced US IMI/Materials 25/50 | 27.31 | 15.84 | 10.33 | 267,243 |
| MSCI US IMI/2500 | 24.94 | 17.33 | 9.05 | 237,905 |
See Financial Highlights for dividend and capital gains information.
83
Materials Index Fund
Fiscal-Year Total Returns (%): August 31, 2004–August 31, 2014
For a benchmark description, see the Glossary.
| | | |
| Cumulative Returns: ETF Shares, August 31, 2004–August 31, 2014 | | |
| |
| | One Year | Five Years | Ten Years |
| Materials Index Fund ETF Shares Market Price | 27.17% | 106.93% | 164.34% |
| Materials Index Fund ETF Shares Net Asset Value | 27.17 | 107.06 | 164.18 |
| Spliced US IMI/Materials 25/50 | 27.31 | 108.57 | 167.24 |
Average Annual Total Returns: Periods Ended June 30, 2014
This table presents total returns through the latest calendar quarter—rather than through the end of the fiscal
period. Securities and Exchange Commission rules require that we provide this information.
| | | | |
| | Inception Date | One Year | Five Years | Ten Years |
| ETF Shares | 1/26/2004 | | | |
| Market Price | | 31.58% | 18.77% | 9.97% |
| Net Asset Value | | 31.61 | 18.77 | 9.96 |
| Admiral Shares | 2/11/2004 | 31.61 | 18.78 | 9.95 |
See Financial Highlights for dividend and capital gains information.
84
Materials Index Fund
Financial Statements
Statement of Net Assets
As of August 31, 2014
The fund reports a complete list of its holdings in regulatory filings four times in each fiscal year, at the quarter-ends. For the second and fourth fiscal quarters, the lists appear in the fund’s semiannual and annual reports to shareholders. For the first and third fiscal quarters, the fund files the lists with the Securities and Exchange Commission on Form N-Q. Shareholders can look up the fund’s Forms N-Q on the SEC’s website at sec.gov. Forms N-Q may also be reviewed and copied at the SEC’s Public Reference Room (see the back cover of this report for further information).
| | | |
| | | | Market |
| | | | Value• |
| | | Shares | ($000) |
| Common Stocks (100.0%) | | |
| Chemicals (66.9%) | | |
| | Dow Chemical Co. | 2,106,405 | 112,798 |
| | EI du Pont de Nemours | | |
| | & Co. | 1,606,584 | 106,211 |
| | Monsanto Co. | 916,964 | 106,047 |
| | LyondellBasell Industries | | |
| | NV Class A | 784,127 | 89,665 |
| | Praxair Inc. | 512,541 | 67,425 |
| | Ecolab Inc. | 472,742 | 54,280 |
| | PPG Industries Inc. | 241,874 | 49,792 |
| | Air Products & Chemicals | | |
| | Inc. | 371,385 | 49,472 |
| | Sherwin-Williams Co. | 148,188 | 32,321 |
| | Mosaic Co. | 565,235 | 26,996 |
| | CF Industries Holdings Inc. | 91,102 | 23,474 |
| | Eastman Chemical Co. | 264,503 | 21,814 |
| | Sigma-Aldrich Corp. | 207,944 | 21,626 |
| | Celanese Corp. Class A | 272,645 | 17,051 |
| | FMC Corp. | 232,883 | 15,403 |
| | International Flavors & | | |
| | Fragrances Inc. | 142,235 | 14,450 |
| | Ashland Inc. | 129,537 | 13,889 |
| | Airgas Inc. | 116,947 | 12,909 |
| * | WR Grace & Co. | 126,880 | 12,565 |
| | Valspar Corp. | 140,523 | 11,349 |
| | RPM International Inc. | 232,997 | 10,981 |
| | Rockwood Holdings Inc. | 126,996 | 10,284 |
| | Huntsman Corp. | 360,882 | 9,704 |
| | Albemarle Corp. | 139,168 | 8,848 |
| | Westlake Chemical Corp. | 81,705 | 7,936 |
| | NewMarket Corp. | 17,990 | 7,320 |
| | PolyOne Corp. | 164,531 | 6,453 |
| | Cabot Corp. | 112,770 | 6,178 |
| | Cytec Industries Inc. | 59,642 | 6,145 |
| | Axiall Corp. | 122,332 | 5,087 |
| | Sensient Technologies | | |
| | Corp. | 86,411 | 4,849 |
| | Scotts Miracle-Gro Co. | | |
| | Class A | 80,321 | 4,637 |
| * | Chemtura Corp. | 168,104 | 4,150 |
| | HB Fuller Co. | 87,628 | 4,122 |
| | Minerals Technologies Inc. | 60,331 | 3,778 |
| | Olin Corp. | 138,277 | 3,774 |
| | Tronox Ltd. Class A | 109,404 | 3,321 |
| | Balchem Corp. | 53,247 | 2,739 |
| * | Flotek Industries Inc. | 89,429 | 2,486 |
| * | Rayonier Advanced | | |
| | Materials Inc. | 73,715 | 2,448 |
| | Innophos Holdings Inc. | 38,322 | 2,228 |
| | A Schulman Inc. | 51,071 | 1,983 |
| * | Ferro Corp. | 136,814 | 1,844 |
| | Quaker Chemical Corp. | 23,197 | 1,809 |
| | Innospec Inc. | 42,842 | 1,807 |
| * | Calgon Carbon Corp. | 84,046 | 1,785 |
| | | |
| | | | Market |
| | | | Value• |
| | | Shares | ($000) |
| | Stepan Co. | 35,282 | 1,704 |
| * | Intrepid Potash Inc. | 99,853 | 1,531 |
| | OM Group Inc. | 56,163 | 1,494 |
| * | LSB Industries Inc. | 33,565 | 1,344 |
| | Koppers Holdings Inc. | 35,914 | 1,333 |
| * | Taminco Corp. | 52,593 | 1,260 |
| * | Kraton Performance | | |
| | Polymers Inc. | 57,316 | 1,165 |
| * | Rentech Inc. | 394,581 | 884 |
| | Tredegar Corp. | 39,646 | 825 |
| * | OMNOVA Solutions Inc. | 82,096 | 689 |
| | Kronos Worldwide Inc. | 40,608 | 642 |
| | Hawkins Inc. | 16,761 | 617 |
| | American Vanguard Corp. | 45,076 | 606 |
| * | Landec Corp. | 44,122 | 579 |
| | FutureFuel Corp. | 41,534 | 578 |
| | Zep Inc. | 34,145 | 542 |
| | | | 1,002,026 |
| Construction Materials (2.5%) | |
| | Vulcan Materials Co. | 228,778 | 14,500 |
| | Martin Marietta Materials | | |
| | Inc. | 98,792 | 12,938 |
| | Eagle Materials Inc. | 83,217 | 8,481 |
| * | Headwaters Inc. | 128,440 | 1,668 |
| | United States Lime & | | |
| | Minerals Inc. | 3,882 | 242 |
| | | | 37,829 |
| Containers & Packaging (9.0%) | |
| | Ball Corp. | 231,814 | 14,859 |
| | Sealed Air Corp. | 358,727 | 12,950 |
| | MeadWestvaco Corp. | 293,824 | 12,634 |
| | Rock-Tenn Co. Class A | 251,080 | 12,343 |
| * | Crown Holdings Inc. | 242,392 | 11,700 |
| | Packaging Corp. of America | 171,966 | 11,692 |
| * | Owens-Illinois Inc. | 288,650 | 8,888 |
| | Avery Dennison Corp. | 166,455 | 8,012 |
| | AptarGroup Inc. | 114,544 | 7,348 |
| | Sonoco Products Co. | 178,473 | 7,346 |
| * | Graphic Packaging Holding | | |
| | Co. | 571,732 | 7,313 |
| | Bemis Co. Inc. | 176,319 | 7,183 |
| * | Berry Plastics Group Inc. | 205,600 | 4,957 |
| | Silgan Holdings Inc. | 77,844 | 3,919 |
| | Greif Inc. Class A | 44,896 | 2,150 |
| | Myers Industries Inc. | 49,239 | 971 |
| | | | 134,265 |
| Metals & Mining (17.4%) | | |
| | Freeport-McMoRan Inc. | 1,817,182 | 66,091 |
| | Alcoa Inc. | 2,050,834 | 34,064 |
| | Nucor Corp. | 557,150 | 30,264 |
| | Newmont Mining Corp. | 871,790 | 23,617 |
| | United States Steel Corp. | 253,045 | 9,780 |
| | Reliance Steel & | | |
| | Aluminum Co. | 135,926 | 9,504 |
| | | |
| | | | Market |
| | | | Value• |
| | | Shares | ($000) |
| | Steel Dynamics Inc. | 390,650 | 9,079 |
| | Royal Gold Inc. | 113,290 | 8,808 |
| | Allegheny Technologies Inc. | 189,869 | 8,007 |
| | US Silica Holdings Inc. | 94,019 | 6,752 |
| | Compass Minerals | | |
| | International Inc. | 58,651 | 5,224 |
| | Carpenter Technology Corp. | 92,837 | 5,081 |
| * | Stillwater Mining Co. | 209,523 | 3,889 |
| | Cliffs Natural Resources Inc. | 254,466 | 3,835 |
| | Worthington Industries Inc. | 90,956 | 3,678 |
| | Commercial Metals Co. | 195,597 | 3,380 |
| | TimkenSteel Corp. | 64,769 | 3,095 |
| * | SunCoke Energy Inc. | 122,033 | 2,930 |
| * | AK Steel Holding Corp. | 239,110 | 2,611 |
| | Kaiser Aluminum Corp. | 31,444 | 2,533 |
| * | Century Aluminum Co. | 93,202 | 2,328 |
| | Globe Specialty Metals Inc. | 103,484 | 2,126 |
| | Hecla Mining Co. | 599,981 | 1,962 |
| * | Horsehead Holding Corp. | 88,680 | 1,790 |
| * | RTI International Metals Inc. | 50,727 | 1,472 |
| * | Coeur Mining Inc. | 181,091 | 1,434 |
| | Schnitzer Steel Industries | | |
| | Inc. | 45,769 | 1,267 |
| | Materion Corp. | 34,795 | 1,135 |
| * | McEwen Mining Inc. | 389,701 | 1,080 |
| | Haynes International Inc. | 21,624 | 1,072 |
| *,^ | Allied Nevada Gold Corp. | 173,143 | 661 |
| | Walter Energy Inc. | 115,102 | 643 |
| *,^ | Molycorp Inc. | 342,361 | 613 |
| | Gold Resource Corp. | 65,536 | 406 |
| | Olympic Steel Inc. | 15,955 | 384 |
| * | AM Castle & Co. | 27,902 | 273 |
| | | | 260,868 |
| Paper & Forest Products (4.2%) | | |
| | International Paper Co. | 719,960 | 34,882 |
| * | KapStone Paper and | | |
| | Packaging Corp. | 150,976 | 4,641 |
| | Domtar Corp. | 112,155 | 4,182 |
| * | Louisiana-Pacific Corp. | 246,372 | 3,516 |
| * | Clearwater Paper Corp. | 35,665 | 2,468 |
| | Schweitzer-Mauduit | | |
| | International Inc. | 53,342 | 2,285 |
| * | Resolute Forest Products | | |
| | Inc. | 115,798 | 1,991 |
| | PH Glatfelter Co. | 75,151 | 1,874 |
| * | Boise Cascade Co. | 58,874 | 1,770 |
| | Neenah Paper Inc. | 28,963 | 1,583 |
| | Deltic Timber Corp. | 20,050 | 1,328 |
| * | Mercer International Inc. | 78,290 | 786 |
| | Wausau Paper Corp. | 73,628 | 671 |
| | | | 61,977 |
| Total Common Stocks | | |
| (Cost $1,241,898) | | 1,496,965 |
85
Materials Index Fund
| | |
| | | Market |
| | | Value• |
| | Shares | ($000) |
| Temporary Cash Investment (0.0%) | |
| Money Market Fund (0.0%) | | |
| 1,2 Vanguard Market | | |
| Liquidity Fund, 0.113% | | |
| (Cost $169) | 169,000 | 169 |
| Total Investments (100.0%) | | |
| (Cost $1,242,067) | | 1,497,134 |
| Other Assets and Liabilities (0.0%) | |
| Other Assets | | 10,551 |
| Liabilities2 | | (10,659) |
| | | (108) |
| Net Assets (100%) | | 1,497,026 |
At August 31, 2014, net assets consisted of:
| |
| | Amount |
| | ($000) |
| Paid-in Capital | 1,266,947 |
| Undistributed Net Investment Income | 15,285 |
| Accumulated Net Realized Losses | (40,273) |
| Unrealized Appreciation (Depreciation) | 255,067 |
| Net Assets | 1,497,026 |
| |
| |
| Admiral Shares—Net Assets | |
| Applicable to 3,017,536 outstanding | |
| $.001 par value shares of beneficial | |
| interest (unlimited authorization) | 174,524 |
| Net Asset Value Per Share— | |
| Admiral Shares | $57.84 |
| |
| |
| ETF Shares—Net Assets | |
| Applicable to 11,652,042 outstanding | |
| $.001 par value shares of beneficial | |
| interest (unlimited authorization) | 1,322,502 |
| Net Asset Value Per Share— | |
| ETF Shares | $113.50 |
• See Note A in Notes to Financial Statements.
* Non-income-producing security.
^ Includes partial security positions on loan to broker-dealers. The total value of securities on loan is $157,000.
1 Affiliated money market fund available only to Vanguard funds and certain trusts and accounts managed by Vanguard. Rate shown is the 7-day yield.
2 Includes $169,000 of collateral received for securities on loan.
See accompanying Notes, which are an integral part of the Financial Statements.
86
Materials Index Fund
Statement of Operations
| |
| | Year Ended |
| August 31, 2014 |
| | ($000) |
| Investment Income | |
| Income | |
| Dividends | 24,741 |
| Interest1 | 1 |
| Securities Lending | 130 |
| Total Income | 24,872 |
| Expenses | |
| The Vanguard Group—Note B | |
| Investment Advisory Services | 198 |
| Management and Administrative— | |
| Admiral Shares | 133 |
| Management and Administrative— | |
| ETF Shares | 809 |
| Marketing and Distribution— | |
| Admiral Shares | 23 |
| Marketing and Distribution— | |
| ETF Shares | 205 |
| Custodian Fees | 11 |
| Auditing Fees | 32 |
| Shareholders’ Reports—Admiral Shares | 1 |
| Shareholders’ Reports—ETF Shares | 78 |
| Trustees’ Fees and Expenses | 1 |
| Total Expenses | 1,491 |
| Net Investment Income | 23,381 |
| Realized Net Gain (Loss) on | |
| Investment Securities Sold | 46,571 |
| Change in Unrealized Appreciation | |
| (Depreciation) of Investment Securities | 215,169 |
| Net Increase (Decrease) in Net Assets | |
| Resulting from Operations | 285,121 |
Statement of Changes in Net Assets
| | |
| | Year Ended August 31, |
| | 2014 | 2013 |
| | ($000) | ($000) |
| Increase (Decrease) in Net Assets | | |
| Operations | | |
| Net Investment Income | 23,381 | 20,471 |
| Realized Net Gain (Loss) | 46,571 | 26,138 |
| Change in Unrealized Appreciation (Depreciation) | 215,169 | 78,706 |
| Net Increase (Decrease) in Net Assets Resulting from Operations | 285,121 | 125,315 |
| Distributions | | |
| Net Investment Income | | |
| Admiral Shares | (2,782) | (2,309) |
| ETF Shares | (17,757) | (13,282) |
| Realized Capital Gain | | |
| Admiral Shares | — | — |
| ETF Shares | — | — |
| Total Distributions | (20,539) | (15,591) |
| Capital Share Transactions | | |
| Admiral Shares | 1,431 | (945) |
| ETF Shares | 296,361 | 60,420 |
| Net Increase (Decrease) from Capital Share Transactions | 297,792 | 59,475 |
| Total Increase (Decrease) | 562,374 | 169,199 |
| Net Assets | | |
| Beginning of Period | 934,652 | 765,453 |
| End of Period2 | 1,497,026 | 934,652 |
1 Interest income from an affiliated company of the fund was $1,000.
2 Net Assets—End of Period includes undistributed (overdistributed) net investment income of $15,285,000 and $12,443,000
See accompanying Notes, which are an integral part of the Financial Statements.
87
Materials Index Fund
Financial Highlights
| | | | | |
| Admiral Shares | | | | | |
| |
| For a Share Outstanding | Year Ended August 31, |
| Throughout Each Period | 2014 | 2013 | 2012 | 2011 | 2010 |
| Net Asset Value, Beginning of Period | $46.34 | $40.66 | $39.53 | $33.32 | $30.68 |
| Investment Operations | | | | | |
| Net Investment Income | .936 | 1.014 | .783 | . 579 | .9711 |
| Net Realized and Unrealized Gain (Loss) | | | | | |
| on Investments | 11.528 | 5.464 | 1.151 | 6.551 | 2.128 |
| Total from Investment Operations | 12.464 | 6.478 | 1.934 | 7.130 | 3.099 |
| Distributions | | | | | |
| Dividends from Net Investment Income | (. 964) | (.798) | (. 804) | (. 920) | (. 459) |
| Distributions from Realized Capital Gains | — | — | — | — | — |
| Total Distributions | (. 964) | (.798) | (. 804) | (. 920) | (. 459) |
| Net Asset Value, End of Period | $57.84 | $46.34 | $40.66 | $39.53 | $33.32 |
| |
| Total Return2 | 27.18% | 16.12% | 5.10% | 21.26% | 10.07% |
| |
| Ratios/Supplemental Data | | | | | |
| Net Assets, End of Period (Millions) | $175 | $139 | $123 | $138 | $97 |
| Ratio of Total Expenses to Average Net Assets | 0.12% | 0.14% | 0.14% | 0.19% | 0.24% |
| Ratio of Net Investment Income to | | | | | |
| Average Net Assets | 1.88% | 2.32% | 1.93% | 1.63% | 2.81%1 |
| Portfolio Turnover Rate3 | 4% | 7% | 7% | 14% | 10% |
1 Net investment income per share and the ratio of net investment income to average net assets include $.417 and 1.14%, respectively,
resulting from a special dividend from Weyerhaeuser Co. in July 2010.
2 Total returns do not include transaction or account service fees that may have applied in the periods shown. Fund prospectuses provide
information about any applicable transaction and account service fees.
3 Excludes the value of portfolio securities received or delivered as a result of in-kind purchases or redemptions of the fund’s capital shares,
including ETF Creation Units.
| | | | | |
| ETF Shares | | | | | |
| |
| For a Share Outstanding | Year Ended August 31, |
| Throughout Each Period | 2014 | 2013 | 2012 | 2011 | 2010 |
| Net Asset Value, Beginning of Period | $90.94 | $79.81 | $77.59 | $65.40 | $60.23 |
| Investment Operations | | | | | |
| Net Investment Income | 1.847 | 1.993 | 1.537 | 1.142 | 1.9071 |
| Net Realized and Unrealized Gain (Loss) | | | | | |
| on Investments | 22.612 | 10.708 | 2.259 | 12.852 | 4.186 |
| Total from Investment Operations | 24.459 | 12.701 | 3.796 | 13.994 | 6.093 |
| Distributions | | | | | |
| Dividends from Net Investment Income | (1.899) | (1.571) | (1.576) | (1.804) | (. 923) |
| Distributions from Realized Capital Gains | — | — | — | — | — |
| Total Distributions | (1.899) | (1.571) | (1.576) | (1.804) | (. 923) |
| Net Asset Value, End of Period | $113.50 | $90.94 | $79.81 | $77.59 | $65.40 |
| |
| Total Return | 27.17% | 16.08% | 5.09% | 21.26% | 10.07% |
| |
| Ratios/Supplemental Data | | | | | |
| Net Assets, End of Period (Millions) | $1,323 | $796 | $642 | $593 | $415 |
| Ratio of Total Expenses to Average Net Assets | 0.12% | 0.14% | 0.14% | 0.19% | 0.24% |
| Ratio of Net Investment Income to | | | | | |
| Average Net Assets | 1.88% | 2.32% | 1.93% | 1.63% | 2.81%1 |
| Portfolio Turnover Rate2 | 4% | 7% | 7% | 14% | 10% |
1 Net investment income per share and the ratio of net investment income to average net assets include $.819 and 1.14%, respectively,resulting from a special dividend from Weyerhaeuser Co. in July 2010.2 Excludes the value of portfolio securities received or delivered as a result of in-kind purchases or redemptions of the fund’s capital shares,including ETF Creation Units.See accompanying Notes, which are an integral part of the Financial Statements.
88
Materials Index Fund
Notes to Financial Statements
Vanguard Materials Index Fund is registered under the Investment Company Act of 1940 as an open-end investment company, or mutual fund. The fund offers two classes of shares: Admiral Shares and ETF Shares. Admiral Shares are designed for investors who meet certain administrative, service, and account-size criteria. ETF Shares are listed for trading on NYSE Arca; they can be purchased and sold through a broker.
A. The following significant accounting policies conform to generally accepted accounting principles for U.S. investment companies. The fund consistently follows such policies in preparing its financial statements.
1. Security Valuation: Securities are valued as of the close of trading on the New York Stock Exchange (generally 4 p.m., Eastern time) on the valuation date. Equity securities are valued at the latest quoted sales prices or official closing prices taken from the primary market in which each security trades; such securities not traded on the valuation date are valued at the mean of the latest quoted bid and asked prices. Securities for which market quotations are not readily available, or whose values have been materially affected by events occurring before the fund’s pricing time but after the close of the securities’ primary markets, are valued by methods deemed by the board of trustees to represent fair value. Investments in Vanguard Market Liquidity Fund are valued at that fund’s net asset value.
2. Federal Income Taxes: The fund intends to continue to qualify as a regulated investment company and distribute all of its taxable income. Management has analyzed the fund’s tax positions taken for all open federal income tax years (August 31, 2011–2014), and has concluded that no provision for federal income tax is required in the fund’s financial statements.
3. Distributions: Distributions to shareholders are recorded on the ex-dividend date.
4. Securities Lending: To earn additional income, the fund lends its securities to qualified institutional borrowers. Security loans are required to be secured at all times by collateral in an amount at least equal to the market value of securities loaned. Daily market fluctuations could cause the value of loaned securities to be more or less than the value of the collateral received. When this occurs, the collateral is adjusted and settled on the next business day. The fund further mitigates its counterparty risk by entering into securities lending transactions only with a diverse group of prequalified counterparties, monitoring their financial strength, and entering into master securities lending agreements with its counterparties. The master securities lending agreements provide that, in the event of a counterparty’s default (including bankruptcy), the fund may terminate any loans with that borrower, determine the net amount owed, and sell or retain the collateral up to the net amount owed to the fund; however, such actions may be subject to legal proceedings. While collateral mitigates counterparty risk, in the absence of a default the fund may experience delays and costs in recovering the securities loaned. The fund invests cash collateral received in Vanguard Market Liquidity Fund, and records a liability in the Statement of Net Assets for the return of the collateral, during the period the securities are on loan. Securities lending income represents fees charged to borrowers plus income earned on invested cash collateral, less expenses associated with the loan.
5. Credit Facility: The fund and certain other funds managed by The Vanguard Group participate in a $2.89 billion committed credit facility provided by a syndicate of lenders pursuant to a credit agreement that may be renewed annually; each fund is individually liable for its borrowings, if any, under the credit facility. Borrowings may be utilized for temporary and emergency purposes, and are subject to the fund’s regulatory and contractual borrowing restrictions. The participating funds are charged administrative fees and an annual commitment fee of 0.06% of the undrawn amount of the facility; these fees are allocated to the funds based on a method approved by the fund’s board of trustees and included in Management and Administrative expenses on the fund’s Statement of Operations. Any borrowings under this facility bear interest at a rate equal to the higher of the federal funds rate or LIBOR reference rate plus an agreed-upon spread.
The fund had no borrowings outstanding at August 31, 2014, or at any time during the period then ended.
6. Other: Dividend income is recorded on the ex-dividend date. Interest income includes income distributions received from Vanguard Market Liquidity Fund and is accrued daily. Security transactions are accounted for on the date securities are bought or sold. Costs used to determine realized gains (losses) on the sale of investment securities are those of the specific securities sold.
89
Materials Index Fund
Each class of shares has equal rights as to assets and earnings, except that each class separately bears certain class-specific expenses related to maintenance of shareholder accounts (included in Management and Administrative expenses) and shareholder reporting. Marketing and distribution expenses are allocated to each class of shares based on a method approved by the board of trustees. Income, other non-class-specific expenses, and gains and losses on investments are allocated to each class of shares based on its relative net assets.
B. The Vanguard Group furnishes at cost investment advisory, corporate management, administrative, marketing, and distribution services. The costs of such services are allocated to the fund based on methods approved by the board of trustees. The fund has committed to provide up to 0.40% of its net assets in capital contributions to Vanguard. At August 31, 2014, the fund had contributed capital of $147,000 to Vanguard (included in Other Assets), representing 0.01% of the fund’s net assets and 0.06% of Vanguard’s capitalization. The fund’s trustees and officers are also directors and officers of Vanguard.
C. Various inputs may be used to determine the value of the fund’s investments. These inputs are summarized in three broad levels for financial statement purposes. The inputs or methodologies used to value securities are not necessarily an indication of the risk associated with investing in those securities.
Level 1—Quoted prices in active markets for identical securities.
Level 2—Other significant observable inputs (including quoted prices for similar securities, interest rates, prepayment speeds, credit risk, etc.).
Level 3—Significant unobservable inputs (including the fund’s own assumptions used to determine the fair value of investments).
At August 31, 2014, 100% of the market value of the fund’s investments was determined based on Level 1 inputs.
D. Distributions are determined on a tax basis and may differ from net investment income and realized capital gains for financial reporting purposes. Differences may be permanent or temporary. Permanent differences are reclassified among capital accounts in the financial statements to reflect their tax character. Temporary differences arise when certain items of income, expense, gain, or loss are recognized in different periods for financial statement and tax purposes. These differences will reverse at some time in the future. Differences in classification may also result from the treatment of short-term gains as ordinary income for tax purposes.
During the year ended August 31, 2014, the fund realized $45,839,000 of net capital gains resulting from in-kind redemptions—in which shareholders exchanged fund shares for securities held by the fund rather than for cash. Because such gains are not taxable to the fund, and are not distributed to shareholders, they have been reclassified from accumulated net realized losses to paid-in capital.
For tax purposes, at August 31, 2014, the fund had $15,959,000 of ordinary income available for distribution. The fund used capital loss carryforwards of $1,031,000 to offset taxable capital gains realized during the year ended August 31, 2014. At August 31, 2014, the fund had available capital losses totaling $40,272,000 to offset future net capital gains. Of this amount, $39,879,000 is subject to expiration dates; $18,746,000 may be used to offset future net capital gains through August 31, 2018, and $21,133,000 through August 31, 2019. Capital losses of $393,000 realized beginning in fiscal 2012 may be carried forward indefinitely under the Regulated Investment Company Modernization Act of 2010, but must be used before any expiring loss carryforwards.
At August 31, 2014, the cost of investment securities for tax purposes was $1,242,067,000. Net unrealized appreciation of investment securities for tax purposes was $255,067,000, consisting of unrealized gains of $349,925,000 on securities that had risen in value since their purchase and $94,858,000 in unrealized losses on securities that had fallen in value since their purchase.
E. During the year ended August 31, 2014, the fund purchased $467,273,000 of investment securities and sold $166,674,000 of investment securities, other than temporary cash investments. Purchases and sales include $390,607,000 and $114,817,000, respectively, in connection with in-kind purchases and redemptions of the fund’s capital shares.
90
Materials Index Fund
F. Capital share transactions for each class of shares were:
| | | | |
| | Year Ended August 31, |
| | | 2014 | | | 2013 |
| | Amount | Shares | Amount | Shares |
| | ($000) | (000) | ($000) | (000) |
| Admiral Shares | | | | |
| Issued | 37,288 | 704 | 30,574 | 686 |
| Issued in Lieu of Cash Distributions | 2,322 | 46 | 2,029 | 48 |
| Redeemed | (38,179) | (729) | (33,548) | (764) |
| Net Increase (Decrease) —Admiral Shares | 1,431 | 21 | (945) | (30) |
| ETF Shares | | | | |
| Issued | 411,198 | 4,001 | 139,315 | 1,601 |
| Issued in Lieu of Cash Distributions | — | — | — | — |
| Redeemed | (114,837) | (1,100) | (78,895) | (900) |
| Net Increase (Decrease)—ETF Shares | 296,361 | 2,901 | 60,420 | 701 |
G. Management has determined that no material events or transactions occurred subsequent to August 31, 2014, that would require recognition or disclosure in these financial statements.
91
Telecommunication Services Index Fund
Fund Profile
As of August 31, 2014
| | |
| Share-Class Characteristics | |
| | Admiral | ETF |
| | Shares | Shares |
| Ticker Symbol | VTCAX | VOX |
| Expense Ratio1 | 0.14% | 0.14% |
| 30-Day SEC Yield | 3.14% | 3.14% |
| | | |
| Portfolio Characteristics | | |
| | | MSCI | |
| | | US IMI/ | |
| | | Telecom | MSCI |
| | | Services | US IMI/ |
| | Fund | 25/50 | 2500 |
| Number of Stocks | 30 | 29 | 2,499 |
| Median Market Cap | $23.5B | $23.5B | $48.7B |
| Price/Earnings Ratio | 17.9x | 17.9x | 20.7x |
| Price/Book Ratio | 2.7x | 2.7x | 2.7x |
| Return on Equity | 13.4% | 13.4% | 18.0% |
| Earnings Growth Rate | 5.5% | 5.5% | 15.2% |
| Dividend Yield | 3.4% | 3.4% | 1.9% |
| Foreign Holdings | 0.0% | 0.0% | 0.0% |
| Turnover Rate | 19% | — | — |
| Short-Term Reserves | 0.1% | — | — |
| | |
| Volatility Measures | | |
| | MSCI US | |
| | IMI/Telecom | |
| | Services | MSCI US |
| | 25/50 | IMI/2500 |
| R-Squared | 1.00 | 0.30 |
| Beta | 1.01 | 0.53 |
| These measures show the degree and timing of the fund’s fluctuations compared with the indexes over 36 months. |
|
| |
| Subindustry Diversification | |
| (% of equity exposure) | |
| |
| Alternative Carriers | 18.2% |
| Integrated Telecommunication Services | 64.7 |
| Wireless Telecommunication Services | 16.9 |
| Other | 0.2 |
| | |
| Ten Largest Holdings (% of total net assets) |
| |
| Verizon | Integrated | |
| Communications | Telecommunication | |
| Inc. | Services | 22.5% |
| AT&T Inc. | Integrated | |
| | Telecommunication | |
| | Services | 22.5 |
| SBA | Wireless | |
| Communications | Telecommunication | |
| Corp. | Services | 4.4 |
| CenturyLink Inc. | Integrated | |
| | Telecommunication | |
| | Services | 4.4 |
| Level 3 | | |
| Communications | | |
| Inc. | Alternative Carriers | 3.1 |
| Windstream | Integrated | |
| Holdings Inc. | Telecommunication | |
| | Services | 3.0 |
| Frontier | Integrated | |
| Communications | Telecommunication | |
| Corp. | Services | 3.0 |
| T-Mobile US Inc. | Wireless | |
| | Telecommunication | |
| | Services | 2.9 |
| tw telecom inc | Alternative Carriers | 2.8 |
| Sprint Corp. | Wireless | |
| | Telecommunication | |
| | Services | 2.0 |
| Top Ten Total | | 70.6% |
| The holdings listed exclude any temporary cash investments and equity index products. |
|
1 The expense ratios shown are from the prospectus dated December 23, 2013, and represent estimated costs for the current fiscal year. For the fiscal year ended August 31, 2014, the expense ratios were 0.12% for
Admiral Shares and 0.12% for ETF Shares.
92
Telecommunication Services Index Fund
Performance Summary
All of the returns in this report represent past performance, which is not a guarantee of future results that may be achieved by the fund. (Current performance may be lower or higher than the performance data cited. For performance data current to the most recent month-end, visit our website at vanguard.com/performance.) Note, too, that both investment returns and principal value can fluctuate widely, so an investor’s shares, when sold, could be worth more or less than their original cost. The returns shown do not reflect taxes that a shareholder would pay on fund distributions or on the sale of fund shares.
Cumulative Performance: September 23, 2004–August 31, 2014
Initial Investment of $10,000
| | | | |
| | | Average Annual Total Returns | |
| | Periods Ended August 31, 2014 | |
| | | | Since | Final Value |
| | | | Inception | of a $10,000 |
| | One Year | Five Years | (9/23/2004) | Investment |
| Telecommunication Services Index Fund | | | | |
| ETF Shares Net Asset Value | 17.08% | 15.48% | 8.90% | $23,326 |
| Telecommunication Services Index Fund | | | | |
| ETF Shares Market Price | 17.11 | 15.49 | 8.90 | 23,325 |
| Spliced US IMI/Telecommunication | | | | |
| Services 25/50 | 17.00 | 14.65 | 7.92 | 21,330 |
| Telecommunication Funds Average | 18.89 | 13.31 | 6.29 | 18,328 |
| MSCI US IMI/2500 | 24.94 | 17.33 | 9.02 | 23,578 |
For a benchmark description, see the Glossary.
Telecommunication Funds Average: Derived from data provided by Lipper, a Thomson Reuters Company.
“Since Inception” performance is calculated from the ETF Shares’ inception date for both the fund and its comparative standards.
| | | | |
| | | | Since | Final Value |
| | | | Inception | of a $100,000 |
| | One Year | Five Years | (3/11/2005) | Investment |
| Telecommunication Services Index Fund | | | | |
| Admiral Shares | 17.13% | 15.49% | 8.57% | $217,991 |
| Spliced US IMI/Telecommunication Services 25/50 | 17.00 | 14.65 | 7.92 | 205,816 |
| MSCI US IMI/2500 | 24.94 | 17.33 | 8.37 | 214,122 |
| “Since Inception” performance is calculated from the Admiral Shares’ inception date for both the fund and its comparative standards. |
See Financial Highlights for dividend and capital gains information.
93
Telecommunication Services Index Fund
Fiscal-Year Total Returns (%): September 23, 2004–August 31, 2014
For a benchmark description, see the Glossary.
| | | |
| Cumulative Returns: ETF Shares, September 23, 2004–August 31, 2014 | | |
| | | | Since |
| | | | Inception |
| | One Year | Five Years | (9/23/2004) |
| Telecommunication Services Index Fund ETF Shares Market Price | 17.11% | 105.43% | 133.25% |
| Telecommunication Services Index Fund ETF Shares Net Asset Value | 17.08 | 105.34 | 133.26 |
| Spliced US IMI/Telecommunication Services 25/50 | 17.00 | 98.12 | 113.30 |
| “Since Inception” performance is calculated from the ETF Shares’ inception date for both the fund and its comparative standards. |
Average Annual Total Returns: Periods Ended June 30, 2014
This table presents total returns through the latest calendar quarter—rather than through the end of the fiscal
period. Securities and Exchange Commission rules require that we provide this information.
| | | | |
| | | | | Since |
| | Inception Date | One Year | Five Years | Inception |
| ETF Shares | 9/23/2004 | | | |
| Market Price | | 15.87% | 15.76% | 8.99% |
| Net Asset Value | | 15.91 | 15.77 | 8.99 |
| Admiral Shares | 3/11/2005 | 15.94 | 15.79 | 8.67 |
See Financial Highlights for dividend and capital gains information.
94
Telecommunication Services Index Fund
Financial Statements
Statement of Net Assets
As of August 31, 2014
The fund reports a complete list of its holdings in regulatory filings four times in each fiscal year, at the quarter-ends. For the second and fourth fiscal quarters, the lists appear in the fund’s semiannual and annual reports to shareholders. For the first and third fiscal quarters, the fund files the lists with the Securities and Exchange Commission on Form N-Q. Shareholders can look up the fund’s Forms N-Q on the SEC’s website at sec.gov. Forms N-Q may also be reviewed and copied at the SEC’s Public Reference Room (see the back cover of this report for further information).
| | | |
| | | | Market |
| | | | Value• |
| | | Shares | ($000) |
| Common Stocks (100.0%) | | |
| Diversified Telecommunication Services (82.9%) |
| | Alternative Carriers (18.2%) | |
| * | Level 3 Communications | | |
| | Inc. | 532,785 | 23,954 |
| * | tw telecom inc Class A | 530,669 | 21,776 |
| *,^ | Iridium Communications | | |
| | Inc. | 1,491,781 | 14,023 |
| * | inContact Inc. | 1,384,551 | 12,682 |
| | Cogent Communications | | |
| | Holdings Inc. | 357,668 | 12,397 |
| * | 8x8 Inc. | 1,590,103 | 12,355 |
| * | Premiere Global Services | | |
| | Inc. | 868,495 | 11,438 |
| * | Vonage Holdings Corp. | 3,198,521 | 11,035 |
| | Lumos Networks Corp. | 722,961 | 10,577 |
| *,^ | magicJack VocalTec Ltd. | 756,767 | 9,490 |
| |
| | Integrated Telecommunication Services (64.7%) |
| | Verizon Communications | | |
| | Inc. | 3,470,094 | 172,880 |
| | AT&T Inc. | 4,942,118 | 172,776 |
| | CenturyLink Inc. | 826,428 | 33,875 |
| | Windstream Holdings Inc. | 2,071,223 | 23,405 |
| | Frontier Communications | | |
| | Corp. | 3,403,225 | 23,142 |
| | Consolidated | | |
| | Communications | | |
| | Holdings Inc. | 590,310 | 14,392 |
| | Atlantic Tele-Network Inc. | 206,626 | 12,116 |
| * | Hawaiian Telcom Holdco | | |
| | Inc. | 424,643 | 11,678 |
| * | Cincinnati Bell Inc. | 3,119,398 | 11,448 |
| | IDT Corp. Class B | 702,207 | 11,032 |
| * | General Communication | | |
| | Inc. Class A | 968,411 | 10,885 |
| | | | 637,356 |
| Other (0.2%)1 | | |
| * | Leap Wireless | | |
| | International Inc CVR | 577,114 | 1,454 |
| | | |
| | | | Market |
| | | | Value• |
| | | Shares | ($000) |
| Wireless Telecommunication Services (16.9%) |
| * | SBA Communications | | |
| | Corp. Class A | 309,950 | 34,184 |
| * | T-Mobile US Inc. | 732,993 | 22,049 |
| * | Sprint Corp. | 2,733,046 | 15,332 |
| | Telephone & Data | | |
| | Systems Inc. | 544,870 | 14,352 |
| | Shenandoah | | |
| | Telecommunications Co. | 444,605 | 12,280 |
| | Spok Holdings Inc. | 770,197 | 11,399 |
| | NTELOS Holdings Corp. | 775,625 | 10,231 |
| * | United States Cellular Corp. | 270,791 | 10,214 |
| | | | 130,041 |
| Total Common Stocks | | |
| (Cost $717,426) | | 768,851 |
| Temporary Cash Investments (0.4%) | |
| Money Market Fund (0.4%) | | |
| 2,3 | Vanguard Market | | |
| | Liquidity Fund, 0.113% | 2,892,000 | 2,892 |
| |
| | | Face | |
| | | Amount | |
| | | ($000 | |
| U.S. Government and Agency Obligations (0.0%) |
| 4 | Fannie Mae | | |
| | Discount Notes, | | |
| | 0.080%, 9/3/14 | 200 | 200 |
| Total Temporary Cash Investments | |
| (Cost $3,091) | | 3,092 |
| Total Investments (100.4%) | | |
| (Cost $720,517) | | 771,943 |
| Other Assets and Liabilities (–0.4%) | |
| Other Assets | | 6,738 |
| Liabilities3 | | (9,881) |
| | | | (3,143) |
| Net Assets (100%) | | 768,800 |
| |
| At August 31, 2014, net assets consisted of: |
| | Amount |
| | ($000) |
| Paid-in Capital | 774,504 |
| Undistributed Net Investment Income | 14,121 |
| Accumulated Net Realized Losses | (71,251) |
| Unrealized Appreciation (Depreciation) | 51,426 |
| Net Assets | 768,800 |
| |
| |
| Admiral Shares—Net Assets | |
| Applicable to 567,195 outstanding | |
| $.001 par value shares of beneficial | |
| interest (unlimited authorization) | 25,561 |
| Net Asset Value Per Share— | |
| Admiral Shares | $45.07 |
| |
| |
| ETF Shares—Net Assets | |
| Applicable to 8,403,838 outstanding | |
| $.001 par value shares of beneficial | |
| interest (unlimited authorization) | 743,239 |
| Net Asset Value Per Share— | |
| ETF Shares | $88.44 |
• See Note A in Notes to Financial Statements.
* Non-income-producing security.
^Includes partial security positions on loan to broker-dealers. The total value of securities on loan is $2,531,000.
1 “Other” represents securities that are not classified by the fund’s benchmark index.
2 Affiliated money market fund available only to Vanguard funds and certain trusts and accounts managed by Vanguard. Rate shown is the 7-day yield.
3 Includes $2,640,000 of collateral received for securities on loan.
4 The issuer was placed under federal conservatorship in September 2008; since that time, its daily operations have been managed by the Federal Housing Finance Agency and it receives capital from the
U.S. Treasury, as needed to maintain a positive net worth, in exchange for senior preferred stock.
See accompanying Notes, which are an integral part of the Financial Statements.
95
Telecommunication Services Index Fund
Statement of Operations
| |
| | Year Ended |
| August 31, 2014 |
| | ($000) |
| Investment Income | |
| Income | |
| Dividends | 22,005 |
| Interest1 | 1 |
| Securities Lending | 106 |
| Total Income | 22,112 |
| Expenses | |
| The Vanguard Group—Note B | |
| Investment Advisory Services | 104 |
| Management and Administrative— | |
| Admiral Shares | 20 |
| Management and Administrative— | |
| ETF Shares | 396 |
| Marketing and Distribution— | |
| Admiral Shares | 3 |
| Marketing and Distribution— | |
| ETF Shares | 131 |
| Custodian Fees | 9 |
| Auditing Fees | 32 |
| Shareholders’ Reports—Admiral Shares | — |
| Shareholders’ Reports—ETF Shares | 86 |
| Total Expenses | 781 |
| Net Investment Income | 21,331 |
| Realized Net Gain (Loss) | |
| Investment Securities Sold | 399 |
| Futures Contracts | 72 |
| Realized Net Gain (Loss) | 471 |
| Change in Unrealized Appreciation | |
| (Depreciation) | |
| Investment Securities | 74,721 |
| Futures Contracts | 1 |
| Change in Unrealized Appreciation | |
| (Depreciation) | 74,722 |
| Net Increase (Decrease) in Net Assets | |
| Resulting from Operations | 96,524 |
Statement of Changes in Net Assets
| | |
| | Year Ended August 31, |
| | 2014 | 2013 |
| | ($000) | ($000) |
| Increase (Decrease) in Net Assets | | |
| Operations | | |
| Net Investment Income | 21,331 | 24,456 |
| Realized Net Gain (Loss) | 471 | 61,827 |
| Change in Unrealized Appreciation (Depreciation) | 74,722 | (18,059) |
| Net Increase (Decrease) in Net Assets Resulting from Operations | 96,524 | 68,224 |
| Distributions | | |
| Net Investment Income | | |
| Admiral Shares | (927) | (678) |
| ETF Shares | (23,038) | (16,305) |
| Realized Capital Gain | | |
| Admiral Shares | — | — |
| ETF Shares | — | — |
| Total Distributions | (23,965) | (16,983) |
| Capital Share Transactions | | |
| Admiral Shares | 1,775 | (347) |
| ETF Shares | 162,554 | (62,644) |
| Net Increase (Decrease) from Capital Share Transactions | 164,329 | (62,991) |
| Total Increase (Decrease) | 236,888 | (11,750) |
| Net Assets | | |
| Beginning of Period | 531,912 | 543,662 |
| End of Period2 | 768,800 | 531,912 |
1 Interest income from an affiliated company of the fund was $1,000.
2 Net Assets—End of Period includes undistributed (overdistributed) net investment income of $14,121,000 and $16,755,000.
See accompanying Notes, which are an integral part of the Financial Statements.
96
Telecommunication Services Index Fund
Financial Highlights
| | | | | |
| Admiral Shares | | | | | |
| |
| For a Share Outstanding | Year Ended August 31, |
| Throughout Each Period | 2014 | 2013 | 2012 | 2011 | 2010 |
| Net Asset Value, Beginning of Period | $40.02 | $36.09 | $33.18 | $29.22 | $25.77 |
| Investment Operations | | | | | |
| Net Investment Income | 1.217 | 1.9061 | 1.0822 | 1.077 | 1.0242 |
| Net Realized and Unrealized Gain (Loss) | | | | | |
| on Investments | 5.486 | 3.284 | 2.845 | 3.853 | 3.183 |
| Total from Investment Operations | 6.703 | 5.190 | 3.927 | 4.930 | 4.207 |
| Distributions | | | | | |
| Dividends from Net Investment Income | (1.653) | (1.260) | (1.017) | (. 970) | (.757) |
| Distributions from Realized Capital Gains | — | — | — | — | — |
| Total Distributions | (1.653) | (1.260) | (1.017) | (. 970) | (.757) |
| Net Asset Value, End of Period | $45.07 | $40.02 | $36.09 | $33.18 | $29.22 |
| |
| Total Return 3 | 17.13% | 14.80% | 12.33% | 16.87% | 16.40% |
| |
| Ratios/Supplemental Data | | | | | |
| Net Assets, End of Period (Millions) | $26 | $21 | $19 | $20 | $14 |
| Ratio of Total Expenses to Average Net Assets | 0.12% | 0.14% | 0.14% | 0.19% | 0.24% |
| Ratio of Net Investment Income to | | | | | |
| Average Net Assets | 3.29% | 4.56%1 | 3.24% | 3.60% | 3.60% |
| Portfolio Turnover Rate4 | 19% | 19% | 28% | 21% | 23% |
1 Net investment income per share and the ratio of net investment income to average net assets include $.359 and 0.89%, respectively,resulting from a special dividend received in connection with a merger between T-Mobile US Inc. and MetroPCS Communications Inc. inMay 2013.2 Calculated based on average shares outstanding.3 Total returns do not include transaction or account service fees that may have applied in the periods shown. Fund prospectuses provideinformation about any applicable transaction and account service fees.4 Excludes the value of portfolio securities received or delivered as a result of in-kind purchases or redemptions of the fund’s capital shares,including ETF Creation Units.See accompanying Notes, which are an integral part of the Financial Statements.
97
Telecommunication Services Index Fund
Financial Highlights
| | | | | |
| ETF Shares | | | | | |
| |
| For a Share Outstanding | Year Ended August 31, |
| Throughout Each Period | 2014 | 2013 | 2012 | 2011 | 2010 |
| Net Asset Value, Beginning of Period | $78.54 | $70.82 | $65.11 | $57.34 | $50.58 |
| Investment Operations | | | | | |
| Net Investment Income | 2.394 | 3.7341 | 2.1052 | 2.118 | 1.9812 |
| Net Realized and Unrealized Gain (Loss) | | | | | |
| on Investments | 10.749 | 6.455 | 5.614 | 7.557 | 6.290 |
| Total from Investment Operations | 13.143 | 10.189 | 7.719 | 9.675 | 8.271 |
| Distributions | | | | | |
| Dividends from Net Investment Income | (3.243) | (2.469) | (2.009) | (1.905) | (1.511) |
| Distributions from Realized Capital Gains | — | — | — | — | — |
| Total Distributions | (3.243) | (2.469) | (2.009) | (1.905) | (1.511) |
| Net Asset Value, End of Period | $88.44 | $78.54 | $70.82 | $65.11 | $57.34 |
| |
| Total Return | 17.08% | 14.78% | 12.33% | 16.87% | 16.39% |
| |
| Ratios/Supplemental Data | | | | | |
| Net Assets, End of Period (Millions) | $743 | $511 | $524 | $391 | $241 |
| Ratio of Total Expenses to Average Net Assets | 0.12% | 0.14% | 0.14% | 0.19% | 0.24% |
| Ratio of Net Investment Income to | | | | | |
| Average Net Assets | 3.29% | 4.56%1 | 3.24% | 3.60% | 3.60% |
| Portfolio Turnover Rate3 | 19% | 19% | 28% | 21% | 23% |
1 Net investment income per share and the ratio of net investment income to average net assets include $.704 and 0.89%, respectively,resulting from a special dividend received in connection with a merger between T-Mobile US Inc. and MetroPCS Communications Inc. inMay 2013.2 Calculated based on average shares outstanding.3 Excludes the value of portfolio securities received or delivered as a result of in-kind purchases or redemptions of the fund’s capital shares,including ETF Creation Units.See accompanying Notes, which are an integral part of the Financial Statements.
98
Telecommunication Services Index Fund
Notes to Financial Statements
Vanguard Telecommunication Services Index Fund is registered under the Investment Company Act of 1940 as an open-end investment company, or mutual fund. The fund offers two classes of shares: Admiral Shares and ETF Shares. Admiral Shares are designed for investors who meet certain administrative, service, and account-size criteria. ETF Shares are listed for trading on NYSE Arca; they can be purchased and sold through a broker.
A. The following significant accounting policies conform to generally accepted accounting principles for U.S. investment companies. The fund consistently follows such policies in preparing its financial statements.
1. Security Valuation: Securities are valued as of the close of trading on the New York Stock Exchange (generally 4 p.m., Eastern time) on the valuation date. Equity securities are valued at the latest quoted sales prices or official closing prices taken from the primary market in which each security trades; such securities not traded on the valuation date are valued at the mean of the latest quoted bid and asked prices. Securities for which market quotations are not readily available, or whose values have been materially affected by events occurring before the fund’s pricing time but after the close of the securities’ primary markets, are valued by methods deemed by the board of trustees to represent fair value. Investments in Vanguard Market Liquidity Fund are valued at that fund’s net asset value. Temporary cash investments acquired over 60 days to maturity are valued using the latest bid prices or using valuations based on a matrix system (which considers such factors as security prices, yields, maturities, and ratings), both as furnished by independent pricing services. Other temporary cash investments are valued at amortized cost, which approximates market value.
2. Futures Contracts: The fund uses index futures contracts to a limited extent, with the objectives of maintaining full exposure to the stock market, enhancing returns, maintaining liquidity, and minimizing transaction costs. The fund may purchase futures contracts to immediately invest incoming cash in the market, or sell futures in response to cash outflows, thereby simulating a fully invested position in the underlying index while maintaining a cash balance for liquidity. The fund may seek to enhance returns by using futures contracts instead of the underlying securities when futures are believed to be priced more attractively than the underlying securities. The primary risks associated with the use of futures contracts are imperfect correlation between changes in market values of stocks held by the fund and the prices of futures contracts, and the possibility of an illiquid market. Counterparty risk involving futures is mitigated because a regulated clearinghouse is the counterparty instead of the clearing broker. To further mitigate counterparty risk, the fund trades futures contracts on an exchange, monitors the financial strength of its clearing brokers and clearinghouse, and has entered into clearing agreements with its clearing brokers. The clearinghouse imposes initial margin requirements to secure the fund’s performance and requires daily settlement of variation margin representing changes in the market value of each contract.
Futures contracts are valued at their quoted daily settlement prices. The aggregate settlement values of the contracts are not recorded in the Statement of Net Assets. Fluctuations in the value of the contracts are recorded in the Statement of Net Assets as an asset (liability) and in the Statement of Operations as unrealized appreciation (depreciation) until the contracts are closed, when they are recorded as realized futures gains (losses).
During the year ended August 31, 2014, the fund’s average investments in long and short futures contracts represented less than 1% and 0% of net assets, respectively, based on the average of aggregate settlement values at each quarter-end during the period. The fund had no open futures contracts at August 31, 2014.
3. Federal Income Taxes: The fund intends to continue to qualify as a regulated investment company and distribute all of its taxable income. Management has analyzed the fund’s tax positions taken for all open federal income tax years (August 31, 2011–2014), and has concluded that no provision for federal income tax is required in the fund’s financial statements.
4. Distributions: Distributions to shareholders are recorded on the ex-dividend date.
5. Securities Lending: To earn additional income, the fund lends its securities to qualified institutional borrowers. Security loans are required to be secured at all times by collateral in an amount at least equal to the market value of securities loaned. Daily market fluctuations could cause the value of loaned securities to be more or less than the value of the collateral received. When this occurs, the collateral is adjusted and settled on the next business day. The fund further mitigates its counterparty risk by entering into securities lending transactions only with a diverse group of prequalified counterparties, monitoring their financial strength, and entering into master securities lending agreements with its counterparties. The master securities lending agreements provide that, in the event of a counterparty’s default (including bankruptcy), the fund may terminate any loans with that borrower, determine the net amount owed, and sell or retain the collateral up to the net amount owed to the fund; however,
99
Telecommunication Services Index Fund
such actions may be subject to legal proceedings. While collateral mitigates counterparty risk, in the absence of a default the fund may experience delays and costs in recovering the securities loaned. The fund invests cash collateral received in Vanguard Market Liquidity Fund, and records a liability in the Statement of Net Assets for the return of the collateral, during the period the securities are on loan. Securities lending income represents fees charged to borrowers plus income earned on invested cash collateral, less expenses associated with the loan.
6. Credit Facility: The fund and certain other funds managed by The Vanguard Group participate in a $2.89 billion committed credit facility provided by a syndicate of lenders pursuant to a credit agreement that may be renewed annually; each fund is individually liable for its borrowings, if any, under the credit facility. Borrowings may be utilized for temporary and emergency purposes, and are subject to the fund’s regulatory and contractual borrowing restrictions. The participating funds are charged administrative fees and an annual commitment fee of 0.06% of the undrawn amount of the facility; these fees are allocated to the funds based on a method approved by the fund’s board of trustees and included in Management and Administrative expenses on the fund’s Statement of Operations. Any borrowings under this facility bear interest at a rate equal to the higher of the federal funds rate or LIBOR reference rate plus an agreed-upon spread.
The fund had no borrowings outstanding at August 31, 2014, or at any time during the period then ended.
7. Other: Dividend income is recorded on the ex-dividend date. Interest income includes income distributions received from Vanguard Market Liquidity Fund and is accrued daily. Premiums and discounts on debt securities purchased are amortized and accreted, respectively, to interest income over the lives of the respective securities. Security transactions are accounted for on the date securities are bought or sold. Costs used to determine realized gains (losses) on the sale of investment securities are those of the specific securities sold.
Each class of shares has equal rights as to assets and earnings, except that each class separately bears certain class-specific expenses related to maintenance of shareholder accounts (included in Management and Administrative expenses) and shareholder reporting. Marketing and distribution expenses are allocated to each class of shares based on a method approved by the board of trustees. Income, other non-class-specific expenses, and gains and losses on investments are allocated to each class of shares based on its relative net assets.
B. The Vanguard Group furnishes at cost investment advisory, corporate management, administrative, marketing, and distribution services. The costs of such services are allocated to the fund based on methods approved by the board of trustees. The fund has committed to provide up to 0.40% of its net assets in capital contributions to Vanguard. At August 31, 2014, the fund had contributed capital of $77,000 to Vanguard (included in Other Assets), representing 0.01% of the fund’s net assets and 0.03% of Vanguard’s capitalization. The fund’s trustees and officers are also directors and officers of Vanguard.
C. Various inputs may be used to determine the value of the fund’s investments. These inputs are summarized in three broad levels for financial statement purposes. The inputs or methodologies used to value securities are not necessarily an indication of the risk associated with investing in those securities.
Level 1—Quoted prices in active markets for identical securities.
Level 2—Other significant observable inputs (including quoted prices for similar securities, interest rates, prepayment speeds, credit risk, etc.).
Level 3—Significant unobservable inputs (including the fund’s own assumptions used to determine the fair value of investments).
The following table summarizes the market value of the fund’s investments as of August 31, 2014, based on the inputs used to value them:
| | | |
| | Level 1 | Level 2 | Level 3 |
| Investments | ($000) | ($000) | ($000) |
| Common Stocks | 767,397 | — | 1,454 |
| Temporary Cash Investments | 2,892 | 200 | — |
| Total | 770,289 | 200 | 1,454 |
100
Telecommunication Services Index Fund
D. Distributions are determined on a tax basis and may differ from net investment income and realized capital gains for financial reporting purposes. Differences may be permanent or temporary. Permanent differences are reclassified among capital accounts in the financial statements to reflect their tax character. Temporary differences arise when certain items of income, expense, gain, or loss are recognized in different periods for financial statement and tax purposes. These differences will reverse at some time in the future. Differences in classification may also result from the treatment of short-term gains as ordinary income for tax purposes.
During the year ended August 31, 2014, the fund realized $21,773,000 of net capital gains resulting from in-kind redemptions—in which shareholders exchanged fund shares for securities held by the fund rather than for cash. Because such gains are not taxable to the fund, and are not distributed to shareholders, they have been reclassified from accumulated net realized losses to paid-in capital.
For tax purposes, at August 31, 2014, the fund had $14,458,000 of ordinary income available for distribution. The fund used capital loss carryforwards of $4,665,000 to offset taxable capital gains realized during the year ended August 31, 2014. At August 31, 2014, the fund had available capital losses totaling $71,251,000 to offset future net capital gains. Of this amount, $45,285,000 is subject to expiration dates; $7,492,000 may be used to offset future net capital gains through August 31, 2017, $26,335,000 through August 31, 2018, and $11,458,000 through August 31, 2019. Capital losses of $25,966,000 realized beginning in fiscal 2012 may be carried forward indefinitely under the Regulated Investment Company Modernization Act of 2010, but must be used before any expiring loss carryforwards.
At August 31, 2014, the cost of investment securities for tax purposes was $720,517,000. Net unrealized appreciation of investment securities for tax purposes was $51,426,000, consisting of unrealized gains of $70,670,000 on securities that had risen in value since their purchase and $19,244,000 in unrealized losses on securities that had fallen in value since their purchase.
E. During the year ended August 31, 2014, the fund purchased $382,741,000 of investment securities and sold $217,129,000 of investment securities, other than temporary cash investments. Purchases and sales include $228,176,000 and $90,765,000, respectively, in connection with in-kind purchases and redemptions of the fund’s capital shares.
F. Capital share transactions for each class of shares were:
| | | | |
| | | | Year Ended August 31, |
| | | 2014 | | | 2013 |
| | Amount | Shares | Amount | Shares |
| | ($000) | (000) | ($000) | (000) |
| Admiral Shares | | | | |
| Issued | 7,745 | 180 | 5,668 | 146 |
| Issued in Lieu of Cash Distributions | 809 | 20 | 598 | 17 |
| Redeemed | (6,779) | (160) | (6,613) | (172) |
| Net Increase (Decrease) —Admiral Shares | 1,775 | 40 | (347) | (9) |
| ETF Shares | | | | |
| Issued | 253,552 | 3,000 | 222,108 | 2,900 |
| Issued in Lieu of Cash Distributions | — | — | — | — |
| Redeemed | (90,998) | (1,100) | (284,752) | (3,800) |
| Net Increase (Decrease)—ETF Shares | 162,554 | 1,900 | (62,644) | (900) |
At August 31, 2014, one shareholder was the record or beneficial owner of 39% of the fund’s net assets. If the shareholder were to redeem its investment in the fund, the redemption might result in an increase in the fund’s expense ratio.
G. Management has determined that no material events or transactions occurred subsequent to August 31, 2014, that would require recognition or disclosure in these financial statements.
101
Utilities Index Fund
Fund Profile
As of August 31, 2014
| | |
| Share-Class Characteristics | |
| | Admiral | ETF |
| | Shares | Shares |
| Ticker Symbol | VUIAX | VPU |
| Expense Ratio1 | 0.14% | 0.14% |
| 30-Day SEC Yield | 3.41% | 3.41% |
| | | |
| Portfolio Characteristics | | |
| | | MSCI | |
| | | US IMI/ | MSCI |
| | | Utilities | US IMI/ |
| | Fund | 25/50 | 2500 |
| Number of Stocks | 78 | 78 | 2,499 |
| Median Market Cap | $18.9B | $18.9B | $48.7B |
| Price/Earnings Ratio | 20.1x | 20.1x | 20.7x |
| Price/Book Ratio | 1.7x | 1.7x | 2.7x |
| Return on Equity | 10.4% | 10.4% | 18.0% |
| Earnings Growth Rate | 1.1% | 1.1% | 15.2% |
| Dividend Yield | 3.5% | 3.5% | 1.9% |
| Foreign Holdings | 0.0% | 0.0% | 0.0% |
| Turnover Rate | 7% | — | — |
| Short-Term Reserves | 0.0% | — | — |
| | |
| Volatility Measures | | |
| | MSCI US | |
| | IMI/Utilities | MSCI US |
| | 25/50 | IMI/2500 |
| R-Squared | 1.00 | 0.11 |
| Beta | 1.00 | 0.32 |
| These measures show the degree and timing of the fund’s fluctuations compared with the indexes over 36 months. |
|
| |
| Subindustry Diversification | |
| (% of equity exposure) | |
| |
| Electric Utilities | 52.1% |
| Gas Utilities | 6.7 |
| Independent Power Producers | |
| & Energy Traders | 4.6 |
| Multi-Utilities | 33.8 |
| Renewable Electricity | 0.2 |
| Water Utilities | 2.6 |
| | |
| Ten Largest Holdings (% of total net assets) |
| |
| Duke Energy Corp. | Electric Utilities | 7.8% |
| NextEra Energy Inc. | Electric Utilities | 6.4 |
| Dominion Resources Inc. | Multi-Utilities | 6.1 |
| Southern Co. | Electric Utilities | 5.9 |
| Exelon Corp. | Electric Utilities | 4.3 |
| American Electric | | |
| Power Co. Inc. | Electric Utilities | 3.9 |
| Sempra Energy | Multi-Utilities | 3.7 |
| PPL Corp. | Electric Utilities | 3.3 |
| PG&E Corp. | Multi-Utilities | 3.2 |
| Public Service | | |
| Enterprise Group Inc. | Multi-Utilities | 2.8 |
| Top Ten | | 47.4% |
| The holdings listed exclude any temporary cash investments and equity index products. |
|
1 The expense ratios shown are from the prospectus dated December 23, 2013, and represent estimated costs for the current fiscal year. For the fiscal year ended August 31, 2014, the expense ratios were 0.12% for
Admiral Shares and 0.12% for ETF Shares.
102
Utilities Index Fund
Performance Summary
All of the returns in this report represent past performance, which is not a guarantee of future results that may be achieved by the fund. (Current performance may be lower or higher than the performance data cited. For performance data current to the most recent month-end, visit our website at vanguard.com/performance.) Note, too, that both investment returns and principal value can fluctuate widely, so an investor’s shares, when sold, could be worth more or less than their original cost. The returns shown do not reflect taxes that a shareholder would pay on fund distributions or on the sale of fund shares.
Cumulative Performance: August 31, 2004–August 31, 2014
Initial Investment of $10,000
| | | | |
| | | Average Annual Total Returns | Final Value |
| | Periods Ended August 31, 2014 | of a $10,000 |
| | One Year | Five Years | Ten Years | Investment |
| Utilities Index Fund | | | | |
| ETF Shares Net Asset Value | 20.55% | 13.28% | 9.78% | $25,434 |
| Utilities Index Fund | | | | |
| ETF Shares Market Price | 20.55 | 13.27 | 9.80 | 25,461 |
| Spliced US IMI/Utilities 25/50 | 20.74 | 13.48 | 9.99 | 25,906 |
| Utility Funds Average | 22.89 | 12.69 | 9.52 | 24,821 |
| MSCI US IMI/2500 | 24.94 | 17.33 | 9.05 | 23,791 |
For a benchmark description, see the Glossary.
Utility Funds Average: Derived from data provided by Lipper, a Thomson Reuters Company. |
|
| | | | |
| | | | | Final Value |
| | | | | of a $100,000 |
| | One Year | Five Years | Ten Years | Investment |
| Utilities Index Fund Admiral Shares | 20.58% | 13.30% | 9.77% | $253,993 |
| Spliced US IMI/Utilities 25/50 | 20.74 | 13.48 | 9.99 | 259,060 |
| MSCI US IMI/2500 | 24.94 | 17.33 | 9.05 | 237,905 |
See Financial Highlights for dividend and capital gains information.
103
Utilities Index Fund
Fiscal-Year Total Returns (%): August 31, 2004–August 31, 2014
For a benchmark description, see the Glossary.
| | | |
| Cumulative Returns: ETF Shares, August 31, 2004–August 31, 2014 | | |
| |
| | One Year | Five Years | Ten Years |
| Utilities Index Fund ETF Shares Market Price | 20.55% | 86.44% | 154.61% |
| Utilities Index Fund ETF Shares Net Asset Value | 20.55 | 86.58 | 154.34 |
| Spliced US IMI/Utilities 25/50 | 20.74 | 88.19 | 159.06 |
Average Annual Total Returns: Periods Ended June 30, 2014
This table presents total returns through the latest calendar quarter—rather than through the end of the fiscal
period. Securities and Exchange Commission rules require that we provide this information.
| | | | |
| | Inception Date | One Year | Five Years | Ten Years |
| ETF Shares | 1/26/2004 | | | |
| Market Price | | 21.99% | 14.85% | 10.56% |
| Net Asset Value | | 22.02 | 14.88 | 10.56 |
| Admiral Shares | 4/28/2004 | 22.03 | 14.89 | 10.55 |
See Financial Highlights for dividend and capital gains information.
104
Utilities Index Fund
Financial Statements
Statement of Net Assets
As of August 31, 2014
The fund reports a complete list of its holdings in regulatory filings four times in each fiscal year, at the quarter-ends. For the second and fourth fiscal quarters, the lists appear in the fund’s semiannual and annual reports to shareholders. For the first and third fiscal quarters, the fund files the lists with the Securities and Exchange Commission on Form N-Q. Shareholders can look up the fund’s Forms N-Q on the SEC’s website at sec.gov. Forms N-Q may also be reviewed and copied at the SEC’s Public Reference Room (see the back cover of this report for further information).
| | | |
| | | | Market |
| | | | Value• |
| | | Shares | ($000) |
| Common Stocks (100.0%) | | |
| Electric Utilities (52.1%) | | |
| | Duke Energy Corp. | 2,272,553 | 168,146 |
| | NextEra Energy Inc. | 1,401,433 | 137,971 |
| | Southern Co. | 2,862,454 | 127,093 |
| | Exelon Corp. | 2,759,368 | 92,218 |
| | American Electric Power | | |
| | Co. Inc. | 1,568,422 | 84,224 |
| | PPL Corp. | 2,030,038 | 70,300 |
| | Edison International | 994,590 | 58,820 |
| | Xcel Energy Inc. | 1,612,989 | 51,696 |
| | Northeast Utilities | 1,015,423 | 46,598 |
| | FirstEnergy Corp. | 1,349,276 | 46,199 |
| | Entergy Corp. | 576,481 | 44,625 |
| | OGE Energy Corp. | 639,636 | 23,999 |
| | Pepco Holdings Inc. | 806,248 | 22,220 |
| | Pinnacle West Capital | | |
| | Corp. | 354,446 | 20,186 |
| | ITC Holdings Corp. | 506,362 | 18,913 |
| | Westar Energy Inc. | | |
| | Class A | 414,084 | 15,292 |
| | Great Plains Energy Inc. | 494,831 | 12,702 |
| | Cleco Corp. | 193,941 | 10,942 |
| | IDACORP Inc. | 161,745 | 9,174 |
| | Portland General Electric | | |
| | Co. | 251,338 | 8,664 |
| ^ | Hawaiian Electric | | |
| | Industries Inc. | 325,815 | 8,273 |
| | UIL Holdings Corp. | 181,894 | 6,776 |
| | PNM Resources Inc. | 256,222 | 6,716 |
| | ALLETE Inc. | 129,591 | 6,307 |
| | NRG Yield Inc. Class A | 105,946 | 5,762 |
| | El Paso Electric Co. | 129,817 | 5,107 |
| | MGE Energy Inc. | 111,197 | 4,474 |
| | Empire District Electric Co. | 138,631 | 3,584 |
| | Otter Tail Corp. | 105,370 | 3,002 |
| | Unitil Corp. | 42,097 | 1,372 |
| | | | 1,121,355 |
| Gas Utilities (6.7%) | | |
| | AGL Resources Inc. | 383,034 | 20,419 |
| | UGI Corp. | 369,626 | 19,583 |
| | National Fuel Gas Co. | 229,401 | 17,535 |
| | Atmos Energy Corp. | 321,900 | 16,275 |
| | Questar Corp. | 562,656 | 13,228 |
| | Piedmont Natural Gas Co. | | |
| | Inc. | 250,517 | 9,369 |
| | Southwest Gas Corp. | 149,484 | 7,805 |
| | WGL Holdings Inc. | 166,627 | 7,247 |
| | New Jersey Resources | | |
| | Corp. | 135,548 | 7,080 |
| | | |
| | | | Market |
| | | | Value• |
| | | Shares | ($000) |
| | Laclede Group Inc. | 134,443 | 6,648 |
| | ONE Gas Inc. | 167,264 | 6,261 |
| | South Jersey Industries | | |
| | Inc. | 105,804 | 6,131 |
| | Northwest Natural Gas Co. | 86,951 | 3,953 |
| | Chesapeake Utilities Corp. | 31,146 | 2,148 |
| | | | 143,682 |
| Independent Power and Renewable | |
| Electricity Producers (4.9%) | | |
| | AES Corp. | 2,214,584 | 33,617 |
| | NRG Energy Inc. | 1,083,773 | 33,359 |
| * | Calpine Corp. | 1,156,730 | 27,496 |
| * | Dynegy Inc. Class A | 161,224 | 5,269 |
| | Pattern Energy Group Inc. | | |
| | Class A | 119,288 | 3,845 |
| | Ormat Technologies Inc. | 51,334 | 1,413 |
| | | | 104,999 |
| Multi-Utilities (33.7%) | | |
| | Dominion Resources Inc. | 1,868,871 | 131,232 |
| | Sempra Energy | 749,269 | 79,400 |
| | PG&E Corp. | 1,493,354 | 69,411 |
| | Public Service Enterprise | | |
| | Group Inc. | 1,625,707 | 60,785 |
| | Consolidated Edison Inc. | 941,149 | 54,483 |
| | DTE Energy Co. | 568,931 | 44,519 |
| | NiSource Inc. | 1,011,905 | 40,142 |
| | Wisconsin Energy Corp. | 724,412 | 32,837 |
| | CenterPoint Energy Inc. | 1,312,224 | 32,595 |
| | Ameren Corp. | 779,937 | 31,190 |
| | CMS Energy Corp. | 865,584 | 26,435 |
| | SCANA Corp. | 432,098 | 22,443 |
| | Alliant Energy Corp. | 356,401 | 20,846 |
| | MDU Resources Group Inc. | 584,664 | 18,306 |
| | Integrys Energy Group Inc. | 256,872 | 17,439 |
| | TECO Energy Inc. | 749,488 | 13,566 |
| | Vectren Corp. | 264,975 | 10,925 |
| | Black Hills Corp. | 143,231 | 7,696 |
| | Avista Corp. | 193,652 | 6,286 |
| | NorthWestern Corp. | 124,496 | 6,011 |
| | | | 726,547 |
| Water Utilities (2.6%) | | |
| | American Water Works Co. | | |
| | Inc. | 575,047 | 29,103 |
| | Aqua America Inc. | 568,762 | 14,225 |
| | American States Water Co. | 124,371 | 4,017 |
| | California Water Service | | |
| | Group | 154,042 | 3,753 |
| | SJW Corp. | 48,687 | 1,331 |
| | Connecticut Water Service | | |
| | Inc. | 35,605 | 1,173 |
| | |
| | | Market |
| | | Value• |
| | Shares | ($000) |
| Middlesex Water Co. | 51,068 | 1,048 |
| York Water Co. | 41,462 | 837 |
| | | 55,487 |
| Total Common Stocks | | |
| (Cost $1,979,863) | | 2,152,070 |
| Temporary Cash Investment (0.0%) | |
| Money Market Fund (0.0%) | | |
| 1,2 Vanguard Market | | |
| Liquidity Fund 0.113%, | | |
| (Cost $1,058) | 1,058,202 | 1,058 |
| Total Investments (100.0%) | | |
| (Cost $1,980,921) | | 2,153,128 |
| Other Assets and Liabilities (0.0%) | |
| Other Assets | | 24,418 |
| Liabilities2 | | (24,985) |
| | | (567) |
| Net Assets (100%) | | 2,152,561 |
| |
| |
| At August 31, 2014, net assets consisted of: |
| | | Amount |
| | | ($000) |
| Paid-in Capital | | 1,973,826 |
| Undistributed Net Investment Income | 13,108 |
| Accumulated Net Realized Losses | (6,580) |
| Unrealized Appreciation (Depreciation) | 172,207 |
| Net Assets | | 2,152,561 |
| |
| |
| Admiral Shares—Net Assets | | |
| Applicable to 9,308,755 outstanding | |
| $.001 par value shares of beneficial | |
| interest (unlimited authorization) | 441,873 |
| Net Asset Value Per Share— | | |
| Admiral Shares | | $47.47 |
| |
| |
| ETF Shares—Net Assets | | |
| Applicable to 18,080,621 outstanding | |
| $.001 par value shares of beneficial | |
| interest (unlimited authorization) | 1,710,688 |
| Net Asset Value Per Share— | | |
| ETF Shares | | $94.61 |
• See Note A in Notes to Financial Statements
^ Includes partial security positions on loan to broker-dealers. The total value of securities on loan is $1,033,000.
* Non-income-producing security.
1 Affiliated money market fund available only to Vanguard funds and certain trusts and accounts managed by Vanguard. Rate shown is the 7-day yield.
2 Includes $1,058,000 of collateral received for securities on loan.
See accompanying Notes, which are an integral part of the Financial Statements.
105
Utilities Index Fund
Statement of Operations
| |
| | Year Ended |
| August 31, 2014 |
| | ($000) |
| Investment Income | |
| Income | |
| Dividends | 70,085 |
| Interest1 | 2 |
| Securities Lending | 14 |
| Total Income | 70,101 |
| Expenses | |
| The Vanguard Group—Note B | |
| Investment Advisory Services | 304 |
| Management and Administrative— | |
| Admiral Shares | 330 |
| Management and Administrative— | |
| ETF Shares | 1,103 |
| Marketing and Distribution— | |
| Admiral Shares | 61 |
| Marketing and Distribution— | |
| ETF Shares | 323 |
| Custodian Fees | 28 |
| Auditing Fees | 32 |
| Shareholders’ Reports—Admiral Shares | 2 |
| Shareholders’ Reports—ETF Shares | 92 |
| Trustees’ Fees and Expenses | 1 |
| Total Expenses | 2,276 |
| Net Investment Income | 67,825 |
| Realized Net Gain (Loss) on | |
| Investment Securities Sold | 118,085 |
| Change in Unrealized Appreciation | |
| (Depreciation) of Investment Securities | 154,281 |
| Net Increase (Decrease) in Net Assets | |
| Resulting from Operations | 340,191 |
Statement of Changes in Net Assets
| | |
| | Year Ended August 31, |
| | 2014 | 2013 |
| | ($000) | ($000) |
| Increase (Decrease) in Net Assets | | |
| Operations | | |
| Net Investment Income | 67,825 | 61,848 |
| Realized Net Gain (Loss) | 118,085 | 59,137 |
| Change in Unrealized Appreciation (Depreciation) | 154,281 | 13,075 |
| Net Increase (Decrease) in Net Assets Resulting from Operations | 340,191 | 134,060 |
| Distributions | | |
| Net Investment Income | | |
| Admiral Shares | (13,546) | (12,363) |
| ETF Shares | (52,639) | (49,213) |
| Realized Capital Gain | | |
| Admiral Shares | — | — |
| ETF Shares | — | — |
| Total Distributions | (66,185) | (61,576) |
| Capital Share Transactions | | |
| Admiral Shares | 36,462 | 22,541 |
| ETF Shares | 138,918 | 143,996 |
| Net Increase (Decrease) from Capital Share Transactions | 175,380 | 166,537 |
| Total Increase (Decrease) | 449,386 | 239,021 |
| Net Assets | | |
| Beginning of Period | 1,703,175 | 1,464,154 |
| End of Period2 | 2,152,561 | 1,703,175 |
1 Interest income from an affiliated company of the fund was $2,000.
2 Net Assets—End of Period includes undistributed net investment income of $13,108,000 and $11,468,000.
See accompanying Notes, which are an integral part of the Financial Statements.
106
Utilities Index Fund
Financial Highlights
| | | | | |
| Admiral Shares | | | | | |
| |
| For a Share Outstanding | Year Ended August 31, |
| Throughout Each Period | 2014 | 2013 | 2012 | 2011 | 2010 |
| Net Asset Value, Beginning of Period | $40.80 | $38.99 | $36.40 | $32.60 | $30.73 |
| Investment Operations | | | | | |
| Net Investment Income | 1.569 | 1.529 | 1.452 | 1.344 | 1.2931 |
| Net Realized and Unrealized Gain (Loss) | | | | | |
| on Investments | 6.656 | 1.838 | 2.539 | 3.783 | 1.782 |
| Total from Investment Operations | 8.225 | 3.367 | 3.991 | 5.127 | 3.075 |
| Distributions | | | | | |
| Dividends from Net Investment Income | (1.555) | (1.557) | (1.401) | (1.327) | (1.205) |
| Distributions from Realized Capital Gains | — | — | — | — | — |
| Total Distributions | (1.555) | (1.557) | (1.401) | (1.327) | (1.205) |
| Net Asset Value, End of Period | $47.47 | $40.80 | $38.99 | $36.40 | $32.60 |
| |
| Total Return2 | 20.58% | 8.83% | 11.22% | 16.09% | 10.20% |
| |
| Ratios/Supplemental Data | | | | | |
| Net Assets, End of Period (Millions) | $442 | $347 | $310 | $218 | $153 |
| Ratio of Total Expenses to Average Net Assets | 0.12% | 0.14% | 0.14% | 0.19% | 0.24% |
| Ratio of Net Investment Income to | | | | | |
| Average Net Assets | 3.59% | 3.72% | 3.93% | 3.99% | 4.07% |
| Portfolio Turnover Rate3 | 7% | 7% | 5% | 6% | 8% |
1 Calculated based on average shares outstanding.
2 Total returns do not include transaction and account service fees that may have applied in the periods shown. Fund prospectuses provide
information about any applicable transaction and account service fees.
3 Excludes the value of portfolio securities received or delivered as a result of in-kind purchases or redemptions of the fund’s capital shares,
including ETF Creation Units.
| | | | | |
| ETF Shares | | | | | |
| |
| For a Share Outstanding | Year Ended August 31, |
| Throughout Each Period | 2014 | 2013 | 2012 | 2011 | 2010 |
| Net Asset Value, Beginning of Period | $81.32 | $77.69 | $72.52 | $64.93 | $61.24 |
| Investment Operations | | | | | |
| Net Investment Income | 3.127 | 3.043 | 2.880 | 2.678 | 2.5541 |
| Net Realized and Unrealized Gain (Loss) | | | | | |
| on Investments | 13.261 | 3.675 | 5.080 | 7.551 | 3.550 |
| Total from Investment Operations | 16.388 | 6.718 | 7.960 | 10.229 | 6.104 |
| Distributions | | | | | |
| Dividends from Net Investment Income | (3.098) | (3.088) | (2.790) | (2.639) | (2.414) |
| Distributions from Realized Capital Gains | — | — | — | — | — |
| Total Distributions | (3.098) | (3.088) | (2.790) | (2.639) | (2.414) |
| Net Asset Value, End of Period | $94.61 | $81.32 | $77.69 | $72.52 | $64.93 |
| |
| Total Return | 20.55% | 8.82% | 11.20% | 16.09% | 10.18% |
| |
| Ratios/Supplemental Data | | | | | |
| Net Assets, End of Period (Millions) | $1,711 | $1,356 | $1,154 | $831 | $581 |
| Ratio of Total Expenses to Average Net Assets | 0.12% | 0.14% | 0.14% | 0.19% | 0.24% |
| Ratio of Net Investment Income to | | | | | |
| Average Net Assets | 3.59% | 3.72% | 3.93% | 3.99% | 4.07% |
| Portfolio Turnover Rate2 | 7% | 7% | 5% | 6% | 8% |
1 Calculated based on average shares outstanding.2 Excludes the value of portfolio securities received or delivered as a result of in-kind purchases or redemptions of the fund’s capital shares,including ETF Creation Units.See accompanying Notes, which are an integral part of the Financial Statements.
107
Utilities Index Fund
Notes to Financial Statements
Vanguard Utilities Index Fund is registered under the Investment Company Act of 1940 as an open-end investment company, or mutual fund. The fund offers two classes of shares: Admiral Shares and ETF Shares. Admiral Shares are designed for investors who meet certain administrative, service, and account-size criteria. ETF Shares are listed for trading on NYSE Arca; they can be purchased and sold through a broker.
A. The following significant accounting policies conform to generally accepted accounting principles for U.S. investment companies. The fund consistently follows such policies in preparing its financial statements.
1. Security Valuation: Securities are valued as of the close of trading on the New York Stock Exchange (generally 4 p.m., Eastern time) on the valuation date. Equity securities are valued at the latest quoted sales prices or official closing prices taken from the primary market in which each security trades; such securities not traded on the valuation date are valued at the mean of the latest quoted bid and asked prices. Securities for which market quotations are not readily available, or whose values have been materially affected by events occurring before the fund’s pricing time but after the close of the securities’ primary markets, are valued by methods deemed by the board of trustees to represent fair value. Investments in Vanguard Market Liquidity Fund are valued at that fund’s net asset value.
2. Federal Income Taxes: The fund intends to continue to qualify as a regulated investment company and distribute all of its taxable income. Management has analyzed the fund’s tax positions taken for all open federal income tax years (August 31, 2011–2014), and has concluded that no provision for federal income tax is required in the fund’s financial statements.
3. Distributions: Distributions to shareholders are recorded on the ex-dividend date.
4. Securities Lending: To earn additional income, the fund lends its securities to qualified institutional borrowers. Security loans are required to be secured at all times by collateral in an amount at least equal to the market value of securities loaned. Daily market fluctuations could cause the value of loaned securities to be more or less than the value of the collateral received. When this occurs, the collateral is adjusted and settled on the next business day. The fund further mitigates its counterparty risk by entering into securities lending transactions only with a diverse group of prequalified counterparties, monitoring their financial strength, and entering into master securities lending agreements with its counterparties. The master securities lending agreements provide that, in the event of a counterparty’s default (including bankruptcy), the fund may terminate any loans with that borrower, determine the net amount owed, and sell or retain the collateral up to the net amount owed to the fund; however, such actions may be subject to legal proceedings. While collateral mitigates counterparty risk, in the absence of a default the fund may experience delays and costs in recovering the securities loaned. The fund invests cash collateral received in Vanguard Market Liquidity Fund, and records a liability in the Statement of Net Assets for the return of the collateral, during the period the securities are on loan. Securities lending income represents fees charged to borrowers plus income earned on invested cash collateral, less expenses associated with the loan.
5. Credit Facility: The fund and certain other funds managed by The Vanguard Group participate in a $2.89 billion committed credit facility provided by a syndicate of lenders pursuant to a credit agreement that may be renewed annually; each fund is individually liable for its borrowings, if any, under the credit facility. Borrowings may be utilized for temporary and emergency purposes, and are subject to the fund’s regulatory and contractual borrowing restrictions. The participating funds are charged administrative fees and an annual commitment fee of 0.06% of the undrawn amount of the facility; these fees are allocated to the funds based on a method approved by the fund’s board of trustees and included in Management and Administrative expenses on the fund’s Statement of Operations. Any borrowings under this facility bear interest at a rate equal to the higher of the federal funds rate or LIBOR reference rate plus an agreed-upon spread.
The fund had no borrowings outstanding at August 31, 2014, or at any time during the period then ended.
6. Other: Dividend income is recorded on the ex-dividend date. Interest income includes income distributions received from Vanguard Market Liquidity Fund and is accrued daily. Security transactions are accounted for on the date securities are bought or sold. Costs used to determine realized gains (losses) on the sale of investment securities are those of the specific securities sold.
108
Utilities Index Fund
Each class of shares has equal rights as to assets and earnings, except that each class separately bears certain class-specific expenses related to maintenance of shareholder accounts (included in Management and Administrative expenses) and shareholder reporting. Marketing and distribution expenses are allocated to each class of shares based on a method approved by the board of trustees. Income, other non-class-specific expenses, and gains and losses on investments are allocated to each class of shares based on its relative net assets.
B. The Vanguard Group furnishes at cost investment advisory, corporate management, administrative, marketing, and distribution services. The costs of such services are allocated to the fund based on methods approved by the board of trustees. The fund has committed to provide up to 0.40% of its net assets in capital contributions to Vanguard. At August 31, 2014, the fund had contributed capital of $219,000 to Vanguard (included in Other Assets), representing 0.01% of the fund’s net assets and 0.09% of Vanguard’s capitalization. The fund’s trustees and officers are also directors and officers of Vanguard.
C. Various inputs may be used to determine the value of the fund’s investments. These inputs are summarized in three broad levels for financial statement purposes. The inputs or methodologies used to value securities are not necessarily an indication of the risk associated with investing in those securities.
Level 1—Quoted prices in active markets for identical securities.
Level 2—Other significant observable inputs (including quoted prices for similar securities, interest rates, prepayment speeds, credit risk, etc.).
Level 3—Significant unobservable inputs (including the fund’s own assumptions used to determine the fair value of investments).
At August 31, 2014, 100% of the market value of the fund’s investments was determined based on Level 1 inputs.
D. Distributions are determined on a tax basis and may differ from net investment income and realized capital gains for financial reporting purposes. Differences may be permanent or temporary. Permanent differences are reclassified among capital accounts in the financial statements to reflect their tax character. Temporary differences arise when certain items of income, expense, gain, or loss are recognized in different periods for financial statement and tax purposes. These differences will reverse at some time in the future. Differences in classification may also result from the treatment of short-term gains as ordinary income for tax purposes.
During the year ended August 31, 2014, the fund realized $101,399,000 of net capital gains resulting from in-kind redemptions—in which shareholders exchanged fund shares for securities held by the fund rather than for cash. Because such gains are not taxable to the fund, and are not distributed to shareholders, they have been reclassified from accumulated net realized losses to paid-in capital.
For tax purposes, at August 31, 2014, the fund had $14,043,000 of ordinary income available for distribution. The fund used capital loss carryforwards of $16,818,000 to offset taxable capital gains realized during the year ended August 31, 2014. At August 31, 2014, the fund had available capital losses totaling $6,446,000 to offset future net capital gains of $3,083,000 through August 31, 2018, and $3,363,000 through August 31, 2019.
At August 31, 2014, the cost of investment securities for tax purposes was $1,981,056,000. Net unrealized appreciation of investment securities for tax purposes was $172,072,000, consisting of unrealized gains of $246,867,000 on securities that had risen in value since their purchase and $74,795,000 in unrealized losses on securities that had fallen in value since their purchase.
E. During the year ended August 31, 2014, the fund purchased $737,515,000 of investment securities and sold $560,791,000 of investment securities, other than temporary cash investments. Purchases and sales include $558,025,000 and $427,214,000, respectively, in connection with in-kind purchases and redemptions of the fund’s capital shares.
109
Utilities Index Fund
F. Capital share transactions for each class of shares were:
| | | | |
| | Year Ended August 31, |
| | | 2014 | | | 2013 |
| | Amount | Shares | Amount | Shares |
| | ($000) | (000) | ($000) | (000) |
| Admiral Shares | | | | |
| Issued | 112,297 | 2,523 | 139,755 | 3,494 |
| Issued in Lieu of Cash Distributions | 10,045 | 232 | 9,195 | 232 |
| Redeemed | (85,880) | (1,957) | (126,409) | (3,159) |
| Net Increase (Decrease) —Admiral Shares | 36,462 | 798 | 22,541 | 567 |
| ETF Shares | | | | |
| Issued | 568,143 | 6,306 | 404,847 | 5,016 |
| Issued in Lieu of Cash Distributions | — | — | — | — |
| Redeemed | (429,225) | (4,900) | (260,851) | (3,200) |
| Net Increase (Decrease)—ETF Shares | 138,918 | 1,406 | 143,996 | 1,816 |
G. Management has determined that no material events or transactions occurred subsequent to August 31, 2014, that would require recognition or disclosure in these financial statements.
110
Report of Independent Registered Public Accounting Firm
To the Board of Trustees of Vanguard World Fund and the Shareholders of Vanguard Consumer Discretionary Index Fund, Vanguard Consumer Staples Index Fund, Vanguard Energy Index Fund, Vanguard Financials Index Fund, Vanguard Health Care Index Fund, Vanguard Industrials Index Fund, Vanguard Information Technology Index Fund, Vanguard Materials Index Fund, Vanguard Telecommunication Services Index Fund and Vanguard Utilities Index Fund: In our opinion, the accompanying statements of net assets and the related statements of operations and of changes in net assets and the financial highlights present fairly, in all material respects, the financial position of Vanguard Consumer Discretionary Index Fund, Vanguard Consumer Staples Index Fund, Vanguard Energy Index Fund, Vanguard Financials Index Fund, Vanguard Health Care Index Fund, Vanguard Industrials Index Fund, Vanguard Information Technology Index Fund, Vanguard Materials Index Fund, Vanguard Telecommunication Services Index Fund and Vanguard Utilities Index Fund (constituting separate portfolios of Vanguard World Fund, hereafter referred to as the “Funds”) at August 31, 2014, the results of each of their operations for the year then ended, the changes in each of their net assets for each of the two years in the period then ended, and the financial highlights for each of the five years in the period then ended, in conformity with accounting principles generally accepted in the United States of America. These financial statements and financial highlights (hereafter referred to as “financial statements”) are the responsibility of the Funds’ management. Our responsibility is to express an opinion on these financial statements based on our audits. We conducted our audits of these financial statements in accordance with the standards of the Public Company Accounting Oversight Board (United States). Those standards require that we plan and perform the audit to obtain reasonable assurance about whether the financial statements are free of material misstatement. An audit includes examining, on a test basis, evidence supporting the amounts and disclosures in the financial statements, assessing the accounting principles used and significant estimates made by management, and evaluating the overall financial statement presentation. We believe that our audits, which included confirmation of securities at August 31, 2014 by correspondence with the custodian and broker and by agreement to the underlying ownership records of the transfer agent, provide a reasonable basis for our opinion.
/s/PricewaterhouseCoopers LLP
Philadelphia, Pennsylvania
October 10, 2014

Special 2014 tax information (unaudited) for Vanguard U.S. Sector Index Funds
This information for the fiscal year ended August 31, 2014, is included pursuant to provisions of the Internal Revenue Code.
The funds distributed qualified dividend income to shareholders during the fiscal year as follows:
| |
| Fund | ($000) |
| Consumer Discretionary Index Fund | 12,243 |
| Consumer Staples Index Fund | 41,586 |
| Energy Index Fund | 53,807 |
| Financials Index Fund | 23,913 |
| Health Care Index Fund | 30,216 |
| Industrials Index Fund | 16,203 |
| Information Technology Index Fund | 48,486 |
| Materials Index Fund | 20,539 |
| Telecommunication Services Index Fund | 23,965 |
| Utilities Index Fund | 66,185 |
For corporate shareholders, the percentage of investment income (dividend income plus short-term gains, if any) that qualifies for the dividends-received deduction is as follows:
| |
| Fund | Percentage |
| Consumer Discretionary Index Fund | 100.0% |
| Consumer Staples Index Fund | 100.0 |
| Energy Index Fund | 100.0 |
| Financials Index Fund | 63.8 |
| Health Care Index Fund | 100.0 |
| Industrials Index Fund | 100.0 |
| Information Technology Index Fund | 100.0 |
| Materials Index Fund | 95.3 |
| Telecommunication Services Index Fund | 100.0 |
| Utilities Index Fund | 100.0 |
111
Your Fund’s After-Tax Returns
This table presents returns for your fund both before and after taxes. The after-tax returns are shown in two ways: (1) assuming that an investor owned the fund during the entire period and paid taxes on the fund’s distributions, and (2) assuming that an investor paid taxes on the fund’s distributions and sold all shares at the end of each period.
Calculations are based on the highest individual federal income tax and capital gains tax rates in effect at the times of the distributions and the hypothetical sales. State and local taxes were not considered. After-tax returns reflect any qualified dividend income, using actual prior-year figures and estimates for 2014. (In the example, returns after the sale of fund shares may be higher than those assuming no sale. This occurs when the sale would have produced a capital loss. The calculation assumes that the investor received a tax deduction for the loss.) The table shows returns for one share class only; returns for other share classes will differ. Please note that your actual after-tax returns will depend on your tax situation and may differ from those shown. Also note that if you own the fund in a tax-deferred account, such as an individual retirement account or a 401(k) plan, this information does not apply to you. Such accounts are not subject to current taxes.
Finally, keep in mind that a fund’s performance—whether before or after taxes—does not guarantee future results.
Average Annual Total Returns: U.S. Sector Index Funds
Periods Ended August 31, 2014
| | | |
| | One Year | Five Years | Ten Years |
| Consumer Discretionary Index Fund ETF Shares | | | |
| Returns Before Taxes | 20.75% | 23.38% | 10.26% |
| Returns After Taxes on Distributions | 20.50 | 23.15 | 10.07 |
| Returns After Taxes on Distributions and Sale of Fund Shares | 11.93 | 19.29 | 8.47 |
| |
| | One Year | Five Years | Ten Years |
| Consumer Staples Index Fund ETF Shares | | | |
| Returns Before Taxes | 17.42% | 16.42% | 10.69% |
| Returns After Taxes on Distributions | 16.81 | 15.94 | 10.32 |
| Returns After Taxes on Distributions and Sale of Fund Shares | 10.30 | 13.33 | 8.86 |
| |
| | | | Since |
| | | | Inception |
| | One Year | Five Years | (9/23/2004) |
| Energy Index Fund ETF Shares | | | |
| Returns Before Taxes | 24.31% | 15.56% | 12.74% |
| Returns After Taxes on Distributions | 23.79 | 15.25 | 12.50 |
| Returns After Taxes on Distributions and Sale of Fund Shares | 14.09 | 12.59 | 10.70 |
| |
| | One Year | Five Years | Ten Years |
| Financials Index Fund ETF Shares | | | |
| Returns Before Taxes | 21.20% | 12.09% | 1.61% |
| Returns After Taxes on Distributions | 20.49 | 11.59 | 1.15 |
| Returns After Taxes on Distributions and Sale of Fund Shares | 12.24 | 9.53 | 1.24 |
| |
| | One Year | Five Years | Ten Years |
| Health Care Index Fund ETF Shares | | | |
| Returns Before Taxes | 31.76% | 20.52% | 10.89% |
| Returns After Taxes on Distributions | 31.40 | 20.17 | 10.65 |
| Returns After Taxes on Distributions and Sale of Fund Shares | 18.19 | 16.77 | 9.02 |
112
Average Annual Total Returns: U.S. Sector Index Funds
Periods Ended August 31, 2014
| | | |
| | | | Since |
| | | | Inception |
| | One Year | Five Years | (9/23/2004) |
| Industrials Index Fund ETF Shares | | | |
| Returns Before Taxes | 24.83% | 19.32% | 9.47% |
| Returns After Taxes on Distributions | 24.52 | 19.02 | 9.23 |
| Returns After Taxes on Distributions and Sale of Fund Shares | 14.29 | 15.79 | 7.79 |
| |
| | One Year | Five Years | Ten Years |
| Information Technology Index Fund ETF Shares | | | |
| Returns Before Taxes | 32.04% | 17.27% | 10.41% |
| Returns After Taxes on Distributions | 31.71 | 17.10 | 10.28 |
| Returns After Taxes on Distributions and Sale of Fund Shares | 18.35 | 14.03 | 8.62 |
| |
| | One Year | Five Years | Ten Years |
| Materials Index Fund ETF Shares | | | |
| Returns Before Taxes | 27.17% | 15.67% | 10.20% |
| Returns After Taxes on Distributions | 26.61 | 15.31 | 9.87 |
| Returns After Taxes on Distributions and Sale of Fund Shares | 15.75 | 12.69 | 8.43 |
| |
| | | | Since |
| | | | Inception |
| | One Year | Five Years | (9/23/2004) |
| Telecommunication Services Index Fund ETF Shares | | | |
| Returns Before Taxes | 17.08% | 15.48% | 8.90% |
| Returns After Taxes on Distributions | 16.02 | 14.85 | 8.43 |
| Returns After Taxes on Distributions and Sale of Fund Shares | 10.43 | 12.54 | 7.32 |
| |
| | One Year | Five Years | Ten Years |
| Utilities Index Fund ETF Shares | | | |
| Returns Before Taxes | 20.55% | 13.28% | 9.78% |
| Returns After Taxes on Distributions | 19.54 | 12.54 | 9.15 |
| Returns After Taxes on Distributions and Sale of Fund Shares | 12.33 | 10.69 | 8.09 |
113
About Your Fund’s Expenses
As a shareholder of the fund, you incur ongoing costs, which include costs for portfolio management, administrative services, and shareholder reports (like this one), among others. Operating expenses, which are deducted from a fund’s gross income, directly reduce the investment return of the fund.
A fund’s expenses are expressed as a percentage of its average net assets. This figure is known as the expense ratio. The examples on this page are intended to help you understand the ongoing costs (in dollars) of investing in your fund and to compare these costs with those of other mutual funds. The examples are based on an investment of $1,000 made at the beginning of the period shown and held for the entire period.
The accompanying table illustrates your fund’s costs in two ways:
• Based on actual fund return. This section helps you to estimate the actual expenses that you paid over the period. The “Ending Account Value” shown is derived from the fund’s actual return, and the third column shows the dollar amount that would have been paid by an investor who started with $1,000 in the fund. You may use the information here, together with the amount you invested, to estimate the expenses that you paid over the period.
To do so, simply divide your account value by $1,000 (for example, an $8,600 account value divided by $1,000 = 8.6), then multiply the result by the number given for your fund under the heading “Expenses Paid During Period.”
• Based on hypothetical 5% yearly return. This section is intended to help you compare your fund’s costs with those of other mutual funds. It assumes that the fund had a yearly return of 5% before expenses, but that the expense ratio is unchanged. In this case—because the return used is not the fund’s actual return—the results do not apply to your investment. The example is useful in making comparisons because the Securities and Exchange Commission requires all mutual funds to calculate expenses based on a 5% return. You can assess your fund’s costs by comparing this hypothetical example with the hypothetical examples that appear in shareholder reports of other funds.
Note that the expenses shown in the table are meant to highlight and help you compare ongoing costs only and do not reflect transaction costs incurred by the fund for buying and selling securities. Further, the expenses do not include any purchase, redemptions, or account service fees described in the fund prospectus. If such fees were applied to your account, your costs would be higher. Your fund does not carry a “sales load.” The calculations assume no shares were bought or sold during the period. Your actual costs may have been higher or lower, depending on the amount of your investment and the timing of any purchases or redemptions.
You can find more information about the fund’s expenses in the Financial Statements section of this report. For additional information on operating expenses and other shareholder costs, please refer to your fund’s current prospectus.
114
| | | | |
| Six Months Ended August 31, 2014 | | | | |
| | | Beginning | Ending | Expenses |
| | | Account Value | Account Value | Paid During |
| Index Fund | Share Class | 2/28/2014 | 8/31/2014 | Period |
| Based on Actual Fund Return | | | | |
| Consumer Discretionary | Admiral | $1,000.00 | $1,030.63 | $0.56 |
| | ETF | 1,000.00 | 1,030.70 | 0.56 |
| Consumer Staples | Admiral | $1,000.00 | $1,081.27 | $0.58 |
| | ETF | 1,000.00 | 1,081.44 | 0.58 |
| Energy | Admiral | $1,000.00 | $1,135.69 | $0.59 |
| | ETF | 1,000.00 | 1,135.72 | 0.59 |
| Financials | Admiral | $1,000.00 | $1,072.25 | $0.57 |
| | ETF | 1,000.00 | 1,072.20 | 0.57 |
| Health Care | Admiral | $1,000.00 | $1,073.44 | $0.57 |
| | ETF | 1,000.00 | 1,073.58 | 0.57 |
| Industrials | Admiral | $1,000.00 | $1,040.12 | $0.62 |
| | ETF | 1,000.00 | 1,040.33 | 0.57 |
| Information Technology | Admiral | $1,000.00 | $1,094.46 | $0.58 |
| | ETF | 1,000.00 | 1,105.17 | 0.58 |
| Materials | Admiral | $1,000.00 | $1,076.89 | $0.58 |
| | ETF | 1,000.00 | 1,076.75 | 0.58 |
| Telecommunication Services | Admiral | $1,000.00 | $1,105.13 | $0.58 |
| | ETF | 1,000.00 | 1,094.42 | 0.58 |
| Utilities | Admiral | $1,000.00 | $1,087.88 | $0.58 |
| | ETF | 1,000.00 | 1,087.79 | 0.58 |
| Based on Hypothetical 5% Yearly Return | | | |
| Consumer Discretionary | Admiral | $1,000.00 | $1,024.65 | $0.56 |
| | ETF | 1,000.00 | 1,024.65 | 0.56 |
| Consumer Staples | Admiral | $1,000.00 | $1,024.65 | $0.56 |
| | ETF | 1,000.00 | 1,024.65 | 0.56 |
| Energy | Admiral | $1,000.00 | $1,024.65 | $0.56 |
| | ETF | 1,000.00 | 1,024.65 | 0.56 |
| Financials | Admiral | $1,000.00 | $1,024.65 | $0.56 |
| | ETF | 1,000.00 | 1,024.65 | 0.56 |
| Health Care | Admiral | $1,000.00 | $1,024.65 | $0.56 |
| | ETF | 1,000.00 | 1,024.65 | 0.56 |
| Industrials | Admiral | $1,000.00 | $1,024.60 | $0.61 |
| | ETF | 1,000.00 | 1,024.65 | 0.56 |
| Information Technology | Admiral | $1,000.00 | $1,024.65 | $0.56 |
| | ETF | 1,000.00 | 1,024.65 | 0.56 |
| Materials | Admiral | $1,000.00 | $1,024.65 | $0.56 |
| | ETF | 1,000.00 | 1,024.65 | 0.56 |
| Telecommunication Services | Admiral | $1,000.00 | $1,024.65 | $0.56 |
| | ETF | 1,000.00 | 1,024.65 | 0.56 |
| Utilities | Admiral | $1,000.00 | $1,024.65 | $0.56 |
| | ETF | 1,000.00 | 1,024.65 | 0.56 |
The calculations are based on expenses incurred in the most recent six-month period. The funds’ annualized six-month expenseratios for that period are 0.11% for the Consumer Discretionary Index Fund Admiral Shares and 0.11% for the ETF Shares; 0.11% for theConsumer Staples Index Fund Admiral Shares and 0.11% for the ETF Shares; 0.11% for the Energy Index Fund Admiral Shares and 0.11%for the ETF Shares; 0.11% for the Financials Index Fund Admiral Shares and 0.11% for the ETF Shares; 0.11% for the Health Care IndexFund Admiral Shares and 0.11% for the ETF Shares; 0.12% for the Industrials Index Fund Admiral Shares and 0.11% for the ETF Shares;0.11% for the Information Technology Index Fund Admiral Shares and 0.11% for the ETF Shares; 0.11% for the Materials Index FundAdmiral Shares and 0.11% for the ETF Shares; 0.11% for the Telecommunication Services Index Fund Admiral Shares and 0.11% for theETF Shares; 0.11% for the Utilities Index Fund Admiral Shares and 0.11% for the ETF Shares. The dollar amounts shown as “ExpensesPaid” are equal to the annualized expense ratio multiplied by the average account value over the period, multiplied by the number ofdays in the most recent six-month period, then divided by the number of days in the most recent 12-month period.115
Trustees Approve Advisory Arrangements
The board of trustees of Vanguard Consumer Discretionary Index Fund, Consumer Staples Index Fund, Energy Index Fund, Financials Index Fund, Health Care Index Fund, Industrials Index Fund, Information Technology Index Fund, Materials Index Fund, Telecommunication Services Index Fund, and Utilities Index Fund has renewed each fund’s investment advisory arrangement with The Vanguard Group, Inc. (Vanguard). Vanguard’s Equity Investment Group—through its Equity Index Group—serves as the investment advisor for each fund. The board determined that continuing each fund’s internalized management structure was in the best interests of each fund and its shareholders.
The board based its decision upon an evaluation of the advisor’s investment staff, portfolio management process, and performance. The trustees considered the factors discussed below, among others. However, no single factor determined whether the board approved the arrangements. Rather, it was the totality of the circumstances that drove the board’s decision.
Nature, extent, and quality of services
The board considered the quality of each fund’s investment management services over both the short and long term and took into account the organizational depth and stability of the advisor. The board noted that Vanguard has been managing investments for more than three decades. The Equity Index Group adheres to a sound, disciplined investment management process; the team has considerable experience, stability, and depth.
The board concluded that Vanguard’s experience, stability, depth, and performance, among other factors, warranted continuation of each advisory arrangement.
Investment performance
The board considered the short- and long-term performance of each fund, including any periods of outperformance or underperformance relative to a target index and peer group. The board concluded that the performance was such that each advisory arrangement should continue. Information about the funds’ most recent performance can be found on the Performance Summary pages of this report.
Cost
The board concluded that each fund’s expense ratio was well below the average expense ratio charged by funds in its respective peer group and that each fund’s advisory fee rate was also well below its peer-group average. Information about the funds’ expenses appears in the About Your Fund’s Expenses section of this report as well as in the Financial Statements sections.
The board does not conduct a profitability analysis of Vanguard, because of Vanguard’s unique “at-cost” structure. Unlike most other mutual fund management companies, Vanguard is owned by the funds it oversees, and produces “profits” only in the form of reduced expenses for fund shareholders.
The benefit of economies of scale
The board concluded that each fund’s at-cost arrangement with Vanguard ensures that the funds will realize economies of scale as they grow, with the cost to shareholders declining as fund assets increase.
The board will consider whether to renew the advisory arrangements again after a one-year period.
116
Glossary
30-Day SEC Yield. A fund’s 30-day SEC yield is derived using a formula specified by the U.S. Securities and Exchange Commission. Under the formula, data related to the fund’s security holdings in the previous 30 days are used to calculate the fund’s hypothetical net income for that period, which is then annualized and divided by the fund’s estimated average net assets over the calculation period. For the purposes of this calculation, a security’s income is based on its current market yield to maturity (for bonds), its actual income (for asset-backed securities), or its projected dividend yield (for stocks). Because the SEC yield represents hypothetical annualized income, it will differ—at times significantly—from the fund’s actual experience. As a result, the fund’s income distributions may be higher or lower than implied by the SEC yield.
Beta. A measure of the magnitude of a fund’s past share-price fluctuations in relation to the ups and downs of a given market index. The index is assigned a beta of 1.00. Compared with a given index, a fund with a beta of 1.20 typically would have seen its share price rise or fall by 12% when the index rose or fell by 10%. For this report, beta is based on returns over the past 36 months for both the fund and the index. Note that a fund’s beta should be reviewed in conjunction with its R-squared (see definition below). The lower the R-squared, the less correlation there is between the fund and the index, and the less reliable beta is as an indicator of volatility.
Earnings Growth Rate. The average annual rate of growth in earnings over the past five years for the stocks now in a fund.
Equity Exposure. A measure that reflects a fund’s investments in stocks and stock futures. Any holdings in short-term reserves are excluded.
Expense Ratio. A fund’s total annual operating expenses expressed as a percentage of the fund’s average net assets. The expense ratio includes management administrative expenses, but does not include the transaction costs of buying and selling portfolio securities.
Foreign Holdings. The percentage of a fund represented by stocks or depositary receipts of companies based outside the United States.
Inception Date. The date on which the assets of a fund (or one of its share classes) are first invested in accordance with the fund’s investment objective. For funds with a subscription period, the inception date is the day after that period ends. Investment performance is measured from the inception date.
Median Market Cap. An indicator of the size of companies in which a fund invests; the midpoint of market capitalization (market price x shares outstanding) of a fund’s stocks, weighted by the proportion of the fund’s assets invested in each stock. Stocks representing half of the fund’s assets have market capitalizations above the median, and the rest are below it.
Price/Book Ratio. The share price of a stock divided by its net worth, or book value, per share. For a fund, the weighted average price/book ratio of the stocks it holds.
Price/Earnings Ratio. The ratio of a stock’s current price to its per-share earnings over the past year. For a fund, the weighted average P/E of the stocks it holds. P/E is an indicator of market expectations about corporate prospects; the higher the P/E, the greater the expectations for a company’s future growth.
R-Squared. A measure of how much of a fund’s past returns can be explained by the returns from the market in general, as measured by a given index. If a fund’s total returns were precisely synchronized with an index’s returns, its R-squared would be 1.00. If the fund’s returns bore no relationship to the index’s returns, its R-squared would be 0. For this report, R-squared is based on returns over the past 36 months for both the fund and the index.
Return on Equity. The annual average rate of return generated by a company during the past five years for each dollar of shareholder’s equity (net income divided by shareholder’s equity). For a fund, the weighted average return on equity for the companies whose stocks it holds.
Short-Term Reserves. The percentage of a fund invested in highly liquid, short-term securities that can be readily converted to cash.
Turnover Rate. An indication of the fund’s trading activity. Funds with high turnover rates incur higher transaction costs and may be more likely to distribute capital gains (which may be taxable to investors). The turnover rate excludes in-kind transactions, which have minimal impact on costs.
117
Benchmark Information
Spliced US IMI/Consumer Discretionary 25/50. MSCI US IMI/Consumer Discretionary
through February 26, 2010; MSCI US IMI/Consumer Discretionary 25/50 thereafter.
Spliced US IMI/Consumer Staples 25/50. MSCI US IMI/Consumer Staples through
February 26, 2010; MSCI US IMI/Consumer Staples 25/50 thereafter.
Spliced US IMI/Energy 25/50. MSCI US IMI/Energy through February 26, 2010;
MSCI US IMI/Energy 25/50 thereafter.
Spliced US IMI/Financials 25/50. MSCI US IMI/Financials through February 26, 2010;
MSCI US IMI/Financials 25/50 thereafter.
Spliced US IMI/Health Care 25/50. MSCI US IMI/Health Care through February 26, 2010;
MSCI US IMI/Health Care 25/50 thereafter.
Spliced US IMI/Industrials 25/50. MSCI US IMI/Industrials through February 26, 2010;
MSCI US IMI/Industrials 25/50 thereafter.
Spliced US IMI/Information Technology 25/50. MSCI US IMI/Information Technology Index
through February 26, 2010; MSCI US IMI/Information Technology 25/50 Index thereafter.
Spliced US IMI/Materials 25/50. MSCI US IMI/Materials through February 26, 2010;
MSCI US IMI/Materials 25/50 thereafter.
Spliced US IMI/Telecommunication Services 25/50. MSCI US IMI/Telecommunication
Services through February 26, 2010; MSCI US IMI/Telecommunication Services 25/50
thereafter.
Spliced US IMI/Utilities 25/50. MSCI US IMI/Utilities through February 26, 2010;
MSCI US IMI/Utilities 25/50 thereafter.
118
This page intentionally left blank.
This page intentionally left blank.
The People Who Govern Your Fund
The trustees of your mutual fund are there to see that the fund is operated and managed in your best interests since, as a shareholder, you are a part owner of the fund. Your fund’s trustees also serve on the board of directors of The Vanguard Group, Inc., which is owned by the Vanguard funds and provides services to them on an at-cost basis.
A majority of Vanguard’s board members are independent, meaning that they have no affiliation with Vanguard or the funds they oversee, apart from the sizable personal investments they have made as private individuals.
The independent board members have distinguished backgrounds in business, academia, and public service. Each of the trustees and executive officers oversees 177 Vanguard funds.
The following table provides information for each trustee and executive officer of the fund. More information about the trustees is in the Statement of Additional Information, which can be obtained, without charge, by contacting Vanguard at 800-662-7447, or online at vanguard.com.
| | | |
| Interested Trustee1 | products); Director of Skytop Lodge Corporation | Peter F. Volanakis | |
| | (hotels), the University Medical Center at Princeton, | Born 1955. Trustee Since July 2009. Principal |
| F. William McNabb III | the Robert Wood Johnson Foundation, and the Center | Occupation(s) During the Past Five Years: President |
| Born 1957. Trustee Since July 2009. Chairman of the | for Talent Innovation; Member of the Advisory Board | and Chief Operating Officer (retired 2010) of Corning |
| Board. Principal Occupation(s) During the Past Five | of the Maxwell School of Citizenship and Public | Incorporated (communications equipment); Trustee of |
| Years: Chairman of the Board of The Vanguard Group, | Affairs at Syracuse University. | Colby-Sawyer College; Member of the Advisory Board |
| Inc., and of each of the investment companies served | | of the Norris Cotton Cancer Center and of the Advisory |
| by The Vanguard Group, since January 2010; Director | F. Joseph Loughrey | Board of the Parthenon Group (strategy consulting). |
| of The Vanguard Group since 2008; Chief Executive | Born 1949. Trustee Since October 2009. Principal | | |
| Officer and President of The Vanguard Group, and of | Occupation(s) During the Past Five Years: President | Executive Officers | |
| each of the investment companies served by The | and Chief Operating Officer (retired 2009) of Cummins | | |
| Vanguard Group, since 2008; Director of Vanguard | Inc. (industrial machinery); Chairman of the Board of | Glenn Booraem | |
| Marketing Corporation; Managing Director of The | Hillenbrand, Inc. (specialized consumer services), and | Born 1967. Controller Since July 2010. Principal |
| Vanguard Group (1995–2008). | of Oxfam America; Director of SKF AB (industrial | Occupation(s) During the Past Five Years: Principal |
| | machinery), Hyster-Yale Materials Handling, Inc. | of The Vanguard Group, Inc.; Controller of each of |
| Independent Trustees | (forklift trucks), the Lumina Foundation for Education, | the investment companies served by The Vanguard |
| | and the V Foundation for Cancer Research; Member | Group; Assistant Controller of each of the investment |
| Emerson U. Fullwood | of the Advisory Council for the College of Arts and | companies served by The Vanguard Group |
| Born 1948. Trustee Since January 2008. Principal | Letters and of the Advisory Board to the Kellogg | (2001–2010). | |
| Occupation(s) During the Past Five Years: Executive | Institute for International Studies, both at the | | |
| Chief Staff and Marketing Officer for North America | University of Notre Dame. | Thomas J. Higgins | |
| and Corporate Vice President (retired 2008) of Xerox | | Born 1957. Chief Financial Officer Since September |
| Corporation (document management products and | Mark Loughridge | 2008. Principal Occupation(s) During the Past Five |
| services); Executive in Residence and 2009–2010 | Born 1953. Trustee Since March 2012. Principal | Years: Principal of The Vanguard Group, Inc.; Chief |
| Distinguished Minett Professor at the Rochester | Occupation(s) During the Past Five Years: Senior | Financial Officer of each of the investment companies |
| Institute of Technology; Director of SPX Corporation | Vice President and Chief Financial Officer (retired | served by The Vanguard Group; Treasurer of each of |
| (multi-industry manufacturing), the United Way of | 2013) at IBM (information technology services); | the investment companies served by The Vanguard |
| Rochester, Amerigroup Corporation (managed health | Fiduciary Member of IBM’s Retirement Plan | Group (1998–2008). | |
| care), the University of Rochester Medical Center, | Committee (2004–2013); Member of the Council | | |
| Monroe Community College Foundation, and North | on Chicago Booth. | Kathryn J. Hyatt |
| Carolina A&T University. | | Born 1955. Treasurer Since November 2008. |
| | Scott C. Malpass | Principal Occupation(s) During the Past Five Years: |
| Rajiv L. Gupta | Born 1962. Trustee Since March 2012. Principal | Principal of The Vanguard Group, Inc.; Treasurer of |
| Born 1945. Trustee Since December 2001.2 | Occupation(s) During the Past Five Years: Chief | each of the investment companies served by The |
| Principal Occupation(s) During the Past Five Years: | Investment Officer and Vice President at the | Vanguard Group; Assistant Treasurer of each of |
| Chairman and Chief Executive Officer (retired 2009) | University of Notre Dame; Assistant Professor | the investment companies served by The Vanguard |
| and President (2006–2008) of Rohm and Haas Co. | of Finance at the Mendoza College of Business at | Group (1988–2008). | |
| (chemicals); Director of Tyco International, Ltd. | Notre Dame; Member of the Notre Dame 403(b) | | |
| (diversified manufacturing and services), Hewlett- | Investment Committee; Board Member of TIFF | Heidi Stam |
| Packard Co. (electronic computer manufacturing), | Advisory Services, Inc. (investment advisor); | Born 1956. Secretary Since July 2005. Principal |
| and Delphi Automotive LLP (automotive components); | Member of the Investment Advisory Committees | Occupation(s) During the Past Five Years: Managing |
| Senior Advisor at New Mountain Capital. | of the Financial Industry Regulatory Authority | Director of The Vanguard Group, Inc.; General Counsel |
| | (FINRA) and of Major League Baseball. | of The Vanguard Group; Secretary of The Vanguard |
| Amy Gutmann | | Group and of each of the investment companies |
| Born 1949. Trustee Since June 2006. Principal | André F. Perold | served by The Vanguard Group; Director and Senior |
| Occupation(s) During the Past Five Years: President of | Born 1952. Trustee Since December 2004. Principal | Vice President of Vanguard Marketing Corporation. |
| the University of Pennsylvania; Christopher H. Browne | Occupation(s) During the Past Five Years: George | | |
| Distinguished Professor of Political Science, School of | Gund Professor of Finance and Banking, Emeritus | Vanguard Senior Management Team |
| Arts and Sciences, and Professor of Communication, | at the Harvard Business School (retired 2011); | Mortimer J. Buckley | Chris D. McIsaac |
| Annenberg School for Communication, with secondary | Chief Investment Officer and Managing Partner of | Kathleen C. Gubanich | Michael S. Miller |
| faculty appointments in the Department of Philosophy, | HighVista Strategies LLC (private investment firm); | Paul A. Heller | James M. Norris |
| School of Arts and Sciences, and at the Graduate | Director of Rand Merchant Bank; Overseer of the | Martha G. King | Glenn W. Reed |
| School of Education, University of Pennsylvania; | Museum of Fine Arts Boston. | John T. Marcante | |
| Trustee of the National Constitution Center; Chair | | | |
| of the Presidential Commission for the Study of | Alfred M. Rankin, Jr. | |
| Bioethical Issues. | Born 1941. Trustee Since January 1993. Principal | Chairman Emeritus and Senior Advisor |
| | Occupation(s) During the Past Five Years: Chairman, | John J. Brennan | |
| JoAnn Heffernan Heisen | President, and Chief Executive Officer of NACCO | Chairman, 1996–2009 | |
| Born 1950. Trustee Since July 1998. Principal | Industries, Inc. (housewares/lignite), and of Hyster- | Chief Executive Officer and President, 1996–2008 |
| Occupation(s) During the Past Five Years: Corporate | Yale Materials Handling, Inc. (forklift trucks); Chairman | | |
| Vice President and Chief Global Diversity Officer | of the Board of University Hospitals of Cleveland. | Founder | |
| (retired 2008) and Member of the Executive | | John C. Bogle | |
| Committee (1997–2008) of Johnson & Johnson | | Chairman and Chief Executive Officer, 1974–1996 |
| (pharmaceuticals/medical devices/consumer | | | |
1 Mr. McNabb is considered an “interested person,” as defined in the Investment Company Act of 1940, because he is an officer of the Vanguard funds.
2 December 2002 for Vanguard Equity Income Fund, the Vanguard Municipal Bond Funds, and the Vanguard State Tax-Exempt Funds.
| 
|
| | P.O. Box 2600 |
| | Valley Forge, PA 19482-2600 |
| |
| |
| |
| |
| Connect with Vanguard® > vanguard.com | |
| |
| |
| |
| |
| Fund Information > 800-662-7447 | All comparative mutual fund data are from Lipper Inc., a |
| Thomson Reuters Company, or Morningstar, Inc., unless |
| Direct Investor Account Services > 800-662-2739 | otherwise noted. |
| |
| Institutional Investor Services > 800-523-1036 | You can obtain a free copy of Vanguard’s proxy voting |
| | guidelines by visiting vanguard.com/proxyreporting or |
| Text Telephone for People | by calling Vanguard at 800-662-2739. The guidelines |
| With Hearing Impairment > 800-749-7273 | are also available from the SEC’s website, sec.gov. |
| | In addition, you may obtain a free report on how your |
| fund voted the proxies for securities it owned during |
| This material may be used in conjunction | the 12 months ended June 30. To get the report, visit |
| with the offering of shares of any Vanguard | either vanguard.com/proxyreporting or sec.gov. |
| fund only if preceded or accompanied by the | |
| fund’s current prospectus. | You can review and copy information about your fund |
| | at the SEC’s Public Reference Room in Washington, D.C. |
| The funds or securities referred to herein are not | To find out more about this public service, call the SEC |
| sponsored, endorsed, or promoted by MSCI, and MSCI | at 202-551-8090. Information about your fund is also |
| bears no liability with respect to any such funds or | available on the SEC’s website, and you can receive |
| securities. The prospectus or the Statement of Additional | copies of this information, for a fee, by sending a |
| Information contains a more detailed description of the | request in either of two ways: via e-mail addressed to |
| limited relationship MSCI has with Vanguard and any | publicinfo@sec.gov or via regular mail addressed to the |
| related funds. | Public Reference Section, Securities and Exchange |
| | Commission, Washington, DC 20549-1520. |
| |
| |
| |
| |
| | © 2014 The Vanguard Group, Inc. |
| | All rights reserved. |
| | Vanguard Marketing Corporation, |
| | Distributor. Q4830 102014 |

Annual Report | August 31, 2014
Vanguard Mega Cap Index Funds
Vanguard Mega Cap Index Fund
Vanguard Mega Cap Growth Index Fund
Vanguard Mega Cap Value Index Fund
The mission continues
On May 1, 1975, Vanguard began operations, a fledgling company based on the simple but revolutionary idea that a mutual fund company should be managed solely in the interest of its investors.
Four decades later, that revolutionary spirit continues to animate the enterprise. Vanguard remains on a mission to give investors the best chance of investment success.
As we mark our 40th anniversary, we thank you for entrusting your assets to Vanguard and giving us the opportunity to help you reach your financial goals in the decades to come.
| |
| Contents | |
| Your Fund’s Total Returns. | 1 |
| Chairman’s Letter. | 2 |
| Mega Cap Index Fund. | 10 |
| Mega Cap Growth Index Fund. | 26 |
| Mega Cap Value Index Fund. | 40 |
| Your Fund’s After-Tax Returns. | 56 |
| About Your Fund’s Expenses. | 57 |
| Trustees Approve Advisory Arrangements. | 59 |
| Glossary. | 60 |
Please note: The opinions expressed in this report are just that—informed opinions. They should not be considered promises or advice.
Also, please keep in mind that the information and opinions cover the period through the date on the front of this report. Of course, the
risks of investing in your fund are spelled out in the prospectus.
See the Glossary for definitions of investment terms used in this report.
About the cover: Since our founding, Vanguard has drawn inspiration from the enterprise and valor demonstrated by British
naval hero Horatio Nelson and his command at the Battle of the Nile in 1798. The photograph displays a replica of a merchant
ship from the same era as Nelson’s flagship, the HMS Vanguard.
Your Fund’s Total Returns
| |
| Fiscal Year Ended August 31, 2014 | |
| | Total |
| | Returns |
| Vanguard Mega Cap Index Fund | |
| Institutional Shares | 25.15% |
| ETF Shares | |
| Market Price | 25.17 |
| Net Asset Value | 25.13 |
| CRSP US Mega Cap Index | 25.24 |
| Large-Cap Core Funds Average | 23.43 |
| Large-Cap Core Funds Average: Derived from data provided by Lipper, a Thomson Reuters Company. | |
| Vanguard Mega Cap Growth Index Fund | |
| Institutional Shares | 28.07% |
| ETF Shares | |
| Market Price | 28.05 |
| Net Asset Value | 28.05 |
| CRSP US Mega Cap Growth Index | 28.17 |
| Large-Cap Growth Funds Average | 25.10 |
| Large-Cap Growth Funds Average: Derived from data provided by Lipper, a Thomson Reuters Company. | |
| Vanguard Mega Cap Value Index Fund | |
| Institutional Shares | 22.95% |
| ETF Shares | |
| Market Price | 22.93 |
| Net Asset Value | 22.92 |
| CRSP US Mega Cap Value Index | 23.05 |
| Large-Cap Value Funds Average | 22.67 |
| Large-Cap Value Funds Average: Derived from data provided by Lipper, a Thomson Reuters Company. |
Institutional Shares are available to certain institutional investors who meet specific administrative, service, and account-size criteria. TheVanguard ETF® Shares shown are traded on the NYSE Arca exchange and are available only through brokers. The table provides ETF returnsbased on both the NYSE Arca market price and the net asset value for a share. U.S. Pat. Nos. 6,879,964; 7,337,138; 7,720,749; 7,925,573;8,090,646; and 8,417,623.For the ETF Shares, the market price is determined by the midpoint of the bid-offer spread as of the closing time of the New York StockExchange (generally 4 p.m., Eastern time). The net asset value is also determined as of the NYSE closing time. For more information abouthow the ETF Shares' market prices have compared with their net asset value, visit vanguard.com, select your ETF, and then select the Priceand Performance tab. The ETF premium/discount analysis there shows the percentages of days on which the ETF Shares' market price wasabove or below the NAV.1

Chairman’s Letter
Dear Shareholder,
For the 12 months ended August 31, 2014, the Vanguard Mega Cap Index Funds produced healthy returns as a broad-based rally lifted stocks of all sizes. All three funds covered in this report successfully tracked their target indexes. The Mega Cap Growth Index Fund led the trio with a result of about 28%. The Mega Cap Value Index Fund returned about 23%, and the Mega Cap Index Fund––essentially a combination of the other two portfolios––returned about 25%.
All three funds’ results exceeded the average returns of their respective large-cap peer groups. The Growth Fund did best, surpassing its peers by about 3 percentage points. The Index Fund and Growth Index Fund benefited most from their technology holdings; financial companies contributed the most to the Value Index.
If you hold fund shares in a taxable account, you may wish to review the information on the funds’ after-tax returns that appears later in this report.
U.S. stocks cleared hurdles en route to new record highs
Despite an assortment of challenges, the broad U.S. stock market recorded an impressive return of about 25% for the fiscal year ended August 31. U.S. stocks registered positive results in 10 of those 12 months, and a July swoon was followed by an August flurry of record highs.
2
Investors applauded mostly solid corporate earnings, generally upbeat economic news, and the Federal Reserve’s continued accommodative policies. Still, turmoil in the Middle East and Ukraine, economic worries in Europe and China, and uncertainty about the Fed’s next moves pressured the market at times.
International stocks returned about 18%. Emerging markets, after sliding earlier in the period, rebounded to lead the way. The developed markets of the Pacific region and Europe trailed but still notched double-digit returns.
Defying analysts’ expectations, bond prices rose over the year
The broad U.S. taxable bond market returned 5.66%, rallying from the drubbing it took a year ago when investors fretted over the future of the Fed’s bond-buying program.
The Fed began reducing its purchases in January and has consistently cut them further since, with the goal of ending the program in October. Interest rates have not risen as forecast, however. The yield of the 10-year U.S. Treasury note ended August at 2.34%, down from 2.76% a year earlier. (Bond prices and yields move in opposite directions.)
| | | |
| Market Barometer | | | |
| |
| | | Average Annual Total Returns |
| | Periods Ended August 31, 2014 |
| | One | Three | Five |
| | Year | Years | Years |
| Stocks | | | |
| Russell 1000 Index (Large-caps) | 25.36% | 20.80% | 17.24% |
| Russell 2000 Index (Small-caps) | 17.68 | 19.00 | 17.03 |
| Russell 3000 Index (Broad U.S. market) | 24.74 | 20.65 | 17.22 |
| FTSE All-World ex US Index (International) | 18.04 | 9.48 | 8.44 |
| |
| Bonds | | | |
| Barclays U.S. Aggregate Bond Index (Broad taxable market) | 5.66% | 2.91% | 4.48% |
| Barclays Municipal Bond Index (Broad tax-exempt market) | 10.14 | 4.88 | 5.39 |
| Citigroup Three-Month U.S. Treasury Bill Index | 0.04 | 0.04 | 0.07 |
| |
| CPI | | | |
| Consumer Price Index | 1.70% | 1.64% | 1.96% |
3
Municipal bonds returned 10.14% as investors searched for tax-exempt income amid a limited supply of new issues. International bond markets (as measured by the Barclays Global Aggregate Index ex USD) returned 6.52%.
Following such a strong advance, it’s worth remembering that the current low yields imply lower future returns: As yields drop, the scope for further declines—and increases in prices—diminishes.
The Fed’s target of 0%–0.25% for short-term interest rates continued to restrict returns for money market funds and savings accounts.
Stocks of all sizes and sectors experienced a broad-based rally
Vanguard’s three Mega Cap Index Funds were created for shareholders seeking diversified exposure to the largest U.S. stocks or the growth or value segments of that group. The CRSP US Mega Cap Indexes represent about 70% of the U.S. stock market’s value. Mega-caps have generally delivered higher yields, smoother earnings, and a more consistent performance than their mid- and small-cap brethren.
During the past fiscal year, stocks of all sizes moved forward within a fairly tight range. Large- and mid-caps recorded nearly identical returns of about 25%. Small-caps,
| | | |
| Expense Ratios | | | |
| Your Fund Compared With Its Peer Group | | | |
| |
| | Institutional | ETF | Peer Group |
| | Shares | Shares | Average |
| Mega Cap Index Fund | 0.08% | 0.11% | 1.15% |
| Mega Cap Growth Index Fund | 0.10 | 0.11 | 1.22 |
| Mega Cap Value Index Fund | 0.08 | 0.11 | 1.14 |
The fund expense ratios shown are from the prospectus dated December 23, 2013, and represent estimated costs for the current fiscal year.For the fiscal year ended August 31, 2014, the expense ratios were: for the Mega Cap Index Fund, 0.08% for Institutional Shares and 0.11%for ETF Shares; for the Mega Cap Growth Index Fund, 0.10% for Institutional Shares and 0.11% for ETF Shares; and for the Mega Cap ValueIndex Fund, 0.08% for Institutional Shares and 0.11% for ETF Shares. Peer-group expense ratios are derived from data provided by Lipper, aThomson Reuters Company, and capture information through year-end 2013.Peer groups: For the Mega Cap Index Fund, Large-Cap Core Funds; for the Mega Cap Growth Index Fund, Large-Cap Growth Funds; and for theMega Cap Value Index Fund, Large-Cap Value Funds.4
which experienced some turbulence as concerns arose over their valuations, finished several steps behind.
Small-Cap stocks’ underperformance in the fiscal year stands in contrast to other recent years when large-cap stocks lagged. It’s good to keep in mind that leadership alternates over time, and that’s why Vanguard counsels that broad diversification is the best course. For more on the performance of small- and large-cap stocks, please see the text box on page 6.
Although all sectors played a role in the stock market’s strong advance, technology companies had the most influence in the Mega Cap category. Tech firms produced returns of 36% or higher for all three funds; the Growth Index Fund and Index Fund profited the most from their heavier exposure. Internet, software, hardware, and semiconductor providers were the top performers. The sector’s products and services became increasingly accessible to larger segments of the population in the U.S. and abroad as the economic growth engine rumbled forward.
A wide range of health care companies boosted all three Mega Cap Funds. Investors anticipated an increase in health care spending to coincide with the aging population and the expanded number of insured under the Affordable Care Act. The bulk of returns came from pharmaceutical and biotechnology companies as mergers and acquisitions,
| |
| Total Returns | |
| Inception Through August 31, 2014 | |
| | Average |
| | Annual Return |
| Mega Cap Index Fund Institutional Shares (Returns since inception: 2/22/2008) | 8.52% |
| Spliced Mega Cap Index | 8.58 |
| Large-Cap Core Funds Average | 7.36 |
| For a benchmark description, see the Glossary. | |
| Large-Cap Core Funds Average: Derived from data provided by Lipper, a Thomson Reuters Company. | |
| |
| Mega Cap Growth Index Fund Institutional Shares (Returns since inception: 4/3/2008) | 10.17% |
| Spliced Mega Cap Growth Index | 10.26 |
| Large-Cap Growth Funds Average | 8.11 |
| For a benchmark description, see the Glossary. | |
| Large-Cap Growth Funds Average: Derived from data provided by Lipper, a Thomson Reuters Company. | |
| |
| Mega Cap Value Index Fund Institutional Shares (Returns since inception: 3/5/2008) | 7.23% |
| Spliced Mega Cap Value Index | 7.25 |
| Large-Cap Value Funds Average | 7.19 |
For a benchmark description, see the Glossary.
Large-Cap Value Funds Average: Derived from data provided by Lipper, a Thomson Reuters Company. |
|
The figures shown represent past performance, which is not a guarantee of future results. (Current performance may be
lower or higher than the performance data cited. For performance data current to the most recent month-end, visit our
website at vanguard.com/performance.) Note, too, that both investment returns and principal value can fluctuate widely, so
an investor’s shares, when sold, could be worth more or less than their original cost.5
new drug development, and overseas opportunities combined with the larger trends lifting the industry. Health care providers and medical equipment and supply firms also excelled.
Financial stocks added the most to the Value Index Fund’s result, but the sector’s returns also topped 20% for the Growth Index Fund and the Index Fund. The economic recovery and strong
|
| Small-cap stocks versus large-caps: A case for diversification |
| |
| At times, particularly over the past dozen years, small-capitalization stocks have outpaced their |
| large-cap counterparts. This performance edge may appear compelling, but before making any |
| drastic decisions to tilt your portfolio heavily toward small-caps, consider two points. |
| |
| First, there’s no guarantee that small caps’ performance advantage will persist. As shown in |
| the chart below, these stocks had an extended period of underperformance in the 1990s, and |
| that could happen again. |
| |
| Second, investing in small companies’ stocks involves additional risks. These firms generally |
| have less business diversification, fewer financial resources, and less management depth than |
| larger enterprises. As a result, their stocks can be highly volatile. |
| |
| Investors with a heavy allocation to only one segment of the market can end up with greater |
| volatility and less diversification. A better alternative can be a market-cap-weighted equity |
| portfolio of stocks of all capitalizations that offers more diversification over the long term. |
| |
| Small-cap performance relative to large-caps |

| Chart compares the annual returns of the Russell 2000 Index, a small-cap benchmark, with those of the Russell 1000 Index, a large-cap benchmark. Source: Vanguard. |
|
6
investment environment supported virtually all types of large financial companies: banks, asset managers, consumer finance and investment services firms, insurers, and real estate investment trusts (REITs).
Industrial conglomerates, integrated oil and gas giants, broadcasting and entertainment firms in consumer services, and food and beverage companies in consumer goods also boosted the funds’ results. No sector was left too far behind, although the smaller basic materials, telecommunications, and utilities industries didn’t affect returns nearly as much as their larger counterparts.
Through all types of conditions, funds have tracked their indexes
Less than one year after their launch in December 2007, the three Mega Cap Index Funds suffered through one of history’s worst stock markets. Since March 2009, they have rebounded along with the broad U.S. stock market as the economy has steadily and slowly clawed back from the financial crisis and recession.
All three funds have succeeded in meeting their objective of closely tracking their respective target indexes. They managed this achievement amid the extreme volatility of their first year of existence and through five straight years of positive returns. Each has also exceeded the average return of its large-cap peer group—the Growth Index Fund by about 2 percentage points and the Index Fund by more than 1 point.
Vanguard Equity Investment Group, the funds’ advisor, is responsible for these accomplishments. The knowledge and skill of the team, whose sophisticated portfolio management techniques reflect more than 30 years of indexing experience, have kept the funds close on the heels of their benchmarks. Aiding in this effort were the funds’ low expenses, which allow you to keep more of their returns.
High costs don’t equal strong fund performance
The old adage “you get what you pay for” doesn’t apply to mutual funds. In fact, the reverse is true: Research suggests that higher costs are consistent with weaker returns. (See, for example, Shopping for Alpha: You Get What You Don’t Pay For at vanguard.com/research.)
Shouldn’t paying the highest fees allow you to purchase the services of the greatest talents and therefore get the best returns? As it turns out, the data don’t really support that argument. The explanation is simple: Every dollar paid for management fees is a dollar less earning potential return. Keeping expenses down can help narrow the gap between what the markets return and what investors actually earn.
That’s why Vanguard seeks to minimize costs on all our funds. Indexing, of course, is the purest expression of low-cost investing. In our actively managed funds, which are run by some of the most prominent advisory firms in the investment industry, we
7
work to keep fees low. It’s a strategy that reflects decades of experience and research, boiled down to one tenet: The less you pay, the more you keep.
As always, thank you for entrusting your assets to Vanguard.
Sincerely,

F. William McNabb III
Chairman and Chief Executive Officer
September 12, 2014
8
| | | | |
| Your Fund’s Performance at a Glance | | | | |
| August 31, 2013, Through August 31, 2014 | | | | |
| | | | Distributions Per Share |
| | Starting | Ending | Income | Capital |
| | Share Price | Share Price | Dividends | Gains |
| Vanguard Mega Cap Index Fund | | | | |
| Institutional Shares | $110.38 | $135.41 | $2.468 | $0.000 |
| ETF Shares | 55.99 | 68.69 | 1.237 | 0.000 |
| Vanguard Mega Cap Growth Index Fund | | | | |
| Institutional Shares | $124.49 | $157.21 | $1.990 | $0.000 |
| ETF Shares | 62.69 | 79.16 | 0.999 | 0.000 |
| Vanguard Mega Cap Value Index Fund | | | | |
| Institutional Shares | $98.45 | $118.18 | $2.606 | $0.000 |
| ETF Shares | 49.65 | 59.60 | 1.299 | 0.000 |
9
Mega Cap Index Fund
Fund Profile
As of August 31, 2014
| | |
| Share-Class Characteristics | |
| |
| | Institutional | ETF |
| | Shares | Shares |
| Ticker Symbol | VMCTX | MGC |
| Expense Ratio1 | 0.08% | 0.11% |
| 30-Day SEC Yield | 1.93% | 1.90% |
| | | |
| Portfolio Characteristics | | |
| | | | DJ |
| | | | U.S. |
| | | | Total |
| | | CRSP US | Market |
| | | Mega Cap | FA |
| | Fund | Index | Index |
| Number of Stocks | 304 | 304 | 3,709 |
| Median Market Cap | $89.1B | $89.1B | $48.0B |
| Price/Earnings Ratio | 19.0x | 19.0x | 20.7x |
| Price/Book Ratio | 2.8x | 2.8x | 2.7x |
| Return on Equity | 19.7% | 19.7% | 17.8% |
| Earnings Growth | | | |
| Rate | 15.5% | 15.5% | 15.3% |
| Dividend Yield | 2.0% | 2.0% | 1.8% |
| Foreign Holdings | 0.0% | 0.0% | 0.0% |
| Turnover Rate | 6% | — | — |
| Short-Term Reserves | -0.1% | — | — |
| | | |
| Sector Diversification (% of equity exposure) |
| | | | DJ |
| | | | U.S. |
| | | | Total |
| | | CRSP US | Market |
| | | Mega Cap | FA |
| | Fund | Index | Index |
| Basic Materials | 2.6% | 2.6% | 3.1% |
| Consumer Goods | 9.4 | 9.4 | 9.8 |
| Consumer Services | 12.8 | 12.8 | 13.3 |
| Financials | 17.5 | 17.5 | 18.3 |
| Health Care | 13.6 | 13.6 | 12.5 |
| Industrials | 10.5 | 10.5 | 12.6 |
| Oil & Gas | 10.6 | 10.6 | 9.5 |
| Technology | 17.6 | 17.6 | 15.5 |
| Telecommunications | 2.7 | 2.7 | 2.2 |
| Utilities | 2.7 | 2.7 | 3.2 |
| | |
| Volatility Measures | | |
| | | DJ |
| | Spliced | U.S. Total |
| | Mega Cap | Market |
| | Index | FA Index |
| R-Squared | 1.00 | 0.99 |
| Beta | 1.00 | 0.93 |
| These measures show the degree and timing of the fund’s fluctuations compared with the indexes over 36 months. |
|
| | |
| Ten Largest Holdings (% of total net assets) |
| Apple Inc. | Computer Hardware | 3.9% |
| Exxon Mobil Corp. | Integrated Oil & Gas | 2.7 |
| Microsoft Corp. | Software | 2.1 |
| Google Inc. | Internet | 2.1 |
| Johnson & Johnson | Pharmaceuticals | 1.9 |
| Wells Fargo & Co. | Banks | 1.7 |
| General Electric Co. | Diversified Industrials | 1.6 |
| Berkshire Hathaway Inc. | Reinsurance | 1.6 |
| Chevron Corp. | Integrated Oil & Gas | 1.6 |
| JPMorgan Chase & Co. | Banks | 1.4 |
| Top Ten | | 20.6% |
| The holdings listed exclude any temporary cash investments and |
| equity index products. | | |
Investment Focus
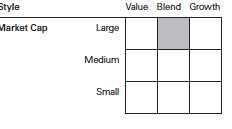
1 The expense ratios shown are from the prospectus dated December 23, 2013, and represent estimated costs for the current fiscal year. For the
fiscal year ended August 31, 2014, the expense ratios were 0.08% for Institutional Shares and 0.11% for ETF Shares.
10
Mega Cap Index Fund
Performance Summary
All of the returns in this report represent past performance, which is not a guarantee of future results that may be achieved by the fund. (Current performance may be lower or higher than the performance data cited. For performance data current to the most recent month-end, visit our website at vanguard.com/performance.) Note, too, that both investment returns and principal value can fluctuate widely, so an investor’s shares, when sold, could be worth more or less than their original cost. The returns shown do not reflect taxes that a shareholder would pay on fund distributions or on the sale of fund shares.
Cumulative Performance: December 17, 2007, Through August 31, 2014
Initial Investment of $10,000
| | | | | |
| | | | Average Annual Total Returns | |
| | | Periods Ended August 31, 2014 | |
| |
| | | | | Since | Final Value |
| | | One | Five | Inception | of a $10,000 |
| | | Year | Years | (12/17/2007) | Investment |
| |
| | Mega Cap Index Fund*ETF Shares | | | | |
| | Net Asset Value | 25.13% | 16.55% | 7.23% | $15,967 |
| | Mega Cap Index Fund*ETF Shares | | | | |
| | Market Price | 25.17 | 16.54 | 7.23 | 15,969 |
| |
| •••••••• | Spliced Mega Cap Index | 25.24 | 16.67 | 7.32 | 16,054 |
| |
| – – – – | Large-Cap Core Funds Average | 23.43 | 15.02 | 6.09 | 14,863 |
| | Dow Jones U.S. Total Stock Market | | | | |
| | Float Adjusted Index | 24.68 | 17.29 | 7.82 | 16,562 |
Large-Cap Core Funds Average: Derived from data provided by Lipper, a Thomson Reuters Company.
"Since Inception" performance is calculated from the ETF Shares’ inception date for both the fund and its comparative standards.
| | | | |
| | One | Five | Inception | of a $5,000,000 |
| | Year | Years | (2/22/2008) | Investment |
| Mega Cap Index Fund Institutional Shares | 25.15% | 16.58% | 8.52% | $8,521,975 |
| Spliced Mega Cap Index | 25.24 | 16.67 | 8.58 | 8,551,200 |
| Dow Jones U.S. Total Stock Market Float | | | | |
| Adjusted Index | 24.68 | 17.29 | 9.03 | 8,786,912 |
"Since Inception" performance is calculated from the Institutional Shares’ inception date for both the fund and its comparative standards.See Financial Highlights for dividend and capital gains information.11
Mega Cap Index Fund
| | | |
| Cumulative Returns of ETF Shares: December 17, 2007, Through August 31, 2014 | |
| | | | Since |
| | One | Five | Inception |
| | Year | Years | (12/17/2007) |
| Mega Cap Index Fund ETF Shares Market Price | 25.17% | 114.96% | 59.69% |
| Mega Cap Index Fund ETF Shares Net Asset Value | 25.13 | 115.09 | 59.67 |
| Spliced Mega Cap Index | 25.24 | 116.18 | 60.54 |
| "Since Inception" performance is calculated from the ETF Shares’ inception date for both the fund and its comparative standards. |
Fiscal-Year Total Returns (%): December 17, 2007, Through August 31, 2014
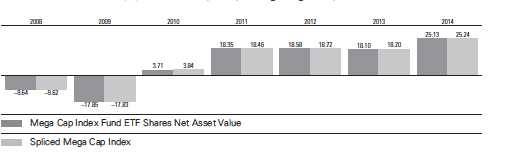
For a benchmark description, see the Glossary.
Average Annual Total Returns: Periods Ended June 30, 2014
This table presents returns through the latest calendar quarter—rather than through the end of the fiscal period.
Securities and Exchange Commission rules require that we provide this information.
| | | | |
| | Inception | One | Five | Since |
| | Date | Year | Years | Inception |
| Institutional Shares | 2/22/2008 | 24.61% | 18.39% | 8.31% |
| ETF Shares | 12/17/2007 | | | |
| Market Price | | 24.65 | 18.35 | 7.00 |
| Net Asset Value | | 24.60 | 18.36 | 7.00 |
12
Mega Cap Index Fund
Financial Statements
Statement of Net Assets
As of August 31, 2014
The fund reports a complete list of its holdings in regulatory filings four times in each fiscal year, at the quarter-ends. For the second and fourth fiscal quarters, the lists appear in the fund’s semiannual and annual reports to shareholders. For the first and third fiscal quarters, the fund files the lists with the Securities and Exchange Commission on Form N-Q. Shareholders can look up the fund’s Forms N-Q on the SEC’s website at sec.gov. Forms N-Q may also be reviewed and copied at the SEC’s Public Reference Room (see the back cover of this report for further information).
| | |
| | | Market |
| | | Value |
| | Shares | ($000) |
| Common Stocks (99.8%)1 | | |
| Basic Materials (2.6%) | | |
| Dow Chemical Co. | 85,635 | 4,586 |
| EI du Pont de Nemours | | |
| & Co. | 65,427 | 4,325 |
| LyondellBasell Industries NV | | |
| Class A | 31,911 | 3,649 |
| Praxair Inc. | 20,854 | 2,743 |
| Freeport-McMoRan Inc. | 73,800 | 2,684 |
| Ecolab Inc. | 19,207 | 2,205 |
| PPG Industries Inc. | 9,825 | 2,023 |
| Air Products & | | |
| Chemicals Inc. | 15,155 | 2,019 |
| International Paper Co. | 30,695 | 1,487 |
| Nucor Corp. | 22,710 | 1,234 |
| Mosaic Co. | 23,030 | 1,100 |
| Newmont Mining Corp. | 35,515 | 962 |
| | | 29,017 |
| Consumer Goods (9.4%) | | |
| Procter & Gamble Co. | 192,556 | 16,003 |
| Coca-Cola Co. | 281,442 | 11,742 |
| PepsiCo Inc. | 108,025 | 9,991 |
| Philip Morris | | |
| International Inc. | 106,458 | 9,111 |
| Altria Group Inc. | 141,330 | 6,089 |
| Ford Motor Co. | 276,438 | 4,813 |
| Monsanto Co. | 37,346 | 4,319 |
| Colgate-Palmolive Co. | 65,237 | 4,223 |
| Mondelez International Inc. | | |
| Class A | 114,283 | 4,136 |
| NIKE Inc. Class B | 49,818 | 3,913 |
| General Motors Co. | 91,250 | 3,176 |
| Kimberly-Clark Corp. | 26,810 | 2,895 |
| Kraft Foods Group Inc. | 42,441 | 2,500 |
| General Mills Inc. | 43,616 | 2,328 |
| Archer-Daniels-Midland Co. | 46,453 | 2,316 |
| Johnson Controls Inc. | 47,140 | 2,301 |
| VF Corp. | 24,423 | 1,566 |
| * Tesla Motors Inc. | 5,735 | 1,547 |
| Lorillard Inc. | 25,793 | 1,540 |
| | | |
| | | | Market |
| | | | Value |
| | | Shares | ($000) |
| | Mead Johnson Nutrition Co. | 14,325 | 1,369 |
| | Reynolds American Inc. | 22,796 | 1,333 |
| | Kellogg Co. | 20,355 | 1,322 |
| | Estee Lauder Cos. Inc. | | |
| | Class A | 16,763 | 1,288 |
| * | Michael Kors Holdings Ltd. | 13,187 | 1,057 |
| | Stanley Black & Decker Inc. | 11,109 | 1,016 |
| | Hershey Co. | 10,351 | 946 |
| | Activision Blizzard Inc. | 35,404 | 833 |
| | Brown-Forman Corp. | | |
| | Class B | 7,273 | 674 |
| | Campbell Soup Co. | 13,513 | 606 |
| | Coach Inc. | 9,726 | 358 |
| | | | 105,311 |
| Consumer Services (12.7%) | | |
| | Walt Disney Co. | 111,012 | 9,978 |
| | Home Depot Inc. | 97,280 | 9,096 |
| * | Amazon.com Inc. | 26,202 | 8,883 |
| | Wal-Mart Stores Inc. | 114,928 | 8,677 |
| | Comcast Corp. Class A | 146,964 | 8,043 |
| | CVS Caremark Corp. | 83,211 | 6,611 |
| | McDonald’s Corp. | 70,356 | 6,594 |
| * | Priceline Group Inc. | 3,727 | 4,638 |
| | Time Warner Inc. | 59,577 | 4,589 |
| * | eBay Inc. | 81,220 | 4,508 |
| | Twenty-First Century | | |
| | Fox Inc. Class A | 118,681 | 4,204 |
| | Starbucks Corp. | 50,867 | 3,958 |
| | Costco Wholesale Corp. | 31,186 | 3,776 |
| | Lowe’s Cos. Inc. | 70,972 | 3,727 |
| | Walgreen Co. | 61,071 | 3,696 |
| | McKesson Corp. | 16,426 | 3,204 |
| | Time Warner Cable Inc. | 19,868 | 2,939 |
| * | DIRECTV | 33,997 | 2,939 |
| | TJX Cos. Inc. | 47,426 | 2,827 |
| | Target Corp. | 44,996 | 2,703 |
| | Delta Air Lines Inc. | 60,362 | 2,389 |
| | Yum! Brands Inc. | 31,485 | 2,280 |
| | Viacom Inc. Class B | 27,776 | 2,254 |
| | CBS Corp. Class B | 34,739 | 2,060 |
13
Mega Cap Index Fund
| | | |
| | | | Market |
| | | | Value |
| | | Shares | ($000) |
| | Comcast Corp. | 37,325 | 2,038 |
| | American Airlines Group Inc. | 51,177 | 1,991 |
| * | Netflix Inc. | 4,063 | 1,941 |
| | Las Vegas Sands Corp. | 28,687 | 1,908 |
| | Cardinal Health Inc. | 24,137 | 1,779 |
| | Kroger Co. | 34,473 | 1,757 |
| | Sysco Corp. | 41,562 | 1,572 |
| | Omnicom Group Inc. | 18,483 | 1,331 |
| * | AutoZone Inc. | 2,313 | 1,246 |
| | Carnival Corp. | 31,730 | 1,202 |
| | Starwood Hotels & Resorts | | |
| | Worldwide Inc. | 13,737 | 1,161 |
| | Wynn Resorts Ltd. | 5,733 | 1,106 |
| | Whole Foods Market Inc. | 26,166 | 1,024 |
| * | Liberty Interactive Corp. | | |
| | Class A | 32,947 | 973 |
| * | DISH Network Corp. Class A | 14,925 | 967 |
| * | Bed Bath & Beyond Inc. | 13,626 | 876 |
| | Gap Inc. | 17,495 | 807 |
| | Macy’s Inc. | 12,817 | 798 |
| | Kohl’s Corp. | 13,181 | 775 |
| * | Sirius XM Holdings Inc. | 192,620 | 699 |
| * | Dollar General Corp. | 10,698 | 685 |
| * | Liberty Media Corp. | 13,800 | 669 |
| | Twenty-First Century | | |
| | Fox Inc. | 14,166 | 488 |
| * | Hilton Worldwide | | |
| | Holdings Inc. | 17,498 | 443 |
| * | Liberty Media Corp. Class A | 6,694 | 330 |
| | CBS Corp. Class A | 355 | 21 |
| | Viacom Inc. Class A | 4 | — |
| | | | 143,160 |
| Financials (17.5%) | | |
| | Wells Fargo & Co. | 374,901 | 19,285 |
| * | Berkshire Hathaway Inc. | | |
| | Class B | 128,546 | 17,643 |
| | JPMorgan Chase & Co. | 269,428 | 16,017 |
| | Bank of America Corp. | 748,013 | 12,035 |
| | Citigroup Inc. | 205,417 | 10,610 |
| | Visa Inc. Class A | 35,539 | 7,553 |
| | American Express Co. | 75,411 | 6,753 |
| | American International | | |
| | Group Inc. | 102,869 | 5,767 |
| | US Bancorp | 129,132 | 5,460 |
| | MasterCard Inc. Class A | 72,008 | 5,459 |
| | Goldman Sachs Group Inc. | 28,676 | 5,136 |
| | Simon Property Group Inc. | 22,144 | 3,765 |
| | Morgan Stanley | 105,171 | 3,608 |
| | MetLife Inc. | 64,035 | 3,505 |
| | Capital One Financial Corp. | 40,681 | 3,338 |
| | PNC Financial Services | | |
| | Group Inc. | 38,083 | 3,228 |
| | Bank of New York | | |
| | Mellon Corp. | 81,151 | 3,179 |
| | Prudential Financial Inc. | 32,810 | 2,943 |
| | American Tower Corporation | 28,263 | 2,787 |
| | |
| | | Market |
| | | Value |
| | Shares | ($000) |
| BlackRock Inc. | 7,718 | 2,551 |
| Travelers Cos. Inc. | 24,831 | 2,352 |
| ACE Ltd. | 21,642 | 2,301 |
| Charles Schwab Corp. | 78,561 | 2,240 |
| State Street Corp. | 29,161 | 2,100 |
| Marsh & McLennan Cos. Inc. | 39,037 | 2,073 |
| Discover Financial Services | 33,111 | 2,065 |
| Aflac Inc. | 32,371 | 1,982 |
| BB&T Corp. | 51,032 | 1,905 |
| Allstate Corp. | 30,802 | 1,894 |
| Crown Castle | | |
| International Corp. | 23,774 | 1,890 |
| Aon plc | 21,045 | 1,834 |
| Public Storage | 10,399 | 1,822 |
| CME Group Inc. | 22,723 | 1,739 |
| Equity Residential | 25,704 | 1,709 |
| Ameriprise Financial Inc. | 13,499 | 1,698 |
| Franklin Resources Inc. | 28,999 | 1,639 |
| Chubb Corp. | 17,518 | 1,611 |
| McGraw Hill Financial Inc. | 19,298 | 1,566 |
| Intercontinental Exchange Inc. | 8,188 | 1,547 |
| Prologis Inc. | 35,656 | 1,460 |
| SunTrust Banks Inc. | 37,857 | 1,442 |
| T. Rowe Price Group Inc. | 17,751 | 1,438 |
| HCP Inc. | 32,611 | 1,413 |
| Ventas Inc. | 20,872 | 1,373 |
| Boston Properties Inc. | 10,892 | 1,322 |
| Weyerhaeuser Co. | 37,542 | 1,275 |
| Vornado Realty Trust | 11,953 | 1,265 |
| Invesco Ltd. | 30,667 | 1,252 |
| Fifth Third Bancorp | 60,314 | 1,231 |
| Host Hotels & Resorts Inc. | 53,577 | 1,223 |
| Northern Trust Corp. | 16,018 | 1,111 |
| General Growth | | |
| Properties Inc. | 40,811 | 1,003 |
| Loews Corp. | 21,943 | 960 |
| Progressive Corp. | 37,956 | 950 |
| TD Ameritrade Holding Corp. | 17,538 | 581 |
| Synchrony Financial | 8,920 | 230 |
| Berkshire Hathaway Inc. | | |
| Class A | 1 | 206 |
| | | 196,324 |
| Health Care (13.6%) | | |
| Johnson & Johnson | 201,437 | 20,895 |
| Pfizer Inc. | 453,587 | 13,331 |
| Merck & Co. Inc. | 207,878 | 12,496 |
| Gilead Sciences Inc. | 109,256 | 11,754 |
| Amgen Inc. | 53,834 | 7,503 |
| AbbVie Inc. | 113,174 | 6,256 |
| UnitedHealth Group Inc. | 69,817 | 6,052 |
| Bristol-Myers Squibb Co. | 117,966 | 5,975 |
| Biogen Idec Inc. | 16,883 | 5,792 |
| Celgene Corp. | 56,947 | 5,411 |
| Eli Lilly & Co. | 71,785 | 4,563 |
| Medtronic Inc. | 71,163 | 4,544 |
| Abbott Laboratories | 106,978 | 4,519 |
14
Mega Cap Index Fund
| | | |
| | | | Market |
| | | | Value |
| | | Shares | ($000) |
| * | Express Scripts Holding Co. | 55,179 | 4,079 |
| * | Actavis plc | 17,898 | 4,062 |
| | Allergan Inc. | 21,177 | 3,466 |
| | Thermo Fisher Scientific Inc. | 28,342 | 3,407 |
| | Baxter International Inc. | 38,539 | 2,890 |
| | Covidien plc | 32,149 | 2,792 |
| * | Alexion Pharmaceuticals Inc. | 14,053 | 2,379 |
| | WellPoint Inc. | 19,899 | 2,318 |
| | Aetna Inc. | 25,509 | 2,095 |
| * | Regeneron | | |
| | Pharmaceuticals Inc. | 5,259 | 1,843 |
| | Cigna Corp. | 19,183 | 1,815 |
| | Stryker Corp. | 20,227 | 1,685 |
| | Becton Dickinson and Co. | 13,735 | 1,609 |
| * | HCA Holdings Inc. | 22,955 | 1,603 |
| | Humana Inc. | 11,035 | 1,421 |
| | St. Jude Medical Inc. | 20,305 | 1,332 |
| * | Intuitive Surgical Inc. | 2,743 | 1,289 |
| | Zoetis Inc. | 35,757 | 1,267 |
| | Zimmer Holdings Inc. | 11,926 | 1,184 |
| * | Illumina Inc. | 4,555 | 817 |
| | Perrigo Co. plc | 4,568 | 679 |
| | | | 153,123 |
| Industrials (10.5%) | | |
| | General Electric Co. | 713,756 | 18,543 |
| | Union Pacific Corp. | 64,513 | 6,791 |
| | 3M Co. | 46,521 | 6,699 |
| | United Technologies Corp. | 62,014 | 6,696 |
| | Boeing Co. | 46,753 | 5,928 |
| | Honeywell International Inc. | 52,946 | 5,042 |
| | United Parcel Service Inc. | | |
| | Class B | 50,296 | 4,895 |
| | Caterpillar Inc. | 44,434 | 4,846 |
| | Accenture plc Class A | 45,102 | 3,656 |
| | Lockheed Martin Corp. | 19,358 | 3,368 |
| | Danaher Corp. | 42,329 | 3,243 |
| | Emerson Electric Co. | 49,989 | 3,200 |
| | FedEx Corp. | 20,015 | 2,960 |
| | Automatic Data | | |
| | Processing Inc. | 34,344 | 2,867 |
| | General Dynamics Corp. | 20,722 | 2,554 |
| | Precision Castparts Corp. | 10,324 | 2,520 |
| | Illinois Tool Works Inc. | 28,004 | 2,470 |
| | Eaton Corp. plc | 33,995 | 2,373 |
| | Norfolk Southern Corp. | 22,023 | 2,357 |
| | CSX Corp. | 71,557 | 2,212 |
| | Deere & Co. | 25,957 | 2,183 |
| | Raytheon Co. | 22,225 | 2,141 |
| | Cummins Inc. | 13,059 | 1,895 |
| | TE Connectivity Ltd. | 29,158 | 1,828 |
| | Northrop Grumman Corp. | 13,663 | 1,738 |
| * | LinkedIn Corp. Class A | 7,483 | 1,689 |
| | PACCAR Inc. | 25,238 | 1,585 |
| | Waste Management Inc. | 31,588 | 1,484 |
| | Tyco International Ltd. | 32,941 | 1,470 |
| | Agilent Technologies Inc. | 23,700 | 1,355 |
| | | |
| | | | Market |
| | | | Value |
| | | Shares | ($000) |
| | Parker-Hannifin Corp. | 10,549 | 1,218 |
| | Rockwell Automation Inc. | 9,809 | 1,144 |
| | Ingersoll-Rand plc | 18,333 | 1,104 |
| | Dover Corp. | 11,807 | 1,038 |
| | Paychex Inc. | 23,292 | 970 |
| | Republic Services Inc. | | |
| | Class A | 19,142 | 753 |
| | Xerox Corp. | 39,425 | 545 |
| | Fluor Corp. | 5,756 | 425 |
| | | | 117,785 |
| Oil & Gas (10.6%) | | |
| | Exxon Mobil Corp. | 305,698 | 30,405 |
| | Chevron Corp. | 135,504 | 17,541 |
| | Schlumberger Ltd. | 92,590 | 10,152 |
| | ConocoPhillips | 87,380 | 7,097 |
| | Occidental Petroleum Corp. | 55,897 | 5,798 |
| | EOG Resources Inc. | 38,919 | 4,276 |
| | Anadarko Petroleum Corp. | 35,901 | 4,046 |
| | Halliburton Co. | 57,111 | 3,861 |
| | Phillips 66 | 40,331 | 3,510 |
| | Williams Cos. Inc. | 47,323 | 2,813 |
| | Apache Corp. | 27,496 | 2,800 |
| | National Oilwell Varco Inc. | 30,596 | 2,644 |
| | Baker Hughes Inc. | 31,008 | 2,144 |
| | Pioneer Natural | | |
| | Resources Co. | 10,198 | 2,128 |
| | Devon Energy Corp. | 27,560 | 2,079 |
| | Valero Energy Corp. | 37,909 | 2,052 |
| | Hess Corp. | 20,152 | 2,037 |
| | Marathon Oil Corp. | 48,215 | 2,010 |
| | Kinder Morgan Inc. | 47,388 | 1,908 |
| | Noble Energy Inc. | 25,598 | 1,847 |
| | Marathon Petroleum Corp. | 18,415 | 1,676 |
| | Chesapeake Energy Corp. | 42,793 | 1,164 |
| * | Cameron International Corp. | 14,465 | 1,075 |
| * | FMC Technologies Inc. | 16,703 | 1,033 |
| * | Southwestern Energy Co. | 25,073 | 1,032 |
| | Ensco plc Class A | 16,544 | 835 |
| * | Weatherford International plc | 24,866 | 589 |
| * | Continental Resources Inc. | 3,326 | 536 |
| | | | 119,088 |
| Technology (17.5%) | | |
| | Apple Inc. | 429,165 | 43,989 |
| | Microsoft Corp. | 529,152 | 24,039 |
| | International Business | | |
| | Machines Corp. | 72,102 | 13,865 |
| | Intel Corp. | 354,201 | 12,369 |
| * | Google Inc. Class A | 20,044 | 11,673 |
| * | Google Inc. Class C | 20,399 | 11,660 |
| * | Facebook Inc. Class A | 141,951 | 10,621 |
| | Oracle Corp. | 237,948 | 9,882 |
| | QUALCOMM Inc. | 120,232 | 9,150 |
| | Cisco Systems Inc. | 364,584 | 9,111 |
| | Hewlett-Packard Co. | 134,828 | 5,123 |
| | EMC Corp. | 145,514 | 4,297 |
15
Mega Cap Index Fund
| | | |
| | | | Market |
| | | | Value |
| | | Shares | ($000) |
| | Texas Instruments Inc. | 76,855 | 3,703 |
| * | Yahoo! Inc. | 64,339 | 2,478 |
| * | Micron Technology Inc. | 75,996 | 2,477 |
| * | salesforce.com inc | 41,556 | 2,456 |
| * | Adobe Systems Inc. | 33,661 | 2,420 |
| | Applied Materials Inc. | 86,460 | 1,998 |
| * | Cognizant Technology | | |
| | Solutions Corp. Class A | 43,210 | 1,976 |
| | Corning Inc. | 92,828 | 1,936 |
| | Intuit Inc. | 19,278 | 1,604 |
| * | Twitter Inc. | 31,461 | 1,565 |
| | Broadcom Corp. Class A | 38,043 | 1,498 |
| | Symantec Corp. | 49,052 | 1,191 |
| | Analog Devices Inc. | 22,330 | 1,142 |
| | NetApp Inc. | 23,494 | 991 |
| | Motorola Solutions Inc. | 16,203 | 962 |
| | SanDisk Corp. | 8,029 | 787 |
| | CA Inc. | 21,991 | 621 |
| * | VMware Inc. Class A | 6,005 | 592 |
| * | Citrix Systems Inc. | 5,782 | 406 |
| | Altera Corp. | 11,043 | 390 |
| | Juniper Networks Inc. | 15,927 | 369 |
| | | | 197,341 |
| Telecommunications (2.7%) | | |
| | Verizon | | |
| | Communications Inc. | 294,869 | 14,690 |
| | AT&T Inc. | 369,240 | 12,909 |
| | CenturyLink Inc. | 40,670 | 1,667 |
| * | T-Mobile US Inc. | 19,789 | 595 |
| * | Sprint Corp. | 55,271 | 310 |
| | | | 30,171 |
| Utilities (2.7%) | | |
| | Duke Energy Corp. | 50,357 | 3,726 |
| | NextEra Energy Inc. | 31,073 | 3,059 |
| | Dominion Resources Inc. | 41,442 | 2,910 |
| | Southern Co. | 63,440 | 2,817 |
| | Exelon Corp. | 61,286 | 2,048 |
| | Spectra Energy Corp. | 47,863 | 1,994 |
| | American Electric | | |
| | Power Co. Inc. | 34,685 | 1,863 |
| | Sempra Energy | 16,552 | 1,754 |
| | PPL Corp. | 44,836 | 1,553 |
| | PG&E Corp. | 33,050 | 1,536 |
| | Edison International | 23,240 | 1,374 |
| | Public Service Enterprise | | |
| | Group Inc. | 35,848 | 1,340 |
| | Consolidated Edison Inc. | 20,910 | 1,211 |
| | Xcel Energy Inc. | 35,756 | 1,146 |
| | FirstEnergy Corp. | 30,055 | 1,029 |
| | Entergy Corp. | 12,801 | 991 |
| | | | 30,351 |
| Total Common Stocks | | |
| (Cost $771,413) | | 1,121,671 |
| | | |
| | | | Market |
| | | | Value |
| | | Shares | ($000) |
| Temporary Cash Investments (0.1%)1 | |
| Money Market Fund (0.1%) | | |
| 2 | Vanguard Market Liquidity | | |
| | Fund, 0.113% | 910,071 | 910 |
| |
| | | Face | |
| | | Amount | |
| | | ($000) | |
| U.S. Government and Agency Obligations (0.0%) |
| 3,4 | Fannie Mae Discount | | |
| | Notes, 0.075%, 10/15/14 | 100 | 100 |
| 4,5 | Federal Home Loan Bank | | |
| | Discount Notes, 0.080%, | | |
| | 10/8/14 | 100 | 100 |
| | | | 200 |
| Total Temporary Cash Investments | |
| (Cost $1,110) | | 1,110 |
| Total Investments (99.9%) | | |
| (Cost $772,523) | | 1,122,781 |
| Other Assets and Liabilities (0.1%) | |
| Other Assets | | 2,527 |
| Liabilities | | (1,140) |
| | | | 1,387 |
| Net Assets (100%) | | 1,124,168 |
16
Mega Cap Index Fund
| |
| At August 31, 2014, net assets consisted of: |
| | Amount |
| | ($000) |
| Paid-in Capital | 789,706 |
| Undistributed Net Investment Income | 3,938 |
| Accumulated Net Realized Losses | (19,791) |
| Unrealized Appreciation (Depreciation) | |
| Investment Securities | 350,258 |
| Futures Contracts | 57 |
| Net Assets | 1,124,168 |
| |
| |
| Institutional Shares—Net Assets | |
| Applicable to 2,316,462 outstanding | |
| $.001 par value shares of beneficial | |
| interest (unlimited authorization) | 313,670 |
| Net Asset Value Per Share— | |
| Institutional Shares | $135.41 |
| |
| |
| ETF Shares—Net Assets | |
| Applicable to 11,800,000 outstanding | |
| $.001 par value shares of beneficial | |
| interest (unlimited authorization) | 810,498 |
| Net Asset Value Per Share— | |
| ETF Shares | $68.69 |
See Note A in Notes to Financial Statements.
* Non-income-producing security.
1 The fund invests a portion of its cash reserves in equity markets through the use of index futures contracts. After giving effect to futures
investments, the fund’s effective common stock and temporary cash investment positions represent 100.0% and -0.1%, respectively, of
net assets.
2 Affiliated money market fund available only to Vanguard funds and certain trusts and accounts managed by Vanguard. Rate shown is
the 7-day yield.
3 The issuer was placed under federal conservatorship in September 2008; since that time, its daily operations have been managed by the
Federal Housing Finance Agency and it receives capital from the U.S. Treasury, as needed to maintain a positive net worth, in exchange
for senior preferred stock.
4 Securities with a value of $200,000 have been segregated as initial margin for open futures contracts.
5 The issuer operates under a congressional charter; its securities are generally neither guaranteed by the U.S. Treasury nor backed by
the full faith and credit of the U.S. government.
See accompanying Notes, which are an integral part of the Financial Statements.
17
Mega Cap Index Fund
Statement of Operations
| |
| | Year Ended |
| | August 31, 2014 |
| | ($000) |
| Investment Income | |
| Income | |
| Dividends | 20,856 |
| Interest1 | 2 |
| Securities Lending | 11 |
| Total Income | 20,869 |
| Expenses | |
| The Vanguard Group—Note B | |
| Investment Advisory Services | 161 |
| Management and Administrative—Institutional Shares | 133 |
| Management and Administrative—ETF Shares | 447 |
| Marketing and Distribution—Institutional Shares | 42 |
| Marketing and Distribution—ETF Shares | 140 |
| Custodian Fees | 25 |
| Auditing Fees | 32 |
| Shareholders’ Reports—Institutional Shares | — |
| Shareholders’ Reports—ETF Shares | 16 |
| Trustees’ Fees and Expenses | 1 |
| Total Expenses | 997 |
| Net Investment Income | 19,872 |
| Realized Net Gain (Loss) | |
| Investment Securities Sold | 44,435 |
| Futures Contracts | 442 |
| Realized Net Gain (Loss) | 44,877 |
| Change in Unrealized Appreciation (Depreciation) | |
| Investment Securities | 154,840 |
| Futures Contracts | 60 |
| Change in Unrealized Appreciation (Depreciation) | 154,900 |
| Net Increase (Decrease) in Net Assets Resulting from Operations | 219,649 |
| 1 Interest income from an affiliated company of the fund was $2,000. |
See accompanying Notes, which are an integral part of the Financial Statements.
18
Mega Cap Index Fund
Statement of Changes in Net Assets
| | |
| | Year Ended August 31, |
| | 2014 | 2013 |
| | ($000) | ($000) |
| Increase (Decrease) in Net Assets | | |
| Operations | | |
| Net Investment Income | 19,872 | 18,376 |
| Realized Net Gain (Loss) | 44,877 | 8,104 |
| Change in Unrealized Appreciation (Depreciation) | 154,900 | 105,387 |
| Net Increase (Decrease) in Net Assets Resulting from Operations | 219,649 | 131,867 |
| Distributions | | |
| Net Investment Income | | |
| Institutional Shares | (6,371) | (6,464) |
| ETF Shares | (13,330) | (11,412) |
| Realized Capital Gain | | |
| Institutional Shares | — | — |
| ETF Shares | — | — |
| Total Distributions | (19,701) | (17,876) |
| Capital Share Transactions | | |
| Institutional Shares | (88,842) | 48,349 |
| ETF Shares | 85,731 | 73,926 |
| Net Increase (Decrease) from Capital Share Transactions | (3,111) | 122,275 |
| Total Increase (Decrease) | 196,837 | 236,266 |
| Net Assets | | |
| Beginning of Period | 927,331 | 691,065 |
| End of Period1 | 1,124,168 | 927,331 |
1 Net Assets—End of Period includes undistributed (overdistributed) net investment income of $3,938,000 and $3,767,000.See accompanying Notes, which are an integral part of the Financial Statements.
19
Mega Cap Index Fund
Financial Highlights
| | | | | |
| Institutional Shares | | | | | |
| |
| For a Share Outstanding | Year Ended August 31, |
| Throughout Each Period | 2014 | 2013 | 2012 | 2011 | 2010 |
| Net Asset Value, Beginning of Period | $110.38 | $95.66 | $82.40 | $71.03 | $69.95 |
| Investment Operations | | | | | |
| Net Investment Income | 2.498 | 2.373 | 2.000 | 1.676 | 1.657 |
| Net Realized and Unrealized Gain (Loss) | | | | | |
| on Investments | 25.000 | 14.727 | 13.113 | 11.379 | 1.033 |
| Total from Investment Operations | 27.498 | 17.100 | 15.113 | 13.055 | 2.690 |
| Distributions | | | | | |
| Dividends from Net Investment Income | (2.468) | (2.380) | (1.853) | (1.685) | (1.610) |
| Distributions from Realized Capital Gains | — | — | — | — | — |
| Total Distributions | (2.468) | (2.380) | (1.853) | (1.685) | (1.610) |
| Net Asset Value, End of Period | $135.41 | $110.38 | $95.66 | $82.40 | $71.03 |
| |
| Total Return | 25.15% | 18.13% | 18.63% | 18.38% | 3.74% |
| |
| Ratios/Supplemental Data | | | | | |
| Net Assets, End of Period (Millions) | $314 | $339 | $250 | $152 | $92 |
| Ratio of Total Expenses to Average Net Assets | 0.08% | 0.08% | 0.08% | 0.10% | 0.11% |
| Ratio of Net Investment Income to | | | | | |
| Average Net Assets | 2.03% | 2.29% | 2.28% | 2.01% | 2.24% |
| Portfolio Turnover Rate1 | 6% | 10% | 19% | 8% | 7% |
1 Excludes the value of portfolio securities received or delivered as a result of in-kind purchases or redemptions of the fund’s capital shares,including ETF Creation Units.See accompanying Notes, which are an integral part of the Financial Statements.
20
Mega Cap Index Fund
Financial Highlights
| | | | | |
| ETF Shares | | | | | |
| |
| For a Share Outstanding | Year Ended August 31, |
| Throughout Each Period | 2014 | 2013 | 2012 | 2011 | 2010 |
| Net Asset Value, Beginning of Period | $55.99 | $48.52 | $41.80 | $36.03 | $35.49 |
| Investment Operations | | | | | |
| Net Investment Income | 1.250 | 1.189 | 1.000 | .842 | . 834 |
| Net Realized and Unrealized Gain (Loss) | | | | | |
| on Investments | 12.687 | 7.471 | 6.648 | 5.774 | .517 |
| Total from Investment Operations | 13.937 | 8.660 | 7.648 | 6.616 | 1.351 |
| Distributions | | | | | |
| Dividends from Net Investment Income | (1.237) | (1.190) | (.928) | (.846) | (.811) |
| Distributions from Realized Capital Gains | — | — | — | — | — |
| Total Distributions | (1.237) | (1.190) | (.928) | (.846) | (.811) |
| Net Asset Value, End of Period | $68.69 | $55.99 | $48.52 | $41.80 | $36.03 |
| |
| Total Return | 25.13% | 18.10% | 18.58% | 18.35% | 3.71% |
| |
| Ratios/Supplemental Data | | | | | |
| Net Assets, End of Period (Millions) | $810 | $588 | $442 | $313 | $227 |
| Ratio of Total Expenses to Average Net Assets | 0.11% | 0.11% | 0.12% | 0.12% | 0.13% |
| Ratio of Net Investment Income to | | | | | |
| Average Net Assets | 2.00% | 2.26% | 2.24% | 1.99% | 2.22% |
| Portfolio Turnover Rate1 | 6% | 10% | 19% | 8% | 7% |
1 Excludes the value of portfolio securities received or delivered as a result of in-kind purchases or redemptions of the fund’s capital shares,including ETF Creation Units.See accompanying Notes, which are an integral part of the Financial Statements.
21
Mega Cap Index Fund
Notes to Financial Statements
Vanguard Mega Cap Index Fund is registered under the Investment Company Act of 1940 as an open-end investment company, or mutual fund. The fund offers two classes of shares: Institutional Shares and ETF Shares. Institutional Shares are designed for investors who meet certain administrative, service, and account-size criteria. ETF Shares are listed for trading on NYSE Arca; they can be purchased and sold through a broker.
A. The following significant accounting policies conform to generally accepted accounting principles for U.S. investment companies. The fund consistently follows such policies in preparing its financial statements.
1. Security Valuation: Securities are valued as of the close of trading on the New York Stock Exchange (generally 4 p.m., Eastern time) on the valuation date. Equity securities are valued at the latest quoted sales prices or official closing prices taken from the primary market in which each security trades; such securities not traded on the valuation date are valued at the mean of the latest quoted bid and asked prices. Securities for which market quotations are not readily available, or whose values have been materially affected by events occurring before the fund’s pricing time but after the close of the securities’ primary markets, are valued by methods deemed by the board of trustees to represent fair value. Investments in Vanguard Market Liquidity Fund are valued at that fund’s net asset value. Temporary cash investments acquired over 60 days to maturity are valued using the latest bid prices or using valuations based on a matrix system (which considers such factors as security prices, yields, maturities, and ratings), both as furnished by independent pricing services. Other temporary cash investments are valued at amortized cost, which approximates market value.
2. Futures Contracts: The fund uses index futures contracts to a limited extent, with the objectives of maintaining full exposure to the stock market, enhancing returns, maintaining liquidity, and minimizing transaction costs. The fund may purchase futures contracts to immediately invest incoming cash in the market, or sell futures in response to cash outflows, thereby simulating a fully invested position in the underlying index while maintaining a cash balance for liquidity. The fund may seek to enhance returns by using futures contracts instead of the underlying securities when futures are believed to be priced more attractively than the underlying securities. The primary risks associated with the use of futures contracts are imperfect correlation between changes in market values of stocks held by the fund and the prices of futures contracts, and the possibility of an illiquid market. Counterparty risk involving futures is mitigated because a regulated clearinghouse is the counterparty instead of the clearing broker. To further mitigate counterparty risk, the fund trades futures contracts on an exchange, monitors the financial strength of its clearing brokers and clearinghouse, and has entered into clearing agreements with its clearing brokers. The clearinghouse imposes initial margin requirements to secure the fund’s performance and requires daily settlement of variation margin representing changes in the market value of each contract.
Futures contracts are valued at their quoted daily settlement prices. The aggregate settlement values of the contracts are not recorded in the Statement of Net Assets. Fluctuations in the value of the contracts are recorded in the Statement of Net Assets as an asset (liability) and in the Statement of Operations as unrealized appreciation (depreciation) until the contracts are closed, when they are recorded as realized futures gains (losses).
During the year ended August 31, 2014, the fund’s average investments in long and short futures contracts represented less than 1% and 0% of net assets, respectively, based on the average of aggregate settlement values at each quarter-end during the period.
22
Mega Cap Index Fund
3. Federal Income Taxes: The fund intends to continue to qualify as a regulated investment company and distribute all of its taxable income. Management has analyzed the fund’s tax positions taken for all open federal income tax years (August 31, 2011–2014), and has concluded that no provision for federal income tax is required in the fund’s financial statements.
4. Distributions: Distributions to shareholders are recorded on the ex-dividend date.
5. Securities Lending: To earn additional income, the fund lends its securities to qualified institutional borrowers. Security loans are required to be secured at all times by collateral in an amount at least equal to the market value of securities loaned. Daily market fluctuations could cause the value of loaned securities to be more or less than the value of the collateral received. When this occurs, the collateral is adjusted and settled on the next business day. The fund further mitigates its counterparty risk by entering into securities lending transactions only with a diverse group of prequalified counter-parties, monitoring their financial strength, and entering into master securities lending agreements with its counterparties. The master securities lending agreements provide that, in the event of a counterparty’s default (including bankruptcy), the fund may terminate any loans with that borrower, determine the net amount owed, and sell or retain the collateral up to the net amount owed to the fund; however, such actions may be subject to legal proceedings. While collateral mitigates counterparty risk, in the absence of a default the fund may experience delays and costs in recovering the securities loaned. The fund invests cash collateral received in Vanguard Market Liquidity Fund, and records a liability in the Statement of Net Assets for the return of the collateral, during the period the securities are on loan. Securities lending income represents fees charged to borrowers plus income earned on invested cash collateral, less expenses associated with the loan.
6. Credit Facility: The fund and certain other funds managed by The Vanguard Group participate in a $2.89 billion committed credit facility provided by a syndicate of lenders pursuant to a credit agreement that may be renewed annually; each fund is individually liable for its borrowings, if any, under the credit facility. Borrowings may be utilized for temporary and emergency purposes, and are subject to the fund’s regulatory and contractual borrowing restrictions. The participating funds are charged administrative fees and an annual commitment fee of 0.06% of the undrawn amount of the facility; these fees are allocated to the funds based on a method approved by the fund’s board of trustees and included in Management and Administrative expenses on the fund’s Statement of Operations. Any borrowings under this facility bear interest at a rate equal to the higher of the federal funds rate or LIBOR reference rate plus an agreed-upon spread.
The fund had no borrowings outstanding at August 31, 2014, or at any time during the period then ended.
7. Other: Dividend income is recorded on the ex-dividend date. Interest income includes income distributions received from Vanguard Market Liquidity Fund and is accrued daily. Premiums and discounts on debt securities purchased are amortized and accreted, respectively, to interest income over the lives of the respective securities. Security transactions are accounted for on the date securities are bought or sold. Costs used to determine realized gains (losses) on the sale of investment securities are those of the specific securities sold.
Each class of shares has equal rights as to assets and earnings, except that each class separately bears certain class-specific expenses related to maintenance of shareholder accounts (included in Management and Administrative expenses) and shareholder reporting. Marketing and distribution expenses are allocated to each class of shares based on a method approved by the board of trustees. Income, other non-class-specific expenses, and gains and losses on investments are allocated to each class of shares based on its relative net assets.
23
Mega Cap Index Fund
B. The Vanguard Group furnishes at cost investment advisory, corporate management, administrative, marketing, and distribution services. The costs of such services are allocated to the fund based on methods approved by the board of trustees. The fund has committed to provide up to 0.40% of its net assets in capital contributions to Vanguard. At August 31, 2014, the fund had contributed capital of $107,000 to Vanguard (included in Other Assets), representing 0.01% of the fund’s net assets and 0.04% of Vanguard’s capitalization. The fund’s trustees and officers are also directors and officers of Vanguard.
C. Various inputs may be used to determine the value of the fund’s investments. These inputs are summarized in three broad levels for financial statement purposes. The inputs or methodologies used to value securities are not necessarily an indication of the risk associated with investing in those securities.
Level 1—Quoted prices in active markets for identical securities.
Level 2—Other significant observable inputs (including quoted prices for similar securities, interest rates, prepayment speeds, credit risk, etc.).
Level 3—Significant unobservable inputs (including the fund’s own assumptions used to determine the fair value of investments).
The following table summarizes the market value of the fund’s investments as of August 31, 2014, based on the inputs used to value them:
| | | |
| | Level 1 | Level 2 | Level 3 |
| Investments | ($000) | ($000) | ($000) |
| Common Stocks | 1,121,671 | — | — |
| Temporary Cash Investments | 910 | 200 | — |
| Futures Contracts—Assets1 | 6 | — | — |
| Total | 1,122,587 | 200 | — |
| 1 Represents variation margin on the last day of the reporting period. |
D. At August 31, 2014, the aggregate settlement value of open futures contracts and the related unrealized appreciation (depreciation) were:
| | | | |
| | | | ($000) |
| | | | Aggregate | |
| | | Number of | Settlement | Unrealized |
| | | Long (Short) | Value | Appreciation |
| Futures Contracts | Expiration | Contracts | Long (Short) | (Depreciation) |
| E-mini S&P 500 Index | September 2014 | 25 | 2,502 | 57 |
Unrealized appreciation (depreciation) on open futures contracts is required to be treated as realized gain (loss) for tax purposes.
E. Distributions are determined on a tax basis and may differ from net investment income and realized capital gains for financial reporting purposes. Differences may be permanent or temporary. Permanent differences are reclassified among capital accounts in the financial statements to reflect their tax character. Temporary differences arise when certain items of income, expense, gain, or loss are recognized in different periods for financial statement and tax purposes. These differences will reverse at some time in the future. Differences in classification may also result from the treatment of short-term gains as ordinary income for tax purposes.
24
Mega Cap Index Fund
During the year ended August 31, 2014, the fund realized $44,782,000 of net capital gains resulting from in-kind redemptions—in which shareholders exchanged fund shares for securities held by the fund rather than for cash. Because such gains are not taxable to the fund, and are not distributed to shareholders, they have been reclassified from accumulated net realized losses to paid-in capital.
For tax purposes, at August 31, 2014, the fund had $4,308,000 of ordinary income available for distribution. The fund used capital loss carryforwards of $385,000 to offset taxable capital gains realized during the year ended August 31, 2014. At August 31, 2014, the fund had available capital losses totaling $19,735,000 to offset future net capital gains. Of this amount, $18,779,000 is subject to expiration dates; $12,576,000 may be used to offset future net capital gains through August 31, 2018, and $6,203,000 through August 31, 2019. Capital losses of $956,000 realized beginning in fiscal 2012 may be carried forward indefinitely under the Regulated Investment Company Modernization Act of 2010, but must be used before any expiring loss carryforwards.
At August 31, 2014, the cost of investment securities for tax purposes was $772,523,000. Net unrealized appreciation of investment securities for tax purposes was $350,258,000, consisting of unrealized gains of $353,785,000 on securities that had risen in value since their purchase and $3,527,000 in unrealized losses on securities that had fallen in value since their purchase.
F. During the year ended August 31, 2014, the fund purchased $153,173,000 of investment securities and sold $157,584,000 of investment securities, other than temporary cash investments. Purchases and sales include $85,219,000 and $100,263,000, respectively, in connection with in-kind purchases and redemptions of the fund’s capital shares.
| | | | |
| G. Capital share transactions for each class of shares were: | | | |
| | Year Ended August 31, |
| | | 2014 | | | 2013 |
| | Amount | Shares | Amount | Shares |
| | ($000) | (000) | ($000) | (000) |
| Institutional Shares | | | | |
| Issued | 2,207 | 18 | 50,463 | 481 |
| Issued in Lieu of Cash Distributions | 6,066 | 49 | 6,144 | 61 |
| Redeemed | (97,115) | (825) | (8,258) | (75) |
| Net Increase (Decrease) —Institutional Shares | (88,842) | (758) | 48,349 | 467 |
| ETF Shares | | | | |
| Issued | 186,602 | 3,000 | 93,799 | 1,800 |
| Issued in Lieu of Cash Distributions | — | — | — | — |
| Redeemed | (100,871) | (1,700) | (19,873) | (400) |
| Net Increase (Decrease)—ETF Shares | 85,731 | 1,300 | 73,926 | 1,400 |
H. Management has determined that no material events or transactions occurred subsequent to August 31, 2014, that would require recognition or disclosure in these financial statements.
25
Mega Cap Growth Index Fund
Fund Profile
As of August 31, 2014
| | |
| Share-Class Characteristics | |
| |
| | Institutional | ETF |
| | Shares | Shares |
| Ticker Symbol | VMGAX | MGK |
| Expense Ratio1 | 0.10% | 0.11% |
| 30-Day SEC Yield | 1.32% | 1.31% |
| | | |
| Portfolio Characteristics | | |
| | | | DJ |
| | | | U.S. |
| | | CRSP US | Total |
| | | Mega Cap | Market |
| | | Growth | FA |
| | Fund | Index | Index |
| Number of Stocks | 151 | 151 | 3,709 |
| Median Market Cap | $88.6B | $88.6B | $48.0B |
| Price/Earnings Ratio | 24.3x | 24.3x | 20.7x |
| Price/Book Ratio | 4.9x | 4.9x | 2.7x |
| Return on Equity | 23.8% | 23.8% | 17.8% |
| Earnings Growth | | | |
| Rate | 18.9% | 18.9% | 15.3% |
| Dividend Yield | 1.4% | 1.4% | 1.8% |
| Foreign Holdings | 0.0% | 0.0% | 0.0% |
| Turnover Rate | 11% | — | — |
| Short-Term Reserves | 0.0% | — | — |
| | | |
| Sector Diversification (% of equity exposure) |
| | | | DJ |
| | | | U.S. |
| | | CRSP US | Total |
| | | Mega Cap | Market |
| | | Growth | FA |
| | Fund | Index | Index |
| Basic Materials | 1.5% | 1.5% | 3.1% |
| Consumer Goods | 9.0 | 9.0 | 9.8 |
| Consumer Services | 20.2 | 20.2 | 13.3 |
| Financials | 11.8 | 11.8 | 18.3 |
| Health Care | 12.5 | 12.5 | 12.5 |
| Industrials | 9.9 | 9.9 | 12.6 |
| Oil & Gas | 7.9 | 7.9 | 9.5 |
| Technology | 27.2 | 27.2 | 15.5 |
| Telecommunications | 0.0 | 0.0 | 2.2 |
| Utilities | 0.0 | 0.0 | 3.2 |
| | |
| Volatility Measures | | |
| | Spliced | DJ |
| | Mega Cap | U.S. Total |
| | Growth | Market |
| | Index | FA Index |
| R-Squared | 1.00 | 0.94 |
| Beta | 1.00 | 0.98 |
| These measures show the degree and timing of the fund’s |
| fluctuations compared with the indexes over 36 months. |
| | |
| Ten Largest Holdings (% of total net assets) |
| Apple Inc. | Computer Hardware | 8.9% |
| Google Inc. | Internet | 4.7 |
| Gilead Sciences Inc. | Biotechnology | 2.4 |
| Coca-Cola Co. | Soft Drinks | 2.4 |
| Facebook Inc. | Internet | 2.2 |
| Schlumberger Ltd. | Oil Equipment, | |
| | Services & | |
| | Distribution | 2.1 |
| Comcast Corp. | Broadcasting & | |
| | Entertainment | 2.0 |
| Walt Disney Co. | Broadcasting & | |
| | Entertainment | 2.0 |
| Oracle Corp. | Software | 2.0 |
| QUALCOMM Inc. | Semiconductors | 1.9 |
| Top Ten | | 30.6% |
| The holdings listed exclude any temporary cash investments and equity index products. |
|
Investment Focus
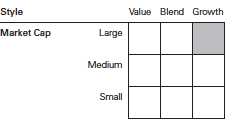
1 The expense ratios shown are from the prospectus dated December 23, 2013, and represent estimated costs for the current fiscal year. For the
fiscal year ended August 31, 2014, the expense ratios were 0.10% for Institutional Shares and 0.11% for ETF Shares.
26
Mega Cap Growth Index Fund
Performance Summary
All of the returns in this report represent past performance, which is not a guarantee of future results that may be achieved by the fund. (Current performance may be lower or higher than the performance data cited. For performance data current to the most recent month-end, visit our website at vanguard.com/performance.) Note, too, that both investment returns and principal value can fluctuate widely, so an investor’s shares, when sold, could be worth more or less than their original cost. The returns shown do not reflect taxes that a shareholder would pay on fund distributions or on the sale of fund shares.
Cumulative Performance: December 17, 2007, Through August 31, 2014
Initial Investment of $10,000
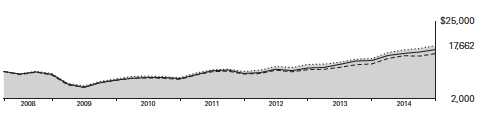
| | | | | |
| | | | Average Annual Total Returns | |
| | | Periods Ended August 31, 2014 | |
| |
| | | | | Since | Final Value |
| | | One | Five | Inception | of a $10,000 |
| | | Year | Years | (12/17/2007) | Investment |
| |
| | Mega Cap Growth Index Fund*ETF | | | | |
| | Shares Net Asset Value | 28.05% | 17.81% | 8.85% | $17,662 |
| | Mega Cap Growth Index Fund*ETF | | | | |
| | Shares Market Price | 28.05 | 17.79 | 8.85 | 17,661 |
| |
| •••••••• | Spliced Mega Cap Growth Index | 28.17 | 17.93 | 8.96 | 17,774 |
| |
| – – – – | Large-Cap Growth Funds Average | 25.10 | 15.80 | 6.61 | 15,361 |
| | Dow Jones U.S. Total Stock Market | | | | |
| | Float Adjusted Index | 24.68 | 17.29 | 7.82 | 16,562 |
For a benchmark description, see the Glossary.
Large-Cap Growth Funds Average: Derived from data provided by Lipper, a Thomson Reuters Company.
"Since Inception" performance is calculated from the ETF Shares’ inception date for both the fund and its comparative standards.
| | | | |
| | | | Since | Final Value |
| | One | Five | Inception | of a $5,000,000 |
| | Year | Years | (4/3/2008) | Investment |
| Mega Cap Growth Index Fund Institutional | | | | |
| Shares | 28.07% | 17.83% | 10.17% | $9,302,706 |
| |
| Spliced Mega Cap Growth Index | 28.17 | 17.93 | 10.26 | 9,348,118 |
| Dow Jones U.S. Total Stock Market Float | | | | |
| Adjusted Index | 24.68 | 17.29 | 8.98 | 8,676,966 |
"Since Inception" performance is calculated from the Institutional Shares’ inception date for both the fund and its comparative standards.See Financial Highlights for dividend and capital gains information.27
Mega Cap Growth Index Fund
| | | |
| Cumulative Returns of ETF Shares: December 17, 2007, Through August 31, 2014 | |
| |
| | | | Since |
| | One | Five | Inception |
| | Year | Years | (12/17/2007) |
| Mega Cap Growth Index Fund ETF Shares Market | | | |
| Price | 28.05% | 126.75% | 76.61% |
| Mega Cap Growth Index Fund ETF Shares Net | | | |
| Asset Value | 28.05 | 126.94 | 76.62 |
| Spliced Mega Cap Growth Index | 28.17 | 128.11 | 77.74 |
"Since Inception" performance is calculated from the ETF Shares’ inception date for both the fund and its comparative standards.
Fiscal-Year Total Returns (%): December 17, 2007, Through August 31, 2014
For a benchmark description, see the Glossary.
Average Annual Total Returns: Periods Ended June 30, 2014
This table presents returns through the latest calendar quarter—rather than through the end of the fiscal period.
Securities and Exchange Commission rules require that we provide this information.
| | | | |
| | Inception | One | Five | Since |
| | Date | Year | Years | Inception |
| Institutional Shares | 4/3/2008 | 28.63% | 19.12% | 9.92% |
| ETF Shares | 12/17/2007 | | | |
| Market Price | | 28.69 | 19.09 | 8.58 |
| Net Asset Value | | 28.63 | 19.11 | 8.58 |
28
Mega Cap Growth Index Fund
Financial Statements
Statement of Net Assets
As of August 31, 2014
The fund reports a complete list of its holdings in regulatory filings four times in each fiscal year, at the quarter-ends. For the second and fourth fiscal quarters, the lists appear in the fund’s semiannual and annual reports to shareholders. For the first and third fiscal quarters, the fund files the lists with the Securities and Exchange Commission on Form N-Q. Shareholders can look up the fund’s Forms N-Q on the SEC’s website at sec.gov. Forms N-Q may also be reviewed and copied at the SEC’s Public Reference Room (see the back cover of this report for further information).
| | | |
| | | | Market |
| | | | Value |
| | | Shares | ($000) |
| Common Stocks (100.0%)1 | | |
| Basic Materials (1.6%) | | |
| | Praxair Inc. | 65,018 | 8,553 |
| | Ecolab Inc. | 60,002 | 6,889 |
| | PPG Industries Inc. | 30,636 | 6,307 |
| | Nucor Corp. | 35,331 | 1,919 |
| | | | 23,668 |
| Consumer Goods (9.0%) | | |
| | Coca-Cola Co. | 877,143 | 36,595 |
| | Philip Morris | | |
| | International Inc. | 331,396 | 28,361 |
| | Monsanto Co. | 116,240 | 13,443 |
| | Colgate-Palmolive Co. | 202,908 | 13,134 |
| | NIKE Inc. Class B | 155,315 | 12,200 |
| | VF Corp. | 76,266 | 4,890 |
| * | Tesla Motors Inc. | 17,871 | 4,820 |
| | Lorillard Inc. | 80,288 | 4,793 |
| | Mead Johnson Nutrition Co. | 44,826 | 4,285 |
| | Estee Lauder Cos. Inc. | | |
| | Class A | 51,946 | 3,991 |
| * | Michael Kors Holdings Ltd. | 40,791 | 3,268 |
| | Stanley Black & Decker Inc. | 34,612 | 3,167 |
| | Hershey Co. | 32,295 | 2,953 |
| | Brown-Forman Corp. | | |
| | Class B | 22,782 | 2,111 |
| | Coach Inc. | 15,101 | 556 |
| | | | 138,567 |
| Consumer Services (20.1%) | | |
| | Walt Disney Co. | 345,674 | 31,069 |
| | Comcast Corp. Class A | 526,789 | 28,831 |
| | Home Depot Inc. | 303,296 | 28,358 |
| * | Amazon.com Inc. | 81,637 | 27,678 |
| | McDonald’s Corp. | 219,263 | 20,549 |
| * | Priceline Group Inc. | 11,625 | 14,465 |
| * | eBay Inc. | 252,779 | 14,029 |
| | Starbucks Corp. | 158,532 | 12,335 |
| | Costco Wholesale Corp. | 97,200 | 11,769 |
| | Twenty-First Century | | |
| | Fox Inc. Class A | 321,963 | 11,404 |
| | Time Warner Cable Inc. | 61,838 | 9,148 |
| | | |
| | | | Market |
| | | | Value |
| | | Shares | ($000) |
| * | DIRECTV | 105,777 | 9,145 |
| | TJX Cos. Inc. | 147,545 | 8,795 |
| | Yum! Brands Inc. | 97,917 | 7,092 |
| | Viacom Inc. Class B | 86,068 | 6,985 |
| | CBS Corp. Class B | 108,962 | 6,460 |
| | American Airlines Group Inc. | 159,844 | 6,220 |
| * | Netflix Inc. | 12,627 | 6,031 |
| | Las Vegas Sands Corp. | 89,657 | 5,963 |
| | Lowe’s Cos. Inc. | 110,480 | 5,801 |
| * | AutoZone Inc. | 7,223 | 3,892 |
| | Starwood Hotels & Resorts | | |
| | Worldwide Inc. | 42,600 | 3,602 |
| | Wynn Resorts Ltd. | 17,935 | 3,459 |
| | Whole Foods Market Inc. | 81,433 | 3,187 |
| | Twenty-First Century Fox Inc. | 91,820 | 3,162 |
| * | Liberty Interactive Corp. | | |
| | Class A | 102,383 | 3,022 |
| * | DISH Network Corp. Class A | 46,522 | 3,015 |
| * | Bed Bath & Beyond Inc. | 42,659 | 2,741 |
| | Comcast Corp. | 47,634 | 2,601 |
| | Gap Inc. | 54,485 | 2,515 |
| * | Sirius XM Holdings Inc. | 602,011 | 2,185 |
| * | Dollar General Corp. | 33,554 | 2,147 |
| * | Hilton Worldwide | | |
| | Holdings Inc. | 54,402 | 1,378 |
| | Viacom Inc. Class A | 216 | 18 |
| | CBS Corp. Class A | 141 | 9 |
| | | | 309,060 |
| Financials (11.8%) | | |
| | Visa Inc. Class A | 110,745 | 23,535 |
| | American Express Co. | 234,672 | 21,015 |
| | MasterCard Inc. Class A | 224,134 | 16,992 |
| | Simon Property Group Inc. | 68,895 | 11,714 |
| | American Tower Corporation | 87,755 | 8,653 |
| | BlackRock Inc. | 24,053 | 7,950 |
| | Charles Schwab Corp. | 245,432 | 6,997 |
| | Marsh & McLennan | | |
| | Cos. Inc. | 121,921 | 6,474 |
| | Crown Castle | | |
| | International Corp. | 74,032 | 5,886 |
29
Mega Cap Growth Index Fund
| | | |
| | | | Market |
| | | | Value |
| | | Shares | ($000) |
| | Public Storage | 32,551 | 5,702 |
| | Equity Residential | 79,988 | 5,317 |
| | Franklin Resources Inc. | 90,365 | 5,107 |
| | McGraw Hill Financial Inc. | 60,273 | 4,890 |
| | Intercontinental | | |
| | Exchange Inc. | 25,512 | 4,822 |
| | Prologis Inc. | 110,695 | 4,532 |
| | T. Rowe Price Group Inc. | 55,325 | 4,481 |
| | HCP Inc. | 101,537 | 4,400 |
| | Ventas Inc. | 65,272 | 4,294 |
| | Boston Properties Inc. | 33,959 | 4,123 |
| | Vornado Realty Trust | 37,420 | 3,962 |
| | Weyerhaeuser Co. | 116,631 | 3,960 |
| | Invesco Ltd. | 95,885 | 3,916 |
| | Host Hotels & Resorts Inc. | 167,825 | 3,830 |
| | General Growth | | |
| | Properties Inc. | 127,331 | 3,128 |
| | Aon plc | 32,858 | 2,864 |
| | TD Ameritrade Holding Corp. | 55,052 | 1,823 |
| | | | 180,367 |
| Health Care (12.5%) | | |
| * | Gilead Sciences Inc. | 340,559 | 36,637 |
| | Amgen Inc. | 167,798 | 23,388 |
| | AbbVie Inc. | 352,439 | 19,483 |
| * | Biogen Idec Inc. | 52,611 | 18,048 |
| * | Celgene Corp. | 177,521 | 16,868 |
| * | Express Scripts Holding Co. | 171,930 | 12,711 |
| * | Actavis plc | 55,719 | 12,647 |
| | Allergan Inc. | 66,033 | 10,808 |
| | Thermo Fisher Scientific Inc. | 88,432 | 10,631 |
| * | Alexion Pharmaceuticals Inc. | 43,891 | 7,430 |
| * | Regeneron | | |
| | Pharmaceuticals Inc. | 16,429 | 5,759 |
| | Stryker Corp. | 62,981 | 5,247 |
| * | Intuitive Surgical Inc. | 8,511 | 4,000 |
| | Zoetis Inc. | 111,093 | 3,937 |
| * | Illumina Inc. | 14,264 | 2,558 |
| | Perrigo Co. plc | 14,145 | 2,104 |
| | | | 192,256 |
| Industrials (9.9%) | | |
| | Union Pacific Corp. | 200,945 | 21,154 |
| | 3M Co. | 145,202 | 20,909 |
| | Boeing Co. | 145,635 | 18,467 |
| | United Parcel Service Inc. | | |
| | Class B | 156,532 | 15,235 |
| | Accenture plc Class A | 140,333 | 11,375 |
| | United Technologies Corp. | 96,520 | 10,422 |
| | Danaher Corp. | 131,777 | 10,095 |
| | Automatic Data | | |
| | Processing Inc. | 106,834 | 8,919 |
| | Precision Castparts Corp. | 32,101 | 7,835 |
| | Cummins Inc. | 40,910 | 5,937 |
| * | LinkedIn Corp. Class A | 23,346 | 5,270 |
| | PACCAR Inc. | 78,639 | 4,939 |
| | | |
| | | | Market |
| | | | Value |
| | | Shares | ($000) |
| | Agilent Technologies Inc. | 73,867 | 4,222 |
| | Rockwell Automation Inc. | 30,719 | 3,582 |
| | Paychex Inc. | 72,609 | 3,024 |
| | | | 151,385 |
| Oil & Gas (7.9%) | | |
| | Schlumberger Ltd. | 288,458 | 31,627 |
| | EOG Resources Inc. | 121,156 | 13,313 |
| | Anadarko Petroleum Corp. | 111,973 | 12,618 |
| | Halliburton Co. | 177,893 | 12,027 |
| | Williams Cos. Inc. | 147,516 | 8,768 |
| | National Oilwell Varco Inc. | 95,083 | 8,218 |
| | Pioneer Natural | | |
| | Resources Co. | 31,679 | 6,610 |
| | Kinder Morgan Inc. | 148,078 | 5,962 |
| | Noble Energy Inc. | 80,129 | 5,780 |
| * | Cameron International Corp. | 45,206 | 3,360 |
| * | FMC Technologies Inc. | 52,167 | 3,226 |
| * | Southwestern Energy Co. | 78,288 | 3,224 |
| | Ensco plc Class A | 51,972 | 2,624 |
| * | Weatherford | | |
| | International plc | 77,125 | 1,827 |
| * | Continental Resources Inc. | 10,264 | 1,655 |
| | | | 120,839 |
| Technology (27.2%) | | |
| | Apple Inc. | 1,337,106 | 137,053 |
| * | Google Inc. Class A | 62,466 | 36,378 |
| * | Google Inc. Class C | 63,572 | 36,338 |
| * | Facebook Inc. Class A | 442,101 | 33,078 |
| | Oracle Corp. | 741,576 | 30,798 |
| | QUALCOMM Inc. | 374,287 | 28,483 |
| | International Business | | |
| | Machines Corp. | 112,241 | 21,584 |
| | EMC Corp. | 453,740 | 13,399 |
| | Texas Instruments Inc. | 239,321 | 11,531 |
| * | Yahoo! Inc. | 201,042 | 7,742 |
| * | Micron Technology Inc. | 237,401 | 7,739 |
| * | salesforce.com inc | 129,395 | 7,646 |
| * | Adobe Systems Inc. | 105,018 | 7,551 |
| | Applied Materials Inc. | 269,641 | 6,230 |
| * | Cognizant Technology | | |
| | Solutions Corp. Class A | 135,122 | 6,179 |
| | Intuit Inc. | 59,738 | 4,969 |
| * | Twitter Inc. | 98,091 | 4,880 |
| | Analog Devices Inc. | 69,615 | 3,559 |
| | NetApp Inc. | 73,447 | 3,097 |
| | SanDisk Corp. | 25,068 | 2,456 |
| * | VMware Inc. Class A | 18,811 | 1,854 |
| | Motorola Solutions Inc. | 25,260 | 1,500 |
| * | Citrix Systems Inc. | 18,090 | 1,271 |
| | Altera Corp. | 34,676 | 1,225 |
| | Juniper Networks Inc. | 49,799 | 1,155 |
| | | | 417,695 |
| Total Common Stocks | | |
| (Cost $1,081,471) | | 1,533,837 |
30
| | |
| Mega Cap Growth Index Fund | |
| |
| |
| |
| | | Market |
| | | Value |
| | Shares | ($000) |
| Temporary Cash Investments (0.0%)1 | |
| Money Market Fund (0.0%) | |
| 2 Vanguard Market Liquidity | |
| Fund, 0.113% | 399,089 | 399 |
| |
| | Face | |
| | Amount | |
| | ($000) | |
| U.S. Government and Agency Obligations (0.0%) |
| 3,4 Federal Home Loan | | |
| Bank Discount Notes, | | |
| 0.100%, 2/4/15 | 200 | 200 |
| Total Temporary Cash Investments | |
| (Cost $599) | | 599 |
| Total Investments (100.0%) | |
| (Cost $1,082,070) | | 1,534,436 |
| Other Assets and Liabilities (0.0%) | |
| Other Assets | | 1,809 |
| Liabilities | | (1,617) |
| | | 192 |
| Net Assets (100%) | | 1,534,628 |
| |
| At August 31, 2014, net assets consisted of: |
| | Amount |
| | ($000) |
| Paid-in Capital | 1,088,909 |
| Undistributed Net Investment Income | 3,184 |
| Accumulated Net Realized Losses | (9,849) |
| Unrealized Appreciation (Depreciation) | |
| Investment Securities | 452,366 |
| Futures Contracts | 18 |
| Net Assets | 1,534,628 |
| |
| |
| Institutional Shares—Net Assets | |
| Applicable to 93,906 outstanding | |
| $.001 par value shares of beneficial | |
| interest (unlimited authorization) | 14,763 |
| Net Asset Value Per Share— | |
| Institutional Shares | $157.21 |
| |
| |
| ETF Shares—Net Assets | |
| Applicable to 19,200,000 outstanding | |
| $.001 par value shares of beneficial | |
| interest (unlimited authorization) | 1,519,865 |
| Net Asset Value Per Share— | |
| ETF Shares | $79.16 |
See Note A in Notes to Financial Statements.
* Non-income-producing security.
1 The fund invests a portion of its cash reserves in equity markets through the use of index futures contracts. After giving effect to futures
investments, the fund’s effective common stock and temporary cash investment positions represent 100.0% and 0.0%, respectively, of
net assets.
2 Affiliated money market fund available only to Vanguard funds and certain trusts and accounts managed by Vanguard. Rate shown is
the 7-day yield.
3 The issuer operates under a congressional charter; its securities are generally neither guaranteed by the U.S. Treasury nor backed by
the full faith and credit of the U.S. government.
4 Securities with a value of $100,000 have been segregated as initial margin for open futures contracts.
See accompanying Notes, which are an integral part of the Financial Statements.
31
Mega Cap Growth Index Fund
Statement of Operations
| |
| | Year Ended |
| | August 31, 2014 |
| | ($000) |
| Investment Income | |
| Income | |
| Dividends | 19,045 |
| Interest1 | 2 |
| Securities Lending | 37 |
| Total Income | 19,084 |
| Expenses | |
| The Vanguard Group—Note B | |
| Investment Advisory Services | 203 |
| Management and Administrative—Institutional Shares | 10 |
| Management and Administrative—ETF Shares | 827 |
| Marketing and Distribution—Institutional Shares | 3 |
| Marketing and Distribution—ETF Shares | 258 |
| Custodian Fees | 18 |
| Auditing Fees | 32 |
| Shareholders’ Reports—Institutional Shares | — |
| Shareholders’ Reports—ETF Shares | 37 |
| Trustees’ Fees and Expenses | 1 |
| Total Expenses | 1,389 |
| Net Investment Income | 17,695 |
| Realized Net Gain (Loss) | |
| Investment Securities Sold | 16,040 |
| Futures Contracts | 119 |
| Realized Net Gain (Loss) | 16,159 |
| Change in Unrealized Appreciation (Depreciation) | |
| Investment Securities | 270,971 |
| Futures Contracts | 33 |
| Change in Unrealized Appreciation (Depreciation) | 271,004 |
| Net Increase (Decrease) in Net Assets Resulting from Operations | 304,858 |
| 1 Interest income from an affiliated company of the fund was $2,000. |
See accompanying Notes, which are an integral part of the Financial Statements.
32
Mega Cap Growth Index Fund
Statement of Changes in Net Assets
| | |
| | Year Ended August 31, |
| | 2014 | 2013 |
| | ($000) | ($000) |
| Increase (Decrease) in Net Assets | | |
| Operations | | |
| Net Investment Income | 17,695 | 16,016 |
| Realized Net Gain (Loss) | 16,159 | 98,203 |
| Change in Unrealized Appreciation (Depreciation) | 271,004 | 5,997 |
| Net Increase (Decrease) in Net Assets Resulting from Operations | 304,858 | 120,216 |
| Distributions | | |
| Net Investment Income | | |
| Institutional Shares | (264) | (49) |
| ETF Shares | (17,090) | (15,499) |
| Realized Capital Gain | | |
| Institutional Shares | — | — |
| ETF Shares | — | — |
| Total Distributions | (17,354) | (15,548) |
| Capital Share Transactions | | |
| Institutional Shares | (10,714) | 20,698 |
| ETF Shares | 202,339 | 46,396 |
| Net Increase (Decrease) from Capital Share Transactions | 191,625 | 67,094 |
| Total Increase (Decrease) | 479,129 | 171,762 |
| Net Assets | | |
| Beginning of Period | 1,055,499 | 883,737 |
| End of Period1 | 1,534,628 | 1,055,499 |
1 Net Assets—End of Period includes undistributed (overdistributed) net investment income of $3,184,000 and $2,843,000.See accompanying Notes, which are an integral part of the Financial Statements.
33
Mega Cap Growth Index Fund
Financial Highlights
| | | | | |
| Institutional Shares | | | | | |
| |
| For a Share Outstanding | Year Ended August 31, |
| Throughout Each Period | 2014 | 2013 | 2012 | 2011 | 2010 |
| Net Asset Value, Beginning of Period | $124.49 | $110.67 | $92.75 | $76.74 | $74.21 |
| Investment Operations | | | | | |
| Net Investment Income | 1.978 | 2.027 | 1.4531 | 1.227 | 1.180 |
| Net Realized and Unrealized Gain (Loss) | | | | | |
| on Investments | 32.732 | 13.374 | 17.831 | 16.067 | 2.465 |
| Total from Investment Operations | 34.710 | 15.401 | 19.284 | 17.294 | 3.645 |
| Distributions | | | | | |
| Dividends from Net Investment Income | (1.990) | (1.581) | (1.364) | (1.284) | (1.115) |
| Distributions from Realized Capital Gains | — | — | — | — | — |
| Total Distributions | (1.990) | (1.581) | (1.364) | (1.284) | (1.115) |
| Net Asset Value, End of Period | $157.21 | $124.49 | $110.67 | $92.75 | $76.74 |
| |
| Total Return | 28.07% | 14.05% | 21.00% | 22.57% | 4.84% |
| |
| Ratios/Supplemental Data | | | | | |
| Net Assets, End of Period (Millions) | $15 | $21 | $0.2 | $124 | $90 |
| Ratio of Total Expenses to Average Net Assets | 0.10% | 0.10% | 0.09% | 0.10% | 0.11% |
| Ratio of Net Investment Income to | | | | | |
| Average Net Assets | 1.41% | 1.70% | 1.52% | 1.35% | 1.39% |
| Portfolio Turnover Rate 2 | 11% | 41% | 16% | 26% | 21% |
1 Calculated based on average shares outstanding.2 Excludes the value of portfolio securities received or delivered as a result of in-kind purchases or redemptions of the fund’s capital shares,including ETF Creation Units.See accompanying Notes, which are an integral part of the Financial Statements.
34
Mega Cap Growth Index Fund
Financial Highlights
| | | | | |
| ETF Shares | | | | | |
| |
| For a Share Outstanding | Year Ended August 31, |
| Throughout Each Period | 2014 | 2013 | 2012 | 2011 | 2010 |
| Net Asset Value, Beginning of Period | $62.69 | $55.92 | $46.87 | $38.78 | $37.50 |
| Investment Operations | | | | | |
| Net Investment Income | .994 | 1.006 | .7711 | .611 | . 586 |
| Net Realized and Unrealized Gain (Loss) | | | | | |
| on Investments | 16.475 | 6.751 | 8.966 | 8.120 | 1.248 |
| Total from Investment Operations | 17.469 | 7.757 | 9.737 | 8.731 | 1.834 |
| Distributions | | | | | |
| Dividends from Net Investment Income | (.999) | (.987) | (.687) | (. 641) | (. 554) |
| Distributions from Realized Capital Gains | — | — | — | — | — |
| Total Distributions | (.999) | (.987) | (.687) | (. 641) | (. 554) |
| Net Asset Value, End of Period | $79.16 | $62.69 | $55.92 | $46.87 | $38.78 |
| |
| Total Return | 28.05% | 14.04% | 20.98% | 22.54% | 4.82% |
| |
| Ratios/Supplemental Data | | | | | |
| Net Assets, End of Period (Millions) | $1,520 | $1,034 | $884 | $516 | $287 |
| Ratio of Total Expenses to Average Net Assets | 0.11% | 0.11% | 0.12% | 0.12% | 0.13% |
| Ratio of Net Investment Income to | | | | | |
| Average Net Assets | 1.40% | 1.69% | 1.49% | 1.33% | 1.37% |
| Portfolio Turnover Rate 2 | 11% | 41% | 16% | 26% | 21% |
1 Calculated based on average shares outstanding.2 Excludes the value of portfolio securities received or delivered as a result of in-kind purchases or redemptions of the fund’s capital shares,including ETF Creation Units.See accompanying Notes, which are an integral part of the Financial Statements.
35
Mega Cap Growth Index Fund
Notes to Financial Statements
Vanguard Mega Cap Growth Index Fund is registered under the Investment Company Act of 1940 as an open-end investment company, or mutual fund. The fund offers two classes of shares: Institutional Shares and ETF Shares. Institutional Shares are designed for investors who meet certain administrative, service, and account-size criteria. ETF Shares are listed for trading on NYSE Arca; they can be purchased and sold through a broker.
A. The following significant accounting policies conform to generally accepted accounting principles for U.S. investment companies. The fund consistently follows such policies in preparing its financial statements.
1. Security Valuation: Securities are valued as of the close of trading on the New York Stock Exchange (generally 4 p.m., Eastern time) on the valuation date. Equity securities are valued at the latest quoted sales prices or official closing prices taken from the primary market in which each security trades; such securities not traded on the valuation date are valued at the mean of the latest quoted bid and asked prices. Securities for which market quotations are not readily available, or whose values have been materially affected by events occurring before the fund’s pricing time but after the close of the securities’ primary markets, are valued by methods deemed by the board of trustees to represent fair value. Investments in Vanguard Market Liquidity Fund are valued at that fund’s net asset value. Temporary cash investments acquired over 60 days to maturity are valued using the latest bid prices or using valuations based on a matrix system (which considers such factors as security prices, yields, maturities, and ratings), both as furnished by independent pricing services. Other temporary cash investments are valued at amortized cost, which approximates market value.
2. Futures Contracts: The fund uses index futures contracts to a limited extent, with the objectives of maintaining full exposure to the stock market, enhancing returns, maintaining liquidity, and minimizing transaction costs. The fund may purchase futures contracts to immediately invest incoming cash in the market, or sell futures in response to cash outflows, thereby simulating a fully invested position in the underlying index while maintaining a cash balance for liquidity. The fund may seek to enhance returns by using futures contracts instead of the underlying securities when futures are believed to be priced more attractively than the underlying securities. The primary risks associated with the use of futures contracts are imperfect correlation between changes in market values of stocks held by the fund and the prices of futures contracts, and the possibility of an illiquid market. Counterparty risk involving futures is mitigated because a regulated clearinghouse is the counterparty instead of the clearing broker. To further mitigate counterparty risk, the fund trades futures contracts on an exchange, monitors the financial strength of its clearing brokers and clearinghouse, and has entered into clearing agreements with its clearing brokers. The clearinghouse imposes initial margin requirements to secure the fund’s performance and requires daily settlement of variation margin representing changes in the market value of each contract.
Futures contracts are valued at their quoted daily settlement prices. The aggregate settlement values of the contracts are not recorded in the Statement of Net Assets. Fluctuations in the value of the contracts are recorded in the Statement of Net Assets as an asset (liability) and in the Statement of Operations as unrealized appreciation (depreciation) until the contracts are closed, when they are recorded as realized futures gains (losses).
During the year ended August 31, 2014, the fund’s average investments in long and short futures contracts represented less than 1% and 0% of net assets, respectively, based on the average of aggregate settlement values at each quarter-end during the period.
36
Mega Cap Growth Index Fund
3. Federal Income Taxes: The fund intends to continue to qualify as a regulated investment company and distribute all of its taxable income. Management has analyzed the fund’s tax positions taken for all open federal income tax years (August 31, 2011–2014), and has concluded that no provision for federal income tax is required in the fund’s financial statements.
4. Distributions: Distributions to shareholders are recorded on the ex-dividend date.
5. Securities Lending: To earn additional income, the fund lends its securities to qualified institutional borrowers. Security loans are required to be secured at all times by collateral in an amount at least equal to the market value of securities loaned. Daily market fluctuations could cause the value of loaned securities to be more or less than the value of the collateral received. When this occurs, the collateral is adjusted and settled on the next business day. The fund further mitigates its counterparty risk by entering into securities lending transactions only with a diverse group of prequalified counterparties, monitoring their financial strength, and entering into master securities lending agreements with its counterparties. The master securities lending agreements provide that, in the event of a counterparty’s default (including bankruptcy), the fund may terminate any loans with that borrower, determine the net amount owed, and sell or retain the collateral up to the net amount owed to the fund; however, such actions may be subject to legal proceedings. While collateral mitigates counterparty risk, in the absence of a default the fund may experience delays and costs in recovering the securities loaned. The fund invests cash collateral received in Vanguard Market Liquidity Fund, and records a liability in the Statement of Net Assets for the return of the collateral, during the period the securities are on loan. Securities lending income represents fees charged to borrowers plus income earned on invested cash collateral, less expenses associated with the loan.
6. Credit Facility: The fund and certain other funds managed by The Vanguard Group participate in a $2.89 billion committed credit facility provided by a syndicate of lenders pursuant to a credit agreement that may be renewed annually; each fund is individually liable for its borrowings, if any, under the credit facility. Borrowings may be utilized for temporary and emergency purposes, and are subject to the fund’s regulatory and contractual borrowing restrictions. The participating funds are charged administrative fees and an annual commitment fee of 0.06% of the undrawn amount of the facility; these fees are allocated to the funds based on a method approved by the fund’s board of trustees and included in Management and Administrative expenses on the fund’s Statement of Operations. Any borrowings under this facility bear interest at a rate equal to the higher of the federal funds rate or LIBOR reference rate plus an agreed-upon spread.
The fund had no borrowings outstanding at August 31, 2014, or at any time during the period then ended.
7. Other: Dividend income is recorded on the ex-dividend date. Interest income includes income distributions received from Vanguard Market Liquidity Fund and is accrued daily. Premiums and discounts on debt securities purchased are amortized and accreted, respectively, to interest income over the lives of the respective securities. Security transactions are accounted for on the date securities are bought or sold. Costs used to determine realized gains (losses) on the sale of investment securities are those of the specific securities sold.
Each class of shares has equal rights as to assets and earnings, except that each class separately bears certain class-specific expenses related to maintenance of shareholder accounts (included in Management and Administrative expenses) and shareholder reporting. Marketing and distribution
37
Mega Cap Growth Index Fund
expenses are allocated to each class of shares based on a method approved by the board of trustees. Income, other non-class-specific expenses, and gains and losses on investments are allocated to each class of shares based on its relative net assets.
B. The Vanguard Group furnishes at cost investment advisory, corporate management, administrative, marketing, and distribution services. The costs of such services are allocated to the fund based on methods approved by the board of trustees. The fund has committed to provide up to 0.40% of its net assets in capital contributions to Vanguard. At August 31, 2014, the fund had contributed capital of $143,000 to Vanguard (included in Other Assets), representing 0.01% of the fund’s net assets and 0.06% of Vanguard’s capitalization. The fund’s trustees and officers are also directors and officers of Vanguard.
C. Various inputs may be used to determine the value of the fund’s investments. These inputs are summarized in three broad levels for financial statement purposes. The inputs or methodologies used to value securities are not necessarily an indication of the risk associated with investing in those securities.
Level 1—Quoted prices in active markets for identical securities.
Level 2—Other significant observable inputs (including quoted prices for similar securities, interest rates, prepayment speeds, credit risk, etc.).
Level 3—Significant unobservable inputs (including the fund’s own assumptions used to determine the fair value of investments).
The following table summarizes the market value of the fund’s investments as of August 31, 2014, based on the inputs used to value them:
| | | |
| | Level 1 | Level 2 | Level 3 |
| Investments | ($000) | ($000) | ($000) |
| Common Stocks | 1,533,837 | — | — |
| Temporary Cash Investments | 399 | 200 | — |
| Futures Contracts—Assets1 | 1 | — | — |
| Total | 1,534,237 | 200 | — |
| 1 Represents variation margin on the last day of the reporting period. |
D. At August 31, 2014, the aggregate settlement value of open futures contracts and the related unrealized appreciation (depreciation) were:
| | | | |
| | | | ($000) |
| | | | Aggregate | |
| | | Number of | Settlement | Unrealized |
| | | Long (Short) | Value | Appreciation |
| Futures Contracts | Expiration | Contracts | Long (Short) | (Depreciation) |
| S&P 500 Index | September 2014 | 1 | 500 | 18 |
Unrealized appreciation (depreciation) on open futures contracts is required to be treated as realized gain (loss) for tax purposes.
E. Distributions are determined on a tax basis and may differ from net investment income and realized capital gains for financial reporting purposes. Differences may be permanent or temporary. Permanent differences are reclassified among capital accounts in the financial statements to reflect their tax character. Temporary differences arise when certain items of income, expense, gain, or loss
38
Mega Cap Growth Index Fund
are recognized in different periods for financial statement and tax purposes. These differences will reverse at some time in the future. Differences in classification may also result from the treatment of short-term gains as ordinary income for tax purposes.
During the year ended August 31, 2014, the fund realized $21,461,000 of net capital gains resulting from in-kind redemptions—in which shareholders exchanged fund shares for securities held by the fund rather than for cash. Because such gains are not taxable to the fund, and are not distributed to shareholders, they have been reclassified from accumulated net realized losses to paid-in capital.
For tax purposes, at August 31, 2014, the fund had $3,671,000 of ordinary income available for distribution. At August 31, 2014, the fund had available capital losses totaling $9,831,000 to offset future net capital gains. Of this amount, $4,562,000 is subject to expiration on August 31, 2019. Capital losses of $5,269,000 realized beginning in fiscal 2012 may be carried forward indefinitely under the Regulated Investment Company Modernization Act of 2010, but must be used before any expiring loss carryforwards.
At August 31, 2014, the cost of investment securities for tax purposes was $1,082,070,000. Net unrealized appreciation of investment securities for tax purposes was $452,366,000, consisting of unrealized gains of $456,359,000 on securities that had risen in value since their purchase and $3,993,000 in unrealized losses on securities that had fallen in value since their purchase.
F. During the year ended August 31, 2014, the fund purchased $405,322,000 of investment securities and sold $212,321,000 of investment securities, other than temporary cash investments. Purchases and sales include $271,321,000 and $66,086,000, respectively, in connection with in-kind purchases and redemptions of the fund’s capital shares.
| | | | |
| G. Capital share transactions for each class of shares were: | | | |
| | Year Ended August 31, |
| | | 2014 | | | 2013 |
| | Amount | Shares | Amount | Shares |
| | ($000) | (000) | ($000) | (000) |
| Institutional Shares | | | | |
| Issued | 244 | 1 | 21,311 | 172 |
| Issued in Lieu of Cash Distributions | 264 | 2 | 49 | — |
| Redeemed | (11,222) | (79) | (662) | (5) |
| Net Increase (Decrease) —Institutional Shares | (10,714) | (76) | 20,698 | 167 |
| ETF Shares | | | | |
| Issued | 272,056 | 3,700 | 245,835 | 4,200 |
| Issued in Lieu of Cash Distributions | — | — | — | — |
| Redeemed | (69,717) | (1,000) | (199,439) | (3,500) |
| Net Increase (Decrease)—ETF Shares | 202,339 | 2,700 | 46,396 | 700 |
H. Management has determined that no material events or transactions occurred subsequent to August 31, 2014, that would require recognition or disclosure in these financial statements.
39
Mega Cap Value Index Fund
Fund Profile
As of August 31, 2014
| | |
| Share-Class Characteristics | |
| |
| | Institutional | ETF |
| | Shares | Shares |
| Ticker Symbol | VMVLX | MGV |
| Expense Ratio1 | 0.08% | 0.11% |
| 30-Day SEC Yield | 2.43% | 2.40% |
| | | |
| Portfolio Characteristics | | |
| | | | DJ |
| | | | U.S. |
| | | CRSP US | Total |
| | | Mega Cap | Market |
| | | Value | FA |
| | Fund | Index | Index |
| Number of Stocks | 160 | 160 | 3,709 |
| Median Market Cap | $92.9B | $92.9B | $48.0B |
| Price/Earnings Ratio | 16.4x | 16.4x | 20.7x |
| Price/Book Ratio | 2.1x | 2.1x | 2.7x |
| Return on Equity | 16.7% | 16.7% | 17.8% |
| Earnings Growth | | | |
| Rate | 12.8% | 12.8% | 15.3% |
| Dividend Yield | 2.5% | 2.5% | 1.8% |
| Foreign Holdings | 0.0% | 0.0% | 0.0% |
| Turnover Rate | 8% | — | — |
| Short-Term Reserves | 0.0% | — | — |
| | | |
| Sector Diversification (% of equity exposure) |
| | | | DJ |
| | | | U.S. |
| | | CRSP US | Total |
| | | Mega Cap | Market |
| | | Value | FA |
| | Fund | Index | Index |
| Basic Materials | 3.4% | 3.4% | 3.1% |
| Consumer Goods | 9.7 | 9.7 | 9.8 |
| Consumer Services | 7.0 | 7.0 | 13.3 |
| Financials | 22.0 | 22.0 | 18.3 |
| Health Care | 14.5 | 14.5 | 12.5 |
| Industrials | 11.0 | 11.0 | 12.6 |
| Oil & Gas | 12.7 | 12.7 | 9.5 |
| Technology | 10.1 | 10.1 | 15.5 |
| Telecommunications | 4.8 | 4.8 | 2.2 |
| Utilities | 4.8 | 4.8 | 3.2 |
| | |
| Volatility Measures | | |
| | Spliced | DJ |
| | Mega Cap | U.S. Total |
| | Value | Market |
| | Index | FA Index |
| R-Squared | 1.00 | 0.92 |
| Beta | 1.00 | 0.89 |
| These measures show the degree and timing of the fund’s fluctuations compared with the indexes over 36 months. |
|
| | |
| Ten Largest Holdings (% of total net assets) |
| Exxon Mobil Corp. | Integrated Oil & Gas | 4.8% |
| Microsoft Corp. | Software | 3.8 |
| Johnson & Johnson | Pharmaceuticals | 3.3 |
| Wells Fargo & Co. | Banks | 3.1 |
| General Electric Co. | Diversified Industrials | 2.9 |
| Berkshire Hathaway Inc. | Reinsurance | 2.8 |
| Chevron Corp. | Integrated Oil & Gas | 2.8 |
| JPMorgan Chase & Co. | Banks | 2.5 |
| Procter & Gamble Co. | Nondurable | |
| | Household Products | 2.5 |
| Verizon Communications Fixed Line | |
| Inc. | Telecommunications | 2.3 |
| Top Ten | | 30.8% |
| The holdings listed exclude any temporary cash investments and equity index products. |
|
Investment Focus
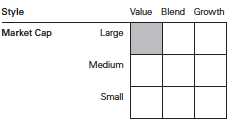
1 The expense ratios shown are from the prospectus dated December 23, 2013, and represent estimated costs for the current fiscal year. For the
fiscal year ended August 31, 2014, the expense ratios were 0.08% for Institutional Shares and 0.11% for ETF Shares.
40
Mega Cap Value Index Fund
Performance Summary
All of the returns in this report represent past performance, which is not a guarantee of future results that may be achieved by the fund. (Current performance may be lower or higher than the performance data cited. For performance data current to the most recent month-end, visit our website at vanguard.com/performance.) Note, too, that both investment returns and principal value can fluctuate widely, so an investor’s shares, when sold, could be worth more or less than their original cost. The returns shown do not reflect taxes that a shareholder would pay on fund distributions or on the sale of fund shares.
Cumulative Performance: December 17, 2007, Through August 31, 2014
Initial Investment of $10,000
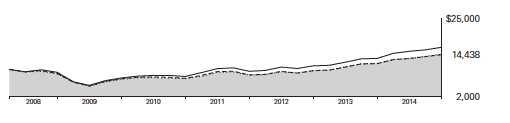
| | | | | |
| | | | Average Annual Total Returns | |
| | | Periods Ended August 31, 2014 | |
| |
| | | | | Since | Final Value |
| | | One | Five | Inception | of a $10,000 |
| | | Year | Years | (12/17/2007) | Investment |
| |
| | Mega Cap Value Index Fund*ETF | | | | |
| | Shares Net Asset Value | 22.92% | 15.38% | 5.63% | $14,438 |
| | Mega Cap Value Index Fund*ETF | | | | |
| | Shares Market Price | 22.93 | 15.35 | 5.62 | 14,431 |
| |
| •••••••• | Spliced Mega Cap Value Index | 23.05 | 15.48 | 5.68 | 14,483 |
| |
| – – – – | Large-Cap Value Funds Average | 22.67 | 14.79 | 5.57 | 14,381 |
| | Dow Jones U.S. Total Stock Market | | | | |
| | Float Adjusted Index | 24.68 | 17.29 | 7.82 | 16,562 |
For a benchmark description, see the Glossary.
Large-Cap Value Funds Average: Derived from data provided by Lipper, a Thomson Reuters Company.
"Since Inception" performance is calculated from the ETF Shares’ inception date for both the fund and its comparative standards.
| | | | |
| | | | Since | Final Value |
| | One | Five | Inception | of a $5,000,000 |
| | Year | Years | (3/5/2008) | Investment |
| Mega Cap Value Index Fund Institutional | | | | |
| Shares | 22.95% | 15.41% | 7.23% | $7,866,709 |
| |
| Spliced Mega Cap Value Index | 23.05 | 15.48 | 7.25 | 7,873,853 |
| Dow Jones U.S. Total Stock Market Float | | | | |
| Adjusted Index | 24.68 | 17.29 | 9.30 | 8,904,417 |
"Since Inception" performance is calculated from the Institutional Shares’ inception date for both the fund and its comparative standards.See Financial Highlights for dividend and capital gains information.41
Mega Cap Value Index Fund
Cumulative Returns of ETF Shares: December 17, 2007, Through August 31, 2014
| | | |
| | | | Since |
| | One | Five | Inception |
| | Year | Years | (12/17/2007) |
| Mega Cap Value Index Fund ETF Shares Market | | | |
| Price | 22.93% | 104.24% | 44.31% |
| Mega Cap Value Index Fund ETF Shares Net Asset | | | |
| Value | 22.92 | 104.51 | 44.38 |
| Spliced Mega Cap Value Index | 23.05 | 105.41 | 44.83 |
| "Since Inception" performance is calculated from the ETF Shares’ inception date for both the fund and its comparative standards. |
Fiscal-Year Total Returns (%): December 17, 2007, Through August 31, 2014

For a benchmark description, see the Glossary.
Average Annual Total Returns: Periods Ended June 30, 2014
This table presents returns through the latest calendar quarter—rather than through the end of the fiscal period.
Securities and Exchange Commission rules require that we provide this information.
| | | | |
| | Inception | One | Five | Since |
| | Date | Year | Years | Inception |
| Institutional Shares | 3/5/2008 | 21.69% | 17.69% | 7.06% |
| ETF Shares | 12/17/2007 | | | |
| Market Price | | 21.67 | 17.65 | 5.42 |
| Net Asset Value | | 21.66 | 17.66 | 5.42 |
42
Mega Cap Value Index Fund
Financial Statements
Statement of Net Assets
As of August 31, 2014
The fund reports a complete list of its holdings in regulatory filings four times in each fiscal year, at the quarter-ends. For the second and fourth fiscal quarters, the lists appear in the fund’s semiannual and annual reports to shareholders. For the first and third fiscal quarters, the fund files the lists with the Securities and Exchange Commission on Form N-Q. Shareholders can look up the fund’s Forms N-Q on the SEC’s website at sec.gov. Forms N-Q may also be reviewed and copied at the SEC’s Public Reference Room (see the back cover of this report for further information).
| | |
| | | Market |
| | | Value |
| | Shares | ($000) |
| Common Stocks (100.0%)1 | | |
| Basic Materials (3.4%) | | |
| Dow Chemical Co. | 147,241 | 7,885 |
| EI du Pont de Nemours | | |
| & Co. | 112,393 | 7,430 |
| LyondellBasell Industries | | |
| NV Class A | 54,844 | 6,271 |
| Freeport-McMoRan Inc. | 127,052 | 4,621 |
| Air Products & | | |
| Chemicals Inc. | 25,945 | 3,456 |
| International Paper Co. | 53,100 | 2,573 |
| Mosaic Co. | 39,362 | 1,880 |
| Newmont Mining Corp. | 60,905 | 1,650 |
| Nucor Corp. | 19,545 | 1,062 |
| | | 36,828 |
| Consumer Goods (9.7%) | | |
| Procter & Gamble Co. | 331,060 | 27,514 |
| PepsiCo Inc. | 185,385 | 17,146 |
| Altria Group Inc. | 242,905 | 10,464 |
| Ford Motor Co. | 474,757 | 8,266 |
| Mondelez International Inc. | | |
| Class A | 196,541 | 7,113 |
| General Motors Co. | 156,828 | 5,458 |
| Kimberly-Clark Corp. | 46,055 | 4,974 |
| Kraft Foods Group Inc. | 72,774 | 4,286 |
| General Mills Inc. | 75,049 | 4,006 |
| Archer-Daniels-Midland Co. | 79,980 | 3,988 |
| Johnson Controls Inc. | 81,172 | 3,962 |
| Reynolds American Inc. | 39,242 | 2,294 |
| Kellogg Co. | 35,024 | 2,276 |
| Activision Blizzard Inc. | 61,181 | 1,440 |
| Campbell Soup Co. | 23,105 | 1,036 |
| Coach Inc. | 8,364 | 308 |
| | | 104,531 |
| Consumer Services (7.0%) | | |
| Wal-Mart Stores Inc. | 197,417 | 14,905 |
| CVS Caremark Corp. | 142,975 | 11,359 |
| Time Warner Inc. | 102,459 | 7,892 |
| Walgreen Co. | 104,999 | 6,355 |
| | | |
| | | | Market |
| | | | Value |
| | | Shares | ($000) |
| | McKesson Corp. | 28,166 | 5,493 |
| | Target Corp. | 77,402 | 4,650 |
| | Delta Air Lines Inc. | 103,634 | 4,102 |
| | Lowe’s Cos. Inc. | 61,070 | 3,207 |
| | Cardinal Health Inc. | 41,686 | 3,072 |
| | Kroger Co. | 59,066 | 3,011 |
| | Sysco Corp. | 71,547 | 2,707 |
| | Omnicom Group Inc. | 31,655 | 2,280 |
| | Carnival Corp. | 54,436 | 2,062 |
| | Macy’s Inc. | 22,064 | 1,374 |
| | Kohl’s Corp. | 22,765 | 1,338 |
| * | Liberty Media Corp. | 23,707 | 1,149 |
| * | Liberty Media Corp. | | |
| | Class A | 11,446 | 564 |
| | | | 75,520 |
| Financials (22.0%) | | |
| | Wells Fargo & Co. | 644,324 | 33,144 |
| * | Berkshire Hathaway Inc. | | |
| | Class B | 222,136 | 30,488 |
| | JPMorgan Chase & Co. | 462,970 | 27,524 |
| | Bank of America Corp. | 1,285,809 | 20,689 |
| | Citigroup Inc. | 352,945 | 18,230 |
| | American International | | |
| | Group Inc. | 176,853 | 9,914 |
| | US Bancorp | 222,006 | 9,386 |
| | Goldman Sachs Group Inc. | 49,213 | 8,815 |
| | Morgan Stanley | 180,728 | 6,201 |
| | MetLife Inc. | 110,052 | 6,024 |
| | Capital One Financial Corp. | 69,973 | 5,742 |
| | PNC Financial | | |
| | Services Group Inc. | 65,258 | 5,531 |
| | Bank of New York | | |
| | Mellon Corp. | 139,458 | 5,464 |
| | Prudential Financial Inc. | 56,230 | 5,044 |
| | Travelers Cos. Inc. | 42,550 | 4,030 |
| | ACE Ltd. | 37,152 | 3,950 |
| | State Street Corp. | 50,016 | 3,603 |
| | Discover Financial Services | 57,014 | 3,556 |
| | Aflac Inc. | 55,586 | 3,404 |
| | BB&T Corp. | 87,824 | 3,278 |
43
Mega Cap Value Index Fund
| | | |
| | | | Market |
| | | | Value |
| | | Shares | ($000) |
| | Allstate Corp. | 53,109 | 3,266 |
| | CME Group Inc. | 39,059 | 2,990 |
| | Ameriprise Financial Inc. | 23,202 | 2,918 |
| | Chubb Corp. | 29,959 | 2,755 |
| | SunTrust Banks Inc. | 65,262 | 2,485 |
| | Fifth Third Bancorp | 103,714 | 2,116 |
| | Northern Trust Corp. | 27,386 | 1,899 |
| | Loews Corp. | 37,665 | 1,647 |
| | Progressive Corp. | 64,919 | 1,624 |
| | Aon plc | 18,076 | 1,576 |
| * | Synchrony Financial | 15,179 | 391 |
| * | Berkshire Hathaway Inc. | | |
| | Class A | 1 | 206 |
| | | | 237,890 |
| Health Care (14.5%) | | |
| | Johnson & Johnson | 346,134 | 35,904 |
| | Pfizer Inc. | 779,326 | 22,904 |
| | Merck & Co. Inc. | 357,369 | 21,481 |
| | UnitedHealth Group Inc. | 119,901 | 10,393 |
| | Bristol-Myers Squibb Co. | 202,644 | 10,264 |
| | Eli Lilly & Co. | 123,262 | 7,834 |
| | Medtronic Inc. | 122,234 | 7,805 |
| | Abbott Laboratories | 183,750 | 7,762 |
| | Baxter International Inc. | 66,083 | 4,955 |
| | Covidien plc | 55,262 | 4,798 |
| | WellPoint Inc. | 34,157 | 3,980 |
| | Aetna Inc. | 43,725 | 3,591 |
| | Cigna Corp. | 32,921 | 3,114 |
| | Becton Dickinson and Co. | 23,649 | 2,771 |
| * | HCA Holdings Inc. | 39,310 | 2,745 |
| | Humana Inc. | 18,966 | 2,442 |
| | St. Jude Medical Inc. | 34,804 | 2,283 |
| | Zimmer Holdings Inc. | 20,628 | 2,049 |
| | | | 157,075 |
| Industrials (11.0%) | | |
| | General Electric Co. | 1,226,606 | 31,867 |
| | Honeywell International Inc. | 91,115 | 8,677 |
| | Caterpillar Inc. | 76,385 | 8,331 |
| | Lockheed Martin Corp. | 33,194 | 5,776 |
| | United Technologies Corp. | 53,246 | 5,750 |
| | Emerson Electric Co. | 85,749 | 5,490 |
| | FedEx Corp. | 34,387 | 5,085 |
| | General Dynamics Corp. | 35,682 | 4,398 |
| | Illinois Tool Works Inc. | 47,907 | 4,226 |
| | Eaton Corp. plc | 58,211 | 4,064 |
| | Norfolk Southern Corp. | 37,900 | 4,055 |
| | CSX Corp. | 122,718 | 3,793 |
| | Deere & Co. | 44,566 | 3,748 |
| | Raytheon Co. | 38,299 | 3,690 |
| | TE Connectivity Ltd. | 50,017 | 3,135 |
| | Northrop Grumman Corp. | 23,612 | 3,004 |
| | Waste Management Inc. | 54,194 | 2,545 |
| | Tyco International Ltd. | 56,506 | 2,521 |
| | Parker-Hannifin Corp. | 18,243 | 2,107 |
| | | |
| | | | Market |
| | | | Value |
| | | Shares | ($000) |
| | Ingersoll-Rand plc | 31,398 | 1,890 |
| | Dover Corp. | 20,417 | 1,794 |
| | Republic Services Inc. | | |
| | Class A | 32,597 | 1,282 |
| | Xerox Corp. | 67,645 | 934 |
| | Fluor Corp. | 9,650 | 713 |
| | | | 118,875 |
| Oil & Gas (12.7%) | | |
| | Exxon Mobil Corp. | 525,311 | 52,247 |
| | Chevron Corp. | 232,849 | 30,142 |
| | ConocoPhillips | 150,155 | 12,196 |
| | Occidental Petroleum Corp. | 96,107 | 9,969 |
| | Phillips 66 | 69,282 | 6,029 |
| | Apache Corp. | 47,124 | 4,799 |
| | Baker Hughes Inc. | 53,247 | 3,682 |
| | Devon Energy Corp. | 47,439 | 3,578 |
| | Valero Energy Corp. | 65,223 | 3,531 |
| | Hess Corp. | 34,644 | 3,503 |
| | Marathon Oil Corp. | 82,689 | 3,447 |
| | Marathon Petroleum Corp. | 31,885 | 2,902 |
| | Chesapeake Energy Corp. | 73,103 | 1,988 |
| | | | 138,013 |
| Technology (10.1%) | | |
| | Microsoft Corp. | 909,343 | 41,311 |
| | Intel Corp. | 608,730 | 21,257 |
| | Cisco Systems Inc. | 626,519 | 15,657 |
| | International Business | | |
| | Machines Corp. | 61,956 | 11,914 |
| | Hewlett-Packard Co. | 231,776 | 8,807 |
| | Corning Inc. | 159,995 | 3,338 |
| | Broadcom Corp. Class A | 65,486 | 2,579 |
| | Symantec Corp. | 84,399 | 2,049 |
| | CA Inc. | 37,996 | 1,073 |
| | Motorola Solutions Inc. | 13,960 | 829 |
| | | | 108,814 |
| Telecommunications (4.8%) | | |
| | Verizon | | |
| | Communications Inc. | 506,652 | 25,241 |
| | AT&T Inc. | 634,657 | 22,188 |
| | CenturyLink Inc. | 70,145 | 2,875 |
| * | T-Mobile US Inc. | 34,301 | 1,032 |
| * | Sprint Corp. | 96,865 | 543 |
| | | | 51,879 |
| Utilities (4.8%) | | |
| | Duke Energy Corp. | 86,478 | 6,398 |
| | NextEra Energy Inc. | 53,327 | 5,250 |
| | Dominion Resources Inc. | 71,158 | 4,997 |
| | Southern Co. | 109,084 | 4,843 |
| | Exelon Corp. | 105,043 | 3,510 |
| | Spectra Energy Corp. | 81,971 | 3,415 |
| | American Electric | | |
| | Power Co. Inc. | 59,732 | 3,208 |
| | Sempra Energy | 28,493 | 3,019 |
| | PPL Corp. | 77,328 | 2,678 |
44
| | | |
| Mega Cap Value Index Fund | | |
| |
| |
| |
| | | | Market |
| | | | Value |
| | | Shares | ($000) |
| | PG&E Corp. | 56,937 | 2,646 |
| | Edison International | 39,902 | 2,360 |
| | Public Service | | |
| | Enterprise Group Inc. | 61,983 | 2,318 |
| | Consolidated Edison Inc. | 35,725 | 2,068 |
| | Xcel Energy Inc. | 61,273 | 1,964 |
| | FirstEnergy Corp. | 51,334 | 1,758 |
| | Entergy Corp. | 21,944 | 1,699 |
| | | | 52,131 |
| Total Common Stocks | | |
| (Cost $871,729) | | 1,081,556 |
| Temporary Cash Investments (0.0%)1 | |
| |
| | | Face | |
| | | Amount | |
| | | ($000) | |
| U.S. Government and Agency Obligations (0.0%) |
| 2,3 | Fannie Mae Discount | | |
| | Notes, 0.075%, 10/15/14 | 100 | 100 |
| 4 | Federal Home Loan | | |
| | Bank Discount Notes, | | |
| | 0.086%, 9/12/14 | 100 | 100 |
| Total Temporary Cash Investments | |
| (Cost $200) | | 200 |
| Total Investments (100.0%) | | |
| (Cost $871,929) | | 1,081,756 |
| Other Assets and Liabilities (0.0%) | |
| Other Assets | | 3,472 |
| Liabilities | | (3,032) |
| | | | 440 |
| Net Assets (100%) | | 1,082,196 |
| |
| At August 31, 2014, net assets consisted of: |
| | Amount |
| | ($000) |
| Paid-in Capital | 874,397 |
| Undistributed Net Investment Income | 5,156 |
| Accumulated Net Realized Losses | (7,202) |
| Unrealized Appreciation (Depreciation) | |
| Investment Securities | 209,827 |
| Futures Contracts | 18 |
| Net Assets | 1,082,196 |
| |
| |
| Institutional Shares—Net Assets | |
| Applicable to 1,792,412 outstanding | |
| $.001 par value shares of beneficial | |
| interest (unlimited authorization) | 211,830 |
| Net Asset Value Per Share— | |
| Institutional Shares | $118.18 |
| |
| |
| ETF Shares—Net Assets | |
| Applicable to 14,602,369 outstanding | |
| $.001 par value shares of beneficial | |
| interest (unlimited authorization) | 870,366 |
| Net Asset Value Per Share— | |
| ETF Shares | $59.60 |
See Note A in Notes to Financial Statements.
* Non-income-producing security.
1 The fund invests a portion of its cash reserves in equity markets through the use of index futures contracts. After giving effect to futures
investments, the fund’s effective common stock and temporary cash investment positions represent 100.0% and 0.0%, respectively, of
net assets.
2 The issuer was placed under federal conservatorship in September 2008; since that time, its daily operations have been managed by the
Federal Housing Finance Agency and it receives capital from the U.S. Treasury, as needed to maintain a positive net worth, in exchange
for senior preferred stock.
3 Securities with a value of $100,000 have been segregated as initial margin for open futures contracts.
4 The issuer operates under a congressional charter; its securities are generally neither guaranteed by the U.S. Treasury nor backed by
the full faith and credit of the U.S. government.
See accompanying Notes, which are an integral part of the Financial Statements.
45
Mega Cap Value Index Fund
Statement of Operations
| |
| | Year Ended |
| | August 31, 2014 |
| | ($000) |
| Investment Income | |
| Income | |
| Dividends | 23,369 |
| Interest1 | 1 |
| Total Income | 23,370 |
| Expenses | |
| The Vanguard Group—Note B | |
| Investment Advisory Services | 145 |
| Management and Administrative—Institutional Shares | 68 |
| Management and Administrative—ETF Shares | 485 |
| Marketing and Distribution—Institutional Shares | 39 |
| Marketing and Distribution—ETF Shares | 130 |
| Custodian Fees | 19 |
| Auditing Fees | 32 |
| Shareholders’ Reports—Institutional Shares | 4 |
| Shareholders’ Reports—ETF Shares | 16 |
| Trustees’ Fees and Expenses | 1 |
| Total Expenses | 939 |
| Net Investment Income | 22,431 |
| Realized Net Gain (Loss) | |
| Investment Securities Sold | 66,167 |
| Futures Contracts | 276 |
| Realized Net Gain (Loss) | 66,443 |
| Change in Unrealized Appreciation (Depreciation) | |
| Investment Securities | 96,042 |
| Futures Contracts | 26 |
| Change in Unrealized Appreciation (Depreciation) | 96,068 |
| Net Increase (Decrease) in Net Assets Resulting from Operations | 184,942 |
| 1 Interest income from an affiliated company of the fund was $1,000. |
See accompanying Notes, which are an integral part of the Financial Statements.
46
Mega Cap Value Index Fund
Statement of Changes in Net Assets
| | |
| | Year Ended August 31, |
| | 2014 | 2013 |
| | ($000) | ($000) |
| Increase (Decrease) in Net Assets | | |
| Operations | | |
| Net Investment Income | 22,431 | 17,853 |
| Realized Net Gain (Loss) | 66,443 | 20,792 |
| Change in Unrealized Appreciation (Depreciation) | 96,068 | 88,338 |
| Net Increase (Decrease) in Net Assets Resulting from Operations | 184,942 | 126,983 |
| Distributions | | |
| Net Investment Income | | |
| Institutional Shares | (4,526) | (3,520) |
| ETF Shares | (16,562) | (13,519) |
| Realized Capital Gain | | |
| Institutional Shares | — | — |
| ETF Shares | — | — |
| Total Distributions | (21,088) | (17,039) |
| Capital Share Transactions | | |
| Institutional Shares | 13,763 | 31,045 |
| ETF Shares | 130,154 | 109,662 |
| Net Increase (Decrease) from Capital Share Transactions | 143,917 | 140,707 |
| Total Increase (Decrease) | 307,771 | 250,651 |
| Net Assets | | |
| Beginning of Period | 774,425 | 523,774 |
| End of Period1 | 1,082,196 | 774,425 |
1 Net Assets—End of Period includes undistributed (overdistributed) net investment income of $5,156,000 and $3,813,000.See accompanying Notes, which are an integral part of the Financial Statements.
47
Mega Cap Value Index Fund
Financial Highlights
| | | | | |
| Institutional Shares | | | | | |
| |
| For a Share Outstanding | Year Ended August 31, |
| Throughout Each Period | 2014 | 2013 | 2012 | 2011 | 2010 |
| Net Asset Value, Beginning of Period | $98.45 | $82.90 | $73.55 | $65.97 | $66.02 |
| Investment Operations | | | | | |
| Net Investment Income | 2.687 | 2.5311 | 2.339 | 1.965 | 1.932 |
| Net Realized and Unrealized Gain (Loss) | | | | | |
| on Investments | 19.649 | 15.493 | 9.303 | 7.528 | (. 075) |
| Total from Investment Operations | 22.336 | 18.024 | 11.642 | 9.493 | 1.857 |
| Distributions | | | | | |
| Dividends from Net Investment Income | (2.606) | (2.474) | (2.292) | (1.913) | (1.907) |
| Distributions from Realized Capital Gains | — | — | — | — | — |
| Total Distributions | (2.606) | (2.474) | (2.292) | (1.913) | (1.907) |
| Net Asset Value, End of Period | $118.18 | $98.45 | $82.90 | $73.55 | $65.97 |
| |
| Total Return | 22.95% | 22.07% | 16.19% | 14.33% | 2.69% |
| |
| Ratios/Supplemental Data | | | | | |
| Net Assets, End of Period (Millions) | $212 | $164 | $110 | $105 | $76 |
| Ratio of Total Expenses to Average Net Assets | 0.08% | 0.08% | 0.08% | 0.10% | 0.11% |
| Ratio of Net Investment Income to | | | | | |
| Average Net Assets | 2.50% | 2.75% | 3.01% | 2.65% | 2.88% |
| Portfolio Turnover Rate 2 | 8% | 34% | 17% | 24% | 26% |
1 Calculated based on average shares outstanding.2 Excludes the value of portfolio securities received or delivered as a result of in-kind purchases or redemptions of the fund’s capital shares,including ETF Creation Units.See accompanying Notes, which are an integral part of the Financial Statements.
48
Mega Cap Value Index Fund
Financial Highlights
| | | | | |
| ETF Shares | | | | | |
| |
| For a Share Outstanding | Year Ended August 31, |
| Throughout Each Period | 2014 | 2013 | 2012 | 2011 | 2010 |
| Net Asset Value, Beginning of Period | $49.65 | $41.80 | $37.09 | $33.26 | $33.29 |
| Investment Operations | | | | | |
| Net Investment Income | 1.338 | 1.2721 | 1.164 | .983 | .969 |
| Net Realized and Unrealized Gain (Loss) | | | | | |
| on Investments | 9.911 | 7.809 | 4.689 | 3.805 | (.042) |
| Total from Investment Operations | 11.249 | 9.081 | 5.853 | 4.788 | .927 |
| Distributions | | | | | |
| Dividends from Net Investment Income | (1.299) | (1.231) | (1.143) | (.958) | (.957) |
| Distributions from Realized Capital Gains | — | — | — | — | — |
| Total Distributions | (1.299) | (1.231) | (1.143) | (.958) | (.957) |
| Net Asset Value, End of Period | $59.60 | $49.65 | $41.80 | $37.09 | $33.26 |
| |
| Total Return | 22.92% | 22.05% | 16.13% | 14.32% | 2.68% |
| |
| Ratios/Supplemental Data | | | | | |
| Net Assets, End of Period (Millions) | $870 | $611 | $414 | $341 | $226 |
| Ratio of Total Expenses to Average Net Assets | 0.11% | 0.11% | 0.12% | 0.12% | 0.13% |
| Ratio of Net Investment Income to | | | | | |
| Average Net Assets | 2.47% | 2.72% | 2.97% | 2.63% | 2.86% |
| Portfolio Turnover Rate 2 | 8% | 34% | 17% | 24% | 26% |
1 Calculated based on average shares outstanding.2 Excludes the value of portfolio securities received or delivered as a result of in-kind purchases or redemptions of the fund’s capital shares,including ETF Creation Units.See accompanying Notes, which are an integral part of the Financial Statements.
49
Mega Cap Value Index Fund
Notes to Financial Statements
Vanguard Mega Cap Value Index Fund is registered under the Investment Company Act of 1940 as an open-end investment company, or mutual fund. The fund offers two classes of shares: Institutional Shares and ETF Shares. Institutional Shares are designed for investors who meet certain administrative, service, and account-size criteria. ETF Shares are listed for trading on NYSE Arca; they can be purchased and sold through a broker.
A. The following significant accounting policies conform to generally accepted accounting principles for U.S. investment companies. The fund consistently follows such policies in preparing its financial statements.
1. Security Valuation: Securities are valued as of the close of trading on the New York Stock Exchange (generally 4 p.m., Eastern time) on the valuation date. Equity securities are valued at the latest quoted sales prices or official closing prices taken from the primary market in which each security trades; such securities not traded on the valuation date are valued at the mean of the latest quoted bid and asked prices. Securities for which market quotations are not readily available, or whose values have been materially affected by events occurring before the fund’s pricing time but after the close of the securities’ primary markets, are valued by methods deemed by the board of trustees to represent fair value. Investments in Vanguard Market Liquidity Fund are valued at that fund’s net asset value. Temporary cash investments acquired over 60 days to maturity are valued using the latest bid prices or using valuations based on a matrix system (which considers such factors as security prices, yields, maturities, and ratings), both as furnished by independent pricing services. Other temporary cash investments are valued at amortized cost, which approximates market value.
2. Futures Contracts: The fund uses index futures contracts to a limited extent, with the objectives of maintaining full exposure to the stock market, enhancing returns, maintaining liquidity, and minimizing transaction costs. The fund may purchase futures contracts to immediately invest incoming cash in the market, or sell futures in response to cash outflows, thereby simulating a fully invested position in the underlying index while maintaining a cash balance for liquidity. The fund may seek to enhance returns by using futures contracts instead of the underlying securities when futures are believed to be priced more attractively than the underlying securities. The primary risks associated with the use of futures contracts are imperfect correlation between changes in market values of stocks held by the fund and the prices of futures contracts, and the possibility of an illiquid market. Counterparty risk involving futures is mitigated because a regulated clearinghouse is the counterparty instead of the clearing broker. To further mitigate counterparty risk, the fund trades futures contracts on an exchange, monitors the financial strength of its clearing brokers and clearinghouse, and has entered into clearing agreements with its clearing brokers. The clearinghouse imposes initial margin requirements to secure the fund’s performance and requires daily settlement of variation margin representing changes in the market value of each contract.
Futures contracts are valued at their quoted daily settlement prices. The aggregate settlement values of the contracts are not recorded in the Statement of Net Assets. Fluctuations in the value of the contracts are recorded in the Statement of Net Assets as an asset (liability) and in the Statement of Operations as unrealized appreciation (depreciation) until the contracts are closed, when they are recorded as realized futures gains (losses).
50
Mega Cap Value Index Fund
During the year ended August 31, 2014, the fund’s average investments in long and short futures contracts represented less than 1% and 0% of net assets, respectively, based on the average of aggregate settlement values at each quarter-end during the period.
3. Federal Income Taxes: The fund intends to continue to qualify as a regulated investment company and distribute all of its taxable income. Management has analyzed the fund’s tax positions taken for all open federal income tax years (August 31, 2011–2014), and has concluded that no provision for federal income tax is required in the fund’s financial statements.
4. Distributions: Distributions to shareholders are recorded on the ex-dividend date.
5. Credit Facility: The fund and certain other funds managed by The Vanguard Group participate in a $2.89 billion committed credit facility provided by a syndicate of lenders pursuant to a credit agreement that may be renewed annually; each fund is individually liable for its borrowings, if any, under the credit facility. Borrowings may be utilized for temporary and emergency purposes, and are subject to the fund’s regulatory and contractual borrowing restrictions. The participating funds are charged administrative fees and an annual commitment fee of 0.06% of the undrawn amount of the facility; these fees are allocated to the funds based on a method approved by the fund’s board of trustees and included in Management and Administrative expenses on the fund’s Statement of Operations. Any borrowings under this facility bear interest at a rate equal to the higher of the federal funds rate or LIBOR reference rate plus an agreed-upon spread.
The fund had no borrowings outstanding at August 31, 2014, or at any time during the period then ended.
6. Other: Dividend income is recorded on the ex-dividend date. Interest income includes income distributions received from Vanguard Market Liquidity Fund and is accrued daily. Premiums and discounts on debt securities purchased are amortized and accreted, respectively, to interest income over the lives of the respective securities. Security transactions are accounted for on the date securities are bought or sold. Costs used to determine realized gains (losses) on the sale of investment securities are those of the specific securities sold.
Each class of shares has equal rights as to assets and earnings, except that each class separately bears certain class-specific expenses related to maintenance of shareholder accounts (included in Management and Administrative expenses) and shareholder reporting. Marketing and distribution expenses are allocated to each class of shares based on a method approved by the board of trustees. Income, other non-class-specific expenses, and gains and losses on investments are allocated to each class of shares based on its relative net assets.
B. The Vanguard Group furnishes at cost investment advisory, corporate management, administrative, marketing, and distribution services. The costs of such services are allocated to the fund based on methods approved by the board of trustees. The fund has committed to provide up to 0.40% of its net assets in capital contributions to Vanguard. At August 31, 2014, the fund had contributed capital of $106,000 to Vanguard (included in Other Assets), representing 0.01% of the fund’s net assets and 0.04% of Vanguard’s capitalization. The fund’s trustees and officers are also directors and officers of Vanguard.
51
Mega Cap Value Index Fund
C. Various inputs may be used to determine the value of the fund’s investments. These inputs are summarized in three broad levels for financial statement purposes. The inputs or methodologies used to value securities are not necessarily an indication of the risk associated with investing in those securities.
Level 1—Quoted prices in active markets for identical securities.
Level 2���Other significant observable inputs (including quoted prices for similar securities, interest rates, prepayment speeds, credit risk, etc.).
Level 3—Significant unobservable inputs (including the fund’s own assumptions used to determine the fair value of investments).
The following table summarizes the market value of the fund’s investments as of August 31, 2014, based on the inputs used to value them:
| | | |
| | Level 1 | Level 2 | Level 3 |
| Investments | ($000) | ($000) | ($000) |
| Common Stocks | 1,081,556 | — | — |
| Temporary Cash Investments | — | 200 | — |
| Futures Contracts—Assets1 | 1 | — | — |
| Total | 1,081,557 | 200 | — |
| 1 Represents variation margin on the last day of the reporting period. |
D. At August 31, 2014, the aggregate settlement value of open futures contracts and the related unrealized appreciation (depreciation) were:
| | | | |
| | | | ($000) |
| | | | Aggregate | |
| | | Number of | Settlement | Unrealized |
| | | Long (Short) | Value | Appreciation |
| Futures Contracts | Expiration | Contracts | Long (Short) | (Depreciation) |
| E-mini S&P 500 Index | September 2014 | 1 | 500 | 18 |
Unrealized appreciation (depreciation) on open futures contracts is required to be treated as realized gain (loss) for tax purposes.
E. Distributions are determined on a tax basis and may differ from net investment income and realized capital gains for financial reporting purposes. Differences may be permanent or temporary. Permanent differences are reclassified among capital accounts in the financial statements to reflect their tax character. Temporary differences arise when certain items of income, expense, gain, or loss are recognized in different periods for financial statement and tax purposes. These differences will reverse at some time in the future. Differences in classification may also result from the treatment of short-term gains as ordinary income for tax purposes.
During the year ended August 31, 2014, the fund realized $63,070,000 of net capital gains resulting from in-kind redemptions—in which shareholders exchanged fund shares for securities held by the fund rather than for cash. Because such gains are not taxable to the fund, and are not distributed to shareholders, they have been reclassified from accumulated net realized losses to paid-in capital.
52
Mega Cap Value Index Fund
For tax purposes, at August 31, 2014, the fund had $5,484,000 of ordinary income available for distribution. The fund used capital loss carryforwards of $3,399,000 to offset taxable capital gains realized during the year ended August 31, 2014. At August 31, 2014, the fund had available capital losses totaling $7,184,000 to offset future net capital gains. Of this amount, $6,977,000 is subject to expiration on August 31, 2019. Capital losses of $207,000 realized beginning in fiscal 2012 may be carried forward indefinitely under the Regulated Investment Company Modernization Act of 2010, but must be used before any expiring loss carryforwards.
At August 31, 2014, the cost of investment securities for tax purposes was $871,929,000. Net unrealized appreciation of investment securities for tax purposes was $209,827,000, consisting of unrealized gains of $213,875,000 on securities that had risen in value since their purchase and $4,048,000 in unrealized losses on securities that had fallen in value since their purchase.
F. During the year ended August 31, 2014, the fund purchased $405,740,000 of investment securities and sold $259,663,000 of investment securities, other than temporary cash investments. Purchases and sales include $307,236,000 and $185,646,000, respectively, in connection with in-kind purchases and redemptions of the fund’s capital shares.
| | | | |
| G. Capital share transactions for each class of shares were: | | | |
| | Year Ended August 31, |
| | | 2014 | | | 2013 |
| | Amount | Shares | Amount | Shares |
| | ($000) | (000) | ($000) | (000) |
| Institutional Shares | | | | |
| Issued | 41,244 | 382 | 49,701 | 541 |
| Issued in Lieu of Cash Distributions | 3,640 | 34 | 2,843 | 32 |
| Redeemed | (31,121) | (286) | (21,499) | (236) |
| Net Increase (Decrease) —Institutional Shares | 13,763 | 130 | 31,045 | 337 |
| ETF Shares | | | | |
| Issued | 319,267 | 5,602 | 152,877 | 3,400 |
| Issued in Lieu of Cash Distributions | — | — | — | — |
| Redeemed | (189,113) | (3,300) | (43,215) | (1,000) |
| Net Increase (Decrease)—ETF Shares | 130,154 | 2,302 | 109,662 | 2,400 |
H. Management has determined that no material events or transactions occurred subsequent to August 31, 2014, that would require recognition or disclosure in these financial statements.
53
Report of Independent Registered
Public Accounting Firm
To the Board of Trustees of Vanguard World Fund and the Shareholders of Vanguard Mega Cap Index Fund, Vanguard Mega Cap Growth Index Fund and Vanguard Mega Cap Value Index Fund:
In our opinion, the accompanying statements of net assets and the related statements of operations and of changes in net assets and the financial highlights present fairly, in all material respects, the financial position of Vanguard Mega Cap Index Fund, Vanguard Mega Cap Growth Index Fund and Vanguard Mega Cap Value Index Fund (constituting separate portfolios of Vanguard World Fund, hereafter referred to as the “Funds”) at August 31, 2014, the results of each of their operations for the year then ended, the changes in each of their net assets for each of the two years in the period then ended, and the financial highlights for each of the five years in the period then ended, in conformity with accounting principles generally accepted in the United States of America. These financial statements and financial highlights (hereafter referred to as “financial statements”) are the responsibility of the Funds’ management. Our responsibility is to express an opinion on these financial statements based on our audits. We conducted our audits of these financial statements in accordance with the standards of the Public Company Accounting Oversight Board (United States). Those standards require that we plan and perform the audit to obtain reasonable assurance about whether the financial statements are free of material misstatement. An audit includes examining, on a test basis, evidence supporting the amounts and disclosures in the financial statements, assessing the accounting principles used and significant estimates made by management, and evaluating the overall financial statement presentation. We believe that our audits, which included confirmation of securities at August 31, 2014 by correspondence with the custodian and broker and by agreement to the underlying ownership records of the transfer agent, provide a reasonable basis for our opinion.
/s/PricewaterhouseCoopers LLP
Philadelphia, Pennsylvania
October 10, 2014
54

Special 2014 tax information (unaudited) for Vanguard Mega Cap Index Funds
This information for the fiscal year ended August 31, 2014, is included pursuant to provisions of the
Internal Revenue Code.
The funds distributed qualified dividend income to shareholders during the fiscal year as follows:
| |
| Fund | ($000) |
| Mega Cap Index Fund | 19,701 |
| Mega Cap Growth Index Fund | 17,354 |
| Mega Cap Value Index Fund | 21,088 |
For corporate shareholders, the percentage of investment income (dividend income plus short-term gains, if any) that qualifies for the dividends-received deduction is as follows:
| |
| Fund | Percentage |
| Mega Cap Index Fund | 99.6% |
| Mega Cap Growth Index Fund | 96.6 |
| Mega Cap Value Index Fund | 100.0 |
55
Your Fund’s After-Tax Returns
This table presents returns for your fund both before and after taxes. The after-tax returns are shown in two ways: (1) assuming that an investor owned the fund during the entire period and paid taxes on the fund’s distributions, and (2) assuming that an investor paid taxes on the fund’s distributions and sold all shares at the end of each period.
Calculations are based on the highest individual federal income tax and capital gains tax rates in effect at the times of the distributions and the hypothetical sales. State and local taxes were not considered. After-tax returns reflect any qualified dividend income, using actual prior-year figures and estimates for 2014. (In the example, returns after the sale of fund shares may be higher than those assuming no sale. This occurs when the sale would have produced a capital loss. The calculation assumes that the investor received a tax deduction for the loss.)
The table shows returns for ETF Shares only; returns for other share classes will differ. Please note that your actual after-tax returns will depend on your tax situation and may differ from those shown. Also note that if you own the fund in a tax-deferred account, such as an individual retirement account or a 401(k) plan, this information does not apply to you. Such accounts are not subject to current taxes.
Finally, keep in mind that a fund’s performance—whether before or after taxes—does not guarantee future results.
Average Annual Total Returns: Mega Cap Index Funds
Periods Ended August 31, 2014
| | | |
| | | | Since |
| | One | Five | Inception |
| | Year | Years | (12/17/2007) |
| Mega Cap Index Fund ETF Shares | | | |
| Returns Before Taxes | 25.13% | 16.55% | 7.23% |
| Returns After Taxes on Distributions | 24.54 | 16.13 | 6.87 |
| Returns After Taxes on Distributions and Sale of Fund Shares | 14.63 | 13.40 | 5.72 |
| | | | Since |
| | One | Five | Inception |
| | Year | Years | (12/17/2007) |
| Mega Cap Growth Index Fund ETF Shares | | | |
| Returns Before Taxes | 28.05% | 17.81% | 8.85% |
| Returns After Taxes on Distributions | 27.63 | 17.51 | 8.60 |
| Returns After Taxes on Distributions and Sale of Fund Shares | 16.17 | 14.47 | 7.08 |
| |
| | | | Since |
| | One | Five | Inception |
| | Year | Years | (12/17/2007) |
| Mega Cap Value Index Fund ETF Shares | | | |
| Returns Before Taxes | 22.92% | 15.38% | 5.63% |
| Returns After Taxes on Distributions | 22.23 | 14.85 | 5.16 |
| Returns After Taxes on Distributions and Sale of Fund Shares | 13.45 | 12.41 | 4.42 |
56
About Your Fund’s Expenses
As a shareholder of the fund, you incur ongoing costs, which include costs for portfolio management, administrative services, and shareholder reports (like this one), among others. Operating expenses, which are deducted from a fund’s gross income, directly reduce the investment return of the fund.
A fund’s expenses are expressed as a percentage of its average net assets. This figure is known as the expense ratio. The following examples are intended to help you understand the ongoing costs (in dollars) of investing in your fund and to compare these costs with those of other mutual funds. The examples are based on an investment of $1,000 made at the beginning of the period shown and held for the entire period.
The accompanying table illustrates your fund’s costs in two ways:
• Based on actual fund return. This section helps you to estimate the actual expenses that you paid over the period. The ”Ending Account Value“ shown is derived from the fund‘s actual return, and the third column shows the dollar amount that would have been paid by an investor who started with $1,000 in the fund. You may use the information here, together with the amount you invested, to estimate the expenses that you paid over the period.
To do so, simply divide your account value by $1,000 (for example, an $8,600 account value divided by $1,000 = 8.6), then multiply the result by the number given for your fund under the heading ”Expenses Paid During Period.“
• Based on hypothetical 5% yearly return. This section is intended to help you compare your fund‘s costs with those of other mutual funds. It assumes that the fund had a yearly return of 5% before expenses, but that the expense ratio is unchanged. In this case—because the return used is not the fund’s actual return—the results do not apply to your investment. The example is useful in making comparisons because the Securities and Exchange Commission requires all mutual funds to calculate expenses based on a 5% return. You can assess your fund’s costs by comparing this hypothetical example with the hypothetical examples that appear in shareholder reports of other funds.
Note that the expenses shown in the table are meant to highlight and help you compare ongoing costs only and do not reflect transaction costs incurred by the fund for buying and selling securities. Further, the expenses do not include any purchase, redemption, or account service fees described in the fund prospectus. If such fees were applied to your account, your costs would be higher. Your fund does not carry a “sales load.”
The calculations assume no shares were bought or sold during the period. Your actual costs may have been higher or lower, depending on the amount of your investment and the timing of any purchases or redemptions.
You can find more information about the fund’s expenses, including annual expense ratios, in the Financial Statements section of this report. For additional information on operating expenses and other shareholder costs, please refer to your fund’s current prospectus.
57
| | | |
| Six Months Ended August 31, 2014 | | | |
| | Beginning | Ending | Expenses |
| | Account Value | Account Value | Paid During |
| | 2/28/2014 | 8/31/2014 | Period |
| Based on Actual Fund Return | | | |
| Mega Cap Index Fund | | | |
| Institutional Shares | $1,000.00 | $1,089.95 | $0.42 |
| ETF Shares | 1,000.00 | 1,089.86 | 0.58 |
| Mega Cap Growth Index Fund | | | |
| Institutional Shares | $1,000.00 | $1,080.43 | $0.52 |
| ETF Shares | 1,000.00 | 1,080.35 | 0.58 |
| Mega Cap Value Index Fund | | | |
| Institutional Shares | $1,000.00 | $1,097.25 | $0.42 |
| ETF Shares | 1,000.00 | 1,097.01 | 0.58 |
| Based on Hypothetical 5% Yearly Return | | | |
| Mega Cap Index Fund | | | |
| Institutional Shares | $1,000.00 | $1,024.80 | $0.41 |
| ETF Shares | 1,000.00 | 1,024.65 | 0.56 |
| Mega Cap Growth Index Fund | | | |
| Institutional Shares | $1,000.00 | $1,024.70 | $0.51 |
| ETF Shares | 1,000.00 | 1,024.65 | 0.56 |
| Mega Cap Value Index Fund | | | |
| Institutional Shares | $1,000.00 | $1,024.80 | $0.41 |
| ETF Shares | 1,000.00 | 1,024.65 | 0.56 |
The calculations are based on expenses incurred in the most recent six-month period. The funds’ annualized six-month expense ratios for thatperiod are: for the Mega Cap Index Fund, 0.08% for Institutional Shares and 0.11% for ETF Shares; for the Mega Cap Growth Index Fund,0.10% for Institutional Shares and 0.11% for ETF Shares; and for the Mega Cap Value Index Fund, 0.08% for Institutional Shares and 0.11%for ETF Shares. The dollar amounts shown as “Expenses Paid” are equal to the annualized expense ratio multiplied by the average accountvalue over the period, multiplied by the number of days in the most recent six-month period, then divided by the number of days in the mostrecent 12-month period.58
Trustees Approve Advisory Arrangements
The board of trustees of Vanguard Mega Cap Index Fund, Mega Cap Growth Index Fund, and Mega Cap Value Index Fund has renewed each fund’s investment advisory arrangement with The Vanguard Group, Inc. (Vanguard). Vanguard’s Equity Investment Group—through its Equity Index Group—serves as investment advisor for each fund. The board determined that continuing each fund’s internalized management structure was in the best interests of each fund and its shareholders.
The board based its decision upon an evaluation of the advisor’s investment staff, portfolio management process, and performance. The trustees considered the factors discussed below, among others. However, no single factor determined whether the board approved the arrangements. Rather, it was the totality of the circumstances that drove the board’s decision.
Nature, extent, and quality of services
The board considered the quality of each fund’s investment management services over both the short and long term, and took into account the organizational depth and stability of the advisor. The board noted that Vanguard has been managing investments for more than three decades. The Equity Index Group adheres to a sound, disciplined investment management process; the team has considerable experience, stability, and depth.
The board concluded that Vanguard’s experience, stability, depth, and performance, among other factors, warranted continuation of each advisory arrangement.
Investment performance
The board considered the short- and long-term performance of each fund, including any periods of outperformance or underperformance relative to a target index and peer group. The board concluded that the performance was such that each advisory arrangement should continue. Information about the funds’ most recent performance can be found on the Performance Summary pages of this report.
Cost
The board concluded that each fund’s expense ratio was well below the average expense ratio charged by funds in its respective peer group and that each fund’s advisory fee rate was also well below its peer-group average. Information about the funds’ expenses appears in the About Your Fund’s Expenses section of this report as well as in the Financial Statements sections.
The board does not conduct a profitability analysis of Vanguard, because of Vanguard’s unique “at-cost” structure. Unlike most other mutual fund management companies, Vanguard is owned by the funds it oversees, and produces “profits” only in the form of reduced expenses for fund shareholders.
The benefit of economies of scale
The board concluded that each fund’s at-cost arrangement with Vanguard ensures that the funds will realize economies of scale as they grow, with the cost to shareholders declining as fund assets increase.
The board will consider whether to renew the advisory arrangements again after a one-year period.
59
Glossary
30-Day SEC Yield. A fund’s 30-day SEC yield is derived using a formula specified by the U.S. Securities and Exchange Commission. Under the formula, data related to the fund’s security holdings in the previous 30 days are used to calculate the fund’s hypothetical net income for that period, which is then annualized and divided by the fund’s estimated average net assets over the calculation period. For the purposes of this calculation, a security’s income is based on its current market yield to maturity (for bonds), its actual income (for asset-backed securities), or its projected dividend yield (for stocks). Because the SEC yield represents hypothetical annualized income, it will differ—at times significantly—from the fund’s actual experience. As a result, the fund’s income distributions may be higher or lower than implied by the SEC yield.
Beta. A measure of the magnitude of a fund’s past share-price fluctuations in relation to the ups and downs of a given market index. The index is assigned a beta of 1.00. Compared with a given index, a fund with a beta of 1.20 typically would have seen its share price rise or fall by 12% when the index rose or fell by 10%. For this report, beta is based on returns over the past 36 months for both the fund and the index. Note that a fund’s beta should be reviewed in conjunction with its R-squared (see definition). The lower the R-squared, the less correlation there is between the fund and the index, and the less reliable beta is as an indicator of volatility.
Dividend Yield. Dividend income earned by stocks, expressed as a percentage of the aggregate market value (or of net asset value, for a fund). The yield is determined by dividing the amount of the annual dividends by the aggregate value (or net asset value) at the end of the period. For a fund, the dividend yield is based solely on stock holdings and does not include any income produced by other investments.
Earnings Growth Rate. The average annual rate of growth in earnings over the past five years for the stocks now in a fund.
Equity Exposure. A measure that reflects a fund’s investments in stocks and stock futures. Any holdings in short-term reserves are excluded.
Expense Ratio. A fund’s total annual operating expenses expressed as a percentage of the fund’s average net assets. The expense ratio includes management and administrative expenses, but does not include the transaction costs of buying and selling portfolio securities.
Foreign Holdings. The percentage of a fund represented by securities or depositary receipts of companies based outside the United States.
Inception Date. The date on which the assets of a fund (or one of its share classes) are first invested in accordance with the fund’s investment objective. For funds with a subscription period, the inception date is the day after that period ends. Investment performance is measured from the inception date.
Median Market Cap. An indicator of the size of companies in which a fund invests; the midpoint of market capitalization (market price x shares outstanding) of a fund’s stocks, weighted by the proportion of the fund’s assets invested in each stock. Stocks representing half of the fund’s assets have market capitalizations above the median, and the rest are below it.
Price/Book Ratio. The share price of a stock divided by its net worth, or book value, per share. For a fund, the weighted average price/book ratio of the stocks it holds.
60
Price/Earnings Ratio. The ratio of a stock’s current price to its per-share earnings over the past year. For a fund, the weighted average P/E of the stocks it holds. P/E is an indicator of market expectations about corporate prospects; the higher the P/E, the greater the expectations for a company’s future growth.
R-Squared. A measure of how much of a fund’s past returns can be explained by the returns from the market in general, as measured by a given index. If a fund’s total returns were precisely synchronized with an index’s returns, its R-squared would be 1.00. If the fund’s returns bore no relationship to the index’s returns, its R-squared would be 0. For this report, R-squared is based on returns over the past 36 months for both the fund and the index.
Return on Equity. The annual average rate of return generated by a company during the past five years for each dollar of shareholder’s equity (net income divided by shareholder’s equity). For a fund, the weighted average return on equity for the companies whose stocks it holds.
Short-Term Reserves. The percentage of a fund invested in highly liquid, short-term securities that can be readily converted to cash.
Turnover Rate. An indication of the fund’s trading activity. Funds with high turnover rates incur higher transaction costs and may be more likely to distribute capital gains (which may be taxable to investors). The turnover rate excludes in-kind transactions, which have minimal impact on costs.
Benchmark Information
Spliced Mega Cap Index: MSCI US Large Cap 300 Index through January 30, 2013; CRSP US Mega Cap Index thereafter.
Spliced Mega Cap Growth Index: MSCI US Large Cap Growth Index through April 16, 2013; CRSP US Mega Cap Growth Index thereafter.
Spliced Mega Cap Value Index: MSCI US Large Cap Value Index through April 16, 2013; CRSP US Mega Cap Value Index thereafter.
61
This page intentionally left blank.
This page intentionally left blank.
The People Who Govern Your Fund
The trustees of your mutual fund are there to see that the fund is operated and managed in your best interests since, as a shareholder, you are a part owner of the fund. Your fund’s trustees also serve on the board of directors of The Vanguard Group, Inc., which is owned by the Vanguard funds and provides services to them on an at-cost basis.
A majority of Vanguard’s board members are independent, meaning that they have no affiliation with Vanguard or the funds they oversee, apart from the sizable personal investments they have made as private individuals. The independent board members have distinguished backgrounds in business, academia, and public service. Each of the trustees and executive officers oversees 177 Vanguard funds.
The following table provides information for each trustee and executive officer of the fund. More information about the trustees is in the Statement of Additional Information, which can be obtained, without charge, by contacting Vanguard at 800-662-7447, or online at vanguard.com.
| |
| InterestedTrustee1 | and Delphi Automotive LLP (automotive components); |
| | Senior Advisor at New Mountain Capital. |
| F. William McNabb III | |
| Born 1957. Trustee Since July 2009. Chairman of the | Amy Gutmann |
| Board. Principal Occupation(s) During the Past Five | Born 1949. Trustee Since June 2006. Principal |
| Years: Chairman of the Board of The Vanguard Group, | Occupation(s) During the Past Five Years: President of |
| Inc., and of each of the investment companies served | the University of Pennsylvania; Christopher H. Browne |
| by The Vanguard Group, since January 2010; Director | Distinguished Professor of Political Science, School of |
| of The Vanguard Group since 2008; Chief Executive | Arts and Sciences, and Professor of Communication, |
| Officer and President of The Vanguard Group, and of | Annenberg School for Communication, with secondary |
| each of the investment companies served by The | faculty appointments in the Department of Philosophy, |
| Vanguard Group, since 2008; Director of Vanguard | School of Arts and Sciences, and at the Graduate |
| Marketing Corporation; Managing Director of The | School of Education, University of Pennsylvania; |
| Vanguard Group (1995–2008). | Trustee of the National Constitution Center; Chair |
| | of the Presidential Commission for the Study of |
| | Bioethical Issues. |
| IndependentTrustees | |
| | JoAnn Heffernan Heisen |
| Emerson U. Fullwood | Born 1950. Trustee Since July 1998. Principal |
| Born 1948. Trustee Since January 2008. Principal | Occupation(s) During the Past Five Years: Corporate |
| Occupation(s) During the Past Five Years: Executive | Vice President and Chief Global Diversity Officer |
| Chief Staff and Marketing Officer for North America | (retired 2008) and Member of the Executive |
| and Corporate Vice President (retired 2008) of Xerox | Committee (1997–2008) of Johnson & Johnson |
| Corporation (document management products and | (pharmaceuticals/medical devices/consumer |
| services); Executive in Residence and 2009–2010 | products); Director of Skytop Lodge Corporation |
| Distinguished Minett Professor at the Rochester | (hotels), the University Medical Center at Princeton, |
| Institute of Technology; Director of SPX Corporation | the Robert Wood Johnson Foundation, and the Center |
| (multi-industry manufacturing), the United Way of | for Talent Innovation; Member of the Advisory Board |
| Rochester, Amerigroup Corporation (managed health | of the Maxwell School of Citizenship and Public Affairs |
| care), the University of Rochester Medical Center, | at Syracuse University. |
| Monroe Community College Foundation, and North | |
| Carolina A&T University. | F. Joseph Loughrey |
| | Born 1949. Trustee Since October 2009. Principal |
| Rajiv L. Gupta | Occupation(s) During the Past Five Years: President |
| Born 1945. Trustee Since December 2001.2 | and Chief Operating Officer (retired 2009) of Cummins |
| Principal Occupation(s) During the Past Five Years: | Inc. (industrial machinery); Chairman of the Board |
| Chairman and Chief Executive Officer (retired 2009) | of Hillenbrand, Inc. (specialized consumer services), |
| and President (2006–2008) of Rohm and Haas Co. | and of Oxfam America; Director of SKF AB (industrial |
| (chemicals); Director of Tyco International, Ltd. | machinery), Hyster-Yale Materials Handling, Inc. |
| (diversified manufacturing and services), Hewlett- | (forklift trucks), the Lumina Foundation for Education, |
| Packard Co. (electronic computer manufacturing), | |
| | |
| and the V Foundation for Cancer Research; Member | Executive Officers | |
| of the Advisory Council for the College of Arts and | | |
| Letters and of the Advisory Board to the Kellogg | Glenn Booraem | |
| Institute for International Studies, both at the | Born 1967. Controller Since July 2010. Principal |
| University of Notre Dame. | Occupation(s) During the Past Five Years: Principal |
| | of The Vanguard Group, Inc.; Controller of each of |
| Mark Loughridge | the investment companies served by The Vanguard |
| Born 1953. Trustee Since March 2012. Principal | Group; Assistant Controller of each of the investment |
| Occupation(s) During the Past Five Years: Senior Vice | companies served by The Vanguard Group (2001–2010). |
| President and Chief Financial Officer (retired 2013) | | |
| at IBM (information technology services); Fiduciary | Thomas J. Higgins | |
| Member of IBM’s Retirement Plan Committee (2004– | Born 1957. Chief Financial Officer Since September |
| 2013); Member of the Council on Chicago Booth. | 2008. Principal Occupation(s) During the Past Five |
| | Years: Principal of The Vanguard Group, Inc.; Chief |
| Scott C. Malpass | Financial Officer of each of the investment companies |
| Born 1962. Trustee Since March 2012. Principal | served by The Vanguard Group; Treasurer of each of |
| Occupation(s) During the Past Five Years: Chief | the investment companies served by The Vanguard |
| Investment Officer and Vice President at the University | Group (1998–2008). | |
| of Notre Dame; Assistant Professor of Finance at the | | |
| Mendoza College of Business at Notre Dame; Member | Kathryn J. Hyatt | |
| of the Notre Dame 403(b) Investment Committee; | Born 1955. Treasurer Since November 2008. Principal |
| Board Member of TIFF Advisory Services, Inc. | Occupation(s) During the Past Five Years: Principal of |
| (investment advisor); Member of the Investment | The Vanguard Group, Inc.; Treasurer of each of the |
| Advisory Committees of the Financial Industry | investment companies served by The Vanguard |
| Regulatory Authority (FINRA) and of Major League | Group; Assistant Treasurer of each of the investment |
| Baseball. | companies served by The Vanguard Group (1988–2008). |
| |
| André F. Perold | Heidi Stam | |
| Born 1952. Trustee Since December 2004. Principal | Born 1956. Secretary Since July 2005. Principal |
| Occupation(s) During the Past Five Years: George | Occupation(s) During the Past Five Years: Managing |
| Gund Professor of Finance and Banking, Emeritus | Director of The Vanguard Group, Inc.; General Counsel |
| at the Harvard Business School (retired 2011); | of The Vanguard Group; Secretary of The Vanguard |
| Chief Investment Officer and Managing Partner of | Group and of each of the investment companies |
| HighVista Strategies LLC (private investment firm); | served by The Vanguard Group; Director and Senior |
| Director of Rand Merchant Bank; Overseer of the | Vice President of Vanguard Marketing Corporation. |
| Museum of Fine Arts Boston. | | |
| | Vanguard Senior ManagementTeam |
| Alfred M. Rankin, Jr. | | |
| Born 1941. Trustee Since January 1993. Principal | Mortimer J. Buckley | Chris D. McIsaac |
| Occupation(s) During the Past Five Years: Chairman, | Kathleen C. Gubanich | Michael S. Miller |
| President, and Chief Executive Officer of NACCO | Paul A. Heller | James M. Norris |
| Industries, Inc. (housewares/lignite), and of Hyster- | Martha G. King | Glenn W. Reed |
| Yale Materials Handling, Inc. (forklift trucks); Chairman | John T. Marcante | |
| of the Board of University Hospitals of Cleveland. | | |
| |
| Peter F. Volanakis | Chairman Emeritus and Senior Advisor |
| Born 1955. Trustee Since July 2009. Principal | | |
| Occupation(s) During the Past Five Years: President | John J. Brennan | |
| and Chief Operating Officer (retired 2010) of Corning | Chairman, 1996–2009 | |
| Incorporated (communications equipment); Trustee of | Chief Executive Officer and President, 1996–2008 |
| Colby-Sawyer College; Member of the Advisory Board | | |
| of the Norris Cotton Cancer Center and of the Advisory | Founder | |
| Board of the Parthenon Group (strategy consulting). | | |
| | John C. Bogle | |
| | Chairman and Chief Executive Officer, 1974–1996 |
1 Mr. McNabb is considered an “interested person,” as defined in the Investment Company Act of 1940, because he is an officer of the
Vanguard funds.
2 December 2002 for Vanguard Equity Income Fund, the Vanguard Municipal Bond Funds, and the Vanguard State Tax-Exempt Funds.
| 
|
| | P.O. Box 2600 |
| | Valley Forge, PA 19482-2600 |
| |
| |
| |
| Connect with Vanguard® > vanguard.com | |
| |
| |
| |
| Fund Information > 800-662-7447 | |
| Direct Investor Account Services > 800-662-2739 | |
| Institutional Investor Services > 800-523-1036 | |
| Text Telephone for People | |
| With Hearing Impairment > 800-749-7273 | |
| |
| This material may be used in conjunction | |
| with the offering of shares of any Vanguard | |
| fund only if preceded or accompanied by | |
| the fund’s current prospectus. | |
| |
| All comparative mutual fund data are from Lipper, a | |
| Thomson Reuters Company, or Morningstar, Inc., unless | |
| otherwise noted. | |
| |
| You can obtain a free copy of Vanguard’s proxy voting | |
| guidelines by visiting vanguard.com/proxyreporting or by | |
| calling Vanguard at 800-662-2739. The guidelines are | |
| also available from the SEC’s website, sec.gov. In | |
| addition, you may obtain a free report on how your fund | |
| voted the proxies for securities it owned during the 12 | |
| months ended June 30. To get the report, visit either | |
| vanguard.com/proxyreporting or sec.gov. | |
| |
| You can review and copy information about your fund at | |
| the SEC’s Public Reference Room in Washington, D.C. To | |
| find out more about this public service, call the SEC at | |
| 202-551-8090. Information about your fund is also | |
| available on the SEC’s website, and you can receive | |
| copies of this information, for a fee, by sending a | |
| request in either of two ways: via e-mail addressed to | |
| publicinfo@sec.gov or via regular mail addressed to the | |
| Public Reference Section, Securities and Exchange | |
| Commission, Washington, DC 20549-1520. | |
| |
| | © 2014 The Vanguard Group, Inc. |
| | All rights reserved. |
| | Vanguard Marketing Corporation, Distributor. |
| |
| | Q8280 102014 |
Annual Report | August 31, 2014
Vanguard Extended Duration Treasury Index Fund
The mission continues
On May 1, 1975, Vanguard began operations, a fledgling company based on the simple but revolutionary idea that a mutual fund company should be managed solely in the interest of its investors.
Four decades later, that revolutionary spirit continues to animate the enterprise. Vanguard remains on a mission to give investors the best chance of investment success.
As we mark our 40th anniversary, we thank you for entrusting your assets to Vanguard and giving us the opportunity to help you reach your financial goals in the decades to come.
| |
| Contents | |
| Your Fund’s Total Returns. | 1 |
| Chairman’s Letter. | 2 |
| Fund Profile. | 8 |
| Performance Summary. | 9 |
| Financial Statements. | 12 |
| About Your Fund’s Expenses. | 24 |
| Trustees Approve Advisory Arrangement. | 26 |
| Glossary. | 27 |
Please note: The opinions expressed in this report are just that—informed opinions. They should not be considered promises or advice.
Also, please keep in mind that the information and opinions cover the period through the date on the front of this report. Of course, the
risks of investing in your fund are spelled out in the prospectus.
See the Glossary for definitions of investment terms used in this report.
About the cover: Since our founding, Vanguard has drawn inspiration from the enterprise and valor demonstrated by British
naval hero Horatio Nelson and his command at the Battle of the Nile in 1798. The photograph displays a replica of a merchant
ship from the same era as Nelson’s flagship, the HMS Vanguard.
Your Fund’s Total Returns
| | | | |
| Fiscal Year Ended August 31, 2014 | | | | |
| |
| | 30-Day SEC | Income | Capital | Total |
| | Yields | Returns | Returns | Returns |
| Vanguard Extended Duration Treasury Index Fund | | | | |
| Institutional Shares | 3.13% | 4.09% | 20.18% | 24.27% |
| Institutional Plus Shares | 3.15 | 4.12 | 20.19 | 24.31 |
| ETF Shares | 3.11 | | | |
| Market Price | | | | 24.22 |
| Net Asset Value | | | | 24.17 |
| Barclays U.S. Treasury STRIPS 20–30 Year Equal | | | | |
| Par Bond Index | | | | 23.70 |
| General U.S. Treasury Funds Average | | | | 7.41 |
General U.S. Treasury Funds Average: Derived from data provided by Lipper, a Thomson Reuters Company.
Institutional Shares and Institutional Plus Shares are available to certain institutional investors who meet specific administrative, service, and
account-size criteria. The Vanguard ETF® Shares shown are traded on the NYSE Arca exchange and are available only through brokers. The
table provides ETF returns based on both the NYSE Arca market price and the net asset value for a share. U.S. Pat. Nos. 6,879,964; 7,337,138;
7,720,749; 7,925,573; 8,090,646; and 8,417,623.
For the ETF Shares, the market price is determined by the midpoint of the bid-offer spread as of the closing time of the New York Stock
Exchange (generally 4 p.m., Eastern time). The net asset value is also determined as of the NYSE closing time. For more information about
how the ETF Shares' market prices have compared with their net asset value, visit vanguard.com, select your ETF, and then select the Price
and Performance tab. The ETF premium/discount analysis there shows the percentages of days on which the ETF Shares' market price was
above or below the NAV.
Your Fund’s Performance at a Glance
August 31, 2013, Through August 31, 2014
| | | | |
| | | | Distributions Per Share |
| | Starting | Ending | | |
| | Share | Share | Income | Capital |
| | Price | Price | Dividends | Gains |
| Vanguard Extended Duration Treasury Index Fund | | | | |
| Institutional Shares | $28.85 | $34.18 | $0.983 | $0.371 |
| Institutional Plus Shares | 72.42 | 85.80 | 2.491 | 0.931 |
| ETF Shares | 95.57 | 113.24 | 3.236 | 1.229 |
1

Chairman’s Letter
Dear Shareholder,
Bonds have confounded expectations so far in 2014. The markets were anticipating that yields, which had been rising across the board toward the end of 2013, would continue to do so once the Federal Reserve began scaling back its unprecedented bond-buying program. That proved to be the case for some shorter-dated bonds, but a revival in investor demand for longer-dated securities sent their yields falling even once the Fed began pulling back on its purchases.
Because bond yields and prices move in opposite directions, the environment was very positive for bonds with the longest maturities. Institutional Shares of Vanguard Extended Duration Treasury Index Fund returned 24.27% for the 12 months ended August 31, 2014. In breaking down that result, capital return contributed more than 20 percentage points and income return was roughly 4 percentage points.
The fund slightly outpaced the 23.70% return of its benchmark, largely because of temporary differences in security pricing. The fund’s return significantly exceeded the average for its peer group, though the comparison is imperfect as many peers hold Treasuries across the maturity spectrum.
If you have been invested for a while in the Extended Duration Treasury Fund, you’ll know that large swings in performance are par for the course. For fiscal 2013, for example, when yields moved higher, the
2
fund generated a negative return almost as large as this year’s gain. These swings are to be expected from a fund that seeks to offer investors such as managers of defined benefit pension plans a portfolio of assets that closely matches the value of their long-term liabilities.
Fixed income saw solid gains both at home and abroad
The broad U.S. taxable bond market returned 5.66% for the period, rallying from the drubbing it took a year ago. Municipal bonds fared even better, returning 10.14% as greater investor appetite for tax-exempt income drove up demand and as a decline in new issues limited supply.
International bond markets (as measured by the Barclays Global Aggregate Index ex USD) returned 6.52%. The European Central Bank continued its monetary easing, which included the unprecedented step of lowering a key interest rate below zero, to –0.10%, to try to avert deflation and induce banks to lend and thus fuel economic growth. The central banks of Japan and China implemented stimulus measures as well.
Following such a strong advance for bonds, it’s worth remembering that the current low yields imply lower future returns: As yields drop, the scope for further declines—and increases in prices—diminishes.
| | | |
| Market Barometer | | | |
| | | Average Annual Total Returns |
| | | Periods Ended August 31, 2014 |
| | One | Three | Five |
| | Year | Years | Years |
| Bonds | | | |
| Barclays U.S. Aggregate Bond Index (Broad taxable | | | |
| market) | 5.66% | 2.91% | 4.48% |
| Barclays Municipal Bond Index (Broad tax-exempt market) | 10.14 | 4.88 | 5.39 |
| Citigroup Three-Month U.S. Treasury Bill Index | 0.04 | 0.04 | 0.07 |
| |
| Stocks | | | |
| Russell 1000 Index (Large-caps) | 25.36% | 20.80% | 17.24% |
| Russell 2000 Index (Small-caps) | 17.68 | 19.00 | 17.03 |
| Russell 3000 Index (Broad U.S. market) | 24.74 | 20.65 | 17.22 |
| FTSE All-World ex US Index (International) | 18.04 | 9.48 | 8.44 |
| |
| CPI | | | |
| Consumer Price Index | 1.70% | 1.64% | 1.96% |
3
Stocks cleared hurdles en route to new highs
Despite an assortment of challenges, the broad U.S. stock market recorded an impressive return of about 25% for the 12 months ended August 31. U.S. stocks registered positive results in all but two months, and a late-July swoon was followed by an August flurry of record highs.
Investors applauded mostly solid corporate earnings, generally upbeat economic news, and the Fed’s continued accommodative policies. Still, turmoil in the Middle East and Ukraine, economic worries in Europe and China, and uncertainty about the Fed’s next moves pressured stocks at different times.
International stocks returned about 18%. Emerging markets, after sliding earlier in the period, rebounded to lead the way. The developed markets of the Pacific region and Europe trailed but still notched double-digit returns.
Bonds with longer maturities staged a strong rebound
In the spring of 2013, the Fed began bracing investors for a dialing back of its bond-buying program designed to speed the economy’s recovery from the Great Recession. Given the scale of the program, many investors assumed that the Fed’s cutback would hurt bond prices, which did decline through the end of 2013.
| | | |
| Expense Ratios | | | |
| |
| | Institutional | Institutional | ETF |
| | Shares | Plus Shares | Shares |
| Extended Duration Treasury Index Fund | 0.10% | 0.08% | 0.12% |
The fund expense ratios shown are from the prospectus dated December 23, 2013, and represent estimated costs for the current fiscal year.For the fiscal year ended August 31, 2014, the fund’s expense ratios were 0.10% for Institutional Shares, 0.08% for Institutional Plus Shares,and 0.12% for ETF Shares.4
The markets rarely evolve as expected, however. Yields at the long end of the curve began to ease back down as interest rates looked set to stay low for longer than the market had been anticipating. Forward guidance from the Fed reassured investors that tapering would be gradual and that short-term rates, which it has held at 0%–0.25% since late 2008, would probably remain low even after its program ended. The fragility of growth both at home and abroad also made any rise in rates soon seem less likely.
At the same time, demand picked up as a number of buyers came back to the bond market. Investors such as insurance companies and pension funds began to rebalance their portfolios out of equities and into bonds after last year’s strong run-up in the stock market. More demand also came from international buyers who saw relative value in U.S. bonds. And heightened tensions in Eastern Europe and the Middle East drove more risk-averse investors to turn to government bonds as a safe harbor for their assets.
Over the 12 months, the yield curve flattened. The 3-year Treasury note saw its yield rise 17 basis points to 0.94%. In contrast, the yield of the 10-year Treasury note fell 42 basis points to 2.34% and that of the 30-year bond dropped 64 basis points to 3.08%. (A basis point is one-hundredth of a percentage point.)
| |
| Total Returns | |
| Inception Through August 31, 2014 | |
| | Average |
| | Annual Return |
| Extended Duration Treasury Index Fund Institutional Shares (Returns since inception: | |
| 11/28/2007) | 9.01% |
| Barclays U.S. Treasury STRIPS 20–30 Year Equal Par Bond Index | 9.29 |
| General U.S. Treasury Funds Average | 5.25 |
| General U.S. Treasury Funds Average: Derived from data provided by Lipper, a Thomson Reuters Company. |
The figures shown represent past performance, which is not a guarantee of future results. (Current performance may be
lower or higher than the performance data cited. For performance data current to the most recent month-end, visit our
website at vanguard.com/performance.) Note, too, that both investment returns and principal value can fluctuate widely, so
an investor’s shares, when sold, could be worth more or less than their original cost.5
6
As the Extended Duration Treasury Index Fund was invested exclusively in bonds with maturities of more than 20 years, its performance for the fiscal year moved in step with long-term yields. The fund returned about –5% for the last four months of 2013, then surged more than 30% over the first eight months of 2014.
|
| Market predictions about yields often miss the mark |
| |
| U.S. bond yields have been below their historical long-term averages for some time now. |
| But history has shown that just because yields are low doesn’t mean that they have to |
| move higher. |
| |
| At the end of 2010, the market believed yields were at such low levels that a significant |
| rise was in the offing. The dotted line in the chart below shows where the market expected |
| Treasury yields to be three years down the road (as indicated by the so-called forward yield |
| curve). For some maturities, those expectations implied that yields would more than double. |
| |
| Bond yields rarely move as expected, however. The black line in the chart shows that Treasury |
| yields at the end of 2013 were well below market expectations, and in fact even lower than |
| where they had been three years earlier. |
| |
| While the current low level of yields implies slim returns from bonds in the future, investors |
| should keep in mind that it remains just as hard today as it was in 2010 to say where yields |
| will head next. |
| |
| The market’s forecast for 2013 yields versus where yields actually ended up |
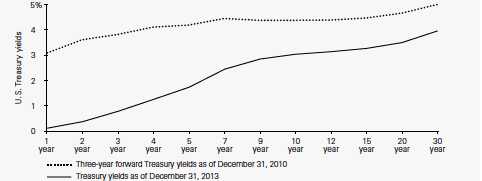
| Sources: Vanguard and Bloomberg. |
Given the downward trajectory of long-term bond yields, the 30-day SEC yield for the fund’s Institutional Shares slipped to 3.13% as of August 31, from 3.82% a year earlier.
The fund’s track record is relatively short but promising
The fund has been around for only a relatively short period, about seven years, but so far its Institutional Shares have behaved as expected. Over the fund’s tenure, the sharp ups and downs in price returns of long-dated Treasury bonds have resulted in an average annual return of 9.01%. After taking expenses into account, that performance was roughly in line with the benchmark’s return of 9.29%. It was also well ahead of the average return for peer funds.
High costs don’t equal strong fund performance
The adage “You get what you pay for” doesn’t apply to mutual funds. In fact, the reverse is true: Research suggests that higher costs are consistent with weaker returns. (See, for example, Shopping for Alpha: You Get What You Don’t Pay For at vanguard.com/research.)
Wouldn’t paying the highest fees allow you to purchase the services of the greatest talents, and therefore get you the best returns? As it turns out, the data don’t support that argument. The explanation is simple: Every dollar paid for management fees is a dollar less earning potential return. Keeping expenses down can help narrow the gap between what the markets return and what investors actually earn.
That’s why Vanguard seeks to minimize costs on all our funds. Indexing, of course, is the purest expression of low-cost investing. And we negotiate low fees for our actively managed funds, which are run by world-class advisors. It’s a strategy that reflects decades of experience and research, boiled down to one tenet: The less you pay, the more you keep.
As always, thank you for investing with Vanguard.
Sincerely,

F. William McNabb III
Chairman and Chief Executive Officer
September 12, 2014
7
Extended Duration Treasury Index Fund
Fund Profile
As of August 31, 2014
| | | |
| Share-Class Characteristics | | |
| | | Institutional | |
| | Institutional | Plus | ETF |
| | Shares | Shares | Shares |
| Ticker Symbol | VEDTX | VEDIX | EDV |
| Expense Ratio1 | 0.10% | 0.08% | 0.12% |
| 30-Day SEC Yield | 3.13% | 3.15% | 3.11% |
| | |
| Financial Attributes | | |
| |
| |
| | | Barclays |
| | | Treasury |
| | | STRIPS |
| | | 20–30 Year |
| | Fund | Index |
| |
| Number of Bonds | 69 | 67 |
| |
| Yield to Maturity | | |
| (before expenses) | 3.2% | 3.2% |
| |
| Average Coupon | 0.0% | 0.0% |
| |
| Average Duration | 25.0 years | 24.8 years |
| |
| Average Effective | | |
| Maturity | 25.4 years | 24.9 years |
| |
| Short-Term | | |
| Reserves | 0.0% | — |
| |
| Sector Diversification (% of portfolio) | |
| Treasury/Agency | 100.0% |
The agency and mortgage-backed securities sectors may include issues from government-sponsored enterprises;
such issues are generally not backed by the full faith and credit of the U.S. government.
| |
| Volatility Measures | |
| | Barclays |
| | Treasury |
| | STRIPS |
| | 20–30 Year |
| | Index |
| R-Squared | 0.99 |
| Beta | 1.02 |
These measures show the degree and timing of the fund’s fluctuations compared with the index over 36 months.
| |
| Distribution by Effective Maturity | |
| (% of portfolio) | |
| 20 - 30 Years | 100.0% |
| |
| |
| Distribution by Credit Quality (% of portfolio) |
| U.S. Government | 100.0% |
Credit-quality ratings are obtained from Barclays and are from Moody's, Fitch, and S&P. When ratings from all three agencies are
used, the median rating is shown. When ratings from two of the agencies are used, the lower rating for each issue is shown. For
more information about these ratings, see the Glossary entry for Credit Quality.
Investment Focus
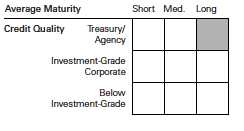
1 The expense ratios shown are from the prospectus dated December 23, 2013, and represent estimated costs for the current fiscal year. For the
fiscal year ended August 31, 2014, the expense ratios were 0.10% for Institutional Shares, 0.08% for Institutional Plus Shares, and 0.12% for ETF
Shares.
8
Extended Duration Treasury Index Fund
Performance Summary
All of the returns in this report represent past performance, which is not a guarantee of future results that may be achieved by the fund. (Current performance may be lower or higher than the performance data cited. For performance data current to the most recent month-end, visit our website at vanguard.com/performance.) Note, too, that both investment returns and principal value can fluctuate widely, so an investor’s shares, when sold, could be worth more or less than their original cost. The returns shown do not reflect taxes that a shareholder would pay on fund distributions or on the sale of fund shares.
Cumulative Performance: December 6, 2007, Through August 31, 2014
Initial Investment of $10,000
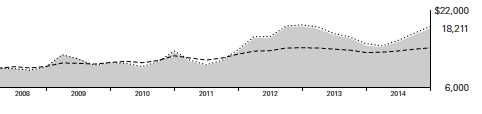
| | | | | |
| | | | Average Annual Total Returns | |
| | | Periods Ended August 31, 2014 | |
| |
| | | | | Since | Final Value |
| | | One | Five | Inception | of a $10,000 |
| | | Year | Years | (12/6/2007) | Investment |
| | Extended Duration Treasury Index | | | | |
| | Fund ETF Shares Net Asset Value | 24.17% | 10.52% | 9.31% | $18,211 |
| | Extended Duration Treasury Index | | | | |
| | Fund ETF Shares Market Price | 24.22 | 10.18 | 9.37 | 18,279 |
| | Barclays U.S. Treasury STRIPS 20–30 | | | | |
| •••••••• | Year Equal Par Bond Index | 23.70 | 10.77 | 9.70 | 18,651 |
| |
| – – – – | General U.S. Treasury Funds Average | 7.41 | 4.92 | 5.37 | 14,219 |
General U.S. Treasury Funds Average: Derived from data provided by Lipper, a Thomson Reuters Company."Since Inception" performance is calculated from the ETF Shares’ inception date for both the fund and its comparative standards.
Vanguard fund returns are adjusted to reflect the 0.50% fee on purchases of fund shares. The fee does not apply to the ETF Shares. The
Fiscal-Year Total Returns table is not adjusted for fees.
See Financial Highlights for dividend and capital gains information.
9
| | | | |
| Extended Duration Treasury Index Fund | | | | |
| |
| |
| |
| |
| | | Average Annual Total Returns | |
| | Periods Ended August 31, 2014 | |
| |
| | | | Since | Final Value |
| | One | Five | Inception | of a $5,000,000 |
| | Year | Years | (11/28/2007) | Investment |
| Extended Duration Treasury Index Fund | | | | |
| Institutional Shares | 23.65% | 10.44% | 8.93% | $8,912,192 |
| Barclays U.S. Treasury STRIPS 20–30 Year | | | | |
| Equal Par Bond Index | 23.70 | 10.77 | 9.29 | 9,113,004 |
"Since Inception" performance is calculated from the Institutional Shares’ inception date for both the fund and its comparative standard.
| | | |
| | | Since | Final Value |
| | One | Inception | of a $100,000,000 |
| | Year | (8/28/2013) | Investment |
| Extended Duration Treasury Index Fund | | | |
| Institutional Plus Shares | 23.69% | 25.12% | $125,352,319 |
| Barclays U.S. Treasury STRIPS 20–30 Year | | | |
| Equal Par Bond Index | 23.70 | 26.44 | 126,680,203 |
"Since Inception" performance is calculated from the Institutional Plus Shares’ inception date for both the fund and its comparative standard.
| | | |
| Cumulative Returns of ETF Shares: December 6, 2007, Through August 31, 2014 | | |
| |
| | | | Since |
| | One | Five | Inception |
| | Year | Years | (12/6/2007) |
| Extended Duration Treasury Index Fund ETF Shares | | | |
| Market Price | 24.22% | 62.38% | 82.79% |
| Extended Duration Treasury Index Fund ETF Shares | | | |
| Net Asset Value | 24.17 | 64.87 | 82.11 |
| Barclays U.S. Treasury STRIPS 20–30 Year Equal Par | | | |
| Bond Index | 23.70 | 66.80 | 86.51 |
"Since Inception" performance is calculated from the ETF Shares’ inception date for both the fund and its comparative standard.Vanguard fund returns are adjusted to reflect the 0.50% fee on purchases of fund shares. The fee does not apply to the ETF Shares. The
Fiscal-Year Total Returns table is not adjusted for fees.
10
Extended Duration Treasury Index Fund
| | |
| Fiscal-Year Total Returns (%): December 6, 2007, Through August 31, 2014 | |
| | | Barclays |
| | | Treasury |
| | | STRIPS |
| | | 20–30 Year |
| | ETF Shares Net Asset Value | Index |
| Fiscal Year | Total Returns | Total Returns |
| 2008 | 2.29% | 3.16% |
| 2009 | 7.98 | 8.39 |
| 2010 | 20.80 | 21.48 |
| 2011 | 1.33 | 1.99 |
| 2012 | 37.90 | 36.86 |
| 2013 | -21.34 | -20.48 |
| 2014 | 24.17 | 23.70 |
Average Annual Total Returns: Periods Ended June 30, 2014
This table presents returns through the latest calendar quarter—rather than through the end of the fiscal period.
Securities and Exchange Commission rules require that we provide this information.
| | | | | | |
| | | | Since Inception |
| | Inception Date | One Year | Five Years | Income | Capital | Total |
| Institutional Shares | 11/28/2007 | 8.47% | 9.61% | 3.88% | 4.02% | 7.90% |
| Fee-Adjusted Returns | | 7.93 | 9.50 | | | 7.82 |
| Institutional Plus Shares | 8/28/2013 | — | — | 3.92 | 12.15 | 16.07 |
| Fee-Adjusted Returns | | — | — | | | 15.49 |
| ETF Shares | 12/6/2007 | | | | | |
| Market Price | | 8.63 | 9.33 | | | 8.24 |
| Net Asset Value | | 8.36 | 9.58 | | | 8.20 |
Vanguard fund returns are adjusted to reflect the 0.50% fee on purchases of fund shares. The fee does not apply to the ETF Shares. The
Fiscal-Year Total Returns table is not adjusted for fees.
11
Extended Duration Treasury Index Fund
Financial Statements
Statement of Net Assets
As of August 31, 2014
The fund reports a complete list of its holdings in regulatory filings four times in each fiscal year, at the quarter-ends. For the second and fourth fiscal quarters, the lists appear in the fund’s semiannual and annual reports to shareholders. For the first and third fiscal quarters, the fund files the lists with the Securities and Exchange Commission on Form N-Q. Shareholders can look up the fund’s Forms N-Q on the SEC’s website at sec.gov. Forms N-Q may also be reviewed and copied at the SEC’s Public Reference Room (see the back cover of this report for further information).
| | | | |
| | | | Face | Market |
| | | Maturity | Amount | Value |
| | Coupon | Date | ($000) | ($000) |
| U.S. Government and Agency Obligations (100.1%) | | | | |
| U.S. Government Securities (100.1%) | | | | |
| United States Treasury Strip Coupon | 0.000% | 11/15/34 | 37,400 | 20,015 |
| United States Treasury Strip Coupon | 0.000% | 2/15/35 | 36,330 | 19,263 |
| United States Treasury Strip Coupon | 0.000% | 5/15/35 | 37,335 | 19,642 |
| United States Treasury Strip Coupon | 0.000% | 8/15/35 | 37,465 | 19,540 |
| United States Treasury Strip Coupon | 0.000% | 11/15/35 | 39,525 | 20,430 |
| United States Treasury Strip Coupon | 0.000% | 2/15/36 | 35,225 | 18,072 |
| United States Treasury Strip Coupon | 0.000% | 5/15/36 | 40,285 | 20,514 |
| United States Treasury Strip Coupon | 0.000% | 8/15/36 | 34,500 | 17,423 |
| United States Treasury Strip Coupon | 0.000% | 11/15/36 | 37,660 | 18,812 |
| United States Treasury Strip Coupon | 0.000% | 2/15/37 | 42,760 | 21,230 |
| United States Treasury Strip Coupon | 0.000% | 5/15/37 | 34,150 | 16,803 |
| United States Treasury Strip Coupon | 0.000% | 8/15/37 | 35,140 | 17,095 |
| United States Treasury Strip Coupon | 0.000% | 11/15/37 | 37,145 | 17,882 |
| United States Treasury Strip Coupon | 0.000% | 2/15/38 | 37,300 | 17,782 |
| United States Treasury Strip Coupon | 0.000% | 5/15/38 | 38,480 | 18,188 |
| United States Treasury Strip Coupon | 0.000% | 8/15/38 | 37,100 | 17,370 |
| United States Treasury Strip Coupon | 0.000% | 11/15/38 | 37,200 | 17,284 |
| United States Treasury Strip Coupon | 0.000% | 2/15/39 | 34,500 | 15,886 |
| United States Treasury Strip Coupon | 0.000% | 5/15/39 | 35,200 | 16,066 |
| United States Treasury Strip Coupon | 0.000% | 8/15/39 | 37,400 | 16,897 |
| United States Treasury Strip Coupon | 0.000% | 11/15/39 | 31,850 | 14,278 |
| United States Treasury Strip Coupon | 0.000% | 2/15/40 | 29,500 | 13,093 |
| United States Treasury Strip Coupon | 0.000% | 5/15/40 | 42,420 | 18,655 |
| United States Treasury Strip Coupon | 0.000% | 8/15/40 | 35,550 | 15,489 |
| United States Treasury Strip Coupon | 0.000% | 11/15/40 | 40,465 | 17,504 |
| United States Treasury Strip Coupon | 0.000% | 2/15/41 | 36,650 | 15,696 |
| United States Treasury Strip Coupon | 0.000% | 5/15/41 | 42,700 | 18,148 |
| United States Treasury Strip Coupon | 0.000% | 8/15/41 | 34,500 | 14,509 |
| United States Treasury Strip Coupon | 0.000% | 11/15/41 | 34,700 | 14,482 |
| United States Treasury Strip Coupon | 0.000% | 2/15/42 | 54,680 | 22,607 |
| United States Treasury Strip Coupon | 0.000% | 5/15/42 | 40,295 | 16,533 |
| United States Treasury Strip Coupon | 0.000% | 8/15/42 | 45,300 | 18,389 |
| United States Treasury Strip Coupon | 0.000% | 11/15/42 | 45,865 | 18,489 |
| United States Treasury Strip Coupon | 0.000% | 2/15/43 | 54,855 | 21,895 |
| United States Treasury Strip Coupon | 0.000% | 5/15/43 | 43,855 | 17,353 |
| United States Treasury Strip Coupon | 0.000% | 8/15/43 | 40,250 | 15,789 |
| United States Treasury Strip Coupon | 0.000% | 11/15/43 | 27,105 | 10,539 |
12
Extended Duration Treasury Index Fund
| | | | |
| | | | Face | Market |
| | | Maturity | Amount | Value |
| | Coupon | Date | ($000) | ($000) |
| United States Treasury Strip Coupon | 0.000% | 2/15/44 | 27,050 | 10,444 |
| United States Treasury Strip Coupon | 0.000% | 5/15/44 | 50 | 19 |
| United States Treasury Strip Coupon | 0.000% | 8/15/44 | 50 | 19 |
| United States Treasury Strip Principal | 0.000% | 2/15/36 | 30,955 | 16,350 |
| United States Treasury Strip Principal | 0.000% | 2/15/37 | 36,050 | 18,321 |
| United States Treasury Strip Principal | 0.000% | 5/15/37 | 32,320 | 16,269 |
| United States Treasury Strip Principal | 0.000% | 2/15/38 | 32,500 | 15,775 |
| United States Treasury Strip Principal | 0.000% | 5/15/38 | 28,145 | 13,551 |
| United States Treasury Strip Principal | 0.000% | 2/15/39 | 35,580 | 16,637 |
| United States Treasury Strip Principal | 0.000% | 5/15/39 | 31,535 | 14,644 |
| United States Treasury Strip Principal | 0.000% | 8/15/39 | 24,435 | 11,252 |
| United States Treasury Strip Principal | 0.000% | 11/15/39 | 30,325 | 13,838 |
| United States Treasury Strip Principal | 0.000% | 2/15/40 | 31,365 | 14,229 |
| United States Treasury Strip Principal | 0.000% | 5/15/40 | 31,200 | 14,033 |
| United States Treasury Strip Principal | 0.000% | 8/15/40 | 37,400 | 16,631 |
| United States Treasury Strip Principal | 0.000% | 11/15/40 | 22,655 | 10,000 |
| United States Treasury Strip Principal | 0.000% | 2/15/41 | 33,880 | 14,920 |
| United States Treasury Strip Principal | 0.000% | 5/15/41 | 35,280 | 15,350 |
| United States Treasury Strip Principal | 0.000% | 8/15/41 | 40,220 | 17,266 |
| United States Treasury Strip Principal | 0.000% | 11/15/41 | 40,070 | 16,967 |
| United States Treasury Strip Principal | 0.000% | 2/15/42 | 34,425 | 14,410 |
| United States Treasury Strip Principal | 0.000% | 5/15/42 | 35,785 | 14,834 |
| United States Treasury Strip Principal | 0.000% | 8/15/42 | 41,785 | 17,112 |
| United States Treasury Strip Principal | 0.000% | 11/15/42 | 50,735 | 20,567 |
| United States Treasury Strip Principal | 0.000% | 2/15/43 | 53,820 | 21,633 |
| United States Treasury Strip Principal | 0.000% | 5/15/43 | 65,420 | 26,045 |
| United States Treasury Strip Principal | 0.000% | 8/15/43 | 57,830 | 22,843 |
| United States Treasury Strip Principal | 0.000% | 11/15/43 | 53,310 | 20,874 |
| United States Treasury Strip Principal | 0.000% | 2/15/44 | 31,050 | 12,042 |
| United States Treasury Strip Principal | 0.000% | 5/15/44 | 32,600 | 12,561 |
| United States Treasury Strip Principal | 0.000% | 8/15/44 | 10,050 | 3,844 |
| Total U.S. Government and Agency Obligations (Cost $941,019) | | | 1,102,922 |
| |
| | | | Shares | |
| Temporary Cash Investment (0.0%) | | | | |
| Money Market Fund (0.0%) | | | | |
| 1 Vanguard Market Liquidity Fund (Cost $346) | 0.113% | | 346,000 | 346 |
| Total Investments (100.1%) (Cost $941,365) | | | | 1,103,268 |
| Other Assets and Liabilities (-0.1%) | | | | |
| Other Assets | | | | 31,873 |
| Liabilities | | | | (32,679) |
| | | | | (806) |
| Net Assets (100%) | | | | 1,102,462 |
13
Extended Duration Treasury Index Fund
| |
| At August 31, 2014, net assets consisted of: | |
| | Amount |
| | ($000) |
| Paid-in Capital | 930,536 |
| Undistributed Net Investment Income | 6,549 |
| Accumulated Net Realized Gains | 3,474 |
| Unrealized Appreciation (Depreciation) | 161,903 |
| Net Assets | 1,102,462 |
| |
| Institutional Shares—Net Assets | |
| Applicable to 15,478,481 outstanding $.001 par value shares of | |
| beneficial interest (unlimited authorization) | 529,061 |
| Net Asset Value Per Share—Institutional Shares | $34.18 |
| |
| Institutional Plus Shares—Net Assets | |
| Applicable to 3,779,138 outstanding $.001 par value shares of | |
| beneficial interest (unlimited authorization) | 324,266 |
| Net Asset Value Per Share—Institutional Plus Shares | $85.80 |
| |
| ETF Shares—Net Assets | |
| Applicable to 2,200,000 outstanding $.001 par value shares of | |
| beneficial interest (unlimited authorization) | 249,135 |
| Net Asset Value Per Share—ETF Shares | $113.24 |
See Note A in Notes to Financial Statements.
1 Affiliated money market fund available only to Vanguard funds and certain trusts and accounts managed by Vanguard. Rate shown is the
7-day yield.
See accompanying Notes, which are an integral part of the Financial Statements.
14
Extended Duration Treasury Index Fund
Statement of Operations
| |
| | Year Ended |
| | August 31, 2014 |
| | ($000) |
| Investment Income | |
| Income | |
| Interest1 | 33,365 |
| Total Income | 33,365 |
| Expenses | |
| The Vanguard Group—Note B | |
| Investment Advisory Services | 83 |
| Management and Administrative—Institutional Shares | 280 |
| Management and Administrative—Institutional Plus Shares | 138 |
| Management and Administrative—ETF Shares | 148 |
| Marketing and Distribution—Institutional Shares | 92 |
| Marketing and Distribution—Institutional Plus Shares | 47 |
| Marketing and Distribution—ETF Shares | 38 |
| Custodian Fees | 11 |
| Auditing Fees | 35 |
| Shareholders’ Reports—Institutional Shares | — |
| Shareholders’ Reports—Institutional Plus Shares | — |
| Shareholders’ Reports—ETF Shares | 9 |
| Trustees’ Fees and Expenses | 1 |
| Total Expenses | 882 |
| Net Investment Income | 32,483 |
| Realized Net Gain (Loss) on Investment Securities Sold | 25,182 |
| Change in Unrealized Appreciation (Depreciation) of Investment Securities | 165,532 |
| Net Increase (Decrease) in Net Assets Resulting from Operations | 223,197 |
| 1 Interest income from an affiliated company of the fund was less than $1,000. |
See accompanying Notes, which are an integral part of the Financial Statements.
15
Extended Duration Treasury Index Fund
Statement of Changes in Net Assets
| | |
| | Year Ended August 31, |
| | 2014 | 2013 |
| | ($000) | ($000) |
| Increase (Decrease) in Net Assets | | |
| Operations | | |
| Net Investment Income | 32,483 | 19,330 |
| Realized Net Gain (Loss) | 25,182 | 35,848 |
| Change in Unrealized Appreciation (Depreciation) | 165,532 | (201,751) |
| Net Increase (Decrease) in Net Assets Resulting from Operations | 223,197 | (146,573) |
| Distributions | | |
| Net Investment Income | | |
| Institutional Shares | (14,243) | (14,467) |
| Institutional Plus Shares | (9,409) | — |
| ETF Shares | (5,755) | (5,507) |
| Realized Capital Gain1 | | |
| Institutional Shares | (5,314) | (17,505) |
| Institutional Plus Shares | (3,511) | — |
| ETF Shares | (1,598) | (6,910) |
| Total Distributions | (39,830) | (44,389) |
| Capital Share Transactions | | |
| Institutional Shares | 70,804 | (75,761) |
| Institutional Plus Shares | 238,106 | 24,878 |
| ETF Shares | 52,609 | 10,289 |
| Net Increase (Decrease) from Capital Share Transactions | 361,519 | (40,594) |
| Total Increase (Decrease) | 544,886 | (231,556) |
| Net Assets | | |
| Beginning of Period | 557,576 | 789,132 |
| End of Period2 | 1,102,462 | 557,576 |
1 Includes fiscal 2014 and 2013 short-term gain distributions totaling $0 and $7,603,000, respectively. Short-term gain distributions aretreated as ordinary income dividends for tax purposes.2 Net Assets—End of Period includes undistributed net investment income of $6,549,000 and $3,473,000.See accompanying Notes, which are an integral part of the Financial Statements.
16
Extended Duration Treasury Index Fund
Financial Highlights
| | | | | |
| Institutional Shares | | | | | |
| |
| For a Share Outstanding | Year Ended August 31, |
| Throughout Each Period | 2014 | 2013 | 2012 | 2011 | 2010 |
| Net Asset Value, Beginning of Period | $28.85 | $39.55 | $30.19 | $31.18 | $30.69 |
| Investment Operations | | | | | |
| Net Investment Income | 1.006 | 1.121 | 1.084 | 1.1271 | 1.1731 |
| Net Realized and Unrealized Gain (Loss) | | | | | |
| on Investments 2 | 5.678 | (9.183) | 10.162 | (.948) | 3.796 |
| Total from Investment Operations | 6.684 | (8.062) | 11.246 | .179 | 4.969 |
| Distributions | | | | | |
| Dividends from Net Investment Income | (.983) | (1.148) | (1.101) | (1.101) | (1.134) |
| Distributions from Realized Capital Gains | (.371) | (1.490) | (.785) | (.068) | (3.345) |
| Total Distributions | (1.354) | (2.638) | (1.886) | (1.169) | (4.479) |
| Net Asset Value, End of Period | $34.18 | $28.85 | $39.55 | $30.19 | $31.18 |
| |
| Total Return 3 | 24.27% | -21.30% | 37.92% | 1.33% | 20.84% |
| |
| Ratios/Supplemental Data | | | | | |
| Net Assets, End of Period (Millions) | $529 | $375 | $586 | $409 | $286 |
| Ratio of Total Expenses to Average Net Assets | 0.10% | 0.10% | 0.10% | 0.11% | 0.11% |
| Ratio of Net Investment Income to | | | | | |
| Average Net Assets | 3.61% | 3.17% | 3.08% | 4.42% | 4.41% |
| Portfolio Turnover Rate4 | 17% | 31% | 47% | 22% | 24% |
1 Calculated based on average shares outstanding.2 Includes increases from purchase fees of $0.06, $0.03, $0.05, $0.02, and $0.00.3 Total returns do not include transaction fees that may have applied in the periods shown. Fund prospectuses provide information about anyapplicable transaction fees.4 Excludes the value of portfolio securities received or delivered as a result of in-kind purchases or redemptions of the fund’s capital shares,including ETF Creation Units.See accompanying Notes, which are an integral part of the Financial Statements.
17
Extended Duration Treasury Index Fund
Financial Highlights
| | |
| Institutional Plus Shares | | |
| | Year | Aug. 28, |
| | Ended | 20131 to |
| | August 31, | Aug. 31, |
| For a Share Outstanding Throughout Each Period | 2014 | 2013 |
| Net Asset Value, Beginning of Period | $72.42 | $71.46 |
| Investment Operations | | |
| Net Investment Income | 2.542 | — |
| Net Realized and Unrealized Gain (Loss) on Investments2 | 14.260 | .960 |
| Total from Investment Operations | 16.802 | .960 |
| Distributions | | |
| Dividends from Net Investment Income | (2.491) | — |
| Distributions from Realized Capital Gains | (.931) | — |
| Total Distributions | (3.422) | — |
| Net Asset Value, End of Period | $85.80 | $72.42 |
| |
| Total Return | 24.31% | 1.34% |
| |
| Ratios/Supplemental Data | | |
| Net Assets, End of Period (Millions) | $324 | $25 |
| Ratio of Total Expenses to Average Net Assets | 0.08% | 0.08%3 |
| Ratio of Net Investment Income to Average Net Assets | 3.63% | 3.19%3 |
| Portfolio Turnover Rate4 | 17% | 31% |
1 Inception.2 Includes increases from purchase fees of $0.15 and $0.07.3 Annualized.4 Excludes the value of portfolio securities received or delivered as a result of in-kind purchases or redemptions of the fund’s capital shares,including ETF Creation Units.See accompanying Notes, which are an integral part of the Financial Statements.
18
Extended Duration Treasury Index Fund
Financial Highlights
| | | | | |
| ETF Shares | | | | | |
| |
| For a Share Outstanding | Year Ended August 31, |
| Throughout Each Period | 2014 | 2013 | 2012 | 2011 | 2010 |
| Net Asset Value, Beginning of Period | $95.57 | $131.02 | $100.09 | $103.39 | $101.91 |
| Investment Operations | | | | | |
| Net Investment Income | 3.311 | 3.695 | 3.566 | 3.7231 | 3.9211 |
| Net Realized and Unrealized Gain (Loss) | | | | | |
| on Investments 2 | 18.824 | (30.430) | 33.594 | (3.168) | 12.419 |
| Total from Investment Operations | 22.135 | (26.735) | 37.160 | .555 | 16.340 |
| Distributions | | | | | |
| Dividends from Net Investment Income | (3.236) | (3.779) | (3.628) | (3.630) | (3.752) |
| Distributions from Realized Capital Gains | (1.229) | (4.936) | (2.602) | (.225) | (11.108) |
| Total Distributions | (4.465) | (8.715) | (6.230) | (3.855) | (14.860) |
| Net Asset Value, End of Period | $113.24 | $95.57 | $131.02 | $100.09 | $103.39 |
| |
| Total Return | 24.17% | -21.34% | 37.90% | 1.33% | 20.80% |
| |
| Ratios/Supplemental Data | | | | | |
| Net Assets, End of Period (Millions) | $249 | $158 | $203 | $120 | $176 |
| Ratio of Total Expenses to Average Net Assets | 0.12% | 0.12% | 0.12% | 0.13% | 0.13% |
| Ratio of Net Investment Income to | | | | | |
| Average Net Assets | 3.59% | 3.15% | 3.06% | 4.40% | 4.39% |
| Portfolio Turnover Rate3 | 17% | 31% | 47% | 22% | 24% |
1 Calculated based on average shares outstanding.2 Includes increases from purchase fees of $0.19, $0.10, $0.18, $0.07, and $0.01.3 Excludes the value of portfolio securities received or delivered as a result of in-kind purchases or redemptions of the fund’s capital shares,including ETF Creation Units.See accompanying Notes, which are an integral part of the Financial Statements.
19
Extended Duration Treasury Index Fund
Notes to Financial Statements
Vanguard Extended Duration Treasury Index Fund is registered under the Investment Company Act of 1940 as an open-end investment company, or mutual fund. The fund offers three classes of shares: Institutional Shares, Institutional Plus Shares, and ETF Shares. Institutional Shares and Institutional Plus Shares are designed for investors who meet certain administrative, service, and account-size criteria. ETF Shares are listed for trading on NYSE Arca; they can be purchased and sold through a broker.
A. The following significant accounting policies conform to generally accepted accounting principles for U.S. investment companies. The fund consistently follows such policies in preparing its financial statements.
1. Security Valuation: Securities are valued as of the close of trading on the New York Stock Exchange (generally 4 p.m., Eastern time) on the valuation date. Bonds, and temporary cash investments acquired over 60 days to maturity, are valued using the latest bid prices or using valuations based on a matrix system (which considers such factors as security prices, yields, maturities, and ratings), both as furnished by independent pricing services. Investments in Vanguard Market Liquidity Fund are valued at that fund’s net asset value. Other temporary cash investments are valued at amortized cost, which approximates market value. Securities for which market quotations are not readily available, or whose values have been affected by events occurring before the fund’s pricing time but after the close of the securities’ primary markets, are valued by methods deemed by the board of trustees to represent fair value.
2. Federal Income Taxes: The fund intends to continue to qualify as a regulated investment company and distribute all of its taxable income. Management has analyzed the fund’s tax positions taken for all open federal income tax years (August 31, 2011–2014), and has concluded that no provision for federal income tax is required in the fund’s financial statements.
3. Distributions: Distributions to shareholders are recorded on the ex-dividend date.
4. Credit Facility: The fund and certain other funds managed by The Vanguard Group participate in a $2.89 billion committed credit facility provided by a syndicate of lenders pursuant to a credit agreement that may be renewed annually; each fund is individually liable for its borrowings, if any, under the credit facility. Borrowings may be utilized for temporary and emergency purposes, and are subject to the fund’s regulatory and contractual borrowing restrictions. The participating funds are charged administrative fees and an annual commitment fee of 0.06% of the undrawn amount of the facility; these fees are allocated to the funds based on a method approved by the fund’s board of trustees and included in Management and Administrative expenses on the fund’s Statement of Operations. Any borrowings under this facility bear interest at a rate equal to the higher of the federal funds rate or LIBOR reference rate plus an agreed-upon spread.
The fund had no borrowings outstanding at August 31, 2014, or at any time during the period then ended.
5. Other: Interest income includes income distributions received from Vanguard Market Liquidity Fund and is accrued daily. Premiums and discounts on debt securities purchased are amortized and accreted, respectively, to interest income over the lives of the respective securities. Security transactions are accounted for on the date securities are bought or sold. Costs used to determine realized gains (losses) on the sale of investment securities are those of the specific securities sold. Fees assessed on purchases of Institutional Shares and Institutional Plus Shares are credited to paid-in capital.
20
Extended Duration Treasury Index Fund
Each class of shares has equal rights as to assets and earnings, except that each class separately bears certain class-specific expenses related to maintenance of shareholder accounts (included in Management and Administrative expenses) and shareholder reporting. Marketing and distribution expenses are allocated to each class of shares based on a method approved by the board of trustees. Income, other non-class-specific expenses, and gains and losses on investments are allocated to each class of shares based on its relative net assets.
B. The Vanguard Group furnishes at cost investment advisory, corporate management, administrative, marketing, and distribution services. The costs of such services are allocated to the fund based on methods approved by the board of trustees. The fund has committed to provide up to 0.40% of its net assets in capital contributions to Vanguard. At August 31, 2014, the fund had contributed capital of $103,000 to Vanguard (included in Other Assets), representing 0.01% of the fund’s net assets and 0.04% of Vanguard’s capitalization. The fund’s trustees and officers are also directors and officers of Vanguard.
C. Various inputs may be used to determine the value of the fund’s investments. These inputs are summarized in three broad levels for financial statement purposes. The inputs or methodologies used to value securities are not necessarily an indication of the risk associated with investing in those securities.
Level 1—Quoted prices in active markets for identical securities.
Level 2—Other significant observable inputs (including quoted prices for similar securities, interest rates, prepayment speeds, credit risk, etc.).
Level 3—Significant unobservable inputs (including the fund’s own assumptions used to determine the fair value of investments).
The following table summarizes the market value of the fund’s investments as of August 31, 2014, based on the inputs used to value them:
| | | |
| | Level 1 | Level 2 | Level 3 |
| Investments | ($000) | ($000) | ($000) |
| U.S. Government and Agency Obligations | — | 1,102,922 | — |
| Temporary Cash Investments | 346 | — | — |
| Total | 346 | 1,102,922 | — |
D. Distributions are determined on a tax basis and may differ from net investment income and realized capital gains for financial reporting purposes. Differences may be permanent or temporary. Permanent differences are reclassified among capital accounts in the financial statements to reflect their tax character. Temporary differences arise when certain items of income, expense, gain, or loss are recognized in different periods for financial statement and tax purposes. These differences will reverse at some time in the future. Differences in classification may also result from the treatment of short-term gains as ordinary income for tax purposes.
During the year ended August 31, 2014, the fund realized $18,845,000 of net capital gains resulting from in-kind redemptions—in which shareholders exchanged fund shares for securities held by the fund rather than for cash. Because such gains are not taxable to the fund, and are not distributed to shareholders, they have been reclassified from accumulated net realized gains to paid-in capital.
The fund used a tax accounting practice to treat a portion of the price of capital shares redeemed during the year as distributions from realized capital gains. Accordingly, the fund has reclassified $1,227,000 from accumulated net realized gains to paid-in capital.
21
Extended Duration Treasury Index Fund
For tax purposes, at August 31, 2014, the fund had $8,403,000 of ordinary income and $1,970,000 of long-term capital gains available for distribution.
At August 31, 2014, the cost of investment securities for tax purposes was $941,365,000. Net unrealized appreciation of investment securities for tax purposes was $161,903,000, consisting of unrealized gains of $163,005,000 on securities that had risen in value since their purchase and $1,102,000 in unrealized losses on securities that had fallen in value since their purchase.
E. During the year ended August 31, 2014, the fund purchased $617,880,000 of investment securities and sold $297,120,000 of investment securities, other than temporary cash investments. Purchases and sales include $173,562,000 and $140,924,000, respectively, in connection with in-kind purchases and redemptions of the fund’s capital shares.
F. Capital share transactions for each class of shares were:
| | | | |
| | Year Ended August 31, |
| | | 2014 | | | 2013 |
| | Amount | Shares | Amount | Shares |
| | ($000) | (000) | ($000) | (000) |
| Institutional Shares | | | | |
| Issued1 | 97,644 | 3,397 | 125,693 | 3,650 |
| Issued in Lieu of Cash Distributions | 18,970 | 674 | 30,751 | 901 |
| Redeemed | (45,810) | (1,581) | (232,205) | (6,381) |
| Net Increase (Decrease) —Institutional Shares | 70,804 | 2,490 | (75,761) | (1,830) |
| Institutional Plus Shares2 | | | | |
| Issued1 | 236,786 | 3,398 | 24,878 | 348 |
| Issued in Lieu of Cash Distributions | 12,920 | 183 | — | — |
| Redeemed | (11,600) | (150) | — | — |
| Net Increase (Decrease) —Institutional Plus Shares | 238,106 | 3,431 | 24,878 | 348 |
| ETF Shares | | | | |
| Issued1 | 193,623 | 2,000 | 82,690 | 750 |
| Issued in Lieu of Cash Distributions | — | — | — | — |
| Redeemed | (141,014) | (1,450) | (72,401) | (650) |
| Net Increase (Decrease)—ETF Shares | 52,609 | 550 | 10,289 | 100 |
1 Includes purchase fees for fiscal 2014 and 2013 of $1,885,000 and $566,000, respectively (fund totals).
2 Inception was August 28, 2013. |
|
At August 31, 2014, one shareholder was the record or beneficial owner of 29% of the fund’s net assets. If the shareholder were to redeem its investment in the fund, the redemption might result in an increase in the fund’s expense ratio, cause the fund to incur higher transaction costs, or lead to the realization of taxable capital gains.
G. Management has determined that no material events or transactions occurred subsequent to August 31, 2014, that would require recognition or disclosure in these financial statements.
22
Report of Independent Registered Public Accounting Firm
To the Board of Trustees of Vanguard World Fund and the Shareholders of Vanguard Extended Duration Treasury Index Fund:
In our opinion, the accompanying statement of net assets and the related statements of operations and of changes in net assets and the financial highlights present fairly, in all material respects, the financial position of Vanguard Extended Duration Treasury Index Fund (constituting a separate portfolio of Vanguard World Fund, hereafter referred to as the “Fund”) at August 31, 2014, the results of its operations for the year then ended, the changes in its net assets for each of the two years in the period then ended, and the financial highlights for each of the periods indicated, in conformity with accounting principles generally accepted in the United States of America. These financial statements and financial highlights (hereafter referred to as “financial statements”) are the responsibility of the Fund’s management. Our responsibility is to express an opinion on these financial statements based on our audits. We conducted our audits of these financial statements in accordance with the standards of the Public Company Accounting Oversight Board (United States). Those standards require that we plan and perform the audit to obtain reasonable assurance about whether the financial statements are free of material misstatement. An audit includes examining, on a test basis, evidence supporting the amounts and disclosures in the financial statements, assessing the accounting principles used and significant estimates made by management, and evaluating the overall financial statement presentation. We believe that our audits, which included confirmation of securities at August 31, 2014 by correspondence with the custodian and by agreement to the underlying ownership records of the transfer agent, provide a reasonable basis for our opinion.
/s/PricewaterhouseCoopers LLP
Philadelphia, Pennsylvania
October 10, 2014

Special 2014 tax information (unaudited) for Vanguard Extended Duration Treasury Index Fund
This information for the fiscal year ended August 31, 2014, is included pursuant to provisions of the Internal Revenue Code.
The fund distributed $11,089,000 as capital gain dividends (from net long-term capital gains) to shareholders during the fiscal year.
For nonresident alien shareholders, 100% of income dividends are interest-related dividends.
23
About Your Fund’s Expenses
As a shareholder of the fund, you incur ongoing costs, which include costs for portfolio management, administrative services, and shareholder reports (like this one), among others. Operating expenses, which are deducted from a fund’s gross income, directly reduce the investment return of the fund.
A fund’s expenses are expressed as a percentage of its average net assets. This figure is known as the expense ratio. The following examples are intended to help you understand the ongoing costs (in dollars) of investing in your fund and to compare these costs with those of other mutual funds. The examples are based on an investment of $1,000 made at the beginning of the period shown and held for the entire period.
The accompanying table illustrates your fund’s costs in two ways:
• Based on actual fund return. This section helps you to estimate the actual expenses that you paid over the period. The ”Ending Account Value“ shown is derived from the fund‘s actual return, and the third column shows the dollar amount that would have been paid by an investor who started with $1,000 in the fund. You may use the information here, together with the amount you invested, to estimate the expenses that you paid over the period.
To do so, simply divide your account value by $1,000 (for example, an $8,600 account value divided by $1,000 = 8.6), then multiply the result by the number given for your fund under the heading ”Expenses Paid During Period.“
• Based on hypothetical 5% yearly return. This section is intended to help you compare your fund‘s costs with those of other mutual funds. It assumes that the fund had a yearly return of 5% before expenses, but that the expense ratio is unchanged. In this case—because the return used is not the fund’s actual return—the results do not apply to your investment. The example is useful in making comparisons because the Securities and Exchange Commission requires all mutual funds to calculate expenses based on a 5% return. You can assess your fund’s costs by comparing this hypothetical example with the hypothetical examples that appear in shareholder reports of other funds.
Note that the expenses shown in the table are meant to highlight and help you compare ongoing costs only and do not reflect transaction costs incurred by the fund for buying and selling securities. Further, the expenses do not include any purchase, redemption, or account service fees described in the fund prospectus. If such fees were applied to your account, your costs would be higher. Your fund does not carry a “sales load.”
The calculations assume no shares were bought or sold during the period. Your actual costs may have been higher or lower, depending on the amount of your investment and the timing of any purchases or redemptions.
You can find more information about the fund’s expenses, including annual expense ratios, in the Financial Statements section of this report. For additional information on operating expenses and other shareholder costs, please refer to your fund’s current prospectus.
24
| | | |
| Six Months Ended August 31, 2014 | | | |
| | Beginning | Ending | Expenses |
| | Account Value | Account Value | Paid During |
| Extended Duration Treasury Index Fund | 2/28/2014 | 8/31/2014 | Period |
| Based on Actual Fund Return | | | |
| Institutional Shares | $1,000.00 | $1,180.37 | $0.55 |
| Institutional Plus Shares | 1,000.00 | 1,180.17 | 0.44 |
| ETF Shares | 1,000.00 | 1,179.94 | 0.66 |
| Based on Hypothetical 5% Yearly Return | | | |
| Institutional Shares | $1,000.00 | $1,024.70 | $0.51 |
| Institutional Plus Shares | 1,000.00 | 1,024.80 | 0.41 |
| ETF Shares | 1,000.00 | 1,024.60 | 0.61 |
The calculations are based on expenses incurred in the most recent six-month period. The fund’s annualized six-month expense ratios for thatperiod are 0.10% for Institutional Shares, 0.08% for Institutional Plus Shares, and 0.12% for ETF Shares. The dollar amounts shown as“Expenses Paid” are equal to the annualized expense ratio multiplied by the average account value over the period, multiplied by the numberof days in the most recent six-month period, then divided by the number of days in the most recent 12-month period.25
Trustees Approve Advisory Arrangement
The board of trustees of Vanguard Extended Duration Treasury Index Fund has renewed the fund’s investment advisory arrangement with The Vanguard Group, Inc. (Vanguard). Vanguard—through its Fixed Income Group—serves as the investment advisor to the fund. The board determined that continuing the fund’s internalized management structure was in the best interests of the fund and its shareholders.
The board based its decision upon an evaluation of the advisor’s investment staff, portfolio management process, and performance. The trustees considered the factors discussed below, among others. However, no single factor determined whether the board approved the arrangement. Rather, it was the totality of the circumstances that drove the board’s decision.
Nature, extent, and quality of services
The board considered the quality of the fund’s investment management services over both the short and long term, and took into account the organizational depth and stability of the advisor. The board noted that Vanguard has been managing investments for more than three decades. The Fixed Income Group adheres to a sound, disciplined investment management process; the team has considerable experience, stability, and depth.
The board concluded that Vanguard’s experience, stability, depth, and performance, among other factors, warranted continuation of the advisory arrangement.
Investment performance
The board considered the short- and long-term performance of the fund, including any periods of outperformance or underperformance relative to a target index and peer group. The board concluded that the performance was such that the advisory arrangement should continue. Information about the fund’s most recent performance can be found in the Performance Summary section of this report.
Cost
The board concluded that the fund’s expense ratio was well below the average expense ratio charged by funds in its peer group and that the fund’s advisory fee rate was also well below its peer-group average. Information about the fund’s expenses appears in the About Your Fund’s Expenses section of this report as well as in the Financial Statements section.
The board does not conduct a profitability analysis of Vanguard, because of Vanguard’s unique “at-cost” structure. Unlike most other mutual fund management companies, Vanguard is owned by the funds it oversees, and produces “profits” only in the form of reduced expenses for fund shareholders.
The benefit of economies of scale
The board concluded that the fund’s at-cost arrangement with Vanguard ensures that the fund will realize economies of scale as it grows, with the cost to shareholders declining as fund assets increase.
The board will consider whether to renew the advisory arrangement again after a one-year period.
26
Glossary
30-Day SEC Yield. A fund’s 30-day SEC yield is derived using a formula specified by the U.S. Securities and Exchange Commission. Under the formula, data related to the fund’s security holdings in the previous 30 days are used to calculate the fund’s hypothetical net income for that period, which is then annualized and divided by the fund’s estimated average net assets over the calculation period. For the purposes of this calculation, a security’s income is based on its current market yield to maturity (for bonds), its actual income (for asset-backed securities), or its projected dividend yield (for stocks). Because the SEC yield represents hypothetical annualized income, it will differ—at times significantly—from the fund’s actual experience. As a result, the fund’s income distributions may be higher or lower than implied by the SEC yield.
Average Coupon. The average interest rate paid on the fixed income securities held by a fund. It is expressed as a percentage of face value.
Average Duration. An estimate of how much the value of the bonds held by a fund will fluctuate in response to a change in interest rates. To see how the value could change, multiply the average duration by the change in rates. If interest rates rise by 1 percentage point, the value of the bonds in a fund with an average duration of five years would decline by about 5%. If rates decrease by a percentage point, the value would rise by 5%.
Average Effective Maturity. The average length of time until fixed income securities held by a fund reach maturity and are repaid, taking into consideration the possibility that the issuer may call the bond before its maturity date. The figure reflects the proportion of fund assets represented by each security; it also reflects any futures contracts held. In general, the longer the average effective maturity, the more a fund’s share price will fluctuate in response to changes in market interest rates.
Credit Quality. Credit-quality ratings are measured on a scale that generally ranges from AAA (highest) to D (lowest). “Not Rated” is used to classify securities for which a rating is not available. U.S. Treasury, U.S. Agency, and U.S. Agency mortgage-backed securities appear under “U.S. Government.” Credit-quality ratings are obtained from Barclays using ratings generally derived from Moody’s, Fitch, and S&P. When ratings from all three agencies are used, the median rating is shown. When ratings from two of the agencies are used, the lower rating is shown.
Distribution by Coupon. A breakdown of the securities in a fund according to coupon rate—the interest rate that an issuer promises to pay, expressed as an annual percentage of face value. Securities with unusually high coupon rates may be subject to call risk, the possibility that they will be redeemed (or “called”) early by the issuer.
Expense Ratio. A fund’s total annual operating expenses expressed as a percentage of the fund’s average net assets. The expense ratio includes management and administrative expenses, but does not include the transaction costs of buying and selling portfolio securities.
Inception Date. The date on which the assets of a fund (or one of its share classes) are first invested in accordance with the fund’s investment objective. For funds with a subscription period, the inception date is the day after that period ends. Investment performance is measured from the inception date.
Short-Term Reserves. The percentage of a fund invested in highly liquid, short-term securities that can be readily converted to cash.
27
Yield to Maturity. The rate of return an investor would receive if the fixed income securities held by a fund were held to their maturity dates.
28
Vanguard Extended Duration Treasury Index Fund is not sponsored, endorsed, issued, sold, or promoted by Barclays Capital
Inc. or any of its affiliates (“Barclays”). Barclays makes no representation or warranty, express or implied, to the owners or
purchasers of the fund or any member of the public regarding the advisability of investing in securities generally or in the
fund particularly or the ability of the Barclays index to track general bond market performance. Barclays has not passed on
the legality or suitability of the fund with respect to any person or entity. Barclays’ only relationship to Vanguard and the
fund is the licensing of the Barclays index, which is determined, composed, and calculated by Barclays without regard to
Vanguard or the fund or any owners or purchasers of the fund. Barclays has no obligation to take the needs of Vanguard,
the fund, or the owners of the fund into consideration in determining, composing, or calculating the Barclays index. Barclays
is not responsible for and has not participated in the determination of the timing of, prices at, or quantities of the fund to be
issued. Barclays has no obligation or liability in connection with the administration, marketing, or trading of the fund.
Barclays shall have no liability to third parties for the quality, accuracy, and/or completeness of the index or any data included
therein or for interruptions in the delivery of the index. Barclays makes no warranty, express or implied, as to results to be
obtained by owners of the fund or any other person or entity from the use of the index or any data included therein in connec-
tion with the rights licensed hereunder or for any other use. Barclays reserves the right to change the methods of calculation
or publication, or to cease the calculation or publication of the Barclays U.S. Treasury STRIPS 20–30 Year Equal Par Bond
Index, and Barclays shall not be liable for any miscalculation of or any incorrect, delayed, or interrupted publication with
respect to the index. Barclays makes no express or implied warranties, and hereby expressly disclaims all warranties of
merchantability or fitness for a particular purpose or use with respect to the index or any data included therein. Barclays
shall not be liable for any damages, including, without limitation, any indirect or consequential damages resulting from the
use of the index or any data included therein.
29
This page intentionally left blank.
This page intentionally left blank.
The People Who Govern Your Fund
The trustees of your mutual fund are there to see that the fund is operated and managed in your best interests since, as a shareholder, you are a part owner of the fund. Your fund’s trustees also serve on the board of directors of The Vanguard Group, Inc., which is owned by the Vanguard funds and provides services to them on an at-cost basis.
A majority of Vanguard’s board members are independent, meaning that they have no affiliation with Vanguard or the funds they oversee, apart from the sizable personal investments they have made as private individuals. The independent board members have distinguished backgrounds in business, academia, and public service. Each of the trustees and executive officers oversees 177 Vanguard funds.
The following table provides information for each trustee and executive officer of the fund. More information about the trustees is in the Statement of Additional Information, which can be obtained, without charge, by contacting Vanguard at 800-662-7447, or online at vanguard.com.
| |
| InterestedTrustee1 | and Delphi Automotive LLP (automotive components); |
| | Senior Advisor at New Mountain Capital. |
| F. William McNabb III | |
| Born 1957. Trustee Since July 2009. Chairman of the | Amy Gutmann |
| Board. Principal Occupation(s) During the Past Five | Born 1949. Trustee Since June 2006. Principal |
| Years: Chairman of the Board of The Vanguard Group, | Occupation(s) During the Past Five Years: President of |
| Inc., and of each of the investment companies served | the University of Pennsylvania; Christopher H. Browne |
| by The Vanguard Group, since January 2010; Director | Distinguished Professor of Political Science, School of |
| of The Vanguard Group since 2008; Chief Executive | Arts and Sciences, and Professor of Communication, |
| Officer and President of The Vanguard Group, and of | Annenberg School for Communication, with secondary |
| each of the investment companies served by The | faculty appointments in the Department of Philosophy, |
| Vanguard Group, since 2008; Director of Vanguard | School of Arts and Sciences, and at the Graduate |
| Marketing Corporation; Managing Director of The | School of Education, University of Pennsylvania; |
| Vanguard Group (1995–2008). | Trustee of the National Constitution Center; Chair |
| | of the Presidential Commission for the Study of |
| | Bioethical Issues. |
| IndependentTrustees | |
| | JoAnn Heffernan Heisen |
| Emerson U. Fullwood | Born 1950. Trustee Since July 1998. Principal |
| Born 1948. Trustee Since January 2008. Principal | Occupation(s) During the Past Five Years: Corporate |
| Occupation(s) During the Past Five Years: Executive | Vice President and Chief Global Diversity Officer |
| Chief Staff and Marketing Officer for North America | (retired 2008) and Member of the Executive |
| and Corporate Vice President (retired 2008) of Xerox | Committee (1997–2008) of Johnson & Johnson |
| Corporation (document management products and | (pharmaceuticals/medical devices/consumer |
| services); Executive in Residence and 2009–2010 | products); Director of Skytop Lodge Corporation |
| Distinguished Minett Professor at the Rochester | (hotels), the University Medical Center at Princeton, |
| Institute of Technology; Director of SPX Corporation | the Robert Wood Johnson Foundation, and the Center |
| (multi-industry manufacturing), the United Way of | for Talent Innovation; Member of the Advisory Board |
| Rochester, Amerigroup Corporation (managed health | of the Maxwell School of Citizenship and Public Affairs |
| care), the University of Rochester Medical Center, | at Syracuse University. |
| Monroe Community College Foundation, and North | |
| Carolina A&T University. | F. Joseph Loughrey |
| | Born 1949. Trustee Since October 2009. Principal |
| Rajiv L. Gupta | Occupation(s) During the Past Five Years: President |
| Born 1945. Trustee Since December 2001.2 | and Chief Operating Officer (retired 2009) of Cummins |
| Principal Occupation(s) During the Past Five Years: | Inc. (industrial machinery); Chairman of the Board |
| Chairman and Chief Executive Officer (retired 2009) | of Hillenbrand, Inc. (specialized consumer services), |
| and President (2006–2008) of Rohm and Haas Co. | and of Oxfam America; Director of SKF AB (industrial |
| (chemicals); Director of Tyco International, Ltd. | machinery), Hyster-Yale Materials Handling, Inc. |
| (diversified manufacturing and services), Hewlett- | (forklift trucks), the Lumina Foundation for Education, |
| Packard Co. (electronic computer manufacturing), | |
| | |
| and the V Foundation for Cancer Research; Member | Executive Officers | |
| of the Advisory Council for the College of Arts and | | |
| Letters and of the Advisory Board to the Kellogg | Glenn Booraem | |
| Institute for International Studies, both at the | Born 1967. Controller Since July 2010. Principal |
| University of Notre Dame. | Occupation(s) During the Past Five Years: Principal |
| | of The Vanguard Group, Inc.; Controller of each of |
| Mark Loughridge | the investment companies served by The Vanguard |
| Born 1953. Trustee Since March 2012. Principal | Group; Assistant Controller of each of the investment |
| Occupation(s) During the Past Five Years: Senior Vice | companies served by The Vanguard Group (2001–2010). |
| President and Chief Financial Officer (retired 2013) | | |
| at IBM (information technology services); Fiduciary | Thomas J. Higgins | |
| Member of IBM’s Retirement Plan Committee (2004– | Born 1957. Chief Financial Officer Since September |
| 2013); Member of the Council on Chicago Booth. | 2008. Principal Occupation(s) During the Past Five |
| | Years: Principal of The Vanguard Group, Inc.; Chief |
| Scott C. Malpass | Financial Officer of each of the investment companies |
| Born 1962. Trustee Since March 2012. Principal | served by The Vanguard Group; Treasurer of each of |
| Occupation(s) During the Past Five Years: Chief | the investment companies served by The Vanguard |
| Investment Officer and Vice President at the University | Group (1998–2008). | |
| of Notre Dame; Assistant Professor of Finance at the | | |
| Mendoza College of Business at Notre Dame; Member | Kathryn J. Hyatt | |
| of the Notre Dame 403(b) Investment Committee; | Born 1955. Treasurer Since November 2008. Principal |
| Board Member of TIFF Advisory Services, Inc. | Occupation(s) During the Past Five Years: Principal of |
| (investment advisor); Member of the Investment | The Vanguard Group, Inc.; Treasurer of each of the |
| Advisory Committees of the Financial Industry | investment companies served by The Vanguard |
| Regulatory Authority (FINRA) and of Major League | Group; Assistant Treasurer of each of the investment |
| Baseball. | companies served by The Vanguard Group (1988–2008). |
| |
| André F. Perold | Heidi Stam | |
| Born 1952. Trustee Since December 2004. Principal | Born 1956. Secretary Since July 2005. Principal |
| Occupation(s) During the Past Five Years: George | Occupation(s) During the Past Five Years: Managing |
| Gund Professor of Finance and Banking, Emeritus | Director of The Vanguard Group, Inc.; General Counsel |
| at the Harvard Business School (retired 2011); | of The Vanguard Group; Secretary of The Vanguard |
| Chief Investment Officer and Managing Partner of | Group and of each of the investment companies |
| HighVista Strategies LLC (private investment firm); | served by The Vanguard Group; Director and Senior |
| Director of Rand Merchant Bank; Overseer of the | Vice President of Vanguard Marketing Corporation. |
| Museum of Fine Arts Boston. | | |
| | Vanguard Senior ManagementTeam |
| Alfred M. Rankin, Jr. | | |
| Born 1941. Trustee Since January 1993. Principal | Mortimer J. Buckley | Chris D. McIsaac |
| Occupation(s) During the Past Five Years: Chairman, | Kathleen C. Gubanich | Michael S. Miller |
| President, and Chief Executive Officer of NACCO | Paul A. Heller | James M. Norris |
| Industries, Inc. (housewares/lignite), and of Hyster- | Martha G. King | Glenn W. Reed |
| Yale Materials Handling, Inc. (forklift trucks); Chairman | John T. Marcante | |
| of the Board of University Hospitals of Cleveland. | | |
| |
| Peter F. Volanakis | Chairman Emeritus and Senior Advisor |
| Born 1955. Trustee Since July 2009. Principal | | |
| Occupation(s) During the Past Five Years: President | John J. Brennan | |
| and Chief Operating Officer (retired 2010) of Corning | Chairman, 1996–2009 | |
| Incorporated (communications equipment); Trustee of | Chief Executive Officer and President, 1996–2008 |
| Colby-Sawyer College; Member of the Advisory Board | | |
| of the Norris Cotton Cancer Center and of the Advisory | Founder | |
| Board of the Parthenon Group (strategy consulting). | | |
| | John C. Bogle | |
| | Chairman and Chief Executive Officer, 1974–1996 |
1 Mr. McNabb is considered an “interested person,” as defined in the Investment Company Act of 1940, because he is an officer of the
Vanguard funds.
2 December 2002 for Vanguard Equity Income Fund, the Vanguard Municipal Bond Funds, and the Vanguard State Tax-Exempt Funds.
| 
|
| | P.O. Box 2600 |
| | Valley Forge, PA 19482-2600 |
| |
| |
| |
| Connect with Vanguard® > vanguard.com | |
| |
| |
| |
| Fund Information > 800-662-7447 | Vanguard Extended Duration Treasury ETF is not |
| Direct Investor Account Services > 800-662-2739 | sponsored, endorsed, sold, or promoted by Barclays. |
| | Barclays makes no representation or warranty, express |
| Institutional Investor Services > 800-523-1036 | or implied, to the owners of Vanguard Extended |
| Duration Treasury ETF or any member of the public |
| Text Telephone for People | regarding the advisability of investing in securities |
| With Hearing Impairment > 800-749-7273 | generally or in Vanguard Extended Duration Treasury |
| ETF particularly or the ability of the Barclays Index to |
| This material may be used in conjunction | track general bond market performance. Barclays |
| with the offering of shares of any Vanguard | hereby expressly disclaims all warranties of |
| fund only if preceded or accompanied by | merchantability and fitness for a particular purpose |
| the fund’s current prospectus. | with respect to the Barclays Index and any data |
| All comparative mutual fund data are from Lipper, a | included therein. Barclays’ only relationship to |
| Thomson Reuters Company, or Morningstar, Inc., unless | Vanguard and Vanguard Extended Duration Treasury |
| otherwise noted. | ETF is the licensing of the Barclays Index, which is |
| | determined, composed, and calculated by Barclays |
| You can obtain a free copy of Vanguard’s proxy voting | without regard to Vanguard or Vanguard Extended |
| guidelines by visiting vanguard.com/proxyreporting or by | Duration Treasury ETF. Barclays is not responsible for, |
| calling Vanguard at 800-662-2739. The guidelines are | and has not participated in, the determination of the |
| also available from the SEC’s website, sec.gov. In | timing of, prices of, or quantities of Vanguard Extended |
| addition, you may obtain a free report on how your fund | Duration Treasury ETF to be issued. |
| voted the proxies for securities it owned during the 12 | |
| months ended June 30. To get the report, visit either | |
| vanguard.com/proxyreporting or sec.gov. | |
| |
| You can review and copy information about your fund at | |
| the SEC’s Public Reference Room in Washington, D.C. To | |
| find out more about this public service, call the SEC at | |
| 202-551-8090. Information about your fund is also | |
| available on the SEC’s website, and you can receive | |
| copies of this information, for a fee, by sending a | |
| request in either of two ways: via e-mail addressed to | |
| publicinfo@sec.gov or via regular mail addressed to the | |
| Public Reference Section, Securities and Exchange | |
| Commission, Washington, DC 20549-1520. | |
| |
| | © 2014 The Vanguard Group, Inc. |
| | All rights reserved. |
| | Vanguard Marketing Corporation, Distributor. |
| |
| | Q12750 102014 |
Item 2: Code of Ethics. The Registrant has adopted a code of ethics that applies to the Registrant’s principal executive officer, principal financial officer, principal accounting officer or controller or persons performing similar functions. The Code of Ethics was amended during the reporting period covered by this report to make certain technical, non-material changes.
Item 3: Audit Committee Financial Expert. The following members of the Audit Committee have been determined by the Registrant’s Board of Trustees to be Audit Committee Financial Experts serving on its Audit Committee, and to be independent: Rajiv L. Gupta, Amy Gutmann, JoAnn Heffernan Heisen, F. Joseph Loughrey, Mark Loughridge, Scott C. Malpass, André F. Perold, and Alfred M. Rankin, Jr.
Item 4: Principal Accountant Fees and Services.
(a) Audit Fees.
Audit Fees of the Registrant
Fiscal Year Ended August 31, 2014: $562,000 Fiscal Year Ended August 31, 2013: $494,000
Aggregate Audit Fees of Registered Investment Companies in the Vanguard Group.
Fiscal Year Ended August 31, 2014: $6,605,127 Fiscal Year Ended August 31, 2013: $5,714,113
Includes fees billed in connection with audits of the Registrant, other registered investment companies in the Vanguard complex, The Vanguard Group, Inc. and Vanguard Marketing Corporation.
(b) Audit-Related Fees.
Fiscal Year Ended August 31, 2014: $2,176,479 Fiscal Year Ended August 31, 2013: $1,552,950
Includes fees billed in connection with assurance and related services provided to the Registrant, other registered investment companies in the Vanguard complex, The Vanguard Group, Inc., and Vanguard Marketing Corporation.
(c) Tax Fees.
Fiscal Year Ended August 31, 2014: $316,869 Fiscal Year Ended August 31, 2013: $110,000
Includes fees billed in connection with tax compliance, planning, and advice services provided to the Registrant, other registered investment companies in the Vanguard complex, The Vanguard Group, Inc., and Vanguard Marketing Corporation.
(d) All Other Fees.
Fiscal Year Ended August 31, 2014: $198,163 Fiscal Year Ended August 31, 2013: $132,000
Includes fees billed for services related to tax reported information provided to the Registrant, other registered investment companies in the Vanguard complex, The Vanguard Group, Inc., and Vanguard Marketing Corporation.
(e) (1) Pre-Approval Policies. The policy of the Registrant’s Audit Committee is to consider and, if appropriate, approve before the principal accountant is engaged for such services, all specific audit and non-audit services provided to: the Registrant, other registered investment companies in the Vanguard complex, The Vanguard Group, Inc., and entities controlled by The Vanguard Group, Inc. that provide ongoing services to the Registrant. In making a determination, the Audit Committee considers whether the services are consistent with maintaining the principal accountant’s independence.
In the event of a contingency situation in which the principal accountant is needed to provide services in between scheduled Audit Committee meetings, the Chairman of the Audit Committee would be called on to consider and, if appropriate, pre-approve audit or permitted non-audit services in an amount sufficient to complete services through the next Audit Committee meeting, and to determine if such services would be consistent with maintaining the accountant’s independence. At the next scheduled Audit Committee meeting, services and fees would be presented to the Audit Committee for formal consideration, and, if appropriate, approval by the entire Audit Committee. The Audit Committee would again consider whether such services and fees are consistent with maintaining the principal accountant’s independence.
The Registrant’s Audit Committee is informed at least annually of all audit and non-audit services provided by the principal accountant to the Vanguard complex, whether such services are provided to: the Registrant, other registered investment companies in the Vanguard complex, The Vanguard Group, Inc., or other entities controlled by The Vanguard Group, Inc. that provide ongoing services to the Registrant.
(2) No percentage of the principal accountant’s fees or services were approved pursuant to the waiver provision of paragraph (c)(7)(i)(C) of Rule 2-01 of Regulation S-X.
(f) For the most recent fiscal year, over 50% of the hours worked under the principal accountant’s engagement were not performed by persons other than full-time, permanent employees of the principal accountant.
(g) Aggregate Non-Audit Fees.
Fiscal Year Ended August 31, 2014: $515,032 Fiscal Year Ended August 31, 2013: $242,000
Includes fees billed for non-audit services provided to the Registrant, other registered investment companies in the Vanguard complex, The Vanguard Group, Inc., and Vanguard Marketing Corporation.
(h) For the most recent fiscal year, the Audit Committee has determined that the provision of all non-audit services was consistent with maintaining the principal accountant’s independence.
Item 5: Audit Committee of Listed Registrants.
The Registrant is a listed issuer as defined in rule 10A-3 under the Securities Exchange Act of 1934 (“Exchange Act”). The Registrant has a separately-designated standing audit committee established in accordance with Section 3(a)(58)(A) of the Exchange Act. The Registrant’s audit committee members are: Emerson U. Fullwood, Rajiv L. Gupta, Amy Gutmann, JoAnn Heffernan Heisen, F. Joseph Loughrey, Mark Loughridge, Scott C. Malpass, André F. Perold, Alfred M. Rankin, Jr., and Peter F. Volanakis.
Item 6: Investments.
Not Applicable.
Item 7: Disclosure of Proxy Voting Policies and Procedures for Closed-End Management Investment Companies.
Not Applicable.
Item 8: Portfolio Managers of Closed-End Management Investment Companies.
Not Applicable.
Item 9: Purchase of Equity Securities by Closed-End Management Investment Company and Affiliated Purchasers.
Not Applicable.
Item 10: Submission of Matters to a Vote of Security Holders.
Not Applicable.
Item 11: Controls and Procedures.
(a) Disclosure Controls and Procedures. The Principal Executive and Financial Officers concluded that the Registrant’s Disclosure Controls and Procedures are effective based on their evaluation of the Disclosure Controls and Procedures as of a date within 90 days of the filing date of this report.
(b) Internal Control Over Financial Reporting. There were no significant changes in Registrant’s Internal Control Over Financial Reporting or in other factors that could significantly affect this control subsequent to the date of the evaluation, including any corrective actions with regard to significant deficiencies and material weaknesses.
Item 12: Exhibits.
(a) Code of Ethics. (b) Certifications.
Pursuant to the requirements of the Securities Exchange Act of 1934 and the Investment Company Act of 1940, the registrant has duly caused this report to be signed on its behalf by the undersigned, thereunto duly authorized.
| |
| | VANGUARD WORLD FUND |
| |
| |
| BY: | /s/ F. WILLIAM MCNABB III* |
| | F. WILLIAM MCNABB III |
| | CHIEF EXECUTIVE OFFICER |
| |
| Date: October 22, 2014 |
Pursuant to the requirements of the Securities Exchange Act of 1934 and the Investment Company Act of 1940, this report has been signed below by the following persons on behalf of the registrant and in the capacities and on the dates indicated.
| |
| | VANGUARD WORLD FUND |
| |
| BY: | /s/ F. WILLIAM MCNABB III* |
| | F. WILLIAM MCNABB III |
| | CHIEF EXECUTIVE OFFICER |
| Date: October 22, 2014 |
|
| | VANGUARD WORLD FUND |
| |
| BY: | /s/ THOMAS J. HIGGINS* |
| | THOMAS J. HIGGINS |
| | CHIEF FINANCIAL OFFICER |
| Date: October 22, 2014 |
* By: /s/ Heidi Stam
Heidi Stam, pursuant to a Power of Attorney filed on April 22, 2014 see file Number 2-17620, Incorporated by Reference.