UNITED STATES
SECURITIES AND EXCHANGE COMMISSION
Washington, D.C. 20549
FORM N-CSR
CERTIFIED SHAREHOLDER REPORT
OF
REGISTERED MANAGEMENT INVESTMENT COMPANIES
Investment Company Act file number: 811-01027
Name of Registrant: | | Vanguard World Fund |
Address of Registrant: | | P.O. Box 2600 |
| | Valley Forge, PA 19482 |
Name and address of agent for service: | | Anne E. Robinson, Esquire |
| | P.O. Box 876 |
| | Valley Forge, PA 19482 |
Registrant’s telephone number, including area code: (610) 669-1000
Date of fiscal year end: August 31
Date of reporting period: September 1, 2018—August 31, 2019
Item 1: Reports to Shareholders

Annual Report | August 31, 2019 Vanguard U.S. Growth Fund |
See the inside front cover for important information about access to your fund’s annual and semiannual shareholder reports. |
Important information about access to shareholder reports
Beginning on January 1, 2021, as permitted by regulations adopted by the Securities and Exchange Commission, paper copies of your fund’s annual and semiannual shareholder reports will no longer be sent to you by mail, unless you specifically request them. Instead, you will be notified by mail each time a report is posted on the website and will be provided with a link to access the report.
If you have already elected to receive shareholder reports electronically, you will not be affected by this change and do not need to take any action. You may elect to receive shareholder reports and other communications from the fund electronically by contacting your financial intermediary (such as a broker-dealer or bank) or, if you invest directly with the fund, by calling Vanguard at one of the phone numbers on the back cover of this report or by logging on to vanguard.com.
You may elect to receive paper copies of all future shareholder reports free of charge. If you invest through a financial intermediary, you can contact the intermediary to request that you continue to receive paper copies. If you invest directly with the fund, you can call Vanguard at one of the phone numbers on the back cover of this report or log on to vanguard.com. Your election to receive paper copies will apply to all the funds you hold through an intermediary or directly with Vanguard.
A Note From Our Chairman | 1 |
Your Fund’s Performance at a Glance | 2 |
Advisors’ Report | 3 |
About Your Fund’s Expenses | 9 |
Performance Summary | 11 |
Financial Statements | 13 |
Please note: The opinions expressed in this report are just that—informed opinions. They should not be considered promises or advice. Also, please keep in mind that the information and opinions cover the period through the date on the front of this report. Of course, the risks of investing in your fund are spelled out in the prospectus.
A Note From Our Chairman

Tim Buckley
Chairman and Chief Executive Officer
Dear Shareholder,
Recent volatility in financial markets—affecting stocks, bonds, and commodities—has been a good reminder of the wise old adage, “Never keep all your eggs in one basket.” Maintaining balance and diversification in your investment portfolio can help to both limit risk and set you up for long-term success.
It’s understandable why some investors might become complacent after a long market run-up like the one that lifted stock prices, especially U.S. stock prices, in the years following the global financial crisis. But failing to rebalance regularly can leave a portfolio with a much different mix of assets than intended and, often, more risk than intended.
Balance across and diversification within asset classes are powerful tools for managing risk and achieving your investment goals. A portfolio’s allocation will determine a large portion of its long-term return and also the majority of its volatility risk. A well-diversified portfolio is less vulnerable to significant swings in the performance of any one segment of the asset classes in which it invests.
Balance and diversification will never eliminate the risk of loss, nor will they guarantee positive returns in a declining market. But they should reduce the chance that you’ll suffer disproportionate losses in one particular high-flying asset class or sector when it comes back to earth. And exposure to all key market components should give you at least some participation in the sectors that are performing best at any given time.
Vanguard is committed to helping you achieve balance and diversification in your portfolios to help meet your investment goals. We thank you for your continued loyalty.
Sincerely,

Mortimer J. Buckley
Chairman and Chief Executive Officer
October 1, 2019
1
Your Fund’s Performance at a Glance
· Vanguard U.S. Growth Fund absorbed Vanguard Morgan™ Growth Fund in April. As part of the merger, the reconfigured U.S. Growth Fund picked up one of Morgan Growth Fund’s advisors—Vanguard Quantitative Equity Group. William Blair Investment Management, LLC, no longer serves as an advisor to the U.S. Growth Fund.
· The U.S. Growth Fund returned 3.70% (for Investor Shares) for the 12 months ended August 31, 2019. The fund lagged its benchmark, which returned 4.27%.
· Growth stocks outperformed value stocks and large-capitalization stocks outperformed mid- and small-cap stocks.
· The broad U.S. stock market advanced about 1% as corporate fundamentals appeared solid, on balance, though quarterly earnings growth softened. Stocks endured a stretch of heightened volatility at the end of 2018 and at times this year.
· Information technology stocks, the fund’s largest weighting, helped performance the most relative to the benchmark. Communication services and consumer discretionary detracted the most.
Market Barometer | | | |
| | Average Annual Total Returns |
| | Periods Ended August 31, 2019 |
| One Year | Three Years | Five Years |
Stocks | | | |
Russell 1000 Index (Large-caps) | 2.49% | 12.57% | 9.85% |
Russell 2000 Index (Small-caps) | -12.89 | 7.89 | 6.41 |
Russell 3000 Index (Broad U.S. market) | 1.31 | 12.24 | 9.60 |
FTSE All-World ex US Index (International) | -3.18 | 5.97 | 1.71 |
| | | |
Bonds | | | |
Bloomberg Barclays U.S. Aggregate Bond Index | | | |
(Broad taxable market) | 10.17% | 3.09% | 3.35% |
Bloomberg Barclays Municipal Bond Index | | | |
(Broad tax-exempt market) | 8.72 | 3.30 | 3.85 |
FTSE Three-Month U.S. Treasury Bill Index | 2.36 | 1.47 | 0.91 |
| | | |
CPI | | | |
Consumer Price Index | 1.75% | 2.13% | 1.53% |
2
Advisors’ Report
For the 12 months ended August 31, 2019, Vanguard U.S. Growth Fund returned 3.70% for Investor Shares and 3.80% for Admiral Shares. It trailed its benchmark, the Russell 1000 Growth Index, which returned 4.27%. Your fund is managed by five advisors. The use of multiple independent advisors enhances the fund’s diversification by providing exposure to distinct yet complementary investment approaches. It is not uncommon for different advisors to have different views about individual securities or the broader investment environment.
The table on page 8 presents the advisors, the percentage and amount of fund assets that each manages, and brief descriptions of their investment strategies. Each advisor has also prepared a discussion of the investment environment during the fiscal year and of how the portfolio’s positioning reflects this assessment. These reports were prepared on September 18, 2019.
Wellington Management Company LLP
Portfolio Manager:
Andrew J. Shilling, CFA,
Senior Managing Director
We aim for our portion of the fund to outperform growth benchmarks and, in the longer term, the broader market. Our investment approach is based on using fundamental research and rigorous valuation discipline to identify large-capitalization companies with a clear competitive advantage that will enable them to sustain above-average growth.
We take a long-term perspective because we believe that investors often underestimate the potential for growth.
During the 12-month period, growth stocks outperformed value stocks and large-capitalization companies led their smaller-cap peers. Notable contributors to our portfolio’s performance included FleetCor Technologies, a provider of fuel cards for vehicle fleets and workforce payment products and services; Edwards Lifesciences, a medical device company specializing in artificial heart valves and hemodynamic monitoring; and ServiceNow, a provider of enterprise cloud-based services.
Detractors included our positions in 2U, an online education services provider; the absence from the portfolio of Starbucks, a global coffee retailer; and Activision Blizzard, a gaming and electronic entertainment company. We liquidated our positions in 2U and Activision Blizzard during the period.
We have maintained the portfolio’s exposure to quality growth companies benefiting from secular trends and long-cycle growth. We believe these companies, supported by strong barriers to entry, can outgrow the broader market through the coming years.
We remain true to our process, seeking to invest in companies with competitive advantages, strong balance sheets, experienced and proven management, and the ability to sustain above-average growth. We are confident that this time-tested process will continue to yield a portfolio that is well-positioned to outperform.
3
Jennison Associates LLC
Portfolio Managers:
Kathleen A. McCarragher, Managing Director
Blair A. Boyer, Managing Director
Markets were highly volatile during the 12-month period. Initially, global growth was accelerating, U.S. employment continued to strengthen, and lower U.S. corporate tax rates were helping to boost wages and capital spending. A sell-off in late 2018 reflected concerns about a trade war with China, the pace of U.S. growth, slowing expansion in non-U.S. economies, and U.S. interest rate increases. Equity markets then rebounded throughout most of 2019 as the Federal Reserve ceased monetary tightening, corporate earnings showed strength, and trade friction appeared to abate. Markets fell again as the period ended with trade tension escalating again.
Our portfolio benefited from exposure to several companies, including:
· Mastercard and Visa, which continued to benefit from the shift from cash to electronic transactions.
· Microsoft, Workday, Red Hat, Adobe, and ServiceNow, which offer mission-critical applications and services that are changing the way businesses operate.
· Estée Lauder, which has enhanced its brand portfolio in the fast-growing luxury beauty care market with complementary acquisitions and brand development.
· Costco, whose consistent membership fee income allows for low prices and broad product selection, leading to high inventory turnover.
· Netflix, which continues to raise its competitive barriers with investments in content. Subscriber growth momentum eased, but with global penetration still low, the company has room for growth.
· Home Depot, which is consolidating its leadership position with investments in customer service, delivery initiatives, and pricing.
Portfolio performance was hurt during the period by positions in:
· Nvidia, which fell on microchip inventory issues and worries that trade disruption would depress chip demand.
· Video game publisher Activision Blizzard, which was hurt by slowing revenue growth.
· Tesla, which declined on controversy surrounding its CEO and concerns about production volume.
Although we believe our portfolio holds fundamentally strong companies with solid long-term growth prospects, we remain alert to the challenges posed by slowing economic growth and trade friction.
4
Vanguard Quantitative Equity Group
Portfolio Managers:
James P. Stetler
Binbin Guo, Principal, Head of Alpha Equity Investments
Markets continued to advance over the 12 months ended August 31, 2019. U.S. stocks led the way, large-cap stocks outperformed small-caps, and growth stocks outpaced value.
Stocks outside the United States were in negative territory. Developed markets outperformed their emerging markets counterparts, which were hurt particularly by slowing global growth and U.S.-China trade tensions.
In response to these challenges, the Federal Reserve cut interest rates August 1 and signaled that more rate cuts could come. (It cut rates again in September.) The Fed’s accommodative stance helped push stocks higher. Attention turned to the size and pace of rate cuts for the rest of 2019.
Although it’s important to understand how overall performance is affected by such macro factors, our approach to investing focuses on specific fundamentals, not technical analysis of stock price movements. We believe that attractive stocks exhibit five key characteristics: high quality—healthy balance sheets and steady cash-flow generation; effective management decisions—sound investment policies that favor internal over external funding; consistent earnings growth—ability to grow earnings year after year; strong market sentiment—market confirmation of our view; and reasonable valuation—shares that are not overpriced.
Using these five themes, we generate a daily composite stock ranking. We then monitor our portfolio based on those rankings and adjust when appropriate to maximize expected returns while minimizing exposure to risks that our research indicates don’t improve returns (such as industry selection and other risks relative to our benchmark).
Since our group joined the U.S. Growth Fund on April 8, 2019, our growth and sentiment models made significant contributions to our relative performance. Our management decisions model has also made a positive contribution to performance, while our valuation and quality models detracted.
Our strongest sector results were in information technology, primarily because of strong stock selection in software companies, and in communication services, where our portfolio benefited from strong selection in interactive media companies like Match Group and Twitter. Our weakest results were in industrials, due in part to poor selection in professional services companies, and in energy, where our selection in oil and gas and consumable fuels detracted.
5
At the stock level, top contributors included overweight positions in Cypress Semi-conductor, Booz Allen Hamilton, and Starbucks, as well as an underweight to 3M. Overweights to Chesapeake Energy, Ionis Pharmaceuticals, Cabot Oil & Gas, VMware, and Align Technology detracted.
Jackson Square Partners, LLC
Portfolio Managers:
Jeffrey S. Van Harte, CFA,
Chairman and Chief Investment Officer
Christopher J. Bonavico, CFA,
Equity Analyst
Christopher M. Ericksen, CFA,
Equity Analyst
Daniel J. Prislin, CFA,
Equity Analyst
For the 12 months ended August 31, 2019, performance of assets we managed was driven primarily by our stock selection.
Our largest relative contributor to performance during the period was Ball, a manufacturer of metal packaging for beverages, food, and household products. Ball reported positive earnings this year with mid-single-digit global beverage can growth, confirming the acceleration in can volume that is driven by consumer preference and sustainability concerns. Ball also revealed detailed plans and market sizing for its unique initiative in aluminum cups, which could grow to rival the can business in profit generation over the long term. We continue to believe in the secular growth of sustainable packaging, which we believe should persist at higher rates longer than the market anticipates.
Biogen, a biotechnology company focused on neurodegenerative diseases, detracted from performance. The company announced that it was discontinuing trials on what had looked like a promising, high-profile treatment for Alzheimer’s disease, which has very limited treatment options. We continue to believe there is significant intrinsic business value in Biogen’s extant business and in the rest of its pipeline.
We remain committed to our long-held investment philosophy to own what we view as strong secular-growth companies with solid business models that have the potential to deliver shareholder value in a variety of market environments.
Baillie Gifford Overseas Ltd.
Portfolio Managers:
Tom Slater, Investment Manager, Partner
Gary Robinson, Investment Manager, Partner
Factors other than company fundamentals dominated the market during this period. We remain optimistic about the long-term growth opportunities for the companies in the portfolio. However, some stock-specific issues had a notable impact on performance.
6
Among the main detractors from our portfolio’s performance was GrubHub, which saw competition increase significantly over the period. Abiomed’s share price also suffered as sales of its heart pump slowed following a Food and Drug Administration warning letter that confused the market somewhat. Tesla delivered record sales of its ground-breaking Model 3 car. However, Wall Street continued an intense debate about Tesla’s long-term profitability and the company made some missteps in scaling its international deliveries. Both issues contributed to a weaker share price.
Notable contributors to performance included Shopify, the e-commerce software provider, whose revenues grew significantly. Shopify is increasingly important to entrepreneurs and large enterprises alike as they grow their businesses online. MarketAxess, the electronic bond trading platform, continued to gain market share and investors became increasingly confident that it will unlock further opportunities through its technological lead. Finally, streaming content provider Roku is emerging as one of several key players in the structural trend away from cable subscriptions to “over the top” television.
Competition for capital in the portfolio is high, thus turnover remains low. We initiated new positions in nine companies with attractive and durable growth prospects, including Chewy (online pet supplies) and Lyft (ride-sharing). Funding came in part from the complete sales of Under Armour and Celgene.
7
Vanguard U.S. Growth Fund Investment Advisors
| | Fund Assets Managed | | |
Investment Advisor | | % | | $Million | | Investment Strategy |
Wellington Management Company LLP | | 27 | | 7,065 | | Employs proprietary fundamental research and a rigorous valuation discipline in an effort to invest in high-quality, large-cap, sustainable-growth companies. The investment approach is based on the belief that stock prices often overreact to short-term trends and that bottom-up, intensive research focused on longer-term fundamentals can be used to identify stocks that will outperform the market over time. |
| | | | | | |
Jennison Associates LLC | | 26 | | 6,709 | | Uses a research-driven, fundamental investment approach that relies on in-depth company knowledge gleaned through meetings with management, customers, and suppliers. |
| | | | | | |
Vanguard Quantitative Equity Group | | 15 | | 3,856 | | Employs a quantitative fundamental management approach, using models that assess valuation, market sentiment, earnings quality and growth, and management decisions of companies versus their peers. |
| | | | | | |
Jackson Square Partners, LLC | | 15 | | 3,837 | | Uses a bottom-up approach, seeking companies that have large end-market potential, dominant business models, and strong free cash flow generation that is attractively priced compared with the intrinsic value of the securities. |
| | | | | | |
Baillie Gifford Overseas Ltd. | | 15 | | 3,799 | | Uses an active, bottom-up approach to identify exceptional growth companies and own them for long periods. Such companies have special cultures, address large market opportunities, and enjoy sustainable competitive advantages. This approach is based on the belief that these factors drive long-term returns, and a long investment horizon enables the inherent asymmetry of equity market returns to be captured. |
| | | | | | |
Cash Investments | | 2 | | 614 | | These short-term reserves are invested by Vanguard in equity index products to simulate investment in stocks. Each advisor may also maintain a modest cash position. |
8
About Your Fund’s Expenses
As a shareholder of the fund, you incur ongoing costs, which include costs for portfolio management, administrative services, and shareholder reports (like this one), among others. Operating expenses, which are deducted from a fund’s gross income, directly reduce the investment return of the fund.
A fund’s expenses are expressed as a percentage of its average net assets. This figure is known as the expense ratio. The following examples are intended to help you understand the ongoing costs (in dollars) of investing in your fund and to compare these costs with those of other mutual funds. The examples are based on an investment of $1,000 made at the beginning of the period shown and held for the entire period.
The accompanying table illustrates your fund’s costs in two ways:
· Based on actual fund return. This section helps you to estimate the actual expenses that you paid over the period. The “Ending Account Value” shown is derived from the fund’s actual return, and the third column shows the dollar amount that would have been paid by an investor who started with $1,000 in the fund. You may use the information here, together with the amount you invested, to estimate the expenses that you paid over the period.
To do so, simply divide your account value by $1,000 (for example, an $8,600 account value divided by $1,000 = 8.6), then multiply the result by the number given for your fund under the heading “Expenses Paid During Period.”
· Based on hypothetical 5% yearly return. This section is intended to help you compare your fund’s costs with those of other mutual funds. It assumes that the fund had a yearly return of 5% before expenses, but that the expense ratio is unchanged. In this case—because the return used is not the fund’s actual return—the results do not apply to your investment. The example is useful in making comparisons because the Securities and Exchange Commission requires all mutual funds to calculate expenses based on a 5% return. You can assess your fund’s costs by comparing this hypothetical example with the hypothetical examples that appear in shareholder reports of other funds.
Note that the expenses shown in the table are meant to highlight and help you compare ongoing costs only and do not reflect transaction costs incurred by the fund for buying and selling securities. Further, the expenses do not include any purchase, redemption, or account service fees described in the fund prospectus. If such fees were applied to your account, your costs would be higher. Your fund does not carry a “sales load.”
The calculations assume no shares were bought or sold during the period. Your actual costs may have been higher or lower, depending on the amount of your investment and the timing of any purchases or redemptions.
You can find more information about the fund’s expenses, including annual expense ratios, in the Financial Statements section of this report. For additional information on operating expenses and other shareholder costs, please refer to your fund’s current prospectus.
9
Six Months Ended August 31, 2019
| | Beginning | | Ending | | Expenses |
| | Account Value | | Account Value | | Paid During |
U.S. Growth Fund | | 2/28/2019 | | 8/31/2019 | | Period |
Based on Actual Fund Return | | | | | | |
Investor Shares | | $1,000.00 | | $1,069.34 | | $1.93 |
Admiral™ Shares | | 1,000.00 | | 1,069.85 | | 1.46 |
Based on Hypothetical 5% Yearly Return | | | | | | |
Investor Shares | | $1,000.00 | | $1,023.34 | | $1.89 |
Admiral Shares | | 1,000.00 | | 1,023.79 | | 1.43 |
The calculations are based on expenses incurred in the most recent six-month period. The fund’s annualized six-month expense ratios for that period are 0.37% for Investor Shares and 0.28% for Admiral Shares. The dollar amounts shown as “Expenses Paid” are equal to the annualized expense ratio multiplied by the average account value over the period, multiplied by the number of days in the most recent six-month period, then divided by the number of days in the most recent 12-month period (184/365).
10
U.S. Growth Fund
Performance Summary
All of the returns in this report represent past performance, which is not a guarantee of future results that may be achieved by the fund. (Current performance may be lower or higher than the performance data cited. For performance data current to the most recent month-end, visit our website at vanguard.com/performance.) Note, too, that both investment returns and principal value can fluctuate widely, so an investor’s shares, when sold, could be worth more or less than their original cost. The returns shown do not reflect taxes that a shareholder would pay on fund distributions or on the sale of fund shares.
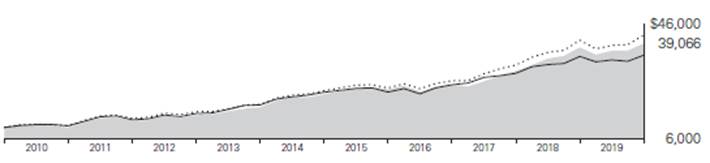
Cumulative Performance: August 31, 2009, Through August 31, 2019
Initial Investment of $10,000
| Average Annual Total Returns | |
| Periods Ended August 31, 2019 | |
| | | | Final Value |
| One | Five | Ten | of a $10,000 |
| Year | Years | Years | Investment |

| U.S. Growth Fund Investor Shares | 3.70% | 12.74% | 14.60% | $39,066 |

| Russell 1000 Growth Index | 4.27 | 13.06 | 15.42 | 41,941 |

| Dow Jones U.S. Total Stock Market Float Adjusted Index | 1.23 | 9.55 | 13.35 | 35,018 |
| | | | | |
| | | | | Final Value |
| | One | Five | Ten | of a $50,000 |
| | Year | Years | Years | Investment |
U.S. Growth Fund Admiral Shares | 3.80% | 12.88% | 14.76% | $198,015 |
Russell 1000 Growth Index | 4.27 | 13.06 | 15.42 | 209,707 |
Dow Jones U.S. Total Stock Market Float Adjusted Index | 1.23 | 9.55 | 13.35 | 175,091 |
See Financial Highlights for dividend and capital gains information.
11
U.S. Growth Fund
Sector Diversification
As of August 31, 2019
Communication Services | 14.4% |
Consumer Discretionary | 17.4 |
Consumer Staples | 3.7 |
Energy | 0.2 |
Financials | 6.1 |
Health Care | 12.1 |
Industrials | 8.0 |
Information Technology | 34.5 |
Materials | 1.3 |
Other | 0.4 |
Real Estate | 1.8 |
Utilities | 0.1 |
The table reflects the fund’s equity exposure, based on its investments in stocks and stock index futures. Any holdings in short-term reserves are excluded. Sector categories are based on the Global Industry Classification Standard (“GICS”), except for the “Other” category (if applicable), which includes securities that have not been provided a GICS classification as of the effective reporting period.
The Global Industry Classification Standard (“GICS”) was developed by and is the exclusive property and a service mark of MSCI Inc. (“MSCI”) and Standard and Poor’s, a division of McGraw-Hill Companies, Inc. (“S&P”), and is licensed for use by Vanguard. Neither MSCI, S&P nor any third party involved in making or compiling the GICS or any GICS classification makes any express or implied warranties or representations with respect to such standard or classification (or the results to be obtained by the use thereof), and all such parties hereby expressly disclaim all warranties of originality, accuracy, completeness, merchantability or fitness for a particular purpose with respect to any such standard or classification. Without limiting any of the foregoing, in no event shall MSCI, S&P, any of its affiliates or any third party involved in making or compiling the GICS or any GICS classification have any liability for any direct, indirect, special, punitive, consequential or any other damages (including lost profits) even if notified of the possibility of such damages.
12
U.S. Growth Fund
Financial Statements
Statement of Net Assets
As of August 31, 2019
The fund files its complete schedule of portfolio holdings with the Securities and Exchange Commission (SEC) for the first and third quarters of each fiscal year as an exhibit to its reports on Form N-PORT. The fund’s Form N-PORT reports are available on the SEC’s website at www.sec.gov.
| | | Market |
| | | Value· |
| | Shares | ($000) |
Common Stocks (96.1%)1 | | |
Communication Services (14.0%) | | |
* | Alphabet Inc. Class C | 710,078 | 843,644 |
* | Facebook Inc. Class A | 4,175,281 | 775,224 |
* | Netflix Inc. | 1,810,869 | 531,943 |
* | Alphabet Inc. Class A | 407,988 | 485,722 |
| Tencent Holdings Ltd. | 4,124,583 | 170,286 |
* | Charter Communications Inc. Class A | 409,427 | 167,697 |
* | Liberty Global plc | 5,099,846 | 133,208 |
* | Take-Two Interactive Software Inc. | 1,008,054 | 133,033 |
* | TripAdvisor Inc. | 2,248,569 | 85,423 |
| Tencent Holdings Ltd. ADR | 905,959 | 37,389 |
* | Zillow Group Inc. Class A | 929,226 | 31,752 |
| Activision Blizzard Inc. | 574,821 | 29,086 |
* | IAC/InterActiveCorp | 101,580 | 25,866 |
* | Spotify Technology SA | 183,266 | 24,732 |
^ | Match Group Inc. | 280,250 | 23,765 |
* | Twitter Inc. | 551,901 | 23,539 |
*,^ | Eventbrite Inc. Class A | 1,257,484 | 21,981 |
*,2 | Pinterest Inc. Class A (Restricted) | 532,157 | 16,485 |
*,^ | Pinterest Inc. Class A (XNYS) | 478,205 | 16,460 |
* | Electronic Arts Inc. | 161,716 | 15,149 |
* | Liberty Global plc Class A | 553,163 | 14,780 |
| Nexstar Media Group Inc. Class A | 41,845 | 4,138 |
| Comcast Corp. Class A | 53,548 | 2,370 |
* | T-Mobile US Inc. | 24,266 | 1,894 |
| | | 3,615,566 |
Consumer Discretionary (16.9%) | | |
* | Amazon.com Inc. | 820,064 | 1,456,671 |
| Home Depot Inc. | 1,846,980 | 420,945 |
* | Alibaba Group Holding Ltd. ADR | 1,481,179 | 259,251 |
*,^ | Tesla Inc. | 1,088,795 | 245,643 |
* | Wayfair Inc. | 1,580,870 | 178,227 |
* | Dollar Tree Inc. | 1,686,014 | 171,181 |
| Hasbro Inc. | 1,528,968 | 168,905 |
| NIKE Inc. Class B | 1,948,971 | 164,688 |
| Lululemon Athletica Inc. | 778,734 | 143,809 |
* | Roku Inc. | 907,327 | 137,333 |
*,^ | GrubHub Inc. | 1,734,410 | 102,920 |
| Kering SA | 174,733 | 84,667 |
| adidas AG | 249,705 | 73,991 |
| Hilton Worldwide Holdings Inc. | 795,362 | 73,468 |
* | O’Reilly Automotive Inc. | 188,179 | 72,216 |
* | Under Armour Inc. Class A | 3,664,563 | 68,197 |
| Ross Stores Inc. | 556,627 | 59,008 |
* | Chegg Inc. | 1,457,264 | 57,766 |
| Starbucks Corp. | 585,469 | 56,533 |
*,^ | Chewy Inc. | 1,615,057 | 53,297 |
* | Booking Holdings Inc. | 23,113 | 45,450 |
| TJX Cos. Inc. | 660,700 | 36,319 |
*,^ | Stitch Fix Inc. Class A | 1,802,463 | 34,355 |
*,2 | Uber Technologies Inc. | 999,588 | 29,301 |
| eBay Inc. | 707,919 | 28,522 |
| Darden Restaurants Inc. | 179,259 | 21,687 |
| Expedia Group Inc. | 141,953 | 18,468 |
* | CarMax Inc. | 216,237 | 18,008 |
* | AutoZone Inc. | 13,991 | 15,414 |
| Best Buy Co. Inc. | 224,732 | 14,304 |
| H&R Block Inc. | 494,120 | 11,968 |
* | Under Armour Inc. Class C | 591,621 | 10,010 |
* | NVR Inc. | 2,682 | 9,652 |
* | Tempur Sealy International Inc. | 78,341 | 6,042 |
| Wyndham Destinations Inc. | 127,553 | 5,656 |
| Hanesbrands Inc. | 376,833 | 5,147 |
* | frontdoor Inc. | 78,340 | 4,022 |
| Gentex Corp. | 125,746 | 3,345 |
| Wendy’s Co. | 137,034 | 3,015 |
| Columbia Sportswear Co. | 27,527 | 2,582 |
13
U.S. Growth Fund
| | | Market |
| | | Value· |
| | Shares | ($000) |
* | Chipotle Mexican Grill Inc. Class A | 3,028 | 2,539 |
| Lowe’s Cos. Inc. | 19,986 | 2,242 |
| Lear Corp. | 15,341 | 1,722 |
| | | 4,378,486 |
Consumer Staples (3.5%) | | |
| Constellation Brands Inc. Class A | 1,483,866 | 303,228 |
| Costco Wholesale Corp. | 635,290 | 187,258 |
| Estee Lauder Cos. Inc. Class A | 909,494 | 180,071 |
* | Monster Beverage Corp. | 1,856,745 | 108,935 |
| PepsiCo Inc. | 229,661 | 31,402 |
| Sysco Corp. | 382,526 | 28,433 |
| Hershey Co. | 164,310 | 26,040 |
| Coca-Cola Co. | 434,752 | 23,929 |
| Campbell Soup Co. | 318,176 | 14,318 |
| Lamb Weston Holdings Inc. | 59,100 | 4,160 |
* | Pilgrim’s Pride Corp. | 82,584 | 2,573 |
| | | 910,347 |
Energy (0.1%) | | |
| Cabot Oil & Gas Corp. | 671,523 | 11,497 |
| ConocoPhillips | 99,198 | 5,176 |
| | | 16,673 |
Financials (5.7%) | | |
| MarketAxess Holdings Inc. | 721,279 | 286,795 |
| KKR & Co. Inc. Class A | 7,358,927 | 190,155 |
| S&P Global Inc. | 509,702 | 132,619 |
| Progressive Corp. | 1,569,395 | 118,960 |
* | Markel Corp. | 95,631 | 109,314 |
| CME Group Inc. | 488,091 | 106,057 |
| Charles Schwab Corp. | 2,657,529 | 101,704 |
| First Republic Bank | 1,112,404 | 99,805 |
| Intercontinental Exchange Inc. | 801,253 | 74,901 |
| MSCI Inc. Class A | 301,508 | 70,743 |
| Marsh & McLennan Cos. Inc. | 659,946 | 65,922 |
| Interactive Brokers Group Inc. | 993,273 | 46,882 |
| Discover Financial Services | 277,040 | 22,155 |
| OneMain Holdings Inc. | 362,102 | 12,981 |
| Synchrony Financial | 347,415 | 11,135 |
| LPL Financial Holdings Inc. | 137,380 | 10,297 |
* | Athene Holding Ltd. Class A | 191,316 | 7,434 |
| CIT Group Inc. | 129,530 | 5,517 |
* | Arch Capital Group Ltd. | 87,813 | 3,468 |
| Comerica Inc. | 47,348 | 2,919 |
| Everest Re Group Ltd. | 9,912 | 2,338 |
| Aon plc | 10,237 | 1,995 |
| | | 1,484,096 |
Health Care (11.6%) | | |
* | Illumina Inc. | 1,454,313 | 409,156 |
| UnitedHealth Group Inc. | 1,192,635 | 279,077 |
* | IQVIA Holdings Inc. | 1,603,926 | 248,849 |
* | Edwards Lifesciences Corp. | 970,912 | 215,387 |
| AstraZeneca plc ADR | 3,259,067 | 146,756 |
| Intuitive Surgical Inc. | 276,690 | 141,483 |
* | Novocure Ltd. | 1,499,070 | 136,206 |
| Thermo Fisher Scientific Inc. | 424,110 | 121,745 |
* | Penumbra Inc. | 623,209 | 90,708 |
| Vertex Pharmaceuticals Inc. | 495,831 | 89,259 |
* | ABIOMED Inc. | 453,356 | 87,529 |
| BioMarin Pharmaceutical Inc. | 1,150,448 | 86,353 |
* | Biogen Inc. | 322,123 | 70,787 |
* | Glaukos Corp. | 1,071,265 | 68,893 |
| Zoetis Inc. | 526,521 | 66,563 |
| Danaher Corp. | 395,167 | 56,149 |
| Alexion Pharmaceuticals Inc. | 534,786 | 53,885 |
* | Alnylam Pharmaceuticals Inc. | 573,215 | 46,253 |
| AbbVie Inc. | 701,724 | 46,131 |
* | Elanco Animal Health Inc. | 1,556,078 | 40,489 |
| Eli Lilly & Co. | 315,145 | 35,602 |
| Merck & Co. Inc. | 406,640 | 35,162 |
| Johnson & Johnson | 267,792 | 34,374 |
| Stryker Corp. | 144,286 | 31,838 |
*,^ | Denali Therapeutics Inc. | 1,723,460 | 31,022 |
| Bristol-Myers Squibb Co. | 586,703 | 28,203 |
* | Veeva Systems Inc. Class A | 175,758 | 28,188 |
| HCA Healthcare Inc. | 191,653 | 23,037 |
* | PRA Health Sciences Inc. | 214,688 | 21,220 |
* | DexCom Inc. | 123,330 | 21,165 |
| Cooper Cos. Inc. | 60,240 | 18,659 |
| McKesson Corp. | 134,924 | 18,656 |
* | Seattle Genetics Inc. | 256,325 | 18,619 |
*,^ | Moderna Inc. | 1,131,513 | 17,799 |
* | Agios Pharmaceuticals Inc. | 453,622 | 17,215 |
| Agilent Technologies Inc. | 215,063 | 15,293 |
14
U.S. Growth Fund
| | | Market |
| | | Value· |
| | Shares | ($000) |
* | Henry Schein Inc. | 227,189 | 13,999 |
* | Align Technology Inc. | 66,939 | 12,257 |
| Amgen Inc. | 56,744 | 11,838 |
* | Centene Corp. | 252,860 | 11,788 |
| Bruker Corp. | 158,088 | 6,825 |
* | Ionis Pharmaceuticals Inc. | 100,688 | 6,364 |
| Hill-Rom Holdings Inc. | 56,853 | 6,122 |
| Becton Dickinson and Co. | 22,692 | 5,762 |
| STERIS plc | 35,295 | 5,450 |
* | Integra LifeSciences Holdings Corp. | 81,576 | 4,896 |
| Gilead Sciences Inc. | 71,598 | 4,549 |
* | Charles River Laboratories International Inc. | 15,046 | 1,974 |
| Encompass Health Corp. | 30,214 | 1,837 |
| | | 2,991,371 |
Industrials (7.6%) | | |
| Boeing Co. | 845,555 | 307,858 |
| Lockheed Martin Corp. | 394,719 | 151,615 |
| Safran SA | 991,181 | 143,962 |
| TransUnion | 1,692,308 | 141,562 |
* | CoStar Group Inc. | 211,983 | 130,342 |
| Northrop Grumman Corp. | 335,371 | 123,373 |
* | IHS Markit Ltd. | 1,799,848 | 118,088 |
| Union Pacific Corp. | 686,612 | 111,204 |
| Airbus SE | 746,435 | 102,855 |
| Equifax Inc. | 666,850 | 97,613 |
| Watsco Inc. | 467,287 | 76,425 |
| HEICO Corp. Class A | 508,922 | 56,165 |
| Fortive Corp. | 639,478 | 45,339 |
| Honeywell International Inc. | 228,808 | 37,666 |
*,^ | Lyft Inc. Class A | 598,207 | 29,294 |
* | NOW Inc. | 2,339,647 | 27,818 |
* | Copart Inc. | 306,076 | 23,075 |
| Spirit AeroSystems Holdings Inc. Class A | 285,158 | 22,984 |
| Armstrong World Industries Inc. | 237,214 | 22,647 |
| Expeditors International of Washington Inc. | 308,046 | 21,902 |
| WW Grainger Inc. | 79,728 | 21,818 |
| Caterpillar Inc. | 182,764 | 21,749 |
| AMETEK Inc. | 238,437 | 20,489 |
| United Parcel Service Inc. Class B | 157,050 | 18,636 |
| Nielsen Holdings plc | 880,381 | 18,277 |
| Allison Transmission Holdings Inc. | 408,623 | 18,155 |
| Canadian National Railway Co. | 187,815 | 17,305 |
| L3Harris Technologies Inc. | 80,731 | 17,067 |
| Landstar System Inc. | 133,976 | 14,941 |
| CH Robinson Worldwide Inc. | 71,871 | 6,072 |
| Robert Half International Inc. | 98,796 | 5,283 |
* | JetBlue Airways Corp. | 160,247 | 2,775 |
| | | 1,974,354 |
Information Technology (33.4%) | | |
| Microsoft Corp. | 11,242,659 | 1,549,913 |
| Mastercard Inc. Class A | 3,396,122 | 955,567 |
| Apple Inc. | 3,585,675 | 748,474 |
| Visa Inc. Class A | 3,863,595 | 698,615 |
* | salesforce.com Inc. | 2,716,803 | 424,011 |
* | PayPal Holdings Inc. | 3,619,027 | 394,655 |
* | Adobe Inc. | 1,238,086 | 352,248 |
* | ServiceNow Inc. | 1,094,098 | 286,479 |
* | Workday Inc. Class A | 1,572,882 | 278,840 |
* | Shopify Inc. Class A | 689,329 | 265,660 |
* | Autodesk Inc. | 1,433,286 | 204,702 |
| NVIDIA Corp. | 1,102,177 | 184,626 |
* | FleetCor Technologies Inc. | 584,554 | 174,431 |
* | Trade Desk Inc. Class A | 611,838 | 150,371 |
| CDW Corp. | 1,058,635 | 122,272 |
| Global Payments Inc. | 701,104 | 116,369 |
* | Advanced Micro Devices Inc. | 3,579,512 | 112,576 |
| Applied Materials Inc. | 2,339,671 | 112,351 |
| Fidelity National Information Services Inc. | 804,265 | 109,557 |
3 | Adyen NV | 137,315 | 99,553 |
| SS&C Technologies Holdings Inc. | 2,119,503 | 98,790 |
* | Arista Networks Inc. | 431,328 | 97,747 |
^ | Microchip Technology Inc. | 1,089,256 | 94,035 |
| Broadcom Inc. | 314,817 | 88,980 |
| Square Inc. | 1,055,923 | 65,298 |
* | DocuSign Inc. Class A | 1,372,754 | 64,094 |
| Accenture plc Class A | 286,102 | 56,697 |
| Texas Instruments Inc. | 429,311 | 53,127 |
* | Splunk Inc. | 469,490 | 52,498 |
* | Tyler Technologies Inc. | 202,953 | 52,066 |
* | Yext Inc. | 2,487,143 | 39,222 |
* | Gartner Inc. | 290,240 | 38,796 |
| Cisco Systems Inc. | 806,045 | 37,731 |
*,^ | Appian Corp. Class A | 576,444 | 34,281 |
* | New Relic Inc. | 498,635 | 28,592 |
* | Cadence Design Systems Inc. | 398,317 | 27,277 |
15
U.S. Growth Fund
| | | Market |
| | | Value· |
| | Shares | ($000) |
| Booz Allen Hamilton Holding Corp. Class A | 346,677 | 26,178 |
| Xilinx Inc. | 244,329 | 25,425 |
* | Atlassian Corp. plc Class A | 188,444 | 25,348 |
| QUALCOMM Inc. | 299,038 | 23,256 |
| VMware Inc. Class A | 164,358 | 23,247 |
* | Dell Technologies Inc. | 439,372 | 22,641 |
* | Fortinet Inc. | 284,751 | 22,547 |
* | Paycom Software Inc. | 85,186 | 21,307 |
| Teradyne Inc. | 388,385 | 20,573 |
* | Anaplan Inc. | 318,756 | 17,318 |
| Broadridge Financial Solutions Inc. | 111,694 | 14,458 |
* | Manhattan Associates Inc. | 168,207 | 13,899 |
* | 2U Inc. | 768,511 | 13,741 |
* | HubSpot Inc. | 65,608 | 13,101 |
| Oracle Corp. | 224,897 | 11,708 |
| HP Inc. | 609,615 | 11,150 |
* | Fair Isaac Corp. | 28,194 | 9,945 |
| Citrix Systems Inc. | 105,602 | 9,819 |
* | ON Semiconductor Corp. | 417,959 | 7,440 |
* | NCR Corp. | 220,032 | 6,933 |
* | Ceridian HCM Holding Inc. | 105,624 | 6,102 |
* | Euronet Worldwide Inc. | 33,548 | 5,137 |
* | Dropbox Inc. Class A | 231,589 | 4,145 |
*,^ | Pagerduty Inc. | 98,938 | 3,885 |
* | Teradata Corp. | 106,155 | 3,277 |
| Sabre Corp. | 134,937 | 3,190 |
| Jabil Inc. | 85,711 | 2,469 |
| Intuit Inc. | 6,717 | 1,937 |
| International Business Machines Corp. | 13,734 | 1,861 |
| | | 8,642,538 |
Materials (1.3%) | | |
| Ball Corp. | 2,605,373 | 209,498 |
| Sherwin-Williams Co. | 110,187 | 58,041 |
| Royal Gold Inc. | 120,387 | 16,057 |
* | Element Solutions Inc. | 1,046,811 | 9,767 |
* | Berry Global Group Inc. | 248,196 | 9,714 |
| Scotts Miracle-Gro Co. | 77,200 | 8,208 |
| Sealed Air Corp. | 201,509 | 8,024 |
| Ecolab Inc. | 23,520 | 4,853 |
| | | 324,162 |
Other (0.4%) | | |
^,4 | Vanguard Growth ETF | 574,591 | 95,486 |
*,§,2 | WeWork Class A PP | 19,046 | 1,295 |
| | | 96,781 |
Real Estate (1.6%) | | |
| American Tower Corp. | 671,324 | 154,532 |
| Equinix Inc. | 134,771 | 74,970 |
| Crown Castle International Corp. | 510,195 | 74,065 |
*,^ | Redfin Corp. | 2,238,711 | 37,812 |
| Simon Property Group Inc. | 176,639 | 26,309 |
| Omega Healthcare Investors Inc. | 433,892 | 17,651 |
| CubeSmart | 310,257 | 11,135 |
| Americold Realty Trust | 214,989 | 7,830 |
| UDR Inc. | 138,817 | 6,688 |
* | CBRE Group Inc. Class A | 121,645 | 6,358 |
| Alexandria Real Estate Equities Inc. | 34,684 | 5,197 |
| Hudson Pacific Properties Inc. | 69,605 | 2,367 |
| | | 424,914 |
Utilities (0.0%) | | |
| NRG Energy Inc. | 171,224 | 6,232 |
Total Common Stocks | | |
(Cost $16,422,532) | | 24,865,520 |
Preferred Stocks (0.2%) | | |
*,§,2,5 | WeWork Pfd. D1 PP | 260,418 | 17,708 |
*,§,2,5 | Airbnb Inc., 8.00% | 128,123 | 16,807 |
*,§,2,5 | WeWork Pfd. D2 PP | 204,614 | 13,914 |
Total Preferred Stocks | | |
(Cost $19,671) | | 48,429 |
16
U.S. Growth Fund
| | | Market |
| | | Value· |
| | Shares | ($000) |
Temporary Cash Investments (4.6%)1 | | |
Money Market Fund (3.8%) | | |
6,7 | Vanguard Market Liquidity Fund, 2.249% | 9,894,374 | 989,536 |
| | | |
| | Face | |
| | Amount | |
| | ($000) | |
Repurchase Agreement (0.7%) | | |
| Bank of America Securities, LLC 2.160%, 9/3/19 (Dated 8/30/19, Repurchase Value $171,741,000, collateralized by Federal National Mortgage Assn. 3.000%, 4/1/49 and Federal Home Loan Mortgage Corp. 5.000%, 3/1/49, with a value of $175,134,000) | 171,700 | 171,700 |
| | | |
U.S. Government and Agency Obligations (0.1%) | | |
8 | United States Treasury Bill, 2.048%, 11/21/19 | 25,000 | 24,893 |
8 | United States Treasury Bill, 2.007%, 11/29/19 | 500 | 498 |
| | | 25,391 |
Total Temporary Cash Investments | | |
(Cost $1,186,566) | | 1,186,627 |
Total Investments (100.9%) | | |
(Cost $17,628,769) | | 26,100,576 |
Other Assets and Liabilities (-0.9%) | | |
Other Assets8 | | 218,490 |
Liabilities6 | | (439,542) |
| | | (221,052) |
Net Assets (100%) | | 25,879,524 |
| Amount |
| ($000) |
Statement of Assets and Liabilities | |
Assets | |
Investments in Securities, at Value | |
Unaffiliated Issuers | 25,015,554 |
Affiliated Issuers | 1,085,022 |
Total Investments in Securities | 26,100,576 |
Investment in Vanguard | 1,252 |
Receivables for Investment Securities Sold | 172,484 |
Receivables for Accrued Income | 20,234 |
Receivables for Capital Shares Issued | 7,395 |
Variation Margin Receivable—Futures Contracts | 117 |
Other Assets8 | 17,008 |
Total Assets | 26,319,066 |
Liabilities | |
Payables for Investment Securities Purchased | 70,893 |
Collateral for Securities on Loan | 317,024 |
Payables to Investment Advisor | 9,484 |
Payables for Capital Shares Redeemed | 24,164 |
Payables to Vanguard | 17,633 |
Variation Margin Payable—Futures Contracts | 344 |
Total Liabilities | 439,542 |
Net Assets | 25,879,524 |
| |
| |
At August 31, 2019, net assets consisted of: | |
| Amount |
| ($000) |
Paid-in Capital | 16,566,449 |
Total Distributable Earnings (Loss) | 9,313,075 |
Net Assets | 25,879,524 |
17
U.S. Growth Fund
| Amount |
| ($000) |
Investor Shares—Net Assets | |
Applicable to 214,994,631 outstanding $.001 par value shares of beneficial interest (unlimited authorization) | 8,819,378 |
Net Asset Value Per Share—Investor Shares | $41.02 |
| |
Admiral Shares—Net Assets | |
Applicable to 160,492,189 outstanding $.001 par value shares of beneficial interest (unlimited authorization) | 17,060,146 |
Net Asset Value Per Share—Admiral Shares | $106.30 |
· See Note A in Notes to Financial Statements.
* Non-income-producing security.
^ Includes partial security positions on loan to broker-dealers. The total value of securities on loan is $311,740,000.
§ Security value determined using significant unobservable inputs.
1 The fund invests a portion of its cash reserves in equity markets through the use of index futures contracts. After giving effect to futures investments, the fund’s effective common stock and temporary cash investment positions represent 98.2% and 2.5%, respectively, of net assets.
2 Restricted securities totaling $95,510,000, representing 0.4% of net assets. See Restricted Securities table for additional information.
3 Security exempt from registration under Rule 144A of the Securities Act of 1933. Such securities may be sold in transactions exempt from registration, normally to qualified institutional buyers. At August 31, 2019, the value of this security represented 0.4% of net assets.
4 Considered an affiliated company of the fund as the issuer is another member of The Vanguard Group.
5 Perpetual security with no stated maturity date.
6 Includes $317,024,000 of collateral received for securities on loan.
7 Affiliated money market fund available only to Vanguard funds and certain trusts and accounts managed by Vanguard. Rate shown is the 7-day yield.
8 Securities with a value of $24,102,000 and cash of $30,000 have been segregated as initial margin for open futures contracts.
ADR—American Depositary Receipt.
PP—Private Placement.
18
U.S. Growth Fund
Restricted Securities as of Period End
| | Acquisition |
| Acquisition | Cost |
Security Name | Date | ($000) |
Uber Technologies Inc. | June 20141 | 15,5071 |
WeWork Pfd. D1 PP | December 2014 | 4,336 |
WeWork Pfd. D2 PP | December 2014 | 3,407 |
WeWork Class A PP | December 2014 | 317 |
Pinterest Inc. Class A (Restricted) | March 20151 | 11,4611 |
Airbnb Inc. | June 2015 | 11,928 |
1 Represents pre-initial public offering acquisition date and cost. Fund currently holds the publicly traded shares.
Derivative Financial Instruments Outstanding as of Period End
Futures Contracts | | | | |
| | | | ($000) |
| | | | Value and |
| | Number of | | Unrealized |
| | Long (Short) | Notional | Appreciation |
| Expiration | Contracts | Amount | (Depreciation) |
Long Futures Contracts | | | | |
E-mini S&P 500 Index | September 2019 | 3,446 | 503,943 | 2,675 |
E-mini S&P Mid-Cap 400 Index | September 2019 | 262 | 49,293 | (599) |
| | | | 2,076 |
See accompanying Notes, which are an integral part of the Financial Statements.
19
U.S. Growth Fund
Statement of Operations
| Year Ended |
| August 31, 2019 |
| ($000) |
Investment Income | |
Income | |
Dividends—Unaffiliated Issuers1 | 117,406 |
Dividends—Affiliated Issuers | 240 |
Interest—Unaffiliated Issuers | 2,607 |
Interest—Affiliated Issuers | 12,664 |
Securities Lending—Net | 5,321 |
Total Income | 138,238 |
Expenses | |
Investment Advisory Fees—Note B | |
Basic Fee | 24,436 |
Performance Adjustment | 1,527 |
The Vanguard Group—Note C | |
Management and Administrative—Investor Shares | 13,328 |
Management and Administrative—Admiral Shares | 12,840 |
Marketing and Distribution—Investor Shares | 500 |
Marketing and Distribution—Admiral Shares | 439 |
Custodian Fees | 97 |
Auditing Fees | 34 |
Shareholders’ Reports—Investor Shares | 169 |
Shareholders’ Reports—Admiral Shares | 92 |
Trustees’ Fees and Expenses | 23 |
Total Expenses | 53,485 |
Expenses Paid Indirectly | (240) |
Net Expenses | 53,245 |
Net Investment Income | 84,993 |
Realized Net Gain (Loss) | |
Investment Securities Sold—Unaffiliated Issuers | 1,114,457 |
Investment Securities Sold—Affiliated Issuers | 326 |
Futures Contracts | (17,441) |
Foreign Currencies | (219) |
Realized Net Gain (Loss) | 1,097,123 |
Change in Unrealized Appreciation (Depreciation) | |
Investment Securities—Unaffiliated Issuers | (354,043) |
Investment Securities—Affiliated Issuers | 5,226 |
Futures Contracts | (8,351) |
Foreign Currencies | (74) |
Change in Unrealized Appreciation (Depreciation) | (357,242) |
Net Increase (Decrease) in Net Assets Resulting from Operations | 824,874 |
1 Dividends are net of foreign withholding taxes of $343,000.
See accompanying Notes, which are an integral part of the Financial Statements.
20
U.S. Growth Fund
Statement of Changes in Net Assets
| Year Ended August 31, |
| 2019 | 2018 |
| ($000) | ($000) |
Increase (Decrease) in Net Assets | | |
Operations | | |
Net Investment Income | 84,993 | 37,599 |
Realized Net Gain (Loss) | 1,097,123 | 712,534 |
Change in Unrealized Appreciation (Depreciation) | (357,242) | 1,487,575 |
Net Increase (Decrease) in Net Assets Resulting from Operations | 824,874 | 2,237,708 |
Distributions | | |
Net Investment Income | | |
Investor Shares | (14,003) | (15,531) |
Admiral Shares | (26,012) | (16,499) |
Realized Capital Gain1 | | |
Investor Shares | (328,376) | (180,528) |
Admiral Shares | (451,846) | (192,765) |
Total Distributions | (820,237) | (405,323) |
Capital Share Transactions | | |
Investor Shares | 4,292,730 | (383,169) |
Admiral Shares | 10,751,352 | 1,477,489 |
Net Increase (Decrease) from Capital Share Transactions | 15,044,082 | 1,094,320 |
Total Increase (Decrease) | 15,048,719 | 2,926,705 |
Net Assets | | |
Beginning of Period | 10,830,805 | 7,904,100 |
End of Period | 25,879,524 | 10,830,805 |
1 Includes fiscal 2019 and 2018 short-term gain distributions totaling $87,222,000 and $24,991,000, respectively. Short-term gain distributions are treated as ordinary income dividends for tax purposes.
See accompanying Notes, which are an integral part of the Financial Statements.
21
U.S. Growth Fund
Financial Highlights
Investor Shares
For a Share Outstanding | | Year Ended August 31, | |
Throughout Each Period | | 2019 | | 2018 | | 2017 | | 2016 | | 2015 | |
Net Asset Value, Beginning of Period | | $43.31 | | $35.62 | | $30.32 | | $30.89 | | $31.03 | |
Investment Operations | | | | | | | | | | | |
Net Investment Income | | .176 | 1 | .134 | 1 | .151 | 1 | .151 | | .169 | |
Net Realized and Unrealized Gain (Loss) on Investments | | .771 | | 9.394 | | 5.590 | | 1.944 | | 2.168 | |
Total from Investment Operations | | .947 | | 9.528 | | 5.741 | | 2.095 | | 2.337 | |
Distributions | | | | | | | | | | | |
Dividends from Net Investment Income | | (.132 | ) | (.146 | ) | (.121 | ) | (.147 | ) | (.194 | ) |
Distributions from Realized Capital Gains | | (3.105 | ) | (1.692 | ) | (.320 | ) | (2.518 | ) | (2.283 | ) |
Total Distributions | | (3.237 | ) | (1.838 | ) | (.441 | ) | (2.665 | ) | (2.477 | ) |
Net Asset Value, End of Period | | $41.02 | | $43.31 | | $35.62 | | $30.32 | | $30.89 | |
| | | | | | | | | | | |
Total Return2 | | 3.70% | | 27.64% | | 19.24% | | 6.89% | | 7.96% | |
| | | | | | | | | | | |
Ratios/Supplemental Data | | | | | | | | | | | |
Net Assets, End of Period (Millions) | | $8,819 | | $4,582 | | $4,113 | | $3,794 | | $3,975 | |
Ratio of Total Expenses to Average Net Assets3 | | 0.39% | | 0.42% | | 0.43% | | 0.46% | | 0.47% | |
Ratio of Net Investment Income to Average Net Assets | | 0.44% | | 0.35% | | 0.47% | | 0.50% | | 0.53% | |
Portfolio Turnover Rate | | 41% | | 33% | | 27% | | 32% | | 38% | |
1 Calculated based on average shares outstanding.
2 Total returns do not include account service fees that may have applied in the periods shown. Fund prospectuses provide information about any applicable account service fees.
3 Includes performance-based investment advisory fee increases (decreases) of 0.01%, 0.01%, (0.01%), 0.02%, and 0.03%.
See accompanying Notes, which are an integral part of the Financial Statements.
22
U.S. Growth Fund
Financial Highlights
Admiral Shares
For a Share Outstanding | | Year Ended August 31, | |
Throughout Each Period | | 2019 | | 2018 | | 2017 | | 2016 | | 2015 | |
Net Asset Value, Beginning of Period | | $112.28 | | $92.24 | | $78.52 | | $80.01 | | $80.37 | |
Investment Operations | | | | | | | | | | | |
Net Investment Income | | .572 | 1 | .476 | 1 | .502 | 1 | .506 | | .563 | |
Net Realized and Unrealized Gain (Loss) on Investments | | 1.963 | | 24.323 | | 14.480 | | 5.018 | | 5.607 | |
Total from Investment Operations | | 2.535 | | 24.799 | | 14.982 | | 5.524 | | 6.170 | |
Distributions | | | | | | | | | | | |
Dividends from Net Investment Income | | (.464 | ) | (.375 | ) | (.433 | ) | (.499 | ) | (.623 | ) |
Distributions from Realized Capital Gains | | (8.051 | ) | (4.384 | ) | (.829 | ) | (6.515 | ) | (5.907 | ) |
Total Distributions | | (8.515 | ) | (4.759 | ) | (1.262 | ) | (7.014 | ) | (6.530 | ) |
Net Asset Value, End of Period | | $106.30 | | $112.28 | | $92.24 | | $78.52 | | $80.01 | |
| | | | | | | | | | | |
Total Return2 | | 3.80% | | 27.78% | | 19.42% | | 7.03% | | 8.12% | |
| | | | | | | | | | | |
Ratios/Supplemental Data | | | | | | | | | | | |
Net Assets, End of Period (Millions) | | $17,060 | | $6,249 | | $3,791 | | $3,066 | | $2,421 | |
Ratio of Total Expenses to Average Net Assets3 | | 0.28% | | 0.30% | | 0.30% | | 0.32% | | 0.33% | |
Ratio of Net Investment Income to Average Net Assets | | 0.55% | | 0.47% | | 0.60% | | 0.64% | | 0.67% | |
Portfolio Turnover Rate | | 41% | | 33% | | 27% | | 32% | | 38% | |
1 Calculated based on average shares outstanding.
2 Total returns do not include account service fees that may have applied in the periods shown. Fund prospectuses provide information about any applicable account service fees.
3 Includes performance-based investment advisory fee increases (decreases) of 0.01%, 0.01%, (0.01%), 0.02%, and 0.03%.
See accompanying Notes, which are an integral part of the Financial Statements.
23
U.S. Growth Fund
Notes to Financial Statements
Vanguard U.S. Growth Fund is registered under the Investment Company Act of 1940 as an open-end investment company, or mutual fund. The fund offers two classes of shares: Investor Shares and Admiral Shares. Each of the share classes has different eligibility and minimum purchase requirements, and is designed for different types of investors.
A. The following significant accounting policies conform to generally accepted accounting principles for U.S. investment companies. The fund consistently follows such policies in preparing its financial statements.
1. Security Valuation: Securities are valued as of the close of trading on the New York Stock Exchange (generally 4 p.m., Eastern time) on the valuation date. Equity securities are valued at the latest quoted sales prices or official closing prices taken from the primary market in which each security trades; such securities not traded on the valuation date are valued at the mean of the latest quoted bid and asked prices. Securities for which market quotations are not readily available, or whose values have been affected by events occurring before the fund’s pricing time but after the close of the securities’ primary markets, are valued at their fair values calculated according to procedures adopted by the board of trustees. These procedures include obtaining quotations from an independent pricing service, monitoring news to identify significant market- or security-specific events, and evaluating changes in the values of foreign market proxies (for example, ADRs, futures contracts, or exchange-traded funds), between the time the foreign markets close and the fund’s pricing time. When fair-value pricing is employed, the prices of securities used by a fund to calculate its net asset value may differ from quoted or published prices for the same securities. Investments in Vanguard Market Liquidity Fund are valued at that fund’s net asset value. Temporary cash investments are valued using the latest bid prices or using valuations based on a matrix system (which considers such factors as security prices, yields, maturities, and ratings), both as furnished by independent pricing services.
2. Foreign Currency: Securities and other assets and liabilities denominated in foreign currencies are translated into U.S. dollars using exchange rates obtained from an independent third party as of the fund’s pricing time on the valuation date. Realized gains (losses) and unrealized appreciation (depreciation) on investment securities include the effects of changes in exchange rates since the securities were purchased, combined with the effects of changes in security prices. Fluctuations in the value of other assets and liabilities resulting from changes in exchange rates are recorded as unrealized foreign currency gains (losses) until the assets or liabilities are settled in cash, at which time they are recorded as realized foreign currency gains (losses).
3. Futures Contracts: The fund uses index futures contracts to a limited extent, with the objective of maintaining full exposure to the stock market while maintaining liquidity. The fund may purchase or sell futures contracts to achieve a desired level of investment, whether to accommodate portfolio turnover or cash flows from capital share transactions. The primary risks associated with the use of futures contracts are imperfect correlation between changes in market values of stocks held by the fund and the prices of futures contracts, and the possibility of an illiquid market. Counterparty risk involving futures is mitigated because a regulated clearinghouse is the counterparty instead of the clearing broker. To further mitigate counterparty risk, the fund trades futures contracts on an exchange, monitors the financial strength of its clearing brokers and clearinghouse, and has entered into clearing agreements with its clearing brokers. The clearinghouse imposes initial margin requirements to secure the fund’s performance and requires daily settlement of variation margin representing changes in the market value of each contract. Any assets pledged as initial margin for open contracts are noted in the Statement of Net Assets.
24
U.S. Growth Fund
Futures contracts are valued at their quoted daily settlement prices. The notional amounts of the contracts are not recorded in the Statement of Net Assets. Fluctuations in the value of the contracts are recorded in the Statement of Assets and Liabilities as an asset (liability) and in the Statement of Operations as unrealized appreciation (depreciation) until the contracts are closed, when they are recorded as realized futures gains (losses).
During the year ended August 31, 2019, the fund’s average investments in long and short futures contracts represented 3% and 0% of net assets, respectively, based on the average of the notional amounts at each quarter-end during the period.
4. Repurchase Agreements: The fund enters into repurchase agreements with institutional counterparties. Securities pledged as collateral to the fund under repurchase agreements are held by a custodian bank until the agreements mature, and in the absence of a default, such collateral cannot be repledged, resold, or rehypothecated. Each agreement requires that the market value of the collateral be sufficient to cover payments of interest and principal. The fund further mitigates its counterparty risk by entering into repurchase agreements only with a diverse group of prequalified counterparties, monitoring their financial strength, and entering into master repurchase agreements with its counterparties. The master repurchase agreements provide that, in the event of a counterparty’s default (including bankruptcy), the fund may terminate any repurchase agreements with that counterparty, determine the net amount owed, and sell or retain the collateral up to the net amount owed to the fund. Such action may be subject to legal proceedings, which may delay or limit the disposition of collateral.
5. Federal Income Taxes: The fund intends to continue to qualify as a regulated investment company and distribute all of its taxable income. Management has analyzed the fund’s tax positions taken for all open federal income tax years (August 31, 2016–2019), and has concluded that no provision for federal income tax is required in the fund’s financial statements.
6. Distributions: Distributions to shareholders are recorded on the ex-dividend date. Distributions are determined on a tax basis and may differ from net investment income and realized capital gains for financial reporting purposes.
7. Securities Lending: To earn additional income, the fund lends its securities to qualified institutional borrowers. Security loans are subject to termination by the fund at any time, and are required to be secured at all times by collateral in an amount at least equal to the market value of securities loaned. Daily market fluctuations could cause the value of loaned securities to be more or less than the value of the collateral received. When this occurs, the collateral is adjusted and settled before the opening of the market on the next business day. The fund further mitigates its counterparty risk by entering into securities lending transactions only with a diverse group of prequalified counterparties, monitoring their financial strength, and entering into master securities lending agreements with its counterparties. The master securities lending agreements provide that, in the event of a counterparty’s default (including bankruptcy), the fund may terminate any loans with that borrower, determine the net amount owed, and sell or retain the collateral up to the net amount owed to the fund; however, such actions may be subject to legal proceedings. While collateral mitigates counterparty risk, in the event of a default, the fund may experience delays and costs in recovering the securities loaned. The fund invests cash collateral received in Vanguard Market Liquidity Fund, and records a liability in the Statement of Assets and Liabilities for the return of the collateral, during the period the securities are on loan. Securities lending income represents fees charged to borrowers plus income earned on invested cash collateral, less expenses associated with the loan. During the term of the loan, the fund is entitled to all distributions made on or in respect of the loaned securities.
25
U.S. Growth Fund
8. Credit Facility: The fund and certain other funds managed by The Vanguard Group (“Vanguard”) participate in a $4.3 billion committed credit facility provided by a syndicate of lenders pursuant to a credit agreement that may be renewed annually; each fund is individually liable for its borrowings, if any, under the credit facility. Borrowings may be utilized for temporary and emergency purposes, and are subject to the fund’s regulatory and contractual borrowing restrictions. The participating funds are charged administrative fees and an annual commitment fee of 0.10% of the undrawn amount of the facility; these fees are allocated to the funds based on a method approved by the fund’s board of trustees and included in Management and Administrative expenses on the fund’s Statement of Operations. Any borrowings under this facility bear interest at a rate based upon the higher of the one-month London Interbank Offered Rate, federal funds effective rate, or overnight bank funding rate plus an agreed-upon spread.
The fund had no borrowings outstanding at August 31, 2019, or at any time during the period then ended.
9. Other: Dividend income is recorded on the ex-dividend date. Interest income includes income distributions received from Vanguard Market Liquidity Fund and is accrued daily. Premiums and discounts on debt securities purchased are amortized and accreted, respectively, to interest income over the lives of the respective securities. Security transactions are accounted for on the date securities are bought or sold. Costs used to determine realized gains (losses) on the sale of investment securities are those of the specific securities sold.
Each class of shares has equal rights as to assets and earnings, except that each class separately bears certain class-specific expenses related to maintenance of shareholder accounts (included in Management and Administrative expenses) and shareholder reporting. Marketing and distribution expenses are allocated to each class of shares based on a method approved by the board of trustees. Income, other non-class-specific expenses, and gains and losses on investments are allocated to each class of shares based on its relative net assets.
B. The investment advisory firms Wellington Management Company LLP, Jennison Associates LLC, Jackson Square Partners, LLC, and Baillie Gifford Overseas Ltd. each provide investment advisory services to a portion of the fund for a fee calculated at an annual percentage rate of average net assets managed by the advisor. The basic fees of Wellington Management Company LLP, Jennison Associates LLC, and Jackson Square Partners, LLC, are subject to quarterly adjustments based on performance relative to the Russell 1000 Growth Index for the preceding three years. The basic fee of Baillie Gifford Overseas Ltd. is subject to quarterly adjustments based on performance relative to the S&P 500 Index for the preceding three years. Until November 2018, a portion of the fund was managed by William Blair Investment Management, LLC. The basic fee paid to William Blair Investment Management, LLC, was subject to quarterly adjustments based on performance relative to the Russell 1000 Growth Index for the preceding five years.
Beginning April 2019, Vanguard provides investment advisory services to a portion of the fund as described below; the fund paid Vanguard advisory fees of $191,000 for the year ended August 31, 2019.
For the year ended August 31, 2019, the aggregate investment advisory fee paid to all advisors represented an effective annual basic rate of 0.15% of the fund’s average net assets, before a net increase of $1,527,000 (0.01%) based on performance.
26
U.S. Growth Fund
C. In accordance with the terms of a Funds’ Service Agreement (the “FSA”) between Vanguard and the fund, Vanguard furnishes to the fund investment advisory, corporate management, administrative, marketing, and distribution services at Vanguard’s cost of operations (as defined by the FSA). These costs of operations are allocated to the fund based on methods and guidelines approved by the board of trustees. Vanguard does not require reimbursement in the current period for certain costs of operations (such as deferred compensation/benefits and risk/insurance costs); the fund’s liability for these costs of operations is included in Payables to Vanguard on the Statement of Assets and Liabilities. All other costs of operations payable to Vanguard are generally settled twice a month.
Upon the request of Vanguard, the fund may invest up to 0.40% of its net assets as capital in Vanguard. At August 31, 2019, the fund had contributed to Vanguard capital in the amount of $1,252,000, representing less than 0.01% of the fund’s net assets and 0.50% of Vanguard’s capital received pursuant to the FSA. The fund’s trustees and officers are also directors and employees, respectively, of Vanguard.
D. The fund has asked its investment advisors to direct certain security trades, subject to obtaining the best price and execution, to brokers who have agreed to rebate to the fund part of the commissions generated. Such rebates are used solely to reduce the fund’s management and administrative expenses. The fund’s custodian bank has also agreed to reduce its fees when the fund maintains cash on deposit in the non-interest-bearing custody account. For the year ended August 31, 2019, these arrangements reduced the fund’s management and administrative expenses by $237,000 and custodian fees by $3,000. The total expense reduction represented an effective annual rate of 0.00% of the fund’s average net assets.
E. Various inputs may be used to determine the value of the fund’s investments. These inputs are summarized in three broad levels for financial statement purposes. The inputs or methodologies used to value securities are not necessarily an indication of the risk associated with investing in those securities.
Level 1—Quoted prices in active markets for identical securities.
Level 2—Other significant observable inputs (including quoted prices for similar securities, interest rates, prepayment speeds, credit risk, etc.).
Level 3—Significant unobservable inputs (including the fund’s own assumptions used to determine the fair value of investments). Any investments valued with significant unobservable inputs are noted on the Statement of Net Assets.
The following table summarizes the market value of the fund’s investments and derivatives as of August 31, 2019, based on the inputs used to value them:
| Level 1 | Level 2 | Level 3 |
Investments | ($000) | ($000) | ($000) |
Common Stocks | 24,143,125 | 721,100 | 1,295 |
Preferred Stocks | — | — | 48,429 |
Temporary Cash Investments | 989,536 | 197,091 | — |
Futures Contracts—Assets1 | 117 | — | — |
Futures Contracts—Liabilities1 | (344) | — | — |
Total | 25,132,434 | 918,191 | 49,724 |
1 Represents variation margin on the last day of the reporting period.
27
U.S. Growth Fund
F. Permanent differences between book-basis and tax-basis components of net assets are reclassified among capital accounts in the financial statements to reflect their tax character. These reclassifications have no effect on net assets or net asset value per share. As of period end, permanent differences primarily attributable to the accounting for foreign currency transactions, distributions in connection with fund share redemptions and merger-related adjustments were reclassified between the following accounts:
| Amount |
| ($000) |
Paid-in Capital | 108,565 |
Total Distributable Earnings (Loss) | (108,565) |
Temporary differences between book-basis and tax-basis components of total distributable earnings (loss) arise when certain items of income, gain, or loss are recognized in different periods for financial statement and tax purposes; these differences will reverse at some time in the future. The differences are primarily related to the tax deferral on wash sales and the realization of unrealized gains or losses on certain futures contracts. As of period end, the tax-basis components of total distributable earnings (loss) are detailed in the table as follows:
| Amount |
| ($000) |
Undistributed Ordinary Income | 110,828 |
Undistributed Long-Term Gains | 751,540 |
Capital Loss Carryforwards (Non-expiring) | — |
Net Unrealized Gains (Losses) | 8,466,304 |
As of August 31, 2019, gross unrealized appreciation and depreciation for investments and derivatives based on cost for U.S. federal income tax purposes were as follows:
| Amount |
| ($000) |
Tax Cost | 17,634,199 |
Gross Unrealized Appreciation | 9,188,840 |
Gross Unrealized Depreciation | (722,462) |
Net Unrealized Appreciation (Depreciation) | 8,466,378 |
G. During the year ended August 31, 2019, the fund purchased $6,489,437,000 of investment securities and sold $6,924,016,000 of investment securities, other than temporary cash investments.
28
U.S. Growth Fund
H. Capital share transactions for each class of shares were:
| Year Ended August 31, |
| 2019 | | 2018 |
| Amount | Shares | | Amount | Shares |
| ($000) | (000) | | ($000) | (000) |
Investor Shares | | | | | |
Issued | 975,070 | 24,941 | | 885,293 | 22,516 |
Issued in Connection with Acquisition of Vanguard Morgan Growth Fund | 4,276,013 | 107,224 | | — | — |
Issued in Lieu of Cash Distributions | 333,194 | 9,768 | | 192,107 | 5,198 |
Redeemed | (1,291,547) | (32,733) | | (1,460,569) | (37,385) |
Net Increase (Decrease)—Investor Shares | 4,292,730 | 109,200 | | (383,169) | (9,671) |
Admiral Shares | | | | | |
Issued | 2,236,862 | 21,975 | | 2,260,647 | 22,186 |
Issued in Connection with Acquisition of Vanguard Morgan Growth Fund | 10,459,067 | 101,244 | | — | — |
Issued in Lieu of Cash Distributions | 449,504 | 5,088 | | 199,346 | 2,082 |
Redeemed | (2,394,081) | (23,467) | | (982,504) | (9,715) |
Net Increase (Decrease)—Admiral Shares | 10,751,352 | 104,840 | | 1,477,489 | 14,553 |
I. On April 5, 2019, the fund acquired all of the net assets of Vanguard Morgan Growth Fund pursuant to a plan of reorganization approved by the funds’ board of trustees in November 2018. The purpose of the transaction was to combine two funds with comparable investment objectives. The acquisition was accomplished by a tax-free exchange of 208 million shares of the fund for 275 million shares of Vanguard Morgan Growth Fund. Each class of shares for Vanguard Morgan Growth Fund was exchanged for the like share class of the fund. The fund’s net assets of $11.4 billion were combined with Vanguard Morgan Growth Fund’s net assets of $14.7 billion, including $4.5 billion of unrealized appreciation, resulting in combined net assets of $26.1 billion.
Assuming that the acquisition had been completed on September 1, 2018, the beginning of the fund’s reporting period, the fund’s pro forma results of operations for the year ended August 31, 2019, would be:
| ($000) |
Net Investment Income | 140,696 |
Realized Net Gain (Loss) | 2,794,376 |
Change in Unrealized Appreciation (Depreciation) | (2,051,846) |
Net Increase (Decrease) in Net Assets Resulting from Operations | 883,226 |
Because the combined funds have been managed as a single integrated fund since the acquisition was completed, it is not practical to separate the results of operations of Vanguard Morgan Growth Fund that have been included in the fund’s Statement of Operations since April 5, 2019.
29
U.S. Growth Fund
J. Transactions during the period in investments where the issuer is another member of The Vanguard Group were as follows:
| | Current Period Transactions | |
| Aug. 31, | | Proceeds | Realized | | | | Aug. 31, |
| 2018 | | from | Net | Change in | | Capital Gain | 2019 |
| Market | Purchases | Securities | Gain | Unrealized | | Distributions | Market |
| Value | at Cost | Sold | (Loss) | App. (Dep.) | Income | Received | Value |
| ($000) | ($000) | ($000) | ($000) | ($000) | ($000) | ($000) | ($000) |
Vanguard Growth ETF | 498 | 89,878 | 465 | 309 | 5,266 | 240 | — | 95,486 |
Vanguard Market Liquidity Fund | 379,919 | NA1 | NA1 | 17 | (40) | 12,664 | — | 989,536 |
Total | 380,417 | | | 326 | 5,226 | 12,904 | — | 1,085,022 |
1 Not applicable—purchases and sales are for temporary cash investment purposes.
K. Management has determined that no events or transactions occurred subsequent to August 31, 2019, that would require recognition or disclosure in these financial statements.
30
Report of Independent Registered Public Accounting Firm
To the Board of Trustees of Vanguard World Fund and Shareholders of Vanguard U.S. Growth Fund
Opinion on the Financial Statements
We have audited the accompanying statement of net assets and statement of assets and liabilities of Vanguard U.S. Growth Fund (one of the funds constituting Vanguard World Fund, referred to hereafter as the “Fund”) as of August 31, 2019, the related statement of operations for the year ended August 31, 2019, the statement of changes in net assets for each of the two years in the period ended August 31, 2019, including the related notes, and the financial highlights for each of the five years in the period ended August 31, 2019 (collectively referred to as the “financial statements”). In our opinion, the financial statements present fairly, in all material respects, the financial position of the Fund as of August 31, 2019, the results of its operations for the year then ended, the changes in its net assets for each of the two years in the period ended August 31, 2019 and the financial highlights for each of the five years in the period ended August 31, 2019 in conformity with accounting principles generally accepted in the United States of America.
Basis for Opinion
These financial statements are the responsibility of the Fund’s management. Our responsibility is to express an opinion on the Fund’s financial statements based on our audits. We are a public accounting firm registered with the Public Company Accounting Oversight Board (United States) (“PCAOB”) and are required to be independent with respect to the Fund in accordance with the U.S. federal securities laws and the applicable rules and regulations of the Securities and Exchange Commission and the PCAOB.
We conducted our audits of these financial statements in accordance with the standards of the PCAOB. Those standards require that we plan and perform the audit to obtain reasonable assurance about whether the financial statements are free of material misstatement, whether due to error or fraud.
Our audits included performing procedures to assess the risks of material misstatement of the financial statements, whether due to error or fraud, and performing procedures that respond to those risks. Such procedures included examining, on a test basis, evidence regarding the amounts and disclosures in the financial statements. Our audits also included evaluating the accounting principles used and significant estimates made by management, as well as evaluating the overall presentation of the financial statements. Our procedures included confirmation of securities owned as of August 31, 2019 by correspondence with the custodians and brokers and by agreement to the underlying ownership records of the transfer agent; when replies were not received from brokers, we performed other auditing procedures. We believe that our audits provide a reasonable basis for our opinion.
/s/PricewaterhouseCoopers LLP
Philadelphia, Pennsylvania
October 18, 2019
We have served as the auditor of one or more investment companies in The Vanguard Group of Funds since 1975.
31
Special 2019 tax information (unaudited) for Vanguard U.S. Growth Fund
This information for the fiscal year ended August 31, 2019, is included pursuant to provisions of the Internal Revenue Code.
The fund distributed $780,006,000 as capital gain dividends (20% rate gain distributions) to shareholders during the fiscal year.
For nonresident alien shareholders, 100% of short-term capital gain dividends distributed by the fund are qualified short-term capital gains.
The fund distributed $57,450,000 of qualified dividend income to shareholders during the fiscal year.
For corporate shareholders, 75.6% of investment income (dividend income plus short-term gains, if any) qualifies for the dividends-received deduction.
32
This page intentionally left blank.
This page intentionally left blank.
The People Who Govern Your Fund
The trustees of your mutual fund are there to see that the fund is operated and managed in your best interests since, as a shareholder, you are a part owner of the fund. Your fund’s trustees also serve on the board of directors of The Vanguard Group, Inc., which is owned by the Vanguard funds and provides services to them.
A majority of Vanguard’s board members are independent, meaning that they have no affiliation with Vanguard or the funds they oversee, apart from the sizable personal investments they have made as private individuals. The independent board members have distinguished backgrounds in business, academia, and public service. Each of the trustees and executive officers oversees 212 Vanguard funds.
Information for each trustee and executive officer of the fund appears below. The mailing address of the trustees and officers is P.O. Box 876, Valley Forge, PA 19482. More information about the trustees is in the Statement of Additional Information, which can be obtained, without charge, by contacting Vanguard at 800-662-7447, or online at vanguard.com.
Interested Trustee1
Mortimer J. Buckley
Born in 1969. Trustee since January 2018. Principal occupation(s) during the past five years and other experience: chairman of the board (January 2019– present) of Vanguard and of each of the investment companies served by Vanguard; chief executive officer (January 2018–present) of Vanguard; chief executive officer, president, and trustee (January 2018–present) of each of the investment companies served by Vanguard; president and director (2017–present) of Vanguard; and president (February 2018–present) of Vanguard Marketing Corporation. Chief investment officer (2013–2017), managing director (2002–2017), head of the Retail Investor Group (2006–2012), and chief information officer (2001–2006) of Vanguard. Chairman of the board (2011–2017) and trustee (2009–2017) of the Children’s Hospital of Philadelphia; trustee (2018–present) of The Shipley School.
Independent Trustees
Emerson U. Fullwood
Born in 1948. Trustee since January 2008. Principal occupation(s) during the past five years and other experience: executive chief staff and marketing officer for North America and corporate vice president (retired 2008) of Xerox Corporation (document management products and services). Former president of the Worldwide Channels Group, Latin America, and Worldwide Customer Service and executive chief staff officer of Developing Markets of Xerox. Executive in residence and 2009–2010 Distinguished Minett Professor at the Rochester Institute of Technology. Director of SPX FLOW, Inc. (multi-industry manufacturing). Director of the University of Rochester Medical Center, the Monroe Community College Foundation, the United Way of Rochester, North Carolina A&T University, and Roberts Wesleyan College. Trustee of the University of Rochester.
Amy Gutmann
Born in 1949. Trustee since June 2006. Principal occupation(s) during the past five years and other experience: president (2004–present) of the University of Pennsylvania. Christopher H. Browne Distinguished Professor of Political Science, School of Arts and Sciences, and professor of communication, Annenberg School for Communication, with secondary faculty appointments in the Department of Philosophy, School of Arts and Sciences, and at the Graduate School of Education, University of Pennsylvania. Trustee of the National Constitution Center.
F. Joseph Loughrey
Born in 1949. Trustee since October 2009. Principal occupation(s) during the past five years and other experience: president and chief operating officer (retired 2009) and vice chairman of the board (2008–2009) of Cummins Inc. (industrial machinery). Chairman of the board of Hillenbrand, Inc. (specialized consumer services), and the Lumina Foundation.
1 Mr. Buckley is considered an “interested person,” as defined in the Investment Company Act of 1940, because he is an officer of the Vanguard funds.
Director of the V Foundation and Oxfam America. Member of the advisory council for the College of Arts and Letters and chair of the advisory board to the Kellogg Institute for International Studies, both at the University of Notre Dame.
Mark Loughridge
Born in 1953. Trustee since March 2012. Principal occupation(s) during the past five years and other experience: senior vice president and chief financial officer (retired 2013) of IBM (information technology services). Fiduciary member of IBM’s Retirement Plan Committee (2004–2013), senior vice president and general manager (2002–2004) of IBM Global Financing, vice president and controller (1998–2002) of IBM, and a variety of other prior management roles at IBM. Member of the Council on Chicago Booth.
Scott C. Malpass
Born in 1962. Trustee since March 2012. Principal occupation(s) during the past five years and other experience: chief investment officer (1989–present) and vice president (1996–present) of the University of Notre Dame. Assistant professor of finance at the Mendoza College of Business, University of Notre Dame, and member of the Notre Dame 403(b) Investment Committee. Chairman of the board of TIFF Advisory Services, Inc. Member of the board of Catholic Investment Services, Inc. (investment advisors) and the board of superintendence of the Institute for the Works of Religion.
Deanna Mulligan
Born in 1963. Trustee since January 2018. Principal occupation(s) during the past five years and other experience: president (2010–present) and chief executive officer (2011–present) of The Guardian Life Insurance Company of America. Chief operating officer (2010–2011) and executive vice president (2008–2010) of Individual Life and Disability of The Guardian Life Insurance Company of America. Member of the board of The Guardian Life Insurance Company of America, the American Council of Life Insurers, the Partnership for New York City (business leadership), and the Committee Encouraging Corporate Philanthropy. Trustee of the Economic Club of New York and the Bruce Museum (arts and science). Member of the Advisory Council for the Stanford Graduate School of Business.
André F. Perold
Born in 1952. Trustee since December 2004. Principal occupation(s) during the past five years and other experience: George Gund Professor of Finance and Banking, Emeritus at the Harvard Business School (retired 2011). Chief investment officer and co-managing partner of HighVista Strategies LLC (private investment firm). Board of advisors and investment committee member of the Museum of Fine Arts Boston. Board member (2018–present) of RIT Capital Partners (investment firm); investment committee member of Partners Health Care System.
Sarah Bloom Raskin
Born in 1961. Trustee since January 2018. Principal occupation(s) during the past five years and other experience: deputy secretary (2014–2017) of the United States Department of the Treasury. Governor (2010–2014) of the Federal Reserve Board. Commissioner (2007–2010) of financial regulation for the State of Maryland. Member of the board of directors (2012–2014) of Neighborhood Reinvestment Corporation. Director (2017–present) of i(x) Investments, LLC; director (2017–present) of Reserve Trust. Rubinstein Fellow (2017–present) of Duke University; trustee (2017–present) of Amherst College.
Peter F. Volanakis
Born in 1955. Trustee since July 2009. Principal occupation(s) during the past five years and other experience: president and chief operating officer (retired 2010) of Corning Incorporated (communications equipment) and director of Corning Incorporated (2000–2010) and Dow Corning (2001–2010). Director (2012) of SPX Corporation (multi-industry manufacturing). Overseer of the Amos Tuck School of Business Administration, Dartmouth College (2001–2013). Chairman of the board of trustees of Colby-Sawyer College. Member of the board of Hypertherm Inc. (industrial cutting systems, software, and consumables).
Executive Officers
Glenn Booraem
Born in 1967. Principal occupation(s) during the past five years and other experience: principal of Vanguard. Investment stewardship officer (2017–present), treasurer (2015–2017), controller (2010–2015), and assistant controller (2001–2010) of each of the investment companies served by Vanguard.
Christine M. Buchanan
Born in 1970. Principal occupation(s) during the past five years and other experience: principal of Vanguard and global head of Fund Administration at Vanguard. Treasurer (2017–present) of each of the investment companies served by Vanguard. Partner (2005–2017) at KPMG LLP (audit, tax, and advisory services).
Thomas J. Higgins
Born in 1957. Principal occupation(s) during the past five years and other experience: principal of Vanguard. Chief financial officer (2008–present) and treasurer (1998–2008) of each of the investment companies served by Vanguard.
Peter Mahoney
Born in 1974. Principal occupation(s) during the past five years and other experience: principal of Vanguard. Controller (2015–present) of each of the investment companies served by Vanguard. Head of International Fund Services (2008–2014) at Vanguard.
Anne E. Robinson
Born in 1970. Principal occupation(s) during the past five years and other experience: general counsel (2016–present) of Vanguard. Secretary (2016–present) of Vanguard and of each of the investment companies served by Vanguard. Managing director (2016–present) of Vanguard. Director and senior vice president (2016–2018) of Vanguard Marketing Corporation. Managing director and general counsel of Global Cards and Consumer Services (2014–2016) at Citigroup. Counsel (2003–2014) at American Express.
Michael Rollings
Born in 1963. Principal occupation(s) during the past five years and other experience: finance director (2017–present) and treasurer (2017) of each of the investment companies served by Vanguard. Managing director (2016–present) of Vanguard. Chief financial officer (2016–present) of Vanguard. Director (2016–present) of Vanguard Marketing Corporation. Executive vice president and chief financial officer (2006–2016) of MassMutual Financial Group.
John E. Schadl
Born in 1972. Principal occupation(s) during the past five years and other experience: principal of Vanguard. Chief compliance officer (2019–present) of Vanguard and of each of the investment companies served by Vanguard. Assistant vice president (May 2019–present) of Vanguard Marketing Corporation.
Vanguard Senior Management Team
Joseph Brennan | Chris D. McIsaac |
Mortimer J. Buckley | James M. Norris |
Gregory Davis | Thomas M. Rampulla |
John James | Karin A. Risi |
Martha G. King | Anne E. Robinson |
John T. Marcante | Michael Rollings |
| 
|
| |
| P.O. Box 2600 |
| Valley Forge, PA 19482-2600 |
Connect with Vanguard® > vanguard.com
Fund Information > 800-662-7447
Direct Investor Account Services > 800-662-2739
Institutional Investor Services > 800-523-1036
Text Telephone for People
Who Are Deaf or Hard of Hearing > 800-749-7273
This material may be used in conjunction with the offering of shares of any Vanguard fund only if preceded or accompanied by the fund’s current prospectus.
All comparative mutual fund data are from Morningstar, Inc., unless otherwise noted.
You can obtain a free copy of Vanguard’s proxy voting guidelines by visiting vanguard.com/proxyreporting or by calling Vanguard at 800-662-2739. The guidelines are also available from the SEC’s website, www.sec.gov. In addition, you may obtain a free report on how your fund voted the proxies for securities it owned during the 12 months ended June 30. To get the report, visit either vanguard.com/proxyreporting or www.sec.gov.
You can review information about your fund on the SEC’s website, and you can receive copies of this information, for a fee, by sending a request via email addressed to publicinfo@sec.gov.
Source for Bloomberg Barclays indexes: Bloomberg Index Services Limited. Copyright 2019, Bloomberg. All rights reserved.
CFA® is a registered trademark owned by CFA Institute.
| © 2019 The Vanguard Group, Inc. |
| All rights reserved. |
| Vanguard Marketing Corporation, Distributor. |
| |
| Q230 102019 |

Annual Report | August 31, 2019 Vanguard International Growth Fund |
See the inside front cover for important information about access to your fund’s annual and semiannual shareholder reports. |
Important information about access to shareholder reports
Beginning on January 1, 2021, as permitted by regulations adopted by the Securities and Exchange Commission, paper copies of your fund’s annual and semiannual shareholder reports will no longer be sent to you by mail, unless you specifically request them. Instead, you will be notified by mail each time a report is posted on the website and will be provided with a link to access the report.
If you have already elected to receive shareholder reports electronically, you will not be affected by this change and do not need to take any action. You may elect to receive shareholder reports and other communications from the fund electronically by contacting your financial intermediary (such as a broker-dealer or bank) or, if you invest directly with the fund, by calling Vanguard at one of the phone numbers on the back cover of this report or by logging on to vanguard.com.
You may elect to receive paper copies of all future shareholder reports free of charge. If you invest through a financial intermediary, you can contact the intermediary to request that you continue to receive paper copies. If you invest directly with the fund, you can call Vanguard at one of the phone numbers on the back cover of this report or log on to vanguard.com. Your election to receive paper copies will apply to all the funds you hold through an intermediary or directly with Vanguard.
A Note From Our Chairman | 1 |
Your Fund’s Performance at a Glance | 2 |
Advisors’ Report | 3 |
About Your Fund’s Expenses | 7 |
Performance Summary | 9 |
Financial Statements | 11 |
Please note: The opinions expressed in this report are just that—informed opinions. They should not be considered promises or advice. Also, please keep in mind that the information and opinions cover the period through the date on the front of this report. Of course, the risks of investing in your fund are spelled out in the prospectus.
A Note From Our Chairman

Tim Buckley
Chairman and Chief Executive Officer
Dear Shareholder,
Recent volatility in financial markets— affecting stocks, bonds, and commodities— has been a good reminder of the wise old adage, “Never keep all your eggs in one basket.” Maintaining balance and diversification in your investment portfolio can help to both limit risk and set you up for long-term success.
It’s understandable why some investors might become complacent after a long market run-up like the one that lifted stock prices, especially U.S. stock prices, in the years following the global financial crisis. But failing to rebalance regularly can leave a portfolio with a much different mix of assets than intended and, often, more risk than intended.
Balance across and diversification within asset classes are powerful tools for managing risk and achieving your investment goals. A portfolio’s allocation will determine a large portion of its long-term return and also the majority of its volatility risk. A well-diversified portfolio is less vulnerable to significant swings in the performance of any one segment of the asset classes in which it invests.
Balance and diversification will never eliminate the risk of loss, nor will they guarantee positive returns in a declining market. But they should reduce the chance that you’ll suffer disproportionate losses in one particular high-flying asset class or sector when it comes back to earth. And exposure to all key market components should give you at least some participation in the sectors that are performing best at any given time.
Vanguard is committed to helping you achieve balance and diversification in your portfolios to help meet your investment goals. We thank you for your continued loyalty.
Sincerely,

Mortimer J. Buckley
Chairman and Chief Executive Officer
October 1, 2019
1
Your Fund’s Performance at a Glance
· For the 12 months ended August 31, 2019, Vanguard International Growth Fund returned –4.58% for Investor Shares and –4.50% for Admiral Shares. The fund underperformed its benchmark.
· Market sentiment was dampened by signs of decelerating global growth, flare-ups in trade disputes, heightened international tensions with Iran, and a lack of agreement in the United Kingdom on how to exit the European Union.
· Relative to its benchmark, the fund outperformed in the Pacific owing largely to its holdings in Hong Kong and Japan. It lagged its benchmark in other regions, however, with stock selection detracting significantly from relative performance in Germany, Belgium, and China.
· The fund outpaced its benchmark in a majority of industry sectors. Stock selection in financials and consumer discretionary added value, as did largely avoiding the energy sector. However, the fund underperformed in other sectors, notably materials, health care and communication services.
Market Barometer | | | |
| | Average Annual Total Returns |
| | Periods Ended August 31, 2019 |
| One Year | Three Years | Five Years |
Stocks | | | |
Russell 1000 Index (Large-caps) | 2.49% | 12.57% | 9.85% |
Russell 2000 Index (Small-caps) | -12.89 | 7.89 | 6.41 |
Russell 3000 Index (Broad U.S. market) | 1.31 | 12.24 | 9.60 |
FTSE All-World ex US Index (International) | -3.18 | 5.97 | 1.71 |
| | | |
Bonds | | | |
Bloomberg Barclays U.S. Aggregate Bond Index | | | |
(Broad taxable market) | 10.17% | 3.09% | 3.35% |
Bloomberg Barclays Municipal Bond Index | | | |
(Broad tax-exempt market) | 8.72 | 3.30 | 3.85 |
FTSE Three-Month U.S. Treasury Bill Index | 2.36 | 1.47 | 0.91 |
| | | |
CPI | | | |
Consumer Price Index | 1.75% | 2.13% | 1.53% |
2
Advisors’ Report
For the 12 months ended August 31, 2019, Vanguard International Growth Fund returned –4.58% for Investor Shares and –4.50% for Admiral Shares. It lagged its benchmark index (–3.27%). Your fund is managed by two independent advisors, a strategy that enhances the fund’s diversification by providing exposure to distinct yet complementary investment approaches. It is not uncommon for advisors to have different views about individual securities or the broader investment environment.
The advisors, the amount and percentage of fund assets each manages, and brief descriptions of their investment strategies are presented in the table below. The advisors have also prepared a discussion of the investment environment that existed during the fiscal year and of how the portfolio’s positioning reflects this assessment. These comments were prepared on September 23, 2019.
Baillie Gifford Overseas Ltd.
Portfolio Managers:
James K. Anderson,
Head of Global Equities, Partner
Thomas Coutts
Head of International Growth, Partner
We believe successful investing lies in finding exceptional and durable growth companies. But growth investing isn’t easy; more ideas will fail than succeed.
Vanguard International Growth Fund Investment Advisors
| | Fund Assets Managed | | |
Investment Advisor | | % | | $Million | | Investment Strategy |
Baillie Gifford Overseas Ltd. | | 59 | | 21,241 | | The advisor seeks stocks that can generate above-average growth in earnings and cash flow, producing a bottom-up, stock-driven approach to country and asset allocation. An in-depth view on each company is measured against the consensus view, leading to discrepancies and potential opportunities to add value. |
Schroder Investment Management North America Inc. | | 40 | | 14,122 | | Equity analysts located around the world and an international team of global sector specialists help to identify reasonably priced companies with strong growth prospects and a sustainable competitive advantage. |
Cash Investments | | 1 | | 242 | | These short-term reserves are invested by Vanguard in equity index products to simulate investment in stocks. Each advisor may also maintain a modest cash position. |
3
These companies are hard to find and can be hard to hold, especially in the current environment. In times of macroeconomic uncertainty, we focus on decades, not quarters, and we are patient.
Companies are seizing on an unprecedented explosion of technology-driven innovation. Despite market uncertainty, they are growing by creating products and services that are being adopted more quickly than ever. Why? Because we are more connected. Enabled by increasing computing power, humans now create rich seams of data, presenting innovators with opportunities to mine and exploit them. New companies are using this data to create sectors such as online food delivery, tailored personal finance, and autonomous electric vehicles. Almost every facet of consumer behavior is affected, and consumer demand is setting the pace. As companies are spawned from this disruption, we aim to pick the best of them.
Many holdings that contributed well over the period are long-term leaders in their sectors and heavy investors in R&D. ASML, the Dutch manufacturer of semiconductor machines, is a unique example. Its extreme ultraviolet (EUV) lithography allows the progression of Moore’s Law to continue, and a monopolistic position in the technology gives considerable pricing power. We believe ASML’s investment in developing this commercially proven system will pay dividends as EUV lithography helps develop the next wave of chips for AI, autonomous driving, 5G, and more.
Another contributor was Argentinian e-commerce platform MercadoLibre, the market leader in Latin America, which has grown its revenues by 48% this fiscal year. The opportunity remains large on a continent of some 650 million people with underpenetrated internet, e-commerce, and financial services markets.
Ferrari still leads in the luxury super-sport segment, with strong demand from existing and new buyers. The company is laser-focused on careful supply management and continues to grow both volume and margins.
Results were weaker for Chinese web search portal Baidu and South Korean biosimilar drug company Celltrion. Despite increasing revenue by 15% for the 12 months, Baidu reported its first quarterly loss in 14 years because of increased R&D costs and content acquisition for its online video platform iQiyi. Celltrion detracted as intensifying competition led to margin erosion. Celltrion has been a long-term contributor to the fund and we remain excited by its lucrative drug pipeline in this nascent market. Overall, we are patient in the short-term and buoyed by the determination of both companies to invest heavily for the future.
Appreciating the rapid change we are seeing in China, we added an IPO to our existing unlisted holding in online marketplace company Meituan-Dianping and participated in the IPO of electric vehicle company NIO. Another addition
4
at IPO was Jumia, the pan-African digital retail company. Finally, after getting to know Temenos, we took a holding in this global leader of banking software.
To fund these purchases, we sold Distribuidora Internacional de Alimentacion (DIA), Jeronimo Martins, and Standard Chartered, where the growth opportunities have diminished. We sold Epiroc and Puma, which were spun out of existing holdings. We also sold Chinese education company New Oriental. As the education market consolidates in China, our conviction has grown stronger for the digital offering from the other large player, TAL Education.
Schroder Investment Management North America Inc.
Portfolio Manager:
Simon Webber, CFA
International equities declined modestly over the period as investors continued to grapple with slowing economic growth and political uncertainty. Trade and broader relationship tensions between the U.S. and China took a toll on business confidence. Manufacturing and industrial sectors were particularly affected as many investment plans were put on hold. Central bank policy broadly turned to supportive measures, and a widespread global collapse in bond yields created a two-tier equity market. “Bond proxy” sectors such as consumer staples performed strongly, but economic cyclicals faced intense pressure.
Stock selection supported relative performance through the year, with particularly strong contributions from holdings in the financial, industrial, and consumer staples sectors. By region, our emerging-market and U.K. exposures contributed, while our European positions detracted.
Our position in Nestle helped. The food and drink producer continues to manage its brand portfolio proactively, focusing investment on high-growth categories and addressing low-growth businesses through product innovation and divestitures. We believe the refocused product range will have better pricing power and, combined with an extensive cost-cutting scheme, should expand group-level margins materially by 2020.
Umicore was a weaker holding. The group issued a cautious outlook in April, citing tough market conditions as reductions in Chinese electric vehicle (EV) subsidies led to slowing demand for Umicore’s cathode materials. Although the company faces tough operating conditions in the short-term, EV demand will likely grow as much as tenfold around the world in the next decade, and Umicore is well-placed to benefit.
In health care, we initiated a position in Roche; we believe the market is underestimating the strength of its pipeline. Oncology is its biggest driver, and the company is at the forefront of medical advances that will transform the treatment of cancer and
5
Alzheimer’s. We believe that new product launches coupled with management cost discipline will drive margin expansion.
The portfolio is well-balanced and diversified across cyclical and defensive sectors of the economy. And it is focused on individual companies whose future growth, we are convinced, will surprise the market on the upside.
We remain concerned about market complacency regarding financial leverage amid record-low interest rates. The portfolio in aggregate is invested in companies with significantly stronger balance sheets than the market average. This gives our holdings the ability to react decisively to an uncertain market environment by investing in their own businesses or making acquisitions when opportunities arise.
In contrast, many listed companies are struggling under a combination of relatively high debt and high dividend payout ratios, which constrains their ability to invest and weakens their business in the long term. We focus on choosing stocks with strong and sustainable return-on-capital, resilient balance sheets, and good cash-flow generation. It is increasingly important for companies to have elements of pricing power and self-help; those dependent on macro support alone are unlikely to deliver in the current economic slowdown. We expect firms with these characteristics to have greater resiliency and flexibility to adapt to the evolving competitive landscape.
6
About Your Fund’s Expenses
As a shareholder of the fund, you incur ongoing costs, which include costs for portfolio management, administrative services, and shareholder reports (like this one), among others. Operating expenses, which are deducted from a fund’s gross income, directly reduce the investment return of the fund.
A fund’s expenses are expressed as a percentage of its average net assets. This figure is known as the expense ratio. The following examples are intended to help you understand the ongoing costs (in dollars) of investing in your fund and to compare these costs with those of other mutual funds. The examples are based on an investment of $1,000 made at the beginning of the period shown and held for the entire period.
The accompanying table illustrates your fund’s costs in two ways:
· Based on actual fund return. This section helps you to estimate the actual expenses that you paid over the period. The “Ending Account Value” shown is derived from the fund’s actual return, and the third column shows the dollar amount that would have been paid by an investor who started with $1,000 in the fund. You may use the information here, together with the amount you invested, to estimate the expenses that you paid over the period.
To do so, simply divide your account value by $1,000 (for example, an $8,600 account value divided by $1,000 = 8.6), then multiply the result by the number given for your fund under the heading “Expenses Paid During Period.”
· Based on hypothetical 5% yearly return. This section is intended to help you compare your fund’s costs with those of other mutual funds. It assumes that the fund had a yearly return of 5% before expenses, but that the expense ratio is unchanged. In this case—because the return used is not the fund’s actual return—the results do not apply to your investment. The example is useful in making comparisons because the Securities and Exchange Commission requires all mutual funds to calculate expenses based on a 5% return. You can assess your fund’s costs by comparing this hypothetical example with the hypothetical examples that appear in shareholder reports of other funds.
Note that the expenses shown in the table are meant to highlight and help you compare ongoing costs only and do not reflect transaction costs incurred by the fund for buying and selling securities. Further, the expenses do not include any purchase, redemption, or account service fees described in the fund prospectus. If such fees were applied to your account, your costs would be higher. Your fund does not carry a “sales load.”
The calculations assume no shares were bought or sold during the period. Your actual costs may have been higher or lower, depending on the amount of your investment and the timing of any purchases or redemptions.
You can find more information about the fund’s expenses, including annual expense ratios, in the Financial Statements section of this report. For additional information on operating expenses and other shareholder costs, please refer to your fund’s current prospectus.
7
Six Months Ended August 31, 2019 | | | | | | |
| | Beginning | | Ending | | Expenses |
| | Account Value | | Account Value | | Paid During |
International Growth Fund | | 2/28/2019 | | 8/31/2019 | | Period |
Based on Actual Fund Return | | | | | | |
Investor Shares | | $1,000.00 | | $1,004.97 | | $2.07 |
Admiral™ Shares | | 1,000.00 | | 1,005.25 | | 1.62 |
Based on Hypothetical 5% Yearly Return | | | | | | |
Investor Shares | | $1,000.00 | | $1,023.14 | | $2.09 |
Admiral Shares | | 1,000.00 | | 1,023.59 | | 1.63 |
The calculations are based on expenses incurred in the most recent six-month period. The fund’s annualized six-month expense ratios for that period are 0.41% for Investor Shares and 0.32% for Admiral Shares. The dollar amounts shown as “Expenses Paid” are equal to the annualized expense ratio multiplied by the average account value over the period, multiplied by the number of days in the most recent six-month period, then divided by the number of days in the most recent 12-month period (184/365).
8
International Growth Fund
Performance Summary
All of the returns in this report represent past performance, which is not a guarantee of future results that may be achieved by the fund. (Current performance may be lower or higher than the performance data cited. For performance data current to the most recent month-end, visit our website at vanguard.com/performance.) Note, too, that both investment returns and principal value can fluctuate widely, so an investor’s shares, when sold, could be worth more or less than their original cost. The returns shown do not reflect taxes that a shareholder would pay on fund distributions or on the sale of fund shares.
Cumulative Performance: August 31, 2009, Through August 31, 2019
Initial Investment of $10,000
| | | | Average Annual Total Returns | | |
| | | | Periods Ended August 31, 2019 | | |
| | | | One
Year | | Five
Years | | Ten
Years | | Final Value
of a $10,000
Investment |

| | International Growth Fund Investor Shares | | -4.58% | | 5.81% | | 8.14% | | $21,878 |

| | Spliced International Index | | -3.27 | | 1.37 | | 4.14 | | 14,998 |
Spliced International Index: MSCI EAFE Index through May 31, 2010; MSCI All Country World Index ex USA thereafter.
| | | | Final Value |
| One | Five | Ten | of a $50,000 |
| Year | Years | Years | Investment |
International Growth Fund Admiral Shares | -4.50% | 5.95% | 8.28% | $110,784 |
Spliced International Index | -3.27 | 1.37 | 4.14 | 74,989 |
See Financial Highlights for dividend and capital gains information.
9
International Growth Fund
Sector Diversification
As of August 31, 2019
Communication Services | | 10.6% | |
Consumer Discretionary | | 33.8 | |
Consumer Staples | | 6.5 | |
Energy | | 1.3 | |
Financials | | 13.7 | |
Health Care | | 11.3 | |
Industrials | | 9.3 | |
Information Technology | | 9.3 | |
Materials | | 3.6 | |
Other | | 0.6 | |
Real Estate | | 0.0 | |
Utilities | | 0.0 | |
The table reflects the fund’s equity exposure, based on its investments in stocks and stock index futures. Any holdings in short-term reserves are excluded. Sector categories are based on the Global Industry Classification Standard (“GICS”), except for the “Other” category (if applicable), which includes securities that have not been provided a GICS classification as of the effective reporting period.
The Global Industry Classification Standard (“GICS”) was developed by and is the exclusive property and a service mark of MSCI Inc. (“MSCI”) and Standard and Poor’s, a division of McGraw-Hill Companies, Inc. (“S&P”), and is licensed for use by Vanguard. Neither MSCI, S&P nor any third party involved in making or compiling the GICS or any GICS classification makes any express or implied warranties or representations with respect to such standard or classification (or the results to be obtained by the use thereof), and all such parties hereby expressly disclaim all warranties of originality, accuracy, completeness, merchantability or fitness for a particular purpose with respect to any such standard or classification. Without limiting any of the foregoing, in no event shall MSCI, S&P, any of its affiliates or any third party involved in making or compiling the GICS or any GICS classification have any liability for any direct, indirect, special, punitive, consequential or any other damages (including lost profits) even if notified of the possibility of such damages.
10
International Growth Fund
Financial Statements
Statement of Net Assets
As of August 31, 2019
The fund files its complete schedule of portfolio holdings with the Securities and Exchange Commission (SEC) for the first and third quarters of each fiscal year as an exhibit to its reports on Form N-PORT. The fund’s Form N-PORT reports are available on the SEC’s website at www.sec.gov.
| | | | | Market | |
| | | | | Value· | |
| | Shares | | ($000 | ) |
Common Stocks (98.5%)1 | | | | | |
Australia (0.3%) | | | | | |
| Brambles Ltd. | | 14,789,660 | | 112,411 | |
| | | | | | |
Austria (0.4%) | | | | | |
| Erste Group Bank AG | | 4,310,170 | | 138,635 | |
| | | | | | |
Belgium (1.0%) | | | | | |
^ | Umicore SA | | 11,385,753 | | 362,722 | |
| | | | | | |
Brazil (0.7%) | | | | | |
| B3 SA - Brasil Bolsa Balcao | | 11,674,291 | | 126,300 | |
| Raia Drogasil SA | | 5,124,291 | | 113,895 | |
| | | | | 240,195 | |
Canada (1.0%) | | | | | |
| Nutrien Ltd. | | 3,665,128 | | 184,578 | |
| Toronto-Dominion Bank | | 3,133,272 | | 169,913 | |
| | | | | 354,491 | |
China (17.6%) | | | | | |
* | Alibaba Group Holding Ltd. ADR | | 11,394,039 | | 1,994,299 | |
| Tencent Holdings Ltd. | | 41,153,400 | | 1,699,040 | |
* | TAL Education Group ADR | | 18,485,132 | | 658,625 | |
* | Baidu Inc. ADR | | 4,633,984 | | 484,112 | |
| Ping An Insurance Group Co. of China Ltd. | | 37,534,500 | | 430,634 | |
* | Meituan Dianping Class B | | 32,888,430 | | 311,226 | |
* | Ctrip.com International Ltd. ADR | | 9,001,376 | | 291,465 | |
| China Pacific Insurance Group Co. Ltd. | | 34,671,200 | | 138,393 | |
| China Mengniu Dairy Co. Ltd. | | 33,524,000 | | 132,619 | |
^,* | iQIYI Inc. ADR | | 3,583,399 | | 65,540 | |
^,* | NIO Inc. ADR | | 17,591,617 | | 50,312 | |
| | | | | 6,256,265 | |
Denmark (2.9%) | | | | | |
* | Genmab A/S | | 2,594,661 | | 530,400 | |
| Vestas Wind Systems A/S | | 2,278,474 | | 167,548 | |
| Chr Hansen Holding A/S | | 1,658,818 | | 139,486 | |
| Novozymes A/S | | 2,401,809 | | 102,387 | |
^ | Ambu A/S Class B | | 5,449,774 | | 93,438 | |
| | | | | 1,033,259 | |
France (8.0%) | | | | | |
| Kering SA | | 1,535,503 | | 744,032 | |
| L’Oreal SA | | 2,310,130 | | 630,800 | |
| Schneider Electric SE | | 5,203,061 | | 435,832 | |
| EssilorLuxottica SA | | 1,942,580 | | 286,822 | |
| Danone SA | | 3,081,319 | | 276,055 | |
| TOTAL SA | | 5,324,542 | | 265,903 | |
| Vivendi SA | | 7,343,173 | | 205,346 | |
| | | | | 2,844,790 | |
Germany (6.9%) | | | | | |
*,2 | Zalando SE | | 10,466,867 | | 519,290 | |
*,2 | Delivery Hero SE | | 6,275,610 | | 318,067 | |
| Bayerische Motoren Werke AG | | 3,349,995 | | 224,051 | |
| adidas AG | | 734,594 | | 217,671 | |
| SAP SE | | 1,667,180 | | 199,025 | |
| Infineon Technologies AG | | 8,885,472 | | 153,994 | |
| BASF SE | | 2,275,881 | | 150,589 | |
^,*,3 | HelloFresh SE | | 10,552,945 | | 137,965 | |
| GEA Group AG | | 5,087,264 | | 137,126 | |
| Continental AG | | 1,057,002 | | 127,558 | |
* | MorphoSys AG | | 664,989 | | 78,886 | |
*,2 | Rocket Internet SE | | 2,762,933 | | 77,081 | |
^,*,3 | Jumia Technologies AG ADR | | 6,724,836 | | 74,982 | |
^,* | AIXTRON SE | | 3,130,112 | | 31,064 | |
^,*,3 | Home24 SE | | 1,862,256 | | 6,147 | |
| | | | | 2,453,496 | |
11
International Growth Fund
| | | | | Market | |
| | | | | Value· | |
| | | Shares | | ($000 | ) |
Hong Kong (4.2%) | | | | | |
| AIA Group Ltd. | | 123,142,800 | | 1,191,623 | |
| Jardine Matheson Holdings Ltd. | | 3,239,027 | | 176,130 | |
| Hong Kong Exchanges & Clearing Ltd. | | 4,767,930 | | 145,512 | |
| | | | | 1,513,265 | |
India (2.3%) | | | | | |
| Housing Development Finance Corp. Ltd. | | 11,680,736 | | 354,877 | |
| HDFC Bank Ltd. | | 6,437,279 | | 201,245 | |
| Zee Entertainment Enterprises Ltd. | | 33,638,320 | | 175,648 | |
*,§,4 | ANI Technologies | | 166,185 | | 49,455 | |
| Larsen & Toubro Ltd. | | 2,239,483 | | 41,675 | |
| | | | | 822,900 | |
Indonesia (0.4%) | | | | | |
| Bank Central Asia Tbk PT | | 66,399,100 | | 142,510 | |
| | | | | | |
Israel (0.3%) | | | | | |
* | Check Point Software Technologies Ltd. | | 1,003,311 | | 108,057 | |
| | | | | | |
Italy (2.6%) | | | | | |
| Ferrari NV | | 4,745,012 | | 749,239 | |
| Fiat Chrysler Automobiles NV | | 13,737,294 | | 179,654 | |
| | | | | 928,893 | |
Japan (10.8%) | | | | | |
| M3 Inc. | | 26,545,800 | | 562,610 | |
| SMC Corp. | | 1,428,000 | | 538,362 | |
| SoftBank Group Corp. | | 9,578,400 | | 434,033 | |
| Nintendo Co. Ltd. | | 731,600 | | 276,838 | |
| Nidec Corp. | | 2,080,800 | | 270,764 | |
| Bridgestone Corp. | | 5,745,200 | | 217,579 | |
| Recruit Holdings Co. Ltd. | | 6,702,200 | | 202,944 | |
| Sony Corp. | | 3,375,700 | | 192,288 | |
| Takeda Pharmaceutical Co. Ltd. | | 4,806,100 | | 162,042 | |
| Sekisui Chemical Co. Ltd. | | 10,005,000 | | 143,936 | |
| Kubota Corp. | | 8,488,000 | | 121,612 | |
| Pigeon Corp. | | 3,300,800 | | 119,665 | |
| Keyence Corp. | | 202,000 | | 119,362 | |
| Toyota Motor Corp. | | 1,725,900 | | 113,022 | |
| ORIX Corp. | | 7,045,400 | | 103,955 | |
| Murata Manufacturing Co. Ltd. | | 2,240,300 | | 93,136 | |
^ | SBI Holdings Inc. | | 4,470,400 | | 89,262 | |
| Suzuki Motor Corp. | | 2,218,500 | | 85,412 | |
| | | | | 3,846,822 | |
Netherlands (5.3%) | | | | | |
| ASML Holding NV | | 7,790,064 | | 1,732,576 | |
| Koninklijke Philips NV | | 3,529,779 | | 166,375 | |
| | | | | 1,898,951 | |
Norway (0.7%) | | | | | |
| DNB ASA | | 8,478,225 | | 136,586 | |
| Norsk Hydro ASA | | 38,345,698 | | 120,334 | |
| | | | | 256,920 | |
Other (0.2%) | | | | | |
5 | Vanguard FTSE All-World ex-US ETF | | 1,128,434 | | 55,124 | |
| | | | | | |
Singapore (0.4%) | | | | | |
| Oversea-Chinese Banking Corp. Ltd. | | 19,070,500 | | 146,157 | |
| | | | | | |
South Korea (1.6%) | | | | | |
| Samsung Electronics Co. Ltd. | | 6,379,876 | | 232,285 | |
^,* | Celltrion Inc. | | 1,695,815 | | 220,573 | |
| Samsung SDI Co. Ltd. | | 560,382 | | 115,733 | |
| | | | | 568,591 | |
Spain (2.9%) | | | | | |
| Industria de Diseno Textil SA | | 21,245,632 | | 657,427 | |
| Banco Bilbao Vizcaya Argentaria SA | | 80,169,921 | | 380,341 | |
| | | | | 1,037,768 | |
Sweden (4.4%) | | | | | |
* | Spotify Technology SA | | 2,908,470 | | 392,498 | |
| Atlas Copco AB Class A | | 9,836,886 | | 294,107 | |
| Kinnevik AB | | 10,340,628 | | 282,049 | |
| Svenska Handelsbanken AB Class A | | 28,108,694 | | 247,665 | |
| Assa Abloy AB Class B | | 7,216,721 | | 150,643 | |
| SKF AB | | 7,055,500 | | 113,905 | |
^ | Elekta AB Class B | | 6,427,670 | | 81,872 | |
| | | | | 1,562,739 | |
Switzerland (5.3%) | | | | | |
| Nestle SA | | 5,177,491 | | 581,818 | |
| Roche Holding AG | | 1,909,988 | | 521,924 | |
| Novartis AG | | 2,634,439 | | 237,507 | |
| Lonza Group AG | | 574,461 | | 203,896 | |
| Cie Financiere Richemont SA | | 2,311,487 | | 179,606 | |
| Temenos AG | | 872,365 | | 146,976 | |
| Straumann Holding AG | | 13,099 | | 10,298 | |
| | | | | 1,882,025 | |
Taiwan (1.0%) | | | | | |
| Taiwan Semiconductor Manufacturing Co. Ltd. | | 41,599,000 | | 341,804 | |
12
International Growth Fund
| | | | | Market | |
| | | | | Value· | |
| | | Shares | | ($000 | ) |
Thailand (0.3%) | | | | | |
| Kasikornbank PCL (Foreign) | | 22,280,856 | | 116,326 | |
| | | | | | |
Turkey (0.2%) | | | | | |
* | Turkiye Garanti Bankasi AS | | 39,634,985 | | 60,712 | |
| | | | | | |
United Kingdom (6.8%) | | | | | |
| Rolls-Royce Holdings plc | | 46,651,516 | | 438,448 | |
| Diageo plc | | 8,713,257 | | 373,051 | |
* | Ocado Group plc | | 19,221,816 | | 303,365 | |
| BHP Group plc | | 8,794,634 | | 190,261 | |
| Royal Dutch Shell plc Class A | | 6,669,211 | | 185,186 | |
| Burberry Group plc | | 6,851,592 | | 181,337 | |
| Smith & Nephew plc | | 7,487,455 | | 179,423 | |
| GlaxoSmithKline plc | | 6,981,170 | | 145,485 | |
| Whitbread plc | | 2,253,798 | | 120,181 | |
| Lloyds Banking Group plc | | 170,979,423 | | 104,028 | |
| Aviva plc | | 21,361,017 | | 92,220 | |
| Bunzl plc | | 2,273,703 | | 55,768 | |
^,*,2 | Aston Martin Lagonda Global Holdings plc | | 6,321,596 | | 36,949 | |
| Next plc | | 83,261 | | 6,027 | |
| | | | | 2,411,729 | |
United States (10.0%) | | | | | |
* | Amazon.com Inc. | | 669,737 | | 1,189,647 | |
* | Booking Holdings Inc. | | 51,269 | | 100,816 | |
* | Illumina Inc. | | 2,734,956 | | 769,453 | |
* | MercadoLibre Inc. | | 1,706,131 | | 1,014,465 | |
| Philip Morris International Inc. | | 788,444 | | 56,839 | |
^,* | Tesla Inc. | | 1,894,281 | | 427,369 | |
| | | | | 3,558,589 | |
Total Common Stocks | | | | | |
(Cost $25,510,096) | | | | 35,056,146 | |
Preferred Stocks (0.4%) | | | | | |
*,§,3,4,6 | You & Mr. Jones | | 44,800,000 | | 127,680 | |
*,§,4,6 | CureVac GmbH | | 12,600 | | 19,709 | |
Total Preferred Stocks | | | | | |
(Cost $75,682) | | | | 147,389 | |
Temporary Cash Investments (3.5%)1 | | | | | |
Money Market Fund (3.4%) | | | | | |
7,8 | Vanguard Market Liquidity Fund, 2.249% | | 12,435,941 | | 1,243,718 | |
| | | | | | |
| | | Face | | | |
| | | Amount | | | |
| | | ($000 | ) | | | |
U.S. Government and Agency Obligations (0.1%) | | | | | |
| United States Treasury Bill, 1.954%, 11/7/19 | | 4,500 | | 4,484 | |
| United States Treasury Bill, 2.135%, 11/14/19 | | 2,400 | | 2,391 | |
9 | United States Treasury Bill, 2.048%, 11/21/19 | | 10,000 | | 9,957 | |
9 | United States Treasury Bill, 2.082%, 12/26/19 | | 3,500 | | 3,479 | |
| | | | | 20,311 | |
Total Temporary Cash Investments | | | | | |
(Cost $1,263,905) | | | | 1,264,029 | |
Total Investments (102.4%) | | | | | |
(Cost $26,849,683) | | | | 36,467,564 | |
Other Assets and Liabilities (-2.4%) | | | | | |
Other Assets10 | | | | 193,194 | |
Liabilities | | | | (1,055,559 | ) |
| | | | | (862,365 | ) |
Net Assets (100%) | | | | 35,605,199 | |
| | | | | | | |
13
International Growth Fund
| | Amount | |
| | ($000 | ) |
Statement of Assets and Liabilities | | | |
Assets | | | |
Investments in Securities, at Value | | | |
Unaffiliated Issuers | | 34,821,948 | |
Affiliated Issuers | | 1,645,616 | |
Total Investments in Securities | | 36,467,564 | |
Investment in Vanguard | | 1,731 | |
Receivables for Investment Securities Sold | | 45,064 | |
Receivables for Accrued Income | | 64,710 | |
Receivables for Capital Shares Issued | | 22,508 | |
Variation Margin Receivable—Futures Contracts | | 2,516 | |
Unrealized Appreciation—Forward Currency Contracts | | 5,679 | |
Other Assets10 | | 50,986 | |
Total Assets | | 36,660,758 | |
Liabilities | | | |
Payables for Investment Securities Purchased | | (31,328 | ) |
Collateral for Securities on Loan | | (943,002 | ) |
Payables for Capital Shares Redeemed | | (13,861 | ) |
Payables to Investment Advisor | | (15,675 | ) |
Payables to Vanguard | | (23,316 | ) |
Variation Margin Payable—Futures Contracts | | (17 | ) |
Unrealized Depreciation—Forward Currency Contracts | | (11,097 | ) |
Other Liabilities | | (17,263 | ) |
Total Liabilities | | (1,055,559 | ) |
Net Assets (100%) | | 35,605,199 | |
| | | |
At August 31, 2019, net assets consisted of: | | | |
| | Amount | |
| | ($000 | ) |
Paid-in Capital | | 25,853,807 | |
Total Distributable Earnings (Loss) | | 9,751,392 | |
Net Assets | | 35,605,199 | |
| | | |
Investor Shares—Net Assets | | | |
Applicable to 249,373,598 outstanding $.001 par value shares of beneficial interest (unlimited authorization) | | 7,056,331 | |
Net Asset Value Per Share—Investor Shares | | $28.30 | |
Admiral Shares—Net Assets | | | |
Applicable to 317,030,200 outstanding $.001 par value shares of beneficial interest (unlimited authorization) | | 28,548,868 | |
Net Asset Value Per Share—Admiral Shares | | $90.05 | |
· See Note A in Notes to Financial Statements.
^ Includes partial security positions on loan to broker-dealers. The total value of securities on loan is $925,745,000.
* Non-income-producing security.
§ Security value determined using significant unobservable inputs.
1 The fund invests a portion of its cash reserves in equity markets through the use of index futures contracts. After giving effect to futures investments, the fund’s effective common stock and temporary cash investment positions represent 99.0% and 3.0%, respectively, of net assets.
2 Security exempt from registration under Rule 144A of the Securities Act of 1933. Such securities may be sold in transactions exempt from registration, normally to qualified institutional buyers. At August 31, 2019, the aggregate value of these securities was $951,387,000, representing 2.7% of net assets.
3 Considered an affiliated company of the fund as the fund owns more than 5% of the outstanding voting securities of such company.
4 Restricted securities totaling $196,844,000, representing 0.6% of net assets. See Restricted Securities table for additional information.
5 Considered an affiliated company of the fund as the issuer is another member of The Vanguard Group.
6 Perpetual security with no stated maturity date.
7 Affiliated money market fund available only to Vanguard funds and certain trusts and accounts managed by Vanguard. Rate shown is the 7-day yield.
8 Includes $943,002,000 of collateral received for securities on loan.
9 Securities with a value of $9,901,000 have been segregated as initial margin for open futures contracts.
10 Cash of $6,030,000 has been segregated as collateral for open forward currency contracts.
ADR—American Depositary Receipt.
14
International Growth Fund
Restricted Securities as of Period End | | |
| | |
| | Acquisition |
| Acquisition | Cost |
Security Name | Date | ($000) |
You & Mr. Jones | September 2015 | 44,800 |
CureVac GmbH | October 2015 | 30,882 |
ANI Technologies | December 2015 | 51,748 |
Derivative Financial Instruments Outstanding as of Period End |
Futures Contracts | | | | |
| | | | ($000) |
| | | | Value and |
| | Number of | | Unrealized |
| | Long (Short) | Notional | Appreciation |
| Expiration | Contracts | Amount | (Depreciation) |
Long Futures Contracts | | | | |
Dow Jones EURO STOXX 50 Index | September 2019 | 1,912 | 71,847 | 289 |
Topix Index | September 2019 | 352 | 50,032 | (405) |
FTSE 100 Index | September 2019 | 432 | 37,745 | (741) |
S&P ASX 200 Index | September 2019 | 271 | 29,981 | (454) |
| | | | (1,311) |
Forward Currency Contracts | | | | | | | |
| Contract | | | | | Unrealized | Unrealized |
| Settlement | | | Contract Amount (000) | Appreciation | (Depreciation) |
Counterparty | Date | | Receive | | Deliver | ($000) | ($000) |
Morgan Stanley Capital Services LLC | 9/25/19 | EUR | 124,013 | USD | 140,372 | — | (3,804) |
Citibank, N.A. | 9/18/19 | JPY | 12,573,713 | USD | 116,709 | 1,809 | — |
Toronto-Dominion Bank | 9/24/19 | GBP | 64,712 | USD | 82,482 | — | (3,656) |
Toronto-Dominion Bank | 9/24/19 | AUD | 93,932 | USD | 64,723 | — | (1,418) |
Citibank, N.A. | 9/24/19 | EUR | 38,013 | USD | 42,394 | — | (537) |
Citibank, N.A. | 9/17/19 | JPY | 3,281,975 | USD | 30,883 | 50 | — |
Royal Bank of Canada | 9/24/19 | GBP | 22,491 | USD | 27,366 | 31 | — |
Citibank, N.A. | 9/23/19 | AUD | 29,180 | USD | 19,865 | — | (200) |
JPMorgan Chase Bank, N.A. | 9/23/19 | AUD | 15,796 | USD | 11,071 | — | (425) |
JPMorgan Chase Bank, N.A. | 9/24/19 | EUR | 9,569 | USD | 10,705 | — | (168) |
15
International Growth Fund
Forward Currency Contracts (continued) | | | | | | | |
| Contract | | | | | Unrealized | Unrealized |
| Settlement | | | Contract Amount (000) | Appreciation | (Depreciation) |
Counterparty | Date | | Receive | | Deliver | ($000) | ($000) |
Goldman Sachs International | 9/24/19 | EUR | 9,201 | USD | 10,387 | — | (255) |
Royal Bank of Canada | 9/24/19 | EUR | 8,104 | USD | 9,031 | — | (107) |
Morgan Stanley Capital Services LLC | 9/24/19 | GBP | 6,904 | USD | 8,643 | — | (233) |
Royal Bank of Canada | 9/17/19 | JPY | 726,425 | USD | 6,865 | — | (18) |
Barclays Bank plc | 9/17/19 | JPY | 687,720 | USD | 6,402 | 80 | — |
Morgan Stanley Capital Services LLC | 9/17/19 | JPY | 660,450 | USD | 6,127 | 98 | — |
Barclays Bank plc | 9/25/19 | EUR | 2,076 | USD | 2,349 | — | (63) |
Royal Bank of Canada | 9/18/19 | JPY | 195,842 | USD | 1,818 | 28 | — |
Royal Bank of Canada | 9/23/19 | AUD | 2,072 | USD | 1,406 | — | (10) |
Bank of America, N.A. | 9/24/19 | AUD | 1,131 | USD | 779 | — | (17) |
BNP Paribas | 9/24/19 | GBP | 601 | USD | 750 | — | (18) |
Toronto-Dominion Bank | 9/24/19 | USD | 99,772 | EUR | 88,642 | 2,165 | — |
Barclays Bank plc | 9/17/19 | USD | 74,195 | JPY | 7,825,940 | 435 | — |
UBS AG | 9/23/19 | USD | 49,628 | AUD | 73,376 | 178 | — |
Barclays Bank plc | 9/24/19 | USD | 32,594 | GBP | 26,768 | — | (13) |
JPMorgan Chase Bank, N.A. | 9/24/19 | USD | 17,048 | GBP | 14,001 | — | (7) |
Deutsche Bank AG | 9/24/19 | USD | 12,412 | EUR | 11,143 | 142 | — |
Goldman Sachs International | 9/24/19 | USD | 11,070 | EUR | 9,960 | 102 | — |
Royal Bank of Canada | 9/24/19 | USD | 10,472 | EUR | 9,343 | 184 | — |
Citibank, N.A. | 9/17/19 | USD | 10,470 | JPY | 1,111,825 | — | (10) |
UBS AG | 9/24/19 | USD | 9,971 | EUR | 8,967 | 97 | — |
Royal Bank of Canada | 9/17/19 | USD | 7,777 | JPY | 827,680 | — | (24) |
Deutsche Bank AG | 9/23/19 | USD | 6,491 | AUD | 9,579 | 35 | — |
UBS AG | 9/24/19 | USD | 5,701 | GBP | 4,693 | — | (15) |
Goldman Sachs International | 9/17/19 | USD | 5,531 | JPY | 591,480 | — | (43) |
UBS AG | 9/17/19 | USD | 5,472 | JPY | 581,880 | — | (12) |
Deutsche Bank AG | 9/17/19 | USD | 5,428 | JPY | 571,520 | 42 | — |
HSBC Bank USA, N.A. | 9/24/19 | USD | 5,246 | GBP | 4,311 | — | (5) |
Royal Bank of Canada | 9/24/19 | USD | 4,522 | GBP | 3,744 | — | (39) |
Goldman Sachs International | 9/17/19 | USD | 4,476 | JPY | 474,400 | 5 | — |
Goldman Sachs International | 9/24/19 | USD | 4,193 | GBP | 3,412 | 37 | — |
UBS AG | 9/24/19 | USD | 4,145 | GBP | 3,378 | 30 | — |
Royal Bank of Canada | 9/23/19 | USD | 4,085 | AUD | 6,005 | 38 | — |
Bank of America, N.A. | 9/23/19 | USD | 3,940 | AUD | 5,795 | 34 | — |
16
International Growth Fund
Forward Currency Contracts (continued) | | | | | | | |
| Contract | | | | | Unrealized | Unrealized |
| Settlement | | | Contract Amount (000) | Appreciation | (Depreciation) |
Counterparty | Date | | Receive | | Deliver | ($000) | ($000) |
Goldman Sachs International | 9/23/19 | USD | 3,580 | AUD | 5,280 | 22 | — |
Barclays Bank plc | 9/24/19 | USD | 3,477 | GBP | 2,842 | 15 | — |
JPMorgan Chase Bank, N.A. | 9/24/19 | USD | 488 | GBP | 383 | 22 | — |
| | | | | | 5,679 | (11,097) |
AUD—Australian dollar.
EUR—euro.
GBP—British pound.
JPY—Japanese yen.
USD—U.S. dollar.
At August 31, 2019, the counterparties had deposited in segregated accounts securities with a value of $1,559,000 in connection with open forward currency contracts. After August 31, 2019, the counterparties posted additional collateral of $1,380,000 in connection with open forward currency contracts as of August 31, 2019.
See accompanying Notes, which are an integral part of the Financial Statements.
17
International Growth Fund
Statement of Operations
| Year Ended |
| August 31, 2019 |
| ($000) |
Investment Income | |
Income | |
Dividends—Unaffiliated Issuers1 | 526,647 |
Dividends—Affiliated Issuers | 1,667 |
Interest—Unaffiliated Issuers | 617 |
Interest—Affiliated Issuers | 11,685 |
Securities Lending—Net | 36,756 |
Total Income | 577,372 |
Expenses | |
Investment Advisory Fees—Note B | |
Basic Fee | 49,469 |
Performance Adjustment | 10,483 |
The Vanguard Group—Note C | |
Management and Administrative—Investor Shares | 17,266 |
Management and Administrative—Admiral Shares | 37,892 |
Marketing and Distribution—Investor Shares | 850 |
Marketing and Distribution—Admiral Shares | 1,588 |
Custodian Fees | 2,200 |
Auditing Fees | 46 |
Shareholders’ Reports—Investor Shares | 125 |
Shareholders’ Reports—Admiral Shares | 233 |
Trustees’ Fees and Expenses | 45 |
Total Expenses | 120,197 |
Net Investment Income | 457,175 |
Realized Net Gain (Loss) | |
Investment Securities Sold—Unaffiliated Issuers | (13,231) |
Investment Securities Sold—Affiliated Issuers | 214 |
Futures Contracts | 2,687 |
Forward Currency Contracts | (19,337) |
Foreign Currencies | (2,595) |
Realized Net Gain (Loss) | (32,262) |
Change in Unrealized Appreciation (Depreciation) | |
Investment Securities—Unaffiliated Issuers | (2,154,205) |
Investment Securities—Affiliated Issuers | (4,789) |
Futures Contracts | (434) |
Forward Currency Contracts | 3,840 |
Foreign Currencies | (1,045) |
Change in Unrealized Appreciation (Depreciation) | (2,156,633) |
Net Increase (Decrease) in Net Assets Resulting from Operations | (1,731,720) |
1 Dividends are net of foreign withholding taxes of $63,506,000.
See accompanying Notes, which are an integral part of the Financial Statements.
18
International Growth Fund
Statement of Changes in Net Assets
| Year Ended August 31, |
| 2019 | 2018 |
| ($000) | ($000) |
Increase (Decrease) in Net Assets | | |
Operations | | |
Net Investment Income | 457,175 | 485,445 |
Realized Net Gain (Loss) | (32,262) | 1,574,400 |
Change in Unrealized Appreciation (Depreciation) | (2,156,633) | 1,400,252 |
Net Increase (Decrease) in Net Assets Resulting from Operations | (1,731,720) | 3,460,097 |
Distributions | | |
Net Investment Income | | |
Investor Shares | (101,822) | (66,639) |
Admiral Shares | (414,446) | (217,469) |
Realized Capital Gain1 | | |
Investor Shares | (234,310) | — |
Admiral Shares | (863,521) | — |
Total Distributions | (1,614,099) | (284,108) |
Capital Share Transactions | | |
Investor Shares | (284,833) | (426,156) |
Admiral Shares | 1,992,089 | 3,661,907 |
Net Increase (Decrease) from Capital Share Transactions | 1,707,256 | 3,235,751 |
Total Increase (Decrease) | (1,638,563) | 6,411,740 |
Net Assets | | |
Beginning of Period | 37,243,762 | 30,832,022 |
End of Period | 35,605,199 | 37,243,762 |
1 Includes fiscal 2019 and 2018 short-term gain distributions totaling $14,449,000 and $0, respectively. Short-term gain distributions are treated as ordinary income dividends for tax purposes.
See accompanying Notes, which are an integral part of the Financial Statements.
19
International Growth Fund
Financial Highlights
Investor Shares
For a Share Outstanding | | Year Ended August 31, | |
Throughout Each Period | | 2019 | | 2018 | | 2017 | | 2016 | | 2015 | |
Net Asset Value, Beginning of Period | | $31.23 | | $28.38 | | $22.38 | | $20.83 | | $23.79 | |
Investment Operations | | | | | | | | | | | |
Net Investment Income | | .342 | 1 | .381 | 1 | .240 | 1 | .304 | | .308 | |
Net Realized and Unrealized Gain (Loss) on Investments | | (1.941 | ) | 2.722 | | 6.028 | | 1.539 | | (2.774 | ) |
Total from Investment Operations | | (1.599 | ) | 3.103 | | 6.268 | | 1.843 | | (2.466 | ) |
Distributions | | | | | | | | | | | |
Dividends from Net Investment Income | | (.403 | ) | (.253 | ) | (.268 | ) | (.293 | ) | (.494 | ) |
Distributions from Realized Capital Gains | | (.928 | ) | — | | — | | — | | — | |
Total Distributions | | (1.331 | ) | (.253 | ) | (.268 | ) | (.293 | ) | (.494 | ) |
Net Asset Value, End of Period | | $28.30 | | $31.23 | | $28.38 | | $22.38 | | $20.83 | |
| | | | | | | | | | | |
Total Return2 | | -4.58% | | 10.97% | | 28.43% | | 8.95% | | -10.46% | |
| | | | | | | | | | | |
Ratios/Supplemental Data | | | | | | | | | | | |
Net Assets, End of Period (Millions) | | $7,056 | | $8,074 | | $7,731 | | $6,700 | | $7,172 | |
Ratio of Total Expenses to Average Net Assets3 | | 0.43% | | 0.45% | | 0.45% | | 0.46% | | 0.47% | |
Ratio of Net Investment Income to Average Net Assets | | 1.23% | | 1.25% | | 1.01% | | 1.47% | | 1.34% | |
Portfolio Turnover Rate | | 13% | | 16% | | 15% | | 29% | | 29% | |
1 Calculated based on average shares outstanding.
2 Total returns do not include account service fees that may have applied in the periods shown. Fund prospectuses provide information about any applicable account service fees.
3 Includes performance-based investment advisory fee increases (decreases) of 0.03%, 0.03%, 0.03%, 0.04%, and 0.03%.
See accompanying Notes, which are an integral part of the Financial Statements.
20
International Growth Fund
Financial Highlights
Admiral Shares
For a Share Outstanding | | Year Ended August 31, | |
Throughout Each Period | | 2019 | | 2018 | | 2017 | | 2016 | | 2015 | |
Net Asset Value, Beginning of Period | | $99.45 | | $90.24 | | $71.19 | | $66.28 | | $75.70 | |
Investment Operations | | | | | | | | | | | |
Net Investment Income | | 1.203 | 1 | 1.365 | 1 | .879 | 1 | 1.062 | | 1.088 | |
Net Realized and Unrealized Gain (Loss) on Investments | | (6.230 | ) | 8.652 | | 19.127 | | 4.877 | | (8.821 | ) |
Total from Investment Operations | | (5.027 | ) | 10.017 | | 20.006 | | 5.939 | | (7.733 | ) |
Distributions | | | | | | | | | | | |
Dividends from Net Investment Income | | (1.418 | ) | (.807 | ) | (.956 | ) | (1.029 | ) | (1.687 | ) |
Distributions from Realized Capital Gains | | (2.955 | ) | — | | — | | — | | — | |
Total Distributions | | (4.373 | ) | (.807 | ) | (.956 | ) | (1.029 | ) | (1.687 | ) |
Net Asset Value, End of Period | | $90.05 | | $99.45 | | $90.24 | | $71.19 | | $66.28 | |
| | | | | | | | | | | |
Total Return2 | | -4.50% | | 11.14% | | 28.57% | | 9.07% | | -10.32% | |
| | | | | | | | | | | |
Ratios/Supplemental Data | | | | | | | | | | | |
Net Assets, End of Period (Millions) | | $28,549 | | $29,170 | | $23,101 | | $15,704 | | $13,752 | |
Ratio of Total Expenses to Average Net Assets3 | | 0.32% | | 0.32% | | 0.32% | | 0.33% | | 0.34% | |
Ratio of Net Investment Income to Average Net Assets | | 1.34% | | 1.38% | | 1.14% | | 1.60% | | 1.47% | |
Portfolio Turnover Rate | | 13% | | 16% | | 15% | | 29% | | 29% | |
1 Calculated based on average shares outstanding.
2 Total returns do not include account service fees that may have applied in the periods shown. Fund prospectuses provide information about any applicable account service fees.
3 Includes performance-based investment advisory fee increases (decreases) of 0.03%, 0.03%, 0.03%, 0.04%, and 0.03%.
See accompanying Notes, which are an integral part of the Financial Statements.
21
International Growth Fund
Notes to Financial Statements
Vanguard International Growth Fund is registered under the Investment Company Act of 1940 as an open-end investment company, or mutual fund. The fund invests in securities of foreign issuers, which may subject it to investment risks not normally associated with investing in securities of U.S. corporations. The fund offers two classes of shares: Investor Shares and Admiral Shares. Each of the share classes has different eligibility and minimum purchase requirements, and is designed for different types of investors.
A. The following significant accounting policies conform to generally accepted accounting principles for U.S. investment companies. The fund consistently follows such policies in preparing its financial statements.
1. Security Valuation: Securities are valued as of the close of trading on the New York Stock Exchange (generally 4 p.m., Eastern time) on the valuation date. Equity securities are valued at the latest quoted sales prices or official closing prices taken from the primary market in which each security trades; such securities not traded on the valuation date are valued at the mean of the latest quoted bid and asked prices. Securities for which market quotations are not readily available, or whose values have been affected by events occurring before the fund’s pricing time but after the close of the securities’ primary markets, are valued at their fair values calculated according to procedures adopted by the board of trustees. These procedures include obtaining quotations from an independent pricing service, monitoring news to identify significant market- or security-specific events, and evaluating changes in the values of foreign market proxies (for example, ADRs, futures contracts, or exchange-traded funds), between the time the foreign markets close and the fund’s pricing time. When fair-value pricing is employed, the prices of securities used by a fund to calculate its net asset value may differ from quoted or published prices for the same securities. Investments in Vanguard Market Liquidity Fund are valued at that fund’s net asset value. Temporary cash investments are valued using the latest bid prices or using valuations based on a matrix system (which considers such factors as security prices, yields, maturities, and ratings), both as furnished by independent pricing services.
2. Foreign Currency: Securities and other assets and liabilities denominated in foreign currencies are translated into U.S. dollars using exchange rates obtained from an independent third party as of the fund’s pricing time on the valuation date. Realized gains (losses) and unrealized appreciation (depreciation) on investment securities include the effects of changes in exchange rates since the securities were purchased, combined with the effects of changes in security prices. Fluctuations in the value of other assets and liabilities resulting from changes in exchange rates are recorded as unrealized foreign currency gains (losses) until the assets or liabilities are settled in cash, at which time they are recorded as realized foreign currency gains (losses).
3. Futures and Forward Currency Contracts: The fund uses index futures contracts to a limited extent, with the objective of maintaining full exposure to the stock market while maintaining liquidity. The fund may purchase or sell futures contracts to achieve a desired level of investment, whether to accommodate portfolio turnover or cash flows from capital share transactions. The primary risks associated with the use of futures contracts are imperfect correlation between changes in market values of stocks held by the fund and the prices of futures contracts, and the possibility of an illiquid market. Counterparty risk involving futures is mitigated because a regulated clearinghouse is the counterparty instead of the clearing broker. To further mitigate counterparty risk, the fund trades futures contracts on an exchange, monitors the financial strength of its clearing brokers and
22
International Growth Fund
clearinghouse, and has entered into clearing agreements with its clearing brokers. The clearinghouse imposes initial margin requirements to secure the fund’s performance and requires daily settlement of variation margin representing changes in the market value of each contract. Any assets pledged as initial margin for open contracts are noted in the Statement of Net Assets.
The fund enters into forward currency contracts to provide the appropriate currency exposure related to any open futures contracts or to protect the value of securities and related receivables and payables against changes in foreign exchange rates. The fund’s risks in using these contracts include movement in the values of the foreign currencies relative to the U.S. dollar and the ability of the counterparties to fulfill their obligations under the contracts. The fund mitigates its counterparty risk by entering into forward currency contracts only with a diverse group of prequalified counterparties, monitoring their financial strength, entering into master netting arrangements with its counterparties, and requiring its counterparties to transfer collateral as security for their performance. In the absence of a default, the collateral pledged or received by the fund cannot be repledged, resold, or rehypothecated. The master netting arrangements provide that, in the event of a counterparty’s default (including bankruptcy), the fund may terminate the forward currency contracts, determine the net amount owed by either party in accordance with its master netting arrangements, and sell or retain any collateral held up to the net amount owed to the fund under the master netting arrangements. The forward currency contracts contain provisions whereby a counterparty may terminate open contracts if the fund’s net assets decline below a certain level, triggering a payment by the fund if the fund is in a net liability position at the time of the termination. The payment amount would be reduced by any collateral the fund has pledged. Any assets pledged as collateral for open contracts are noted in the Statement of Net Assets. The value of collateral received or pledged is compared daily to the value of the forward currency contracts exposure with each counterparty, and any difference, if in excess of a specified minimum transfer amount, is adjusted and settled within two business days.
Futures contracts are valued at their quoted daily settlement prices. Forward currency contracts are valued at their quoted daily prices obtained from an independent third party, adjusted for currency risk based on the expiration date of each contract. The notional amounts of the contracts are not recorded in the Statement of Net Assets. Fluctuations in the value of the contracts are recorded in the Statement of Assets and Liabilities as an asset (liability) and in the Statement of Operations as unrealized appreciation (depreciation) until the contracts are closed, when they are recorded as realized gains (losses) on futures or forward currency contracts.
During the year ended August 31, 2019, the fund’s average investments in long and short futures contracts represented less than 1% and 0% of net assets, respectively, based on the average of the notional amounts at each quarter-end during the period. The fund’s average investment in forward currency contracts represented 1% of net assets, based on the average of the notional amounts at each quarter-end during the period.
4. Federal Income Taxes: The fund intends to continue to qualify as a regulated investment company and distribute all of its taxable income. Management has analyzed the fund’s tax positions taken for all open federal income tax years (August 31, 2016–2019), and has concluded that no provision for federal income tax is required in the fund’s financial statements.
23
International Growth Fund
5. Distributions: Distributions to shareholders are recorded on the ex-dividend date. Distributions are determined on a tax basis and may differ from net investment income and realized capital gains for financial reporting purposes.
6. Securities Lending: To earn additional income, the fund lends its securities to qualified institutional borrowers. Security loans are subject to termination by the fund at any time, and are required to be secured at all times by collateral in an amount at least equal to the market value of securities loaned. Daily market fluctuations could cause the value of loaned securities to be more or less than the value of the collateral received. When this occurs, the collateral is adjusted and settled before the opening of the market on the next business day. The fund further mitigates its counterparty risk by entering into securities lending transactions only with a diverse group of prequalified counterparties, monitoring their financial strength, and entering into master securities lending agreements with its counterparties. The master securities lending agreements provide that, in the event of a counterparty’s default (including bankruptcy), the fund may terminate any loans with that borrower, determine the net amount owed, and sell or retain the collateral up to the net amount owed to the fund; however, such actions may be subject to legal proceedings. While collateral mitigates counterparty risk, in the event of a default, the fund may experience delays and costs in recovering the securities loaned. The fund invests cash collateral received in Vanguard Market Liquidity Fund, and records a liability in the Statement of Assets and Liabilities for the return of the collateral, during the period the securities are on loan. Securities lending income represents fees charged to borrowers plus income earned on invested cash collateral, less expenses associated with the loan. During the term of the loan, the fund is entitled to all distributions made on or in respect of the loaned securities.
7. Credit Facility: The fund and certain other funds managed by The Vanguard Group (“Vanguard”) participate in a $4.3 billion committed credit facility provided by a syndicate of lenders pursuant to a credit agreement that may be renewed annually; each fund is individually liable for its borrowings, if any, under the credit facility. Borrowings may be utilized for temporary and emergency purposes, and are subject to the fund’s regulatory and contractual borrowing restrictions. The participating funds are charged administrative fees and an annual commitment fee of 0.10% of the undrawn amount of the facility; these fees are allocated to the funds based on a method approved by the fund’s board of trustees and included in Management and Administrative expenses on the fund’s Statement of Operations. Any borrowings under this facility bear interest at a rate based upon the higher of the one-month London Interbank Offered Rate, federal funds effective rate, or overnight bank funding rate plus an agreed-upon spread.
The fund had no borrowings outstanding at August 31, 2019, or at any time during the period then ended.
8. Other: Dividend income is recorded on the ex-dividend date. Interest income includes income distributions received from Vanguard Market Liquidity Fund and is accrued daily. Premiums and discounts on debt securities purchased are amortized and accreted, respectively, to interest income over the lives of the respective securities. Security transactions are accounted for on the date securities are bought or sold. Costs used to determine realized gains (losses) on the sale of investment securities are those of the specific securities sold.
24
International Growth Fund
Withholding taxes on foreign dividends and capital gains have been provided for in accordance with the fund’s understanding of the applicable countries’ tax rules and rates. The fund has filed tax reclaims for previously withheld taxes on dividends earned in certain European Union countries. These filings are subject to various administrative and judicial proceedings within these countries. Such tax reclaims received during the year, if any, are included in dividend income. No other amounts for additional tax reclaims are reflected in the financial statements due to their uncertainty as to the ultimate resolution of proceedings, the likelihood of receipt of these reclaims, and the potential timing of payment.
Each class of shares has equal rights as to assets and earnings, except that each class separately bears certain class-specific expenses related to maintenance of shareholder accounts (included in Management and Administrative expenses) and shareholder reporting. Marketing and distribution expenses are allocated to each class of shares based on a method approved by the board of trustees. Income, other non-class-specific expenses, and gains and losses on investments are allocated to each class of shares based on its relative net assets.
B. The investment advisory firms Baillie Gifford Overseas Ltd. and Schroder Investment Management North America Inc. each provide investment advisory services to a portion of the fund for a fee calculated at an annual percentage rate of average net assets managed by the advisor. The basic fee of Baillie Gifford Overseas Ltd. and Schroder Investment Management North America Inc. are subject to quarterly adjustments based on performance relative to the MSCI All Country World Index ex USA for the preceding three years.
Vanguard manages the cash reserves of the fund as described below.
For the year ended August 31, 2019, the aggregate investment advisory fee represented an effective annual basic rate of 0.14% of the fund’s average net assets, before an increase of $10,483,000 (0.03%) based on performance.
C. In accordance with the terms of a Funds’ Service Agreement (the “FSA”) between Vanguard and the fund, Vanguard furnishes to the fund investment advisory, corporate management, administrative, marketing, and distribution services at Vanguard’s cost of operations (as defined by the FSA). These costs of operations are allocated to the fund based on methods and guidelines approved by the board of trustees. Vanguard does not require reimbursement in the current period for certain costs of operations (such as deferred compensation/benefits and risk/insurance costs); the fund’s liability for these costs of operations is included in Payables to Vanguard on the Statement of Assets and Liabilities. All other costs of operations payable to Vanguard are generally settled twice a month.
Upon the request of Vanguard, the fund may invest up to 0.40% of its net assets as capital in Vanguard. At August 31, 2019, the fund had contributed to Vanguard capital in the amount of $1,731,000, representing less than 0.01% of the fund’s net assets and 0.69% of Vanguard’s capital received pursuant to the FSA. The fund’s trustees and officers are also directors and employees, respectively, of Vanguard.
D. Various inputs may be used to determine the value of the fund’s investments. These inputs are summarized in three broad levels for financial statement purposes. The inputs or methodologies used to value securities are not necessarily an indication of the risk associated with investing in those securities.
25
International Growth Fund
Level 1—Quoted prices in active markets for identical securities.
Level 2—Other significant observable inputs (including quoted prices for similar securities, interest rates, prepayment speeds, credit risk, etc.).
Level 3—Significant unobservable inputs (including the fund’s own assumptions used to determine the fair value of investments). Any investments valued with significant unobservable inputs are noted on the Statement of Net Assets.
The following table summarizes the market value of the fund’s investments and derivatives as of August 31, 2019, based on the inputs used to value them:
| Level 1 | Level 2 | Level 3 |
Investments | ($000) | ($000) | ($000) |
Common Stocks—North and South America | 4,153,275 | — | — |
Common Stocks—Other | 4,175,014 | 26,678,402 | 49,455 |
Preferred Stocks | — | — | 147,389 |
Temporary Cash Investments | 1,243,718 | 20,311 | — |
Futures Contracts—Assets1 | 2,516 | — | — |
Futures Contracts—Liabilities1 | (17) | — | — |
Forward Currency Contracts—Assets | — | 5,679 | — |
Forward Currency Contracts—Liabilities | — | (11,097) | — |
Total | 9,574,506 | 26,693,295 | 196,844 |
1 Represents variation margin on the last day of the reporting period.
E. At August 31, 2019, the fair values of derivatives were reflected in the Statement of Assets and Liabilities as follows:
| | Foreign | |
| Equity | Exchange | |
| Contracts | Contracts | Total |
Statement of Assets and Liabilities Caption | ($000) | ($000) | ($000) |
Variation Margin Receivable—Futures Contracts | 2,516 | — | 2,516 |
Unrealized Appreciation—Forward Currency Contracts | — | 5,679 | 5,679 |
Total Assets | 2,516 | 5,679 | 8,195 |
| | | |
Variation Margin Payable—Futures Contracts | (17) | — | (17) |
Unrealized Depreciation—Forward Currency Contracts | — | (11,097) | (11,097) |
Total Liabilities | (17) | (11,097) | (11,114) |
26
International Growth Fund
Realized net gain (loss) and the change in unrealized appreciation (depreciation) on derivatives for the year ended August 31, 2019, were:
| | Foreign | |
| Equity | Exchange | |
| Contracts | Contracts | Total |
Realized Net Gain (Loss) on Derivatives | ($000) | ($000) | ($000) |
Futures Contracts | 2,687 | — | 2,687 |
Forward Currency Contracts | — | (19,337) | (19,337) |
Realized Net Gain (Loss) on Derivatives | 2,687 | (19,337) | (16,650) |
| | | |
Change in Unrealized Appreciation (Depreciation) on Derivatives | | | |
Futures Contracts | (434) | — | (434) |
Forward Currency Contracts | — | 3,840 | 3,840 |
Change in Unrealized Appreciation (Depreciation) on Derivatives | (434) | 3,840 | 3,406 |
F. Permanent differences between book-basis and tax-basis components of net assets are reclassified among capital accounts in the financial statements to reflect their tax character. These reclassifications have no effect on net assets or net asset value per share. As of period end, permanent differences primarily attributable to the accounting for foreign currency transactions and passive foreign investment companies were reclassified between the individual components of total distributable earnings (loss).
| Amount |
| ($000) |
Paid-in Capital | — |
Total Distributable Earnings (Loss) | — |
Temporary differences between book-basis and tax-basis components of total distributable earnings (loss) arise when certain items of income, gain, or loss are recognized in different periods for financial statement and tax purposes; these differences will reverse at some time in the future. The differences are primarily related to the tax deferral on wash sales, the realization of unrealized gains or losses on certain futures contracts, unrealized gains on passive foreign investment companies and the deferral of post-October capital losses to future periods. As of period end, the tax-basis components of total distributable earnings (loss) are detailed in the table as follows:
| Amount |
| ($000) |
Undistributed Ordinary Income | 370,642 |
Undistributed Long-Term Gains | — |
Capital Loss Carryforwards1 | (195,415) |
Net Unrealized Gains (Losses) | 9,597,187 |
1 Includes losses of $195,415,000 realized subsequent to October 31, 2018, which are deferred and will be treated as realized for tax purposes in the next fiscal year.
27
International Growth Fund
As of August 31, 2019, gross unrealized appreciation and depreciation for investments and derivatives based on cost for U.S. federal income tax purposes were as follows:
| Amount |
| ($000) |
Tax Cost | 26,867,576 |
Gross Unrealized Appreciation | 12,284,290 |
Gross Unrealized Depreciation | (2,685,161) |
Net Unrealized Appreciation (Depreciation) | 9,599,129 |
G. During the year ended August 31, 2019, the fund purchased $5,214,820,000 of investment securities and sold $4,648,035,000 of investment securities, other than temporary cash investments.
H. Capital share transactions for each class of shares were:
| Year Ended August 31, |
| 2019 | | 2018 |
| Amount | Shares | | Amount | Shares |
| ($000) | (000) | | ($000) | (000) |
Investor Shares | | | | | |
Issued | 945,569 | 33,667 | | 2,130,616 | 68,838 |
Issued in Lieu of Cash Distributions | 322,714 | 12,842 | | 64,011 | 2,138 |
Redeemed | (1,553,116) | (55,661) | | (2,620,783) | (84,901) |
Net Increase (Decrease)—Investor Shares | (284,833) | (9,152) | | (426,156) | (13,925) |
Admiral Shares | | | | | |
Issued | 5,613,299 | 63,290 | | 7,766,732 | 78,708 |
Issued in Lieu of Cash Distributions | 1,174,401 | 14,695 | | 199,790 | 2,098 |
Redeemed | (4,795,611) | (54,277) | | (4,304,615) | (43,465) |
Net Increase (Decrease)—Admiral Shares | 1,992,089 | 23,708 | | 3,661,907 | 37,341 |
28
International Growth Fund
I. Certain of the fund’s investments are in companies that are considered to be affiliated companies of the fund because the fund owns more than 5% of the outstanding voting securities of the company or the issuer is another member of The Vanguard Group. Transactions during the period in securities of these companies were as follows:
| | Current Period Transactions | |
| Aug. 31, | | Proceeds | Realized | | | | Aug. 31, |
| 2018 | | from | Net | Change in | | Capital Gain | 2019 |
| Market | Purchases | Securities | Gain | Unrealized | | Distributions | Market |
| Value | at Cost | Sold | (Loss) | App. (Dep.) | Income | Received | Value |
| ($000) | ($000) | ($000) | ($000) | ($000) | ($000) | ($000) | ($000) |
HelloFresh SE | 150,128 | — | — | — | (12,163) | — | — | 137,965 |
Home 24 SE | NA1 | — | — | — | (47,981) | — | — | 6,147 |
Jumia Technologies AG ADR | — | 97,510 | — | — | (22,528) | — | — | 74,982 |
Vanguard FTSE All-World ex-US ETF | 58,780 | — | — | — | (3,656) | 1,667 | — | 55,124 |
Vanguard Market Liquidity Fund | 956,789 | NA2 | NA2 | 214 | (87) | 11,685 | — | 1,243,718 |
You & Mr. Jones | 46,054 | — | — | — | 81,626 | — | — | 127,680 |
Total | 1,211,751 | | | 214 | (4,789) | 13,352 | — | 1,645,616 |
1 Not applicable—at August 31, 2018, the issuer was not an affiliated company of the fund.
2 Not applicable—purchases and sales are for temporary cash investment purposes.
J. Management has determined that no events or transactions occurred subsequent to August 31, 2019, that would require recognition or disclosure in these financial statements.
29
Report of Independent Registered Public Accounting Firm
To the Board of Trustees of Vanguard World Fund and Shareholders of Vanguard International Growth Fund
Opinion on the Financial Statements
We have audited the accompanying statement of net assets and statement of assets and liabilities of Vanguard International Growth Fund (one of the funds constituting Vanguard World Fund, referred to hereafter as the “Fund”) as of August 31, 2019, the related statement of operations for the year ended August 31, 2019, the statement of changes in net assets for each of the two years in the period ended August 31, 2019, including the related notes, and the financial highlights for each of the five years in the period ended August 31, 2019 (collectively referred to as the “financial statements”). In our opinion, the financial statements present fairly, in all material respects, the financial position of the Fund as of August 31, 2019, the results of its operations for the year then ended, the changes in its net assets for each of the two years in the period ended August 31, 2019 and the financial highlights for each of the five years in the period ended August 31, 2019 in conformity with accounting principles generally accepted in the United States of America.
Basis for Opinion
These financial statements are the responsibility of the Fund’s management. Our responsibility is to express an opinion on the Fund’s financial statements based on our audits. We are a public accounting firm registered with the Public Company Accounting Oversight Board (United States) (“PCAOB”) and are required to be independent with respect to the Fund in accordance with the U.S. federal securities laws and the applicable rules and regulations of the Securities and Exchange Commission and the PCAOB.
We conducted our audits of these financial statements in accordance with the standards of the PCAOB. Those standards require that we plan and perform the audit to obtain reasonable assurance about whether the financial statements are free of material misstatement, whether due to error or fraud.
Our audits included performing procedures to assess the risks of material misstatement of the financial statements, whether due to error or fraud, and performing procedures that respond to those risks. Such procedures included examining, on a test basis, evidence regarding the amounts and disclosures in the financial statements. Our audits also included evaluating the accounting principles used and significant estimates made by management, as well as evaluating the overall presentation of the financial statements. Our procedures included confirmation of securities owned as of August 31, 2019 by correspondence with the custodians and brokers and by agreement to the underlying ownership records of the transfer agent; when replies were not received from brokers, we performed other auditing procedures. We believe that our audits provide a reasonable basis for our opinion.
/s/PricewaterhouseCoopers LLP
Philadelphia, Pennsylvania
October 18, 2019
We have served as the auditor of one or more investment companies in The Vanguard Group of Funds since 1975.
30
Special 2019 tax information (unaudited) for Vanguard International Growth Fund
This information for the fiscal year ended August 31, 2019, is included pursuant to provisions of the Internal Revenue Code.
The fund distributed $431,456,000 of qualified dividend income to shareholders during the fiscal year.
The fund designates to shareholders foreign source income of $583,834,000 and foreign taxes paid of $47,060,000. Shareholders will receive more detailed information with their Form 1099-DIV in January 2020 to determine the calendar-year amounts to be included on their 2019 tax returns.
31
This page intentionally left blank.
This page intentionally left blank.
This page intentionally left blank.
The People Who Govern Your Fund
The trustees of your mutual fund are there to see that the fund is operated and managed in your best interests since, as a shareholder, you are a part owner of the fund. Your fund’s trustees also serve on the board of directors of The Vanguard Group, Inc., which is owned by the Vanguard funds and provides services to them.
A majority of Vanguard’s board members are independent, meaning that they have no affiliation with Vanguard or the funds they oversee, apart from the sizable personal investments they have made as private individuals. The independent board members have distinguished backgrounds in business, academia, and public service. Each of the trustees and executive officers oversees 212 Vanguard funds.
Information for each trustee and executive officer of the fund appears below. The mailing address of the trustees and officers is P.O. Box 876, Valley Forge, PA 19482. More information about the trustees is in the Statement of Additional Information, which can be obtained, without charge, by contacting Vanguard at 800-662-7447, or online at vanguard.com.
Interested Trustee1
Mortimer J. Buckley
Born in 1969. Trustee since January 2018. Principal occupation(s) during the past five years and other experience: chairman of the board (January 2019–present) of Vanguard and of each of the investment companies served by Vanguard; chief executive officer (January 2018–present) of Vanguard; chief executive officer, president, and trustee (January 2018–present) of each of the investment companies served by Vanguard; president and director (2017–present) of Vanguard; and president (February 2018–present) of Vanguard Marketing Corporation. Chief investment officer (2013–2017), managing director (2002–2017), head of the Retail Investor Group (2006–2012), and chief information officer (2001–2006) of Vanguard. Chairman of the board (2011–2017) and trustee (2009–2017) of the Children’s Hospital of Philadelphia; trustee (2018–present) of The Shipley School.
Independent Trustees
Emerson U. Fullwood
Born in 1948. Trustee since January 2008. Principal occupation(s) during the past five years and other experience: executive chief staff and marketing officer for North America and corporate vice president (retired 2008) of Xerox Corporation (document management products and services). Former president of the Worldwide Channels Group, Latin America, and Worldwide Customer Service and executive chief staff officer of Developing Markets of Xerox. Executive in residence and 2009–2010 Distinguished Minett Professor at the Rochester Institute of Technology. Director of SPX FLOW, Inc. (multi-industry manufacturing). Director of the University of Rochester Medical Center, the Monroe Community College Foundation, the United Way of Rochester, North Carolina A&T University, and Roberts Wesleyan College. Trustee of the University of Rochester.
Amy Gutmann
Born in 1949. Trustee since June 2006. Principal occupation(s) during the past five years and other experience: president (2004–present) of the University of Pennsylvania. Christopher H. Browne Distinguished Professor of Political Science, School of Arts and Sciences, and professor of communication, Annenberg School for Communication, with secondary faculty appointments in the Department of Philosophy, School of Arts and Sciences, and at the Graduate School of Education, University of Pennsylvania. Trustee of the National Constitution Center.
F. Joseph Loughrey
Born in 1949. Trustee since October 2009. Principal occupation(s) during the past five years and other experience: president and chief operating officer (retired 2009) and vice chairman of the board (2008–2009) of Cummins Inc. (industrial machinery). Chairman of the board of Hillenbrand, Inc. (specialized consumer services), and the Lumina Foundation.
1 Mr. Buckley is considered an “interested person,” as defined in the Investment Company Act of 1940, because he is an officer of the Vanguard funds.
Director of the V Foundation and Oxfam America. Member of the advisory council for the College of Arts and Letters and chair of the advisory board to the Kellogg Institute for International Studies, both at the University of Notre Dame.
Mark Loughridge
Born in 1953. Trustee since March 2012. Principal occupation(s) during the past five years and other experience: senior vice president and chief financial officer (retired 2013) of IBM (information technology services). Fiduciary member of IBM’s Retirement Plan Committee (2004–2013), senior vice president and general manager (2002–2004) of IBM Global Financing, vice president and controller (1998–2002) of IBM, and a variety of other prior management roles at IBM. Member of the Council on Chicago Booth.
Scott C. Malpass
Born in 1962. Trustee since March 2012. Principal occupation(s) during the past five years and other experience: chief investment officer (1989–present) and vice president (1996–present) of the University of Notre Dame. Assistant professor of finance at the Mendoza College of Business, University of Notre Dame, and member of the Notre Dame 403(b) Investment Committee. Chairman of the board of TIFF Advisory Services, Inc. Member of the board of Catholic Investment Services, Inc. (investment advisors) and the board of superintendence of the Institute for the Works of Religion.
Deanna Mulligan
Born in 1963. Trustee since January 2018. Principal occupation(s) during the past five years and other experience: president (2010–present) and chief executive officer (2011–present) of The Guardian Life Insurance Company of America. Chief operating officer (2010–2011) and executive vice president (2008–2010) of Individual Life and Disability of The Guardian Life Insurance Company of America. Member of the board of The Guardian Life Insurance Company of America, the American Council of Life Insurers, the Partnership for New York City (business leadership), and the Committee Encouraging Corporate Philanthropy. Trustee of the Economic Club of New York and the Bruce Museum (arts and science). Member of the Advisory Council for the Stanford Graduate School of Business.
André F. Perold
Born in 1952. Trustee since December 2004. Principal occupation(s) during the past five years and other experience: George Gund Professor of Finance and Banking, Emeritus at the Harvard Business School (retired 2011). Chief investment officer and co-managing partner of HighVista Strategies LLC (private investment firm). Board of advisors and investment committee member of the Museum of Fine Arts Boston. Board member (2018–present) of RIT Capital Partners (investment firm); investment committee member of Partners Health Care System.
Sarah Bloom Raskin
Born in 1961. Trustee since January 2018. Principal occupation(s) during the past five years and other experience: deputy secretary (2014–2017) of the United States Department of the Treasury. Governor (2010–2014) of the Federal Reserve Board. Commissioner (2007–2010) of financial regulation for the State of Maryland. Member of the board of directors (2012–2014) of Neighborhood Reinvestment Corporation. Director (2017–present) of i(x) Investments, LLC; director (2017–present) of Reserve Trust. Rubinstein Fellow (2017–present) of Duke University; trustee (2017–present) of Amherst College.
Peter F. Volanakis
Born in 1955. Trustee since July 2009. Principal occupation(s) during the past five years and other experience: president and chief operating officer (retired 2010) of Corning Incorporated (communications equipment) and director of Corning Incorporated (2000–2010) and Dow Corning (2001–2010). Director (2012) of SPX Corporation (multi-industry manufacturing). Overseer of the Amos Tuck School of Business Administration, Dartmouth College (2001–2013). Chairman of the board of trustees of Colby-Sawyer College. Member of the board of Hypertherm Inc. (industrial cutting systems, software, and consumables).
Executive Officers
Glenn Booraem
Born in 1967. Principal occupation(s) during the past five years and other experience: principal of Vanguard. Investment stewardship officer (2017–present), treasurer (2015–2017), controller (2010–2015), and assistant controller (2001–2010) of each of the investment companies served by Vanguard.
Christine M. Buchanan
Born in 1970. Principal occupation(s) during the past five years and other experience: principal of Vanguard and global head of Fund Administration at Vanguard. Treasurer (2017–present) of each of the investment companies served by Vanguard. Partner (2005–2017) at KPMG LLP (audit, tax, and advisory services).
Thomas J. Higgins
Born in 1957. Principal occupation(s) during the past five years and other experience: principal of Vanguard. Chief financial officer (2008–present) and treasurer (1998–2008) of each of the investment companies served by Vanguard.
Peter Mahoney
Born in 1974. Principal occupation(s) during the past five years and other experience: principal of Vanguard. Controller (2015–present) of each of the investment companies served by Vanguard. Head of International Fund Services (2008–2014) at Vanguard.
Anne E. Robinson
Born in 1970. Principal occupation(s) during the past five years and other experience: general counsel (2016–present) of Vanguard. Secretary (2016–present) of Vanguard and of each of the investment companies served by Vanguard. Managing director (2016–present) of Vanguard. Director and senior vice president (2016–2018) of Vanguard Marketing Corporation. Managing director and general counsel of Global Cards and Consumer Services (2014–2016) at Citigroup. Counsel (2003–2014) at American Express.
Michael Rollings
Born in 1963. Principal occupation(s) during the past five years and other experience: finance director (2017–present) and treasurer (2017) of each of the investment companies served by Vanguard. Managing director (2016–present) of Vanguard. Chief financial officer (2016–present) of Vanguard. Director (2016–present) of Vanguard Marketing Corporation. Executive vice president and chief financial officer (2006–2016) of MassMutual Financial Group.
John E. Schadl
Born in 1972. Principal occupation(s) during the past five years and other experience: principal of Vanguard. Chief compliance officer (2019–present) of Vanguard and of each of the investment companies served by Vanguard. Assistant vice president (May 2019–present) of Vanguard Marketing Corporation.
Vanguard Senior Management Team
Joseph Brennan | Chris D. McIsaac |
Mortimer J. Buckley | James M. Norris |
Gregory Davis | Thomas M. Rampulla |
John James | Karin A. Risi |
Martha G. King | Anne E. Robinson |
John T. Marcante | Michael Rollings |
| 
|
| |
| P.O. Box 2600 |
| Valley Forge, PA 19482-2600 |
Connect with Vanguard® > vanguard.com
Fund Information > 800-662-7447
Direct Investor Account Services > 800-662-2739
Institutional Investor Services > 800-523-1036
Text Telephone for People
Who Are Deaf or Hard of Hearing > 800-749-7273
This material may be used in conjunction with the offering of shares of any Vanguard fund only if preceded or accompanied by the fund’s current prospectus.
All comparative mutual fund data are from Morningstar, Inc., unless otherwise noted.
You can obtain a free copy of Vanguard’s proxy voting guidelines by visiting vanguard.com/proxyreporting or by calling Vanguard at 800-662-2739. The guidelines are also available from the SEC’s website, www.sec.gov. In addition, you may obtain a free report on how your fund voted the proxies for securities it owned during the 12 months ended June 30. To get the report, visit either vanguard.com/proxyreporting or www.sec.gov.
You can review information about your fund on the SEC’s website, and you can receive copies of this information, for a fee, by sending a request via email addressed to publicinfo@sec.gov.
Source for Bloomberg Barclays indexes: Bloomberg Index Services Limited. Copyright 2019, Bloomberg. All rights reserved.
CFA® is a registered trademark owned by CFA Institute.
| © 2019 The Vanguard Group, Inc. |
| All rights reserved. |
| Vanguard Marketing Corporation, Distributor. |
| |
| Q810 102019 |

Annual Report | August 31, 2019 Vanguard FTSE Social Index Fund |
See the inside front cover for important information about access to your fund’s annual and semiannual shareholder reports. |
Important information about access to shareholder reports
Beginning on January 1, 2021, as permitted by regulations adopted by the Securities and Exchange Commission, paper copies of your fund’s annual and semiannual shareholder reports will no longer be sent to you by mail, unless you specifically request them. Instead, you will be notified by mail each time a report is posted on the website and will be provided with a link to access the report.
If you have already elected to receive shareholder reports electronically, you will not be affected by this change and do not need to take any action. You may elect to receive shareholder reports and other communications from the fund electronically by contacting your financial intermediary (such as a broker-dealer or bank) or, if you invest directly with the fund, by calling Vanguard at one of the phone numbers on the back cover of this report or by logging on to vanguard.com.
You may elect to receive paper copies of all future shareholder reports free of charge. If you invest through a financial intermediary, you can contact the intermediary to request that you continue to receive paper copies. If you invest directly with the fund, you can call Vanguard at one of the phone numbers on the back cover of this report or log on to vanguard.com. Your election to receive paper copies will apply to all the funds you hold through an intermediary or directly with Vanguard.
Contents | |
| |
A Note From Our Chairman | 1 |
| |
Your Fund’s Performance at a Glance | 2 |
| |
About Your Fund’s Expenses | 3 |
| |
Performanc Summary | 5 |
| |
Financial Statements | 8 |
| |
Trustees Approve Advisory Arrangement | 27 |
Please note: The opinions expressed in this report are just that—informed opinions. They should not be considered promises or advice. Also, please keep in mind that the information and opinions cover the period through the date on the front of this report. Of course, the risks of investing in your fund are spelled out in the prospectus.
A Note From Our Chairman

Tim Buckley
Chairman and Chief Executive Officer
Dear Shareholder,
Recent volatility in financial markets—affecting stocks, bonds, and commodities—has been a good reminder of the wise old adage, “Never keep all your eggs in one basket.” Maintaining balance and diversification in your investment portfolio can help to both limit risk and set you up for long-term success.
It’s understandable why some investors might become complacent after a long market run-up like the one that lifted stock prices, especially U.S. stock prices, in the years following the global financial crisis. But failing to rebalance regularly can leave a portfolio with a much different mix of assets than intended and, often, more risk than intended.
Balance across and diversification within asset classes are powerful tools for managing risk and achieving your investment goals. A portfolio’s allocation will determine a large portion of its long-term return and also the majority of its volatility risk. A well-diversified portfolio is less vulnerable to significant swings in the performance of any one segment of the asset classes in which it invests.
Balance and diversification will never eliminate the risk of loss, nor will they guarantee positive returns in a declining market. But they should reduce the chance that you’ll suffer disproportionate losses in one particular high-flying asset class or sector when it comes back to earth. And exposure to all key market components should give you at least some participation in the sectors that are performing best at any given time.
Vanguard is committed to helping you achieve balance and diversification in your portfolios to help meet your investment goals. We thank you for your continued loyalty.
Sincerely,

Mortimer J. Buckley
Chairman and Chief Executive Officer
October 1, 2019
1
Your Fund’s Performance at a Glance
· For the 12 months ended August 31, 2019, Vanguard FTSE Social Index Fund returned 3.53% for Investor Shares and 3.58% for Institutional Shares. Those results were roughly in line with that of its socially conscious benchmark after taking the costs of running the fund into account.
· As part of our ongoing efforts to broaden the availability of low-cost investments, Vanguard launched Admiral Shares of this fund on February 7, 2019. From inception through August 31, 2019, this share class returned 9.85%.
· With global growth slowing and trade disputes escalating, U.S. stocks had a rocky run, dropping sharply toward the end of 2018 and then rebounding. Eight of the fund’s ten industry sectors advanced for the 12 months. Utilities, telecommunications, and consumer services produced double-digit returns. Health care and oil & gas were the laggards.
Market Barometer | | | | | | | |
| | Average Annual Total Returns | |
| | Periods Ended August 31, 2019 | |
| | One Year | | Three Years | | Five Years | |
Stocks | | | | | | | |
Russell 1000 Index (Large-caps) | | 2.49% | | 12.57% | | 9.85% | |
Russell 2000 Index (Small-caps) | | -12.89 | | 7.89 | | 6.41 | |
Russell 3000 Index (Broad U.S. market) | | 1.31 | | 12.24 | | 9.60 | |
FTSE All-World ex US Index (International) | | -3.18 | | 5.97 | | 1.71 | |
| | | | | | | |
Bonds | | | | | | | |
Bloomberg Barclays U.S. Aggregate Bond Index (Broad taxable market) | | 10.17% | | 3.09% | | 3.35% | |
Bloomberg Barclays Municipal Bond Index (Broad tax-exempt market) | | 8.72 | | 3.30 | | 3.85 | |
FTSE Three-Month U.S. Treasury Bill Index | | 2.36 | | 1.47 | | 0.91 | |
| | | | | | | |
CPI | | | | | | | |
Consumer Price Index | | 1.75% | | 2.13% | | 1.53% | |
2
About Your Fund’s Expenses
As a shareholder of the fund, you incur ongoing costs, which include costs for portfolio management, administrative services, and shareholder reports (like this one), among others. Operating expenses, which are deducted from a fund’s gross income, directly reduce the investment return of the fund.
A fund’s expenses are expressed as a percentage of its average net assets. This figure is known as the expense ratio. The following examples are intended to help you understand the ongoing costs (in dollars) of investing in your fund and to compare these costs with those of other mutual funds. The examples are based on an investment of $1,000 made at the beginning of the period shown and held for the entire period.
The accompanying table illustrates your fund’s costs in two ways:
· Based on actual fund return. This section helps you to estimate the actual expenses that you paid over the period. The “Ending Account Value” shown is derived from the fund’s actual return, and the third column shows the dollar amount that would have been paid by an investor who started with $1,000 in the fund. You may use the information here, together with the amount you invested, to estimate the expenses that you paid over the period.
To do so, simply divide your account value by $1,000 (for example, an $8,600 account value divided by $1,000 = 8.6), then multiply the result by the number given for your fund under the heading “Expenses Paid During Period.”
· Based on hypothetical 5% yearly return. This section is intended to help you compare your fund’s costs with those of other mutual funds. It assumes that the fund had a yearly return of 5% before expenses, but that the expense ratio is unchanged. In this case—because the return used is not the fund’s actual return—the results do not apply to your investment. The example is useful in making comparisons because the Securities and Exchange Commission requires all mutual funds to calculate expenses based on a 5% return. You can assess your fund’s costs by comparing this hypothetical example with the hypothetical examples that appear in shareholder reports of other funds.
Note that the expenses shown in the table are meant to highlight and help you compare ongoing costs only and do not reflect transaction costs incurred by the fund for buying and selling securities. Further, the expenses do not include any purchase, redemption, or account service fees described in the fund prospectus. If such fees were applied to your account, your costs would be higher. Your fund does not carry a “sales load.”
The calculations assume no shares were bought or sold during the period. Your actual costs may have been higher or lower, depending on the amount of your investment and the timing of any purchases or redemptions.
You can find more information about the fund’s expenses, including annual expense ratios, in the Financial Statements section of this report. For additional information on operating expenses and other shareholder costs, please refer to your fund’s current prospectus.
3
Six Months Ended August 31, 2019 | | | |
FTSE Social Index Fund | Beginning
Account Value
2/28/2019 | Ending
Account Value
8/31/2019 | Expenses
Paid During
Period |
Based on Actual Fund Return | | | |
Investor Shares | $1,000.00 | $1,066.12 | $0.94 |
Admiral™ Shares | 1,000.00 | 1,066.46 | 0.73 |
Institutional Shares | 1,000.00 | 1,066.42 | 0.63 |
Based on Hypothetical 5% Yearly Return | | | |
Investor Shares | $1,000.00 | $1,024.30 | $0.92 |
Admiral Shares | 1,000.00 | 1,024.50 | 0.71 |
Institutional Shares | 1,000.00 | 1,024.60 | 0.61 |
The calculations are based on expenses incurred in the most recent six-month period. The fund’s annualized six-month expense ratios for that period are 0.18% for Investor Shares, 0.14% for Admiral Shares, and 0.12% for Institutional Shares. The dollar amounts shown as “Expenses Paid” are equal to the annualized expense ratio multiplied by the average account value over the period, multiplied by the number of days in the most recent six-month period, then divided by the number of days in the most recent 12-month period (184/365).
4
FTSE Social Index Fund
Performance Summary
All of the returns in this report represent past performance, which is not a guarantee of future results that may be achieved by the fund. (Current performance may be lower or higher than the performance data cited. For performance data current to the most recent month-end, visit our website at vanguard.com/performance.) Note, too, that both investment returns and principal value can fluctuate widely, so an investor’s shares, when sold, could be worth more or less than their original cost. The returns shown do not reflect taxes that a shareholder would pay on fund distributions or on the sale of fund shares.
Cumulative Performance: August 31, 2009, Through August 31, 2019
Initial Investment of $10,000

| | | | Average Annual Total Returns | | |
| | | | Periods Ended August 31, 2019 | | |
| | | | | | | | | | Final Value |
| | | | One | | Five | | Ten | | of a $10,000 |
| | | | Year | | Years | | Years | | Investment |

| | FTSE Social Index Fund Investor Shares | | 3.53% | | 10.89% | | 13.85% | | $36,586 |

| | FTSE 4Good US Select Index | | 3.64 | | 11.08 | | 14.10 | | 37,382 |

| | Dow Jones U.S. Total Stock Market Float Adjusted Index | | 1.23 | | 9.55 | | 13.35 | | 35,018 |
| | | | | | | | Since | | Final Value |
| | | | | | | | Inception | | of a $10,000 |
| | | | | | | | (2/7/2019) | | Investment |
FTSE Social Index Fund Admiral Shares | | | | | | 9.85% | | $10,985 |
FTSE 4Good US Select Index | | | | | | 9.91 | | 10,991 |
Dow Jones U.S. Total Stock Market Float Adjusted Index | | | | | | 8.40 | | 10,840 |
“Since Inception” performance is calculated from the Admiral Shares’ inception date for both the fund and its comparative standards.
See Financial Highlights for dividend and capital gains information.
5
FTSE Social Index Fund
| | | | Average Annual Total Returns | | |
| | | | Periods Ended August 31, 2019 | | |
| | | | | | | | | | Final Value |
| | | | One | | Five | | Ten | | of a $5,000,000 |
| | | | Year | | Years | | Years | | Investment |
FTSE Social Index Fund Institutional Shares | | 3.58% | | 10.98% | | 13.97% | | $18,492,805 |
FTSE 4Good US Select Index | | 3.64 | | 11.08 | | 14.10 | | 18,691,211 |
Dow Jones U.S. Total Stock Market Float Adjusted Index | | 1.23 | | 9.55 | | 13.35 | | 17,509,140 |
| | | | | | | | | | | | |
6
FTSE Social Index Fund
Sector Diversification
As of August 31, 2019
Basic Materials | | 2.0 | % |
Consumer Goods | | 8.2 | |
Consumer Services | | 9.9 | |
Financials | | 22.1 | |
Health Care | | 15.8 | |
Industrials | | 9.6 | |
Oil & Gas | | 2.6 | |
Technology | | 28.6 | |
Telecommunications | | 0.1 | |
Utilities | | 1.1 | |
The table reflects the fund’s equity exposure, based on its investments in stocks and stock index futures. Any holdings in short-term reserves are excluded. Sector categories are based on the Industry Classification Benchmark (“ICB”), except for the “Other” category (if applicable), which includes securities that have not been provided an ICB classification as of the effective reporting period.
The Industry Classification Benchmark (“ICB”) is owned by FTSE. FTSE does not accept any liability to any person for any loss or damage arising out of any error or omission in the ICB.
7
FTSE Social Index Fund
Financial Statements
Statement of Net Assets
As of August 31, 2019
The fund files its complete schedule of portfolio holdings with the Securities and Exchange Commission (SEC) for the first and third quarters of each fiscal year as an exhibit to its reports on Form N-PORT. The fund’s Form N-PORT reports are available on the SEC’s website at www.sec.gov.
| | | | | | Market | |
| | | | | | Value· | |
| | | | Shares | | ($000 | ) |
Common Stocks (99.8%)1 | | | | | |
Basic Materials (2.0%) | | | | | |
| | Linde plc | | 177,627 | | 33,556 | |
| | Ecolab Inc. | | 82,568 | | 17,035 | |
| | Air Products & Chemicals Inc. | | 71,833 | | 16,228 | |
| | Newmont Goldcorp Corp. | | 267,246 | | 10,660 | |
| | PPG Industries Inc. | | 77,005 | | 8,531 | |
| | LyondellBasell Industries NV Class A | | 95,578 | | 7,396 | |
| | Nucor Corp. | | 98,994 | | 4,849 | |
| | International Flavors & Fragrances Inc. | | 34,619 | | 3,799 | |
| | FMC Corp. | | 43,310 | | 3,739 | |
| | CF Industries Holdings Inc. | | 72,439 | | 3,491 | |
| | Avery Dennison Corp. | | 27,540 | | 3,183 | |
| | Albemarle Corp. | | 34,560 | | 2,133 | |
| | Mosaic Co. | | 115,254 | | 2,120 | |
| | Steel Dynamics Inc. | | 69,500 | | 1,876 | |
| | Ashland Global Holdings Inc. | | 21,258 | | 1,557 | |
* | | Alcoa Corp. | | 60,437 | | 1,084 | |
| | Westlake Chemical Corp. | | 11,821 | | 693 | |
| | | | | | 121,930 | |
Consumer Goods (8.2%) | | | | | |
| | Procter & Gamble Co. | | 808,847 | | 97,248 | |
| | PepsiCo Inc. | | 458,470 | | 62,687 | |
| | NIKE Inc. Class B | | 403,042 | | 34,057 | |
| | Mondelez International Inc. Class A | | 465,117 | | 25,684 | |
| | Colgate-Palmolive Co. | | 274,966 | | 20,389 | |
| | Kimberly-Clark Corp. | | 111,700 | | 15,762 | |
| | General Motors Co. | | 404,585 | | 15,006 | |
| | Estee Lauder Cos. Inc. Class A | | 70,431 | | 13,945 | |
| | Activision Blizzard Inc. | | 247,729 | | 12,535 | |
| | Ford Motor Co. | | 1,278,647 | | 11,725 | |
| | General Mills Inc. | | 196,259 | | 10,559 | |
*,^ | | Tesla Inc. | | 46,066 | | 10,393 | |
* | | Electronic Arts Inc. | | 96,135 | | 9,006 | |
| | Tyson Foods Inc. Class A | | 94,354 | | 8,779 | |
| | VF Corp. | | 100,643 | | 8,248 | |
| | Hershey Co. | | 47,068 | | 7,459 | |
* | | Monster Beverage Corp. | | 126,545 | | 7,424 | |
* | | Lululemon Athletica Inc. | | 38,541 | | 7,117 | |
| | Aptiv plc | | 84,251 | | 7,007 | |
| | Clorox Co. | | 41,762 | | 6,605 | |
| | McCormick & Co. Inc. | | 40,264 | | 6,558 | |
| | Church & Dwight Co. Inc. | | 80,796 | | 6,446 | |
| | DR Horton Inc. | | 111,512 | | 5,517 | |
| | Kraft Heinz Co. | | 204,273 | | 5,213 | |
| | Kellogg Co. | | 79,975 | | 5,022 | |
* | | Take-Two Interactive Software Inc. | | 36,500 | | 4,817 | |
| | Lennar Corp. Class A | | 91,641 | | 4,674 | |
| | Conagra Brands Inc. | | 157,104 | | 4,455 | |
| | Genuine Parts Co. | | 45,809 | | 4,136 | |
| | Garmin Ltd. | | 47,628 | | 3,885 | |
| | Hormel Foods Corp. | | 90,925 | | 3,874 | |
| | JM Smucker Co. | | 35,753 | | 3,760 | |
| | Lamb Weston Holdings Inc. | | 48,118 | | 3,387 | |
| | Coca-Cola European Partners plc | | 58,098 | | 3,273 | |
| | PulteGroup Inc. | | 84,380 | | 2,852 | |
| | Whirlpool Corp. | | 20,118 | | 2,798 | |
* | | LKQ Corp. | | 102,791 | | 2,700 | |
| | Campbell Soup Co. | | 55,208 | | 2,484 | |
| | Bunge Ltd. | | 45,299 | | 2,419 | |
| | Fortune Brands Home & Security Inc. | | 45,931 | | 2,345 | |
* | | Mohawk Industries Inc. | | 19,416 | | 2,308 | |
| | Lear Corp. | | 20,456 | | 2,296 | |
| | Gentex Corp. | | 82,545 | | 2,196 | |
| | BorgWarner Inc. | | 67,290 | | 2,196 | |
| | Newell Brands Inc. | | 124,027 | | 2,059 | |
| | Autoliv Inc. | | 29,145 | | 1,994 | |
| | Tapestry Inc. | | 94,486 | | 1,951 | |
| | PVH Corp. | | 24,756 | | 1,877 | |
| | Keurig Dr Pepper Inc. | | 65,767 | | 1,794 | |
| | Toll Brothers Inc. | | 47,099 | | 1,705 | |
| | Ingredion Inc. | | 21,646 | | 1,673 | |
8
FTSE Social Index Fund
| | | | | | Market | |
| | | | | | Value· | |
| | | | Shares | | ($000 | ) |
| | Harley-Davidson Inc. | | 51,681 | | 1,649 | |
| | Leggett & Platt Inc. | | 44,079 | | 1,639 | |
| | Hanesbrands Inc. | | 119,360 | | 1,630 | |
| | Polaris Inc. | | 18,690 | | 1,533 | |
| | Ralph Lauren Corp. Class A | | 17,337 | | 1,532 | |
* | | Capri Holdings Ltd. | | 46,018 | | 1,214 | |
* | | Under Armour Inc. Class C | | 68,637 | | 1,161 | |
* | | Herbalife Nutrition Ltd. | | 33,229 | | 1,144 | |
* | | Under Armour Inc. Class A | | 57,050 | | 1,062 | |
| | Goodyear Tire & Rubber Co. | | 77,200 | | 885 | |
| | Coty Inc. Class A | | 90,800 | | 867 | |
* | | Kontoor Brands Inc. | | 14,234 | | 487 | |
| | | | | | 509,102 | |
Consumer Services (9.8%) | | | | | |
| | Home Depot Inc. | | 360,826 | | 82,236 | |
| | Walt Disney Co. | | 571,651 | | 78,465 | |
| | McDonald’s Corp. | | 251,142 | | 54,741 | |
* | | Netflix Inc. | | 137,881 | | 40,503 | |
| | Starbucks Corp. | | 396,454 | | 38,282 | |
| | Lowe’s Cos. Inc. | | 260,912 | | 29,274 | |
* | | Booking Holdings Inc. | | 14,095 | | 27,717 | |
| | CVS Health Corp. | | 424,446 | | 25,857 | |
| | TJX Cos. Inc. | | 397,452 | | 21,848 | |
| | Dollar General Corp. | | 84,903 | | 13,252 | |
| | Ross Stores Inc. | | 117,610 | | 12,468 | |
| | Sysco Corp. | | 155,912 | | 11,589 | |
| | Delta Air Lines Inc. | | 189,959 | | 10,991 | |
* | | O’Reilly Automotive Inc. | | 25,195 | | 9,669 | |
* | | AutoZone Inc. | | 8,141 | | 8,969 | |
| | McKesson Corp. | | 62,804 | | 8,684 | |
| | Southwest Airlines Co. | | 159,550 | | 8,348 | |
* | | MercadoLibre Inc. | | 13,400 | | 7,968 | |
* | | Dollar Tree Inc. | | 77,176 | | 7,836 | |
* | | Chipotle Mexican Grill Inc. Class A | | 8,334 | | 6,987 | |
* | | United Airlines Holdings Inc. | | 78,700 | | 6,635 | |
| | Expedia Group Inc. | | 45,290 | | 5,892 | |
| | Omnicom Group Inc. | | 71,133 | | 5,410 | |
| | Yum China Holdings Inc. | | 118,582 | | 5,387 | |
* | | Copart Inc. | | 64,800 | | 4,885 | |
| | Darden Restaurants Inc. | | 40,333 | | 4,879 | |
| | Best Buy Co. Inc. | | 75,123 | | 4,782 | |
* | | CarMax Inc. | | 54,064 | | 4,502 | |
* | | Ulta Beauty Inc. | | 18,339 | | 4,360 | |
| | AmerisourceBergen Corp. Class A | | 49,348 | | 4,060 | |
| | Tractor Supply Co. | | 39,338 | | 4,008 | |
| | Fox Corp. Class A | | 115,166 | | 3,820 | |
| | American Airlines Group Inc. | | 130,550 | | 3,435 | |
| | Tiffany & Co. | | 39,027 | | 3,312 | |
| | Aramark | | 79,417 | | 3,245 | |
| | Vail Resorts Inc. | | 13,100 | | 3,095 | |
| | Advance Auto Parts Inc. | | 22,225 | | 3,066 | |
| | Domino’s Pizza Inc. | | 13,500 | | 3,062 | |
* | | Discovery Communications Inc. | | 116,698 | | 3,038 | |
| | Viacom Inc. Class B | | 114,277 | | 2,855 | |
| | Kohl’s Corp. | | 53,266 | | 2,517 | |
| | Interpublic Group of Cos. Inc. | | 125,813 | | 2,501 | |
| | Nielsen Holdings plc | | 115,944 | | 2,407 | |
| | Alaska Air Group Inc. | | 39,454 | | 2,356 | |
| | Fox Corp. Class B | | 55,072 | | 1,806 | |
| | Wyndham Hotels & Resorts Inc. | | 31,100 | | 1,598 | |
| | H&R Block Inc. | | 65,606 | | 1,589 | |
| | Rollins Inc. | | 46,300 | | 1,519 | |
| | Macy’s Inc. | | 102,101 | | 1,507 | |
*,^ | | Discovery Communications Inc. Class A | | 49,466 | | 1,365 | |
| | Foot Locker Inc. | | 36,268 | | 1,313 | |
| | L Brands Inc. | | 73,339 | | 1,211 | |
| | Gap Inc. | | 74,193 | | 1,171 | |
^ | | Nordstrom Inc. | | 35,231 | | 1,021 | |
| | | | | | 613,293 | |
Financials (22.1%) | | | | | |
| | JPMorgan Chase & Co. | | 1,055,978 | | 116,010 | |
| | Visa Inc. Class A | | 569,518 | | 102,980 | |
| | Mastercard Inc. Class A | | 293,842 | | 82,678 | |
| | Bank of America Corp. | | 2,816,541 | | 77,483 | |
| | Wells Fargo & Co. | | 1,325,765 | | 61,741 | |
| | Citigroup Inc. | | 756,957 | | 48,710 | |
| | American Tower Corp. | | 143,905 | | 33,126 | |
| | American Express Co. | | 223,952 | | 26,957 | |
| | CME Group Inc. | | 115,865 | | 25,176 | |
| | US Bancorp | | 474,131 | | 24,982 | |
| | Chubb Ltd. | | 149,037 | | 23,292 | |
| | Goldman Sachs Group Inc. | | 107,783 | | 21,978 | |
| | S&P Global Inc. | | 80,543 | | 20,957 | |
| | Crown Castle International Corp. | | 135,594 | | 19,684 | |
| | PNC Financial Services Group Inc. | | 147,598 | | 19,030 | |
| | Prologis Inc. | | 205,480 | | 17,182 | |
| | Intercontinental Exchange Inc. | | 181,832 | | 16,998 | |
| | Marsh & McLennan Cos. Inc. | | 165,901 | | 16,572 | |
| | Morgan Stanley | | 395,586 | | 16,413 | |
| | BlackRock Inc. | | 38,817 | | 16,403 | |
| | Equinix Inc. | | 27,361 | | 15,220 | |
| | Aon plc | | 78,063 | | 15,211 | |
| | Charles Schwab Corp. | | 392,126 | | 15,007 | |
9
FTSE Social Index Fund
| | | | | | Market | |
| | | | | | Value· | |
| | | | Shares | | ($000 | ) |
| | Simon Property Group Inc. | | 100,646 | | 14,990 | |
| | American International Group Inc. | | 284,048 | | 14,782 | |
| | Progressive Corp. | | 190,870 | | 14,468 | |
| | Capital One Financial Corp. | | 153,062 | | 13,258 | |
| | Public Storage | | 48,427 | | 12,821 | |
| | Travelers Cos. Inc. | | 85,705 | | 12,595 | |
| | Aflac Inc. | | 241,682 | | 12,128 | |
| | BB&T Corp. | | 250,502 | | 11,936 | |
| | Welltower Inc. | | 132,437 | | 11,861 | |
| | Bank of New York Mellon Corp. | | 278,462 | | 11,712 | |
| | MetLife Inc. | | 262,720 | | 11,639 | |
| | Moody’s Corp. | | 53,780 | | 11,594 | |
| | Allstate Corp. | | 108,598 | | 11,119 | |
| | Prudential Financial Inc. | | 132,885 | | 10,643 | |
| | Equity Residential | | 119,715 | | 10,147 | |
| | AvalonBay Communities Inc. | | 45,541 | | 9,680 | |
| | SBA Communications Corp. Class A | | 36,700 | | 9,631 | |
| | SunTrust Banks Inc. | | 145,269 | | 8,936 | |
| | Ventas Inc. | | 116,998 | | 8,587 | |
* | | IHS Markit Ltd. | | 129,229 | | 8,479 | |
| | Discover Financial Services | | 105,977 | | 8,475 | |
| | Digital Realty Trust Inc. | | 67,896 | | 8,394 | |
| | T. Rowe Price Group Inc. | | 75,298 | | 8,329 | |
| | Realty Income Corp. | | 103,162 | | 7,614 | |
| | Synchrony Financial | | 224,653 | | 7,200 | |
| | Hartford Financial Services Group Inc. | | 117,625 | | 6,855 | |
| | M&T Bank Corp. | | 44,339 | | 6,483 | |
| | Weyerhaeuser Co. | | 244,965 | | 6,445 | |
| | Boston Properties Inc. | | 50,167 | | 6,442 | |
| | Fifth Third Bancorp | | 240,782 | | 6,369 | |
| | MSCI Inc. Class A | | 26,850 | | 6,300 | |
| | State Street Corp. | | 122,363 | | 6,278 | |
| | Northern Trust Corp. | | 65,510 | | 5,760 | |
| | Equifax Inc. | | 39,318 | | 5,755 | |
* | | CBRE Group Inc. Class A | | 109,374 | | 5,717 | |
| | Ameriprise Financial Inc. | | 43,546 | | 5,617 | |
| | Cincinnati Financial Corp. | | 49,851 | | 5,608 | |
| | Arthur J Gallagher & Co. | | 60,189 | | 5,460 | |
| | Alexandria Real Estate Equities Inc. | | 36,300 | | 5,439 | |
| | KeyCorp | | 327,173 | | 5,431 | |
| | HCP Inc. | | 155,750 | | 5,406 | |
| | Citizens Financial Group Inc. | | 151,041 | | 5,096 | |
* | | Markel Corp. | | 4,442 | | 5,078 | |
* | | Arch Capital Group Ltd. | | 125,572 | | 4,960 | |
| | First Republic Bank | | 54,337 | | 4,875 | |
| | Principal Financial Group Inc. | | 90,845 | | 4,835 | |
| | Regions Financial Corp. | | 328,883 | | 4,808 | |
| | Mid-America Apartment Communities Inc. | | 36,826 | | 4,665 | |
| | Huntington Bancshares Inc. | | 337,537 | | 4,472 | |
| | UDR Inc. | | 90,833 | | 4,376 | |
| | Loews Corp. | | 85,355 | | 4,103 | |
| | Ally Financial Inc. | | 129,348 | | 4,055 | |
| | Annaly Capital Management Inc. | | 480,033 | | 3,984 | |
| | Invitation Homes Inc. | | 138,203 | | 3,975 | |
| | TD Ameritrade Holding Corp. | | 88,860 | | 3,946 | |
| | Duke Realty Corp. | | 116,602 | | 3,879 | |
| | Host Hotels & Resorts Inc. | | 239,700 | | 3,845 | |
| | Fidelity National Financial Inc. | | 86,413 | | 3,797 | |
| | Nasdaq Inc. | | 37,856 | | 3,780 | |
| | Regency Centers Corp. | | 54,502 | | 3,516 | |
| | Lincoln National Corp. | | 65,383 | | 3,457 | |
* | | Alleghany Corp. | | 4,568 | | 3,423 | |
| | WR Berkley Corp. | | 47,431 | | 3,379 | |
| | Vornado Realty Trust | | 55,758 | | 3,372 | |
| | E*TRADE Financial Corp. | | 80,098 | | 3,343 | |
* | | SVB Financial Group | | 16,800 | | 3,270 | |
| | Raymond James Financial Inc. | | 40,666 | | 3,193 | |
* | | Globe Life Inc. | | 35,105 | | 3,133 | |
| | Western Union Co. | | 140,927 | | 3,117 | |
| | Everest Re Group Ltd. | | 13,101 | | 3,090 | |
| | Comerica Inc. | | 50,004 | | 3,083 | |
| | VEREIT Inc. | | 315,756 | | 3,079 | |
| | Iron Mountain Inc. | | 92,824 | | 2,956 | |
| | Brown & Brown Inc. | | 76,200 | | 2,811 | |
| | AGNC Investment Corp. | | 176,690 | | 2,627 | |
| | RenaissanceRe Holdings Ltd. | | 14,135 | | 2,552 | |
| | Liberty Property Trust | | 48,306 | | 2,518 | |
| | Assurant Inc. | | 20,018 | | 2,462 | |
| | SEI Investments Co. | | 42,231 | | 2,429 | |
| | Kimco Realty Corp. | | 131,844 | | 2,423 | |
| | Franklin Resources Inc. | | 91,300 | | 2,399 | |
| | Zions Bancorp NA | | 58,046 | | 2,385 | |
| | Voya Financial Inc. | | 47,253 | | 2,331 | |
| | SL Green Realty Corp. | | 27,418 | | 2,199 | |
| | Old Republic International Corp. | | 92,900 | | 2,170 | |
| | AXA Equitable Holdings Inc. | | 99,325 | | 2,063 | |
| | Invesco Ltd. | | 127,341 | | 1,999 | |
| | People’s United Financial Inc. | | 132,825 | | 1,909 | |
10
FTSE Social Index Fund
| | | | | | Market | |
| | | | | | Value· | |
| | | | Shares | | ($000 | ) |
| | Commerce Bancshares Inc. | | 32,036 | | 1,828 | |
| | Unum Group | | 70,398 | | 1,789 | |
| | New York Community Bancorp Inc. | | 147,179 | | 1,698 | |
| | Axis Capital Holdings Ltd. | | 26,662 | | 1,637 | |
| | Park Hotels & Resorts Inc. | | 69,500 | | 1,637 | |
| | Jefferies Financial Group Inc. | | 83,100 | | 1,549 | |
| | Macerich Co. | | 46,919 | | 1,339 | |
| | CIT Group Inc. | | 30,900 | | 1,316 | |
* | | Zillow Group Inc. Class C | | 38,100 | | 1,312 | |
| | Affiliated Managers Group Inc. | | 16,800 | | 1,287 | |
| | Hospitality Properties Trust | | 52,898 | | 1,277 | |
| | Janus Henderson Group plc | | 64,100 | | 1,225 | |
| | Santander Consumer USA Holdings Inc. | | 35,298 | | 922 | |
* | | Zillow Group Inc. Class A | | 20,250 | | 692 | |
| | CNA Financial Corp. | | 8,600 | | 405 | |
| | | | | | 1,379,303 | |
Health Care (15.8%) | | | | | |
| | Johnson & Johnson | | 869,661 | | 111,630 | |
| | Merck & Co. Inc. | | 843,365 | | 72,926 | |
| | UnitedHealth Group Inc. | | 309,543 | | 72,433 | |
| | Pfizer Inc. | | 1,821,536 | | 64,756 | |
| | Abbott Laboratories | | 563,894 | | 48,111 | |
| | Medtronic plc | | 439,461 | | 47,413 | |
| | Amgen Inc. | | 199,672 | | 41,656 | |
| | AbbVie Inc. | | 484,429 | | 31,846 | |
| | Eli Lilly & Co. | | 281,833 | | 31,839 | |
| | Gilead Sciences Inc. | | 417,141 | | 26,505 | |
| | Bristol-Myers Squibb Co. | | 534,909 | | 25,713 | |
| | Stryker Corp. | | 112,310 | | 24,782 | |
* | | Celgene Corp. | | 229,787 | | 22,243 | |
| | Becton Dickinson and Co. | | 87,593 | | 22,242 | |
| | Anthem Inc. | | 84,275 | | 22,040 | |
| | Zoetis Inc. | | 156,666 | | 19,806 | |
* | | Boston Scientific Corp. | | 454,475 | | 19,420 | |
* | | Intuitive Surgical Inc. | | 37,579 | | 19,216 | |
| | Cigna Corp. | | 121,846 | | 18,761 | |
| | Allergan plc | | 107,443 | | 17,161 | |
* | | Vertex Pharmaceuticals Inc. | | 84,010 | | 15,123 | |
* | | Edwards Lifesciences Corp. | | 68,013 | | 15,088 | |
| | Baxter International Inc. | | 158,146 | | 13,909 | |
* | | Biogen Inc. | | 63,145 | | 13,876 | |
* | | Illumina Inc. | | 48,065 | | 13,523 | |
| | Humana Inc. | | 44,196 | | 12,517 | |
| | HCA Healthcare Inc. | | 88,166 | | 10,598 | |
| | Zimmer Biomet Holdings Inc. | | 67,272 | | 9,364 | |
* | | IQVIA Holdings Inc. | | 58,767 | | 9,118 | |
* | | IDEXX Laboratories Inc. | | 27,691 | | 8,023 | |
* | | Regeneron Pharmaceuticals Inc. | | 26,715 | | 7,749 | |
* | | Alexion Pharmaceuticals Inc. | | 70,598 | | 7,113 | |
| | ResMed Inc. | | 46,224 | | 6,439 | |
* | | Centene Corp. | | 133,672 | | 6,232 | |
| | Teleflex Inc. | | 15,000 | | 5,459 | |
* | | Laboratory Corp. of America Holdings | | 32,057 | | 5,371 | |
| | Cooper Cos. Inc. | | 15,819 | | 4,900 | |
* | | Incyte Corp. | | 58,456 | | 4,783 | |
* | | Align Technology Inc. | | 25,748 | | 4,715 | |
| | Quest Diagnostics Inc. | | 43,697 | | 4,473 | |
* | | WellCare Health Plans Inc. | | 16,300 | | 4,413 | |
* | | BioMarin Pharmaceutical Inc. | | 58,214 | | 4,369 | |
* | | Hologic Inc. | | 86,827 | | 4,287 | |
| | Cardinal Health Inc. | | 97,413 | | 4,201 | |
| | Dentsply Sirona Inc. | | 76,299 | | 3,979 | |
| | Universal Health Services Inc. Class B | | 26,470 | | 3,827 | |
* | | Mylan NV | | 166,435 | | 3,240 | |
* | | Varian Medical Systems Inc. | | 29,863 | | 3,163 | |
* | | Henry Schein Inc. | | 48,354 | | 2,980 | |
* | | ABIOMED Inc. | | 14,500 | | 2,799 | |
* | | Alnylam Pharmaceuticals Inc. | | 34,688 | | 2,799 | |
* | | DaVita Inc. | | 41,723 | | 2,352 | |
* | | Jazz Pharmaceuticals plc | | 18,254 | | 2,339 | |
| | Perrigo Co. plc | | 40,508 | | 1,895 | |
* | | Alkermes plc | | 51,300 | | 1,076 | |
| | | | | | 986,591 | |
Industrials (9.5%) | | | | | |
* | | PayPal Holdings Inc. | | 384,767 | | 41,959 | |
| | Accenture plc Class A | | 208,713 | | 41,361 | |
| | Union Pacific Corp. | | 231,959 | | 37,568 | |
| | Fidelity National Information Services Inc. | | 199,407 | | 27,163 | |
| | United Parcel Service Inc. Class B | | 228,349 | | 27,096 | |
| | Automatic Data Processing Inc. | | 142,346 | | 24,176 | |
* | | Fiserv Inc. | | 184,636 | | 19,745 | |
| | CSX Corp. | | 252,226 | | 16,904 | |
| | Waste Management Inc. | | 139,114 | | 16,603 | |
| | Deere & Co. | | 103,996 | | 16,110 | |
| | Illinois Tool Works Inc. | | 106,234 | | 15,920 | |
| | Norfolk Southern Corp. | | 87,193 | | 15,176 | |
| | Sherwin-Williams Co. | | 27,084 | | 14,267 | |
11
FTSE Social Index Fund
| | | | | | Market | |
| | | | | | Value· | |
| | | | Shares | | ($000 | ) |
| | FedEx Corp. | | 79,221 | | 12,565 | |
| | Johnson Controls International plc | | 293,569 | | 12,532 | |
| | Eaton Corp. plc | | 138,074 | | 11,145 | |
| | Ball Corp. | | 108,089 | | 8,691 | |
| | Global Payments Inc. | | 51,304 | | 8,515 | |
| | Verisk Analytics Inc. Class A | | 52,315 | | 8,451 | |
| | Willis Towers Watson plc | | 42,046 | | 8,324 | |
| | Amphenol Corp. Class A | | 95,000 | | 8,316 | |
* | | FleetCor Technologies Inc. | | 27,800 | | 8,296 | |
| | Total System Services Inc. | | 57,172 | | 7,674 | |
| | Cummins Inc. | | 50,184 | | 7,491 | |
| | Agilent Technologies Inc. | | 103,725 | | 7,376 | |
| | PACCAR Inc. | | 110,979 | | 7,276 | |
* | | CoStar Group Inc. | | 11,800 | | 7,255 | |
| | Fortive Corp. | | 96,876 | | 6,869 | |
* | | Square Inc. | | 108,300 | | 6,697 | |
| | Stanley Black & Decker Inc. | | 49,605 | | 6,591 | |
| | Republic Services Inc. Class A | | 69,532 | | 6,206 | |
| | Vulcan Materials Co. | | 43,006 | | 6,075 | |
* | | Keysight Technologies Inc. | | 61,366 | | 5,944 | |
| | Rockwell Automation Inc. | | 38,568 | | 5,893 | |
| | Fastenal Co. | | 186,186 | | 5,701 | |
* | | Mettler-Toledo International Inc. | | 7,987 | | 5,246 | |
| | Martin Marietta Materials Inc. | | 20,290 | | 5,149 | |
| | TransUnion | | 61,300 | | 5,128 | |
| | Broadridge Financial Solutions Inc. | | 37,988 | | 4,917 | |
* | | Waters Corp. | | 22,409 | | 4,748 | |
| | Xylem Inc. | | 58,253 | | 4,463 | |
| | Dover Corp. | | 47,118 | | 4,417 | |
| | Kansas City Southern | | 32,951 | | 4,145 | |
| | Wabtec Corp. | | 58,301 | | 4,035 | |
| | Expeditors International of Washington Inc. | | 56,187 | | 3,995 | |
| | WW Grainger Inc. | | 14,447 | | 3,953 | |
| | Masco Corp. | | 95,900 | | 3,906 | |
| | CH Robinson Worldwide Inc. | | 43,597 | | 3,684 | |
| | Old Dominion Freight Line Inc. | | 21,250 | | 3,480 | |
| | Arconic Inc. | | 131,389 | | 3,395 | |
* | | Trimble Inc. | | 82,950 | | 3,112 | |
| | Packaging Corp. of America | | 30,520 | | 3,070 | |
| | JB Hunt Transport Services Inc. | | 28,351 | | 3,063 | |
| | Allegion plc | | 30,459 | | 2,932 | |
* | | United Rentals Inc. | | 25,409 | | 2,860 | |
| | Snap-on Inc. | | 17,919 | | 2,664 | |
* | | Sensata Technologies Holding plc | | 52,177 | | 2,378 | |
* | | XPO Logistics Inc. | | 29,600 | | 2,097 | |
| | Sealed Air Corp. | | 50,837 | | 2,024 | |
* | | Arrow Electronics Inc. | | 28,788 | | 1,992 | |
| | Robert Half International Inc. | | 37,207 | | 1,989 | |
*,^ | | Alliance Data Systems Corp. | | 14,647 | | 1,801 | |
| | Xerox Holdings Corp. | | 61,717 | | 1,789 | |
| | MDU Resources Group Inc. | | 64,115 | | 1,724 | |
* | | Flex Ltd. | | 168,900 | | 1,627 | |
| | Acuity Brands Inc. | | 12,838 | | 1,610 | |
| | ManpowerGroup Inc. | | 19,611 | | 1,603 | |
| | Avnet Inc. | | 34,484 | | 1,445 | |
| | Jabil Inc. | | 48,655 | | 1,402 | |
| | nVent Electric plc | | 52,100 | | 1,056 | |
| | | | | | 594,830 | |
Oil & Gas (2.6%) | | | | | |
| | ConocoPhillips | | 371,028 | | 19,360 | |
| | Phillips 66 | | 148,700 | | 14,666 | |
| | EOG Resources Inc. | | 189,429 | | 14,054 | |
| | Kinder Morgan Inc. | | 639,965 | | 12,972 | |
| | Occidental Petroleum Corp. | | 292,433 | | 12,715 | |
| | Marathon Petroleum Corp. | | 215,048 | | 10,583 | |
| | Valero Energy Corp. | | 136,515 | | 10,277 | |
| | ONEOK Inc. | | 134,881 | | 9,614 | |
| | Williams Cos. Inc. | | 397,636 | | 9,384 | |
| | Pioneer Natural Resources Co. | | 54,702 | | 6,751 | |
| | Hess Corp. | | 87,900 | | 5,533 | |
| | Diamondback Energy Inc. | | 53,750 | | 5,272 | |
| | Concho Resources Inc. | | 64,759 | | 4,737 | |
| | Baker Hughes a GE Co. Class A | | 168,339 | | 3,651 | |
| | Marathon Oil Corp. | | 263,241 | | 3,117 | |
| | Devon Energy Corp. | | 133,484 | | 2,935 | |
| | Targa Resources Corp. | | 74,021 | | 2,674 | |
| | Apache Corp. | | 121,806 | | 2,628 | |
| | Cabot Oil & Gas Corp. | | 136,835 | | 2,343 | |
| | HollyFrontier Corp. | | 51,760 | | 2,296 | |
| | Cimarex Energy Co. | | 34,164 | | 1,462 | |
| | Helmerich & Payne Inc. | | 34,379 | | 1,292 | |
| | Murphy Oil Corp. | | 54,099 | | 986 | |
| | Equitrans Midstream Corp. | | 64,870 | | 875 | |
* | | Continental Resources Inc. | | 29,100 | | 850 | |
| | EQT Corp. | | 82,588 | | 840 | |
| | | | | | 161,867 | |
Technology (28.5%) | | | | | |
| | Microsoft Corp. | | 2,476,148 | | 341,362 | |
| | Apple Inc. | | 1,506,995 | | 314,570 | |
* | | Facebook Inc. Class A | | 782,417 | | 145,271 | |
12
FTSE Social Index Fund
| | | | | | Market | |
| | | | | | Value· | |
| | | | Shares | | ($000 | ) |
* | | Alphabet Inc. Class C | | 99,446 | | 118,152 | |
* | | Alphabet Inc. Class A | | 98,051 | | 116,733 | |
| | Intel Corp. | | 1,466,697 | | 69,536 | |
| | Cisco Systems Inc. | | 1,442,185 | | 67,509 | |
* | | Adobe Inc. | | 159,310 | | 45,325 | |
* | | salesforce.com Inc. | | 268,101 | | 41,843 | |
| | Oracle Corp. | | 752,321 | | 39,166 | |
| | Texas Instruments Inc. | | 307,075 | | 38,001 | |
| | Broadcom Inc. | | 126,424 | | 35,732 | |
| | NVIDIA Corp. | | 190,889 | | 31,976 | |
| | QUALCOMM Inc. | | 397,749 | | 30,933 | |
| | Intuit Inc. | | 81,438 | | 23,483 | |
* | | Micron Technology Inc. | | 362,090 | | 16,392 | |
* | | ServiceNow Inc. | | 60,093 | | 15,735 | |
| | Applied Materials Inc. | | 310,412 | | 14,906 | |
| | Analog Devices Inc. | | 120,000 | | 13,180 | |
| | Cognizant Technology Solutions Corp. Class A | | 185,637 | | 11,396 | |
| | NXP Semiconductors NV | | 110,748 | | 11,312 | |
* | | Twitter Inc. | | 246,399 | | 10,509 | |
* | | Advanced Micro Devices Inc. | | 328,061 | | 10,317 | |
| | Lam Research Corp. | | 48,971 | | 10,309 | |
* | | Autodesk Inc. | | 72,124 | | 10,301 | |
| | Motorola Solutions Inc. | | 53,686 | | 9,712 | |
* | | Workday Inc. Class A | | 52,206 | | 9,255 | |
| | HP Inc. | | 504,887 | | 9,234 | |
| | Xilinx Inc. | | 83,275 | | 8,666 | |
| | KLA Corp. | | 52,850 | | 7,816 | |
| | Cerner Corp. | | 105,472 | | 7,268 | |
| | Corning Inc. | | 252,205 | | 7,024 | |
* | | VeriSign Inc. | | 34,339 | | 7,000 | |
* | | Synopsys Inc. | | 48,815 | | 6,922 | |
| | Microchip Technology Inc. | | 76,100 | | 6,570 | |
* | | Cadence Design Systems Inc. | | 91,100 | | 6,239 | |
| | Hewlett Packard Enterprise Co. | | 450,461 | | 6,225 | |
* | | Palo Alto Networks Inc. | | 30,218 | | 6,153 | |
* | | Splunk Inc. | | 49,284 | | 5,511 | |
| | CDW Corp. | | 47,408 | | 5,476 | |
| | Western Digital Corp. | | 95,323 | | 5,459 | |
| | Marvell Technology Group Ltd. | | 213,900 | | 5,127 | |
| | Maxim Integrated Products Inc. | | 88,796 | | 4,843 | |
* | | Akamai Technologies Inc. | | 52,403 | | 4,671 | |
| | Symantec Corp. | | 194,583 | | 4,524 | |
| | Seagate Technology plc | | 89,671 | | 4,502 | |
* | | Arista Networks Inc. | | 19,542 | | 4,429 | |
| | Skyworks Solutions Inc. | | 56,247 | | 4,234 | |
* | | Check Point Software Technologies Ltd. | | 37,958 | | 4,088 | |
| | NetApp Inc. | | 80,465 | | 3,867 | |
| | Citrix Systems Inc. | | 41,138 | | 3,825 | |
* | | Gartner Inc. | | 28,500 | | 3,810 | |
* | | GoDaddy Inc. Class A | | 57,300 | | 3,629 | |
| | VMware Inc. Class A | | 25,474 | | 3,603 | |
| | SS&C Technologies Holdings Inc. | | 72,700 | | 3,389 | |
* | | Yandex NV Class A | | 84,220 | | 3,125 | |
| | DXC Technology Co. | | 87,005 | | 2,890 | |
| | Amdocs Ltd. | | 44,625 | | 2,889 | |
* | | Qorvo Inc. | | 40,000 | | 2,857 | |
| | Juniper Networks Inc. | | 111,325 | | 2,578 | |
* | | Dell Technologies Inc. | | 49,553 | | 2,553 | |
* | | F5 Networks Inc. | | 19,544 | | 2,516 | |
* | | PTC Inc. | | 33,900 | | 2,219 | |
| | CDK Global Inc. | | 39,350 | | 1,698 | |
| | | | | | 1,780,345 | |
Telecommunications (0.2%) | | | | | |
* | | T-Mobile US Inc. | | 102,114 | | 7,970 | |
* | | Sprint Corp. | | 184,441 | | 1,252 | |
| | | | | | 9,222 | |
Utilities (1.1%) | | | | | |
| | WEC Energy Group Inc. | | 103,020 | | 9,866 | |
| | Consolidated Edison Inc. | | 107,325 | | 9,541 | |
| | Eversource Energy | | 103,584 | | 8,300 | |
| | American Water Works Co. Inc. | | 59,097 | | 7,524 | |
| | PPL Corp. | | 236,037 | | 6,975 | |
| | CMS Energy Corp. | | 92,605 | | 5,839 | |
| | Evergy Inc. | | 79,400 | | 5,161 | |
| | CenterPoint Energy Inc. | | 163,016 | | 4,514 | |
| | Alliant Energy Corp. | | 77,400 | | 4,060 | |
| | NiSource Inc. | | 122,492 | | 3,620 | |
| | AES Corp. | | 218,000 | | 3,342 | |
| | Avangrid Inc. | | 18,659 | | 943 | |
| | | | | | 69,685 | |
Total Common Stocks
(Cost $4,700,010) | | | | 6,226,168 | |
Temporary Cash Investment (0.2%)1 | | | | | |
Money Market Fund (0.2%) | | | | | |
2,3 | | Vanguard Market Liquidity Fund, 2.249% (Cost $9,801) | | 98,013 | | 9,802 | |
Total Investments (100.0%)
(Cost $4,709,811) | | | | 6,235,970 | |
13
FTSE Social Index Fund
| | Amount | |
| | ($000 | ) |
Other Assets and Liabilities (0.0%) | | | |
Other Assets | | | |
Investment in Vanguard | | 294 | |
Receivables for Accrued Income | | 9,415 | |
Receivables for Capital Shares Issued | | 14,561 | |
Other Assets4 | | 494 | |
Total Other Assets | | 24,764 | |
Liabilities | | | |
Payables for Investment Securities Purchased | | (8,398 | ) |
Collateral for Securities on Loan | | (9,085 | ) |
Payables for Capital Shares Redeemed | | (5,098 | ) |
Payables to Vanguard | | (1,004 | ) |
Variation Margin Payable—Futures Contracts | | (7 | ) |
Total Liabilities | | (23,592 | ) |
Net Assets (100%) | | 6,237,142 | |
| | | |
| | | |
At August 31, 2019, net assets consisted of: | | | |
| | Amount | |
| | ($000 | ) |
Paid-in Capital | | 4,726,069 | |
Total Distributable Earnings (Loss) | | 1,511,073 | |
Net Assets | | 6,237,142 | |
| | | |
Investor Shares—Net Assets | | | |
Applicable to 2,996,296 outstanding $.001 par value shares of beneficial interest (unlimited authorization) | | 58,775 | |
Net Asset Value Per Share—Investor Shares | | $19.62 | |
| | | |
| | Amount | |
| | ($000 | ) |
Admiral Shares—Net Assets | | | |
Applicable to 127,522,009 outstanding $.001 par value shares of beneficial interest (unlimited authorization) | | 3,477,504 | |
Net Asset Value Per Share—Admiral Shares | | $27.27 | |
| | | |
Institutional Shares—Net Assets | | | |
Applicable to 137,581,493 outstanding $.001 par value shares of beneficial interest (unlimited authorization) | | 2,700,863 | |
Net Asset Value Per Share—Institutional Shares | | $19.63 | |
· See Note A in Notes to Financial Statements.
* Non-income-producing security.
^ Includes partial security positions on loan to broker-dealers. The total value of securities on loan is $8,990,000.
1 The fund invests a portion of its cash reserves in equity markets through the use of index futures contracts. After giving effect to futures investments, the fund’s effective common stock and temporary cash investment positions represent 100.0% and 0.0%, respectively, of net assets.
2 Affiliated money market fund available only to Vanguard funds and certain trusts and accounts managed by Vanguard. Rate shown is the 7-day yield.
3 Includes $9,085,000 of collateral received for securities on loan.
4 Cash of $447,000 has been segregated as initial margin for open futures contracts.
Derivative Financial Instruments Outstanding as of Period End |
Futures Contracts |
| | | | | | | | ($000 | ) |
| | | | | | | | Value and | |
| | | | Number of | | | | Unrealized | |
| | | | Long (Short | ) | Notional | | Appreciation | |
| | Expiration | | Contracts | | Amount | | (Depreciation | ) |
Long Futures Contracts | | | | | | | | | |
E-mini S&P 500 Index | | September 2019 | | 71 | | 10,383 | | 159 | |
See accompanying Notes, which are an integral part of the Financial Statements.
14
FTSE Social Index Fund
Statement of Operations
| Year Ended | |
| August 31, 2019 | |
| ($000 | ) |
Investment Income | | |
Income | | |
Dividends | 93,808 | |
Interest1 | 172 | |
Securities Lending—Net | 163 | |
Total Income | 94,143 | |
Expenses | | |
The Vanguard Group—Note B | | |
Investment Advisory Services | 780 | |
Management and Administrative—Investor Shares | 3,297 | |
Management and Administrative—Admiral Shares | 1,007 | |
Management and Administrative—Institutional Shares | 2,070 | |
Marketing and Distribution—Investor Shares | 295 | |
Marketing and Distribution—Admiral Shares | 31 | |
Marketing and Distribution—Institutional Shares | 81 | |
Custodian Fees | 116 | |
Auditing Fees | 32 | |
Shareholders’ Reports—Investor Shares | 22 | |
Shareholders’ Reports—Admiral Shares | 1 | |
Shareholders’ Reports—Institutional Shares | 36 | |
Trustees’ Fees and Expenses | 3 | |
Total Expenses | 7,771 | |
Net Investment Income | 86,372 | |
Realized Net Gain (Loss) | | |
Investment Securities Sold1,2 | 229,814 | |
Futures Contracts | 157 | |
Realized Net Gain (Loss) | 229,971 | |
Change in Unrealized Appreciation (Depreciation) | | |
Investment Securities1 | (79,582 | ) |
Futures Contracts | 78 | |
Change in Unrealized Appreciation (Depreciation) | (79,504 | ) |
Net Increase (Decrease) in Net Assets Resulting from Operations | 236,839 | |
1 Interest income, realized net gain (loss), and change in unrealized appreciation (depreciation) from an affiliated company of the fund were $164,000, $6,000, and ($1,000), respectively. Purchases and sales are for temporary cash investment purposes.
2 Includes $227,305,000 of net gain (loss) resulting from in-kind redemptions; such gain (loss) is not taxable to the fund.
See accompanying Notes, which are an integral part of the Financial Statements.
15
FTSE Social Index Fund
Statement of Changes in Net Assets
| Year Ended August 31, | |
| 2019 | 2018 | |
| ($000) | ($000 | ) |
Increase (Decrease) in Net Assets | | | |
Operations | | | |
Net Investment Income | 86,372 | 69,426 | |
Realized Net Gain (Loss) | 229,971 | (2,106 | ) |
Change in Unrealized Appreciation (Depreciation) | (79,504) | 739,335 | |
Net Increase (Decrease) in Net Assets Resulting from Operations | 236,839 | 806,655 | |
Distributions | | | |
Net Investment Income | | | |
Investor Shares | (40,288) | (35,275 | ) |
Admiral Shares | (8,771) | — | |
Institutional Shares | (36,429) | (27,400 | ) |
Realized Capital Gain | | | |
Investor Shares | — | — | |
Admiral Shares | — | — | |
Institutional Shares | — | — | |
Total Distributions | (85,488) | (62,675 | ) |
Capital Share Transactions | | | |
Investor Shares | (2,824,591) | 444,974 | |
Admiral Shares | 3,456,334 | — | |
Institutional Shares | 288,120 | 581,627 | |
Net Increase (Decrease) from Capital Share Transactions | 919,863 | 1,026,601 | |
Total Increase (Decrease) | 1,071,214 | 1,770,581 | |
Net Assets | | | |
Beginning of Period | 5,165,928 | 3,395,347 | |
End of Period | 6,237,142 | 5,165,928 | |
See accompanying Notes, which are an integral part of the Financial Statements.
16
FTSE Social Index Fund
Financial Highlights
Investor Shares | |
| |
For a Share Outstanding | Year Ended August 31, |
Throughout Each Period | 2019 | 2018 | 2017 | 2016 | 2015 |
Net Asset Value, Beginning of Period | $19.27 | $16.14 | $13.95 | $12.99 | $12.74 |
Investment Operations | | | | | |
Net Investment Income | .2931 | .2901 | .2561 | .241 | .183 |
Net Realized and Unrealized Gain (Loss) on Investments | .362 | 3.108 | 2.175 | 1.025 | .231 |
Total from Investment Operations | .655 | 3.398 | 2.431 | 1.266 | .414 |
Distributions | | | | | |
Dividends from Net Investment Income | (.305) | (.268) | (.241) | (.306) | (.164) |
Distributions from Realized Capital Gains | — | — | — | — | — |
Total Distributions | (.305) | (.268) | (.241) | (.306) | (.164) |
Net Asset Value, End of Period | $19.62 | $19.27 | $16.14 | $13.95 | $12.99 |
| | | | | |
Total Return2 | 3.53% | 21.27% | 17.61% | 9.95% | 3.25% |
| | | | | |
Ratios/Supplemental Data | | | | | |
Net Assets, End of Period (Millions) | $59 | $2,817 | $1,952 | $1,435 | $1,131 |
Ratio of Total Expenses to Average Net Assets | 0.18% | 0.18% | 0.20% | 0.22% | 0.25% |
Ratio of Net Investment Income to Average Net Assets | 1.43% | 1.65% | 1.71% | 1.87% | 1.63% |
Portfolio Turnover Rate3 | 11% | 8% | 11% | 16% | 20% |
1 Calculated based on average shares outstanding.
2 Total returns do not include account service fees that may have applied in the periods shown. Fund prospectuses provide information about any applicable account service fees.
3 Excludes the value of portfolio securities received or delivered as a result of in-kind purchases or redemptions of the fund’s capital shares.
See accompanying Notes, which are an integral part of the Financial Statements.
17
FTSE Social Index Fund
Financial Highlights
Admiral Shares | | |
| February 7, 20191 to | |
For a Share Outstanding Throughout the Period | August 31, 2019 | |
Net Asset Value, Beginning of Period | $25.00 | |
Investment Operations | | |
Net Investment Income2 | .273 | |
Net Realized and Unrealized Gain (Loss) on Investments | 2.183 | |
Total from Investment Operations | 2.456 | |
Distributions | | |
Dividends from Net Investment Income | (.186 | ) |
Distributions from Realized Capital Gains | — | |
Total Distributions | (.186 | ) |
Net Asset Value, End of Period | $27.27 | |
| | |
Total Return3 | 9.85% | |
| | |
Ratios/Supplemental Data | | |
Net Assets, End of Period (Millions) | $3,478 | |
Ratio of Total Expenses to Average Net Assets | 0.14%4 | |
Ratio of Net Investment Income to Average Net Assets | 1.79%4 | |
Portfolio Turnover Rate5 | 11%6 | |
1 Inception
2 Calculated based on average shares outstanding.
3 Total returns do not include account service fees that may have applied in the periods shown. Fund prospectuses provide information about any applicable account service fees.
4 Annualized.
5 Excludes the value of portfolio securities received or delivered as a result of in-kind purchases or redemptions of the fund’s capital shares.
6 Reflects the fund’s portfolio turnover for the fiscal year ended August 31, 2019.
See accompanying Notes, which are an integral part of the Financial Statements.
18
FTSE Social Index Fund
Financial Highlights
Institutional Shares | |
| |
For a Share Outstanding | Year Ended August 31, |
Throughout Each Period | 2019 | 2018 | 2017 | 2016 | 2015 |
Net Asset Value, Beginning of Period | $19.28 | $16.15 | $13.96 | $13.00 | $12.75 |
Investment Operations | | | | | |
Net Investment Income | .3141 | .3051 | .2711 | .254 | .193 |
Net Realized and Unrealized Gain (Loss) on Investments | .351 | 3.105 | 2.175 | 1.029 | .233 |
Total from Investment Operations | .665 | 3.410 | 2.446 | 1.283 | .426 |
Distributions | | | | | |
Dividends from Net Investment Income | (.315) | (.280) | (.256) | (.323) | (.176) |
Distributions from Realized Capital Gains | — | — | — | — | — |
Total Distributions | (.315) | (.280) | (.256) | (.323) | (.176) |
Net Asset Value, End of Period | $19.63 | $19.28 | $16.15 | $13.96 | $13.00 |
| | | | | |
Total Return | 3.58% | 21.34% | 17.72% | 10.09% | 3.34% |
| | | | | |
Ratios/Supplemental Data | | | | | |
Net Assets, End of Period (Millions) | $2,701 | $2,349 | $1,443 | $876 | $706 |
Ratio of Total Expenses to Average Net Assets | 0.12% | 0.12% | 0.12% | 0.12% | 0.15% |
Ratio of Net Investment Income to Average Net Assets | 1.49% | 1.71% | 1.79% | 1.97% | 1.73% |
Portfolio Turnover Rate2 | 11% | 8% | 11% | 16% | 20% |
1 Calculated based on average shares outstanding.
2 Excludes the value of portfolio securities received or delivered as a result of in-kind purchases or redemptions of the fund’s capital shares.
See accompanying Notes, which are an integral part of the Financial Statements.
19
FTSE Social Index Fund
Notes to Financial Statements
Vanguard FTSE Social Index Fund is registered under the Investment Company Act of 1940 as an open-end investment company, or mutual fund. The fund offers three classes of shares: Investor Shares, Admiral Shares, and Institutional Shares. Each of the share classes has different eligibility and minimum purchase requirements, and is designed for different types of investors. Admiral Shares were issued on February 7, 2019.
A. The following significant accounting policies conform to generally accepted accounting principles for U.S. investment companies. The fund consistently follows such policies in preparing its financial statements.
1. Security Valuation: Securities are valued as of the close of trading on the New York Stock Exchange (generally 4 p.m., Eastern time) on the valuation date. Equity securities are valued at the latest quoted sales prices or official closing prices taken from the primary market in which each security trades; such securities not traded on the valuation date are valued at the mean of the latest quoted bid and asked prices. Securities for which market quotations are not readily available, or whose values have been materially affected by events occurring before the fund’s pricing time but after the close of the securities’ primary markets, are valued by methods deemed by the board of trustees to represent fair value. Investments in Vanguard Market Liquidity Fund are valued at that fund’s net asset value. Temporary cash investments are valued using the latest bid prices or using valuations based on a matrix system (which considers such factors as security prices, yields, maturities, and ratings), both as furnished by independent pricing services.
2. Futures Contracts: The fund uses index futures contracts to a limited extent, with the objectives of maintaining full exposure to the stock market, maintaining liquidity, and minimizing transaction costs. The fund may purchase futures contracts to immediately invest incoming cash in the market, or sell futures in response to cash outflows, thereby simulating a fully invested position in the underlying index while maintaining a cash balance for liquidity. The primary risks associated with the use of futures contracts are imperfect correlation between changes in market values of stocks held by the fund and the prices of futures contracts, and the possibility of an illiquid market. Counterparty risk involving futures is mitigated because a regulated clearinghouse is the counterparty instead of the clearing broker. To further mitigate counterparty risk, the fund trades futures contracts on an exchange, monitors the financial strength of its clearing brokers and clearinghouse, and has entered into clearing agreements with its clearing brokers. The clearinghouse imposes initial margin requirements to secure the fund’s performance and requires daily settlement of variation margin representing changes in the market value of each contract. Any assets pledged as initial margin for open contracts are noted in the Statement of Net Assets.
Futures contracts are valued at their quoted daily settlement prices. The notional amounts of the contracts are not recorded in the Statement of Net Assets. Fluctuations in the value of the contracts are recorded in the Statement of Net Assets as an asset (liability) and in the Statement of Operations as unrealized appreciation (depreciation) until the contracts are closed, when they are recorded as realized futures gains (losses).
During the year ended August 31, 2019, the fund’s average investments in long and short futures contracts represented less than 1% and 0% of net assets, respectively, based on the average of the notional amounts at each quarter-end during the period.
20
FTSE Social Index Fund
3. Federal Income Taxes: The fund intends to continue to qualify as a regulated investment company and distribute all of its taxable income. Management has analyzed the fund’s tax positions taken for all open federal income tax years (August 31, 2016–2019), and has concluded that no provision for federal income tax is required in the fund’s financial statements.
4. Distributions: Distributions to shareholders are recorded on the ex-dividend date. Distributions are determined on a tax basis and may differ from net investment income and realized capital gains for financial reporting purposes.
5. Securities Lending: To earn additional income, the fund lends its securities to qualified institutional borrowers. Security loans are subject to termination by the fund at any time, and are required to be secured at all times by collateral in an amount at least equal to the market value of securities loaned. Daily market fluctuations could cause the value of loaned securities to be more or less than the value of the collateral received. When this occurs, the collateral is adjusted and settled before the opening of the market on the next business day. The fund further mitigates its counterparty risk by entering into securities lending transactions only with a diverse group of prequalified counterparties, monitoring their financial strength, and entering into master securities lending agreements with its counterparties. The master securities lending agreements provide that, in the event of a counterparty’s default (including bankruptcy), the fund may terminate any loans with that borrower, determine the net amount owed, and sell or retain the collateral up to the net amount owed to the fund; however, such actions may be subject to legal proceedings. While collateral mitigates counterparty risk, in the event of a default, the fund may experience delays and costs in recovering the securities loaned. The fund invests cash collateral received in Vanguard Market Liquidity Fund, and records a liability in the Statement of Net Assets for the return of the collateral, during the period the securities are on loan. Securities lending income represents fees charged to borrowers plus income earned on invested cash collateral, less expenses associated with the loan. During the term of the loan, the fund is entitled to all distributions made on or in respect of the loaned securities.
6. Credit Facility: The fund and certain other funds managed by The Vanguard Group (“Vanguard”) participate in a $4.3 billion committed credit facility provided by a syndicate of lenders pursuant to a credit agreement that may be renewed annually; each fund is individually liable for its borrowings, if any, under the credit facility. Borrowings may be utilized for temporary and emergency purposes, and are subject to the fund’s regulatory and contractual borrowing restrictions. The participating funds are charged administrative fees and an annual commitment fee of 0.10% of the undrawn amount of the facility; these fees are allocated to the funds based on a method approved by the fund’s board of trustees and included in Management and Administrative expenses on the fund’s Statement of Operations. Any borrowings under this facility bear interest at a rate based upon the higher of the one-month London Interbank Offered Rate, federal funds effective rate, or overnight bank funding rate plus an agreed-upon spread.
The fund had no borrowings outstanding at August 31, 2019, or at any time during the period then ended.
7. Other: Dividend income is recorded on the ex-dividend date. Interest income includes income distributions received from Vanguard Market Liquidity Fund and is accrued daily. Premiums and discounts on debt securities purchased are amortized and accreted, respectively, to interest income
21
FTSE Social Index Fund
over the lives of the respective securities. Security transactions are accounted for on the date securities are bought or sold. Costs used to determine realized gains (losses) on the sale of investment securities are those of the specific securities sold.
Each class of shares has equal rights as to assets and earnings, except that each class separately bears certain class-specific expenses related to maintenance of shareholder accounts (included in Management and Administrative expenses) and shareholder reporting. Marketing and distribution expenses are allocated to each class of shares based on a method approved by the board of trustees. Income, other non-class-specific expenses, and gains and losses on investments are allocated to each class of shares based on its relative net assets.
B. In accordance with the terms of a Funds’ Service Agreement (the “FSA”) between Vanguard and the fund, Vanguard furnishes to the fund investment advisory, corporate management, administrative, marketing, and distribution services at Vanguard’s cost of operations (as defined by the FSA). These costs of operations are allocated to the fund based on methods and guidelines approved by the board of trustees. Vanguard does not require reimbursement in the current period for certain costs of operations (such as deferred compensation/benefits and risk/insurance costs); the fund’s liability for these costs of operations is included in Payables to Vanguard on the Statement of Net Assets. All other costs of operations payable to Vanguard are generally settled twice a month.
Upon the request of Vanguard, the fund may invest up to 0.40% of its net assets as capital in Vanguard. At August 31, 2019, the fund had contributed to Vanguard capital in the amount of $294,000, representing less than 0.01% of the fund’s net assets and 0.12% of Vanguard’s capital received pursuant to the FSA. The fund’s trustees and officers are also directors and employees, respectively, of Vanguard.
C. Various inputs may be used to determine the value of the fund’s investments. These inputs are summarized in three broad levels for financial statement purposes. The inputs or methodologies used to value securities are not necessarily an indication of the risk associated with investing in those securities.
Level 1—Quoted prices in active markets for identical securities.
Level 2—Other significant observable inputs (including quoted prices for similar securities, interest rates, prepayment speeds, credit risk, etc.).
Level 3—Significant unobservable inputs (including the fund’s own assumptions used to determine the fair value of investments). Any investments valued with significant unobservable inputs are noted on the Statement of Net Assets.
At August 31, 2019, 100% of the market value of the fund’s investments and derivatives was determined based on Level 1 inputs.
22
FTSE Social Index Fund
D. Permanent differences between book-basis and tax-basis components of net assets are reclassified among capital accounts in the financial statements to reflect their tax character. These reclassifications have no effect on net assets or net asset value per share. As of period end, permanent differences primarily attributable to the accounting for in-kind redemptions and the expiration of capital loss carryforwards were reclassified between the following accounts:
| Amount | |
| ($000 | ) |
Paid-in Capital | 226,911 | |
Total Distributable Earnings (Loss) | (226,911 | ) |
Temporary differences between book-basis and tax-basis components of total distributable earnings (loss) arise when certain items of income, gain, or loss are recognized in different periods for financial statement and tax purposes; these differences will reverse at some time in the future. The differences are primarily related to the tax deferral on wash sales and the realization of unrealized gains or losses on certain futures contracts. As of period end, the tax-basis components of total distributable earnings (loss) are detailed in the table as follows:
| Amount | |
| ($000 | ) |
Undistributed Ordinary Income | 21,138 | |
Undistributed Long-Term Gains | — | |
Capital Loss Carryforwards (Non-expiring)* | (35,619 | ) |
Net Unrealized Gains (Losses) | 1,526,159 | |
* The fund used capital loss carryforwards of $2,744,000 to offset taxable capital gains realized during the year ended August 31, 2019.
As of August 31, 2019, gross unrealized appreciation and depreciation for investments and derivatives based on cost for U.S. federal income tax purposes were as follows:
| Amount | |
| ($000 | ) |
Tax Cost | 4,709,811 | |
Gross Unrealized Appreciation | 1,746,038 | |
Gross Unrealized Depreciation | (219,879 | ) |
Net Unrealized Appreciation (Depreciation) | 1,526,159 | |
E. During the year ended August 31, 2019, the fund purchased $1,900,688,000 of investment securities and sold $978,935,000 of investment securities, other than temporary cash investments. Purchases and sales include $0 and $423,499,000, respectively, in connection with in-kind purchases and redemptions of the fund’s capital shares.
23
FTSE Social Index Fund
The fund purchased securities from and sold securities to other Vanguard funds or accounts managed by Vanguard or its affiliates, in accordance with procedures adopted by the board of trustees in compliance with Rule 17a-7 of the Investment Company Act of 1940. For the year ended August 31, 2019, such purchases and sales were $113,204,000 and $149,565,000, respectively; these amounts are included in the purchases and sales of investment securities noted above.
F. Capital share transactions for each class of shares were:
| Year Ended August 31, | |
| | 2019 | | | 2018 | |
| Amount | Shares | | Amount | Shares | |
| ($000) | (000) | | ($000) | (000 | ) |
Investor Shares | | | | | | |
Issued | 1,047,133 | 55,926 | | 875,104 | 49,256 | |
Issued in Lieu of Cash Distributions | 35,663 | 1,980 | | 31,033 | 1,813 | |
Redeemed1 | (3,907,387) | (201,067) | | (461,163) | (25,902 | ) |
Net Increase (Decrease)—Investor Shares | (2,824,591) | (143,161) | | 444,974 | 25,167 | |
Admiral Shares2 | | | | | | |
Issued1 | 3,569,059 | 131,708 | | — | — | |
Issued in Lieu of Cash Distributions | 7,410 | 274 | | — | — | |
Redeemed | (120,135) | (4,460) | | — | — | |
Net Increase (Decrease)—Admiral Shares | 3,456,334 | 127,522 | | — | — | |
Institutional Shares | | | | | | |
Issued | 1,010,600 | 53,651 | | 778,428 | 43,355 | |
Issued in Lieu of Cash Distributions | 35,748 | 1,947 | | 26,908 | 1,569 | |
Redeemed | (758,228) | (39,850) | | (223,709) | (12,466 | ) |
Net Increase (Decrease)—Institutional Shares | 288,120 | 15,748 | | 581,627 | 32,458 | |
1 In November 2018, the fund announced changes to the availability and minimum investment criteria of the Investor and Admiral share classes. As a result, all of the outstanding Investor Shares automatically converted to Admiral Shares beginning in April 2019, with the exception of those held by Vanguard funds and certain other institutional investors. Investor Shares—Redeemed and Admiral Shares—Issued include $3,361,780,000 from the conversion during the year ended August 31, 2019.
2 Inception was February 7, 2019, for Admiral Shares.
G. Management has determined that no events or transactions occurred subsequent to August 31, 2019, that would require recognition or disclosure in these financial statements.
24
Report of Independent Registered Public Accounting Firm
To the Board of Trustees of Vanguard World Fund and Shareholders of Vanguard FTSE Social Index Fund
Opinion on the Financial Statements
We have audited the accompanying statement of net assets of Vanguard FTSE Social Index Fund (one of the funds constituting Vanguard World Fund, referred to hereafter as the “Fund”) as of August 31, 2019, the related statement of operations for the year ended August 31, 2019, the statement of changes in net assets for each of the two years in the period ended August 31, 2019, including the related notes, and the financial highlights for each of the periods indicated therein (collectively referred to as the “financial statements”). In our opinion, the financial statements present fairly, in all material respects, the financial position of the Fund as of August 31, 2019, the results of its operations for the year then ended, the changes in its net assets for each of the two years in the period ended August 31, 2019 and the financial highlights for each of the periods indicated therein in conformity with accounting principles generally accepted in the United States of America.
Basis for Opinion
These financial statements are the responsibility of the Fund’s management. Our responsibility is to express an opinion on the Fund’s financial statements based on our audits. We are a public accounting firm registered with the Public Company Accounting Oversight Board (United States) (“PCAOB”) and are required to be independent with respect to the Fund in accordance with the U.S. federal securities laws and the applicable rules and regulations of the Securities and Exchange Commission and the PCAOB.
We conducted our audits of these financial statements in accordance with the standards of the PCAOB. Those standards require that we plan and perform the audit to obtain reasonable assurance about whether the financial statements are free of material misstatement, whether due to error or fraud.
Our audits included performing procedures to assess the risks of material misstatement of the financial statements, whether due to error or fraud, and performing procedures that respond to those risks. Such procedures included examining, on a test basis, evidence regarding the amounts and disclosures in the financial statements. Our audits also included evaluating the accounting principles used and significant estimates made by management, as well as evaluating the overall presentation of the financial statements. Our procedures included confirmation of securities owned as of August 31, 2019 by correspondence with the custodian and brokers and by agreement to the underlying ownership records of the transfer agent; when replies were not received from brokers, we performed other auditing procedures. We believe that our audits provide a reasonable basis for our opinion.
/s/PricewaterhouseCoopers LLP
Philadelphia, Pennsylvania
October 16, 2019
We have served as the auditor of one or more investment companies in The Vanguard Group of Funds since 1975.
25
Special 2019 tax information (unaudited) for Vanguard FTSE Social Index Fund
This information for the fiscal year ended August 31, 2019, is included pursuant to provisions of the Internal Revenue Code.
The fund distributed $85,488,000 of qualified dividend income to shareholders during the fiscal year.
For corporate shareholders, 98.4% of investment income (dividend income plus short-term gains, if any) qualifies for the dividends-received deduction.
26
Trustees Approve Advisory Arrangement
The board of trustees of Vanguard FTSE Social Index Fund has renewed the fund’s investment advisory arrangement with The Vanguard Group, Inc. (Vanguard), through its Equity Index Group. The board determined that continuing the fund’s internalized management structure was in the best interests of the fund and its shareholders.
The board based its decision upon an evaluation of the advisor’s investment staff, portfolio management process, and performance. This evaluation included information provided to the board by Vanguard’s Portfolio Review Department, which is responsible for fund and advisor oversight and product management. The Portfolio Review Department met regularly with the advisor and made monthly presentations to the board during the fiscal year that directed the board’s focus to relevant information and topics.
The board, or an investment committee made up of board members, also received information throughout the year through advisor presentations. For each advisor presentation, the board was provided with letters and reports that included information about, among other things, the advisory firm and the advisor’s assessment of the investment environment, portfolio performance, and portfolio characteristics.
In addition, the board received monthly reports, which included a Market and Economic Report, a Fund Dashboard Monthly Summary, and a Fund Performance Report.
Prior to their meeting, the trustees were provided with a memo and materials that summarized the information they received over the course of the year. They also considered the factors discussed below, among others. However, no single factor determined whether the board approved the arrangement. Rather, it was the totality of the circumstances that drove the board’s decision.
Nature, extent, and quality of services
The board reviewed the quality of the fund’s investment management services over both the short and long term, and took into account the organizational depth and stability of the advisor. The board considered that Vanguard has been managing investments for more than four decades. The Equity Index Group adheres to a sound, disciplined investment management process; the team has considerable experience, stability, and depth.
The board concluded that Vanguard’s experience, stability, depth, and performance, among other factors, warranted continuation of the advisory arrangement.
Investment performance
The board considered the short- and long-term performance of the fund, including any periods of outperformance or underperformance compared with its target index and peer group. The board concluded that the performance was such that the advisory arrangement should continue.
Cost
The board concluded that the fund’s expense ratio was well below the average expense ratio charged by funds in its peer group and that the fund’s advisory expenses were also well below the peer-group average.
27
The board does not conduct a profitability analysis of Vanguard because of Vanguard’s unique structure. Unlike most other mutual fund management companies, Vanguard is owned by the funds it oversees.
The benefit of economies of scale
The board concluded that the fund’s arrangement with Vanguard ensures that the fund will realize economies of scale as it grows, with the cost to shareholders declining as fund assets increase.
The board will consider whether to renew the advisory arrangement again after a one-year period.
28
London Stock Exchange Group companies include FTSE International Limited (“FTSE”), Frank Russell Company (“Russell”), MTS Next Limited (“MTS”), and FTSE TMX Global Debt Capital Markets Inc. (“FTSE TMX”). All rights reserved. “FTSE®”, “Russell®”, “MTS®”, “FTSE TMX®” and “FTSE Russell” and other service marks and trademarks related to the FTSE or Russell indexes are trademarks of the London Stock Exchange Group companies and are used by FTSE, MTS, FTSE TMX and Russell under license. All information is provided for information purposes only. Every effort is made to ensure that all information given in this publication is accurate, but no responsibility or liability can be accepted by the London Stock Exchange Group companies nor its licensors for any errors or for any loss from use of this publication. Neither the London Stock Exchange Group companies nor any of their licensors make any claim, prediction, warranty or representation whatsoever, expressly or impliedly, either as to the results to be obtained from the use of the Indices or the fitness or suitability of the Indices for any particular purpose to which they might be put. The London Stock Exchange Group companies do not provide investment advice and nothing in this document should be taken as constituting financial or investment advice. The London Stock Exchange Group companies make no representation regarding the advisability of investing in any asset. A decision to invest in any such asset should not be made in reliance on any information herein. Indexes cannot be invested in directly. Inclusion of an asset in an index is not a recommendation to buy, sell or hold that asset. The general information contained in this publication should not be acted upon without obtaining specific legal, tax, and investment advice from a licensed professional. No part of this information may be reproduced, stored in a retrieval system or transmitted in any form or by any means, electronic, mechanical, photocopying, recording or otherwise, without prior written permission of the London Stock Exchange Group companies. Distribution of the London Stock Exchange Group companies’ index values and the use of their indexes to create financial products require a license with FTSE, FTSE TMX, MTS and/or Russell and/or its licensors.
29
This page intentionally left blank.
The People Who Govern Your Fund
The trustees of your mutual fund are there to see that the fund is operated and managed in your best interests since, as a shareholder, you are a part owner of the fund. Your fund’s trustees also serve on the board of directors of The Vanguard Group, Inc., which is owned by the Vanguard funds and provides services to them.
A majority of Vanguard’s board members are independent, meaning that they have no affiliation with Vanguard or the funds they oversee, apart from the sizable personal investments they have made as private individuals. The independent board members have distinguished backgrounds in business, academia, and public service. Each of the trustees and executive officers oversees 212 Vanguard funds.
Information for each trustee and executive officer of the fund appears below. The mailing address of the trustees and officers is P.O. Box 876, Valley Forge, PA 19482. More information about the trustees is in the Statement of Additional Information, which can be obtained, without charge, by contacting Vanguard at 800-662-7447, or online at vanguard.com.
Interested Trustee1
Mortimer J. Buckley
Born in 1969. Trustee since January 2018. Principal occupation(s) during the past five years and other experience: chairman of the board (January 2019–present) of Vanguard and of each of the investment companies served by Vanguard; chief executive officer (January 2018–present) of Vanguard; chief executive officer, president, and trustee (January 2018–present) of each of the investment companies served by Vanguard; president and director (2017–present) of Vanguard; and president (February 2018–present) of Vanguard Marketing Corporation. Chief investment officer (2013–2017), managing director (2002–2017), head of the Retail Investor Group (2006–2012), and chief information officer (2001–2006) of Vanguard. Chairman of the board (2011–2017) and trustee (2009–2017) of the Children’s Hospital of Philadelphia; trustee (2018–present) of The Shipley School.
Independent Trustees
Emerson U. Fullwood
Born in 1948. Trustee since January 2008. Principal occupation(s) during the past five years and other experience: executive chief staff and marketing officer for North America and corporate vice president (retired 2008) of Xerox Corporation (document management products and services). Former president of the Worldwide Channels Group, Latin America, and Worldwide Customer Service and executive chief staff officer of Developing Markets of Xerox. Executive in residence and 2009–2010 Distinguished Minett Professor at the Rochester Institute of Technology. Director of SPX FLOW, Inc. (multi-industry manufacturing). Director of the University of Rochester Medical Center, the Monroe Community College Foundation, the United Way of Rochester, North Carolina A&T University, and Roberts Wesleyan College. Trustee of the University of Rochester.
Amy Gutmann
Born in 1949. Trustee since June 2006. Principal occupation(s) during the past five years and other experience: president (2004–present) of the University of Pennsylvania. Christopher H. Browne Distinguished Professor of Political Science, School of Arts and Sciences, and professor of communication, Annenberg School for Communication, with secondary faculty appointments in the Department of Philosophy, School of Arts and Sciences, and at the Graduate School of Education, University of Pennsylvania. Trustee of the National Constitution Center.
F. Joseph Loughrey
Born in 1949. Trustee since October 2009. Principal occupation(s) during the past five years and other experience: president and chief operating officer (retired 2009) and vice chairman of the board (2008–2009) of Cummins Inc. (industrial machinery). Chairman of the board of Hillenbrand, Inc. (specialized consumer services), and the Lumina Foundation.
1 Mr. Buckley is considered an “interested person,” as defined in the Investment Company Act of 1940, because he is an officer of the Vanguard funds.
Director of the V Foundation and Oxfam America. Member of the advisory council for the College of Arts and Letters and chair of the advisory board to the Kellogg Institute for International Studies, both at the University of Notre Dame.
Mark Loughridge
Born in 1953. Trustee since March 2012. Principal occupation(s) during the past five years and other experience: senior vice president and chief financial officer (retired 2013) of IBM (information technology services). Fiduciary member of IBM’s Retirement Plan Committee (2004–2013), senior vice president and general manager (2002–2004) of IBM Global Financing, vice president and controller (1998–2002) of IBM, and a variety of other prior management roles at IBM. Member of the Council on Chicago Booth.
Scott C. Malpass
Born in 1962. Trustee since March 2012. Principal occupation(s) during the past five years and other experience: chief investment officer (1989–present) and vice president (1996–present) of the University of Notre Dame. Assistant professor of finance at the Mendoza College of Business, University of Notre Dame, and member of the Notre Dame 403(b) Investment Committee. Chairman of the board of TIFF Advisory Services, Inc. Member of the board of Catholic Investment Services, Inc. (investment advisors) and the board of superintendence of the Institute for the Works of Religion.
Deanna Mulligan
Born in 1963. Trustee since January 2018. Principal occupation(s) during the past five years and other experience: president (2010–present) and chief executive officer (2011–present) of The Guardian Life Insurance Company of America. Chief operating officer (2010–2011) and executive vice president (2008–2010) of Individual Life and Disability of The Guardian Life Insurance Company of America. Member of the board of The Guardian Life Insurance Company of America, the American Council of Life Insurers, the Partnership for New York City (business leadership), and the Committee Encouraging Corporate Philanthropy. Trustee of the Economic Club of New York and the Bruce Museum (arts and science). Member of the Advisory Council for the Stanford Graduate School of Business.
André F. Perold
Born in 1952. Trustee since December 2004. Principal occupation(s) during the past five years and other experience: George Gund Professor of Finance and Banking, Emeritus at the Harvard Business School (retired 2011). Chief investment officer and co-managing partner of HighVista Strategies LLC (private investment firm). Board of advisors and investment committee member of the Museum of Fine Arts Boston. Board member (2018–present) of RIT Capital Partners (investment firm); investment committee member of Partners Health Care System.
Sarah Bloom Raskin
Born in 1961. Trustee since January 2018. Principal occupation(s) during the past five years and other experience: deputy secretary (2014–2017) of the United States Department of the Treasury. Governor (2010–2014) of the Federal Reserve Board. Commissioner (2007–2010) of financial regulation for the State of Maryland. Member of the board of directors (2012–2014) of Neighborhood Reinvestment Corporation. Director (2017–present) of i(x) Investments, LLC; director (2017–present) of Reserve Trust. Rubinstein Fellow (2017–present) of Duke University; trustee (2017–present) of Amherst College.
Peter F. Volanakis
Born in 1955. Trustee since July 2009. Principal occupation(s) during the past five years and other experience: president and chief operating officer (retired 2010) of Corning Incorporated (communications equipment) and director of Corning Incorporated (2000–2010) and Dow Corning (2001–2010). Director (2012) of SPX Corporation (multi-industry manufacturing). Overseer of the Amos Tuck School of Business Administration, Dartmouth College (2001–2013). Chairman of the board of trustees of Colby-Sawyer College. Member of the board of Hypertherm Inc. (industrial cutting systems, software, and consumables).
Executive Officers
Glenn Booraem
Born in 1967. Principal occupation(s) during the past five years and other experience: principal of Vanguard. Investment stewardship officer (2017–present), treasurer (2015–2017), controller (2010–2015), and assistant controller (2001–2010) of each of the investment companies served by Vanguard.
Christine M. Buchanan
Born in 1970. Principal occupation(s) during the past five years and other experience: principal of Vanguard and global head of Fund Administration at Vanguard. Treasurer (2017–present) of each of the investment companies served by Vanguard. Partner (2005–2017) at KPMG LLP (audit, tax, and advisory services).
Thomas J. Higgins
Born in 1957. Principal occupation(s) during the past five years and other experience: principal of Vanguard. Chief financial officer (2008–present) and treasurer (1998–2008) of each of the investment companies served by Vanguard.
Peter Mahoney
Born in 1974. Principal occupation(s) during the past five years and other experience: principal of Vanguard. Controller (2015–present) of each of the investment companies served by Vanguard. Head of International Fund Services (2008–2014) at Vanguard.
Anne E. Robinson
Born in 1970. Principal occupation(s) during the past five years and other experience: general counsel (2016–present) of Vanguard. Secretary (2016–present) of Vanguard and of each of the investment companies served by Vanguard. Managing director (2016–present) of Vanguard. Director and senior vice president (2016–2018) of Vanguard Marketing Corporation. Managing director and general counsel of Global Cards and Consumer Services (2014–2016) at Citigroup. Counsel (2003–2014) at American Express.
Michael Rollings
Born in 1963. Principal occupation(s) during the past five years and other experience: finance director (2017–present) and treasurer (2017) of each of the investment companies served by Vanguard. Managing director (2016–present) of Vanguard. Chief financial officer (2016–present) of Vanguard. Director (2016–present) of Vanguard Marketing Corporation. Executive vice president and chief financial officer (2006–2016) of MassMutual Financial Group.
John E. Schadl
Born in 1972. Principal occupation(s) during the past five years and other experience: principal of Vanguard. Chief compliance officer (2019–present) of Vanguard and of each of the investment companies served by Vanguard. Assistant vice president (May 2019–present) of Vanguard Marketing Corporation.
Vanguard Senior Management Team |
|
Joseph Brennan | Chris D. McIsaac |
Mortimer J. Buckley | James M. Norris |
Gregory Davis | Thomas M. Rampulla |
John James | Karin A. Risi |
Martha G. King | Anne E. Robinson |
John T. Marcante | Michael Rollings |
| 
|
| |
| P.O. Box 2600 |
| Valley Forge, PA 19482-2600 |
Connect with Vanguard® > vanguard.com
Fund Information > 800-662-7447
Direct Investor Account Services > 800-662-2739
Institutional Investor Services > 800-523-1036
Text Telephone for People
Who Are Deaf or Hard of Hearing > 800-749-7273
This material may be used in conjunction with the offering of shares of any Vanguard fund only if preceded or accompanied by the fund’s current prospectus.
All comparative mutual fund data are from Morningstar, Inc., unless otherwise noted.
You can obtain a free copy of Vanguard’s proxy voting guidelines by visiting vanguard.com/proxyreporting or by calling Vanguard at 800-662-2739. The guidelines are also available from the SEC’s website, www.sec.gov. In addition, you may obtain a free report on how your fund voted the proxies for securities it owned during the 12 months ended June 30. To get the report, visit either vanguard.com/proxyreporting or www.sec.gov.
You can review information about your fund on the SEC’s website, and you can receive copies of this information, for a fee, by sending a request via email addressed to publicinfo@sec.gov.
Source for Bloomberg Barclays indexes: Bloomberg Index Services Limited. Copyright 2019, Bloomberg. All rights reserved.
| © 2019 The Vanguard Group, Inc. |
| All rights reserved. |
| Vanguard Marketing Corporation, Distributor. |
| |
| Q2130 102019 |

Annual Report | August 31, 2019 Vanguard U.S. Sector Index Funds |
Vanguard Communication Services Index Fund Vanguard Consumer Discretionary Index Fund Vanguard Consumer Staples Index Fund Vanguard Energy Index Fund Vanguard Financials Index Fund Vanguard Health Care Index Fund Vanguard Industrials Index Fund Vanguard Information Technology Index Fund Vanguard Materials Index Fund Vanguard Utilities Index Fund See the inside front cover for important information about access to your fund’s annual and semiannual shareholder reports. |
Important information about access to shareholder reports
Beginning on January 1, 2021, as permitted by regulations adopted by the Securities and Exchange Commission, paper copies of your fund’s annual and semiannual shareholder reports will no longer be sent to you by mail, unless you specifically request them. Instead, you will be notified by mail each time a report is posted on the website and will be provided with a link to access the report.
If you have already elected to receive shareholder reports electronically, you will not be affected by this change and do not need to take any action. You may elect to receive shareholder reports and other communications from the fund electronically by contacting your financial intermediary (such as a broker-dealer or bank) or, if you invest directly with the fund, by calling Vanguard at one of the phone numbers on the back cover of this report or by logging on to vanguard.com.
You may elect to receive paper copies of all future shareholder reports free of charge. If you invest through a financial intermediary, you can contact the intermediary to request that you continue to receive paper copies. If you invest directly with the fund, you can call Vanguard at one of the phone numbers on the back cover of this report or log on to vanguard.com. Your election to receive paper copies will apply to all the funds you hold through an intermediary or directly with Vanguard.
Contents | |
| |
A Note From Our Chairman | 1 |
Your Fund’s Performance at a Glance | 2 |
About Your Fund’s Expenses | 3 |
Communication Services Index Fund | 5 |
Consumer Discretionary Index Fund | 15 |
Consumer Staples Index Fund | 26 |
Energy Index Fund | 36 |
Financials Index Fund | 47 |
Health Care Index Fund | 59 |
Industrials Index Fund | 72 |
Information Technology Index Fund | 84 |
Materials Index Fund | 96 |
Utilities Index Fund | 106 |
Trustees Approve Advisory Arrangements | 118 |

Please note: The opinions expressed in this report are just that—informed opinions. They should not be considered promises or advice. Also, please keep in mind that the information and opinions cover the period through the date on the front of this report. Of course, the risks of investing in your fund are spelled out in the prospectus.
A Note From Our Chairman

Tim Buckley
Chairman and Chief Executive Officer
Dear Shareholder,
Recent volatility in financial markets—affecting stocks, bonds, and commodities—has been a good reminder of the wise old adage, “Never keep all your eggs in one basket.” Maintaining balance and diversification in your investment portfolio can help to both limit risk and set you up for long-term success.
It’s understandable why some investors might become complacent after a long market run-up like the one that lifted stock prices, especially U.S. stock prices, in the years following the global financial crisis. But failing to rebalance regularly can leave a portfolio with a much different mix of assets than intended and, often, more risk than intended.
Balance across and diversification within asset classes are powerful tools for managing risk and achieving your investment goals. A portfolio’s allocation will determine a large portion of its long-term return and also the majority of its volatility risk. A well-diversified portfolio is less vulnerable to significant swings in the performance of any one segment of the asset classes in which it invests.
Balance and diversification will never eliminate the risk of loss, nor will they guarantee positive returns in a declining market. But they should reduce the chance that you’ll suffer disproportionate losses in one particular high-flying asset class or sector when it comes back to earth. And exposure to all key market components should give you at least some participation in the sectors that are performing best at any given time.
Vanguard is committed to helping you achieve balance and diversification in your portfolios to help meet your investment goals. We thank you for your continued loyalty.
Sincerely,

Mortimer J. Buckley
Chairman and Chief Executive Officer
October 1, 2019
1
Your Fund’s Performance at a Glance
· For the 12 months ended August 31, 2019, returns for the Vanguard U.S. Sector Index Funds ranged from about –24% to more than 20%. All ten funds closely tracked their target indexes.
· Market sentiment was dampened by signs of decelerating global growth, flare-ups in trade disputes, heightened tensions with Iran, and a lack of agreement in the United Kingdom on how to exit the European Union.
· Four of the funds had positive returns, led by Vanguard Utilities Index, Consumer Staples Index, and Information Technology Index Funds. Six funds lost ground, notably Vanguard Energy Index and Materials Index Funds.
Market Barometer | | | | | | | |
| | Average Annual Total Returns | |
| | Periods Ended August 31, 2019 | |
| | One Year | | Three Years | | Five Years | |
Stocks | | | | | | | |
Russell 1000 Index (Large-caps) | | 2.49% | | 12.57% | | 9.85% | |
Russell 2000 Index (Small-caps) | | -12.89 | | 7.89 | | 6.41 | |
Russell 3000 Index (Broad U.S. market) | | 1.31 | | 12.24 | | 9.60 | |
FTSE All-World ex US Index (International) | | -3.18 | | 5.97 | | 1.71 | |
| | | | | | | |
Bonds | | | | | | | |
Bloomberg Barclays U.S. Aggregate Bond Index (Broad taxable market) | | 10.17% | | 3.09% | | 3.35% | |
Bloomberg Barclays Municipal Bond Index (Broad tax-exempt market) | | 8.72 | | 3.30 | | 3.85 | |
FTSE Three-Month U.S. Treasury Bill Index | | 2.36 | | 1.47 | | 0.91 | |
| | | | | | | |
CPI | | | | | | | |
Consumer Price Index | | 1.75% | | 2.13% | | 1.53% | |
2
About Your Fund’s Expenses
As a shareholder of the fund, you incur ongoing costs, which include costs for portfolio management, administrative services, and shareholder reports (like this one), among others. Operating expenses, which are deducted from a fund’s gross income, directly reduce the investment return of the fund.
A fund’s expenses are expressed as a percentage of its average net assets. This figure is known as the expense ratio. The following examples are intended to help you understand the ongoing costs (in dollars) of investing in your fund and to compare these costs with those of other mutual funds. The examples are based on an investment of $1,000 made at the beginning of the period shown and held for the entire period.
The accompanying table illustrates your fund’s costs in two ways:
· Based on actual fund return. This section helps you to estimate the actual expenses that you paid over the period. The “Ending Account Value” shown is derived from the fund’s actual return, and the third column shows the dollar amount that would have been paid by an investor who started with $1,000 in the fund. You may use the information here, together with the amount you invested, to estimate the expenses that you paid over the period.
To do so, simply divide your account value by $1,000 (for example, an $8,600 account value divided by $1,000 = 8.6), then multiply the result by the number given for your fund under the heading “Expenses Paid During Period.”
· Based on hypothetical 5% yearly return. This section is intended to help you compare your fund’s costs with those of other mutual funds. It assumes that the fund had a yearly return of 5% before expenses, but that the expense ratio is unchanged. In this case—because the return used is not the fund’s actual return—the results do not apply to your investment. The example is useful in making comparisons because the Securities and Exchange Commission requires all mutual funds to calculate expenses based on a 5% return. You can assess your fund’s costs by comparing this hypothetical example with the hypothetical examples that appear in shareholder reports of other funds.
Note that the expenses shown in the table are meant to highlight and help you compare ongoing costs only and do not reflect transaction costs incurred by the fund for buying and selling securities. Further, the expenses do not include any purchase, redemption, or account service fees described in the fund prospectus. If such fees were applied to your account, your costs would be higher. Your fund does not carry a “sales load.”
The calculations assume no shares were bought or sold during the period. Your actual costs may have been higher or lower, depending on the amount of your investment and the timing of any purchases or redemptions.
You can find more information about the fund’s expenses in the Financial Statements section of this report. For additional information on operating expenses and other shareholder costs, please refer to your fund’s current prospectus.
3
Six Months Ended August 31, 2019 | | | | | | | | | |
| | | | Beginning | | Ending | | Expenses | |
| | | | Account Value | | Account Value | | Paid During | |
Index Fund | | Share Class | | 2/28/2019 | | 8/31/2019 | | Period | |
Based on Actual Fund Return | | | | | | | | | |
Communication Services | | ETF | | $1,000.00 | | $1,064.83 | | $0.52 | |
| | Admiral | | 1,000.00 | | 1,064.73 | | 0.52 | |
Consumer Discretionary | | ETF | | $1,000.00 | | $1,066.52 | | $0.52 | |
| | Admiral | | 1,000.00 | | 1,066.59 | | 0.52 | |
Consumer Staples | | ETF | | $1,000.00 | | $1,109.49 | | $0.53 | |
| | Admiral | | 1,000.00 | | 1,109.51 | | 0.53 | |
Energy | | ETF | | $1,000.00 | | $874.53 | | $0.47 | |
| | Admiral | | 1,000.00 | | 874.61 | | 0.47 | |
Financials | | ETF | | $1,000.00 | | $1,016.18 | | $0.51 | |
| | Admiral | | 1,000.00 | | 1,016.12 | | 0.51 | |
Health Care | | ETF | | $1,000.00 | | $994.52 | | $0.50 | |
| | Admiral | | 1,000.00 | | 994.59 | | 0.50 | |
Industrials | | ETF | | $1,000.00 | | $1,009.14 | | $0.51 | |
| | Admiral | | 1,000.00 | | 1,009.14 | | 0.51 | |
Information Technology | | ETF | | $1,000.00 | | $1,112.08 | | $0.53 | |
| | Admiral | | 1,000.00 | | 1,112.15 | | 0.53 | |
Materials | | ETF | | $1,000.00 | | $1,006.25 | | $0.51 | |
| | Admiral | | 1,000.00 | | 1,006.37 | | 0.51 | |
Utilities | | ETF | | $1,000.00 | | $1,111.79 | | $0.53 | |
| | Admiral | | 1,000.00 | | 1,111.90 | | 0.53 | |
Based on Hypothetical 5% Yearly Return | | | | | | | | | |
Communication Services | | ETF | | $1,000.00 | | $1,024.70 | | $0.51 | |
| | Admiral | | 1,000.00 | | 1,024.70 | | 0.51 | |
Consumer Discretionary | | ETF | | $1,000.00 | | $1,024.70 | | $0.51 | |
| | Admiral | | 1,000.00 | | 1,024.70 | | 0.51 | |
Consumer Staples | | ETF | | $1,000.00 | | $1,024.70 | | $0.51 | |
| | Admiral | | 1,000.00 | | 1,024.70 | | 0.51 | |
Energy | | ETF | | $1,000.00 | | $1,024.70 | | $0.51 | |
| | Admiral | | 1,000.00 | | 1,024.70 | | 0.51 | |
Financials | | ETF | | $1,000.00 | | $1,024.70 | | $0.51 | |
| | Admiral | | 1,000.00 | | 1,024.70 | | 0.51 | |
Health Care | | ETF | | $1,000.00 | | $1,024.70 | | $0.51 | |
| | Admiral | | 1,000.00 | | 1,024.70 | | 0.51 | |
Industrials | | ETF | | $1,000.00 | | $1,024.70 | | $0.51 | |
| | Admiral | | 1,000.00 | | 1,024.70 | | 0.51 | |
Information Technology | | ETF | | $1,000.00 | | $1,024.70 | | $0.51 | |
| | Admiral | | 1,000.00 | | 1,024.70 | | 0.51 | |
Materials | | ETF | | $1,000.00 | | $1,024.70 | | $0.51 | |
| | Admiral | | 1,000.00 | | 1,024.70 | | 0.51 | |
Utilities | | ETF | | $1,000.00 | | $1,024.70 | | $0.51 | |
| | Admiral | | 1,000.00 | | 1,024.70 | | 0.51 | |
The calculations are based on expenses incurred in the most recent six-month period. The funds’ annualized six-month expense ratios for that period are 0.10% for the Communication Services Index Fund ETF Shares and 0.10% for the Admiral Shares; 0.10% for the Consumer Discretionary Index Fund ETF Shares and 0.10% for the Admiral Shares; 0.10% for the Consumer Staples Index Fund ETF Shares and 0.10% for the Admiral Shares; 0.10% for the Energy Index Fund ETF Shares and 0.10% for the Admiral Shares; 0.10% for the Financials Index Fund ETF Shares and 0.10% for the Admiral Shares; 0.10% for the Health Care Index Fund ETF Shares and 0.10% for the Admiral Shares; 0.10% for the Industrials Index Fund ETF Shares and 0.10% for the Admiral Shares; 0.10% for the Information Technology Index Fund ETF Shares and 0.10% for the Admiral Shares; 0.10% for the Materials Index Fund ETF Shares and 0.10% for the Admiral Shares; 0.10% for the Utilities Index Fund ETF Shares and 0.10% for the Admiral Shares. The dollar amounts shown as “Expenses Paid” are equal to the annualized expense ratio multiplied by the average account value over the period, multiplied by the number of days in the most recent six-month period, then divided by the number of days in the most recent 12-month period (184/365).
4
Communication Services Index Fund
Performance Summary
All of the returns in this report represent past performance, which is not a guarantee of future results that may be achieved by the fund. (Current performance may be lower or higher than the performance data cited. For performance data current to the most recent month-end, visit our website at vanguard.com/performance.) Note, too, that both investment returns and principal value can fluctuate widely, so an investor’s shares, when sold, could be worth more or less than their original cost. The returns shown do not reflect taxes that a shareholder would pay on fund distributions or on the sale of fund shares.
Cumulative Performance: August 31, 2009–August 31, 2019
Initial Investment of $10,000

| | | | Average Annual Total Returns | | Final Value |
| | | | Periods Ended August 31, 2019 | | of a $10,000 |
| | | | One Year | | Five Years | | Ten Years | | Investment |

| | Communication Services Index Fund ETF Shares Net Asset Value | | 1.47% | | 2.89% | | 9.00% | | $23,679 |
| | Communication Services Index Fund ETF Shares Market Price | | 1.44 | | 2.88 | | 9.00 | | 23,681 |

| | Communication Services Spliced Index | | 1.41 | | 2.87 | | 8.60 | | 22,826 |

| | MSCI US IMI/2500 | | 1.32 | | 9.63 | | 13.41 | | 35,213 |
Communication Services Spliced Index: MSCI US IMI/Telecommunication Services through February 28, 2010; MSCI US IMI/ Telecommunication Services 25/50 through May 2, 2018; MSCI US IMI/Communication Services 25/50 Transition Index through December 2, 2018; MSCI US IMI/Communication Services 25/50 thereafter.
| | | | | | | | | | Final Value |
| | | | | | | | | | of a $100,000 |
| | | | One Year | | Five Years | | Ten Years | | Investment |
Communication Services Index Fund Admiral Shares | | 1.46% | | 2.91% | | 9.02% | | $237,116 |
Communication Services Spliced Index | | 1.41 | | 2.87 | | 8.60 | | 228,261 |
MSCI US IMI/2500 | | 1.32 | | 9.63 | | 13.41 | | 352,130 |
Cumulative Returns: ETF Shares, August 31, 2009–August 31, 2019
| | | | One Year | | Five Years | | Ten Years |
Communication Services Index Fund ETF Shares Market Price | | 1.44% | | 15.27% | | 136.81% |
Communication Services Index Fund ETF Shares Net Asset Value | | 1.47 | | 15.32 | | 136.79 |
Communication Services Spliced Index | | 1.41 | | 15.21 | | 128.26 |
For the ETF Shares, the market price is determined by the midpoint of the bid-offer spread as of the closing time of the New York Stock Exchange (generally 4 p.m., Eastern time). The net asset value is also determined as of the NYSE closing time. For more information about how the ETF Shares’ market prices have compared with their net asset value, visit vanguard.com, select your ETF, and then select the Price and Performance tab. The ETF premium/discount analysis there shows the percentages of days on which the ETF Shares’ market price was above or below the NAV.
See Financial Highlights for dividend and capital gains information.
5
Communication Services Index Fund
Sector Diversification
As of August 31, 2019
Advertising | | 1.6% | |
Alternative Carriers | | 3.4 | |
Broadcasting | | 4.9 | |
Cable & Satellite | | 12.7 | |
Integrated Telecommunication Services | | 12.3 | |
Interactive Home Entertainment | | 4.3 | |
Interactive Media & Services | | 43.2 | |
Movies & Entertainment | | 12.6 | |
Publishing | | 2.1 | |
Wireless Telecommunication Services | | 2.9 | |
The table reflects the fund’s equity exposure, based on its investments in stocks and stock index futures. Any holdings in short-term reserves are excluded. Sector categories are based on the Global Industry Classification Standard (“GICS”), except for the “Other” category (if applicable), which includes securities that have not been provided a GICS classification as of the effective reporting period.
The Global Industry Classification Standard (“GICS”) was developed by and is the exclusive property and a service mark of MSCI Inc. (“MSCI”) and Standard and Poor’s, a division of McGraw-Hill Companies, Inc. (“S&P”), and is licensed for use by Vanguard. Neither MSCI, S&P nor any third party involved in making or compiling the GICS or any GICS classification makes any express or implied warranties or representations with respect to such standard or classification (or the results to be obtained by the use thereof), and all such parties hereby expressly disclaim all warranties of originality, accuracy, completeness, merchantability or fitness for a particular purpose with respect to any such standard or classification. Without limiting any of the foregoing, in no event shall MSCI, S&P, any of its affiliates or any third party involved in making or compiling the GICS or any GICS classification have any liability for any direct, indirect, special, punitive, consequential or any other damages (including lost profits) even if notified of the possibility of such damages.
6
Communication Services Index Fund
Financial Statements
Statement of Net Assets
As of August 31, 2019
The fund files its complete schedule of portfolio holdings with the Securities and Exchange Commission (SEC) for the first and third quarters of each fiscal year as an exhibit to its reports on Form N-PORT. The fund’s Form N-PORT reports are available on the SEC’s website at www.sec.gov.
| | | | | Market | |
| | | | | Value· | |
| | | Shares | | ($000 | ) |
Common Stocks (99.8%)1 | | | | | |
Diversified Telecommunication Services (15.7%) | | | | | |
| Alternative Carriers (3.5%) | | | | | |
| CenturyLink Inc. | | 1,445,038 | | 16,445 | |
* | Zayo Group Holdings Inc. | | 469,717 | | 15,811 | |
* | GCI Liberty Inc. Class A | | 160,095 | | 9,964 | |
* | Vonage Holdings Corp. | | 682,995 | | 9,029 | |
| Cogent Communications Holdings Inc. | | 130,445 | | 7,943 | |
* | Iridium Communications Inc. | | 284,135 | | 6,870 | |
* | Bandwidth Inc. Class A | | 21,998 | | 1,918 | |
* | Anterix Inc. | | 35,026 | | 1,357 | |
* | ORBCOMM Inc. | | 224,373 | | 1,034 | |
*,^ | Globalstar Inc. | | 1,720,737 | | 651 | |
| | | | | | |
| Integrated Telecommunication Services (12.2%) | | | | | |
| AT&T Inc. | | 4,384,111 | | 154,584 | |
| Verizon Communications Inc. | | 1,612,283 | | 93,770 | |
| ATN International Inc. | | 33,076 | | 1,879 | |
^ | Consolidated Communications Holdings Inc. | | 211,826 | | 854 | |
* | Cincinnati Bell Inc. | | 134,409 | | 730 | |
*,^ | Pareteum Corp. | | 295,866 | | 633 | |
*,^ | Frontier Communications Corp. | | 313,211 | | 251 | |
| | | | | 323,723 | |
| | | | | | |
Entertainment (16.9%) | | | | | |
| Interactive Home Entertainment (4.3%) | | | | | |
| Activision Blizzard Inc. | | 660,377 | | 33,415 | |
* | Electronic Arts Inc. | | 283,705 | | 26,578 | |
* | Take-Two Interactive Software Inc. | | 142,596 | | 18,818 | |
* | Zynga Inc. Class A | | 1,598,283 | | 9,126 | |
* | Glu Mobile Inc. | | 342,956 | | 1,523 | |
| | | | | | |
| Movies & Entertainment (12.6%) | | | | | |
| Walt Disney Co. | | 680,414 | | 93,394 | |
* | Netflix Inc. | | 306,929 | | 90,160 | |
* | Live Nation Entertainment Inc. | | 190,285 | | 13,227 | |
* | Liberty Media Corp- Liberty Formula One | | 292,022 | | 12,189 | |
| Viacom Inc. Class B | | 446,073 | | 11,143 | |
| Cinemark Holdings Inc. | | 211,516 | | 8,072 | |
* | Madison Square Garden Co. Class A | | 30,238 | | 7,630 | |
| World Wrestling Entertainment Inc. Class A | | 83,972 | | 5,998 | |
* | IMAX Corp. | | 163,870 | | 3,428 | |
* | Liberty Media Corp- Liberty Formula One Class A | | 76,593 | | 3,032 | |
* | Liberty Media Corp- Liberty Braves Class C | | 106,478 | | 2,924 | |
| Lions Gate Entertainment Corp. Class B | | 262,241 | | 2,187 | |
| Lions Gate Entertainment Corp. Class A | | 213,443 | | 1,927 | |
| Marcus Corp. | | 56,813 | | 1,907 | |
^ | AMC Entertainment Holdings Inc. Class A | | 147,097 | | 1,634 | |
* | Liberty Media Corp- Liberty Braves Class A | | 25,254 | | 694 | |
* | Reading International Inc. Class A | | 43,499 | | 539 | |
| | | | | 349,545 | |
Interactive Media & Services (43.1%) | | | | | |
* | Facebook Inc. Class A | | 1,661,204 | | 308,436 | |
* | Alphabet Inc. Class C | | 199,525 | | 237,056 | |
* | Alphabet Inc. Class A | | 188,971 | | 224,976 | |
* | Twitter Inc. | | 667,296 | | 28,460 | |
* | IAC/InterActiveCorp | | 81,794 | | 20,828 | |
* | Snap Inc. | | 859,830 | | 13,611 | |
^ | Match Group Inc. | | 126,971 | | 10,767 | |
*,^ | Zillow Group Inc. | | 245,524 | | 8,453 | |
* | Pinterest Inc. Class A (XNYS) | | 224,629 | | 7,732 | |
* | TripAdvisor Inc. | | 180,866 | | 6,871 | |
* | Yelp Inc. Class A | | 201,271 | | 6,745 | |
* | Zillow Group Inc. Class A | | 163,061 | | 5,572 | |
* | Cargurus Inc. | | 84,646 | | 2,761 | |
* | Liberty TripAdvisor Holdings Inc. Class A | | 213,448 | | 1,865 | |
* | Cars.com Inc. | | 187,551 | | 1,671 | |
* | Eventbrite Inc. Class A | | 74,815 | | 1,308 | |
*,^ | ANGI Homeservices Inc. Class A | | 153,126 | | 1,188 | |
* | TrueCar Inc. | | 249,873 | | 989 | |
* | Care.com Inc. | | 86,675 | | 857 | |
* | Meet Group Inc. | | 209,788 | | 724 | |
| | | | | 890,870 | |
Media (21.2%) | | | | | |
| Advertising (1.6%) | | | | | |
| Omnicom Group Inc. | | 232,590 | | 17,691 | |
| Interpublic Group of Cos. Inc. | | 522,079 | | 10,379 | |
| National CineMedia Inc. | | 187,737 | | 1,539 | |
* | Cardlytics Inc. | | 33,402 | | 1,255 | |
| Emerald Expositions Events Inc. | | 74,526 | | 713 | |
* | Boston Omaha Corp. Class A | | 25,359 | | 519 | |
* | comScore Inc. | | 132,207 | | 246 | |
| | | | | | |
Broadcasting (4.9%) | | | | | |
| CBS Corp. Class B | | 355,791 | | 14,965 | |
| Fox Corp. Class A | | 405,450 | | 13,449 | |
* | Discovery Communications Inc. | | 419,165 | | 10,911 | |
* | Discovery Communications Inc. Class A | | 301,181 | | 8,313 | |
| Tribune Media Co. Class A | | 175,850 | | 8,191 | |
| Fox Corp. Class B | | 249,336 | | 8,178 | |
| Nexstar Media Group Inc. Class A | | 80,310 | | 7,942 | |
| Sinclair Broadcast Group Inc. Class A | | 174,368 | | 7,772 | |
| TEGNA Inc. | | 493,806 | | 7,066 | |
* | AMC Networks Inc. Class A | | 123,371 | | 5,983 | |
* | Gray Television Inc. | | 246,685 | | 3,774 | |
| EW Scripps Co. Class A | | 142,235 | | 1,758 | |
| Entercom Communications Corp. Class A | | 367,494 | | 1,308 | |
* | Hemisphere Media Group Inc. Class A | | 52,531 | | 624 | |
| Entravision Communications Corp. Class A | | 181,343 | | 555 | |
| | | | | | |
| Cable & Satellite (12.7%) | | | | | |
| Comcast Corp. Class A | | 2,143,436 | | 94,869 | |
* | Charter Communications Inc. Class A | | 135,053 | | 55,316 | |
* | Liberty Global plc | | 572,295 | | 14,948 | |
* | Liberty Broadband Corp. | | 126,114 | | 13,298 | |
* | DISH Network Corp. Class A | | 327,732 | | 10,999 | |
| Cable One Inc. | | 8,334 | | 10,814 | |
* | Liberty Media Corp- Liberty SiriusXM Class C | | 260,179 | | 10,618 | |
* | Liberty Global plc Class A | | 340,124 | | 9,088 | |
^ | Sirius XM Holdings Inc. | | 1,461,512 | | 9,018 | |
* | Liberty Broadband Corp. Class A | | 83,605 | | 8,758 | |
* | Liberty Media Corp- Liberty SiriusXM Class A | | 193,490 | | 7,834 | |
* | Liberty Latin America Ltd. | | 349,373 | | 5,761 | |
* | Altice USA Inc. Class A | | 141,015 | | 4,073 | |
* | MSG Networks Inc. | | 181,490 | | 2,976 | |
* | Liberty Latin America Ltd. Class A | | 129,135 | | 2,120 | |
* | Loral Space & Communications Inc. | | 35,174 | | 1,301 | |
* | WideOpenWest Inc. | | 74,570 | | 419 | |
| | | | | | |
| Publishing (2.0%) | | | | | |
| News Corp. Class A | | 702,396 | | 9,658 | |
| New York Times Co. Class A | | 257,521 | | 7,520 | |
| John Wiley & Sons Inc. Class A | | 134,857 | | 6,001 | |
| News Corp. Class B | | 393,475 | | 5,572 | |
| Meredith Corp. | | 118,687 | | 5,196 | |
| Gannett Co. Inc. | | 339,038 | | 3,567 | |
| Scholastic Corp. | | 89,454 | | 3,137 | |
| New Media Investment Group Inc. | | 162,367 | | 1,425 | |
| Tribune Publishing Co. | | 48,173 | | 368 | |
| | | | | 437,785 | |
7
Communication Services Index Fund
| | | | | Market | |
| | | | | Value· | |
| | | Shares | | ($000 | ) |
Wireless Telecommunication Services (2.9%) | | | | | |
* | T-Mobile US Inc. | | 382,809 | | 29,878 | |
* | Sprint Corp. | | 2,196,337 | | 14,913 | |
| Telephone & Data Systems Inc. | | 300,442 | | 7,571 | |
| Shenandoah Telecommunications Co. | | 140,221 | | 4,423 | |
* | Boingo Wireless Inc. | | 127,232 | | 1,638 | |
* | United States Cellular Corp. | | 39,551 | | 1,423 | |
*,^ | Gogo Inc. | | 170,160 | | 684 | |
| | | | | 60,530 | |
Total Common Stocks
(Cost $2,058,791) | | | | 2,062,453 | |
Temporary Cash Investment (1.2%)1 | | | | | |
Money Market Fund (1.2%) | | | | | |
2,3 | Vanguard Market Liquidity Fund, 2.249% (Cost $24,582) | | 245,806 | | 24,583 | |
Total Investments (101.0%)
(Cost $2,083,373) | | | | 2,087,036 | |
| | | | | |
| | | | Amount | |
| | | | ($000 | ) |
Other Assets and Liabilities (-1.0%) | | | | | |
Other Assets | | | | | |
Investment in Vanguard | | | | 98 | |
Receivables for Accrued Income | | | | 768 | |
Receivables for Capital Shares Issued | | | | 12 | |
Unrealized Appreciation—OTC Swap Contracts | | | | 135 | |
Other Assets | | | | 186 | |
Total Other Assets | | | | 1,199 | |
Liabilities | | | | | |
Payables for Investment Securities Purchased | | | | (2,000 | ) |
Collateral for Securities on Loan | | | | (19,442 | ) |
Payables for Capital Shares Redeemed | | | | (215 | ) |
Payables to Vanguard | | | | (352 | ) |
Total Liabilities | | | | (22,009 | ) |
Net Assets (100.0%) | | | | 2,066,226 | |
At August 31, 2019, net assets consisted of:
| | | | Amount | |
| | | | ($000 | ) |
Paid-in Capital | | | | 2,407,541 | |
Total Distributable Earnings (Loss) | | | | (341,315 | ) |
Net Assets | | | | 2,066,226 | |
| | | | | |
ETF Shares—Net Assets | | | | | |
Applicable to 23,114,812 outstanding $.001 par value shares of beneficial interest (unlimited authorization) | | | | 2,016,441 | |
Net Asset Value Per Share—ETF Shares | | | | $87.24 | |
| | | | | |
Admiral Shares—Net Assets | | | | | |
Applicable to 1,119,866 outstanding $.001 par value shares of beneficial interest (unlimited authorization) | | | | 49,785 | |
Net Asset Value Per Share—Admiral Shares | | | | $44.46 | |
· | See Note A in Notes to Financial Statements. |
| |
* | Non-income-producing security. |
| |
^ | Includes partial security positions on loan to broker-dealers. The total value of securities on loan is $17,619,000. |
| |
1 | The fund invests a portion of its cash reserves in equity markets through the use of swap contracts. After giving effect to swap investments, the fund’s effective common stock and temporary cash investment positions represent 100.0% and 1.0%, respectively, of net assets. |
| |
2 | Affiliated money market fund available only to Vanguard funds and certain trusts and accounts managed by Vanguard. Rate shown is the 7-day yield. |
| |
3 | Includes $19,442,000 of collateral received for securities on loan. OTC—Over-the-Counter. |
Derivative Financial Instruments Outstanding as of Period End |
|
Over-the-Counter Total Return Swaps |
| | | | | | | | | | | | | |
| | | | | | | | Floating | | | | | |
| | | | | | | | Interest Rate | | Value and | | Value and | |
| | | | | | Notional | | Received | | Unrealized | | Unrealized | |
| | Termination | | | | Amount | | (Paid | )1 | Appreciation | | (Depreciation | ) |
Reference Entity | | Date | | Counterparty | | ($000 | ) | (% | ) | ($000 | ) | ($000 | ) |
Sirius XM Holdings Inc. | | 2/4/20 | | GSI | | 3,881 | | (2.182 | ) | 135 | | — | |
1 | Payment received/paid monthly. |
GSI—Goldman Sachs International.
See accompanying Notes, which are an integral part of the Financial Statements.
8
Communication Services Index Fund
Statement of Operations
| | Year Ended | |
| | August 31, 2019 | |
| | ($000 | ) |
Investment Income | | | |
Income | | | |
Dividends | | 19,426 | |
Interest1 | | 54 | |
Securities Lending—Net | | 225 | |
Total Income | | 19,705 | |
Expenses | | | |
The Vanguard Group—Note B | | | |
Investment Advisory Services | | 236 | |
Management and Administrative—ETF Shares | | 1,075 | |
Management and Administrative—Admiral Shares | | 35 | |
Marketing and Distribution—ETF Shares | | 91 | |
Marketing and Distribution—Admiral Shares | | 3 | |
Custodian Fees | | 42 | |
Auditing Fees | | 33 | |
Shareholders’ Reports—ETF Shares | | 139 | |
Shareholders’ Reports—Admiral Shares | | 1 | |
Trustees’ Fees and Expenses | | 1 | |
Total Expenses | | 1,656 | |
Net Investment Income | | 18,049 | |
Realized Net Gain (Loss) | | | |
Investment Securities Sold1,2 | | 21,649 | |
Futures Contracts | | (68 | ) |
Swap Contracts | | (302 | ) |
Realized Net Gain (Loss) | | 21,279 | |
Change in Unrealized Appreciation (Depreciation) | | | |
Investment Securities1 | | (5,924 | ) |
Swap Contracts | | 135 | |
Change in Unrealized Appreciation (Depreciation) | | (5,789 | ) |
Net Increase (Decrease) in Net Assets Resulting from Operations | | 33,539 | |
1 | Interest income, realized net gain (loss), and change in unrealized appreciation (depreciation) from an affiliated company of the fund were $54,000, $1,000, and ($4,000), respectively. Purchases and sales are for temporary cash investment purposes. |
| |
2 | Includes $83,266,000 of net gain (loss) resulting from in-kind redemptions; such gain (loss) is not taxable to the fund. |
Statement of Changes in Net Assets
| | Year Ended August 31, | |
| | 2019 | | 2018 | |
| | ($000 | ) | ($000 | ) |
Increase (Decrease) in Net Assets | | | | | |
Operations | | | | | |
Net Investment Income | | 18,049 | | 39,579 | |
Realized Net Gain (Loss) | | 21,279 | | (198,104 | ) |
Change in Unrealized Appreciation (Depreciation) | | (5,789 | ) | 102,207 | |
Net Increase (Decrease) in Net Assets Resulting from Operations | | 33,539 | | (56,318 | ) |
Distributions | | | | | |
Net Investment Income | | | | | |
ETF Shares | | (14,813 | ) | (43,280 | ) |
Admiral Shares | | (463 | ) | (1,863 | ) |
Realized Capital Gain | | | | | |
ETF Shares | | — | | — | |
Admiral Shares | | — | | — | |
Total Distributions | | (15,276 | ) | (45,143 | ) |
Capital Share Transactions | | | | | |
ETF Shares | | 983,508 | | (275,041 | ) |
Admiral Shares | | 3,352 | | (659 | ) |
Net Increase (Decrease) from Capital Share Transactions | | 986,860 | | (275,700 | ) |
Total Increase (Decrease) | | 1,005,123 | | (377,161 | ) |
Net Assets | | | | | |
Beginning of Period | | 1,061,103 | | 1,438,264 | |
End of Period | | 2,066,226 | | 1,061,103 | |
See accompanying Notes, which are an integral part of the Financial Statements.
9
Communication Services Index Fund
Financial Highlights
ETF Shares
For a Share Outstanding | | Year Ended August 31, | |
Throughout Each Period | | 2019 | | 2018 | | 2017 | | 2016 | | 2015 | |
Net Asset Value, Beginning of Period | | $86.83 | | $93.54 | | $95.16 | | $83.80 | | $88.44 | |
Investment Operations | | | | | | | | | | | |
Net Investment Income | | .917 | 1 | 3.067 | 1 | 3.108 | 1 | 2.622 | | 2.789 | |
Net Realized and Unrealized Gain (Loss) on Investments | | .316 | | (6.297 | ) | (1.587 | ) | 12.811 | | (5.178 | ) |
Total from Investment Operations | | 1.233 | | (3.230 | ) | 1.521 | | 15.433 | | (2.389 | ) |
Distributions | | | | | | | | | | | |
Dividends from Net Investment Income | | (.823 | ) | (3.480 | ) | (3.141 | ) | (4.073 | ) | (2.251 | ) |
Distributions from Realized Capital Gains | | — | | — | | — | | — | | — | |
Total Distributions | | (.823 | ) | (3.480 | ) | (3.141 | ) | (4.073 | ) | (2.251 | ) |
Net Asset Value, End of Period | | $87.24 | | $86.83 | | $93.54 | | $95.16 | | $83.80 | |
| | | | | | | | | | | |
Total Return | | 1.47% | | -3.50% | | 1.62% | | 19.14% | | -2.72% | |
| | | | | | | | | | | |
Ratios/Supplemental Data | | | | | | | | | | | |
Net Assets, End of Period (Millions) | | $2,016 | | $1,015 | | $1,388 | | $1,483 | | $795 | |
Ratio of Total Expenses to Average Net Assets | | 0.10% | | 0.10% | | 0.10% | | 0.10% | | 0.10% | |
Ratio of Net Investment Income to Average Net Assets | | 1.09% | | 3.48% | | 3.26% | | 3.10% | | 3.20% | |
Portfolio Turnover Rate2 | | 33% | | 84% | | 18% | | 20% | | 18% | |
1 | Calculated based on average shares outstanding. |
| |
2 | Excludes the value of portfolio securities received or delivered as a result of in-kind purchases or redemptions of the fund’s capital shares, including ETF Creation Units. |
Admiral Shares
For a Share Outstanding | | Year Ended August 31, | |
Throughout Each Period | | 2019 | | 2018 | | 2017 | | 2016 | | 2015 | |
Net Asset Value, Beginning of Period | | $44.25 | | $47.67 | | $48.50 | | $42.71 | | $45.07 | |
Investment Operations | | | | | | | | | | | |
Net Investment Income | | .470 | 1 | 1.554 | 1 | 1.601 | 1 | 1.337 | | 1.419 | |
Net Realized and Unrealized Gain (Loss) on Investments | | .157 | | (3.199 | ) | (.829 | ) | 6.529 | | (2.637 | ) |
Total from Investment Operations | | .627 | | (1.645 | ) | .772 | | 7.866 | | (1.218 | ) |
Distributions | | | | | | | | | | | |
Dividends from Net Investment Income | | (.417 | ) | (1.775 | ) | (1.602 | ) | (2.076 | ) | (1.142 | ) |
Distributions from Realized Capital Gains | | — | | — | | — | | — | | — | |
Total Distributions | | (.417 | ) | (1.775 | ) | (1.602 | ) | (2.076 | ) | (1.142 | ) |
Net Asset Value, End of Period | | $44.46 | | $44.25 | | $47.67 | | $48.50 | | $42.71 | |
| | | | | | | | | | | |
Total Return2 | | 1.46% | | -3.48% | | 1.61% | | 19.14% | | -2.66% | |
| | | | | | | | | | | |
Ratios/Supplemental Data | | | | | | | | | | | |
Net Assets, End of Period (Millions) | | $50 | | $46 | | $50 | | $65 | | $24 | |
Ratio of Total Expenses to Average Net Assets | | 0.10% | | 0.10% | | 0.10% | | 0.10% | | 0.10% | |
Ratio of Net Investment Income to Average Net Assets | | 1.09% | | 3.48% | | 3.26% | | 3.10% | | 3.20% | |
Portfolio Turnover Rate3 | | 33% | | 84% | | 18% | | 20% | | 18% | |
1 | Calculated based on average shares outstanding. |
| |
2 | Total returns do not include account service fees that may have applied in the periods shown. Fund prospectuses provide information about any applicable account service fees. |
| |
3 | Excludes the value of portfolio securities received or delivered as a result of in-kind purchases or redemptions of the fund’s capital shares, including ETF Creation Units. |
See accompanying Notes, which are an integral part of the Financial Statements.
10
Communication Services Index Fund
Notes to Financial Statements
Vanguard Communication Services Index Fund is registered under the Investment Company Act of 1940 as an open-end investment company, or mutual fund. The fund offers two classes of shares: ETF Shares and Admiral Shares. Each of the share classes has different eligibility and minimum purchase requirements, and is designed for different types of investors. ETF Shares are listed for trading on NYSE Arca; they can be purchased and sold through a broker.
A. The following significant accounting policies conform to generally accepted accounting principles for U.S. investment companies. The fund consistently follows such policies in preparing its financial statements.
1. Security Valuation: Securities are valued as of the close of trading on the New York Stock Exchange (generally 4 p.m., Eastern time) on the valuation date. Equity securities are valued at the latest quoted sales prices or official closing prices taken from the primary market in which each security trades; such securities not traded on the valuation date are valued at the mean of the latest quoted bid and asked prices. Securities for which market quotations are not readily available, or whose values have been materially affected by events occurring before the fund’s pricing time but after the close of the securities’ primary markets, are valued by methods deemed by the board of trustees to represent fair value. Investments in Vanguard Market Liquidity Fund are valued at that fund’s net asset value.
2. Futures Contracts: The fund uses index futures contracts to a limited extent, with the objectives of maintaining full exposure to the stock market, maintaining liquidity, and minimizing transaction costs. The fund may purchase futures contracts to immediately invest incoming cash in the market, or sell futures in response to cash outflows, thereby simulating a fully invested position in the underlying index while maintaining a cash balance for liquidity. The primary risks associated with the use of futures contracts are imperfect correlation between changes in market values of stocks held by the fund and the prices of futures contracts, and the possibility of an illiquid market. Counterparty risk involving futures is mitigated because a regulated clearinghouse is the counterparty instead of the clearing broker. To further mitigate counterparty risk, the fund trades futures contracts on an exchange, monitors the financial strength of its clearing brokers and clearinghouse, and has entered into clearing agreements with its clearing brokers. The clearinghouse imposes initial margin requirements to secure the fund’s performance and requires daily settlement of variation margin representing changes in the market value of each contract. Any assets pledged as initial margin for open contracts are noted in the Statement of Net Assets.
Futures contracts are valued at their quoted daily settlement prices. The notional amounts of the contracts are not recorded in the Statement of Net Assets. Fluctuations in the value of the contracts are recorded in the Statement of Net Assets as an asset (liability) and in the Statement of Operations as unrealized appreciation (depreciation) until the contracts are closed, when they are recorded as realized futures gains (losses).
During the year ended August 31, 2019, the fund’s average investments in long and short futures contracts represented less than 1% and 0% of net assets, respectively, based on the average of the notional amounts at each quarter-end during the period. The fund had no open futures contracts at August 31, 2019.
3. Swap Contracts: The fund has entered into equity swap contracts to earn the total return on selected reference stocks in the fund’s target index. Under the terms of the swaps, the fund receives the total return on the referenced stock (i.e., receiving the increase or paying the decrease in value of the selected reference stock and receiving the equivalent of any dividends in respect of the selected referenced stock) over a specified period of time, applied to a notional amount that represents the value of a designated number of shares of the selected reference stock at the beginning of the equity swap contract. The fund also pays a floating rate that is based on short-term interest rates, applied to the notional amount. At the same time, the fund generally invests an amount approximating the notional amount of the swap in high-quality temporary cash investments.
The notional amounts of swap contracts are not recorded in the Statement of Net Assets. Swaps are valued daily based on market quotations received from independent pricing services or recognized dealers and the change in value is recorded in the Statement of Net Assets as an asset (liability) and in the Statement of Operations as unrealized appreciation (depreciation) until termination of the swap, at which time realized gain (loss) is recorded.
11
Communication Services Index Fund
A risk associated with all types of swaps is the possibility that a counterparty may default on its obligation to pay net amounts due to the fund. The fund’s maximum amount subject to counterparty risk is the unrealized appreciation on the swap contract. The fund mitigates its counterparty risk by entering into swaps only with a diverse group of prequalified counterparties, monitoring their financial strength, entering into master netting arrangements with its counterparties, and requiring its counterparties to transfer collateral as security for their performance. In the absence of a default, the collateral pledged or received by the fund cannot be repledged, resold, or rehypothecated. In the event of a counterparty’s default (including bankruptcy), the fund may terminate any swap contracts with that counterparty, determine the net amount owed by either party in accordance with its master netting arrangements, and sell or retain any collateral held up to the net amount owed to the fund under the master netting arrangements. The swap contracts contain provisions whereby a counterparty may terminate open contracts if the fund net assets decline below a certain level, triggering a payment by the fund if the fund is in a net liability position at the time of the termination. The payment amount would be reduced by any collateral the fund has pledged. Any securities pledged as collateral for open contracts are noted in the Statement of Net Assets. The value of collateral received or pledged is compared daily to the value of the swap contracts exposure with each counterparty, and any difference, if in excess of a specified minimum transfer amount, is adjusted and settled within two business days.
During the year ended August 31, 2019, the fund’s average amounts of investments in total return swaps represented less than 1% of net assets, based on the average of notional amounts at each quarter-end during the period.
4. Federal Income Taxes: The fund intends to continue to qualify as a regulated investment company and distribute all of its taxable income. Management has analyzed the fund’s tax positions taken for all open federal income tax years (August 31, 2016–2019), and has concluded that no provision for federal income tax is required in the fund’s financial statements.
5. Distributions: Distributions to shareholders are recorded on the ex-dividend date. Distributions are determined on a tax basis and may differ from net investment income and realized capital gains for financial reporting purposes.
6. Securities Lending: To earn additional income, the fund lends its securities to qualified institutional borrowers. Security loans are subject to termination by the fund at any time, and are required to be secured at all times by collateral in an amount at least equal to the market value of securities loaned. Daily market fluctuations could cause the value of loaned securities to be more or less than the value of the collateral received. When this occurs, the collateral is adjusted and settled before the opening of the market on the next business day. The fund further mitigates its counterparty risk by entering into securities lending transactions only with a diverse group of prequalified counterparties, monitoring their financial strength, and entering into master securities lending agreements with its counterparties. The master securities lending agreements provide that, in the event of a counterparty’s default (including bankruptcy), the fund may terminate any loans with that borrower, determine the net amount owed, and sell or retain the collateral up to the net amount owed to the fund; however, such actions may be subject to legal proceedings. While collateral mitigates counterparty risk, in the event of a default, the fund may experience delays and costs in recovering the securities loaned. The fund invests cash collateral received in Vanguard Market Liquidity Fund, and records a liability in the Statement of Net Assets for the return of the collateral, during the period the securities are on loan. Securities lending income represents fees charged to borrowers plus income earned on invested cash collateral, less expenses associated with the loan. During the term of the loan, the fund is entitled to all distributions made on or in respect of the loaned securities.
7. Credit Facility: The fund and certain other funds managed by The Vanguard Group (“Vanguard”) participate in a $4.3 billion committed credit facility provided by a syndicate of lenders pursuant to a credit agreement that may be renewed annually; each fund is individually liable for its borrowings, if any, under the credit facility. Borrowings may be utilized for temporary and emergency purposes, and are subject to the fund’s regulatory and contractual borrowing restrictions. The participating funds are charged administrative fees and an annual commitment fee of 0.10% of the undrawn amount of the facility; these fees are allocated to the funds based on a method approved by the fund’s board of trustees and included in Management and Administrative expenses on the fund’s Statement of Operations. Any borrowings under this facility bear interest at a rate based upon the higher of the one-month London Interbank Offered Rate, federal funds effective rate, or overnight bank funding rate plus an agreed-upon spread.
The fund had no borrowings outstanding at August 31, 2019, or at any time during the period then ended.
12
Communication Services Index Fund
8. Other: Dividend income is recorded on the ex-dividend date. Interest income includes income distributions received from Vanguard Market Liquidity Fund and is accrued daily. Security transactions are accounted for on the date securities are bought or sold. Costs used to determine realized gains (losses) on the sale of investment securities are those of the specific securities sold.
Each class of shares has equal rights as to assets and earnings, except that each class separately bears certain class-specific expenses related to maintenance of shareholder accounts (included in Management and Administrative expenses) and shareholder reporting. Marketing and distribution expenses are allocated to each class of shares based on a method approved by the board of trustees. Income, other non-class-specific expenses, and gains and losses on investments are allocated to each class of shares based on its relative net assets.
B. In accordance with the terms of a Funds’ Service Agreement (the “FSA”) between Vanguard and the fund, Vanguard furnishes to the fund investment advisory, corporate management, administrative, marketing, and distribution services at Vanguard’s cost of operations (as defined by the FSA). These costs of operations are allocated to the fund based on methods and guidelines approved by the board of trustees. Vanguard does not require reimbursement in the current period for certain costs of operations (such as deferred compensation/benefits and risk/insurance costs); the fund’s liability for these costs of operations is included in Payables to Vanguard on the Statement of Net Assets. All other costs of operations payable to Vanguard are generally settled twice a month.
Upon the request of Vanguard, the fund may invest up to 0.40% of its net assets as capital in Vanguard. At August 31, 2019, the fund had contributed to Vanguard capital in the amount of $98,000, representing less than 0.01% of the fund’s net assets and 0.04% of Vanguard’s capital received pursuant to the FSA. The fund’s trustees and officers are also directors and employees, respectively, of Vanguard.
C. Various inputs may be used to determine the value of the fund’s investments. These inputs are summarized in three broad levels for financial statement purposes. The inputs or methodologies used to value securities are not necessarily an indication of the risk associated with investing in those securities.
Level 1—Quoted prices in active markets for identical securities.
Level 2—Other significant observable inputs (including quoted prices for similar securities, interest rates, prepayment speeds, credit risk, etc.).
Level 3—Significant unobservable inputs (including the fund’s own assumptions used to determine the fair value of investments). Any investments valued with significant unobservable inputs are noted on the Statement of Net Assets.
The following table summarizes the market value of the fund’s investments and derivatives as of August 31, 2019, based on the inputs used to value them:
Investments | Level 1 ($000) | Level 2 ($000) | Level 3 ($000) |
Common Stocks | 2,062,453 | — | — |
Temporary Cash Investments | 24,583 | — | — |
Swap Contracts—Assets | — | 135 | — |
Total | 2,087,036 | 135 | — |
D. Permanent differences between book-basis and tax-basis components of net assets are reclassified among capital accounts in the financial statements to reflect their tax character. These reclassifications have no effect on net assets or net asset value per share. As of period end, permanent differences primarily attributable to the accounting for in-kind redemptions, the expiration of capital loss carry-forwards, and swap agreements were reclassified between the following accounts:
| Amount ($000) |
Paid-in Capital | 71,808 |
Total Distributable Earnings (Loss) | (71,808) |
13
Communication Services Index Fund
Temporary differences between book-basis and tax-basis components of total distributable earnings (loss) arise when certain items of income, gain, or loss are recognized in different periods for financial statement and tax purposes; these differences will reverse at some time in the future. The differences are primarily related to the tax deferral on wash sales and the realization of unrealized gains or losses on certain swap agreements. As of period end, the tax-basis components of total distributable earnings (loss) are detailed in the table as follows:
| Amount ($000) |
Undistributed Ordinary Income | 5,528 |
Undistributed Long-Term Gains | — |
Capital Loss Carryforwards (Non-expiring) | (350,254) |
Net Unrealized Gains (Losses) | 3,663 |
As of August 31, 2019, gross unrealized appreciation and depreciation for investments and derivatives based on cost for U.S. federal income tax purposes were as follows:
| Amount ($000) |
Tax Cost | 2,083,373 |
Gross Unrealized Appreciation | 121,114 |
Gross Unrealized Depreciation | (117,451) |
Net Unrealized Appreciation (Depreciation) | 3,663 |
E. During the year ended August 31, 2019, the fund purchased $2,369,423,000 of investment securities and sold $1,382,644,000 of investment securities, other than temporary cash investments. Purchases and sales include $1,808,725,000 and $847,199,000, respectively, in connection with in-kind purchases and redemptions of the fund’s capital shares.
F. Capital share transactions for each class of shares were:
| Year Ended August 31, |
| | 2019 | | | 2018 |
| Amount ($000) | Shares (000) | | Amount ($000) | Shares (000) |
ETF Shares | | | | | |
Issued | 1,833,068 | 21,800 | | 499,222 | 5,625 |
Issued in Lieu of Cash Distributions | — | — | | — | — |
Redeemed | (849,560) | (10,375) | | (774,263) | (8,775) |
Net Increase (Decrease)—ETF Shares | 983,508 | 11,425 | | (275,041) | (3,150) |
Admiral Shares | | | | | |
Issued | 27,900 | 653 | | 29,914 | 666 |
Issued in Lieu of Cash Distributions | 387 | 9 | | 1,591 | 35 |
Redeemed | (24,935) | (584) | | (32,164) | (711) |
Net Increase (Decrease)—Admiral Shares | 3,352 | 78 | | (659) | (10) |
G. Management has determined that no events or transactions occurred subsequent to August 31, 2019, that would require recognition or disclosure in these financial statements.
14
Consumer Discretionary Index Fund
Performance Summary
All of the returns in this report represent past performance, which is not a guarantee of future results that may be achieved by the fund. (Current performance may be lower or higher than the performance data cited. For performance data current to the most recent month-end, visit our website at vanguard.com/performance.) Note, too, that both investment returns and principal value can fluctuate widely, so an investor’s shares, when sold, could be worth more or less than their original cost. The returns shown do not reflect taxes that a shareholder would pay on fund distributions or on the sale of fund shares.
Cumulative Performance: August 31, 2009–August 31, 2019
Initial Investment of $10,000
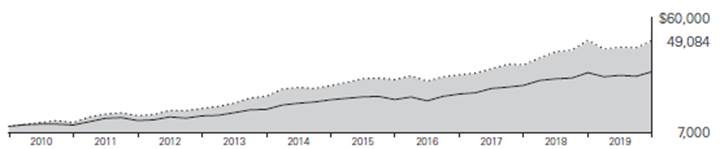
| | Average Annual Total Returns | Final Value of a $10,000 Investment |
| | Periods Ended August 31, 2019 |
| | One Year | Five Years | Ten Years |

| Consumer Discretionary Index Fund ETF Shares Net Asset Value | -0.14% | 11.41% | 17.24% | $49,084 |
| Consumer Discretionary Index Fund ETF Shares Market Price | -0.25 | 11.41 | 17.23 | 49,040 |

| Consumer Discretionary Spliced Index | -0.09 | 11.50 | 17.37 | 49,622 |

| MSCI US IMI/2500 | 1.32 | 9.63 | 13.41 | 35,213 |
Consumer Discretionary Spliced Index: MSCI US IMI/Consumer Discretionary through February 28, 2010; MSCI US IMI/Consumer Discretionary 25/50 through May 2, 2018; MSCI US IMI/Consumer Discretionary 25/50 Transition Index through December 2, 2018; MSCI US IMI/Consumer Discretionary 25/50 thereafter.
| | | | Final Value |
| | | | of a $100,000 |
| One Year | Five Years | Ten Years | Investment |
Consumer Discretionary Index Fund Admiral Shares | -0.14% | 11.42% | 17.25% | $490,888 |
Consumer Discretionary Spliced Index | -0.09 | 11.50 | 17.37 | 496,221 |
MSCI US IMI/2500 | 1.32 | 9.63 | 13.41 | 352,130 |
Cumulative Returns: ETF Shares, August 31, 2009–August 31, 2019
| One Year | Five Years | Ten Years |
Consumer Discretionary Index Fund ETF Shares Market Price | -0.25% | 71.61% | 390.40% |
Consumer Discretionary Index Fund ETF Shares Net Asset Value | -0.14 | 71.67 | 390.84 |
Consumer Discretionary Spliced Index | -0.09 | 72.34 | 396.22 |
For the ETF Shares, the market price is determined by the midpoint of the bid-offer spread as of the closing time of the New York Stock Exchange (generally 4 p.m., Eastern time). The net asset value is also determined as of the NYSE closing time. For more information about how the ETF Shares’ market prices have compared with their net asset value, visit vanguard.com, select your ETF, and then select the Price and Performance tab. The ETF premium/discount analysis there shows the percentages of days on which the ETF Shares’ market price was above or below the NAV.
See Financial Highlights for dividend and capital gains information.
15
Consumer Discretionary Index Fund
Sector Diversification
As of August 31, 2019
Apparel Retail | 4.9% |
Apparel, Accessories & Luxury Goods | 3.2 |
Auto Parts & Equipment | 2.4 |
Automobile Manufacturers | 3.6 |
Automotive Retail | 3.5 |
Casinos & Gaming | 2.3 |
Computer & Electronics Retail | 0.6 |
Consumer Electronics | 0.8 |
Department Stores | 0.6 |
Distributors | 1.1 |
Education Services | 1.1 |
Footwear | 4.0 |
General Merchandise Stores | 4.1 |
Home Furnishings | 0.6 |
Home Improvement Retail | 11.3 |
Homebuilding | 2.9 |
Homefurnishing Retail | 0.6 |
Hotels, Resorts & Cruise Lines | 4.6 |
Household Appliances | 0.5 |
Housewares & Specialties | 0.2 |
Internet & Direct Marketing Retail | 28.2 |
Leisure Facilities | 0.8 |
Leisure Products | 1.1 |
Motorcycle Manufacturers | 0.2 |
Restaurants | 13.8 |
Specialized Consumer Services | 1.1 |
Specialty Stores | 1.8 |
Tires & Rubber | 0.1 |
The table reflects the fund’s equity exposure, based on its investments in stocks and stock index futures. Any holdings in short-term reserves are excluded. Sector categories are based on the Global Industry Classification Standard (“GICS”), except for the “Other” category (if applicable), which includes securities that have not been provided a GICS classification as of the effective reporting period.
The Global Industry Classification Standard (“GICS”) was developed by and is the exclusive property and a service mark of MSCI Inc. (“MSCI”) and Standard and Poor’s, a division of McGraw-Hill Companies, Inc. (“S&P”), and is licensed for use by Vanguard. Neither MSCI, S&P nor any third party involved in making or compiling the GICS or any GICS classification makes any express or implied warranties or representations with respect to such standard or classification (or the results to be obtained by the use thereof), and all such parties hereby expressly disclaim all warranties of originality, accuracy, completeness, merchantability or fitness for a particular purpose with respect to any such standard or classification. Without limiting any of the foregoing, in no event shall MSCI, S&P, any of its affiliates or any third party involved in making or compiling the GICS or any GICS classification have any liability for any direct, indirect, special, punitive, consequential or any other damages (including lost profits) even if notified of the possibility of such damages.
16
Consumer Discretionary Index Fund
Financial Statements
Statement of Net Assets
As of August 31, 2019
The fund files its complete schedule of portfolio holdings with the Securities and Exchange Commission (SEC) for the first and third quarters of each fiscal year as an exhibit to its reports on Form N-PORT. The fund’s Form N-PORT reports are available on the SEC’s website at www.sec.gov.
| | | | Market |
| | | | Value· |
| | Shares | | ($000) |
Common Stocks (99.7%)1 | | | |
Auto Components (2.6%) | | | |
| Aptiv plc | 290,991 | | 24,202 |
| Gentex Corp. | 300,041 | | 7,981 |
| Lear Corp. | 69,516 | | 7,804 |
| BorgWarner Inc. | 234,626 | | 7,656 |
| Autoliv Inc. | 98,844 | | 6,761 |
* | Fox Factory Holding Corp. | 45,274 | | 3,261 |
| Goodyear Tire & Rubber Co. | 269,344 | | 3,089 |
| LCI Industries | 30,602 | | 2,593 |
* | Visteon Corp. | 35,737 | | 2,465 |
* | Dorman Products Inc. | 33,791 | | 2,402 |
| Adient plc | 111,446 | | 2,248 |
| Dana Inc. | 172,881 | | 2,201 |
*,^ | Veoneer Inc. | 132,712 | | 1,947 |
* | Gentherm Inc. | 44,983 | | 1,651 |
| Cooper Tire & Rubber Co. | 63,663 | | 1,495 |
| Delphi Technologies plc | 109,386 | | 1,447 |
* | Stoneridge Inc. | 40,593 | | 1,247 |
| Standard Motor Products Inc. | 27,544 | | 1,220 |
| Tower International Inc. | 35,593 | | 1,101 |
* | Garrett Motion Inc. | 95,913 | | 944 |
* | Cooper-Standard Holdings Inc. | 24,695 | | 925 |
* | American Axle & Manufacturing Holdings Inc. | 144,059 | | 913 |
* | Modine Manufacturing Co. | 74,906 | | 765 |
| Tenneco Inc. Class A | 76,946 | | 671 |
* | Motorcar Parts of America Inc. | 34,299 | | 498 |
| | | | 87,487 |
Automobiles (3.8%) | | | |
| General Motors Co. | 1,399,823 | | 51,920 |
| Ford Motor Co. | 4,281,588 | | 39,262 |
*,^ | Tesla Inc. | 112,249 | | 25,325 |
| Harley-Davidson Inc. | 185,461 | | 5,916 |
| Thor Industries Inc. | 64,483 | | 2,960 |
| Winnebago Industries Inc. | 40,794 | | 1,306 |
| | | | 126,689 |
Distributors (1.0%) | | | |
| Genuine Parts Co. | 163,467 | | 14,759 |
* | LKQ Corp. | 358,095 | | 9,407 |
| Pool Corp. | 45,730 | | 8,981 |
| Core-Mark Holding Co. Inc. | 57,912 | | 1,876 |
* | Funko Inc. Class A | 19,315 | | 463 |
| | | | 35,486 |
Diversified Consumer Services (2.3%) | | | |
* | Bright Horizons Family | | | |
| Solutions Inc. | 65,241 | | 10,768 |
| Service Corp. Internationa | 205,042 | | 9,493 |
* | ServiceMaster Global Holdings Inc. | 154,243 | | 8,798 |
* | Grand Canyon Education Inc. | 55,079 | | 6,918 |
| H&R Block Inc. | 235,877 | | 5,713 |
* | frontdoor Inc. | 100,857 | | 5,178 |
* | Chegg Inc. | 120,562 | | 4,779 |
| Strategic Education Inc. | 25,838 | | 4,373 |
| Graham Holdings Co. Class B | 5,145 | | 3,622 |
* | Adtalem Global Education Inc. | 70,168 | | 2,998 |
* | Sotheby’s | 46,679 | | 2,696 |
* | Laureate Education Inc. Class A | 121,520 | | 2,224 |
* | Weight Watchers International Inc. | 63,841 | | 1,915 |
* | Career Education Corp. | 92,745 | | 1,902 |
* | K12 Inc. | 49,527 | | 1,305 |
*,^ | OneSpaWorld Holdings Ltd. | 63,145 | | 991 |
* | Houghton Mifflin Harcourt Co. | 153,825 | | 915 |
* | Regis Corp. | 51,140 | | 827 |
| Carriage Services Inc. Class A | 34,582 | | 736 |
* | American Public Education Inc. | 26,970 | | 653 |
| | | | 76,804 |
Hotels, Restaurants & Leisure (21.4%) | | | |
| McDonald’s Corp. | 836,564 | | 182,346 |
| Starbucks Corp. | 1,334,067 | | 128,818 |
| Marriott International Inc. Class A | 315,431 | | 39,763 |
| Yum! Brands Inc. | 339,567 | | 39,655 |
| Hilton Worldwide Holdings Inc. | 309,871 | | 28,623 |
* | Chipotle Mexican Grill Inc. Class A | 28,996 | | 24,311 |
| Las Vegas Sands Corp. | 391,148 | | 21,697 |
| Carnival Corp. | 467,007 | | 20,586 |
| Royal Caribbean Cruises Ltd. | 195,766 | | 20,415 |
| Darden Restaurants Inc. | 138,417 | | 16,746 |
| MGM Resorts International | 565,474 | | 15,867 |
* | Norwegian Cruise Line Holdings Ltd. | 245,993 | | 12,484 |
| Wynn Resorts Ltd. | 109,217 | | 12,030 |
| Aramark | 279,476 | | 11,419 |
| Vail Resorts Inc. | 45,674 | | 10,792 |
| Domino’s Pizza Inc. | 44,368 | | 10,064 |
| Dunkin’ Brands Group Inc. | 94,523 | | 7,792 |
* | Caesars Entertainment Corp. | 647,426 | | 7,452 |
* | Planet Fitness Inc. Class A | 99,143 | | 7,001 |
| Wyndham Hotels & Resorts Inc. | 114,005 | | 5,858 |
| Churchill Downs Inc. | 43,172 | | 5,321 |
| Six Flags Entertainment Corp. | 87,202 | | 5,160 |
| Wyndham Destinations Inc. | 113,609 | | 5,037 |
| Wendy’s Co. | 222,157 | | 4,887 |
| Marriott Vacations Worldwide Corp. | 46,454 | | 4,580 |
| Texas Roadhouse Inc. Class A | 79,204 | | 4,076 |
| Cracker Barrel Old Country Store Inc. | 23,829 | | 3,941 |
| Choice Hotels International Inc. | 43,317 | | 3,941 |
* | Hilton Grand Vacations Inc. | 114,757 | | 3,875 |
| Hyatt Hotels Corp. Class A | 50,491 | | 3,643 |
| Wingstop Inc. | 35,774 | | 3,584 |
* | Shake Shack Inc. Class A | 34,915 | | 3,462 |
| Extended Stay America Inc. | 221,652 | | 3,114 |
*,^ | Eldorado Resorts Inc. | 76,950 | | 2,963 |
| Jack in the Box Inc. | 31,872 | | 2,719 |
* | Penn National Gaming Inc. | 137,074 | | 2,628 |
| Boyd Gaming Corp. | 101,944 | | 2,451 |
* | SeaWorld Entertainment Inc. | 72,052 | | 2,090 |
| Dave & Buster’s Entertainment Inc. | 47,916 | | 2,063 |
| Cheesecake Factory Inc. | 53,357 | | 2,027 |
* | Denny’s Corp. | 84,397 | | 1,991 |
| Bloomin’ Brands Inc. | 107,925 | | 1,947 |
| Brinker International Inc. | 48,904 | | 1,858 |
| Red Rock Resorts Inc. Class A | 87,149 | | 1,817 |
| Papa John’s International Inc. | 31,559 | | 1,570 |
| Dine Brands Global Inc. | 21,580 | | 1,522 |
| International Speedway Corp. Class A | 33,329 | | 1,500 |
* | Scientific Games Corp. | 72,650 | | 1,343 |
| BJ’s Restaurants Inc. | 29,448 | | 1,073 |
* | Everi Holdings Inc. | 99,819 | | 892 |
* | Monarch Casino & Resort Inc. | 19,951 | | 885 |
* | Lindblad Expeditions Holdings Inc. | 45,318 | | 846 |
| Ruth’s Hospitality Group Inc. | 43,315 | | 843 |
* | Playa Hotels & Resorts NV | 99,462 | | 805 |
* | Chuy’s Holdings Inc. | 31,648 | | 803 |
* | Red Robin Gourmet Burgers Inc. | 23,648 | | 792 |
| Twin River Worldwide Holdings Inc. | 34,625 | | 784 |
* | Del Taco Restaurants Inc. | 62,812 | | 702 |
* | Golden Entertainment Inc. | 39,638 | | 562 |
| Speedway Motorsports Inc. | 27,556 | | 544 |
* | Carrols Restaurant Group Inc. | 70,380 | | 514 |
* | El Pollo Loco Holdings Inc. | 49,815 | | 509 |
| BBX Capital Corp. Class A | 120,314 | | 499 |
17
Consumer Discretionary Index Fund
| | | | Market |
| | | | Value· |
| | Shares | | ($000) |
* | Habit Restaurants Inc. Class A | 49,945 | | 438 |
* | Fiesta Restaurant Group Inc. | 49,494 | | 428 |
* | PlayAGS Inc. | 43,451 | | 423 |
* | Biglari Holdings Inc. Class B | 3,725 | | 327 |
* | Biglari Holdings Inc. | 275 | | 121 |
| | | | 721,619 |
Household Durables (5.1%) | | | |
| DR Horton Inc. | 397,754 | | 19,677 |
| Lennar Corp. Class A | 324,122 | | 16,530 |
* | Roku Inc. | 92,119 | | 13,943 |
* | NVR Inc. | 3,856 | | 13,878 |
| Garmin Ltd. | 147,751 | | 12,052 |
| PulteGroup Inc. | 301,621 | | 10,195 |
| Whirlpool Corp. | 71,953 | | 10,008 |
* | Mohawk Industries Inc. | 71,198 | | 8,465 |
| Newell Brands Inc. | 482,474 | | 8,009 |
| Toll Brothers Inc. | 160,559 | | 5,811 |
| Leggett & Platt Inc. | 149,773 | | 5,570 |
* | Helen of Troy Ltd. | 31,367 | | 4,815 |
* | Tempur Sealy International Inc. | 55,278 | | 4,263 |
* | TopBuild Corp. | 42,629 | | 3,948 |
* | Taylor Morrison Home Corp. Class A | 141,975 | | 3,388 |
* | Meritage Homes Corp. | 47,205 | | 3,084 |
| KB Home | 98,325 | | 2,762 |
* | TRI Pointe Group Inc. | 175,150 | | 2,452 |
| MDC Holdings Inc. | 62,531 | | 2,418 |
* | Cavco Industries Inc. | 11,694 | | 2,146 |
* | LGI Homes Inc. | 25,252 | | 2,058 |
*,^ | iRobot Corp. | 33,095 | | 2,046 |
* | Skyline Champion Corp. | 70,133 | | 1,964 |
| La-Z-Boy Inc. | 59,502 | | 1,896 |
* | Installed Building Products Inc. | 29,253 | | 1,665 |
* | M/I Homes Inc. | 40,436 | | 1,461 |
* | Century Communities Inc. | 37,426 | | 1,055 |
* | Universal Electronics Inc. | 22,783 | | 1,029 |
* | William Lyon Homes Class A | 53,294 | | 942 |
| Tupperware Brands Corp. | 64,426 | | 838 |
* | Beazer Homes USA Inc. | 59,469 | | 745 |
| Ethan Allen Interiors Inc. | 41,766 | | 718 |
* | Sonos Inc. | 46,071 | | 669 |
*,^ | GoPro Inc. Class A | 169,557 | | 656 |
* | Green Brick Partners Inc. | 58,468 | | 537 |
| Hooker Furniture Corp. | 22,974 | | 410 |
| Hamilton Beach Brands Holding Co. Class A | 21,892 | | 310 |
* | Lovesac Co. | 14,311 | | 246 |
| | | | 172,659 |
Internet & Direct Marketing Retail (28.1%) | | | |
* | Amazon.com Inc. | 410,322 | | 728,851 |
* | Booking Holdings Inc. | 47,789 | | 93,973 |
| eBay Inc. | 924,062 | | 37,231 |
* | MercadoLibre Inc. | 47,631 | | 28,321 |
| Expedia Group Inc. | 158,804 | | 20,660 |
* | Wayfair Inc. | 66,930 | | 7,546 |
* | Etsy Inc. | 134,298 | | 7,090 |
* | GrubHub Inc. | 103,762 | | 6,157 |
* | Qurate Retail Group Inc. QVC Group Class A | 477,123 | | 5,110 |
* | Shutterfly Inc. | 42,570 | | 2,166 |
* | Stamps.com Inc. | 24,924 | | 1,604 |
* | Groupon Inc. Class A | 579,960 | | 1,438 |
*,^ | Stitch Fix Inc. Class A | 57,041 | | 1,087 |
* | Shutterstock Inc. | 27,368 | | 961 |
* | Quotient Technology Inc. | 118,527 | | 870 |
*,^ | Overstock.com Inc. | 54,369 | | 855 |
* | 1-800-Flowers.com Inc. Class A | 42,259 | | 622 |
^ | PetMed Express Inc. | 36,263 | | 573 |
* | Duluth Holdings Inc. | 36,759 | | 338 |
* | Lands’ End Inc. | 29,850 | | 231 |
*,^ | Waitr Holdings Inc. | 86,374 | | 150 |
* | Chewy Inc. | 1,525 | | 50 |
| | | | 945,884 |
Leisure Products (1.1%) | | | |
| Hasbro Inc. | 134,848 | | 14,897 |
| Polaris Inc. | 67,207 | | 5,512 |
| Brunswick Corp. | 100,472 | | 4,682 |
*,^ | Mattel Inc. | 400,076 | | 3,921 |
| Callaway Golf Co. | 120,330 | | 2,137 |
| Acushnet Holdings Corp. | 48,332 | | 1,255 |
| Sturm Ruger & Co. Inc. | 24,391 | | 1,000 |
* | Malibu Boats Inc. Class A | 29,240 | | 814 |
*,^ | YETI Holdings Inc. | 27,723 | | 783 |
| Johnson Outdoors Inc. Class A | 10,318 | | 578 |
* | Vista Outdoor Inc. | 95,574 | | 534 |
* | American Outdoor Brands Corp. | 88,469 | | 532 |
* | MasterCraft Boat Holdings Inc. | 32,209 | | 488 |
| | | | 37,133 |
Multiline Retail (4.6%) | | | |
| Target Corp. | 569,351 | | 60,943 |
| Dollar General Corp. | 287,968 | | 44,949 |
* | Dollar Tree Inc. | 263,349 | | 26,738 |
| Kohl’s Corp. | 186,739 | | 8,825 |
| Macy’s Inc. | 348,097 | | 5,138 |
| Nordstrom Inc. | 136,174 | | 3,945 |
* | Ollie’s Bargain Outlet Holdings Inc. | 64,348 | | 3,568 |
| Big Lots Inc. | 51,777 | | 1,178 |
^ | Dillard’s Inc. Class A | 18,070 | | 1,058 |
*,^ | JC Penney Co. Inc. | 561,357 | | 418 |
| | | | 156,760 |
Other (0.0%)2 | | | |
*,§ | Media General Inc. CVR | 69,182 | | 3 |
| | | | |
Specialty Retail (22.5%) | | | |
| Home Depot Inc. | 1,208,954 | | 275,533 |
| Lowe’s Cos. Inc. | 878,243 | | 98,539 |
| TJX Cos. Inc. | 1,342,118 | | 73,776 |
| Ross Stores Inc. | 409,204 | | 43,380 |
* | O’Reilly Automotive Inc. | 87,027 | | 33,397 |
* | AutoZone Inc. | 27,567 | | 30,370 |
| Best Buy Co. Inc. | 273,455 | | 17,405 |
* | CarMax Inc. | 189,950 | | 15,819 |
* | Burlington Stores Inc. | 75,584 | | 15,305 |
* | Ulta Beauty Inc. | 62,918 | | 14,957 |
| Tractor Supply Co. | 136,487 | | 13,905 |
| Advance Auto Parts Inc. | 81,474 | | 11,239 |
| Tiffany & Co. | 122,889 | | 10,430 |
* | Five Below Inc. | 62,991 | | 7,740 |
| Williams-Sonoma Inc. | 92,893 | | 6,112 |
| Aaron’s Inc. | 80,536 | | 5,163 |
| Foot Locker Inc. | 130,382 | | 4,719 |
*,^ | Carvana Co. Class A | 55,162 | | 4,477 |
| L Brands Inc. | 267,191 | | 4,411 |
| Gap Inc. | 261,582 | | 4,130 |
* | Floor & Decor Holdings Inc. Class A | 80,665 | | 3,970 |
| Lithia Motors Inc. Class A | 27,529 | | 3,608 |
| American Eagle Outfitters Inc. | 197,615 | | 3,324 |
* | Murphy USA Inc. | 36,973 | | 3,305 |
* | RH | 22,892 | | 3,279 |
* | AutoNation Inc. | 66,683 | | 3,165 |
| Monro Inc. | 39,603 | | 3,078 |
| Dick’s Sporting Goods Inc. | 88,300 | | 3,006 |
* | National Vision Holdings Inc. | 95,498 | | 2,708 |
* | Asbury Automotive Group Inc. | 25,256 | | 2,382 |
* | Urban Outfitters Inc. | 91,419 | | 2,140 |
| Penske Automotive Group Inc. | 48,076 | | 2,057 |
* | Sally Beauty Holdings Inc. | 147,564 | | 1,805 |
* | Sleep Number Corp. | 42,847 | | 1,793 |
| Group 1 Automotive Inc. | 23,964 | | 1,791 |
| Children’s Place Inc. | 20,469 | | 1,786 |
^ | Bed Bath & Beyond Inc. | 167,213 | | 1,617 |
* | Rent-A-Center Inc. | 60,606 | | 1,547 |
| Guess? Inc. | 82,253 | | 1,486 |
| Designer Brands Inc. Class A | 87,869 | | 1,449 |
| Abercrombie & Fitch Co. | 82,010 | | 1,199 |
| Sonic Automotive Inc. Class A | 43,127 | | 1,161 |
| Caleres Inc. | 57,525 | | 1,159 |
* | Genesco Inc. | 28,468 | | 1,016 |
| Office Depot Inc. | 708,991 | | 922 |
| Buckle Inc. | 46,790 | | 917 |
* | Zumiez Inc. | 33,655 | | 874 |
* | America’s Car-Mart Inc. | 10,015 | | 859 |
| Signet Jewelers Ltd. | 69,358 | | 849 |
* | Michaels Cos. Inc. | 134,551 | | 763 |
| Cato Corp. Class A | 44,425 | | 761 |
| Winmark Corp. | 4,389 | | 713 |
* | Conn’s Inc. | 33,482 | | 675 |
| Haverty Furniture Cos. Inc. | 34,788 | | 666 |
| Shoe Carnival Inc. | 21,362 | | 657 |
| Chico’s FAS Inc. | 206,824 | | 645 |
* | MarineMax Inc. | 44,564 | | 644 |
* | Hibbett Sports Inc. | 34,389 | | 569 |
*,^ | Lumber Liquidators Holdings Inc. | 54,655 | | 514 |
^ | GameStop Corp. Class A | 124,333 | | 494 |
| Tailored Brands Inc. | 90,987 | | 493 |
*,^ | Party City Holdco Inc. | 99,257 | | 467 |
| Camping World Holdings Inc. Class A | 58,634 | | 446 |
*,^ | At Home Group Inc. | 63,485 | | 428 |
* | Express Inc. | 153,295 | | 325 |
| Tile Shop Holdings Inc. | 100,307 | | 270 |
*,^ | Ascena Retail Group Inc. | 392,216 | | 98 |
| | | | 758,687 |
Textiles, Apparel & Luxury Goods (7.2%) | | | |
| NIKE Inc. Class B | 1,378,909 | | 116,518 |
| VF Corp. | 372,534 | | 30,529 |
* | Lululemon Athletica Inc. | 124,070 | | 22,912 |
| Tapestry Inc. | 326,345 | | 6,739 |
| PVH Corp. | 86,300 | | 6,542 |
| Hanesbrands Inc. | 409,923 | | 5,600 |
| Ralph Lauren Corp. Class A | 61,890 | | 5,467 |
* | Deckers Outdoor Corp. | 33,579 | | 4,951 |
18
Consumer Discretionary Index Fund
| | | | Market |
| | | | Value· |
| | Shares | | ($000) |
* | Skechers U.S.A. Inc. Class A | 155,855 | | 4,934 |
| Carter’s Inc. | 52,975 | | 4,846 |
* | Capri Holdings Ltd. | 170,871 | | 4,508 |
* | Under Armour Inc. Class C | 233,701 | | 3,954 |
* | Under Armour Inc. Class A | 210,506 | | 3,918 |
| Columbia Sportswear Co. | 36,687 | | 3,441 |
| Steven Madden Ltd. | 99,658 | | 3,311 |
| Wolverine World Wide Inc. | 111,447 | | 2,892 |
* | Crocs Inc. | 83,806 | | 1,869 |
* | Kontoor Brands Inc. | 53,221 | | 1,822 |
| Oxford Industries Inc. | 21,969 | | 1,533 |
* | G-III Apparel Group Ltd. | 54,083 | | 1,109 |
* | Levi Strauss & Co. Class A | 58,155 | | 983 |
*,^ | Fossil Group Inc. | 69,453 | | 889 |
* | Unifi Inc. | 31,251 | | 601 |
| Movado Group Inc. | 25,795 | | 555 |
* | Vera Bradley Inc. | 48,931 | | 518 |
| Culp Inc. | 25,941 | | 364 |
| | | | 241,305 |
Total Common Stocks
(Cost $2,891,172) | | | 3,360,516 |
Temporary Cash Investment (1.2%)1 | | | |
Money Market Fund (1.2%) | | | |
3,4 | Vanguard Market Liquidity Fund, 2.249% (Cost $39,999) | 399,972 | | 40,001 |
Total Investments (100.9%)
(Cost $2,931,171) | | | 3,400,517 |
| Amount |
| ($000) |
Other Assets and Liabilities (-0.9%) | |
Other Assets | |
Investment in Vanguard | 165 |
Receivables for Accrued Income | 4,427 |
Receivables for Capital Shares Issued | 229 |
Unrealized Appreciation—OTC Swap Contracts | 295 |
Total Other Assets | 5,116 |
Liabilities | |
Payables for Investment Securities Purchased | (11) |
Collateral for Securities on Loan | (35,172) |
Payables for Capital Shares Redeemed | (400) |
Payables to Vanguard | (543) |
Other Liabilities | (44) |
Total Liabilities | (36,170) |
Net Assets (100%) | 3,369,463 |
At August 31, 2019, net assets consisted of:
| Amount |
| ($000) |
Paid-in Capital | 2,975,395 |
Total Distributable Earnings (Loss) | 394,068 |
Net Assets | 3,369,463 |
| |
ETF Shares—Net Assets | |
Applicable to 17,078,664 outstanding $.001 par value shares of beneficial interest (unlimited authorization) | 3,048,742 |
Net Asset Value Per Share—ETF Shares | $178.51 |
Admiral Shares—Net Assets | |
Applicable to 3,471,010 outstanding $.001 par value shares of beneficial interest (unlimited authorization) | 320,721 |
Net Asset Value Per Share—Admiral Shares | $92.40 |
· See Note A in Notes to Financial Statements.
* Non-income-producing security.
^ Includes partial security positions on loan to broker-dealers. The total value of securities on loan is $34,003,000.
§ Security value determined using significant unobservable inputs.
1 The fund invests a portion of its cash reserves in equity markets through the use of swap contracts. After giving effect to swap investments, the fund’s effective common stock and temporary cash investment positions represent 99.9% and 1.0%, respectively, of net assets.
2 “Other” represents securities that are not classified by the fund’s benchmark index.
3 Affiliated money market fund available only to Vanguard funds and certain trusts and accounts managed by Vanguard. Rate shown is the 7-day yield.
4 Includes $35,172,000 of collateral received for securities on loan.
CVR—Contingent Value Rights.
OTC—Over-the-Counter.
Derivative Financial Instruments Outstanding as of Period End |
Over-the-Counter Total Return Swaps | | | | | |
| | | | Floating | | |
| | | | Interest Rate | Value and | Value and |
| | | Notional | Received | Unrealized | Unrealized |
| Termination | | Amount | (Paid)1 | Appreciation | (Depreciation) |
Reference Entity | Date | Counterparty | ($000) | (%) | ($000) | ($000) |
Tesla Inc. | 2/4/20 | GSI | 6,469 | (2.182) | 295 | — |
1 Payment received/paid monthly.
GSI—Goldman Sachs International.
See accompanying Notes, which are an integral part of the Financial Statements.
19
Consumer Discretionary Index Fund
Statement of Operations
| Year Ended August 31, 2019 |
| ($000) |
Investment Income | |
Income | |
Dividends | 40,911 |
Interest1 | 84 |
Securities Lending—Net | 425 |
Total Income | 41,420 |
Expenses | |
The Vanguard Group—Note B | |
Investment Advisory Services | 483 |
Management and Administrative—ETF Shares | 2,131 |
Management and Administrative—Admiral Shares | 237 |
Marketing and Distribution—ETF Shares | 132 |
Marketing and Distribution—Admiral Shares | 19 |
Custodian Fees | — |
Auditing Fees | 33 |
Shareholders’ Reports—ETF Shares | 146 |
Shareholders’ Reports—Admiral Shares | 6 |
Trustees’ Fees and Expenses | 2 |
Total Expenses | 3,189 |
Net Investment Income | 38,231 |
Realized Net Gain (Loss) | |
Investment Securities Sold1,2 | 200,354 |
Futures Contracts | (463) |
Swap Contracts | (1,847) |
Realized Net Gain (Loss) | 198,044 |
Change in Unrealized Appreciation | |
(Depreciation) | |
Investment Securities1 | (298,055) |
Swap Contracts | 295 |
Change in Unrealized Appreciation (Depreciation) | (297,760) |
Net Increase (Decrease) in Net Assets Resulting from Operations | (61,485) |
1 Interest income, realized net gain (loss), and change in unrealized appreciation (depreciation) from an affiliated company of the fund were $80,000, ($4,000), and ($1,000), respectively. Purchases and sales are for temporary cash investment purposes.
2 Includes $256,223,000 of net gain (loss) resulting from in-kind redemptions; such gain (loss) is not taxable to the fund.
Statement of Changes in Net Assets
| Year Ended August 31, |
| 2019 ($000) | 2018 ($000) |
Increase (Decrease) in Net Assets | | |
Operations | | |
Net Investment Income | 38,231 | 36,568 |
Realized Net Gain (Loss) | 198,044 | 177,750 |
Change in Unrealized Appreciation (Depreciation) | (297,760) | 506,647 |
Net Increase (Decrease) in Net Assets Resulting from Operations | (61,485) | 720,965 |
Distributions | | |
Net Investment Income | | |
ETF Shares | (34,304) | (31,797) |
Admiral Shares | (3,668) | (3,079) |
Realized Capital Gain | | |
ETF Shares | — | — |
Admiral Shares | — | — |
Total Distributions | (37,972) | (34,876) |
Capital Share Transactions | | |
ETF Shares | (55,912) | 376,174 |
Admiral Shares | (1,729) | 62,722 |
Net Increase (Decrease) from Capital Share Transactions | (57,641) | 438,896 |
Total Increase (Decrease) | (157,098) | 1,124,985 |
Net Assets | | |
Beginning of Period | 3,526,561 | 2,401,576 |
End of Period | 3,369,463 | 3,526,561 |
See accompanying Notes, which are an integral part of the Financial Statements.
20
Consumer Discretionary Index Fund
Financial Highlights
ETF Shares
For a Share Outstanding Throughout Each Period | Year Ended August 31, |
2019 | 2018 | 2017 | 2016 | 2015 |
Net Asset Value, Beginning of Period | $180.85 | $141.74 | $126.45 | $120.80 | $111.79 |
Investment Operations | | | | | |
Net Investment Income | 2.0521 | 2.0661 | 2.0681 | 1.875 | 1.542 |
Net Realized and Unrealized Gain (Loss) on Investments | (2.391) | 39.031 | 15.248 | 6.259 | 8.900 |
Total from Investment Operations | (.339) | 41.097 | 17.316 | 8.134 | 10.442 |
Distributions | | | | | |
Dividends from Net Investment Income | (2.001) | (1.987) | (2.026) | (2.484) | (1.432) |
Distributions from Realized Capital Gains | — | — | — | — | — |
Total Distributions | (2.001) | (1.987) | (2.026) | (2.484) | (1.432) |
Net Asset Value, End of Period | $178.51 | $180.85 | $141.74 | $126.45 | $120.80 |
| | | | | |
Total Return | -0.14% | 29.22% | 13.81% | 6.84% | 9.41% |
| | | | | |
Ratios/Supplemental Data | | | | | |
Net Assets, End of Period (Millions) | $3,049 | $3,199 | $2,198 | $1,926 | $1,842 |
Ratio of Total Expenses to Average Net Assets | 0.10% | 0.10% | 0.10% | 0.10% | 0.10% |
Ratio of Net Investment Income to Average Net Assets | 1.20% | 1.28% | 1.53% | 1.54% | 1.31% |
Portfolio Turnover Rate2 | 9% | 28% | 6% | 7% | 6% |
1 Calculated based on average shares outstanding.
2 Excludes the value of portfolio securities received or delivered as a result of in-kind purchases or redemptions of the fund’s capital shares, including ETF Creation Units.
Admiral Shares
For a Share Outstanding Throughout Each Period | Year Ended August 31, |
2019 | 2018 | 2017 | 2016 | 2015 |
Net Asset Value, Beginning of Period | $93.61 | $73.36 | $65.45 | $62.53 | $57.87 |
Investment Operations | | | | | |
Net Investment Income | 1.0581 | 1.0731 | 1.0711 | .971 | .805 |
Net Realized and Unrealized Gain (Loss) on Investments | (1.232) | 20.205 | 7.890 | 3.239 | 4.595 |
Total from Investment Operations | (.174) | 21.278 | 8.961 | 4.210 | 5.400 |
Distributions | | | | | |
Dividends from Net Investment Income | (1.036) | (1.028) | (1.051) | (1.290) | (.740) |
Distributions from Realized Capital Gains | — | — | — | — | — |
Total Distributions | (1.036) | (1.028) | (1.051) | (1.290) | (.740) |
Net Asset Value, End of Period | $92.40 | $93.61 | $73.36 | $65.45 | $62.53 |
| | | | | |
Total Return2 | -0.14% | 29.24% | 13.81% | 6.83% | 9.43% |
| | | | | |
Ratios/Supplemental Data | | | | | |
Net Assets, End of Period (Millions) | $321 | $328 | $204 | $169 | $139 |
Ratio of Total Expenses to Average Net Assets | 0.10% | 0.10% | 0.10% | 0.10% | 0.09% |
Ratio of Net Investment Income to Average Net Assets | 1.20% | 1.28% | 1.53% | 1.54% | 1.32% |
Portfolio Turnover Rate3 | 9% | 28% | 6% | 7% | 6% |
1 Calculated based on average shares outstanding.
2 Total returns do not include account service fees that may have applied in the periods shown. Fund prospectuses provide information about any applicable account service fees.
3 Excludes the value of portfolio securities received or delivered as a result of in-kind purchases or redemptions of the fund’s capital shares, including ETF Creation Units.
See accompanying Notes, which are an integral part of the Financial Statements.
21
Consumer Discretionary Index Fund
Notes to Financial Statements
Vanguard Consumer Discretionary Index Fund is registered under the Investment Company Act of 1940 as an open-end investment company, or mutual fund. The fund offers two classes of shares: ETF Shares and Admiral Shares. Each of the share classes has different eligibility and minimum purchase requirements, and is designed for different types of investors. ETF Shares are listed for trading on NYSE Arca; they can be purchased and sold through a broker.
A. The following significant accounting policies conform to generally accepted accounting principles for U.S. investment companies. The fund consistently follows such policies in preparing its financial statements.
1. Security Valuation: Securities are valued as of the close of trading on the New York Stock Exchange (generally 4 p.m., Eastern time) on the valuation date. Equity securities are valued at the latest quoted sales prices or official closing prices taken from the primary market in which each security trades; such securities not traded on the valuation date are valued at the mean of the latest quoted bid and asked prices. Securities for which market quotations are not readily available, or whose values have been materially affected by events occurring before the fund’s pricing time but after the close of the securities’ primary markets, are valued by methods deemed by the board of trustees to represent fair value. Investments in Vanguard Market Liquidity Fund are valued at that fund’s net asset value. Temporary cash investments are valued using the latest bid prices or using valuations based on a matrix system (which considers such factors as security prices, yields, maturities, and ratings), both as furnished by independent pricing services.
2. Futures Contracts: The fund uses index futures contracts to a limited extent, with the objectives of maintaining full exposure to the stock market, maintaining liquidity, and minimizing transaction costs. The fund may purchase futures contracts to immediately invest incoming cash in the market, or sell futures in response to cash outflows, thereby simulating a fully invested position in the underlying index while maintaining a cash balance for liquidity. The primary risks associated with the use of futures contracts are imperfect correlation between changes in market values of stocks held by the fund and the prices of futures contracts, and the possibility of an illiquid market. Counterparty risk involving futures is mitigated because a regulated clearinghouse is the counterparty instead of the clearing broker. To further mitigate counterparty risk, the fund trades futures contracts on an exchange, monitors the financial strength of its clearing brokers and clearinghouse, and has entered into clearing agreements with its clearing brokers. The clearinghouse imposes initial margin requirements to secure the fund’s performance and requires daily settlement of variation margin representing changes in the market value of each contract. Any assets pledged as initial margin for open contracts are noted in the Statement of Net Assets.
Futures contracts are valued at their quoted daily settlement prices. The notional amounts of the contracts are not recorded in the Statement of Net Assets. Fluctuations in the value of the contracts are recorded in the Statement of Net Assets as an asset (liability) and in the Statement of Operations as unrealized appreciation (depreciation) until the contracts are closed, when they are recorded as realized futures gains (losses).
During the year ended August 31, 2019, the fund’s average investments in long and short futures contracts represented less than 1% and 0% of net assets, respectively, based on the average of the notional amounts at each quarter-end during the period. The fund had no open futures contracts at August 31, 2019.
3. Swap Contracts: The fund has entered into equity swap contracts to earn the total return on selected reference stocks in the fund’s target index. Under the terms of the swaps, the fund receives the total return on the referenced stock (i.e., receiving the increase or paying the decrease in value of the selected reference stock and receiving the equivalent of any dividends in respect of the selected referenced stock) over a specified period of time, applied to a notional amount that represents the value of a designated number of shares of the selected reference stock at the beginning of the equity swap contract. The fund also pays a floating rate that is based on short-term interest rates, applied to the notional amount. At the same time, the fund generally invests an amount approximating the notional amount of the swap in high-quality temporary cash investments.
The notional amounts of swap contracts are not recorded in the Statement of Net Assets. Swaps are valued daily based on market quotations received from independent pricing services or recognized dealers and the change in value is recorded in the Statement of Net Assets as an asset (liability) and in the Statement of Operations as unrealized appreciation (depreciation) until termination of the swap, at which time realized gain (loss) is recorded.
22
Consumer Discretionary Index Fund
A risk associated with all types of swaps is the possibility that a counterparty may default on its obligation to pay net amounts due to the fund. The fund’s maximum amount subject to counterparty risk is the unrealized appreciation on the swap contract. The fund mitigates its counterparty risk by entering into swaps only with a diverse group of prequalified counterparties, monitoring their financial strength, entering into master netting arrangements with its counterparties, and requiring its counterparties to transfer collateral as security for their performance. In the absence of a default, the collateral pledged or received by the fund cannot be repledged, resold, or rehypothecated. In the event of a counterparty’s default (including bankruptcy), the fund may terminate any swap contracts with that counterparty, determine the net amount owed by either party in accordance with its master netting arrangements, and sell or retain any collateral held up to the net amount owed to the fund under the master netting arrangements. The swap contracts contain provisions whereby a counterparty may terminate open contracts if the fund net assets decline below a certain level, triggering a payment by the fund if the fund is in a net liability position at the time of the termination. The payment amount would be reduced by any collateral the fund has pledged. Any securities pledged as collateral for open contracts are noted in the Statement of Net Assets. The value of collateral received or pledged is compared daily to the value of the swap contracts exposure with each counterparty, and any difference, if in excess of a specified minimum transfer amount, is adjusted and settled within two business days.
During the year ended August 31, 2019, the fund’s average amounts of investments in total return swaps represented less than 1% of net assets, based on the average of notional amounts at each quarter-end during the period.
4. Federal Income Taxes: The fund intends to continue to qualify as a regulated investment company and distribute all of its taxable income. Management has analyzed the fund’s tax positions taken for all open federal income tax years (August 31, 2016–2019), and has concluded that no provision for federal income tax is required in the fund’s financial statements.
5. Distributions: Distributions to shareholders are recorded on the ex-dividend date. Distributions are determined on a tax basis and may differ from net investment income and realized capital gains for financial reporting purposes.
6. Securities Lending: To earn additional income, the fund lends its securities to qualified institutional borrowers. Security loans are subject to termination by the fund at any time, and are required to be secured at all times by collateral in an amount at least equal to the market value of securities loaned. Daily market fluctuations could cause the value of loaned securities to be more or less than the value of the collateral received. When this occurs, the collateral is adjusted and settled before the opening of the market on the next business day. The fund further mitigates its counterparty risk by entering into securities lending transactions only with a diverse group of prequalified counterparties, monitoring their financial strength, and entering into master securities lending agreements with its counterparties. The master securities lending agreements provide that, in the event of a counterparty’s default (including bankruptcy), the fund may terminate any loans with that borrower, determine the net amount owed, and sell or retain the collateral up to the net amount owed to the fund; however, such actions may be subject to legal proceedings. While collateral mitigates counterparty risk, in the event of a default, the fund may experience delays and costs in recovering the securities loaned. The fund invests cash collateral received in Vanguard Market Liquidity Fund, and records a liability in the Statement of Net Assets for the return of the collateral, during the period the securities are on loan. Securities lending income represents fees charged to borrowers plus income earned on invested cash collateral, less expenses associated with the loan. During the term of the loan, the fund is entitled to all distributions made on or in respect of the loaned securities.
7. Credit Facility: The fund and certain other funds managed by The Vanguard Group (“Vanguard”) participate in a $4.3 billion committed credit facility provided by a syndicate of lenders pursuant to a credit agreement that may be renewed annually; each fund is individually liable for its borrowings, if any, under the credit facility. Borrowings may be utilized for temporary and emergency purposes, and are subject to the fund’s regulatory and contractual borrowing restrictions. The participating funds are charged administrative fees and an annual commitment fee of 0.10% of the undrawn amount of the facility; these fees are allocated to the funds based on a method approved by the fund’s board of trustees and included in Management and Administrative expenses on the fund’s Statement of Operations. Any borrowings under this facility bear interest at a rate based upon the higher of the one-month London Interbank Offered Rate, federal funds effective rate, or overnight bank funding rate plus an agreed-upon spread.
The fund had no borrowings outstanding at August 31, 2019, or at any time during the period then ended.
23
Consumer Discretionary Index Fund
8. Other: Dividend income is recorded on the ex-dividend date. Interest income includes income distributions received from Vanguard Market Liquidity Fund and is accrued daily. Premiums and discounts on debt securities purchased are amortized and accreted, respectively, to interest income over the lives of the respective securities. Security transactions are accounted for on the date securities are bought or sold. Costs used to determine realized gains (losses) on the sale of investment securities are those of the specific securities sold.
Each class of shares has equal rights as to assets and earnings, except that each class separately bears certain class-specific expenses related to maintenance of shareholder accounts (included in Management and Administrative expenses) and shareholder reporting. Marketing and distribution expenses are allocated to each class of shares based on a method approved by the board of trustees. Income, other non-class-specific expenses, and gains and losses on investments are allocated to each class of shares based on its relative net assets.
B. In accordance with the terms of a Funds’ Service Agreement (the “FSA”) between Vanguard and the fund, Vanguard furnishes to the fund investment advisory, corporate management, administrative, marketing, and distribution services at Vanguard’s cost of operations (as defined by the FSA). These costs of operations are allocated to the fund based on methods and guidelines approved by the board of trustees. Vanguard does not require reimbursement in the current period for certain costs of operations (such as deferred compensation/benefits and risk/insurance costs); the fund’s liability for these costs of operations is included in Payables to Vanguard on the Statement of Net Assets. All other costs of operations payable to Vanguard are generally settled twice a month.
Upon the request of Vanguard, the fund may invest up to 0.40% of its net assets as capital in Vanguard. At August 31, 2019, the fund had contributed to Vanguard capital in the amount of $165,000, representing less than 0.01% of the fund’s net assets and 0.07% of Vanguard’s capital received pursuant to the FSA. The fund’s trustees and officers are also directors and employees, respectively, of Vanguard.
C. Various inputs may be used to determine the value of the fund’s investments. These inputs are summarized in three broad levels for financial statement purposes. The inputs or methodologies used to value securities are not necessarily an indication of the risk associated with investing in those securities.
Level 1—Quoted prices in active markets for identical securities.
Level 2—Other significant observable inputs (including quoted prices for similar securities, interest rates, prepayment speeds, credit risk, etc.).
Level 3—Significant unobservable inputs (including the fund’s own assumptions used to determine the fair value of investments). Any investments valued with significant unobservable inputs are noted on the Statement of Net Assets.
The following table summarizes the market value of the fund’s investments and derivatives as of August 31, 2019, based on the inputs used to value them:
| | Level 1 | | Level 2 | | Level 3 | |
Investments | | ($000 | ) | ($000 | ) | ($000 | ) |
Common Stocks | | 3,360,513 | | — | | 3 | |
Temporary Cash Investments | | 40,001 | | — | | — | |
Swap Contracts—Assets | | — | | 295 | | — | |
Total | | 3,400,514 | | 295 | | 3 | |
D. Permanent differences between book-basis and tax-basis components of net assets are reclassified among capital accounts in the financial statements to reflect their tax character. These reclassifications have no effect on net assets or net asset value per share. As of period end, the following permanent differences primarily attributable to the accounting for in-kind redemptions, the expiration of capital loss carryforwards and swap agreements were reclassified between the following accounts:
| | Amount | |
| | ($000 | ) |
Paid-in Capital | | 254,729 | |
Total Distributable Earnings (Loss) | | (254,729 | ) |
24
Consumer Discretionary Index Fund
Temporary differences between book-basis and tax-basis components of total distributable earnings (loss) arise when certain items of income, gain, or loss are recognized in different periods for financial statement and tax purposes; these differences will reverse at some time in the future. The differences are primarily related to the tax deferral on wash sales and the realization of unrealized gains or losses on swap agreements. As of period end, the tax-basis components of total distributable earnings (loss) are detailed in the table as follows:
| | Amount | |
| | ($000 | ) |
Undistributed Ordinary Income | | 6,994 | |
Undistributed Long-Term Gains | | — | |
Capital Loss Carryforwards (Non-expiring) | | (81,895 | ) |
Net Unrealized Gains (Losses) | | 469,346 | |
As of August 31, 2019, gross unrealized appreciation and depreciation for investments and derivatives based on cost for U.S. federal income tax purposes were as follows:
| | Amount | |
| | ($000 | ) |
Tax Cost | | 2,931,171 | |
Gross Unrealized Appreciation | | 777,484 | |
Gross Unrealized Depreciation | | (308,138 | ) |
Net Unrealized Appreciation (Depreciation) | | 469,346 | |
E. During the year ended August 31, 2019, the fund purchased $909,089,000 of investment securities and sold $978,448,000 of investment securities, other than temporary cash investments. Purchases and sales include $562,262,000 and $679,156,000, respectively, in connection with in-kind purchases and redemptions of the fund’s capital shares.
F. Capital share transactions for each class of shares were:
| | | | | Year Ended August 31, | |
| | 2019 | | | 2018 | |
| | Amount | | Shares | | | Amount | | Shares | |
| | ($000 | ) | (000 | ) | | ($000 | ) | (000 | ) |
ETF Shares | | | | | | | | | | |
Issued | | 625,380 | | 3,592 | | | 754,991 | | 4,555 | |
Issued in Lieu of Cash Distributions | | — | | — | | | — | | — | |
Redeemed | | (681,292 | ) | (4,200 | ) | | (378,817 | ) | (2,375 | ) |
Net Increase (Decrease)—ETF Shares | | (55,912 | ) | (608 | ) | | 376,174 | | 2,180 | |
Admiral Shares | | | | | | | | | | |
Issued | | 108,968 | | 1,234 | | | 131,064 | | 1,547 | |
Issued in Lieu of Cash Distributions | | 3,235 | | 36 | | | 2,715 | | 33 | |
Redeemed | | (113,932 | ) | (1,303 | ) | | (71,057 | ) | (854 | ) |
Net Increase (Decrease)—Admiral Shares | | (1,729 | ) | (33 | ) | | 62,722 | | 726 | |
G. Management has determined that no events or transactions occurred subsequent to August 31, 2019, that would require recognition or disclosure in these financial statements.
25
Consumer Staples Index Fund
Performance Summary
All of the returns in this report represent past performance, which is not a guarantee of future results that may be achieved by the fund. (Current performance may be lower or higher than the performance data cited. For performance data current to the most recent month-end, visit our website at vanguard.com/performance.) Note, too, that both investment returns and principal value can fluctuate widely, so an investor’s shares, when sold, could be worth more or less than their original cost. The returns shown do not reflect taxes that a shareholder would pay on fund distributions or on the sale of fund shares.
Cumulative Performance: August 31, 2009–August 31, 2019
Initial Investment of $10,000
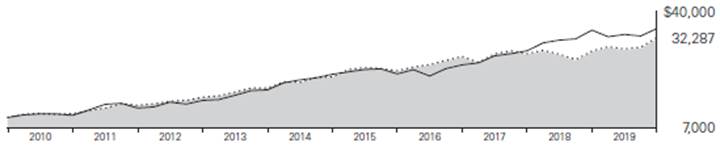
| | | | Average Annual Total Returns | | Final Value |
| | | | Periods Ended August 31, 2019 | | of a $10,000 |
| | | | One Year | | Five Years | | Ten Years | | Investment |

| | Consumer Staples Index Fund ETF Shares Net Asset Value | | 13.24% | | 8.59% | | 12.44% | | $32,287 |
| | Consumer Staples Index Fund ETF Shares Market Price | | 13.25 | | 8.59 | | 12.43 | | 32,277 |

| | Spliced US IMI/Consumer Staples 25/50 | | 13.35 | | 8.68 | | 12.57 | | 32,667 |

| | MSCI US IMI/2500 | | 1.32 | | 9.63 | | 13.41 | | 35,213 |
Spliced US IMI/Consumer Staples 25/50: MSCI US IMI/Consumer Staples through February 28, 2010; MSCI US IMI/Consumer Staples 25/50 thereafter.
| | | | | | Final Value |
| | | | | | of a $100,000 |
| | | | One Year | | Five Years | | Ten Years | | Investment |
Consumer Staples Index Fund Admiral Shares | | 13.24% | | 8.60% | | 12.44% | | $323,090 |
Spliced US IMI/Consumer Staples 25/50 | | 13.35 | | 8.68 | | 12.57 | | 326,674 |
MSCI US IMI/2500 | | 1.32 | | 9.63 | | 13.41 | | 352,130 |
Cumulative Returns: ETF Shares, August 31, 2009–August 31, 2019
| | One Year | | Five Years | | Ten Years |
Consumer Staples Index Fund ETF Shares Market Price | | 13.25% | | 50.99% | | 222.77% |
Consumer Staples Index Fund ETF Shares Net Asset Value | | 13.24 | | 50.96 | | 222.87 |
Spliced US IMI/Consumer Staples 25/50 | | 13.35 | | 51.64 | | 226.67 |
For the ETF Shares, the market price is determined by the midpoint of the bid-offer spread as of the closing time of the New York Stock Exchange (generally 4 p.m., Eastern time). The net asset value is also determined as of the NYSE closing time. For more information about how the ETF Shares’ market prices have compared with their net asset value, visit vanguard.com, select your ETF, and then select the Price and Performance tab. The ETF premium/discount analysis there shows the percentages of days on which the ETF Shares’ market price was above or below the NAV.
See Financial Highlights for dividend and capital gains information.
26
Consumer Staples Index Fund
Sector Diversification
As of August 31, 2019
Agricultural Products | | 2.2 | % |
Brewers | | 0.8 | |
Distillers & Vintners | | 2.8 | |
Drug Retail | | 2.3 | |
Food Distributors | | 3.1 | |
Food Retail | | 1.9 | |
Household Products | | 23.5 | |
Hypermarkets & Super Centers | | 13.0 | |
Packaged Foods & Meats | | 17.4 | |
Personal Products | | 3.7 | |
Soft Drinks | | 21.5 | |
Tobacco | | 7.8 | |
The table reflects the fund’s equity exposure, based on its investments in stocks and stock index futures. Any holdings in short-term reserves are excluded. Sector categories are based on the Global Industry Classification Standard (“GICS”), except for the “Other” category (if applicable), which includes securities that have not been provided a GICS classification as of the effective reporting period.
The Global Industry Classification Standard (“GICS”) was developed by and is the exclusive property and a service mark of MSCI Inc. (“MSCI”) and Standard and Poor’s, a division of McGraw-Hill Companies, Inc. (“S&P”), and is licensed for use by Vanguard. Neither MSCI, S&P nor any third party involved in making or compiling the GICS or any GICS classification makes any express or implied warranties or representations with respect to such standard or classification (or the results to be obtained by the use thereof), and all such parties hereby expressly disclaim all warranties of originality, accuracy, completeness, merchantability or fitness for a particular purpose with respect to any such standard or classification. Without limiting any of the foregoing, in no event shall MSCI, S&P, any of its affiliates or any third party involved in making or compiling the GICS or any GICS classification have any liability for any direct, indirect, special, punitive, consequential or any other damages (including lost profits) even if notified of the possibility of such damages.
27
Consumer Staples Index Fund
Financial Statements
Statement of Net Assets
As of August 31, 2019
The fund files its complete schedule of portfolio holdings with the Securities and Exchange Commission (SEC) for the first and third quarters of each fiscal year as an exhibit to its reports on Form N-PORT. The fund’s Form N-PORT reports are available on the SEC’s website at www.sec.gov.
| | | | | Market |
| | | | | Value· |
| | | Shares | | ($000) |
Common Stocks (99.6%)1 | | | | |
Beverages (25.0%) | | | | |
| Coca-Cola Co. | | 11,631,638 | | 640,205 |
| PepsiCo Inc. | | 4,068,726 | | 556,317 |
| Constellation Brands Inc. Class A | | 523,539 | | 106,985 |
* | Monster Beverage Corp. | | 1,272,300 | | 74,646 |
| Brown-Forman Corp. Class B | | 980,152 | | 57,819 |
| Molson Coors Brewing Co. Class B | | 617,955 | | 31,738 |
* | Boston Beer Co. Inc. Class A | | 39,330 | | 17,243 |
| Coca-Cola Consolidated Inc. | | 28,765 | | 9,683 |
| MGP Ingredients Inc. | | 81,458 | | 3,924 |
^ | National Beverage Corp. | | 84,892 | | 3,472 |
*,^ | New Age Beverages Corp. | | 704,272 | | 2,141 |
| | | | | 1,504,173 |
Food & Staples Retailing (20.2%) | | | | |
| Walmart Inc. | | 4,140,620 | | 473,107 |
| Costco Wholesale Corp. | | 975,268 | | 287,470 |
| Walgreens Boots Alliance Inc. | | 2,642,773 | | 135,283 |
| Sysco Corp. | | 1,627,241 | | 120,953 |
| Kroger Co. | | 2,805,127 | | 66,425 |
* | US Foods Holding Corp. | | 725,032 | | 29,327 |
| Casey’s General Stores Inc. | | 137,242 | | 23,036 |
* | Performance Food Group Co. | | 383,197 | | 17,930 |
* | BJ’s Wholesale Club Holdings Inc. | | 482,403 | | 12,668 |
* | Sprouts Farmers Market Inc. | | 537,594 | | 9,650 |
* | Chefs’ Warehouse Inc. | | 213,106 | | 8,222 |
| PriceSmart Inc. | | 117,106 | | 7,077 |
| Ingles Markets Inc. Class A | | 125,078 | | 4,863 |
| Weis Markets Inc. | | 115,501 | | 4,416 |
| Andersons Inc. | | 180,244 | | 4,131 |
* | United Natural Foods Inc. | | 379,173 | | 3,049 |
| SpartanNash Co. | | 281,352 | | 3,030 |
^ | Rite Aid Corp. | | 451,580 | | 2,917 |
| Village Super Market Inc. Class A | | 102,878 | | 2,569 |
| | | | | 1,216,123 |
Food Products (19.6%) | | | | |
| Mondelez International Inc. Class A | | 4,670,132 | | 257,885 |
| General Mills Inc. | | 1,852,368 | | 99,657 |
| Tyson Foods Inc. Class A | | 940,491 | | 87,503 |
| Hershey Co. | | 467,530 | | 74,094 |
| Archer-Daniels-Midland Co. | | 1,818,166 | | 69,181 |
| McCormick & Co. Inc. | | 387,093 | | 63,046 |
| Kraft Heinz Co. | | 2,106,322 | | 53,753 |
| Kellogg Co. | | 824,707 | | 51,792 |
| Conagra Brands Inc. | | 1,618,834 | | 45,910 |
| Hormel Foods Corp. | | 954,094 | | 40,654 |
| JM Smucker Co. | | 364,431 | | 38,324 |
| Lamb Weston Holdings Inc. | | 481,751 | | 33,910 |
| Bunge Ltd. | | 475,589 | | 25,401 |
* | Post Holdings Inc. | | 218,194 | | 21,752 |
| Campbell Soup Co. | | 423,463 | | 19,056 |
* | Freshpet Inc. | | 386,180 | | 18,954 |
| Ingredion Inc. | | 236,385 | | 18,265 |
| Flowers Foods Inc. | | 689,269 | | 15,715 |
| Sanderson Farms Inc. | | 95,564 | | 14,298 |
* | Darling Ingredients Inc. | | 738,571 | | 13,737 |
| J&J Snack Foods Corp. | | 66,576 | | 12,853 |
| Lancaster Colony Corp. | | 79,166 | | 11,550 |
* | TreeHouse Foods Inc. | | 214,307 | | 10,855 |
* | Pilgrim’s Pride Corp. | | 319,823 | | 9,966 |
* | Simply Good Foods Co. | | 329,010 | | 9,749 |
* | Hostess Brands Inc. Class A | | 613,305 | | 8,599 |
| Calavo Growers Inc. | | 91,594 | | 8,120 |
* | Hain Celestial Group Inc. | | 391,916 | | 7,466 |
| Cal-Maine Foods Inc. | | 153,405 | | 6,219 |
| Tootsie Roll Industries Inc. | | 154,249 | | 5,658 |
| John B Sanfilippo & Son Inc. | | 58,791 | | 5,444 |
^ | B&G Foods Inc. | | 316,828 | | 5,364 |
| Fresh Del Monte Produce Inc. | | 184,061 | | 4,793 |
* | Landec Corp. | | 316,273 | | 3,476 |
* | Farmer Brothers Co. | | 133,265 | | 1,618 |
| | | | | 1,174,617 |
Household Products (23.4%) | | | | |
| Procter & Gamble Co. | | 7,380,012 | | 887,299 |
| Colgate-Palmolive Co. | | 2,549,627 | | 189,055 |
| Kimberly-Clark Corp. | | 1,091,094 | | 153,964 |
| Church & Dwight Co. Inc. | | 829,797 | | 66,201 |
| Clorox Co. | | 404,693 | | 64,006 |
| WD-40 Co. | | 68,918 | | 12,564 |
| Energizer Holdings Inc. | | 259,238 | | 9,981 |
| Spectrum Brands Holdings Inc. | | 169,655 | | 9,478 |
* | Central Garden & Pet Co. Class A | | 278,710 | | 6,706 |
* | Central Garden & Pet Co. | | 133,488 | | 3,527 |
| | | | | 1,402,781 |
Personal Products (3.6%) | | | | |
| Estee Lauder Cos. Inc. Class A | | 693,865 | | 137,378 |
* | Herbalife Nutrition Ltd. | | 434,823 | | 14,971 |
| Medifast Inc. | | 110,412 | | 11,037 |
| Coty Inc. Class A | | 1,105,055 | | 10,553 |
| Nu Skin Enterprises Inc. Class A | | 237,273 | | 9,638 |
* | Avon Products Inc. | | 2,178,456 | | 9,476 |
| Inter Parfums Inc. | | 146,250 | | 9,402 |
* | Edgewell Personal Care Co. | | 242,981 | | 6,765 |
* | USANA Health Sciences Inc. | | 75,262 | | 5,116 |
* | elf Beauty Inc. | | 264,360 | | 4,314 |
| | | | | 218,650 |
Tobacco (7.8%) | | | | |
| Altria Group Inc. | | 5,203,097 | | 227,583 |
| Philip Morris International Inc. | | 3,134,145 | | 225,941 |
| Vector Group Ltd. | | 617,206 | | 7,209 |
| Universal Corp. | | 125,785 | | 6,297 |
| | | | | 467,030 |
Total Common Stocks
(Cost $5,317,434) | | | | 5,983,374 |
Temporary Cash Investment (0.4%)1 | | | | |
Money Market Fund (0.4%) | | | | |
2,3 | Vanguard Market Liquidity Fund, 2.249% (Cost $22,539) | | 225,375 | | 22,540 |
Total Investments (100.0%)
(Cost $5,339,973) | | | | 6,005,914 |
| | | | | Amount |
| | | | | ($000) |
Other Assets and Liabilities (0.0%) | | | | |
Other Assets | | | | |
Investment in Vanguard | | | | 279 |
Receivables for Accrued Income | | | | 8,884 |
Receivables for Capital Shares Issued | | | | 927 |
Unrealized Appreciation—OTC Swap Contracts | | | | 719 |
Other Assets | | | | 140 |
Total Other Assets | | | | 10,949 |
Liabilities | | | | |
Payables for Investment Securities Purchased | | | | (25) |
Collateral for Securities on Loan | | | | (10,005) |
Payables for Capital Shares Redeemed | | | | (508) |
Payables to Vanguard | | | | (1,010) |
Total Liabilities | | | | (11,548) |
Net Assets (100%) | | | | 6,005,315 |
28
Consumer Staples Index Fund
At August 31, 2019, net assets consisted of:
| | | | | Amount |
| | | | | ($000) |
Paid-in Capital | | | | 5,432,547 |
Total Distributable Earnings (Loss) | | | | 572,768 |
Net Assets | | | | 6,005,315 |
| | | | |
ETF Shares—Net Assets | | | | |
Applicable to 34,228,990 outstanding $.001 par value shares of beneficial interest (unlimited authorization) | | | | 5,295,785 |
Net Asset Value Per Share—ETF Shares | | | | $154.72 |
| | | | |
Admiral Shares—Net Assets | | | | |
Applicable to 9,300,749 outstanding $.001 par value shares of beneficial interest (unlimited authorization) | | | | 709,530 |
Net Asset Value Per Share—Admiral Shares | | | | $76.29 |
· See Note A in Notes to Financial Statements.
* Non-income-producing security.
^ Includes partial security positions on loan to broker-dealers. The total value of securities on loan is $9,265,000.
1 The fund invests a portion of its cash reserves in equity markets through the use of swap contracts. After giving effect to swap investments, the fund’s effective common stock and temporary cash investment positions represent 99.9% and 0.1%, respectively, of net assets.
2 Affiliated money market fund available only to Vanguard funds and certain trusts and accounts managed by Vanguard. Rate shown is the 7-day yield.
3 Includes $10,005,000 of collateral received for securities on loan. OTC—Over-the-Counter.
Derivative Financial Instruments Outstanding as of Period End | |
| |
Over-the-Counter Total Return Swaps | |
| | | | | | | | Floating | | | | | |
| | | | | | | | Interest Rate | | Value and | | Value and | |
| | | | | | Notional | | Received | | Unrealized | | Unrealized | |
| | Termination | | | | Amount | | (Paid) | 1 | Appreciation | | (Depreciation | ) |
Reference Entity | | Date | | Counterparty | | ($000 | ) | (%) | | ($000 | ) | ($000 | ) |
Campbell Soup Co. | | 2/4/20 | | GSI | | 7,378 | | (2.182) | | 492 | | — | |
Coca-Cola Co. | | 2/4/20 | | GSI | | 10,774 | | (2.182) | | 227 | | — | |
| | | | | | | | | | 719 | | — | |
1 Payment received/paid monthly.
GSI—Goldman Sachs International.
At August 31, 2019, a counterparty had deposited in a segregated account securities with a value of $554,000 in connection with open over-the-counter swap contracts.
See accompanying Notes, which are an integral part of the Financial Statements.
29
Consumer Staples Index Fund
Statement of Operations
| | Year Ended |
| | August 31, 2019 |
| | ($000) |
Investment Income | | |
Income | | |
Dividends | | 145,729 |
Interest1 | | 171 |
Securities Lending—Net | | 474 |
Total Income | | 146,374 |
Expenses | | |
The Vanguard Group—Note B | | |
Investment Advisory Services | | 771 |
Management and Administrative—ETF Shares | | 3,305 |
Management and Administrative—Admiral Shares | | 466 |
Marketing and Distribution—ETF Shares | | 232 |
Marketing and Distribution—Admiral Shares | | 39 |
Custodian Fees | | 88 |
Auditing Fees | | 33 |
Shareholders’ Reports—ETF Shares | | 264 |
Shareholders’ Reports—Admiral Shares | | 15 |
Trustees’ Fees and Expenses | | 3 |
Total Expenses | | 5,216 |
Net Investment Income | | 141,158 |
Realized Net Gain (Loss) | | |
Investment Securities Sold1,2 | | 112,531 |
Futures Contracts | | (118) |
Swap Contracts | | 3,000 |
Realized Net Gain (Loss) | | 115,413 |
Change in Unrealized Appreciation (Depreciation) | | |
Investment Securities1 | | 407,624 |
Futures Contracts | | (101) |
Swap Contracts | | 719 |
Change in Unrealized Appreciation (Depreciation) | | 408,242 |
Net Increase (Decrease) in Net Assets Resulting from Operations | | 664,813 |
1 Interest income, realized net gain (loss), and change in unrealized appreciation (depreciation) from an affiliated company of the fund were $132,000, ($4,000), and ($1,000), respectively. Purchases and sales are for temporary cash investment purposes.
2 Includes $169,588,000 of net gain(loss) resulting from in-kind redemptions; such gain(loss) is not taxable to the fund.
Statement of Changes in Net Assets
| | Year Ended August 31, | |
| | 2019 | | 2018 | |
| | ($000 | ) | ($000 | ) |
Increase (Decrease) in Net Assets | | | | | |
Operations | | | | | |
Net Investment Income | | 141,158 | | 115,562 | |
Realized Net Gain (Loss) | | 115,413 | | 165,928 | |
Change in Unrealized Appreciation (Depreciation) | | 408,242 | | (172,271 | ) |
Net Increase (Decrease) in Net Assets Resulting from Operations | | 664,813 | | 109,219 | |
Distributions | | | | | |
Net Investment Income | | | | | |
ETF Shares | | (116,549 | ) | (99,387 | ) |
Admiral Shares | | (15,822 | ) | (16,715 | ) |
Realized Capital Gain | | | | | |
ETF Shares | | — | | — | |
Admiral Shares | | — | | — | |
Total Distributions | | (132,371 | ) | (116,102 | ) |
Capital Share Transactions | | | | | |
ETF Shares | | 844,523 | | 207,348 | |
Admiral Shares | | 58,390 | | (152,708 | ) |
Net Increase (Decrease) from Capital Share Transactions | | 902,913 | | 54,640 | |
Total Increase (Decrease) | | 1,435,355 | | 47,757 | |
Net Assets | | | | | |
Beginning of Period | | 4,569,960 | | 4,522,203 | |
End of Period | | 6,005,315 | | 4,569,960 | |
See accompanying Notes, which are an integral part of the Financial Statements.
30
Consumer Staples Index Fund
Financial Highlights
ETF Shares
For a Share Outstanding Throughout Each Period | | Year Ended August 31, | |
| 2019 | | 2018 | | 2017 | | 2016 | | 2015 | |
Net Asset Value, Beginning of Period | | $140.13 | | $140.15 | | $139.97 | | $123.72 | | $117.12 | |
Investment Operations | | | | | | | | | | | |
Net Investment Income | | 3.896 | 1 | 3.603 | 1 | 3.651 | 1 | 3.189 | | 2.903 | |
Net Realized and Unrealized Gain (Loss) on Investments | | 14.346 | | (.033 | ) | .212 | | 17.752 | | 6.114 | |
Total from Investment Operations | | 18.242 | | 3.570 | | 3.863 | | 20.941 | | 9.017 | |
Distributions | | | | | | | | | | | |
Dividends from Net Investment Income | | (3.652 | ) | (3.590 | ) | (3.683 | ) | (4.691 | ) | (2.417 | ) |
Distributions from Realized Capital Gains | | — | | — | | — | | — | | — | |
Total Distributions | | (3.652 | ) | (3.590 | ) | (3.683 | ) | (4.691 | ) | (2.417 | ) |
Net Asset Value, End of Period | | $154.72 | | $140.13 | | $140.15 | | $139.97 | | $123.72 | |
| | | | | | | | | | | |
Total Return | | 13.24% | | 2.60% | | 2.83% | | 17.36% | | 7.67% | |
| | | | | | | | | | | |
Ratios/Supplemental Data | | | | | | | | | | | |
Net Assets, End of Period (Millions) | | $5,296 | | $3,983 | | $3,780 | | $3,518 | | $2,393 | |
Ratio of Total Expenses to Average Net Assets | | 0.10% | | 0.10% | | 0.10% | | 0.10% | | 0.10% | |
Ratio of Net Investment Income to Average Net Assets | | 2.71% | | 2.60% | | 2.63% | | 2.50% | | 2.53% | |
Portfolio Turnover Rate2 | | 6% | | 8% | | 5% | | 6% | | 6% | |
1 Calculated based on average shares outstanding.
2 Excludes the value of portfolio securities received or delivered as a result of in-kind purchases or redemptions of the fund’s capital shares, including ETF Creation Units.
Admiral Shares
For a Share Outstanding Throughout Each Period | | Year Ended August 31, | |
| 2019 | | 2018 | | 2017 | | 2016 | | 2015 | |
Net Asset Value, Beginning of Period | | $69.09 | | $69.10 | | $69.02 | | $61.01 | | $57.74 | |
Investment Operations | | | | | | | | | | | |
Net Investment Income | | 1.923 | 1 | 1.776 | 1 | 1.797 | 1 | 1.575 | | 1.431 | |
Net Realized and Unrealized Gain (Loss) on Investments | | 7.076 | | (.018 | ) | .101 | | 8.752 | | 3.025 | |
Total from Investment Operations | | 8.999 | | 1.758 | | 1.898 | | 10.327 | | 4.456 | |
Distributions | | | | | | | | | | | |
Dividends from Net Investment Income | | (1.799 | ) | (1.768 | ) | (1.818 | ) | (2.317 | ) | (1.186 | ) |
Distributions from Realized Capital Gains | | — | | — | | — | | — | | — | |
Total Distributions | | (1.799 | ) | (1.768 | ) | (1.818 | ) | (2.317 | ) | (1.186 | ) |
Net Asset Value, End of Period | | $76.29 | | $69.09 | | $69.10 | | $69.02 | | $61.01 | |
| | | | | | | | | | | |
Total Return2 | | 13.24% | | 2.59% | | 2.81% | | 17.37% | | 7.73% | |
| | | | | | | | | | | |
Ratios/Supplemental Data | | | | | | | | | | | |
Net Assets, End of Period (Millions) | | $710 | | $587 | | $742 | | $728 | | $319 | |
Ratio of Total Expenses to Average Net Assets | | 0.10% | | 0.10% | | 0.10% | | 0.10% | | 0.10% | |
Ratio of Net Investment Income to Average Net Assets | | 2.71% | | 2.60% | | 2.63% | | 2.50% | | 2.53% | |
Portfolio Turnover Rate3 | | 6% | | 8% | | 5% | | 6% | | 6% | |
1 Calculated based on average shares outstanding.
2 Total returns do not include account service fees that may have applied in the periods shown. Fund prospectuses provide information about any applicable account service fees.
3 Excludes the value of portfolio securities received or delivered as a result of in-kind purchases or redemptions of the fund’s capital shares, including ETF Creation Units.
See accompanying Notes, which are an integral part of the Financial Statements.
31
Consumer Staples Index Fund
Notes to Financial Statements
Vanguard Consumer Staples Index Fund is registered under the Investment Company Act of 1940 as an open-end investment company, or mutual fund. The fund offers two classes of shares: ETF Shares and Admiral Shares. Each of the share classes has different eligibility and minimum purchase requirements, and is designed for different types of investors. ETF Shares are listed for trading on NYSE Arca; they can be purchased and sold through a broker.
A. The following significant accounting policies conform to generally accepted accounting principles for U.S. investment companies. The fund consistently follows such policies in preparing its financial statements.
1. Security Valuation: Securities are valued as of the close of trading on the New York Stock Exchange (generally 4 p.m., Eastern time) on the valuation date. Equity securities are valued at the latest quoted sales prices or official closing prices taken from the primary market in which each security trades; such securities not traded on the valuation date are valued at the mean of the latest quoted bid and asked prices. Securities for which market quotations are not readily available, or whose values have been materially affected by events occurring before the fund’s pricing time but after the close of the securities’ primary markets, are valued by methods deemed by the board of trustees to represent fair value. Investments in Vanguard Market Liquidity Fund are valued at that fund’s net asset value. Temporary cash investments are valued using the latest bid prices or using valuations based on a matrix system (which considers such factors as security prices, yields, maturities, and ratings), both as furnished by independent pricing services.
2. Futures Contracts: The fund uses index futures contracts to a limited extent, with the objectives of maintaining full exposure to the stock market, maintaining liquidity, and minimizing transaction costs. The fund may purchase futures contracts to immediately invest incoming cash in the market, or sell futures in response to cash outflows, thereby simulating a fully invested position in the underlying index while maintaining a cash balance for liquidity. The primary risks associated with the use of futures contracts are imperfect correlation between changes in market values of stocks held by the fund and the prices of futures contracts, and the possibility of an illiquid market. Counterparty risk involving futures is mitigated because a regulated clearinghouse is the counterparty instead of the clearing broker. To further mitigate counterparty risk, the fund trades futures contracts on an exchange, monitors the financial strength of its clearing brokers and clearinghouse, and has entered into clearing agreements with its clearing brokers. The clearinghouse imposes initial margin requirements to secure the fund’s performance and requires daily settlement of variation margin representing changes in the market value of each contract. Any assets pledged as initial margin for open contracts are noted in the Statement of Net Assets.
Futures contracts are valued at their quoted daily settlement prices. The notional amounts of the contracts are not recorded in the Statement of Net Assets. Fluctuations in the value of the contracts are recorded in the Statement of Net Assets as an asset (liability) and in the Statement of Operations as unrealized appreciation (depreciation) until the contracts are closed, when they are recorded as realized futures gains (losses).
During the year ended August 31, 2019, the fund’s average investments in long and short futures contracts represented less than 1% and 0% of net assets, respectively, based on the average of the notional amounts at each quarter-end during the period. The fund had no open futures contracts at August 31, 2019.
3. Swap Contracts: The fund has entered into equity swap contracts to earn the total return on selected reference stocks in the fund’s target index. Under the terms of the swaps, the fund receives the total return on the referenced stock (i.e., receiving the increase or paying the decrease in value of the selected reference stock and receiving the equivalent of any dividends in respect of the selected referenced stock) over a specified period of time, applied to a notional amount that represents the value of a designated number of shares of the selected reference stock at the beginning of the equity swap contract. The fund also pays a floating rate that is based on short-term interest rates, applied to the notional amount. At the same time, the fund generally invests an amount approximating the notional amount of the swap in high-quality temporary cash investments.
The notional amounts of swap contracts are not recorded in the Statement of Net Assets. Swaps are valued daily based on market quotations received from independent pricing services or recognized dealers and the change in value is recorded in the Statement of Net Assets as an asset (liability) and in the Statement of Operations as unrealized appreciation (depreciation) until termination of the swap, at which time realized gain (loss) is recorded.
32
Consumer Staples Index Fund
A risk associated with all types of swaps is the possibility that a counterparty may default on its obligation to pay net amounts due to the fund. The fund’s maximum amount subject to counterparty risk is the unrealized appreciation on the swap contract. The fund mitigates its counterparty risk by entering into swaps only with a diverse group of prequalified counterparties, monitoring their financial strength, entering into master netting arrangements with its counterparties, and requiring its counterparties to transfer collateral as security for their performance. In the absence of a default, the collateral pledged or received by the fund cannot be repledged, resold, or rehypothecated. In the event of a counterparty’s default (including bankruptcy), the fund may terminate any swap contracts with that counterparty, determine the net amount owed by either party in accordance with its master netting arrangements, and sell or retain any collateral held up to the net amount owed to the fund under the master netting arrangements. The swap contracts contain provisions whereby a counterparty may terminate open contracts if the fund net assets decline below a certain level, triggering a payment by the fund if the fund is in a net liability position at the time of the termination. The payment amount would be reduced by any collateral the fund has pledged. Any securities pledged as collateral for open contracts are noted in the Statement of Net Assets. The value of collateral received or pledged is compared daily to the value of the swap contracts exposure with each counterparty, and any difference, if in excess of a specified minimum transfer amount, is adjusted and settled within two business days.
During the year ended August 31, 2019, the fund’s average amounts of investments in total return swaps represented less than 1% of net assets, based on the average of notional amounts at each quarter-end during the period.
4. Federal Income Taxes: The fund intends to continue to qualify as a regulated investment company and distribute all of its taxable income. Management has analyzed the fund’s tax positions taken for all open federal income tax years (August 31, 2016–2019), and has concluded that no provision for federal income tax is required in the fund’s financial statements.
5. Distributions: Distributions to shareholders are recorded on the ex-dividend date. Distributions are determined on a tax basis and may differ from net investment income and realized capital gains for financial reporting purposes.
6. Securities Lending: To earn additional income, the fund lends its securities to qualified institutional borrowers. Security loans are subject to termination by the fund at any time, and are required to be secured at all times by collateral in an amount at least equal to the market value of securities loaned. Daily market fluctuations could cause the value of loaned securities to be more or less than the value of the collateral received. When this occurs, the collateral is adjusted and settled before the opening of the market on the next business day. The fund further mitigates its counterparty risk by entering into securities lending transactions only with a diverse group of prequalified counterparties, monitoring their financial strength, and entering into master securities lending agreements with its counterparties. The master securities lending agreements provide that, in the event of a counterparty’s default (including bankruptcy), the fund may terminate any loans with that borrower, determine the net amount owed, and sell or retain the collateral up to the net amount owed to the fund; however, such actions may be subject to legal proceedings. While collateral mitigates counterparty risk, in the event of a default, the fund may experience delays and costs in recovering the securities loaned. The fund invests cash collateral received in Vanguard Market Liquidity Fund, and records a liability in the Statement of Net Assets for the return of the collateral, during the period the securities are on loan. Securities lending income represents fees charged to borrowers plus income earned on invested cash collateral, less expenses associated with the loan. During the term of the loan, the fund is entitled to all distributions made on or in respect of the loaned securities.
7. Credit Facility: The fund and certain other funds managed by The Vanguard Group (“Vanguard”) participate in a $4.3 billion committed credit facility provided by a syndicate of lenders pursuant to a credit agreement that may be renewed annually; each fund is individually liable for its borrowings, if any, under the credit facility. Borrowings may be utilized for temporary and emergency purposes, and are subject to the fund’s regulatory and contractual borrowing restrictions. The participating funds are charged administrative fees and an annual commitment fee of 0.10% of the undrawn amount of the facility; these fees are allocated to the funds based on a method approved by the fund’s board of trustees and included in Management and Administrative expenses on the fund’s Statement of Operations. Any borrowings under this facility bear interest at a rate based upon the higher of the one-month London Interbank Offered Rate, federal funds effective rate, or overnight bank funding rate plus an agreed-upon spread.
The fund had no borrowings outstanding at August 31, 2019, or at any time during the period then ended.
33
Consumer Staples Index Fund
8. Other: Dividend income is recorded on the ex-dividend date. Interest income includes income distributions received from Vanguard Market Liquidity Fund and is accrued daily. Premiums and discounts on debt securities purchased are amortized and accreted, respectively, to interest income over the lives of the respective securities. Security transactions are accounted for on the date securities are bought or sold. Costs used to determine realized gains (losses) on the sale of investment securities are those of the specific securities sold.
Each class of shares has equal rights as to assets and earnings, except that each class separately bears certain class-specific expenses related to maintenance of shareholder accounts (included in Management and Administrative expenses) and shareholder reporting. Marketing and distribution expenses are allocated to each class of shares based on a method approved by the board of trustees. Income, other non-class-specific expenses, and gains and losses on investments are allocated to each class of shares based on its relative net assets.
B. In accordance with the terms of a Funds’ Service Agreement (the “FSA”) between Vanguard and the fund, Vanguard furnishes to the fund investment advisory, corporate management, administrative, marketing, and distribution services at Vanguard’s cost of operations (as defined by the FSA). These costs of operations are allocated to the fund based on methods and guidelines approved by the board of trustees. Vanguard does not require reimbursement in the current period for certain costs of operations (such as deferred compensation/benefits and risk/insurance costs); the fund’s liability for these costs of operations is included in Payables to Vanguard on the Statement of Net Assets. All other costs of operations payable to Vanguard are generally settled twice a month.
Upon the request of Vanguard, the fund may invest up to 0.40% of its net assets as capital in Vanguard. At August 31, 2019, the fund had contributed to Vanguard capital in the amount of $279,000, representing less than 0.01% of the fund’s net assets and 0.11% of Vanguard’s capital received pursuant to the FSA. The fund’s trustees and officers are also directors and employees, respectively, of Vanguard.
C. Various inputs may be used to determine the value of the fund’s investments. These inputs are summarized in three broad levels for financial statement purposes. The inputs or methodologies used to value securities are not necessarily an indication of the risk associated with investing in those securities.
Level 1—Quoted prices in active markets for identical securities.
Level 2—Other significant observable inputs (including quoted prices for similar securities, interest rates, prepayment speeds, credit risk, etc.).
Level 3—Significant unobservable inputs (including the fund’s own assumptions used to determine the fair value of investments). Any investments valued with significant unobservable inputs are noted on the Statement of Net Assets.
The following table summarizes the market value of the fund’s investments and derivatives as of August 31, 2019, based on the inputs used to value them:
| | Level 1 | | Level 2 | | Level 3 | |
Investments | | ($000 | ) | ($000 | ) | ($000 | ) |
Common Stocks | | 5,983,374 | | — | | — | |
Temporary Cash Investments | | 22,540 | | — | | — | |
Swap Contracts—Assets | | — | | 719 | | — | |
Total | | 6,005,914 | | 719 | | — | |
D. Permanent differences between book-basis and tax-basis components of net assets are reclassified among capital accounts in the financial statements to reflect their tax character. These reclassifications have no effect on net assets or net asset value per share. As of period end, permanent differences primarily attributable to the accounting for in-kind redemptions and swap agreements were reclassified between the following accounts:
| | Amount | |
| | ($000 | ) |
Paid-in Capital | | 169,588 | |
Total Distributable Earnings (Loss) | | (169,588 | ) |
34
Consumer Staples Index Fund
Temporary differences between book-basis and tax-basis components of total distributable earnings (loss) arise when certain items of income, gain, or loss are recognized in different periods for financial statement and tax purposes; these differences will reverse at some time in the future. The differences are primarily related to the tax deferral on wash sales and the realization of unrealized gains or losses on swap agreements. As of period end, the tax-basis components of total distributable earnings (loss) are detailed in the table as follows:
| | Amount | |
| | ($000 | ) |
Undistributed Ordinary Income | | 28,947 | |
Undistributed Long-Term Gains | | — | |
Capital Loss Carryforwards (Non-expiring) | | (121,403 | ) |
Net Unrealized Gains (Losses) | | 665,941 | |
As of August 31, 2019, gross unrealized appreciation and depreciation for investments and derivatives based on cost for U.S. federal income tax purposes were as follows:
| | Amount | |
| | ($000 | ) |
Tax Cost | | 5,339,973 | |
Gross Unrealized Appreciation | | 1,127,195 | |
Gross Unrealized Depreciation | | (461,254 | ) |
Net Unrealized Appreciation (Depreciation) | | 665,941 | |
E. During the year ended August 31, 2019, the fund purchased $1,952,275,000 of investment securities and sold $1,052,802,000 of investment securities, other than temporary cash investments. Purchases and sales include $1,477,771,000 and $745,782,000, respectively, in connection with in-kind purchases and redemptions of the fund’s capital shares.
F. Capital share transactions for each class of shares were:
| | Year Ended August 31, | |
| | | | 2019 | | 2018 | |
| | Amount | | Shares | | Amount | | Shares | |
| | ($000 | ) | (000 | ) | ($000 | ) | (000 | ) |
ETF Shares | | | | | | | | | |
Issued | | 1,595,617 | | 11,157 | | 928,324 | | 6,677 | |
Issued in Lieu of Cash Distributions | | — | | — | | — | | — | |
Redeemed | | (751,094 | ) | (5,350 | ) | (720,976 | ) | (5,225 | ) |
Net Increase (Decrease)—ETF Shares | | 844,523 | | 5,807 | | 207,348 | | 1,452 | |
Admiral Shares | | | | | | | | | |
Issued | | 217,155 | | 3,077 | | 169,310 | | 2,477 | |
Issued in Lieu of Cash Distributions | | 13,107 | | 184 | | 14,196 | | 207 | |
Redeemed | | (171,872 | ) | (2,460 | ) | (336,214 | ) | (4,927 | ) |
Net Increase (Decrease)—Admiral Shares | | 58,390 | | 801 | | (152,708 | ) | (2,243 | ) |
G. Management has determined that no events or transactions occurred subsequent to August 31, 2019, that would require recognition or disclosure in these financial statements.
35
Energy Index Fund
Performance Summary
All of the returns in this report represent past performance, which is not a guarantee of future results that may be achieved by the fund. (Current performance may be lower or higher than the performance data cited. For performance data current to the most recent month-end, visit our website at vanguard.com/performance.) Note, too, that both investment returns and principal value can fluctuate widely, so an investor’s shares, when sold, could be worth more or less than their original cost. The returns shown do not reflect taxes that a shareholder would pay on fund distributions or on the sale of fund shares.
Cumulative Performance: August 31, 2009–August 31, 2019
Initial Investment of $10,000
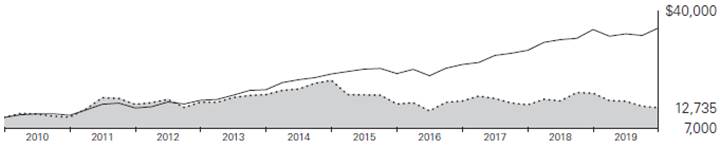
| | | | Average Annual Total Returns | | Final Value |
| | | | Periods Ended August 31, 2019 | | of a $10,000 |
| | | | One Year | | Five Years | | Ten Years | | Investment |

| | Energy Index Fund ETF Shares Net Asset Value | | -24.34% | | -9.18% | | 2.45% | | $12,735 |
| | Energy Index Fund ETF Shares Market Price | | -24.35 | | -9.18 | | 2.43 | | 12,716 |

| | Spliced US IMI/Energy 25/50 | | -24.24 | | -9.02 | | 2.44 | | 12,722 |

| | MSCI US IMI/2500 | | 1.32 | | 9.63 | | 13.41 | | 35,213 |
Spliced US IMI/Energy 25/50: MSCI US IMI/Energy through February 28, 2010; MSCI US IMI/Energy 25/50 thereafter.
| | | | | | | | | | Final Value |
| | | | | | | | | | of a $100,000 |
| | | | One Year | | Five Years | | Ten Years | | Investment |
Energy Index Fund Admiral Shares | | -24.33% | | -9.16% | | 2.45% | | $127,445 |
Spliced US IMI/Energy 25/50 | | -24.24 | | -9.02 | | 2.44 | | 127,222 |
MSCI US IMI/2500 | | 1.32 | | 9.63 | | 13.41 | | 352,130 |
Cumulative Returns: ETF Shares, August 31, 2009–August 31, 2019
| | | | One Year | | Five Years | | Ten Years |
Energy Index Fund ETF Shares Market Price | | | | -24.35% | | -38.21% | | 27.16% |
Energy Index Fund ETF Shares Net Asset Value | | | | -24.34 | | -38.20 | | 27.35 |
Spliced US IMI/Energy 25/50 | | | | -24.24 | | -37.66 | | 27.22 |
For the ETF Shares, the market price is determined by the midpoint of the bid-offer spread as of the closing time of the New York Stock Exchange (generally 4 p.m., Eastern time). The net asset value is also determined as of the NYSE closing time. For more information about how the ETF Shares’ market prices have compared with their net asset value, visit vanguard.com, select your ETF, and then select the Price and Performance tab. The ETF premium/discount analysis there shows the percentages of days on which the ETF Shares’ market price was above or below the NAV.
See Financial Highlights for dividend and capital gains information.
36
Energy Index Fund
Sector Diversification
As of August 31, 2019
Coal & Consumable Fuels | | 0.3 | % |
Integrated Oil & Gas | | 44.3 | |
Oil & Gas Drilling | | 1.0 | |
Oil & Gas Equipment & Services | | 9.6 | |
Oil & Gas Exploration & Production | | 22.6 | |
Oil & Gas Refining & Marketing | | 10.9 | |
Oil & Gas Storage & Transportation | | 11.3 | |
The table reflects the fund’s equity exposure, based on its investments in stocks and stock index futures. Any holdings in short-term reserves are excluded. Sector categories are based on the Global Industry Classification Standard (“GICS”), except for the “Other” category (if applicable), which includes securities that have not been provided a GICS classification as of the effective reporting period.
The Global Industry Classification Standard (“GICS”) was developed by and is the exclusive property and a service mark of MSCI Inc. (“MSCI”) and Standard and Poor’s, a division of McGraw-Hill Companies, Inc. (“S&P”), and is licensed for use by Vanguard. Neither MSCI, S&P nor any third party involved in making or compiling the GICS or any GICS classification makes any express or implied warranties or representations with respect to such standard or classification (or the results to be obtained by the use thereof), and all such parties hereby expressly disclaim all warranties of originality, accuracy, completeness, merchantability or fitness for a particular purpose with respect to any such standard or classification. Without limiting any of the foregoing, in no event shall MSCI, S&P, any of its affiliates or any third party involved in making or compiling the GICS or any GICS classification have any liability for any direct, indirect, special, punitive, consequential or any other damages (including lost profits) even if notified of the possibility of such damages.
37
Energy Index Fund
Financial Statements
Statement of Net Assets
As of August 31, 2019
The fund files its complete schedule of portfolio holdings with the Securities and Exchange Commission (SEC) for the first and third quarters of each fiscal year as an exhibit to its reports on Form N-PORT. The fund’s Form N-PORT reports are available on the SEC’s website at www.sec.gov.
| | | | | Market |
| | | | | Value· |
| | | Shares | | ($000) |
Common Stocks (99.5%)1 | | | | |
Energy Equipment & Services (10.5%) | | | | |
| Oil & Gas Drilling (0.9%) | | | | |
| Helmerich & Payne Inc. | | 324,661 | | 12,204 |
* | Transocean Ltd. | | 1,587,778 | | 7,224 |
| Patterson-UTI Energy Inc. | | 642,058 | | 5,554 |
*,^ | Valaris plc Class A | | 658,157 | | 3,067 |
| Nabors Industries Ltd. | | 1,180,581 | | 1,983 |
*,^ | Diamond Offshore Drilling Inc. | | 259,914 | | 1,687 |
* | Noble Corp. plc | | 1,039,879 | | 1,664 |
| | | | | |
| Oil & Gas Equipment & Services (9.6%) | | | | |
| Schlumberger Ltd. | | 4,014,995 | | 130,206 |
| Halliburton Co. | | 2,547,128 | | 47,988 |
| Baker Hughes a GE Co. Class A | | 1,506,269 | | 32,671 |
| TechnipFMC plc | | 1,249,922 | | 31,048 |
| National Oilwell Varco Inc. | | 1,133,686 | | 23,161 |
* | Apergy Corp. | | 236,231 | | 6,137 |
| Core Laboratories NV | | 137,026 | | 5,425 |
* | Dril-Quip Inc. | | 111,892 | | 5,130 |
* | Oceaneering International Inc. | | 314,170 | | 4,072 |
| Archrock Inc. | | 416,328 | | 4,043 |
* | Cactus Inc. Class A | | 147,672 | | 3,761 |
* | Helix Energy Solutions Group Inc. | | 456,116 | | 3,302 |
* | ProPetro Holding Corp. | | 275,598 | | 2,935 |
*,^ | McDermott International Inc. | | 605,667 | | 2,859 |
* | SEACOR Holdings Inc. | | 58,273 | | 2,737 |
* | Oil States International Inc. | | 191,646 | | 2,643 |
| US Silica Holdings Inc. | | 229,597 | | 2,335 |
| DMC Global Inc. | | 50,633 | | 2,199 |
* | C&J Energy Services Inc. | | 227,171 | | 2,172 |
* | Newpark Resources Inc. | | 310,559 | | 2,053 |
| Liberty Oilfield Services Inc. Class A | | 189,339 | | 2,039 |
* | Tidewater Inc. | | 124,541 | | 1,963 |
* | Matrix Service Co. | | 95,163 | | 1,891 |
* | Select Energy Services Inc. Class A | | 213,549 | | 1,743 |
* | Frank’s International NV | | 338,883 | | 1,474 |
* | Exterran Corp. | | 123,238 | | 1,300 |
^ | RPC Inc. | | 241,375 | | 1,282 |
* | Keane Group Inc. | | 200,946 | | 1,065 |
* | SEACOR Marine Holdings Inc. | | 75,671 | | 986 |
* | TETRA Technologies Inc. | | 543,697 | | 902 |
* | KLX Energy Services Holdings Inc. | | 88,023 | | 883 |
* | Forum Energy Technologies Inc. | | 448,785 | | 633 |
* | FTS International Inc. | | 200,907 | | 504 |
* | Nine Energy Service Inc. | | 90,118 | | 494 |
| Mammoth Energy Services Inc. | | 123,586 | | 450 |
*,^ | Covia Holdings Corp. | | 288,956 | | 433 |
* | Superior Energy Services Inc. | | 1,172,563 | | 393 |
* | NCS Multistage Holdings Inc. | | 136,544 | | 295 |
| | | | | 368,990 |
Oil, Gas & Consumable Fuels (89.0%) | | | | |
| Coal & Consumable Fuels (0.4%) | | | | |
| Peabody Energy Corp. | | 233,804 | | 4,309 |
| Arch Coal Inc. Class A | | 54,081 | | 4,141 |
* | Contura Energy Inc. | | 65,844 | | 1,896 |
* | CONSOL Energy Inc. | | 99,289 | | 1,664 |
| | | | | |
| Integrated Oil & Gas (44.1%) | | | | |
| Exxon Mobil Corp. | | 11,456,295 | | 784,527 |
| Chevron Corp. | | 5,548,333 | | 653,150 |
| Occidental Petroleum Corp. | | 2,349,560 | | 102,159 |
* | Unit Corp. | | 270,072 | | 818 |
| | | | | |
| Oil & Gas Exploration & Production (22.5%) | | | | |
| ConocoPhillips | | 3,027,069 | | 157,952 |
| EOG Resources Inc. | | 1,682,190 | | 124,802 |
| Pioneer Natural Resources Co. | | 493,297 | | 60,883 |
| Hess Corp. | | 795,033 | | 50,047 |
| Diamondback Energy Inc. | | 455,697 | | 44,695 |
| Concho Resources Inc. | | 584,676 | | 42,769 |
| Devon Energy Corp. | | 1,472,905 | | 32,389 |
| Noble Energy Inc. | | 1,398,508 | | 31,578 |
| Marathon Oil Corp. | | 2,472,514 | | 29,275 |
| Apache Corp. | | 1,106,879 | | 23,875 |
| Cabot Oil & Gas Corp. | | 1,278,249 | | 21,884 |
* | Parsley Energy Inc. Class A | | 833,593 | | 14,930 |
* | WPX Energy Inc. | | 1,253,410 | | 13,487 |
| Cimarex Energy Co. | | 301,717 | | 12,907 |
^ | Texas Pacific Land Trust | | 18,436 | | 12,079 |
| Murphy Oil Corp. | | 494,463 | | 9,014 |
* | Continental Resources Inc. | | 283,593 | | 8,281 |
| EQT Corp. | | 766,924 | | 7,800 |
* | PDC Energy Inc. | | 203,981 | | 6,497 |
| Kosmos Energy Ltd. | | 865,164 | | 5,468 |
*,^ | Chesapeake Energy Corp. | | 3,782,812 | | 5,447 |
* | Matador Resources Co. | | 343,948 | | 5,383 |
* | CNX Resources Corp. | | 612,304 | | 4,880 |
* | SRC Energy Inc. | | 784,247 | | 3,937 |
* | Magnolia Oil & Gas Corp. Class A | | 347,920 | | 3,552 |
| SM Energy Co. | | 343,959 | | 3,261 |
* | Callon Petroleum Co. | | 734,851 | | 3,020 |
* | Centennial Resource Development Inc. Class A | | 617,244 | | 2,975 |
* | Oasis Petroleum Inc. | | 950,073 | | 2,964 |
* | Southwestern Energy Co. | | 1,754,038 | | 2,771 |
| QEP Resources Inc. | | 775,063 | | 2,759 |
* | Antero Resources Corp. | | 853,719 | | 2,706 |
| Range Resources Corp. | | 718,277 | | 2,557 |
* | Carrizo Oil & Gas Inc. | | 306,791 | | 2,543 |
*,^ | Tellurian Inc. | | 335,815 | | 2,193 |
* | Whiting Petroleum Corp. | | 303,330 | | 2,011 |
* | Gran Tierra Energy Inc. | | 1,347,943 | | 1,901 |
| Berry Petroleum Corp. | | 228,423 | | 1,825 |
* | Denbury Resources Inc. | | 1,660,618 | | 1,794 |
*,^ | California Resources Corp. | | 170,565 | | 1,670 |
* | Jagged Peak Energy Inc. | | 237,139 | | 1,636 |
* | W&T Offshore Inc. | | 362,682 | | 1,589 |
*,^ | Extraction Oil & Gas Inc. | | 388,897 | | 1,567 |
* | Talos Energy Inc. | | 79,965 | | 1,523 |
* | Northern Oil and Gas Inc. | | 803,583 | | 1,479 |
* | Laredo Petroleum Inc. | | 566,485 | | 1,405 |
* | Bonanza Creek Energy Inc. | | 60,204 | | 1,358 |
* | Gulfport Energy Corp. | | 548,221 | | 1,316 |
* | Penn Virginia Corp. | | 41,894 | | 1,194 |
| Falcon Minerals Corp. | | 166,530 | | 976 |
* | HighPoint Resources Corp. | | 620,507 | | 726 |
* | SandRidge Energy Inc. | | 151,336 | | 708 |
* | Roan Resources Inc. | | 517,213 | | 584 |
* | Ring Energy Inc. | | 366,681 | | 535 |
* | Montage Resources Corp. | | 164,730 | | 491 |
* | SilverBow Resources Inc. | | 42,125 | | 366 |
* | Sanchez Energy Corp. | | 111 | | — |
| | | | | |
| Oil & Gas Refining & Marketing (10.8%) | | | | |
| Phillips 66 | | 1,315,888 | | 129,786 |
| Marathon Petroleum Corp. | | 2,000,596 | | 98,449 |
| Valero Energy Corp. | | 1,237,733 | | 93,177 |
| HollyFrontier Corp. | | 485,004 | | 21,515 |
| PBF Energy Inc. Class A | | 344,309 | | 8,160 |
| World Fuel Services Corp. | | 203,425 | | 7,811 |
| Delek US Holdings Inc. | | 232,947 | | 7,629 |
| CVR Energy Inc. | | 95,075 | | 3,782 |
* | Par Pacific Holdings Inc. | | 108,455 | | 2,358 |
* | Renewable Energy Group Inc. | | 138,457 | | 1,685 |
* | REX American Resources Corp. | | 20,970 | | 1,440 |
| Green Plains Inc. | | 159,255 | | 1,307 |
* | Clean Energy Fuels Corp. | | 578,675 | | 1,152 |
| | | | | |
| Oil & Gas Storage & Transportation (11.2%) | | | | |
| Kinder Morgan Inc. | | 5,906,483 | | 119,724 |
| ONEOK Inc. | | 1,198,137 | | 85,403 |
| Williams Cos. Inc. | | 3,517,696 | | 83,018 |
* | Cheniere Energy Inc. | | 675,238 | | 40,319 |
| Targa Resources Corp. | | 681,934 | | 24,631 |
| Plains GP Holdings LP Class A | | 452,871 | | 9,927 |
| Equitrans Midstream Corp. | | 651,961 | | 8,795 |
^ | EnLink Midstream LLC | | 817,867 | | 6,494 |
^ | Antero Midstream Corp. | | 703,810 | | 5,004 |
38
Energy Index Fund
| | | | | Market |
| | | | | Value· |
| | | Shares | | ($000) |
| Tallgrass Energy LP Class A | | 241,907 | | 4,737 |
| SemGroup Corp. Class A | | 232,167 | | 2,052 |
* | International Seaways Inc. | | 79,554 | | 1,370 |
* | Altus Midstream Co. Class A | | 277,891 | | 642 |
| | | | | 3,111,245 |
Total Common Stocks | | | | |
(Cost $5,005,448) | | | | 3,480,235 |
Temporary Cash Investment (0.9%)1 | | | | |
Money Market Fund (0.9%) | | | | |
2,3 | Vanguard Market Liquidity Fund, 2.249% (Cost $29,779) | | 297,794 | | 29,782 |
Total Investments (100.4%) | | | | |
(Cost $5,035,227) | | | | 3,510,017 |
| | | | | |
| | | | | Amount |
| | | | | ($000) |
Other Assets and Liabilities (-0.4%) | | | | |
Other Assets | | | | |
Investment in Vanguard | | | | 183 |
Receivables for Accrued Income | | | | 22,772 |
Receivables for Capital Shares Issued | | | | 861 |
Unrealized Appreciation—OTC Swap Contracts | | | | 943 |
Other Assets3 | | | | 181 |
Total Other Assets | | | | 24,940 |
Liabilities | | | | |
Payables for Investment Securities Purchased | | | | (628) |
Collateral for Securities on Loan | | | | (29,940) |
Payables for Capital Shares Redeemed | | | | (1,013) |
Payables to Vanguard | | | | (1,305) |
Unrealized Depreciation—OTC Swap Contracts | | | | (153) |
Other Liabilities | | | | (4,559) |
Total Liabilities | | | | (37,598) |
Net Assets (100%) | | | | 3,497,359 |
At August 31, 2019, net assets consisted of:
| | Amount |
| | ($000) |
Paid-in Capital | | 5,727,180 |
Total Distributable Earnings (Loss) | | (2,229,821) |
Net Assets | | 3,497,359 |
| | |
ETF Shares—Net Assets | | |
Applicable to 39,986,855 outstanding $.001 par value shares of beneficial interest (unlimited authorization) | | 3,029,142 |
Net Asset Value Per Share—ETF Shares | | $75.75 |
| | |
Admiral Shares—Net Assets | | |
Applicable to 12,372,497 outstanding $.001 par value shares of beneficial interest (unlimited authorization) | | 468,217 |
Net Asset Value Per Share—Admiral Shares | | $37.84 |
· See Note A in Notes to Financial Statements.
* Non-income-producing security.
^ Includes partial security positions on loan to broker-dealers. The total value of securities on loan is $27,184,000.
1 The fund invests a portion of its cash reserves in equity markets through the use of swap contracts. After giving effect to swap investments, the fund’s effective common stock and temporary cash investment positions represent 100.0% and 0.4%, respectively, of net assets.
2 Affiliated money market fund available only to Vanguard funds and certain trusts and accounts managed by Vanguard. Rate shown is the 7-day yield.
3 Includes $29,940,000 of collateral received for securities on loan, of which $29,759,000 is held in Vanguard Market Liquidity Fund and $181,000 is held in cash.
OTC—Over-the-Counter.
Derivative Financial Instruments Outstanding as of Period End |
|
Over-the-Counter Total Return Swaps |
| | | | | | | | Floating | | | | | |
| | | | | | | | Interest Rate | | Value and | | Value and | |
| | | | | | Notional | | Received | | Unrealized | | Unrealized | |
| | Termination | | | | Amount | | (Paid) | 1 | Appreciation | | (Depreciation | ) |
Reference Entity | | Date | | Counterparty | | ($000 | ) | (%) | | ($000 | ) | ($000 | ) |
Occidental Petroleum Corp. | | 2/4/20 | | GSI | | 13,188 | | (2.182) | | — | | (153 | ) |
Tallgrass Energy LP Class A | | 2/4/20 | | GSI | | 3,851 | | (2.182) | | 943 | | — | |
| | | | | | | | | | 943 | | (153 | ) |
1 Payment received/paid monthly.
GSI—Goldman Sachs International.
At August 31, 2019, a counterparty had deposited in a segregated account securities with a value of $674,000 in connection with open over-the-counter swap contracts.
See accompanying Notes, which are an integral part of the Financial Statements.
39
Energy Index Fund
Statement of Operations
| | Year Ended | |
| | August 31, 2019 | |
| | ($000 | ) |
Investment Income | | | |
Income | | | |
Dividends | | 134,660 | |
Interest1 | | 127 | |
Securities Lending—Net | | 389 | |
Total Income | | 135,176 | |
Expenses | | | |
The Vanguard Group—Note B | | | |
Investment Advisory Services | | 633 | |
Management and Administrative—ETF Shares | | 2,443 | |
Management and Administrative—Admiral Shares | | 400 | |
Marketing and Distribution—ETF Shares | | 168 | |
Marketing and Distribution—Admiral Shares | | 34 | |
Custodian Fees | | 139 | |
Auditing Fees | | 33 | |
Shareholders’ Reports—ETF Shares | | 300 | |
Shareholders’ Reports—Admiral Shares | | 9 | |
Trustees’ Fees and Expenses | | 2 | |
Total Expenses | | 4,161 | |
Net Investment Income | | 131,015 | |
Realized Net Gain (Loss) | | | |
Investment Securities Sold1,2 | | (16,113 | ) |
Futures Contracts | | (332 | ) |
Swap Contracts | | (2,812 | ) |
Realized Net Gain (Loss) | | (19,257 | ) |
Change in Unrealized Appreciation (Depreciation) | | | |
Investment Securities1 | | (1,259,678 | ) |
Futures Contracts | | — | |
Swap Contracts | | 790 | |
Change in Unrealized Appreciation (Depreciation) | | (1,258,888 | ) |
Net Increase (Decrease) in Net Assets Resulting from Operations | | (1,147,130 | ) |
1 Interest income, realized net gain (loss), and change in unrealized appreciation (depreciation) from an affiliated company of the fund were $127,000, ($14,000), and ($1,000), respectively. Purchases and sales are for temporary cash investment purposes.
2 Includes $67,928,000 of net gain (loss) resulting from in-kind redemptions; such gain (loss) is not taxable to the fund.
Statement of Changes in Net Assets
| | Year Ended August 31, | |
| | 2019 | | 2018 | |
| | ($000 | ) | ($000 | ) |
Increase (Decrease) in Net Assets | | | | | |
Operations | | | | | |
Net Investment Income | | 131,015 | | 121,288 | |
Realized Net Gain (Loss) | | (19,257 | ) | 39,542 | |
Change in Unrealized Appreciation (Depreciation) | | (1,258,888 | ) | 800,610 | |
Net Increase (Decrease) in Net Assets Resulting from Operations | | (1,147,130 | ) | 961,440 | |
Distributions | | | | | |
Net Investment Income | | | | | |
ETF Shares | | (112,343 | ) | (124,038 | ) |
Admiral Shares | | (16,737 | ) | (17,765 | ) |
Realized Capital Gain | | | | | |
ETF Shares | | — | | — | |
Admiral Shares | | — | | — | |
Total Distributions | | (129,080 | ) | (141,803 | ) |
Capital Share Transactions | | | | | |
ETF Shares | | (148,483 | ) | (86,473 | ) |
Admiral Shares | | (7,983 | ) | 18,737 | |
Net Increase (Decrease) from Capital Share Transactions | | (156,466 | ) | (67,736 | ) |
Total Increase (Decrease) | | (1,432,676 | ) | 751,901 | |
Net Assets | | | | | |
Beginning of Period | | 4,930,035 | | 4,178,134 | |
End of Period | | 3,497,359 | | 4,930,035 | |
See accompanying Notes, which are an integral part of the Financial Statements.
40
Energy Index Fund
Financial Highlights
ETF Shares
For a Share Outstanding Throughout Each Period | | Year Ended August 31, | |
| 2019 | | 2018 | | 2017 | | 2016 | | 2015 | |
Net Asset Value, Beginning of Period | | $103.13 | | $85.71 | | $95.06 | | $93.86 | | $142.26 | |
Investment Operations | | | | | | | | | | | |
Net Investment Income | | 2.769 | 1 | 2.519 | 1 | 2.819 | 1,2 | 2.470 | | 2.953 | 1 |
Net Realized and Unrealized Gain (Loss) on Investments | | (27.449 | ) | 17.837 | | (9.801 | ) | 2.587 | | (49.144 | ) |
Total from Investment Operations | | (24.680 | ) | 20.356 | | (6.982 | ) | 5.057 | | (46.191 | ) |
Distributions | | | | | | | | | | | |
Dividends from Net Investment Income | | (2.700 | ) | (2.936 | ) | (2.368 | ) | (3.857 | ) | (2.209 | ) |
Distributions from Realized Capital Gains | | — | | — | | — | | — | | — | |
Total Distributions | | (2.700 | ) | (2.936 | ) | (2.368 | ) | (3.857 | ) | (2.209 | ) |
Net Asset Value, End of Period | | $75.75 | | $103.13 | | $85.71 | | $95.06 | | $93.86 | |
| | | | | | | | | | | |
Total Return | | -24.34% | | 24.06% | | -7.55% | | 5.82% | | -32.70% | |
| | | | | | | | | | | |
Ratios/Supplemental Data | | | | | | | | | | | |
Net Assets, End of Period (Millions) | | $3,029 | | $4,288 | | $3,656 | | $3,944 | | $3,736 | |
Ratio of Total Expenses to Average Net Assets | | 0.10% | | 0.10% | | 0.10% | | 0.10% | | 0.10% | |
Ratio of Net Investment Income to Average Net Assets | | 3.15% | | 2.56% | | 2.93%2 | | 2.86% | | 2.65% | |
Portfolio Turnover Rate3 | | 7% | | 5% | | 11% | | 15% | | 4% | |
1 Calculated based on average shares outstanding.
2 Net investment income per share and the ratio of net investment income to average net assets include $.453 and 0.47%, respectively, from income received as a result of General Electric Co. and Baker Hughes Inc. merger in July 2017.
3 Excludes the value of portfolio securities received or delivered as a result of in-kind purchases or redemptions of the fund’s capital shares, including ETF Creation Units.
See accompanying Notes, which are an integral part of the Financial Statements.
41
Energy Index Fund
Financial Highlights
Admiral Shares
For a Share Outstanding Throughout Each Period | | Year Ended August 31, | |
| 2019 | | 2018 | | 2017 | | 2016 | | 2015 | |
Net Asset Value, Beginning of Period | | $51.52 | | $42.82 | | $47.49 | | $46.89 | | $71.06 | |
Investment Operations | | | | | | | | | | | |
Net Investment Income | | 1.388 | 1 | 1.249 | 1 | 1.375 | 1,2 | 1.234 | | 1.495 | 1 |
Net Realized and Unrealized Gain (Loss) on Investments | | (13.720 | ) | 8.916 | | (4.863 | ) | 1.293 | | (24.561 | ) |
Total from Investment Operations | | (12.332 | ) | 10.165 | | (3.488 | ) | 2.527 | | (23.066 | ) |
Distributions | | | | | | | | | | | |
Dividends from Net Investment Income | | (1.348 | ) | (1.465 | ) | (1.182 | ) | (1.927 | ) | (1.104 | ) |
Distributions from Realized Capital Gains | | — | | — | | — | | — | | — | |
Total Distributions | | (1.348 | ) | (1.465 | ) | (1.182 | ) | (1.927 | ) | (1.104 | ) |
Net Asset Value, End of Period | | $37.84 | | $51.52 | | $42.82 | | $47.49 | | $46.89 | |
| | | | | | | | | | | |
Total Return3 | | -24.33% | | 24.06% | | -7.56% | | 5.83% | | -32.66% | |
| | | | | | | | | | | |
Ratios/Supplemental Data | | | | | | | | | | | |
Net Assets, End of Period (Millions) | | $468 | | $642 | | $523 | | $894 | | $733 | |
Ratio of Total Expenses to Average Net Assets | | 0.10% | | 0.10% | | 0.10% | | 0.10% | | 0.10% | |
Ratio of Net Investment Income to Average Net Assets | | 3.15% | | 2.56% | | 2.93%2 | | 2.86% | | 2.65% | |
Portfolio Turnover Rate4 | | 7% | | 5% | | 11% | | 15% | | 4% | |
1 Calculated based on average shares outstanding.
2 Net investment income per share and the ratio of net investment income to average net assets include $.228 and 0.47%, respectively, from income received as a result of General Electric Co. and Baker Hughes Inc. merger in July 2017.
3 Total returns do not include account service fees that may have applied in the periods shown. Fund prospectuses provide information about any applicable account service fees.
4 Excludes the value of portfolio securities received or delivered as a result of in-kind purchases or redemptions of the fund’s capital shares, including ETF Creation Units.
See accompanying Notes, which are an integral part of the Financial Statements.
42
Energy Index Fund
Notes to Financial Statements
Vanguard Energy Index Fund is registered under the Investment Company Act of 1940 as an open-end investment company, or mutual fund. The fund offers two classes of shares: ETF Shares and Admiral Shares. Each of the share classes has different eligibility and minimum purchase requirements, and is designed for different types of investors. ETF Shares are listed for trading on NYSE Arca; they can be purchased and sold through a broker.
A. The following significant accounting policies conform to generally accepted accounting principles for U.S. investment companies. The fund consistently follows such policies in preparing its financial statements.
1. Security Valuation: Securities are valued as of the close of trading on the New York Stock Exchange (generally 4 p.m., Eastern time) on the valuation date. Equity securities are valued at the latest quoted sales prices or official closing prices taken from the primary market in which each security trades; such securities not traded on the valuation date are valued at the mean of the latest quoted bid and asked prices. Securities for which market quotations are not readily available, or whose values have been materially affected by events occurring before the fund’s pricing time but after the close of the securities’ primary markets, are valued by methods deemed by the board of trustees to represent fair value. Investments in Vanguard Market Liquidity Fund are valued at that fund’s net asset value.
2. Futures Contracts: The fund uses index futures contracts to a limited extent, with the objectives of maintaining full exposure to the stock market, maintaining liquidity, and minimizing transaction costs. The fund may purchase futures contracts to immediately invest incoming cash in the market, or sell futures in response to cash outflows, thereby simulating a fully invested position in the underlying index while maintaining a cash balance for liquidity. The primary risks associated with the use of futures contracts are imperfect correlation between changes in market values of stocks held by the fund and the prices of futures contracts, and the possibility of an illiquid market. Counterparty risk involving futures is mitigated because a regulated clearinghouse is the counterparty instead of the clearing broker. To further mitigate counterparty risk, the fund trades futures contracts on an exchange, monitors the financial strength of its clearing brokers and clearinghouse, and has entered into clearing agreements with its clearing brokers. The clearinghouse imposes initial margin requirements to secure the fund’s performance and requires daily settlement of variation margin representing changes in the market value of each contract. Any assets pledged as initial margin for open contracts are noted in the Statement of Net Assets.
Futures contracts are valued at their quoted daily settlement prices. The notional amounts of the contracts are not recorded in the Statement of Net Assets. Fluctuations in the value of the contracts are recorded in the Statement of Net Assets as an asset (liability) and in the Statement of Operations as unrealized appreciation (depreciation) until the contracts are closed, when they are recorded as realized futures gains (losses).
During the year ended August 31, 2019, the fund’s average investments in long and short futures contracts represented less than 1% and 0% of net assets, respectively, based on the average of the notional amounts at each quarter-end during the period. The fund had no open futures contracts at August 31, 2019.
3. Swap Contracts: The fund has entered into equity swap contracts to earn the total return on selected reference stocks in the fund’s target index. Under the terms of the swaps, the fund receives the total return on the referenced stock (i.e., receiving the increase or paying the decrease in value of the selected reference stock and receiving the equivalent of any dividends in respect of the selected referenced stock) over a specified period of time, applied to a notional amount that represents the value of a designated number of shares of the selected reference stock at the beginning of the equity swap contract. The fund also pays a floating rate that is based on short-term interest rates, applied to the notional amount. At the same time, the fund generally invests an amount approximating the notional amount of the swap in high-quality temporary cash investments.
The notional amounts of swap contracts are not recorded in the Statement of Net Assets. Swaps are valued daily based on market quotations received from independent pricing services or recognized dealers and the change in value is recorded in the Statement of Net Assets as an asset (liability) and in the Statement of Operations as unrealized appreciation (depreciation) until termination of the swap, at which time realized gain (loss) is recorded.
43
Energy Index Fund
A risk associated with all types of swaps is the possibility that a counterparty may default on its obligation to pay net amounts due to the fund. The fund’s maximum amount subject to counterparty risk is the unrealized appreciation on the swap contract. The fund mitigates its counterparty risk by entering into swaps only with a diverse group of prequalified counterparties, monitoring their financial strength, entering into master netting arrangements with its counterparties, and requiring its counterparties to transfer collateral as security for their performance. In the absence of a default, the collateral pledged or received by the fund cannot be repledged, resold, or rehypothecated. In the event of a counterparty’s default (including bankruptcy), the fund may terminate any swap contracts with that counterparty, determine the net amount owed by either party in accordance with its master netting arrangements, and sell or retain any collateral held up to the net amount owed to the fund under the master netting arrangements. The swap contracts contain provisions whereby a counterparty may terminate open contracts if the fund net assets decline below a certain level, triggering a payment by the fund if the fund is in a net liability position at the time of the termination. The payment amount would be reduced by any collateral the fund has pledged. Any securities pledged as collateral for open contracts are noted in the Statement of Net Assets. The value of collateral received or pledged is compared daily to the value of the swap contracts exposure with each counterparty, and any difference, if in excess of a specified minimum transfer amount, is adjusted and settled within two business days.
During the year ended August 31, 2019, the fund’s average amounts of investments in credit protection sold, credit protection purchased, interest rate swaps, cross currency swaps each represented less than 1% of net assets, based on the average of notional amounts at each quarter-end during the period.
4. Federal Income Taxes: The fund intends to continue to qualify as a regulated investment company and distribute all of its taxable income. Management has analyzed the fund’s tax positions taken for all open federal income tax years (August 31, 2016–2019), and has concluded that no provision for federal income tax is required in the fund’s financial statements.
5. Distributions: Distributions to shareholders are recorded on the ex-dividend date. Distributions are determined on a tax basis and may differ from net investment income and realized capital gains for financial reporting purposes.
6. Securities Lending: To earn additional income, the fund lends its securities to qualified institutional borrowers. Security loans are subject to termination by the fund at any time, and are required to be secured at all times by collateral in an amount at least equal to the market value of securities loaned. Daily market fluctuations could cause the value of loaned securities to be more or less than the value of the collateral received. When this occurs, the collateral is adjusted and settled before the opening of the market on the next business day. The fund further mitigates its counterparty risk by entering into securities lending transactions only with a diverse group of prequalified counterparties, monitoring their financial strength, and entering into master securities lending agreements with its counterparties. The master securities lending agreements provide that, in the event of a counterparty’s default (including bankruptcy), the fund may terminate any loans with that borrower, determine the net amount owed, and sell or retain the collateral up to the net amount owed to the fund; however, such actions may be subject to legal proceedings. While collateral mitigates counterparty risk, in the event of a default, the fund may experience delays and costs in recovering the securities loaned. The fund invests cash collateral received in Vanguard Market Liquidity Fund, and records a liability in the Statement of Net Assets for the return of the collateral, during the period the securities are on loan. Securities lending income represents fees charged to borrowers plus income earned on invested cash collateral, less expenses associated with the loan. During the term of the loan, the fund is entitled to all distributions made on or in respect of the loaned securities.
7. Credit Facility: The fund and certain other funds managed by The Vanguard Group (“Vanguard”) participate in a $4.3 billion committed credit facility provided by a syndicate of lenders pursuant to a credit agreement that may be renewed annually; each fund is individually liable for its borrowings, if any, under the credit facility. Borrowings may be utilized for temporary and emergency purposes, and are subject to the fund’s regulatory and contractual borrowing restrictions. The participating funds are charged administrative fees and an annual commitment fee of 0.10% of the undrawn amount of the facility; these fees are allocated to the funds based on a method approved by the fund’s board of trustees and included in Management and Administrative expenses on the fund’s Statement of Operations. Any borrowings under this facility bear interest at a rate based upon the higher of the one-month London Interbank Offered Rate, federal funds effective rate, or overnight bank funding rate plus an agreed-upon spread.
The fund had no borrowings outstanding at August 31, 2019, or at any time during the period then ended.
44
Energy Index Fund
8. Other: Dividend income is recorded on the ex-dividend date. Interest income includes income distributions received from Vanguard Market Liquidity Fund and is accrued daily. Security transactions are accounted for on the date securities are bought or sold. Costs used to determine realized gains (losses) on the sale of investment securities are those of the specific securities sold.
Each class of shares has equal rights as to assets and earnings, except that each class separately bears certain class-specific expenses related to maintenance of shareholder accounts (included in Management and Administrative expenses) and shareholder reporting. Marketing and distribution expenses are allocated to each class of shares based on a method approved by the board of trustees. Income, other non-class-specific expenses, and gains and losses on investments are allocated to each class of shares based on its relative net assets.
B. In accordance with the terms of a Funds’ Service Agreement (the “FSA”) between Vanguard and the fund, Vanguard furnishes to the fund investment advisory, corporate management, administrative, marketing, and distribution services at Vanguard’s cost of operations (as defined by the FSA). These costs of operations are allocated to the fund based on methods and guidelines approved by the board of trustees. Vanguard does not require reimbursement in the current period for certain costs of operations (such as deferred compensation/benefits and risk/insurance costs); the fund’s liability for these costs of operations is included in Payables to Vanguard on the Statement of Net Assets. All other costs of operations payable to Vanguard are generally settled twice a month.
Upon the request of Vanguard, the fund may invest up to 0.40% of its net assets as capital in Vanguard. At August 31, 2019, the fund had contributed to Vanguard capital in the amount of $183,000, representing 0.01% of the fund’s net assets and 0.07% of Vanguard’s capital received pursuant to the FSA. The fund’s trustees and officers are also directors and employees, respectively, of Vanguard.
C. Various inputs may be used to determine the value of the fund’s investments. These inputs are summarized in three broad levels for financial statement purposes. The inputs or methodologies used to value securities are not necessarily an indication of the risk associated with investing in those securities.
Level 1—Quoted prices in active markets for identical securities.
Level 2—Other significant observable inputs (including quoted prices for similar securities, interest rates, prepayment speeds, credit risk, etc.).
Level 3—Significant unobservable inputs (including the fund’s own assumptions used to determine the fair value of investments). Any investments valued with significant unobservable inputs are noted on the Statement of Net Assets.
The following table summarizes the market value of the fund’s investments and derivatives as of August 31, 2019, based on the inputs used to value them:
| | Level 1 | | Level 2 | | Level 3 |
Investments | | ($000 | ) | ($000 | ) | ($000) |
Common Stocks | | 3,480,235 | | — | | — |
Temporary Cash Investments | | 29,782 | | — | | — |
Swap Contracts—Assets | | — | | 943 | | — |
Swap Contracts—Liabilities | | — | | (153 | ) | — |
Total | | 3,510,017 | | 790 | | — |
D. Permanent differences between book-basis and tax-basis components of net assets are reclassified among capital accounts in the financial statements to reflect their tax character. These reclassifications have no effect on net assets or net asset value per share. As of period end, permanent differences primarily attributable to the accounting for in-kind redemptions, swap agreements, and the expiration of capital loss carryforwards were reclassified between the following accounts:
| | Amount |
| | ($000) |
Paid-in Capital | | 37,229 |
Total Distributable Earnings (Loss) | | (37,229) |
45
Energy Index Fund
Temporary differences between book-basis and tax-basis components of total distributable earnings (loss) arise when certain items of income, gain, or loss are recognized in different periods for financial statement and tax purposes; these differences will reverse at some time in the future. The differences are primarily related to the tax deferral on wash sales and the realization of unrealized gains or losses on certain swap agreements. As of period end, the tax-basis components of total distributable earnings (loss) are detailed in the table as follows:
| | Amount |
| | ($000) |
Undistributed Ordinary Income | | 25,658 |
Undistributed Long-term Gains | | — |
Capital Loss Carryforwards (Non-expiring) | | (729,136) |
Net Unrealized Gains (Losses) | | (1,525,210) |
As of August 31, 2019, gross unrealized appreciation and depreciation for investments and derivatives based on cost for U.S. federal income tax purposes were as follows:
| | Amount |
| | ($000) |
Tax Cost | | 5,035,227 |
Gross Unrealized Appreciation | | 88,573 |
Gross Unrealized Depreciation | | (1,613,783) |
Net Unrealized Appreciation (Depreciation) | | (1,525,210) |
E. During the year ended August 31, 2019, the fund purchased $1,019,927,000 of investment securities and sold $1,191,160,000 of investment securities, other than temporary cash investments. Purchases and sales include $592,289,000 and $891,391,000, respectively, in connection with in-kind purchases and redemptions of the fund’s capital shares.
F. Capital share transactions for each class of shares were:
| | Year Ended August 31, | |
| | | | 2019 | | | | | 2018 | |
| | Amount | | Shares | | | Amount | | Shares | |
| | ($000 | ) | (000 | ) | | ($000 | ) | (000 | ) |
ETF Shares | | | | | | | | | | |
Issued | | 743,090 | | 8,685 | | | 746,982 | | 7,479 | |
Issued in Lieu of Cash Distributions | | — | | — | | | — | | — | |
Redeemed | | (891,573 | ) | (10,275 | ) | | (833,455 | ) | (8,550 | ) |
Net Increase (Decrease)—ETF Shares | | (148,483 | ) | (1,590 | ) | | (86,473 | ) | (1,071 | ) |
Admiral Shares | | | | | | | | | | |
Issued | | 174,793 | | 4,125 | | | 230,387 | | 4,568 | |
Issued in Lieu of Cash Distributions | | 15,012 | | 333 | | | 15,446 | | 324 | |
Redeemed | | (197,788 | ) | (4,550 | ) | | (227,096 | ) | (4,632 | ) |
Net Increase (Decrease)—Admiral Shares | | (7,983 | ) | (92 | ) | | 18,737 | | 260 | |
G. Management has determined that no events or transactions occurred subsequent to August 31, 2019, that would require recognition or disclosure in these financial statements.
46
Financials Index Fund
Performance Summary
All of the returns in this report represent past performance, which is not a guarantee of future results that may be achieved by the fund. (Current performance may be lower or higher than the performance data cited. For performance data current to the most recent month-end, visit our website at vanguard.com/performance.) Note, too, that both investment returns and principal value can fluctuate widely, so an investor’s shares, when sold, could be worth more or less than their original cost. The returns shown do not reflect taxes that a shareholder would pay on fund distributions or on the sale of fund shares.
Cumulative Performance: August 31, 2009–August 31, 2019
Initial Investment of $10,000
| | | | Average Annual Total Returns | | Final Value |
| | | | Periods Ended August 31, 2019 | | of a $10,000 |
| | | | One Year | | Five Years | | Ten Years | | Investment |

| | Financials Index Fund ETF Shares Net Asset Value | | -3.85% | | 9.44% | | 10.75% | | $27,774 |
| | Financials Index Fund ETF Shares Market Price | | -3.89 | | 9.42 | | 10.74 | | 27,739 |

| | Spliced US IMI/Financials 25/50 | | -3.78 | | 9.53 | | 10.86 | | 28,041 |

| | MSCI US IMI/2500 | | 1.32 | | 9.63 | | 13.41 | | 35,213 |
Spliced US IMI/Financials 25/50: MSCI US IMI/Financials through February 28, 2010; MSCI US IMI/Financials 25/50 thereafter.
| | | | | | | | Final Value |
| | | | | | | | of a $100,000 |
| | One Year | | Five Years | | Ten Years | | Investment |
Financials Index Fund Admiral Shares | | -3.87% | | 9.44% | | 10.76% | | $277,806 |
Spliced US IMI/Financials 25/50 | | -3.78 | | 9.53 | | 10.86 | | 280,410 |
MSCI US IMI/2500 | | 1.32 | | 9.63 | | 13.41 | | 352,130 |
Cumulative Returns: ETF Shares, August 31, 2009–August 31, 2019
| | | | One Year | | Five Years | | Ten Years |
Financials Index Fund ETF Shares Market Price | | | | -3.89% | | 56.82% | | 177.39% |
Financials Index Fund ETF Shares Net Asset Value | | | | -3.85 | | 56.97 | | 177.74 |
Spliced US IMI/Financials 25/50 | | | | -3.78 | | 57.65 | | 180.41 |
For the ETF Shares, the market price is determined by the midpoint of the bid-offer spread as of the closing time of the New York Stock Exchange (generally 4 p.m., Eastern time). The net asset value is also determined as of the NYSE closing time. For more information about how the ETF Shares’ market prices have compared with their net asset value, visit vanguard.com, select your ETF, and then select the Price and Performance tab. The ETF premium/discount analysis there shows the percentages of days on which the ETF Shares’ market price was above or below the NAV.
See Financial Highlights for dividend and capital gains information.
47
Financials Index Fund
Sector Diversification
As of August 31, 2019
Asset Management & Custody Banks | | 6.0 | % |
Consumer Finance | | 5.7 | |
Diversified Banks | | 27.6 | |
Financial Exchanges & Data | | 8.2 | |
Insurance Brokers | | 4.1 | |
Investment Banking & Brokerage | | 6.0 | |
Life & Health Insurance | | 4.5 | |
Mortgage REITs | | 1.8 | |
Multi-line Insurance | | 2.3 | |
Multi-Sector Holdings | | 7.2 | |
Other Diversified Financial Services | | 0.4 | |
Property & Casualty Insurance | | 9.2 | |
Regional Banks | | 14.5 | |
Reinsurance | | 1.1 | |
Thrifts & Mortgage Finance | | 1.4 | |
The table reflects the fund’s equity exposure, based on its investments in stocks and stock index futures. Any holdings in short-term reserves are excluded. Sector categories are based on the Global Industry Classification Standard (“GICS”), except for the “Other” category (if applicable), which includes securities that have not been provided a GICS classification as of the effective reporting period.
The Global Industry Classification Standard (“GICS”) was developed by and is the exclusive property and a service mark of MSCI Inc. (“MSCI”) and Standard and Poor’s, a division of McGraw-Hill Companies, Inc. (“S&P”), and is licensed for use by Vanguard. Neither MSCI, S&P nor any third party involved in making or compiling the GICS or any GICS classification makes any express or implied warranties or representations with respect to such standard or classification (or the results to be obtained by the use thereof), and all such parties hereby expressly disclaim all warranties of originality, accuracy, completeness, merchantability or fitness for a particular purpose with respect to any such standard or classification. Without limiting any of the foregoing, in no event shall MSCI, S&P, any of its affiliates or any third party involved in making or compiling the GICS or any GICS classification have any liability for any direct, indirect, special, punitive, consequential or any other damages (including lost profits) even if notified of the possibility of such damages.
48
Financials Index Fund
Financial Statements
Statement of Net Assets
As of August 31, 2019
The fund files its complete schedule of portfolio holdings with the Securities and Exchange Commission (SEC) for the first and third quarters of each fiscal year as an exhibit to its reports on Form N-PORT. The fund’s Form N-PORT reports are available on the SEC’s website at www.sec.gov.
| | | | | | Market | |
| | | | | | Value· | |
| | | | Shares | | ($000 | ) |
Common Stocks (99.9%)1 | | | | | |
Banks (42.1%) | | | | | |
| | JPMorgan Chase & Co. | | 6,683,836 | | 734,286 | |
| | Bank of America Corp. | | 18,611,137 | | 511,992 | |
| | Wells Fargo & Co. | | 8,797,073 | | 409,680 | |
| | Citigroup Inc. | | 4,764,607 | | 306,602 | |
| | US Bancorp | | 3,116,049 | | 164,185 | |
| | PNC Financial Services Group Inc. | | 930,084 | | 119,916 | |
| | BB&T Corp. | | 1,577,925 | | 75,188 | |
| | SunTrust Banks Inc. | | 914,410 | | 56,245 | |
| | Fifth Third Bancorp | | 1,512,981 | | 40,018 | |
| | M&T Bank Corp. | | 267,398 | | 39,096 | |
| | KeyCorp | | 2,077,497 | | 34,486 | |
| | Citizens Financial Group Inc. | | 945,382 | | 31,897 | |
| | First Republic Bank | | 345,168 | | 30,968 | |
| | Regions Financial Corp. | | 2,087,786 | | 30,523 | |
| | Huntington Bancshares Inc. | | 2,155,843 | | 28,565 | |
* | | SVB Financial Group | | 107,223 | | 20,868 | |
| | Comerica Inc. | | 317,635 | | 19,582 | |
| | Zions Bancorp NA | | 376,093 | | 15,454 | |
| | Signature Bank | | 113,711 | | 13,264 | |
| | East West Bancorp Inc. | | 300,165 | | 12,346 | |
| | TCF Financial Corp. | | 319,150 | | 12,306 | |
| | People’s United Financial Inc. | | 819,954 | | 11,783 | |
| | Commerce Bancshares Inc. | | 204,776 | | 11,687 | |
| | Synovus Financial Corp. | | 324,520 | | 11,533 | |
| | Popular Inc. | | 199,042 | | 10,464 | |
| | First Horizon National Corp. | | 648,367 | | 10,264 | |
| | Cullen/Frost Bankers Inc. | | 123,388 | | 10,242 | |
| | Western Alliance Bancorp | | 205,338 | | 8,916 | |
| | Prosperity Bancshares Inc. | | 136,665 | | 8,872 | |
| | Webster Financial Corp. | | 190,025 | | 8,506 | |
| | CIT Group Inc. | | 198,531 | | 8,455 | |
| | PacWest Bancorp | | 244,817 | | 8,343 | |
| | Sterling Bancorp | | 431,677 | | 8,232 | |
| | Pinnacle Financial Partners Inc. | | 151,269 | | 7,967 | |
| | United Bankshares Inc. | | 211,173 | | 7,788 | |
| | IBERIABANK Corp. | | 111,731 | | 7,708 | |
| | First Financial Bankshares Inc. | | 251,522 | | 7,702 | |
| | Wintrust Financial Corp. | | 117,101 | | 7,357 | |
| | FNB Corp. | | 670,376 | | 7,207 | |
| | Valley National Bancorp | | 684,288 | | 7,192 | |
| | First Hawaiian Inc. | | 278,958 | | 7,169 | |
| | Umpqua Holdings Corp. | | 452,895 | | 7,115 | |
| | Bank of Hawaii Corp. | | 84,470 | | 6,984 | |
| | Glacier Bancorp Inc. | | 174,908 | | 6,942 | |
| | Bank OZK | | 265,037 | | 6,838 | |
| | Associated Banc-Corp | | 339,537 | | 6,533 | |
| | BankUnited Inc. | | 203,885 | | 6,475 | |
| | Community Bank System Inc. | | 106,057 | | 6,468 | |
| | Hancock Whitney Corp. | | 176,592 | | 6,200 | |
| | First Citizens BancShares Inc. Class A | | 13,931 | | 6,194 | |
| | UMB Financial Corp. | | 96,537 | | 6,016 | |
| | Home BancShares Inc. | | 330,733 | | 5,861 | |
| | BancorpSouth Bank | | 209,415 | | 5,778 | |
* | | Texas Capital Bancshares Inc. | | 103,622 | | 5,583 | |
| | Atlantic Union Bankshares Corp. | | 153,178 | | 5,531 | |
| | Fulton Financial Corp. | | 346,394 | | 5,525 | |
| | CenterState Bank Corp. | | 241,000 | | 5,451 | |
| | Old National Bancorp | | 323,720 | | 5,438 | |
| | Investors Bancorp Inc. | | 487,971 | | 5,416 | |
| | South State Corp. | | 73,083 | | 5,377 | |
| | Cathay General Bancorp | | 158,376 | | 5,257 | |
| | Columbia Banking System Inc. | | 151,525 | | 5,229 | |
| | BOK Financial Corp. | | 66,245 | | 5,044 | |
| | Ameris Bancorp | | 136,545 | | 4,805 | |
| | Independent Bank Corp. | | 70,694 | | 4,780 | |
| | CVB Financial Corp. | | 232,319 | | 4,779 | |
| | Simmons First National Corp. Class A | | 197,868 | | 4,749 | |
| | First Financial Bancorp | | 201,604 | | 4,722 | |
| | First Midwest Bancorp Inc. | | 230,074 | | 4,417 | |
| | First BanCorp (XNYS) | | 450,516 | | 4,316 | |
| | United Community Banks Inc. | | 161,560 | | 4,267 | |
| | Trustmark Corp. | | 126,006 | | 4,118 | |
| | Cadence BanCorp Class A | | 265,528 | | 4,081 | |
| | LegacyTexas Financial Group Inc. | | 100,890 | | 4,076 | |
| | International Bancshares Corp. | | 114,473 | | 4,074 | |
| | Towne Bank | | 150,292 | | 3,948 | |
| | Banner Corp. | | 72,650 | | 3,917 | |
| | WesBanco Inc. | | 112,152 | | 3,838 | |
| | Hilltop Holdings Inc. | | 155,705 | | 3,698 | |
| | First Merchants Corp. | | 102,369 | | 3,657 | |
| | Great Western Bancorp Inc. | | 117,382 | | 3,502 | |
| | Hope Bancorp Inc. | | 260,960 | | 3,499 | |
| | Independent Bank Group Inc. | | 71,518 | | 3,498 | |
| | Pacific Premier Bancorp Inc. | | 116,302 | | 3,426 | |
| | Westamerica Bancorporation | | 55,430 | | 3,415 | |
| | First Interstate BancSystem Inc. Class A | | 84,042 | | 3,278 | |
| | Renasant Corp. | | 96,669 | | 3,170 | |
| | NBT Bancorp Inc. | | 90,034 | | 3,148 | |
| | Heartland Financial USA Inc. | | 68,015 | | 2,974 | |
| | ServisFirst Bancshares Inc. | | 93,196 | | 2,833 | |
| | Park National Corp. | | 30,867 | | 2,781 | |
| | Eagle Bancorp Inc. | | 66,909 | | 2,726 | |
| | Berkshire Hills Bancorp Inc. | | 89,898 | | 2,637 | |
| | City Holding Co. | | 33,782 | | 2,512 | |
| | First Busey Corp. | | 101,926 | | 2,497 | |
| | First Commonwealth Financial Corp. | | 200,673 | | 2,482 | |
* | | Seacoast Banking Corp. of Florida | | 104,547 | | 2,440 | |
| | S&T Bancorp Inc. | | 71,219 | | 2,437 | |
| | Sandy Spring Bancorp Inc. | | 72,338 | | 2,422 | |
| | Brookline Bancorp Inc. | | 165,547 | | 2,324 | |
| | Tompkins Financial Corp. | | 28,452 | | 2,251 | |
| | Lakeland Financial Corp. | | 52,976 | | 2,242 | |
| | OFG Bancorp | | 107,492 | | 2,206 | |
| | Southside Bancshares Inc. | | 65,313 | | 2,151 | |
| | Veritex Holdings Inc. | | 90,899 | | 2,145 | |
| | First Bancorp (XNGS) | | 60,324 | | 2,125 | |
| | Enterprise Financial Services Corp. | | 53,486 | | 2,108 | |
| | Heritage Financial Corp. | | 77,182 | | 2,021 | |
| | TriCo Bancshares | | 55,767 | | 1,972 | |
| | BancFirst Corp. | | 36,478 | | 1,961 | |
| | National Bank Holdings Corp. Class A | | 59,587 | | 1,945 | |
| | Boston Private Financial Holdings Inc. | | 172,707 | | 1,834 | |
| | 1st Source Corp. | | 37,472 | | 1,663 | |
| | Central Pacific Financial Corp. | | 58,814 | | 1,636 | |
| | Stock Yards Bancorp Inc. | | 44,784 | | 1,626 | |
| | Preferred Bank | | 31,509 | | 1,574 | |
* | | Triumph Bancorp Inc. | | 52,338 | | 1,570 | |
| | Washington Trust Bancorp Inc. | | 32,543 | | 1,510 | |
| | Univest Financial Corp. | | 59,170 | | 1,498 | |
| | Carolina Financial Corp. | | 43,390 | | 1,482 | |
| | German American Bancorp Inc. | | 48,130 | | 1,469 | |
| | Lakeland Bancorp Inc. | | 96,297 | | 1,433 | |
| | Bryn Mawr Bank Corp. | | 41,428 | | 1,413 | |
| | ConnectOne Bancorp Inc. | | 68,521 | | 1,403 | |
| | Banc of California Inc. | | 93,527 | | 1,363 | |
| | Horizon Bancorp Inc. | | 83,426 | | 1,357 | |
| | Great Southern Bancorp Inc. | | 23,792 | | 1,340 | |
| | Camden National Corp. | | 32,212 | | 1,336 | |
| | Community Trust Bancorp Inc. | | 32,902 | | 1,280 | |
| | Peoples Bancorp Inc. | | 40,475 | | 1,243 | |
| | FB Financial Corp. | | 34,380 | | 1,233 | |
| | Opus Bank | | 55,684 | | 1,156 | |
* | | Customers Bancorp Inc. | | 60,976 | | 1,152 | |
| | Hanmi Financial Corp. | | 63,751 | | 1,142 | |
| | Origin Bancorp Inc. | | 35,591 | | 1,140 | |
49
Financials Index Fund
| | | | | | Market | |
| | | | | | Value· | |
| | | | Shares | | ($000 | ) |
| | First of Long Island Corp. | | 52,331 | | 1,139 | |
| | Midland States Bancorp Inc. | | 42,919 | | 1,106 | |
| | First Foundation Inc. | | 78,246 | | 1,092 | |
| | QCR Holdings Inc. | | 30,730 | | 1,085 | |
* | | Nicolet Bankshares Inc. | | 17,032 | | 1,079 | |
| | Bank of Marin Bancorp | | 26,199 | | 1,064 | |
| | CBTX Inc. | | 39,252 | | 1,057 | |
| | First Bancshares Inc. | | 33,049 | | 1,042 | |
| | Flushing Financial Corp. | | 53,425 | | 1,031 | |
| | Heritage Commerce Corp. | | 84,829 | | 983 | |
| | Peapack Gladstone Financial Corp. | | 34,725 | | 977 | |
* | | TriState Capital Holdings Inc. | | 48,507 | | 958 | |
| | First Community Bankshares Inc. | | 29,819 | | 949 | |
| | Financial Institutions Inc. | | 32,414 | | 942 | |
| | Mercantile Bank Corp. | | 30,575 | | 941 | |
* | | Bancorp Inc. | | 101,803 | | 929 | |
| | Live Oak Bancshares Inc. | | 51,313 | | 921 | |
| | First Financial Corp. | | 22,464 | | 912 | |
| | People’s Utah Bancorp | | 34,111 | | 904 | |
| | Bridge Bancorp Inc. | | 33,378 | | 898 | |
| | HomeTrust Bancshares Inc. | | 35,512 | | 896 | |
| | Republic Bancorp Inc. Class A | | 20,916 | | 888 | |
| | Arrow Financial Corp. | | 27,546 | | 886 | |
| | MidWestOne Financial Group Inc. | | 30,127 | | 873 | |
| | First Mid Bancshares Inc. | | 27,183 | | 872 | |
| | Independent Bank Corp. | | 43,160 | | 839 | |
| | Franklin Financial Network Inc. | | 28,875 | | 835 | |
* | | Atlantic Capital Bancshares Inc. | | 49,883 | | 813 | |
* | | Amerant Bancorp Inc. | | 47,474 | | 786 | |
| | CNB Financial Corp. | | 29,488 | | 780 | |
* | | Equity Bancshares Inc. Class A | | 30,816 | | 780 | |
* | | Allegiance Bancshares Inc. | | 23,674 | | 767 | |
| | Farmers National Banc Corp. | | 55,760 | | 753 | |
| | Bar Harbor Bankshares | | 33,373 | | 737 | |
| | Old Line Bancshares Inc. | | 27,742 | | 733 | |
| | Sierra Bancorp | | 28,053 | | 691 | |
| | RBB Bancorp | | 35,190 | | 649 | |
| | Old Second Bancorp Inc. | | 54,089 | | 638 | |
| | West Bancorporation Inc. | | 30,429 | | 634 | |
* | | Byline Bancorp Inc. | | 34,385 | | 591 | |
| | Southern National Bancorp of Virginia Inc. | | 38,142 | | 558 | |
| | Macatawa Bank Corp. | | 55,521 | | 549 | |
| | Capital City Bank Group Inc. | | 22,429 | | 547 | |
* | | HarborOne Bancorp Inc. | | 53,445 | | 532 | |
| | Century Bancorp Inc. Class A | | 5,935 | | 481 | |
| | Amalgamated Bank Class A | | 29,284 | | 470 | |
* | | Republic First Bancorp Inc. | | 97,246 | | 393 | |
| | | | | | 3,242,312 | |
Capital Markets (20.1%) | | | | | |
| | CME Group Inc. | | 737,506 | | 160,253 | |
| | Goldman Sachs Group Inc. | | 678,422 | | 138,337 | |
| | S&P Global Inc. | | 507,238 | | 131,978 | |
· | | Intercontinental Exchange Inc. | | 1,161,587 | | 108,585 | |
| | Morgan Stanley | | 2,599,339 | | 107,847 | |
| | BlackRock Inc. | | 238,759 | | 100,890 | |
| | Charles Schwab Corp. | | 2,475,522 | | 94,738 | |
| | Moody’s Corp. | | 351,538 | | 75,785 | |
| | Bank of New York Mellon Corp. | | 1,775,428 | | 74,674 | |
| | T. Rowe Price Group Inc. | | 387,183 | | 42,830 | |
| | MSCI Inc. Class A | | 174,457 | | 40,933 | |
| | State Street Corp. | | 768,502 | | 39,432 | |
| | Northern Trust Corp. | | 426,475 | | 37,500 | |
| | Ameriprise Financial Inc. | | 275,880 | | 35,583 | |
| | MarketAxess Holdings Inc. | | 77,655 | | 30,877 | |
| | Cboe Global Markets Inc. | | 229,946 | | 27,400 | |
| | KKR & Co. Inc. Class A | | 1,008,623 | | 26,063 | |
| | TD Ameritrade Holding Corp. | | 569,899 | | 25,309 | |
| | Nasdaq Inc. | | 238,889 | | 23,851 | |
| | FactSet Research Systems Inc. | | 78,754 | | 21,428 | |
| | E*TRADE Financial Corp. | | 504,031 | | 21,038 | |
| | Raymond James Financial Inc. | | 261,334 | | 20,517 | |
| | Franklin Resources Inc. | | 627,314 | | 16,486 | |
| | SEI Investments Co. | | 267,020 | | 15,356 | |
| | Invesco Ltd. | | 827,060 | | 12,985 | |
| | LPL Financial Holdings Inc. | | 171,954 | | 12,888 | |
| | Eaton Vance Corp. | | 234,976 | | 10,132 | |
| | Affiliated Managers Group Inc. | | 105,483 | | 8,083 | |
| | Stifel Financial Corp. | | 145,714 | | 7,784 | |
| | Interactive Brokers Group Inc. | | 147,237 | | 6,950 | |
| | Evercore Inc. Class A | | 84,615 | | 6,749 | |
| | Legg Mason Inc. | | 178,824 | | 6,579 | |
| | Janus Henderson Group plc | | 341,642 | | 6,529 | |
| | Morningstar Inc. | | 39,330 | | 6,355 | |
| | Federated Investors Inc. Class B | | 197,886 | | 6,340 | |
| | Ares Management Corp. | | 159,795 | | 4,650 | |
| | Houlihan Lokey Inc. Class A | | 79,443 | | 3,510 | |
| | Moelis & Co. Class A | | 101,356 | | 3,398 | |
| | Artisan Partners Asset Management Inc. Class A | | 109,604 | | 2,920 | |
| | BGC Partners Inc. Class A | | 546,887 | | 2,789 | |
| | Cohen & Steers Inc. | | 49,187 | | 2,653 | |
| | Waddell & Reed Financial Inc. Class A | | 154,603 | | 2,500 | |
| | Hamilton Lane Inc. Class A | | 39,097 | | 2,429 | |
* | | Blucora Inc. | | 101,019 | | 2,281 | |
| | Piper Jaffray Cos. | | 27,813 | | 2,024 | |
| | Virtu Financial Inc. Class A | | 101,574 | | 1,910 | |
| | PJT Partners Inc. | | 44,604 | | 1,856 | |
| | Virtus Investment Partners Inc. | | 14,404 | | 1,537 | |
| | Brightsphere Investment Group Inc. | | 161,019 | | 1,464 | |
* | | INTL. FCStone Inc. | | 33,505 | | 1,314 | |
| | WisdomTree Investments Inc. | | 255,506 | | 1,229 | |
| | Diamond Hill Investment Group Inc. | | 6,828 | �� | 921 | |
* | | Cowen Inc. Class A | | 54,800 | | 855 | |
* | | Donnelley Financial Solutions Inc. | | 67,031 | | 713 | |
| | B. Riley Financial Inc. | | 29,088 | | 615 | |
| | Greenhill & Co. Inc. | | 34,735 | | 488 | |
| | Westwood Holdings Group Inc. | | 15,682 | | 430 | |
* | | Victory Capital Holdings Inc. Class A | | 26,761 | | 427 | |
| | Ladenburg Thalmann Financial Services Inc. | | 201,897 | | 396 | |
| | Pzena Investment Management Inc. Class A | | 36,859 | | 300 | |
| | Associated Capital Group Inc. Class A | | 7,492 | | 260 | |
| | GAMCO Investors Inc. Class A | | 10,706 | | 189 | |
| | | | | | 1,553,122 | |
Consumer Finance (5.7%) | | | | | |
| | American Express Co. | | 1,462,622 | | 176,056 | |
| | Capital One Financial Corp. | | 967,706 | | 83,823 | |
| | Discover Financial Services | | 667,146 | | 53,352 | |
| | Synchrony Financial | | 1,278,415 | | 40,973 | |
| | Ally Financial Inc. | | 818,470 | | 25,659 | |
* | | Credit Acceptance Corp. | | 21,312 | | 9,647 | |
| | FirstCash Inc. | | 88,818 | | 8,769 | |
| | SLM Corp. | | 883,179 | | 7,454 | |
| | OneMain Holdings Inc. | | 168,385 | | 6,036 | |
| | Santander Consumer USA Holdings Inc. | | 217,541 | | 5,680 | |
| | Navient Corp. | | 444,116 | | 5,658 | |
* | | PRA Group Inc. | | 93,621 | | 3,196 | |
* | | Green Dot Corp. Class A | | 103,061 | | 3,152 | |
| | Nelnet Inc. Class A | | 40,759 | | 2,733 | |
* | | Encore Capital Group Inc. | | 53,536 | | 1,975 | |
* | | World Acceptance Corp. | | 14,404 | | 1,914 | |
* | | Enova International Inc. | | 69,612 | | 1,664 | |
* | | LendingClub Corp. | | 124,854 | | 1,634 | |
* | | EZCORP Inc. Class A | | 108,347 | | 853 | |
* | | Curo Group Holdings Corp. | | 28,947 | | 394 | |
| | | | | | 440,622 | |
Diversified Financial Services (7.6%) | | | | | |
* | | Berkshire Hathaway Inc. Class B | | 2,678,121 | | 544,757 | |
| | Voya Financial Inc. | | 296,902 | | 14,643 | |
| | AXA Equitable Holdings Inc. | | 606,458 | | 12,596 | |
| | Jefferies Financial Group Inc. | | 508,987 | | 9,487 | |
* | | Cannae Holdings Inc. | | 127,013 | | 3,533 | |
| | FGL Holdings | | 342,558 | | 2,734 | |
* | | On Deck Capital Inc. | | 109,807 | | 357 | |
| | | | | | 588,107 | |
50
Financials Index Fund
| | | | | | Market | |
| | | | | | Value· | |
| | | | Shares | | ($000 | ) |
Equity Real Estate Investment Trusts | | | | | |
(REITs) (0.0%) | | | | | |
§ | | Winthrop Realty Trust | | 23,515 | | 26 | |
| | | | | | | |
Insurance (21.2%) | | | | | |
| | Chubb Ltd. | | 943,369 | | 147,430 | |
| | Marsh & McLennan Cos. Inc. | | 1,053,587 | | 105,243 | |
| | Aon plc | | 495,580 | | 96,564 | |
| | American International Group Inc. | | 1,792,058 | | 93,259 | |
| | Progressive Corp. | | 1,203,259 | | 91,207 | |
| | Travelers Cos. Inc. | | 539,408 | | 79,271 | |
| | Aflac Inc. | | 1,535,936 | | 77,073 | |
| | MetLife Inc. | | 1,664,894 | | 73,755 | |
| | Allstate Corp. | | 686,346 | | 70,275 | |
| | Prudential Financial Inc. | | 836,588 | | 67,002 | |
| | Willis Towers Watson plc | | 266,264 | | 52,712 | |
| | Hartford Financial Services Group Inc. | | 744,783 | | 43,406 | |
| | Cincinnati Financial Corp. | | 319,228 | | 35,910 | |
| | Arthur J Gallagher & Co. | | 381,676 | | 34,622 | |
* | | Arch Capital Group Ltd. | | 832,003 | | 32,864 | |
* | | Markel Corp. | | 28,535 | | 32,618 | |
| | Principal Financial Group Inc. | | 574,019 | | 30,549 | |
| | Loews Corp. | | 565,391 | | 27,178 | |
| | Fidelity National Financial Inc. | | 566,301 | | 24,883 | |
* | | Alleghany Corp. | | 29,759 | | 22,299 | |
| | Lincoln National Corp. | | 417,039 | | 22,053 | |
| | WR Berkley Corp. | | 301,717 | | 21,497 | |
| | Reinsurance Group of America Inc. Class A | | 129,055 | | 19,871 | |
| | Everest Re Group Ltd. | | 83,917 | | 19,794 | |
* | | Globe Life Inc. | | 215,029 | | 19,194 | |
| | Brown & Brown Inc. | | 493,872 | | 18,219 | |
| | RenaissanceRe Holdings Ltd. | | 90,958 | | 16,423 | |
| | American Financial Group Inc. | | 157,085 | | 15,861 | |
| | Assurant Inc. | | 126,393 | | 15,546 | |
| | Old Republic International Corp. | | 592,930 | | 13,851 | |
| | First American Financial Corp. | | 230,988 | | 13,501 | |
* | | Athene Holding Ltd. Class A | | 333,306 | | 12,952 | |
| | Erie Indemnity Co. Class A | | 52,362 | | 11,484 | |
| | Hanover Insurance Group Inc. | | 83,825 | | 11,161 | |
| | Unum Group | | 436,696 | | 11,097 | |
| | Axis Capital Holdings Ltd. | | 172,871 | | 10,613 | |
| | Primerica Inc. | | 87,241 | | 10,397 | |
| | Selective Insurance Group Inc. | | 122,009 | | 9,716 | |
| | Assured Guaranty Ltd. | | 209,244 | | 8,903 | |
| | Kemper Corp. | | 114,259 | | 7,996 | |
* | | Brighthouse Financial Inc. | | 214,851 | | 7,576 | |
| | RLI Corp. | | 78,417 | | 7,181 | |
| | White Mountains Insurance Group Ltd. | | 6,545 | | 6,942 | |
| | CNO Financial Group Inc. | | 329,880 | | 4,777 | |
| | Argo Group International Holdings Ltd. | | 70,638 | | 4,642 | |
* | | Genworth Financial Inc. Class A | | 1,037,114 | | 4,594 | |
| | ProAssurance Corp. | | 110,788 | | 4,329 | |
* | | Enstar Group Ltd. | | 24,090 | | 4,303 | |
| | Kinsale Capital Group Inc. | | 41,915 | | 4,117 | |
| | American Equity Investment Life Holding Co. | | 187,490 | | 4,040 | |
| | Horace Mann Educators Corp. | | 84,257 | | 3,696 | |
* | | eHealth Inc. | | 42,293 | | 3,523 | |
| | National General Holdings Corp. | | 139,677 | | 3,294 | |
| | Mercury General Corp. | | 57,603 | | 3,082 | |
| | James River Group Holdings Ltd. | | 62,400 | | 3,075 | |
| | Safety Insurance Group Inc. | | 30,164 | | 2,909 | |
| | Employers Holdings Inc. | | 66,076 | | 2,850 | |
| | AMERISAFE Inc. | | 39,257 | | 2,697 | |
| | United Fire Group Inc. | | 43,480 | | 1,964 | |
| | American National Insurance Co. | | 16,616 | | 1,895 | |
| | Stewart Information Services Corp. | | 48,532 | | 1,738 | |
* | | Ambac Financial Group Inc. | | 93,808 | | 1,692 | |
| | Universal Insurance Holdings Inc. | | 66,690 | | 1,667 | |
* | | MBIA Inc. | | 176,570 | | 1,589 | |
* | | Third Point Reinsurance Ltd. | | 155,714 | | 1,467 | |
*,^ | | Trupanion Inc. | | 59,001 | | 1,421 | |
| | National Western Life Group Inc. Class A | | 4,962 | | 1,279 | |
| | FBL Financial Group Inc. Class A | | 22,908 | | 1,242 | |
| | State Auto Financial Corp. | | 35,386 | | 1,131 | |
| | Goosehead Insurance Inc. Class A | | 22,280 | | 1,030 | |
* | | Watford Holdings Ltd. | | 41,713 | | 968 | |
| | Heritage Insurance Holdings Inc. | | 55,747 | | 731 | |
*,^ | | Citizens Inc. Class A | | 104,407 | | 656 | |
| | EMC Insurance Group Inc. | | 17,636 | | 634 | |
* | | Greenlight Capital Re Ltd. Class A | | 59,585 | | 548 | |
| | HCI Group Inc. | | 14,047 | | 547 | |
| | United Insurance Holdings Corp. | | 44,624 | | 523 | |
| | Global Indemnity Ltd. | | 19,074 | | 491 | |
| | Donegal Group Inc. Class A | | 26,639 | | 384 | |
| | Crawford & Co. Class A | | 34,710 | | 335 | |
*,^ | | Health Insurance Innovations Inc. Class A | | 17,847 | | 327 | |
| | Protective Insurance Corp. Class B | | 19,968 | | 324 | |
| | Crawford & Co. Class B | | 20,635 | | 179 | |
| | | | | | 1,630,638 | |
Mortgage Real Estate Investment Trusts | | | | | |
(REITs) (1.8%) | | | | | |
| | Annaly Capital | | | | | |
| | Management Inc. | | 2,998,914 | | 24,891 | |
| | AGNC Investment Corp. | | 1,106,519 | | 16,454 | |
| | Starwood Property Trust Inc. | | 577,193 | | 13,524 | |
| | New Residential Investment Corp. | | 855,921 | | 12,043 | |
| | Blackstone Mortgage Trust Inc. Class A | | 245,771 | | 8,553 | |
| | Chimera Investment Corp. | | 386,700 | | 7,374 | |
| | Two Harbors Investment Corp. | | 561,667 | | 7,094 | |
| | MFA Financial Inc. | | 928,019 | | 6,654 | |
| | Apollo Commercial Real Estate Finance Inc. | | 300,523 | | 5,575 | |
| | Invesco Mortgage Capital Inc. | | 292,397 | | 4,395 | |
| | PennyMac Mortgage Investment Trust | | 176,959 | | 3,851 | |
| | Redwood Trust Inc. | | 198,479 | | 3,295 | |
| | Ladder Capital Corp. Class A | | 185,100 | | 3,106 | |
| | New York Mortgage Trust Inc. | | 472,535 | | 2,906 | |
| | Colony Credit Real Estate Inc. | | 172,074 | | 2,156 | |
^ | | Arbor Realty Trust Inc. | | 166,798 | | 2,093 | |
| | Granite Point Mortgage Trust Inc. | | 110,601 | | 2,023 | |
| | ARMOUR Residential REIT Inc. | | 122,965 | | 2,019 | |
| | TPG RE Finance Trust Inc. | | 90,100 | | 1,749 | |
| | Capstead Mortgage Corp. | | 195,150 | | 1,419 | |
| | KKR Real Estate Finance Trust Inc. | | 54,660 | | 1,033 | |
| | Western Asset Mortgage Capital Corp. | | 109,532 | | 1,029 | |
| | AG Mortgage Investment Trust Inc. | | 67,507 | | 1,012 | |
| | Ready Capital Corp. | | 64,163 | | 942 | |
| | Ares Commercial Real Estate Corp. | | 51,704 | | 775 | |
| | Exantas Capital Corp. | | 65,793 | | 737 | |
| | Dynex Capital Inc. | | 50,539 | | 713 | |
| | Anworth Mortgage Asset Corp. | | 203,109 | | 630 | |
| | Orchid Island Capital Inc. | | 110,287 | | 599 | |
| | | | | | 138,644 | |
Other (0.0%)2 | | | | | |
*,§ | | American International Group Inc. Warrants Exp. 01/19/2021 | | 7,950 | | — | |
*,§ | | NewStar Financial Inc. CVR | | 42,593 | | 11 | |
| | | | | | 11 | |
Thrifts & Mortgage Finance (1.4%) | | | | | |
| | New York Community Bancorp Inc. | | 962,502 | | 11,107 | |
| | Radian Group Inc. | | 428,531 | | 9,663 | |
* | | Essent Group Ltd. | | 192,523 | | 9,337 | |
| | MGIC Investment Corp. | | 733,004 | | 9,273 | |
| | Washington Federal Inc. | | 164,815 | | 5,867 | |
* | | LendingTree Inc. | | 15,974 | | 4,953 | |
| | WSFS Financial Corp. | | 104,447 | | 4,305 | |
* | | NMI Holdings Inc. Class A | | 139,165 | | 3,944 | |
* | | PennyMac Financial Services Inc. | | 129,038 | | 3,818 | |
| | Capitol Federal Financial Inc. | | 278,027 | | 3,745 | |
| | Walker & Dunlop Inc. | | 59,510 | | 3,324 | |
| | Northwest Bancshares Inc. | | 207,443 | | 3,280 | |
| | Provident Financial Services Inc. | | 129,861 | | 3,092 | |
51
Financials Index Fund
| | | | | | Market | |
| | | | | | Value· | |
| | | | Shares | | ($000 | ) |
* | | Axos Financial Inc. | | 113,715 | | 2,946 | |
| | Flagstar Bancorp Inc. | | 64,443 | | 2,343 | |
| | Kearny Financial Corp. | | 179,985 | | 2,264 | |
| | Meta Financial Group Inc. | | 72,854 | | 2,252 | |
| | OceanFirst Financial Corp. | | 105,469 | | 2,217 | |
| | TFS Financial Corp. | | 114,257 | | 2,001 | |
| | Meridian Bancorp Inc. | | 105,144 | | 1,838 | |
* | | Columbia Financial Inc. | | 117,818 | | 1,786 | |
| | Federal Agricultural Mortgage Corp. | | 18,886 | | 1,555 | |
| | TrustCo Bank Corp. NY | | 199,310 | | 1,529 | |
| | Northfield Bancorp Inc. | | 93,262 | | 1,447 | |
| | Oritani Financial Corp. | | 83,752 | | 1,435 | |
* | | HomeStreet Inc. | | 52,774 | | 1,392 | |
* | | Mr Cooper Group Inc. | | 150,805 | | 1,329 | |
| | United Financial Bancorp Inc. | | 105,266 | | 1,316 | |
| | Dime Community Bancshares Inc. | | 63,810 | | 1,265 | |
| | First Defiance Financial Corp. | | 40,561 | | 1,061 | |
| | United Community Financial Corp. | | 99,044 | | 956 | |
| | Waterstone Financial Inc. | | 53,726 | | 891 | |
| | Hingham Institution for Savings | | 2,634 | | 474 | |
| | Luther Burbank Corp. | | 40,800 | | 427 | |
* | | Ocwen Financial Corp. | | 235,601 | | 422 | |
| | Sterling Bancorp Inc. | | 32,549 | | 304 | |
| | Merchants Bancorp | | 17,836 | | 283 | |
| | | | | | 109,441 | |
Total Common Stocks
(Cost $7,314,673) | | | | 7,702,923 | |
Temporary Cash Investments (0.0%)1 | | | | | |
Money Market Fund (0.0%) | | | | | |
3,4 | | Vanguard Market Liquidity Fund, 2.249%
(Cost $3,563) | | 35,622 | | 3,563 | |
Total Investments (99.9%)
(Cost $7,318,236) | | | | 7,706,486 | |
| | | | | | | |
| | | | | | Amount | |
| | | | | | ($000 | ) |
Other Assets and Liabilities (0.1%) | | | | | |
Other Assets | | | | | |
Investment in Vanguard | | | | 394 | |
Receivables for Investment Securities Sold | | | | 113 | |
Receivables for Accrued Income | | | | 13,237 | |
Receivables for Capital Shares Issued | | | | 182 | |
Other Assets5 | | | | 780 | |
Total Other Assets | | | | 14,706 | |
Liabilities | | | | | |
Payables for Investment Securities Purchased | | | | (88 | ) |
Collateral for Securities on Loan | | | | (3,557 | ) |
Payables for Capital Shares Redeemed | | | | (2,391 | ) |
Payables to Vanguard | | | | (1,111 | ) |
Other Liabilities | | | | (1,804 | ) |
Total Liabilities | | | | (8,951 | ) |
Net Assets (100%) | | | | 7,712,241 | |
At August 31, 2019, net assets consisted of:
| | | | | | Amount | |
| | | | | | ($000 | ) |
Paid-in Capital | | | | 7,329,641 | |
Total Distributable Earnings (Loss) | | | | 382,600 | |
Net Assets | | | | 7,712,241 | |
| | | | | |
ETF Shares—Net Assets | | | | | |
Applicable to 107,303,864 outstanding $.001 par value shares of beneficial interest (unlimited authorization) | | | | 7,222,205 | |
Net Asset Value Per Share—ETF Shares | | | | $67.31 | |
| | | | | |
Admiral Shares—Net Assets | | | | | |
Applicable to 14,527,603 outstanding $.001 par value shares of beneficial interest (unlimited authorization) | | | | 490,036 | |
Net Asset Value Per Share—Admiral Shares | | | | $33.73 | |
· See Note A in Notes to Financial Statements.
* Non-income-producing security.
§ Security value determined using significant unobservable inputs.
^ Includes partial security positions on loan to broker-dealers. The total value of securities on loan is $3,384,000.
1 The fund invests a portion of its cash reserves in equity markets through the use of swap contracts. After giving effect to swap investments, the fund’s effective common stock and temporary cash investment positions represent 100.0% and -0.1%, respectively, of net assets.
2 “Other” represents securities that are not classified by the fund’s benchmark index.
3 Affiliated money market fund available only to Vanguard funds and certain trusts and accounts managed by Vanguard. Rate shown is the 7-day yield.
4 Includes $3,557,000 of collateral received for securities on loan.
5 Cash of $780,000 has been segregated as collateral for over-the-counter swap contracts.
CVR—Contingent Value Rights.
REIT—Real Estate Investment Trust.
Derivative Financial Instruments Outstanding as of Period End | |
| | | | |
Over-the-Counter Total Return Swaps | | | | |
| | | | Floating | | |
| | | | Interest Rate | Value and | Value and |
| | | Notional | Received | Unrealized | Unrealized |
| Termination | | Amount | (Paid)1 | Appreciation | (Depreciation) |
Reference Entity | Date | Counterparty | ($000) | (%) | ($000) | ($000) |
T. Rowe Price Group Inc. | 9/2/20 | BOANA | 11,062 | (1.989) | — | — |
1 Payment received/paid monthly.
BOANA—Bank of America NA.
See accompanying Notes, which are an integral part of the Financial Statements.
52
Financials Index Fund
Statement of Operations
| Year Ended |
| August 31, 2019 |
| ($000) |
Investment Income | |
Income | |
Dividends | 190,212 |
Interest1 | 64 |
Securities Lending—Net | 153 |
Total Income | 190,429 |
Expenses | |
The Vanguard Group—Note B | |
Investment Advisory Services | 1,209 |
Management and Administrative—ETF Shares | 5,299 |
Management and Administrative—Admiral Shares | 443 |
Marketing and Distribution—ETF Shares | 403 |
Marketing and Distribution—Admiral Shares | 37 |
Custodian Fees | 78 |
Auditing Fees | 34 |
Shareholders’ Reports—ETF Shares | 408 |
Shareholders’ Reports—Admiral Shares | 10 |
Trustees’ Fees and Expenses | 4 |
Total Expenses | 7,925 |
Net Investment Income | 182,504 |
Realized Net Gain (Loss) | |
Investment Securities Sold1,2 | 453,165 |
Futures Contracts | (1,032) |
Swap Contracts | 1,121 |
Realized Net Gain (Loss) | 453,254 |
Change in Unrealized Appreciation (Depreciation) | |
Investment Securities1 | (1,094,417) |
Swap Contracts | — |
Change in Unrealized Appreciation (Depreciation) | (1,094,417) |
Net Increase (Decrease) in Net Assets Resulting from Operations | (458,659) |
1 Interest income, realized net gain (loss), and change in unrealized appreciation (depreciation) from an affiliated company of the fund were $60,000, ($8,000), and ($1,000), respectively. Purchases and sales are for temporary cash investment purposes.
2 Includes $496,413,000 of net gain (loss) resulting from in-kind redemptions; such gain (loss) is not taxable to the fund.
Statement of Changes in Net Assets
| Year Ended August 31, |
| 2019 | 2018 |
| ($000) | ($000) |
Increase (Decrease) in Net Assets | | |
Operations | | |
Net Investment Income | 182,504 | 155,827 |
Realized Net Gain (Loss) | 453,254 | 321,793 |
Change in Unrealized Appreciation (Depreciation) | (1,094,417) | 692,718 |
Net Increase (Decrease) in Net Assets Resulting from Operations | (458,659) | 1,170,338 |
Distributions | | |
Net Investment Income | | |
ETF Shares | (165,401) | (137,850) |
Admiral Shares | (13,448) | (11,634) |
Realized Capital Gain | | |
ETF Shares | — | — |
Admiral Shares | — | — |
Total Distributions | (178,849) | (149,484) |
Capital Share Transactions | | |
ETF Shares | (697,070) | 1,442,638 |
Admiral Shares | (155,784) | 93,701 |
Net Increase (Decrease) from Capital Share Transactions | (852,854) | 1,536,339 |
Total Increase (Decrease) | (1,490,362) | 2,557,193 |
Net Assets | | |
Beginning of Period | 9,202,603 | 6,645,410 |
End of Period | 7,712,241 | 9,202,603 |
See accompanying Notes, which are an integral part of the Financial Statements.
53
Financials Index Fund
Financial Highlights
ETF Shares
For a Share Outstanding | Year Ended August 31, |
Throughout Each Period | 2019 | 2018 | 2017 | 2016 | 2015 |
Net Asset Value, Beginning of Period | $71.60 | $62.26 | $50.81 | $47.70 | $47.32 |
Investment Operations | | | | | |
Net Investment Income | 1.5391 | 1.2981 | 1.0351 | 1.108 | .917 |
Net Realized and Unrealized Gain (Loss) on Investments | (4.338) | 9.307 | 11.387 | 3.070 | .349 |
Total from Investment Operations | (2.799) | 10.605 | 12.422 | 4.178 | 1.266 |
Distributions | | | | | |
Dividends from Net Investment Income | (1.491) | (1.265) | (.972) | (1.068) | (.886) |
Distributions from Realized Capital Gains | — | — | — | — | — |
Total Distributions | (1.491) | (1.265) | (.972) | (1.068) | (.886) |
Net Asset Value, End of Period | $67.31 | $71.60 | $62.26 | $50.81 | $47.70 |
| | | | | |
Total Return | -3.85% | 17.15% | 24.65% | 8.93% | 2.63% |
| | | | | |
Ratios/Supplemental Data | | | | | |
Net Assets, End of Period (Millions) | $7,222 | $8,512 | $6,127 | $3,735 | $3,081 |
Ratio of Total Expenses to Average Net Assets | 0.10% | 0.10% | 0.10% | 0.10% | 0.10% |
Ratio of Net Investment Income to Average Net Assets | 2.30% | 1.87% | 1.75% | 2.39% | 1.99% |
Portfolio Turnover Rate2 | 5% | 3% | 5% | 21% | 4% |
1 Calculated based on average shares outstanding.
2 Excludes the value of portfolio securities received or delivered as a result of in-kind purchases or redemptions of the fund’s capital shares, including ETF Creation Units.
Admiral Shares
For a Share Outstanding | Year Ended August 31, |
Throughout Each Period | 2019 | 2018 | 2017 | 2016 | 2015 |
Net Asset Value, Beginning of Period | $35.88 | $31.20 | $25.47 | $23.91 | $23.72 |
Investment Operations | | | | | |
Net Investment Income | .7711 | .6511 | .5141 | .556 | .460 |
Net Realized and Unrealized Gain (Loss) on Investments | (2.174) | 4.663 | 5.704 | 1.539 | .174 |
Total from Investment Operations | (1.403) | 5.314 | 6.218 | 2.095 | .634 |
Distributions | | | | | |
Dividends from Net Investment Income | (.747) | (.634) | (.488) | (.535) | (.444) |
Distributions from Realized Capital Gains | — | — | — | — | — |
Total Distributions | (.747) | (.634) | (.488) | (.535) | (.444) |
Net Asset Value, End of Period | $33.73 | $35.88 | $31.20 | $25.47 | $23.91 |
| | | | | |
Total Return2 | -3.87% | 17.16% | 24.62% | 8.96% | 2.64% |
| | | | | |
Ratios/Supplemental Data | | | | | |
Net Assets, End of Period (Millions) | $490 | $690 | $518 | $244 | $204 |
Ratio of Total Expenses to Average Net Assets | 0.10% | 0.10% | 0.10% | 0.10% | 0.10% |
Ratio of Net Investment Income to Average Net Assets | 2.30% | 1.87% | 1.75% | 2.39% | 1.99% |
Portfolio Turnover Rate3 | 5% | 3% | 5% | 21% | 4% |
1 Calculated based on average shares outstanding.
2 Total returns do not include account service fees that may have applied in the periods shown. Fund prospectuses provide information about any applicable account service fees.
3 Excludes the value of portfolio securities received or delivered as a result of in-kind purchases or redemptions of the fund’s capital shares, including ETF Creation Units.
See accompanying Notes, which are an integral part of the Financial Statements.
54
Financials Index Fund
Notes to Financial Statements
Vanguard Financials Index Fund is registered under the Investment Company Act of 1940 as an open-end investment company, or mutual fund. The fund offers two classes of shares: ETF Shares and Admiral Shares. Each of the share classes has different eligibility and minimum purchase requirements, and is designed for different types of investors. ETF Shares are listed for trading on NYSE Arca; they can be purchased and sold through a broker.
A. The following significant accounting policies conform to generally accepted accounting principles for U.S. investment companies. The fund consistently follows such policies in preparing its financial statements.
1. Security Valuation: Securities are valued as of the close of trading on the New York Stock Exchange (generally 4 p.m., Eastern time) on the valuation date. Equity securities are valued at the latest quoted sales prices or official closing prices taken from the primary market in which each security trades; such securities not traded on the valuation date are valued at the mean of the latest quoted bid and asked prices. Securities for which market quotations are not readily available, or whose values have been materially affected by events occurring before the fund’s pricing time but after the close of the securities’ primary markets, are valued by methods deemed by the board of trustees to represent fair value. Investments in Vanguard Market Liquidity Fund are valued at that fund’s net asset value. Temporary cash investments are valued using the latest bid prices or using valuations based on a matrix system (which considers such factors as security prices, yields, maturities, and ratings), both as furnished by independent pricing services.
2. Futures Contracts: The fund uses index futures contracts to a limited extent, with the objectives of maintaining full exposure to the stock market, maintaining liquidity, and minimizing transaction costs. The fund may purchase futures contracts to immediately invest incoming cash in the market, or sell futures in response to cash outflows, thereby simulating a fully invested position in the underlying index while maintaining a cash balance for liquidity. The primary risks associated with the use of futures contracts are imperfect correlation between changes in market values of stocks held by the fund and the prices of futures contracts, and the possibility of an illiquid market. Counterparty risk involving futures is mitigated because a regulated clearinghouse is the counterparty instead of the clearing broker. To further mitigate counterparty risk, the fund trades futures contracts on an exchange, monitors the financial strength of its clearing brokers and clearinghouse, and has entered into clearing agreements with its clearing brokers. The clearinghouse imposes initial margin requirements to secure the fund’s performance and requires daily settlement of variation margin representing changes in the market value of each contract. Any assets pledged as initial margin for open contracts are noted in the Statement of Net Assets.
Futures contracts are valued at their quoted daily settlement prices. The notional amounts of the contracts are not recorded in the Statement of Net Assets. Fluctuations in the value of the contracts are recorded in the Statement of Net Assets as an asset (liability) and in the Statement of Operations as unrealized appreciation (depreciation) until the contracts are closed, when they are recorded as realized futures gains (losses).
During the year ended August 31, 2019, the fund’s average investments in long and short futures contracts represented less than 1% and 0% of net assets, respectively, based on the average of the notional amounts at each quarter-end during the period. The fund had no open futures contracts at August 31, 2019.
3. Swap Contracts: The fund has entered into equity swap contracts to earn the total return on selected reference stocks in the fund’s target index. Under the terms of the swaps, the fund receives the total return on the referenced stock (i.e., receiving the increase or paying the decrease in value of the selected reference stock and receiving the equivalent of any dividends in respect of the selected referenced stock) over a specified period of time, applied to a notional amount that represents the value of a designated number of shares of the selected reference stock at the beginning of the equity swap contract. The fund also pays a floating rate that is based on short-term interest rates, applied to the notional amount. At the same time, the fund generally invests an amount approximating the notional amount of the swap in high-quality temporary cash investments.
The notional amounts of swap contracts are not recorded in the Statement of Net Assets. Swaps are valued daily based on market quotations received from independent pricing services or recognized dealers and the change in value is recorded in the Statement of Net Assets as an asset (liability) and in the Statement of Operations as unrealized appreciation (depreciation) until termination of the swap, at which time realized gain (loss) is recorded.
55
Financials Index Fund
A risk associated with all types of swaps is the possibility that a counterparty may default on its obligation to pay net amounts due to the fund. The fund’s maximum amount subject to counterparty risk is the unrealized appreciation on the swap contract. The fund mitigates its counterparty risk by entering into swaps only with a diverse group of prequalified counterparties, monitoring their financial strength, entering into master netting arrangements with its counterparties, and requiring its counterparties to transfer collateral as security for their performance. In the absence of a default, the collateral pledged or received by the fund cannot be repledged, resold, or rehypothecated. In the event of a counterparty’s default (including bankruptcy), the fund may terminate any swap contracts with that counterparty, determine the net amount owed by either party in accordance with its master netting arrangements, and sell or retain any collateral held up to the net amount owed to the fund under the master netting arrangements. The swap contracts contain provisions whereby a counterparty may terminate open contracts if the fund net assets decline below a certain level, triggering a payment by the fund if the fund is in a net liability position at the time of the termination. The payment amount would be reduced by any collateral the fund has pledged. Any securities pledged as collateral for open contracts are noted in the Statement of Net Assets. The value of collateral received or pledged is compared daily to the value of the swap contracts exposure with each counterparty, and any difference, if in excess of a specified minimum transfer amount, is adjusted and settled within two business days.
During the year ended August 31, 2019, the fund’s average amounts of investments in total return swaps represented less than 1% of net assets, based on the average of notional amounts at each quarter-end during the period.
4. Federal Income Taxes: The fund intends to continue to qualify as a regulated investment company and distribute all of its taxable income. Management has analyzed the fund’s tax positions taken for all open federal income tax years (August 31, 2016–2019), and has concluded that no provision for federal income tax is required in the fund’s financial statements.
5. Distributions: Distributions to shareholders are recorded on the ex-dividend date. Distributions are determined on a tax basis and may differ from net investment income and realized capital gains for financial reporting purposes.
6. Securities Lending: To earn additional income, the fund lends its securities to qualified institutional borrowers. Security loans are subject to termination by the fund at any time, and are required to be secured at all times by collateral in an amount at least equal to the market value of securities loaned. Daily market fluctuations could cause the value of loaned securities to be more or less than the value of the collateral received. When this occurs, the collateral is adjusted and settled before the opening of the market on the next business day. The fund further mitigates its counterparty risk by entering into securities lending transactions only with a diverse group of prequalified counterparties, monitoring their financial strength, and entering into master securities lending agreements with its counterparties. The master securities lending agreements provide that, in the event of a counterparty’s default (including bankruptcy), the fund may terminate any loans with that borrower, determine the net amount owed, and sell or retain the collateral up to the net amount owed to the fund; however, such actions may be subject to legal proceedings. While collateral mitigates counterparty risk, in the event of a default, the fund may experience delays and costs in recovering the securities loaned. The fund invests cash collateral received in Vanguard Market Liquidity Fund, and records a liability in the Statement of Net Assets for the return of the collateral, during the period the securities are on loan. Securities lending income represents fees charged to borrowers plus income earned on invested cash collateral, less expenses associated with the loan. During the term of the loan, the fund is entitled to all distributions made on or in respect of the loaned securities.
7. Credit Facility: The fund and certain other funds managed by The Vanguard Group (“Vanguard”) participate in a $4.3 billion committed credit facility provided by a syndicate of lenders pursuant to a credit agreement that may be renewed annually; each fund is individually liable for its borrowings, if any, under the credit facility. Borrowings may be utilized for temporary and emergency purposes, and are subject to the fund’s regulatory and contractual borrowing restrictions. The participating funds are charged administrative fees and an annual commitment fee of 0.10% of the undrawn amount of the facility; these fees are allocated to the funds based on a method approved by the fund’s board of trustees and included in Management and Administrative expenses on the fund’s Statement of Operations. Any borrowings under this facility bear interest at a rate based upon the higher of the one-month London Interbank Offered Rate, federal funds effective rate, or overnight bank funding rate plus an agreed-upon spread.
The fund had no borrowings outstanding at August 31, 2019, or at any time during the period then ended.
56
Financials Index Fund
8. Other: Dividend income is recorded on the ex-dividend date. Interest income includes income distributions received from Vanguard Market Liquidity Fund and is accrued daily. Premiums and discounts on debt securities purchased are amortized and accreted, respectively, to interest income over the lives of the respective securities. Security transactions are accounted for on the date securities are bought or sold. Costs used to determine realized gains (losses) on the sale of investment securities are those of the specific securities sold.
Each class of shares has equal rights as to assets and earnings, except that each class separately bears certain class-specific expenses related to maintenance of shareholder accounts (included in Management and Administrative expenses) and shareholder reporting. Marketing and distribution expenses are allocated to each class of shares based on a method approved by the board of trustees. Income, other non-class-specific expenses, and gains and losses on investments are allocated to each class of shares based on its relative net assets.
B. In accordance with the terms of a Funds’ Service Agreement (the “FSA”) between Vanguard and the fund, Vanguard furnishes to the fund investment advisory, corporate management, administrative, marketing, and distribution services at Vanguard’s cost of operations (as defined by the FSA). These costs of operations are allocated to the fund based on methods and guidelines approved by the board of trustees. Vanguard does not require reimbursement in the current period for certain costs of operations (such as deferred compensation/benefits and risk/insurance costs); the fund’s liability for these costs of operations is included in Payables to Vanguard on the Statement of Net Assets. All other costs of operations payable to Vanguard are generally settled twice a month.
Upon the request of Vanguard, the fund may invest up to 0.40% of its net assets as capital in Vanguard. At August 31, 2019, the fund had contributed to Vanguard capital in the amount of $394,000, representing 0.01% of the fund’s net assets and 0.16% of Vanguard’s capital received pursuant to the FSA. The fund’s trustees and officers are also directors and employees, respectively, of Vanguard.
C. Various inputs may be used to determine the value of the fund’s investments. These inputs are summarized in three broad levels for financial statement purposes. The inputs or methodologies used to value securities are not necessarily an indication of the risk associated with investing in those securities.
Level 1—Quoted prices in active markets for identical securities.
Level 2—Other significant observable inputs (including quoted prices for similar securities, interest rates, prepayment speeds, credit risk, etc.).
Level 3—Significant unobservable inputs (including the fund’s own assumptions used to determine the fair value of investments). Any investments valued with significant unobservable inputs are noted on the Statement of Net Assets.
The following table summarizes the market value of the fund’s investments and derivatives as of August 31, 2019, based on the inputs used to value them:
| Level 1 | Level 2 | Level 3 |
Investments | ($000) | ($000) | ($000) |
Common Stocks | 7,702,886 | — | 37 |
Temporary Cash Investments | 3,563 | — | — |
Total | 7,706,449 | — | 37 |
D. Permanent differences between book-basis and tax-basis components of net assets are reclassified among capital accounts in the financial statements to reflect their tax character. These reclassifications have no effect on net assets or net asset value per share. As of period end, permanent differences primarily attributable to the accounting for in-kind redemptions, the expiration of capital loss carry-forwards, and swap agreements were reclassified to the following accounts:
| Amount |
| ($000) |
Paid-in Capital | 428,974 |
Total Distributable Earnings (Loss) | (428,974) |
57
Financials Index Fund
Temporary differences between book-basis and tax-basis components of total distributable earnings (loss) arise when certain items of income, gain, or loss are recognized in different periods for financial statement and tax purposes; these differences will reverse at some time in the future. The differences are primarily related to the tax deferral on wash sales. As of period end, the tax-basis components of total distributable earnings (loss) are detailed in the table as follows:
| Amount |
| ($000) |
Undistributed Ordinary Income | 39,365 |
Undistributed Long-Term Gains | — |
Capital Loss Carryforwards (Non-expiring) | (44,257) |
Net Unrealized Gains (Losses) | 388,228 |
As of August 31, 2019, gross unrealized appreciation and depreciation for investments based on cost for U.S. federal income tax purposes were as follows:
| Amount |
| ($000) |
Tax Cost | 7,318,258 |
Gross Unrealized Appreciation | 930,924 |
Gross Unrealized Depreciation | (542,696) |
Net Unrealized Appreciation (Depreciation) | 388,228 |
E. During the year ended August 31, 2019, the fund purchased $1,658,829,000 of investment securities and sold $2,512,477,000 of investment securities, other than temporary cash investments. Purchases and sales include $1,169,446,000 and $2,112,602,000, respectively, in connection with in-kind purchases and redemptions of the fund’s capital shares.
F. Capital share transactions for each class of shares were:
| Year Ended August 31, |
| | 2019 | | | 2018 |
| Amount | Shares | | Amount | Shares |
| ($000) | (000) | | ($000) | (000) |
ETF Shares | | | | | |
Issued | 1,423,985 | 21,039 | | 2,440,296 | 34,877 |
Issued in Lieu of Cash Distributions | — | — | | — | — |
Redeemed | (2,121,055) | (32,625) | | (997,658) | (14,400) |
Net Increase (Decrease)—ETF Shares | (697,070) | (11,586) | | 1,442,638 | 20,477 |
Admiral Shares | | | | | |
Issued | 147,528 | 4,455 | | 383,758 | 10,937 |
Issued in Lieu of Cash Distributions | 11,597 | 349 | | 10,277 | 301 |
Redeemed | (314,909) | (9,513) | | (300,334) | (8,610) |
Net Increase (Decrease)—Admiral Shares | (155,784) | (4,709) | | 93,701 | 2,628 |
At August 31, 2019, one shareholder was the record or beneficial owner of 31% of the fund’s net assets. If this shareholder were to redeem its investment in the fund, the redemption might result in an increase in the fund’s expense ratio, cause the fund to incur higher transaction costs, or lead to the realization of taxable capital gains.
G. Management has determined that no events or transactions occurred subsequent to August 31, 2019, that would require recognition or disclosure in these financial statements.
58
Health Care Index Fund
Performance Summary
All of the returns in this report represent past performance, which is not a guarantee of future results that may be achieved by the fund. (Current performance may be lower or higher than the performance data cited. For performance data current to the most recent month-end, visit our website at vanguard.com/performance.) Note, too, that both investment returns and principal value can fluctuate widely, so an investor’s shares, when sold, could be worth more or less than their original cost. The returns shown do not reflect taxes that a shareholder would pay on fund distributions or on the sale of fund shares.
Cumulative Performance: August 31, 2009–August 31, 2019
Initial Investment of $10,000
| | Average Annual Total Returns | | Final Value |
| | Periods Ended August 31, 2019 | | of a $10,000 |
| | One Year | Five Years | Ten Years | | Investment |

| Health Care Index Fund ETF Shares Net Asset Value | -2.22% | 9.36% | 14.80% | | $39,757 |
| Health Care Index Fund ETF Shares Market Price | -2.26 | 9.34 | 14.79 | | 39,740 |

| Spliced US IMI/Health Care 25/50 | -2.16 | 9.41 | 14.91 | | 40,125 |

| MSCI US IMI/2500 | 1.32 | 9.63 | 13.41 | | 35,213 |
Spliced US IMI/Health Care 25/50: MSCI US IMI/Health Care through February 28, 2010; MSCI US IMI/Health Care 25/50 thereafter.
| | | | | Final Value |
| | | | | of a $100,000 |
| One Year | Five Years | Ten Years | | Investment |
Health Care Index Fund Admiral Shares | -2.21% | 9.36% | 14.81% | | $397,811 |
Spliced US IMI/Health Care 25/50 | -2.16 | 9.41 | 14.91 | | 401,250 |
MSCI US IMI/2500 | 1.32 | 9.63 | 13.41 | | 352,130 |
Cumulative Returns: ETF Shares, August 31, 2009–August 31, 2019
| One Year | Five Years | | Ten Years |
Health Care Index Fund ETF Shares Market Price | -2.26% | 56.29% | | 297.40% |
Health Care Index Fund ETF Shares Net Asset Value | -2.22 | 56.39 | | 297.57 |
Spliced US IMI/Health Care 25/50 | -2.16 | 56.78 | | 301.25 |
For the ETF Shares, the market price is determined by the midpoint of the bid-offer spread as of the closing time of the New York Stock Exchange (generally 4 p.m., Eastern time). The net asset value is also determined as of the NYSE closing time. For more information about how the ETF Shares’ market prices have compared with their net asset value, visit vanguard.com, select your ETF, and then select the Price and Performance tab. The ETF premium/discount analysis there shows the percentages of days on which the ETF Shares’ market price was above or below the NAV.
See Financial Highlights for dividend and capital gains information.
59
Health Care Index Fund
Sector Diversification
As of August 31, 2019
Biotechnology | 18.6% |
Health Care Distributors | 1.6 |
Health Care Equipment | 24.4 |
Health Care Facilities | 1.6 |
Health Care Services | 5.2 |
Health Care Supplies | 2.0 |
Health Care Technology | 1.7 |
Life Sciences Tools & Services | 7.4 |
Managed Health Care | 9.4 |
Pharmaceuticals | 28.1 |
The table reflects the fund’s equity exposure, based on its investments in stocks and stock index futures. Any holdings in short-term reserves are excluded. Sector categories are based on the Global Industry Classification Standard (“GICS”), except for the “Other” category (if applicable), which includes securities that have not been provided a GICS classification as of the effective reporting period.
The Global Industry Classification Standard (“GICS”) was developed by and is the exclusive property and a service mark of MSCI Inc. (“MSCI”) and Standard and Poor’s, a division of McGraw-Hill Companies, Inc. (“S&P”), and is licensed for use by Vanguard. Neither MSCI, S&P nor any third party involved in making or compiling the GICS or any GICS classification makes any express or implied warranties or representations with respect to such standard or classification (or the results to be obtained by the use thereof), and all such parties hereby expressly disclaim all warranties of originality, accuracy, completeness, merchantability or fitness for a particular purpose with respect to any such standard or classification. Without limiting any of the foregoing, in no event shall MSCI, S&P, any of its affiliates or any third party involved in making or compiling the GICS or any GICS classification have any liability for any direct, indirect, special, punitive, consequential or any other damages (including lost profits) even if notified of the possibility of such damages.
60
Health Care Index Fund
Financial Statements
Statement of Net Assets
As of August 31, 2019
The fund files its complete schedule of portfolio holdings with the Securities and Exchange Commission (SEC) for the first and third quarters of each fiscal year as an exhibit to its reports on Form N-PORT. The fund’s Form N-PORT reports are available on the SEC’s website at www.sec.gov.
| | | | | | Market | |
| | | | | | Value· | |
| | | | Shares | | ($000 | ) |
Common Stocks (99.9%)1 | | | | | |
Biotechnology (18.6%) | | | | | |
| | Amgen Inc. | | 1,561,003 | | 325,656 | |
| | AbbVie Inc. | | 3,783,433 | | 248,723 | |
| | Gilead Sciences Inc. | | 3,254,031 | | 206,761 | |
* | | Celgene Corp. | | 1,804,832 | | 174,708 | |
* | | Vertex Pharmaceuticals Inc. | | 655,290 | | 117,965 | |
* | | Biogen Inc. | | 496,411 | | 109,086 | |
* | | Regeneron Pharmaceuticals Inc. | | 206,868 | | 60,002 | |
* | | Alexion Pharmaceuticals Inc. | | 574,110 | | 57,847 | |
* | | Exact Sciences Corp. | | 330,623 | | 39,417 | |
* | | Incyte Corp. | | 466,205 | | 38,145 | |
* | | BioMarin Pharmaceutical Inc. | | 458,529 | | 34,417 | |
* | | Neurocrine Biosciences Inc. | | 233,738 | | 23,238 | |
* | | Alnylam Pharmaceuticals Inc. | | 283,518 | | 22,877 | |
* | | Sage Therapeutics Inc. | | 131,021 | | 22,492 | |
* | | Ionis Pharmaceuticals Inc. | | 341,293 | | 21,573 | |
* | | Seattle Genetics Inc. | | 289,173 | | 21,006 | |
* | | Sarepta Therapeutics Inc. | | 189,886 | | 17,118 | |
* | | Exelixis Inc. | | 772,977 | | 15,344 | |
* | | Bluebird Bio Inc. | | 141,135 | | 14,581 | |
* | | Repligen Corp. | | 110,615 | | 10,266 | |
* | | United Therapeutics Corp. | | 111,989 | | 9,246 | |
* | | Blueprint Medicines Corp. | | 118,870 | | 9,114 | |
* | | FibroGen Inc. | | 198,166 | | 8,850 | |
* | | Spark Therapeutics Inc. | | 88,561 | | 8,627 | |
* | | Alkermes plc | | 401,296 | | 8,419 | |
* | | Medicines Co. | | 188,666 | | 7,916 | |
* | | ACADIA Pharmaceuticals Inc. | | 276,278 | | 7,642 | |
* | | Ultragenyx Pharmaceutical Inc. | | 139,865 | | 7,619 | |
*,^ | | Arrowhead Pharmaceuticals Inc. | | 218,461 | | 7,465 | |
* | | Arena Pharmaceuticals Inc. | | 126,646 | | 6,698 | |
* | | Global Blood Therapeutics Inc. | | 144,734 | | 6,655 | |
* | | PTC Therapeutics Inc. | | 134,716 | | 6,004 | |
* | | Amicus Therapeutics Inc. | | 591,066 | | 5,846 | |
* | | Iovance Biotherapeutics Inc. | | 269,381 | | 5,660 | |
* | | Halozyme Therapeutics Inc. | | 336,862 | | 5,565 | |
*,^ | | Allakos Inc. | | 61,134 | | 5,408 | |
* | | Portola Pharmaceuticals Inc. | | 185,474 | | 5,390 | |
* | | Invitae Corp. | | 218,547 | | 5,302 | |
* | | Acceleron Pharma Inc. | | 114,805 | | 5,156 | |
* | | Genomic Health Inc. | | 66,718 | | 5,115 | |
* | | Agios Pharmaceuticals Inc. | | 134,767 | | 5,114 | |
*,^ | | Immunomedics Inc. | | 390,628 | | 5,000 | |
* | | Mirati Therapeutics Inc. | | 60,002 | | 4,918 | |
* | | Emergent BioSolutions Inc. | | 111,804 | | 4,897 | |
* | | Xencor Inc. | | 130,247 | | 4,856 | |
* | | Ligand Pharmaceuticals Inc. | | 50,224 | | 4,566 | |
* | | Myriad Genetics Inc. | | 187,326 | | 4,408 | |
* | | Biohaven Pharmaceutical Holding Co. Ltd. | | 112,400 | | 4,405 | |
* | | Intercept Pharmaceuticals Inc. | | 65,995 | | 4,236 | |
* | | Natera Inc. | | 124,809 | | 4,113 | |
* | | uniQure NV | | 72,154 | | 3,914 | |
* | | Ironwood Pharmaceuticals Inc. Class A | | 401,104 | | 3,734 | |
* | | Heron Therapeutics Inc. | | 192,883 | | 3,572 | |
* | | Insmed Inc. | | 211,703 | | 3,480 | |
* | | Apellis Pharmaceuticals Inc. | | 113,406 | | 3,300 | |
* | | Sangamo Therapeutics Inc. | | 295,626 | | 3,222 | |
* | | Radius Health Inc. | | 112,690 | | 3,189 | |
*,^ | | CRISPR Therapeutics AG | | 67,903 | | 3,138 | |
* | | Momenta Pharmaceuticals Inc. | | 239,300 | | 3,022 | |
* | | Audentes Therapeutics Inc. | | 96,510 | | 3,002 | |
* | | Coherus Biosciences Inc. | | 133,222 | | 2,956 | |
* | | REGENXBIO Inc. | | 83,795 | | 2,890 | |
* | | Denali Therapeutics Inc. | | 158,667 | | 2,856 | |
*,^ | | Editas Medicine Inc. | | 113,584 | | 2,820 | |
* | | Enanta Pharmaceuticals Inc. | | 37,744 | | 2,663 | |
* | | AnaptysBio Inc. | | 62,097 | | 2,524 | |
* | | Epizyme Inc. | | 186,362 | | 2,417 | |
* | | G1 Therapeutics Inc. | | 66,542 | | 2,416 | |
* | | Deciphera Pharmaceuticals Inc. | | 62,825 | | 2,279 | |
*,^ | | Esperion Therapeutics Inc. | | 61,627 | | 2,258 | |
* | | CareDx Inc. | | 97,453 | | 2,224 | |
* | | Fate Therapeutics Inc. | | 133,680 | | 2,182 | |
* | | Anika Therapeutics Inc. | | 36,329 | | 2,062 | |
* | | Madrigal Pharmaceuticals Inc. | | 21,682 | | 2,010 | |
* | | Aimmune Therapeutics Inc. | | 95,351 | | 1,944 | |
* | | Ra Pharmaceuticals Inc. | | 70,436 | | 1,916 | |
* | | Spectrum Pharmaceuticals Inc. | | 256,278 | | 1,881 | |
* | | Cytokinetics Inc. | | 125,764 | | 1,767 | |
*,^ | | ZIOPHARM Oncology Inc. | | 349,971 | | 1,746 | |
* | | Athenex Inc. | | 118,016 | | 1,738 | |
* | | Vanda Pharmaceuticals Inc. | | 121,127 | | 1,707 | |
* | | MacroGenics Inc. | | 118,518 | | 1,700 | |
*,^ | | Allogene Therapeutics Inc. | | 62,101 | | 1,691 | |
* | | Atara Biotherapeutics Inc. | | 122,086 | | 1,648 | |
* | | Eagle Pharmaceuticals Inc. | | 28,457 | | 1,605 | |
*,^ | | OPKO Health Inc. | | 869,016 | | 1,599 | |
* | | Achillion Pharmaceuticals Inc. | | 336,819 | | 1,465 | |
* | | Alder Biopharmaceuticals Inc. | | 161,488 | | 1,445 | |
*,^ | | TG Therapeutics Inc. | | 209,906 | | 1,304 | |
* | | Kura Oncology Inc. | | 84,670 | | 1,285 | |
* | | Krystal Biotech Inc. | | 28,195 | | 1,269 | |
* | | Voyager Therapeutics Inc. | | 70,915 | | 1,267 | |
* | | Retrophin Inc. | | 96,178 | | 1,211 | |
*,^ | | Intellia Therapeutics Inc. | | 80,936 | | 1,149 | |
*,^ | | Viking Therapeutics Inc. | | 163,281 | | 1,135 | |
* | | Karyopharm Therapeutics Inc. | | 126,957 | | 1,097 | |
* | | Rhythm Pharmaceuticals Inc. | | 48,392 | | 1,090 | |
*,^ | | Intrexon Corp. | | 185,687 | | 1,084 | |
*,^ | | Flexion Therapeutics Inc. | | 82,257 | | 1,083 | |
* | | Avrobio Inc. | | 54,551 | | 1,063 | |
* | | Gossamer Bio Inc. | | 50,514 | | 1,059 | |
* | | ImmunoGen Inc. | | 381,152 | | 1,037 | |
* | | CytomX Therapeutics Inc. | | 115,320 | | 1,013 | |
*,^ | | Akcea Therapeutics Inc. | | 47,903 | | 1,009 | |
* | | AMAG Pharmaceuticals Inc. | | 87,441 | | 955 | |
* | | Progenics Pharmaceuticals Inc. | | 216,667 | | 953 | |
* | | Homology Medicines Inc. | | 49,558 | | 937 | |
*,^ | | Dynavax Technologies Corp. Class A | | 214,792 | | 889 | |
* | | Syros Pharmaceuticals Inc. | | 79,498 | | 872 | |
* | | Prothena Corp. plc | | 102,060 | | 858 | |
* | | Principia Biopharma Inc. | | 21,345 | | 847 | |
* | | Puma Biotechnology Inc. | | 78,059 | | 839 | |
* | | Twist Bioscience Corp. | | 28,524 | | 828 | |
* | | Agenus Inc. | | 284,849 | | 820 | |
* | | Myovant Sciences Ltd. | | 100,508 | | 807 | |
* | | Akebia Therapeutics Inc. | | 194,540 | | 804 | |
*,^ | | Corbus Pharmaceuticals Holdings Inc. | | 153,555 | | 795 | |
* | | Eidos Therapeutics Inc. | | 18,783 | | 785 | |
*,^ | | Rubius Therapeutics Inc. | | 81,669 | | 758 | |
* | | PDL BioPharma Inc. | | 311,429 | | 729 | |
* | | Rigel Pharmaceuticals Inc. | | 429,464 | | 726 | |
* | | MeiraGTx Holdings plc | | 34,110 | | 691 | |
*,^ | | Geron Corp. | | 475,285 | | 665 | |
* | | Assembly Biosciences Inc. | | 58,683 | | 664 | |
* | | Clovis Oncology Inc. | | 114,868 | | 644 | |
* | | Minerva Neurosciences Inc. | | 83,585 | | 597 | |
* | | BioCryst Pharmaceuticals Inc. | | 198,754 | | 594 | |
*,^ | | Inovio Pharmaceuticals Inc. | | 250,684 | | 542 | |
*,^ | | Sorrento Therapeutics Inc. | | 253,957 | | 536 | |
* | | Scholar Rock Holding Corp. | | 49,227 | | 521 | |
* | | Gritstone Oncology Inc. | | 50,571 | | 512 | |
* | | Forty Seven Inc. | | 62,362 | | 473 | |
* | | Concert Pharmaceuticals Inc. | | 46,503 | | 468 | |
* | | Y-mAbs Therapeutics Inc. | | 17,506 | | 465 | |
61
Health Care Index Fund
| | | | | | Market | |
| | | | | | Value· | |
| | | | Shares | | ($000 | ) |
* | | Arcus Biosciences Inc. | | 56,075 | | 438 | |
* | | Five Prime Therapeutics Inc. | | 77,135 | | 419 | |
* | | Acorda Therapeutics Inc. | | 121,816 | | 394 | |
* | | Cyclerion Therapeutics Inc. | | 41,324 | | 393 | |
*,^ | | MannKind Corp. | | 356,069 | | 392 | |
*,^ | | Crinetics Pharmaceuticals Inc. | | 24,664 | | 391 | |
* | | KalVista Pharmaceuticals Inc. | | 24,222 | | 378 | |
* | | Translate Bio Inc. | | 40,739 | | 370 | |
*,^ | | Novavax Inc. | | 60,011 | | 358 | |
*,^ | | Solid Biosciences Inc. | | 41,766 | | 338 | |
*,^ | | Marker Therapeutics Inc. | | 63,905 | | 330 | |
* | | PhaseBio Pharmaceuticals Inc. | | 35,448 | | 306 | |
* | | Synthorx Inc. | | 16,433 | | 294 | |
* | | GlycoMimetics Inc. | | 88,373 | | 294 | |
* | | TCR2 Therapeutics Inc. | | 15,326 | | 258 | |
* | | Kiniksa Pharmaceuticals Ltd. Class A | | 26,750 | | 236 | |
* | | Precision BioSciences Inc. | | 24,283 | | 207 | |
*,^ | | Organogenesis Holdings Inc. | | 47,090 | | 194 | |
*,^ | | Lexicon Pharmaceuticals Inc. | | 121,854 | | 161 | |
* | | Calyxt Inc. | | 25,071 | | 155 | |
* | | Replimune Group Inc. | | 14,496 | | 151 | |
* | | Aduro Biotech Inc. | | 122,302 | | 150 | |
* | | Abeona Therapeutics Inc. | | 85,768 | | 132 | |
* | | Kezar Life Sciences Inc. | | 14,691 | | 50 | |
* | | Achaogen Inc. | | 14,105 | | — | |
| | | | | | 1,903,932 | |
Health Care Equipment & Supplies (26.4%) | | | | | |
| | Abbott Laboratories | | 4,515,141 | | 385,232 | |
| | Medtronic plc | | 3,431,538 | | 370,229 | |
| | Danaher Corp. | | 1,649,092 | | 234,320 | |
| | Stryker Corp. | | 860,978 | | 189,983 | |
| | Becton Dickinson and Co. | | 690,248 | | 175,268 | |
* | | Boston Scientific Corp. | | 3,558,339 | | 152,048 | |
* | | Intuitive Surgical Inc. | | 295,395 | | 151,047 | |
* | | Edwards Lifesciences Corp. | | 533,543 | | 118,361 | |
| | Baxter International Inc. | | 1,240,208 | | 109,076 | |
| | Zimmer Biomet Holdings Inc. | | 524,130 | | 72,959 | |
* | | IDEXX Laboratories Inc. | | 220,194 | | 63,799 | |
| | ResMed Inc. | | 366,952 | | 51,116 | |
| | Teleflex Inc. | | 118,161 | | 43,001 | |
* | | DexCom Inc. | | 233,114 | | 40,005 | |
| | Cooper Cos. Inc. | | 126,690 | | 39,242 | |
* | | Align Technology Inc. | | 194,603 | | 35,634 | |
* | | Hologic Inc. | | 686,192 | | 33,877 | |
| | STERIS plc | | 216,176 | | 33,378 | |
| | Dentsply Sirona Inc. | | 599,044 | | 31,240 | |
| | West Pharmaceutical Services Inc. | | 188,010 | | 27,348 | |
* | | Varian Medical Systems Inc. | | 232,884 | | 24,669 | |
* | | Insulet Corp. | | 152,783 | | 23,555 | |
* | | ABIOMED Inc. | | 115,434 | | 22,287 | |
* | | Masimo Corp. | | 129,666 | | 19,871 | |
| | Hill-Rom Holdings Inc. | | 171,107 | | 18,425 | |
* | | Novocure Ltd. | | 195,825 | | 17,793 | |
* | | Haemonetics Corp. | | 130,941 | | 17,485 | |
* | | Penumbra Inc. | | 80,058 | | 11,652 | |
* | | Integra LifeSciences Holdings Corp. | | 186,276 | | 11,180 | |
* | | Globus Medical Inc. | | 196,326 | | 10,026 | |
* | | Tandem Diabetes Care Inc. | | 134,127 | | 9,715 | |
* | | LivaNova plc | | 123,930 | | 9,621 | |
* | | Neogen Corp. | | 133,637 | | 9,424 | |
| | Cantel Medical Corp. | | 95,900 | | 8,816 | |
* | | NuVasive Inc. | | 132,889 | | 8,441 | |
* | | ICU Medical Inc. | | 50,290 | | 8,134 | |
| | CONMED Corp. | | 72,509 | | 7,307 | |
* | | Nevro Corp. | | 78,314 | | 6,557 | |
* | | Wright Medical Group NV | | 307,503 | | 6,411 | |
* | | Integer Holdings Corp. | | 83,181 | | 6,022 | |
* | | Quidel Corp. | | 91,802 | | 5,788 | |
* | | Glaukos Corp. | | 88,712 | | 5,705 | |
* | | Merit Medical Systems Inc. | | 140,412 | | 4,884 | |
* | | iRhythm Technologies Inc. | | 63,270 | | 4,816 | |
* | | Cardiovascular Systems Inc. | | 89,621 | | 4,340 | |
* | | Avanos Medical Inc. | | 122,341 | | 4,059 | |
| | Atrion Corp. | | 3,774 | | 2,933 | |
* | | AtriCure Inc. | | 98,566 | | 2,700 | |
* | | STAAR Surgical Co. | | 86,021 | | 2,590 | |
* | | Varex Imaging Corp. | | 97,366 | | 2,566 | |
* | | CryoLife Inc. | | 94,750 | | 2,539 | |
* | | Orthofix Medical Inc. | | 49,302 | | 2,507 | |
* | | Natus Medical Inc. | | 87,750 | | 2,429 | |
* | | Tactile Systems Technology Inc. | | 43,919 | | 2,215 | |
* | | Inogen Inc. | | 47,578 | | 2,206 | |
* | | Lantheus Holdings Inc. | | 98,596 | | 2,146 | |
| | Mesa Laboratories Inc. | | 8,860 | | 1,960 | |
* | | Cerus Corp. | | 352,916 | | 1,895 | |
* | | AngioDynamics Inc. | | 96,279 | | 1,769 | |
*,^ | | CryoPort Inc. | | 78,488 | | 1,708 | |
* | | Surmodics Inc. | | 34,547 | | 1,626 | |
* | | Axogen Inc. | | 89,681 | | 1,421 | |
| | LeMaitre Vascular Inc. | | 42,517 | | 1,346 | |
* | | Heska Corp. | | 18,971 | | 1,332 | |
* | | Antares Pharma Inc. | | 398,195 | | 1,290 | |
* | | OraSure Technologies Inc. | | 156,481 | | 1,033 | |
| | Meridian Bioscience Inc. | | 110,774 | | 1,023 | |
* | | Corindus Vascular Robotics Inc. | | 237,438 | | 1,009 | |
* | | Axonics Modulation Technologies Inc. | | 24,957 | | 830 | |
* | | GenMark Diagnostics Inc. | | 128,214 | | 768 | |
*,^ | | Shockwave Medical Inc. | | 17,779 | | 744 | |
* | | OrthoPediatrics Corp. | | 22,572 | | 727 | |
* | | Accuray Inc. | | 229,599 | | 615 | |
*,^ | | ViewRay Inc. | | 146,956 | | 579 | |
* | | SI-BONE Inc. | | 25,125 | | 488 | |
*,^ | | TransEnterix Inc. | | 472,127 | | 432 | |
| | Invacare Corp. | | 84,223 | | 408 | |
* | | Establishment Labs Holdings Inc. | | 15,690 | | 312 | |
* | | Rockwell Medical Inc. | | 113,250 | | 290 | |
* | | Neuronetics Inc. | | 20,302 | | 217 | |
| | | | | | 2,692,799 | |
Health Care Providers & Services (17.8%) | | | | | |
| | UnitedHealth Group Inc. | | 2,432,279 | | 569,153 | |
| | CVS Health Corp. | | 3,324,643 | | 202,537 | |
| | Anthem Inc. | | 658,191 | | 172,130 | |
| | Cigna Corp. | | 971,007 | | 149,506 | |
| | Humana Inc. | | 345,527 | | 97,857 | |
| | HCA Healthcare Inc. | | 700,621 | | 84,215 | |
| | McKesson Corp. | | 486,365 | | 67,250 | |
* | | Centene Corp. | | 1,058,022 | | 49,325 | |
* | | Laboratory Corp. of America Holdings | | 252,230 | | 42,264 | |
| | Quest Diagnostics Inc. | | 344,060 | | 35,221 | |
* | | WellCare Health Plans Inc. | | 128,982 | | 34,921 | |
| | AmerisourceBergen Corp. Class A | | 403,654 | | 33,209 | |
| | Cardinal Health Inc. | | 762,657 | | 32,893 | |
| | Universal Health Services Inc. Class B | | 212,173 | | 30,676 | |
* | | Henry Schein Inc. | | 381,770 | | 23,525 | |
* | | Molina Healthcare Inc. | | 152,280 | | 19,839 | |
| | Chemed Corp. | | 40,813 | | 17,526 | |
| | Encompass Health Corp. | | 253,533 | | 15,412 | |
*,^ | | DaVita Inc. | | 265,568 | | 14,970 | |
* | | HealthEquity Inc. | | 177,499 | | 10,536 | |
* | | Amedisys Inc. | | 81,769 | | 10,524 | |
* | | LHC Group Inc. | | 76,584 | | 9,075 | |
* | | Guardant Health Inc. | | 93,554 | | 8,189 | |
* | | AMN Healthcare Services Inc. | | 119,122 | | 6,957 | |
| | Ensign Group Inc. | | 128,842 | | 6,429 | |
* | | Acadia Healthcare Co. Inc. | | 227,958 | | 6,032 | |
* | | Premier Inc. Class A | | 158,447 | | 5,587 | |
* | | Tenet Healthcare Corp. | | 225,600 | | 4,884 | |
* | | Select Medical Holdings Corp. | | 294,005 | | 4,769 | |
* | | MEDNAX Inc. | | 222,277 | | 4,686 | |
| | US Physical Therapy Inc. | | 32,847 | | 4,386 | |
| | Patterson Cos. Inc. | | 220,633 | | 3,689 | |
* | | Magellan Health Inc. | | 58,125 | | 3,662 | |
* | | Brookdale Senior Living Inc. | | 429,458 | | 3,513 | |
* | | BioTelemetry Inc. | | 86,105 | | 3,414 | |
* | | Covetrus Inc. | | 255,901 | | 3,401 | |
* | | R1 RCM Inc. | | 227,566 | | 2,653 | |
* | | Addus HomeCare Corp. | | 28,463 | | 2,504 | |
| | National HealthCare Corp. | | 29,254 | | 2,364 | |
* | | Tivity Health Inc. | | 123,371 | | 2,253 | |
* | | CorVel Corp. | | 26,214 | | 2,208 | |
| | National Research Corp. | | 31,712 | | 2,031 | |
* | | Providence Service Corp. | | 29,780 | | 1,674 | |
* | | Hanger Inc. | | 85,652 | | 1,617 | |
* | | PetIQ Inc. Class A | | 49,415 | | 1,564 | |
* | | RadNet Inc. | | 108,863 | | 1,514 | |
*,^ | | Apollo Medical Holdings Inc. | | 64,057 | | 1,254 | |
* | | Triple-S Management Corp. Class B | | 58,766 | | 1,206 | |
* | | Cross Country Healthcare Inc. | | 92,636 | | 950 | |
* | | Diplomat Pharmacy Inc. | | 152,449 | | 886 | |
*,^ | | Community Health Systems Inc. | | 226,122 | | 563 | |
* | | Surgery Partners Inc. | | 50,069 | | 322 | |
*,^ | | Avalon GloboCare Corp. | | 53,203 | | 104 | |
| | | | | | 1,817,829 | |
Health Care Technology (1.7%) | | | | | |
| | Cerner Corp. | | 833,031 | | 57,404 | |
* | | Veeva Systems Inc. Class A | | 327,198 | | 52,476 | |
* | | Medidata Solutions Inc. | | 159,365 | | 14,595 | |
*,^ | | Teladoc Health Inc. | | 174,161 | | 10,081 | |
* | | HMS Holdings Corp. | | 222,978 | | 8,145 | |
* | | Omnicell Inc. | | 105,704 | | 7,590 | |
* | | Allscripts Healthcare Solutions Inc. | | 426,517 | | 3,873 | |
* | | Inovalon Holdings Inc. Class A | | 168,989 | | 2,859 | |
* | | Tabula Rasa HealthCare Inc. | | 47,893 | | 2,720 | |
62
Health Care Index Fund
| | | | | | Market | |
| | | | | | Value· | |
| | | | Shares | | ($000 | ) |
* | | Inspire Medical Systems Inc. | | 30,775 | | 2,139 | |
* | | Vocera Communications Inc. | | 78,739 | | 1,807 | |
* | | NextGen Healthcare Inc. | | 123,971 | | 1,762 | |
* | | HealthStream Inc. | | 67,081 | | 1,695 | |
* | | Evolent Health Inc. Class A | | 189,394 | | 1,301 | |
| | Simulations Plus Inc. | | 32,004 | | 1,156 | |
| | Computer Programs & Systems Inc. | | 34,343 | | 726 | |
* | | Castlight Health Inc. Class B | | 213,558 | | 301 | |
| | | | | | 170,630 | |
Life Sciences Tools & Services (7.3%) | | | | | |
| | Thermo Fisher Scientific Inc. | | 1,023,657 | | 293,851 | |
* | | Illumina Inc. | | 376,159 | | 105,829 | |
* | | IQVIA Holdings Inc. | | 429,183 | | 66,588 | |
| | Agilent Technologies Inc. | | 809,062 | | 57,532 | |
* | | Mettler-Toledo International Inc. | | 63,502 | | 41,707 | |
* | | Waters Corp. | | 177,813 | | 37,677 | |
| | PerkinElmer Inc. | | 283,792 | | 23,470 | |
| | Bio-Techne Corp. | | 96,942 | | 18,571 | |
* | | Bio-Rad Laboratories Inc. Class A | | 53,795 | | 18,167 | |
* | | Charles River Laboratories International Inc. | | 124,833 | | 16,378 | |
* | | PRA Health Sciences Inc. | | 151,370 | | 14,961 | |
| | Bruker Corp. | | 281,377 | | 12,147 | |
* | | Avantor Inc. | | 579,072 | | 10,134 | |
* | | Syneos Health Inc. | | 159,301 | | 8,368 | |
* | | NeoGenomics Inc. | | 249,224 | | 6,226 | |
* | | Medpace Holdings Inc. | | 73,074 | | 5,912 | |
* | | Cambrex Corp. | | 86,020 | | 5,155 | |
| | Luminex Corp. | | 102,918 | | 2,110 | |
* | | Codexis Inc. | | 131,309 | | 1,842 | |
* | | Pacific Biosciences of California Inc. | | 328,073 | | 1,821 | |
*,^ | | Accelerate Diagnostics Inc. | | 76,251 | | 1,433 | |
* | | Quanterix Corp. | | 35,327 | | 930 | |
| | | | | | 750,809 | |
Other (0.0%)2 | | | | | |
*,^,§ | | Corium CVR | | 65,324 | | 12 | |
*,§ | | Clinical Data CVR | | 8,685 | | — | |
*,§ | | MannKind Corp. Warrants Exp. 12/26/2019 | | 98,864 | | — | |
* | | Advaxis Inc. Warrants Exp. 9/11/2024 | | 7,710 | | — | |
| | | | | | 12 | |
Pharmaceuticals (28.1%) | | | | | |
| | Johnson & Johnson | | 6,795,611 | | 872,285 | |
| | Merck & Co. Inc. | | 6,589,748 | | 569,815 | |
| | Pfizer Inc. | | 13,979,525 | | 496,972 | |
| | Eli Lilly & Co. | | 2,236,292 | | 252,634 | |
| | Bristol-Myers Squibb Co. | | 4,186,326 | | 201,237 | |
| | Zoetis Inc. | | 1,224,922 | | 154,855 | |
| | Allergan plc | | 838,913 | | 133,991 | |
* | | Mylan NV | | 1,320,793 | | 25,716 | |
* | | Elanco Animal Health Inc. | | 907,099 | | 23,603 | |
* | | Catalent Inc. | | 372,888 | | 19,666 | |
* | | Jazz Pharmaceuticals plc | | 144,881 | | 18,566 | |
| | Perrigo Co. plc | | 330,141 | | 15,444 | |
* | | Horizon Therapeutics plc | | 473,990 | | 13,096 | |
* | | Nektar Therapeutics Class A | | 446,488 | | 7,845 | |
* | | MyoKardia Inc. | | 112,146 | | 6,030 | |
* | | Zogenix Inc. | | 103,242 | | 4,407 | |
* | | Prestige Consumer Healthcare Inc. | | 133,313 | | 4,250 | |
* | | Reata Pharmaceuticals Inc. Class A | | 50,062 | | 3,860 | |
* | | Supernus Pharmaceuticals Inc. | | 134,615 | | 3,639 | |
* | | Pacira BioSciences Inc. | | 94,647 | | 3,525 | |
* | | Corcept Therapeutics Inc. | | 265,761 | | 3,351 | |
* | | Aerie Pharmaceuticals Inc. | | 112,630 | | 2,440 | |
*,^ | | Cara Therapeutics Inc. | | 103,380 | | 2,423 | |
* | | Theravance Biopharma Inc. | | 108,767 | | 2,396 | |
*,^ | | Omeros Corp. | | 118,691 | | 2,195 | |
* | | Innoviva Inc. | | 181,516 | | 2,104 | |
* | | Amphastar Pharmaceuticals Inc. | | 90,577 | | 2,034 | |
* | | Tricida Inc. | | 50,932 | | 1,777 | |
*,^ | | Tilray Inc. | | 61,825 | | 1,587 | |
*,^ | | TherapeuticsMD Inc. | | 527,552 | | 1,525 | |
* | | Axsome Therapeutics Inc. | | 59,576 | | 1,516 | |
* | | ANI Pharmaceuticals Inc. | | 22,750 | | 1,490 | |
* | | Intersect ENT Inc. | | 81,430 | | 1,334 | |
* | | Endo International plc | | 519,044 | | 1,230 | |
* | | Odonate Therapeutics Inc. | | 36,219 | | 1,116 | |
*,^ | | WaVe Life Sciences Ltd. | | 48,451 | | 1,114 | |
| | Phibro Animal Health Corp. Class A | | 51,862 | | 1,071 | |
* | | Revance Therapeutics Inc. | | 100,787 | | 1,068 | |
* | | Intra-Cellular Therapies Inc. | | 120,110 | | 1,028 | |
* | | Dermira Inc. | | 118,710 | | 951 | |
* | | Cymabay Therapeutics Inc. | | 154,866 | | 917 | |
* | | Collegium Pharmaceutical Inc. | | 68,193 | | 790 | |
* | | Arvinas Inc. | | 28,981 | | 754 | |
* | | Akorn Inc. | | 235,906 | | 682 | |
* | | SIGA Technologies Inc. | | 134,752 | | 676 | |
* | | Amneal Pharmaceuticals Inc. | | 235,102 | | 599 | |
*,^ | | Mallinckrodt plc | | 212,102 | | 549 | |
*,^ | | Evolus Inc. | | 31,420 | | 542 | |
*,^ | | Dova Pharmaceuticals Inc. | | 32,736 | | 491 | |
* | | Xeris Pharmaceuticals Inc. | | 37,689 | | 437 | |
*,^ | | Optinose Inc. | | 41,153 | | 315 | |
* | | Eloxx Pharmaceuticals Inc. | | 38,204 | | 237 | |
* | | Assertio Therapeutics Inc. | | 159,617 | | 230 | |
* | | Kala Pharmaceuticals Inc. | | 46,477 | | 191 | |
| | | | | | 2,872,596 | |
Total Common Stocks
(Cost $8,679,549) | | | 10,208,607 | |
Temporary Cash Investment (0.4%)1 | | | | | |
Money Market Fund (0.4%) | | | | | |
3,4 | | Vanguard Market Liquidity Fund, 2.249% (Cost $38,438) | | 384,386 | | 38,442 | |
Total Investments (100.3%)
(Cost $8,717,987) | | | 10,247,049 | |
| | Amount | |
| | ($000 | ) |
Other Assets and Liabilities (-0.3%) | | | |
Other Assets | | | |
Investment in Vanguard | | 493 | |
Receivables for Accrued Income | | 17,459 | |
Receivables for Capital Shares Issued | | 764 | |
Unrealized Appreciation—OTC Swap Contracts | | 324 | |
Other Assets4 | | 5,229 | |
Total Other Assets | | 24,269 | |
Liabilities | | | |
Payables for Investment Securities Purchased | | (10 | ) |
Collateral for Securities on Loan | | (43,647 | ) |
Payables for Capital Shares Redeemed | | (1,901 | ) |
Payables to Vanguard | | (1,635 | ) |
Other Liabilities | | (9,867 | ) |
Total Liabilities | | (57,060 | ) |
Net Assets (100%) | | 10,214,258 | |
At August 31, 2019, net assets consisted of:
| | Amount | |
| | ($000 | ) |
Paid-in Capital | | 8,797,390 | |
Total Distributable Earnings (Loss) | | 1,416,868 | |
Net Assets | | 10,214,258 | |
| | | |
ETF Shares—Net Assets | | | |
Applicable to 52,424,862 outstanding $.001 par value shares of beneficial interest (unlimited authorization) | | 8,898,531 | |
Net Asset Value Per Share— ETF Shares | | $169.74 | |
| | | |
Admiral Shares—Net Assets | | | |
Applicable to 15,496,040 outstanding $.001 par value shares of beneficial interest (unlimited authorization) | | 1,315,727 | |
Net Asset Value Per Share— Admiral Shares | | $84.91 | |
· See Note A in Notes to Financial Statements.
* Non-income-producing security.
^ Includes partial security positions on loan to broker-dealers. The total value of securities on loan is $40,367,000.
§ Security value determined using significant unobservable inputs.
1 The fund invests a portion of its assets in equity markets through the use of swap contracts. After giving effect to swap investments, the fund’s effective common stock and temporary cash investment positions represent 100.0% and 0.3%, respectively, of net assets.
2 “Other” represents securities that are not classified by the fund’s benchmark index.
3 Affiliated money market fund available only to Vanguard funds and certain trusts and accounts managed by Vanguard. Rate shown is the 7-day yield.
4 Includes $43,647,000 of collateral received for securities on loan, of which $38,418,000 is held in Vanguard Market Liquidity Fund and $5,229,000 is held in cash.
CVR—Contingent Value Rights.
OTC—Over-the-Counter.
63
Health Care Index Fund
Derivative Financial Instruments Outstanding as of Period End |
Over-the-Counter Total Return Swaps |
| | | | | | | | Floating | | | | | |
| | | | | | | | Interest Rate | | Value and | | Value and | |
| | | | | | Notional | | Received | | Unrealized | | Unrealized | |
| | Termination | | | | Amount | | (Paid | )1 | Appreciation | | (Depreciation | ) |
Reference Entity | | Date | | Counterparty | | ($000 | ) | (% | ) | ($000 | ) | ($000 | ) |
Pfizer Inc. | | 2/4/20 | | GSI | | 7,930 | | (2.182 | ) | 324 | | — | |
1 Payment received/paid monthly.
GSI—Goldman Sachs International.
See accompanying Notes, which are an integral part of the Financial Statements.
64
Health Care Index Fund
Statement of Operations
| | Year Ended | |
| | August 31, 2019 | |
| | ($000 | ) |
Investment Income | | | |
Income | | | |
Dividends | | 224,007 | |
Interest1 | | 132 | |
Securities Lending—Net | | 2,310 | |
Total Income | | 226,449 | |
Expenses | | | |
The Vanguard Group—Note B | | | |
Investment Advisory Services | | 1,523 | |
Management and Administrative— ETF Shares | | 6,798 | |
Management and Administrative— Admiral Shares | | 1,013 | |
Marketing and Distribution— ETF Shares | | 373 | |
Marketing and Distribution— Admiral Shares | | 76 | |
Custodian Fees | | 41 | |
Auditing Fees | | 33 | |
Shareholders’ Reports—ETF Shares | | 350 | |
Shareholders’ Reports—Admiral Shares | | 12 | |
Trustees’ Fees and Expenses | | 5 | |
Total Expenses | | 10,224 | |
Net Investment Income | | 216,225 | |
Realized Net Gain (Loss) | | | |
Investment Securities Sold1,2 | | 428,648 | |
Futures Contracts | | (94 | ) |
Swap Contracts | | (1,751 | ) |
Realized Net Gain (Loss) | | 426,803 | |
Change in Unrealized Appreciation (Depreciation) | | | |
Investment Securities1 | | (874,792 | ) |
Futures Contracts | | (9 | ) |
Swap Contracts | | 324 | |
Change in Unrealized Appreciation (Depreciation) | | (874,477 | ) |
Net Increase (Decrease) in Net Assets Resulting from Operations | | (231,449 | ) |
1 Interest income, realized net gain (loss), and change in unrealized appreciation (depreciation) from affiliated companies of the fund were $112,000, ($11,000), and ($4,000), respectively.
2 Includes $469,682,000 of net gain (loss) resulting from in-kind redemptions; such gain (loss) is not taxable to the fund.
Statement of Changes in Net Assets
| | Year Ended August 31, | |
| | 2019 | | 2018 | |
| | ($000) | | ($000) | |
Increase (Decrease) in Net Assets | | | | | |
Operations | | | | | |
Net Investment Income | | 216,225 | | 115,866 | |
Realized Net Gain (Loss) | | 426,803 | | 303,245 | |
Change in Unrealized Appreciation (Depreciation) | | (874,477 | ) | 1,070,942 | |
Net Increase (Decrease) in Net Assets Resulting from Operations | | (231,449 | ) | 1,490,053 | |
Distributions | | | | | |
Net Investment Income | | | | | |
ETF Shares | | (183,804 | ) | (97,160 | ) |
Admiral Shares | | (26,640 | ) | (13,600 | ) |
Realized Capital Gain | | | | | |
ETF Shares | | — | | — | |
Admiral Shares | | — | | — | |
Total Distributions | | (210,444 | ) | (110,760 | ) |
Capital Share Transactions | | | | | |
ETF Shares | | 692,430 | | 387,467 | |
Admiral Shares | | 121,577 | | 149,874 | |
Net Increase (Decrease) from Capital Share Transactions | | 814,007 | | 537,341 | |
Total Increase (Decrease) | | 372,114 | | 1,916,634 | |
Net Assets | | | | | |
Beginning of Period | | 9,842,144 | | 7,925,510 | |
End of Period | | 10,214,258 | | 9,842,144 | |
See accompanying Notes, which are an integral part of the Financial Statements.
65
Health Care Index Fund
Financial Highlights
ETF Shares
For a Share Outstanding | | Year Ended August 31, |
Throughout Each Period | | 2019 | | 2018 | | 2017 | | 2016 | | 2015 |
Net Asset Value, Beginning of Period | | $177.07 | | $151.13 | | $133.25 | | $132.34 | | $117.17 |
Investment Operations | | | | | | | | | | |
Net Investment Income | | 3.6001,2 | | 2.1941 | | 1.9941 | | 1.795 | | 1.350 |
Net Realized and Unrealized Gain (Loss) on Investments | | (7.457) | | 25.846 | | 17.846 | | 1.559 | | 15.105 |
Total from Investment Operations | | (3.857) | | 28.040 | | 19.840 | | 3.354 | | 16.455 |
Distributions | | | | | | | | | | |
Dividends from Net Investment Income | | (3.473) | | (2.100) | | (1.960) | | (2.444) | | (1.285) |
Distributions from Realized Capital Gains | | — | | — | | — | | — | | — |
Total Distributions | | (3.473) | | (2.100) | | (1.960) | | (2.444) | | (1.285) |
Net Asset Value, End of Period | | $169.74 | | $177.07 | | $151.13 | | $133.25 | | $132.34 |
| | | | | | | | | | |
Total Return | | -2.22% | | 18.75% | | 15.06% | | 2.61% | | 14.08% |
| | | | | | | | | | |
Ratios/Supplemental Data | | | | | | | | | | |
Net Assets, End of Period (Millions) | | $8,899 | | $8,594 | | $7,002 | | $5,708 | | $5,826 |
Ratio of Total Expenses to Average Net Assets | | 0.10% | | 0.10% | | 0.10% | | 0.10% | | 0.09% |
Ratio of Net Investment Income to Average Net Assets | | 2.12%2 | | 1.38% | | 1.46% | | 1.40% | | 1.25% |
Portfolio Turnover Rate3 | | 5% | | 6% | | 4% | | 7% | | 4% |
1 Calculated based on average shares outstanding.
2 Net investment income per share and the ratio of net investment income to average net assets include $1.132 and 0.67%, respectively, resulting from a cash payment received in connection with the merger of Cigna Corp. and Express Scripts Holding Co. in December 2018.
3 Excludes the value of portfolio securities received or delivered as a result of in-kind purchases or redemptions of the fund’s capital shares, including ETF Creation Units.
See accompanying Notes, which are an integral part of the Financial Statements.
66
Health Care Index Fund
Financial Highlights
Admiral Shares
For a Share Outstanding | | Year Ended August 31, |
Throughout Each Period | | 2019 | | 2018 | | 2017 | | 2016 | | 2015 |
Net Asset Value, Beginning of Period | | $88.57 | | $75.60 | | $66.65 | | $66.20 | | $58.61 |
Investment Operations | | | | | | | | | | |
Net Investment Income | | 1.8041,2 | | 1.1011 | | .9961 | | .898 | | .676 |
Net Realized and Unrealized Gain (Loss) on Investments | | (3.727) | | 12.920 | | 8.934 | | .774 | | 7.557 |
Total from Investment Operations | | (1.923) | | 14.021 | | 9.930 | | 1.672 | | 8.233 |
Distributions | | | | | | | | | | |
Dividends from Net Investment Income | | (1.737) | | (1.051) | | (.980) | | (1.222) | | (.643) |
Distributions from Realized Capital Gains | | — | | — | | — | | — | | — |
Total Distributions | | (1.737) | | (1.051) | | (.980) | | (1.222) | | (.643) |
Net Asset Value, End of Period | | $84.91 | | $88.57 | | $75.60 | | $66.65 | | $66.20 |
| | | | | | | | | | |
Total Return3 | | -2.21% | | 18.74% | | 15.07% | | 2.61% | | 14.11% |
| | | | | | | | | | |
Ratios/Supplemental Data | | | | | | | | | | |
Net Assets, End of Period (Millions) | | $1,316 | | $1,248 | | $924 | | $800 | | $824 |
Ratio of Total Expenses to Average Net Assets | | 0.10% | | 0.10% | | 0.10% | | 0.10% | | 0.10% |
Ratio of Net Investment Income to Average Net Assets | | 2.12%2 | | 1.38% | | 1.46% | | 1.40% | | 1.24% |
Portfolio Turnover Rate4 | | 5% | | 6% | | 4% | | 7% | | 4% |
1 Calculated based on average shares outstanding.
2 Net investment income per share and the ratio of net investment income to average net assets include $.566 and 0.67%, respectively, resulting from a cash payment received in connection with the merger of Cigna Corp. and Express Scripts Holding Co. in December 2018.
3 Total returns do not include account service fees that may have applied in the periods shown. Fund prospectuses provide information about any applicable account service fees.
4 Excludes the value of portfolio securities received or delivered as a result of in-kind purchases or redemptions of the fund’s capital shares, including ETF Creation Units.
See accompanying Notes, which are an integral part of the Financial Statements.
67
Health Care Index Fund
Notes to Financial Statements
Vanguard Health Care Index Fund is registered under the Investment Company Act of 1940 as an open-end investment company, or mutual fund. The fund offers two classes of shares: ETF Shares and Admiral Shares. Each of the share classes has different eligibility and minimum purchase requirements, and is designed for different types of investors. ETF Shares are listed for trading on NYSE Arca; they can be purchased and sold through a broker.
A. The following significant accounting policies conform to generally accepted accounting principles for U.S. investment companies. The fund consistently follows such policies in preparing its financial statements.
1. Security Valuation: Securities are valued as of the close of trading on the New York Stock Exchange (generally 4 p.m., Eastern time) on the valuation date. Equity securities are valued at the latest quoted sales prices or official closing prices taken from the primary market in which each security trades; such securities not traded on the valuation date are valued at the mean of the latest quoted bid and asked prices. Securities for which market quotations are not readily available, or whose values have been materially affected by events occurring before the fund’s pricing time but after the close of the securities’ primary markets, are valued by methods deemed by the board of trustees to represent fair value. Investments in Vanguard Market Liquidity Fund are valued at that fund’s net asset value. Temporary cash investments are valued using the latest bid prices or using valuations based on a matrix system (which considers such factors as security prices, yields, maturities, and ratings), both as furnished by independent pricing services.
2. Futures Contracts: The fund uses index futures contracts to a limited extent, with the objectives of maintaining full exposure to the stock market, maintaining liquidity, and minimizing transaction costs. The fund may purchase futures contracts to immediately invest incoming cash in the market, or sell futures in response to cash outflows, thereby simulating a fully invested position in the underlying index while maintaining a cash balance for liquidity. The primary risks associated with the use of futures contracts are imperfect correlation between changes in market values of stocks held by the fund and the prices of futures contracts, and the possibility of an illiquid market. Counterparty risk involving futures is mitigated because a regulated clearinghouse is the counterparty instead of the clearing broker. To further mitigate counterparty risk, the fund trades futures contracts on an exchange, monitors the financial strength of its clearing brokers and clearinghouse, and has entered into clearing agreements with its clearing brokers. The clearinghouse imposes initial margin requirements to secure the fund’s performance and requires daily settlement of variation margin representing changes in the market value of each contract. Any assets pledged as initial margin for open contracts are noted in the Statement of Net Assets.
Futures contracts are valued at their quoted daily settlement prices. The notional amounts of the contracts are not recorded in the Statement of Net Assets. Fluctuations in the value of the contracts are recorded in the Statement of Net Assets as an asset (liability) and in the Statement of Operations as unrealized appreciation (depreciation) until the contracts are closed, when they are recorded as realized futures gains (losses).
During the year ended August 31, 2019, the fund’s average investments in long and short futures contracts represented less than 1% and 0% of net assets, respectively, based on the average of the notional amounts at each quarter-end during the period. The fund had no open futures contracts at August 31, 2019.
3. Swap Contracts: The fund has entered into equity swap contracts to earn the total return on selected reference stocks in the fund’s target index. Under the terms of the swaps, the fund receives the total return on the referenced stock (i.e., receiving the increase or paying the decrease in value of the selected reference stock and receiving the equivalent of any dividends in respect of the selected referenced stock) over a specified period of time, applied to a notional amount that represents the value of a designated number of shares of the selected reference stock at the beginning of the equity swap contract. The fund also pays a floating rate that is based on short-term interest rates, applied to the notional amount. At the same time, the fund generally invests an amount approximating the notional amount of the swap in high-quality temporary cash investments.
The notional amounts of swap contracts are not recorded in the Statement of Net Assets. Swaps are valued daily based on market quotations received from independent pricing services or recognized dealers and the change in value is recorded in the Statement of Net Assets as an asset (liability) and in the Statement of Operations as unrealized appreciation (depreciation) until termination of the swap, at which time realized gain (loss) is recorded.
68
Health Care Index Fund
A risk associated with all types of swaps is the possibility that a counterparty may default on its obligation to pay net amounts due to the fund. The fund’s maximum amount subject to counterparty risk is the unrealized appreciation on the swap contract. The fund mitigates its counterparty risk by entering into swaps only with a diverse group of prequalified counterparties, monitoring their financial strength, entering into master netting arrangements with its counterparties, and requiring its counterparties to transfer collateral as security for their performance. In the absence of a default, the collateral pledged or received by the fund cannot be repledged, resold, or rehypothecated. In the event of a counterparty’s default (including bankruptcy), the fund may terminate any swap contracts with that counterparty, determine the net amount owed by either party in accordance with its master netting arrangements, and sell or retain any collateral held up to the net amount owed to the fund under the master netting arrangements. The swap contracts contain provisions whereby a counterparty may terminate open contracts if the fund net assets decline below a certain level, triggering a payment by the fund if the fund is in a net liability position at the time of the termination. The payment amount would be reduced by any collateral the fund has pledged. Any securities pledged as collateral for open contracts are noted in the Statement of Net Assets. The value of collateral received or pledged is compared daily to the value of the swap contracts exposure with each counterparty, and any difference, if in excess of a specified minimum transfer amount, is adjusted and settled within two business days.
During the year ended August 31, 2019, the fund’s average amounts of investments in total return swaps represented less than 1% of net assets, based on the average of notional amounts at each quarter-end during the period.
4. Federal Income Taxes: The fund intends to continue to qualify as a regulated investment company and distribute all of its taxable income. Management has analyzed the fund’s tax positions taken for all open federal income tax years (August 31, 2016–2019), and has concluded that no provision for federal income tax is required in the fund’s financial statements.
5. Distributions: Distributions to shareholders are recorded on the ex-dividend date. Distributions are determined on a tax basis and may differ from net investment income and realized capital gains for financial reporting purposes.
6. Securities Lending: To earn additional income, the fund lends its securities to qualified institutional borrowers. Security loans are subject to termination by the fund at any time, and are required to be secured at all times by collateral in an amount at least equal to the market value of securities loaned. Daily market fluctuations could cause the value of loaned securities to be more or less than the value of the collateral received. When this occurs, the collateral is adjusted and settled before the opening of the market on the next business day. The fund further mitigates its counterparty risk by entering into securities lending transactions only with a diverse group of prequalified counterparties, monitoring their financial strength, and entering into master securities lending agreements with its counterparties. The master securities lending agreements provide that, in the event of a counterparty’s default (including bankruptcy), the fund may terminate any loans with that borrower, determine the net amount owed, and sell or retain the collateral up to the net amount owed to the fund; however, such actions may be subject to legal proceedings. While collateral mitigates counterparty risk, in the event of a default, the fund may experience delays and costs in recovering the securities loaned. The fund invests cash collateral received in Vanguard Market Liquidity Fund, and records a liability in the Statement of Net Assets for the return of the collateral, during the period the securities are on loan. Securities lending income represents fees charged to borrowers plus income earned on invested cash collateral, less expenses associated with the loan. During the term of the loan, the fund is entitled to all distributions made on or in respect of the loaned securities.
7. Credit Facility: The fund and certain other funds managed by The Vanguard Group (“Vanguard”) participate in a $4.3 billion committed credit facility provided by a syndicate of lenders pursuant to a credit agreement that may be renewed annually; each fund is individually liable for its borrowings, if any, under the credit facility. Borrowings may be utilized for temporary and emergency purposes, and are subject to the fund’s regulatory and contractual borrowing restrictions. The participating funds are charged administrative fees and an annual commitment fee of 0.10% of the undrawn amount of the facility; these fees are allocated to the funds based on a method approved by the fund’s board of trustees and included in Management and Administrative expenses on the fund’s Statement of Operations. Any borrowings under this facility bear interest at a rate based upon the higher of the one-month London Interbank Offered Rate, federal funds effective rate, or overnight bank funding rate plus an agreed-upon spread.
The fund had no borrowings outstanding at August 31, 2019, or at any time during the period then ended.
69
Health Care Index Fund
8. Other: Dividend income is recorded on the ex-dividend date. Interest income includes income distributions received from Vanguard Market Liquidity Fund and is accrued daily. Premiums and discounts on debt securities purchased are amortized and accreted, respectively, to interest income over the lives of the respective securities. Security transactions are accounted for on the date securities are bought or sold. Costs used to determine realized gains (losses) on the sale of investment securities are those of the specific securities sold.
Each class of shares has equal rights as to assets and earnings, except that each class separately bears certain class-specific expenses related to maintenance of shareholder accounts (included in Management and Administrative expenses) and shareholder reporting. Marketing and distribution expenses are allocated to each class of shares based on a method approved by the board of trustees. Income, other non-class-specific expenses, and gains and losses on investments are allocated to each class of shares based on its relative net assets.
B. In accordance with the terms of a Funds’ Service Agreement (the “FSA”) between Vanguard and the fund, Vanguard furnishes to the fund investment advisory, corporate management, administrative, marketing, and distribution services at Vanguard’s cost of operations (as defined by the FSA). These costs of operations are allocated to the fund based on methods and guidelines approved by the board of trustees. Vanguard does not require reimbursement in the current period for certain costs of operations (such as deferred compensation/benefits and risk/insurance costs); the fund’s liability for these costs of operations is included in Payables to Vanguard on the Statement of Net Assets. All other costs of operations payable to Vanguard are generally settled twice a month.
Upon the request of Vanguard, the fund may invest up to 0.40% of its net assets as capital in Vanguard. At August 31, 2019, the fund had contributed to Vanguard capital in the amount of $493,000, representing less than 0.01% of the fund’s net assets and 0.20% of Vanguard’s capital received pursuant to the FSA. The fund’s trustees and officers are also directors and employees, respectively, of Vanguard.
C. Various inputs may be used to determine the value of the fund’s investments. These inputs are summarized in three broad levels for financial statement purposes. The inputs or methodologies used to value securities are not necessarily an indication of the risk associated with investing in those securities.
Level 1—Quoted prices in active markets for identical securities.
Level 2—Other significant observable inputs (including quoted prices for similar securities, interest rates, prepayment speeds, credit risk, etc.).
Level 3—Significant unobservable inputs (including the fund’s own assumptions used to determine the fair value of investments). Any investments valued with significant unobservable inputs are noted on the Statement of Net Assets.
The following table summarizes the market value of the fund’s investments and derivatives as of August 31, 2019, based on the inputs used to value them:
| | Level 1 | | Level 2 | | Level 3 | |
Investments | | ($000 | ) | ($000 | ) | ($000 | ) |
Common Stocks | | 10,208,595 | | — | | 12 | |
Temporary Cash Investments | | 38,442 | | — | | — | |
Swap Contracts—Assets | | — | | 324 | | — | |
Total | | 10,247,037 | | 324 | | 12 | |
D. Permanent differences between book-basis and tax-basis components of net assets are reclassified among capital accounts in the financial statements to reflect their tax character. These reclassifications have no effect on net assets or net asset value per share. As of period end, permanent differences primarily attributable to the accounting for in-kind redemptions, passive foreign investment companies, and swap agreements were reclassified between the following accounts:
| | Amount | |
| | ($000 | ) |
| | | |
Paid-in Capital | | 469,649 | |
Total Distributable Earnings (Loss) | | (469,649 | ) |
70
Health Care Index Fund
Temporary differences between book-basis and tax-basis components of total distributable earnings (loss) arise when certain items of income, gain, or loss are recognized in different periods for financial statement and tax purposes; these differences will reverse at some time in the future. The differences are primarily related to the tax deferral on wash sales, the realization of unrealized gains or losses on certain swap agreements, and unrealized gains on passive foreign investment companies. As of period end, the tax-basis components of total distributable earnings (loss) are detailed in the table as follows:
| | Amount | |
| | ($000 | ) |
Undistributed Ordinary Income | | 29,233 | |
Undistributed Long-Term Gains | | — | |
Capital Loss Carryforwards (Non-expiring) | | (140,248 | ) |
Net Unrealized Gains (Losses) | | 1,529,014 | |
As of August 31, 2019, gross unrealized appreciation and depreciation for investments and derivatives based on cost for U.S. federal income tax purposes were as follows:
| | Amount | |
| | ($000 | ) |
Tax Cost | | 8,718,035 | |
Gross Unrealized Appreciation | | 2,442,099 | |
Gross Unrealized Depreciation | | (913,085 | ) |
Net Unrealized Appreciation (Depreciation) | | 1,529,014 | |
E. During the year ended August 31, 2019, the fund purchased $2,455,907,000 of investment securities and sold $1,639,648,000 of investment securities, other than temporary cash investments. Purchases and sales include $1,642,063,000 and $1,136,126,000, respectively, in connection with in-kind purchases and redemptions of the fund’s capital shares.
F. Capital share transactions for each class of shares were:
| | Year Ended August 31, | |
| | | | 2019 | | | | 2018 | |
| | Amount | | Shares | | Amount | | Shares | |
| | ($000) | | (000) | | ($000) | | (000 | ) |
ETF Shares | | | | | | | | | |
Issued | | 1,841,149 | | 10,713 | | 1,206,793 | | 7,410 | |
Issued in Lieu of Cash Distributions | | — | | — | | — | | — | |
Redeemed | | (1,148,719 | ) | (6,825 | ) | (819,326 | ) | (5,200 | ) |
Net Increase (Decrease)—ETF Shares | | 692,430 | | 3,888 | | 387,467 | | 2,210 | |
Admiral Shares | | | | | | | | | |
Issued | | 463,889 | | 5,465 | | 369,026 | | 4,634 | |
Issued in Lieu of Cash Distributions | | 23,415 | | 269 | | 12,050 | | 154 | |
Redeemed | | (365,727 | ) | (4,327 | ) | (231,202 | ) | (2,921 | ) |
Net Increase (Decrease)—Admiral Shares | | 121,577 | | 1,407 | | 149,874 | | 1,867 | |
G. Management has determined that no events or transactions occurred subsequent to August 31, 2019, that would require recognition or disclosure in these financial statements.
71
Industrials Index Fund
Performance Summary
All of the returns in this report represent past performance, which is not a guarantee of future results that may be achieved by the fund. (Current performance may be lower or higher than the performance data cited. For performance data current to the most recent month-end, visit our website at vanguard.com/performance.) Note, too, that both investment returns and principal value can fluctuate widely, so an investor’s shares, when sold, could be worth more or less than their original cost. The returns shown do not reflect taxes that a shareholder would pay on fund distributions or on the sale of fund shares.
Cumulative Performance: August 31, 2009–August 31, 2019
Initial Investment of $10,000
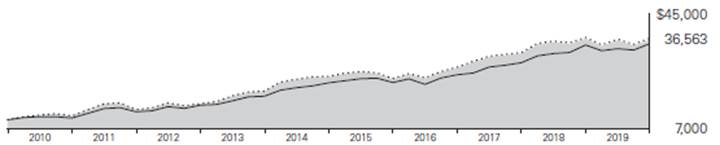
| | | | Average Annual Total Returns | | Final Value |
| | | | Periods Ended August 31, 2019 | | of a $10,000 |
| | | | One Year | | Five Years | | Ten Years | | Investment |

| | Industrials Index Fund ETF Shares Net Asset Value | | -0.73% | | 8.62% | | 13.84% | | $36,563 |
| | Industrials Index Fund ETF Shares Market Price | | -0.75 | | 8.62 | | 13.84 | | 36,546 |

| | Spliced US IMI/Industrials 25/50 | | -0.65 | | 8.71 | | 13.98 | | 37,002 |

| | MSCI US IMI/2500 | | 1.32 | | 9.63 | | 13.41 | | 35,213 |
Spliced US IMI/Industrials 25/50: MSCI US IMI/Industrials through February 28, 2010; MSCI US IMI/Industrials 25/50 thereafter.
| | | | | | | | Final Value |
| | | | | | | | of a $100,000 |
| | One Year | | Five Years | | Ten Years | | Investment |
Industrials Index Fund Admiral Shares | | -0.75% | | 8.63% | | 13.85% | | $365,738 |
Spliced US IMI/Industrials 25/50 | | -0.65 | | 8.71 | | 13.98 | | 370,023 |
MSCI US IMI/2500 | | 1.32 | | 9.63 | | 13.41 | | 352,130 |
Cumulative Returns: ETF Shares, August 31, 2009–August 31, 2019
| | One Year | | Five Years | | Ten Years |
Industrials Index Fund ETF Shares Market Price | | -0.75% | | 51.17% | | 265.46% |
Industrials Index Fund ETF Shares Net Asset Value | | -0.73 | | 51.19 | | 265.63 |
Spliced US IMI/Industrials 25/50 | | -0.65 | | 51.80 | | 270.02 |
For the ETF Shares, the market price is determined by the midpoint of the bid-offer spread as of the closing time of the New York Stock Exchange (generally 4 p.m., Eastern time). The net asset value is also determined as of the NYSE closing time. For more information about how the ETF Shares’ market prices have compared with their net asset value, visit vanguard.com, select your ETF, and then select the Price and Performance tab. The ETF premium/discount analysis there shows the percentages of days on which the ETF Shares’ market price was above or below the NAV.
See Financial Highlights for dividend and capital gains information.
72
Industrials Index Fund
Sector Diversification
As of August 31, 2019
Aerospace & Defense | | 25.2% |
Agricultural & Farm Machinery | | 2.0 |
Air Freight & Logistics | | 5.4 |
Airlines | | 3.8 |
Airport Services | | 0.1 |
Building Products | | 4.0 |
Commercial Printing | | 0.3 |
Construction & Engineering | | 1.6 |
Construction Machinery & Heavy Trucks | | 5.3 |
Diversified Support Services | | 2.0 |
Electrical Components & Equipment | | 5.1 |
Environmental & Facilities Services | | 4.3 |
Heavy Electrical Equipment | | 0.1 |
Human Resource & Employment Services | | 1.0 |
Industrial Conglomerates | | 11.4 |
Industrial Machinery | | 10.7 |
Marine | | 0.2 |
Office Services & Supplies | | 0.5 |
Railroads | | 7.8 |
Research & Consulting Services | | 4.4 |
Security & Alarm Services | | 0.2 |
Trading Companies & Distributors | | 3.0 |
Trucking | | 1.6 |
The table reflects the fund’s equity exposure, based on its investments in stocks and stock index futures. Any holdings in short-term reserves are excluded. Sector categories are based on the Global Industry Classification Standard (“GICS”), except for the “Other” category (if applicable), which includes securities that have not been provided a GICS classification as of the effective reporting period.
The Global Industry Classification Standard (“GICS”) was developed by and is the exclusive property and a service mark of MSCI Inc. (“MSCI”) and Standard and Poor’s, a division of McGraw-Hill Companies, Inc. (“S&P”), and is licensed for use by Vanguard. Neither MSCI, S&P nor any third party involved in making or compiling the GICS or any GICS classification makes any express or implied warranties or representations with respect to such standard or classification (or the results to be obtained by the use thereof), and all such parties hereby expressly disclaim all warranties of originality, accuracy, completeness, merchantability or fitness for a particular purpose with respect to any such standard or classification. Without limiting any of the foregoing, in no event shall MSCI, S&P, any of its affiliates or any third party involved in making or compiling the GICS or any GICS classification have any liability for any direct, indirect, special, punitive, consequential or any other damages (including lost profits) even if notified of the possibility of such damages.
73
Industrials Index Fund
Financial Statements
Statement of Net Assets
As of August 31, 2019
The fund files its complete schedule of portfolio holdings with the Securities and Exchange Commission (SEC) for the first and third quarters of each fiscal year as an exhibit to its reports on Form N-PORT. The fund’s Form N-PORT reports are available on the SEC’s website at www.sec.gov.
| | | | | | Market | |
| | | | | | Value· | |
| | | | Shares | | ($000 | ) |
Common Stocks (99.9%)1 | | | | | |
Aerospace & Defense (25.2%) | | | | | |
| | Boeing Co. | | 670,416 | | 244,092 | |
| | United Technologies Corp. | | 1,027,437 | | 133,813 | |
| | Lockheed Martin Corp. | | 319,176 | | 122,599 | |
| | Northrop Grumman Corp. | | 202,328 | | 74,430 | |
| | Raytheon Co. | | 351,039 | | 65,055 | |
| | General Dynamics Corp. | | 307,992 | | 58,910 | |
| | L3Harris Technologies Inc. | | 277,492 | | 58,665 | |
| | TransDigm Group Inc. | | 60,046 | | 32,324 | |
* | | Teledyne Technologies Inc. | | 45,480 | | 14,035 | |
| | Textron Inc. | | 292,299 | | 13,154 | |
| | Arconic Inc. | | 498,297 | | 12,876 | |
| | Huntington Ingalls Industries Inc. | | 52,171 | | 10,904 | |
| | HEICO Corp. Class A | | 96,095 | | 10,605 | |
| | Spirit AeroSystems Holdings Inc. Class A | | 129,922 | | 10,472 | |
| | Hexcel Corp. | | 106,648 | | 8,974 | |
| | HEICO Corp. | | 53,441 | | 7,731 | |
| | BWX Technologies Inc. | | 119,203 | | 7,057 | |
| | Curtiss-Wright Corp. | | 51,112 | | 6,268 | |
* | | Mercury Systems Inc. | | 69,349 | | 5,938 | |
* | | Aerojet Rocketdyne Holdings Inc. | | 88,710 | | 4,633 | |
* | | Axon Enterprise Inc. | | 74,078 | | 4,443 | |
| | Moog Inc. Class A | | 40,705 | | 3,307 | |
| | Cubic Corp. | | 37,097 | | 2,570 | |
* | | Kratos Defense & Security Solutions Inc. | | 112,822 | | 2,253 | |
| | AAR Corp. | | 41,742 | | 1,793 | |
* | | AeroVironment Inc. | | 26,870 | | 1,385 | |
| | Triumph Group Inc. | | 62,335 | | 1,295 | |
* | | Astronics Corp. | | 30,749 | | 846 | |
* | | Wesco Aircraft Holdings Inc. | | 67,829 | | 746 | |
* | | Ducommun Inc. | | 13,632 | | 561 | |
| | National Presto Industries Inc. | | 6,010 | | 515 | |
| | Park Aerospace Corp. | | 22,738 | | 384 | |
| | | | | | 922,633 | |
Air Freight & Logistics (5.4%) | | | | | |
| | United Parcel Service Inc. Class B | | 874,883 | | 103,814 | |
| | FedEx Corp. | | 310,640 | | 49,271 | |
| | Expeditors International of Washington Inc. | | 215,816 | | 15,344 | |
| | CH Robinson Worldwide Inc. | | 171,179 | | 14,463 | |
* | | XPO Logistics Inc. | | 115,241 | | 8,166 | |
| | Forward Air Corp. | | 35,911 | | 2,237 | |
* | | Hub Group Inc. Class A | | 42,730 | | 1,840 | |
* | | Air Transport Services Group Inc. | | 74,959 | | 1,514 | |
* | | Atlas Air Worldwide Holdings Inc. | | 32,344 | | 836 | |
* | | Echo Global Logistics Inc. | | 34,710 | | 696 | |
* | | Radiant Logistics Inc. | | 46,010 | | 224 | |
| | | | | | 198,405 | |
Airlines (3.8%) | | | | | |
| | Delta Air Lines Inc. | | 738,887 | | 42,752 | |
| | Southwest Airlines Co. | | 613,083 | | 32,077 | |
* | | United Airlines Holdings Inc. | | 297,061 | | 25,045 | |
| | American Airlines Group Inc. | | 502,611 | | 13,224 | |
| | Alaska Air Group Inc. | | 154,978 | | 9,255 | |
* | | JetBlue Airways Corp. | | 376,892 | | 6,528 | |
| | SkyWest Inc. | | 64,168 | | 3,674 | |
* | | Spirit Airlines Inc. | | 85,890 | | 3,224 | |
| | Allegiant Travel Co. Class A | | 16,338 | | 2,320 | |
| | Hawaiian Holdings Inc. | | 60,595 | | 1,479 | |
| | | | | | 139,578 | |
Building Products (4.0%) | | | | | |
| | Johnson Controls International plc | | 998,459 | | 42,624 | |
| | Masco Corp. | | 368,581 | | 15,012 | |
| | Allegion plc | | 117,957 | | 11,356 | |
| | Lennox International Inc. | | 44,323 | | 11,248 | |
| | Fortune Brands Home & Security Inc. | | 175,401 | | 8,956 | |
| | AO Smith Corp. | | 176,884 | | 8,229 | |
| | Owens Corning | | 136,009 | | 7,801 | |
* | | Trex Co. Inc. | | 73,297 | | 6,269 | |
| | Armstrong World Industries Inc. | | 58,261 | | 5,562 | |
| | Simpson Manufacturing Co. Inc. | | 50,344 | | 3,232 | |
| | Universal Forest Products Inc. | | 76,874 | | 3,006 | |
* | | Builders FirstSource Inc. | | 144,869 | | 2,818 | |
| | AAON Inc. | | 52,261 | | 2,507 | |
* | | Resideo Technologies Inc. | | 153,786 | | 2,119 | |
* | | Masonite International Corp. | | 32,153 | | 1,717 | |
| | Advanced Drainage Systems Inc. | | 54,078 | | 1,697 | |
* | | Gibraltar Industries Inc. | | 40,228 | | 1,620 | |
* | | American Woodmark Corp. | | 19,170 | | 1,579 | |
* | | JELD-WEN Holding Inc. | | 81,655 | | 1,409 | |
| | CSW Industrials Inc. | | 18,649 | | 1,272 | |
| | Apogee Enterprises Inc. | | 32,319 | | 1,194 | |
* | | PGT Innovations Inc. | | 73,971 | | 1,184 | |
* | | Continental Building Products Inc. | | 43,146 | | 1,085 | |
* | | Patrick Industries Inc. | | 28,351 | | 1,025 | |
| | Griffon Corp. | | 46,410 | | 810 | |
| | Quanex Building Products Corp. | | 41,311 | | 711 | |
| | Insteel Industries Inc. | | 23,546 | | 440 | |
* | | Cornerstone Building Brands Inc. | | 84,345 | | 396 | |
* | | Armstrong Flooring Inc. | | 20,143 | | 136 | |
| | | | | | 147,014 | |
Commercial Services & Supplies (7.2%) | | | | | |
| | Waste Management Inc. | | 532,511 | | 63,555 | |
| | Waste Connections Inc. | | 330,811 | | 30,401 | |
| | Cintas Corp. | | 111,557 | | 29,429 | |
| | Republic Services Inc. Class A | | 282,254 | | 25,191 | |
* | | Copart Inc. | | 258,741 | | 19,506 | |
* | | IAA Inc. | | 166,474 | | 8,132 | |
| | Rollins Inc. | | 184,761 | | 6,062 | |
| | Tetra Tech Inc. | | 68,990 | | 5,596 | |
* | | Stericycle Inc. | | 114,059 | | 5,120 | |
* | | Clean Harbors Inc. | | 66,498 | | 4,891 | |
| | MSA Safety Inc. | | 46,021 | | 4,861 | |
| | Brink’s Co. | | 62,480 | | 4,702 | |
| | KAR Auction Services Inc. | | 166,860 | | 4,432 | |
| | UniFirst Corp. | | 19,220 | | 3,765 | |
| | Herman Miller Inc. | | 74,336 | | 3,143 | |
* | | Cimpress NV | | 27,002 | | 3,097 | |
| | ABM Industries Inc. | | 82,994 | | 3,092 | |
* | | Advanced Disposal Services Inc. | | 94,497 | | 3,064 | |
| | Brady Corp. Class A | | 61,716 | | 2,914 | |
| | Covanta Holding Corp. | | 148,171 | | 2,548 | |
| | Deluxe Corp. | | 54,767 | | 2,524 | |
* | | Casella Waste Systems Inc. Class A | | 55,057 | | 2,505 | |
^ | | Healthcare Services Group Inc. | | 93,340 | | 2,105 | |
| | McGrath RentCorp | | 30,357 | | 1,944 | |
| | Mobile Mini Inc. | | 56,439 | | 1,764 | |
| | Steelcase Inc. Class A | | 111,127 | | 1,726 | |
| | HNI Corp. | | 54,704 | | 1,706 | |
| | US Ecology Inc. | | 27,597 | | 1,672 | |
| | Viad Corp. | | 25,402 | | 1,642 | |
| | Knoll Inc. | | 62,909 | | 1,451 | |
| | ACCO Brands Corp. | | 127,283 | | 1,180 | |
| | Matthews International Corp. Class A | | 39,849 | | 1,168 | |
* | | SP Plus Corp. | | 28,668 | | 989 | |
^ | | ADT Inc. | | 187,678 | | 893 | |
| | Interface Inc. Class A | | 75,463 | | 834 | |
| | Pitney Bowes Inc. | | 226,603 | | 807 | |
| | Kimball International Inc. Class B | | 45,329 | | 795 | |
* | | BrightView Holdings Inc. | | 39,046 | | 716 | |
| | Ennis Inc. | | 33,199 | | 668 | |
* | | Team Inc. | | 36,352 | | 599 | |
* | | Heritage-Crystal Clean Inc. | | 18,395 | | 451 | |
| | Quad/Graphics Inc. | | 41,482 | | 373 | |
| | VSE Corp. | | 11,192 | | 356 | |
* | | PICO Holdings Inc. | | 24,676 | | 238 | |
* | | Civeo Corp. | | 169,444 | | 235 | |
| | RR Donnelley & Sons Co. | | 87,005 | | 211 | |
| | LSC Communications Inc. | | 42,061 | | 55 | |
| | | | | | 263,108 | |
Construction & Engineering (1.6%) | | | | | |
| | Jacobs Engineering Group Inc. | | 171,557 | | 15,245 | |
* | | AECOM | | 196,966 | | 6,988 | |
74
Industrials Index Fund
| | | | | | Market | |
| | | | | | Value· | |
| | | | Shares | | ($000 | ) |
| | EMCOR Group Inc. | | 70,204 | | 6,139 | |
| | Quanta Services Inc. | | 177,916 | | 6,031 | |
* | | MasTec Inc. | | 76,424 | | 4,805 | |
| | Valmont Industries Inc. | | 27,457 | | 3,720 | |
| | Fluor Corp. | | 175,267 | | 3,097 | |
| | Comfort Systems USA Inc. | | 46,245 | | 1,788 | |
| | Arcosa Inc. | | 54,604 | | 1,774 | |
* | | Dycom Industries Inc. | | 39,535 | | 1,759 | |
| | Granite Construction Inc. | | 58,443 | | 1,662 | |
| | Primoris Services Corp. | | 54,835 | | 1,072 | |
* | | WillScot Corp. Class A | | 67,267 | | 938 | |
* | | Aegion Corp. Class A | | 39,921 | | 788 | |
* | | NV5 Global Inc. | | 12,434 | | 768 | |
| | Argan Inc. | | 17,500 | | 723 | |
* | | MYR Group Inc. | | 21,208 | | 608 | |
* | | Tutor Perini Corp. | | 49,928 | | 499 | |
* | | Ameresco Inc. Class A | | 26,703 | | 385 | |
* | | Construction Partners Inc. Class A | | 16,637 | | 274 | |
* | | IES Holdings Inc. | | 11,345 | | 214 | |
| | | | | | 59,277 | |
Electrical Equipment (5.2%) | | | | | |
| | Emerson Electric Co. | | 771,033 | | 45,946 | |
| | Eaton Corp. plc | | 530,738 | | 42,841 | |
| | AMETEK Inc. | | 285,782 | | 24,557 | |
| | Rockwell Automation Inc. | | 148,542 | | 22,696 | |
* | | Sensata Technologies Holding plc | | 203,024 | | 9,254 | |
| | Hubbell Inc. Class B | | 68,478 | | 8,980 | |
| | Acuity Brands Inc. | | 49,987 | | 6,269 | |
* | | Generac Holdings Inc. | | 78,040 | | 6,086 | |
| | nVent Electric plc | | 196,916 | | 3,989 | |
| | Regal Beloit Corp. | | 53,965 | | 3,826 | |
| | EnerSys | | 53,782 | | 3,012 | |
* | | Atkore International Group Inc. | | 57,991 | | 1,682 | |
* | | Sunrun Inc. | | 93,837 | | 1,439 | |
| | Encore Wire Corp. | | 26,098 | | 1,409 | |
| | AZZ Inc. | | 32,894 | | 1,358 | |
| | GrafTech International Ltd. | | 90,992 | | 1,109 | |
* | | Thermon Group Holdings Inc. | | 41,359 | | 900 | |
* | | Vicor Corp. | | 23,265 | | 709 | |
*,^ | | Plug Power Inc. | | 308,163 | | 669 | |
* | | TPI Composites Inc. | | 35,677 | | 629 | |
| | Powell Industries Inc. | | 11,561 | | 420 | |
* | | Vivint Solar Inc. | | 51,739 | | 417 | |
*,^ | | Bloom Energy Corp. Class A | | 65,396 | | 293 | |
| | | | | | 188,490 | |
Industrial Conglomerates (11.4%) | | | | | |
| | Honeywell International Inc. | | 912,626 | | 150,237 | |
| | 3M Co. | | 723,047 | | 116,931 | |
| | General Electric Co. | | 10,939,138 | | 90,248 | |
| | Roper Technologies Inc. | | 130,258 | | 47,773 | |
| | Carlisle Cos. Inc. | | 71,643 | | 10,385 | |
| | Raven Industries Inc. | | 45,475 | | 1,327 | |
| | | | | | 416,901 | |
Machinery (18.1%) | | | | | |
| | Caterpillar Inc. | | 717,340 | | 85,363 | |
| | Illinois Tool Works Inc. | | 408,576 | | 61,229 | |
| | Deere & Co. | | 377,749 | | 58,517 | |
| | Ingersoll-Rand plc | | 302,426 | | 36,621 | |
| | PACCAR Inc. | | 434,562 | | 28,490 | |
| | Cummins Inc. | | 187,682 | | 28,015 | |
| | Fortive Corp. | | 378,351 | | 26,825 | |
| | Parker-Hannifin Corp. | | 161,087 | | 26,703 | |
| | Stanley Black & Decker Inc. | | 190,168 | | 25,266 | |
| | Xylem Inc. | | 225,838 | | 17,301 | |
| | Dover Corp. | | 182,361 | | 17,095 | |
| | Wabtec Corp. | | 228,257 | | 15,798 | |
| | IDEX Corp. | | 94,965 | | 15,642 | |
| | Snap-on Inc. | | 69,457 | | 10,327 | |
| | Toro Co. | | 133,221 | | 9,593 | |
| | Graco Inc. | | 209,061 | | 9,527 | |
| | Nordson Corp. | | 64,947 | | 8,830 | |
* | | WABCO Holdings Inc. | | 64,188 | | 8,570 | |
| | Donaldson Co. Inc. | | 159,881 | | 7,732 | |
* | | Middleby Corp. | | 69,946 | | 7,670 | |
| | Woodward Inc. | | 70,030 | | 7,553 | |
| | Pentair plc | | 205,221 | | 7,372 | |
| | Flowserve Corp. | | 164,314 | | 7,013 | |
| | Allison Transmission Holdings Inc. | | 143,100 | | 6,358 | |
| | ITT Inc. | | 109,993 | | 6,261 | |
| | Lincoln Electric Holdings Inc. | | 74,725 | | 6,169 | |
| | Oshkosh Corp. | | 87,697 | | 6,162 | |
| | AGCO Corp. | | 81,750 | | 5,651 | |
* | | RBC Bearings Inc. | | 31,092 | | 4,960 | |
* | | Gardner Denver Holdings Inc. | | 164,466 | | 4,717 | |
| | Crane Co. | | 60,038 | | 4,577 | |
| | John Bean Technologies Corp. | | 39,642 | | 4,056 | |
* | | Rexnord Corp. | | 132,526 | | 3,470 | |
| | Timken Co. | | 85,776 | | 3,446 | |
| | Watts Water Technologies Inc. Class A | | 34,801 | | 3,189 | |
| | Kennametal Inc. | | 103,319 | | 3,088 | |
* | | Proto Labs Inc. | | 31,871 | | 3,019 | |
* | | Colfax Corp. | | 110,524 | | 3,006 | |
| | Albany International Corp. Class A | | 36,515 | | 3,002 | |
| | Barnes Group Inc. | | 60,981 | | 2,735 | |
* | | Welbilt Inc. | | 167,825 | | 2,642 | |
* | | Chart Industries Inc. | | 41,943 | | 2,636 | |
| | ESCO Technologies Inc. | | 32,592 | | 2,481 | |
| | Trinity Industries Inc. | | 138,307 | | 2,416 | |
| | Franklin Electric Co. Inc. | | 49,673 | | 2,278 | |
| | Federal Signal Corp. | | 75,795 | | 2,252 | |
| | Terex Corp. | | 89,233 | | 2,216 | |
| | Hillenbrand Inc. | | 78,502 | | 2,154 | |
| | Altra Industrial Motion Corp. | | 80,663 | | 2,096 | |
* | | SPX Corp. | | 54,965 | | 2,086 | |
| | Mueller Water Products Inc. Class A | | 198,703 | | 2,078 | |
* | | Harsco Corp. | | 100,530 | | 1,799 | |
* | | SPX FLOW Inc. | | 53,168 | | 1,792 | |
| | Mueller Industries Inc. | | 67,607 | | 1,782 | |
| | Actuant Corp. Class A | | 77,295 | | 1,717 | |
* | | TriMas Corp. | | 57,641 | | 1,694 | |
* | | Meritor Inc. | | 94,513 | | 1,590 | |
* | | Evoqua Water Technologies Corp. | | 100,779 | | 1,558 | |
| | EnPro Industries Inc. | | 24,882 | | 1,550 | |
| | Helios Technologies Inc. | | 35,930 | | 1,537 | |
| | Tennant Co. | | 21,475 | | 1,469 | |
| | Alamo Group Inc. | | 12,537 | | 1,431 | |
* | | Milacron Holdings Corp. | | 88,358 | | 1,400 | |
* | | Navistar International Corp. | | 55,635 | | 1,280 | |
| | Douglas Dynamics Inc. | | 28,630 | | 1,196 | |
| | Lindsay Corp. | | 13,509 | | 1,192 | |
| | Kadant Inc. | | 13,904 | | 1,144 | |
| | Standex International Corp. | | 15,800 | | 1,086 | |
| | Wabash National Corp. | | 69,437 | | 947 | |
| | Greenbrier Cos. Inc. | | 40,644 | | 947 | |
| | Columbus McKinnon Corp. | | 28,367 | | 918 | |
| | Astec Industries Inc. | | 26,851 | | 741 | |
* | | CIRCOR International Inc. | | 21,276 | | 731 | |
| | Gorman-Rupp Co. | | 23,137 | | 691 | |
* | | Gates Industrial Corp. plc | | 71,808 | | 625 | |
* | | Manitowoc Co. Inc. | | 44,110 | | 551 | |
| | REV Group Inc. | | 34,565 | | 446 | |
* | | Lydall Inc. | | 21,537 | | 433 | |
| | Hyster-Yale Materials Handling Inc. | | 7,861 | | 429 | |
*,^ | | Energy Recovery Inc. | | 39,998 | | 387 | |
| | NN Inc. | | 52,783 | | 339 | |
* | | Blue Bird Corp. | | 17,985 | | 328 | |
| | Omega Flex Inc. | | 3,750 | | 316 | |
| | Park-Ohio Holdings Corp. | | 10,320 | | 281 | |
| | Briggs & Stratton Corp. | | 52,498 | | 227 | |
| | Titan International Inc. | | 64,010 | | 166 | |
| | | | | | 660,973 | |
Marine (0.2%) | | | | | |
* | | Kirby Corp. | | 71,329 | | 5,249 | |
| | Matson Inc. | | 53,476 | | 1,900 | |
* | | Genco Shipping & Trading Ltd. | | 20,450 | | 196 | |
| | | | | | 7,345 | |
Professional Services (5.3%) | | | | | |
| | Verisk Analytics Inc. Class A | | 194,934 | | 31,490 | |
* | | IHS Markit Ltd. | | 476,423 | | 31,258 | |
* | | CoStar Group Inc. | | 45,844 | | 28,188 | |
| | Equifax Inc. | | 151,650 | | 22,198 | |
| | TransUnion | | 235,107 | | 19,667 | |
| | Nielsen Holdings plc | | 445,393 | | 9,246 | |
| | Robert Half International Inc. | | 148,984 | | 7,966 | |
| | ManpowerGroup Inc. | | 74,928 | | 6,125 | |
* | | FTI Consulting Inc. | | 47,603 | | 5,148 | |
| | Insperity Inc. | | 49,084 | | 4,862 | |
| | Exponent Inc. | | 64,986 | | 4,607 | |
* | | ASGN Inc. | | 66,172 | | 4,134 | |
* | | TriNet Group Inc. | | 57,047 | | 3,830 | |
| | Korn Ferry | | 70,965 | | 2,773 | |
| | ICF International Inc. | | 23,676 | | 2,004 | |
* | | Huron Consulting Group Inc. | | 28,666 | | 1,755 | |
* | | CBIZ Inc. | | 65,001 | | 1,452 | |
| | Navigant Consulting Inc. | | 49,274 | | 1,373 | |
* | | TrueBlue Inc. | | 51,025 | | 990 | |
*,^ | | Upwork Inc. | | 67,889 | | 982 | |
| | Kelly Services Inc. Class A | | 39,816 | | 964 | |
| | Kforce Inc. | | 28,603 | | 931 | |
| | Barrett Business Services Inc. | | 9,255 | | 806 | |
| | Resources Connection Inc. | | 38,851 | | 643 | |
| | Heidrick & Struggles International Inc. | | 23,851 | | 633 | |
| | Forrester Research Inc. | | 13,597 | | 474 | |
* | | Willdan Group Inc. | | 12,976 | | 469 | |
| | CRA International Inc. | | 9,995 | | 389 | |
* | | Mistras Group Inc. | | 23,075 | | 337 | |
| | | | | | 195,694 | |
Road & Rail (9.4%) | | | | | |
| | Union Pacific Corp. | | 887,807 | | 143,789 | |
| | CSX Corp. | | 964,241 | | 64,623 | |
| | Norfolk Southern Corp. | | 313,657 | | 54,592 | |
| | Kansas City Southern | | 126,251 | | 15,882 | |
75
Industrials Index Fund
| | | | | | Market | |
| | | | | | Value· | |
| | | | Shares | | ($000 | ) |
| | Old Dominion Freight Line Inc. | | 81,300 | | 13,314 | |
| | JB Hunt Transport Services Inc. | | 109,217 | | 11,800 | |
* | | Genesee & Wyoming Inc. Class A | | 71,022 | | 7,875 | |
| | Landstar System Inc. | | 50,311 | | 5,611 | |
| | Knight-Swift Transportation Holdings Inc. | | 162,723 | | 5,555 | |
| | AMERCO | | 11,052 | | 3,886 | |
| | Ryder System Inc. | | 66,835 | | 3,219 | |
* | | Saia Inc. | | 32,447 | | 2,776 | |
* | | Avis Budget Group Inc. | | 80,562 | | 1,996 | |
| | Werner Enterprises Inc. | | 56,900 | | 1,859 | |
*,^ | | Hertz Global Holdings Inc. | | 107,652 | | 1,304 | |
| | Schneider National Inc. Class B | | 64,669 | | 1,257 | |
| | Heartland Express Inc. | | 56,078 | | 1,154 | |
| | Marten Transport Ltd. | | 51,707 | | 1,017 | |
| | ArcBest Corp. | | 31,646 | | 937 | |
*,^ | | Uber Technologies Inc. | | 11,574 | | 377 | |
* | | Covenant Transportation Group Inc. Class A | | 15,944 | | 229 | |
| | Universal Logistics Holdings Inc. | | 10,571 | | 221 | |
* | | US Xpress Enterprises Inc. Class A | | 26,453 | | 111 | |
* | | YRC Worldwide Inc. | | 40,142 | | 88 | |
* | | Daseke Inc. | | 49,283 | | 87 | |
| | | | | | 343,559 | |
Trading Companies & Distributors (3.0%) | | | | | |
| | Fastenal Co. | | 718,639 | | 22,005 | |
| | WW Grainger Inc. | | 59,157 | | 16,188 | |
* | | United Rentals Inc. | | 98,828 | | 11,124 | |
* | | HD Supply Holdings Inc. | | 214,586 | | 8,350 | |
| | Watsco Inc. | | 40,377 | | 6,604 | |
| | Air Lease Corp. Class A | | 132,406 | | 5,500 | |
* | | SiteOne Landscape Supply Inc. | | 48,818 | | 3,818 | |
| | MSC Industrial Direct Co. Inc. Class A | | 56,277 | | 3,805 | |
* | | Univar Inc. | | 170,579 | | 3,301 | |
| | GATX Corp. | | 43,147 | | 3,202 | |
* | | Beacon Roofing Supply Inc. | | 85,526 | | 2,727 | |
| | Applied Industrial Technologies Inc. | | 48,928 | | 2,612 | |
* | | WESCO International Inc. | | 53,184 | | 2,398 | |
| | Triton International Ltd. | | 66,621 | | 2,142 | |
* | | BMC Stock Holdings Inc. | | 83,307 | | 2,119 | |
| | Kaman Corp. | | 31,551 | | 1,842 | |
* | | NOW Inc. | | 135,930 | | 1,616 | |
| | Aircastle Ltd. | | 70,216 | | 1,534 | |
* | | MRC Global Inc. | | 103,910 | | 1,306 | |
| | Rush Enterprises Inc. Class A | | 35,536 | | 1,283 | |
* | | GMS Inc. | | 40,302 | | 1,187 | |
* | | Herc Holdings Inc. | | 26,766 | | 1,105 | |
| | H&E Equipment Services Inc. | | 40,014 | | 972 | |
* | | DXP Enterprises Inc. | | 20,810 | | 675 | |
* | | CAI International Inc. | | 20,834 | | 441 | |
* | | Foundation Building Materials Inc. | | 24,700 | | 423 | |
| | Systemax Inc. | | 16,485 | | 331 | |
* | | Veritiv Corp. | | 15,782 | | 261 | |
| | Rush Enterprises Inc. Class B | | 4,736 | | 176 | |
* | | General Finance Corp. | | 20,066 | | 166 | |
| | EVI Industries Inc. | | 5,098 | | 152 | |
| | | | | | 109,365 | |
Transportation Infrastructure (0.1%) | | | | | |
| | Macquarie Infrastructure Corp. | | 97,495 | | 3,687 | |
Total Common Stocks | | | | | |
(Cost $3,368,508) | | | | 3,656,029 | |
Temporary Cash Investments (0.1%)1 | | | | | |
Money Market Fund (0.1%) | | | | | |
2,3 | | Vanguard Market Liquidity Fund, 2.249% (Cost $3,128) | | 31,285 | | 3,129 | |
Total Investments (100.0%) | | | | | |
(Cost $3,371,636) | | | | 3,659,158 | |
| | Amount | |
| | ($000 | ) |
Other Assets and Liabilities (0.0%) | | | |
Other Assets | | | |
Investment in Vanguard | | 182 | |
Receivables for Accrued Income | | 9,541 | |
Receivables for Capital Shares Issued | | 219 | |
Unrealized Appreciation—OTC Swap Contracts | | 101 | |
Other Assets3 | | 405 | |
Total Other Assets | | 10,448 | |
Liabilities | | | |
Payables for Investment Securities Purchased | | (5,090 | ) |
Collateral for Securities on Loan | | (3,531 | ) |
Payables for Capital Shares Redeemed | | (293 | ) |
Payables to Vanguard | | (610 | ) |
Other Liabilities | | (675 | ) |
Total Liabilities | | (10,199 | ) |
Net Assets (100%) | | 3,659,407 | |
At August 31, 2019, net assets consisted of:
| | Amount | |
| | ($000 | ) |
Paid-in Capital | | 3,398,097 | |
Total Distributable Earnings (Loss) | | 261,310 | |
Net Assets | | 3,659,407 | |
| | | |
ETF Shares—Net Assets | | | |
Applicable to 24,257,273 outstanding $.001 par value shares of beneficial interest (unlimited authorization) | | 3,457,342 | |
Net Asset Value Per Share—ETF Shares | | $142.53 | |
| | | |
Admiral Shares—Net Assets | | | |
Applicable to 2,759,581 outstanding $.001 par value shares of beneficial interest (unlimited authorization) | | 202,065 | |
Net Asset Value Per Share—Admiral Shares | | $73.22 | |
· See Note A in Notes to Financial Statements.
* Non-income-producing security.
^ Includes partial security positions on loan to broker-dealers. The total value of securities on loan is $3,168,000.
1 The fund invests a portion of its cash reserves in equity markets through the use of swap contracts. After giving effect to swap investments, the fund’s effective common stock and temporary cash investment positions represent 100.0% and 0.0%, respectively, of net assets.
2 Affiliated money market fund available only to Vanguard funds and certain trusts and accounts managed by Vanguard. Rate shown is the 7-day yield.
3 Includes $3,531,000 of collateral received for securities on loan, of which $3,126,000 is held in Vanguard Market Liquidity Fund and $405,000 is held in cash.
OTC—Over-the-Counter.
76
Industrials Index Fund
Derivative Financial Instruments Outstanding as of Period End | | | | | |
| | | | | | | | | | | | | |
Over-the-Counter Total Return Swaps | | | | | | | |
| | | | | | | | Floating | | | | | |
| | | | | | | | Interest Rate | | Value and | | Value and | |
| | | | | | Notional | | Received | | Unrealized | | Unrealized | |
| | Termination | | | | Amount | | (Paid | )1 | Appreciation | | (Depreciation | ) |
Reference Entity | | Date | | Counterparty | | ($000 | ) | (% | ) | ($000 | ) | ($000 | ) |
Norfolk Southern | | 2/4/20 | | GSI | | 3,397 | | (2.182 | ) | 101 | | — | |
1 Payment received/paid monthly.
GSI—Goldman Sachs International.
See accompanying Notes, which are an integral part of the Financial Statements.
77
Industrials Index Fund
Statement of Operations
| | Year Ended | |
| | August 31, 2019 | |
| | ($000 | ) |
Investment Income | | | |
Income | | | |
Dividends | | 72,441 | |
Interest1 | | 51 | |
Securities Lending—Net | | 281 | |
Total Income | | 72,773 | |
Expenses | | | |
The Vanguard Group—Note B | | | |
Investment Advisory Services | | 563 | |
Management and Administrative—ETF Shares | | 2,510 | |
Management and Administrative—Admiral Shares | | 148 | |
Marketing and Distribution—ETF Shares | | 177 | |
Marketing and Distribution—Admiral Shares | | 13 | |
Custodian Fees | | 55 | |
Auditing Fees | | 33 | |
Shareholders’ Reports—ETF Shares | | 186 | |
Shareholders’ Reports—Admiral Shares | | 5 | |
Trustees’ Fees and Expenses | | 2 | |
Total Expenses | | 3,692 | |
Net Investment Income | | 69,081 | |
Realized Net Gain (Loss) | | | |
Investment Securities Sold1,2 | | 268,137 | |
Futures Contracts | | 44 | |
Swap Contracts | | 343 | |
Realized Net Gain (Loss) | | 268,524 | |
Change in Unrealized Appreciation (Depreciation) | | | |
Investment Securities1 | | (460,259 | ) |
Futures Contracts | | — | |
Swap Contracts | | 101 | |
Change in Unrealized Appreciation (Depreciation) | | (460,158 | ) |
Net Increase (Decrease) in Net Assets Resulting from Operations | | (122,553 | ) |
1 Interest income, realized net gain (loss), and change in unrealized appreciation (depreciation) from an affiliated company of the fund were $43,000, ($2,000), and ($1,000), respectively. Purchases and sales are for temporary cash investment purposes.
2 Includes $267,575,000 of net gain (loss) resulting from in-kind redemptions; such gain (loss) is not taxable to the fund.
Statement of Changes in Net Assets
| | Year Ended August 31, | |
| | 2019 | | 2018 | |
| | ($000 | ) | ($000 | ) |
Increase (Decrease) in Net Assets | | | | | |
Operations | | | | | |
Net Investment Income | | 69,081 | | 61,880 | |
Realized Net Gain (Loss) | | 268,524 | | 197,071 | |
Change in Unrealized Appreciation (Depreciation) | | (460,158 | ) | 267,782 | |
Net Increase (Decrease) in Net Assets Resulting from Operations | | (122,553 | ) | 526,733 | |
Distributions | | | | | |
Net Investment Income | | | | | |
ETF Shares | | (62,999 | ) | (57,742 | ) |
Admiral Shares | | (3,522 | ) | (3,306 | ) |
Realized Capital Gain | | | | | |
ETF Shares | | — | | — | |
Admiral Shares | | — | | — | |
Total Distributions | | (66,521 | ) | (61,048 | ) |
Capital Share Transactions | | | | | |
ETF Shares | | (317,178 | ) | 313,464 | |
Admiral Shares | | (4,653 | ) | 13,333 | |
Net Increase (Decrease) from Capital Share Transactions | | (321,831 | ) | 326,797 | |
Total Increase (Decrease) | | (510,905 | ) | 792,482 | |
Net Assets | | | | | |
Beginning of Period | | 4,170,312 | | 3,377,830 | |
End of Period | | 3,659,407 | | 4,170,312 | |
See accompanying Notes, which are an integral part of the Financial Statements.
78
Industrials Index Fund
Financial Highlights
ETF Shares
For a Share Outstanding | | Year Ended August 31, | |
Throughout Each Period | | 2019 | | 2018 | | 2017 | | 2016 | | 2015 | |
Net Asset Value, Beginning of Period | | $146.12 | | $128.70 | | $111.57 | | $99.23 | | $103.95 | |
Investment Operations | | | | | | | | | | | |
Net Investment Income | | 2.597 | 1 | 2.263 | 1 | 2.383 | 1 | 2.083 | | 1.914 | |
Net Realized and Unrealized Gain (Loss) on Investments | | (3.754 | ) | 17.412 | | 16.998 | | 13.204 | | (4.961 | ) |
Total from Investment Operations | | (1.157 | ) | 19.675 | | 19.381 | | 15.287 | | (3.047 | ) |
Distributions | | | | | | | | | | | |
Dividends from Net Investment Income | | (2.433 | ) | (2.255 | ) | (2.251 | ) | (2.947 | ) | (1.673 | ) |
Distributions from Realized Capital Gains | | — | | — | | — | | — | | — | |
Total Distributions | | (2.433 | ) | (2.255 | ) | (2.251 | ) | (2.947 | ) | (1.673 | ) |
Net Asset Value, End of Period | | $142.53 | | $146.12 | | $128.70 | | $111.57 | | $99.23 | |
| | | | | | | | | | | |
Total Return | | -0.73% | | 15.41% | | 17.55% | | 15.78% | | -3.03% | |
| | | | | | | | | | | |
Ratios/Supplemental Data | | | | | | | | | | | |
Net Assets, End of Period (Millions) | | $3,457 | | $3,957 | | $3,202 | | $2,338 | | $1,898 | |
Ratio of Total Expenses to Average Net Assets | | 0.10% | | 0.10% | | 0.10% | | 0.10% | | 0.10% | |
Ratio of Net Investment Income to Average Net Assets | | 1.87% | | 1.62% | | 1.95% | | 2.08% | | 1.83% | |
Portfolio Turnover Rate2 | | 4% | | 4% | | 5% | | 8% | | 4% | |
1 Calculated based on average shares outstanding.
2 Excludes the value of portfolio securities received or delivered as a result of in-kind purchases or redemptions of the fund’s capital shares, including ETF Creation Units.
Admiral Shares
For a Share Outstanding | | Year Ended August 31, | |
Throughout Each Period | | 2019 | | 2018 | | 2017 | | 2016 | | 2015 | |
Net Asset Value, Beginning of Period | | $75.07 | | $66.12 | | $57.32 | | $50.98 | | $53.40 | |
Investment Operations | | | | | | | | | | | |
Net Investment Income | | 1.340 | 1 | 1.154 | 1 | 1.237 | 1 | 1.069 | | .982 | |
Net Realized and Unrealized Gain (Loss) on Investments | | (1.941 | ) | 8.955 | | 8.721 | | 6.783 | | (2.541 | ) |
Total from Investment Operations | | (.601 | ) | 10.109 | | 9.958 | | 7.852 | | (1.559 | ) |
Distributions | | | | | | | | | | | |
Dividends from Net Investment Income | | (1.249 | ) | (1.159 | ) | (1.158 | ) | (1.512 | ) | (.861 | ) |
Distributions from Realized Capital Gains | | — | | — | | — | | — | | — | |
Total Distributions | | (1.249 | ) | (1.159 | ) | (1.158 | ) | (1.512 | ) | (.861 | ) |
Net Asset Value, End of Period | | $73.22 | | $75.07 | | $66.12 | | $57.32 | | $50.98 | |
| | | | | | | | | | | |
Total Return2 | | -0.75% | | 15.41% | | 17.55% | | 15.77% | | -2.98% | |
| | | | | | | | | | | |
Ratios/Supplemental Data | | | | | | | | | | | |
Net Assets, End of Period (Millions) | | $202 | | $213 | | $176 | | $77 | | $66 | |
Ratio of Total Expenses to Average Net Assets | | 0.10% | | 0.10% | | 0.10% | | 0.10% | | 0.10% | |
Ratio of Net Investment Income to Average Net Assets | | 1.87% | | 1.62% | | 1.95% | | 2.08% | | 1.83% | |
Portfolio Turnover Rate3 | | 4% | | 4% | | 5% | | 8% | | 4% | |
1 Calculated based on average shares outstanding.
2 Total returns do not include account service fees that may have applied in the periods shown. Fund prospectuses provide information about any applicable account service fees.
3 Excludes the value of portfolio securities received or delivered as a result of in-kind purchases or redemptions of the fund’s capital shares, including ETF Creation Units.
See accompanying Notes, which are an integral part of the Financial Statements.
79
Industrials Index Fund
Notes to Financial Statements
Vanguard Industrials Index Fund is registered under the Investment Company Act of 1940 as an open-end investment company, or mutual fund. The fund offers two classes of shares: ETF Shares and Admiral Shares. Each of the share classes has different eligibility and minimum purchase requirements, and is designed for different types of investors. ETF Shares are listed for trading on NYSE Arca; they can be purchased and sold through a broker.
A. The following significant accounting policies conform to generally accepted accounting principles for U.S. investment companies. The fund consistently follows such policies in preparing its financial statements.
1. Security Valuation: Securities are valued as of the close of trading on the New York Stock Exchange (generally 4 p.m., Eastern time) on the valuation date. Equity securities are valued at the latest quoted sales prices or official closing prices taken from the primary market in which each security trades; such securities not traded on the valuation date are valued at the mean of the latest quoted bid and asked prices. Securities for which market quotations are not readily available, or whose values have been materially affected by events occurring before the fund’s pricing time but after the close of the securities’ primary markets, are valued by methods deemed by the board of trustees to represent fair value. Investments in Vanguard Market Liquidity Fund are valued at that fund’s net asset value. Temporary cash investments are valued using the latest bid prices or using valuations based on a matrix system (which considers such factors as security prices, yields, maturities, and ratings), both as furnished by independent pricing services.
2. Futures Contracts: The fund uses index futures contracts to a limited extent, with the objectives of maintaining full exposure to the stock market, maintaining liquidity, and minimizing transaction costs. The fund may purchase futures contracts to immediately invest incoming cash in the market, or sell futures in response to cash outflows, thereby simulating a fully invested position in the underlying index while maintaining a cash balance for liquidity. The primary risks associated with the use of futures contracts are imperfect correlation between changes in market values of stocks held by the fund and the prices of futures contracts, and the possibility of an illiquid market. Counterparty risk involving futures is mitigated because a regulated clearinghouse is the counterparty instead of the clearing broker. To further mitigate counterparty risk, the fund trades futures contracts on an exchange, monitors the financial strength of its clearing brokers and clearinghouse, and has entered into clearing agreements with its clearing brokers. The clearinghouse imposes initial margin requirements to secure the fund’s performance and requires daily settlement of variation margin representing changes in the market value of each contract. Any assets pledged as initial margin for open contracts are noted in the Statement of Net Assets.
Futures contracts are valued at their quoted daily settlement prices. The notional amounts of the contracts are not recorded in the Statement of Net Assets. Fluctuations in the value of the contracts are recorded in the Statement of Net Assets as an asset (liability) and in the Statement of Operations as unrealized appreciation (depreciation) until the contracts are closed, when they are recorded as realized futures gains (losses).
During the year ended August 31, 2019, the fund’s average investments in long and short futures contracts each represented less than 1% and 0% of net assets, based on the average of the notional amounts at each quarter-end during the period. The fund had no open futures contracts at August 31, 2019.
3. Swap Contracts: The fund has entered into equity swap contracts to earn the total return on selected reference stocks in the fund’s target index. Under the terms of the swaps, the fund receives the total return on the referenced stock (i.e., receiving the increase or paying the decrease in value of the selected reference stock and receiving the equivalent of any dividends in respect of the selected referenced stock) over a specified period of time, applied to a notional amount that represents the value of a designated number of shares of the selected reference stock at the beginning of the equity swap contract. The fund also pays a floating rate that is based on short-term interest rates, applied to the notional amount. At the same time, the fund generally invests an amount approximating the notional amount of the swap in high-quality temporary cash investments.
The notional amounts of swap contracts are not recorded in the Statement of Net Assets. Swaps are valued daily based on market quotations received from independent pricing services or recognized dealers and the change in value is recorded in the Statement of Net Assets as an asset (liability) and in the Statement of Operations as unrealized appreciation (depreciation) until termination of the swap, at which time realized gain (loss) is recorded.
80
Industrials Index Fund
A risk associated with all types of swaps is the possibility that a counterparty may default on its obligation to pay net amounts due to the fund. The fund’s maximum amount subject to counterparty risk is the unrealized appreciation on the swap contract. The fund mitigates its counterparty risk by entering into swaps only with a diverse group of prequalified counterparties, monitoring their financial strength, entering into master netting arrangements with its counterparties, and requiring its counterparties to transfer collateral as security for their performance. In the absence of a default, the collateral pledged or received by the fund cannot be repledged, resold, or rehypothecated. In the event of a counterparty’s default (including bankruptcy), the fund may terminate any swap contracts with that counterparty, determine the net amount owed by either party in accordance with its master netting arrangements, and sell or retain any collateral held up to the net amount owed to the fund under the master netting arrangements. The swap contracts contain provisions whereby a counterparty may terminate open contracts if the fund net assets decline below a certain level, triggering a payment by the fund if the fund is in a net liability position at the time of the termination. The payment amount would be reduced by any collateral the fund has pledged. Any securities pledged as collateral for open contracts are noted in the Statement of Net Assets. The value of collateral received or pledged is compared daily to the value of the swap contracts exposure with each counterparty, and any difference, if in excess of a specified minimum transfer amount, is adjusted and settled within two business days.
During the year ended August 31, 2019, the fund’s average amounts of investments in total return swaps represented less than 1% of net assets, based on the average of notional amounts at each quarter-end during the period.
4. Federal Income Taxes: The fund intends to continue to qualify as a regulated investment company and distribute all of its taxable income. Management has analyzed the fund’s tax positions taken for all open federal income tax years (August 31, 2016–2019), and has concluded that no provision for federal income tax is required in the fund’s financial statements.
5. Distributions: Distributions to shareholders are recorded on the ex-dividend date. Distributions are determined on a tax basis and may differ from net investment income and realized capital gains for financial reporting purposes.
6. Securities Lending: To earn additional income, the fund lends its securities to qualified institutional borrowers. Security loans are subject to termination by the fund at any time, and are required to be secured at all times by collateral in an amount at least equal to the market value of securities loaned. Daily market fluctuations could cause the value of loaned securities to be more or less than the value of the collateral received. When this occurs, the collateral is adjusted and settled before the opening of the market on the next business day. The fund further mitigates its counterparty risk by entering into securities lending transactions only with a diverse group of prequalified counterparties, monitoring their financial strength, and entering into master securities lending agreements with its counterparties. The master securities lending agreements provide that, in the event of a counterparty’s default (including bankruptcy), the fund may terminate any loans with that borrower, determine the net amount owed, and sell or retain the collateral up to the net amount owed to the fund; however, such actions may be subject to legal proceedings. While collateral mitigates counterparty risk, in the event of a default, the fund may experience delays and costs in recovering the securities loaned. The fund invests cash collateral received in Vanguard Market Liquidity Fund, and records a liability in the Statement of Net Assets for the return of the collateral, during the period the securities are on loan. Securities lending income represents fees charged to borrowers plus income earned on invested cash collateral, less expenses associated with the loan. During the term of the loan, the fund is entitled to all distributions made on or in respect of the loaned securities.
7. Credit Facility: The fund and certain other funds managed by The Vanguard Group (“Vanguard”) participate in a $4.3 billion committed credit facility provided by a syndicate of lenders pursuant to a credit agreement that may be renewed annually; each fund is individually liable for its borrowings, if any, under the credit facility. Borrowings may be utilized for temporary and emergency purposes, and are subject to the fund’s regulatory and contractual borrowing restrictions. The participating funds are charged administrative fees and an annual commitment fee of 0.10% of the undrawn amount of the facility; these fees are allocated to the funds based on a method approved by the fund’s board of trustees and included in Management and Administrative expenses on the fund’s Statement of Operations. Any borrowings under this facility bear interest at a rate based upon the higher of the one-month London Interbank Offered Rate, federal funds effective rate, or overnight bank funding rate plus an agreed-upon spread.
The fund had no borrowings outstanding at August 31, 2019, or at any time during the period then ended.
81
Industrials Index Fund
8. Other: Dividend income is recorded on the ex-dividend date. Interest income includes income distributions received from Vanguard Market Liquidity Fund and is accrued daily. Premiums and discounts on debt securities purchased are amortized and accreted, respectively, to interest income over the lives of the respective securities. Security transactions are accounted for on the date securities are bought or sold. Costs used to determine realized gains (losses) on the sale of investment securities are those of the specific securities sold.
Each class of shares has equal rights as to assets and earnings, except that each class separately bears certain class-specific expenses related to maintenance of shareholder accounts (included in Management and Administrative expenses) and shareholder reporting. Marketing and distribution expenses are allocated to each class of shares based on a method approved by the board of trustees. Income, other non-class-specific expenses, and gains and losses on investments are allocated to each class of shares based on its relative net assets.
B. In accordance with the terms of a Funds’ Service Agreement (the “FSA”) between Vanguard and the fund, Vanguard furnishes to the fund investment advisory, corporate management, administrative, marketing, and distribution services at Vanguard’s cost of operations (as defined by the FSA). These costs of operations are allocated to the fund based on methods and guidelines approved by the board of trustees. Vanguard does not require reimbursement in the current period for certain costs of operations (such as deferred compensation/benefits and risk/insurance costs); the fund’s liability for these costs of operations is included in Payables to Vanguard on the Statement of Net Assets. All other costs of operations payable to Vanguard are generally settled twice a month.
Upon the request of Vanguard, the fund may invest up to 0.40% of its net assets as capital in Vanguard. At August 31, 2019, the fund had contributed to Vanguard capital in the amount of $182,000, representing less than 0.01% of the fund’s net assets and 0.07% of Vanguard’s capital received pursuant to the FSA. The fund’s trustees and officers are also directors and employees, respectively, of Vanguard.
C. Various inputs may be used to determine the value of the fund’s investments. These inputs are summarized in three broad levels for financial statement purposes. The inputs or methodologies used to value securities are not necessarily an indication of the risk associated with investing in those securities.
Level 1—Quoted prices in active markets for identical securities.
Level 2—Other significant observable inputs (including quoted prices for similar securities, interest rates, prepayment speeds, credit risk, etc.).
Level 3—Significant unobservable inputs (including the fund’s own assumptions used to determine the fair value of investments). Any investments valued with significant unobservable inputs are noted on the Statement of Net Assets.
The following table summarizes the market value of the fund’s investments and derivatives as of August 31, 2019, based on the inputs used to value them:
| | Level 1 | | Level 2 | | Level 3 | |
Investments | | ($000 | ) | ($000 | ) | ($000 | ) |
Common Stocks | | 3,656,029 | | — | | — | |
Temporary Cash Investments | | 3,129 | | — | | — | |
Swap Contracts—Assets | | — | | 101 | | — | |
Total | | 3,659,158 | | 101 | | — | |
D. Permanent differences between book-basis and tax-basis components of net assets are reclassified among capital accounts in the financial statements to reflect their tax character. These reclassifications have no effect on net assets or net asset value per share. As of period end, permanent differences primarily attributable to the accounting for in-kind redemptions, the expiration of capital loss carry-forwards, passive foreign investment companies, and swap agreements were reclassified to the following accounts.
| | Amount | |
| | ($000 | ) |
Paid-in Capital | | 262,427 | |
Total Distributable Earnings (Loss) | | (262,427 | ) |
82
Industrials Index Fund
Temporary differences between book-basis and tax-basis components of total distributable earnings (loss) arise when certain items of income, gain, or loss are recognized in different periods for financial statement and tax purposes; these differences will reverse at some time in the future. The differences are primarily related to the tax deferral on wash sales, unrealized gains on passive foreign investment companies and swap agreements. As of period end, the tax-basis components of total distributable earnings (loss) are detailed in the table as follows:
| | Amount | |
| | ($000 | ) |
Undistributed Ordinary Income | | 16,687 | |
Undistributed Long-term Gains | | — | |
Capital Loss Carryforwards (Non-expiring)* | | (42,411 | ) |
Net Unrealized Gains (Losses) | | 287,465 | |
* The fund used capital loss carryforwards of $606,000 to offset taxable capital gains realized during the year ended August 31, 2019.
As of August 31, 2019, gross unrealized appreciation and depreciation for investments based on cost for U.S. federal income tax purposes were as follows:
| | Amount | |
| | ($000 | ) |
Tax Cost | | 3,371,693 | |
Gross Unrealized Appreciation | | 701,587 | |
Gross Unrealized Depreciation | | (414,122 | ) |
Net Unrealized Appreciation (Depreciation) | | 287,465 | |
E. During the year ended August 31, 2019, the fund purchased $751,619,000 of investment securities and sold $1,070,741,000 of investment securities, other than temporary cash investments. Purchases and sales include $550,805,000 and $928,582,000, respectively, in connection with in-kind purchases and redemptions of the fund’s capital shares.
F. Capital share transactions for each class of shares were:
| | Year Ended August 31, | |
| | | | 2019 | | | | | 2018 | |
| | Amount | | Shares | | Amount | | Shares | |
| | ($000 | ) | (000 | ) | ($000 | ) | (000 | ) |
ETF Shares | | | | | | | | | |
Issued | | 613,810 | | 4,352 | | 895,688 | | 6,351 | |
Issued in Lieu of Cash Distributions | | — | | — | | — | | — | |
Redeemed | | (930,988 | ) | (7,175 | ) | (582,224 | ) | (4,150 | ) |
Net Increase (Decrease)—ETF Shares | | (317,178 | ) | (2,823 | ) | 313,464 | | 2,201 | |
Admiral Shares | | | | | | | | | |
Issued | | 68,108 | | 955 | | 115,722 | | 1,602 | |
Issued in Lieu of Cash Distributions | | 2,995 | | 42 | | 2,828 | | 40 | |
Redeemed | | (75,756 | ) | (1,078 | ) | (105,217 | ) | (1,459 | ) |
Net Increase (Decrease)—Admiral Shares | | (4,653 | ) | (81 | ) | 13,333 | | 183 | |
At August 31, 2019, one shareholder was the record or beneficial owner of 44% of the fund’s net assets. If this shareholder were to redeem its investment in the fund, the redemption might result in an increase in the fund’s expense ratio, cause the fund to incur higher transaction costs, or lead to the realization of taxable capital gains.
G. Management has determined that no events or transactions occurred subsequent to August 31, 2019, that would require recognition or disclosure in these financial statements.
83
Information Technology Index Fund
Performance Summary
All of the returns in this report represent past performance, which is not a guarantee of future results that may be achieved by the fund. (Current performance may be lower or higher than the performance data cited. For performance data current to the most recent month-end, visit our website at vanguard.com/performance.) Note, too, that both investment returns and principal value can fluctuate widely, so an investor’s shares, when sold, could be worth more or less than their original cost. The returns shown do not reflect taxes that a shareholder would pay on fund distributions or on the sale of fund shares.
Cumulative Performance: August 31, 2009–August 31, 2019
Initial Investment of $10,000
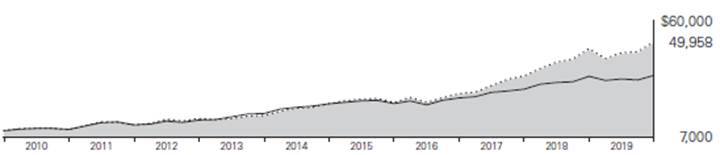
| | | | Average Annual Total Returns | | Final Value |
| | | | Periods Ended August 31, 2019 | | of a $10,000 |
| | | | One Year | | Five Years | | Ten Years | | Investment |

| | Information Technology Index Fund ETF Shares Net Asset Value | | 6.70% | | 17.63% | | 17.45% | | $49,958 |
| | Information Technology Index Fund ETF Shares Market Price | | 6.63 | | 17.62 | | 17.43 | | 49,869 |

| | Information Technology Spliced Index | | 6.80 | | 17.75 | | 17.61 | | 50,616 |

| | MSCI US IMI/2500 | | 1.32 | | 9.63 | | 13.41 | | 35,213 |
Information Technology Spliced Index: MSCI US IMI/Information Technology through February 28, 2010; MSCI US IMI/Information Technology 25/50 through May 2, 2018; MSCI US IMI/ Information Technology 25/50 Transition Index through December 2, 2018; MSCI US IMI/ Information Technology 25/50 thereafter.
| | | | | | | | Final Value |
| | | | | | | | of a $100,000 |
| | One Year | | Five Years | | Ten Years | | Investment |
Information Technology Index Fund Admiral Shares | | 6.70% | | 17.65% | | 17.46% | | $499,802 |
Information Technology Spliced Index | | 6.80 | | 17.75 | | 17.61 | | 506,162 |
MSCI US IMI/2500 | | 1.32 | | 9.63 | | 13.41 | | 352,130 |
Cumulative Returns: ETF Shares, August 31, 2009–August 31, 2019
| | One Year | | Five Years | | Ten Years |
Information Technology Index Fund ETF Shares Market Price | | 6.63% | | 125.10% | | 398.69% |
Information Technology Index Fund ETF Shares Net Asset Value | | 6.70 | | 125.25 | | 399.58 |
Information Technology Spliced Index | | 6.80 | | 126.4 | | 406.16 |
For the ETF Shares, the market price is determined by the midpoint of the bid-offer spread as of the closing time of the New York Stock Exchange (generally 4 p.m., Eastern time). The net asset value is also determined as of the NYSE closing time. For more information about how the ETF Shares’ market prices have compared with their net asset value, visit vanguard.com, select your ETF, and then select the Price and Performance tab. The ETF premium/discount analysis there shows the percentages of days on which the ETF Shares’ market price was above or below the NAV.
See Financial Highlights for dividend and capital gains information.
84
Information Technology Index Fund
Sector Diversification
As of August 31, 2019
Application Software | | 11.8 | % |
Communications Equipment | | 4.7 | |
Data Processing & Outsourced Services | | 17.7 | |
Electronic Components | | 1.1 | |
Electronic Equipment & Instruments | | 1.2 | |
Electronic Manufacturing Services | | 0.9 | |
Internet Services & Infrastructure | | 1.3 | |
IT Consulting & Other Services | | 5.8 | |
Semiconductor Equipment | | 2.4 | |
Semiconductors | | 14.9 | |
Systems Software | | 20.4 | |
Technology Distributors | | 0.6 | |
Technology Hardware, Storage & Peripherals | | 17.2 | |
The table reflects the fund’s equity exposure, based on its investments in stocks and stock index futures. Any holdings in short-term reserves are excluded. Sector categories are based on the Global Industry Classification Standard (“GICS”), except for the “Other” category (if applicable), which includes securities that have not been provided a GICS classification as of the effective reporting period.
The Global Industry Classification Standard (“GICS”) was developed by and is the exclusive property and a service mark of MSCI Inc. (“MSCI”) and Standard and Poor’s, a division of McGraw-Hill Companies, Inc. (“S&P”), and is licensed for use by Vanguard. Neither MSCI, S&P nor any third party involved in making or compiling the GICS or any GICS classification makes any express or implied warranties or representations with respect to such standard or classification (or the results to be obtained by the use thereof), and all such parties hereby expressly disclaim all warranties of originality, accuracy, completeness, merchantability or fitness for a particular purpose with respect to any such standard or classification. Without limiting any of the foregoing, in no event shall MSCI, S&P, any of its affiliates or any third party involved in making or compiling the GICS or any GICS classification have any liability for any direct, indirect, special, punitive, consequential or any other damages (including lost profits) even if notified of the possibility of such damages.
85
Information Technology Index Fund
Financial Statements
Statement of Net Assets
As of August 31, 2019
The fund files its complete schedule of portfolio holdings with the Securities and Exchange Commission (SEC) for the first and third quarters of each fiscal year as an exhibit to its reports on Form N-PORT. The fund’s Form N-PORT reports are available on the SEC’s website at www.sec.gov.
| | | | Market | |
| | | | Value· | |
| | Shares | | ($000 | ) |
Common Stocks (99.5%)1 | | | | | |
Communications Equipment (4.7%) | | | | | |
| Cisco Systems Inc. | | 15,852,561 | | 742,058 | |
| Motorola Solutions Inc. | | 610,150 | | 110,382 | |
* | Arista Networks Inc. | | 198,659 | | 45,020 | |
| Juniper Networks Inc. | | 1,274,185 | | 29,510 | |
* | F5 Networks Inc. | | 220,511 | | 28,386 | |
* | Ciena Corp. | | 575,245 | | 23,545 | |
* | Lumentum Holdings Inc. | | 282,466 | | 15,750 | |
* | Viavi Solutions Inc. | | 849,035 | | 11,793 | |
* | ViaSat Inc. | | 146,318 | | 11,607 | |
* | Finisar Corp. | | 413,207 | | 9,343 | |
* | CommScope Holding Co. Inc. | | 711,384 | | 7,640 | |
* | Acacia Communications Inc. | | 121,022 | | 7,631 | |
* | EchoStar Corp. Class A | | 179,745 | | 7,594 | |
* | NetScout Systems Inc. | | 287,060 | | 6,358 | |
| InterDigital Inc. | | 117,422 | | 5,774 | |
| Ubiquiti Inc. | | 51,400 | | 5,680 | |
* | NETGEAR Inc. | | 116,670 | | 4,051 | |
| Plantronics Inc. | | 123,778 | | 3,846 | |
* | Infinera Corp. | | 592,873 | | 3,160 | |
* | Extreme Networks Inc. | | 437,519 | | 2,923 | |
| Comtech Telecommunications Corp. | | 88,206 | | 2,360 | |
* | Harmonic Inc. | | 338,604 | | 2,231 | |
| ADTRAN Inc. | | 184,962 | | 1,900 | |
* | Calix Inc. | | 199,538 | | 1,199 | |
* | CalAmp Corp. | | 124,890 | | 1,199 | |
* | Ribbon Communications Inc. | | 205,117 | | 1,061 | |
* | Casa Systems Inc. | | 109,041 | | 628 | |
* | Applied Optoelectronics Inc. | | 70,310 | | 626 | |
| | | | | 1,093,255 | |
Electronic Equipment, Instruments & Components (3.8%) | | | | | |
| TE Connectivity Ltd. | | 1,247,486 | | 113,796 | |
| Amphenol Corp. Class A | | 1,106,405 | | 96,855 | |
| Corning Inc. | | 2,906,455 | | 80,945 | |
* | Keysight Technologies Inc. | | 697,008 | | 67,512 | |
| CDW Corp. | | 539,819 | | 62,349 | |
* | Zebra Technologies Corp. | | 200,265 | | 41,060 | |
* | Trimble Inc. | | 932,225 | | 34,977 | |
| Cognex Corp. | | 635,668 | | 28,656 | |
| FLIR Systems Inc. | | 503,023 | | 24,784 | |
* | Arrow Electronics Inc. | | 313,422 | | 21,689 | |
| National Instruments Corp. | | 464,645 | | 19,515 | |
* | Flex Ltd. | | 1,901,375 | | 18,310 | |
* | IPG Photonics Corp. | | 138,247 | | 17,105 | |
| Avnet Inc. | | 393,927 | | 16,502 | |
| Jabil Inc. | | 507,637 | | 14,625 | |
| Dolby Laboratories Inc. Class A | | 237,379 | | 14,613 | |
| Littelfuse Inc. | | 91,540 | | 14,287 | |
| SYNNEX Corp. | | 162,240 | | 13,597 | |
* | Coherent Inc. | | 90,178 | | 13,072 | |
* | Tech Data Corp. | | 136,111 | | 12,622 | |
* | Novanta Inc. | | 130,333 | | 9,775 | |
* | Rogers Corp. | | 69,136 | | 9,155 | |
* | Itron Inc. | | 131,307 | | 9,119 | |
* | II-VI Inc. | | 220,756 | | 8,281 | |
| Vishay Intertechnology Inc. | | 491,002 | | 7,773 | |
* | Sanmina Corp. | | 257,523 | | 7,442 | |
* | Anixter International Inc. | | 117,821 | | 7,066 | |
* | Fabrinet | | 137,158 | | 6,925 | |
* | Knowles Corp. | | 339,604 | | 6,887 | |
| Belden Inc. | | 146,261 | | 6,671 | |
* | OSI Systems Inc. | | 63,378 | | 6,655 | |
* | Plexus Corp. | | 111,059 | | 6,354 | |
* | Insight Enterprises Inc. | | 131,622 | | 6,326 | |
| Badger Meter Inc. | | 106,192 | | 5,477 | |
| Methode Electronics Inc. | | 137,834 | | 4,375 | |
* | ePlus Inc. | | 50,067 | | 4,092 | |
* | TTM Technologies Inc. | | 371,393 | | 3,959 | |
| MTS Systems Corp. | | 67,511 | | 3,839 | |
| Benchmark Electronics Inc. | | 136,102 | | 3,604 | |
| KEMET Corp. | | 200,561 | | 3,359 | |
| CTS Corp. | | 111,962 | | 3,194 | |
* | FARO Technologies Inc. | | 62,160 | | 3,061 | |
* | Fitbit Inc. Class A | | 855,741 | | 2,644 | |
* | ScanSource Inc. | | 92,893 | | 2,625 | |
| AVX Corp. | | 191,091 | | 2,589 | |
| PC Connection Inc. | | 42,700 | | 1,504 | |
* | nLight Inc. | | 98,458 | | 1,272 | |
* | Kimball Electronics Inc. | | 94,115 | | 1,243 | |
| Daktronics Inc. | | 136,857 | | 990 | |
* | Arlo Technologies Inc. | | 276,467 | | 868 | |
| | | | | 873,995 | |
IT Services (24.8%) | | | | | |
| Visa Inc. Class A | | 5,939,793 | | 1,074,033 | |
| Mastercard Inc. Class A | | 3,365,829 | | 947,043 | |
| Accenture plc Class A | | 2,361,966 | | 468,071 | |
* | PayPal Holdings Inc. | | 4,133,519 | | 450,760 | |
| International Business Machines Corp. | | 3,283,241 | | 444,978 | |
| Fidelity National Information Services Inc. | | 2,272,236 | | 309,524 | |
| Automatic Data Processing Inc. | | 1,611,634 | | 273,720 | |
* | Fiserv Inc. | | 2,129,207 | | 227,697 | |
| Cognizant Technology Solutions Corp. Class A | | 2,107,918 | | 129,405 | |
| Paychex Inc. | | 1,197,293 | | 97,819 | |
| Global Payments Inc. | | 580,328 | | 96,323 | |
* | FleetCor Technologies Inc. | | 319,191 | | 95,247 | |
| Total System Services Inc. | | 622,528 | | 83,556 | |
* | VeriSign Inc. | | 397,237 | | 80,977 | |
* | Square Inc. | | 1,245,535 | | 77,024 | |
| Broadridge Financial Solutions Inc. | | 429,891 | | 55,645 | |
* | Akamai Technologies Inc. | | 607,708 | | 54,165 | |
* | Twilio Inc. Class A | | 411,823 | | 53,731 | |
* | Okta Inc. | | 385,087 | | 48,713 | |
* | Gartner Inc. | | 333,573 | | 44,589 | |
| Leidos Holdings Inc. | | 507,082 | | 44,299 | |
| Jack Henry & Associates Inc. | | 286,035 | | 41,464 | |
* | GoDaddy Inc. Class A | | 650,238 | | 41,186 | |
| Booz Allen Hamilton Holding Corp. Class A | | 518,273 | | 39,135 | |
* | EPAM Systems Inc. | | 202,413 | | 38,728 | |
| Western Union Co. | | 1,599,740 | | 35,386 | |
| DXC Technology Co. | | 996,135 | | 33,092 | |
* | Black Knight Inc. | | 527,248 | | 32,821 | |
* | WEX Inc. | | 160,401 | | 32,810 | |
* | Euronet Worldwide Inc. | | 192,419 | | 29,467 | |
| Sabre Corp. | | 1,013,048 | | 23,948 | |
* | MongoDB Inc. | | 155,329 | | 23,658 | |
* | CACI International Inc. Class A | | 92,337 | | 20,526 | |
*,^ | Alliance Data Systems Corp. | | 161,883 | | 19,904 | |
| MAXIMUS Inc. | | 237,625 | | 18,283 | |
| Science Applications International Corp. | | 196,635 | | 17,306 | |
* | CoreLogic Inc. | | 296,465 | | 14,349 | |
| Perspecta Inc. | | 544,272 | | 14,124 | |
| KBR Inc. | | 524,356 | | 13,382 | |
* | LiveRamp Holdings Inc. | | 243,539 | | 10,316 | |
* | ExlService Holdings Inc. | | 127,239 | | 8,614 | |
| EVERTEC Inc. | | 224,325 | | 7,820 | |
| ManTech International Corp. Class A | | 99,277 | | 6,977 | |
| CSG Systems International Inc. | | 121,426 | | 6,542 | |
* | Verra Mobility Corp. Class A | | 381,539 | | 5,311 | |
| NIC Inc. | | 245,761 | | 5,117 | |
* | Perficient Inc. | | 123,275 | | 4,541 | |
* | Conduent Inc. | | 662,221 | | 4,311 | |
* | Sykes Enterprises Inc. | | 147,169 | | 4,268 | |
* | Cardtronics plc Class A | | 143,532 | | 4,251 | |
* | Evo Payments Inc. Class A | | 133,664 | | 3,967 | |
* | Virtusa Corp. | | 108,535 | | 3,922 | |
| Switch Inc. | | 188,030 | | 3,084 | |
| TTEC Holdings Inc. | | 62,138 | | 2,915 | |
| Presidio Inc. | | 174,339 | | 2,793 | |
| Cass Information Systems Inc. | | 47,168 | | 2,387 | |
*,^ | Tucows Inc. Class A | | 35,757 | | 1,804 | |
*,^ | USA Technologies Inc. | | 205,094 | | 1,688 | |
| Hackett Group Inc. | | 93,085 | | 1,501 | |
* | Carbonite Inc. | | 121,049 | | 1,459 | |
*,^ | GreenSky Inc. Class A | | 209,704 | | 1,426 | |
86
Information Technology Index Fund
| | | | Market | |
| | | | Value· | |
| | Shares | | ($000 | ) |
*,^ | Paysign Inc. | | 101,988 | | 1,355 | |
* | Unisys Corp. | | 184,264 | | 1,205 | |
*,^ | GTT Communications Inc. | | 114,102 | | 1,085 | |
* | Limelight Networks Inc. | | 417,374 | | 1,014 | |
* | Endurance International Group Holdings Inc. | | 150,438 | | 758 | |
* | International Money Express Inc. | | 46,009 | | 600 | |
* | Exela Technologies Inc. | | 226,169 | | 260 | |
| | | | | 5,748,179 | |
Semiconductors & Semiconductor Equipment (17.2%) | | | | | |
| Intel Corp. | | 16,579,273 | | 786,023 | |
| Texas Instruments Inc. | | 3,474,284 | | 429,943 | |
| Broadcom Inc. | | 1,465,916 | | 414,326 | |
| NVIDIA Corp. | | 2,142,571 | | 358,902 | |
| QUALCOMM Inc. | | 4,501,976 | | 350,119 | |
* | Micron Technology Inc. | | 4,098,513 | | 185,540 | |
| Applied Materials Inc. | | 3,466,934 | | 166,482 | |
| Analog Devices Inc. | | 1,369,345 | | 150,395 | |
* | Advanced Micro Devices Inc. | | 3,805,343 | | 119,678 | |
| Lam Research Corp. | | 555,264 | | 116,889 | |
| Xilinx Inc. | | 940,370 | | 97,855 | |
| KLA Corp. | | 598,545 | | 88,525 | |
| Microchip Technology Inc. | | 881,196 | | 76,074 | |
| Marvell Technology Group Ltd. | | 2,318,981 | | 55,586 | |
| Maxim Integrated Products Inc. | | 1,010,618 | | 55,119 | |
| Skyworks Solutions Inc. | | 639,406 | | 48,128 | |
| Teradyne Inc. | | 634,801 | | 33,625 | |
| Universal Display Corp. | | 157,391 | | 32,339 | |
* | Qorvo Inc. | | 441,144 | | 31,511 | |
| Cypress Semiconductor Corp. | | 1,352,316 | | 31,117 | |
* | ON Semiconductor Corp. | | 1,531,586 | | 27,262 | |
| Monolithic Power Systems Inc. | | 151,528 | | 22,814 | |
| Entegris Inc. | | 503,849 | | 21,580 | |
| Versum Materials Inc. | | 404,332 | | 21,025 | |
* | Mellanox Technologies Ltd. | | 172,308 | | 18,446 | |
* | First Solar Inc. | | 293,746 | | 18,233 | |
* | Silicon Laboratories Inc. | | 161,167 | | 17,567 | |
* | Cree Inc. | | 389,840 | | 16,736 | |
| MKS Instruments Inc. | | 200,266 | | 15,679 | |
| Cabot Microelectronics Corp. | | 108,542 | | 13,530 | |
* | SolarEdge Technologies Inc. | | 157,692 | | 12,918 | |
* | Cirrus Logic Inc. | | 213,866 | | 11,472 | |
* | Semtech Corp. | | 247,261 | | 10,377 | |
| Power Integrations Inc. | | 109,711 | | 9,766 | |
* | Inphi Corp. | | 150,930 | | 9,235 | |
* | Lattice Semiconductor Corp. | | 462,856 | | 9,114 | |
| Brooks Automation Inc. | | 267,528 | | 8,917 | |
* | Enphase Energy Inc. | | 288,090 | | 8,548 | |
* | Advanced Energy Industries Inc. | | 139,830 | | 7,221 | |
* | Ambarella Inc. | | 110,287 | | 6,162 | |
* | Diodes Inc. | | 159,535 | | 5,831 | |
* | Rambus Inc. | | 406,644 | | 5,099 | |
| Kulicke & Soffa Industries Inc. | | 241,267 | | 5,026 | |
* | MaxLinear Inc. | | 245,806 | | 4,872 | |
* | FormFactor Inc. | | 280,779 | | 4,798 | |
* | Synaptics Inc. | | 127,681 | | 4,088 | |
* | Amkor Technology Inc. | | 395,907 | | 3,464 | |
| Xperi Corp. | | 185,027 | | 3,390 | |
* | MACOM Technology Solutions Holdings Inc. | | 168,292 | | 3,305 | |
*,^ | SunPower Corp. Class A | | 229,468 | | 2,873 | |
* | Photronics Inc. | | 248,295 | | 2,682 | |
* | Rudolph Technologies Inc. | | 116,199 | | 2,555 | |
* | CEVA Inc. | | 80,127 | | 2,517 | |
* | Nanometrics Inc. | | 89,645 | | 2,446 | |
*,^ | Impinj Inc. | | 54,928 | | 1,998 | |
* | Axcelis Technologies Inc. | | 122,581 | | 1,877 | |
* | Ichor Holdings Ltd. | | 84,009 | | 1,786 | |
| Cohu Inc. | | 149,345 | | 1,780 | |
* | Ultra Clean Holdings Inc. | | 139,225 | | 1,662 | |
* | Veeco Instruments Inc. | | 174,440 | | 1,615 | |
* | SMART Global Holdings Inc. | | 49,650 | | 1,411 | |
* | PDF Solutions Inc. | | 96,082 | | 1,125 | |
| NVE Corp. | | 17,336 | | 1,113 | |
* | Aquantia Corp. | | 82,919 | | 1,093 | |
* | Alpha & Omega Semiconductor Ltd. | | 72,234 | | 851 | |
* | NeoPhotonics Corp. | | 129,533 | | 811 | |
| | | | | 3,984,846 | |
Software (31.9%) | | | | | |
| Microsoft Corp. | | 26,958,400 | | 3,716,485 | |
* | Adobe Inc. | | 1,807,018 | | 514,115 | |
* | salesforce.com Inc. | | 3,079,242 | | 480,577 | |
| Oracle Corp. | | 8,859,103 | | 461,205 | |
| Intuit Inc. | | 960,038 | | 276,837 | |
* | ServiceNow Inc. | | 684,058 | | 179,114 | |
* | Autodesk Inc. | | 815,425 | | 116,459 | |
* | Workday Inc. Class A | | 600,005 | | 106,369 | |
* | Synopsys Inc. | | 555,050 | | 78,712 | |
* | Palo Alto Networks Inc. | | 355,371 | | 72,361 | |
* | Cadence Design Systems Inc. | | 1,040,691 | | 71,266 | |
* | ANSYS Inc. | | 310,823 | | 64,204 | |
* | Splunk Inc. | | 556,198 | | 62,194 | |
| Symantec Corp. | | 2,289,455 | | 53,230 | |
* | Paycom Software Inc. | | 184,193 | | 46,070 | |
| Citrix Systems Inc. | | 488,099 | | 45,383 | |
| VMware Inc. Class A | | 306,084 | | 43,292 | |
* | Fortinet Inc. | | 538,010 | | 42,600 | |
| SS&C Technologies Holdings Inc. | | 843,253 | | 39,304 | |
* | Fair Isaac Corp. | | 107,378 | | 37,874 | |
* | RingCentral Inc. Class A | | 260,611 | | 36,780 | |
* | Tyler Technologies Inc. | | 141,640 | | 36,336 | |
* | Aspen Technology Inc. | | 255,662 | | 34,054 | |
* | Trade Desk Inc. Class A | | 135,535 | | 33,310 | |
* | Zendesk Inc. | | 405,496 | | 32,521 | |
* | Coupa Software Inc. | | 215,895 | | 29,994 | |
* | HubSpot Inc. | | 148,215 | | 29,596 | |
* | Guidewire Software Inc. | | 301,486 | | 28,997 | |
* | PTC Inc. | | 404,686 | | 26,495 | |
* | Proofpoint Inc. | | 206,348 | | 23,443 | |
* | Alteryx Inc. Class A | | 164,340 | | 23,410 | |
* | Manhattan Associates Inc. | | 239,850 | | 19,819 | |
| CDK Global Inc. | | 450,071 | | 19,425 | |
* | RealPage Inc. | | 297,686 | | 18,954 | |
* | Nuance Communications Inc. | | 1,073,749 | | 18,050 | |
* | DocuSign Inc. Class A | | 385,106 | | 17,981 | |
| Blackbaud Inc. | | 181,074 | | 16,472 | |
* | Zscaler Inc. | | 228,823 | | 15,729 | |
* | Smartsheet Inc. Class A | | 322,831 | | 15,690 | |
| j2 Global Inc. | | 173,301 | | 14,661 | |
* | Five9 Inc. | | 220,858 | | 13,960 | |
* | Paylocity Holding Corp. | | 127,628 | | 13,940 | |
* | Teradata Corp. | | 432,319 | | 13,346 | |
* | Q2 Holdings Inc. | | 146,878 | | 13,212 | |
* | Verint Systems Inc. | | 243,447 | | 12,973 | |
* | Dropbox Inc. Class A | | 716,167 | | 12,819 | |
* | Nutanix Inc. | | 526,114 | | 12,748 | |
| LogMeIn Inc. | | 184,350 | | 12,322 | |
* | ACI Worldwide Inc. | | 409,350 | | 12,190 | |
* | Envestnet Inc. | | 192,076 | | 10,989 | |
* | New Relic Inc. | | 184,031 | | 10,552 | |
| Pegasystems Inc. | | 144,880 | | 10,163 | |
* | FireEye Inc. | | 755,250 | | 10,143 | |
* | Everbridge Inc. | | 115,990 | | 9,998 | |
* | Cornerstone OnDemand Inc. | | 189,953 | | 9,910 | |
* | Qualys Inc. | | 123,690 | | 9,848 | |
* | LivePerson Inc. | | 230,113 | | 9,145 | |
* | Ceridian HCM Holding Inc. | | 156,622 | | 9,048 | |
* | PROS Holdings Inc. | | 126,241 | | 8,966 | |
* | 8x8 Inc. | | 354,781 | | 8,625 | |
* | Elastic NV | | 96,367 | | 8,470 | |
* | Rapid7 Inc. | | 152,080 | | 8,165 | |
* | Varonis Systems Inc. | | 112,008 | | 7,652 | |
* | Box Inc. | | 510,731 | | 7,472 | |
* | Mimecast Ltd. | | 181,262 | | 7,419 | |
* | Blackline Inc. | | 143,456 | | 7,306 | |
* | CommVault Systems Inc. | | 163,375 | | 7,086 | |
* | SPS Commerce Inc. | | 133,122 | | 6,728 | |
* | Bottomline Technologies DE Inc. | | 161,438 | | 6,658 | |
* | SailPoint Technologies Holding Inc. | | 291,401 | | 6,565 | |
* | Alarm.com Holdings Inc. | | 135,906 | | 6,469 | |
| Progress Software Corp. | | 164,452 | | 6,213 | |
*,^ | Cloudera Inc. | | 812,288 | | 5,800 | |
* | Avaya Holdings Corp. | | 409,764 | | 5,786 | |
* | Workiva Inc. Class A | | 112,625 | | 5,418 | |
* | Appfolio Inc. | | 53,207 | | 5,255 | |
*,^ | Appian Corp. Class A | | 87,102 | | 5,180 | |
* | Instructure Inc. | | 117,517 | | 4,860 | |
* | ForeScout Technologies Inc. | | 123,491 | | 4,425 | |
* | Altair Engineering Inc. Class A | | 127,113 | | 4,368 | |
* | MicroStrategy Inc. Class A | | 30,325 | | 4,345 | |
* | Pluralsight Inc. Class A | | 265,056 | | 4,267 | |
*,^ | Zuora Inc. Class A | | 283,235 | | 4,263 | |
* | Pivotal Software Inc. Class A | | 266,721 | | 3,977 | |
* | 2U Inc. | | 221,919 | | 3,968 | |
* | Yext Inc. | | 226,442 | | 3,571 | |
| TiVo Corp. | | 462,448 | | 3,482 | |
| Ebix Inc. | | 89,732 | | 3,178 | |
| Monotype Imaging Holdings Inc. | | 158,462 | | 3,130 | |
* | Upland Software Inc. | | 77,193 | | 2,933 | |
* | Model N Inc. | | 94,243 | | 2,698 | |
* | Benefitfocus Inc. | | 96,479 | | 2,520 | |
* | Tenable Holdings Inc. | | 102,881 | | 2,346 | |
* | Cision Ltd. | | 285,524 | | 1,976 | |
* | Carbon Black Inc. | | 66,261 | | 1,729 | |
* | MobileIron Inc. | | 246,086 | | 1,698 | |
87
Information Technology Index Fund
| | | | Market | |
| | | | Value· | |
| | Shares | | ($000 | ) |
| American Software Inc. Class A | | 107,514 | | 1,694 | |
| QAD Inc. Class A | | 40,073 | | 1,624 | |
* | OneSpan Inc. | | 115,991 | | 1,566 | |
* | SVMK Inc. | | 92,471 | | 1,548 | |
* | A10 Networks Inc. | | 195,465 | | 1,357 | |
* | Domo Inc. | | 39,049 | | 970 | |
* | Slack Technologies Inc. Class A | | 32,024 | | 917 | |
* | ShotSpotter Inc. | | 28,438 | | 774 | |
| | | | | 7,412,091 | |
Technology Hardware, Storage & Peripherals (17.1%) | | | | | |
| Apple Inc. | | 17,039,035 | | 3,556,728 | |
| HP Inc. | | 5,577,106 | | 102,005 | |
| Hewlett Packard Enterprise Co. | | 4,958,520 | | 68,527 | |
| Western Digital Corp. | | 1,085,089 | | 62,143 | |
| Seagate Technology plc | | 922,508 | | 46,319 | |
| NetApp Inc. | | 916,106 | | 44,028 | |
* | Dell Technologies Inc. | | 581,041 | | 29,941 | |
| Xerox Holdings Corp. | | 748,795 | | 21,708 | |
* | NCR Corp. | | 443,566 | | 13,977 | |
* | Pure Storage Inc. Class A | | 842,879 | | 13,722 | |
* | Cray Inc. | | 153,758 | | 5,371 | |
*,^ | 3D Systems Corp. | | 432,290 | | 3,026 | |
* | Diebold Nixdorf Inc. | | 263,604 | | 2,955 | |
| | | | | 3,970,450 | |
Total Common Stocks | | | | | |
(Cost $17,513,837) | | | | 23,082,816 | |
Temporary Cash Investments (0.5%)1 | | | | | |
Money Market Fund (0.5%) | | | | | |
2,3 | Vanguard Market Liquidity Fund, 2.249% | | 1,178,268 | | 117,838 | |
| | | Face | | | |
| | | Amount | | | |
| | | ($000 | ) | | | |
U.S. Government and Agency Obligations (0.0%) | | | | | |
4 | United States Treasury Bill, 1.997%, 12/26/19 | | 1,000 | | 994 | |
Total Temporary Cash Investments | | | | | |
(Cost $118,822) | | | | 118,832 | |
Total Investments (100.0%) | | | | | |
(Cost $17,632,659) | | | | 23,201,648 | |
| | | | | | | |
| | | | Amount | |
| | | | ($000 | ) |
Other Assets and Liabilities (0.0%) | | | | | |
Other Assets | | | | | |
Investment in Vanguard | | | | 1,119 | |
Receivables for Accrued Income | | | | 31,336 | |
Receivables for Capital Shares Issued | | | | 3,777 | |
Other Assets4 | | | | 724 | |
Total Other Assets | | | | 36,956 | |
Liabilities | | | | | |
Payables for Investment Securities Purchased | | | | (637 | ) |
Collateral for Securities on Loan | | | | (23,450 | ) |
Payables for Capital Shares Redeemed | | | | (2,859 | ) |
Payables to Vanguard | | | | (2,674 | ) |
Variation Margin Payable—Futures Contracts | | | | (68 | ) |
Other Liabilities | | | | (159 | ) |
Total Liabilities | | | | (29,847 | ) |
Net Assets (100%) | | | | 23,208,757 | |
At August 31, 2019, net assets consisted of:
| | | | Amount | |
| | | | ($000 | ) |
Paid-in Capital | | | | 17,689,964 | |
Total Distributable Earnings (Loss) | | | | 5,518,793 | |
Net Assets | | | | 23,208,757 | |
| | | | | |
ETF Shares—Net Assets | | | | | |
Applicable to 97,063,374 outstanding $.001 par value shares of beneficial interest (unlimited authorization) | | | | 20,738,260 | |
Net Asset Value Per Share—ETF Shares | | | | $213.66 | |
| | | | | |
Admiral Shares—Net Assets | | | | | |
Applicable to 22,581,514 outstanding $.001 par value shares of beneficial interest (unlimited authorization) | | | | 2,470,497 | |
Net Asset Value Per Share—Admiral Shares | | | | $109.40 | |
· See Note A in Notes to Financial Statements.
* Non-income-producing security.
^ Includes partial security positions on loan to broker-dealers. The total value of securities on loan is $22,250,000.
1 The fund invests a portion of its cash reserves in equity markets through the use of index futures contracts and swap contracts. After giving effect to futures and swap investments, the fund’s effective common stock and temporary cash investment positions represent 100.0% and 0.0%, respectively, of net assets.
2 Affiliated money market fund available only to Vanguard funds and certain trusts and accounts managed by Vanguard. Rate shown is the 7-day yield.
3 Includes $23,450,000 of collateral received for securities on loan.
4 Securities with a value of $497,000 and cash of $724,000 have been segregated as initial margin for open futures contracts.
88
Information Technology Index Fund
Derivative Financial Instruments Outstanding as of Period End
Futures Contracts
| | | | | | | | | | ($000 | ) |
| | | | | | | | | | Value and | |
| | | | | | Number of | | | | Unrealized | |
| | | | | | Long (Short | ) | Notional | | Appreciation | |
| | | | Expiration | | Contracts | | Amount | | (Depreciation | ) |
Long Futures Contracts | | | | | | | | | | | |
E-mini NASDAQ 100 Index | | | | September 2019 | | 160 | | 24,610 | | 523 | |
Over-the-Counter Total Return Swaps
| | | | | | | | Floating | | | | | |
| | | | | | | | Interest Rate | | Value and | | Value and | |
| | | | | | Notional | | Received | | Unrealized | | Unrealized | |
| | Termination | | | | Amount | | (Paid) | 1 | Appreciation | | (Depreciation | ) |
Reference Entity | | Date | | Counterparty | | ($000 | ) | (%) | | ($000 | ) | ($000 | ) |
Visa Inc. Class A | | 9/2/20 | | BOANA | | 90,410 | | (1.989 | ) | — | | — | |
1 Payment received/paid monthly.
BOANA—Bank of America, NA.
At August 31, 2019, a counterparty had deposited in a segregated account securities with a value of $1,662,000.
See accompanying Notes, which are an integral part of the Financial Statements.
89
Information Technology Index Fund
Statement of Operations
| | Year Ended | |
| | August 31, 2019 | |
| | $(000 | ) |
Investment Income | | | |
Income | | | |
Dividends | | 307,860 | |
Interest1 | | 2,074 | |
Securities Lending—Net | | 895 | |
Total Income | | 310,829 | |
Expenses | | | |
The Vanguard Group—Note B | | | |
Investment Advisory Services | | 3,051 | |
Management and Administrative—ETF Shares | | 15,291 | |
Management and Administrative—Admiral Shares | | 1,674 | |
Marketing and Distribution—ETF Shares | | 888 | |
Marketing and Distribution—Admiral Shares | | 133 | |
Custodian Fees | | — | |
Auditing Fees | | 33 | |
Shareholders’ Reports—ETF Shares | | 852 | |
Shareholders’ Reports—Admiral Shares | | 19 | |
Trustees’ Fees and Expenses | | 10 | |
Total Expenses | | 21,951 | |
Expenses Paid Indirectly | | (7 | ) |
Net Expenses | | 21,944 | |
Net Investment Income | | 288,885 | |
Realized Net Gain (Loss) | | | |
Investment Securities Sold1,2 | | 2,685,421 | |
Futures Contracts | | (2,972 | ) |
Swap Contracts | | 20,762 | |
Realized Net Gain (Loss) | | 2,703,211 | |
Change in Unrealized Appreciation (Depreciation) | | | |
Investment Securities1 | | (1,976,769 | ) |
Futures Contracts | | 515 | |
Swap Contracts | | (5,071 | ) |
Change in Unrealized Appreciation (Depreciation) | | (1,981,325 | ) |
Net Increase (Decrease) in Net Assets Resulting from Operations | | 1,010,771 | |
1 Interest income, realized net gain (loss), and change in unrealized appreciation (depreciation) from an affiliated company of the fund were $2,030,000, ($6,000), and ($1,000), respectively. Purchases and sales are for temporary cash investment purposes.
2 Includes $2,738,090,000 of net gain (loss) resulting from in-kind redemptions; such gain (loss) is not taxable to the fund.
Statement of Changes in Net Assets
| | Year Ended August 31, | |
| | 2019 | | 2018 | |
| | $(000 | ) | $(000 | ) |
Increase (Decrease) in Net Assets | | | | | |
Operations | | | | | |
Net Investment Income | | 288,885 | | 219,648 | |
Realized Net Gain (Loss) | | 2,703,211 | | 3,217,988 | |
Change in Unrealized Appreciation (Depreciation) | | (1,981,325 | ) | 2,729,899 | |
Net Increase (Decrease) in Net Assets Resulting from Operations | | 1,010,771 | | 6,167,535 | |
Distributions | | | | | |
Net Investment Income | | | | | |
ETF Shares | | (260,834 | ) | (181,165 | ) |
Admiral Shares | | (26,967 | ) | (13,713 | ) |
Realized Capital Gain | | | | | |
ETF Shares | | — | | — | |
Admiral Shares | | — | | — | |
Total Distributions | | (287,801 | ) | (194,878 | ) |
Capital Share Transactions | | | | | |
ETF Shares | | (2,459,914 | ) | 2,412,421 | |
Admiral Shares | | 317,194 | | 672,602 | |
Net Increase (Decrease) from Capital Share Transactions | | (2,142,720 | ) | 3,085,023 | |
Total Increase (Decrease) | | (1,419,750 | ) | 9,057,680 | |
Net Assets | | | | | |
Beginning of Period | | 24,628,507 | | 15,570,827 | |
End of Period | | 23,208,757 | | 24,628,507 | |
See accompanying Notes, which are an integral part of the Financial Statements.
90
Information Technology Index Fund
Financial Highlights
ETF Shares
| | | | | | | | | | | |
For a Share Outstanding | | Year Ended August 31, | |
Throughout Each Period | | 2019 | | 2018 | | 2017 | | 2016 | | 2015 | |
Net Asset Value, Beginning of Period | | $202.82 | | $151.19 | | $117.82 | | $102.35 | | $101.41 | |
Investment Operations | | | | | | | | | | | |
Net Investment Income | | 2.572 | 1 | 1.921 | 1 | 1.646 | 1 | 1.566 | | 1.277 | |
Net Realized and Unrealized Gain (Loss) on Investments | | 10.792 | | 51.430 | | 33.329 | | 16.049 | | .834 | |
Total from Investment Operations | | 13.364 | | 53.351 | | 34.975 | | 17.615 | | 2.111 | |
Distributions | | | | | | | | | | | |
Dividends from Net Investment Income | | (2.524 | ) | (1.721 | ) | (1.605 | ) | (2.145 | ) | (1.171 | ) |
Distributions from Realized Capital Gains | | — | | — | | — | | — | | — | |
Total Distributions | | (2.524 | ) | (1.721 | ) | (1.605 | ) | (2.145 | ) | (1.171 | ) |
Net Asset Value, End of Period | | $213.66 | | $202.82 | | $151.19 | | $117.82 | | $102.35 | |
| | | | | | | | | | | |
Total Return | | 6.70% | | 35.52% | | 29.93% | | 17.48% | | 2.05% | |
| | | | | | | | | | | |
Ratios/Supplemental Data | | | | | | | | | | | |
Net Assets, End of Period (Millions) | | $20,738 | | $22,595 | | $14,638 | | $9,429 | | $7,259 | |
Ratio of Total Expenses to Average Net Assets | | 0.10% | | 0.10% | | 0.10% | | 0.10% | | 0.10% | |
Ratio of Net Investment Income to Average Net Assets | | 1.32% | | 1.10% | | 1.24% | | 1.50% | | 1.35% | |
Portfolio Turnover Rate2 | | 5% | | 7% | | 6% | | 5% | | 3% | |
1 Calculated based on average shares outstanding.
2 Excludes the value of portfolio securities received or delivered as a result of in-kind purchases or redemptions of the fund’s capital shares, including ETF Creation Units.
Admiral Shares
| | | | | | | | | | | |
For a Share Outstanding | | Year Ended August 31, | |
Throughout Each Period | | 2019 | | 2018 | | 2017 | | 2016 | | 2015 | |
Net Asset Value, Beginning of Period | | $103.86 | | $77.42 | | $60.33 | | $52.41 | | $51.93 | |
Investment Operations | | | | | | | | | | | |
Net Investment Income | | 1.326 | 1 | 1.001 | 1 | .850 | 1 | .802 | | .655 | |
Net Realized and Unrealized Gain (Loss) on Investments | | 5.509 | | 26.324 | | 17.062 | | 8.216 | | .426 | |
Total from Investment Operations | | 6.835 | | 27.325 | | 17.912 | | 9.018 | | 1.081 | |
Distributions | | | | | | | | | | | |
Dividends from Net Investment Income | | (1.295 | ) | (.885 | ) | (.822 | ) | (1.098 | ) | (.601 | ) |
Distributions from Realized Capital Gains | | — | | — | | — | | — | | — | |
Total Distributions | | (1.295 | ) | (.885 | ) | (.822 | ) | (1.098 | ) | (.601 | ) |
Net Asset Value, End of Period | | $109.40 | | $103.86 | | $77.42 | | $60.33 | | $52.41 | |
| | | | | | | | | | | |
Total Return2 | | 6.70% | | 35.54% | | 29.94% | | 17.49% | | 2.09% | |
| | | | | | | | | | | |
Ratios/Supplemental Data | | | | | | | | | | | |
Net Assets, End of Period (Millions) | | $2,470 | | $2,033 | | $933 | | $456 | | $342 | |
Ratio of Total Expenses to Average Net Assets | | 0.10% | | 0.10% | | 0.10% | | 0.10% | | 0.10% | |
Ratio of Net Investment Income to Average Net Assets | | 1.32% | | 1.10% | | 1.24% | | 1.50% | | 1.35% | |
Portfolio Turnover Rate3 | | 5% | | 7% | | 6% | | 5% | | 3% | |
1 Calculated based on average shares outstanding.
2 Total returns do not include account service fees that may have applied in the periods shown. Fund prospectuses provide information about any applicable account service fees.
3 Excludes the value of portfolio securities received or delivered as a result of in-kind purchases or redemptions of the fund’s capital shares, including ETF Creation Units.
See accompanying Notes, which are an integral part of the Financial Statements.
91
Information Technology Index Fund
Notes to Financial Statements
Vanguard Information Technology Index Fund is registered under the Investment Company Act of 1940 as an open-end investment company, or mutual fund. The fund offers two classes of shares: ETF Shares and Admiral Shares. Each of the share classes has different eligibility and minimum purchase requirements, and is designed for different types of investors. ETF Shares are listed for trading on NYSE Arca; they can be purchased and sold through a broker.
A. The following significant accounting policies conform to generally accepted accounting principles for U.S. investment companies. The fund consistently follows such policies in preparing its financial statements.
1. Security Valuation: Securities are valued as of the close of trading on the New York Stock Exchange (generally 4 p.m., Eastern time) on the valuation date. Equity securities are valued at the latest quoted sales prices or official closing prices taken from the primary market in which each security trades; such securities not traded on the valuation date are valued at the mean of the latest quoted bid and asked prices. Securities for which market quotations are not readily available, or whose values have been materially affected by events occurring before the fund’s pricing time but after the close of the securities’ primary markets, are valued by methods deemed by the board of trustees to represent fair value. Investments in Vanguard Market Liquidity Fund are valued at that fund’s net asset value. Temporary cash investments are valued using the latest bid prices or using valuations based on a matrix system (which considers such factors as security prices, yields, maturities, and ratings), both as furnished by independent pricing services.
2. Futures Contracts: The fund uses index futures contracts to a limited extent, with the objectives of maintaining full exposure to the stock market, maintaining liquidity, and minimizing transaction costs. The fund may purchase futures contracts to immediately invest incoming cash in the market, or sell futures in response to cash outflows, thereby simulating a fully invested position in the underlying index while maintaining a cash balance for liquidity. The primary risks associated with the use of futures contracts are imperfect correlation between changes in market values of stocks held by the fund and the prices of futures contracts, and the possibility of an illiquid market. Counterparty risk involving futures is mitigated because a regulated clearinghouse is the counterparty instead of the clearing broker. To further mitigate counterparty risk, the fund trades futures contracts on an exchange, monitors the financial strength of its clearing brokers and clearinghouse, and has entered into clearing agreements with its clearing brokers. The clearinghouse imposes initial margin requirements to secure the fund’s performance and requires daily settlement of variation margin representing changes in the market value of each contract. Any assets pledged as initial margin for open contracts are noted in the Statement of Net Assets.
Futures contracts are valued at their quoted daily settlement prices. The notional amounts of the contracts are not recorded in the Statement of Net Assets. Fluctuations in the value of the contracts are recorded in the Statement of Net Assets as an asset (liability) and in the Statement of Operations as unrealized appreciation (depreciation) until the contracts are closed, when they are recorded as realized futures gains (losses).
During the year ended August 31, 2019, the fund’s average investments in long and short futures contracts represented less than 1% and 0% of net assets, respectively, based on the average of the notional amounts at each quarter-end during the period.
3. Swap Contracts: The fund has entered into equity swap contracts to earn the total return on selected reference stocks in the fund’s target index. Under the terms of the swaps, the fund receives the total return on the referenced stock (i.e., receiving the increase or paying the decrease in value of the selected reference stock and receiving the equivalent of any dividends in respect of the selected referenced stock) over a specified period of time, applied to a notional amount that represents the value of a designated number of shares of the selected reference stock at the beginning of the equity swap contract. The fund also pays a floating rate that is based on short-term interest rates, applied to the notional amount. At the same time, the fund generally invests an amount approximating the notional amount of the swap in high-quality temporary cash investments.
The notional amounts of swap contracts are not recorded in the Statement of Net Assets. Swaps are valued daily based on market quotations received from independent pricing services or recognized dealers and the change in value is recorded in the Statement of Net Assets as an asset (liability) and in the Statement of Operations as unrealized appreciation (depreciation) until termination of the swap, at which time realized gain (loss) is recorded.
92
Information Technology Index Fund
A risk associated with all types of swaps is the possibility that a counterparty may default on its obligation to pay net amounts due to the fund. The fund’s maximum amount subject to counterparty risk is the unrealized appreciation on the swap contract. The fund mitigates its counterparty risk by entering into swaps only with a diverse group of prequalified counterparties, monitoring their financial strength, entering into master netting arrangements with its counterparties, and requiring its counterparties to transfer collateral as security for their performance. In the absence of a default, the collateral pledged or received by the fund cannot be repledged, resold, or rehypothecated. In the event of a counterparty’s default (including bankruptcy), the fund may terminate any swap contracts with that counterparty, determine the net amount owed by either party in accordance with its master netting arrangements, and sell or retain any collateral held up to the net amount owed to the fund under the master netting arrangements. The swap contracts contain provisions whereby a counterparty may terminate open contracts if the fund net assets decline below a certain level, triggering a payment by the fund if the fund is in a net liability position at the time of the termination. The payment amount would be reduced by any collateral the fund has pledged. Any securities pledged as collateral for open contracts are noted in the Statement of Net Assets. The value of collateral received or pledged is compared daily to the value of the swap contracts exposure with each counterparty, and any difference, if in excess of a specified minimum transfer amount, is adjusted and settled within two business days.
During the year ended August 31, 2019, the fund’s average amounts of investments in total return swaps represented less than 1% of net assets, based on the average of notional amounts at each quarter-end during the period.
4. Federal Income Taxes: The fund intends to continue to qualify as a regulated investment company and distribute all of its taxable income. Management has analyzed the fund’s tax positions taken for all open federal income tax years (August 31, 2016–2019), and has concluded that no provision for federal income tax is required in the fund’s financial statements.
5. Distributions: Distributions to shareholders are recorded on the ex-dividend date. Distributions are determined on a tax basis and may differ from net investment income and realized capital gains for financial reporting purposes.
6. Securities Lending: To earn additional income, the fund lends its securities to qualified institutional borrowers. Security loans are subject to termination by the fund at any time, and are required to be secured at all times by collateral in an amount at least equal to the market value of securities loaned. Daily market fluctuations could cause the value of loaned securities to be more or less than the value of the collateral received. When this occurs, the collateral is adjusted and settled before the opening of the market on the next business day. The fund further mitigates its counterparty risk by entering into securities lending transactions only with a diverse group of prequalified counterparties, monitoring their financial strength, and entering into master securities lending agreements with its counterparties. The master securities lending agreements provide that, in the event of a counterparty’s default (including bankruptcy), the fund may terminate any loans with that borrower, determine the net amount owed, and sell or retain the collateral up to the net amount owed to the fund; however, such actions may be subject to legal proceedings. While collateral mitigates counterparty risk, in the event of a default, the fund may experience delays and costs in recovering the securities loaned. The fund invests cash collateral received in Vanguard Market Liquidity Fund, and records a liability in the Statement of Net Assets for the return of the collateral, during the period the securities are on loan. Securities lending income represents fees charged to borrowers plus income earned on invested cash collateral, less expenses associated with the loan. During the term of the loan, the fund is entitled to all distributions made on or in respect of the loaned securities.
7. Credit Facility: The fund and certain other funds managed by The Vanguard Group (“Vanguard”) participate in a $4.3 billion committed credit facility provided by a syndicate of lenders pursuant to a credit agreement that may be renewed annually; each fund is individually liable for its borrowings, if any, under the credit facility. Borrowings may be utilized for temporary and emergency purposes, and are subject to the fund’s regulatory and contractual borrowing restrictions. The participating funds are charged administrative fees and an annual commitment fee of 0.10% of the undrawn amount of the facility; these fees are allocated to the funds based on a method approved by the fund’s board of trustees and included in Management and Administrative expenses on the fund’s Statement of Operations. Any borrowings under this facility bear interest at a rate based upon the higher of the one-month London Interbank Offered Rate, federal funds effective rate, or overnight bank funding rate plus an agreed-upon spread.
The fund had no borrowings outstanding at August 31, 2019, or at any time during the period then ended.
93
Information Technology Index Fund
8. Other: Dividend income is recorded on the ex-dividend date. Interest income includes income distributions received from Vanguard Market Liquidity Fund and is accrued daily. Premiums and discounts on debt securities purchased are amortized and accreted, respectively, to interest income over the lives of the respective securities. Security transactions are accounted for on the date securities are bought or sold. Costs used to determine realized gains (losses) on the sale of investment securities are those of the specific securities sold.
Each class of shares has equal rights as to assets and earnings, except that each class separately bears certain class-specific expenses related to maintenance of shareholder accounts (included in Management and Administrative expenses) and shareholder reporting. Marketing and distribution expenses are allocated to each class of shares based on a method approved by the board of trustees. Income, other non-class-specific expenses, and gains and losses on investments are allocated to each class of shares based on its relative net assets.
B. In accordance with the terms of a Funds’ Service Agreement (the “FSA”) between Vanguard and the fund, Vanguard furnishes to the fund investment advisory, corporate management, administrative, marketing, and distribution services at Vanguard’s cost of operations (as defined by the FSA). These costs of operations are allocated to the fund based on methods and guidelines approved by the board of trustees. Vanguard does not require reimbursement in the current period for certain costs of operations (such as deferred compensation/benefits and risk/insurance costs); the fund’s liability for these costs of operations is included in Payables to Vanguard on the Statement of Net Assets. All other costs of operations payable to Vanguard are generally settled twice a month.
Upon the request of Vanguard, the fund may invest up to 0.40% of its net assets as capital in Vanguard. At August 31, 2019, the fund had contributed to Vanguard capital in the amount of $1,119,000, representing less than 0.01% of the fund’s net assets and 0.45% of Vanguard’s capital received pursuant to the FSA. The fund’s trustees and officers are also directors and employees, respectively, of Vanguard.
C. The fund’s custodian bank has agreed to reduce its fees when the fund maintains cash on deposit in the non-interest-bearing custody account. For the year ended August 31, 2019, custodian fee offset arrangements reduced the fund’s expenses by $7,000 (an annual rate of 0.00% of average net assets).
D. Various inputs may be used to determine the value of the fund’s investments. These inputs are summarized in three broad levels for financial statement purposes. The inputs or methodologies used to value securities are not necessarily an indication of the risk associated with investing in those securities.
Level 1—Quoted prices in active markets for identical securities.
Level 2—Other significant observable inputs (including quoted prices for similar securities, interest rates, prepayment speeds, credit risk, etc.).
Level 3—Significant unobservable inputs (including the fund’s own assumptions used to determine the fair value of investments). Any investments valued with significant unobservable inputs are noted on the Statement of Net Assets.
The following table summarizes the market value of the fund’s investments and derivatives as of August 31, 2019, based on the inputs used to value them:
| | Level 1 | | Level 2 | | Level 3 | |
Investments | | ($000 | ) | ($000 | ) | ($000 | ) |
Common Stocks | | 23,082,816 | | — | | — | |
Temporary Cash Investments | | 117,838 | | 994 | | — | |
Futures Contracts—Liabilities1 | | (68 | ) | — | | — | |
Total | | 23,200,586 | | 994 | | — | |
1 Represents variation margin on the last day of the reporting period.
E. Permanent differences between book-basis and tax-basis components of net assets are reclassified among capital accounts in the financial statements to reflect their tax character. These reclassifications have no effect on net assets or net asset value per share. As of period end, permanent differences primarily attributable to the accounting for in-kind redemptions, the expiration of capital loss carry-forwards, and swap agreements were reclassified to the following accounts:
| | Amount | |
| | ($000 | ) |
Paid-in Capital | | 2,733,444 | |
Total Distributable Earnings (Loss) | | (2,733,444 | ) |
94
Information Technology Index Fund
Temporary differences between book-basis and tax-basis components of total distributable earnings (loss) arise when certain items of income, gain, or loss are recognized in different periods for financial statement and tax purposes; these differences will reverse at some time in the future. The differences are primarily related to the tax deferral on wash sales and the realization of unrealized gains or losses on certain futures contracts. As of period end, the tax-basis components of total distributable earnings (loss) are detailed in the table as follows:
| | Amount | |
| | ($000 | ) |
Undistributed Ordinary Income | | 83,633 | |
Undistributed Long-Term Gains | | — | |
Capital Loss Carryforwards (Non-expiring) | | (132,283 | ) |
Net Unrealized Gains (Losses) | | 5,568,989 | |
As of August 31, 2019, gross unrealized appreciation and depreciation for investments and derivatives based on cost for U.S. federal income tax purposes were as follows:
| | Amount | |
| | ($000 | ) |
Tax Cost | | 17,632,659 | |
Gross Unrealized Appreciation | | 6,205,454 | |
Gross Unrealized Depreciation | | (636,465 | ) |
Net Unrealized Appreciation (Depreciation) | | 5,568,989 | |
F. During the year ended August 31, 2019, the fund purchased $4,251,727,000 of investment securities and sold $6,408,941,000 of investment securities, other than temporary cash investments. Purchases and sales include $2,606,605,000 and $5,295,953,000, respectively, in connection with in-kind purchases and redemptions of the fund’s capital shares.
G. Capital share transactions for each class of shares were:
| | Year Ended August 31, | |
| | 2019 | | | 2018 | |
| | Amount | | Shares | | | Amount | | Shares | |
| | ($000 | ) | (000 | ) | | ($000 | ) | (000 | ) |
ETF Shares | | | | | | | | | | |
Issued | | 2,875,252 | | 14,358 | | | 9,211,374 | | 51,414 | |
Issued in Lieu of Cash Distributions | | — | | — | | | — | | — | |
Redeemed | | (5,335,166 | ) | (28,700 | ) | | (6,798,953 | ) | (36,825 | ) |
Net Increase (Decrease)—ETF Shares | | (2,459,914 | ) | (14,342 | ) | | 2,412,421 | | 14,589 | |
Admiral Shares | | | | | | | | | | |
Issued | | 952,910 | | 9,462 | | | 1,079,669 | | 12,095 | |
Issued in Lieu of Cash Distributions | | 24,513 | | 243 | | | 12,466 | | 143 | |
Redeemed | | (660,229 | ) | (6,699 | ) | | (419,533 | ) | (4,713 | ) |
Net Increase (Decrease)—Admiral Shares | | 317,194 | | 3,006 | | | 672,602 | | 7,525 | |
H. Management has determined that no events or transactions occurred subsequent to August 31, 2019, that would require recognition or disclosure in these financial statements.
95
Materials Index Fund
Performance Summary
All of the returns in this report represent past performance, which is not a guarantee of future results that may be achieved by the fund. (Current performance may be lower or higher than the performance data cited. For performance data current to the most recent month-end, visit our website at vanguard.com/performance.) Note, too, that both investment returns and principal value can fluctuate widely, so an investor’s shares, when sold, could be worth more or less than their original cost. The returns shown do not reflect taxes that a shareholder would pay on fund distributions or on the sale of fund shares.
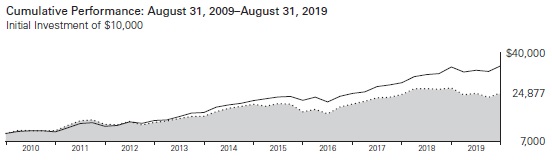
| | | Average Annual Total Returns | | Final Value | |
| | | Periods Ended August 31, 2019 | | of a $10,000 | |
| | | One Year | | Five Years | | Ten Years | | Investment | |

| Materials Index Fund ETF Shares Net Asset Value | | -6.73% | | 3.74% | | 9.54% | | $24,877 | |
| Materials Index Fund ETF Shares Market Price | | -6.76 | | 3.73 | | 9.53 | | 24,849 | |

| Spliced US IMI/Materials 25/50 | | -6.60 | | 3.81 | | 9.66 | | 25,148 | |

| MSCI US IMI/2500 | | 1.32 | | 9.63 | | 13.41 | | 35,213 | |
Spliced US IMI/Materials 25/50: MSCI US IMI/Materials through February 28, 2010; MSCI US IMI/Materials 25/50 thereafter.
| | | | | | | | Final Value | |
| | | | | | | | of a $100,000 | |
| | One Year | | Five Years | | Ten Years | | Investment | |
Materials Index Fund Admiral Shares | | -6.74% | | 3.74% | | 9.55% | | $248,848 | |
Spliced US IMI/Materials 25/50 | | -6.60 | | 3.81 | | 9.66 | | 251,480 | |
MSCI US IMI/2500 | | 1.32 | | 9.63 | | 13.41 | | 352,130 | |
Cumulative Returns: ETF Shares, August 31, 2009–August 31, 2019
| | One Year | | Five Years | | Ten Years | |
Materials Index Fund ETF Shares Market Price | | -6.76% | | 20.08% | | 148.49% | |
Materials Index Fund ETF Shares Net Asset Value | | -6.73 | | 20.14 | | 148.77 | |
Spliced US IMI/Materials 25/50 | | -6.60 | | 20.57 | | 151.48 | |
For the ETF Shares, the market price is determined by the midpoint of the bid-offer spread as of the closing time of the New York Stock Exchange (generally 4 p.m., Eastern time). The net asset value is also determined as of the NYSE closing time. For more information about how the ETF Shares’ market prices have compared with their net asset value, visit vanguard.com, select your ETF, and then select the Price and Performance tab. The ETF premium/discount analysis there shows the percentages of days on which the ETF Shares’ market price was above or below the NAV.
See Financial Highlights for dividend and capital gains information.
96
Materials Index Fund
Sector Diversification
As of August 31, 2019
Aluminum | | 0.6 | % |
Commodity Chemicals | | 8.2 | |
Construction Materials | | 4.9 | |
Copper | | 1.6 | |
Diversified Chemicals | | 1.9 | |
Diversified Metals & Mining | | 0.3 | |
Fertilizers & Agricultural Chemicals | | 6.6 | |
Forest Products | | 0.5 | |
Gold | | 5.1 | |
Industrial Gases | | 18.0 | |
Metal & Glass Containers | | 6.3 | |
Paper Packaging | | 8.9 | |
Paper Products | | 0.7 | |
Silver | | 0.1 | |
Specialty Chemicals | | 31.2 | |
Steel | | 5.1 | |
The table reflects the fund’s equity exposure, based on its investments in stocks and stock index futures. Any holdings in short-term reserves are excluded. Sector categories are based on the Global Industry Classification Standard (“GICS”), except for the “Other” category (if applicable), which includes securities that have not been provided a GICS classification as of the effective reporting period.
The Global Industry Classification Standard (“GICS”) was developed by and is the exclusive property and a service mark of MSCI Inc. (“MSCI”) and Standard and Poor’s, a division of McGraw-Hill Companies, Inc. (“S&P”), and is licensed for use by Vanguard. Neither MSCI, S&P nor any third party involved in making or compiling the GICS or any GICS classification makes any express or implied warranties or representations with respect to such standard or classification (or the results to be obtained by the use thereof), and all such parties hereby expressly disclaim all warranties of originality, accuracy, completeness, merchantability or fitness for a particular purpose with respect to any such standard or classification. Without limiting any of the foregoing, in no event shall MSCI, S&P, any of its affiliates or any third party involved in making or compiling the GICS or any GICS classification have any liability for any direct, indirect, special, punitive, consequential or any other damages (including lost profits) even if notified of the possibility of such damages.
97
Materials Index Fund
Financial Statements
Statement of Net Assets
As of August 31, 2019
The fund files its complete schedule of portfolio holdings with the Securities and Exchange Commission (SEC) for the first and third quarters of each fiscal year as an exhibit to its reports on Form N-PORT. The fund’s Form N-PORT reports are available on the SEC’s website at www.sec.gov.
| | | | | Market | |
| | | | | Value· | |
| | | Shares | | ($000 | ) |
Common Stocks (99.8%)1 | | | | | |
Chemicals (65.8%) | | | | | |
| Linde plc | | 1,542,997 | | 291,488 | |
| Ecolab Inc. | | 737,455 | | 152,144 | |
| DuPont de Nemours Inc. | | 2,136,635 | | 145,142 | |
| Air Products & Chemicals Inc. | | 625,777 | | 141,376 | |
| Sherwin-Williams Co. | | 236,192 | | 124,414 | |
| Dow Inc. | | 2,128,799 | | 90,751 | |
| PPG Industries Inc. | | 671,139 | | 74,355 | |
| Corteva Inc. | | 2,133,858 | | 62,565 | |
| LyondellBasell Industries NV Class A | | 762,251 | | 58,983 | |
| Celanese Corp. Class A | | 359,916 | | 40,804 | |
| FMC Corp. | | 374,248 | | 32,309 | |
| CF Industries Holdings Inc. | | 628,473 | | 30,286 | |
| International Flavors & Fragrances Inc. | | 263,131 | | 28,879 | |
| Eastman Chemical Co. | | 393,996 | | 25,756 | |
| RPM International Inc. | | 372,591 | | 25,213 | |
| Mosaic Co. | | 1,042,260 | | 19,167 | |
| Albemarle Corp. | | 301,360 | | 18,603 | |
* | Axalta Coating Systems Ltd. | | 600,639 | | 17,346 | |
| Ashland Global Holdings Inc. | | 178,263 | | 13,056 | |
| Scotts Miracle-Gro Co. | | 118,240 | | 12,571 | |
| Valvoline Inc. | | 534,909 | | 12,089 | |
| NewMarket Corp. | | 25,441 | | 12,078 | |
| Huntsman Corp. | | 596,557 | | 11,883 | |
| WR Grace & Co. | | 171,198 | | 11,592 | |
* | Ingevity Corp. | | 119,017 | | 9,066 | |
| Balchem Corp. | | 91,993 | | 8,168 | |
| Olin Corp. | | 468,395 | | 7,953 | |
| Sensient Technologies Corp. | | 120,424 | | 7,866 | |
| PolyOne Corp. | | 221,025 | | 7,075 | |
| Cabot Corp. | | 166,469 | | 6,659 | |
| Chemours Co. | | 466,913 | | 6,616 | |
| Westlake Chemical Corp. | | 109,818 | | 6,434 | |
| HB Fuller Co. | | 144,759 | | 6,168 | |
* | Element Solutions Inc. | | 657,553 | | 6,135 | |
| Quaker Chemical Corp. | | 37,976 | | 6,033 | |
| Innospec Inc. | | 69,730 | | 5,800 | |
| Stepan Co. | | 57,993 | | 5,532 | |
| Minerals Technologies Inc. | | 100,352 | | 4,837 | |
| Trinseo SA | | 115,821 | | 4,064 | |
* | GCP Applied Technologies Inc. | | 185,239 | | 3,251 | |
* | Livent Corp. | | 413,224 | | 2,541 | |
* | Kraton Corp. | | 90,818 | | 2,492 | |
* | Ferro Corp. | | 220,801 | | 2,250 | |
| Chase Corp. | | 21,364 | | 2,141 | |
| Tronox Holdings plc Class A | | 275,314 | | 2,046 | |
* | AdvanSix Inc. | | 80,461 | | 1,797 | |
* | PQ Group Holdings Inc. | | 116,525 | | 1,665 | |
| Innophos Holdings Inc. | | 56,329 | | 1,582 | |
* | Koppers Holdings Inc. | | 58,579 | | 1,553 | |
| Tredegar Corp. | | 75,355 | | 1,303 | |
* | OMNOVA Solutions Inc. | | 127,221 | | 1,279 | |
| Hawkins Inc. | | 27,304 | | 1,211 | |
| American Vanguard Corp. | | 75,897 | | 1,075 | |
* | Intrepid Potash Inc. | | 278,859 | | 828 | |
| FutureFuel Corp. | | 74,261 | | 801 | |
| Kronos Worldwide Inc. | | 65,783 | | 720 | |
| Rayonier Advanced Materials Inc. | | 141,239 | | 496 | |
* | Venator Materials plc | | 151,139 | | 337 | |
*,§ | A Schulman Inc. CVR | | 108,962 | | 47 | |
| | | | | 1,580,671 | |
Construction Materials (4.9%) | | | | | |
| Vulcan Materials Co. | | 375,515 | | 53,042 | |
| Martin Marietta Materials Inc. | | 177,621 | | 45,075 | |
| Eagle Materials Inc. | | 125,435 | | 10,560 | |
* | Summit Materials Inc. Class A | | 319,040 | | 6,694 | |
* | US Concrete Inc. | | 44,779 | | 1,814 | |
| United States Lime & Minerals Inc. | | 6,338 | | 489 | |
* | Forterra Inc. | | 54,717 | | 327 | |
| | | | | 118,001 | |
Containers & Packaging (15.1%) | | | | | |
| Ball Corp. | | 904,028 | | 72,693 | |
| Amcor plc | | 4,614,089 | | 45,310 | |
| International Paper Co. | | 1,073,049 | | 41,956 | |
| Avery Dennison Corp. | | 239,959 | | 27,732 | |
| Packaging Corp. of America | | 268,612 | | 27,017 | |
* | Crown Holdings Inc. | | 384,740 | | 25,331 | |
| Westrock Co. | | 730,813 | | 24,979 | |
| AptarGroup Inc. | | 179,637 | | 21,955 | |
| Sealed Air Corp. | | 442,832 | | 17,634 | |
| Sonoco Products Co. | | 284,613 | | 16,280 | |
* | Berry Global Group Inc. | | 373,877 | | 14,634 | |
| Graphic Packaging Holding Co. | | 839,758 | | 11,597 | |
| Silgan Holdings Inc. | | 221,474 | | 6,591 | |
| Owens-Illinois Inc. | | 440,302 | | 4,478 | |
| Greif Inc. Class A | | 74,677 | | 2,628 | |
| Myers Industries Inc. | | 90,531 | | 1,524 | |
| | | | | 362,339 | |
Metals & Mining (12.8%) | | | | | |
| Newmont Goldcorp Corp. | | 2,330,154 | | 92,950 | |
| Nucor Corp. | | 866,476 | | 42,440 | |
| Freeport-McMoRan Inc. | | 4,124,116 | | 37,901 | |
| Royal Gold Inc. | | 186,278 | | 24,846 | |
| Reliance Steel & Aluminum Co. | | 191,233 | | 18,594 | |
| Steel Dynamics Inc. | | 632,225 | | 17,070 | |
* | Alcoa Corp. | | 527,569 | | 9,459 | |
* | Allegheny Technologies Inc. | | 358,816 | | 7,112 | |
| Carpenter Technology Corp. | | 134,942 | | 6,563 | |
^ | Cleveland-Cliffs Inc. | | 805,404 | | 6,395 | |
^ | United States Steel Corp. | | 489,018 | | 5,413 | |
| Commercial Metals Co. | | 334,548 | | 5,242 | |
| Compass Minerals International Inc. | | 96,119 | | 4,780 | |
| Kaiser Aluminum Corp. | | 45,767 | | 4,047 | |
| Worthington Industries Inc. | | 113,843 | | 3,950 | |
| Materion Corp. | | 57,751 | | 3,398 | |
* | Coeur Mining Inc. | | 581,828 | | 3,183 | |
| Warrior Met Coal Inc. | | 132,347 | | 2,766 | |
| Hecla Mining Co. | | 1,379,351 | | 2,455 | |
* | AK Steel Holding Corp. | | 897,414 | | 1,938 | |
| Schnitzer Steel Industries Inc. | | 75,415 | | 1,670 | |
*,^ | McEwen Mining Inc. | | 817,067 | | 1,659 | |
* | SunCoke Energy Inc. | | 255,125 | | 1,592 | |
| Haynes International Inc. | | 35,523 | | 1,061 | |
* | Century Aluminum Co. | | 151,211 | | 833 | |
* | TimkenSteel Corp. | | 110,687 | | 578 | |
* | Ryerson Holding Corp. | | 48,270 | | 332 | |
| | | | | 308,227 | |
Paper & Forest Products (1.2%) | | | | | |
| Louisiana-Pacific Corp. | | 351,164 | | 8,442 | |
| Domtar Corp. | | 179,687 | | 5,921 | |
| Boise Cascade Co. | | 110,542 | | 3,471 | |
| Neenah Inc. | | 47,834 | | 3,051 | |
| Schweitzer-Mauduit International Inc. | | 87,612 | | 2,938 | |
| PH Glatfelter Co. | | 125,236 | | 1,801 | |
| Mercer International Inc. | | 121,004 | | 1,457 | |
* | Verso Corp. | | 99,133 | | 1,012 | |
* | Clearwater Paper Corp. | | 46,829 | | 750 | |
| Resolute Forest Products Inc. | | 167,902 | | 719 | |
| | | | | 29,562 | |
Total Common Stocks | | | | | |
(Cost $2,638,763) | | | | 2,398,800 | |
Temporary Cash Investment (0.4%)1 | | | | | |
Money Market Fund (0.4%) | | | | | |
2,3 | Vanguard Market Liquidity Fund, 2.249% (Cost $10,410) | | 104,091 | | 10,410 | |
Total Investments (100.2%) | | | | | |
(Cost $2,649,173) | | | | 2,409,210 | |
98
Materials Index Fund
| | Amount | |
| | ($000 | ) |
Other Assets and Liabilities (-0.2%) | | | |
Other Assets | | | |
Investment in Vanguard | | 120 | |
Receivables for Accrued Income | | 6,443 | |
Receivables for Capital Shares Issued | | 726 | |
Other Assets4 | | 20 | |
Total Other Assets | | 7,309 | |
Liabilities | | | |
Payables for Investment Securities Purchased | | (2,437 | ) |
Collateral for Securities on Loan | | (9,702 | ) |
Payables for Capital Shares Redeemed | | (336 | ) |
Payables to Vanguard | | (538 | ) |
Unrealized Depreciation—OTC Swap Contracts | | (23 | ) |
Total Liabilities | | (13,036 | ) |
Net Assets (100%) | | 2,403,483 | |
At August 31, 2019, net assets consisted of:
| | Amount | |
| | ($000 | ) |
Paid-in Capital | | 2,710,628 | |
Total Distributable Earnings (Loss) | | (307,145 | ) |
Net Assets | | 2,403,483 | |
| | | |
ETF Shares—Net Assets | | | |
Applicable to 15,645,340 outstanding $.001 par value shares of beneficial interest (unlimited authorization) | | 1,921,281 | |
Net Asset Value Per Share—ETF Shares | | $122.80 | |
| | | |
Admiral Shares—Net Assets | | | |
Applicable to 7,706,506 outstanding $.001 par value shares of beneficial interest (unlimited authorization) | | 482,202 | |
Net Asset Value Per Share—Admiral Shares | | $62.57 | |
· See Note A in Notes to Financial Statements.
* Non-income-producing security.
§ Security value determined using significant unobservable inputs.
^ Includes partial security positions on loan to broker-dealers. The total value of securities on loan is $8,209,000.
1 The fund invests a portion of cash reserves in equity markets through the use of swap contracts. After giving effect to swap investments, the fund’s effective common stock and temporary cash investment positions represent 99.9% and 0.3%, respectively, of net assets.
2 Affiliated money market fund available only to Vanguard funds and certain trusts and accounts managed by Vanguard. Rate shown is the 7-day yield.
3 Includes $9,702,000 of collateral received for securities on loan.
4 Cash of $20,000 has been segregated as collateral for open over-the-counter swap contracts.
CVR—Contingent Value Rights.
OTC—Over-the-Counter.
Derivative Financial Instruments Outstanding as of Period End |
Over-the-Counter Total Return Swaps |
| | | | | | | | Floating | | | | | |
| | | | | | | | Interest Rate | | Value and | | Value and | |
| | | | | | Notional | | Received | | Unrealized | | Unrealized | |
| | Termination | | | | Amount | | (Paid | ) | Appreciation | | (Depreciation | ) |
Reference Entity | | Date | | Counterparty | | ($000 | ) | (% | )1 | ($000 | ) | ($000 | ) |
International Flavors & Fragrances Inc. | | 2/4/20 | | GSI | | 2,765 | | (2.182 | ) | — | | (23 | ) |
1 Payment received/paid monthly.
GSI—Goldman Sachs International.
See accompanying Notes, which are an integral part of the Financial Statements.
99
Materials Index Fund
Statement of Operations
| | Year Ended | |
| | August 31, 2019 | |
| | ($000 | ) |
Investment Income | | | |
Income | | | |
Dividends | | 55,045 | |
Interest1 | | 48 | |
Securities Lending—Net | | 61 | |
Total Income | | 55,154 | |
Expenses | | | |
The Vanguard Group—Note B | | | |
Investment Advisory Services | | 397 | |
Management and Administrative—ETF Shares | | 1,419 | |
Management and Administrative—Admiral Shares | | 334 | |
Marketing and Distribution—ETF Shares | | 118 | |
Marketing and Distribution—Admiral Shares | | 28 | |
Custodian Fees | | 42 | |
Auditing Fees | | 33 | |
Shareholders’ Reports—ETF Shares | | 199 | |
Shareholders’ Reports—Admiral Shares | | 7 | |
Trustees’ Fees and Expenses | | 1 | |
Total Expenses | | 2,578 | |
Net Investment Income | | 52,576 | |
Realized Net Gain (Loss) | | | |
Investment Securities Sold1,2 | | 118,680 | |
Futures Contracts | | 27 | |
Swap Contracts | | (553 | ) |
Realized Net Gain (Loss) | | 118,154 | |
Change in Unrealized Appreciation (Depreciation) | | | |
Investment Securities1 | | (439,963 | ) |
Swap Contracts | | (23 | ) |
Change in Unrealized Appreciation (Depreciation) | | (439,986 | ) |
Net Increase (Decrease) in Net Assets Resulting from Operations | | (269,256 | ) |
1 Interest income, realized net gain (loss), and change in unrealized appreciation (depreciation) from an affiliated company of the fund were $38,000, $1,000, and ($1,000), respectively. Purchases and sales are for temporary cash investment purposes.
2 Includes $153,739,000 of net gain (loss) resulting from in-kind redemptions; such gain (loss) is not taxable to the fund.
Statement of Changes in Net Assets
| | Year Ended August 31, | |
| | 2019 | | 2018 | |
| | ($000 | ) | ($000 | ) |
Increase (Decrease) in Net Assets | | | | | |
Operations | | | | | |
Net Investment Income | | 52,576 | | 49,739 | |
Realized Net Gain (Loss) | | 118,154 | | 100,559 | |
Change in Unrealized Appreciation (Depreciation) | | (439,986 | ) | 70,395 | |
Net Increase (Decrease) in Net Assets Resulting from Operations | | (269,256 | ) | 220,693 | |
Distributions | | | | | |
Net Investment Income | | | | | |
ETF Shares | | (44,813 | ) | (40,107 | ) |
Admiral Shares | | (9,048 | ) | (7,107 | ) |
Realized Capital Gain | | | | | |
ETF Shares | | — | | — | |
Admiral Shares | | — | | — | |
Total Distributions | | (53,861 | ) | (47,214 | ) |
Capital Share Transactions | | | | | |
ETF Shares | | (545,088 | ) | 692,426 | |
Admiral Shares | | 70,433 | | 50,459 | |
Net Increase (Decrease) from Capital Share Transactions | | (474,655 | ) | 742,885 | |
Total Increase (Decrease) | | (797,772 | ) | 916,364 | |
Net Assets | | | | | |
Beginning of Period | | 3,201,255 | | 2,284,891 | |
End of Period | | 2,403,483 | | 3,201,255 | |
See accompanying Notes, which are an integral part of the Financial Statements.
100
Materials Index Fund
Financial Highlights
ETF Shares
For a Share Outstanding | | Year Ended August 31, | |
Throughout Each Period | | 2019 | | 2018 | | 2017 | | 2016 | | 2015 | |
Net Asset Value, Beginning of Period | | $134.33 | | $124.29 | | $108.16 | | $96.39 | | $113.50 | |
Investment Operations | | | | | | | | | | | |
Net Investment Income | | 2.501 | 1 | 2.285 | 1 | 2.175 | 1 | 1.980 | | 2.126 | |
Net Realized and Unrealized Gain (Loss) on Investments | | (11.541 | ) | 9.961 | | 16.072 | | 12.770 | | (17.344 | ) |
Total from Investment Operations | | (9.040 | ) | 12.246 | | 18.247 | | 14.750 | | (15.218 | ) |
Distributions | | | | | | | | | | | |
Dividends from Net Investment Income | | (2.490 | ) | (2.206 | ) | (2.117 | ) | (2.980 | ) | (1.892 | ) |
Distributions from Realized Capital Gains | | — | | — | | — | | — | | — | |
Total Distributions | | (2.490 | ) | (2.206 | ) | (2.117 | ) | (2.980 | ) | (1.892 | ) |
Net Asset Value, End of Period | | $122.80 | | $134.33 | | $124.29 | | $108.16 | | $96.39 | |
| | | | | | | | | | | |
Total Return | | -6.73% | | 9.91% | | 17.06% | | 15.83% | | -13.56% | |
| | | | | | | | | | | |
Ratios/Supplemental Data | | | | | | | | | | | |
Net Assets, End of Period (Millions) | | $1,921 | | $2,749 | | $1,913 | | $1,448 | | $1,022 | |
Ratio of Total Expenses to Average Net Assets | | 0.10% | | 0.10% | | 0.10% | | 0.10% | | 0.10% | |
Ratio of Net Investment Income to Average Net Assets | | 2.04% | | 1.71% | | 1.87% | | 2.06% | | 1.86% | |
Portfolio Turnover Rate2 | | 4% | | 5% | | 5% | | 6% | | 4% | |
1 Calculated based on average shares outstanding.
2 Excludes the value of portfolio securities received or delivered as a result of in-kind purchases or redemptions of the fund’s capital shares, including ETF Creation Units.
Admiral Shares
For a Share Outstanding | | Year Ended August 31, | |
Throughout Each Period | | 2019 | | 2018 | | 2017 | | 2016 | | 2015 | |
Net Asset Value, Beginning of Period | | $68.45 | | $63.33 | | $55.11 | | $49.12 | | $57.84 | |
Investment Operations | | | | | | | | | | | |
Net Investment Income | | 1.282 | 1 | 1.159 | 1 | 1.104 | 1 | 1.008 | | 1.088 | |
Net Realized and Unrealized Gain (Loss) on Investments | | (5.892 | ) | 5.084 | | 8.195 | | 6.505 | | (8.846 | ) |
Total from Investment Operations | | (4.610 | ) | 6.243 | | 9.299 | | 7.513 | | (7.758 | ) |
Distributions | | | | | | | | | | | |
Dividends from Net Investment Income | | (1.270 | ) | (1.123 | ) | (1.079 | ) | (1.523 | ) | (.962 | ) |
Distributions from Realized Capital Gains | | — | | — | | — | | — | | — | |
Total Distributions | | (1.270 | ) | (1.123 | ) | (1.079 | ) | (1.523 | ) | (.962 | ) |
Net Asset Value, End of Period | | $62.57 | | $68.45 | | $63.33 | | $55.11 | | $49.12 | |
| | | | | | | | | | | |
Total Return2 | | -6.74% | | 9.91% | | 17.06% | | 15.80% | | -13.54% | |
| | | | | | | | | | | |
Ratios/Supplemental Data | | | | | | | | | | | |
Net Assets, End of Period (Millions) | | $482 | | $452 | | $372 | | $235 | | $193 | |
Ratio of Total Expenses to Average Net Assets | | 0.10% | | 0.10% | | 0.10% | | 0.10% | | 0.10% | |
Ratio of Net Investment Income to Average Net Assets | | 2.04% | | 1.71% | | 1.87% | | 2.06% | | 1.86% | |
Portfolio Turnover Rate3 | | 4% | | 5% | | 5% | | 6% | | 4% | |
1 Calculated based on average shares outstanding.
2 Total returns do not include account service fees that may have applied in the periods shown. Fund prospectuses provide information about any applicable account service fees.
3 Excludes the value of portfolio securities received or delivered as a result of in-kind purchases or redemptions of the fund’s capital shares, including ETF Creation Units.
See accompanying Notes, which are an integral part of the Financial Statements.
101
Materials Index Fund
Notes to Financial Statements
Vanguard Materials Index Fund is registered under the Investment Company Act of 1940 as an open-end investment company, or mutual fund. The fund offers two classes of shares: ETF Shares and Admiral Shares. Each of the share classes has different eligibility and minimum purchase requirements, and is designed for different types of investors. ETF Shares are listed for trading on NYSE Arca; they can be purchased and sold through a broker.
A. The following significant accounting policies conform to generally accepted accounting principles for U.S. investment companies. The fund consistently follows such policies in preparing its financial statements.
1. Security Valuation: Securities are valued as of the close of trading on the New York Stock Exchange (generally 4 p.m., Eastern time) on the valuation date. Equity securities are valued at the latest quoted sales prices or official closing prices taken from the primary market in which each security trades; such securities not traded on the valuation date are valued at the mean of the latest quoted bid and asked prices. Securities for which market quotations are not readily available, or whose values have been materially affected by events occurring before the fund’s pricing time but after the close of the securities’ primary markets, are valued by methods deemed by the board of trustees to represent fair value. Investments in Vanguard Market Liquidity Fund are valued at that fund’s net asset value. Temporary cash investments are valued using the latest bid prices or using valuations based on a matrix system (which considers such factors as security prices, yields, maturities, and ratings), both as furnished by independent pricing services.
2. Futures Contracts: The fund uses index futures contracts to a limited extent, with the objectives of maintaining full exposure to the stock market, maintaining liquidity, and minimizing transaction costs. The fund may purchase futures contracts to immediately invest incoming cash in the market, or sell futures in response to cash outflows, thereby simulating a fully invested position in the underlying index while maintaining a cash balance for liquidity. The primary risks associated with the use of futures contracts are imperfect correlation between changes in market values of stocks held by the fund and the prices of futures contracts, and the possibility of an illiquid market. Counterparty risk involving futures is mitigated because a regulated clearinghouse is the counterparty instead of the clearing broker. To further mitigate counterparty risk, the fund trades futures contracts on an exchange, monitors the financial strength of its clearing brokers and clearinghouse, and has entered into clearing agreements with its clearing brokers. The clearinghouse imposes initial margin requirements to secure the fund’s performance and requires daily settlement of variation margin representing changes in the market value of each contract. Any assets pledged as initial margin for open contracts are noted in the Statement of Net Assets.
Futures contracts are valued at their quoted daily settlement prices. The notional amounts of the contracts are not recorded in the Statement of Net Assets. Fluctuations in the value of the contracts are recorded in the Statement of Net Assets as an asset (liability) and in the Statement of Operations as unrealized appreciation (depreciation) until the contracts are closed, when they are recorded as realized futures gains (losses).
During the year ended August 31, 2019, the fund’s average investments in long and short futures contracts represented less than 1% and 0% of net assets, respectively, based on the average of the notional amounts at each quarter-end during the period. The fund had no open futures contracts at August 31, 2019.
3. Swap Contracts: The fund has entered into equity swap contracts to earn the total return on selected reference stocks in the fund’s target index. Under the terms of the swaps, the fund receives the total return on the referenced stock (i.e., receiving the increase or paying the decrease in value of the selected reference stock and receiving the equivalent of any dividends in respect of the selected referenced stock) over a specified period of time, applied to a notional amount that represents the value of a designated number of shares of the selected reference stock at the beginning of the equity swap contract. The fund also pays a floating rate that is based on short-term interest rates, applied to the notional amount. At the same time, the fund generally invests an amount approximating the notional amount of the swap in high-quality temporary cash investments.
The notional amounts of swap contracts are not recorded in the Statement of Net Assets. Swaps are valued daily based on market quotations received from independent pricing services or recognized dealers and the change in value is recorded in the Statement of Net Assets as an asset (liability) and in the Statement of Operations as unrealized appreciation (depreciation) until termination of the swap, at which time realized gain (loss) is recorded.
102
Materials Index Fund
A risk associated with all types of swaps is the possibility that a counterparty may default on its obligation to pay net amounts due to the fund. The fund’s maximum amount subject to counterparty risk is the unrealized appreciation on the swap contract. The fund mitigates its counterparty risk by entering into swaps only with a diverse group of prequalified counterparties, monitoring their financial strength, entering into master netting arrangements with its counterparties, and requiring its counterparties to transfer collateral as security for their performance. In the absence of a default, the collateral pledged or received by the fund cannot be repledged, resold, or rehypothecated. In the event of a counterparty’s default (including bankruptcy), the fund may terminate any swap contracts with that counterparty, determine the net amount owed by either party in accordance with its master netting arrangements, and sell or retain any collateral held up to the net amount owed to the fund under the master netting arrangements. The swap contracts contain provisions whereby a counterparty may terminate open contracts if the fund net assets decline below a certain level, triggering a payment by the fund if the fund is in a net liability position at the time of the termination. The payment amount would be reduced by any collateral the fund has pledged. Any securities pledged as collateral for open contracts are noted in the Statement of Net Assets. The value of collateral received or pledged is compared daily to the value of the swap contracts exposure with each counterparty, and any difference, if in excess of a specified minimum transfer amount, is adjusted and settled within two business days.
During the year ended August 31, 2019, the fund’s average amounts of investments in total return swaps represented less than 1% of net assets, based on the average of notional amounts at each quarter-end during the period.
4. Federal Income Taxes: The fund intends to continue to qualify as a regulated investment company and distribute all of its taxable income. Management has analyzed the fund’s tax positions taken for all open federal income tax years (August 31, 2016–2019), and has concluded that no provision for federal income tax is required in the fund’s financial statements.
5. Distributions: Distributions to shareholders are recorded on the ex-dividend date. Distributions are determined on a tax basis and may differ from net investment income and realized capital gains for financial reporting purposes.
6. Securities Lending: To earn additional income, the fund lends its securities to qualified institutional borrowers. Security loans are subject to termination by the fund at any time, and are required to be secured at all times by collateral in an amount at least equal to the market value of securities loaned. Daily market fluctuations could cause the value of loaned securities to be more or less than the value of the collateral received. When this occurs, the collateral is adjusted and settled before the opening of the market on the next business day. The fund further mitigates its counterparty risk by entering into securities lending transactions only with a diverse group of prequalified counterparties, monitoring their financial strength, and entering into master securities lending agreements with its counterparties. The master securities lending agreements provide that, in the event of a counterparty’s default (including bankruptcy), the fund may terminate any loans with that borrower, determine the net amount owed, and sell or retain the collateral up to the net amount owed to the fund; however, such actions may be subject to legal proceedings. While collateral mitigates counterparty risk, in the event of a default, the fund may experience delays and costs in recovering the securities loaned. The fund invests cash collateral received in Vanguard Market Liquidity Fund, and records a liability in the Statement of Net Assets for the return of the collateral, during the period the securities are on loan. Securities lending income represents fees charged to borrowers plus income earned on invested cash collateral, less expenses associated with the loan. During the term of the loan, the fund is entitled to all distributions made on or in respect of the loaned securities.
7. Credit Facility: The fund and certain other funds managed by The Vanguard Group (“Vanguard”) participate in a $4.3 billion committed credit facility provided by a syndicate of lenders pursuant to a credit agreement that may be renewed annually; each fund is individually liable for its borrowings, if any, under the credit facility. Borrowings may be utilized for temporary and emergency purposes, and are subject to the fund’s regulatory and contractual borrowing restrictions. The participating funds are charged administrative fees and an annual commitment fee of 0.10% of the undrawn amount of the facility; these fees are allocated to the funds based on a method approved by the fund’s board of trustees and included in Management and Administrative expenses on the fund’s Statement of Operations. Any borrowings under this facility bear interest at a rate based upon the higher of the one-month London Interbank Offered Rate, federal funds effective rate, or overnight bank funding rate plus an agreed-upon spread.
The fund had no borrowings outstanding at August 31, 2019, or at any time during the period then ended.
103
Materials Index Fund
8. Other: Dividend income is recorded on the ex-dividend date. Interest income includes income distributions received from Vanguard Market Liquidity Fund and is accrued daily. Premiums and discounts on debt securities purchased are amortized and accreted, respectively, to interest income over the lives of the respective securities. Security transactions are accounted for on the date securities are bought or sold. Costs used to determine realized gains (losses) on the sale of investment securities are those of the specific securities sold.
Each class of shares has equal rights as to assets and earnings, except that each class separately bears certain class-specific expenses related to maintenance of shareholder accounts (included in Management and Administrative expenses) and shareholder reporting. Marketing and distribution expenses are allocated to each class of shares based on a method approved by the board of trustees. Income, other non-class-specific expenses, and gains and losses on investments are allocated to each class of shares based on its relative net assets.
B. In accordance with the terms of a Funds’ Service Agreement (the “FSA”) between Vanguard and the fund, Vanguard furnishes to the fund investment advisory, corporate management, administrative, marketing, and distribution services at Vanguard’s cost of operations (as defined by the FSA). These costs of operations are allocated to the fund based on methods and guidelines approved by the board of trustees. Vanguard does not require reimbursement in the current period for certain costs of operations (such as deferred compensation/benefits and risk/insurance costs); the fund’s liability for these costs of operations is included in Payables to Vanguard on the Statement of Net Assets. All other costs of operations payable to Vanguard are generally settled twice a month.
Upon the request of Vanguard, the fund may invest up to 0.40% of its net assets as capital in Vanguard. At August 31, 2019, the fund had contributed to Vanguard capital in the amount of $120,000, representing less than 0.01% of the fund’s net assets and 0.05% of Vanguard’s capital received pursuant to the FSA. The fund’s trustees and officers are also directors and employees, respectively, of Vanguard.
C. Various inputs may be used to determine the value of the fund’s investments. These inputs are summarized in three broad levels for financial statement purposes. The inputs or methodologies used to value securities are not necessarily an indication of the risk associated with investing in those securities.
Level 1—Quoted prices in active markets for identical securities.
Level 2—Other significant observable inputs (including quoted prices for similar securities, interest rates, prepayment speeds, credit risk, etc.).
Level 3—Significant unobservable inputs (including the fund’s own assumptions used to determine the fair value of investments). Any investments valued with significant unobservable inputs are noted on the Statement of Net Assets.
The following table summarizes the market value of the fund’s investments and derivatives as of August 31, 2019, based on the inputs used to value them:
| Level 1 | Level 2 | Level 3 |
Investments | ($000) | ($000) | ($000) |
Common Stocks | 2,398,753 | — | 47 |
Temporary Cash Investments | 10,410 | — | — |
Swap Contracts—Liabilities | — | (23) | — |
Total | 2,409,163 | (23) | 47 |
D. Permanent differences between book-basis and tax-basis components of net assets are reclassified among capital accounts in the financial statements to reflect their tax character. These reclassifications have no effect on net assets or net asset value per share. As of period end, permanent differences primarily attributable to the accounting for in-kind redemptions, the expiration of capital loss carry-forwards and swap agreements were reclassified between the following accounts:
| Amount |
| ($000) |
Paid-in Capital | 140,082 |
Total Distributable Earnings (Loss) | (140,082) |
104
Materials Index Fund
Temporary differences between book-basis and tax-basis components of total distributable earnings (loss) arise when certain items of income, gain, or loss are recognized in different periods for financial statement and tax purposes; these differences will reverse at some time in the future. The differences are primarily related to the tax deferral on wash sales and the realization of unrealized gains or losses on certain swap agreements. As of period end, the tax-basis components of total distributable earnings (loss) are detailed in the table as follows:
| Amount |
| ($000) |
Undistributed Ordinary Income | 8,924 |
Undistributed Long-Term Gains | — |
Capital Loss Carryforwards (Non-expiring) | (75,687) |
Net Unrealized Gains (Losses) | (239,963) |
As of August 31, 2019, gross unrealized appreciation and depreciation for investments and derivatives based on cost for U.S. federal income tax purposes were as follows:
| Amount |
| ($000) |
Tax Cost | 2,649,173 |
Gross Unrealized Appreciation | 263,460 |
Gross Unrealized Depreciation | (503,423) |
Net Unrealized Appreciation (Depreciation) | (239,963) |
E. During the year ended August 31, 2019, the fund purchased $815,558,000 of investment securities and sold $1,295,640,000 of investment securities, other than temporary cash investments. Purchases and sales include $414,251,000 and $1,204,738,000, respectively, in connection with in-kind purchases and redemptions of the fund’s capital shares.
F. Capital share transactions for each class of shares were:
| Year Ended August 31, |
| | 2019 | | | 2018 |
| Amount | Shares | | Amount | Shares |
| ($000) | (000) | | ($000) | (000) |
ETF Shares | | | | | |
Issued | 662,298 | 5,428 | | 1,186,394 | 8,777 |
Issued in Lieu of Cash Distributions | — | — | | — | — |
Redeemed | (1,207,386) | (10,250) | | (493,968) | (3,700) |
Net Increase (Decrease)—ETF Shares | (545,088) | (4,822) | | 692,426 | 5,077 |
Admiral Shares | | | | | |
Issued | 165,502 | 2,647 | | 172,752 | 2,524 |
Issued in Lieu of Cash Distributions | 8,315 | 131 | | 6,475 | 97 |
Redeemed | (103,384) | (1,673) | | (128,768) | (1,894) |
Net Increase (Decrease)—Admiral Shares | 70,433 | 1,105 | | 50,459 | 727 |
G. Management has determined that no events or transactions occurred subsequent to August 31, 2019, that would require recognition or disclosure in these financial statements.
105
Utilities Index Fund
Performance Summary
All of the returns in this report represent past performance, which is not a guarantee of future results that may be achieved by the fund. (Current performance may be lower or higher than the performance data cited. For performance data current to the most recent month-end, visit our website at vanguard.com/performance.) Note, too, that both investment returns and principal value can fluctuate widely, so an investor’s shares, when sold, could be worth more or less than their original cost. The returns shown do not reflect taxes that a shareholder would pay on fund distributions or on the sale of fund shares.
Cumulative Performance: August 31, 2009–August 31, 2019
Initial Investment of $10,000
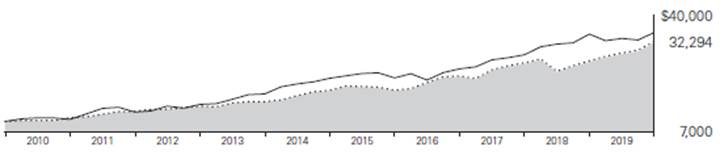
| | Average Annual Total Returns | Final Value of a $10,000 Investment |
| | Periods Ended August 31, 2019 |
| | One Year | Five Years | Ten Years |

| Utilities Index Fund ETF Shares Net Asset Value | 20.17% | 11.60% | 12.44% | $32,294 |
| Utilities Index Fund ETF Shares Market Price | 20.19 | 11.60 | 12.43 | 32,276 |

| Spliced US IMI/Utilities 25/50 | 20.27 | 11.68 | 12.57 | 32,689 |

| MSCI US IMI/2500 | 1.32 | 9.63 | 13.41 | 35,213 |
Spliced US IMI/Utilities 25/50: MSCI US IMI/Utilities through February 28, 2010; MSCI US IMI/Utilities 25/50 thereafter.
| | | | Final Value |
| | | | of a $100,000 |
| One Year | Five Years | Ten Years | Investment |
Utilities Index Fund Admiral Shares | 20.19% | 11.60% | 12.45% | $323,163 |
Spliced US IMI/Utilities 25/50 | 20.27 | 11.68 | 12.57 | 326,886 |
MSCI US IMI/2500 | 1.32 | 9.63 | 13.41 | 352,130 |
Cumulative Returns: ETF Shares, August 31, 2009–August 31, 2019
| One Year | Five Years | Ten Years |
Utilities Index Fund ETF Shares Market Price | 20.19% | 73.12% | 222.76% |
Utilities Index Fund ETF Shares Net Asset Value | 20.17 | 73.09 | 222.94 |
Spliced US IMI/Utilities 25/50 | 20.27 | 73.70 | 226.89 |
For the ETF Shares, the market price is determined by the midpoint of the bid-offer spread as of the closing time of the New York Stock Exchange (generally 4 p.m., Eastern time). The net asset value is also determined as of the NYSE closing time. For more information about how the ETF Shares’ market prices have compared with their net asset value, visit vanguard.com, select your ETF, and then select the Price and Performance tab. The ETF premium/discount analysis there shows the percentages of days on which the ETF Shares’ market price was above or below the NAV.
See Financial Highlights for dividend and capital gains information.
106
Utilities Index Fund
Sector Diversification
As of August 31, 2019
Electric Utilities | 56.5% |
Gas Utilities | 5.3 |
Independent Power Producers & Energy Traders | 4.0 |
Multi-Utilities | 29.8 |
Water Utilities | 4.4 |
The table reflects the fund’s equity exposure, based on its investments in stocks and stock index futures. Any holdings in short-term reserves are excluded. Sector categories are based on the Global Industry Classification Standard (“GICS”), except for the “Other” category (if applicable), which includes securities that have not been provided a GICS classification as of the effective reporting period.
The Global Industry Classification Standard (“GICS”) was developed by and is the exclusive property and a service mark of MSCI Inc. (“MSCI”) and Standard and Poor’s, a division of McGraw-Hill Companies, Inc. (“S&P”), and is licensed for use by Vanguard. Neither MSCI, S&P nor any third party involved in making or compiling the GICS or any GICS classification makes any express or implied warranties or representations with respect to such standard or classification (or the results to be obtained by the use thereof), and all such parties hereby expressly disclaim all warranties of originality, accuracy, completeness, merchantability or fitness for a particular purpose with respect to any such standard or classification. Without limiting any of the foregoing, in no event shall MSCI, S&P, any of its affiliates or any third party involved in making or compiling the GICS or any GICS classification have any liability for any direct, indirect, special, punitive, consequential or any other damages (including lost profits) even if notified of the possibility of such damages.
107
Utilities Index Fund
Financial Statements
Statement of Net Assets
As of August 31, 2019
The fund files its complete schedule of portfolio holdings with the Securities and Exchange Commission (SEC) for the first and third quarters of each fiscal year as an exhibit to its reports on Form N-PORT. The fund’s Form N-PORT reports are available on the SEC’s website at www.sec.gov.
| | | | | | Market | |
| | | | | | Value· | |
| | | | Shares | | ($000 | ) |
Common Stocks (99.9%)1 | | | | | |
Electric Utilities (56.4%) | | | | | |
| | NextEra Energy Inc. | | 2,609,719 | | 571,737 | |
| | Duke Energy Corp. | | 3,967,119 | | 367,911 | |
| | Southern Co. | | 5,668,598 | | 330,253 | |
| | Exelon Corp. | | 5,290,815 | | 250,044 | |
| | American Electric Power Co. Inc. | | 2,688,722 | | 245,077 | |
| | Xcel Energy Inc. | | 2,804,454 | | 180,102 | |
| | Edison International | | 1,927,959 | | 139,334 | |
| | Eversource Energy | | 1,729,857 | | 138,613 | |
| | FirstEnergy Corp. | | 2,895,942 | | 133,213 | |
| | Entergy Corp. | | 1,034,929 | | 116,781 | |
| | PPL Corp. | | 3,932,910 | | 116,217 | |
| | Evergy Inc. | | 1,330,218 | | 86,464 | |
| | Alliant Energy Corp. | | 1,191,908 | | 62,516 | |
| | Pinnacle West Capital Corp. | | 612,019 | | 58,332 | |
| | OGE Energy Corp. | | 1,090,208 | | 46,737 | |
| | IDACORP Inc. | | 274,594 | | 30,153 | |
| | Portland General Electric Co. | | 487,301 | | 27,723 | |
| | Hawaiian Electric Industries Inc. | | 593,802 | | 26,365 | |
| | ALLETE Inc. | | 281,089 | | 24,098 | |
| | PNM Resources Inc. | | 434,357 | | 22,157 | |
| | Avangrid Inc. | | 337,118 | | 17,038 | |
| | El Paso Electric Co. | | 221,844 | | 14,797 | |
| | MGE Energy Inc. | | 189,087 | | 14,342 | |
| | Otter Tail Corp. | | 195,089 | | 9,875 | |
^ | | Spark Energy Inc. Class A | | 62,819 | | 594 | |
| | | | | | 3,030,473 | |
Gas Utilities (5.3%) | | | | | |
| | Atmos Energy Corp. | | 637,657 | | 70,289 | |
| | UGI Corp. | | 1,138,322 | | 55,402 | |
| | Southwest Gas Holdings Inc. | | 290,658 | | 26,517 | |
| | ONE Gas Inc. | | 286,899 | | 26,283 | |
| | Spire Inc. | | 276,751 | | 23,496 | |
| | New Jersey Resources Corp. | | 486,091 | | 22,234 | |
| | National Fuel Gas Co. | | 422,636 | | 19,754 | |
| | South Jersey Industries Inc. | | 503,968 | | 16,298 | |
| | Northwest Natural Holding Co. | | 158,098 | | 11,282 | |
| | Chesapeake Utilities Corp. | | 89,189 | | 8,435 | |
| | Star Group LP | | 259,088 | | 2,384 | |
| | | | | | 282,374 | |
Independent Power and Renewable Electricity Producers (4.0%) | | | | | |
| | AES Corp. | | 3,615,075 | | 55,419 | |
| | NRG Energy Inc. | | 1,455,091 | | 52,965 | |
| | Vistra Energy Corp. | | 1,973,661 | | 49,243 | |
^ | | NextEra Energy Partners LP | | 306,542 | | 15,710 | |
| | Ormat Technologies Inc. | | 207,364 | | 15,401 | |
| | Pattern Energy Group Inc. Class A | | 480,940 | | 13,058 | |
| | Clearway Energy Inc. | | 328,955 | | 5,822 | |
| | TerraForm Power Inc. Class A | | 340,792 | | 5,780 | |
| | Clearway Energy Inc. Class A | | 262,399 | | 4,398 | |
| | | | | | 217,796 | |
Multi-Utilities (29.8%) | | | | | |
| | Dominion Energy Inc. | | 4,372,139 | | 339,409 | |
| | Sempra Energy | | 1,495,171 | | 211,761 | |
| | Public Service Enterprise Group Inc. | | 2,754,201 | | 166,547 | |
| | WEC Energy Group Inc. | | 1,718,868 | | 164,616 | |
| | Consolidated Edison Inc. | | 1,782,439 | | 158,459 | |
| | DTE Energy Co. | | 998,386 | | 129,451 | |
| | Ameren Corp. | | 1,338,333 | | 103,252 | |
| | CMS Energy Corp. | | 1,546,303 | | 97,494 | |
| | CenterPoint Energy Inc. | | 2,736,817 | | 75,782 | |
| | NiSource Inc. | | 2,033,691 | | 60,096 | |
| | MDU Resources Group Inc. | | 1,079,698 | | 29,033 | |
| | Black Hills Corp. | | 328,653 | | 25,211 | |
| | NorthWestern Corp. | | 274,934 | | 19,916 | |
| | Avista Corp. | | 357,742 | | 16,778 | |
| | Unitil Corp. | | 81,671 | | 4,931 | |
| | | | | | 1,602,736 | |
Water Utilities (4.4%) | | | | | |
| | American Water Works Co. Inc. | | 983,955 | | 125,277 | |
| | Aqua America Inc. | | 1,175,073 | | 52,044 | |
| | American States Water Co. | | 200,190 | | 18,524 | |
| | California Water Service Group | | 262,263 | | 14,802 | |
| | SJW Group | | 131,408 | | 8,979 | |
| | Middlesex Water Co. | | 89,823 | | 5,483 | |
| | Connecticut Water Service Inc. | | 65,477 | | 4,592 | |
| | York Water Co. | | 70,118 | | 2,618 | |
* | | AquaVenture Holdings Ltd. | | 100,600 | | 1,779 | |
| | | | | | 234,098 | |
Total Common Stocks
(Cost $4,557,927) | | | | 5,367,477 | |
Temporary Cash Investment (0.0%)1 | | | | | |
Money Market Fund (0.0%) | | | | | |
2,3 | | Vanguard Market Liquidity Fund, 2.249% (Cost $868) | | 8,681 | | 868 | |
Total Investments (99.9%)
(Cost $4,558,795) | | | | 5,368,345 | |
| | Amount | |
| | ($000 | ) |
Other Assets and Liabilities (0.1%) | | | |
Other Assets | | | |
Investment in Vanguard | | 237 | |
Receivables for Accrued Income | | 23,088 | |
Receivables for Capital Shares Issued | | 1,767 | |
Unrealized Appreciation—OTC Swap Contracts | | 81 | |
Total Other Assets | | 25,173 | |
Liabilities | | | |
Payables for Investment Securities Purchased | | (3,006 | ) |
Collateral for Securities on Loan | | (865 | ) |
Payables for Capital Shares Redeemed | | (131 | ) |
Payables to Vanguard | | (901 | ) |
Other Liabilities | | (15,257 | ) |
Total Liabilities | | (20,160 | ) |
Net Assets (100%) | | 5,373,358 | |
At August 31, 2019, net assets consisted of: | | | |
| | Amount | |
| | ($000 | ) |
Paid-in Capital | | 4,675,269 | |
Total Distributable Earnings (Loss) | | 698,089 | |
Net Assets | | 5,373,358 | |
| | | |
ETF Shares—Net Assets | | | |
Applicable to 29,527,265 outstanding $.001 par value shares of beneficial interest (unlimited authorization) | | 4,106,990 | |
Net Asset Value Per Share—ETF Shares | | $139.09 | |
| | | |
Admiral Shares—Net Assets | | | |
Applicable to 18,147,157 outstanding $.001 par value shares of beneficial interest (unlimited authorization) | | 1,266,368 | |
Net Asset Value Per Share—Admiral Shares | | $69.78 | |
· See Note A in Notes to Financial Statements.
^ Includes partial security positions on loan to broker-dealers. The total value of securities on loan is $827,000.
* Non-income-producing security.
1 The fund invests a portion of its cash reserves in equity markets through the use of swap contracts. After giving effect to swap investments, the fund’s effective common stock and temporary cash investment positions represent 100.0% and -0.1%, respectively, of net assets.
2 Affiliated money market fund available only to Vanguard funds and certain trusts and accounts managed by Vanguard. Rate shown is the 7-day yield.
3 Includes $865,000 of collateral received for securities on loan.
OTC—Over-the-Counter.
108
Utilities Index Fund
Derivative Financial Instruments Outstanding as of Period End | | | |
| | | | | | |
Over-the-Counter Total Return Swaps | | | | |
| | | | Floating | | |
| | | | Interest Rate | Value and | Value and |
| | | Notional | Received | Unrealized | Unrealized |
| Termination | | Amount | (Paid)1 | Appreciation | (Depreciation) |
Reference Entity | Date | Counterparty | ($000) | (%) | ($000) | ($000) |
Alliant Energy Corp. | 2/4/20 | GSI | 4,951 | (2.182) | 81 | — |
1 Payment received/paid monthly.
GSI—Goldman Sachs International.
See accompanying Notes, which are an integral part of the Financial Statements.
109
Utilities Index Fund
Statement of Operations
| Year Ended |
| August 31, 2019 |
| ($000) |
Investment Income | |
Income | |
Dividends | 146,637 |
Interest1 | 65 |
Securities Lending—Net | 8 |
Total Income | 146,710 |
Expenses | |
The Vanguard Group—Note B | |
Investment Advisory Services | 647 |
Management and Administrative—ETF Shares | 2,414 |
Management and Administrative—Admiral Shares | 780 |
Marketing and Distribution—ETF Shares | 183 |
Marketing and Distribution—Admiral Shares | 64 |
Custodian Fees | 110 |
Auditing Fees | 33 |
Shareholders’ Reports—ETF Shares | 178 |
Shareholders’ Reports—Admiral Shares | 12 |
Trustees’ Fees and Expenses | 2 |
Total Expenses | 4,423 |
Net Investment Income | 142,287 |
Realized Net Gain (Loss) | |
Investment Securities Sold1,2 | 121,807 |
Futures Contracts | 49 |
Swap Contracts | 1,006 |
Realized Net Gain (Loss) | 122,862 |
Change in Unrealized Appreciation (Depreciation) | |
Investment Securities1 | 585,160 |
Swap Contracts | 81 |
Change in Unrealized Appreciation (Depreciation) | 585,241 |
Net Increase (Decrease) in Net Assets Resulting from Operations | 850,390 |
1 Interest income, realized net gain (loss), and change in unrealized appreciation (depreciation) from an affiliated company of the fund were $65,000, ($3,000), and ($1,000), respectively. Purchases and sales are for temporary cash investment purposes.
2 Includes $246,771,000 of net gain (loss) resulting from in-kind redemptions; such gain (loss) is not taxable to the fund.
Statement of Changes in Net Assets
| Year Ended August 31, |
| 2019 | 2018 |
| ($000) | ($000) |
Increase (Decrease) in Net Assets | | |
Operations | | |
Net Investment Income | 142,287 | 112,216 |
Realized Net Gain (Loss) | 122,862 | 104,150 |
Change in Unrealized Appreciation (Depreciation) | 585,241 | (151,539) |
Net Increase (Decrease) in Net Assets Resulting from Operations | 850,390 | 64,827 |
Distributions | | |
Net Investment Income | | |
ETF Shares | (103,410) | (85,520) |
Admiral Shares | (31,297) | (26,611) |
Realized Capital Gain | | |
ETF Shares | — | — |
Admiral Shares | — | — |
Total Distributions | (134,707) | (112,131) |
Capital Share Transactions | | |
ETF Shares | 749,411 | 156,610 |
Admiral Shares | 230,614 | 34,023 |
Net Increase (Decrease) from Capital Share Transactions | 980,025 | 190,633 |
Total Increase (Decrease) | 1,695,708 | 143,329 |
Net Assets | | |
Beginning of Period | 3,677,650 | 3,534,321 |
End of Period | 5,373,358 | 3,677,650 |
See accompanying Notes, which are an integral part of the Financial Statements.
110
Utilities Index Fund
Financial Highlights
ETF Shares
For a Share Outstanding | Year Ended August 31, |
Throughout Each Period | 2019 | 2018 | 2017 | 2016 | 2015 |
Net Asset Value, Beginning of Period | $119.32 | $120.75 | $107.35 | $91.41 | $94.61 |
Investment Operations | | | | | |
Net Investment Income | 4.0871 | 3.7571 | 3.6971 | 3.355 | 3.337 |
Net Realized and Unrealized Gain (Loss) on Investments | 19.562 | (1.434) | 13.374 | 15.889 | (3.261) |
Total from Investment Operations | 23.649 | 2.323 | 17.071 | 19.244 | .076 |
Distributions | | | | | |
Dividends from Net Investment Income | (3.879) | (3.753) | (3.671) | (3.304) | (3.276) |
Distributions from Realized Capital Gains | — | — | — | — | — |
Total Distributions | (3.879) | (3.753) | (3.671) | (3.304) | (3.276) |
Net Asset Value, End of Period | $139.09 | $119.32 | $120.75 | $107.35 | $91.41 |
| | | | | |
Total Return | 20.17% | 2.05% | 16.27% | 21.40% | -0.02% |
| | | | | |
Ratios/Supplemental Data | | | | | |
Net Assets, End of Period (Millions) | $4,107 | $2,809 | $2,689 | $2,249 | $1,581 |
Ratio of Total Expenses to Average Net Assets | 0.10% | 0.10% | 0.10% | 0.10% | 0.10% |
Ratio of Net Investment Income to Average Net Assets | 3.22% | 3.25% | 3.33% | 3.38% | 3.39% |
Portfolio Turnover Rate2 | 4% | 4% | 4% | 3% | 7% |
1 Calculated based on average shares outstanding.
2 Excludes the value of portfolio securities received or delivered as a result of in-kind purchases or redemptions of the fund’s capital shares, including ETF Creation Units.
Admiral Shares
For a Share Outstanding | Year Ended August 31, |
Throughout Each Period | 2019 | 2018 | 2017 | 2016 | 2015 |
Net Asset Value, Beginning of Period | $59.86 | $60.58 | $53.86 | $45.86 | $47.47 |
Investment Operations | | | | | |
Net Investment Income | 2.0381 | 1.8831 | 1.8631 | 1.683 | 1.676 |
Net Realized and Unrealized Gain (Loss) on Investments | 9.828 | (.719) | 6.698 | 7.974 | (1.641) |
Total from Investment Operations | 11.866 | 1.164 | 8.561 | 9.657 | .035 |
Distributions | | | | | |
Dividends from Net Investment Income | (1.946) | (1.884) | (1.841) | (1.657) | (1.645) |
Distributions from Realized Capital Gains | — | — | — | — | — |
Total Distributions | (1.946) | (1.884) | (1.841) | (1.657) | (1.645) |
Net Asset Value, End of Period | $69.78 | $59.86 | $60.58 | $53.86 | $45.86 |
| | | | | |
Total Return2 | 20.19% | 2.04% | 16.24% | 21.42% | -0.01% |
| | | | | |
Ratios/Supplemental Data | | | | | |
Net Assets, End of Period (Millions) | $1,266 | $868 | $845 | $704 | $447 |
Ratio of Total Expenses to Average Net Assets | 0.10% | 0.10% | 0.10% | 0.10% | 0.10% |
Ratio of Net Investment Income to Average Net Assets | 3.22% | 3.25% | 3.33% | 3.38% | 3.39% |
Portfolio Turnover Rate3 | 4% | 4% | 4% | 3% | 7% |
1 Calculated based on average shares outstanding.
2 Total returns do not include account service fees that may have applied in the periods shown. Fund prospectuses provide information about any applicable account service fees.
3 Excludes the value of portfolio securities received or delivered as a result of in-kind purchases or redemptions of the fund’s capital shares, including ETF Creation Units.
See accompanying Notes, which are an integral part of the Financial Statements.
111
Utilities Index Fund
Notes to Financial Statements
Vanguard Utilities Index Fund is registered under the Investment Company Act of 1940 as an open-end investment company, or mutual fund. The fund offers two classes of shares: ETF Shares and Admiral Shares. Each of the share classes has different eligibility and minimum purchase requirements, and is designed for different types of investors. ETF Shares are listed for trading on NYSE Arca; they can be purchased and sold through a broker.
A. The following significant accounting policies conform to generally accepted accounting principles for U.S. investment companies. The fund consistently follows such policies in preparing its financial statements.
1. Security Valuation: Securities are valued as of the close of trading on the New York Stock Exchange (generally 4 p.m., Eastern time) on the valuation date. Equity securities are valued at the latest quoted sales prices or official closing prices taken from the primary market in which each security trades; such securities not traded on the valuation date are valued at the mean of the latest quoted bid and asked prices. Securities for which market quotations are not readily available, or whose values have been materially affected by events occurring before the fund’s pricing time but after the close of the securities’ primary markets, are valued by methods deemed by the board of trustees to represent fair value. Investments in Vanguard Market Liquidity Fund are valued at that fund’s net asset value.
2. Futures Contracts: The fund uses index futures contracts to a limited extent, with the objectives of maintaining full exposure to the stock market, maintaining liquidity, and minimizing transaction costs. The fund may purchase futures contracts to immediately invest incoming cash in the market, or sell futures in response to cash outflows, thereby simulating a fully invested position in the underlying index while maintaining a cash balance for liquidity. The primary risks associated with the use of futures contracts are imperfect correlation between changes in market values of stocks held by the fund and the prices of futures contracts, and the possibility of an illiquid market. Counterparty risk involving futures is mitigated because a regulated clearinghouse is the counterparty instead of the clearing broker. To further mitigate counterparty risk, the fund trades futures contracts on an exchange, monitors the financial strength of its clearing brokers and clearinghouse, and has entered into clearing agreements with its clearing brokers. The clearinghouse imposes initial margin requirements to secure the fund’s performance and requires daily settlement of variation margin representing changes in the market value of each contract. Any assets pledged as initial margin for open contracts are noted in the Statement of Net Assets.
Futures contracts are valued at their quoted daily settlement prices. The notional amounts of the contracts are not recorded in the Statement of Net Assets. Fluctuations in the value of the contracts are recorded in the Statement of Net Assets as an asset (liability) and in the Statement of Operations as unrealized appreciation (depreciation) until the contracts are closed, when they are recorded as realized futures gains (losses).
During the year ended August 31, 2019, the fund’s average investments in long and short futures contracts represented less than 1% and 0% of net assets, respectively, based on the average of the notional amounts at each quarter-end during the period. The fund had no open futures contracts at August 31, 2019.
3. Swap Contracts: The fund has entered into equity swap contracts to earn the total return on selected reference stocks in the fund’s target index. Under the terms of the swaps, the fund receives the total return on the referenced stock (i.e., receiving the increase or paying the decrease in value of the selected reference stock and receiving the equivalent of any dividends in respect of the selected referenced stock) over a specified period of time, applied to a notional amount that represents the value of a designated number of shares of the selected reference stock at the beginning of the equity swap contract. The fund also pays a floating rate that is based on short-term interest rates, applied to the notional amount. At the same time, the fund generally invests an amount approximating the notional amount of the swap in high-quality temporary cash investments.
The notional amounts of swap contracts are not recorded in the Statement of Net Assets. Swaps are valued daily based on market quotations received from independent pricing services or recognized dealers and the change in value is recorded in the Statement of Net Assets as an asset (liability) and in the Statement of Operations as unrealized appreciation (depreciation) until termination of the swap, at which time realized gain (loss) is recorded.
112
Utilities Index Fund
A risk associated with all types of swaps is the possibility that a counterparty may default on its obligation to pay net amounts due to the fund. The fund’s maximum amount subject to counterparty risk is the unrealized appreciation on the swap contract. The fund mitigates its counterparty risk by entering into swaps only with a diverse group of prequalified counterparties, monitoring their financial strength, entering into master netting arrangements with its counterparties, and requiring its counterparties to transfer collateral as security for their performance. In the absence of a default, the collateral pledged or received by the fund cannot be repledged, resold, or rehypothecated. In the event of a counterparty’s default (including bankruptcy), the fund may terminate any swap contracts with that counterparty, determine the net amount owed by either party in accordance with its master netting arrangements, and sell or retain any collateral held up to the net amount owed to the fund under the master netting arrangements. The swap contracts contain provisions whereby a counterparty may terminate open contracts if the fund net assets decline below a certain level, triggering a payment by the fund if the fund is in a net liability position at the time of the termination. The payment amount would be reduced by any collateral the fund has pledged. Any securities pledged as collateral for open contracts are noted in the Statement of Net Assets. The value of collateral received or pledged is compared daily to the value of the swap contracts exposure with each counterparty, and any difference, if in excess of a specified minimum transfer amount, is adjusted and settled within two business days.
During the year ended August 31, 2019, the fund’s average amounts of investments in total return swaps represented less than 1% of net assets, based on the average of notional amounts at each quarter-end during the period.
4. Federal Income Taxes: The fund intends to continue to qualify as a regulated investment company and distribute all of its taxable income. Management has analyzed the fund’s tax positions taken for all open federal income tax years (August 31, 2016–2019), and has concluded that no provision for federal income tax is required in the fund’s financial statements.
5. Distributions: Distributions to shareholders are recorded on the ex-dividend date. Distributions are determined on a tax basis and may differ from net investment income and realized capital gains for financial reporting purposes.
6. Securities Lending: To earn additional income, the fund lends its securities to qualified institutional borrowers. Security loans are subject to termination by the fund at any time, and are required to be secured at all times by collateral in an amount at least equal to the market value of securities loaned. Daily market fluctuations could cause the value of loaned securities to be more or less than the value of the collateral received. When this occurs, the collateral is adjusted and settled before the opening of the market on the next business day. The fund further mitigates its counterparty risk by entering into securities lending transactions only with a diverse group of prequalified counterparties, monitoring their financial strength, and entering into master securities lending agreements with its counterparties. The master securities lending agreements provide that, in the event of a counterparty’s default (including bankruptcy), the fund may terminate any loans with that borrower, determine the net amount owed, and sell or retain the collateral up to the net amount owed to the fund; however, such actions may be subject to legal proceedings. While collateral mitigates counterparty risk, in the event of a default, the fund may experience delays and costs in recovering the securities loaned. The fund invests cash collateral received in Vanguard Market Liquidity Fund, and records a liability in the Statement of Net Assets for the return of the collateral, during the period the securities are on loan. Securities lending income represents fees charged to borrowers plus income earned on invested cash collateral, less expenses associated with the loan. During the term of the loan, the fund is entitled to all distributions made on or in respect of the loaned securities.
7. Credit Facility: The fund and certain other funds managed by The Vanguard Group (“Vanguard”) participate in a $4.3 billion committed credit facility provided by a syndicate of lenders pursuant to a credit agreement that may be renewed annually; each fund is individually liable for its borrowings, if any, under the credit facility. Borrowings may be utilized for temporary and emergency purposes, and are subject to the fund’s regulatory and contractual borrowing restrictions. The participating funds are charged administrative fees and an annual commitment fee of 0.10% of the undrawn amount of the facility; these fees are allocated to the funds based on a method approved by the fund’s board of trustees and included in Management and Administrative expenses on the fund’s Statement of Operations. Any borrowings under this facility bear interest at a rate based upon the higher of the one-month London Interbank Offered Rate, federal funds effective rate, or overnight bank funding rate plus an agreed-upon spread.
The fund had no borrowings outstanding at August 31, 2019, or at any time during the period then ended.
113
Utilities Index Fund
8. Other: Dividend income is recorded on the ex-dividend date. Interest income includes income distributions received from Vanguard Market Liquidity Fund and is accrued daily. Security transactions are accounted for on the date securities are bought or sold. Costs used to determine realized gains (losses) on the sale of investment securities are those of the specific securities sold.
Each class of shares has equal rights as to assets and earnings, except that each class separately bears certain class-specific expenses related to maintenance of shareholder accounts (included in Management and Administrative expenses) and shareholder reporting. Marketing and distribution expenses are allocated to each class of shares based on a method approved by the board of trustees. Income, other non-class-specific expenses, and gains and losses on investments are allocated to each class of shares based on its relative net assets.
B. In accordance with the terms of a Funds’ Service Agreement (the “FSA”) between Vanguard and the fund, Vanguard furnishes to the fund investment advisory, corporate management, administrative, marketing, and distribution services at Vanguard’s cost of operations (as defined by the FSA). These costs of operations are allocated to the fund based on methods and guidelines approved by the board of trustees. Vanguard does not require reimbursement in the current period for certain costs of operations (such as deferred compensation/benefits and risk/insurance costs); the fund’s liability for these costs of operations is included in Payables to Vanguard on the Statement of Net Assets. All other costs of operations payable to Vanguard are generally settled twice a month.
Upon the request of Vanguard, the fund may invest up to 0.40% of its net assets as capital in Vanguard. At August 31, 2019, the fund had contributed to Vanguard capital in the amount of $237,000, representing less than 0.01% of the fund’s net assets and 0.09% of Vanguard’s capital received pursuant to the FSA. The fund’s trustees and officers are also directors and employees, respectively, of Vanguard.
C. Various inputs may be used to determine the value of the fund’s investments. These inputs are summarized in three broad levels for financial statement purposes. The inputs or methodologies used to value securities are not necessarily an indication of the risk associated with investing in those securities.
Level 1—Quoted prices in active markets for identical securities.
Level 2—Other significant observable inputs (including quoted prices for similar securities, interest rates, prepayment speeds, credit risk, etc.).
Level 3—Significant unobservable inputs (including the fund’s own assumptions used to determine the fair value of investments). Any investments valued with significant unobservable inputs are noted on the Statement of Net Assets.
The following table summarizes the market value of the fund’s investments and derivatives as of August 31, 2019, based on the inputs used to value them:
| Level 1 | Level 2 | Level 3 |
Investments | ($000) | ($000) | ($000) |
Common Stocks | 5,367,477 | — | — |
Temporary Cash Investments | 868 | — | — |
Swap Contracts—Assets | — | 81 | — |
Total | 5,368,345 | 81 | — |
D. Permanent differences between book-basis and tax-basis components of net assets are reclassified among capital accounts in the financial statements to reflect their tax character. These reclassifications have no effect on net assets or net asset value per share. As of period end, permanent differences primarily attributable to the accounting for in-kind redemptions, the expiration of capital loss carry-forwards and swap agreements were reclassified between the following accounts:
| Amount |
| ($000) |
Paid-in Capital | 243,409 |
Total Distributable Earnings (Loss) | (243,409) |
114
Utilities Index Fund
Temporary differences between book-basis and tax-basis components of total distributable earnings (loss) arise when certain items of income, gain, or loss are recognized in different periods for financial statement and tax purposes; these differences will reverse at some time in the future. The differences are primarily related to the tax deferral on wash sales and the realization of unrealized gains or losses on certain swap contracts. As of period end, the tax-basis components of total distributable earnings (loss) are detailed in the table as follows:
| | Amount |
| | ($000) |
Undistributed Ordinary Income | | 29,886 |
Undistributed Long-term Gains | | — |
Capital Loss Carryforwards (Non-expiring) | | (140,707) |
Net Unrealized Gains (Losses) | | 809,550 |
As of August 31, 2019, gross unrealized appreciation and depreciation for investments and derivatives based on cost for U.S. federal income tax purposes were as follows:
| Amount |
| ($000) |
Tax Cost | 4,558,795 |
Gross Unrealized Appreciation | 876,477 |
Gross Unrealized Depreciation | (66,927) |
Net Unrealized Appreciation (Depreciation) | 809,550 |
E. During the year ended August 31, 2019, the fund purchased $2,140,576,000 of investment securities and sold $1,155,016,000 of investment securities, other than temporary cash investments. Purchases and sales include $1,488,782,000 and $994,703,000, respectively, in connection with in-kind purchases and redemptions of the fund’s capital shares.
F. Capital share transactions for each class of shares were:
| | | | Year Ended August 31, |
| | 2019 | | | 2018 |
| Amount | Shares | | Amount | Shares |
| ($000) | (000) | | ($000) | (000) |
ETF Shares | | | | | |
Issued | 1,761,117 | 13,983 | | 749,294 | 6,425 |
Issued in Lieu of Cash Distributions | — | — | | — | — |
Redeemed | (1,011,706) | (8,000) | | (592,684) | (5,150) |
Net Increase (Decrease)—ETF Shares | 749,411 | 5,983 | | 156,610 | 1,275 |
Admiral Shares | | | | | |
Issued | 452,254 | 7,138 | | 232,790 | 4,021 |
Issued in Lieu of Cash Distributions | 25,301 | 397 | | 21,216 | 364 |
Redeemed | (246,941) | (3,895) | | (219,983) | (3,830) |
Net Increase (Decrease)—Admiral Shares | 230,614 | 3,640 | | 34,023 | 555 |
G. Management has determined that no events or transactions occurred subsequent to August 31, 2019, that would require recognition or disclosure in these financial statements.
115
Report of Independent Registered Public Accounting Firm
To the Board of Trustees of Vanguard World Fund and Shareholders of Vanguard Communication Services Index Fund, Vanguard Consumer Discretionary Index Fund, Vanguard Consumer Staples Index Fund, Vanguard Energy Index Fund, Vanguard Financials Index Fund, Vanguard Health Care Index Fund, Vanguard Industrials Index Fund, Vanguard Information Technology Index Fund, Vanguard Materials Index Fund and Vanguard Utilities Index Fund
Opinions on the Financial Statements
We have audited the accompanying statements of net assets of Vanguard Communication Services Index Fund, Vanguard Consumer Discretionary Index Fund, Vanguard Consumer Staples Index Fund, Vanguard Energy Index Fund, Vanguard Financials Index Fund, Vanguard Health Care Index Fund, Vanguard Industrials Index Fund, Vanguard Information Technology Index Fund, Vanguard Materials Index Fund and Vanguard Utilities Index Fund (ten of the funds constituting Vanguard World Fund, hereafter collectively referred to as the “Funds”) as of August 31, 2019, the related statements of operations for the year ended August 31, 2019, the statements of changes in net assets for each of the two years in the period ended August 31, 2019, including the related notes, and the financial highlights for each of the five years in the period ended August 31, 2019 (collectively referred to as the “financial statements”). In our opinion, the financial statements present fairly, in all material respects, the financial position of each of the Funds as of August 31, 2019, the results of each of their operations for the year then ended, the changes in each of their net assets for each of the two years in the period ended August 31, 2019 and each of the financial highlights for each of the five years in the period ended August 31, 2019 in conformity with accounting principles generally accepted in the United States of America.
Basis for Opinions
These financial statements are the responsibility of the Funds’ management. Our responsibility is to express an opinion on the Funds’ financial statements based on our audits. We are a public accounting firm registered with the Public Company Accounting Oversight Board (United States) (“PCAOB”) and are required to be independent with respect to the Funds in accordance with the U.S. federal securities laws and the applicable rules and regulations of the Securities and Exchange Commission and the PCAOB.
We conducted our audits of these financial statements in accordance with the standards of the PCAOB. Those standards require that we plan and perform the audit to obtain reasonable assurance about whether the financial statements are free of material misstatement, whether due to error or fraud.
Our audits included performing procedures to assess the risks of material misstatement of the financial statements, whether due to error or fraud, and performing procedures that respond to those risks. Such procedures included examining, on a test basis, evidence regarding the amounts and disclosures in the financial statements. Our audits also included evaluating the accounting principles used and significant estimates made by management, as well as evaluating the overall presentation of the financial statements. Our procedures included confirmation of securities owned as of August 31, 2019 by correspondence with the custodian and brokers and by agreement to the underlying ownership records of the transfer agent; when replies were not received from brokers, we performed other auditing procedures. We believe that our audits provide a reasonable basis for our opinions.
/s/PricewaterhouseCoopers LLP
Philadelphia, Pennsylvania
October 16, 2019
We have served as the auditor of one or more investment companies in The Vanguard Group of Funds since 1975.
116
Special 2019 tax information (unaudited) for Vanguard U.S. Sector Index Funds
This information for the fiscal year ended August 31, 2019, is included pursuant to provisions of the Internal Revenue Code.
The funds distributed qualified dividend income to shareholders during the fiscal year as follows:
Fund | ($000) |
Communication Services Index Fund | 15,276 |
Consumer Discretionary Index Fund | 37,972 |
Consumer Staples Index Fund | 132,360 |
Energy Index Fund | 129,080 |
Financials Index Fund | 177,517 |
Health Care Index Fund | 210,444 |
Industrials Index Fund | 66,521 |
Information Technology Index Fund | 284,110 |
Materials Index Fund | 53,861 |
Utilities Index Fund | 134,707 |
For corporate shareholders, the percentage of investment income (dividend income plus short-term gains, if any) that qualifies for the dividends-received deduction is as follows:
Fund | Percentage |
Communication Services Index Fund | 100.0% |
Consumer Discretionary Index Fund | 100.0 |
Consumer Staples Index Fund | 99.9 |
Energy Index Fund | 97.1 |
Financials Index Fund | 93.7 |
Health Care Index Fund | 99.8 |
Industrials Index Fund | 97.4 |
Information Technology Index Fund | 97.8 |
Materials Index Fund | 86.3 |
Utilities Index Fund | 100.0 |
117
Trustees Approve Advisory Arrangements
The board of trustees of Vanguard Communication Services Index Fund, Vanguard Consumer Discretionary Index Fund, Vanguard Consumer Staples Index Fund, Vanguard Energy Index Fund, Vanguard Financials Index Fund, Vanguard Health Care Index Fund, Vanguard Industrials Index Fund, Vanguard Information Technology Index Fund, Vanguard Materials Index Fund, and Vanguard Utilities Index Fund has renewed each fund’s investment advisory arrangement with The Vanguard Group, Inc. (Vanguard), through its Equity Index Group. The board determined that continuing each fund’s internalized management structure was in the best interests of the fund and its shareholders.
The board based its decision upon an evaluation of the advisor’s investment staff, portfolio management process, and performance. This evaluation included information provided to the board by Vanguard’s Portfolio Review Department, which is responsible for fund and advisor oversight and product management. The Portfolio Review Department met regularly with the advisor and made monthly presentations to the board during the fiscal year that directed the board’s focus to relevant information and topics.
The board, or an investment committee made up of board members, also received information throughout the year through advisor presentations. For each advisor presentation, the board was provided with letters and reports that included information about, among other things, the advisory firm and the advisor’s assessment of the investment environment, portfolio performance, and portfolio characteristics.
In addition, the board received monthly reports, which included a Market and Economic Report, a Fund Dashboard Monthly Summary, and a Fund Performance Report.
Prior to their meeting, the trustees were provided with a memo and materials that summarized the information they received over the course of the year. They also considered the factors discussed below, among others. However, no single factor determined whether the board approved the arrangements. Rather, it was the totality of the circumstances that drove the board’s decision.
Nature, extent, and quality of services
The board reviewed the quality of each fund’s investment management services over both the short and long term and took into account the organizational depth and stability of the advisor. The board considered that Vanguard has been managing investments for more than four decades. The Equity Index Group adheres to a sound, disciplined investment management process; the team has considerable experience, stability, and depth.
The board concluded that Vanguard’s experience, stability, depth, and performance, among other factors, warranted continuation of each advisory arrangement.
Investment performance
The board considered the short- and long-term performance of each fund, including any periods of outperformance or underperformance compared with its target index and peer group. The board concluded that the performance was such that each advisory arrangement should continue.
Cost
The board concluded that each fund’s expense ratio was well below the average expense ratio charged by funds in its peer group and that each fund’s advisory expenses were also well below the peer-group average.
The board does not conduct a profitability analysis of Vanguard because of Vanguard’s unique structure. Unlike most other mutual fund management companies, Vanguard is owned by the funds it oversees.
The benefit of economies of scale
The board concluded that each fund’s arrangement with Vanguard ensures that the funds will realize economies of scale as they grow, with the cost to shareholders declining as fund assets increase.
The board will consider whether to renew the advisory arrangements again after a one-year period.
118
THESE FUNDS ARE NOT SPONSORED, ENDORSED, SOLD OR PROMOTED BY MSCI INC. (“MSCI”), ANY OF ITS AFFILIATES, ANY OF ITS DIRECT OR INDIRECT INFORMATION PROVIDERS OR ANY OTHER THIRD PARTY INVOLVED IN, OR RELATED TO, COMPILING, COMPUTING OR CREATING ANY MSCI INDEX (COLLECTIVELY, THE “MSCI PARTIES”). THE MSCI INDEXES ARE THE EXCLUSIVE PROPERTY OF MSCI. MSCI AND THE MSCI INDEX NAMES ARE SERVICE MARK(S) OF MSCI OR ITS AFFILIATES AND HAVE BEEN LICENSED FOR USE FOR CERTAIN PURPOSES BY VANGUARD. NONE OF THE MSCI PARTIES MAKES ANY REPRESENTATION OR WARRANTY, EXPRESS OR IMPLIED, TO THE OWNERS OF THESE FUNDS OR ANY MEMBER OF THE PUBLIC REGARDING THE ADVISABILITY OF INVESTING IN FUNDS GENERALLY OR IN THESE FUNDS PARTICULARLY OR THE ABILITY OF ANY MSCI INDEX TO TRACK CORRESPONDING STOCK MARKET PERFORMANCE. MSCI OR ITS AFFILIATES ARE THE LICENSORS OF CERTAIN TRADEMARKS, SERVICE MARKS AND TRADE NAMES AND OF THE MSCI INDEXES WHICH ARE DETERMINED, COMPOSED AND CALCULATED BY MSCI WITHOUT REGARD TO THESE FUNDS OR THE ISSUER OR OWNER OF THESE FUNDS. NONE OF THE MSCI PARTIES HAS ANY OBLIGATION TO TAKE THE NEEDS OF THE ISSUERS OR OWNERS OF THESE FUNDS INTO CONSIDERATION IN DETERMINING, COMPOSING OR CALCULATING THE MSCI INDEXES. NONE OF THE MSCI PARTIES IS RESPONSIBLE FOR OR HAS PARTICIPATED IN THE DETERMINATION OF THE TIMING OF, PRICES AT, OR QUANTITIES OF THESE FUNDS TO BE ISSUED OR IN THE DETERMINATION OR CALCULATION OF THE CONSIDERATION INTO WHICH THESE FUNDS ARE REDEEMABLE. NONE OF THE MSCI PARTIES HAS ANY OBLIGATION OR LIABILITY TO THE OWNERS OF THESE FUNDS IN CONNECTION WITH THE ADMINISTRATION, MARKETING OR OFFERING OF THESE FUNDS .
ALTHOUGH MSCI SHALL OBTAIN INFORMATION FOR INCLUSION IN OR FOR USE IN THE CALCULATION OF THE MSCI INDEXES FROM SOURCES WHICH MSCI CONSIDERS RELIABLE, NONE OF THE MSCI PARTIES WARRANTS OR GUARANTEES THE ORIGINALITY, ACCURACY AND/OR THE COMPLETENESS OF ANY MSCI INDEX OR ANY DATA INCLUDED THEREIN. NONE OF THE MSCI PARTIES MAKES ANY WARRANTY, EXPRESS OR IMPLIED, AS TO RESULTS TO BE OBTAINED BY LICENSEE, LICENSEE’S CUSTOMERS OR COUNTERPARTIES, ISSUERS OF THE FUNDS, OWNERS OF THE FUNDS, OR ANY OTHER PERSON OR ENTITY, FROM THE USE OF ANY MSCI INDEX OR ANY DATA INCLUDED THEREIN IN CONNECTION WITH THE RIGHTS LICENSED HEREUNDER OR FOR ANY OTHER USE. NONE OF THE MSCI PARTIES SHALL HAVE ANY LIABILITY FOR ANY ERRORS, OMISSIONS OR INTERRUPTIONS OF OR IN CONNECTION WITH ANY MSCI INDEX OR ANY DATA INCLUDED THEREIN. FURTHER, NONE OF THE MSCI PARTIES MAKES ANY EXPRESS OR IMPLIED WARRANTIES OF ANY KIND, AND THE MSCI PARTIES HEREBY EXPRESSLY DISCLAIM ALL WARRANTIES OF MERCHANTABILITY OR FITNESS FOR A PARTICULAR PURPOSE, WITH RESPECT TO ANY MSCI INDEX AND ANY DATA INCLUDED THEREIN. WITHOUT LIMITING ANY OF THE FOREGOING, IN NO EVENT SHALL ANY OF THE MSCI PARTIES HAVE ANY LIABILITY FOR ANY DIRECT, INDIRECT, SPECIAL, PUNITIVE, CONSEQUENTIAL OR ANY OTHER DAMAGES (INCLUDING WITHOUT LIMITATION LOST PROFITS) EVEN IF NOTIFIED OF THE POSSIBILITY OF SUCH DAMAGES.
119
This page intentionally left blank.
This page intentionally left blank.
This page intentionally left blank.
This page intentionally left blank.
The People Who Govern Your Fund
The trustees of your mutual fund are there to see that the fund is operated and managed in your best interests since, as a shareholder, you are a part owner of the fund. Your fund’s trustees also serve on the board of directors of The Vanguard Group, Inc., which is owned by the Vanguard funds and provides services to them.
A majority of Vanguard’s board members are independent, meaning that they have no affiliation with Vanguard or the funds they oversee, apart from the sizable personal investments they have made as private individuals. The independent board members have distinguished backgrounds in business, academia, and public service. Each of the trustees and executive officers oversees 212 Vanguard funds.
Information for each trustee and executive officer of the fund appears below. The mailing address of the trustees and officers is P.O. Box 876, Valley Forge, PA 19482. More information about the trustees is in the Statement of Additional Information, which can be obtained, without charge, by contacting Vanguard at 800-662-7447, or online at vanguard.com.
Interested Trustee1
Mortimer J. Buckley
Born in 1969. Trustee since January 2018. Principal occupation(s) during the past five years and other experience: chairman of the board (January 2019–present) of Vanguard and of each of the investment companies served by Vanguard; chief executive officer (January 2018–present) of Vanguard; chief executive officer, president, and trustee (January 2018–present) of each of the investment companies served by Vanguard; president and director (2017–present) of Vanguard; and president (February 2018–present) of Vanguard Marketing Corporation. Chief investment officer (2013–2017), managing director (2002–2017), head of the Retail Investor Group (2006–2012), and chief information officer (2001–2006) of Vanguard. Chairman of the board (2011–2017) and trustee (2009–2017) of the Children’s Hospital of Philadelphia; trustee (2018–present) of The Shipley School.
Independent Trustees
Emerson U. Fullwood
Born in 1948. Trustee since January 2008. Principal occupation(s) during the past five years and other experience: executive chief staff and marketing officer for North America and corporate vice president (retired 2008) of Xerox Corporation (document management products and services). Former president of the Worldwide Channels Group, Latin America, and Worldwide Customer Service and executive chief staff officer of Developing Markets of Xerox. Executive in residence and 2009–2010 Distinguished Minett Professor at the Rochester Institute of Technology. Director of SPX FLOW, Inc. (multi-industry manufacturing). Director of the University of Rochester Medical Center, the Monroe Community College Foundation, the United Way of Rochester, North Carolina A&T University, and Roberts Wesleyan College. Trustee of the University of Rochester.
Amy Gutmann
Born in 1949. Trustee since June 2006. Principal occupation(s) during the past five years and other experience: president (2004–present) of the University of Pennsylvania. Christopher H. Browne Distinguished Professor of Political Science, School of Arts and Sciences, and professor of communication, Annenberg School for Communication, with secondary faculty appointments in the Department of Philosophy, School of Arts and Sciences, and at the Graduate School of Education, University of Pennsylvania. Trustee of the National Constitution Center.
F. Joseph Loughrey
Born in 1949. Trustee since October 2009. Principal occupation(s) during the past five years and other experience: president and chief operating officer (retired 2009) and vice chairman of the board (2008–2009) of Cummins Inc. (industrial machinery). Chairman of the board of Hillenbrand, Inc. (specialized consumer services), and the Lumina Foundation. Director of the V Foundation and Oxfam America. Member of the advisory council for the College of Arts and Letters and chair of the advisory board to the Kellogg Institute for International Studies, both at the University of Notre Dame.
Mark Loughridge
Born in 1953. Trustee since March 2012. Principal occupation(s) during the past five years and other experience: senior vice president and chief financial officer (retired 2013) of IBM (information technology services). Fiduciary member of IBM’s Retirement Plan Committee (2004–2013), senior vice president and general manager (2002–2004) of IBM Global Financing, vice president and controller (1998–2002) of IBM, and a variety of other prior management roles at IBM. Member of the Council on Chicago Booth.
Scott C. Malpass
Born in 1962. Trustee since March 2012. Principal occupation(s) during the past five years and other experience: chief investment officer (1989–present) and vice president (1996–present) of the University of Notre Dame. Assistant professor of finance at the Mendoza College of Business, University of Notre Dame, and member of the Notre Dame 403(b) Investment Committee. Chairman of the board of TIFF Advisory Services, Inc. Member of the board of Catholic Investment Services, Inc. (investment advisors) and the board of superintendence of the Institute for the Works of Religion.
Deanna Mulligan
Born in 1963. Trustee since January 2018. Principal occupation(s) during the past five years and other experience: president (2010–present) and chief executive officer (2011–present) of The Guardian Life Insurance Company of America. Chief operating officer (2010–2011) and executive vice president (2008–2010) of Individual Life and Disability of The Guardian Life Insurance Company of America. Member of the board of The Guardian Life Insurance Company of America, the American Council of Life Insurers, the Partnership for New York City (business leadership), and the Committee Encouraging Corporate Philanthropy. Trustee of the Economic Club of New York and the Bruce Museum (arts and science). Member of the Advisory Council for the Stanford Graduate School of Business.
André F. Perold
Born in 1952. Trustee since December 2004. Principal occupation(s) during the past five years and other experience: George Gund Professor of Finance and Banking, Emeritus at the Harvard Business School (retired 2011). Chief investment officer and co-managing partner of HighVista Strategies LLC (private investment firm). Board of advisors and investment committee member of the Museum of Fine Arts Boston. Board member (2018–present) of RIT Capital Partners (investment firm); investment committee member of Partners Health Care System.
Sarah Bloom Raskin
Born in 1961. Trustee since January 2018. Principal occupation(s) during the past five years and other experience: deputy secretary (2014–2017) of the United States Department of the Treasury. Governor (2010–2014) of the Federal Reserve Board. Commissioner (2007–2010) of financial regulation for the State of Maryland. Member of the board of directors (2012–2014) of Neighborhood Reinvestment Corporation. Director (2017–present) of i(x) Investments, LLC; director (2017–present) of Reserve Trust. Rubinstein Fellow (2017–present) of Duke University; trustee (2017–present) of Amherst College.
Peter F. Volanakis
Born in 1955. Trustee since July 2009. Principal occupation(s) during the past five years and other experience: president and chief operating officer (retired 2010) of Corning Incorporated (communications equipment) and director of Corning Incorporated (2000–2010) and Dow Corning (2001–2010). Director (2012) of SPX Corporation (multi-industry manufacturing). Overseer of the Amos Tuck School of Business Administration, Dartmouth College (2001–2013). Chairman of the board of trustees of Colby-Sawyer College. Member of the board of Hypertherm Inc. (industrial cutting systems, software, and consumables).
1 Mr. Buckley is considered an “interested person,” as defined in the Investment Company Act of 1940, because he is an officer of the Vanguard funds.
Executive Officers
Glenn Booraem
Born in 1967. Principal occupation(s) during the past five years and other experience: principal of Vanguard. Investment stewardship officer (2017–present), treasurer (2015–2017), controller (2010–2015), and assistant controller (2001–2010) of each of the investment companies served by Vanguard.
Christine M. Buchanan
Born in 1970. Principal occupation(s) during the past five years and other experience: principal of Vanguard and global head of Fund Administration at Vanguard. Treasurer (2017–present) of each of the investment companies served by Vanguard. Partner (2005–2017) at KPMG LLP (audit, tax, and advisory services).
Thomas J. Higgins
Born in 1957. Principal occupation(s) during the past five years and other experience: principal of Vanguard. Chief financial officer (2008–present) and treasurer (1998–2008) of each of the investment companies served by Vanguard.
Peter Mahoney
Born in 1974. Principal occupation(s) during the past five years and other experience: principal of Vanguard. Controller (2015–present) of each of the investment companies served by Vanguard. Head of International Fund Services (2008–2014) at Vanguard.
Anne E. Robinson
Born in 1970. Principal occupation(s) during the past five years and other experience: general counsel (2016–present) of Vanguard. Secretary (2016–present) of Vanguard and of each of the investment companies served by Vanguard. Managing director (2016–present) of Vanguard. Director and senior vice president (2016–2018) of Vanguard Marketing Corporation. Managing director and general counsel of Global Cards and Consumer Services (2014–2016) at Citigroup. Counsel (2003–2014) at American Express.
Michael Rollings
Born in 1963. Principal occupation(s) during the past five years and other experience: finance director (2017–present) and treasurer (2017) of each of the investment companies served by Vanguard. Managing director (2016–present) of Vanguard. Chief financial officer (2016–present) of Vanguard. Director (2016–present) of Vanguard Marketing Corporation. Executive vice president and chief financial officer (2006–2016) of MassMutual Financial Group.
John E. Schadl
Born in 1972. Principal occupation(s) during the past five years and other experience: principal of Vanguard. Chief compliance officer (2019–present) of Vanguard and of each of the investment companies served by Vanguard. Assistant vice president (May 2019–present) of Vanguard Marketing Corporation.
Vanguard Senior Management Team
Joseph Brennan | Chris D. McIsaac |
Mortimer J. Buckley | James M. Norris |
Gregory Davis | Thomas M. Rampulla |
John James | Karin A. Risi |
Martha G. King | Anne E. Robinson |
John T. Marcante | Michael Rollings |
| 
|
| |
| P.O. Box 2600 |
| Valley Forge, PA 19482-2600 |
Connect with Vanguard® > vanguard.com
Fund Information > 800-662-7447
Direct Investor Account Services > 800-662-2739
Institutional Investor Services > 800-523-1036
Text Telephone for People
Who Are Deaf or Hard of Hearing > 800-749-7273
This material may be used in conjunction with the offering of shares of any Vanguard fund only if preceded or accompanied by the fund’s current prospectus.
All comparative mutual fund data are from Morningstar, Inc., unless otherwise noted.
You can obtain a free copy of Vanguard’s proxy voting guidelines by visiting vanguard.com/proxyreporting or by calling Vanguard at 800-662-2739. The guidelines are also available from the SEC’s website, www.sec.gov. In addition, you may obtain a free report on how your fund voted the proxies for securities it owned during the 12 months ended June 30. To get the report, visit either vanguard.com/proxyreporting or www.sec.gov.
You can review information about your fund on the SEC’s website, and you can receive copies of this information, for a fee, by sending a request via email addressed to publicinfo@sec.gov.
Source for Bloomberg Barclays indexes: Bloomberg Index Services Limited. Copyright 2019, Bloomberg.
All rights reserved.
| © 2019 The Vanguard Group, Inc. |
| All rights reserved. |
| U.S. Patent Nos. 6,879,964; 7,337,138; 7,720,749; 7,925,573; 8,090,646; 8,417,623; and 8,626,636. |
| Vanguard Marketing Corporation, Distributor. |
| |
| Q4830 102019 |

Annual Report | August 31, 2019 Vanguard Extended Duration Treasury Index Fund |
See the inside front cover for important information about access to your fund’s annual and semiannual shareholder reports. |
Important information about access to shareholder reports
Beginning on January 1, 2021, as permitted by regulations adopted by the Securities and Exchange Commission, paper copies of your fund’s annual and semiannual shareholder reports will no longer be sent to you by mail, unless you specifically request them. Instead, you will be notified by mail each time a report is posted on the website and will be provided with a link to access the report.
If you have already elected to receive shareholder reports electronically, you will not be affected by this change and do not need to take any action. You may elect to receive shareholder reports and other communications from the fund electronically by contacting your financial intermediary (such as a broker-dealer or bank) or, if you invest directly with the fund, by calling Vanguard at one of the phone numbers on the back cover of this report or by logging on to vanguard.com.
You may elect to receive paper copies of all future shareholder reports free of charge. If you invest through a financial intermediary, you can contact the intermediary to request that you continue to receive paper copies. If you invest directly with the fund, you can call Vanguard at one of the phone numbers on the back cover of this report or log on to vanguard.com. Your election to receive paper copies will apply to all the funds you hold through an intermediary or directly with Vanguard.
A Note From Our Chairman | 1 |
Your Fund’s Performance at a Glance | 2 |
About Your Fund’s Expenses | 3 |
Performance Summary | 5 |
Financial Statements | 8 |
Trustees Approve Advisory Arrangement | 22 |
Please note: The opinions expressed in this report are just that—informed opinions. They should not be considered promises or advice. Also, please keep in mind that the information and opinions cover the period through the date on the front of this report. Of course, the risks of investing in your fund are spelled out in the prospectus.
A Note From Our Chairman

Tim Buckley
Chairman and Chief Executive Officer
Dear Shareholder,
Recent volatility in financial markets— affecting stocks, bonds, and commodities— has been a good reminder of the wise old adage, “Never keep all your eggs in one basket.” Maintaining balance and diversification in your investment portfolio can help to both limit risk and set you up for long-term success.
It’s understandable why some investors might become complacent after a long market run-up like the one that lifted stock prices, especially U.S. stock prices, in the years following the global financial crisis. But failing to rebalance regularly can leave a portfolio with a much different mix of assets than intended and, often, more risk than intended.
Balance across and diversification within asset classes are powerful tools for managing risk and achieving your investment goals. A portfolio’s allocation will determine a large portion of its long-term return and also the majority of its volatility risk. A well-diversified portfolio is less vulnerable to significant swings in the performance of any one segment of the asset classes in which it invests.
Balance and diversification will never eliminate the risk of loss, nor will they guarantee positive returns in a declining market. But they should reduce the chance that you’ll suffer disproportionate losses in one particular high-flying asset class or sector when it comes back to earth. And exposure to all key market components should give you at least some participation in the sectors that are performing best at any given time.
Vanguard is committed to helping you achieve balance and diversification in your portfolios to help meet your investment goals. We thank you for your continued loyalty.
Sincerely,

Mortimer J. Buckley
Chairman and Chief Executive Officer
October 1, 2019
1
Your Fund’s Performance at a Glance
· Shares of Vanguard Extended Duration Treasury Index Fund returned more than 32% for the 12 months ended August 31, 2019, in line with the fund’s benchmark index.
· Bond yields fell and prices rose as the Federal Reserve cut interest rates in August and again in September, shortly after the fiscal year ended.
· The yield of the 30-year U.S. Treasury bond dropped from 3.02% to 1.96%. Inflation remained low. Long-term Treasuries outperformed their short-term counterparts and long-term corporates.
· Because the fund invests in zero-coupon U.S. Treasuries with maturities ranging from 20 to 30 years, and the prices of such securities are very sensitive to interest rate changes, its interest rate risk is extremely high. As a result, the fund may exhibit substantial short-term volatility and is best used by long-term investors.
Market Barometer | | | |
| | Average Annual Total Returns |
| | Periods Ended August 31, 2019 |
| One Year | Three Years | Five Years |
Stocks | | | |
Russell 1000 Index (Large-caps) | 2.49% | 12.57% | 9.85% |
Russell 2000 Index (Small-caps) | -12.89 | 7.89 | 6.41 |
Russell 3000 Index (Broad U.S. market) | 1.31 | 12.24 | 9.60 |
FTSE All-World ex US Index (International) | -3.18 | 5.97 | 1.71 |
| | | |
Bonds | | | |
Bloomberg Barclays U.S. Aggregate Bond Index | | | |
(Broad taxable market) | 10.17% | 3.09% | 3.35% |
Bloomberg Barclays Municipal Bond Index | | | |
(Broad tax-exempt market) | 8.72 | 3.30 | 3.85 |
FTSE Three-Month U.S. Treasury Bill Index | 2.36 | 1.47 | 0.91 |
| | | |
CPI | | | |
Consumer Price Index | 1.75% | 2.13% | 1.53% |
Fund returns are adjusted to reflect the 0.50% fee on purchases of fund shares. The fee does not apply to the ETF Shares.
2
About Your Fund’s Expenses
As a shareholder of the fund, you incur ongoing costs, which include costs for portfolio management, administrative services, and shareholder reports (like this one), among others. Operating expenses, which are deducted from a fund’s gross income, directly reduce the investment return of the fund.
A fund’s expenses are expressed as a percentage of its average net assets. This figure is known as the expense ratio. The following examples are intended to help you understand the ongoing costs (in dollars) of investing in your fund and to compare these costs with those of other mutual funds. The examples are based on an investment of $1,000 made at the beginning of the period shown and held for the entire period.
The accompanying table illustrates your fund’s costs in two ways:
· Based on actual fund return. This section helps you to estimate the actual expenses that you paid over the period. The “Ending Account Value” shown is derived from the fund’s actual return, and the third column shows the dollar amount that would have been paid by an investor who started with $1,000 in the fund. You may use the information here, together with the amount you invested, to estimate the expenses that you paid over the period.
To do so, simply divide your account value by $1,000 (for example, an $8,600 account value divided by $1,000 = 8.6), then multiply the result by the number given for your fund under the heading “Expenses Paid During Period.”
· Based on hypothetical 5% yearly return. This section is intended to help you compare your fund’s costs with those of other mutual funds. It assumes that the fund had a yearly return of 5% before expenses, but that the expense ratio is unchanged. In this case—because the return used is not the fund’s actual return—the results do not apply to your investment. The example is useful in making comparisons because the Securities and Exchange Commission requires all mutual funds to calculate expenses based on a 5% return. You can assess your fund’s costs by comparing this hypothetical example with the hypothetical examples that appear in shareholder reports of other funds.
Note that the expenses shown in the table are meant to highlight and help you compare ongoing costs only and do not reflect transaction costs incurred by the fund for buying and selling securities. Further, the expenses do not include any purchase, redemption, or account service fees described in the fund prospectus. If such fees were applied to your account, your costs would be higher. Your fund does not carry a “sales load.”
The calculations assume no shares were bought or sold during the period. Your actual costs may have been higher or lower, depending on the amount of your investment and the timing of any purchases or redemptions.
You can find more information about the fund’s expenses, including annual expense ratios, in the Financial Statements section of this report. For additional information on operating expenses and other shareholder costs, please refer to your fund’s current prospectus.
3
Six Months Ended August 31, 2019
| | Beginning | | Ending | | Expenses |
| | Account Value | | Account Value | | Paid During |
Extended Duration Treasury Index Fund | | 2/28/2019 | | 8/31/2019 | | Period |
Based on Actual Fund Return | | | | | | |
ETF Shares | | $1,000.00 | | $1,339.06 | | $0.41 |
Institutional Shares | | 1,000.00 | | 1,339.29 | | 0.35 |
Institutional Plus Shares | | 1,000.00 | | 1,339.41 | | 0.24 |
Based on Hypothetical 5% Yearly Return | | | | | | |
ETF Shares | | $1,000.00 | | $1,024.85 | | $0.36 |
Institutional Shares | | 1,000.00 | | 1,024.90 | | 0.31 |
Institutional Plus Shares | | 1,000.00 | | 1,025.00 | | 0.20 |
The calculations are based on expenses incurred in the most recent six-month period. The fund’s annualized six-month expense ratios for that period are 0.07% for ETF Shares, 0.06% for Institutional Shares, and 0.04% for Institutional Plus Shares. The dollar amounts shown as “Expenses Paid” are equal to the annualized expense ratio multiplied by the average account value over the period, multiplied by the number of days in the most recent six-month period, then divided by the number of days in the most recent 12-month period (184/365).
4
Extended Duration Treasury Index Fund
Performance Summary
All of the returns in this report represent past performance, which is not a guarantee of future results that may be achieved by the fund. (Current performance may be lower or higher than the performance data cited. For performance data current to the most recent month-end, visit our website at vanguard.com/performance.) Note, too, that both investment returns and principal value can fluctuate widely, so an investor’s shares, when sold, could be worth more or less than their original cost. The returns shown do not reflect taxes that a shareholder would pay on fund distributions or on the sale of fund shares.
Cumulative Performance: August 31, 2009, Through August 31, 2019
Initial Investment of $10,000
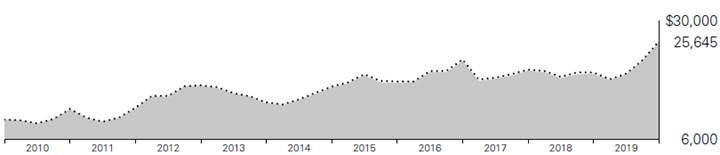
| Average Annual Total Returns | |
| Periods Ended August 31, 2019 | |
| | | | Final Value |
| One | Five | Ten | of a $10,000 |
| Year | Years | Years | Investment |

| Extended Duration Treasury Index Fund ETF Shares Net Asset Value | 32.92% | 9.24% | 9.88% | $25,645 |
| Extended Duration Treasury Index Fund ETF Shares Market Price | 32.92 | 9.22 | 9.70 | 25,239 |

| Bloomberg Barclays U.S. Treasury STRIPS 20–30 Year Equal Par Bond Index | | | | |
32.14 | 9.17 | 9.97 | 25,860 |
| | | | | |
| | | | | |
| | | | | Final Value |
| | One | Five | Ten | of a $5,000,000 |
| | Year | Years | Years | Investment |
Extended Duration Treasury Index Fund Institutional Shares | 32.94% | 9.25% | 9.90% | $12,849,685 |
Bloomberg Barclays U.S. Treasury STRIPS 20–30 Year Equal Par Bond Index | 32.14 | 9.17 | 9.97 | 12,929,842 |
Vanguard fund returns are adjusted to reflect the 0.50% fee on purchases of fund shares. The fee does not apply to the ETF Shares.
See Financial Highlights for dividend and capital gains information.
5
Extended Duration Treasury Index Fund
| | Average Annual Total Returns | |
| | Periods Ended August 31, 2019 | |
| | | | Since | Final Value |
| | One | Five | Inception | of a $100,000,000 |
| | Year | Years | (8/28/2013) | Investment |
Extended Duration Treasury Index Fund Institutional Plus Shares | 32.95% | 9.27% | 11.87% | $196,243,280 |
Bloomberg Barclays U.S. Treasury STRIPS 20–30 Year Equal Par Bond Index | 32.14 | 9.17 | 11.89 | 196,397,589 |
“Since Inception” performance is calculated from the Institutional Plus Shares’ inception date for both the fund and its comparative standards.
Cumulative Returns of ETF Shares: August 31, 2009, Through August 31, 2019
| One | Five | Ten |
| Year | Years | Years |
Extended Duration Treasury Index FundETF Shares Market Price | 32.92% | 55.43% | 152.39% |
Extended Duration Treasury Index FundETF Shares Net Asset Value | 32.92 | 55.55 | 156.45 |
Bloomberg Barclays U.S. Treasury STRIPS 20–30 Year Equal Par Bond Index | 32.14 | 55.03 | 158.60 |
For the ETF Shares, the market price is determined by the midpoint of the bid-offer spread as of the closing time of the New York Stock Exchange (generally 4 p.m., Eastern time). The net asset value is also determined as of the NYSE closing time. For more information about how the ETF Shares’ market prices have compared with their net asset value, visit vanguard.com, select your ETF, and then select the Price and Performance tab. The ETF premium/discount analysis there shows the percentages of days on which the ETF Shares’ market price was above or below the NAV.
Vanguard fund returns are adjusted to reflect the 0.50% fee on purchases of fund shares. The fee does not apply to the ETF Shares.
6
Extended Duration Treasury Index Fund
Sector Diversification
As of August 31, 2019
The table reflects the fund’s market exposure. Any holdings in short-term reserves are excluded. The agency and mortgage-backed securities sectors may include issues from government-sponsored enterprises; such issues are generally not backed by the full faith and credit of the U.S. government.
7
Extended Duration Treasury Index Fund
Financial Statements
Statement of Net Assets
As of August 31, 2019
The fund files its complete schedule of portfolio holdings with the Securities and Exchange Commission (SEC) for the first and third quarters of each fiscal year as an exhibit to its reports on Form N-PORT. The fund’s Form N-PORT reports are available on the SEC’s website at www.sec.gov.
| | | Coupon | | Maturity Date | | Face Amount ($000 | ) | Market Value· ($000 | ) |
U.S. Government and Agency Obligations (100.0%) | | | | | | | |
U.S. Government Securities (100.0%) | | | | | | | | | |
| United States Treasury Strip Coupon | | 0.000% | | 8/15/39 | | 17,123 | | 11,589 | |
| United States Treasury Strip Coupon | | 0.000% | | 11/15/39 | | 92,195 | | 61,973 | |
| United States Treasury Strip Coupon | | 0.000% | | 2/15/40 | | 69,415 | | 46,389 | |
| United States Treasury Strip Coupon | | 0.000% | | 5/15/40 | | 59,750 | | 39,682 | |
| United States Treasury Strip Coupon | | 0.000% | | 8/15/40 | | 78,513 | | 51,801 | |
| United States Treasury Strip Coupon | | 0.000% | | 11/15/40 | | 76,191 | | 49,852 | |
| United States Treasury Strip Coupon | | 0.000% | | 2/15/41 | | 72,709 | | 47,398 | |
| United States Treasury Strip Coupon | | 0.000% | | 5/15/41 | | 56,139 | | 36,297 | |
| United States Treasury Strip Coupon | | 0.000% | | 8/15/41 | | 71,520 | | 45,940 | |
| United States Treasury Strip Coupon | | 0.000% | | 11/15/41 | | 48,883 | | 31,197 | |
| United States Treasury Strip Coupon | | 0.000% | | 2/15/42 | | 61,164 | | 38,810 | |
| United States Treasury Strip Coupon | | 0.000% | | 5/15/42 | | 67,324 | | 42,425 | |
| United States Treasury Strip Coupon | | 0.000% | | 8/15/42 | | 68,450 | | 42,867 | |
| United States Treasury Strip Coupon | | 0.000% | | 11/15/42 | | 56,653 | | 35,253 | |
| United States Treasury Strip Coupon | | 0.000% | | 2/15/43 | | 64,564 | | 39,944 | |
| United States Treasury Strip Coupon | | 0.000% | | 5/15/43 | | 69,692 | | 42,845 | |
| United States Treasury Strip Coupon | | 0.000% | | 8/15/43 | | 60,692 | | 37,112 | |
| United States Treasury Strip Coupon | | 0.000% | | 11/15/43 | | 39,548 | | 24,044 | |
| United States Treasury Strip Coupon | | 0.000% | | 2/15/44 | | 61,427 | | 37,111 | |
| United States Treasury Strip Coupon | | 0.000% | | 5/15/44 | | 66,611 | | 40,013 | |
| United States Treasury Strip Coupon | | 0.000% | | 8/15/44 | | 61,138 | | 36,559 | |
| United States Treasury Strip Coupon | | 0.000% | | 11/15/44 | | 46,090 | | 27,409 | |
| United States Treasury Strip Coupon | | 0.000% | | 2/15/45 | | 56,428 | | 33,337 | |
| United States Treasury Strip Coupon | | 0.000% | | 5/15/45 | | 65,764 | | 38,596 | |
| United States Treasury Strip Coupon | | 0.000% | | 8/15/45 | | 61,826 | | 36,014 | |
| United States Treasury Strip Coupon | | 0.000% | | 11/15/45 | | 65,825 | | 38,266 | |
| United States Treasury Strip Coupon | | 0.000% | | 2/15/46 | | 70,279 | | 40,592 | |
| United States Treasury Strip Coupon | | 0.000% | | 5/15/46 | | 81,613 | | 46,857 | |
| United States Treasury Strip Coupon | | 0.000% | | 8/15/46 | | 52,744 | | 30,118 | |
| United States Treasury Strip Coupon | | 0.000% | | 11/15/46 | | 71,039 | | 40,381 | |
| United States Treasury Strip Coupon | | 0.000% | | 2/15/47 | | 76,714 | | 43,379 | |
| United States Treasury Strip Coupon | | 0.000% | | 5/15/47 | | 71,967 | | 40,526 | |
| United States Treasury Strip Coupon | | 0.000% | | 8/15/47 | | 64,671 | | 36,216 | |
| United States Treasury Strip Coupon | | 0.000% | | 11/15/47 | | 65,201 | | 36,339 | |
| United States Treasury Strip Coupon | | 0.000% | | 2/15/48 | | 82,938 | | 45,998 | |
| United States Treasury Strip Coupon | | 0.000% | | 5/15/48 | | 71,924 | | 39,744 | |
| United States Treasury Strip Coupon | | 0.000% | | 8/15/48 | | 46,500 | | 25,666 | |
| United States Treasury Strip Coupon | | 0.000% | | 11/15/48 | | 6,423 | | 3,519 | |
8
Extended Duration Treasury Index Fund
| | | Coupon | | Maturity Date | | Face Amount ($000 | ) | Market Value· ($000 | ) |
| United States Treasury Strip Coupon | | 0.000% | | 2/15/49 | | 16,318 | | 8,900 | |
| United States Treasury Strip Coupon | | 0.000% | | 5/15/49 | | 12,492 | | 6,753 | |
| United States Treasury Strip Coupon | | 0.000% | | 8/15/49 | | 50 | | 27 | |
| United States Treasury Strip Principal | | 0.000% | | 11/15/39 | | 66,058 | | 45,637 | |
| United States Treasury Strip Principal | | 0.000% | | 2/15/40 | | 65,526 | | 45,095 | |
| United States Treasury Strip Principal | | 0.000% | | 5/15/40 | | 63,961 | | 43,618 | |
| United States Treasury Strip Principal | | 0.000% | | 8/15/40 | | 52,681 | | 35,601 | |
| United States Treasury Strip Principal | | 0.000% | | 11/15/40 | | 60,282 | | 40,417 | |
| United States Treasury Strip Principal | | 0.000% | | 2/15/41 | | 45,634 | | 30,468 | |
| United States Treasury Strip Principal | | 0.000% | | 5/15/41 | | 46,584 | | 30,807 | |
| United States Treasury Strip Principal | | 0.000% | | 8/15/41 | | 27,803 | | 18,209 | |
| United States Treasury Strip Principal | | 0.000% | | 11/15/41 | | 27,398 | | 17,802 | |
| United States Treasury Strip Principal | | 0.000% | | 2/15/42 | | 38,090 | | 24,616 | |
| United States Treasury Strip Principal | | 0.000% | | 5/15/42 | | 47,821 | | 30,654 | |
| United States Treasury Strip Principal | | 0.000% | | 8/15/42 | | 54,215 | | 34,528 | |
| United States Treasury Strip Principal | | 0.000% | | 11/15/42 | | 59,154 | | 37,429 | |
| United States Treasury Strip Principal | | 0.000% | | 2/15/43 | | 75,914 | | 47,737 | |
| United States Treasury Strip Principal | | 0.000% | | 5/15/43 | | 46,539 | | 29,116 | |
| United States Treasury Strip Principal | | 0.000% | | 8/15/43 | | 60,612 | | 37,712 | |
| United States Treasury Strip Principal | | 0.000% | | 11/15/43 | | 52,519 | | 32,508 | |
| United States Treasury Strip Principal | | 0.000% | | 2/15/44 | | 53,716 | | 33,027 | |
| United States Treasury Strip Principal | | 0.000% | | 5/15/44 | | 47,059 | | 28,739 | |
| United States Treasury Strip Principal | | 0.000% | | 8/15/44 | | 54,195 | | 32,911 | |
| United States Treasury Strip Principal | | 0.000% | | 11/15/44 | | 56,009 | | 33,820 | |
| United States Treasury Strip Principal | | 0.000% | | 2/15/45 | | 47,879 | | 28,772 | |
| United States Treasury Strip Principal | | 0.000% | | 5/15/45 | | 67,102 | | 40,120 | |
| United States Treasury Strip Principal | | 0.000% | | 8/15/45 | | 88,367 | | 52,495 | |
| United States Treasury Strip Principal | | 0.000% | | 11/15/45 | | 64,989 | | 38,475 | |
| United States Treasury Strip Principal | | 0.000% | | 2/15/46 | | 56,553 | | 33,207 | |
| United States Treasury Strip Principal | | 0.000% | | 5/15/46 | | 57,187 | | 33,432 | |
| United States Treasury Strip Principal | | 0.000% | | 8/15/46 | | 67,506 | | 39,238 | |
| United States Treasury Strip Principal | | 0.000% | | 11/15/46 | | 96,638 | | 56,095 | |
| United States Treasury Strip Principal | | 0.000% | | 2/15/47 | | 107,985 | | 62,428 | |
| United States Treasury Strip Principal | | 0.000% | | 5/15/47 | | 64,342 | | 36,846 | |
| United States Treasury Strip Principal | | 0.000% | | 8/15/47 | | 87,627 | | 49,858 | |
| United States Treasury Strip Principal | | 0.000% | | 11/15/47 | | 75,073 | | 42,516 | |
| United States Treasury Strip Principal | | 0.000% | | 2/15/48 | | 99,473 | | 56,015 | |
| United States Treasury Strip Principal | | 0.000% | | 5/15/48 | | 83,655 | | 46,886 | |
| United States Treasury Strip Principal | | 0.000% | | 8/15/48 | | 20,732 | | 11,555 | |
| United States Treasury Strip Principal | | 0.000% | | 11/15/48 | | 39,894 | | 22,203 | |
| United States Treasury Strip Principal | | 0.000% | | 2/15/49 | | 67,659 | | 37,424 | |
| United States Treasury Strip Principal | | 0.000% | | 5/15/49 | | 86,393 | | 47,502 | |
| United States Treasury Strip Principal | | 0.000% | | 8/15/49 | | 129,654 | | 70,935 | |
Total U.S. Government and Agency Obligations (Cost $2,365,069) | | | | 2,974,191 | |
| | | | | | | | | | |
| | | | | | | Shares | | | |
Termporary Cash Investment (0.0%) | | | | | | | | | |
Money Market Fund (0.0%) | | | | | | | | | |
1 | Vanguard Market Liquidity Fund (Cost $1,164) | | 2.249% | | | | 11,637 | | 1,164 | |
Total Investments (100.0%) (Cost $2,366,233) | | | | | | | | 2,975,355 | |
9
Extended Duration Treasury Index Fund
| | Amount | |
| | ($000 | ) |
Other Assets and Liabilities (0.0%) | | | |
Other Assets | | | |
Investment in Vanguard | | 121 | |
Receivables for Investment Securities Sold | | 86,645 | |
Receivables for Capital Shares Issued | | 25 | |
Total Other Assets | | 86,791 | |
Liabilities | | | |
Payables for Investment Securities Purchased | | (79,621 | ) |
Payables for Capital Shares Redeemed | | (7,418 | ) |
Payables to Vanguard | | (340 | ) |
Total Liabilities | | (87,379 | ) |
Net Assets (100%) | | 2,974,767 | |
| | | |
| | | |
At August 31, 2019, net assets consisted of: | | | |
| | Amount | |
| | ($000 | ) |
Paid-in Capital | | 2,335,880 | |
Total Distributable Earnings (Loss) | | 638,887 | |
Net Assets | | 2,974,767 | |
| | | |
ETF Shares—Net Assets | | | |
Applicable to 9,100,000 outstanding $.001 par value shares of | | | |
beneficial interest (unlimited authorization) | | 1,332,522 | |
Net Asset Value Per Share—ETF Shares | | $146.43 | |
| | | |
Institutional Shares—Net Assets | | | |
Applicable to 19,490,210 outstanding $.001 par value shares of | | | |
beneficial interest (unlimited authorization) | | 862,291 | |
Net Asset Value Per Share—Institutional Shares | | $44.24 | |
| | | |
Institutional Plus Shares—Net Assets | | | |
Applicable to 7,022,989 outstanding $.001 par value shares of | | | |
beneficial interest (unlimited authorization) | | 779,954 | |
Net Asset Value Per Share—Institutional Plus Shares | | $111.06 | |
· See Note A in Notes to Financial Statements.
1 Affiliated money market fund available only to Vanguard funds and certain trusts and accounts managed by Vanguard. Rate shown is the 7-day yield.
See accompanying Notes, which are an integral part of the Financial Statements.
10
Extended Duration Treasury Index Fund
Statement of Operations
| | Year Ended | |
| | August 31, 2019 | |
| | ($000 | ) |
Investment Income | | | |
Income | | | |
Interest1 | | 65,036 | |
Total Income | | 65,036 | |
Expenses | | | |
The Vanguard Group—Note B | | | |
Investment Advisory Services | | 79 | |
Management and Administrative—ETF Shares | | 482 | |
Management and Administrative—Institutional Shares | | 399 | |
Management and Administrative—Institutional Plus Shares | | 191 | |
Marketing and Distribution—ETF Shares | | 48 | |
Marketing and Distribution—Institutional Shares | | 21 | |
Marketing and Distribution—Institutional Plus Shares | | 9 | |
Custodian Fees | | 3 | |
Auditing Fees | | 36 | |
Shareholders’ Reports—ETF Shares | | 32 | |
Shareholders’ Reports—Institutional Shares | | — | |
Shareholders’ Reports—Institutional Plus Shares | | — | |
Trustees’ Fees and Expenses | | 1 | |
Total Expenses | | 1,301 | |
Expenses Paid Indirectly | | (3 | ) |
Net Expenses | | 1,298 | |
Net Investment Income | | 63,738 | |
Realized Net Gain (Loss) | | | |
Investment Securities Sold1,2 | | 44,679 | |
Futures Contracts | | (16 | ) |
Realized Net Gain (Loss) | | 44,663 | |
Change in Unrealized Appreciation (Depreciation) of Investment Securities1 | | 616,956 | |
Net Increase (Decrease) in Net Assets Resulting from Operations | | 725,357 | |
1 Interest income, realized net gain (loss), and change in unrealized appreciation (depreciation) from affiliated companies of the fund were $13,000, $1,000, and ($1,000), respectively. Purchases and sales are for temporary cash investment purposes.
2 Includes $24,635,000 of net gain (loss) resulting from in-kind redemptions; such gain (loss) is not taxable to the fund.
See accompanying Notes, which are an integral part of the Financial Statements.
11
Extended Duration Treasury Index Fund
Statement of Changes in Net Assets
| | Year Ended August 31, | |
| | 2019 | | 2018 | |
| | ($000 | ) | ($000 | ) |
Increase (Decrease) in Net Assets | | | | | |
Operations | | | | | |
Net Investment Income | | 63,738 | | 51,694 | |
Realized Net Gain (Loss) | | 44,663 | | 17,987 | |
Change in Unrealized Appreciation (Depreciation) | | 616,956 | | (134,305 | ) |
Net Increase (Decrease) in Net Assets Resulting from Operations | | 725,357 | | (64,624 | ) |
Distributions | | | | | |
Net Investment Income | | | | | |
ETF Shares | | (23,240 | ) | (16,702 | ) |
Institutional Shares | | (22,154 | ) | (19,467 | ) |
Institutional Plus Shares | | (16,154 | ) | (14,255 | ) |
Realized Capital Gain1 | | | | | |
ETF Shares | | — | | (1,545 | ) |
Institutional Shares | | — | | (1,694 | ) |
Institutional Plus Shares | | — | | (1,371 | ) |
Total Distributions | | (61,548 | ) | (55,034 | ) |
Capital Share Transactions | | | | | |
ETF Shares | | 389,756 | | 77,251 | |
Institutional Shares | | (129,112 | ) | 147,075 | |
Institutional Plus Shares | | 72,452 | | 201,519 | |
Net Increase (Decrease) from Capital Share Transactions | | 333,096 | | 425,845 | |
Total Increase (Decrease) | | 996,905 | | 306,187 | |
Net Assets | | | | | |
Beginning of Period | | 1,977,862 | | 1,671,675 | |
End of Period | | 2,974,767 | | 1,977,862 | |
1 Includes fiscal 2019 and 2018 short-term gain distributions totaling $0 and $ 41,000, respectively. Short-term gain distributions are treated as ordinary income dividends for tax purposes.
See accompanying Notes, which are an integral part of the Financial Statements.
12
Extended Duration Treasury Index Fund
Financial Highlights
ETF Shares
For a Share Outstanding | | Year Ended August 31, | |
Throughout Each Period | | 2019 | | 2018 | | 2017 | | 2016 | | 2015 | |
Net Asset Value, Beginning of Period | | $113.39 | | $120.92 | | $139.77 | | $116.00 | | $113.24 | |
Investment Operations | | | | | | | | | | | |
Net Investment Income | | 3.347 | 1 | 3.353 | 1 | 3.383 | 1 | 3.420 | | 3.524 | |
Net Realized and Unrealized Gain (Loss) on Investments2 | | 32.972 | | (7.272 | ) | (16.377 | ) | 25.019 | | 3.113 | |
Total from Investment Operations | | 36.319 | | (3.919 | ) | (12.994 | ) | 28.439 | | 6.637 | |
Distributions | | | | | | | | | | | |
Dividends from Net Investment Income | | (3.279 | ) | (3.314 | ) | (3.402 | ) | (3.414 | ) | (3.506 | ) |
Distributions from Realized Capital Gains | | — | | (.297 | ) | (2.454 | ) | (1.255 | ) | (.371 | ) |
Total Distributions | | (3.279 | ) | (3.611 | ) | (5.856 | ) | (4.669 | ) | (3.877 | ) |
Net Asset Value, End of Period | | $146.43 | | $113.39 | | $120.92 | | $139.77 | | $116.00 | |
| | | | | | | | | | | |
Total Return | | 32.92% | | -3.24% | | -8.86% | | 25.30% | | 5.90% | |
| | | | | | | | | | | |
Ratios/Supplemental Data | | | | | | | | | | | |
Net Assets, End of Period (Millions) | | $1,333 | | $658 | | $623 | | $615 | | $365 | |
Ratio of Total Expenses to Average Net Assets | | 0.07% | | 0.07% | | 0.07% | | 0.07% | | 0.10% | |
Ratio of Net Investment Income to Average Net Assets | | 2.87% | | 2.93% | | 2.90% | | 2.77% | | 2.93% | |
Portfolio Turnover Rate3 | | 20% | | 18% | | 18% | | 20% | | 16% | |
1 Calculated based on average shares outstanding.
2 Includes increases from purchase fees of $0.04, $0.07, $0.16, $0.06, and $0.05.
3 Excludes the value of portfolio securities received or delivered as a result of in-kind purchases or redemptions of the fund’s capital shares, including ETF Creation Units.
See accompanying Notes, which are an integral part of the Financial Statements.
13
Extended Duration Treasury Index Fund
Financial Highlights
Institutional Shares
For a Share Outstanding | | Year Ended August 31, | |
Throughout Each Period | | 2019 | | 2018 | | 2017 | | 2016 | | 2015 | |
Net Asset Value, Beginning of Period | | $34.25 | | $36.52 | | $42.20 | | $35.02 | | $34.18 | |
Investment Operations | | | | | | | | | | | |
Net Investment Income | | 1.015 | 1 | 1.016 | 1 | 1.024 | 1 | 1.036 | | 1.069 | |
Net Realized and Unrealized Gain (Loss) on Investments2 | | 9.967 | | (2.191 | ) | (4.934 | ) | 7.558 | | .947 | |
Total from Investment Operations | | 10.982 | | (1.175 | ) | (3.910 | ) | 8.594 | | 2.016 | |
Distributions | | | | | | | | | | | |
Dividends from Net Investment Income | | (.992 | ) | (1.005 | ) | (1.030 | ) | (1.035 | ) | (1.064 | ) |
Distributions from Realized Capital Gains | | — | | (.090 | ) | (.740 | ) | (.379 | ) | (.112 | ) |
Total Distributions | | (.992 | ) | (1.095 | ) | (1.770 | ) | (1.414 | ) | (1.176 | ) |
Net Asset Value, End of Period | | $44.24 | | $34.25 | | $36.52 | | $42.20 | | $35.02 | |
| | | | | | | | | | | |
Total Return3 | | 32.94% | | -3.23% | | -8.86% | | 25.33% | | 5.89% | |
| | | | | | | | | | | |
Ratios/Supplemental Data | | | | | | | | | | | |
Net Assets, End of Period (Millions) | | $862 | | $787 | | $682 | | $660 | | $484 | |
Ratio of Total Expenses to Average Net Assets | | 0.06% | | 0.06% | | 0.06% | | 0.06% | | 0.08% | |
Ratio of Net Investment Income to Average Net Assets | | 2.88% | | 2.94% | | 2.91% | | 2.78% | | 2.95% | |
Portfolio Turnover Rate4 | | 20% | | 18% | | 18% | | 20% | | 16% | |
1 Calculated based on average shares outstanding.
2 Includes increases from purchase fees of $0.01, $0.02, $0.05, $0.02, and $0.01.
3 Total returns do not include transaction fees that may have applied in the periods shown. Fund prospectuses provide information about any applicable transaction fees.
4 Excludes the value of portfolio securities received or delivered as a result of in-kind purchases or redemptions of the fund’s capital shares, including ETF Creation Units.
See accompanying Notes, which are an integral part of the Financial Statements.
14
Extended Duration Treasury Index Fund
Financial Highlights
Institutional Plus Shares
For a Share Outstanding | | Year Ended August 31, | |
Throughout Each Period | | 2019 | | 2018 | | 2017 | | 2016 | | 2015 | |
Net Asset Value, Beginning of Period | | $85.99 | | $91.68 | | $105.93 | | $87.92 | | $85.80 | |
Investment Operations | | | | | | | | | | | |
Net Investment Income | | 2.564 | 1 | 2.568 | 1 | 2.588 | 1 | 2.620 | | 2.701 | |
Net Realized and Unrealized Gain (Loss) on Investments2 | | 25.015 | | (5.492 | ) | (12.375 | ) | 18.958 | | 2.389 | |
Total from Investment Operations | | 27.579 | | (2.924 | ) | (9.787 | ) | 21.578 | | 5.090 | |
Distributions | | | | | | | | | | | |
Dividends from Net Investment Income | | (2.509 | ) | (2.541 | ) | (2.603 | ) | (2.616 | ) | (2.688 | ) |
Distributions from Realized Capital Gains | | — | | (.225 | ) | (1.860 | ) | (.952 | ) | (.282 | ) |
Total Distributions | | (2.509 | ) | (2.766 | ) | (4.463 | ) | (3.568 | ) | (2.970 | ) |
Net Asset Value, End of Period | | $111.06 | | $85.99 | | $91.68 | | $105.93 | | $87.92 | |
| | | | | | | | | | | |
Total Return3 | | 32.95% | | -3.20% | | -8.84% | | 25.34% | | 5.93% | |
| | | | | | | | | | | |
Ratios/Supplemental Data | | | | | | | | | | | |
Net Assets, End of Period (Millions) | | $780 | | $533 | | $367 | | $258 | | $250 | |
Ratio of Total Expenses to Average Net Assets | | 0.04% | | 0.04% | | 0.04% | | 0.04% | | 0.06% | |
Ratio of Net Investment Income to Average Net Assets | | 2.90% | | 2.96% | | 2.93% | | 2.80% | | 2.97% | |
Portfolio Turnover Rate4 | | 20% | | 18% | | 18% | | 20% | | 16% | |
1 Calculated based on average shares outstanding.
2 Includes increases from purchase fees of $0.03, $0.06, $0.12, $0.05, and $0.04.
3 Total returns do not include transaction fees that may have applied in the periods shown. Fund prospectuses provide information about any applicable transaction fees.
4 Excludes the value of portfolio securities received or delivered as a result of in-kind purchases or redemptions of the fund’s capital shares, including ETF Creation Units.
See accompanying Notes, which are an integral part of the Financial Statements.
15
Extended Duration Treasury Index Fund
Notes to Financial Statements
Vanguard Extended Duration Treasury Index Fund is registered under the Investment Company Act of 1940 as an open-end investment company, or mutual fund. The fund offers three classes of shares: ETF Shares, Institutional Shares, and Institutional Plus Shares. Each of the share classes has different eligibility and minimum purchase requirements, and is designed for different types of investors. ETF Shares are listed for trading on NYSE Arca; they can be purchased and sold through a broker.
A. The following significant accounting policies conform to generally accepted accounting principles for U.S. investment companies. The fund consistently follows such policies in preparing its financial statements.
1. Security Valuation: Securities are valued as of the close of trading on the New York Stock Exchange (generally 4 p.m., Eastern time) on the valuation date. Bonds and temporary cash investments are valued using the latest bid prices or using valuations based on a matrix system (which considers such factors as security prices, yields, maturities, and ratings), both as furnished by independent pricing services. Investments in Vanguard Market Liquidity Fund are valued at that fund’s net asset value. Securities for which market quotations are not readily available, or whose values have been affected by events occurring before the fund’s pricing time but after the close of the securities’ primary markets, are valued by methods deemed by the board of trustees to represent fair value.
2. Futures Contracts: The fund uses futures contracts to invest in fixed income asset classes with greater efficiency and lower cost than is possible through direct investment, to add value when these instruments are attractively priced, or to adjust sensitivity to changes in interest rates. The primary risks associated with the use of futures contracts are imperfect correlation between changes in market values of bonds held by the fund and the prices of futures contracts, and the possibility of an illiquid market. Counterparty risk involving futures is mitigated because a regulated clearinghouse is the counterparty instead of the clearing broker. To further mitigate counterparty risk, the fund trades futures contracts on an exchange, monitors the financial strength of its clearing brokers and clearinghouse, and has entered into clearing agreements with its clearing brokers. The clearinghouse imposes initial margin requirements to secure the fund’s performance and requires daily settlement of variation margin representing changes in the market value of each contract. Any assets pledged as initial margin for open contracts are noted in the Statement of Net Assets.
Futures contracts are valued at their quoted daily settlement prices. The notional amounts of the contracts are not recorded in the Statement of Net Assets. Fluctuations in the value of the contracts are recorded in the Statement of Net Assets as an asset (liability) and in the Statement of Operations as unrealized appreciation (depreciation) until the contracts are closed, when they are recorded as realized futures gains (losses).
During the year ended August 31, 2019, the fund’s average investments in long and short futures contracts represented 0% and less than 1% of net assets, respectively, based on the average of the notional amounts at each quarter-end during the period. The fund had no open futures contracts at August 31, 2019.
3. Federal Income Taxes: The fund intends to continue to qualify as a regulated investment company and distribute all of its taxable income. Management has analyzed the fund’s tax positions taken for all open federal income tax years (August 31, 2016–2019), and has concluded that no provision for federal income tax is required in the fund’s financial statements.
4. Distributions: Distributions to shareholders are recorded on the ex-dividend date. Distributions are determined on a tax basis and may differ from net investment income and realized capital gains for financial reporting purposes.
16
Extended Duration Treasury Index Fund
5. Credit Facility: The fund and certain other funds managed by The Vanguard Group (“Vanguard”) participate in a $4.3 billion committed credit facility provided by a syndicate of lenders pursuant to a credit agreement that may be renewed annually; each fund is individually liable for its borrowings, if any, under the credit facility. Borrowings may be utilized for temporary and emergency purposes, and are subject to the fund’s regulatory and contractual borrowing restrictions. The participating funds are charged administrative fees and an annual commitment fee of 0.10% of the undrawn amount of the facility; these fees are allocated to the funds based on a method approved by the fund’s board of trustees and included in Management and Administrative expenses on the fund’s Statement of Operations. Any borrowings under this facility bear interest at a rate based upon the higher of the one-month London Interbank Offered Rate, federal funds effective rate, or overnight bank funding rate plus an agreed-upon spread.
The fund had no borrowings outstanding at August 31, 2019, or at any time during the period then ended.
6. Other: Interest income includes income distributions received from Vanguard Market Liquidity Fund and is accrued daily. Premiums and discounts on debt securities purchased are amortized and accreted, respectively, to interest income over the lives of the respective securities. Security transactions are accounted for on the date securities are bought or sold. Costs used to determine realized gains (losses) on the sale of investment securities are those of the specific securities sold. Fees assessed on capital share transactions are credited to paid-in capital.
Each class of shares has equal rights as to assets and earnings, except that each class separately bears certain class-specific expenses related to maintenance of shareholder accounts (included in Management and Administrative expenses) and shareholder reporting. Marketing and distribution expenses are allocated to each class of shares based on a method approved by the board of trustees. Income, other non-class-specific expenses, and gains and losses on investments are allocated to each class of shares based on its relative net assets.
B. In accordance with the terms of a Funds’ Service Agreement (the “FSA”) between Vanguard and the fund, Vanguard furnishes to the fund investment advisory, corporate management, administrative, marketing, and distribution services at Vanguard’s cost of operations (as defined by the FSA). These costs of operations are allocated to the fund based on methods and guidelines approved by the board of trustees. Vanguard does not require reimbursement in the current period for certain costs of operations (such as deferred compensation/benefits and risk/insurance costs); the fund’s liability for these costs of operations is included in Payables to Vanguard on the Statement of Net Assets. All other costs of operations payable to Vanguard are generally settled twice a month.
Upon the request of Vanguard, the fund may invest up to 0.40% of its net assets as capital in Vanguard. At August 31, 2019, the fund had contributed to Vanguard capital in the amount of $121,000, representing less than 0.01% of the fund’s net assets and 0.05% of Vanguard’s capitalization. The fund’s trustees and officers are also directors and employees, respectively, of Vanguard.
C. The fund’s custodian bank has agreed to reduce its fees when the fund maintains cash on deposit in the non-interest-bearing custody account. For the year ended August 31, 2019, custodian fee offset arrangements reduced the fund’s expenses by $3,000 (an annual rate of 0.00% of average net assets).
17
Extended Duration Treasury Index Fund
D. Various inputs may be used to determine the value of the fund’s investments. These inputs are summarized in three broad levels for financial statement purposes. The inputs or methodologies used to value securities are not necessarily an indication of the risk associated with investing in those securities.
Level 1—Quoted prices in active markets for identical securities.
Level 2—Other significant observable inputs (including quoted prices for similar securities, interest rates, prepayment speeds, credit risk, etc.).
Level 3—Significant unobservable inputs (including the fund’s own assumptions used to determine the fair value of investments). Any investments valued with significant unobservable inputs are noted on the Statement of Net Assets.
The following table summarizes the market value of the fund’s investments as of August 31, 2019, based on the inputs used to value them:
| | Level 1 | | Level 2 | | Level 3 |
Investments | | ($000 | ) | ($000 | ) | ($000) |
U.S. Government and Agency Obligations | | — | | 2,974,191 | | — |
Temporary Cash Investments | | 1,164 | | — | | — |
Total | | 1,164 | | 2,974,191 | | — |
E. Permanent differences between book-basis and tax-basis components of net assets are reclassified among capital accounts in the financial statements to reflect their tax character. These reclassifications have no effect on net assets or net asset value per share. As of period end, permanent differences primarily attributable to the accounting for in-kind redemptions and the accounting for distributions in connection with fund share redemptions were reclassified between the following accounts:
| | Amount |
| | ($000) |
Paid-in Capital | | 24,882 |
Total Distributable Earnings (Loss) | | (24,882) |
Temporary differences between book-basis and tax-basis components of total distributable earnings (loss) arise when certain items of income, gain, or loss are recognized in different periods for financial statement and tax purposes; these differences will reverse at some time in the future. The differences are primarily related to the tax deferral on wash sales. As of period end, the tax-basis components of total distributable earnings (loss) are detailed in the table as follows:
| | Amount |
| | ($000) |
Undistributed Ordinary Income | | 18,142 |
Undistributed Long-Term Gains | | 11,876 |
Capital Loss Carryforwards (Non-expiring)* | | — |
Net Unrealized Gains (Losses) | | 609,122 |
* The fund used capital loss carryforwards of $1,478,000 to offset taxable capital gains realized during the year ended August 31, 2019.
18
Extended Duration Treasury Index Fund
As of August 31, 2019, gross unrealized appreciation and depreciation for investments based on cost for U.S. federal income tax purposes were as follows:
| | Amount |
| | ($000) |
Tax Cost | | 2,366,233 |
Gross Unrealized Appreciation | | 609,565 |
Gross Unrealized Depreciation | | (443) |
Net Unrealized Appreciation (Depreciation) | | 609,122 |
F. During the year ended August 31, 2019, the fund purchased $1,043,477,000 of investment securities and sold $773,794,000 of investment securities, other than temporary cash investments. Purchases and sales include $605,998,000 and $295,739,000, respectively, in connection with in-kind purchases and redemptions of the fund’s capital shares.
G. Capital share transactions for each class of shares were:
| | Year Ended August 31, | |
| | | | 2019 | | | | 2018 | |
| | Amount | | Shares | | Amount | | Shares | |
| | ($000 | ) | (000 | ) | ($000 | ) | (000 | ) |
ETF Shares | | | | | | | | | |
Issued1 | | 607,253 | | 5,250 | | 272,760 | | 2,400 | |
Issued in Lieu of Cash Distributions | | — | | — | | — | | — | |
Redeemed | | (217,497 | ) | (1,950 | ) | (195,509 | ) | (1,750 | ) |
Net Increase (Decrease)—ETF Shares | | 389,756 | | 3,300 | | 77,251 | | 650 | |
Institutional Shares | | | | | | | | | |
Issued1 | | 63,167 | | 1,842 | | 175,785 | | 5,120 | |
Issued in Lieu of Cash Distributions | | 22,033 | | 644 | | 20,957 | | 603 | |
Redeemed | | (214,312 | ) | (5,975 | ) | (49,667 | ) | (1,417 | ) |
Net Increase (Decrease)—Institutional Shares | | (129,112 | ) | (3,489 | ) | 147,075 | | 4,306 | |
Institutional Plus Shares | | | | | | | | | |
Issued1 | | 64,883 | | 720 | | 188,992 | | 2,053 | |
Issued in Lieu of Cash Distributions | | 16,154 | | 187 | | 15,626 | | 179 | |
Redeemed | | (8,585 | ) | (83 | ) | (3,099 | ) | (36 | ) |
Net Increase (Decrease)—Institutional Plus Shares | | 72,452 | | 824 | | 201,519 | | 2,196 | |
1 Includes purchase fees for fiscal 2019 and 2018 of $716,000 and $1,274,000, respectively (fund totals).
H. Management has determined that no events or transactions occurred subsequent to August 31, 2019, that would require recognition or disclosure in these financial statements.
19
Report of Independent Registered
Public Accounting Firm
To the Board of Trustees of Vanguard World Fund and Shareholders of Vanguard Extended Duration Treasury Index Fund
Opinion on the Financial Statements
We have audited the accompanying statement of net assets of Vanguard Extended Duration Treasury Index Fund (one of the funds constituting Vanguard World Fund, referred to hereafter as the “Fund”) as of August 31, 2019, the related statement of operations for the year ended August 31, 2019, the statement of changes in net assets for each of the two years in the period ended August 31, 2019, including the related notes, and the financial highlights for each of the five years in the period ended August 31, 2019 (collectively referred to as the “financial statements”). In our opinion, the financial statements present fairly, in all material respects, the financial position of the Fund as of August 31, 2019, the results of its operations for the year then ended, the changes in its net assets for each of the two years in the period ended August 31, 2019 and the financial highlights for each of the five years in the period ended August 31, 2019 in conformity with accounting principles generally accepted in the United States of America.
Basis for Opinion
These financial statements are the responsibility of the Fund’s management. Our responsibility is to express an opinion on the Fund’s financial statements based on our audits. We are a public accounting firm registered with the Public Company Accounting Oversight Board (United States) (“PCAOB”) and are required to be independent with respect to the Fund in accordance with the U.S. federal securities laws and the applicable rules and regulations of the Securities and Exchange Commission and the PCAOB.
We conducted our audits of these financial statements in accordance with the standards of the PCAOB. Those standards require that we plan and perform the audit to obtain reasonable assurance about whether the financial statements are free of material misstatement, whether due to error or fraud.
Our audits included performing procedures to assess the risks of material misstatement of the financial statements, whether due to error or fraud, and performing procedures that respond to those risks. Such procedures included examining, on a test basis, evidence regarding the amounts and disclosures in the financial statements. Our audits also included evaluating the accounting principles used and significant estimates made by management, as well as evaluating the overall presentation of the financial statements. Our procedures included confirmation of securities owned as of August 31, 2019 by correspondence with the custodian, transfer agent and brokers; when replies were not received from brokers, we performed other auditing procedures. We believe that our audits provide a reasonable basis for our opinion.
/s/PricewaterhouseCoopers LLP
Philadelphia, Pennsylvania
October 16, 2019
We have served as the auditor of one or more investment companies in The Vanguard Group of Funds since 1975.
20
Special 2019 tax information (unaudited) for Vanguard Extended Duration Treasury Index Fund
This information for the fiscal year ended August 31, 2019, is included pursuant to provisions of the Internal Revenue Code.
For nonresident alien shareholders, 99.9% of income dividends are interest-related dividends.
21
Trustees Approve Advisory Arrangement
The board of trustees of Vanguard Extended Duration Treasury Index Fund has renewed the fund’s investment advisory arrangement with The Vanguard Group, Inc. (Vanguard), through its Fixed Income Group. The board determined that continuing the fund’s internalized management structure was in the best interests of the fund and its shareholders.
The board based its decision upon an evaluation of the advisor’s investment staff, portfolio management process, and performance. This evaluation included information provided to the board by Vanguard’s Portfolio Review Department, which is responsible for fund and advisor oversight and product management. The Portfolio Review Department met regularly with the advisor and made monthly presentations to the board during the fiscal year that directed the board’s focus to relevant information and topics.
The board, or an investment committee made up of board members, also received information throughout the year through advisor presentations. For each advisor presentation, the board was provided with letters and reports that included information about, among other things, the advisory firm and the advisor’s assessment of the investment environment, portfolio performance, and portfolio characteristics.
In addition, the board received monthly reports, which included a Market and Economic Report, a Fund Dashboard Monthly Summary, and a Fund Performance Report.
Prior to their meeting, the trustees were provided with a memo and materials that summarized the information they received over the course of the year. They also considered the factors discussed below, among others. However, no single factor determined whether the board approved the arrangement. Rather, it was the totality of the circumstances that drove the board’s decision.
Nature, extent, and quality of services
The board reviewed the quality of the fund’s investment management services over both the short and long term, and took into account the organizational depth and stability of the advisor. The board considered that Vanguard has been managing investments for more than four decades. The Fixed Income Group adheres to a sound, disciplined investment management process; the team has considerable experience, stability, and depth.
The board concluded that Vanguard’s experience, stability, depth, and performance, among other factors, warranted continuation of the advisory arrangement.
Investment performance
The board considered the short- and long-term performance of the fund, including any periods of outperformance or underperformance compared with its target index and peer group. The board concluded that the performance was such that the advisory arrangement should continue.
22
Cost
The board concluded that the fund’s expense ratio was well below the average expense ratio charged by funds in its peer group and that the fund’s advisory expenses were also well below the peer-group average.
The board does not conduct a profitability analysis of Vanguard because of Vanguard’s unique structure. Unlike most other mutual fund management companies, Vanguard is owned by the funds it oversees.
The benefit of economies of scale
The board concluded that the fund’s arrangement with Vanguard ensures that the fund will realize economies of scale as it grows, with the cost to shareholders declining as fund assets increase.
The board will consider whether to renew the advisory arrangement again after a one-year period.
23
BLOOMBERG is a trademark and service mark of Bloomberg Finance L.P. BARCLAYS is a trademark and service mark of Barclays Bank Plc, used under license. Bloomberg Finance L.P. and its affiliates, including Bloomberg Index Services Limited (BISL) (collectively, Bloomberg), or Bloomberg’s licensors, own all proprietary rights in the Bloomberg Barclays U.S. Treasury STRIPS 20–30 Year Equal Par Bond Index (the Index or Bloomberg Barclays Index).
Neither Barclays Bank Plc, Barclays Capital Inc., or any affiliate (collectively Barclays) or Bloomberg is the issuer or producer of the Extended Duration Treasury Index Fund and neither Bloomberg nor Barclays has any responsibilities, obligations or duties to investors in the Extended Duration Treasury Index Fund. The Index is licensed for use by The Vanguard Group, Inc. (Vanguard) as the sponsor of the Extended Duration Treasury Index Fund. Bloomberg and Barclays’ only relationship with Vanguard in respect to the Index is the licensing of the Index, which is determined, composed and calculated by BISL, or any successor thereto, without regard to the Issuer or the Extended Duration Treasury Index Fund or the owners of the Extended Duration Treasury Index Fund.
Additionally, Vanguard may for itself execute transaction(s) with Barclays in or relating to the Index in connection with the Extended Duration Treasury Index Fund. Investors acquire the Extended Duration Treasury Index Fund from Vanguard and investors neither acquire any interest in the Index nor enter into any relationship of any kind whatsoever with Bloomberg or Barclays upon making an investment in the Extended Duration Treasury Index Fund. The Extended Duration Treasury Index Fund is not sponsored, endorsed, sold or promoted by Bloomberg or Barclays. Neither Bloomberg nor Barclays makes any representation or warranty, express or implied regarding the advisability of investing in the Extended Duration Treasury Index Fund or the advisability of investing in securities generally or the ability of the Index to track corresponding or relative market performance. Neither Bloomberg nor Barclays has passed on the legality or suitability of the Extended Duration Treasury Index Fund with respect to any person or entity. Neither Bloomberg nor Barclays is responsible for and has not participated in the determination of the timing of, prices at, or quantities of the Extended Duration Treasury Index Fund to be issued. Neither Bloomberg nor Barclays has any obligation to take the needs of the Issuer or the owners of the Extended Duration Treasury Index Fund or any other third party into consideration in determining, composing or calculating the Index. Neither Bloomberg nor Barclays has any obligation or liability in connection with administration, marketing or trading of the Extended Duration Treasury Index Fund.
24
The licensing agreement between Bloomberg and Barclays is solely for the benefit of Bloomberg and Barclays and not for the benefit of the owners of the Extended Duration Treasury Index Fund, investors or other third parties. In addition, the licensing agreement between Vanguard and Bloomberg is solely for the benefit of Vanguard and Bloomberg and not for the benefit of the owners of the Extended Duration Treasury Index Fund, investors or other third parties.
NEITHER BLOOMBERG NOR BARCLAYS SHALL HAVE ANY LIABILITY TO THE ISSUER, INVESTORS OR TO OTHER THIRD PARTIES FOR THE QUALITY, ACCURACY AND/OR COMPLETENESS OF THE BLOOMBERG BARCLAYS INDEX OR ANY DATA INCLUDED THEREIN OR FOR INTERRUPTIONS IN THE DELIVERY OF THE BLOOMBERG BARCLAYS INDEX. NEITHER BLOOMBERG NOR BARCLAYS MAKES ANY WARRANTY, EXPRESS OR IMPLIED, AS TO RESULTS TO BE OBTAINED BY THE ISSUER, THE INVESTORS OR ANY OTHER PERSON OR ENTITY FROM THE USE OF THE BLOOMBERG BARCLAYS INDEX OR ANY DATA INCLUDED THEREIN. NEITHER BLOOMBERG NOR BARCLAYS MAKES ANY EXPRESS OR IMPLIED WARRANTIES, AND EACH HEREBY EXPRESSLY DISCLAIMS ALL WARRANTIES OF MERCHANTABILITY OR FITNESS FOR A PARTICULAR PURPOSE OR USE WITH RESPECT TO THE BLOOMBERG BARCLAYS INDEX OR ANY DATA INCLUDED THEREIN. BLOOMBERG RESERVES THE RIGHT TO CHANGE THE METHODS OF CALCULATION OR PUBLICATION, OR TO CEASE THE CALCULATION OR PUBLICATION OF THE BLOOMBERG BARCLAYS INDEX, AND NEITHER BLOOMBERG NOR BARCLAYS SHALL BE LIABLE FOR ANY MISCALCULATION OF OR ANY INCORRECT, DELAYED OR INTERRUPTED PUBLICATION WITH RESPECT TO THE BLOOMBERG BARCLAYS INDEX. NEITHER BLOOMBERG NOR BARCLAYS SHALL BE LIABLE FOR ANY DAMAGES, INCLUDING, WITHOUT LIMITATION, ANY SPECIAL, INDIRECT OR CONSEQUENTIAL DAMAGES, OR ANY LOST PROFITS AND EVEN IF ADVISED OF THE POSSIBILITY OF SUCH, RESULTING FROM THE USE OF A BLOOMBERG BARCLAYS INDEX OR ANY DATA INCLUDED THEREIN OR WITH RESPECT TO THE EXTENDED DURATION TREASURY INDEX FUND.
None of the information supplied by Bloomberg or Barclays and used in this publication may be reproduced in any manner without the prior written permission of both Bloomberg and Barclays Capital, the investment banking division of Barclays Bank Plc. Barclays Bank Plc is registered in England No. 1026167. Registered office 1 Churchill Place London E14 5HP.
© 2019 Bloomberg. Used with Permission.
Source: Bloomberg Index Services Limited. Copyright 2019, Bloomberg. All rights reserved.
25
This page intentionally left blank.
The People Who Govern Your Fund
The trustees of your mutual fund are there to see that the fund is operated and managed in your best interests since, as a shareholder, you are a part owner of the fund. Your fund’s trustees also serve on the board of directors of The Vanguard Group, Inc., which is owned by the Vanguard funds and provides services to them.
A majority of Vanguard’s board members are independent, meaning that they have no affiliation with Vanguard or the funds they oversee, apart from the sizable personal investments they have made as private individuals. The independent board members have distinguished backgrounds in business, academia, and public service. Each of the trustees and executive officers oversees 212 Vanguard funds.
Information for each trustee and executive officer of the fund appears below. The mailing address of the trustees and officers is P.O. Box 876, Valley Forge, PA 19482. More information about the trustees is in the Statement of Additional Information, which can be obtained, without charge, by contacting Vanguard at 800-662-7447, or online at vanguard.com.
Interested Trustee1
Mortimer J. Buckley
Born in 1969. Trustee since January 2018. Principal occupation(s) during the past five years and other experience: chairman of the board (January 2019– present) of Vanguard and of each of the investment companies served by Vanguard; chief executive officer (January 2018–present) of Vanguard; chief executive officer, president, and trustee (January 2018–present) of each of the investment companies served by Vanguard; president and director (2017–present) of Vanguard; and president (February 2018–present) of Vanguard Marketing Corporation. Chief investment officer (2013–2017), managing director (2002–2017), head of the Retail Investor Group (2006–2012), and chief information officer (2001–2006) of Vanguard. Chairman of the board (2011–2017) and trustee (2009–2017) of the Children’s Hospital of Philadelphia; trustee (2018–present) of The Shipley School.
Independent Trustees
Emerson U. Fullwood
Born in 1948. Trustee since January 2008. Principal occupation(s) during the past five years and other experience: executive chief staff and marketing officer for North America and corporate vice president (retired 2008) of Xerox Corporation (document management products and services). Former president of the Worldwide Channels Group, Latin America, and Worldwide Customer Service and executive chief staff officer of Developing Markets of Xerox. Executive in residence and 2009–2010 Distinguished Minett Professor at the Rochester Institute of Technology. Director of SPX FLOW, Inc. (multi-industry manufacturing). Director of the University of Rochester Medical Center, the Monroe Community College Foundation, the United Way of Rochester, North Carolina A&T University, and Roberts Wesleyan College. Trustee of the University of Rochester.
Amy Gutmann
Born in 1949. Trustee since June 2006. Principal occupation(s) during the past five years and other experience: president (2004–present) of the University of Pennsylvania. Christopher H. Browne Distinguished Professor of Political Science, School of Arts and Sciences, and professor of communication, Annenberg School for Communication, with secondary faculty appointments in the Department of Philosophy, School of Arts and Sciences, and at the Graduate School of Education, University of Pennsylvania. Trustee of the National Constitution Center.
F. Joseph Loughrey
Born in 1949. Trustee since October 2009. Principal occupation(s) during the past five years and other experience: president and chief operating officer (retired 2009) and vice chairman of the board (2008–2009) of Cummins Inc. (industrial machinery). Chairman of the board of Hillenbrand, Inc. (specialized consumer services), and the Lumina Foundation.
1 Mr. Buckley is considered an “interested person,” as defined in the Investment Company Act of 1940, because he is an officer of the Vanguard funds.
Director of the V Foundation and Oxfam America. Member of the advisory council for the College of Arts and Letters and chair of the advisory board to the Kellogg Institute for International Studies, both at the University of Notre Dame.
Mark Loughridge
Born in 1953. Trustee since March 2012. Principal occupation(s) during the past five years and other experience: senior vice president and chief financial officer (retired 2013) of IBM (information technology services). Fiduciary member of IBM’s Retirement Plan Committee (2004–2013), senior vice president and general manager (2002–2004) of IBM Global Financing, vice president and controller (1998–2002) of IBM, and a variety of other prior management roles at IBM. Member of the Council on Chicago Booth.
Scott C. Malpass
Born in 1962. Trustee since March 2012. Principal occupation(s) during the past five years and other experience: chief investment officer (1989–present) and vice president (1996–present) of the University of Notre Dame. Assistant professor of finance at the Mendoza College of Business, University of Notre Dame, and member of the Notre Dame 403(b) Investment Committee. Chairman of the board of TIFF Advisory Services, Inc. Member of the board of Catholic Investment Services, Inc. (investment advisors) and the board of superintendence of the Institute for the Works of Religion.
Deanna Mulligan
Born in 1963. Trustee since January 2018. Principal occupation(s) during the past five years and other experience: president (2010–present) and chief executive officer (2011–present) of The Guardian Life Insurance Company of America. Chief operating officer (2010–2011) and executive vice president (2008–2010) of Individual Life and Disability of The Guardian Life Insurance Company of America. Member of the board of The Guardian Life Insurance Company of America, the American Council of Life Insurers, the Partnership for New York City (business leadership), and the Committee Encouraging Corporate Philanthropy. Trustee of the Economic Club of New York and the Bruce Museum (arts and science). Member of the Advisory Council for the Stanford Graduate School of Business.
André F. Perold
Born in 1952. Trustee since December 2004. Principal occupation(s) during the past five years and other experience: George Gund Professor of Finance and Banking, Emeritus at the Harvard Business School (retired 2011). Chief investment officer and co-managing partner of HighVista Strategies LLC (private investment firm). Board of advisors and investment committee member of the Museum of Fine Arts Boston. Board member (2018–present) of RIT Capital Partners (investment firm); investment committee member of Partners Health Care System.
Sarah Bloom Raskin
Born in 1961. Trustee since January 2018. Principal occupation(s) during the past five years and other experience: deputy secretary (2014–2017) of the United States Department of the Treasury. Governor (2010–2014) of the Federal Reserve Board. Commissioner (2007–2010) of financial regulation for the State of Maryland. Member of the board of directors (2012–2014) of Neighborhood Reinvestment Corporation. Director (2017–present) of i(x) Investments, LLC; director (2017–present) of Reserve Trust. Rubinstein Fellow (2017–present) of Duke University; trustee (2017–present) of Amherst College.
Peter F. Volanakis
Born in 1955. Trustee since July 2009. Principal occupation(s) during the past five years and other experience: president and chief operating officer (retired 2010) of Corning Incorporated (communications equipment) and director of Corning Incorporated (2000–2010) and Dow Corning (2001–2010). Director (2012) of SPX Corporation (multi-industry manufacturing). Overseer of the Amos Tuck School of Business Administration, Dartmouth College (2001–2013). Chairman of the board of trustees of Colby-Sawyer College. Member of the board of Hypertherm Inc. (industrial cutting systems, software, and consumables).
Executive Officers
Glenn Booraem
Born in 1967. Principal occupation(s) during the past five years and other experience: principal of Vanguard. Investment stewardship officer (2017–present), treasurer (2015–2017), controller (2010–2015), and assistant controller (2001–2010) of each of the investment companies served by Vanguard.
Christine M. Buchanan
Born in 1970. Principal occupation(s) during the past five years and other experience: principal of Vanguard and global head of Fund Administration at Vanguard. Treasurer (2017–present) of each of the investment companies served by Vanguard. Partner (2005–2017) at KPMG LLP (audit, tax, and advisory services).
Thomas J. Higgins
Born in 1957. Principal occupation(s) during the past five years and other experience: principal of Vanguard. Chief financial officer (2008–present) and treasurer (1998–2008) of each of the investment companies served by Vanguard.
Peter Mahoney
Born in 1974. Principal occupation(s) during the past five years and other experience: principal of Vanguard. Controller (2015–present) of each of the investment companies served by Vanguard. Head of International Fund Services (2008–2014) at Vanguard.
Anne E. Robinson
Born in 1970. Principal occupation(s) during the past five years and other experience: general counsel (2016–present) of Vanguard. Secretary (2016–present) of Vanguard and of each of the investment companies served by Vanguard. Managing director (2016–present) of Vanguard. Director and senior vice president (2016–2018) of Vanguard Marketing Corporation. Managing director and general counsel of Global Cards and Consumer Services (2014–2016) at Citigroup. Counsel (2003–2014) at American Express.
Michael Rollings
Born in 1963. Principal occupation(s) during the past five years and other experience: finance director (2017–present) and treasurer (2017) of each of the investment companies served by Vanguard. Managing director (2016–present) of Vanguard. Chief financial officer (2016–present) of Vanguard. Director (2016–present) of Vanguard Marketing Corporation. Executive vice president and chief financial officer (2006–2016) of MassMutual Financial Group.
John E. Schadl
Born in 1972. Principal occupation(s) during the past five years and other experience: principal of Vanguard. Chief compliance officer (2019–present) of Vanguard and of each of the investment companies served by Vanguard. Assistant vice president (May 2019–present) of Vanguard Marketing Corporation.
Vanguard Senior Management Team
Joseph Brennan | | Chris D. McIsaac |
Mortimer J. Buckley | | James M. Norris |
Gregory Davis | | Thomas M. Rampulla |
John James | | Karin A. Risi |
Martha G. King | | Anne E. Robinson |
John T. Marcante | | Michael Rollings |
| 
|
| |
| |
| P.O. Box 2600 |
| Valley Forge, PA 19482-2600 |
Connect with Vanguard® > vanguard.com
Fund Information > 800-662-7447
Direct Investor Account Services > 800-662-2739
Institutional Investor Services > 800-523-1036
Text Telephone for People
Who Are Deaf or Hard of Hearing > 800-749-7273
This material may be used in conjunction with the offering of shares of any Vanguard fund only if preceded or accompanied by the fund’s current prospectus.
All comparative mutual fund data are from Morningstar, Inc., unless otherwise noted.
You can obtain a free copy of Vanguard’s proxy voting guidelines by visiting vanguard.com/proxyreporting or by calling Vanguard at 800-662-2739. The guidelines are also available from the SEC’s website, www.sec.gov. In addition, you may obtain a free report on how your fund voted the proxies for securities it owned during the 12 months ended June 30. To get the report, visit either vanguard.com/proxyreporting or www.sec.gov.
You can review information about your fund on the SEC’s website, and you can receive copies of this information, for a fee, by sending a request via email addressed to publicinfo@sec.gov.
| © 2019 The Vanguard Group, Inc. |
| All rights reserved. |
| U.S. Patent Nos. 6,879,964; 7,337,138; |
| 7,720,749; 7,925,573; 8,090,646; 8,417,623; and 8,626,636. |
| Vanguard Marketing Corporation, Distributor. |
| |
| Q12750 102019 |

Annual Report | August 31, 2019 Vanguard Mega Cap Index Funds |
Vanguard Mega Cap Index Fund Vanguard Mega Cap Growth Index Fund Vanguard Mega Cap Value Index Fund See the inside front cover for important information about access to your fund’s annual and semiannual shareholder reports. |
Important information about access to shareholder reports
Beginning on January 1, 2021, as permitted by regulations adopted by the Securities and Exchange Commission, paper copies of your fund’s annual and semiannual shareholder reports will no longer be sent to you by mail, unless you specifically request them. Instead, you will be notified by mail each time a report is posted on the website and will be provided with a link to access the report.
If you have already elected to receive shareholder reports electronically, you will not be affected by this change and do not need to take any action. You may elect to receive shareholder reports and other communications from the fund electronically by contacting your financial intermediary (such as a broker-dealer or bank) or, if you invest directly with the fund, by calling Vanguard at one of the phone numbers on the back cover of this report or by logging on to vanguard.com.
You may elect to receive paper copies of all future shareholder reports free of charge. If you invest through a financial intermediary, you can contact the intermediary to request that you continue to receive paper copies. If you invest directly with the fund, you can call Vanguard at one of the phone numbers on the back cover of this report or log on to vanguard.com. Your election to receive paper copies will apply to all the funds you hold through an intermediary or directly with Vanguard.
Contents | |
| |
A Note From Our Chairman | 1 |
| |
Your Fund’s Performance at a Glance | 2 |
| |
About Your Fund’s Expenses | 3 |
| |
Mega Cap Index Fund | 5 |
| |
Mega Cap Growth Index Fund | 22 |
| |
Mega Cap Value Index Fund | 37 |
| |
Trustees Approve Advisory Arrangements | 55 |
Please note: The opinions expressed in this report are just that—informed opinions. They should not be considered promises or advice. Also, please keep in mind that the information and opinions cover the period through the date on the front of this report. Of course, the risks of investing in your fund are spelled out in the prospectus.
A Note From Our Chairman

Tim Buckley
Chairman and Chief Executive Officer
Dear Shareholder,
Recent volatility in financial markets—affecting stocks, bonds, and commodities—has been a good reminder of the wise old adage, “Never keep all your eggs in one basket.” Maintaining balance and diversification in your investment portfolio can help to both limit risk and set you up for long-term success.
It’s understandable why some investors might become complacent after a long market run-up like the one that lifted stock prices, especially U.S. stock prices, in the years following the global financial crisis. But failing to rebalance regularly can leave a portfolio with a much different mix of assets than intended and, often, more risk than intended.
Balance across and diversification within asset classes are powerful tools for managing risk and achieving your investment goals. A portfolio’s allocation will determine a large portion of its long-term return and also the majority of its volatility risk. A well-diversified portfolio is less vulnerable to significant swings in the performance of any one segment of the asset classes in which it invests.
Balance and diversification will never eliminate the risk of loss, nor will they guarantee positive returns in a declining market. But they should reduce the chance that you’ll suffer disproportionate losses in one particular high-flying asset class or sector when it comes back to earth. And exposure to all key market components should give you at least some participation in the sectors that are performing best at any given time.
Vanguard is committed to helping you achieve balance and diversification in your portfolios to help meet your investment goals. We thank you for your continued loyalty.
Sincerely,

Mortimer J. Buckley
Chairman and Chief Executive Officer
October 1, 2019
1
Your Fund’s Performance at a Glance
· For the 12 months ended August 31, 2019, large-capitalization equity markets posted generally positive returns, with growth stocks outpacing their value counterparts.
· Returns for the three Vanguard Mega Cap Index Funds ranged from less than 2% for Vanguard Mega Cap Value Index Fund to more than 4% for Vanguard Mega Cap Growth Index Fund. Each fund closely tracked its target index.
· Market sentiment was dampened by signs of decelerating global growth, flare-ups in trade disputes, heightened tensions with Iran, and a lack of agreement in the United Kingdom on how to exit the European Union.
· Consumer goods stocks bolstered returns for Vanguard Mega Cap Index Fund and the Mega Cap Value Index Fund. Financial stocks contributed most to the Mega Cap Growth Index Fund. The oil and gas sector detracted most from returns for all three funds.
Market Barometer | | | | | | | |
| | Average Annual Total Returns | |
| | Periods Ended August 31, 2019 | |
| | One Year | | Three Years | | Five Years | |
Stocks | | | | | | | |
Russell 1000 Index (Large-caps) | | 2.49% | | 12.57% | | 9.85% | |
Russell 2000 Index (Small-caps) | | -12.89 | | 7.89 | | 6.41 | |
Russell 3000 Index (Broad U.S. market) | | 1.31 | | 12.24 | | 9.60 | |
FTSE All-World ex US Index (International) | | -3.18 | | 5.97 | | 1.71 | |
| | | | | | | |
Bonds | | | | | | | |
Bloomberg Barclays U.S. Aggregate Bond Index (Broad taxable market) | | 10.17% | | 3.09% | | 3.35% | |
Bloomberg Barclays Municipal Bond Index (Broad tax-exempt market) | | 8.72 | | 3.30 | | 3.85 | |
FTSE Three-Month U.S. Treasury Bill Index | | 2.36 | | 1.47 | | 0.91 | |
| | | | | | | |
CPI | | | | | | | |
Consumer Price Index | | 1.75% | | 2.13% | | 1.53% | |
2
About Your Fund’s Expenses
As a shareholder of the fund, you incur ongoing costs, which include costs for portfolio management, administrative services, and shareholder reports (like this one), among others. Operating expenses, which are deducted from a fund’s gross income, directly reduce the investment return of the fund.
A fund’s expenses are expressed as a percentage of its average net assets. This figure is known as the expense ratio. The following examples are intended to help you understand the ongoing costs (in dollars) of investing in your fund and to compare these costs with those of other mutual funds. The examples are based on an investment of $1,000 made at the beginning of the period shown and held for the entire period.
The accompanying table illustrates your fund’s costs in two ways:
· Based on actual fund return. This section helps you to estimate the actual expenses that you paid over the period. The “Ending Account Value” shown is derived from the fund’s actual return, and the third column shows the dollar amount that would have been paid by an investor who started with $1,000 in the fund. You may use the information here, together with the amount you invested, to estimate the expenses that you paid over the period.
To do so, simply divide your account value by $1,000 (for example, an $8,600 account value divided by $1,000 = 8.6), then multiply the result by the number given for your fund under the heading “Expenses Paid During Period.”
· Based on hypothetical 5% yearly return. This section is intended to help you compare your fund’s costs with those of other mutual funds. It assumes that the fund had a yearly return of 5% before expenses, but that the expense ratio is unchanged. In this case—because the return used is not the fund’s actual return—the results do not apply to your investment. The example is useful in making comparisons because the Securities and Exchange Commission requires all mutual funds to calculate expenses based on a 5% return. You can assess your fund’s costs by comparing this hypothetical example with the hypothetical examples that appear in shareholder reports of other funds.
Note that the expenses shown in the table are meant to highlight and help you compare ongoing costs only and do not reflect transaction costs incurred by the fund for buying and selling securities. Further, the expenses do not include any purchase, redemption, or account service fees described in the fund prospectus. If such fees were applied to your account, your costs would be higher. Your fund does not carry a “sales load.”
The calculations assume no shares were bought or sold during the period. Your actual costs may have been higher or lower, depending on the amount of your investment and the timing of any purchases or redemptions.
You can find more information about the fund’s expenses, including annual expense ratios, in the Financial Statements section of this report. For additional information on operating expenses and other shareholder costs, please refer to your fund’s current prospectus.
3
Six Months Ended August 31, 2019 | | | |
| Beginning | Ending | Expenses |
| Account Value | Account Value | Paid During |
| 2/28/2019 | 8/31/2019 | Period |
Based on Actual Fund Return | | | |
Mega Cap Index Fund | | | |
ETF Shares | $1,000.00 | $1,063.58 | $0.36 |
Institutional Shares | 1,000.00 | 1,063.61 | 0.31 |
Mega Cap Growth Index Fund | | | |
ETF Shares | $1,000.00 | $1,102.70 | $0.37 |
Institutional Shares | 1,000.00 | 1,102.80 | 0.32 |
Mega Cap Value Index Fund | | | |
ETF Shares | $1,000.00 | $1,025.34 | $0.36 |
Institutional Shares | 1,000.00 | 1,025.35 | 0.31 |
Based on Hypothetical 5% Yearly Return | | | |
Mega Cap Index Fund | | | |
ETF Shares | $1,000.00 | $1,024.85 | $0.36 |
Institutional Shares | 1,000.00 | 1,024.90 | 0.31 |
Mega Cap Growth Index Fund | | | |
ETF Shares | $1,000.00 | $1,024.85 | $0.36 |
Institutional Shares | 1,000.00 | 1,024.90 | 0.31 |
Mega Cap Value Index Fund | | | |
ETF Shares | $1,000.00 | $1,024.85 | $0.36 |
Institutional Shares | 1,000.00 | 1,024.90 | 0.31 |
The calculations are based on expenses incurred in the most recent six-month period. The funds’ annualized six-month expense ratios for that period are: for the Mega Cap Index Fund, 0.07% for ETF Shares and 0.06% for Institutional Shares; for the Mega Cap Growth Index Fund, 0.07% for ETF Shares and 0.06% for Institutional Shares; and for the Mega Cap Value Index Fund, 0.07% for ETF Shares and 0.06% for Institutional Shares. The dollar amounts shown as “Expenses Paid” are equal to the annualized expense ratio multiplied by the average account value over the period, multiplied by the number of days in the most recent six-month period, then divided by the number of days in the most recent 12-month period (184/365).
4
Mega Cap Index Fund
Performance Summary
All of the returns in this report represent past performance, which is not a guarantee of future results that may be achieved by the fund. (Current performance may be lower or higher than the performance data cited. For performance data current to the most recent month-end, visit our website at vanguard.com/performance.) Note, too, that both investment returns and principal value can fluctuate widely, so an investor’s shares, when sold, could be worth more or less than their original cost. The returns shown do not reflect taxes that a shareholder would pay on fund distributions or on the sale of fund shares.
Cumulative Performance: August 31, 2009, Through August 31, 2019
Initial Investment of $10,000
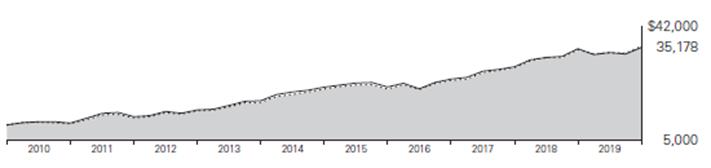
| | | | Average Annual Total Returns | | |
| | | | Periods Ended August 31, 2019 | | |
| | | | | | | | | | Final Value |
| | | | One | | Five | | Ten | | of a $10,000 |
| | | | Year | | Years | | Years | | Investment |

| | Mega Cap Index Fund ETF Shares Net Asset Value | | 3.26% | | 10.34% | | 13.40% | | $35,178 |
| | Mega Cap Index Fund ETF Shares Market Price | | 3.21 | | 10.32 | | 13.39 | | 35,133 |

| | Spliced Mega Cap Index | | 3.28 | | 10.39 | | 13.49 | | 35,442 |

| | Dow Jones U.S. Total Stock Market Float Adjusted Index | | 1.23 | | 9.55 | | 13.35 | | 35,018 |
Spliced Mega Cap Index: MSCI US Large Cap 300 Index through January 30, 2013; CRSP US Mega Cap Index thereafter.
| | | | | | | | | | Final Value |
| | | | One | | Five | | Ten | | of a $5,000,000 |
| | | | Year | | Years | | Years | | Investment |
Mega Cap Index Fund Institutional Shares | | 3.25% | | 10.35% | | 13.43% | | $17,623,588 |
Spliced Mega Cap Index | | 3.28 | | 10.39 | | 13.49 | | 17,720,909 |
Dow Jones U.S. Total Stock Market Float Adjusted Index | | 1.23 | | 9.55 | | 13.35 | | 17,509,140 |
See Financial Highlights for dividend and capital gains information.
5
Mega Cap Index Fund
Cumulative Returns of ETF Shares: August 31, 2009, Through August 31, 2019
| One | Five | Ten |
| Year | Years | Years |
Mega Cap Index Fund ETF Shares Market Price | 3.21% | 63.43% | 251.33% |
Mega Cap Index Fund ETF Shares Net Asset Value | 3.26 | 63.55 | 251.78 |
Spliced Mega Cap Index | 3.28 | 63.95 | 254.42 |
For the ETF Shares, the market price is determined by the midpoint of the bid-offer spread as of the closing time of the New York Stock Exchange (generally 4 p.m., Eastern time). The net asset value is also determined as of the NYSE closing time. For more information about how the ETF Shares’ market prices have compared with their net asset value, visit vanguard.com, select your ETF, and then select the Price and Performance tab. The ETF premium/discount analysis there shows the percentages of days on which the ETF Shares’ market price was above or below the NAV.
6
Mega Cap Index Fund
Sector Diversification
As of August 31, 2019
Basic Materials | 1.7% |
Consumer Goods | 8.0 |
Consumer Services | 14.9 |
Financials | 17.8 |
Health Care | 13.4 |
Industrials | 11.2 |
Oil & Gas | 4.4 |
Technology | 23.4 |
Telecommunications | 2.5 |
Utilities | 2.7 |
The table reflects the fund’s equity exposure, based on its investments in stocks and stock index futures. Any holdings in short-term reserves are excluded. Sector categories are based on the Industry Classification Benchmark (“ICB”), except for the “Other” category (if applicable), which includes securities that have not been provided an ICB classification as of the effective reporting period.
The Industry Classification Benchmark (“ICB”) is owned by FTSE. FTSE does not accept any liability to any person for any loss or damage arising out of any error or omission in the ICB.
7
Mega Cap Index Fund
Financial Statements
Statement of Net Assets
As of August 31, 2019
The fund files its complete schedule of portfolio holdings with the Securities and Exchange Commission (SEC) for the first and third quarters of each fiscal year as an exhibit to its reports on Form N-PORT. The fund’s Form N-PORT reports are available on the SEC’s website at www.sec.gov.
| | | | Market | |
| | | | Value· | |
| | Shares | | ($000 | ) |
Common Stocks (99.6%)1 | | | | | |
Basic Materials (1.7%) | | | | | |
| Linde plc | | 54,079 | | 10,216 | |
| Ecolab Inc. | | 25,821 | | 5,327 | |
| DuPont de Nemours Inc. | | 74,544 | | 5,064 | |
| Air Products & Chemicals Inc. | | 21,939 | | 4,957 | |
| Dow Inc. | | 74,345 | | 3,169 | |
| PPG Industries Inc. | | 23,560 | | 2,610 | |
| LyondellBasell Industries NV Class A | | 26,891 | | 2,081 | |
| International Paper Co. | | 39,718 | | 1,553 | |
| Nucor Corp. | | 15,085 | | 739 | |
| | | | | 35,716 | |
Consumer Goods (8.0%) | | | | | |
| Procter & Gamble Co. | | 250,027 | | 30,061 | |
| Coca-Cola Co. | | 382,722 | | 21,065 | |
| PepsiCo Inc. | | 139,707 | | 19,102 | |
| Philip Morris International Inc. | | 155,047 | | 11,177 | |
| NIKE Inc. Class B | | 125,367 | | 10,594 | |
| Altria Group Inc. | | 186,632 | | 8,163 | |
| Mondelez International Inc. Class A | | 143,793 | | 7,940 | |
| Colgate-Palmolive Co. | | 85,475 | | 6,338 | |
| Kimberly-Clark Corp. | | 34,265 | | 4,835 | |
| General Motors Co. | | 127,215 | | 4,718 | |
| Estee Lauder Cos. Inc. Class A | | 21,812 | | 4,319 | |
| Activision Blizzard Inc. | | 76,527 | | 3,872 | |
| Ford Motor Co. | | 389,875 | | 3,575 | |
| General Mills Inc. | | 59,835 | | 3,219 | |
| Constellation Brands Inc. Class A | | 14,952 | | 3,055 | |
*,^ | Tesla Inc. | | 13,300 | | 3,001 | |
* | Electronic Arts Inc. | | 29,513 | | 2,765 | |
| VF Corp. | | 31,717 | | 2,599 | |
| Hershey Co. | | 14,719 | | 2,333 | |
* | Monster Beverage Corp. | | 37,998 | | 2,229 | |
| Corteva Inc. | | 74,644 | | 2,189 | |
| Archer-Daniels-Midland Co. | | 55,992 | | 2,131 | |
| Brown-Forman Corp. Class B | | 29,086 | | 1,716 | |
| Kellogg Co. | | 25,468 | | 1,599 | |
| Kraft Heinz Co. | | 60,558 | | 1,545 | |
| Tyson Foods Inc. Class A | | 14,720 | | 1,370 | |
| Aptiv plc | | 12,784 | | 1,063 | |
| Keurig Dr Pepper Inc. | | 27,817 | | 759 | |
| | | | | 167,332 | |
Consumer Services (14.8%) | | | | | |
* | Amazon.com Inc. | | 41,755 | | 74,169 | |
| Home Depot Inc. | | 109,766 | | 25,017 | |
| Walt Disney Co. | | 179,396 | | 24,624 | |
| Comcast Corp. Class A | | 451,605 | | 19,988 | |
| McDonald’s Corp. | | 76,066 | | 16,580 | |
| Walmart Inc. | | 142,888 | | 16,326 | |
| Costco Wholesale Corp. | | 43,828 | | 12,919 | |
* | Netflix Inc. | | 43,604 | | 12,809 | |
| Starbucks Corp. | | 114,678 | | 11,073 | |
| Lowe’s Cos. Inc. | | 79,248 | | 8,892 | |
* | Booking Holdings Inc. | | 4,286 | | 8,428 | |
| CVS Health Corp. | | 129,312 | | 7,878 | |
* | Charter Communications Inc. Class A | | 15,568 | | 6,376 | |
| TJX Cos. Inc. | | 114,900 | | 6,316 | |
| Target Corp. | | 50,992 | | 5,458 | |
| Dollar General Corp. | | 25,774 | | 4,023 | |
| Walgreens Boots Alliance Inc. | | 77,228 | | 3,953 | |
| Ross Stores Inc. | | 36,565 | | 3,876 | |
| Sysco Corp. | | 48,809 | | 3,628 | |
| Yum! Brands Inc. | | 30,452 | | 3,556 | |
| Marriott International Inc. Class A | | 28,185 | | 3,553 | |
| Delta Air Lines Inc. | | 58,722 | | 3,398 | |
| eBay Inc. | | 82,768 | | 3,335 | |
* | O’Reilly Automotive Inc. | | 7,775 | | 2,984 | |
| Hilton Worldwide Holdings Inc. | | 29,021 | | 2,681 | |
| McKesson Corp. | | 18,920 | | 2,616 | |
| Southwest Airlines Co. | | 48,722 | | 2,549 | |
| Las Vegas Sands Corp. | | 38,568 | | 2,139 | |
| Kroger Co. | | 80,635 | | 1,909 | |
8
Mega Cap Index Fund
| | | | Market | |
| | | | Value· | |
| | Shares | | ($000 | ) |
| Carnival Corp. | | 39,621 | | 1,746 | |
| CBS Corp. Class B | | 32,923 | | 1,385 | |
* | AutoZone Inc. | | 1,225 | | 1,350 | |
| Fox Corp. Class A | | 35,886 | | 1,190 | |
* | United Airlines Holdings Inc. | | 11,214 | | 945 | |
| Sirius XM Holdings Inc. | | 136,413 | | 842 | |
*,^ | Uber Technologies Inc. | | 17,059 | | 556 | |
| Fox Corp. Class B | | 15,628 | | 513 | |
| CBS Corp. Class A | | 599 | | 27 | |
| | | | | 309,607 | |
Financials (17.7%) | | | | | |
* | Berkshire Hathaway Inc. Class B | | 186,940 | | 38,025 | |
| JPMorgan Chase & Co. | | 307,180 | | 33,747 | |
| Visa Inc. Class A | | 173,368 | | 31,348 | |
| Mastercard Inc. Class A | | 90,566 | | 25,483 | |
| Bank of America Corp. | | 853,059 | | 23,468 | |
| Wells Fargo & Co. | | 403,181 | | 18,776 | |
| Citigroup Inc. | | 230,512 | | 14,833 | |
| American Tower Corp. | | 44,087 | | 10,148 | |
| CME Group Inc. | | 35,723 | | 7,762 | |
| US Bancorp | | 142,985 | | 7,534 | |
| American Express Co. | | 62,521 | | 7,526 | |
| Goldman Sachs Group Inc. | | 34,628 | | 7,061 | |
| S&P Global Inc. | | 24,568 | | 6,392 | |
| Chubb Ltd. | | 38,755 | | 6,057 | |
| Crown Castle International Corp. | | 41,428 | | 6,014 | |
| Intercontinental Exchange Inc. | | 56,134 | | 5,247 | |
| Prologis Inc. | | 62,659 | | 5,240 | |
| PNC Financial Services Group Inc. | | 40,492 | | 5,221 | |
| Morgan Stanley | | 125,677 | | 5,214 | |
| Marsh & McLennan Cos. Inc. | | 50,917 | | 5,086 | |
| Equinix Inc. | | 8,414 | | 4,681 | |
| Aon plc | | 23,947 | | 4,666 | |
| Charles Schwab Corp. | | 119,833 | | 4,586 | |
| BlackRock Inc. | | 10,811 | | 4,568 | |
| American International Group Inc. | | 86,732 | | 4,514 | |
| Progressive Corp. | | 58,292 | | 4,419 | |
| Simon Property Group Inc. | | 29,207 | | 4,350 | |
| Capital One Financial Corp. | | 46,850 | | 4,058 | |
| Public Storage | | 14,734 | | 3,901 | |
| Aflac Inc. | | 74,475 | | 3,737 | |
| Travelers Cos. Inc. | | 24,794 | | 3,644 | |
| BB&T Corp. | | 76,212 | | 3,632 | |
| Welltower Inc. | | 40,367 | | 3,615 | |
| Bank of New York Mellon Corp. | | 85,789 | | 3,608 | |
| Allstate Corp. | | 33,296 | | 3,409 | |
| Prudential Financial Inc. | | 40,460 | | 3,240 | |
| MetLife Inc. | | 70,967 | | 3,144 | |
| Equity Residential | | 37,055 | | 3,141 | |
| SunTrust Banks Inc. | | 44,141 | | 2,715 | |
| Ventas Inc. | | 36,728 | | 2,695 | |
| Discover Financial Services | | 32,326 | | 2,585 | |
| T. Rowe Price Group Inc. | | 22,365 | | 2,474 | |
| Synchrony Financial | | 65,353 | | 2,095 | |
| Boston Properties Inc. | | 15,488 | | 1,989 | |
| Fifth Third Bancorp | | 73,331 | | 1,940 | |
| State Street Corp. | | 35,252 | | 1,809 | |
| Northern Trust Corp. | | 20,567 | | 1,808 | |
| Moody’s Corp. | | 8,012 | | 1,727 | |
| Ameriprise Financial Inc. | | 13,319 | | 1,718 | |
* | Berkshire Hathaway Inc. Class A | | 5 | | 1,515 | |
| AvalonBay Communities Inc. | | 6,958 | | 1,479 | |
| TD Ameritrade Holding Corp. | | 27,392 | | 1,217 | |
| Weyerhaeuser Co. | | 36,725 | | 966 | |
| Interactive Brokers Group Inc. | | 7,094 | | 335 | |
| | | | | 370,162 | |
Health Care (13.3%) | | | | | |
| Johnson & Johnson | | 264,695 | | 33,976 | |
| Merck & Co. Inc. | | 256,616 | | 22,190 | |
| UnitedHealth Group Inc. | | 94,670 | | 22,153 | |
| Pfizer Inc. | | 554,205 | | 19,702 | |
| Abbott Laboratories | | 175,759 | | 14,996 | |
| Medtronic plc | | 133,617 | | 14,416 | |
| Amgen Inc. | | 60,805 | | 12,685 | |
| Thermo Fisher Scientific Inc. | | 39,833 | | 11,434 | |
| Eli Lilly & Co. | | 87,317 | | 9,864 | |
| AbbVie Inc. | | 147,498 | | 9,697 | |
| Gilead Sciences Inc. | | 126,619 | | 8,045 | |
| Bristol-Myers Squibb Co. | | 162,847 | | 7,828 | |
| Becton Dickinson and Co. | | 26,884 | | 6,826 | |
* | Celgene Corp. | | 70,389 | | 6,814 | |
| Anthem Inc. | | 25,664 | | 6,712 | |
| Stryker Corp. | | 29,817 | | 6,579 | |
| Zoetis Inc. | | 47,693 | | 6,029 | |
* | Boston Scientific Corp. | | 138,467 | | 5,917 | |
* | Intuitive Surgical Inc. | | 11,515 | | 5,888 | |
| Cigna Corp. | | 37,850 | | 5,828 | |
| Allergan plc | | 32,624 | | 5,211 | |
* | Edwards Lifesciences Corp. | | 20,780 | | 4,610 | |
* | Vertex Pharmaceuticals Inc. | | 25,486 | | 4,588 | |
| Baxter International Inc. | | 48,465 | | 4,263 | |
* | Biogen Inc. | | 19,331 | | 4,248 | |
9
Mega Cap Index Fund
| | | | Market | |
| | | | Value· | |
| | Shares | | ($000 | ) |
* | Illumina Inc. | | 14,705 | | 4,137 | |
| Humana Inc. | | 13,506 | | 3,825 | |
| HCA Healthcare Inc. | | 27,364 | | 3,289 | |
| Zimmer Biomet Holdings Inc. | | 20,467 | | 2,849 | |
* | Regeneron Pharmaceuticals Inc. | | 8,031 | | 2,329 | |
* | Alexion Pharmaceuticals Inc. | | 21,345 | | 2,151 | |
| | | | | 279,079 | |
Industrials (11.2%) | | | | | |
| Boeing Co. | | 53,258 | | 19,391 | |
| Accenture plc Class A | | 63,567 | | 12,597 | |
* | PayPal Holdings Inc. | | 111,340 | | 12,142 | |
| Honeywell International Inc. | | 72,495 | | 11,934 | |
| Union Pacific Corp. | | 70,504 | | 11,419 | |
| United Technologies Corp. | | 86,030 | | 11,205 | |
| 3M Co. | | 57,463 | | 9,293 | |
| Lockheed Martin Corp. | | 23,966 | | 9,206 | |
| Danaher Corp. | | 64,201 | | 9,122 | |
| Fidelity National Information Services Inc. | | 61,099 | | 8,323 | |
| United Parcel Service Inc. Class B | | 69,639 | | 8,263 | |
| General Electric Co. | | 868,112 | | 7,162 | |
| Automatic Data Processing Inc. | | 41,216 | | 7,000 | |
| Caterpillar Inc. | | 57,091 | | 6,794 | |
| Northrop Grumman Corp. | | 16,914 | | 6,222 | |
| Raytheon Co. | | 27,912 | | 5,173 | |
| CSX Corp. | | 76,607 | | 5,134 | |
| Waste Management Inc. | | 42,380 | | 5,058 | |
| Deere & Co. | | 31,580 | | 4,892 | |
| General Dynamics Corp. | | 24,472 | | 4,681 | |
| Norfolk Southern Corp. | | 26,527 | | 4,617 | |
| Illinois Tool Works Inc. | | 29,246 | | 4,383 | |
| Sherwin-Williams Co. | | 8,247 | | 4,344 | |
| FedEx Corp. | | 23,336 | | 3,701 | |
| Emerson Electric Co. | | 61,459 | | 3,662 | |
| Eaton Corp. plc | | 42,302 | | 3,415 | |
| Johnson Controls International plc | | 79,268 | | 3,384 | |
| TE Connectivity Ltd. | | 33,609 | | 3,066 | |
* | Fiserv Inc. | | 28,238 | | 3,020 | |
| Ingersoll-Rand plc | | 23,967 | | 2,902 | |
| Paychex Inc. | | 32,169 | | 2,628 | |
| Cummins Inc. | | 15,688 | | 2,342 | |
| PACCAR Inc. | | 34,463 | | 2,259 | |
| Agilent Technologies Inc. | | 31,437 | | 2,235 | |
| Parker-Hannifin Corp. | | 12,814 | | 2,124 | |
| Fortive Corp. | | 28,463 | | 2,018 | |
| Stanley Black & Decker Inc. | | 15,055 | | 2,000 | |
| Roper Technologies Inc. | | 5,168 | | 1,895 | |
| Republic Services Inc. Class A | | 20,776 | | 1,854 | |
| Rockwell Automation Inc. | | 11,799 | | 1,803 | |
* | Square Inc. | | 16,859 | | 1,043 | |
| | | | | 233,706 | |
Oil & Gas (4.4%) | | | | | |
| Exxon Mobil Corp. | | 421,672 | | 28,876 | |
| Chevron Corp. | | 189,804 | | 22,344 | |
| ConocoPhillips | | 112,832 | | 5,888 | |
| Schlumberger Ltd. | | 138,074 | | 4,478 | |
| Phillips 66 | | 45,245 | | 4,462 | |
| EOG Resources Inc. | | 57,815 | | 4,289 | |
| Kinder Morgan Inc. | | 192,125 | | 3,894 | |
| Occidental Petroleum Corp. | | 89,234 | | 3,880 | |
| Marathon Petroleum Corp. | | 65,914 | | 3,244 | |
| Valero Energy Corp. | | 41,696 | | 3,139 | |
| Williams Cos. Inc. | | 121,090 | | 2,858 | |
| Pioneer Natural Resources Co. | | 16,854 | | 2,080 | |
| Halliburton Co. | | 82,400 | | 1,552 | |
| Baker Hughes a GE Co. Class A | | 25,505 | | 553 | |
| | | | | 91,537 | |
Technology (23.3%) | | | | | |
| Microsoft Corp. | | 763,815 | | 105,300 | |
| Apple Inc. | | 412,826 | | 86,173 | |
* | Facebook Inc. Class A | | 239,449 | | 44,459 | |
* | Alphabet Inc. Class A | | 29,963 | | 35,672 | |
* | Alphabet Inc. Class C | | 29,398 | | 34,928 | |
| Intel Corp. | | 446,336 | | 21,161 | |
| Cisco Systems Inc. | | 426,768 | | 19,977 | |
* | Adobe Inc. | | 48,625 | | 13,834 | |
* | salesforce.com Inc. | | 81,719 | | 12,754 | |
| International Business Machines Corp. | | 88,435 | | 11,986 | |
| Texas Instruments Inc. | | 93,634 | | 11,587 | |
| Oracle Corp. | | 221,562 | | 11,535 | |
| Broadcom Inc. | | 37,489 | | 10,596 | |
| NVIDIA Corp. | | 57,666 | | 9,660 | |
| QUALCOMM Inc. | | 121,266 | | 9,431 | |
| Intuit Inc. | | 24,513 | | 7,069 | |
* | Micron Technology Inc. | | 110,365 | | 4,996 | |
* | ServiceNow Inc. | | 18,467 | | 4,835 | |
| Applied Materials Inc. | | 93,154 | | 4,473 | |
| Analog Devices Inc. | | 36,787 | | 4,040 | |
| Cognizant Technology Solutions Corp. Class A | | 56,857 | | 3,490 | |
| Lam Research Corp. | | 14,899 | | 3,136 | |
* | Autodesk Inc. | | 21,906 | | 3,129 | |
* | Workday Inc. Class A | | 16,090 | | 2,852 | |
| HP Inc. | | 149,930 | | 2,742 | |
| L3Harris Technologies Inc. | | 11,017 | | 2,329 | |
| Corning Inc. | | 77,866 | | 2,169 | |
10
Mega Cap Index Fund
| | | | Market | |
| | | | Value· | |
| | Shares | | ($000 | ) |
| Hewlett Packard Enterprise Co. | | 134,481 | | 1,859 | |
| VMware Inc. Class A | | 7,660 | | 1,083 | |
* | Dell Technologies Inc. | | 15,437 | | 795 | |
| DXC Technology Co. | | 13,250 | | 440 | |
| | | | | 488,490 | |
Telecommunications (2.5%) | | | | | |
| AT&T Inc. | | 727,532 | | 25,653 | |
| Verizon Communications Inc. | | 412,158 | | 23,971 | |
* | T-Mobile US Inc. | | 29,670 | | 2,316 | |
* | Sprint Corp. | | 62,243 | | 422 | |
| | | | | 52,362 | |
Utilities (2.7%) | | | | | |
| NextEra Energy Inc. | | 47,705 | | 10,451 | |
| Duke Energy Corp. | | 72,596 | | 6,733 | |
| Dominion Energy Inc. | | 79,890 | | 6,202 | |
| Southern Co. | | 103,679 | | 6,040 | |
| Exelon Corp. | | 96,777 | | 4,574 | |
| American Electric Power Co. Inc. | | 49,078 | | 4,473 | |
| Sempra Energy | | 27,402 | | 3,881 | |
| Xcel Energy Inc. | | 51,133 | | 3,284 | |
| Public Service Enterprise Group Inc. | | 50,558 | | 3,057 | |
| Consolidated Edison Inc. | | 33,122 | | 2,944 | |
| Edison International | | 35,285 | | 2,550 | |
| PPL Corp. | | 72,072 | | 2,130 | |
| | | | | 56,319 | |
Total Common Stocks
(Cost $1,404,850) | | | | 2,084,310 | |
Temporary Cash Investments (0.4%)1 | | | | | |
Money Market Fund (0.4%) | | | | | |
2,3 | Vanguard Market Liquidity Fund, 2.249% | | 76,833 | | 7,684 | |
| | | | | |
| | Face | | | |
| | Amount | | | |
| | | ($000) | | | |
U.S. Government and Agency Obligations (0.0%) | | | | | |
| United States Treasury Bill, 2.053%, 11/21/19 | | 530 | | 528 | |
Total Temporary Cash Investments
(Cost $8,211) | | | | 8,212 | |
Total Investments (100.0%)
(Cost $1,413,061) | | | | 2,092,522 | |
| | | | | |
| | | | Amount | |
| | | | | | ($000 | ) |
Other Assets and Liabilities (0.0%) | | | | | |
Other Assets | | | | | |
Investment in Vanguard | | | | 99 | |
Receivables for Accrued Income | | | | 4,245 | |
Other Assets4 | | | | 342 | |
Total Other Assets | | | | 4,686 | |
Liabilities | | | | | |
Payables for Investment Securities | | | | | |
Purchased | | | | (11 | ) |
Collateral for Securities on Loan | | | | (3,290 | ) |
Payables for Capital Shares Redeemed | | | | (176 | ) |
Payables to Vanguard | | | | (328 | ) |
Variation Margin Payable—Futures Contracts | | | | (5 | ) |
Total Liabilities | | | | (3,810 | ) |
Net Assets (100%) | | | | 2,093,398 | |
| | | | | | | |
11
Mega Cap Index Fund
At August 31, 2019, net assets consisted of:
| | | | Amount | |
| | | | | | ($000 | ) |
Paid-in Capital | | | | 1,424,607 | |
Total Distributable Earnings (Loss) | | | | 668,791 | |
Net Assets | | | | 2,093,398 | |
| | | | | |
ETF Shares—Net Assets | | | | | |
Applicable to 19,175,000 outstanding $.001 par value shares of beneficial interest (unlimited authorization) | | | | 1,943,552 | |
Net Asset Value Per Share—ETF Shares | | | | $101.36 | |
| | | | | |
| | | | Amount | |
| | | | | | ($000 | ) |
Institutional Shares—Net Assets | | | | | |
Applicable to 749,818 outstanding $.001 par value shares of beneficial interest (unlimited authorization) | | | | 149,846 | |
Net Asset Value Per Share—Institutional Shares | | | | $199.84 | |
· See Note A in Notes to Financial Statements.
* Non-income-producing security.
^ Includes partial security positions on loan to broker-dealers. The total value of securities on loan is $3,251,000.
1 The fund invests a portion of its cash reserves in equity markets through the use of index futures contracts. After giving effect to futures investments, the fund’s effective common stock and temporary cash investment positions represent 100.0% and 0.0%, respectively, of net assets.
2 Affiliated money market fund available only to Vanguard funds and certain trusts and accounts managed by Vanguard. Rate shown is the 7-day yield.
3 Includes $3,290,000 of collateral received for securities on loan.
4 Cash of $340,000 has been segregated as initial margin for open futures contracts.
Derivative Financial Instruments Outstanding as of Period End |
Futures Contracts |
| | | | | | | | ($000 | ) |
| | | | | | | | Value and | |
| | | | Number of | | | | Unrealized | |
| | | | Long (Short | ) | Notional | | Appreciation | |
| | Expiration | | Contracts | | Amount | | (Depreciation | ) |
Long Futures Contracts | | | | | | | | | |
E-mini S&P 500 Index | | September 2019 | | 62 | | 9,067 | | 7 | |
See accompanying Notes, which are an integral part of the Financial Statements.
12
Mega Cap Index Fund
Statement of Operations
| Year Ended |
| August 31, 2019 |
| ($000) |
Investment Income | |
Income | |
Dividends | 39,005 |
Interest1 | 122 |
Securities Lending—Net | 49 |
Total Income | 39,176 |
Expenses | |
The Vanguard Group—Note B | |
Investment Advisory Services | 265 |
Management and Administrative—ETF Shares | 647 |
Management and Administrative—Institutional Shares | 49 |
Marketing and Distribution—ETF Shares | 68 |
Marketing and Distribution—Institutional Shares | 5 |
Custodian Fees | 10 |
Auditing Fees | 33 |
Shareholders’ Reports—ETF Shares | 172 |
Shareholders’ Reports—Institutional Shares | — |
Trustees’ Fees and Expenses | 1 |
Total Expenses | 1,250 |
Net Investment Income | 37,926 |
Realized Net Gain (Loss) | |
Investment Securities Sold1,2 | 17,262 |
Futures Contracts | 153 |
Realized Net Gain (Loss) | 17,415 |
Change in Unrealized Appreciation (Depreciation) | |
Investment Securities1 | 21,631 |
Futures Contracts | (110) |
Change in Unrealized Appreciation (Depreciation) | 21,521 |
Net Increase (Decrease) in Net Assets Resulting from Operations | 76,862 |
1 Interest income, realized net gain (loss), and change in unrealized appreciation (depreciation) from an affiliated company of the fund were $104,000, ($1,000), and $1,000, respectively. Purchases and sales are for temporary cash investment purposes.
2 Includes $14,456,000 of net gain (loss) resulting from in-kind redemptions; such gain (loss) is not taxable to the fund.
See accompanying Notes, which are an integral part of the Financial Statements.
13
Mega Cap Index Fund
Statement of Changes in Net Assets
| Year Ended August 31, |
| 2019 | 2018 |
| ($000) | ($000) |
Increase (Decrease) in Net Assets | | |
Operations | | |
Net Investment Income | 37,926 | 29,430 |
Realized Net Gain (Loss) | 17,415 | 26,638 |
Change in Unrealized Appreciation (Depreciation) | 21,521 | 222,939 |
Net Increase (Decrease) in Net Assets Resulting from Operations | 76,862 | 279,007 |
Distributions | | |
Net Investment Income | | |
ETF Shares | (34,093) | (26,493) |
Institutional Shares | (2,519) | (2,518) |
Realized Capital Gain | | |
ETF Shares | — | — |
Institutional Shares | — | — |
Total Distributions | (36,612) | (29,011) |
Capital Share Transactions | | |
ETF Shares | 364,632 | 80,628 |
Institutional Shares | 25,154 | (31,572) |
Net Increase (Decrease) from Capital Share Transactions | 389,786 | 49,056 |
Total Increase (Decrease) | 430,036 | 299,052 |
Net Assets | | |
Beginning of Period | 1,663,362 | 1,364,310 |
End of Period | 2,093,398 | 1,663,362 |
See accompanying Notes, which are an integral part of the Financial Statements.
14
Mega Cap Index Fund
Financial Highlights
ETF Shares
For a Share Outstanding | Year Ended August 31, |
Throughout Each Period | 2019 | 2018 | 2017 | 2016 | 2015 |
Net Asset Value, Beginning of Period | $100.26 | $85.02 | $74.19 | $67.35 | $68.69 |
Investment Operations | | | | | |
Net Investment Income | 2.0451 | 1.7901 | 1.6761 | 1.582 | 1.399 |
Net Realized and Unrealized Gain (Loss) on Investments | 1.052 | 15.214 | 10.788 | 6.793 | (1.377) |
Total from Investment Operations | 3.097 | 17.004 | 12.464 | 8.375 | .022 |
Distributions | | | | | |
Dividends from Net Investment Income | (1.997) | (1.764) | (1.634) | (1.535) | (1.362) |
Distributions from Realized Capital Gains | — | — | — | — | — |
Total Distributions | (1.997) | (1.764) | (1.634) | (1.535) | (1.362) |
Net Asset Value, End of Period | $101.36 | $100.26 | $85.02 | $74.19 | $67.35 |
| | | | | |
Total Return | 3.26% | 20.25% | 17.01% | 12.61% | -0.05% |
| | | | | |
Ratios/Supplemental Data | | | | | |
Net Assets, End of Period (Millions) | $1,944 | $1,542 | $1,233 | $1,057 | $970 |
Ratio of Total Expenses to Average Net Assets | 0.07% | 0.07% | 0.07% | 0.07% | 0.09% |
Ratio of Net Investment Income to Average Net Assets | 2.10% | 1.93% | 2.12% | 2.23% | 2.02% |
Portfolio Turnover Rate2 | 4% | 4% | 6% | 7% | 8% |
1 Calculated based on average shares outstanding.
2 Excludes the value of portfolio securities received or delivered as a result of in-kind purchases or redemptions of the fund’s capital shares, including ETF Creation Units.
See accompanying Notes, which are an integral part of the Financial Statements.
15
Mega Cap Index Fund
Financial Highlights
Institutional Shares
For a Share Outstanding | Year Ended August 31, |
Throughout Each Period | 2019 | 2018 | 2017 | 2016 | 2015 |
Net Asset Value, Beginning of Period | $197.68 | $167.62 | $146.25 | $132.77 | $135.41 |
Investment Operations | | | | | |
Net Investment Income | 4.0531 | 3.5131 | 3.3621 | 3.117 | 2.798 |
Net Realized and Unrealized Gain (Loss) on Investments | 2.062 | 30.038 | 21.220 | 13.419 | (2.717) |
Total from Investment Operations | 6.115 | 33.551 | 24.582 | 16.536 | .081 |
Distributions | | | | | |
Dividends from Net Investment Income | (3.955) | (3.491) | (3.212) | (3.056) | (2.721) |
Distributions from Realized Capital Gains | — | — | — | — | — |
Total Distributions | (3.955) | (3.491) | (3.212) | (3.056) | (2.721) |
Net Asset Value, End of Period | $199.84 | $197.68 | $167.62 | $146.25 | $132.77 |
| | | | | |
Total Return | 3.25% | 20.26% | 17.02% | 12.63% | -0.01% |
| | | | | |
Ratios/Supplemental Data | | | | | |
Net Assets, End of Period (Millions) | $150 | $122 | $132 | $133 | $298 |
Ratio of Total Expenses to Average Net Assets | 0.06% | 0.06% | 0.06% | 0.06% | 0.06% |
Ratio of Net Investment Income to Average Net Assets | 2.11% | 1.94% | 2.13% | 2.24% | 2.05% |
Portfolio Turnover Rate2 | 4% | 4% | 6% | 7% | 8% |
1 Calculated based on average shares outstanding.
2 Excludes the value of portfolio securities received or delivered as a result of in-kind purchases or redemptions of the fund’s capital shares, including ETF Creation Units.
See accompanying Notes, which are an integral part of the Financial Statements.
16
Mega Cap Index Fund
Notes to Financial Statements
Vanguard Mega Cap Index Fund is registered under the Investment Company Act of 1940 as an open-end investment company, or mutual fund. The fund offers two classes of shares: ETF Shares and Institutional Shares. Each of the share classes has different eligibility and minimum purchase requirements, and is designed for different types of investors. ETF Shares are listed for trading on NYSE Arca; they can be purchased and sold through a broker.
A. The following significant accounting policies conform to generally accepted accounting principles for U.S. investment companies. The fund consistently follows such policies in preparing its financial statements.
1. Security Valuation: Securities are valued as of the close of trading on the New York Stock Exchange (generally 4 p.m., Eastern time) on the valuation date. Equity securities are valued at the latest quoted sales prices or official closing prices taken from the primary market in which each security trades; such securities not traded on the valuation date are valued at the mean of the latest quoted bid and asked prices. Securities for which market quotations are not readily available, or whose values have been materially affected by events occurring before the fund’s pricing time but after the close of the securities’ primary markets, are valued by methods deemed by the board of trustees to represent fair value. Investments in Vanguard Market Liquidity Fund are valued at that fund’s net asset value. Temporary cash investments are valued using the latest bid prices or using valuations based on a matrix system (which considers such factors as security prices, yields, maturities, and ratings), both as furnished by independent pricing services.
2. Futures Contracts: The fund uses index futures contracts to a limited extent, with the objectives of maintaining full exposure to the stock market, maintaining liquidity, and minimizing transaction costs. The fund may purchase futures contracts to immediately invest incoming cash in the market, or sell futures in response to cash outflows, thereby simulating a fully invested position in the underlying index while maintaining a cash balance for liquidity. The primary risks associated with the use of futures contracts are imperfect correlation between changes in market values of stocks held by the fund and the prices of futures contracts, and the possibility of an illiquid market. Counterparty risk involving futures is mitigated because a regulated clearinghouse is the counterparty instead of the clearing broker. To further mitigate counterparty risk, the fund trades futures contracts on an exchange, monitors the financial strength of its clearing brokers and clearinghouse, and has entered into clearing agreements with its clearing brokers. The clearinghouse imposes initial margin requirements to secure the fund’s performance and requires daily settlement of variation margin representing changes in the market value of each contract. Any assets pledged as initial margin for open contracts are noted in the Statement of Net Assets.
Futures contracts are valued at their quoted daily settlement prices. The notional amounts of the contracts are not recorded in the Statement of Net Assets. Fluctuations in the value of the contracts are recorded in the Statement of Net Assets as an asset (liability) and in the Statement of Operations as unrealized appreciation (depreciation) until the contracts are closed, when they are recorded as realized futures gains (losses).
During the year ended August 31, 2019, the fund’s average investments in long and short futures contracts represented less than 1% and 0% of net assets, respectively, based on the average of the notional amounts at each quarter-end during the period.
17
Mega Cap Index Fund
3. Federal Income Taxes: The fund intends to continue to qualify as a regulated investment company and distribute all of its taxable income. Management has analyzed the fund’s tax positions taken for all open federal income tax years (August 31, 2016–2019), and has concluded that no provision for federal income tax is required in the fund’s financial statements.
4. Distributions: Distributions to shareholders are recorded on the ex-dividend date. Distributions are determined on a tax basis and may differ from net investment income and realized capital gains for financial reporting purposes.
5. Securities Lending: To earn additional income, the fund lends its securities to qualified institutional borrowers. Security loans are subject to termination by the fund at any time, and are required to be secured at all times by collateral in an amount at least equal to the market value of securities loaned. Daily market fluctuations could cause the value of loaned securities to be more or less than the value of the collateral received. When this occurs, the collateral is adjusted and settled before the opening of the market on the next business day. The fund further mitigates its counterparty risk by entering into securities lending transactions only with a diverse group of prequalified counterparties, monitoring their financial strength, and entering into master securities lending agreements with its counterparties. The master securities lending agreements provide that, in the event of a counterparty’s default (including bankruptcy), the fund may terminate any loans with that borrower, determine the net amount owed, and sell or retain the collateral up to the net amount owed to the fund; however, such actions may be subject to legal proceedings. While collateral mitigates counterparty risk, in the event of a default, the fund may experience delays and costs in recovering the securities loaned. The fund invests cash collateral received in Vanguard Market Liquidity Fund, and records a liability in the Statement of Net Assets for the return of the collateral, during the period the securities are on loan. Securities lending income represents fees charged to borrowers plus income earned on invested cash collateral, less expenses associated with the loan. During the term of the loan, the fund is entitled to all distributions made on or in respect of the loaned securities.
6. Credit Facility: The fund and certain other funds managed by The Vanguard Group (“Vanguard”) participate in a $4.3 billion committed credit facility provided by a syndicate of lenders pursuant to a credit agreement that may be renewed annually; each fund is individually liable for its borrowings, if any, under the credit facility. Borrowings may be utilized for temporary and emergency purposes, and are subject to the fund’s regulatory and contractual borrowing restrictions. The participating funds are charged administrative fees and an annual commitment fee of 0.10% of the undrawn amount of the facility; these fees are allocated to the funds based on a method approved by the fund’s board of trustees and included in Management and Administrative expenses on the fund’s Statement of Operations. Any borrowings under this facility bear interest at a rate based upon the higher of the one-month London Interbank Offered Rate, federal funds effective rate, or overnight bank funding rate plus an agreed-upon spread.
The fund had no borrowings outstanding at August 31, 2019, or at any time during the period then ended.
18
Mega Cap Index Fund
7. Other: Dividend income is recorded on the ex-dividend date. Interest income includes income distributions received from Vanguard Market Liquidity Fund and is accrued daily. Premiums and discounts on debt securities purchased are amortized and accreted, respectively, to interest income over the lives of the respective securities. Security transactions are accounted for on the date securities are bought or sold. Costs used to determine realized gains (losses) on the sale of investment securities are those of the specific securities sold.
Each class of shares has equal rights as to assets and earnings, except that each class separately bears certain class-specific expenses related to maintenance of shareholder accounts (included in Management and Administrative expenses) and shareholder reporting. Marketing and distribution expenses are allocated to each class of shares based on a method approved by the board of trustees. Income, other non-class-specific expenses, and gains and losses on investments are allocated to each class of shares based on its relative net assets.
B. In accordance with the terms of a Funds’ Service Agreement (the “FSA”) between Vanguard and the fund, Vanguard furnishes to the fund investment advisory, corporate management, administrative, marketing, and distribution services at Vanguard’s cost of operations (as defined by the FSA). These costs of operations are allocated to the fund based on methods and guidelines approved by the board of trustees. Vanguard does not require reimbursement in the current period for certain costs of operations (such as deferred compensation/benefits and risk/insurance costs); the fund’s liability for these costs of operations is included in Payables to Vanguard on the Statement of Net Assets. All other costs of operations payable to Vanguard are generally settled twice a month.
Upon the request of Vanguard, the fund may invest up to 0.40% of its net assets as capital in Vanguard. At August 31, 2019, the fund had contributed to Vanguard capital in the amount of $99,000, representing less than 0.01% of the fund’s net assets and 0.04% of Vanguard’s capital received pursuant to the FSA. The fund’s trustees and officers are also directors and employees, respectively, of Vanguard.
C. Various inputs may be used to determine the value of the fund’s investments. These inputs are summarized in three broad levels for financial statement purposes. The inputs or methodologies used to value securities are not necessarily an indication of the risk associated with investing in those securities.
Level 1—Quoted prices in active markets for identical securities.
Level 2—Other significant observable inputs (including quoted prices for similar securities, interest rates, prepayment speeds, credit risk, etc.).
Level 3—Significant unobservable inputs (including the fund’s own assumptions used to determine the fair value of investments). Any investments valued with significant unobservable inputs are noted on the Statement of Net Assets.
19
Mega Cap Index Fund
The following table summarizes the market value of the fund’s investments and derivatives as of August 31, 2019, based on the inputs used to value them:
| | Level 1 | | Level 2 | | Level 3 | |
Investments | | ($000 | ) | ($000 | ) | ($000 | ) |
Common Stocks | | 2,084,310 | | — | | — | |
Temporary Cash Investments | | 7,684 | | 528 | | — | |
Futures Contracts—Liabilities1 | | (5 | ) | — | | — | |
Total | | 2,091,989 | | 528 | | — | |
1 Represents variation margin on the last day of the reporting period.
D. Permanent differences between book-basis and tax-basis components of net assets are reclassified among capital accounts in the financial statements to reflect their tax character. These reclassifications have no effect on net assets or net asset value per share. As of period end, permanent differences primarily attributable to the accounting for in-kind redemptions and the expiration of capital loss carryforwards were reclassified between the following accounts:
| | Amount | |
| | ($000 | ) |
Paid-in Capital | | 8,258 | |
Total Distributable Earnings (Loss) | | (8,258 | ) |
Temporary differences between book-basis and tax-basis components of total distributable earnings (loss) arise when certain items of income, gain, or loss are recognized in different periods for financial statement and tax purposes; these differences will reverse at some time in the future. The differences are primarily related to the tax deferral on wash sales and the realization of unrealized gains or losses on certain futures contracts. As of period end, the tax-basis components of total distributable earnings (loss) are detailed in the table as follows:
| | Amount | |
| | ($000 | ) |
Undistributed Ordinary Income | | 7,854 | |
Undistributed Long-Term Gains | | — | |
Capital Loss Carryforwards (Non-expiring)* | | (18,267 | ) |
Net Unrealized Gains (Losses) | | 679,461 | |
* The fund used capital loss carryforwards of $2,848,000 to offset taxable gains realized during the year ended August 31, 2019.
As of August 31, 2019, gross unrealized appreciation and depreciation for investments and derivatives based on cost for U.S. federal income tax purposes were as follows:
| | Amount | |
| | ($000 | ) |
Tax Cost | | 1,413,061 | |
Gross Unrealized Appreciation | | 748,629 | |
Gross Unrealized Depreciation | | (69,168 | ) |
Net Unrealized Appreciation (Depreciation) | | 679,461 | |
20
Mega Cap Index Fund
E. During the year ended August 31, 2019, the fund purchased $484,222,000 of investment securities and sold $96,963,000 of investment securities, other than temporary cash investments. Purchases and sales include $371,300,000 and $24,429,000, respectively, in connection with in-kind purchases and redemptions of the fund’s capital shares.
The fund purchased securities from and sold securities to other Vanguard funds or accounts managed by Vanguard or its affiliates, in accordance with procedures adopted by the board of trustees in compliance with Rule 17a-7 of the Investment Company Act of 1940. For the year ended August 31, 2019, such purchases and sales were $32,228,000 and $13,279,000, respectively; these amounts are included in the purchases and sales of investment securities noted above.
F. Capital share transactions for each class of shares were:
| | Year Ended August 31, | |
| | | | 2019 | | | | 2018 | |
| | Amount | | Shares | | Amount | | Shares | |
| | ($000 | ) | (000 | ) | ($000 | ) | (000 | ) |
ETF Shares | | | | | | | | | |
Issued | | 389,257 | | 4,050 | | 146,233 | | 1,575 | |
Issued in Lieu of Cash Distributions | | — | | — | | — | | — | |
Redeemed | | (24,625 | ) | (250 | ) | (65,605 | ) | (700 | ) |
Net Increase (Decrease)—ETF Shares | | 364,632 | | 3,800 | | 80,628 | | 875 | |
Institutional Shares | | | | | | | | | |
Issued | | 38,620 | | 203 | | 5,389 | | 31 | |
Issued in Lieu of Cash Distributions | | 753 | | 4 | | 1,242 | | 7 | |
Redeemed | | (14,219 | ) | (73 | ) | (38,203 | ) | (207 | ) |
Net Increase (Decrease)—Institutional Shares | | 25,154 | | 134 | | (31,572 | ) | (169 | ) |
G. Management has determined that no events or transactions occurred subsequent to August 31, 2019, that would require recognition or disclosure in these financial statements.
21
Mega Cap Growth Index Fund
Performance Summary
All of the returns in this report represent past performance, which is not a guarantee of future results that may be achieved by the fund. (Current performance may be lower or higher than the performance data cited. For performance data current to the most recent month-end, visit our website at vanguard.com/performance.) Note, too, that both investment returns and principal value can fluctuate widely, so an investor’s shares, when sold, could be worth more or less than their original cost. The returns shown do not reflect taxes that a shareholder would pay on fund distributions or on the sale of fund shares.
Cumulative Performance: August 31, 2009, Through August 31, 2019
Initial Investment of $10,000
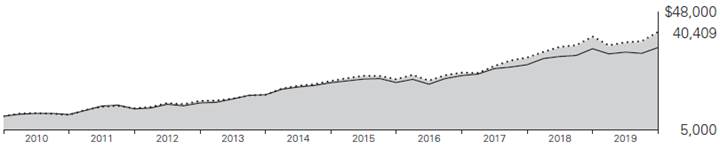
| | | | Average Annual Total Returns | | |
| | | | Periods Ended August 31, 2019 | | |
| | | | | | | | | | Final Value |
| | | | One | | Five | | Ten | | of a $10,000 |
| | | | Year | | Years | | Years | | Investment |

| | Mega Cap Growth Index Fund ETF Shares Net Asset Value | | 4.32% | | 12.23% | | 14.99% | | $40,409 |
| | Mega Cap Growth Index Fund ETF Shares Market Price | | 4.25 | | 12.22 | | 14.97 | | 40,348 |

| | Spliced Mega Cap Growth Index | | 4.37 | | 12.30 | | 15.08 | | 40,742 |

| | Dow Jones U.S. Total Stock Market Float Adjusted Index | | 1.23 | | 9.55 | | 13.35 | | 35,018 |
Spliced Mega Cap Growth Index: MSCI US Large Cap Growth Index through April 16, 2013; CRSP US Mega Cap Growth Index thereafter.
| | | | | | | | Final Value |
| | One | | Five | | Ten | | of a $5,000,000 |
| | Year | | Years | | Years | | Investment |
Mega Cap Growth Index Fund Institutional Shares | | 4.34% | | 12.24% | | 15.00% | | $20,229,869 |
Spliced Mega Cap Growth Index | | 4.37 | | 12.30 | | 15.08 | | 20,370,910 |
Dow Jones U.S. Total Stock Market Float Adjusted Index | | 1.23 | | 9.55 | | 13.35 | | 17,509,140 |
See Financial Highlights for dividend and capital gains information.
22
Mega Cap Growth Index Fund
Cumulative Returns of ETF Shares: August 31, 2009, Through August 31, 2019
| | One | | Five | | Ten |
| | Year | | Years | | Years |
Mega Cap Growth Index Fund ETF Shares Market Price | | 4.25% | | 77.94% | | 303.48% |
Mega Cap Growth Index Fund ETF Shares Net Asset Value | | 4.32 | | 78.06 | | 304.09 |
Spliced Mega Cap Growth Index | | 4.37 | | 78.61 | | 307.42 |
For the ETF Shares, the market price is determined by the midpoint of the bid-offer spread as of the closing time of the New York Stock Exchange (generally 4 p.m., Eastern time). The net asset value is also determined as of the NYSE closing time. For more information about how the ETF Shares’ market prices have compared with their net asset value, visit vanguard.com, select your ETF, and then select the Price and Performance tab. The ETF premium/discount analysis there shows the percentages of days on which the ETF Shares’ market price was above or below the NAV.
23
Mega Cap Growth Index Fund
Sector Diversification
As of August 31, 2019
Basic Materials | | 1.5% |
Consumer Goods | | 4.8 |
Consumer Services | | 22.6 |
Financials | | 12.2 |
Health Care | | 7.9 |
Industrials | | 11.6 |
Oil & Gas | | 1.1 |
Technology | | 38.1 |
Telecommunications | | 0.2 |
The table reflects the fund’s equity exposure, based on its investments in stocks and stock index futures. Any holdings in short-term reserves are excluded. Sector categories are based on the Industry Classification Benchmark (“ICB”), except for the “Other” category (if applicable), which includes securities that have not been provided an ICB classification as of the effective reporting period.
The Industry Classification Benchmark (“ICB”) is owned by FTSE. FTSE does not accept any liability to any person for any loss or damage arising out of any error or omission in the ICB.
24
Mega Cap Growth Index Fund
Financial Statements
Statement of Net Assets
As of August 31, 2019
The fund files its complete schedule of portfolio holdings with the Securities and Exchange Commission (SEC) for the first and third quarters of each fiscal year as an exhibit to its reports on Form N-PORT. The fund’s Form N-PORT reports are available on the SEC’s website at www.sec.gov.
| | | | Market | |
| | | | Value· | |
| | Shares | | ($000 | ) |
Common Stocks (99.7%)1 | | | | | |
Basic Materials (1.5%) | | | | | |
| Linde plc | | 225,339 | | 42,569 | |
| Ecolab Inc. | | 107,708 | | 22,221 | |
| | | | | 64,790 | |
Consumer Goods (4.8%) | | | | | |
| NIKE Inc. Class B | | 521,782 | | 44,091 | |
| Colgate-Palmolive Co. | | 356,507 | | 26,435 | |
| Philip Morris International Inc. | | 322,994 | | 23,285 | |
| Estee Lauder Cos. Inc. Class A | | 91,053 | | 18,028 | |
| Altria Group Inc. | | 388,397 | | 16,988 | |
| Activision Blizzard Inc. | | 318,076 | | 16,095 | |
| Constellation Brands Inc. Class A | | 62,316 | | 12,734 | |
*,^ | Tesla Inc. | | 55,441 | | 12,508 | |
* | Electronic Arts Inc. | | 123,462 | | 11,566 | |
| Hershey Co. | | 61,574 | | 9,758 | |
* | Monster Beverage Corp. | | 157,972 | | 9,268 | |
| Brown-Forman Corp. Class B | | 121,682 | | 7,178 | |
| Keurig Dr Pepper Inc. | | 117,087 | | 3,194 | |
| | | | | 211,128 | |
Consumer Services (22.5%) | | | | | |
* | Amazon.com Inc. | | 173,804 | | 308,726 | |
| Home Depot Inc. | | 456,875 | | 104,126 | |
| Comcast Corp. Class A | | 1,880,787 | | 83,244 | |
| McDonald’s Corp. | | 317,000 | | 69,096 | |
| Costco Wholesale Corp. | | 182,608 | | 53,826 | |
* | Netflix Inc. | | 181,587 | | 53,341 | |
| Walt Disney Co. | | 373,611 | | 51,282 | |
| Starbucks Corp. | | 477,747 | | 46,131 | |
| Lowe’s Cos. Inc. | | 330,447 | | 37,076 | |
* | Booking Holdings Inc. | | 18,009 | | 35,413 | |
* | Charter Communications Inc. Class A | | 64,980 | | 26,615 | |
| TJX Cos. Inc. | | 479,057 | | 26,334 | |
| Dollar General Corp. | | 107,285 | | 16,746 | |
| Ross Stores Inc. | | 152,530 | | 16,170 | |
| Yum! Brands Inc. | | 127,075 | | 14,840 | |
| Marriott International Inc. Class A | | 117,557 | | 14,819 | |
* | O’Reilly Automotive Inc. | | 32,493 | | 12,470 | |
| Hilton Worldwide Holdings Inc. | | 120,858 | | 11,164 | |
* | AutoZone Inc. | | 5,191 | | 5,719 | |
| Southwest Airlines Co. | | 101,628 | | 5,317 | |
^ | Sirius XM Holdings Inc. | | 572,814 | | 3,534 | |
*,^ | Uber Technologies Inc. | | 69,708 | | 2,270 | |
| | | | | 998,259 | |
Financials (12.2%) | | | | | |
| Visa Inc. Class A | | 722,079 | | 130,566 | |
| Mastercard Inc. Class A | | 377,377 | | 106,182 | |
| American Tower Corp. | | 183,565 | | 42,255 | |
| S&P Global Inc. | | 102,228 | | 26,599 | |
| Crown Castle International Corp. | | 172,561 | | 25,051 | |
| Prologis Inc. | | 261,790 | | 21,891 | |
| Intercontinental Exchange Inc. | | 234,096 | | 21,883 | |
| Marsh & McLennan Cos. Inc. | | 212,330 | | 21,210 | |
| Aon plc | | 99,854 | | 19,456 | |
| Equinix Inc. | | 34,919 | | 19,425 | |
| Charles Schwab Corp. | | 498,889 | | 19,092 | |
| Simon Property Group Inc. | | 121,893 | | 18,155 | |
| Public Storage | | 61,546 | | 16,294 | |
| T. Rowe Price Group Inc. | | 93,240 | | 10,314 | |
| Boston Properties Inc. | | 64,215 | | 8,246 | |
| Welltower Inc. | | 84,132 | | 7,535 | |
| Moody’s Corp. | | 33,490 | | 7,220 | |
| AvalonBay Communities Inc. | | 28,941 | | 6,152 | |
| Ventas Inc. | | 76,848 | | 5,640 | |
| TD Ameritrade Holding Corp. | | 114,907 | | 5,103 | |
| Interactive Brokers Group Inc. | | 29,349 | | 1,385 | |
| | | | | 539,654 | |
25
Mega Cap Growth Index Fund
| | | | Market | |
| | | | Value· | |
| | Shares | | ($000 | ) |
Health Care (7.9%) | | | | | |
| Thermo Fisher Scientific Inc. | | 166,085 | | 47,676 | |
| Bristol-Myers Squibb Co. | | 679,232 | | 32,651 | |
| Becton Dickinson and Co. | | 112,038 | | 28,449 | |
* | Celgene Corp. | | 292,872 | | 28,350 | |
| Stryker Corp. | | 124,190 | | 27,404 | |
| Zoetis Inc. | | 198,738 | | 25,124 | |
* | Boston Scientific Corp. | | 577,407 | | 24,673 | |
* | Intuitive Surgical Inc. | | 47,912 | | 24,499 | |
| AbbVie Inc. | | 306,885 | | 20,175 | |
* | Edwards Lifesciences Corp. | | 86,627 | | 19,217 | |
* | Vertex Pharmaceuticals Inc. | | 106,382 | | 19,151 | |
* | Illumina Inc. | | 61,083 | | 17,185 | |
* | Regeneron Pharmaceuticals Inc. | | 33,546 | | 9,730 | |
* | Alexion Pharmaceuticals Inc. | | 88,475 | | 8,915 | |
| Baxter International Inc. | | 100,846 | | 8,869 | |
* | Biogen Inc. | | 40,263 | | 8,848 | |
| | | | | 350,916 | |
Industrials (11.6%) | | | | | |
| Boeing Co. | | 221,943 | | 80,807 | |
| Accenture plc Class A | | 264,829 | | 52,481 | |
* | PayPal Holdings Inc. | | 463,460 | | 50,540 | |
| Union Pacific Corp. | | 293,895 | | 47,599 | |
| Lockheed Martin Corp. | | 99,705 | | 38,298 | |
| Fidelity National Information Services Inc. | | 254,496 | | 34,668 | |
| United Parcel Service Inc. Class B | | 289,659 | | 34,371 | |
| Automatic Data Processing Inc. | | 171,687 | | 29,159 | |
| 3M Co. | | 119,668 | | 19,353 | |
| Danaher Corp. | | 133,771 | | 19,008 | |
| Illinois Tool Works Inc. | | 121,720 | | 18,241 | |
| Sherwin-Williams Co. | | 34,510 | | 18,178 | |
* | Fiserv Inc. | | 117,640 | | 12,580 | |
| Paychex Inc. | | 134,282 | | 10,971 | |
| Raytheon Co. | | 58,072 | | 10,762 | |
| Agilent Technologies Inc. | | 131,281 | | 9,335 | |
| Fortive Corp. | | 118,275 | | 8,386 | |
| Roper Technologies Inc. | | 21,554 | | 7,905 | |
| Rockwell Automation Inc. | | 49,196 | | 7,517 | |
* | Square Inc. | | 69,940 | | 4,325 | |
| | | | | 514,484 | |
Oil & Gas (1.0%) | | | | | |
| EOG Resources Inc. | | 241,018 | | 17,881 | |
| Schlumberger Ltd. | | 287,735 | | 9,331 | |
| Pioneer Natural Resources Co. | | 69,960 | | 8,634 | |
| Occidental Petroleum Corp. | | 185,816 | | 8,079 | |
| Baker Hughes a GE Co. Class A | | 106,712 | | 2,315 | |
| | | | | 46,240 | |
Technology (38.0%) | | | | | |
| Microsoft Corp. | | 3,181,897 | | 438,656 | |
| Apple Inc. | | 1,719,476 | | 358,923 | |
* | Facebook Inc. Class A | | 997,648 | | 185,233 | |
* | Alphabet Inc. Class A | | 124,308 | | 147,992 | |
* | Alphabet Inc. Class C | | 122,932 | | 146,056 | |
* | Adobe Inc. | | 202,609 | | 57,644 | |
* | salesforce.com Inc. | | 340,740 | | 53,179 | |
| Texas Instruments Inc. | | 389,550 | | 48,207 | |
| Broadcom Inc. | | 156,127 | | 44,128 | |
| NVIDIA Corp. | | 240,213 | | 40,238 | |
| Intuit Inc. | | 102,314 | | 29,503 | |
* | Micron Technology Inc. | | 459,556 | | 20,804 | |
* | ServiceNow Inc. | | 77,065 | | 20,179 | |
| Applied Materials Inc. | | 388,728 | | 18,667 | |
| Analog Devices Inc. | | 153,509 | | 16,860 | |
| Lam Research Corp. | | 62,294 | | 13,114 | |
* | Autodesk Inc. | | 91,477 | | 13,065 | |
* | Workday Inc. Class A | | 66,822 | | 11,846 | |
| L3Harris Technologies Inc. | | 46,008 | | 9,727 | |
| Cognizant Technology Solutions Corp. Class A | | 118,147 | | 7,253 | |
| VMware Inc. Class A | | 31,970 | | 4,522 | |
| | | | | 1,685,796 | |
Telecommunications (0.2%) | | | | | |
* | T-Mobile US Inc. | | 124,122 | | 9,688 | |
Total Common Stocks | | | | | |
(Cost $2,950,965) | | | | 4,420,955 | |
Temporary Cash Investment (0.5%)1 | | | | | |
Money Market Fund (0.5%) | | | | | |
2,3 | Vanguard Market Liquidity Fund, 2.249% (Cost $20,732) | | 207,300 | | 20,732 | |
Total Investments (100.2%) | | | | | |
(Cost $2,971,697) | | | | 4,441,687 | |
26
Mega Cap Growth Index Fund
| | Amount | |
| | ($000 | ) |
Other Assets and Liabilities (-0.2%) | | | |
Other Assets | | | |
Investment in Vanguard | | 217 | |
Receivables for Accrued Income | | 4,736 | |
Other Assets4 | | 363 | |
Total Other Assets | | 5,316 | |
Liabilities | | | |
Payables for Investment Securities Purchased | | (9 | ) |
Collateral for Securities on Loan | | (14,824 | ) |
Payables to Vanguard | | (555 | ) |
Variation Margin Payable—Futures Contracts | | (12 | ) |
Total Liabilities | | (15,400 | ) |
Net Assets (100%) | | 4,431,603 | |
At August 31, 2019, net assets consisted of:
| | Amount | |
| | ($000 | ) |
Paid-in Capital | | 3,099,092 | |
Total Distributable Earnings (Loss) | | 1,332,511 | |
Net Assets | | 4,431,603 | |
| | | |
ETF Shares—Net Assets | | | |
Applicable to 33,189,005 outstanding $.001 par value shares of beneficial interest (unlimited authorization) | | 4,388,413 | |
Net Asset Value Per Share—ETF Shares | | $132.22 | |
| | | |
Institutional Shares—Net Assets | | | |
Applicable to 164,454 outstanding $.001 par value shares of beneficial interest (unlimited authorization) | | 43,190 | |
Net Asset Value Per Share—Institutional Shares | | $262.63 | |
· See Note A in Notes to Financial Statements.
* Non-income-producing security.
^ Includes partial security positions on loan to broker-dealers The total value of securities on loan is $14,307,000.
1 The fund invests a portion of its cash reserves in equity markets through the use of index futures contracts. After giving effect to futures investments, the fund’s effective common stock and temporary cash investment positions represent 100.0% and 0.2%, respectively, of net assets.
2 Affiliated money market fund available only to Vanguard funds and certain trusts and accounts managed by Vanguard. Rate shown is the 7-day yield.
3 Includes $14,824,000 of collateral received for securities on loan.
4 Cash of $363,000 has been segregated as initial margin for open futures contracts.
Derivative Financial Instruments Outstanding as of Period End |
| | | | | | | | ($000 | ) |
| | | | | | | | Value and | |
| | | | Number of | | | | Unrealized | |
| | | | Long (Short | ) | Notional | | Appreciation | |
| | Expiration | | Contracts | | Amount | | (Depreciation | ) |
Long Futures Contracts | | | | | | | | | |
E-mini NASDAQ 100 Index | | September 2019 | | 35 | | 5,384 | | (3 | ) |
E-mini S&P 500 Index | | September 2019 | | 36 | | 5,265 | | (14 | ) |
| | | | | | | | (17 | ) |
See accompanying Notes, which are an integral part of the Financial Statements.
27
Mega Cap Growth Index Fund
Statement of Operations
| | Year Ended | |
| | August 31, 2019 | |
| | ($000 | ) |
Investment Income | | | |
Income | | | |
Dividends | | 55,190 | |
Interest1 | | 663 | |
Securities Lending—Net | | 118 | |
Total Income | | 55,971 | |
Expenses | | | |
The Vanguard Group—Note B | | | |
Investment Advisory Services | | 614 | |
Management and Administrative—ETF Shares | | 1,885 | |
Management and Administrative—Institutional Shares | | 16 | |
Marketing and Distribution—ETF Shares | | 158 | |
Marketing and Distribution—Institutional Shares | | 1 | |
Custodian Fees | | 17 | |
Auditing Fees | | 33 | |
Shareholders’ Reports—ETF Shares | | 140 | |
Shareholders’ Reports—Institutional Shares | | — | |
Trustees’ Fees and Expenses | | 2 | |
Total Expenses | | 2,866 | |
Net Investment Income | | 53,105 | |
Realized Net Gain (Loss) | | | |
Investment Securities Sold1,2 | | 166,353 | |
Futures Contracts | | 1,182 | |
Swap Contracts | | (17,126 | ) |
Realized Net Gain (Loss) | | 150,409 | |
Change in Unrealized Appreciation (Depreciation) | | | |
Investment Securities1 | | (16,234 | ) |
Futures Contracts | | (288 | ) |
Swap Contracts | | (4,297 | ) |
Change in Unrealized Appreciation (Depreciation) | | (20,819 | ) |
Net Increase (Decrease) in Net Assets Resulting from Operations | | 182,695 | |
1 Interest income, realized net gain (loss), and change in unrealized appreciation (depreciation) from an affiliated company of the fund were $651,000, ($9,000), and ($13,000), respectively. Purchases and sales are for temporary cash investment purposes.
2 Includes $244,060,000 of net gain (loss) resulting from in-kind redemptions; such gain (loss) is not taxable to the fund.
See accompanying Notes, which are an integral part of the Financial Statements.
28
Mega Cap Growth Index Fund
Statement of Changes in Net Assets
| | Year Ended August 31, | |
| | 2019 | | 2018 | |
| | ($000 | ) | ($000 | ) |
Increase (Decrease) in Net Assets | | | | | |
Operations | | | | | |
Net Investment Income | | 53,105 | | 47,049 | |
Realized Net Gain (Loss) | | 150,409 | | 161,806 | |
Change in Unrealized Appreciation (Depreciation) | | (20,819 | ) | 584,011 | |
Net Increase (Decrease) in Net Assets Resulting from Operations | | 182,695 | | 792,866 | |
Distributions | | | | | |
Net Investment Income | | | | | |
ETF Shares | | (33,904 | ) | (45,748 | ) |
Institutional Shares | | (331 | ) | (494 | ) |
Realized Capital Gain | | | | | |
ETF Shares | | — | | — | |
Institutional Shares | | — | | — | |
Total Distributions | | (34,235 | ) | (46,242 | ) |
Capital Share Transactions | | | | | |
ETF Shares | | 89,447 | | 278,307 | |
Institutional Shares | | (1,367 | ) | 538 | |
Net Increase (Decrease) from Capital Share Transactions | | 88,080 | | 278,845 | |
Total Increase (Decrease) | | 236,540 | | 1,025,469 | |
Net Assets | | | | | |
Beginning of Period | | 4,195,063 | | 3,169,594 | |
End of Period | | 4,431,603 | | 4,195,063 | |
See accompanying Notes, which are an integral part of the Financial Statements.
29
Mega Cap Growth Index Fund
Financial Highlights
ETF Shares
For a Share Outstanding | Year Ended August 31, | |
Throughout Each Period | 2019 | | 2018 | | 2017 | | 2016 | | 2015 | |
Net Asset Value, Beginning of Period | $127.79 | | $104.09 | | $87.15 | | $80.22 | | $79.16 | |
Investment Operations | | | | | | | | | | |
Net Investment Income | 1.588 | 1 | 1.485 | 1 | 1.351 | 1 | 1.269 | | 1.148 | |
Net Realized and Unrealized Gain (Loss) on Investments | 3.860 | | 23.677 | | 16.920 | | 6.897 | | 1.013 | |
Total from Investment Operations | 5.448 | | 25.162 | | 18.271 | | 8.166 | | 2.161 | |
Distributions | | | | | | | | | | |
Dividends from Net Investment Income | (1.018 | ) | (1.462 | ) | (1.331 | ) | (1.236 | ) | (1.101 | ) |
Distributions from Realized Capital Gains | — | | — | | — | | — | | — | |
Total Distributions | (1.018 | ) | (1.462 | ) | (1.331 | ) | (1.236 | ) | (1.101 | ) |
Net Asset Value, End of Period | $132.22 | | $127.79 | | $104.09 | | $87.15 | | $80.22 | |
| | | | | | | | | | |
Total Return | 4.32% | | 24.38% | | 21.17% | | 10.28% | | 2.70% | |
| | | | | | | | | | |
Ratios/Supplemental Data | | | | | | | | | | |
Net Assets, End of Period (Millions) | $4,388 | | $4,152 | | $3,135 | | $2,247 | | $1,928 | |
Ratio of Total Expenses to Average Net Assets | 0.07% | | 0.07% | | 0.07% | | 0.07% | | 0.09% | |
Ratio of Net Investment Income to Average Net Assets | 1.30% | | 1.29% | | 1.43% | | 1.55% | | 1.43% | |
Portfolio Turnover Rate2 | 14% | | 9% | | 8% | | 12% | | 9% | |
1 Calculated based on average shares outstanding.
2 Excludes the value of portfolio securities received or delivered as a result of in-kind purchases or redemptions of the fund’s capital shares, including ETF Creation Units.
See accompanying Notes, which are an integral part of the Financial Statements.
30
Mega Cap Growth Index Fund
Financial Highlights
Institutional Shares
For a Share Outstanding | | Year Ended August 31, | |
Throughout Each Period | | 2019 | | 2018 | | 2017 | | 2016 | | 2015 | |
Net Asset Value, Beginning of Period | | $253.80 | | $206.74 | | $173.07 | | $159.31 | | $157.21 | |
Investment Operations | | | | | | | | | | | |
Net Investment Income | | 3.184 | 1 | 2.963 | 1 | 2.699 | 1 | 2.528 | | 2.293 | |
Net Realized and Unrealized Gain (Loss) on Investments | | 7.684 | | 47.023 | | 33.622 | | 13.693 | | 2.011 | |
Total from Investment Operations | | 10.868 | | 49.986 | | 36.321 | | 16.221 | | 4.304 | |
Distributions | | | | | | | | | | | |
Dividends from Net Investment Income | | (2.038 | ) | (2.926 | ) | (2.651 | ) | (2.461 | ) | (2.204 | ) |
Distributions from Realized Capital Gains | | — | | — | | — | | — | | — | |
Total Distributions | | (2.038 | ) | (2.926 | ) | (2.651 | ) | (2.461 | ) | (2.204 | ) |
Net Asset Value, End of Period | | $262.63 | | $253.80 | | $206.74 | | $173.07 | | $159.31 | |
| | | | | | | | | | | |
Total Return | | 4.34% | | 24.39% | | 21.20% | | 10.28% | | 2.71% | |
| | | | | | | | | | | |
Ratios/Supplemental Data | | | | | | | | | | | |
Net Assets, End of Period (Millions) | | $43 | | $43 | | $35 | | $30 | | $35 | |
Ratio of Total Expenses to Average Net Assets | | 0.06% | | 0.06% | | 0.06% | | 0.06% | | 0.08% | |
Ratio of Net Investment Income to Average Net Assets | | 1.31% | | 1.30% | | 1.44% | | 1.56% | | 1.44% | |
Portfolio Turnover Rate2 | | 14% | | 9% | | 8% | | 12% | | 9% | |
1 Calculated based on average shares outstanding.
2 Excludes the value of portfolio securities received or delivered as a result of in-kind purchases or redemptions of the fund’s capital shares, including ETF Creation Units.
See accompanying Notes, which are an integral part of the Financial Statements.
31
Mega Cap Growth Index Fund
Notes to Financial Statements
Vanguard Mega Cap Growth Index Fund is registered under the Investment Company Act of 1940 as an open-end investment company, or mutual fund. The fund offers two classes of shares: ETF Shares and Institutional Shares. Each of the share classes has different eligibility and minimum purchase requirements, and is designed for different types of investors. ETF Shares are listed for trading on NYSE Arca; they can be purchased and sold through a broker.
A. The following significant accounting policies conform to generally accepted accounting principles for U.S. investment companies. The fund consistently follows such policies in preparing its financial statements.
1. Security Valuation: Securities are valued as of the close of trading on the New York Stock Exchange (generally 4 p.m., Eastern time) on the valuation date. Equity securities are valued at the latest quoted sales prices or official closing prices taken from the primary market in which each security trades; such securities not traded on the valuation date are valued at the mean of the latest quoted bid and asked prices. Securities for which market quotations are not readily available, or whose values have been materially affected by events occurring before the fund’s pricing time but after the close of the securities’ primary markets, are valued by methods deemed by the board of trustees to represent fair value. Investments in Vanguard Market Liquidity Fund are valued at that fund’s net asset value. Temporary cash investments are valued using the latest bid prices or using valuations based on a matrix system (which considers such factors as security prices, yields, maturities, and ratings), both as furnished by independent pricing services.
2. Futures Contracts: The fund uses index futures contracts to a limited extent, with the objectives of maintaining full exposure to the stock market, maintaining liquidity, and minimizing transaction costs. The fund may purchase futures contracts to immediately invest incoming cash in the market, or sell futures in response to cash outflows, thereby simulating a fully invested position in the underlying index while maintaining a cash balance for liquidity. The primary risks associated with the use of futures contracts are imperfect correlation between changes in market values of stocks held by the fund and the prices of futures contracts, and the possibility of an illiquid market. Counterparty risk involving futures is mitigated because a regulated clearinghouse is the counterparty instead of the clearing broker. To further mitigate counterparty risk, the fund trades futures contracts on an exchange, monitors the financial strength of its clearing brokers and clearinghouse, and has entered into clearing agreements with its clearing brokers. The clearinghouse imposes initial margin requirements to secure the fund’s performance and requires daily settlement of variation margin representing changes in the market value of each contract. Any assets pledged as initial margin for open contracts are noted in the Statement of Net Assets.
Futures contracts are valued at their quoted daily settlement prices. The notional amounts of the contracts are not recorded in the Statement of Net Assets. Fluctuations in the value of the contracts are recorded in the Statement of Net Assets as an asset (liability) and in the Statement of Operations as unrealized appreciation (depreciation) until the contracts are closed, when they are recorded as realized futures gains (losses).
During the year ended August 31, 2019, the fund’s average investments in long and short futures contracts represented less than 1% and 0% of net assets, respectively, based on the average of the notional amounts at each quarter-end during the period.
3. Swap Contracts: The fund has entered into equity swap contracts to earn the total return on selected reference stocks in the fund’s target index. Under the terms of the swaps, the fund receives the total return on the referenced stock (i.e., receiving the increase or paying the decrease
32
Mega Cap Growth Index Fund
in value of the selected reference stock and receiving the equivalent of any dividends in respect of the selected referenced stock) over a specified period of time, applied to a notional amount that represents the value of a designated number of shares of the selected reference stock at the beginning of the equity swap contract. The fund also pays a floating rate that is based on short-term interest rates, applied to the notional amount. At the same time, the fund generally invests an amount approximating the notional amount of the swap in high-quality temporary cash investments.
The notional amounts of swap contracts are not recorded in the Statement of Net Assets. Swaps are valued daily based on market quotations received from independent pricing services or recognized dealers and the change in value is recorded in the Statement of Net Assets as an asset (liability) and in the Statement of Operations as unrealized appreciation (depreciation) until termination of the swap, at which time realized gain (loss) is recorded.
A risk associated with all types of swaps is the possibility that a counterparty may default on its obligation to pay net amounts due to the fund. The fund’s maximum amount subject to counterparty risk is the unrealized appreciation on the swap contract. The fund mitigates its counterparty risk by entering into swaps only with a diverse group of prequalified counterparties, monitoring their financial strength, entering into master netting arrangements with its counter-parties, and requiring its counterparties to transfer collateral as security for their performance. In the absence of a default, the collateral pledged or received by the fund cannot be repledged, resold, or rehypothecated. In the event of a counterparty’s default (including bankruptcy), the fund may terminate any swap contracts with that counterparty, determine the net amount owed by either party in accordance with its master netting arrangements, and sell or retain any collateral held up to the net amount owed to the fund under the master netting arrangements. The swap contracts contain provisions whereby a counterparty may terminate open contracts if the fund net assets decline below a certain level, triggering a payment by the fund if the fund is in a net liability position at the time of the termination. The payment amount would be reduced by any collateral the fund has pledged. Any securities pledged as collateral for open contracts are noted in the Statement of Net Assets. The value of collateral received or pledged is compared daily to the value of the swap contracts exposure with each counterparty, and any difference, if in excess of a specified minimum transfer amount, is adjusted and settled within two business days.
During the year ended August 31, 2019, the fund’s average amounts of investments in total return swaps represented less than 1% of net assets, based on the average of notional amounts at each quarter-end during the period. The fund had no open swap contracts at August 31, 2019.
4. Federal Income Taxes: The fund intends to continue to qualify as a regulated investment company and distribute all of its taxable income. Management has analyzed the fund’s tax positions taken for all open federal income tax years (August 31, 2016–2019), and has concluded that no provision for federal income tax is required in the fund’s financial statements.
5. Distributions: Distributions to shareholders are recorded on the ex-dividend date. Distributions are determined on a tax basis and may differ from net investment income and realized capital gains for financial reporting purposes.
6. Securities Lending: To earn additional income, the fund lends its securities to qualified institutional borrowers. Security loans are subject to termination by the fund at any time, and are required to be secured at all times by collateral in an amount at least equal to the market value of securities loaned. Daily market fluctuations could cause the value of loaned securities to be more
33
Mega Cap Growth Index Fund
or less than the value of the collateral received. When this occurs, the collateral is adjusted and settled before the opening of the market on the next business day. The fund further mitigates its counterparty risk by entering into securities lending transactions only with a diverse group of prequalified counterparties, monitoring their financial strength, and entering into master securities lending agreements with its counterparties. The master securities lending agreements provide that, in the event of a counterparty’s default (including bankruptcy), the fund may terminate any loans with that borrower, determine the net amount owed, and sell or retain the collateral up to the net amount owed to the fund; however, such actions may be subject to legal proceedings. While collateral mitigates counterparty risk, in the event of a default, the fund may experience delays and costs in recovering the securities loaned. The fund invests cash collateral received in Vanguard Market Liquidity Fund, and records a liability in the Statement of Net Assets for the return of the collateral, during the period the securities are on loan. Securities lending income represents fees charged to borrowers plus income earned on invested cash collateral, less expenses associated with the loan. During the term of the loan, the fund is entitled to all distributions made on or in respect of the loaned securities.
7. Credit Facility: The fund and certain other funds managed by The Vanguard Group (“Vanguard”) participate in a $4.3 billion committed credit facility provided by a syndicate of lenders pursuant to a credit agreement that may be renewed annually; each fund is individually liable for its borrowings, if any, under the credit facility. Borrowings may be utilized for temporary and emergency purposes, and are subject to the fund’s regulatory and contractual borrowing restrictions. The participating funds are charged administrative fees and an annual commitment fee of 0.10% of the undrawn amount of the facility; these fees are allocated to the funds based on a method approved by the fund’s board of trustees and included in Management and Administrative expenses on the fund’s Statement of Operations. Any borrowings under this facility bear interest at a rate based upon the higher of the one-month London Interbank Offered Rate, federal funds effective rate, or overnight bank funding rate plus an agreed-upon spread.
The fund had no borrowings outstanding at August 31, 2019, or at any time during the period then ended.
8. Other: Dividend income is recorded on the ex-dividend date. Interest income includes income distributions received from Vanguard Market Liquidity Fund and is accrued daily. Premiums and discounts on debt securities purchased are amortized and accreted, respectively, to interest income over the lives of the respective securities. Security transactions are accounted for on the date securities are bought or sold. Costs used to determine realized gains (losses) on the sale of investment securities are those of the specific securities sold.
Each class of shares has equal rights as to assets and earnings, except that each class separately bears certain class-specific expenses related to maintenance of shareholder accounts (included in Management and Administrative expenses) and shareholder reporting. Marketing and distribution expenses are allocated to each class of shares based on a method approved by the board of trustees. Income, other non-class-specific expenses, and gains and losses on investments are allocated to each class of shares based on its relative net assets.
B. In accordance with the terms of a Funds’ Service Agreement (the “FSA”) between Vanguard and the fund, Vanguard furnishes to the fund investment advisory, corporate management, administrative, marketing, and distribution services at Vanguard’s cost of operations (as defined by the FSA). These costs of operations are allocated to the fund based on methods and guidelines approved by the board of trustees. Vanguard does not require reimbursement in the current period
34
Mega Cap Growth Index Fund
for certain costs of operations (such as deferred compensation/benefits and risk/insurance costs); the fund’s liability for these costs of operations is included in Payables to Vanguard on the Statement of Net Assets. All other costs of operations payable to Vanguard are generally settled twice a month.
Upon the request of Vanguard, the fund may invest up to 0.40% of its net assets as capital in Vanguard. At August 31, 2019, the fund had contributed to Vanguard capital in the amount of $217,000, representing less than 0.01% of the fund’s net assets and 0.09% of Vanguard’s capital received pursuant to the FSA. The fund’s trustees and officers are also directors and employees, respectively, of Vanguard.
C. Various inputs may be used to determine the value of the fund’s investments. These inputs are summarized in three broad levels for financial statement purposes. The inputs or methodologies used to value securities are not necessarily an indication of the risk associated with investing in those securities.
Level 1—Quoted prices in active markets for identical securities.
Level 2—Other significant observable inputs (including quoted prices for similar securities, interest rates, prepayment speeds, credit risk, etc.).
Level 3—Significant unobservable inputs (including the fund’s own assumptions used to determine the fair value of investments). Any investments valued with significant unobservable inputs are noted on the Statement of Net Assets.
At August 31, 2019, 100% of the market value of the fund’s investments and derivatives was determined based on Level 1 inputs.
D. Permanent differences between book-basis and tax-basis components of net assets are reclassified among capital accounts in the financial statements to reflect their tax character. These reclassifications have no effect on net assets or net asset value per share. As of period end, permanent differences primarily attributable to the accounting for in-kind redemptions, the expiration of capital loss carryforwards, and swap agreements were reclassified to the following accounts:
| | Amount | |
| | ($000 | ) |
Paid-in Capital | | 240,852 | |
Total Distributable Earnings (Loss) | | (240,852 | ) |
Temporary differences between book-basis and tax-basis components of total distributable earnings (loss) arise when certain items of income, gain, or loss are recognized in different periods for financial statement and tax purposes; these differences will reverse at some time in the future. The differences are primarily related to the tax deferral on wash sales and the realization of unrealized gains or losses on certain futures contracts. As of period end, the tax-basis components of total distributable earnings (loss) are detailed in the table as follows:
| | Amount | |
| | ($000 | ) |
Undistributed Ordinary Income | | 9,854 | |
Undistributed Long-Term Gains | | — | |
Capital Loss Carryforwards (Non-expiring) | | (146,929 | ) |
Net Unrealized Gains (Losses) | | 1,469,990 | |
35
Mega Cap Growth Index Fund
As of August 31, 2019, gross unrealized appreciation and depreciation for investments and derivatives based on cost for U.S. federal income tax purposes were as follows:
| | Amount | |
| | ($000 | ) |
Tax Cost | | 2,971,697 | |
Gross Unrealized Appreciation | | 1,549,070 | |
Gross Unrealized Depreciation | | (79,080 | ) |
Net Unrealized Appreciation (Depreciation) | | 1,469,990 | |
E. During the year ended August 31, 2019, the fund purchased $1,258,333,000 of investment securities and sold $1,093,594,000 of investment securities, other than temporary cash investments. Purchases and sales include $560,120,000 and $509,541,000, respectively, in connection with in-kind purchases and redemptions of the fund’s capital shares.
The fund purchased securities from and sold securities to other Vanguard funds or accounts managed by Vanguard or its affiliates, in accordance with procedures adopted by the board of trustees in compliance with Rule 17a-7 of the Investment Company Act of 1940. For the year ended August 31, 2019, such purchases and sales were $145,297,000 and $228,179,000, respectively; these amounts are included in the purchases and sales of investment securities noted above.
F. Capital share transactions for each class of shares were:
| | Year Ended August 31, | |
| | | | 2019 | | | | 2018 | |
| | Amount | | Shares | | Amount | | Shares | |
| | ($000 | ) | (000) | | ($000 | ) | (000 | ) |
ETF Shares | | | | | | | | | |
Issued | | 602,968 | | 4,900 | | 649,537 | | 5,625 | |
Issued in Lieu of Cash Distributions | | — | | — | | — | | — | |
Redeemed | | (513,521 | ) | (4,200) | | (371,230 | ) | (3,250 | ) |
Net Increase (Decrease)—ETF Shares | | 89,447 | | 700 | | 278,307 | | 2,375 | |
Institutional Shares | | | | | | | | | |
Issued | | 21,064 | | 89 | | 3,509 | | 14 | |
Issued in Lieu of Cash Distributions | | 290 | | 1 | | 344 | | 2 | |
Redeemed | | (22,721 | ) | (97) | | (3,315 | ) | (14 | ) |
Net Increase (Decrease)—Institutional Shares | | (1,367 | ) | (7) | | 538 | | 2 | |
G. Management has determined that no events or transactions occurred subsequent to August 31, 2019, that would require recognition or disclosure in these financial statements.
36
Mega Cap Value Index Fund
Performance Summary
All of the returns in this report represent past performance, which is not a guarantee of future results that may be achieved by the fund. (Current performance may be lower or higher than the performance data cited. For performance data current to the most recent month-end, visit our website at vanguard.com/performance.) Note, too, that both investment returns and principal value can fluctuate widely, so an investor’s shares, when sold, could be worth more or less than their original cost. The returns shown do not reflect taxes that a shareholder would pay on fund distributions or on the sale of fund shares.
Cumulative Performance: August 31, 2009, Through August 31, 2019
Initial Investment of $10,000
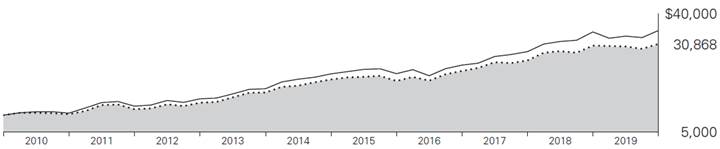
| | Average Annual Total Returns | | |
| | Periods Ended August 31, 2019 | | |
| | | | | | Final Value |
| | One | Five | Ten | | of a $10,000 |
| | Year | Years | Years | | Investment |

| Mega Cap Value Index Fund ETF Shares Net Asset Value | | 1.69% | 8.58% | 11.93% | | $30,868 |
| Mega Cap Value Index Fund ETF Shares Market Price | | 1.65 | 8.59 | 11.92 | | 30,832 |

| Spliced Mega Cap Value Index | | 1.68 | 8.62 | 12.00 | | 31,060 |

| Dow Jones U.S. Total Stock Market Float Adjusted Index | | 1.23 | 9.55 | 13.35 | | 35,018 |
Spliced Mega Cap Value Index: MSCI US Large Cap Value Index through April 16, 2013; CRSP US Mega Cap Value Index thereafter.
| | | | | | Final Value |
| | One | Five | Ten | | of a $5,000,000 |
| | Year | Years | Years | | Investment |
Mega Cap Value Index Fund Institutional Shares | | 1.68% | 8.59% | 11.95% | | $15,460,197 |
Spliced Mega Cap Value Index | | 1.68 | 8.62 | 12.00 | | 15,530,013 |
Dow Jones U.S. Total Stock Market Float Adjusted Index | | 1.23 | 9.55 | 13.35 | | 17,509,140 |
See Financial Highlights for dividend and capital gains information.
37
Mega Cap Value Index Fund
Cumulative Returns of ETF Shares: August 31, 2009, Through August 31, 2019
| | One | Five | Ten |
| | Year | Years | Years |
Mega Cap Value Index Fund ETF Shares Market Price | | 1.65% | 50.97% | 208.32% |
Mega Cap Value Index Fund ETF Shares Net Asset Value | | 1.69 | 50.94 | 208.68 |
Spliced Mega Cap Value Index | | 1.68 | 51.21 | 210.60 |
For the ETF Shares, the market price is determined by the midpoint of the bid-offer spread as of the closing time of the New York Stock Exchange (generally 4 p.m., Eastern time). The net asset value is also determined as of the NYSE closing time. For more information about how the ETF Shares’ market prices have compared with their net asset value, visit vanguard.com, select your ETF, and then select the Price and Performance tab. The ETF premium/discount analysis there shows the percentages of days on which the ETF Shares’ market price was above or below the NAV.
38
Mega Cap Value Index Fund
Sector Diversification
As of August 31, 2019
Basic Materials | | 2.0% |
Consumer Goods | | 11.4 |
Consumer Services | | 6.8 |
Financials | | 23.5 |
Health Care | | 19.0 |
Industrials | | 10.8 |
Oil & Gas | | 7.9 |
Technology | | 8.2 |
Telecommunications | | 4.9 |
Utilities | | 5.5 |
The table reflects the fund’s equity exposure, based on its investments in stocks and stock index futures. Any holdings in short-term reserves are excluded. Sector categories are based on the Industry Classification Benchmark (“ICB”), except for the “Other” category (if applicable), which includes securities that have not been provided an ICB classification as of the effective reporting period.
The Industry Classification Benchmark (“ICB”) is owned by FTSE. FTSE does not accept any liability to any person for any loss or damage arising out of any error or omission in the ICB.
39
Mega Cap Value Index Fund
Financial Statements
Statement of Net Assets
As of August 31, 2019
The fund files its complete schedule of portfolio holdings with the Securities and Exchange Commission (SEC) for the first and third quarters of each fiscal year as an exhibit to its reports on Form N-PORT. The fund’s Form N-PORT reports are available on the SEC’s website at www.sec.gov.
| | | | | | Market | |
| | | | | | Value· | |
| | | | Shares | | ($000 | ) |
Common Stocks (99.8%)1 | | | | | |
Basic Materials (2.0%) | | | | | |
| | DuPont de Nemours Inc. | | 188,264 | | 12,789 | |
| | Air Products & Chemicals Inc. | | 55,176 | | 12,465 | |
| | Dow Inc. | | 186,936 | | 7,969 | |
| | PPG Industries Inc. | | 59,143 | | 6,552 | |
| | LyondellBasell Industries NV Class A | | 67,507 | | 5,224 | |
| | International Paper Co. | | 99,742 | | 3,900 | |
| | Nucor Corp. | | 38,513 | | 1,886 | |
| | | | | | 50,785 | |
Consumer Goods (11.4%) | | | | | |
| | Procter & Gamble Co. | | 629,713 | | 75,710 | |
| | Coca-Cola Co. | | 963,943 | | 53,056 | |
| | PepsiCo Inc. | | 351,908 | | 48,116 | |
| | Mondelez International Inc. Class A | | 361,567 | | 19,966 | |
| | Philip Morris International Inc. | | 195,202 | | 14,072 | |
| | Kimberly-Clark Corp. | | 86,388 | | 12,190 | |
| | General Motors Co. | | 320,113 | | 11,873 | |
| | Altria Group Inc. | | 235,206 | | 10,288 | |
| | Ford Motor Co. | | 983,935 | | 9,023 | |
| | General Mills Inc. | | 150,528 | | 8,098 | |
| | VF Corp. | | 79,584 | | 6,522 | |
| | Corteva Inc. | | 187,964 | | 5,511 | |
| | Archer-Daniels-Midland Co. | | 141,298 | | 5,376 | |
| | Kellogg Co. | | 64,203 | | 4,032 | |
| | Kraft Heinz Co. | | 153,043 | | 3,906 | |
| | Tyson Foods Inc. Class A | | 36,818 | | 3,426 | |
| | Aptiv plc | | 32,177 | | 2,676 | |
| | | | | | 293,841 | |
| | | | | | | |
Consumer Services (6.8%) | | | | | |
| | Walmart Inc. | | 360,169 | | 41,153 | |
| | Walt Disney Co. | | 225,492 | | 30,951 | |
| | CVS Health Corp. | | 326,443 | | 19,887 | |
| | Target Corp. | | 128,508 | | 13,755 | |
| | Walgreens Boots Alliance Inc. | | 195,054 | | 9,985 | |
| | Sysco Corp. | | 122,746 | | 9,124 | |
| | Delta Air Lines Inc. | | 147,585 | | 8,539 | |
| | eBay Inc. | | 207,436 | | 8,358 | |
| | McKesson Corp. | | 47,659 | | 6,590 | |
| | Las Vegas Sands Corp. | | 96,848 | | 5,372 | |
| | Kroger Co. | | 202,853 | | 4,804 | |
| | Carnival Corp. | | 99,224 | | 4,374 | |
| | CBS Corp. Class B | | 84,439 | | 3,551 | |
| | Southwest Airlines Co. | | 61,000 | | 3,191 | |
| | Fox Corp. Class A | | 90,521 | | 3,003 | |
* | | United Airlines Holdings Inc. | | 28,297 | | 2,386 | |
| | Fox Corp. Class B | | 38,492 | | 1,262 | |
| | CBS Corp. Class A | | 710 | | 32 | |
| | | | | | 176,317 | |
Financials (23.5%) | | | | | |
* | | Berkshire Hathaway Inc. Class B | | 488,199 | | 99,304 | |
| | JPMorgan Chase & Co. | | 774,109 | | 85,044 | |
| | Bank of America Corp. | | 2,148,797 | | 59,113 | |
| | Wells Fargo & Co. | | 1,017,301 | | 47,376 | |
| | Citigroup Inc. | | 580,617 | | 37,363 | |
| | CME Group Inc. | | 89,793 | | 19,511 | |
| | US Bancorp | | 360,835 | | 19,012 | |
| | American Express Co. | | 157,039 | | 18,903 | |
| | Goldman Sachs Group Inc. | | 87,132 | | 17,767 | |
| | Chubb Ltd. | | 97,839 | | 15,290 | |
| | PNC Financial Services Group Inc. | | 102,207 | | 13,177 | |
| | Morgan Stanley | | 316,690 | | 13,139 | |
| | BlackRock Inc. | | 27,184 | | 11,487 | |
| | American International Group Inc. | | 218,162 | | 11,353 | |
| | Progressive Corp. | | 146,436 | | 11,100 | |
| | Capital One Financial Corp. | | 117,636 | | 10,190 | |
| | Aflac Inc. | | 187,526 | | 9,410 | |
| | Travelers Cos. Inc. | | 62,585 | | 9,197 | |
| | BB&T Corp. | | 192,819 | | 9,188 | |
| | Bank of New York Mellon Corp. | | 215,921 | | 9,082 | |
40
Mega Cap Value Index Fund
| | | | | | Market | |
| | | | | | Value· | |
| | | | Shares | | ($000 | ) |
| | Allstate Corp. | | 83,868 | | 8,587 | |
| | Prudential Financial Inc. | | 101,733 | | 8,148 | |
| | MetLife Inc. | | 179,155 | | 7,937 | |
| | Equity Residential | | 92,942 | | 7,878 | |
| | SunTrust Banks Inc. | | 111,848 | | 6,880 | |
| | Discover Financial Services | | 81,193 | | 6,493 | |
| | Synchrony Financial | | 164,308 | | 5,266 | |
| | Fifth Third Bancorp | | 184,186 | | 4,872 | |
| | State Street Corp. | | 89,123 | | 4,573 | |
| | Northern Trust Corp. | | 51,985 | | 4,571 | |
| | Welltower Inc. | | 50,758 | | 4,546 | |
| | Ameriprise Financial Inc. | | 33,503 | | 4,321 | |
| | Ventas Inc. | | 46,074 | | 3,381 | |
| | Weyerhaeuser Co. | | 92,877 | | 2,444 | |
* | | Berkshire Hathaway Inc. Class A | | 1 | | 303 | |
| | | | | | 606,206 | |
Health Care (19.0%) | | | | | |
| | Johnson & Johnson | | 667,212 | | 85,643 | |
| | Merck & Co. Inc. | | 646,740 | | 55,924 | |
| | UnitedHealth Group Inc. | | 238,679 | | 55,851 | |
| | Pfizer Inc. | | 1,397,058 | | 49,665 | |
| | Abbott Laboratories | | 442,019 | | 37,713 | |
| | Medtronic plc | | 336,144 | | 36,267 | |
| | Amgen Inc. | | 153,143 | | 31,949 | |
| | Eli Lilly & Co. | | 219,534 | | 24,801 | |
| | Gilead Sciences Inc. | | 319,218 | | 20,283 | |
| | Anthem Inc. | | 64,568 | | 16,886 | |
| | Cigna Corp. | | 95,324 | | 14,677 | |
| | Allergan plc | | 82,213 | | 13,131 | |
| | AbbVie Inc. | | 185,404 | | 12,188 | |
| | Humana Inc. | | 33,873 | | 9,593 | |
| | HCA Healthcare Inc. | | 68,557 | | 8,240 | |
| | Zimmer Biomet Holdings Inc. | | 51,364 | | 7,150 | |
| | Baxter International Inc. | | 60,876 | | 5,354 | |
* | | Biogen Inc. | | 24,300 | | 5,340 | |
| | | | | | 490,655 | |
Industrials (10.7%) | | | | | |
| | Honeywell International Inc. | | 182,745 | | 30,083 | |
| | United Technologies Corp. | | 216,397 | | 28,184 | |
| | General Electric Co. | | 2,189,712 | | 18,065 | |
| | Caterpillar Inc. | | 143,537 | | 17,081 | |
| | Northrop Grumman Corp. | | 42,617 | | 15,677 | |
| | CSX Corp. | | 193,088 | | 12,941 | |
| | Waste Management Inc. | | 106,450 | | 12,705 | |
| | Deere & Co. | | 79,568 | | 12,326 | |
| | General Dynamics Corp. | | 61,527 | | 11,768 | |
| | 3M Co. | | 72,400 | | 11,709 | |
| | Norfolk Southern Corp. | | 66,597 | | 11,591 | |
| | Danaher Corp. | | 80,692 | | 11,466 | |
| | FedEx Corp. | | 58,790 | | 9,325 | |
| | Emerson Electric Co. | | 154,380 | | 9,199 | |
| | Eaton Corp. plc | | 106,281 | | 8,579 | |
| | Johnson Controls International plc | | 199,863 | | 8,532 | |
| | TE Connectivity Ltd. | | 84,458 | | 7,704 | |
| | Ingersoll-Rand plc | | 60,416 | | 7,316 | |
| | Raytheon Co. | | 35,098 | | 6,504 | |
| | Cummins Inc. | | 39,541 | | 5,902 | |
| | PACCAR Inc. | | 87,324 | | 5,725 | |
| | Parker-Hannifin Corp. | | 32,229 | | 5,343 | |
| | Stanley Black & Decker Inc. | | 38,040 | | 5,054 | |
| | Republic Services Inc. Class A | | 52,219 | | 4,661 | |
| | | | | | 277,440 | |
Oil & Gas (7.8%) | | | | | |
| | Exxon Mobil Corp. | | 1,062,998 | | 72,794 | |
| | Chevron Corp. | | 478,404 | | 56,318 | |
| | ConocoPhillips | | 283,669 | | 14,802 | |
| | Phillips 66 | | 113,876 | | 11,231 | |
| | Kinder Morgan Inc. | | 483,083 | | 9,792 | |
| | Marathon Petroleum Corp. | | 166,488 | | 8,193 | |
| | Valero Energy Corp. | | 104,754 | | 7,886 | |
| | Williams Cos. Inc. | | 304,488 | | 7,186 | |
| | Schlumberger Ltd. | | 174,430 | | 5,657 | |
| | Occidental Petroleum Corp. | | 112,300 | | 4,883 | |
| | Halliburton Co. | | 208,414 | | 3,926 | |
| | | | | | 202,668 | |
Technology (8.2%) | | | | | |
| | Intel Corp. | | 1,123,090 | | 53,246 | |
| | Cisco Systems Inc. | | 1,072,663 | | 50,211 | |
| | International Business Machines Corp. | | 222,125 | | 30,105 | |
| | Oracle Corp. | | 556,738 | | 28,984 | |
| | QUALCOMM Inc. | | 304,968 | | 23,717 | |
| | HP Inc. | | 377,520 | | 6,905 | |
| | Corning Inc. | | 196,701 | | 5,478 | |
| | Hewlett Packard Enterprise Co. | | 338,013 | | 4,671 | |
| | Cognizant Technology Solutions Corp. Class A | | 71,504 | | 4,390 | |
* | | Dell Technologies Inc. | | 38,936 | | 2,006 | |
| | DXC Technology Co. | | 33,430 | | 1,111 | |
| | | | | | 210,824 | |
Telecommunications (4.9%) | | | | | |
| | AT&T Inc. | | 1,833,058 | | 64,633 | |
| | Verizon Communications Inc. | | 1,039,164 | | 60,438 | |
* | | Sprint Corp. | | 151,944 | | 1,032 | |
| | | | | | 126,103 | |
41
Mega Cap Value Index Fund
| | | | | | Market | |
| | | | | | Value· | |
| | | | Shares | | ($000 | ) |
Utilities (5.5%) | | | | | |
| | NextEra Energy Inc. | | 120,134 | | 26,319 | |
| | Duke Energy Corp. | | 183,939 | | 17,058 | |
| | Dominion Energy Inc. | | 201,361 | | 15,632 | |
| | Southern Co. | | 261,304 | | 15,224 | |
| | Exelon Corp. | | 243,906 | | 11,527 | |
| | American Electric Power Co. Inc. | | 123,837 | | 11,288 | |
| | Sempra Energy | | 68,764 | | 9,739 | |
| | Xcel Energy Inc. | | 128,917 | | 8,279 | |
| | Public Service Enterprise Group Inc. | | 126,997 | | 7,680 | |
| | Consolidated Edison Inc. | | 83,970 | | 7,465 | |
| | Edison International | | 88,604 | | 6,403 | |
| | PPL Corp. | | 182,146 | | 5,382 | |
| | | | | | 141,996 | |
Total Common Stocks | | | | | |
(Cost $2,194,256) | | | | 2,576,835 | |
Temporary Cash Investments (0.0%)1 | | | | | |
Money Market Fund (0.0%) | | | | | |
2 | | Vanguard Market Liquidity Fund, 2.249% | | 24 | | 2 | |
| | | | Face | | | |
| | | | Amount | | | |
| | | | ($000) | | | |
U.S. Government and Agency Obligations (0.0%) | | | | | |
3 | | United States Treasury Bill, 2.048%, 11/21/19 | | 350 | | 349 | |
Total Temporary Cash Investments | | | | | |
(Cost $351) | | | | 351 | |
Total Investments (99.8%) | | | | | |
(Cost $2,194,607) | | | | 2,577,186 | |
| | | | | | Amount | |
| | | | | | ($000 | ) |
Other Assets and Liabilities (0.2%) | | | | | |
Other Assets | | | | | |
Investment in Vanguard | | | | 126 | |
Receivables for Accrued Income | | | | 7,884 | |
Receivables for Capital Shares Issued | | | | 122 | |
Total Other Assets | | | | 8,132 | |
Liabilities | | | | | |
Payables for Investment Securities Purchased | | | | (1 | ) |
Payables for Capital Shares Redeemed | | | | (11 | ) |
Payables to Vanguard | | | | (357 | ) |
Variation Margin Payable—Futures Contracts | | | | (3 | ) |
Other Liabilities | | | | (2,611 | ) |
Total Liabilities | | | | (2,983 | ) |
Net Assets (100%) | | | | 2,582,335 | |
At August 31, 2019, net assets consisted of:
| | | | | | Amount | |
| | | | | | ($000 | ) |
Paid-in Capital | | | | 2,217,828 | |
Total Distributable Earnings (Loss) | | | | 364,507 | |
Net Assets | | | | 2,582,335 | |
| | | | | |
ETF Shares—Net Assets | | | | | |
Applicable to 31,009,799 outstanding $.001 par value shares of beneficial interest (unlimited authorization) | | | | 2,447,882 | |
Net Asset Value Per Share—ETF Shares | | | | $78.94 | |
42
Mega Cap Value Index Fund
| | | | | | Amount | |
| | | | | | ($000 | ) |
Institutional Shares—Net Assets | | | | | |
Applicable to 858,974 outstanding $.001 par value shares of beneficial interest (unlimited authorization) | | | | 134,453 | |
Net Asset Value Per Share—Institutional Shares | | | | $156.53 | |
· See Note A in Notes to Financial Statements. * Non-income-producing security. 1 The fund invests a portion of its cash reserves in equity markets through the use of index futures contracts. After giving effect to futures investments, the fund’s effective common stock and temporary cash investment positions represent 100.0% and -0.2%, respectively, of net assets. 2 Affiliated money market fund available only to Vanguard funds and certain trusts and accounts managed by Vanguard. Rate shown is the 7-day yield. 3 Securities with a value of $319,000 have been segregated as initial margin for open futures contracts. |
Derivative Financial Instruments Outstanding as of Period End |
Futures Contracts |
| | | | | | | | ($000 | ) |
| | | | | | | | Value and | |
| | | | Number of | | | | Unrealized | |
| | | | Long (Short | ) | Notional | | Appreciation | |
| | Expiration | | Contracts | | Amount | | (Depreciation | ) |
Long Futures Contracts | | | | | | | | | |
E-mini S&P 500 Index | | September 2019 | | 33 | | 4,826 | | 81 | |
See accompanying Notes, which are an integral part of the Financial Statements.
43
Mega Cap Value Index Fund
Statement of Operations
| Year Ended
August 31, 2019 |
| ($000) |
Investment Income | |
Income | |
Dividends | 71,225 |
Interest1 | 53 |
Securities Lending—Net | 67 |
Total Income | 71,345 |
Expenses | |
The Vanguard Group—Note B | |
Investment Advisory Services | 356 |
Management and Administrative—ETF Shares | 1,061 |
Management and Administrative—Institutional Shares | 50 |
Marketing and Distribution—ETF Shares | 101 |
Marketing and Distribution—Institutional Shares | 3 |
Custodian Fees | 22 |
Auditing Fees | 33 |
Shareholders’ Reports—ETF Shares | 43 |
Shareholders’ Reports—Institutional Shares | 1 |
Trustees’ Fees and Expenses | 1 |
Total Expenses | 1,671 |
Net Investment Income | 69,674 |
Realized Net Gain (Loss) | |
Investment Securities Sold1,2 | 194,277 |
Futures Contracts | 574 |
Realized Net Gain (Loss) | 194,851 |
Change in Unrealized Appreciation (Depreciation) | |
Investment Securities1 | (221,410) |
Futures Contracts | 21 |
Change in Unrealized Appreciation (Depreciation) | (221,389) |
Net Increase (Decrease) in Net Assets Resulting from Operations | 43,136 |
1 Interest income, realized net gain (loss), and change in unrealized appreciation (depreciation) from an affiliated company of the fund were $41,000, $1,000, and ($1,000), respectively. Purchases and sales are for temporary cash investment purposes.
2 Includes $193,289,000 of net gain (loss) resulting from in-kind redemptions; such gain (loss) is not taxable to the fund.
See accompanying Notes, which are an integral part of the Financial Statements.
44
Mega Cap Value Index Fund
Statement of Changes in Net Assets
| Year Ended August 31, |
| 2019 | 2018 |
| ($000) | ($000) |
Increase (Decrease) in Net Assets | | |
Operations | | |
Net Investment Income | 69,674 | 51,263 |
Realized Net Gain (Loss) | 194,851 | 33,613 |
Change in Unrealized Appreciation (Depreciation) | (221,389) | 228,709 |
Net Increase (Decrease) in Net Assets Resulting from Operations | 43,136 | 313,585 |
Distributions | | |
Net Investment Income | | |
ETF Shares | (64,527) | (47,205) |
Institutional Shares | (3,466) | (3,196) |
Realized Capital Gain | | |
ETF Shares | — | — |
Institutional Shares | — | — |
Total Distributions | (67,993) | (50,401) |
Capital Share Transactions | | |
ETF Shares | 351,597 | 156,383 |
Institutional Shares | 5,455 | (11,494) |
Net Increase (Decrease) from Capital Share Transactions | 357,052 | 144,889 |
Total Increase (Decrease) | 332,195 | 408,073 |
Net Assets | | |
Beginning of Period | 2,250,140 | 1,842,067 |
End of Period | 2,582,335 | 2,250,140 |
See accompanying Notes, which are an integral part of the Financial Statements.
45
Mega Cap Value Index Fund
Financial Highlights
ETF Shares
For a Share Outstanding | Year Ended August 31, |
Throughout Each Period | 2019 | 2018 | 2017 | 2016 | 2015 |
Net Asset Value, Beginning of Period | $79.89 | $70.19 | $63.52 | $56.89 | $59.60 |
Investment Operations | | | | | |
Net Investment Income | 2.2611 | 1.8931 | 1.8431 | 1.638 | 1.484 |
Net Realized and Unrealized Gain (Loss) on Investments | (1.027) | 9.668 | 6.557 | 6.583 | (2.733) |
Total from Investment Operations | 1.234 | 11.561 | 8.400 | 8.221 | (1.249) |
Distributions | | | | | |
Dividends from Net Investment Income | (2.184) | (1.861) | (1.730) | (1.591) | (1.461) |
Distributions from Realized Capital Gains | — | — | — | — | — |
Total Distributions | (2.184) | (1.861) | (1.730) | (1.591) | (1.461) |
Net Asset Value, End of Period | $78.94 | $79.89 | $70.19 | $63.52 | $56.89 |
| | | | | |
Total Return | 1.69% | 16.71% | 13.40% | 14.71% | -2.22% |
| | | | | |
Ratios/Supplemental Data | | | | | |
Net Assets, End of Period (Millions) | $2,448 | $2,120 | $1,717 | $1,322 | $957 |
Ratio of Total Expenses to Average Net Assets | 0.07% | 0.07% | 0.07% | 0.07% | 0.09% |
Ratio of Net Investment Income to Average Net Assets | 2.90% | 2.50% | 2.73% | 2.84% | 2.51% |
Portfolio Turnover Rate2 | 10% | 8% | 8% | 8% | 5% |
1 Calculated based on average shares outstanding.
2 Excludes the value of portfolio securities received or delivered as a result of in-kind purchases or redemptions of the fund’s capital shares, including ETF Creation Units.
See accompanying Notes, which are an integral part of the Financial Statements.
46
Mega Cap Value Index Fund
Financial Highlights
Institutional Shares
For a Share Outstanding | Year Ended August 31, |
Throughout Each Period | 2019 | 2018 | 2017 | 2016 | 2015 |
Net Asset Value, Beginning of Period | $158.41 | $139.18 | $125.94 | $112.80 | $118.18 |
Investment Operations | | | | | |
Net Investment Income | 4.4671 | 3.7431 | 3.5961 | 3.259 | 2.976 |
Net Realized and Unrealized Gain (Loss) on Investments | (2.002) | 19.188 | 13.077 | 13.063 | (5.427) |
Total from Investment Operations | 2.465 | 22.931 | 16.673 | 16.322 | (2.451) |
Distributions | | | | | |
Dividends from Net Investment Income | (4.345) | (3.701) | (3.433) | (3.182) | (2.929) |
Distributions from Realized Capital Gains | — | — | — | — | — |
Total Distributions | (4.345) | (3.701) | (3.433) | (3.182) | (2.929) |
Net Asset Value, End of Period | $156.53 | $158.41 | $139.18 | $125.94 | $112.80 |
| | | | | |
Total Return | 1.68% | 16.71% | 13.41% | 14.72% | -2.19% |
| | | | | |
Ratios/Supplemental Data | | | | | |
Net Assets, End of Period (Millions) | $134 | $131 | $125 | $207 | $213 |
Ratio of Total Expenses to Average Net Assets | 0.06% | 0.06% | 0.06% | 0.06% | 0.06% |
Ratio of Net Investment Income to Average Net Assets | 2.91% | 2.51% | 2.74% | 2.85% | 2.54% |
Portfolio Turnover Rate2 | 10% | 8% | 8% | 8% | 5% |
1 Calculated based on average shares outstanding.
2 Excludes the value of portfolio securities received or delivered as a result of in-kind purchases or redemptions of the fund’s capital shares, including ETF Creation Units.
See accompanying Notes, which are an integral part of the Financial Statements.
47
Mega Cap Value Index Fund
Notes to Financial Statements
Vanguard Mega Cap Value Index Fund is registered under the Investment Company Act of 1940 as an open-end investment company, or mutual fund. The fund offers two classes of shares: ETF Shares and Institutional Shares. Each of the share classes has different eligibility and minimum purchase requirements, and is designed for different types of investors. ETF Shares are listed for trading on NYSE Arca; they can be purchased and sold through a broker.
A. The following significant accounting policies conform to generally accepted accounting principles for U.S. investment companies. The fund consistently follows such policies in preparing its financial statements.
1. Security Valuation: Securities are valued as of the close of trading on the New York Stock Exchange (generally 4 p.m., Eastern time) on the valuation date. Equity securities are valued at the latest quoted sales prices or official closing prices taken from the primary market in which each security trades; such securities not traded on the valuation date are valued at the mean of the latest quoted bid and asked prices. Securities for which market quotations are not readily available, or whose values have been materially affected by events occurring before the fund’s pricing time but after the close of the securities’ primary markets, are valued by methods deemed by the board of trustees to represent fair value. Investments in Vanguard Market Liquidity Fund are valued at that fund’s net asset value. Temporary cash investments are valued using the latest bid prices or using valuations based on a matrix system (which considers such factors as security prices, yields, maturities, and ratings), both as furnished by independent pricing services.
2. Futures Contracts: The fund uses index futures contracts to a limited extent, with the objectives of maintaining full exposure to the stock market, maintaining liquidity, and minimizing transaction costs. The fund may purchase futures contracts to immediately invest incoming cash in the market, or sell futures in response to cash outflows, thereby simulating a fully invested position in the underlying index while maintaining a cash balance for liquidity. The primary risks associated with the use of futures contracts are imperfect correlation between changes in market values of stocks held by the fund and the prices of futures contracts, and the possibility of an illiquid market. Counterparty risk involving futures is mitigated because a regulated clearinghouse is the counterparty instead of the clearing broker. To further mitigate counterparty risk, the fund trades futures contracts on an exchange, monitors the financial strength of its clearing brokers and clearinghouse, and has entered into clearing agreements with its clearing brokers. The clearinghouse imposes initial margin requirements to secure the fund’s performance and requires daily settlement of variation margin representing changes in the market value of each contract. Any assets pledged as initial margin for open contracts are noted in the Statement of Net Assets.
Futures contracts are valued at their quoted daily settlement prices. The notional amounts of the contracts are not recorded in the Statement of Net Assets. Fluctuations in the value of the contracts are recorded in the Statement of Net Assets as an asset (liability) and in the Statement of Operations as unrealized appreciation (depreciation) until the contracts are closed, when they are recorded as realized futures gains (losses).
During the year ended August 31, 2019, the fund’s average investments in long and short futures contracts represented less than 1% and 0% of net assets, respectively, based on the average of the notional amounts at each quarter-end during the period.
48
Mega Cap Value Index Fund
3. Federal Income Taxes: The fund intends to continue to qualify as a regulated investment company and distribute all of its taxable income. Management has analyzed the fund’s tax positions taken for all open federal income tax years (August 31, 2016–2019), and has concluded that no provision for federal income tax is required in the fund’s financial statements.
4. Distributions: Distributions to shareholders are recorded on the ex-dividend date. Distributions are determined on a tax basis and may differ from net investment income and realized capital gains for financial reporting purposes.
5. Securities Lending: To earn additional income, the fund lends its securities to qualified institutional borrowers. Security loans are subject to termination by the fund at any time, and are required to be secured at all times by collateral in an amount at least equal to the market value of securities loaned. Daily market fluctuations could cause the value of loaned securities to be more or less than the value of the collateral received. When this occurs, the collateral is adjusted and settled before the opening of the market on the next business day. The fund further mitigates its counterparty risk by entering into securities lending transactions only with a diverse group of prequalified counterparties, monitoring their financial strength, and entering into master securities lending agreements with its counterparties. The master securities lending agreements provide that, in the event of a counterparty’s default (including bankruptcy), the fund may terminate any loans with that borrower, determine the net amount owed, and sell or retain the collateral up to the net amount owed to the fund; however, such actions may be subject to legal proceedings. While collateral mitigates counterparty risk, in the event of a default, the fund may experience delays and costs in recovering the securities loaned. The fund invests cash collateral received in Vanguard Market Liquidity Fund, and records a liability in the Statement of Net Assets for the return of the collateral, during the period the securities are on loan. Securities lending income represents fees charged to borrowers plus income earned on invested cash collateral, less expenses associated with the loan. During the term of the loan, the fund is entitled to all distributions made on or in respect of the loaned securities.
6. Credit Facility: The fund and certain other funds managed by The Vanguard Group (“Vanguard”) participate in a $4.3 billion committed credit facility provided by a syndicate of lenders pursuant to a credit agreement that may be renewed annually; each fund is individually liable for its borrowings, if any, under the credit facility. Borrowings may be utilized for temporary and emergency purposes, and are subject to the fund’s regulatory and contractual borrowing restrictions. The participating funds are charged administrative fees and an annual commitment fee of 0.10% of the undrawn amount of the facility; these fees are allocated to the funds based on a method approved by the fund’s board of trustees and included in Management and Administrative expenses on the fund’s Statement of Operations. Any borrowings under this facility bear interest at a rate based upon the higher of the one-month London Interbank Offered Rate, federal funds effective rate, or overnight bank funding rate plus an agreed-upon spread.
The fund had no borrowings outstanding at August 31, 2019, or at any time during the period then ended.
49
Mega Cap Value Index Fund
7. Other: Dividend income is recorded on the ex-dividend date. Interest income includes income distributions received from Vanguard Market Liquidity Fund and is accrued daily. Premiums and discounts on debt securities purchased are amortized and accreted, respectively, to interest income over the lives of the respective securities. Security transactions are accounted for on the date securities are bought or sold. Costs used to determine realized gains (losses) on the sale of investment securities are those of the specific securities sold.
Each class of shares has equal rights as to assets and earnings, except that each class separately bears certain class-specific expenses related to maintenance of shareholder accounts (included in Management and Administrative expenses) and shareholder reporting. Marketing and distribution expenses are allocated to each class of shares based on a method approved by the board of trustees. Income, other non-class-specific expenses, and gains and losses on investments are allocated to each class of shares based on its relative net assets.
B. In accordance with the terms of a Funds’ Service Agreement (the “FSA”) between Vanguard and the fund, Vanguard furnishes to the fund investment advisory, corporate management, administrative, marketing, and distribution services at Vanguard’s cost of operations (as defined by the FSA). These costs of operations are allocated to the fund based on methods and guidelines approved by the board of trustees. Vanguard does not require reimbursement in the current period for certain costs of operations (such as deferred compensation/benefits and risk/insurance costs); the fund’s liability for these costs of operations is included in Payables to Vanguard on the Statement of Net Assets. All other costs of operations payable to Vanguard are generally settled twice a month.
Upon the request of Vanguard, the fund may invest up to 0.40% of its net assets as capital in Vanguard. At August 31, 2019, the fund had contributed to Vanguard capital in the amount of $126,000, representing less than 0.01% of the fund’s net assets and 0.05% of Vanguard’s capital received pursuant to the FSA. The fund’s trustees and officers are also directors and employees, respectively, of Vanguard.
C. Various inputs may be used to determine the value of the fund’s investments. These inputs are summarized in three broad levels for financial statement purposes. The inputs or methodologies used to value securities are not necessarily an indication of the risk associated with investing in those securities.
Level 1—Quoted prices in active markets for identical securities.
Level 2—Other significant observable inputs (including quoted prices for similar securities, interest rates, prepayment speeds, credit risk, etc.).
Level 3—Significant unobservable inputs (including the fund’s own assumptions used to determine the fair value of investments). Any investments valued with significant unobservable inputs are noted on the Statement of Net Assets.
50
Mega Cap Value Index Fund
The following table summarizes the market value of the fund’s investments and derivatives as of August 31, 2019, based on the inputs used to value them:
| Level 1 | Level 2 | Level 3 |
Investments | ($000) | ($000) | ($000) |
Common Stocks | 2,576,835 | — | — |
Temporary Cash Investments | 2 | 349 | — |
Futures Contracts—Liabilities1 | (3) | — | — |
Total | 2,576,834 | 349 | — |
1 Represents variation margin on the last day of the reporting period.
D. Permanent differences between book-basis and tax-basis components of net assets are reclassified among capital accounts in the financial statements to reflect their tax character. These reclassifications have no effect on net assets or net asset value per share. As of period end, permanent differences primarily attributable to the accounting for in-kind redemptions and the expiration of capital loss carryforwards were reclassified to the following accounts:
| Amount |
| ($000) |
Paid-in Capital | 189,032 |
Total Distributable Earnings (Loss) | (189,032) |
Temporary differences between book-basis and tax-basis components of total distributable earnings (loss) arise when certain items of income, gain, or loss are recognized in different periods for financial statement and tax purposes; these differences will reverse at some time in the future. The differences are primarily related to the tax deferral on wash sales and the realization of unrealized gains or losses on certain futures contracts. As of period end, the tax-basis components of total distributable earnings (loss) are detailed in the table as follows:
| Amount |
| ($000) |
Undistributed Ordinary Income | 14,005 |
Undistributed Long-Term Gains | — |
Capital Loss Carryforwards (Non-expiring)* | (31,808) |
Net Unrealized Gains (Losses) | 382,579 |
* The fund used capital loss carryforwards of $1,584,000 to offset taxable capital gains realized during the year ended August 31, 2019.
As of August 31, 2019, gross unrealized appreciation and depreciation for investments and derivatives based on cost for U.S. federal income tax purposes were as follows:
| Amount |
| ($000) |
Tax Cost | 2,194,607 |
Gross Unrealized Appreciation | 504,669 |
Gross Unrealized Depreciation | (122,090) |
Net Unrealized Appreciation (Depreciation) | 382,579 |
51
Mega Cap Value Index Fund
E. During the year ended August 31, 2019, the fund purchased $1,064,047,000 of investment securities and sold $705,406,000 of investment securities, other than temporary cash investments. Purchases and sales include $769,004,000 and $471,291,000, respectively, in connection with in-kind purchases and redemptions of the fund’s capital shares.
F. Capital share transactions for each class of shares were:
| Year Ended August 31, |
| | 2019 | | | 2018 |
| Amount | Shares | Amount | Shares |
| ($000) | (000) | ($000) | (000) |
ETF Shares | | | | |
Issued | 828,137 | 10,705 | 261,009 | 3,450 |
Issued in Lieu of Cash Distributions | — | — | — | — |
Redeemed | (476,540) | (6,225) | (104,626) | (1,375) |
Net Increase (Decrease)—ETF Shares | 351,597 | 4,480 | 156,383 | 2,075 |
Institutional Shares | | | | |
Issued | 24,632 | 157 | 100 | 1 |
Issued in Lieu of Cash Distributions | 1,944 | 13 | 1,611 | 11 |
Redeemed | (21,121) | (136) | (13,205) | (89) |
Net Increase (Decrease)—Institutional Shares | 5,455 | 34 | (11,494) | (77) |
At August 31, 2019, one shareholder was the record or beneficial owner of 25% of the fund’s net assets. If this shareholder were to redeem its investment in the fund, the redemption might result in an increase in the fund’s expense ratio, cause the fund to incur higher transaction costs, or lead to the realization of taxable capital gains.
G. Management has determined that no events or transactions occurred subsequent to August 31, 2019, that would require recognition or disclosure in these financial statements.
52
Report of Independent Registered Public Accounting Firm
To the Board of Trustees of Vanguard World Fund and Shareholders of Vanguard Mega Cap Index Fund, Vanguard Mega Cap Growth Index Fund and Vanguard Mega Cap Value Index Fund
Opinions on the Financial Statements
We have audited the accompanying statements of net assets of Vanguard Mega Cap Index Fund, Vanguard Mega Cap Growth Index Fund and Vanguard Mega Cap Value Index Fund (three of the funds constituting Vanguard World Fund, hereafter collectively referred to as the “Funds”) as of August 31, 2019, the related statements of operations for the year ended August 31, 2019, the statements of changes in net assets for each of the two years in the period ended August 31, 2019, including the related notes, and the financial highlights for each of the five years in the period ended August 31, 2019 (collectively referred to as the “financial statements”). In our opinion, the financial statements present fairly, in all material respects, the financial position of each of the Funds as of August 31, 2019, the results of each of their operations for the year then ended, the changes in each of their net assets for each of the two years in the period ended August 31, 2019 and each of the financial highlights for each of the five years in the period ended August 31, 2019 in conformity with accounting principles generally accepted in the United States of America.
Basis for Opinions
These financial statements are the responsibility of the Funds’ management. Our responsibility is to express an opinion on the Funds’ financial statements based on our audits. We are a public accounting firm registered with the Public Company Accounting Oversight Board (United States) (“PCAOB”) and are required to be independent with respect to the Funds in accordance with the U.S. federal securities laws and the applicable rules and regulations of the Securities and Exchange Commission and the PCAOB.
We conducted our audits of these financial statements in accordance with the standards of the PCAOB. Those standards require that we plan and perform the audit to obtain reasonable assurance about whether the financial statements are free of material misstatement, whether due to error or fraud.
Our audits included performing procedures to assess the risks of material misstatement of the financial statements, whether due to error or fraud, and performing procedures that respond to those risks. Such procedures included examining, on a test basis, evidence regarding the amounts and disclosures in the financial statements. Our audits also included evaluating the accounting principles used and significant estimates made by management, as well as evaluating the overall presentation of the financial statements. Our procedures included confirmation of securities owned as of August 31, 2019 by correspondence with the custodian and brokers and by agreement to the underlying ownership records of the transfer agent; when replies were not received from brokers, we performed other auditing procedures. We believe that our audits provide a reasonable basis for our opinions.
/s/PricewaterhouseCoopers LLP
Philadelphia, Pennsylvania
October 18, 2019
We have served as the auditor of one or more investment companies in The Vanguard Group of Funds since 1975.
53
Special 2019 tax information (unaudited) for Vanguard Mega Cap Index Funds
This information for the fiscal year ended August 31, 2019, is included pursuant to provisions of the Internal Revenue Code.
The funds distributed qualified dividend income to shareholders during the fiscal year as follows:
Fund | ($000) |
Mega Cap Index Fund | 36,612 |
Mega Cap Growth Index Fund | 34,088 |
Mega Cap Value Index Fund | 67,993 |
For corporate shareholders, the percentage of investment income (dividend income plus short-term gains, if any) that qualifies for the dividends-received deduction is as follows:
Fund | Percentage |
Mega Cap Index Fund | 97.9% |
Mega Cap Growth Index Fund | 100.0 |
Mega Cap Value Index Fund | 100.0 |
54
Trustees Approve Advisory Arrangements
The board of trustees of Vanguard Mega Cap Index Fund, Vanguard Mega Cap Growth Index Fund, and Vanguard Mega Cap Value Index Fund has renewed each fund’s investment advisory arrangement with The Vanguard Group, Inc. (Vanguard), through its Equity Index Group. The board determined that continuing each fund’s internalized management structure was in the best interests of the fund and its shareholders.
The board based its decision upon an evaluation of the advisor’s investment staff, portfolio management process, and performance. This evaluation included information provided to the board by Vanguard’s Portfolio Review Department, which is responsible for fund and advisor oversight and product management. The Portfolio Review Department met regularly with the advisor and made monthly presentations to the board during the fiscal year that directed the board’s focus to relevant information and topics.
The board, or an investment committee made up of board members, also received information throughout the year through advisor presentations. For each advisor presentation, the board was provided with letters and reports that included information about, among other things, the advisory firm and the advisor’s assessment of the investment environment, portfolio performance, and portfolio characteristics.
In addition, the board received monthly reports, which included a Market and Economic Report, a Fund Dashboard Monthly Summary, and a Fund Performance Report.
Prior to their meeting, the trustees were provided with a memo and materials that summarized the information they received over the course of the year. They also considered the factors discussed below, among others. However, no single factor determined whether the board approved the arrangements. Rather, it was the totality of the circumstances that drove the board’s decision.
Nature, extent, and quality of services
The board reviewed the quality of each fund’s investment management services over both the short and long term, and took into account the organizational depth and stability of the advisor. The board considered that Vanguard has been managing investments for more than four decades. The Equity Index Group adheres to a sound, disciplined investment management process; the team has considerable experience, stability, and depth.
The board concluded that Vanguard’s experience, stability, depth, and performance, among other factors, warranted continuation of each advisory arrangement.
Investment performance
The board considered the short- and long-term performance of each fund, including any periods of outperformance or underperformance compared with its target index and peer group. The board concluded that the performance was such that each advisory arrangement should continue.
Cost
The board concluded that each fund’s expense ratio was well below the average expense ratio charged by funds in its peer group and that each fund’s advisory expenses were also well below the peer-group average.
55
The board does not conduct a profitability analysis of Vanguard because of Vanguard’s unique structure. Unlike most other mutual fund management companies, Vanguard is owned by the funds it oversees.
The benefit of economies of scale
The board concluded that each fund’s arrangement with Vanguard ensures that the funds will realize economies of scale as they grow, with the cost to shareholders declining as fund assets increase.
The board will consider whether to renew the advisory arrangements again after a one-year period.
56
The CRSP US Mega Cap Index, CRSP US Mega Cap Growth Index, and CRSP US Mega Cap Value Index (the “Indexes”) are products of the Center for Research in Security Prices (“CRSP”) at the Booth School of Business of the University of Chicago (“University”), and have been licensed for use by Vanguard. CRSP® is a trademark of the University and has been licensed by the University for use for certain purposes by Vanguard. Vanguard Mega Cap Index Fund, Mega Cap Growth Index Fund, and Mega Cap Value Index Fund are not sponsored, endorsed, sold or promoted by the University. The University makes no representation or warranty, express or implied, to the owners of Vanguard Mega Cap Index Fund, Mega Cap Growth Index Fund, and Mega Cap Value Index Fund or any member of the public regarding the advisability of investing in securities generally or in Vanguard Mega Cap Index Fund, Mega Cap Growth Index Fund, and Mega Cap Value Index Fund particularly or the ability of the Indexes to track general market performance. The Indexes are determined, composed and calculated without regard to Vanguard or Vanguard Mega Cap Index Fund, Mega Cap Growth Index Fund, and Mega Cap Value Index Fund. The University has no obligation to take the needs of Vanguard or the owners of Vanguard Mega Cap Index Fund, Mega Cap Growth Index Fund, and Mega Cap Value Index Fund into consideration in determining, composing or calculating the Index. The University is not responsible for and has not participated in the determination of the prices, and amount of Vanguard Mega Cap Index Fund, Mega Cap Growth Index Fund, and Mega Cap Value Index Fund or the timing of the issuance or sale of Vanguard Mega Cap Index Fund, Mega Cap Growth Index Fund, and Mega Cap Value Index Fund or in the determination or calculation of the equation by which Vanguard Mega Cap Index Fund, Mega Cap Growth Index Fund, and Mega Cap Value Index Fund are to be converted into cash, surrendered or redeemed, as the case may be. The University has no obligation or liability in connection with the administration, marketing or trading of Vanguard Mega Cap Index Fund, Mega Cap Growth Index Fund, and Mega Cap Value Index Fund. There is no assurance that investment products based on the Indexes will accurately track index performance or provide positive investment returns. The University is not an investment advisor. Inclusion of a security within an index is not a recommendation by the University to buy, sell, or hold such security, nor is it considered to be investment advice.
THE UNIVERSITY DOES NOT GUARANTEE THE ADEQUACY, ACCURACY, TIMELINESS AND/OR THE COMPLETENESS OF THE INDEXES OR ANY DATA RELATED THERETO OR ANY COMMUNICATION, INCLUDING BUT NOT LIMITED TO, ORAL OR WRITTEN COMMUNICATION (INCLUDING ELECTRONIC COMMUNICATIONS) WITH RESPECT THERETO. THE UNIVERSITY SHALL NOT BE SUBJECT TO ANY DAMAGES OR LIABILITY FOR ANY ERRORS, OMISSIONS, OR DELAYS THEREIN. THE UNIVERSITY MAKES NO EXPRESS OR IMPLIED WARRANTIES, AND EXPRESSLY DISCLAIMS ALL WARRANTIES, OF MERCHANTABILITY OR FITNESS FOR A PARTICULAR PURPOSE OR USE OR AS TO RESULTS TO BE OBTAINED BY VANGUARD, OWNERS OF VANGUARD MEGA CAP INDEX FUND, MEGA CAP GROWTH INDEX FUND, AND MEGA CAP VALUE INDEX FUND, OR ANY OTHER PERSON OR ENTITY FROM THE USE OF THE INDEXES OR WITH RESPECT TO ANY DATA RELATED THERETO. WITHOUT LIMITING ANY OF THE FOREGOING, IN NO EVENT WHATSOEVER SHALL THE UNIVERSITY BE LIABLE FOR ANY INDIRECT, SPECIAL, INCIDENTAL, PUNITIVE, OR CONSEQUENTIAL DAMAGES INCLUDING BUT NOT LIMITED TO, LOSS OF PROFITS, TRADING LOSSES, LOST TIME OR GOODWILL, EVEN IF IT HAS BEEN ADVISED OF THE POSSIBILITY OF SUCH DAMAGES, WHETHER IN CONTRACT, TORT, STRICT LIABILITY, OR OTHERWISE. THERE ARE NO THIRD PARTY BENEFICIARIES OF ANY AGREEMENTS OR ARRANGEMENTS BETWEEN THE UNIVERSITY AND VANGUARD, OTHER THAN THE LICENSORS, IF ANY, OF THE UNIVERSITY.
57
This page intentionally left blank.
The People Who Govern Your Fund
The trustees of your mutual fund are there to see that the fund is operated and managed in your best interests since, as a shareholder, you are a part owner of the fund. Your fund’s trustees also serve on the board of directors of The Vanguard Group, Inc., which is owned by the Vanguard funds and provides services to them.
A majority of Vanguard’s board members are independent, meaning that they have no affiliation with Vanguard or the funds they oversee, apart from the sizable personal investments they have made as private individuals. The independent board members have distinguished backgrounds in business, academia, and public service. Each of the trustees and executive officers oversees 212 Vanguard funds.
Information for each trustee and executive officer of the fund appears below. The mailing address of the trustees and officers is P.O. Box 876, Valley Forge, PA 19482. More information about the trustees is in the Statement of Additional Information, which can be obtained, without charge, by contacting Vanguard at 800-662-7447, or online at vanguard.com.
Interested Trustee1
Mortimer J. Buckley
Born in 1969. Trustee since January 2018. Principal occupation(s) during the past five years and other experience: chairman of the board (January 2019–present) of Vanguard and of each of the investment companies served by Vanguard; chief executive officer (January 2018–present) of Vanguard; chief executive officer, president, and trustee (January 2018–present) of each of the investment companies served by Vanguard; president and director (2017–present) of Vanguard; and president (February 2018–present) of Vanguard Marketing Corporation. Chief investment officer (2013–2017), managing director (2002–2017), head of the Retail Investor Group (2006–2012), and chief information officer (2001–2006) of Vanguard. Chairman of the board (2011–2017) and trustee (2009–2017) of the Children’s Hospital of Philadelphia; trustee (2018–present) of The Shipley School.
Independent Trustees
Emerson U. Fullwood
Born in 1948. Trustee since January 2008. Principal occupation(s) during the past five years and other experience: executive chief staff and marketing officer for North America and corporate vice president (retired 2008) of Xerox Corporation (document management products and services). Former president of the Worldwide Channels Group, Latin America, and Worldwide Customer Service and executive chief staff officer of Developing Markets of Xerox. Executive in residence and 2009–2010 Distinguished Minett Professor at the Rochester Institute of Technology. Director of SPX FLOW, Inc. (multi-industry manufacturing). Director of the University of Rochester Medical Center, the Monroe Community College Foundation, the United Way of Rochester, North Carolina A&T University, and Roberts Wesleyan College. Trustee of the University of Rochester.
Amy Gutmann
Born in 1949. Trustee since June 2006. Principal occupation(s) during the past five years and other experience: president (2004–present) of the University of Pennsylvania. Christopher H. Browne Distinguished Professor of Political Science, School of Arts and Sciences, and professor of communication, Annenberg School for Communication, with secondary faculty appointments in the Department of Philosophy, School of Arts and Sciences, and at the Graduate School of Education, University of Pennsylvania. Trustee of the National Constitution Center.
F. Joseph Loughrey
Born in 1949. Trustee since October 2009. Principal occupation(s) during the past five years and other experience: president and chief operating officer (retired 2009) and vice chairman of the board (2008–2009) of Cummins Inc. (industrial machinery). Chairman of the board of Hillenbrand, Inc. (specialized consumer services), and the Lumina Foundation.
1 Mr. Buckley is considered an “interested person,” as defined in the Investment Company Act of 1940, because he is an officer of the Vanguard funds.
Director of the V Foundation and Oxfam America. Member of the advisory council for the College of Arts and Letters and chair of the advisory board to the Kellogg Institute for International Studies, both at the University of Notre Dame.
Mark Loughridge
Born in 1953. Trustee since March 2012. Principal occupation(s) during the past five years and other experience: senior vice president and chief financial officer (retired 2013) of IBM (information technology services). Fiduciary member of IBM’s Retirement Plan Committee (2004–2013), senior vice president and general manager (2002–2004) of IBM Global Financing, vice president and controller (1998–2002) of IBM, and a variety of other prior management roles at IBM. Member of the Council on Chicago Booth.
Scott C. Malpass
Born in 1962. Trustee since March 2012. Principal occupation(s) during the past five years and other experience: chief investment officer (1989–present) and vice president (1996–present) of the University of Notre Dame. Assistant professor of finance at the Mendoza College of Business, University of Notre Dame, and member of the Notre Dame 403(b) Investment Committee. Chairman of the board of TIFF Advisory Services, Inc. Member of the board of Catholic Investment Services, Inc. (investment advisors) and the board of superintendence of the Institute for the Works of Religion.
Deanna Mulligan
Born in 1963. Trustee since January 2018. Principal occupation(s) during the past five years and other experience: president (2010–present) and chief executive officer (2011–present) of The Guardian Life Insurance Company of America. Chief operating officer (2010–2011) and executive vice president (2008–2010) of Individual Life and Disability of The Guardian Life Insurance Company of America. Member of the board of The Guardian Life Insurance Company of America, the American Council of Life Insurers, the Partnership for New York City (business leadership), and the Committee Encouraging Corporate Philanthropy. Trustee of the Economic Club of New York and the Bruce Museum (arts and science). Member of the Advisory Council for the Stanford Graduate School of Business.
André F. Perold
Born in 1952. Trustee since December 2004. Principal occupation(s) during the past five years and other experience: George Gund Professor of Finance and Banking, Emeritus at the Harvard Business School (retired 2011). Chief investment officer and co-managing partner of HighVista Strategies LLC (private investment firm). Board of advisors and investment committee member of the Museum of Fine Arts Boston. Board member (2018–present) of RIT Capital Partners (investment firm); investment committee member of Partners Health Care System.
Sarah Bloom Raskin
Born in 1961. Trustee since January 2018. Principal occupation(s) during the past five years and other experience: deputy secretary (2014–2017) of the United States Department of the Treasury. Governor (2010–2014) of the Federal Reserve Board. Commissioner (2007–2010) of financial regulation for the State of Maryland. Member of the board of directors (2012–2014) of Neighborhood Reinvestment Corporation. Director (2017–present) of i(x) Investments, LLC; director (2017–present) of Reserve Trust. Rubinstein Fellow (2017–present) of Duke University; trustee (2017–present) of Amherst College.
Peter F. Volanakis
Born in 1955. Trustee since July 2009. Principal occupation(s) during the past five years and other experience: president and chief operating officer (retired 2010) of Corning Incorporated (communications equipment) and director of Corning Incorporated (2000–2010) and Dow Corning (2001–2010). Director (2012) of SPX Corporation (multi-industry manufacturing). Overseer of the Amos Tuck School of Business Administration, Dartmouth College (2001–2013). Chairman of the board of trustees of Colby-Sawyer College. Member of the board of Hypertherm Inc. (industrial cutting systems, software, and consumables).
Executive Officers
Glenn Booraem
Born in 1967. Principal occupation(s) during the past five years and other experience: principal of Vanguard. Investment stewardship officer (2017–present), treasurer (2015–2017), controller (2010–2015), and assistant controller (2001–2010) of each of the investment companies served by Vanguard.
Christine M. Buchanan
Born in 1970. Principal occupation(s) during the past five years and other experience: principal of Vanguard and global head of Fund Administration at Vanguard. Treasurer (2017–present) of each of the investment companies served by Vanguard. Partner (2005–2017) at KPMG LLP (audit, tax, and advisory services).
Thomas J. Higgins
Born in 1957. Principal occupation(s) during the past five years and other experience: principal of Vanguard. Chief financial officer (2008–present) and treasurer (1998–2008) of each of the investment companies served by Vanguard.
Peter Mahoney
Born in 1974. Principal occupation(s) during the past five years and other experience: principal of Vanguard. Controller (2015–present) of each of the investment companies served by Vanguard. Head of International Fund Services (2008–2014) at Vanguard.
Anne E. Robinson
Born in 1970. Principal occupation(s) during the past five years and other experience: general counsel (2016–present) of Vanguard. Secretary (2016–present) of Vanguard and of each of the investment companies served by Vanguard. Managing director (2016–present) of Vanguard. Director and senior vice president (2016–2018) of Vanguard Marketing Corporation. Managing director and general counsel of Global Cards and Consumer Services (2014–2016) at Citigroup. Counsel (2003–2014) at American Express.
Michael Rollings
Born in 1963. Principal occupation(s) during the past five years and other experience: finance director (2017–present) and treasurer (2017) of each of the investment companies served by Vanguard. Managing director (2016–present) of Vanguard. Chief financial officer (2016–present) of Vanguard. Director (2016–present) of Vanguard Marketing Corporation. Executive vice president and chief financial officer (2006–2016) of MassMutual Financial Group.
John E. Schadl
Born in 1972. Principal occupation(s) during the past five years and other experience: principal of Vanguard. Chief compliance officer (2019–present) of Vanguard and of each of the investment companies served by Vanguard. Assistant vice president (May 2019–present) of Vanguard Marketing Corporation.
Vanguard Senior Management Team
Joseph Brennan | Chris D. McIsaac |
Mortimer J. Buckley | James M. Norris |
Gregory Davis | Thomas M. Rampulla |
John James | Karin A. Risi |
Martha G. King | Anne E. Robinson |
John T. Marcante | Michael Rollings |
| 
|
| |
| P.O. Box 2600 |
| Valley Forge, PA 19482-2600 |
Connect with Vanguard® > vanguard.com
Fund Information > 800-662-7447
Direct Investor Account Services > 800-662-2739
Institutional Investor Services > 800-523-1036
Text Telephone for People
Who Are Deaf or Hard of Hearing > 800-749-7273
This material may be used in conjunction with the offering of shares of any Vanguard fund only if preceded or accompanied by the fund’s current prospectus.
All comparative mutual fund data are from Morningstar, Inc., unless otherwise noted.
You can obtain a free copy of Vanguard’s proxy voting guidelines by visiting vanguard.com/proxyreporting or by calling Vanguard at 800-662-2739. The guidelines are also available from the SEC’s website, www.sec.gov. In addition, you may obtain a free report on how your fund voted the proxies for securities it owned during the 12 months ended June 30. To get the report, visit either vanguard.com/proxyreporting or www.sec.gov.
You can review information about your fund on the SEC’s website, and you can receive copies of this information, for a fee, by sending a request via email addressed to publicinfo@sec.gov.
Source for Bloomberg Barclays indexes: Bloomberg Index Services Limited. Copyright 2019, Bloomberg. All rights reserved.
| © 2019 The Vanguard Group, Inc. |
| All rights reserved. |
| U.S. Patent Nos. 6,879,964; 7,337,138; |
| 7,720,749; 7,925,573; 8,090,646; 8,417,623; and 8,626,636. |
| Vanguard Marketing Corporation, Distributor. |
| |
| Q8280 102019 |

Annual Report | August 31, 2019 Vanguard Global Wellington™ Fund |
See the inside front cover for important information about access to your fund’s annual and semiannual shareholder reports. |
Important information about access to shareholder reports
Beginning on January 1, 2021, as permitted by regulations adopted by the Securities and Exchange Commission, paper copies of your fund’s annual and semiannual shareholder reports will no longer be sent to you by mail, unless you specifically request them. Instead, you will be notified by mail each time a report is posted on the website and will be provided with a link to access the report.
If you have already elected to receive shareholder reports electronically, you will not be affected by this change and do not need to take any action. You may elect to receive shareholder reports and other communications from the fund electronically by contacting your financial intermediary (such as a broker-dealer or bank) or, if you invest directly with the fund, by calling Vanguard at one of the phone numbers on the back cover of this report or by logging on to vanguard.com.
You may elect to receive paper copies of all future shareholder reports free of charge. If you invest through a financial intermediary, you can contact the intermediary to request that you continue to receive paper copies. If you invest directly with the fund, you can call Vanguard at one of the phone numbers on the back cover of this report or log on to vanguard.com. Your election to receive paper copies will apply to all the funds you hold through an intermediary or directly with Vanguard.
A Note From Our Chairman | 1 |
Your Fund’s Performance at a Glance | 2 |
Advisors’ Report | 3 |
About Your Fund’s Expenses | 9 |
Performance Summary | 11 |
Financial Statements | 13 |
Please note: The opinions expressed in this report are just that—informed opinions. They should not be considered promises or advice. Also, please keep in mind that the information and opinions cover the period through the date on the front of this report. Of course, the risks of investing in your fund are spelled out in the prospectus.
A Note From Our Chairman

Tim Buckley
Chairman and Chief Executive Officer
Dear Shareholder,
Recent volatility in financial markets—affecting stocks, bonds, and commodities—has been a good reminder of the wise old adage, “Never keep all your eggs in one basket.” Maintaining balance and diversification in your investment portfolio can help to both limit risk and set you up for long-term success.
It’s understandable why some investors might become complacent after a long market run-up like the one that lifted stock prices, especially U.S. stock prices, in the years following the global financial crisis. But failing to rebalance regularly can leave a portfolio with a much different mix of assets than intended and, often, more risk than intended.
Balance across and diversification within asset classes are powerful tools for managing risk and achieving your investment goals. A portfolio’s allocation will determine a large portion of its long-term return and also the majority of its volatility risk. A well-diversified portfolio is less vulnerable to significant swings in the performance of any one segment of the asset classes in which it invests.
Balance and diversification will never eliminate the risk of loss, nor will they guarantee positive returns in a declining market. But they should reduce the chance that you’ll suffer disproportionate losses in one particular high-flying asset class or sector when it comes back to earth. And exposure to all key market components should give you at least some participation in the sectors that are performing best at any given time.
Vanguard is committed to helping you achieve balance and diversification in your portfolios to help meet your investment goals. We thank you for your continued loyalty.
Sincerely,

Mortimer J. Buckley
Chairman and Chief Executive Officer
October 1, 2019
1
Your Fund’s Performance at a Glance
· For the 12 months ended August 31, 2019, Vanguard Global Wellington Fund returned 6.80% for Investor Shares and 6.85% for Admiral Shares. Its benchmark returned 4.26%.
· Investors had to contend with bouts of market volatility sparked at times by signs of decelerating global growth, flare-ups in trade disputes, heightened international tensions with Iran, and a lack of agreement in the United Kingdom on how to exit the European Union.
· The fund’s outperformance in stocks versus its benchmark was broad-based: Its returns beat those of its benchmark in ten of the 11 industry sectors. Selection was especially strong in health care and industrials. By region, the United States, Switzerland, and the United Kingdom were bright spots.
· The fund also outperformed its fixed income benchmark, thanks in part to security selection in investment-grade bonds, and in industrials in particular.
Market Barometer | | | |
| Average Annual Total Returns |
| Periods Ended August 31, 2019 |
| One Year | Three Years | Five Years |
Stocks | | | |
Russell 1000 Index (Large-caps) | 2.49% | 12.57% | 9.85% |
Russell 2000 Index (Small-caps) | -12.89 | 7.89 | 6.41 |
Russell 3000 Index (Broad U.S. market) | 1.31 | 12.24 | 9.60 |
FTSE All-World ex US Index (International) | -3.18 | 5.97 | 1.71 |
| | | |
Bonds | | | |
Bloomberg Barclays U.S. Aggregate Bond Index (Broad taxable market) | 10.17% | 3.09% | 3.35% |
Bloomberg Barclays Municipal Bond Index (Broad tax-exempt market) | 8.72 | 3.30 | 3.85 |
FTSE Three-Month U.S. Treasury Bill Index | 2.36 | 1.47 | 0.91 |
| | | |
CPI | | | |
Consumer Price Index | 1.75% | 2.13% | 1.53% |
2
Advisor’s Report
Vanguard Global Wellington Fund returned 6.80% for Investor Shares and 6.85% for Admiral Shares for the 12 months ended August 31, 2019. The fund outperformed the 4.26% return of its custom benchmark, which is weighted 65% in the FTSE Developed Index (net of tax) and 35% in the Bloomberg Barclays Fixed Income Composite Index. The composite index consists of 80% Bloomberg Barclays Global Aggregate Credit Index (USD Hedged), 10% Bloomberg Barclays Global Aggregate Treasury Index (USD Hedged), and 10% Bloomberg Barclays Global Aggregate Securitized Index (USD Hedged).
The investment environment
Global equity markets produced mixed results for the period. The Standard & Poor’s 500 Index returned 2.92%, the FTSE Developed Index (net of tax) returned 0.14%, and the MSCI EAFE Index (net of tax) returned –3.26%.
In the fund’s equity benchmark, utilities, real estate, and consumer staples performed the best. Energy, financials, and materials declined the most over the period.
Equity markets experienced elevated volatility as the global economic cycle continued to decelerate and trade negotiations with China disrupted corporate investment decisions and inventory flows globally. Uncertainty in Europe continued as the U.K.’s path for Brexit implementation remained unresolved.
Defensive areas of the market performed well against this backdrop of uncertainty, benefiting our positioning, which is focused on providing downside protection at times of market stress. High volatility and fear in equity markets created opportunities in economically sensitive sectors and in companies domiciled outside the United States. Equity markets outside the United States are more pessimistic about economic prospects and persistent low interest rates, and equities of economically sensitive sectors are pricing in much of this negative news.
On the fixed income side, absolute returns across most major fixed income spread sectors were positive for the 12-month period, driven by a decrease in government bond yields. The decline in global sovereign yields accelerated in the latter part of the period amid prospects for deteriorating growth and dovish central bank policies. Geopolitical uncertainty remained elevated and global economic momentum slowed.
Monetary policy in the United States continued along a hawkish path for the first half of the period. The Federal Reserve raised rates twice in the second half of 2018 and signaled more rate increases to come. In early 2019, however, Fed policy pivoted in response to tepid economic data, trade policy uncertainty, and stubbornly low inflation. As concerns about growth in the United States increased, the Fed cut rates for the first time since 2008. Credit spreads remained generally stable early in the period
3
but widened significantly in the fourth quarter of 2018, fueled by concerns about an economic downturn. Credit spreads rebounded after the Fed pivot in early 2019, reversing much of the underperformance in late 2018.
Over the period, perceived safe-haven currencies like the U.S. dollar and the Japanese yen rallied against most currencies, while emerging-market currencies bore the brunt of the decline. The euro and the British pound also weakened amid domestic political uncertainty and divergence from the United States on monetary policy.
The U.S. fixed income market advanced over the period, with the Bloomberg Barclays U.S. Aggregate Bond Index returning 10.17%. Non-U.S. bonds returned 11.07%, as measured by the Bloomberg Barclays Global Aggregate ex-USD Hedged Index, and the Bloomberg Barclays U.S. Credit A or Better Index of higher-quality bonds returned 12.13%. The yield on the 10-year U.S. Treasury note fell to 1.50% at the end of August 2019 from 2.86% in August 2018.
The fund’s successes
In the equity portfolio, security selection aided performance while sector allocation was neutral. Our overweight to utilities and health care contributed to relative returns. Our underweight to materials also helped performance compared with the benchmark.
Top contributors to the equity portfolio’s relative performance over the period included American Tower, Novartis, Iberdrola, McDonald’s, and Nestlé, all of which we continue to hold.
For Novartis, business complexity and modest growth presented a great risk reward and an attractive opportunity for the portfolio. The company is simplifying and enhancing its focus on its core competency in innovative pharma. In addition to a pipeline of growth-enhancing new launches and a cultural shift at the top with a new CEO, the company is improving its capital allocation. Novartis has exited noncore segments of its business and is investing in new, innovative medicines.
Iberdrola is one of the best utility assets globally because of its large electric networks and extensive renewable-power business. We also view Iberdrola as an environmental, social, and governance leader that is well-positioned to take advantage of the energy transformation away from fossil fuels and toward a renewables-based, customer-empowered future.
We admire McDonald’s resilience and innovative culture. Through relentless drive to adapt, this brand has endured and developed a global reach. Menu innovation along with investment in store technology and appearance put McDonald’s on the path to further improve consumer appeal. It is nearing a point where it can reap these investments. We expect free-cash-flow
4
generation to improve as a result of declines in capital expenditures and as a benefit of refranchising that ushers in higher returns on capital. McDonald’s offers a defensive, countercyclical consumer discretionary profile with attractive upside, a strong balance sheet, and the expectation for increasing levels of capital return.
In the fixed income portfolio, security selection in corporate credit, specifically industrial sectors and banking, contributed to relative outperformance. The fund’s positioning in supranationals and local authority, as well as overall positioning in securitized sectors, particularly an allocation to collateralized mortgage obligations (CMOs), also aided relative performance.
The fund’s shortfalls
In the equity portfolio, security selection in the energy sector was the primary detractor from performance relative to the benchmark. Underweights to information technology and communication services detracted from benchmark-relative returns, as did overweights to financials and industrials. Top detractors from the equity portfolio’s relative performance over the period included Suncor Energy, Schlumberger, CaixaBank, and Isuzu Motors.
Suncor Energy, with its stable, long-life oil-sands resource, is being undervalued due to pipeline approval issues in Canada. Suncor is minimally affected by these pipeline issues because of captive refining capacity, and we believe its valuation should normalize. It has an attractive dividend yield that is sustainable in a scenario of oil prices under pressure, and a management culture centered on capital return. Suncor is the largest energy holding in the portfolio.
Japanese equities, including the portfolio’s holding in Isuzu Motors, lagged global developed-market returns over the period. We believe Isuzu Motors is facing a temporary slowdown in earnings because of product cycles and should return to normal business operations next fiscal year, making the stock attractive over the longer term. Isuzu Motors has a healthy balance sheet and a low dividend payout ratio that is increasing, adding to the attractiveness of total potential shareholder return.
In the fixed income portfolio, an overweight to and security selection within electric utilities detracted from returns. Within securitized sectors, security selection in 30-year mortgage-backed securities pass-throughs hindered performance. A modest out-of-benchmark allocation to Treasury Inflation-Protected Securities (TIPS) also detracted, as did lack of exposure to select developed-market government bonds. Duration and yield-curve positioning detracted from performance as rates fell.
The fund’s positioning and outlook
In the equity portfolio, our largest overweights at the end of the period were in industrials, health care, financials, and utilities. Our largest underweights were in information technology, communication services, and materials.
5
By region, the equity portfolio is overweighted to Europe, emerging markets, and Japan and underweighted to the United States, the Pacific basin excluding Japan, and Australia. This positioning is based on bottom-up stock-level analysis.
We expect volatility to continue amid slowing global growth, trade tariff uncertainty, and geopolitical turmoil. Central banks around the world do not have much room to make incremental rate cuts, and expectations for additional easing will be difficult to meet. As a result, we remain focused on reasonably priced stocks with dividend support and healthy balance sheets. Generally defensive positioning is warranted; however, we are finding great values in high-quality dividend-paying companies with some economic sensitivity and the portfolio is taking advantage of these mispricing opportunities in the market.
With a more dovish-leaning Fed, we have chosen to position the fixed income portfolio with a slightly longer duration relative to the benchmark. We are positioned with a cautious view of risk assets and have reduced exposure to corporate bonds with a bias toward holding higher-quality and lower-volatility issues.
Credit remains the main investment focus of the portfolio. We are underweight credit risk globally, but we are overweight the U.S. and favor higher-quality and less-cyclical sectors. We expect our significant positioning in those areas to benefit from global central bank policy and the global search for yield. Against this overweight to U.S. corporate credit, we are underweight U.K. credit given concerns about Brexit. We are also underweight euro-area credit and emerging markets given our concerns about the effect of a strong U.S. dollar, global liquidity withdrawal, and trade risks.
On an industry basis, the fixed income portfolio is currently overweight banks, but we have gradually reduced European banking exposure because of profitability concerns over the region’s lower rate environment and increased political risk. The fixed income portfolio is also overweight utilities because of attractive valuations and the sector’s potential to outperform when the cycle turns.
We are also overweight securitized sectors, such as asset-backed securities and commercial mortgage-backed securities, which offer attractive value and diversification relative to corporates. We have increased our mortgage positioning to an overweight as valuations have improved and we believe the sector offers potential downside protection. We remain underweight agency pass-throughs as we expect some interest rate volatility to continue. Instead, we favor CMOs, which have more stable cash flows. We also believe headline inflation will be supported by the recovery in energy prices and are positioned with long inflation breakevens via an allocation to TIPS.
We continue to maintain a modestly pro-cyclical risk posture. U.S. economic growth is slowing, but we believe the risk
6
of recession this year is low. The consumer remains resilient, while manufacturing has retrenched. As the market adapts to slower global growth, we expect reduced tail risk from the shift in global central bank policies.
Nataliya Kofman,
Managing Director and
Equity Portfolio Manager
Michael E. Stack, CFA,
Senior Managing Director and
Fixed Income Portfolio Manager
Loren L. Moran, CFA,
Senior Managing Director and
Fixed Income Portfolio Manager
Wellington Management Company LLP
September 23, 2019
7
About Your Fund’s Expenses
As a shareholder of the fund, you incur ongoing costs, which include costs for portfolio management, administrative services, and shareholder reports (like this one), among others. Operating expenses, which are deducted from a fund’s gross income, directly reduce the investment return of the fund.
A fund’s expenses are expressed as a percentage of its average net assets. This figure is known as the expense ratio. The following examples are intended to help you understand the ongoing costs (in dollars) of investing in your fund and to compare these costs with those of other mutual funds. The examples are based on an investment of $1,000 made at the beginning of the period shown and held for the entire period.
The accompanying table illustrates your fund’s costs in two ways:
· Based on actual fund return. This section helps you to estimate the actual expenses that you paid over the period. The “Ending Account Value” shown is derived from the fund’s actual return, and the third column shows the dollar amount that would have been paid by an investor who started with $1,000 in the fund. You may use the information here, together with the amount you invested, to estimate the expenses that you paid over the period.
To do so, simply divide your account value by $1,000 (for example, an $8,600 account value divided by $1,000 = 8.6), then multiply the result by the number given for your fund under the heading “Expenses Paid During Period.”
· Based on hypothetical 5% yearly return. This section is intended to help you compare your fund’s costs with those of other mutual funds. It assumes that the fund had a yearly return of 5% before expenses, but that the expense ratio is unchanged. In this case—because the return used is not the fund’s actual return—the results do not apply to your investment. The example is useful in making comparisons because the Securities and Exchange Commission requires all mutual funds to calculate expenses based on a 5% return. You can assess your fund’s costs by comparing this hypothetical example with the hypothetical examples that appear in shareholder reports of other funds.
Note that the expenses shown in the table are meant to highlight and help you compare ongoing costs only and do not reflect transaction costs incurred by the fund for buying and selling securities. Further, the expenses do not include any purchase, redemption, or account service fees described in the fund prospectus. If such fees were applied to your account, your costs would be higher. Your fund does not carry a “sales load.”
The calculations assume no shares were bought or sold during the period. Your actual costs may have been higher or lower, depending on the amount of your investment and the timing of any purchases or redemptions.
You can find more information about the fund’s expenses, including annual expense ratios, in the Financial Statements section of this report. For additional information on operating expenses and other shareholder costs, please refer to your fund’s current prospectus.
8
Six Months Ended August 31, 2019 | | | |
| Beginning | Ending | Expenses |
| Account Value | Account Value | Paid During |
Global Wellington Fund | 2/28/2019 | 8/31/2019 | Period |
Based on Actual Fund Return | | | |
Investor Shares | $1,000.00 | $1,066.64 | $2.40 |
Admiral™ Shares | 1,000.00 | 1,066.55 | 1.88 |
Based on Hypothetical 5% Yearly Return | | | |
Investor Shares | $1,000.00 | $1,022.89 | $2.35 |
Admiral Shares | 1,000.00 | 1,023.39 | 1.84 |
The calculations are based on expenses incurred in the most recent six-month period. The fund’s annualized six-month expense ratios for the period are 0.46% for Investor Shares and 0.36% for Admiral Shares. The dollar amounts shown as “Expenses Paid” are equal to the annualized expense ratio multiplied by the average account value over the period, multiplied by the number of days in the most recent six-month period, then divided by the number of days in the most recent 12-month period (184/365).
9
Global Wellington Fund
Performance Summary
All of the returns in this report represent past performance, which is not a guarantee of future results that may be achieved by the fund. (Current performance may be lower or higher than the performance data cited. For performance data current to the most recent month-end, visit our website at vanguard.com/performance.) Note, too, that both investment returns and principal value can fluctuate widely, so an investor’s shares, when sold, could be worth more or less than their original cost. The returns shown do not reflect taxes that a shareholder would pay on fund distributions or on the sale of fund shares.
Cumulative Performance: November 2, 2017, Through August 31, 2019
Initial Investment of $10,000
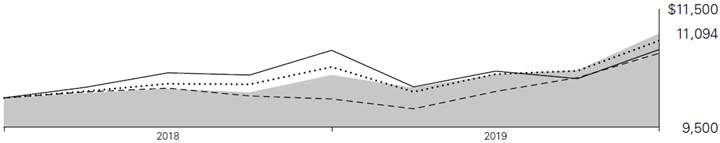
| | Average Annual Total Returns | | |
| | Periods Ended August 31, 2019 | | |
| | | | Since | | Final Value |
| | One | | Inception | | of a $10,000 |
| | Year | | (11/2/2017) | | Investment |

| Global Wellington Fund Investor Shares | | 6.80% | | 5.85% | | $11,094 |

| Global Wellington Composite Index | | 4.26 | | 5.21 | | 10,973 |

| Bloomberg Barclays Global Aggregate Bond Index | | 7.77 | | 4.08 | | 10,758 |

| FTSE Developed Net Tax Index | | 0.14 | | 4.42 | | 10,822 |
Global Wellington Composite Index: 65% FTSE Developed Index (net of tax) and 35% Bloomberg Barclays Fixed Income Composite Index, composed of 80% Bloomberg Barclays Global Aggregate Credit Index (USD Hedged), 10% Bloomberg Barclays Global Aggregate Treasury Index (USD Hedged), and 10% Bloomberg Barclays Global Aggregate Securitized Index (USD Hedged).
“Since Inception” performance is calculated from the Investor Shares’ inception date for both the fund and its comparative standards.
See Financial Highlights for dividend and capital gains information.
10
Global Wellington Fund
| | Average Annual Total Returns | | |
| | Periods Ended August 31, 2019 | | |
| | | | Since | | Final Value |
| | One | | Inception | | of a $50,000 |
| | Year | | (11/2/2017) | | Investment |
Global Wellington Fund Admiral Shares | | 6.85% | | 5.94% | | $55,556 |
Global Wellington Composite Index | | 4.26 | | 5.21 | | 54,866 |
Bloomberg Barclays Global Aggregate Bond Index | | 7.77 | | 4.08 | | 53,788 |
FTSE Developed Net Tax Index | | 0.14 | | 4.42 | | 54,110 |
“Since Inception” performance is calculated from the Admiral Shares’ inception date for both the fund and its comparative standards.
11
Global Wellington Fund
Sector Diversification
As of August 31, 2019
Equity Exposure | | |
Communication Services | | 5.3% |
Consumer Discretionary | | 11.4 |
Consumer Staples | | 8.7 |
Energy | | 5.3 |
Financials | | 17.0 |
Health Care | | 14.9 |
Industrials | | 16.8 |
Information Technology | | 10.8 |
Materials | | 1.7 |
Real Estate | | 3.4 |
Utilities | | 4.7 |
The table reflects the fund’s equity exposure, based on its investments in stocks and stock index futures. Any holdings in short-term reserves are excluded. Sector categories are based on the Global Industry Classification Standard (“GICS”), except for the “Other” category (if applicable), which includes securities that have not been provided a GICS classification as of the effective reporting period.
Fixed Income Exposure | | |
Asset-Backed | | 6.4% |
Commercial Mortgage-Backed | | 2.3 |
Finance | | 22.9 |
Foreign | | 12.3 |
Government Mortgage-Backed | | 6.5 |
Industrial | | 37.2 |
Treasury/Agency | | 3.7 |
Utilities | | 6.0 |
Other | | 2.7 |
The table reflects the fund’s market exposure. Any holdings in short-term reserves are excluded. The agency and mortgage-backed securities sectors may include issues from government-sponsored enterprises; such issues are generally not backed by the full faith and credit of the U.S. government.
The Global Industry Classification Standard (“GICS”) was developed by and is the exclusive property and a service mark of MSCI Inc. (“MSCI”) and Standard and Poor’s, a division of McGraw-Hill Companies, Inc. (“S&P”), and is licensed for use by Vanguard. Neither MSCI, S&P nor any third party involved in making or compiling the GICS or any GICS classification makes any express or implied warranties or representations with respect to such standard or classification (or the results to be obtained by the use thereof), and all such parties hereby expressly disclaim all warranties of originality, accuracy, completeness, merchantability or fitness for a particular purpose with respect to any such standard or classification. Without limiting any of the foregoing, in no event shall MSCI, S&P, any of its affiliates or any third party involved in making or compiling the GICS or any GICS classification have any liability for any direct, indirect, special, punitive, consequential or any other damages (including lost profits) even if notified of the possibility of such damages.
12
Global Wellington Fund
Financial Statements
Statement of Net Assets
As of August 31, 2019
The fund files its complete schedule of portfolio holdings with the Securities and Exchange Commission (SEC) for the first and third quarters of each fiscal year as an exhibit to its reports on Form N-PORT. The fund’s Form N-PORT reports are available on the SEC’s website at www.sec.gov.
| | | | | | Market | |
| | | | | | Value· | |
| | | | Shares | | ($000 | ) |
Common Stocks (64.8%) | | | | | |
Canada (2.7%) | | | | | |
| | Suncor Energy Inc. | | 469,228 | | 13,724 | |
| | Dollarama Inc. | | 201,339 | | 7,705 | |
| | Canadian National Railway Co. (New York Shares) | | 35,332 | | 3,255 | |
| | Bank of Nova Scotia | | 47,778 | | 2,542 | |
| | | | | | 27,226 | |
China (0.7%) | | | | | |
| | Shandong Weigao Group Medical Polymer Co. Ltd. | | 7,153,490 | | 7,364 | |
| | | | | | | |
France (4.5%) | | | | | |
| | Vinci SA | | 129,265 | | 14,123 | |
| | Legrand SA | | 113,245 | | 7,995 | |
| | TOTAL SA | | 152,930 | | 7,637 | |
| | Engie SA | | 388,662 | | 5,910 | |
| | Schneider Electric SE | | 63,533 | | 5,322 | |
| | BNP Paribas SA | | 79,397 | | 3,579 | |
| | | | | | 44,566 | |
Germany (0.5%) | | | | | |
| | Bayerische Motoren Werke AG | | 80,625 | | 5,392 | |
| | | | | | | |
Italy (0.2%) | | | | | |
| | Assicurazioni Generali SPA | | 133,876 | | 2,433 | |
| | | | | | | |
Japan (6.3%) | | | | | |
| | Tokio Marine Holdings Inc. | | 225,997 | | 11,623 | |
| | Marui Group Co. Ltd. | | 576,265 | | 11,462 | |
| | Seven & i Holdings Co. Ltd. | | 268,283 | | 9,488 | |
| | Isuzu Motors Ltd. | | 624,114 | | 6,703 | |
| | Mitsubishi UFJ Financial Group Inc. | | 1,328,822 | | 6,396 | |
| | Sumitomo Mitsui Financial Group Inc. | | 172,901 | | 5,666 | |
| | Daiwa House Industry Co. Ltd. | | 157,702 | | 4,940 | |
| | Nippon Telegraph & Telephone Corp. | | 102,672 | | 4,922 | |
| | Takeda Pharmaceutical Co. Ltd. | | 26,715 | | 901 | |
| | Eisai Co. Ltd. | | 10,495 | | 535 | |
| | | | | | 62,636 | |
Netherlands (1.8%) | | | | | |
| | Koninklijke Philips NV | | 222,612 | | 10,493 | |
| | ING Groep NV | | 558,563 | | 5,336 | |
| | ASML Holding NV | | 9,764 | | 2,172 | |
| | | | | | 18,001 | |
13
Global Wellington Fund
| | | | | | Market | |
| | | | | | Value· | |
| | | | Shares | | ($000 | ) |
South Korea (0.8%) | | | | | |
| | Samsung Electronics Co. Ltd. | | 208,786 | | 7,602 | |
| | | | | | | |
Spain (1.7%) | | | | | |
* | | Iberdrola SA | | 1,168,413 | | 12,028 | |
| | CaixaBank SA | | 2,332,995 | | 5,294 | |
| | | | | | 17,322 | |
Sweden (0.6%) | | | | | |
| | Lundin Petroleum AB | | 183,137 | | 5,584 | |
| | | | | | | |
Switzerland (5.7%) | | | | | |
| | Novartis AG | | 194,953 | | 17,576 | |
| | Nestle SA | | 149,833 | | 16,837 | |
| | Zurich Insurance Group AG | | 28,973 | | 10,325 | |
| | Julius Baer Group Ltd. | | 207,007 | | 8,216 | |
* | | Alcon Inc. | | 71,020 | | 4,319 | |
| | | | | | 57,273 | |
Taiwan (1.1%) | | | | | |
| | Taiwan Semiconductor Manufacturing Co. Ltd. | | 1,349,175 | | 11,086 | |
| | | | | | | |
United Kingdom (3.5%) | | | | | |
| | AstraZeneca plc ADR | | 220,505 | | 9,929 | |
| | Derwent London plc | | 170,886 | | 6,622 | |
| | Rotork plc | | 1,571,366 | | 5,941 | |
| | BAE Systems plc | | 811,587 | | 5,397 | |
| | Diageo plc | | 96,152 | | 4,117 | |
| | Prudential plc | | 192,667 | | 3,211 | |
| | | | | | 35,217 | |
United States (34.7%) | | | | | |
| | Chubb Ltd. | | 112,679 | | 17,609 | |
| | Medtronic plc | | 143,891 | | 15,524 | |
| | McDonald’s Corp. | | 65,879 | | 14,360 | |
| | General Dynamics Corp. | | 74,576 | | 14,264 | |
| | Microsoft Corp. | | 96,314 | | 13,278 | |
| | Verizon Communications Inc. | | 226,873 | | 13,195 | |
| | Sempra Energy | | 86,786 | | 12,291 | |
| | Lockheed Martin Corp. | | 31,451 | | 12,081 | |
| | Cisco Systems Inc. | | 257,615 | | 12,059 | |
| | Deere & Co. | | 77,438 | | 11,996 | |
| | Linde plc | | 60,286 | | 11,350 | |
| | Mondelez International Inc. Class A | | 200,821 | | 11,089 | |
| | Bank of America Corp. | | 401,995 | | 11,059 | |
| | American Tower Corp. | | 46,167 | | 10,627 | |
| | TJX Cos. Inc. | | 187,311 | | 10,296 | |
| | UnitedHealth Group Inc. | | 41,856 | | 9,794 | |
* | | Alphabet Inc. Class A | | 8,070 | | 9,608 | |
| | Autoliv Inc. | | 138,844 | | 9,497 | |
| | PepsiCo Inc. | | 68,848 | | 9,414 | |
| | United Parcel Service Inc. Class B | | 75,688 | | 8,981 | |
| | General Motors Co. | | 233,970 | | 8,678 | |
| | Merck & Co. Inc. | | 100,346 | | 8,677 | |
| | PNC Financial Services Group Inc. | | 57,821 | | 7,455 | |
| | Union Pacific Corp. | | 40,609 | | 6,577 | |
14
Global Wellington Fund
| | | | | | Market | |
| | | | | | Value· | |
| | | | Shares | | ($000 | ) |
| | Texas Instruments Inc. | | 53,076 | | 6,568 | |
| | Comcast Corp. Class A | | 144,306 | | 6,387 | |
| | KLA Corp. | | 42,321 | | 6,259 | |
| | Accenture plc Class A | | 31,426 | | 6,228 | |
| | JPMorgan Chase & Co. | | 53,146 | | 5,839 | |
| | Colgate-Palmolive Co. | | 75,518 | | 5,600 | |
| | Abbott Laboratories | | 62,328 | | 5,318 | |
| | Caterpillar Inc. | | 43,581 | | 5,186 | |
| | Intel Corp. | | 109,324 | | 5,183 | |
| | Honeywell International Inc. | | 29,517 | | 4,859 | |
| | Marsh & McLennan Cos. Inc. | | 39,689 | | 3,965 | |
| | Gilead Sciences Inc. | | 61,199 | | 3,889 | |
| | Schlumberger Ltd. | | 116,551 | | 3,780 | |
| | Chevron Corp. | | 29,599 | | 3,484 | |
| | United Technologies Corp. | | 24,791 | | 3,229 | |
| | Bristol-Myers Squibb Co. | | 46,918 | | 2,255 | |
| | | | | | 347,788 | |
Total Common Stocks (Cost $603,409) | | | | 649,490 | |
| | | Coupon | | Maturity
Date | | Face
Amount
($000 | ) | | |
U.S. Government and Agency Obligations (4.2%) | | | | | | | | | |
United States (4.2%) | | | | | | | | | |
1,2 | Fannie Mae Pool | | 3.000% | | 8/1/34–8/1/49 | | 3,598 | | 3,681 | |
1,2 | Fannie Mae Pool | | 4.000% | | 12/1/48 | | 1,262 | | 1,312 | |
1,2,3 | Fannie Mae Pool | | 3.500% | | 8/1/49–9/1/49 | | 6,596 | | 6,785 | |
1,2 | Fannie Mae REMICS | | 2.000% | | 9/25/40 | | 144 | | 144 | |
1,2 | Fannie Mae REMICS | | 3.500% | | 6/25/44–6/25/59 | | 2,994 | | 3,204 | |
1,2 | Fannie Mae REMICS | | 2.500% | | 5/25/45–3/25/53 | | 1,103 | | 1,116 | |
1,2 | Freddie Mac Gold Pool | | 3.000% | | 11/1/47–12/1/47 | | 2,214 | | 2,262 | |
1,2 | Freddie Mac Gold Pool | | 3.500% | | 11/1/47–12/1/47 | | 6,258 | | 6,487 | |
1,2 | Freddie Mac Gold Pool | | 4.000% | | 10/1/48–12/1/48 | | 1,267 | | 1,314 | |
1,2 | Freddie Mac REMICS | | 4.000% | | 12/15/39–8/15/40 | | 1,334 | | 1,425 | |
1,2 | Freddie Mac REMICS | | 3.500% | | 9/15/40–11/15/40 | | 474 | | 487 | |
1,2 | Freddie Mac REMICS | | 1.750% | | 9/15/42 | | 1,258 | | 1,239 | |
1 | Government National Mortgage Assn. | | 2.750% | | 9/20/44 | | 255 | | 261 | |
1,3 | UMBS TBA | | 3.000% | | 9/1/34 | | 169 | | 173 | |
| United States Treasury Inflation Indexed Bonds | | 0.750% | | 7/15/28 | | 1,510 | | 1,647 | |
| United States Treasury Note/Bond | | 1.500% | | 10/31/19 | | 265 | | 265 | |
| United States Treasury Note/Bond | | 2.500% | | 3/31/23 | | 1,560 | | 1,619 | |
| United States Treasury Note/Bond | | 2.750% | | 7/31/23 | | 785 | | 824 | |
| United States Treasury Note/Bond | | 1.750% | | 6/30/24 | | 1,510 | | 1,534 | |
| United States Treasury Note/Bond | | 2.375% | | 5/15/29 | | 2,735 | | 2,949 | |
4 | United States Treasury Note/Bond | | 2.750% | | 11/15/47 | | 580 | | 679 | |
| United States Treasury Note/Bond | | 2.875% | | 5/15/49 | | 1,805 | | 2,176 | |
| United States Treasury Strip Principal | | 0.000% | | 5/15/47 | | 660 | | 378 | |
| United States Treasury Strip Principal | | 0.000% | | 8/15/47 | | 755 | | 430 | |
Total U.S. Government and Agency Obligations (Cost $40,909) | | | | 42,391 | |
Asset-Backed/Commercial Mortgage-Backed Securities (2.1%) | | | | | |
Australia (0.1%) | | | | | | | | | |
5 | National Australia Bank Ltd. | | 2.400% | | 12/7/21 | | 575 | | 582 | |
15
Global Wellington Fund
| | | Coupon | | Maturity
Date | | Face
Amount
($000 | ) | Market
Value·
($000 | ) |
Bermuda (0.0%) | | | | | | | | | |
1,5 | START Ireland | | 4.089% | | 3/15/44 | | 243 | | 249 | |
| | | | | | | | | |
Canada (0.3%) | | | | | | | | | |
1,5,6 | CARDS II Trust 2017-2A, 1M USD LIBOR + 0.260% | | 2.455% | | 10/17/22 | | 720 | | 720 | |
5,7 | Ford Auto Securitization Trust | | 2.354% | | 6/15/23 | | 2,005 | | 1,504 | |
1,5,6 | Master Credit Card Trust II Series 2018-1A, 1M USD LIBOR + 0.490% | | 2.659% | | 7/21/24 | | 765 | | 763 | |
| | | | | | | | 2,987 | |
Cayman Islands (0.6%) | | | | | | | | | |
1,5,6 | Atlas Senior Loan Fund V Ltd., 3M USD LIBOR + 1.260% | | 3.582% | | 7/16/29 | | 750 | | 748 | |
1,5,6 | KKR CLO 16 Ltd., 3M USD LIBOR + 1.250% | | 3.528% | | 1/20/29 | | 360 | | 360 | |
1,5,6 | KKR CLO 17 Ltd., 3M USD LIBOR + 1.340% | | 3.643% | | 4/15/29 | | 730 | | 730 | |
1,5,6 | Madison Park Funding XVIII Ltd., 3M USD LIBOR + 1.190% | | 3.468% | | 10/21/30 | | 730 | | 728 | |
1,5,6 | Madison Park Funding XXX Ltd., 3M USD LIBOR + 0.750% | | 3.053% | | 4/15/29 | | 1,400 | | 1,385 | |
1,5,6 | Magnetite VII Ltd., 3M USD LIBOR + 0.800% | | 3.103% | | 1/15/28 | | 1,375 | | 1,365 | |
1,5,6 | Race Point IX CLO Ltd., 3M USD LIBOR + 1.210% | | 3.513% | | 10/15/30 | | 730 | | 729 | |
| | | | | | | | | 6,045 | |
Spain (0.1%) | | | | | | | | | |
8 | Bankia SA | | 4.125% | | 3/24/36 | | 850 | | 1,513 | |
| | | | | | | | | |
United States (1.0%) | | | | | | | | | |
1,5 | Aaset 2019-1 Trust | | 3.844% | | 5/15/39 | | 244 | | 246 | |
1,5 | Angel Oak Mortgage Trust I LLC 2018-3 | | 3.649% | | 9/25/48 | | 534 | | 540 | |
1,5 | ARI Fleet Lease Trust 2018-A | | 2.550% | | 10/15/26 | | 154 | | 154 | |
1,5,6 | Bristol Park CLO Ltd., 3M USD LIBOR + 1.420% | | 3.723% | | 4/15/29 | | 685 | | 686 | |
1,5 | Castlelake Aircraft Securitization Trust 2019-1 | | 3.967% | | 4/15/39 | | 267 | | 271 | |
1,5 | Chesapeake Funding II LLC 2017-2A | | 1.990% | | 5/15/29 | | 320 | | 319 | |
1,5 | Chesapeake Funding II LLC 2018-2A | | 3.230% | | 8/15/30 | | 727 | | 739 | |
1,5 | Chrysler Capital Auto Receivables Trust 2016-A | | 3.250% | | 6/15/22 | | 245 | | 245 | |
1,5 | COLT 2018-1 Mortgage Loan Trust | | 2.930% | | 2/25/48 | | 108 | | 109 | |
1,5 | COLT 2018-3 Mortgage Loan Trust | | 3.692% | | 10/26/48 | | 165 | | 167 | |
1,5 | DB Master Finance LLC | | 3.787% | | 5/20/49 | | 145 | | 150 | |
1,5 | DB Master Finance LLC | | 4.021% | | 5/20/49 | | 125 | | 131 | |
1,5 | Deephaven Residential Mortgage Trust 2018-1 | | 2.976% | | 12/25/57 | | 199 | | 199 | |
1,5 | Enterprise Fleet Financing LLC Series 2018-1 | | 2.870% | | 10/20/23 | | 531 | | 534 | |
1,5 | First Investors Auto Owner Trust | | 2.000% | | 3/15/22 | | 59 | | 59 | |
1,5 | First Investors Auto Owner Trust | | 2.410% | | 12/15/22 | | 120 | | 120 | |
1,5 | First Investors Auto Owner Trust 2016-1 | | 3.410% | | 4/18/22 | | 726 | | 728 | |
1,5 | GreatAmerica Leasing Receivables Funding LLC Series 2018-1 | | 2.600% | | 6/15/21 | | 255 | | 256 | |
1,5 | GreatAmerica Leasing Receivables Funding LLC Series 2018-1 | | 2.830% | | 6/17/24 | | 167 | | 169 | |
1,5 | Horizon Aircraft Finance Ltd. | | 3.721% | | 7/15/39 | | 248 | | 251 | |
16
Global Wellington Fund
| | | Coupon | | Maturity
Date | | Face
Amount
($000 | ) | Market
Value·
($000 | ) |
1,5 | Hyundai Auto Lease Securitization Trust 2018-A | | 2.550% | | 8/17/20 | | 118 | | 118 | |
1,5 | MMAF Equipment Finance LLC 2016-A | | 1.480% | | 6/15/20 | | 21 | | 21 | |
1,5 | MMAF Equipment Finance LLC 2017-B | | 2.210% | | 10/17/22 | | 170 | | 170 | |
1,5 | OneMain Direct Auto Receivables Trust 2017-2 | | 2.310% | | 12/14/21 | | 203 | | 203 | |
1 | Seasoned Credit Risk Transfer Trust Series 2018-4 | | 3.500% | | 3/25/58 | | 115 | | 119 | |
1 | Seasoned Credit Risk Transfer Trust Series 2019-1 | | 3.500% | | 7/25/58 | | 118 | | 123 | |
1 | Seasoned Credit Risk Transfer Trust Series 2019-3 | | 3.500% | | 10/25/58 | | 318 | | 333 | |
1,5 | SoFi Consumer Loan Program 2018-2 Trust | | 2.930% | | 4/26/27 | | 93 | | 93 | |
1,5 | SoFi Consumer Loan Program 2019-3 Trust | | 2.900% | | 5/25/28 | | 1,356 | | 1,366 | |
1,5 | Towd Point Mortgage Trust 2018-1 | | 3.000% | | 1/25/58 | | 259 | | 263 | |
1,5 | Vantage Data Centers LLC 2018-1A | | 4.072% | | 2/16/43 | | 296 | | 307 | |
1,5 | Vantage Data Centers LLC 2019-1A | | 3.188% | | 7/15/44 | | 195 | | 199 | |
1,5 | Verus Securitization Trust 2019-2 | | 3.211% | | 4/25/59 | | 362 | | 367 | |
1,5 | Westlake Automobile Receivables Trust | | 2.980% | | 1/18/22 | | 449 | | 450 | |
1,5 | Westlake Automobile Receivables Trust 2018-1 | | 2.240% | | 12/15/20 | | 35 | | 35 | |
| | | | | | | | | 10,240 | |
Total Asset-Backed/Commercial Mortgage-Backed Securities (Cost $21,417) | | 21,616 | |
Corporate Bonds (22.4%) | | | | | | | | | |
Australia (0.3%) | | | | | | | | | |
1,5 | Macquarie Group Ltd. | | 4.150% | | 3/27/24 | | 1,025 | | 1,083 | |
1,5 | National Australia Bank Ltd. | | 3.933% | | 8/2/34 | | 1,050 | | 1,087 | |
5 | WEA Finance LLC | | 4.125% | | 9/20/28 | | 895 | | 985 | |
5 | WEA Finance LLC | | 4.625% | | 9/20/48 | | 220 | | 266 | |
| | | | | | | | | 3,421 | |
Belgium (0.1%) | | | | | | | | | |
9 | Anheuser-Busch InBev SA | | 1.750% | | 3/7/25 | | 375 | | 468 | |
| | | | | | | | | |
Canada (0.7%) | | | | | | | | | |
| Bank of Nova Scotia | | 2.700% | | 8/3/26 | | 1,205 | | 1,235 | |
7 | Bell Canada Inc. | | 3.350% | | 3/22/23 | | 975 | | 758 | |
6 | Canadian Imperial Bank of Commerce, 3M USD LIBOR + 0.720% | | 3.130% | | 6/16/22 | | 570 | | 574 | |
| Emera US Finance LP | | 2.700% | | 6/15/21 | | 400 | | 403 | |
| Fortis Inc. | | 3.055% | | 10/4/26 | | 775 | | 791 | |
| Nutrien Ltd. | | 4.125% | | 3/15/35 | | 650 | | 683 | |
7 | Royal Bank of Canada | | 2.949% | | 5/1/23 | | 1,875 | | 1,455 | |
7 | Toronto-Dominion Bank | | 1.680% | | 6/8/21 | | 740 | | 555 | |
| TransCanada PipeLines Ltd. | | 4.875% | | 1/15/26 | | 400 | | 450 | |
| | | | | | | | | 6,904 | |
China (0.3%) | | | | | | | | | |
| Alibaba Group Holding Ltd. | | 3.125% | | 11/28/21 | | 825 | | 839 | |
| Alibaba Group Holding Ltd. | | 3.400% | | 12/6/27 | | 660 | | 692 | |
5 | Tencent Holdings Ltd. | | 3.595% | | 1/19/28 | | 1,035 | | 1,088 | |
5 | Tencent Holdings Ltd. | | 3.975% | | 4/11/29 | | 445 | | 482 | |
| | | | | | | | | 3,101 | |
17
Global Wellington Fund
| | | Coupon | | Maturity
Date | | Face
Amount
($000 | ) | Market
Value·
($000 | ) |
France (1.3%) | | | | | | | | | |
1,8 | AXA SA | | 5.125% | | 7/4/43 | | 600 | | 779 | |
8 | Banque Federative du Credit Mutuel SA | | 1.250% | | 1/14/25 | | 1,200 | | 1,416 | |
8 | BNP Paribas SA | | 1.500% | | 11/17/25 | | 775 | | 919 | |
8 | BPCE SA | | 1.125% | | 1/18/23 | | 700 | | 800 | |
5 | BPCE SA | | 5.700% | | 10/22/23 | | 400 | | 442 | |
8 | BPCE SA | | 2.875% | | 4/22/26 | | 1,600 | | 2,043 | |
5 | BPCE SA | | 3.250% | | 1/11/28 | | 525 | | 551 | |
8 | Credit Agricole SA | | 1.000% | | 9/16/24 | | 1,400 | | 1,631 | |
5 | Danone SA | | 2.947% | | 11/2/26 | | 555 | | 574 | |
8 | Orange SA | | 1.000% | | 5/12/25 | | 1,300 | | 1,512 | |
8 | Orange SA | | 2.000% | | 1/15/29 | | 300 | | 382 | |
8 | RCI Banque SA | | 0.750% | | 9/26/22 | | 500 | | 561 | |
8 | RCI Banque SA | | 1.375% | | 3/8/24 | | 475 | | 547 | |
8 | Societe Generale SA | | 1.000% | | 4/1/22 | | 600 | | 678 | |
8 | Veolia Environnement SA | | 1.590% | | 1/10/28 | | 400 | | 493 | |
| | | | | | | | | 13,328 | |
Germany (1.5%) | | | | | | | | | |
5 | Bayer US Finance II LLC | | 4.250% | | 12/15/25 | | 1,625 | | 1,748 | |
8 | Daimler AG | | 0.875% | | 1/12/21 | | 2,575 | | 2,871 | |
9 | Deutsche Telekom AG | | 3.125% | | 2/6/34 | | 775 | | 1,054 | |
8 | Deutsche Telekom International Finance BV | | 4.250% | | 3/16/20 | | 1,200 | | 1,351 | |
9 | E.ON International Finance BV | | 5.875% | | 10/30/37 | | 150 | | 276 | |
8 | E.ON SE | | 0.375% | | 8/23/21 | | 1,800 | | 1,998 | |
8 | E.ON SE | | 1.625% | | 5/22/29 | | 565 | | 698 | |
9 | innogy Finance BV | | 4.750% | | 1/31/34 | | 600 | | 953 | |
5 | Siemens Financieringsmaatschappij NV | | 2.900% | | 5/27/22 | | 650 | | 664 | |
8 | Volkswagen Leasing GmbH | | 0.250% | | 10/5/20 | | 1,525 | | 1,683 | |
8 | Volkswagen Leasing GmbH | | 2.625% | | 1/15/24 | | 425 | | 512 | |
8 | Volkswagen Leasing GmbH | | 1.375% | | 1/20/25 | | 950 | | 1,087 | |
| | | | | | | | | 14,895 | |
Hong Kong (0.1%) | | | | | | | | | |
5 | CK Hutchison International 17 II Ltd. | | 2.750% | | 3/29/23 | | 1,275 | | 1,291 | |
| | | | | | | | | | |
Japan (0.3%) | | | | | | | | | |
10 | Toyota Finance Australia Ltd. | | 2.500% | | 12/7/20 | | 1,625 | | 1,111 | |
8 | Toyota Motor Credit Corp. | | 1.800% | | 7/23/20 | | 1,250 | | 1,399 | |
| | | | | | | | | 2,510 | |
Mexico (0.2%) | | | | | | | | | |
| America Movil SAB de CV | | 3.625% | | 4/22/29 | | 275 | | 297 | |
| America Movil SAB de CV | | 6.375% | | 3/1/35 | | 350 | | 484 | |
| Coca-Cola Femsa SAB de CV | | 3.875% | | 11/26/23 | | 540 | | 575 | |
5 | Infraestructura Energetica Nova SAB de CV | | 4.875% | | 1/14/48 | | 980 | | 920 | |
| | | | | | | | | 2,276 | |
Netherlands (0.2%) | | | | | | | | | |
8 | ABN AMRO Bank NV | | 2.500% | | 11/29/23 | | 855 | | 1,051 | |
9 | Cooperatieve Rabobank UA | | 4.625% | | 5/23/29 | | 200 | | 290 | |
| Shell International Finance BV | | 4.000% | | 5/10/46 | | 475 | | 558 | |
| | | | | | | | | 1,899 | |
South Africa (0.2%) | | | | | | | | | |
8 | Anglo American Capital plc | | 1.625% | | 3/11/26 | | 1,400 | | 1,638 | |
18
Global Wellington Fund
| | | Coupon | | Maturity Date | | Face Amount ($000 | ) | Market Value· ($000) |
South Korea (0.0%) | | | | | | | | |
| | | | | | | | |
5 | SK Telecom Co. Ltd. | | 3.750% | | 4/16/23 | | 200 | | 210 |
| | | | | | | | | |
Spain (1.1%) | | | | | | | | |
8 | Abertis Infraestructuras SA | | 3.000% | | 3/27/31 | | 1,000 | | 1,277 |
8 | Banco de Sabadell SA | | 1.625% | | 3/7/24 | | 2,300 | | 2,669 |
8 | CaixaBank SA | | 1.750% | | 10/24/23 | | 1,800 | | 2,086 |
8 | Iberdrola International BV | | 2.875% | | 11/11/20 | | 1,800 | | 2,052 |
8 | Telefonica Emisiones SAU | | 2.242% | | 5/27/22 | | 700 | | 821 |
8 | Telefonica Emisiones SAU | | 1.460% | | 4/13/26 | | 500 | | 599 |
8 | Telefonica Emisiones SAU | | 1.715% | | 1/12/28 | | 900 | | 1,098 |
| Telefonica Emisiones SAU | | 4.665% | | 3/6/38 | | 630 | | 691 |
| | | | | | | | | 11,293 |
Sweden (0.3%) | | | | | | | | |
8 | Skandinaviska Enskilda Banken AB | | 2.000% | | 2/19/21 | | 550 | | 626 |
8 | Skandinaviska Enskilda Banken AB | | 0.300% | | 2/17/22 | | 1,750 | | 1,952 |
| | | | | | | | | 2,578 |
Switzerland (0.4%) | | | | | | | | |
1,8 | Credit Suisse Group AG | | 1.250% | | 7/17/25 | | 675 | | 779 |
8 | Holcim Finance Luxembourg SA | | 2.250% | | 5/26/28 | | 1,200 | | 1,501 |
5 | Roche Holdings Inc. | | 2.625% | | 5/15/26 | | 1,100 | | 1,132 |
1,5 | UBS Group AG | | 3.126% | | 8/13/30 | | 355 | | 365 |
| | | | | | | | | 3,777 |
United Kingdom (2.1%) | | | | | | | | |
| AstraZeneca plc | | 4.000% | | 1/17/29 | | 755 | | 847 |
1 | Barclays plc | | 3.932% | | 5/7/25 | | 860 | | 884 |
| BAT Capital Corp. | | 3.222% | | 8/15/24 | | 575 | | 590 |
| BAT Capital Corp. | | 3.557% | | 8/15/27 | | 925 | | 948 |
| BP Capital Markets plc | | 3.814% | | 2/10/24 | | 475 | | 509 |
7 | BP Capital Markets plc | | 3.470% | | 5/15/25 | | 1,350 | | 1,076 |
9 | CPUK Finance Ltd. | | 3.588% | | 8/28/25 | | 1,400 | | 1,848 |
8 | FCE Bank plc | | 0.869% | | 9/13/21 | | 1,800 | | 1,993 |
1,8 | Heathrow Funding Ltd. | | 1.500% | | 2/11/32 | | 1,025 | | 1,213 |
1,9 | HSBC Holdings plc | | 2.256% | | 11/13/26 | | 2,050 | | 2,534 |
6 | HSBC Holdings plc, 3M USD LIBOR + 1.000% | | 3.124% | | 5/18/24 | | 245 | | 245 |
8 | Imperial Brands Finance plc | | 2.250% | | 2/26/21 | | 1,825 | | 2,067 |
5 | Imperial Brands Finance plc | | 4.250% | | 7/21/25 | | 800 | | 851 |
5 | Sky plc | | 3.125% | | 11/26/22 | | 725 | | 743 |
| Trinity Acquisition plc | | 4.400% | | 3/15/26 | | 1,274 | | 1,393 |
8 | Vodafone Group plc | | 2.200% | | 8/25/26 | | 1,725 | | 2,167 |
8 | Vodafone Group plc | | 1.625% | | 11/24/30 | | 550 | | 661 |
| Vodafone Group plc | | 5.250% | | 5/30/48 | | 400 | | 480 |
| | | | | | | | | 21,049 |
United States (13.3%) | | | | | | | | |
| Abbott Laboratories | | 3.400% | | 11/30/23 | | 500 | | 527 |
| Alabama Power Co. | | 4.300% | | 7/15/48 | | 255 | | 310 |
| Allergan Funding SCS | | 3.800% | | 3/15/25 | | 1,060 | | 1,115 |
8 | Altria Group Inc. | | 2.200% | | 6/15/27 | | 435 | | 527 |
| Amazon.com Inc. | | 4.800% | | 12/5/34 | | 300 | | 382 |
| Amazon.com Inc. | | 4.250% | | 8/22/57 | | 225 | | 288 |
| American Electric Power Co. Inc. | | 3.200% | | 11/13/27 | | 950 | | 1,000 |
8 | American Express Credit Corp. | | 0.625% | | 11/22/21 | | 1,900 | | 2,130 |
19
Global Wellington Fund
| | | Coupon | | Maturity Date | | Face Amount ($000 | ) | Market Value· ($000) |
8 | American International Group Inc. | | 1.500% | | 6/8/23 | | 975 | | 1,130 |
| American International Group Inc. | | 4.250% | | 3/15/29 | | 800 | | 887 |
| American Tower Corp. | | 5.000% | | 2/15/24 | | 380 | | 422 |
| American Tower Corp. | | 4.400% | | 2/15/26 | | 300 | | 330 |
| American Tower Corp. | | 3.800% | | 8/15/29 | | 400 | | 431 |
| Amgen Inc. | | 3.625% | | 5/22/24 | | 275 | | 292 |
| Amgen Inc. | | 4.663% | | 6/15/51 | | 350 | | 417 |
| Anadarko Finance Co. | | 7.500% | | 5/1/31 | | 145 | | 193 |
| Andeavor Logistics LP / Tesoro Logistics Finance Corp. | | 3.500% | | 12/1/22 | | 1,405 | | 1,442 |
| Anheuser-Busch Cos. LLC / Anheuser-Busch InBev Worldwide Inc. | | 4.900% | | 2/1/46 | | 775 | | 927 |
| Anheuser-Busch InBev Worldwide Inc. | | 4.375% | | 4/15/38 | | 670 | | 762 |
| Anheuser-Busch InBev Worldwide Inc. | | 4.600% | | 4/15/48 | | 85 | | 99 |
| Anthem Inc. | | 3.500% | | 8/15/24 | | 275 | | 288 |
| Anthem Inc. | | 4.101% | | 3/1/28 | | 610 | | 665 |
| Anthem Inc. | | 4.375% | | 12/1/47 | | 300 | | 336 |
| Apple Inc. | | 2.750% | | 1/13/25 | | 780 | | 811 |
8 | AT&T Inc. | | 1.875% | | 12/4/20 | | 2,450 | | 2,751 |
| AT&T Inc. | | 3.600% | | 7/15/25 | | 850 | | 899 |
| AT&T Inc. | | 4.125% | | 2/17/26 | | 800 | | 871 |
| AT&T Inc. | | 4.900% | | 8/15/37 | | 1,300 | | 1,494 |
| AutoZone Inc. | | 3.125% | | 4/21/26 | | 1,175 | | 1,224 |
| Bank of America Corp. | | 3.300% | | 1/11/23 | | 570 | | 592 |
1 | Bank of America Corp. | | 3.593% | | 7/21/28 | | 1,885 | | 2,014 |
1 | Bank of America Corp. | | 4.271% | | 7/23/29 | | 1,265 | | 1,428 |
6 | Bank of New York Mellon Corp., 3M USD LIBOR + 1.050% | | 3.316% | | 10/30/23 | | 415 | | 423 |
5 | Bayer US Finance LLC | | 3.375% | | 10/8/24 | | 770 | | 796 |
| BB&T Corp. | | 3.200% | | 9/3/21 | | 510 | | 521 |
| BB&T Corp. | | 3.700% | | 6/5/25 | | 770 | | 830 |
| Berkshire Hathaway Energy Co. | | 5.150% | | 11/15/43 | | 10 | | 13 |
5 | Boston Gas Co. | | 3.001% | | 8/1/29 | | 130 | | 136 |
| Boston Scientific Corp. | | 4.000% | | 3/1/29 | | 60 | | 67 |
| Boston Scientific Corp. | | 4.550% | | 3/1/39 | | 600 | | 718 |
| Brandywine Operating Partnership LP | | 3.950% | | 11/15/27 | | 890 | | 942 |
| Broadcom Corp. / Broadcom Cayman Finance Ltd. | | 3.625% | | 1/15/24 | | 1,190 | | 1,215 |
5 | Brooklyn Union Gas Co. | | 4.273% | | 3/15/48 | | 965 | | 1,160 |
| Capital One Financial Corp. | | 4.200% | | 10/29/25 | | 1,400 | | 1,495 |
| Cardinal Health Inc. | | 4.500% | | 11/15/44 | | 380 | | 370 |
5 | Cargill Inc. | | 4.760% | | 11/23/45 | | 340 | | 439 |
| Charter Communications Operating LLC / Charter Communications Operating Capital | | 6.384% | | 10/23/35 | | 960 | | 1,175 |
8 | Chubb INA Holdings Inc. | | 0.875% | | 6/15/27 | | 1,130 | | 1,303 |
8 | Chubb INA Holdings Inc. | | 1.400% | | 6/15/31 | | 525 | | 627 |
| Cigna Corp. | | 4.375% | | 10/15/28 | | 420 | | 467 |
| Cimarex Energy Co. | | 4.375% | | 6/1/24 | | 1,040 | | 1,098 |
| Citigroup Inc. | | 2.700% | | 3/30/21 | | 345 | | 348 |
| Citigroup Inc. | | 4.600% | | 3/9/26 | | 535 | | 589 |
1 | Citigroup Inc. | | 3.520% | | 10/27/28 | | 1,575 | | 1,668 |
| Cleco Corporate Holdings LLC | | 3.743% | | 5/1/26 | | 1,000 | | 1,034 |
| Comcast Corp. | | 3.950% | | 10/15/25 | | 250 | | 274 |
| Comcast Corp. | | 6.500% | | 11/15/35 | | 885 | | 1,249 |
| Comcast Corp. | | 4.600% | | 10/15/38 | | 255 | | 309 |
20
Global Wellington Fund
| | | Coupon | | Maturity Date | | Face Amount ($000 | ) | Market Value· ($000) |
| Comcast Corp. | | 4.000% | | 3/1/48 | | 40 | | 45 |
| Comcast Corp. | | 3.999% | | 11/1/49 | | 120 | | 135 |
| Comcast Corp. | | 4.049% | | 11/1/52 | | 20 | | 23 |
| CommonSpirit Health | | 4.200% | | 8/1/23 | | 770 | | 818 |
| CommonSpirit Health | | 3.347% | | 10/1/29 | | 355 | | 365 |
| CommonSpirit Health | | 4.187% | | 10/1/49 | | 320 | | 342 |
| Commonwealth Edison Co. | | 3.650% | | 6/15/46 | | 35 | | 39 |
| Commonwealth Edison Co. | | 4.000% | | 3/1/48 | | 245 | | 287 |
| Conagra Brands Inc. | | 4.600% | | 11/1/25 | | 200 | | 221 |
| Conagra Brands Inc. | | 5.300% | | 11/1/38 | | 600 | | 699 |
| Consolidated Edison Co. of New York Inc. | | 6.300% | | 8/15/37 | | 75 | | 106 |
| Consolidated Edison Co. of New York Inc. | | 4.625% | | 12/1/54 | | 290 | | 358 |
5 | Cox Communications Inc. | | 4.600% | | 8/15/47 | | 800 | | 887 |
| Crown Castle International Corp. | | 3.800% | | 2/15/28 | | 905 | | 964 |
| CSX Corp. | | 4.300% | | 3/1/48 | | 365 | | 422 |
| CVS Health Corp. | | 4.100% | | 3/25/25 | | 1,185 | | 1,268 |
| CVS Health Corp. | | 2.875% | | 6/1/26 | | 1,455 | | 1,464 |
| Dignity Health | | 3.812% | | 11/1/24 | | 594 | | 640 |
| Dignity Health | | 4.500% | | 11/1/42 | | 166 | | 182 |
| Discover Bank | | 4.200% | | 8/8/23 | | 575 | | 618 |
| Dominion Energy Gas Holdings LLC | | 4.600% | | 12/15/44 | | 660 | | 800 |
| Dominion Energy Inc. | | 2.715% | | 8/15/21 | | 140 | | 141 |
| Dominion Energy South Carolina Inc. | | 4.250% | | 8/15/28 | | 650 | | 757 |
| Dominion Energy South Carolina Inc. | | 6.625% | | 2/1/32 | | 156 | | 215 |
| Dominion Energy South Carolina Inc. | | 5.300% | | 5/15/33 | | 113 | | 145 |
| Dominion Energy South Carolina Inc. | | 5.450% | | 2/1/41 | | 300 | | 400 |
| Dominion Energy South Carolina Inc. | | 4.600% | | 6/15/43 | | 230 | | 287 |
| Duke Energy Progress LLC | | 4.100% | | 3/15/43 | | 707 | | 818 |
| Energy Transfer Partners LP | | 4.900% | | 3/15/35 | | 1,075 | | 1,132 |
| Enterprise Products Operating LLC | | 3.900% | | 2/15/24 | | 535 | | 573 |
| EQM Midstream Partners LP | | 4.750% | | 7/15/23 | | 1,010 | | 1,016 |
5 | ERAC USA Finance LLC | | 4.500% | | 2/15/45 | | 640 | | 728 |
| Exxon Mobil Corp. | | 2.275% | | 8/16/26 | | 1,075 | | 1,088 |
8 | Fidelity National Information Services Inc. | | 1.500% | | 5/21/27 | | 1,820 | | 2,182 |
8 | Fidelity National Information Services Inc. | | 2.000% | | 5/21/30 | | 710 | | 887 |
| FirstEnergy Corp. | | 3.900% | | 7/15/27 | | 675 | | 724 |
| Fiserv Inc. | | 3.200% | | 7/1/26 | | 355 | | 372 |
| Florida Power & Light Co. | | 3.700% | | 12/1/47 | | 275 | | 311 |
| Ford Motor Credit Co. LLC | | 3.096% | | 5/4/23 | | 1,275 | | 1,261 |
5 | Fox Corp. | | 4.030% | | 1/25/24 | | 160 | | 171 |
5 | Fox Corp. | | 5.576% | | 1/25/49 | | 275 | | 358 |
| General Motors Co. | | 4.200% | | 10/1/27 | | 475 | | 489 |
| General Motors Financial Co. Inc. | | 3.450% | | 4/10/22 | | 1,310 | | 1,336 |
| Georgia Power Co. | | 4.300% | | 3/15/42 | | 860 | | 976 |
| Goldman Sachs Group Inc. | | 2.625% | | 4/25/21 | | 575 | | 579 |
1 | Goldman Sachs Group Inc. | | 3.272% | | 9/29/25 | | 1,375 | | 1,423 |
1 | Goldman Sachs Group Inc. | | 3.814% | | 4/23/29 | | 335 | | 360 |
1 | Goldman Sachs Group Inc. | | 4.223% | | 5/1/29 | | 600 | | 665 |
| HCA Inc. | | 5.250% | | 6/15/49 | | 200 | | 224 |
| HCP Inc. | | 4.000% | | 6/1/25 | | 850 | | 908 |
| Hess Corp. | | 7.300% | | 8/15/31 | | 555 | | 691 |
| Humana Inc. | | 2.900% | | 12/15/22 | | 590 | | 601 |
| International Business Machines Corp. | | 3.300% | | 5/15/26 | | 550 | | 584 |
| International Paper Co. | | 4.350% | | 8/15/48 | | 500 | | 527 |
| John Deere Capital Corp. | | 3.450% | | 3/13/25 | | 985 | | 1,051 |
21
Global Wellington Fund
| | | Coupon | | Maturity Date | | Face Amount ($000 | ) | Market Value· ($000) |
8 | JPMorgan Chase & Co. | | 3.875% | | 9/23/20 | | 1,300 | | 1,492 |
1 | JPMorgan Chase & Co. | | 3.782% | | 2/1/28 | | 1,525 | | 1,659 |
1 | JPMorgan Chase & Co. | | 3.964% | | 11/15/48 | | 975 | | 1,125 |
| Kaiser Foundation Hospitals | | 4.875% | | 4/1/42 | | 45 | | 59 |
5 | KeySpan Gas East Corp. | | 2.742% | | 8/15/26 | | 400 | | 408 |
| Kraft Heinz Foods Co. | | 4.375% | | 6/1/46 | | 895 | | 857 |
| Lockheed Martin Corp. | | 4.700% | | 5/15/46 | | 253 | | 327 |
| Lockheed Martin Corp. | | 4.090% | | 9/15/52 | | 97 | | 117 |
| Lowe’s Cos. Inc. | | 4.550% | | 4/5/49 | | 475 | | 556 |
| Marsh & McLennan Cos. Inc. | | 4.375% | | 3/15/29 | | 660 | | 758 |
8 | Medtronic Global Holdings SCA | | 1.125% | | 3/7/27 | | 1,595 | | 1,873 |
8 | Medtronic Global Holdings SCA | | 1.625% | | 3/7/31 | | 835 | | 1,029 |
| Memorial Sloan-Kettering Cancer Center | | 4.125% | | 7/1/52 | | 150 | | 186 |
| Merck & Co. Inc. | | 3.400% | | 3/7/29 | | 545 | | 600 |
| Merck & Co. Inc. | | 4.000% | | 3/7/49 | | 360 | | 434 |
| Mercy Health | | 3.555% | | 8/1/27 | | 410 | | 442 |
| Mercy Health | | 4.302% | | 7/1/28 | | 370 | | 422 |
5 | Metropolitan Life Global Funding I | | 3.000% | | 9/19/27 | | 775 | | 814 |
| Microsoft Corp. | | 3.700% | | 8/8/46 | | 1,125 | | 1,325 |
| MidAmerican Energy Co. | | 4.250% | | 5/1/46 | | 10 | | 12 |
| Molson Coors Brewing Co. | | 3.000% | | 7/15/26 | | 700 | | 709 |
7 | Molson Coors International LP | | 2.840% | | 7/15/23 | | 1,875 | | 1,420 |
| Morgan Stanley | | 2.750% | | 5/19/22 | | 1,375 | | 1,398 |
| Morgan Stanley | | 3.125% | | 7/27/26 | | 1,850 | | 1,920 |
1 | Morgan Stanley | | 3.772% | | 1/24/29 | | 1,045 | | 1,131 |
| MPLX LP | | 4.125% | | 3/1/27 | | 875 | | 920 |
| MPLX LP | | 4.000% | | 3/15/28 | | 220 | | 230 |
| National Retail Properties Inc. | | 3.900% | | 6/15/24 | | 805 | | 853 |
| National Rural Utilities Cooperative Finance Corp. | | 2.950% | | 2/7/24 | | 400 | | 414 |
| NextEra Energy Capital Holdings Inc. | | 3.250% | | 4/1/26 | | 100 | | 105 |
| NextEra Energy Capital Holdings Inc. | | 3.500% | | 4/1/29 | | 155 | | 166 |
| Noble Energy Inc. | | 3.850% | | 1/15/28 | | 625 | | 651 |
5 | Northwestern Mutual Life Insurance Co. | | 3.850% | | 9/30/47 | | 230 | | 259 |
| Oglethorpe Power Corp. | | 5.250% | | 9/1/50 | | 200 | | 260 |
| Oracle Corp. | | 3.400% | | 7/8/24 | | 575 | | 609 |
| Oracle Corp. | | 4.000% | | 11/15/47 | | 220 | | 253 |
5 | Penske Truck Leasing Co. LP / PTL Finance Corp. | | 3.375% | | 2/1/22 | | 145 | | 148 |
5 | Penske Truck Leasing Co. LP / PTL Finance Corp. | | 4.250% | | 1/17/23 | | 1,405 | | 1,491 |
5 | Penske Truck Leasing Co. LP / PTL Finance Corp. | | 3.950% | | 3/10/25 | | 595 | | 632 |
| Philip Morris International Inc. | | 2.500% | | 11/2/22 | | 575 | | 582 |
8 | Philip Morris International Inc. | | 2.875% | | 3/3/26 | | 425 | | 544 |
8 | Philip Morris International Inc. | | 0.125% | | 8/3/26 | | 900 | | 976 |
| Phillips 66 Partners LP | | 3.750% | | 3/1/28 | | 500 | | 521 |
| PNC Bank NA | | 3.250% | | 1/22/28 | | 910 | | 977 |
1 | Providence St. Joseph Health Obligated Group | | 3.930% | | 10/1/48 | | 225 | | 264 |
| Santander Holdings USA Inc. | | 3.700% | | 3/28/22 | | 2,400 | | 2,462 |
5 | SBA Tower Trust | | 2.877% | | 7/9/21 | | 805 | | 811 |
5 | SBA Tower Trust | | 3.448% | | 3/15/23 | | 675 | | 694 |
| Sempra Energy | | 3.250% | | 6/15/27 | | 500 | | 516 |
| Sierra Pacific Power Co. | | 2.600% | | 5/1/26 | | 149 | | 150 |
| Southern California Edison Co. | | 3.700% | | 8/1/25 | | 30 | | 32 |
22
Global Wellington Fund
| | | Coupon | | Maturity Date | | Face Amount ($000 | ) | Market Value· ($000) |
| Southern California Edison Co. | | 4.125% | | 3/1/48 | | 550 | | 616 |
1,5 | Sprint Spectrum Co LLC / Sprint Spectrum Co II LLC / Sprint Spectrum Co III LLC | | 4.738% | | 3/20/25 | | 805 | | 853 |
| SSM Health Care Corp. | | 3.823% | | 6/1/27 | | 320 | | 352 |
| Starbucks Corp. | | 4.500% | | 11/15/48 | | 320 | | 375 |
| SunTrust Bank | | 3.300% | | 5/15/26 | | 450 | | 472 |
| Synchrony Bank | | 3.000% | | 6/15/22 | | 450 | | 458 |
5 | Teachers Insurance & Annuity Assn. of America | | 4.900% | | 9/15/44 | | 860 | | 1,080 |
| Union Pacific Corp. | | 3.700% | | 3/1/29 | | 210 | | 233 |
| Union Pacific Corp. | | 4.300% | | 3/1/49 | | 130 | | 154 |
1 | United Airlines 2018-1 Class B Pass Through Trust | | 4.600% | | 3/1/26 | | 68 | | 71 |
8 | United Technologies Corp. | | 1.150% | | 5/18/24 | | 380 | | 439 |
| United Technologies Corp. | | 3.950% | | 8/16/25 | | 285 | | 313 |
| United Technologies Corp. | | 4.450% | | 11/16/38 | | 725 | | 876 |
| UnitedHealth Group Inc. | | 3.850% | | 6/15/28 | | 820 | | 912 |
| UnitedHealth Group Inc. | | 4.625% | | 7/15/35 | | 75 | | 92 |
| UnitedHealth Group Inc. | | 4.200% | | 1/15/47 | | 65 | | 76 |
| Verizon Communications Inc. | | 3.500% | | 11/1/24 | | 275 | | 293 |
| Verizon Communications Inc. | | 4.522% | | 9/15/48 | | 1,400 | | 1,686 |
| Verizon Communications Inc. | | 4.672% | | 3/15/55 | | 118 | | 144 |
| Viacom Inc. | | 4.250% | | 9/1/23 | | 800 | | 853 |
5 | Walt Disney Co. | | 6.200% | | 12/15/34 | | 640 | | 903 |
8 | Wells Fargo & Co. | | 2.250% | | 9/3/20 | | 2,500 | | 2,817 |
7 | Wells Fargo & Co. | | 2.975% | | 5/19/26 | | 625 | | 481 |
| Wells Fargo & Co. | | 4.300% | | 7/22/27 | | 275 | | 304 |
| Wells Fargo & Co. | | 4.750% | | 12/7/46 | | 800 | | 982 |
| Welltower Inc. | | 4.000% | | 6/1/25 | | 275 | | 295 |
| | | | | | | | | 133,636 |
Total Corporate Bonds (Cost $216,785) | | | | | | | | 224,274 |
Sovereign Bonds (4.2%) | | | | | | | | |
Australia (0.2%) | | | | | | | | |
10 | Commonwealth of Australia | | 2.250% | | 11/21/22 | | 1,260 | | 891 |
10 | Commonwealth of Australia | | 2.750% | | 11/21/27 | | 135 | | 105 |
10 | Commonwealth of Australia | | 2.250% | | 5/21/28 | | 1,195 | | 899 |
| | | | | | | | | 1,895 |
Canada (0.4%) | | | | | | | | |
7 | Canada | | 2.750% | | 12/1/48 | | 235 | | 232 |
5,7 | Canada Housing Trust No 1 | | 2.350% | | 9/15/23 | | 975 | | 753 |
7 | City of Toronto | | 3.200% | | 8/1/48 | | 1,000 | | 863 |
7 | Province of Ontario | | 2.900% | | 6/2/28 | | 1,910 | | 1,555 |
11 | Province of Ontario | | 0.250% | | 6/28/29 | | 985 | | 1,071 |
| | | | | | | | | 4,474 |
Chile (0.1%) | | | | | | | | |
| Corp. Nacional del Cobre de Chile | | 3.625% | | 8/1/27 | | 650 | | 695 |
| | | | | | | | | |
China (0.3%) | | | | | | | | |
5 | Sinopec Group Overseas Development 2017 Ltd. | | 3.000% | | 4/12/22 | | 1,025 | | 1,039 |
5 | State Grid Overseas Investment 2016 Ltd. | | 2.750% | | 5/4/22 | | 2,135 | | 2,154 |
| | | | | | | | | 3,193 |
23
Global Wellington Fund
| | | Coupon | | Maturity Date | | Face Amount ($000 | ) | Market Value· ($000) |
France (0.3%) | | | | | | | | |
8 | Aeroports de Paris | | 2.750% | | 6/5/28 | | 2,200 | | 2,980 |
| | | | | | | | | |
Japan (1.2%) | | | | | | | | |
12 | Japan | | 0.100% | | 6/20/28 | | 105,200 | | 1,029 |
12 | Japan | | 0.100% | | 12/20/28 | | 879,000 | | 8,589 |
12 | Japan | | 0.100% | | 3/20/29 | | 158,800 | | 1,551 |
12 | Japan | | 0.100% | | 6/20/29 | | 40,250 | | 393 |
| | | | | | | | | 11,562 |
Panama (0.1%) | | | | | | | | |
1,5 | Empresa de Transmision Electrica SA | | 5.125% | | 5/2/49 | | 470 | | 545 |
| | | | | | | | | |
Qatar (0.3%) | | | | | | | | |
5 | State of Qatar | | 2.375% | | 6/2/21 | | 1,400 | | 1,407 |
5 | State of Qatar | | 3.875% | | 4/23/23 | | 550 | | 585 |
5 | State of Qatar | | 4.000% | | 3/14/29 | | 515 | | 588 |
5 | State of Qatar | | 5.103% | | 4/23/48 | | 255 | | 340 |
| | | | | | | | | 2,920 |
Saudi Arabia (0.4%) | | | | | | | | |
5 | Kingdom of Saudi Arabia | | 2.875% | | 3/4/23 | | 2,740 | | 2,822 |
5 | Saudi Arabian Oil Co. | | 2.875% | | 4/16/24 | | 500 | | 513 |
5 | Saudi Arabian Oil Co. | | 3.500% | | 4/16/29 | | 910 | | 974 |
| | | | | | | | | 4,309 |
Singapore (0.1%) | | | | | | | | |
5 | Temasek Financial I Ltd. | | 3.625% | | 8/1/28 | | 510 | | 573 |
| | | | | | | | | |
Supranational (0.1%) | | | | | | | | |
8 | European Financial Stability Facility | | 1.375% | | 5/31/47 | | 1,025 | | 1,489 |
| | | | | | | | | |
United Arab Emirates (0.1%) | | | | | | | | |
| Emirate of Abu Dhabi | | 3.125% | | 10/11/27 | | 1,235 | | 1,337 |
| | | | | | | | | |
United Kingdom (0.6%) | | | | | | | | |
9 | United Kingdom | | 1.500% | | 1/22/21 | | 1,015 | | 1,253 |
9 | United Kingdom | | 0.500% | | 7/22/22 | | 430 | | 526 |
9 | United Kingdom | | 0.750% | | 7/22/23 | | 1,210 | | 1,495 |
9 | United Kingdom | | 1.250% | | 7/22/27 | | 155 | | 202 |
9 | United Kingdom | | 3.500% | | 1/22/45 | | 1,215 | | 2,302 |
| | | | | | | | | 5,778 |
Total Sovereign Bonds (Cost $40,254) | | | | | | | | 41,750 |
Taxable Municipal Bonds (0.9%) | | | | | | | | |
| Bay Area Toll Authority California Toll Bridge Revenue (San Francisco Bay Area) | | 6.907% | | 10/1/50 | | 75 | | 131 |
| California GO | | 7.550% | | 4/1/39 | | 505 | | 847 |
| California GO | | 7.350% | | 11/1/39 | | 140 | | 224 |
| California GO | | 7.625% | | 3/1/40 | | 20 | | 33 |
| Chicago IL Transit Authority Sales Tax Receipts Revenue | | 6.899% | | 12/1/40 | | 55 | | 79 |
| Chicago IL Transit Authority Transfer Tax Receipts Revenue | | 6.899% | | 12/1/40 | | 805 | | 1,163 |
24
Global Wellington Fund
| | | Coupon | | Maturity Date | | Face Amount ($000 | ) | Market Value· ($000) |
| Chicago IL Transit Authority | | 6.300% | | 12/1/21 | | 55 | | 58 |
| Connecticut GO | | 5.770% | | 3/15/25 | | 275 | | 325 |
| Georgia Municipal Electric Power Authority Revenue | | 6.637% | | 4/1/57 | | 757 | | 1,062 |
| Georgia Municipal Electric Power Authority Revenue | | 6.655% | | 4/1/57 | | 94 | | 138 |
| Illinois GO | | 5.100% | | 6/1/33 | | 1,315 | | 1,431 |
13 | Kansas Development Finance Authority | | 5.371% | | 5/1/26 | | 695 | | 778 |
| New York Metropolitan Transportation Authority Revenue (Transit Revenue) | | 6.668% | | 11/15/39 | | 170 | | 255 |
| North Texas Tollway Authority System Revenue | | 6.718% | | 1/1/49 | | 125 | | 209 |
| Sales Tax Securitization Corp. Illinois Revenue | | 4.787% | | 1/1/48 | | 665 | | 850 |
| South Carolina Public Service Authority Revenue | | 2.388% | | 12/1/23 | | 1,275 | | 1,285 |
| University of California Regents Medical Center Revenue | | 6.548% | | 5/15/48 | | 190 | | 298 |
Total Taxable Municipal Bonds (Cost $8,268) | | | | | | | | 9,166 |
Temporary Cash Investment (1.4%) | | | | | | | | |
| | | | | | | Shares | | |
Money Market Fund (1.4%) | | | | | | | | |
14 | Vanguard Market Liquidity Fund (Cost $14,159) | | 2.249% | | | | 141,574 | | 14,159 |
Total Investments (100.0%) (Cost $945,201) | | | | | | | | 1,002,846 |
| | | | | | | | | Amount ($000) |
Other Assets and Liabilities (0.0%) | | | | | | | | |
Other Assets | | | | | | | | |
Investment in Vanguard | | | | | | | | 47 |
Receivables for Investment Securities Sold | | | | | | | | 127 |
Receivables for Accrued Income | | | | | | | | 4,190 |
Receivables for Capital Shares Issued | | | | | | | | 1,046 |
Variation Margin Receivable—Futures Contracts | | | | | | | | — |
Unrealized Appreciation—Forward Currency Contracts | | | | | | 621 |
Other Assets | | | | | | | | 2,217 |
Total Other Assets | | | | | | | | 8,248 |
Liabilities | | | | | | | | |
Payables for Investment Securities Purchased | | | | | | | | (6,792) |
Payables for Capital Shares Redeemed | | | | | | | | (597) |
Payables to Vanguard | | | | | | | | (106) |
Payables to Investment Advisor | | | | | | | | (406) |
Variation Margin Payable—Futures Contracts | | | | | | | | (3) |
Unrealized Depreciation—Forward Currency Contracts | | | | | | (15) |
Other Liabilities | | | | | | | | (388) |
Total Liabilities | | | | | | | | (8,307) |
Net Assets (100%) | | | | | | | | 1,002,787 |
25
Global Wellington Fund
At August 31, 2019, net assets consisted of:
| | | | | | | | | Amount ($000) |
Paid-in Capital | | | | | | | | 947,887 |
Total Distributable Earnings (Loss) | | | | | | | | 54,900 |
Net Assets | | | | | | | | 1,002,787 |
Investor Shares—Net Assets | | | | | | | | |
Applicable to 8,238,639 outstanding $.001 par value shares of beneficial interest (unlimited authorization) | | 176,360 |
Net Asset Value Per Share—Investor Shares | | | | | | | | $21.41 |
Admiral Shares—Net Assets | | | | | | | | |
Applicable to 30,877,285 outstanding $.001 par value shares of beneficial interest (unlimited authorization) | | | | 826,427 |
Net Asset Value Per Share—Admiral Shares | | | | | | | | $26.76 |
· See Note A in Notes to Financial Statements.
* Non-income-producing security.
1 The average or expected maturity is shorter than the final maturity shown because of the possibility of interim principal payments and prepayments or the possibility of the issue being called.
2 The issuer was placed under federal conservatorship in September 2008; since that time, its daily operations have been managed by the Federal Housing Finance Agency and it receives capital from the U.S. Treasury, as needed to maintain a positive net worth, in exchange for senior preferred stock.
3 Includes securities purchased on a when-issued or delayed-delivery basis for which the fund has not taken delivery as of August 31, 2019.
4 Securities with a value of $363,000 have been segregated as initial margin for open futures contracts.
5 Security exempt from registration under Rule 144A of the Securities Act of 1933. Such securities may be sold in transactions exempt from registration, normally to qualified institutional buyers. At August 31, 2019, the aggregate value of these securities was $59,071,000, representing 5.9% of net assets.
6 Adjustable-rate security; rate shown is effective rate at period end. Certain adjustable-rate securities are not based on a published reference rate and spread but are determined by the issuer or agent based on current market conditions.
7 Face amount denominated in Canadian dollars.
8 Face amount denominated in euro.
9 Face amount denominated in British pounds.
10 Face amount denominated in Australian dollars.
11 Face amount denominated in Swiss francs.
12 Face amount denominated in Japanese yen.
13 Scheduled principal and interest payments are guaranteed by AGM (Assured Guaranty Municipal Corporation).
14 Affiliated money market fund available only to Vanguard funds and certain trusts and accounts managed by Vanguard. Rate shown is the 7-day yield.
ADR—American Depositary Receipt.
GO—General Obligation Bond.
LIBOR—London Interbank Offered Rate.
REMICS—Real Estate Mortgage Investment Conduits.
TBA—To Be Announced.
26
Global Wellington Fund
Derivative Financial Instruments Outstanding as of Period End |
| | | | | | | | Value and |
| | | | | | | | Unrealized |
| | | | Number of | | Notional | | Appreciation |
| | | | Long (Short | ) | Amount | | (Depreciation) |
| | Expiration | | Contracts | | ($000 | ) | ($000) |
Long Futures Contracts | | | | | | | | |
Euro-Bobl | | September 2019 | | 91 | | 13,625 | | 202 |
Long Gilt | | December 2019 | | 20 | | 3,268 | | 18 |
Euro-Buxl | | September 2019 | | 13 | | 3,205 | | 392 |
10-Year U.S. Treasury Note | | December 2019 | | 4 | | 527 | | — |
| | | | | | | | | 612 |
Short Futures Contracts | | | | | | | | |
Euro-Schatz | | September 2019 | | (66 | ) | (8,167 | ) | (31) |
5-Year U.S. Treasury Note | | December 2019 | | (30 | ) | (3,599 | ) | 3 |
10-Year Canadian Government Bond | | December 2019 | | (13 | ) | (1,417 | ) | (2) |
Euro-Bund | | September 2019 | | (5 | ) | (984 | ) | (13) |
Ultra Long U.S. Treasury Bond | | December 2019 | | (3 | ) | (592 | ) | (1) |
| | | | | | | | | (44) |
| | | | | | | | | 568 |
27
Global Wellington Fund
Forward Currency Contracts
| Contract | | | | | Unrealized | Unrealized |
| Settlement | | Contract Amount (000) | Appreciation | (Depreciation) |
Counterparty | Date | | Receive | | Deliver | ($000) | ($000) |
J.P. Morgan Securities LLC | 9/30/19 | EUR | 961 | USD | 1,068 | — | (10) |
Goldman Sachs International | 9/30/19 | EUR | 653 | USD | 725 | — | (5) |
J.P. Morgan Securities LLC | 9/30/19 | USD | 79,849 | EUR | 72,030 | 497 | — |
J.P. Morgan Securities LLC | 9/30/19 | USD | 13,664 | GBP | 11,180 | 42 | — |
Bank of America, N.A. | 9/30/19 | USD | 11,608 | JPY | 1,224,332 | 57 | — |
J.P. Morgan Securities LLC | 9/30/19 | USD | 10,648 | CAD | 14,152 | 14 | — |
J.P. Morgan Securities LLC | 9/30/19 | USD | 2,881 | AUD | 4,262 | 8 | — |
J.P. Morgan Securities LLC | 9/30/19 | USD | 1,456 | CHF | 1,434 | 3 | — |
| | | | | | 621 | (15) |
| | | | | | | | |
AUD—Australian dollar.
CAD—Canadian dollar.
CHF—Swiss franc.
EUR—Euro.
GBP—British pound.
JPY—Japanese yen.
USD—U.S. dollar.
At August 31, 2019, the counterparties had deposited in segregated accounts securities with a value of $544,000 in connection with open forward currency contracts.
See accompanying Notes, which are an integral part of the Financial Statements.
28
Global Wellington Fund
Statement of Operations
| Year Ended |
| August 31, 2019 |
| ($000) |
Investment Income | |
Income | |
Dividends1 | 15,743 |
Interest2 | 8,156 |
Securities Lending—Net | 109 |
Total Income | 24,008 |
Expenses | |
Investment Advisory Fees—Note B | |
Basic Fee | 1,360 |
Performance Adjustment | 58 |
The Vanguard Group—Note C | |
Management and Administrative—Investor Shares | 456 |
Management and Administrative—Admiral Shares | 1,395 |
Marketing and Distribution—Investor Shares | 25 |
Marketing and Distribution—Admiral Shares | 46 |
Custodian Fees | 20 |
Auditing Fees | 38 |
Shareholders’ Reports—Investor Shares | 10 |
Shareholders’ Reports—Admiral Shares | 7 |
Trustees’ Fees and Expenses | 1 |
Total Expenses | 3,416 |
Expenses Paid Indirectly | (19) |
Net Expenses | 3,397 |
Net Investment Income | 20,611 |
Realized Net Gain (Loss) | |
Investment Securities Sold2 | (13,367) |
Futures Contracts | 317 |
Forward Currency Contracts | 7,238 |
Foreign Currencies | (78) |
Realized Net Gain (Loss) | (5,890) |
Change in Unrealized Appreciation (Depreciation) | |
Investment Securities2 | 48,104 |
Futures Contracts | 471 |
Forward Currency Contracts | 773 |
Foreign Currencies | (6) |
Change in Unrealized Appreciation (Depreciation) | 49,342 |
Net Increase (Decrease) in Net Assets Resulting from Operations | 64,063 |
1 Dividends are net of foreign withholding taxes of $1,013,000.
2 Interest income, realized net gain (loss), and change in unrealized appreciation (depreciation) from an affiliated company of the fund were $483,000, $1,000, and ($4,000), respectively. Purchases and sales are for temporary cash investment purposes.
See accompanying Notes, which are an integral part of the Financial Statements.
29
Global Wellington Fund
Statement of Changes in Net Assets
| | October 18, |
| Year Ended | 20171 to |
| August 31, | August 31, |
| | 2019 | | 2018 |
| | ($000) | | ($000) |
Increase (Decrease) in Net Assets | | |
Operations | | |
Net Investment Income | 20,611 | 16,103 |
Realized Net Gain (Loss) | (5,890) | (2,181) |
Change in Unrealized Appreciation (Depreciation) | 49,342 | 9,449 |
Net Increase (Decrease) in Net Assets Resulting from Operations | 64,063 | 23,371 |
Distributions | | |
Net Investment Income | | |
Investor Shares | (3,484) | (2,453) |
Admiral Shares | (16,028) | (8,954) |
Realized Capital Gain2 | | |
Investor Shares | (303) | — |
Admiral Shares | (1,312) | — |
Total Distributions | (21,127) | (11,407) |
Capital Share Transactions | | |
Investor Shares | (2,831) | 169,692 |
Admiral Shares | 75,712 | 705,314 |
Net Increase (Decrease) from Capital Share Transactions | 72,881 | 875,006 |
Total Increase (Decrease) | 115,817 | 886,970 |
Net Assets | | |
Beginning of Period | 886,970 | — |
End of Period | 1,002,787 | 886,970 |
1 Commencement of subscription period for the fund.
2 Includes fiscal 2019 and 2018 short-term gain distributions totaling $0 and $0, respectively. Short-term gain distributions are treated as ordinary income dividends for tax purposes.
See accompanying Notes, which are an integral part of the Financial Statements.
30
Global Wellington Fund
Financial Highlights
Investor Shares
| Year | Oct. 18, |
| Ended | 20171 to |
| Aug. 31, | Aug. 31, |
For a Share Outstanding Throughout Each Period | 2019 | 2018 |
Net Asset Value, Beginning of Period | $20.51 | $20.00 |
Investment Operations | | |
Net Investment Income2 | .443 | .392 |
Net Realized and Unrealized Gain (Loss) on Investments | .920 | .379 |
Total from Investment Operations | 1.363 | .771 |
Distributions | | |
Dividends from Net Investment Income | (.426) | (.261) |
Distributions from Realized Capital Gains | (.037) | — |
Total Distributions | (.463) | (.261) |
Net Asset Value, End of Period | $21.41 | $20.51 |
| | |
Total Return3 | 6.80% | 3.88% |
| | |
Ratios/Supplemental Data | | |
Net Assets, End of Period (Millions) | $176 | $172 |
Ratio of Total Expenses to Average Net Assets | 0.46%4 | 0.46%5,6 |
Ratio of Net Investment Income to Average Net Assets | 2.19% | 2.32%6 |
Portfolio Turnover Rate | 54% | 44% |
1 Subscription period for the fund was October 18, 2017, to November 1, 2017, during which time all assets were held in cash. Performance measurement began November 2, 2017, the first business day after the subscription period, at a net asset value of $20.00.
2 Calculated based on average shares outstanding.
3 Total returns do not include account service fees that may have applied in the periods shown. Fund prospectuses provide information about any applicable account service fees.
4 Includes performance-based investment advisory fee increases (decreases) of 0.01%.
5 The ratio of expenses to average net assets for the period net of reduction from custody fee offset arrangements was 0.45%.
6 Annualized.
See accompanying Notes, which are an integral part of the Financial Statements.
31
Global Wellington Fund
Financial Highlights
Admiral Shares
| Year | Oct. 18, |
| Ended | 20171 to |
| Aug. 31, | Aug. 31, |
For a Share Outstanding Throughout Each Period | 2019 | 2018 |
Net Asset Value, Beginning of Period | $25.65 | $25.00 |
Investment Operations | | |
Net Investment Income2 | .583 | .511 |
Net Realized and Unrealized Gain (Loss) on Investments | 1.132 | .480 |
Total from Investment Operations | 1.715 | .991 |
Distributions | | |
Dividends from Net Investment Income | (.559) | (.341) |
Distributions from Realized Capital Gains | (.046) | — |
Total Distributions | (.605) | (.341) |
Net Asset Value, End of Period | $26.76 | $25.65 |
| | |
Total Return3 | 6.85% | 3.99% |
| | |
Ratios/Supplemental Data | | |
Net Assets, End of Period (Millions) | $826 | $715 |
Ratio of Total Expenses to Average Net Assets | 0.36%4 | 0.36%5,6 |
Ratio of Net Investment Income to Average Net Assets | 2.29% | 2.42%6 |
Portfolio Turnover Rate | 54% | 44% |
1 Subscription period for the fund was October 18, 2017, to November 1, 2017, during which time all assets were held in cash. Performance measurement began November 2, 2017, the first business day after the subscription period, at a net asset value of $25.00.
2 Calculated based on average shares outstanding.
3 Total returns do not include account service fees that may have applied in the periods shown. Fund prospectuses provide information about any applicable account service fees.
4 Includes performance-based investment advisory fee increases (decreases) of 0.01%.
5 The ratio of expenses to average net assets for the period net of reduction from custody fee offset arrangements was 0.35%.
6 Annualized.
See accompanying Notes, which are an integral part of the Financial Statements.
32
Global Wellington Fund
Notes to Financial Statements
Vanguard Global Wellington Fund is registered under the Investment Company Act of 1940 as an open-end investment company, or mutual fund. Certain of the fund’s investments are in corporate debt instruments; the issuers’ abilities to meet their obligations may be affected by economic developments in their respective industries. The fund invests in securities of foreign issuers, which may subject it to investment risks not normally associated with investing in securities of U.S. corporations. To minimize the currency risk associated with investment in securities denominated in currencies other than the U.S. dollar, the fund attempts to hedge its currency exposures. The fund offers two classes of shares: Investor Shares and Admiral Shares. Each of the share classes has different eligibility and minimum purchase requirements, and is designed for different types of investors.
A. The following significant accounting policies conform to generally accepted accounting principles for U.S. investment companies. The fund consistently follows such policies in preparing its financial statements.
1. Security Valuation: Securities are valued as of the close of trading on the New York Stock Exchange (generally 4 p.m., Eastern time) on the valuation date. Equity securities are valued at the latest quoted sales prices or official closing prices taken from the primary market in which each security trades; such securities not traded on the valuation date are valued at the mean of the latest quoted bid and asked prices. Bonds and temporary cash investments are valued using the latest bid prices or using valuations based on a matrix system (which considers such factors as security prices, yields, maturities, and ratings), both as furnished by independent pricing services. Structured debt securities, including mortgages and asset-backed securities, are valued using the latest bid prices or using valuations based on a matrix system that considers such factors as issuer, tranche, nominal or option-adjusted spreads, weighted average coupon, weighted average maturity, credit enhancements, and collateral. Investments in Vanguard Market Liquidity Fund are valued at that fund’s net asset value. Securities for which market quotations are not readily available, or whose values have been affected by events occurring before the fund’s pricing time but after the close of the securities’ primary markets, are valued at their fair values calculated according to procedures adopted by the board of trustees. These procedures include obtaining quotations from an independent pricing service, monitoring news to identify significant market- or security-specific events, and evaluating changes in the values of foreign market proxies (for example, ADRs, futures contracts, or exchange-traded funds), between the time the foreign markets close and the fund’s pricing time. When fair-value pricing is employed, the prices of securities used by a fund to calculate its net asset value may differ from quoted or published prices for the same securities.
2. Foreign Currency: Securities and other assets and liabilities denominated in foreign currencies are translated into U.S. dollars using exchange rates obtained from an independent third party as of the fund’s pricing time on the valuation date. Realized gains (losses) and unrealized appreciation (depreciation) on investment securities include the effects of changes in exchange rates since the securities were purchased, combined with the effects of changes in security prices. Fluctuations in the value of other assets and liabilities resulting from changes in exchange rates are recorded as unrealized foreign currency gains (losses) until the assets or liabilities are settled in cash, at which time they are recorded as realized foreign currency gains (losses).
3. Futures Contracts: The fund uses futures contracts to invest in fixed income asset classes with greater efficiency and lower cost than is possible through direct investment, to add value when these instruments are attractively priced, or to adjust sensitivity to changes in interest rates. The primary risks associated with the use of futures contracts are imperfect correlation between
33
Global Wellington Fund
changes in market values of bonds held by the fund and the prices of futures contracts, and the possibility of an illiquid market. Counterparty risk involving futures is mitigated because a regulated clearinghouse is the counterparty instead of the clearing broker. To further mitigate counterparty risk, the fund trades futures contracts on an exchange, monitors the financial strength of its clearing brokers and clearinghouse, and has entered into clearing agreements with its clearing brokers. The clearinghouse imposes initial margin requirements to secure the fund’s performance and requires daily settlement of variation margin representing changes in the market value of each contract. Any assets pledged as initial margin for open contracts are noted in the Statement of Net Assets.
Futures contracts are valued at their quoted daily settlement prices. The notional amounts of the contracts are not recorded in the Statement of Net Assets. Fluctuations in the value of the contracts are recorded in the Statement of Net Assets as an asset (liability) and in the Statement of Operations as unrealized appreciation (depreciation) until the contracts are closed, when they are recorded as realized futures gains (losses).
During the year ended August 31, 2019, the fund’s average investments in long and short futures contracts each represented 3% of net assets, based on the average of the notional amounts at each quarter-end during the period.
4. Forward Currency Contracts: The fund enters into forward currency contracts to protect the value of securities and related receivables and payables against changes in future foreign exchange rates. The fund’s risks in using these contracts include movement in the values of the foreign currencies relative to the U.S. dollar and the ability of the counterparties to fulfill their obligations under the contracts. The fund mitigates its counterparty risk by entering into forward currency contracts only with a diverse group of prequalified counterparties, monitoring their financial strength, entering into master netting arrangements with its counterparties, and requiring its counterparties to transfer collateral as security for their performance. In the absence of a default, the collateral pledged or received by the fund cannot be repledged, resold, or rehypothecated. The master netting arrangements provide that, in the event of a counterparty’s default (including bankruptcy), the fund may terminate the forward currency contracts, determine the net amount owed by either party in accordance with its master netting arrangements, and sell or retain any collateral held up to the net amount owed to the fund under the master netting arrangements. The forward currency contracts contain provisions whereby a counterparty may terminate open contracts if the fund’s net assets decline below a certain level, triggering a payment by the fund if the fund is in a net liability position at the time of the termination. The payment amount would be reduced by any collateral the fund has pledged. Any assets pledged as collateral for open contracts are noted in the Statement of Net Assets. The value of collateral received or pledged is compared daily to the value of the forward currency contracts exposure with each counterparty, and any difference, if in excess of a specified minimum transfer amount, is adjusted and settled within two business days.
Forward currency contracts are valued at their quoted daily prices obtained from an independent third party, adjusted for currency risk based on the expiration date of each contract. The notional amounts of the contracts are not recorded in the Statement of Net Assets. Fluctuations in the value of the contracts are recorded in the Statement of Net Assets as an asset (liability) and in the Statement of Operations as unrealized appreciation (depreciation) until the contracts are closed, when they are recorded as realized forward currency contract gains (losses).
During the year ended August 31, 2019, the fund’s average investment in forward currency contracts represented 12% of net assets, based on the average of notional amounts at each quarter-end during the period.
34
Global Wellington Fund
5. To Be Announced (TBA) Transactions: A TBA transaction is an agreement to buy or sell mortgage-backed securities with agreed-upon characteristics (face amount, coupon, maturity) for settlement at a future date. The fund may be a seller of TBA transactions to reduce its exposure to the mortgage-backed securities market or in order to sell mortgage-backed securities it owns under delayed-delivery arrangements. When the fund is a buyer of TBA transactions, it maintains cash or short-term investments in an amount sufficient to meet the purchase price at the settlement date of the TBA transaction. The primary risk associated with TBA transactions is that a counterparty may default on its obligations. The fund mitigates its counterparty risk by, among other things, performing a credit analysis of counterparties, allocating transactions among numerous counterparties, and monitoring its exposure to each counterparty. The fund may also enter into a Master Securities Forward Transaction Agreement (MSFTA) with certain counterparties and require them to transfer collateral as security for their performance. In the absence of a default, the collateral pledged or received by the fund cannot be repledged, resold, or rehypothecated. Under an MSFTA, upon a counterparty default (including bankruptcy), the fund may terminate any TBA transactions with that counterparty, determine the net amount owed by either party in accordance with its master netting arrangements, and sell or retain any collateral held up to the net amount owed to the fund under the master netting arrangements.
6. Federal Income Taxes: The fund intends to continue to qualify as a regulated investment company and distribute all of its taxable income. Management has analyzed the fund’s tax positions taken for all open federal income tax years (August 31, 2018–2019), and has concluded that no provision for federal income tax is required in the fund’s financial statements.
7. Distributions: Distributions to shareholders are recorded on the ex-dividend date. Distributions are determined on a tax basis and may differ from net investment income and realized capital gains for financial reporting purposes.
8. Securities Lending: To earn additional income, the fund lends its securities to qualified institutional borrowers. Security loans are subject to termination by the fund at any time, and are required to be secured at all times by collateral in an amount at least equal to the market value of securities loaned. Daily market fluctuations could cause the value of loaned securities to be more or less than the value of the collateral received. When this occurs, the collateral is adjusted and settled before the opening of the market on the next business day. The fund further mitigates its counterparty risk by entering into securities lending transactions only with a diverse group of prequalified counterparties, monitoring their financial strength, and entering into master securities lending agreements with its counterparties. The master securities lending agreements provide that, in the event of a counterparty’s default (including bankruptcy), the fund may terminate any loans with that borrower, determine the net amount owed, and sell or retain the collateral up to the net amount owed to the fund; however, such actions may be subject to legal proceedings. While collateral mitigates counterparty risk, in the event of a default, the fund may experience delays and costs in recovering the securities loaned. The fund invests cash collateral received in Vanguard Market Liquidity Fund, and records a liability in the Statement of Net Assets for the return of the collateral, during the period the securities are on loan. Securities lending income represents fees charged to borrowers plus income earned on invested cash collateral, less expenses associated with the loan. During the term of the loan, the fund is entitled to all distributions made on or in respect of the loaned securities.
9. Credit Facility: The fund and certain other funds managed by The Vanguard Group (“Vanguard”) participate in a $4.3 billion committed credit facility provided by a syndicate of lenders pursuant to a credit agreement that may be renewed annually; each fund is individually liable for its borrowings,
35
Global Wellington Fund
if any, under the credit facility. Borrowings may be utilized for temporary and emergency purposes, and are subject to the fund’s regulatory and contractual borrowing restrictions. The participating funds are charged administrative fees and an annual commitment fee of 0.10% of the undrawn amount of the facility; these fees are allocated to the funds based on a method approved by the fund’s board of trustees and included in Management and Administrative expenses on the fund’s Statement of Operations. Any borrowings under this facility bear interest at a rate based upon the higher of the one-month London Interbank Offered Rate, federal funds effective rate, or overnight bank funding rate plus an agreed-upon spread.
The fund had no borrowings outstanding at August 31, 2019, or at any time during the period then ended.
10. Other: Dividend income is recorded on the ex-dividend date. Interest income includes income distributions received from Vanguard Market Liquidity Fund and is accrued daily. Premiums and discounts on debt securities purchased are amortized and accreted, respectively, to interest income over the lives of the respective securities. Security transactions are accounted for on the date securities are bought or sold. Costs used to determine realized gains (losses) on the sale of investment securities are those of the specific securities sold.
Each class of shares has equal rights as to assets and earnings, except that each class separately bears certain class-specific expenses related to maintenance of shareholder accounts (included in Management and Administrative expenses) and shareholder reporting. Marketing and distribution expenses are allocated to each class of shares based on a method approved by the board of trustees. Income, other non-class-specific expenses, and gains and losses on investments are allocated to each class of shares based on its relative net assets.
B. Wellington Management Company LLP provides investment advisory services to the fund for a fee calculated at an annual percentage rate of average net assets. The basic fee is subject to quarterly adjustments based on the fund’s performance relative to the Global Wellington Composite Index, comprising the FTSE Developed Index and the Bloomberg Barclays Fixed Income Composite Index, since December 1, 2017. For the year ended August 31, 2019, the investment advisory fee represented an effective annual basic rate of 0.15% of the fund’s average net assets before an increase of $58,000 (0.01%) based on performance.
C. In accordance with the terms of a Funds’ Service Agreement (the “FSA”) between Vanguard and the fund, Vanguard furnishes to the fund corporate management, administrative, marketing, and distribution services at Vanguard’s cost of operations (as defined by the FSA). These costs of operations are allocated to the fund based on methods and guidelines approved by the board of trustees and are generally settled twice a month.
Upon the request of Vanguard, the fund may invest up to 0.40% of its net assets as capital in Vanguard. At August 31, 2019, the fund had contributed to Vanguard capital in the amount of $47,000, representing less than 0.01% of the fund’s net assets and 0.02% of Vanguard’s capital received pursuant to the FSA. The fund’s trustees and officers are also directors and employees, respectively, of Vanguard.
D. The fund’s custodian bank has agreed to reduce its fees when the fund maintains cash on deposit in the non-interest-bearing custody account. For the year ended August 31, 2019, custodian fee offset arrangements reduced the fund’s expenses by $19,000 (an annual rate of 0.00% of average net assets).
36
Global Wellington Fund
E. Various inputs may be used to determine the value of the fund’s investments. These inputs are summarized in three broad levels for financial statement purposes. The inputs or methodologies used to value securities are not necessarily an indication of the risk associated with investing in those securities.
Level 1—Quoted prices in active markets for identical securities.
Level 2—Other significant observable inputs (including quoted prices for similar securities, interest rates, prepayment speeds, credit risk, etc.).
Level 3—Significant unobservable inputs (including the fund’s own assumptions used to determine the fair value of investments). Any investments valued with significant unobservable inputs are noted on the Statement of Net Assets.
The following table summarizes the market value of the fund’s investments and derivatives as of August 31, 2019, based on the inputs used to value them:
| | Level 1 | | Level 2 | | Level 3 | |
Investments | | ($000 | ) | ($000 | ) | ($000 | ) |
Common Stocks | | 373,593 | | 275,897 | | — | |
U.S. Government and Agency Obligations | | — | | 42,391 | | — | |
Asset-Backed/Commercial Mortgage-Backed Securities | | — | | 21,616 | | — | |
Corporate Bonds | | — | | 224,274 | | — | |
Sovereign Bonds | | — | | 41,750 | | — | |
Taxable Municipal Bonds | | — | | 9,166 | | — | |
Temporary Cash Investments | | 14,159 | | — | | — | |
Futures Contracts—Assets1 | | — | | — | | — | |
Futures Contracts—Liabilities1 | | (3 | ) | — | | — | |
Forward Currency Contracts—Assets | | — | | 621 | | — | |
Forward Currency Contracts—Liabilities | | — | | (15 | ) | — | |
Total | | 387,749 | | 615,700 | | — | |
1 Represents variation margin on the last day of the reporting period.
F. At August 31, 2019, the fair values of derivatives were reflected in the Statement of Net Assets as follows:
| | Interest Rate | | Currency | | | |
| | Contracts | | Contracts | | Total | |
Statement of Net Assets Caption | | ($000 | ) | ($000 | ) | ($000 | ) |
Variation Margin Receivable—Futures Contracts | | — | | — | | — | |
Unrealized Appreciation—Forward Currency Contracts | | — | | 621 | | 621 | |
Total Assets | | — | | 621 | | 621 | |
| | | | | | | |
Variation Margin Payable—Futures Contracts | | (3 | ) | — | | (3 | ) |
Unrealized Depreciation—Forward Currency Contracts | | — | | (15 | ) | (15 | ) |
Total Liabilities | | (3 | ) | (15 | ) | (18 | ) |
37
Global Wellington Fund
Realized net gain (loss) and the change in unrealized appreciation (depreciation) on derivatives for the year ended August 31, 2019, were:
| | Interest Rate | | Currency | | | |
| | Contracts | | Contracts | | Total | |
Realized Net Gain (Loss) on Derivatives | | ($000 | ) | ($000 | ) | ($000 | ) |
Futures Contracts | | 317 | | — | | 317 | |
Forward Currency Contracts | | — | | 7,238 | | 7,238 | |
Realized Net Gain (Loss) on Derivatives | | 317 | | 7,238 | | 7,555 | |
| | | | | | | |
Change in Unrealized Appreciation (Depreciation) on Derivatives | | | | | | | |
Futures Contracts | | 471 | | — | | 471 | |
Forward Currency Contracts | | — | | 773 | | 773 | |
Change in Unrealized Appreciation (Depreciation) on Derivatives | | 471 | | 773 | | 1,244 | |
G. Permanent differences between book-basis and tax-basis components of net assets are reclassified among capital accounts in the financial statements to reflect their tax character. These reclassifications have no effect on net assets or net asset value per share. As of period end, permanent differences primarily attributable to foreign currency transactions were reclassified between the individual components of total distributable earnings (loss).
| | Amount | |
| | ($000 | ) |
Paid-in Capital | | — | |
Total Distributable Earnings (Loss) | | — | |
Temporary differences between book-basis and tax-basis components of total distributable earnings (loss) arise when certain items of income, gain, or loss are recognized in different periods for financial statement and tax purposes; these differences will reverse at some time in the future. The differences are primarily related to the tax deferral of losses on wash sales and straddles; the realization of unrealized gains or losses on certain futures contracts; and forward currency contracts and the deferral of post-October capital losses to future periods. As of period end, the tax-basis components of total distributable earnings (loss) are detailed in the table as follows:
| | Amount | |
| | ($000 | ) |
Undistributed Ordinary Income | | 3,726 | |
Undistributed Long-Term Gains | | — | |
Capital Loss Carryforwards (Non-expiring)* | | (6,241 | ) |
Net Unrealized Gains (Losses) | | 57,415 | |
* Includes losses of $6,241,000 realized subsequent to October 31, 2018, which are deferred and will be treated as realized for tax purposes in the next fiscal year. The fund used capital loss carryforwards of $2,136,000 to offset taxable capital gains realized during the year ended August 31, 2019, reducing the amount of capital gains that would otherwise be available to distribute to shareholders.
38
Global Wellington Fund
As of August 31, 2019, gross unrealized appreciation and depreciation for investments and derivatives based on cost for U.S. federal income tax purposes were as follows:
| | Amount | |
| | ($000 | ) |
Tax Cost | | 945,402 | |
Gross Unrealized Appreciation | | 97,438 | |
Gross Unrealized Depreciation | | (39,995 | ) |
Net Unrealized Appreciation (Depreciation) | | 57,443 | |
H. During the year ended August 31, 2019, the fund purchased $466,460,000 of investment securities and sold $376,626,000 of investment securities, other than U.S. government securities and temporary cash investments. Purchases and sales of U.S. government securities were $108,773,000 and $100,679,000, respectively.
I. Capital share transactions for each class of shares were:
| | Year Ended | | October 18, 20171 to | |
| | August 31, 2019 | | August 31, 2018 | |
| | Amount | | Shares | | Amount | | Shares | |
| | ($000 | ) | (000 | ) | ($000 | ) | (000 | ) |
Investor Shares | | | | | | | | | |
Issued | | 57,984 | | 2,861 | | 300,032 | | 14,826 | |
Issued in Lieu of Cash Distributions | | 3,350 | | 166 | | 2,158 | | 107 | |
Redeemed | | (64,165 | ) | (3,183 | ) | (132,498 | ) | (6,538 | ) |
Net Increase (Decrease)—Investor Shares | | (2,831 | ) | (156 | ) | 169,692 | | 8,395 | |
Admiral Shares | | | | | | | | | |
Issued | | 372,819 | | 14,761 | | 965,403 | | 38,145 | |
Issued in Lieu of Cash Distributions | | 14,816 | | 586 | | 7,432 | | 294 | |
Redeemed | | (311,923 | ) | (12,339 | ) | (267,521 | ) | (10,570 | ) |
Net Increase (Decrease)—Admiral Shares | | 75,712 | | 3,008 | | 705,314 | | 27,869 | |
1 Commencement of subscription period for the fund.
J. Management has determined that no other events or transactions occurred subsequent to August 31, 2019, that would require recognition or disclosure in these financial statements.
39
Report of Independent Registered Public Accounting Firm
To the Board of Trustees of Vanguard World Fund and Shareholders of Vanguard Global Wellington Fund
Opinion on the Financial Statements
We have audited the accompanying statement of net assets of Vanguard Global Wellington Fund (one of the funds constituting Vanguard World Fund, referred to hereafter as the “Fund”) as of August 31, 2019, the related statement of operations for the year ended August 31, 2019, the statement of changes in net assets, including the related notes, and the financial highlights for the period from October 18, 2017 (commencement of subscription period) through August 31, 2019 (collectively referred to as the “financial statements”). In our opinion, the financial statements present fairly, in all material respects, the financial position of the Fund as of August 31, 2019, the results of its operations for the year then ended, the changes in its net assets and the financial highlights for the period from October 18, 2017 (commencement of subscription period) through August 31, 2019 in conformity with accounting principles generally accepted in the United States of America.
Basis for Opinion
These financial statements are the responsibility of the Fund’s management. Our responsibility is to express an opinion on the Fund’s financial statements based on our audits. We are a public accounting firm registered with the Public Company Accounting Oversight Board (United States) (“PCAOB”) and are required to be independent with respect to the Fund in accordance with the U.S. federal securities laws and the applicable rules and regulations of the Securities and Exchange Commission and the PCAOB.
We conducted our audits of these financial statements in accordance with the standards of the PCAOB. Those standards require that we plan and perform the audit to obtain reasonable assurance about whether the financial statements are free of material misstatement, whether due to error or fraud.
Our audits included performing procedures to assess the risks of material misstatement of the financial statements, whether due to error or fraud, and performing procedures that respond to those risks. Such procedures included examining, on a test basis, evidence regarding the amounts and disclosures in the financial statements. Our audits also included evaluating the accounting principles used and significant estimates made by management, as well as evaluating the overall presentation of the financial statements. Our procedures included confirmation of securities owned as of August 31, 2019 by correspondence with the custodian and brokers and by agreement to the underlying ownership records of the transfer agent; when replies were not received from brokers, we performed other auditing procedures. We believe that our audits provide a reasonable basis for our opinion.
/s/PricewaterhouseCoopers LLP
Philadelphia, Pennsylvania
October 18, 2019
We have served as the auditor of one or more investment companies in The Vanguard Group of Funds since 1975.
40
|
Special 2019 tax information (unaudited) for Vanguard Global Wellington Fund |
This information for the fiscal year ended August 31, 2019, is included pursuant to provisions of the Internal Revenue Code.
The fund distributed $1,615,000 as capital gain dividends (20% rate gain distributions) to shareholders during the fiscal year.
The fund distributed $13,577,000 of qualified dividend income to shareholders during the fiscal year.
For corporate shareholders, 30.5% of investment income (dividend income plus short-term gains, if any) qualifies for the dividends-received deduction.
The fund designates to shareholders foreign source income of $10,012,000 and foreign taxes paid of $758,000. Shareholders will receive more detailed information with their Form 1099-DIV in January 2020 to determine the calendar-year amounts to be included on their 2019 tax returns.
41
BLOOMBERG is a trademark and service mark of Bloomberg Finance L.P. BARCLAYS is a trademark and service mark of Barclays Bank Plc, used under license. Bloomberg Finance L.P. and its affiliates, including Bloomberg Index Services Limited BISL) (collectively, Bloomberg), or Bloomberg’s licensors, own all proprietary rights in the Bloomberg Barclays Fixed Income Composite Index, which is composed of 80% Bloomberg Barclays Global Aggregate Credit Index (USD Hedged), 10% Bloomberg Barclays Global Aggregate Treasury Index (USD Hedged), and 10% Bloomberg Barclays Global Aggregate Securitized Index (USD Hedged) (the Indices or Bloomberg Barclays Indices).
Neither Barclays Bank Plc, Barclays Capital Inc., or any affiliate (collectively Barclays) or Bloomberg is the issuer or producer of the Global Wellington Fund and neither Bloomberg nor Barclays has any responsibilities, obligations or duties to investors in the Global Wellington Fund. The Indices are licensed for use by The Vanguard Group, Inc. (Vanguard) as the sponsor of the Global Wellington Fund. Bloomberg and Barclays’ only relationship with Vanguard in respect to the Indices is the licensing of the Indices, which are determined, composed and calculated by BISL, or any successor thereto, without regard to the Issuer or the Global Wellington Fund or the owners of the Global Wellington Fund.
Additionally, Vanguard may for itself execute transaction(s) with Barclays in or relating to the Indices in connection with the Global Wellington Fund. Investors acquire the Global Wellington Fund from Vanguard and investors neither acquire any interest in the Indices nor enter into any relationship of any kind whatsoever with Bloomberg or Barclays upon making an investment in the Global Wellington Fund. The Global Wellington Fund is not sponsored, endorsed, sold or promoted by Bloomberg or Barclays. Neither Bloomberg nor Barclays makes any representation or warranty, express or implied regarding the advisability of investing in the Global Wellington Fund or the advisability of investing in securities generally or the ability of the Indices to track corresponding or relative market performance. Neither Bloomberg nor Barclays has passed on the legality or suitability of the Global Wellington Fund with respect to any person or entity. Neither Bloomberg nor Barclays is responsible for and has not participated in the determination of the timing of, prices at, or quantities of the Global Wellington Fund to be issued. Neither Bloomberg nor Barclays has any obligation to take the needs of the Issuer or the owners of the Global Wellington Fund or any other third party into consideration in determining, composing or calculating the Indices. Neither Bloomberg nor Barclays has any obligation or liability in connection with administration, marketing or trading of the Global Wellington Fund.
42
The licensing agreement between Bloomberg and Barclays is solely for the benefit of Bloomberg and Barclays and not for the benefit of the owners of the Global Wellington Fund, investors or other third parties. In addition, the licensing agreement between Vanguard and Bloomberg is solely for the benefit of Vanguard and Bloomberg and not for the benefit of the owners of the Global Wellington Fund, investors or other third parties.
NEITHER BLOOMBERG NOR BARCLAYS SHALL HAVE ANY LIABILITY TO THE ISSUER, INVESTORS OR TO OTHER THIRD PARTIES FOR THE QUALITY, ACCURACY AND/OR COMPLETENESS OF THE BLOOMBERG BARCLAYS INDICES OR ANY DATA INCLUDED THEREIN OR FOR INTERRUPTIONS IN THE DELIVERY OF THE BLOOMBERG BARCLAYS INDICES. NEITHER BLOOMBERG NOR BARCLAYS MAKES ANY WARRANTY, EXPRESS OR IMPLIED, AS TO RESULTS TO BE OBTAINED BY THE ISSUER, THE INVESTORS OR ANY OTHER PERSON OR ENTITY FROM THE USE OF THE BLOOMBERG BARCLAYS INDICES OR ANY DATA INCLUDED THEREIN. NEITHER BLOOMBERG NOR BARCLAYS MAKES ANY EXPRESS OR IMPLIED WARRANTIES, AND EACH HEREBY EXPRESSLY DISCLAIMS ALL WARRANTIES OF MERCHANTABILITY OR FITNESS FOR A PARTICULAR PURPOSE OR USE WITH RESPECT TO THE BLOOMBERG BARCLAYS INDICES OR ANY DATA INCLUDED THEREIN. BLOOMBERG RESERVES THE RIGHT TO CHANGE THE METHODS OF CALCULATION OR PUBLICATION, OR TO CEASE THE CALCULATION OR PUBLICATION OF THE BLOOMBERG BARCLAYS INDICES, AND NEITHER BLOOMBERG NOR BARCLAYS SHALL BE LIABLE FOR ANY MISCALCULATION OF OR ANY INCORRECT, DELAYED OR INTERRUPTED PUBLICATION WITH RESPECT TO ANY OF THE BLOOMBERG BARCLAYS INDICES. NEITHER BLOOMBERG NOR BARCLAYS SHALL BE LIABLE FOR ANY DAMAGES, INCLUDING, WITHOUT LIMITATION, ANY SPECIAL, INDIRECT OR CONSEQUENTIAL DAMAGES, OR ANY LOST PROFITS AND EVEN IF ADVISED OF THE POSSIBILITY OF SUCH, RESULTING FROM THE USE OF THE BLOOMBERG BARCLAYS INDICES OR ANY DATA INCLUDED THEREIN OR WITH RESPECT TO THE GLOBAL WELLINGTON FUND.
None of the information supplied by Bloomberg or Barclays and used in this publication may be reproduced in any manner without the prior written permission of both Bloomberg and Barclays Capital, the investment banking division of Barclays Bank Plc. Barclays Bank Plc is registered in England No. 1026167. Registered office 1 Churchill Place London E14 5HP.
© 2019 Bloomberg. Used with Permission.
Source: Bloomberg Index Services Limited. Copyright 2019, Bloomberg. All rights reserved.
43
This page intentionally left blank.
This page intentionally left blank.
This page intentionally left blank.
The People Who Govern Your Fund
The trustees of your mutual fund are there to see that the fund is operated and managed in your best interests since, as a shareholder, you are a part owner of the fund. Your fund’s trustees also serve on the board of directors of The Vanguard Group, Inc., which is owned by the Vanguard funds and provides services to them.
A majority of Vanguard’s board members are independent, meaning that they have no affiliation with Vanguard or the funds they oversee, apart from the sizable personal investments they have made as private individuals. The independent board members have distinguished backgrounds in business, academia, and public service. Each of the trustees and executive officers oversees 212 Vanguard funds.
Information for each trustee and executive officer of the fund appears below. The mailing address of the trustees and officers is P.O. Box 876, Valley Forge, PA 19482. More information about the trustees is in the Statement of Additional Information, which can be obtained, without charge, by contacting Vanguard at 800-662-7447, or online at vanguard.com.
Interested Trustee1
Mortimer J. Buckley
Born in 1969. Trustee since January 2018. Principal occupation(s) during the past five years and other experience: chairman of the board (January 2019– present) of Vanguard and of each of the investment companies served by Vanguard; chief executive officer (January 2018–present) of Vanguard; chief executive officer, president, and trustee (January 2018–present) of each of the investment companies served by Vanguard; president and director (2017–present) of Vanguard; and president (February 2018–present) of Vanguard Marketing Corporation. Chief investment officer (2013–2017), managing director (2002–2017), head of the Retail Investor Group (2006–2012), and chief information officer (2001–2006) of Vanguard. Chairman of the board (2011–2017) and trustee (2009–2017) of the Children’s Hospital of Philadelphia; trustee (2018–present) of The Shipley School.
Independent Trustees
Emerson U. Fullwood
Born in 1948. Trustee since January 2008. Principal occupation(s) during the past five years and other experience: executive chief staff and marketing officer for North America and corporate vice president (retired 2008) of Xerox Corporation (document management products and services). Former president of the Worldwide Channels Group, Latin America, and Worldwide Customer Service and executive chief staff officer of Developing Markets of Xerox. Executive in residence and 2009–2010 Distinguished Minett Professor at the Rochester Institute of Technology. Director of SPX FLOW, Inc. (multi-industry manufacturing). Director of the University of Rochester Medical Center, the Monroe Community College Foundation, the United Way of Rochester, North Carolina A&T University, and Roberts Wesleyan College. Trustee of the University of Rochester.
Amy Gutmann
Born in 1949. Trustee since June 2006. Principal occupation(s) during the past five years and other experience: president (2004–present) of the University of Pennsylvania. Christopher H. Browne Distinguished Professor of Political Science, School of Arts and Sciences, and professor of communication, Annenberg School for Communication, with secondary faculty appointments in the Department of Philosophy, School of Arts and Sciences, and at the Graduate School of Education, University of Pennsylvania. Trustee of the National Constitution Center.
F. Joseph Loughrey
Born in 1949. Trustee since October 2009. Principal occupation(s) during the past five years and other experience: president and chief operating officer (retired 2009) and vice chairman of the board (2008–2009) of Cummins Inc. (industrial machinery). Chairman of the board of Hillenbrand, Inc. (specialized consumer services), and the Lumina Foundation.
1 Mr. Buckley is considered an “interested person,” as defined in the Investment Company Act of 1940, because he is an officer of the Vanguard funds.
Director of the V Foundation and Oxfam America. Member of the advisory council for the College of Arts and Letters and chair of the advisory board to the Kellogg Institute for International Studies, both at the University of Notre Dame.
Mark Loughridge
Born in 1953. Trustee since March 2012. Principal occupation(s) during the past five years and other experience: senior vice president and chief financial officer (retired 2013) of IBM (information technology services). Fiduciary member of IBM’s Retirement Plan Committee (2004–2013), senior vice president and general manager (2002–2004) of IBM Global Financing, vice president and controller (1998–2002) of IBM, and a variety of other prior management roles at IBM. Member of the Council on Chicago Booth.
Scott C. Malpass
Born in 1962. Trustee since March 2012. Principal occupation(s) during the past five years and other experience: chief investment officer (1989–present) and vice president (1996–present) of the University of Notre Dame. Assistant professor of finance at the Mendoza College of Business, University of Notre Dame, and member of the Notre Dame 403(b) Investment Committee. Chairman of the board of TIFF Advisory Services, Inc. Member of the board of Catholic Investment Services, Inc. (investment advisors) and the board of superintendence of the Institute for the Works of Religion.
Deanna Mulligan
Born in 1963. Trustee since January 2018. Principal occupation(s) during the past five years and other experience: president (2010–present) and chief executive officer (2011–present) of The Guardian Life Insurance Company of America. Chief operating officer (2010–2011) and executive vice president (2008–2010) of Individual Life and Disability of The Guardian Life Insurance Company of America. Member of the board of The Guardian Life Insurance Company of America, the American Council of Life Insurers, the Partnership for New York City (business leadership), and the Committee Encouraging Corporate Philanthropy. Trustee of the Economic Club of New York and the Bruce Museum (arts and science). Member of the Advisory Council for the Stanford Graduate School of Business.
André F. Perold
Born in 1952. Trustee since December 2004. Principal occupation(s) during the past five years and other experience: George Gund Professor of Finance and Banking, Emeritus at the Harvard Business School (retired 2011). Chief investment officer and co-managing partner of HighVista Strategies LLC (private investment firm). Board of advisors and investment committee member of the Museum of Fine Arts Boston. Board member (2018–present) of RIT Capital Partners (investment firm); investment committee member of Partners Health Care System.
Sarah Bloom Raskin
Born in 1961. Trustee since January 2018. Principal occupation(s) during the past five years and other experience: deputy secretary (2014–2017) of the United States Department of the Treasury. Governor (2010–2014) of the Federal Reserve Board. Commissioner (2007–2010) of financial regulation for the State of Maryland. Member of the board of directors (2012–2014) of Neighborhood Reinvestment Corporation. Director (2017–present) of i(x) Investments, LLC; director (2017–present) of Reserve Trust. Rubinstein Fellow (2017–present) of Duke University; trustee (2017–present) of Amherst College.
Peter F. Volanakis
Born in 1955. Trustee since July 2009. Principal occupation(s) during the past five years and other experience: president and chief operating officer (retired 2010) of Corning Incorporated (communications equipment) and director of Corning Incorporated (2000–2010) and Dow Corning (2001–2010). Director (2012) of SPX Corporation (multi-industry manufacturing). Overseer of the Amos Tuck School of Business Administration, Dartmouth College (2001–2013). Chairman of the board of trustees of Colby-Sawyer College. Member of the board of Hypertherm Inc. (industrial cutting systems, software, and consumables).
Executive Officers
Glenn Booraem
Born in 1967. Principal occupation(s) during the past five years and other experience: principal of Vanguard. Investment stewardship officer (2017–present), treasurer (2015–2017), controller (2010–2015), and assistant controller (2001–2010) of each of the investment companies served by Vanguard.
Christine M. Buchanan
Born in 1970. Principal occupation(s) during the past five years and other experience: principal of Vanguard and global head of Fund Administration at Vanguard. Treasurer (2017–present) of each of the investment companies served by Vanguard. Partner (2005–2017) at KPMG LLP (audit, tax, and advisory services).
Thomas J. Higgins
Born in 1957. Principal occupation(s) during the past five years and other experience: principal of Vanguard. Chief financial officer (2008–present) and treasurer (1998–2008) of each of the investment companies served by Vanguard.
Peter Mahoney
Born in 1974. Principal occupation(s) during the past five years and other experience: principal of Vanguard. Controller (2015–present) of each of the investment companies served by Vanguard. Head of International Fund Services (2008–2014) at Vanguard.
Anne E. Robinson
Born in 1970. Principal occupation(s) during the past five years and other experience: general counsel (2016–present) of Vanguard. Secretary (2016–present) of Vanguard and of each of the investment companies served by Vanguard. Managing director (2016–present) of Vanguard. Director and senior vice president (2016–2018) of Vanguard Marketing Corporation. Managing director and general counsel of Global Cards and Consumer Services (2014–2016) at Citigroup. Counsel (2003–2014) at American Express.
Michael Rollings
Born in 1963. Principal occupation(s) during the past five years and other experience: finance director (2017–present) and treasurer (2017) of each of the investment companies served by Vanguard. Managing director (2016–present) of Vanguard. Chief financial officer (2016–present) of Vanguard. Director (2016–present) of Vanguard Marketing Corporation. Executive vice president and chief financial officer (2006–2016) of MassMutual Financial Group.
John E. Schadl
Born in 1972. Principal occupation(s) during the past five years and other experience: principal of Vanguard. Chief compliance officer (2019–present) of Vanguard and of each of the investment companies served by Vanguard. Assistant vice president (May 2019–present) of Vanguard Marketing Corporation.
Vanguard Senior Management Team
Joseph Brennan | Chris D. McIsaac |
Mortimer J. Buckley | James M. Norris |
Gregory Davis | Thomas M. Rampulla |
John James | Karin A. Risi |
Martha G. King | Anne E. Robinson |
John T. Marcante | Michael Rollings |
| 
|
| |
| P.O. Box 2600 |
| Valley Forge, PA 19482-2600 |
Connect with Vanguard® > vanguard.com
Fund Information > 800-662-7447
Direct Investor Account Services > 800-662-2739
Institutional Investor Services > 800-523-1036
Text Telephone for People
Who Are Deaf or Hard of Hearing > 800-749-7273
This material may be used in conjunction with the offering of shares of any Vanguard fund only if preceded or accompanied by the fund’s current prospectus.
All comparative mutual fund data are from Morningstar, Inc., unless otherwise noted.
You can obtain a free copy of Vanguard’s proxy voting guidelines by visiting vanguard.com/proxyreporting or by calling Vanguard at 800-662-2739. The guidelines are also available from the SEC’s website, www.sec.gov. In addition, you may obtain a free report on how your fund voted the proxies for securities it owned during the 12 months ended June 30. To get the report, visit either vanguard.com/proxyreporting or www.sec.gov.
You can review information about your fund on the SEC’s website, and you can receive copies of this information, for a fee, by sending a request via email addressed to publicinfo@sec.gov.
CFA® is a registered trademark owned by CFA Institute.
| © 2019 The Vanguard Group, Inc. |
| All rights reserved. |
| Vanguard Marketing Corporation, Distributor. |
| |
| Q15670 102019 |

Annual Report | August 31, 2019 Vanguard Global Wellesley® Income Fund |
See the inside front cover for important information about access to your fund’s annual and semiannual shareholder reports. |
Important information about access to shareholder reports
Beginning on January 1, 2021, as permitted by regulations adopted by the Securities and Exchange Commission, paper copies of your fund’s annual and semiannual shareholder reports will no longer be sent to you by mail, unless you specifically request them. Instead, you will be notified by mail each time a report is posted on the website and will be provided with a link to access the report.
If you have already elected to receive shareholder reports electronically, you will not be affected by this change and do not need to take any action. You may elect to receive shareholder reports and other communications from the fund electronically by contacting your financial intermediary (such as a broker-dealer or bank) or, if you invest directly with the fund, by calling Vanguard at one of the phone numbers on the back cover of this report or by logging on to vanguard.com.
You may elect to receive paper copies of all future shareholder reports free of charge. If you invest through a financial intermediary, you can contact the intermediary to request that you continue to receive paper copies. If you invest directly with the fund, you can call Vanguard at one of the phone numbers on the back cover of this report or log on to vanguard.com. Your election to receive paper copies will apply to all the funds you hold through an intermediary or directly with Vanguard.
Contents | |
| |
A Note From Our Chairman | 1 |
Your Fund’s Performance at a Glance | 2 |
Advisor’s Report | 3 |
About Your Fund’s Expenses | 7 |
Performance Summary | 9 |
Financial Statements | 12 |
Please note: The opinions expressed in this report are just that—informed opinions. They should not be considered promises or advice. Also, please keep in mind that the information and opinions cover the period through the date on the front of this report. Of course, the risks of investing in your fund are spelled out in the prospectus.
A Note From Our Chairman

Tim Buckley
Chairman and Chief Executive Officer
Dear Shareholder,
Recent volatility in financial markets—affecting stocks, bonds, and commodities—has been a good reminder of the wise old adage, “Never keep all your eggs in one basket.” Maintaining balance and diversification in your investment portfolio can help to both limit risk and set you up for long-term success.
It’s understandable why some investors might become complacent after a long market run-up like the one that lifted stock prices, especially U.S. stock prices, in the years following the global financial crisis. But failing to rebalance regularly can leave a portfolio with a much different mix of assets than intended and, often, more risk than intended.
Balance across and diversification within asset classes are powerful tools for managing risk and achieving your investment goals. A portfolio’s allocation will determine a large portion of its long-term return and also the majority of its volatility risk. A well-diversified portfolio is less vulnerable to significant swings in the performance of any one segment of the asset classes in which it invests.
Balance and diversification will never eliminate the risk of loss, nor will they guarantee positive returns in a declining market. But they should reduce the chance that you’ll suffer disproportionate losses in one particular high-flying asset class or sector when it comes back to earth. And exposure to all key market components should give you at least some participation in the sectors that are performing best at any given time.
Vanguard is committed to helping you achieve balance and diversification in your portfolios to help meet your investment goals. We thank you for your continued loyalty.
Sincerely,

Mortimer J. Buckley
Chairman and Chief Executive Officer
October 1, 2019
1
Your Fund’s Performance at a Glance
· For the 12 months ended August 31, 2019, Vanguard Global Wellesley Income Fund returned 5.50% for Investor Shares and 5.60% for Admiral Shares. Its composite benchmark index returned 7.00%.
· Investors had a lot to contend with during the year: decelerating global growth, trade disputes, heightened international tensions with Iran, and ongoing uncertainty about Brexit.
· The fund’s stock portfolio underperformed its benchmark equity index. Its results were subpar in six of the 11 industry sectors, with selection weakest in consumer staples and utilities.
· The fixed income portfolio outperformed its benchmark, thanks in part to security selection in investment-grade bonds, particularly in industrials.
· During the period, the fund entered into forward currency contracts to protect the value of its securities, and the related receivables and payments, against changes in future foreign exchange rates. The use of these contracts helped performance.
Market Barometer
| Average Annual Total Returns
Periods Ended August 31, 2019 |
| One Year | Three Years | Five Years |
Stocks | | | |
Russell 1000 Index (Large-caps) | 2.49% | 12.57% | 9.85% |
Russell 2000 Index (Small-caps) | -12.89 | 7.89 | 6.41 |
Russell 3000 Index (Broad U.S. market) | 1.31 | 12.24 | 9.60 |
FTSE All-World ex US Index (International) | -3.18 | 5.97 | 1.71 |
| | | |
Bonds | | | |
Bloomberg Barclays U.S. Aggregate Bond Index | | | |
(Broad taxable market) | 10.17% | 3.09% | 3.35% |
Bloomberg Barclays Municipal Bond Index | | | |
(Broad tax-exempt market) | 8.72 | 3.30 | 3.85 |
FTSE Three-Month U.S. Treasury Bill Index | 2.36 | 1.47 | 0.91 |
| | | |
CPI | | | |
Consumer Price Index | 1.75% | 2.13% | 1.53% |
2
Advisor’s Report
Vanguard Global Wellesley Income Fund returned 5.50% for Investor Shares and 5.60% for Admiral Shares for the 12 months ended August 31, 2019. The fund’s composite benchmark returned 7.00%. It is weighted 65% Bloomberg Barclays Fixed Income Composite Index—made up of 80% Bloomberg Barclays Global Aggregate Credit Index (USD Hedged), 10% Bloomberg Barclays Global Aggregate Treasury Index (USD Hedged), and 10% Bloomberg Barclays Global Aggregate Securitized Index (USD Hedged)—and 35% FTSE Developed High Dividend Yield Index (net of tax).
The investment environment
For the period, the Standard & Poor’s 500 Index returned 2.92%, the MSCI World Index returned 0.84%, and the MSCI EAFE Index returned –3.26%. The U.S. fixed income market advanced with the Bloomberg Barclays U.S. Aggregate Bond Index returning 10.17%. The higher-quality Bloomberg Barclays U.S. Credit A or Better Index returned 12.13%. Non-U.S. bonds returned 11.07%, as measured by the Bloomberg Barclays Global Aggregate ex-USD Hedged Index. The yield on the 10-year U.S. Treasury note started the 12 months at 2.86% and finished at 1.50%.
As we moved further into 2019, global equities rose despite sluggish global growth and geopolitical events dominating news headlines. Trade tensions between China and the United States escalated in May but eased at the end of the second quarter of 2019 after the two countries agreed at the G20 summit to resume trade negotiations.
In Europe, Brexit continues to be a major concern. The U.K. avoided, at least temporarily, an abrupt no-deal departure from the European Union (E.U.) after E.U. leaders granted it a flexible extension through the end of October. U.K. prime minister Theresa May announced that she would resign as the leader of Britain’s Conservative Party after failing to secure a Brexit deal. On the monetary front, dovish central bank rhetoric and policy bolstered global markets. Amid concerns about the downside risks associated with slowing global growth and trade disputes, the U.S. Federal Reserve signaled it was open to rate cuts. The European Central Bank (ECB) hinted that it may lower rates if the outlook for growth and inflation fails to improve.
On the fixed income side, absolute returns across most major fixed income spread sectors were positive for the 12-month period, driven by a decrease in government bond yields. The decline in global sovereign yields accelerated in the later part of the period amid prospects of deteriorating growth and dovish central bank policies. Geopolitical uncertainty remained elevated and global economic momentum slowed.
Monetary policy in the United States continued along a hawkish path for the first half of the period; the Fed hiked rates twice in the second half of 2018 and indicated that more rate increases would follow. In early 2019, however, Fed policy pivoted in response to tepid economic data, trade policy uncertainty, and stubbornly low inflation. As concerns rose about growth in the United States, the Fed cut rates for
3
the first time since 2008. Credit spreads remained generally stable in the earlier part of the period but widened significantly in the fourth quarter of 2018, fueled by concerns of an economic downturn. Credit spreads rebounded following the Fed pivot in early 2019, reversing much of the underperformance seen in late 2018.
Perceived safe-haven currencies like the U.S. dollar and Japanese yen rallied against most other currencies, while emerging markets currencies declined. The euro and British pound also weakened on domestic political uncertainty and divergence from the United States regarding monetary policy.
The fund’s shortfalls
The fund’s equity portfolio underperformed its benchmark, the FTSE Developed High Dividend Yield Index (net of tax). Weak stock selection in consumer staples and utilities weighed on performance. An underweight to consumer staples and an overweight to energy also detracted. Top relative detractors included Kraft Heinz Foods (consumer products; U.S.), Nestlé (consumer products; Switzerland), and China Longyuan Power (wind power producer; China).
On the fixed income side, an overweight to and security selection within utilities, particularly electric, detracted. Within securitized sectors, security selection within 30-year mortgage-backed securities pass-throughs hindered performance. A modest out-of-benchmark allocation to Treasury inflation-protected securities (TIPS) also detracted, as did lack of exposure to select developed markets treasuries. Duration and yield curve positioning detracted from performance as rates fell.
The fund’s successes
In the equity portfolio, strong stock selection within energy, health care, and information technology could not offset the effects of weak selection in other sectors. An over-weighted allocation to information technology and an underweight to materials also contributed. Top relative contributors included KLA (semiconductors; U.S.), AstraZeneca (pharmaceuticals; U.K.), and Koninklijke Philips (medical equipment; Netherlands).
In the fixed income portfolio, security selection within corporate credit, specifically industrial sectors (consumer noncyclicals, technology, capital goods) and financials (banking) contributed the most to relative outperformance. The fund’s positioning within supranationals and local authority also aided relative performance, as did its overall positioning within securitized sectors, particularly an allocation to collateralized mortgage obligations (CMOs).
The fund’s positioning
With a more dovish-leaning Fed, we have positioned the fixed income portfolio with a slight duration overweight relative to the benchmark. We are positioned with a cautious view of risk assets and have been reducing exposure to corporate bonds, with a bias toward holding higher-quality and lower-volatility issues.
4
Credit remains the main investment focus of the portfolio. We are underweight credit risk globally, but overweight in the United States, and we favor higher-quality and less cyclical sectors. We expect our significant U.S. position to benefit from global central bank policy and the global search for yield. Against this overweight to U.S. corporate credit, we are underweight U.K. credit risk given concerns around Brexit. Because of our concerns about the effects of a strong U.S. dollar, global liquidity withdrawal, and trade risks, we are also underweight euro-area credit risk and emerging markets credit risk.
On an industry basis, we favor U.S. financials. The fixed income portfolio is currently overweight banks, but we have gradually reduced European banking exposure because of profitability concerns in the region’s increased political risk and lower-rate environment. The fixed income portfolio is also overweight utilities because of attractive valuations and the likelihood that the sector will outperform when the cycle turns. We are also overweight the securitized sectors, such as asset-backed securities and commercial mortgage-backed securities, which offer attractive value and diversification relative to corporates. We have increased our mortgage positioning to an overweight as valuations have improved and the sector offers good downside protection. Within that, we remain underweight agency pass-throughs as we expect some interest rate volatility to continue. Instead, we favor CMOs, which have more stable cash flows. We believe recovery in energy prices will support headline inflation and are positioned with long inflation breakevens via an allocation to TIPS.
We maintain a modestly pro-cyclical risk posture. U.S. economic growth is slowing, but the risk of recession this year is low. The consumer remains resilient, while manufacturing has retrenched. As the market realigns to slower global growth, we expect tail risk from the shift in global central bank policies to decline.
On the equity side, geopolitical risk remains elevated and trade rhetoric has escalated beyond expectations in recent months, making the potential for the economic impact larger than we anticipated. Looking at the longer-term picture, however, we believe the United States and China will come to an agreement prior to the 2020 U.S. presidential election, as there is ample room for concessions by both governments. In addition, global GDP appears to be slowing, but corporate results continue to exceed expectations and central banks remain accommodative. Our focus on investing in high-quality companies with strong dividend yields should provide some protection in this environment, which we believe could persist as we go further into 2019.
We made several changes to the equity portfolio’s overall positioning during the period. Most notably, we moved from an overweight to an underweight allocation in financials. We also decreased our exposure to information technology. These investment
5
decisions mostly stem from bottom-up risk/return considerations at the individual stock level.
By region, the equity portfolio’s largest allocations, in absolute terms, are to North America and Europe; the latter is the portfolio’s largest relative overweight. Within Europe, we are most overweight euro zone countries, including the Netherlands, France, and Portugal. We are underweight Japan and the rest of the developed Pacific Basin. In most cases, the allocation is a function of large global companies’ corporate domiciles, rather than a reflection of our views of local economies.
At the end of the period, the equity portfolio was most overweighted in communication services, utilities, and consumer discretionary—all sectors where we have found attractively valued companies that present good absolute upside as well as reasonable downside protection through an economic cycle. Our biggest under-weights were in consumer staples, materials, and financials. We initiated new positions in AXA, ABN AMRO Bank, Vinci, the Bank of Nova Scotia, and Pfizer; we eliminated holdings in Roche, Royal Dutch Shell, JPMorgan Chase, Chevron, and Qualcomm.
Respectfully,
Loren L. Moran, CFA
Senior Managing Director and
Fixed Income Portfolio Manager
Michael E. Stack, CFA
Senior Managing Director and
Fixed Income Portfolio Manager
Andre J. Desautels, CFA
Senior Managing Director and
Equity Portfolio Manager
Wellington Management Company LLP
September 23, 2019
6
About Your Fund’s Expenses
As a shareholder of the fund, you incur ongoing costs, which include costs for portfolio management, administrative services, and shareholder reports (like this one), among others. Operating expenses, which are deducted from a fund’s gross income, directly reduce the investment return of the fund.
A fund’s expenses are expressed as a percentage of its average net assets. This figure is known as the expense ratio. The following examples are intended to help you understand the ongoing costs (in dollars) of investing in your fund and to compare these costs with those of other mutual funds. The examples are based on an investment of $1,000 made at the beginning of the period shown and held for the entire period.
The accompanying table illustrates your fund’s costs in two ways:
· Based on actual fund return. This section helps you to estimate the actual expenses that you paid over the period. The “Ending Account Value” shown is derived from the fund’s actual return, and the third column shows the dollar amount that would have been paid by an investor who started with $1,000 in the fund. You may use the information here, together with the amount you invested, to estimate the expenses that you paid over the period.
To do so, simply divide your account value by $1,000 (for example, an $8,600 account value divided by $1,000 = 8.6), then multiply the result by the number given for your fund under the heading “Expenses Paid During Period.”
· Based on hypothetical 5% yearly return. This section is intended to help you compare your fund’s costs with those of other mutual funds. It assumes that the fund had a yearly return of 5% before expenses, but that the expense ratio is unchanged. In this case—because the return used is not the fund’s actual return—the results do not apply to your investment. The example is useful in making comparisons because the Securities and Exchange Commission requires all mutual funds to calculate expenses based on a 5% return. You can assess your fund’s costs by comparing this hypothetical example with the hypothetical examples that appear in shareholder reports of other funds.
Note that the expenses shown in the table are meant to highlight and help you compare ongoing costs only and do not reflect transaction costs incurred by the fund for buying and selling securities. Further, the expenses do not include any purchase, redemption, or account service fees described in the fund prospectus. If such fees were applied to your account, your costs would be higher. Your fund does not carry a “sales load.”
The calculations assume no shares were bought or sold during the period. Your actual costs may have been higher or lower, depending on the amount of your investment and the timing of any purchases or redemptions.
You can find more information about the fund’s expenses, including annual expense ratios, in the Financial Statements section of this report. For additional information on operating expenses and other shareholder costs, please refer to your fund’s current prospectus.
7
Six Months Ended August 31, 2019
| Beginning | Ending | Expenses |
| Account Value | Account Value | Paid During |
Global Wellesley Income Fund | 2/28/2019 | 8/31/2019 | Period |
Based on Actual Fund Return | | | |
Investor Shares | $1,000.00 | $1,055.95 | $2.18 |
Admiral™ Shares | 1,000.00 | 1,056.27 | 1.66 |
Based on Hypothetical 5% Yearly Return | | | |
Investor Shares | $1,000.00 | $1,023.09 | $2.14 |
Admiral Shares | 1,000.00 | 1,023.59 | 1.63 |
The calculations are based on expenses incurred in the most recent six-month period. The fund’s annualized six-month expense ratios for the period are 0.42% for Investor Shares and 0.32% for Admiral Shares. The dollar amounts shown as “Expenses Paid” are equal to the annualized expense ratio multiplied by the average account value over the period, multiplied by the number of days in the most recent six-month period, then divided by the number of days in the most recent 12-month period (184/365).
8
Global Wellesley Income Fund
Performance Summary
All of the returns in this report represent past performance, which is not a guarantee of future results that may be achieved by the fund. (Current performance may be lower or higher than the performance data cited. For performance data current to the most recent month-end, visit our website at vanguard.com/performance.) Note, too, that both investment returns and principal value can fluctuate widely, so an investor’s shares, when sold, could be worth more or less than their original cost. The returns shown do not reflect taxes that a shareholder would pay on fund distributions or on the sale of fund shares.
Cumulative Performance: November 2, 2017, Through August 31, 2019
Initial Investment of $10,000
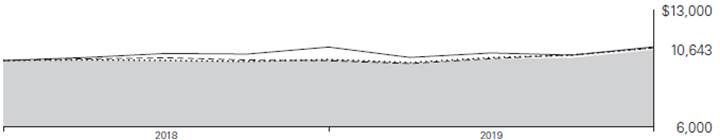
| | | Average Annual Total Returns | | |
| | | Periods Ended August 31, 2019 | | |
| | | | | Since | | Final Value |
| | | One | | Inception | | of a $10,000 |
| | | Year | | (11/2/2017 | ) | Investment |

| Global Wellesley Income Fund Investor Shares | | 5.50% | | 3.47% | | $10,643 |

| Global Wellesley Income Composite Index | | 7.00 | | 4.10 | | 10,762 |

| Bloomberg Barclays Global Aggregate Bond Index | | 7.77 | | 4.08 | | 10,758 |

| FTSE Developed Net Tax Index | | 0.14 | | 4.42 | | 10,822 |
Global Wellesley Income Composite Index: Weighted 65% Bloomberg Barclays Fixed Income Composite Index (composed of 80% Bloomberg Barclays Global Aggregate Credit Index (USD Hedged), 10% Bloomberg Barclays Global Aggregate Treasury Index (USD Hedged), and 10% Bloomberg Barclays Global Aggregate Securitized Index (USD Hedged)), and 35% FTSE Developed High Dividend Yield Index (net of tax).
“Since Inception” performance is calculated from the Investor Shares’ inception date for both the fund and its comparative standards.
See Financial Highlights for dividend and capital gains information.
9
Global Wellesley Income Fund
| | | Average Annual Total Returns | | |
| | | Periods Ended August 31, 2019 | | |
| | | | | Since | | Final Value |
| | | One | | Inception | | of a $50,000 |
| | | Year | | (11/2/2017 | ) | Investment |
Global Wellesley Income Fund Admiral Shares | | 5.60% | | 3.56% | | $53,305 |
Global Wellesley Income Composite Index | | 7.00 | | 4.10 | | 53,808 |
Bloomberg Barclays Global Aggregate Bond Index | | 7.77 | | 4.08 | | 53,788 |
FTSE Developed Net Tax Index | | 0.14 | | 4.42 | | 54,110 |
“Since Inception” performance is calculated from the Admiral Shares’ inception date for both the fund and its comparative standards.
10
Global Wellesley Income Fund
Sector Diversification
As of August 31, 2019
Equity Exposure | | | |
Communication Services | | 14.3 | % |
Consumer Discretionary | | 7.4 | |
Consumer Staples | | 6.8 | |
Energy | | 9.5 | |
Financials | | 22.0 | |
Health Care | | 12.6 | |
Industrials | | 7.4 | |
Information Technology | | 6.6 | |
Materials | | 1.4 | |
Real Estate | | 3.2 | |
Utilities | | 8.8 | |
The table reflects the fund’s equity exposure, based on its investments in stocks. Any holdings in short-term reserves are excluded. Sector categories are based on the Global Industry Classification Standard (“GICS”), except for the “Other” category (if applicable), which includes securities that have not been provided a GICS classification as of the effective reporting period.
Fixed Income Exposure | | | |
Asset-Backed/Commercial Mortgage-Backed | | 9.9 | % |
Finance | | 23.3 | |
Foreign | | 12.6 | |
Government Mortgage-Backed | | 5.3 | |
Industrial | | 38.1 | |
Treasury/Agency | | 2.0 | |
Utilities | | 5.9 | |
Other | | 2.9 | |
The table reflects the fund’s fixed income exposure. Any holdings in short-term reserves are excluded. The agency and mortgage-backed securities sectors may include issues from government-sponsored enterprises; such issues are generally not backed by the full faith and credit of the U.S. government.
The Global Industry Classification Standard (“GICS”) was developed by and is the exclusive property and a service mark of MSCI Inc. (“MSCI”) and Standard and Poor’s, a division of McGraw-Hill Companies, Inc. (“S&P”), and is licensed for use by Vanguard. Neither MSCI, S&P nor any third party involved in making or compiling the GICS or any GICS classification makes any express or implied warranties or representations with respect to such standard or classification (or the results to be obtained by the use thereof), and all such parties hereby expressly disclaim all warranties of originality, accuracy, completeness, merchantability or fitness for a particular purpose with respect to any such standard or classification. Without limiting any of the foregoing, in no event shall MSCI, S&P, any of its affiliates or any third party involved in making or compiling the GICS or any GICS classification have any liability for any direct, indirect, special, punitive, consequential or any other damages (including lost profits) even if notified of the possibility of such damages.
11
Global Wellesley Income Fund
Financial Statements
Statement of Net Assets
As of August 31, 2019
The fund files its complete schedule of portfolio holdings with the Securities and Exchange Commission (SEC) for the first and third quarters of each fiscal year as an exhibit to its reports on Form N-PORT. The fund’s Form N-PORT reports are available on the SEC’s website at www.sec.gov.
| | | | | | | Face | | Market |
| | | | | Maturity | | Amount | | Value· |
| | | Coupon | | Date | | ($000 | ) | ($000) |
U.S. Government and Agency Obligations (6.1%) | | | | | | | | |
United States (6.1%) | | | | | | | | |
1,2 | Fannie Mae Pool | | 3.000% | | 12/1/47 | | 1,494 | | 1,523 |
1,2 | Fannie Mae Pool | | 4.000% | | 11/1/48 | | 1,148 | | 1,195 |
1,2,3 | Fannie Mae Pool | | 3.500% | | 9/1/49 | | 3,080 | | 3,165 |
1,2 | Fannie Mae REMICS | | 2.000% | | 9/25/40 | | 176 | | 175 |
1,2 | Fannie Mae REMICS | | 3.500% | | 6/25/44–6/25/59 | | 2,287 | | 2,439 |
1,2 | Fannie Mae REMICS | | 2.500% | | 5/25/45–3/25/53 | | 1,115 | | 1,128 |
1,2 | Freddie Mac Gold Pool | | 3.000% | | 11/1/47–12/1/47 | | 2,662 | | 2,719 |
1,2 | Freddie Mac Gold Pool | | 3.500% | | 11/1/47–12/1/47 | | 4,849 | | 5,027 |
1,2 | Freddie Mac Gold Pool | | 4.000% | | 10/1/48–12/1/48 | | 1,135 | | 1,178 |
1,2 | Freddie Mac REMICS | | 4.000% | | 12/15/39–8/15/40 | | 1,606 | | 1,717 |
1,2 | Freddie Mac REMICS | | 3.500% | | 9/15/40–11/15/40 | | 568 | | 584 |
1,2 | Freddie Mac REMICS | | 1.750% | | 9/15/42 | | 1,481 | | 1,459 |
1 | Government National Mortgage Assn. | | 2.750% | | 9/20/44 | | 303 | | 310 |
1,3 | UMBS TBA | | 3.000% | | 9/1/34 | | 20 | | 20 |
| United States Treasury Inflation Indexed Bonds | | 0.750% | | 7/15/28 | | 1,450 | | 1,582 |
4 | United States Treasury Note/Bond | | 1.500% | | 10/31/19 | | 365 | | 365 |
| United States Treasury Note/Bond | | 2.375% | | 5/15/29 | | 245 | | 264 |
| United States Treasury Note/Bond | | 3.000% | | 8/15/48 | | 395 | | 485 |
| United States Treasury Note/Bond | | 3.000% | | 2/15/49 | | 270 | | 333 |
| United States Treasury Note/Bond | | 2.875% | | 5/15/49 | | 1,145 | | 1,380 |
| United States Treasury Strip Principal | | 0.000% | | 5/15/47 | | 585 | | 335 |
| United States Treasury Strip Principal | | 0.000% | | 8/15/47 | | 1,450 | | 825 |
Total U.S. Government and Agency Obligations (Cost $27,121) | | | | 28,208 |
Asset-Backed/Commercial Mortgage-Backed Securities (4.2%) | | | | |
Bermuda (0.1%) | | | | |
1,5 | START Ireland | | 4.089% | | 3/15/44 | | 243 | | 249 |
| | | | | | | | | |
Canada (0.3%) | | | | | | | | |
5,6 | Ford Auto Securitization Trust | | 2.354% | | 6/15/23 | | 1,820 | | 1,365 |
| | | | | | | | | |
Cayman Islands (1.5%) | | | | | | | | |
1,5,7 | Atlas Senior Loan Fund V Ltd., 3M USD LIBOR + 1.260% | | 3.582% | | 7/16/29 | | 900 | | 898 |
1,5,7 | KKR CLO 16 Ltd., 3M USD LIBOR + 1.250% | | 3.528% | | 1/20/29 | | 435 | | 435 |
1,5,7 | KKR CLO 17 Ltd., 3M USD LIBOR + 1.340% | | 3.643% | | 4/15/29 | | 875 | | 874 |
1,5,7 | Madison Park Funding XVIII Ltd., 3M USD LIBOR + 1.190% | | 3.468% | | 10/21/30 | | 875 | | 873 |
1,5,7 | Madison Park Funding XXX Ltd., 3M USD LIBOR + 0.750% | | 3.053% | | 4/15/29 | | 1,570 | | 1,553 |
12
Global Wellesley Income Fund
| | | | | | | Face | | Market |
| | | | | Maturity | | Amount | | Value· |
| | | Coupon | | Date | | ($000 | ) | ($000) |
1,5,7 | Magnetite VII Ltd., 3M USD LIBOR + 0.800% | | 3.103% | | 1/15/28 | | 1,510 | | 1,499 |
1,5,7 | Race Point IX CLO Ltd., 3M USD LIBOR + 1.210% | | 3.513% | | 10/15/30 | | 870 | | 869 |
| | | | | | | | | 7,001 |
Spain (0.2%) | | | | | | | | |
8 | Bankia SA | | 4.125% | | 3/24/36 | | 550 | | 979 |
| | | | | | | | | |
United States (2.1%) | | | | | | | | |
1,5 | Angel Oak Mortgage Trust I LLC 2018-3 | | 3.649% | | 9/25/48 | | 560 | | 566 |
1,5 | ARI Fleet Lease Trust 2018-A | | 2.550% | | 10/15/26 | | 167 | | 167 |
1,5,7 | Bristol Park CLO Ltd., 3M USD LIBOR + 1.420% | | 3.723% | | 4/15/29 | | 815 | | 816 |
1,5 | Castlelake Aircraft Securitization Trust 2019-1 | | 3.967% | | 4/15/39 | | 247 | | 252 |
1,5 | Chesapeake Funding II LLC 2017-2A | | 1.990% | | 5/15/29 | | 356 | | 355 |
1,5 | Chesapeake Funding II LLC 2018-2A | | 3.230% | | 8/15/30 | | 723 | | 735 |
1,5 | Chrysler Capital Auto Receivables Trust 2016-A | | 3.250% | | 6/15/22 | | 295 | | 295 |
1,5 | COLT 2018-1 Mortgage Loan Trust | | 2.930% | | 2/25/48 | | 122 | | 123 |
1,5 | COLT 2018-3 Mortgage Loan Trust | | 3.692% | | 10/26/48 | | 172 | | 173 |
1,5 | DB Master Finance LLC | | 3.787% | | 5/20/49 | | 130 | | 135 |
1,5 | DB Master Finance LLC | | 4.021% | | 5/20/49 | | 115 | | 120 |
1,5 | Deephaven Residential Mortgage Trust 2018-1 | | 2.976% | | 12/25/57 | | 217 | | 217 |
1,5 | Enterprise Fleet Financing LLC Series 2018-1 | | 2.870% | | 10/20/23 | | 581 | | 584 |
1,5 | First Investors Auto Owner Trust 2016-1 | | 3.410% | | 4/18/22 | | 662 | | 663 |
1,5 | First Investors Auto Owner Trust 2017-3 | | 2.000% | | 3/15/22 | | 67 | | 67 |
1,5 | First Investors Auto Owner Trust 2017-3 | | 2.410% | | 12/15/22 | | 140 | | 140 |
1,5 | GreatAmerica Leasing Receivables Funding LLC Series 2018-1 | | 2.600% | | 6/15/21 | | 255 | | 256 |
1,5 | GreatAmerica Leasing Receivables Funding LLC Series 2018-1 | | 2.830% | | 6/17/24 | | 183 | | 185 |
1,5 | MMAF Equipment Finance LLC 2016-A | | 1.480% | | 6/15/20 | | 25 | | 25 |
1,5 | MMAF Equipment Finance LLC 2017-B | | 2.210% | | 10/17/22 | | 205 | | 205 |
1,5 | OneMain Direct Auto Receivables Trust 2017-2 | | 2.310% | | 12/14/21 | | 254 | | 254 |
1 | Seasoned Credit Risk Transfer Trust Series 2018-4 | | 3.500% | | 3/25/58 | | 252 | | 262 |
1 | Seasoned Credit Risk Transfer Trust Series 2019-1 | | 3.500% | | 7/25/58 | | 259 | | 270 |
1 | Seasoned Credit Risk Transfer Trust Series 2019-3 | | 3.500% | | 10/25/58 | | 404 | | 423 |
1,5 | SoFi Consumer Loan Program 2018-2 Trust | | 2.930% | | 4/26/27 | | 103 | | 103 |
1,5 | SoFi Consumer Loan Program 2019-3 Trust | | 2.900% | | 5/25/28 | | 1,237 | | 1,245 |
1,5 | Towd Point Mortgage Trust 2018-1 | | 3.000% | | 1/25/58 | | 282 | | 286 |
1,5 | Vantage Data Centers LLC 2018-1A | | 4.072% | | 2/16/43 | | 325 | | 338 |
1,5 | Vantage Data Centers LLC 2019-1A | | 3.188% | | 7/15/44 | | 140 | | 143 |
1,5 | Verus Securitization Trust 2019-2 | | 3.211% | | 4/25/59 | | 329 | | 333 |
1,5 | Westlake Automobile Receivables Trust | | 2.980% | | 1/18/22 | | 446 | | 447 |
| | | | | | | | | 10,183 |
Total Asset-Backed/Commercial Mortgage-Backed Securities (Cost $19,596) | | | | 19,777 |
13
Global Wellesley Income Fund
| | | | | | | Face | | Market |
| | | | | Maturity | | Amount | | Value· |
| | | Coupon | | Date | | ($000 | ) | ($000) |
Corporate Bonds (40.6%) | | | | | | | | |
Australia (0.7%) | | | | | | | | |
1,5 | Macquarie Group Ltd. | | 4.150% | | 3/27/24 | | 1,125 | | 1,188 |
1,5 | National Australia Bank Ltd. | | 3.933% | | 8/2/34 | | 850 | | 880 |
5 | WEA Finance LLC | | 4.125% | | 9/20/28 | | 610 | | 672 |
5 | WEA Finance LLC | | 4.625% | | 9/20/48 | | 225 | | 272 |
| | | | | | | | | 3,012 |
Belgium (0.1%) | | | | | | | | |
9 | Anheuser-Busch InBev SA/NV | | 1.750% | | 3/7/25 | | 325 | | 406 |
| | | | | | | | | |
Canada (1.5%) | | | | | | | | |
| Bank of Nova Scotia | | 2.700% | | 8/3/26 | | 990 | | 1,015 |
6 | Bell Canada Inc. | | 3.350% | | 3/22/23 | | 950 | | 739 |
7 | Canadian Imperial Bank of Commerce, 3M USD LIBOR + 0.720% | | 3.130% | | 6/16/22 | | 700 | | 705 |
| Emera US Finance LP | | 2.700% | | 6/15/21 | | 475 | | 478 |
| Fortis Inc. | | 3.055% | | 10/4/26 | | 625 | | 638 |
| Nutrien Ltd. | | 4.125% | | 3/15/35 | | 750 | | 788 |
6 | Royal Bank of Canada | | 2.949% | | 5/1/23 | | 1,825 | | 1,416 |
6 | Toronto-Dominion Bank | | 1.680% | | 6/8/21 | | 900 | | 675 |
| TransCanada PipeLines Ltd. | | 4.875% | | 1/15/26 | | 475 | | 534 |
| | | | | | | | | 6,988 |
China (0.4%) | | | | | | | | |
| Alibaba Group Holding Ltd. | | 3.400% | | 12/6/27 | | 690 | | 723 |
5 | Tencent Holdings Ltd. | | 3.595% | | 1/19/28 | | 690 | | 725 |
5 | Tencent Holdings Ltd. | | 3.975% | | 4/11/29 | | 405 | | 439 |
| | | | | | | | | 1,887 |
France (2.8%) | | | | | | | | |
1,8 | AXA SA | | 5.125% | | 7/4/43 | | 750 | | 973 |
8 | Banque Federative du Credit Mutuel SA | | 1.250% | | 1/14/25 | | 1,100 | | 1,298 |
8 | BNP Paribas SA | | 1.500% | | 11/17/25 | | 800 | | 949 |
8 | BPCE SA | | 1.125% | | 1/18/23 | | 900 | | 1,028 |
5 | BPCE SA | | 5.700% | | 10/22/23 | | 400 | | 442 |
8 | BPCE SA | | 2.875% | | 4/22/26 | | 1,300 | | 1,660 |
5 | BPCE SA | | 3.250% | | 1/11/28 | | 500 | | 525 |
8 | Credit Agricole SA | | 1.000% | | 9/16/24 | | 1,300 | | 1,515 |
5 | Danone SA | | 2.947% | | 11/2/26 | | 285 | | 295 |
8 | Orange SA | | 1.000% | | 5/12/25 | | 1,200 | | 1,395 |
8 | Orange SA | | 2.000% | | 1/15/29 | | 300 | | 382 |
8 | RCI Banque SA | | 0.750% | | 9/26/22 | | 625 | | 701 |
8 | RCI Banque SA | | 1.375% | | 3/8/24 | | 575 | | 662 |
8 | Societe Generale SA | | 1.000% | | 4/1/22 | | 600 | | 679 |
8 | Veolia Environnement SA | | 1.590% | | 1/10/28 | | 400 | | 493 |
| | | | | | | | | 12,997 |
Germany (2.9%) | | | | | | | | |
5 | Bayer US Finance II LLC | | 4.250% | | 12/15/25 | | 1,410 | | 1,516 |
8 | Daimler AG | | 0.875% | | 1/12/21 | | 3,100 | | 3,457 |
9 | Deutsche Telekom AG | | 3.125% | | 2/6/34 | | 675 | | 918 |
9 | E.ON International Finance BV | | 5.875% | | 10/30/37 | | 200 | | 367 |
8 | E.ON SE | | 0.375% | | 8/23/21 | | 1,775 | | 1,971 |
8 | E.ON SE | | 1.625% | | 5/22/29 | | 250 | | 309 |
9 | innogy Finance BV | | 4.750% | | 1/31/34 | | 500 | | 794 |
5 | Siemens Financieringsmaatschappij NV | | 2.900% | | 5/27/22 | | 800 | | 817 |
14
Global Wellesley Income Fund
| | | | | | | Face | | Market |
| | | | | Maturity | | Amount | | Value· |
| | | Coupon | | Date | | ($000 | ) | ($000) |
8 | Volkswagen Leasing GmbH | | 0.250% | | 10/5/20 | | 1,600 | | 1,765 |
8 | Volkswagen Leasing GmbH | | 2.625% | | 1/15/24 | | 525 | | 633 |
8 | Volkswagen Leasing GmbH | | 1.375% | | 1/20/25 | | 800 | | 916 |
| | | | | | | | | 13,463 |
Hong Kong (0.2%) | | | | | | | | |
5 | CK Hutchison International 17 II Ltd. | | 2.750% | | 3/29/23 | | 975 | | 987 |
| | | | | | | | | |
Japan (0.3%) | | | | | | | | |
10 | Toyota Finance Australia Ltd. | | 2.500% | | 12/7/20 | | 2,075 | | 1,419 |
| | | | | | | | | |
Mexico (0.4%) | | | | | | | | |
| America Movil SAB de CV | | 3.625% | | 4/22/29 | | 250 | | 271 |
| Coca-Cola Femsa SAB de CV | | 3.875% | | 11/26/23 | | 650 | | 692 |
5 | Infraestructura Energetica Nova SAB de CV | | 4.875% | | 1/14/48 | | 1,090 | | 1,023 |
| | | | | | | | | 1,986 |
Netherlands (0.4%) | | | | | | | | |
8 | ABN AMRO Bank NV | | 2.500% | | 11/29/23 | | 1,025 | | 1,260 |
9 | Cooperatieve Rabobank UA | | 4.625% | | 5/23/29 | | 200 | | 290 |
| Shell International Finance BV | | 4.000% | | 5/10/46 | | 425 | | 499 |
| | | | | | | | | 2,049 |
South Africa (0.3%) | | | | | | | | |
8 | Anglo American Capital plc | | 1.625% | | 3/11/26 | | 1,200 | | 1,404 |
| | | | | | | | | |
South Korea (0.0%) | | | | | | | | |
5 | SK Telecom Co. Ltd. | | 3.750% | | 4/16/23 | | 200 | | 210 |
| | | | | | | | | |
Spain (2.2%) | | | | | | | | |
8 | Abertis Infraestructuras SA | | 3.000% | | 3/27/31 | | 1,000 | | 1,277 |
8 | Banco de Sabadell SA | | 1.625% | | 3/7/24 | | 1,200 | | 1,392 |
8 | CaixaBank SA | | 1.750% | | 10/24/23 | | 1,700 | | 1,970 |
8 | Iberdrola International BV | | 2.875% | | 11/11/20 | | 1,800 | | 2,052 |
8 | Telefonica Emisiones SAU | | 2.242% | | 5/27/22 | | 800 | | 938 |
8 | Telefonica Emisiones SAU | | 1.460% | | 4/13/26 | | 500 | | 599 |
8 | Telefonica Emisiones SAU | | 1.715% | | 1/12/28 | | 700 | | 854 |
| Telefonica Emisiones SAU | | 4.665% | | 3/6/38 | | 845 | | 928 |
| | | | | | | | | 10,010 |
Sweden (0.5%) | | | | | | | | |
8 | Skandinaviska Enskilda Banken AB | | 2.000% | | 2/19/21 | | 675 | | 768 |
8 | Skandinaviska Enskilda Banken AB | | 0.300% | | 2/17/22 | | 1,475 | | 1,645 |
| | | | | | | | | 2,413 |
Switzerland (0.6%) | | | | | | | | |
1,8 | Credit Suisse Group AG | | 1.250% | | 7/17/25 | | 600 | | 692 |
8 | Holcim Finance Luxembourg SA | | 2.250% | | 5/26/28 | | 900 | | 1,126 |
5 | Roche Holdings Inc. | | 2.625% | | 5/15/26 | | 850 | | 875 |
1,5 | UBS Group AG | | 3.126% | | 8/13/30 | | 285 | | 293 |
| | | | | | | | | 2,986 |
United Kingdom (4.0%) | | | | | | | | |
| AstraZeneca plc | | 4.000% | | 1/17/29 | | 720 | | 807 |
1 | Barclays plc | | 3.932% | | 5/7/25 | | 785 | | 806 |
| BAT Capital Corp. | | 3.222% | | 8/15/24 | | 675 | | 693 |
| BAT Capital Corp. | | 3.557% | | 8/15/27 | | 825 | | 846 |
6 | BP Capital Markets plc | | 3.470% | | 5/15/25 | | 1,325 | | 1,056 |
15
Global Wellesley Income Fund
| | | | | | | Face | | Market |
| | | | | Maturity | | Amount | | Value· |
| | | Coupon | | Date | | ($000 | ) | ($000) |
9 | CPUK Finance Ltd. | | 3.588% | | 8/28/25 | | 1,200 | | 1,584 |
8 | FCE Bank plc | | 0.869% | | 9/13/21 | | 500 | | 554 |
1,8 | Heathrow Funding Ltd. | | 1.500% | | 2/11/32 | | 875 | | 1,036 |
1,9 | HSBC Holdings plc | | 2.256% | | 11/13/26 | | 1,850 | | 2,287 |
7 | HSBC Holdings plc, 3M USD LIBOR + 1.000% | | 3.124% | | 5/18/24 | | 255 | | 255 |
8 | Imperial Brands Finance plc | | 2.250% | | 2/26/21 | | 2,525 | | 2,860 |
5 | Imperial Brands Finance plc | | 4.250% | | 7/21/25 | | 1,000 | | 1,064 |
5 | Sky plc | | 3.125% | | 11/26/22 | | 825 | | 846 |
| Trinity Acquisition plc | | 4.400% | | 3/15/26 | | 888 | | 971 |
8 | Vodafone Group plc | | 2.200% | | 8/25/26 | | 1,350 | | 1,696 |
8 | Vodafone Group plc | | 0.900% | | 11/24/26 | | 850 | | 983 |
| | | | | | | | | 18,344 |
United States (23.3%) | | | | | | | | |
| Alabama Power Co. | | 4.300% | | 7/15/48 | | 275 | | 334 |
| Allergan Funding SCS | | 3.800% | | 3/15/25 | | 550 | | 579 |
8 | Altria Group Inc. | | 2.200% | | 6/15/27 | | 385 | | 466 |
| Amazon.com Inc. | | 4.800% | | 12/5/34 | | 150 | | 191 |
| Amazon.com Inc. | | 4.250% | | 8/22/57 | | 275 | | 352 |
8 | American International Group Inc. | | 1.500% | | 6/8/23 | | 875 | | 1,014 |
| American International Group Inc. | | 4.250% | | 3/15/29 | | 650 | | 721 |
| American Tower Corp. | | 5.000% | | 2/15/24 | | 200 | | 222 |
| American Tower Corp. | | 4.400% | | 2/15/26 | | 325 | | 358 |
| American Tower Corp. | | 3.800% | | 8/15/29 | | 325 | | 350 |
| Amgen Inc. | | 4.663% | | 6/15/51 | | 375 | | 446 |
| Anadarko Finance Co. | | 7.500% | | 5/1/31 | | 135 | | 180 |
| Andeavor Logistics LP / Tesoro Logistics Finance Corp. | | 3.500% | | 12/1/22 | | 1,325 | | 1,360 |
| Anheuser-Busch Cos. LLC / Anheuser-Busch InBev Worldwide Inc. | | 4.900% | | 2/1/46 | | 700 | | 837 |
| Anheuser-Busch InBev Worldwide Inc. | | 4.375% | | 4/15/38 | | 480 | | 546 |
| Anheuser-Busch InBev Worldwide Inc. | | 4.600% | | 4/15/48 | | 90 | | 104 |
| Anthem Inc. | | 3.500% | | 8/15/24 | | 325 | | 341 |
| Anthem Inc. | | 4.101% | | 3/1/28 | | 665 | | 725 |
| Anthem Inc. | | 4.375% | | 12/1/47 | | 290 | | 325 |
| Apple Inc. | | 2.750% | | 1/13/25 | | 645 | | 671 |
8 | AT&T Inc. | | 1.875% | | 12/4/20 | | 2,425 | | 2,723 |
| AT&T Inc. | | 3.600% | | 7/15/25 | | 950 | | 1,005 |
| AT&T Inc. | | 4.125% | | 2/17/26 | | 700 | | 762 |
| AT&T Inc. | | 4.900% | | 8/15/37 | | 950 | | 1,092 |
| Bank of America Corp. | | 3.300% | | 1/11/23 | | 700 | | 728 |
1 | Bank of America Corp. | | 3.593% | | 7/21/28 | | 1,550 | | 1,656 |
1 | Bank of America Corp. | | 4.271% | | 7/23/29 | | 910 | | 1,027 |
7 | Bank of New York Mellon Corp., 3M USD LIBOR + 1.050% | | 3.316% | | 10/30/23 | | 505 | | 514 |
5 | Bayer US Finance LLC | | 3.375% | | 10/8/24 | | 765 | | 791 |
| BB&T Corp. | | 3.700% | | 6/5/25 | | 805 | | 868 |
5 | Boston Gas Co. | | 3.001% | | 8/1/29 | | 105 | | 110 |
| Boston Scientific Corp. | | 4.000% | | 3/1/29 | | 55 | | 61 |
| Boston Scientific Corp. | | 4.550% | | 3/1/39 | | 550 | | 658 |
| Brandywine Operating Partnership LP | | 3.950% | | 11/15/27 | | 800 | | 847 |
| Broadcom Corp. / Broadcom Cayman Finance Ltd. | | 3.625% | | 1/15/24 | | 850 | | 868 |
5 | Brooklyn Union Gas Co. | | 4.273% | | 3/15/48 | | 760 | | 914 |
16
Global Wellesley Income Fund
| | | | | | | Face | | Market |
| | | | | Maturity | | Amount | | Value· |
| | | Coupon | | Date | | ($000 | ) | ($000) |
| Capital One Financial Corp. | | 4.200% | | 10/29/25 | | 1,000 | | 1,068 |
| Cardinal Health Inc. | | 4.500% | | 11/15/44 | | 350 | | 340 |
5 | Cargill Inc. | | 4.760% | | 11/23/45 | | 275 | | 355 |
| Charter Communications Operating LLC / Charter Communications Operating Capital | | 6.384% | | 10/23/35 | | 750 | | 918 |
8 | Chubb INA Holdings Inc. | | 0.875% | | 6/15/27 | | 1,010 | | 1,164 |
8 | Chubb INA Holdings Inc. | | 1.400% | | 6/15/31 | | 475 | | 567 |
| Cigna Corp. | | 4.375% | | 10/15/28 | | 435 | | 484 |
| Cimarex Energy Co. | | 4.375% | | 6/1/24 | | 859 | | 907 |
1 | Citigroup Inc. | | 3.520% | | 10/27/28 | | 1,530 | | 1,621 |
| Comcast Corp. | | 3.950% | | 10/15/25 | | 255 | | 279 |
| Comcast Corp. | | 6.500% | | 11/15/35 | | 775 | | 1,094 |
| Comcast Corp. | | 4.600% | | 10/15/38 | | 265 | | 321 |
| Comcast Corp. | | 4.000% | | 3/1/48 | | 20 | | 23 |
| Comcast Corp. | | 3.999% | | 11/1/49 | | 60 | | 67 |
| Comcast Corp. | | 4.049% | | 11/1/52 | | 10 | | 11 |
| CommonSpirit Health | | 4.200% | | 8/1/23 | | 895 | | 951 |
| CommonSpirit Health | | 3.347% | | 10/1/29 | | 145 | | 149 |
| CommonSpirit Health | | 4.187% | | 10/1/49 | | 175 | | 187 |
| Conagra Brands Inc. | | 4.600% | | 11/1/25 | | 200 | | 221 |
| Conagra Brands Inc. | | 5.300% | | 11/1/38 | | 145 | | 169 |
5 | Cox Communications Inc. | | 4.600% | | 8/15/47 | | 650 | | 721 |
| Crown Castle International Corp. | | 3.800% | | 2/15/28 | | 1,035 | | 1,103 |
| CSX Corp. | | 4.300% | | 3/1/48 | | 405 | | 468 |
| CVS Health Corp. | | 4.100% | | 3/25/25 | | 1,370 | | 1,466 |
| CVS Health Corp. | | 2.875% | | 6/1/26 | | 1,000 | | 1,006 |
| Dignity Health | | 3.812% | | 11/1/24 | | 659 | | 710 |
| Dignity Health | | 4.500% | | 11/1/42 | | 202 | | 222 |
| Discover Bank | | 4.200% | | 8/8/23 | | 700 | | 752 |
| Dominion Energy Gas Holdings LLC | | 4.600% | | 12/15/44 | | 625 | | 758 |
| Dominion Energy Inc. | | 2.715% | | 8/15/21 | | 125 | | 126 |
| Dominion Energy South Carolina Inc. | | 4.250% | | 8/15/28 | | 690 | | 804 |
| Dominion Energy South Carolina Inc. | | 6.625% | | 2/1/32 | | 156 | | 215 |
| Dominion Energy South Carolina Inc. | | 5.300% | | 5/15/33 | | 129 | | 165 |
| Dominion Energy South Carolina Inc. | | 5.450% | | 2/1/41 | | 250 | | 334 |
| Dominion Energy South Carolina Inc. | | 4.600% | | 6/15/43 | | 280 | | 349 |
| Duke Energy Progress LLC | | 4.100% | | 3/15/43 | | 725 | | 839 |
| Duke Energy Progress LLC | | 4.200% | | 8/15/45 | | 350 | | 418 |
| Energy Transfer Partners LP | | 4.900% | | 3/15/35 | | 975 | | 1,026 |
| EQT Midstream Partners LP | | 4.750% | | 7/15/23 | | 1,100 | | 1,106 |
5 | ERAC USA Finance LLC | | 4.500% | | 2/15/45 | | 500 | | 569 |
| Exxon Mobil Corp. | | 2.275% | | 8/16/26 | | 865 | | 875 |
8 | Fidelity National Information Services Inc. | | 1.500% | | 5/21/27 | | 1,405 | | 1,684 |
8 | Fidelity National Information Services Inc. | | 2.000% | | 5/21/30 | | 645 | | 806 |
| FirstEnergy Corp. | | 3.900% | | 7/15/27 | | 825 | | 885 |
| Fiserv Inc. | | 3.200% | | 7/1/26 | | 320 | | 335 |
| Ford Motor Credit Co. LLC | | 3.096% | | 5/4/23 | | 1,150 | | 1,137 |
5 | Fox Corp. | | 4.030% | | 1/25/24 | | 145 | | 155 |
| General Motors Co. | | 4.200% | | 10/1/27 | | 550 | | 566 |
| General Motors Financial Co. Inc. | | 3.450% | | 4/10/22 | | 1,535 | | 1,566 |
| Georgia Power Co. | | 4.300% | | 3/15/42 | | 940 | | 1,067 |
1 | Goldman Sachs Group Inc. | | 3.272% | | 9/29/25 | | 1,425 | | 1,475 |
1 | Goldman Sachs Group Inc. | | 3.814% | | 4/23/29 | | 235 | | 253 |
1 | Goldman Sachs Group Inc. | | 4.223% | | 5/1/29 | | 635 | | 703 |
17
Global Wellesley Income Fund
| | | | | | | Face | | Market |
| | | | | Maturity | | Amount | | Value· |
| | | Coupon | | Date | | ($000 | ) | ($000) |
| HCA Inc. | | 5.250% | | 6/15/49 | | 175 | | 196 |
| HCP Inc. | | 4.000% | | 6/1/25 | | 475 | | 507 |
| Hess Corp. | | 7.300% | | 8/15/31 | | 515 | | 641 |
| International Business Machines Corp. | | 3.300% | | 5/15/26 | | 500 | | 531 |
| International Paper Co. | | 4.350% | | 8/15/48 | | 475 | | 500 |
| John Deere Capital Corp. | | 3.450% | | 3/13/25 | | 830 | | 886 |
8 | JPMorgan Chase & Co. | | 3.875% | | 9/23/20 | | 1,400 | | 1,606 |
1 | JPMorgan Chase & Co. | | 3.782% | | 2/1/28 | | 1,200 | | 1,305 |
1 | JPMorgan Chase & Co. | | 3.964% | | 11/15/48 | | 850 | | 981 |
| Kaiser Foundation Hospitals | | 4.875% | | 4/1/42 | | 55 | | 72 |
5 | KeySpan Gas East Corp. | | 2.742% | | 8/15/26 | | 500 | | 510 |
| Kraft Heinz Foods Co. | | 4.375% | | 6/1/46 | | 795 | | 761 |
| Lockheed Martin Corp. | | 4.090% | | 9/15/52 | | 118 | | 142 |
| Lowe’s Cos. Inc. | | 4.550% | | 4/5/49 | | 390 | | 456 |
| Marsh & McLennan Cos. Inc. | | 4.375% | | 3/15/29 | | 605 | | 695 |
8 | Medtronic Global Holdings SCA | | 1.125% | | 3/7/27 | | 1,275 | | 1,497 |
8 | Medtronic Global Holdings SCA | | 1.625% | | 3/7/31 | | 760 | | 936 |
| Merck & Co. Inc. | | 3.400% | | 3/7/29 | | 500 | | 550 |
| Merck & Co. Inc. | | 4.000% | | 3/7/49 | | 330 | | 398 |
| Mercy Health | | 3.555% | | 8/1/27 | | 535 | | 577 |
5 | Metropolitan Life Global Funding I | | 3.000% | | 9/19/27 | | 700 | | 735 |
| Microsoft Corp. | | 3.700% | | 8/8/46 | | 650 | | 766 |
| Molson Coors Brewing Co. | | 3.000% | | 7/15/26 | | 425 | | 430 |
6 | Molson Coors International LP | | 2.840% | | 7/15/23 | | 1,825 | | 1,382 |
| Morgan Stanley | | 2.750% | | 5/19/22 | | 700 | | 712 |
| Morgan Stanley | | 3.125% | | 7/27/26 | | 2,100 | | 2,179 |
1 | Morgan Stanley | | 3.772% | | 1/24/29 | | 495 | | 536 |
| MPLX LP | | 4.125% | | 3/1/27 | | 805 | | 846 |
| MPLX LP | | 4.000% | | 3/15/28 | | 200 | | 209 |
| National Retail Properties Inc. | | 3.900% | | 6/15/24 | | 400 | | 424 |
| NextEra Energy Capital Holdings Inc. | | 3.250% | | 4/1/26 | | 90 | | 94 |
| NextEra Energy Capital Holdings Inc. | | 3.500% | | 4/1/29 | | 140 | | 150 |
| Noble Energy Inc. | | 3.850% | | 1/15/28 | | 575 | | 599 |
5 | Northwestern Mutual Life Insurance Co. | | 3.850% | | 9/30/47 | | 280 | | 315 |
| Oglethorpe Power Corp. | | 4.550% | | 6/1/44 | | 20 | | 22 |
| Oglethorpe Power Corp. | | 4.250% | | 4/1/46 | | 81 | | 87 |
| Oglethorpe Power Corp. | | 5.250% | | 9/1/50 | | 250 | | 325 |
| Oracle Corp. | | 3.400% | | 7/8/24 | | 425 | | 450 |
| Oracle Corp. | | 4.000% | | 11/15/47 | | 265 | | 305 |
5 | Penske Truck Leasing Co. LP / PTL Finance Corp. | | 4.250% | | 1/17/23 | | 1,125 | | 1,194 |
5 | Penske Truck Leasing Co. LP / PTL Finance Corp. | | 3.950% | | 3/10/25 | | 415 | | 441 |
| Philip Morris International Inc. | | 2.500% | | 11/2/22 | | 700 | | 708 |
8 | Philip Morris International Inc. | | 2.875% | | 3/3/26 | | 500 | | 640 |
8 | Philip Morris International Inc. | | 0.125% | | 8/3/26 | | 590 | | 640 |
| Phillips 66 Partners LP | | 3.750% | | 3/1/28 | | 400 | | 417 |
| PNC Bank NA | | 3.250% | | 1/22/28 | | 990 | | 1,063 |
1 | Providence St. Joseph Health Obligated Group | | 3.930% | | 10/1/48 | | 245 | | 287 |
| Santander Holdings USA Inc. | | 3.700% | | 3/28/22 | | 1,700 | | 1,744 |
5 | SBA Tower Trust | | 2.877% | | 7/9/21 | | 885 | | 891 |
5 | SBA Tower Trust | | 3.448% | | 3/15/23 | | 755 | | 777 |
| Sierra Pacific Power Co. | | 2.600% | | 5/1/26 | | 180 | | 181 |
18
Global Wellesley Income Fund
| | | | | | | Face | | Market |
| | | | | Maturity | | Amount | | Value· |
| | | Coupon | | Date | | ($000 | ) | ($000) |
| Southern California Edison Co. | | 3.700% | | 8/1/25 | | 30 | | 32 |
| Southern California Edison Co. | | 4.125% | | 3/1/48 | | 475 | | 532 |
1,5 | Sprint Spectrum Co LLC / Sprint Spectrum Co II LLC / Sprint Spectrum Co III LLC | | 4.738% | | 3/20/25 | | 1,100 | | 1,166 |
| SSM Health Care Corp. | | 3.823% | | 6/1/27 | | 380 | | 418 |
| Starbucks Corp. | | 4.500% | | 11/15/48 | | 335 | | 393 |
| SunTrust Bank | | 3.300% | | 5/15/26 | | 550 | | 576 |
| Synchrony Bank | | 3.000% | | 6/15/22 | | 550 | | 559 |
5 | Teachers Insurance & Annuity Assn. of America | | 4.900% | | 9/15/44 | | 635 | | 797 |
| Union Pacific Corp. | | 3.700% | | 3/1/29 | | 190 | | 211 |
| Union Pacific Corp. | | 4.300% | | 3/1/49 | | 120 | | 143 |
1 | United Airlines 2018-1 Class B Pass Through Trust | | 4.600% | | 3/1/26 | | 72 | | 77 |
8 | United Technologies Corp. | | 1.150% | | 5/18/24 | | 395 | | 457 |
| United Technologies Corp. | | 3.950% | | 8/16/25 | | 310 | | 340 |
| United Technologies Corp. | | 4.450% | | 11/16/38 | | 550 | | 665 |
| UnitedHealth Group Inc. | | 3.850% | | 6/15/28 | | 415 | | 462 |
| UnitedHealth Group Inc. | | 4.625% | | 7/15/35 | | 90 | | 111 |
| Verizon Communications Inc. | | 4.522% | | 9/15/48 | | 1,250 | | 1,505 |
| Verizon Communications Inc. | | 4.672% | | 3/15/55 | | 144 | | 176 |
5 | Walt Disney Co. | | 6.200% | | 12/15/34 | | 650 | | 918 |
8 | Wells Fargo & Co. | | 2.250% | | 9/3/20 | | 2,625 | | 2,958 |
6 | Wells Fargo & Co. | | 2.975% | | 5/19/26 | | 600 | | 462 |
| Wells Fargo & Co. | | 4.300% | | 7/22/27 | | 325 | | 360 |
| Wells Fargo & Co. | | 4.750% | | 12/7/46 | | 700 | | 859 |
| Welltower Inc. | | 4.000% | | 6/1/25 | | 325 | | 349 |
| | | | | | | | | 108,128 |
Total Corporate Bonds (Cost $182,369) | | | | | | | | 188,689 |
Sovereign Bonds (7.6%) | | | | | | | | |
Australia (0.3%) | | | | | | | | |
10 | Commonwealth of Australia | | 2.250% | | 11/21/22 | | 1,185 | | 838 |
10 | Commonwealth of Australia | | 2.750% | | 11/21/27 | | 160 | | 124 |
10 | Commonwealth of Australia | | 2.250% | | 5/21/28 | | 870 | | 655 |
| | | | | | | | | 1,617 |
Canada (1.0%) | | | | | | | | |
6 | Canada | | 2.750% | | 12/1/48 | | 65 | | 64 |
5,6 | Canada Housing Trust No. 1 | | 2.350% | | 9/15/23 | | 1,110 | | 858 |
6 | City of Toronto | | 3.200% | | 8/1/48 | | 1,000 | | 863 |
6 | Province of Ontario | | 2.900% | | 6/2/28 | | 1,815 | | 1,477 |
11 | Province of Ontario | | 0.250% | | 6/28/29 | | 1,075 | | 1,169 |
| | | | | | | | | 4,431 |
Chile (0.2%) | | | | | | | | |
| Corp. Nacional del Cobre de Chile | | 3.625% | | 8/1/27 | | 800 | | 855 |
| | | | | | | | | |
China (0.5%) | | | | | | | | |
5 | Sinopec Group Overseas Development 2017 Ltd. | | 3.000% | | 4/12/22 | | 1,225 | | 1,242 |
5 | State Grid Overseas Investment 2016 Ltd. | | 2.750% | | 5/4/22 | | 1,110 | | 1,120 |
| | | | | | | | | 2,362 |
19
Global Wellesley Income Fund
| | | | | | | Face | | Market |
| | | | | Maturity | | Amount | | Value· |
| | | Coupon | | Date | | ($000 | ) | ($000) |
France (0.5%) | | | | | | | | |
8 | Aeroports de Paris | | 2.750% | | 6/5/28 | | 1,800 | | 2,438 |
| | | | | | | | | |
Japan (2.1%) | | | | | | | | |
12 | Japan | | 0.100% | | 6/20/28 | | 71,100 | | 695 |
12 | Japan | | 0.100% | | 12/20/28 | | 849,850 | | 8,305 |
12 | Japan | | 0.100% | | 3/20/29 | | 42,600 | | 416 |
12 | Japan | | 0.100% | | 6/20/29 | | 12,000 | | 117 |
| | | | | | | | | 9,533 |
Panama (0.1%) | | | | | | | | |
1,5 | Empresa de Transmision Electrica SA | | 5.125% | | 5/2/49 | | 415 | | 481 |
| | | | | | | | | |
Qatar (0.4%) | | | | | | | | |
5 | State of Qatar | | 3.875% | | 4/23/23 | | 785 | | 835 |
5 | State of Qatar | | 4.000% | | 3/14/29 | | 595 | | 679 |
5 | State of Qatar | | 5.103% | | 4/23/48 | | 285 | | 380 |
| | | | | | | | | 1,894 |
Saudi Arabia (0.7%) | | | | | | | | |
5 | Kingdom of Saudi Arabia | | 2.875% | | 3/4/23 | | 2,280 | | 2,348 |
5 | Saudi Arabian Oil Co. | | 3.500% | | 4/16/29 | | 785 | | 840 |
| | | | | | | | | 3,188 |
Singapore (0.1%) | | | | | | | | |
5 | Temasek Financial I Ltd. | | 3.625% | | 8/1/28 | | 530 | | 596 |
| | | | | | | | | |
Supranational (0.3%) | | | | | | | | |
8 | European Financial Stability Facility | | 1.375% | | 5/31/47 | | 900 | | 1,307 |
| | | | | | | | | |
United Arab Emirates (0.3%) | | | | | | | | |
| Emirate of Abu Dhabi | | 3.125% | | 10/11/27 | | 1,435 | | 1,554 |
| | | | | | | | | |
United Kingdom (1.1%) | | | | | | | | |
9 | United Kingdom | | 1.500% | | 1/22/21 | | 955 | | 1,179 |
9 | United Kingdom | | 0.500% | | 7/22/22 | | 775 | | 947 |
9 | United Kingdom | | 1.250% | | 7/22/27 | | 445 | | 580 |
9 | United Kingdom | | 3.500% | | 1/22/45 | | 1,200 | | 2,274 |
| | | | | | | | | 4,980 |
Total Sovereign Bonds (Cost $33,775) | | | | | | | | 35,236 |
Taxable Municipal Bonds (1.8%) | | | | | | | | |
| California GO | | 7.550% | | 4/1/39 | | 560 | | 939 |
| California GO | | 7.625% | | 3/1/40 | | 25 | | 42 |
| Chicago IL Transit Authority | | 6.300% | | 12/1/21 | | 65 | | 68 |
| Chicago IL Transit Authority Sales Tax Receipts Revenue | | 6.899% | | 12/1/40 | | 40 | | 58 |
| Chicago IL Transit Authority Transfer Tax Receipts Revenue | | 6.899% | | 12/1/40 | | 645 | | 932 |
| Connecticut GO | | 5.770% | | 3/15/25 | | 250 | | 295 |
| Georgia Municipal Electric Power Authority Revenue | | 6.637% | | 4/1/57 | | 665 | | 933 |
| Georgia Municipal Electric Power Authority Revenue | | 6.655% | | 4/1/57 | | 100 | | 147 |
| Illinois GO | | 5.100% | | 6/1/33 | | 865 | | 941 |
13 | Kansas Development Finance Authority | | 5.371% | | 5/1/26 | | 860 | | 962 |
20
Global Wellesley Income Fund
| | | | | | | Face | | Market |
| | | | | Maturity | | Amount | | Value· |
| | | Coupon | | Date | | ($000 | ) | ($000) |
| New York Metropolitan Transportation Authority Revenue (Transit Revenue) | | 6.668% | | 11/15/39 | | 155 | | 232 |
| North Texas Tollway Authority System Revenue | | 6.718% | | 1/1/49 | | 75 | | 126 |
| Sales Tax Securitization Corp. Illinois Revenue | | 4.787% | | 1/1/48 | | 555 | | 710 |
| South Carolina Public Service Authority Revenue | | 2.388% | | 12/1/23 | | 1,425 | | 1,436 |
| University of California Regents Medical Center Revenue | | 6.548% | | 5/15/48 | | 225 | | 353 |
Total Taxable Municipal Bonds (Cost $7,400) | | | | | | | | 8,174 |
| | | Shares | | |
Common Stocks (37.2%) | | | | |
Canada (3.5%) | | | | |
| TC Energy Corp. | | 100,435 | | 5,146 |
| Bank of Nova Scotia | | 88,588 | | 4,711 |
| Royal Bank of Canada | | 43,073 | | 3,222 |
| Enbridge Inc. | | 92,038 | | 3,078 |
| | | | | 16,157 |
China (1.3%) | | | | |
| Guangdong Investment Ltd. | | 1,074,000 | | 2,261 |
| ENN Energy Holdings Ltd. | | 167,300 | | 1,906 |
5 | China Tower Corp. Ltd. | | 7,000,000 | | 1,594 |
| | | | | 5,761 |
France (3.1%) | | | | |
| TOTAL SA | | 98,927 | | 4,941 |
| Vinci SA | | 44,445 | | 4,856 |
| AXA SA | | 206,414 | | 4,733 |
| | | | | 14,530 |
Germany (1.3%) | | | | |
| E.ON SE | | 354,414 | | 3,297 |
| Volkswagen AG Preference Shares | | 18,153 | | 2,922 |
| | | | | 6,219 |
Greece (0.5%) | | | | |
| Hellenic Telecommunications Organization SA | | 188,306 | | 2,509 |
| | | | | |
Hong Kong (0.5%) | | | | |
| AIA Group Ltd. | | 250,600 | | 2,425 |
| | | | | |
Japan (2.7%) | | | | |
| Mitsubishi UFJ Financial Group Inc. | | 933,100 | | 4,491 |
| Tokio Marine Holdings Inc. | | 58,800 | | 3,024 |
| KDDI Corp. | | 102,700 | | 2,735 |
| Isuzu Motors Ltd. | | 223,900 | | 2,405 |
| | | | | 12,655 |
21
Global Wellesley Income Fund
| | | | | Market |
| | | | | Value· |
| | | Shares | | ($000) |
Netherlands (3.0%) | | | | |
5 | ABN AMRO Bank NV | | 256,119 | | 4,542 |
| Koninklijke KPN NV | | 1,256,847 | | 3,981 |
| Koninklijke Philips NV | | 60,422 | | 2,848 |
| Unilever NV | | 39,628 | | 2,459 |
| | | | | 13,830 |
Portugal (0.7%) | | | | |
| Galp Energia SGPS SA | | 224,000 | | 3,219 |
| | | | | |
Spain (0.6%) | | | | |
* | Iberdrola SA | | 265,258 | | 2,731 |
| | | | | |
Sweden (0.8%) | | | | |
| Millicom International Cellular SA | | 75,701 | | 3,854 |
| | | | | |
Switzerland (2.2%) | | | | |
| Novartis AG | | 45,525 | | 4,104 |
| UBS Group AG | | 359,308 | | 3,815 |
| Nestle SA | | 20,518 | | 2,306 |
| | | | | 10,225 |
Taiwan (0.9%) | | | | |
| Taiwan Semiconductor Manufacturing Co. Ltd. | | 502,000 | | 4,125 |
| | | | | |
United Kingdom (3.1%) | | | | |
| AstraZeneca plc | | 46,184 | | 4,125 |
| Standard Chartered plc | | 449,292 | | 3,414 |
| National Grid plc | | 238,736 | | 2,501 |
| BT Group plc | | 1,154,590 | | 2,326 |
| Segro plc | | 194,119 | | 1,857 |
| | | | | 14,223 |
United States (13.0%) | | | | |
| Philip Morris International Inc. | | 61,466 | | 4,431 |
| Verizon Communications Inc. | | 70,447 | | 4,097 |
| Public Storage | | 13,784 | | 3,649 |
| Comcast Corp. Class A | | 81,941 | | 3,627 |
| Bank of America Corp. | | 130,393 | | 3,587 |
| Boeing Co. | | 8,295 | | 3,020 |
| Home Depot Inc. | | 13,208 | | 3,010 |
| Pfizer Inc. | | 84,204 | | 2,994 |
| Cisco Systems Inc. | | 62,361 | | 2,919 |
| Baxter International Inc. | | 33,063 | | 2,908 |
| Lockheed Martin Corp. | | 7,049 | | 2,708 |
| Merck & Co. Inc. | | 30,651 | | 2,651 |
| Expedia Group Inc. | | 20,348 | | 2,647 |
| Kellogg Co. | | 41,930 | | 2,633 |
| Edison International | | 35,238 | | 2,547 |
| Microsoft Corp. | | 17,915 | | 2,470 |
| FMC Corp. | | 27,682 | | 2,390 |
| Emerson Electric Co. | | 36,841 | | 2,195 |
| Anthem Inc. | | 8,291 | | 2,168 |
| Accenture plc Class A | | 9,129 | | 1,809 |
| TJX Cos. Inc. | | 32,783 | | 1,802 |
| | | | | 60,262 |
Total Common Stocks (Cost $170,147) | | | | 172,725 |
22
Global Wellesley Income Fund
| | | | | | | | | Market |
| | | | | | | | | Value· |
| | | | | Coupon | | Shares | | ($000) |
Temporary Cash Investments (2.3%) | | | | | | | | |
Money Market Fund (2.3%) | | | | | | | | |
14 | Vanguard Market Liquidity Fund (Cost $10,511) | | | | 2.249% | | 105,100 | | 10,511 |
Total Investments (99.8%) (Cost $450,919) | | | | | | | | 463,320 |
| | Amount |
| | ($000) |
Other Assets and Liabilities (0.2%) | | |
Other Assets | | |
Investment in Vanguard | | 22 |
Receivables for Investment Securities Sold | | 121 |
Receivables for Accrued Income | | 2,891 |
Receivables for Capital Shares Issued | | 406 |
Variation Margin Receivable—Futures Contracts | | 3 |
Unrealized Appreciation—Forward Currency Contracts | | 783 |
Other Assets | | 663 |
Total Other Assets | | 4,889 |
Liabilities | | |
Payables for Investment Securities Purchased | | (3,201) |
Payables for Capital Shares Redeemed | | (187) |
Payables to Investment Advisor | | (129) |
Payables to Vanguard | | (50) |
Variation Margin Payable—Futures Contracts | | (2) |
Unrealized Depreciation—Forward Currency Contracts | | (96) |
Other Liabilities | | (130) |
Total Liabilities | | (3,795) |
Net Assets (100%) | | 464,414 |
| | |
| | |
At August 31, 2019, net assets consisted of: | | |
| | |
| | Amount |
| | ($000) |
Paid-in Capital | | 464,781 |
Total Distributable Earnings (Loss) | | (367) |
Net Assets | | 464,414 |
| | |
Investor Shares—Net Assets | | |
Applicable to 4,218,242 outstanding $.001 par value shares of beneficial interest (unlimited authorization) | | 85,032 |
Net Asset Value Per Share—Investor Shares | | $20.16 |
23
Global Wellesley Income Fund
| | Amount |
| | ($000) |
Admiral Shares—Net Assets | | |
Applicable to 15,052,894 outstanding $.001 par value shares of beneficial interest (unlimited authorization) | | 379,382 |
Net Asset Value Per Share—Admiral Shares | | $25.20 |
· See Note A in Notes to Financial Statements.
* Non-income-producing security.
1 The average or expected maturity is shorter than the final maturity shown because of the possibility of interim principal payments and prepayments or the possibility of the issue being called.
2 The issuer was placed under federal conservatorship in September 2008; since that time, its daily operations have been managed by the Federal Housing Finance Agency and it receives capital from the U.S. Treasury, as needed to maintain a positive net worth, in exchange for senior preferred stock.
3 Includes securities purchased on a when-issued or delayed-delivery basis for which the fund has not taken delivery as of August 31, 2019.
4 Securities with a value of $340,000 have been segregated as initial margin for open futures contracts.
5 Security exempt from registration under Rule 144A of the Securities Act of 1933. Such securities may be sold in transactions exempt from registration, normally to qualified institutional buyers. At August 31, 2019, the aggregate value of these securities was $57,786,000, representing 12.4% of net assets.
6 Face amount denominated in Canadian dollars.
7 Adjustable-rate security; rate shown is effective rate at period end. Certain adjustable-rate securities are not based on a published reference rate and spread but are determined by the issuer or agent based on current market conditions.
8 Face amount denominated in euro.
9 Face amount denominated in British pounds.
10 Face amount denominated in Australian dollars.
11 Face amount denominated in Swiss francs.
12 Face amount denominated in Japanese yen.
13 Scheduled principal and interest payments are guaranteed by AGM (Assured Guaranty Municipal Corporation).
14 Affiliated money market fund available only to Vanguard funds and certain trusts and accounts managed by Vanguard. Rate shown is the 7-day yield.
GO—General Obligation Bond.
LIBOR—London Interbank Offered Rate.
REMICS—Real Estate Mortgage Investment Conduits.
TBA—To Be Announced.
24
Global Wellesley Income Fund
Derivative Financial Instruments Outstanding as of Period End |
|
Futures Contracts |
| | | | | | | | Value and |
| | | | | | | | Unrealized |
| | | | Number of | | Notional | | Appreciation |
| | | | Long (Short | ) | Amount | | (Depreciation) |
| | Expiration | | Contracts | | ($000 | ) | ($000) |
Long Futures Contracts | | | | | | | | |
Euro-Bobl | | September 2019 | | 63 | | 9,433 | | 130 |
10-Year U.S. Treasury Note | | December 2019 | | 21 | | 2,766 | | 1 |
Euro-Buxl | | September 2019 | | 12 | | 2,958 | | 345 |
5-Year U.S. Treasury Note | | December 2019 | | 10 | | 1,200 | | — |
Long Gilt | | December 2019 | | 6 | | 980 | | 6 |
| | | | | | | | 482 |
| | | | | | | | |
Short Futures Contracts | | | | | | | | |
Euro-Schatz | | September 2019 | | (37 | ) | (4,578 | ) | (21) |
10-Year Canadian | | | | | | | | |
Government Bond | | December 2019 | | (18 | ) | (1,961 | ) | (2) |
Euro-Bund | | September 2019 | | (11 | ) | (2,165 | ) | (52) |
Ultra Long U.S. Treasury Bond | | December 2019 | | (7 | ) | (1,382 | ) | (3) |
| | | | | | | | (78) |
| | | | | | | | 404 |
25
Global Wellesley Income Fund
Forward Currency Contracts |
| | Contract | | | | | | | | | | Unrealized | | Unrealized |
| | Settlement | | Contract Amount (000) | | Appreciation | | (Depreciation) |
Counterparty | | Date | | | | Receive | | | | Deliver | | ($000 | ) | ($000) |
Bank of America, N.A. | | 9/18/19 | | EUR | | 3,380 | | USD | | 3,802 | | — | | (82) |
Goldman Sachs International | | 9/18/19 | | GBP | | 1,895 | | USD | | 2,306 | | 2 | | — |
J.P. Morgan Securities LLC | | 9/30/19 | | EUR | | 871 | | USD | | 968 | | — | | (9) |
Goldman Sachs International | | 9/30/19 | | EUR | | 603 | | USD | | 670 | | — | | (5) |
J.P. Morgan Securities LLC | | 9/30/19 | | USD | | 68,968 | | EUR | | 62,214 | | 429 | | — |
J.P. Morgan Securities LLC | | 9/30/19 | | USD | | 11,937 | | GBP | | 9,767 | | 36 | | — |
J.P. Morgan Securities LLC | | 9/30/19 | | USD | | 10,442 | | CAD | | 13,878 | | 14 | | — |
Bank of America, N.A. | | 9/30/19 | | USD | | 9,246 | | JPY | | 975,178 | | 45 | | — |
J.P. Morgan Securities LLC | | 9/18/19 | | USD | | 3,856 | | EUR | | 3,380 | | 136 | | — |
J.P. Morgan Securities LLC | | 9/30/19 | | USD | | 2,911 | | AUD | | 4,307 | | 8 | | — |
Goldman Sachs International | | 9/18/19 | | USD | | 2,418 | | GBP | | 1,895 | | 110 | | — |
J.P. Morgan Securities LLC | | 9/30/19 | | USD | | 1,068 | | CHF | | 1,052 | | 3 | | — |
J.P. Morgan Securities LLC | | 9/30/19 | | USD | | 370 | | JPY | | 39,200 | | — | | — |
| | | | | | | | | | | | 783 | | (96) |
AUD—Australian dollar.
CAD—Canadian dollar.
CHF—Swiss franc.
EUR—euro.
GBP—British pound.
JPY—Japanese yen.
USD—U.S. dollar.
At August 31, 2019, the counterparties had deposited in segregated accounts securities with a value of $1,219,000 in connection with open forward currency contracts.
See accompanying Notes, which are an integral part of the Financial Statements.
26
Global Wellesley Income Fund
Statement of Operations
| Year Ended |
| August 31, 2019 |
| ($000) |
Investment Income | |
Income | |
Dividends1 | 6,495 |
Interest2 | 7,314 |
Securities Lending—Net | 58 |
Total Income | 13,867 |
Expenses | |
Investment Advisory Fees—Note B | |
Basic Fee | 545 |
Performance Adjustment | (25) |
The Vanguard Group—Note C | |
Management and Administrative—Investor Shares | 226 |
Management and Administrative—Admiral Shares | 685 |
Marketing and Distribution—Investor Shares | 13 |
Marketing and Distribution—Admiral Shares | 23 |
Custodian Fees | 18 |
Auditing Fees | 35 |
Shareholders’ Reports—Investor Shares | 5 |
Shareholders’ Reports—Admiral Shares | 4 |
Trustees’ Fees and Expenses | 1 |
Total Expenses | 1,530 |
Expenses Paid Indirectly | (18) |
Net Expenses | 1,512 |
Net Investment Income | 12,355 |
Realized Net Gain (Loss) | |
Investment Securities Sold2 | (22,480) |
Futures Contracts | 364 |
Forward Currency Contracts | 7,199 |
Foreign Currencies | 26 |
Realized Net Gain (Loss) | (14,891) |
Change in Unrealized Appreciation (Depreciation) | |
Investment Securities2 | 24,913 |
Futures Contracts | 279 |
Forward Currency Contracts | 700 |
Foreign Currencies | (7) |
Change in Unrealized Appreciation (Depreciation) | 25,885 |
Net Increase (Decrease) in Net Assets Resulting from Operations | 23,349 |
1 Dividends are net of foreign withholding taxes of $554,000.
2 Interest income, realized net gain (loss), and change in unrealized appreciation (depreciation) from an affiliated company of the fund were $190,000, ($1,000), and ($2,000), respectively. Purchases and sales are for temporary cash investment purposes.
See accompanying Notes, which are an integral part of the Financial Statements.
27
Global Income Fund
Statement of Changes in Net Assets
| | | October 18, |
| Year Ended | | 20171 to |
| August 31, | | August 31, |
| 2019 | | 2018 |
| ($000) | | ($000) |
Increase (Decrease) in Net Assets | | | |
Operations | | | |
Net Investment Income | 12,355 | | 10,864 |
Realized Net Gain (Loss) | (14,891) | | 4,280 |
Change in Unrealized Appreciation (Depreciation) | 25,885 | | (12,418) |
Net Increase (Decrease) in Net Assets Resulting from Operations | 23,349 | | 2,726 |
Distributions | | | |
Net Investment Income | | | |
Investor Shares | (2,066) | | (1,499) |
Admiral Shares | (9,444) | | (6,250) |
Realized Capital Gain2 | | | |
Investor Shares | (1,201) | | — |
Admiral Shares | (5,132) | | — |
Total Distributions | (17,843) | | (7,749) |
Capital Share Transactions | | | |
Investor Shares | (8,902) | | 93,990 |
Admiral Shares | (33,414) | | 412,257 |
Net Increase (Decrease) from Capital Share Transactions | (42,316) | | 506,247 |
Total Increase (Decrease) | (36,810) | | 501,224 |
Net Assets | | | |
Beginning of Period | 501,224 | | — |
End of Period | 464,414 | | 501,224 |
1 Commencement of subscription period for the fund.
2 Includes fiscal 2019 and 2018 short-term gain distributions totaling $2,414,000 and $0, respectively. Short-term gain distributions are treated as ordinary income dividends for tax purposes.
See accompanying Notes, which are an integral part of the Financial Statements.
28
Global Wellesley Income Fund
Financial Highlights
Investor Shares
| | Year | | Oct. 18, | |
| | Ended | | 20171 to | |
| | August 31, | | August 31, | |
For a Share Outstanding Throughout Each Period | | 2019 | | 2018 | |
Net Asset Value, Beginning of Period | | $19.87 | | $20.00 | |
Investment Operations | | | | | |
Net Investment Income2 | | .513 | | .443 | |
Net Realized and Unrealized Gain (Loss) on Investments | | .529 | | (.269 | ) |
Total from Investment Operations | | 1.042 | | .174 | |
Distributions | | | | | |
Dividends from Net Investment Income | | (.473 | ) | (.304 | ) |
Distributions from Realized Capital Gains | | (.279 | ) | — | |
Total Distributions | | (.752 | ) | (.304 | ) |
Net Asset Value, End of Period | | $20.16 | | $19.87 | |
| | | | | |
Total Return3 | | 5.50% | | 0.88% | |
| | | | | |
Ratios/Supplemental Data | | | | | |
Net Assets, End of Period (Millions) | | $85 | | $93 | |
Ratio of Total Expenses to Average Net Assets | | 0.42%4 | | 0.43%5,6 | |
Ratio of Net Investment Income to Average Net Assets | | 2.63% | | 2.68%6 | |
Portfolio Turnover Rate | | 90% | | 39% | |
1 Subscription period for the fund was October 18, 2017, to November 1, 2017, during which time all assets were held in cash. Performance measurement began November 2, 2017, the first business day after the subscription period, at a net asset value of $20.00.
2 Calculated based on average shares outstanding.
3 Total returns do not include account service fees that may have applied in the periods shown. Fund prospectuses provide information about any applicable account service fees.
4 Includes performance-based investment advisory fee increases (decreases) of (0.01%).
5 The ratio of expenses to average net assets for the period net of reduction from custody fee offset arrangements was 0.42%.
6 Annualized.
See accompanying Notes, which are an integral part of the Financial Statements.
29
Global Wellesley Income Fund
Financial Highlights
Admiral Shares
| | Year | | Oct. 18, | |
| | Ended | | 20171 to | |
| | August 31, | | August 31, | |
For a Share Outstanding Throughout Each Period | | 2019 | | 2018 | |
Net Asset Value, Beginning of Period | | $24.84 | | $25.00 | |
Investment Operations | | | | | |
Net Investment Income2 | | .666 | | .577 | |
Net Realized and Unrealized Gain (Loss) on Investments | | .658 | | (.341 | ) |
Total from Investment Operations | | 1.324 | | .236 | |
Distributions | | | | | |
Dividends from Net Investment Income | | (.616 | ) | (.396 | ) |
Distributions from Realized Capital Gains | | (.348 | ) | — | |
Total Distributions | | (.964 | ) | (.396 | ) |
Net Asset Value, End of Period | | $25.20 | | $24.84 | |
| | | | | |
Total Return3 | | 5.60% | | 0.96% | |
| | | | | |
Ratios/Supplemental Data | | | | | |
Net Assets, End of Period (Millions) | | $379 | | $408 | |
Ratio of Total Expenses to Average Net Assets | | 0.32%4 | | 0.33%5,6 | |
Ratio of Net Investment Income to Average Net Assets | | 2.73% | | 2.78%6 | |
Portfolio Turnover Rate | | 90% | | 39% | |
1 Subscription period for the fund was October 18, 2017, to November 1, 2017, during which time all assets were held in cash. Performance measurement began November 2, 2017, the first business day after the subscription period, at a net asset value of $25.00.
2 Calculated based on average shares outstanding.
3 Total returns do not include account service fees that may have applied in the periods shown. Fund prospectuses provide information about any applicable account service fees.
4 Includes performance-based investment advisory fee increases (decreases) of (0.01%).
5 The ratio of expenses to average net assets for the period net of reduction from custody fee offset arrangements was 0.32%.
6 Annualized.
See accompanying Notes, which are an integral part of the Financial Statements.
30
Global Wellesley Income Fund
Notes to Financial Statements
Vanguard Global Wellesley Income Fund is registered under the Investment Company Act of 1940 as an open-end investment company, or mutual fund. Certain of the fund’s investments are in corporate debt instruments; the issuers’ abilities to meet their obligations may be affected by economic developments in their respective industries. The fund invests in securities of foreign issuers, which may subject it to investment risks not normally associated with investing in securities of U.S. corporations. To minimize the currency risk associated with investment in securities denominated in currencies other than the U.S. dollar, the fund attempts to hedge its currency exposures. The fund offers two classes of shares: Investor Shares and Admiral Shares. Each of the share classes has different eligibility and minimum purchase requirements, and is designed for different types of investors.
A. The following significant accounting policies conform to generally accepted accounting principles for U.S. investment companies. The fund consistently follows such policies in preparing its financial statements.
1. Security Valuation: Securities are valued as of the close of trading on the New York Stock Exchange (generally 4 p.m., Eastern time) on the valuation date. Equity securities are valued at the latest quoted sales prices or official closing prices taken from the primary market in which each security trades; such securities not traded on the valuation date are valued at the mean of the latest quoted bid and asked prices. Bonds and temporary cash investments are valued using the latest bid prices or using valuations based on a matrix system (which considers such factors as security prices, yields, maturities, and ratings), both as furnished by independent pricing services. Structured debt securities, including mortgages and asset-backed securities, are valued using the latest bid prices or using valuations based on a matrix system that considers such factors as issuer, tranche, nominal or option-adjusted spreads, weighted average coupon, weighted average maturity, credit enhancements, and collateral. Investments in Vanguard Market Liquidity Fund are valued at that fund’s net asset value. Securities for which market quotations are not readily available, or whose values have been affected by events occurring before the fund’s pricing time but after the close of the securities’ primary markets, are valued at their fair values calculated according to procedures adopted by the board of trustees. These procedures include obtaining quotations from an independent pricing service, monitoring news to identify significant market- or security-specific events, and evaluating changes in the values of foreign market proxies (for example, ADRs, futures contracts, or exchange-traded funds), between the time the foreign markets close and the fund’s pricing time. When fair-value pricing is employed, the prices of securities used by a fund to calculate its net asset value may differ from quoted or published prices for the same securities.
2. Foreign Currency: Securities and other assets and liabilities denominated in foreign currencies are translated into U.S. dollars using exchange rates obtained from an independent third party as of the fund’s pricing time on the valuation date. Realized gains (losses) and unrealized appreciation (depreciation) on investment securities include the effects of changes in exchange rates since the securities were purchased, combined with the effects of changes in security prices. Fluctuations in the value of other assets and liabilities resulting from changes in exchange rates are recorded as unrealized foreign currency gains (losses) until the assets or liabilities are settled in cash, at which time they are recorded as realized foreign currency gains (losses).
3. Futures Contracts: The fund uses futures contracts to invest in fixed income asset classes with greater efficiency and lower cost than is possible through direct investment, to add value when these instruments are attractively priced, or to adjust sensitivity to changes in interest rates. The primary risks associated with the use of futures contracts are imperfect correlation between
31
Global Wellesley Income Fund
changes in market values of bonds held by the fund and the prices of futures contracts, and the possibility of an illiquid market. Counterparty risk involving futures is mitigated because a regulated clearinghouse is the counterparty instead of the clearing broker. To further mitigate counterparty risk, the fund trades futures contracts on an exchange, monitors the financial strength of its clearing brokers and clearinghouse, and has entered into clearing agreements with its clearing brokers. The clearinghouse imposes initial margin requirements to secure the fund’s performance and requires daily settlement of variation margin representing changes in the market value of each contract. Any assets pledged as initial margin for open contracts are noted in the Statement of Net Assets.
Futures contracts are valued at their quoted daily settlement prices. The notional amounts of the contracts are not recorded in the Statement of Net Assets. Fluctuations in the value of the contracts are recorded in the Statement of Net Assets as an asset (liability) and in the Statement of Operations as unrealized appreciation (depreciation) until the contracts are closed, when they are recorded as realized futures gains (losses).
During the year ended August 31, 2019, the fund’s average investments in long and short futures contracts each represented 5% of net assets, based on the average of the notional amounts at each quarter-end during the period.
4. Forward Currency Contracts: The fund enters into forward currency contracts to protect the value of securities and related receivables and payables against changes in future foreign exchange rates. The fund’s risks in using these contracts include movement in the values of the foreign currencies relative to the U.S. dollar and the ability of the counterparties to fulfill their obligations under the contracts. The fund mitigates its counterparty risk by entering into forward currency contracts only with a diverse group of prequalified counterparties, monitoring their financial strength, entering into master netting arrangements with its counterparties, and requiring its counterparties to transfer collateral as security for their performance. In the absence of a default, the collateral pledged or received by the fund cannot be repledged, resold, or rehypothecated. The master netting arrangements provide that, in the event of a counterparty’s default (including bankruptcy), the fund may terminate the forward currency contracts, determine the net amount owed by either party in accordance with its master netting arrangements, and sell or retain any collateral held up to the net amount owed to the fund under the master netting arrangements. The forward currency contracts contain provisions whereby a counterparty may terminate open contracts if the fund’s net assets decline below a certain level, triggering a payment by the fund if the fund is in a net liability position at the time of the termination. The payment amount would be reduced by any collateral the fund has pledged. Any assets pledged as collateral for open contracts are noted in the Statement of Net Assets. The value of collateral received or pledged is compared daily to the value of the forward currency contracts exposure with each counterparty, and any difference, if in excess of a specified minimum transfer amount, is adjusted and settled within two business days.
Forward currency contracts are valued at their quoted daily prices obtained from an independent third party, adjusted for currency risk based on the expiration date of each contract. The notional amounts of the contracts are not recorded in the Statement of Net Assets. Fluctuations in the value of the contracts are recorded in the Statement of Net Assets as an asset (liability) and in the Statement of Operations as unrealized appreciation (depreciation) until the contracts are closed, when they are recorded as realized forward currency contract gains (losses).
During the year ended August 31, 2019, the fund’s average investment in forward currency contracts represented 24% of net assets, based on the average of notional amounts at each quarter-end during the period.
32
Global Wellesley Income Fund
5. To Be Announced (TBA) Transactions: A TBA transaction is an agreement to buy or sell mortgage-backed securities with agreed-upon characteristics (face amount, coupon, maturity) for settlement at a future date. The fund may be a seller of TBA transactions to reduce its exposure to the mortgage-backed securities market or in order to sell mortgage-backed securities it owns under delayed-delivery arrangements. When the fund is a buyer of TBA transactions, it maintains cash or short-term investments in an amount sufficient to meet the purchase price at the settlement date of the TBA transaction. The primary risk associated with TBA transactions is that a counterparty may default on its obligations. The fund mitigates its counterparty risk by, among other things, performing a credit analysis of counterparties, allocating transactions among numerous counterparties, and monitoring its exposure to each counterparty. The fund may also enter into a Master Securities Forward Transaction Agreement (MSFTA) with certain counterparties and require them to transfer collateral as security for their performance. In the absence of a default, the collateral pledged or received by the fund cannot be repledged, resold, or rehypothecated. Under an MSFTA, upon a counterparty default (including bankruptcy), the fund may terminate any TBA transactions with that counterparty, determine the net amount owed by either party in accordance with its master netting arrangements, and sell or retain any collateral held up to the net amount owed to the fund under the master netting arrangements.
6. Federal Income Taxes: The fund intends to continue to qualify as a regulated investment company and distribute all of its taxable income. Management has analyzed the fund’s tax positions taken for all open federal income tax years (August 31, 2018–2019), and has concluded that no provision for federal income tax is required in the fund’s financial statements.
7. Distributions: Distributions to shareholders are recorded on the ex-dividend date. Distributions are determined on a tax basis and may differ from net investment income and realized capital gains for financial reporting purposes.
8. Securities Lending: To earn additional income, the fund lends its securities to qualified institutional borrowers. Security loans are subject to termination by the fund at any time, and are required to be secured at all times by collateral in an amount at least equal to the market value of securities loaned. Daily market fluctuations could cause the value of loaned securities to be more or less than the value of the collateral received. When this occurs, the collateral is adjusted and settled before the opening of the market on the next business day. The fund further mitigates its counterparty risk by entering into securities lending transactions only with a diverse group of prequalified counterparties, monitoring their financial strength, and entering into master securities lending agreements with its counterparties. The master securities lending agreements provide that, in the event of a counterparty’s default (including bankruptcy), the fund may terminate any loans with that borrower, determine the net amount owed, and sell or retain the collateral up to the net amount owed to the fund; however, such actions may be subject to legal proceedings. While collateral mitigates counterparty risk, in the event of a default, the fund may experience delays and costs in recovering the securities loaned. The fund invests cash collateral received in Vanguard Market Liquidity Fund, and records a liability in the Statement of Net Assets for the return of the collateral, during the period the securities are on loan. Securities lending income represents fees charged to borrowers plus income earned on invested cash collateral, less expenses associated with the loan. During the term of the loan, the fund is entitled to all distributions made on or in respect of the loaned securities.
9. Credit Facility: The fund and certain other funds managed by The Vanguard Group (“Vanguard”) participate in a $4.3 billion committed credit facility provided by a syndicate of lenders pursuant to a credit agreement that may be renewed annually; each fund is individually liable for its borrowings,
33
Global Wellesley Income Fund
if any, under the credit facility. Borrowings may be utilized for temporary and emergency purposes, and are subject to the fund’s regulatory and contractual borrowing restrictions. The participating funds are charged administrative fees and an annual commitment fee of 0.10% of the undrawn amount of the facility; these fees are allocated to the funds based on a method approved by the fund’s board of trustees and included in Management and Administrative expenses on the fund’s Statement of Operations. Any borrowings under this facility bear interest at a rate based upon the higher of the one-month London Interbank Offered Rate, federal funds effective rate, or overnight bank funding rate plus an agreed-upon spread.
The fund had no borrowings outstanding at August 31, 2019, or at any time during the period then ended.
10. Other: Dividend income is recorded on the ex-dividend date. Interest income includes income distributions received from Vanguard Market Liquidity Fund and is accrued daily. Premiums and discounts on debt securities purchased are amortized and accreted, respectively, to interest income over the lives of the respective securities. Security transactions are accounted for on the date securities are bought or sold. Costs used to determine realized gains (losses) on the sale of investment securities are those of the specific securities sold.
Each class of shares has equal rights as to assets and earnings, except that each class separately bears certain class-specific expenses related to maintenance of shareholder accounts (included in Management and Administrative expenses) and shareholder reporting. Marketing and distribution expenses are allocated to each class of shares based on a method approved by the board of trustees. Income, other non-class-specific expenses, and gains and losses on investments are allocated to each class of shares based on its relative net assets.
B. Wellington Management Company LLP provides investment advisory services to the fund for a fee calculated at an annual percentage rate of average net assets. The basic fee is subject to quarterly adjustments based on the fund’s performance relative to the Global Wellesley Income Composite Index, comprising the FTSE Developed High Dividend Yield Index (net of tax) and the Bloomberg Barclays Fixed Income Composite Index, since December 1, 2017. For the year ended August 31, 2019, the investment advisory fee represented an effective annual basic rate of 0.12% of the fund’s average net assets before a decrease of $25,000 (0.01%) based on performance.
C. In accordance with the terms of a Funds’ Service Agreement (the “FSA”) between Vanguard and the fund, Vanguard furnishes to the fund corporate management, administrative, marketing, and distribution services at Vanguard’s cost of operations (as defined by the FSA). These costs of operations are allocated to the fund based on methods and guidelines approved by the board of trustees and are generally settled twice a month.
Upon the request of Vanguard, the fund may invest up to 0.40% of its net assets as capital in Vanguard. At August 31, 2019, the fund had contributed to Vanguard capital in the amount of $22,000, representing less than 0.01% of the fund’s net assets and 0.01% of Vanguard’s capital received pursuant to the FSA. The fund’s trustees and officers are also directors and employees, respectively, of Vanguard.
D. The fund’s custodian bank has agreed to reduce its fees when the fund maintains cash on deposit in the non-interest-bearing custody account. For the year ended August 31, 2019, custodian fee offset arrangements reduced the fund’s expenses by $18,000 (an annual rate of 0.00% of average net assets).
34
Global Wellesley Income Fund
E. Various inputs may be used to determine the value of the fund’s investments. These inputs are summarized in three broad levels for financial statement purposes. The inputs or methodologies used to value securities are not necessarily an indication of the risk associated with investing in those securities.
Level 1—Quoted prices in active markets for identical securities.
Level 2—Other significant observable inputs (including quoted prices for similar securities, interest rates, prepayment speeds, credit risk, etc.).
Level 3—Significant unobservable inputs (including the fund’s own assumptions used to determine the fair value of investments). Any investments valued with significant unobservable inputs are noted on the Statement of Net Assets.
The following table summarizes the market value of the fund’s investments and derivatives as of August 31, 2019, based on the inputs used to value them:
| Level 1 | Level 2 | Level 3 |
Investments | ($000) | ($000) | ($000) |
U.S. Government and Agency Obligations | — | 28,208 | — |
Asset-Backed/Commercial Mortgage-Backed Securities | — | 19,777 | — |
Corporate Bonds | — | 188,689 | — |
Sovereign Bonds | — | 35,236 | — |
Taxable Municipal Bonds | — | 8,174 | — |
Common Stocks | 76,419 | 96,306 | — |
Temporary Cash Investments | 10,511 | — | — |
Futures Contracts—Assets1 | 3 | — | — |
Futures Contracts—Liabilities1 | (2) | — | — |
Forward Currency Contracts—Assets | — | 783 | — |
Forward Currency Contracts—Liabilities | — | (96) | — |
Total | 86,931 | 377,077 | — |
1 Represents variation margin on the last day of the reporting period.
35
Global Wellesley Income Fund
F. At August 31, 2019, the fair values of derivatives were reflected in the Statement of Net Assets as follows:
| Interest Rate | Currency | |
| Contracts | Contracts | Total |
Statement of Net Assets Caption | ($000) | ($000) | ($000) |
Variation Margin Receivable—Futures Contracts | 3 | — | 3 |
Unrealized Appreciation—Forward Currency Contracts | — | 783 | 783 |
Total Assets | 3 | 783 | 786 |
| | | |
Variation Margin Payable—Futures Contracts | (2) | — | (2) |
Unrealized Depreciation —Forward Currency Contracts | — | (96) | (96) |
Total Liabilities | (2) | (96) | (98) |
Realized net gain (loss) and the change in unrealized appreciation (depreciation) on derivatives for the year ended August 31, 2019, were:
| Interest Rate | Currency | |
| Contracts | Contracts | Total |
Realized Net Gain (Loss) on Derivatives | ($000) | ($000) | ($000) |
Futures Contracts | 364 | — | 364 |
Forward Currency Contracts | — | 7,199 | 7,199 |
Realized Net Gain (Loss) on Derivatives | 364 | 7,199 | 7,563 |
| | | |
Change in Unrealized Appreciation (Depreciation) on Derivatives | | | |
Futures Contracts | 279 | — | 279 |
Forward Currency Contracts | — | 700 | 700 |
Change in Unrealized Appreciation (Depreciation) on Derivatives | 279 | 700 | 979 |
36
Global Wellesley Income Fund
G. Permanent differences between book-basis and tax-basis components of net assets are reclassified among capital accounts in the financial statements to reflect their tax character. These reclassifications have no effect on net assets or net asset value per share. As of period end, permanent differences primarily attributable to the accounting for foreign currency transactions and passive foreign investment companies were reclassified between the individual components of total distributable earnings (loss).
| Amount |
| ($000) |
Paid-in Capital | — |
Total Distributable Earnings (Loss) | — |
Temporary differences between book-basis and tax-basis components of total distributable earnings (loss) arise when certain items of income, gain, or loss are recognized in different periods for financial statement and tax purposes; these differences will reverse at some time in the future. The differences are primarily related to the tax deferral on wash sales and straddles; the realization of unrealized gains or losses on certain futures contracts and forward currency contracts; and the deferral of post-October capital losses to future periods. As of period end, the tax-basis components of total distributable earnings (loss) are detailed in the table as follows:
| Amount |
| ($000) |
Undistributed Ordinary Income | 2,234 |
Undistributed Long-Term Gains | — |
Capital Loss Carryforwards* | (14,775) |
Net Unrealized Gains (Losses) | 12,174 |
* Includes losses of $14,775,000 realized subsequent to October 31, 2018, which are deferred and will be treated as realized for tax purposes in the next fiscal year.
As of August 31, 2019, gross unrealized appreciation and depreciation for investments and derivatives based on cost for U.S. federal income tax purposes were as follows:
| Amount |
| ($000) |
Tax Cost | 451,118 |
Gross Unrealized Appreciation | 20,116 |
Gross Unrealized Depreciation | (7,917) |
Net Unrealized Appreciation (Depreciation) | 12,199 |
37
Global Wellesley Income Fund
H. During the year ended August 31, 2019, the fund purchased $325,429,000 of investment securities and sold $351,550,000 of investment securities, other than U.S. government securities and temporary cash investments. Purchases and sales of U.S. government securities were $76,116,000 and $82,125,000, respectively
I. Capital share transactions for each class of shares were:
| Year Ended
August 31, 2019 | | October 18, 20171 to
August 31, 2018 |
| Amount | Shares | | Amount | Shares |
| ($000) | (000) | | ($000) | (000) |
Investor Shares | | | | | |
Issued | 29,050 | 1,497 | | 167,104 | 8,345 |
Issued in Lieu of Cash Distributions | 2,809 | 147 | | 1,272 | 64 |
Redeemed | (40,761) | (2,103) | | (74,386) | (3,732) |
Net Increase (Decrease)—Investor Shares | (8,902) | (459) | | 93,990 | 4,677 |
Admiral Shares | | | | | |
Issued | 143,988 | 5,941 | | 596,215 | 23,834 |
Issued in Lieu of Cash Distributions | 12,597 | 527 | | 5,296 | 214 |
Redeemed | (189,999) | (7,853) | | (189,254) | (7,610) |
Net Increase (Decrease)—Admiral Shares | (33,414) | (1,385) | | 412,257 | 16,438 |
1 Commencement of subscription period for the fund.
J. Management has determined that no events or transactions occurred subsequent to August 31, 2019, that would require recognition or disclosure in these financial statements.
38
Report of Independent Registered Public Accounting Firm
To the Board of Trustees of Vanguard World Fund and Shareholders of Vanguard Global Wellesley Income Fund
Opinion on the Financial Statements
We have audited the accompanying statement of net assets of Vanguard Global Wellesley Income Fund (one of the funds constituting Vanguard World Fund, referred to hereafter as the “Fund”) as of August 31, 2019, the related statement of operations for the year ended August 31, 2019, the statement of changes in net assets, including the related notes, and the financial highlights for the period from October 18, 2017 (commencement of subscription period) through August 31, 2019 (collectively referred to as the “financial statements”). In our opinion, the financial statements present fairly, in all material respects, the financial position of the Fund as of August 31, 2019, the results of its operations for the year then ended, the changes in its net assets and the financial highlights for the period from October 18, 2017 (commencement of subscription period) through August 31, 2019 in conformity with accounting principles generally accepted in the United States of America.
Basis for Opinion
These financial statements are the responsibility of the Fund’s management. Our responsibility is to express an opinion on the Fund’s financial statements based on our audits. We are a public accounting firm registered with the Public Company Accounting Oversight Board (United States) (“PCAOB”) and are required to be independent with respect to the Fund in accordance with the U.S. federal securities laws and the applicable rules and regulations of the Securities and Exchange Commission and the PCAOB.
We conducted our audits of these financial statements in accordance with the standards of the PCAOB. Those standards require that we plan and perform the audit to obtain reasonable assurance about whether the financial statements are free of material misstatement, whether due to error or fraud.
Our audits included performing procedures to assess the risks of material misstatement of the financial statements, whether due to error or fraud, and performing procedures that respond to those risks. Such procedures included examining, on a test basis, evidence regarding the amounts and disclosures in the financial statements. Our audits also included evaluating the accounting principles used and significant estimates made by management, as well as evaluating the overall presentation of the financial statements. Our procedures included confirmation of securities owned as of August 31, 2019 by correspondence with the custodian and brokers and by agreement to the underlying ownership records of the transfer agent; when replies were not received from brokers, we performed other auditing procedures. We believe that our audits provide a reasonable basis for our opinion.
/s/PricewaterhouseCoopers LLP
Philadelphia, Pennsylvania
October 18, 2019
We have served as the auditor of one or more investment companies in The Vanguard Group of Funds since 1975.
39
Special 2019 tax information (unaudited) for Vanguard Global Wellesley Income Fund
This information for the fiscal year ended August 31, 2019, is included pursuant to provisions of the Internal Revenue Code.
The fund distributed $3,919,000 as capital gain dividends (20% rate gain distributions) to shareholders during the fiscal year .
The fund distributed $4,787,000 of qualified dividend income to shareholders during the fiscal year.
For corporate shareholders, 19.0% of investment income (dividend income plus short-term gains, if any) qualifies for the dividends-received deduction.
The fund designates to shareholders foreign source income of $4,739,000 and foreign taxes paid of $374,000. Shareholders will receive more detailed information with their Form 1099-DIV in January 2020 to determine the calendar-year amounts to be included on their 2019 tax returns.
40
BLOOMBERG is a trademark and service mark of Bloomberg Finance L.P. BARCLAYS is a trademark and service mark of Barclays Bank Plc, used under license. Bloomberg Finance L.P. and its affiliates, including Bloomberg Index Services Limited (BISL) (collectively, Bloomberg), or Bloomberg’s licensors, own all proprietary rights in the Bloomberg Barclays Fixed Income Composite Index, which is composed of 80% Bloomberg Barclays Global Aggregate Credit Index (USD Hedged), 10% Bloomberg Barclays Global Aggregate Treasury Index (USD Hedged), and 10% Bloomberg Barclays Global Aggregate Securitized Index (USD Hedged) (the Indices or Bloomberg Barclays Indices).
Neither Barclays Bank Plc, Barclays Capital Inc., or any affiliate (collectively Barclays) or Bloomberg is the issuer or producer of the Global Wellesley Income Fund and neither Bloomberg nor Barclays has any responsibilities, obligations or duties to investors in the Global Wellesley Income Fund. The Indices are licensed for use by The Vanguard Group, Inc. (Vanguard) as the sponsor of the Global Wellesley Income Fund. Bloomberg and Barclays’ only relationship with Vanguard in respect to the Indices is the licensing of the Indices, which are determined, composed and calculated by BISL, or any successor thereto, without regard to the Issuer or the Global Wellesley Income Fund or the owners of the Global Wellesley Income Fund.
Additionally, Vanguard may for itself execute transaction(s) with Barclays in or relating to the Indices in connection with the Global Wellesley Income Fund. Investors acquire the Global Wellesley Income Fund from Vanguard and investors neither acquire any interest in the Indices nor enter into any relationship of any kind whatsoever with Bloomberg or Barclays upon making an investment in the Global Wellesley Income Fund. The Global Wellesley Income Fund is not sponsored, endorsed, sold or promoted by Bloomberg or Barclays. Neither Bloomberg nor Barclays makes any representation or warranty, express or implied regarding the advisability of investing in the Global Wellesley Income Fund or the advisability of investing in securities generally or the ability of the Indices to track corresponding or relative market performance. Neither Bloomberg nor Barclays has passed on the legality or suitability of the Global Wellesley Income Fund with respect to any person or entity. Neither Bloomberg nor Barclays is responsible for and has not participated in the determination of the timing of, prices at, or quantities of the Global Wellesley Income Fund to be issued. Neither Bloomberg nor Barclays has any obligation to take the needs of the Issuer or the owners of the Global Wellesley Income Fund or any other third party into consideration in determining, composing or calculating the Indices. Neither Bloomberg nor Barclays has any obligation or liability in connection with administration, marketing or trading of the Global Wellesley Income Fund.
41
The licensing agreement between Bloomberg and Barclays is solely for the benefit of Bloomberg and Barclays and not for the benefit of the owners of the Global Wellesley Income Fund, investors or other third parties. In addition, the licensing agreement between Vanguard and Bloomberg is solely for the benefit of Vanguard and Bloomberg and not for the benefit of the owners of the Global Wellesley Income Fund, investors or other third parties.
NEITHER BLOOMBERG NOR BARCLAYS SHALL HAVE ANY LIABILITY TO THE ISSUER, INVESTORS OR TO OTHER THIRD PARTIES FOR THE QUALITY, ACCURACY AND/OR COMPLETENESS OF THE BLOOMBERG BARCLAYS INDICES OR ANY DATA INCLUDED THEREIN OR FOR INTERRUPTIONS IN THE DELIVERY OF THE BLOOMBERG BARCLAYS INDICES. NEITHER BLOOMBERG NOR BARCLAYS MAKES ANY WARRANTY, EXPRESS OR IMPLIED, AS TO RESULTS TO BE OBTAINED BY THE ISSUER, THE INVESTORS OR ANY OTHER PERSON OR ENTITY FROM THE USE OF THE BLOOMBERG BARCLAYS INDICES OR ANY DATA INCLUDED THEREIN. NEITHER BLOOMBERG NOR BARCLAYS MAKES ANY EXPRESS OR IMPLIED WARRANTIES, AND EACH HEREBY EXPRESSLY DISCLAIMS ALL WARRANTIES OF MERCHANTABILITY OR FITNESS FOR A PARTICULAR PURPOSE OR USE WITH RESPECT TO THE BLOOMBERG BARCLAYS INDICES OR ANY DATA INCLUDED THEREIN. BLOOMBERG RESERVES THE RIGHT TO CHANGE THE METHODS OF CALCULATION OR PUBLICATION, OR TO CEASE THE CALCULATION OR PUBLICATION OF THE BLOOMBERG BARCLAYS INDICES, AND NEITHER BLOOMBERG NOR BARCLAYS SHALL BE LIABLE FOR ANY MISCALCULATION OF OR ANY INCORRECT, DELAYED OR INTERRUPTED PUBLICATION WITH RESPECT TO ANY OF THE BLOOMBERG BARCLAYS INDICES. NEITHER BLOOMBERG NOR BARCLAYS SHALL BE LIABLE FOR ANY DAMAGES, INCLUDING, WITHOUT LIMITATION, ANY SPECIAL, INDIRECT OR CONSEQUENTIAL DAMAGES, OR ANY LOST PROFITS AND EVEN IF ADVISED OF THE POSSIBILITY OF SUCH, RESULTING FROM THE USE OF THE BLOOMBERG BARCLAYS INDICES OR ANY DATA INCLUDED THEREIN OR WITH RESPECT TO THE VANGUARD GLOBAL WELLESLEY INCOME FUND.
None of the information supplied by Bloomberg or Barclays and used in this publication may be reproduced in any manner without the prior written permission of both Bloomberg and Barclays Capital, the investment banking division of Barclays Bank Plc. Barclays Bank Plc is registered in England No. 1026167. Registered office 1 Churchill Place London E14 5HP.
© 2019 Bloomberg. Used with Permission.
Source: Bloomberg Index Services Limited. Copyright 2019, Bloomberg. All rights reserved.
42
The People Who Govern Your Fund
The trustees of your mutual fund are there to see that the fund is operated and managed in your best interests since, as a shareholder, you are a part owner of the fund. Your fund’s trustees also serve on the board of directors of The Vanguard Group, Inc., which is owned by the Vanguard funds and provides services to them.
A majority of Vanguard’s board members are independent, meaning that they have no affiliation with Vanguard or the funds they oversee, apart from the sizable personal investments they have made as private individuals. The independent board members have distinguished backgrounds in business, academia, and public service. Each of the trustees and executive officers oversees 212 Vanguard funds.
Information for each trustee and executive officer of the fund appears below. The mailing address of the trustees and officers is P.O. Box 876, Valley Forge, PA 19482. More information about the trustees is in the Statement of Additional Information, which can be obtained, without charge, by contacting Vanguard at 800-662-7447, or online at vanguard.com.
Interested Trustee1
Mortimer J. Buckley
Born in 1969. Trustee since January 2018. Principal occupation(s) during the past five years and other experience: chairman of the board (January 2019–present) of Vanguard and of each of the investment companies served by Vanguard; chief executive officer (January 2018–present) of Vanguard; chief executive officer, president, and trustee (January 2018–present) of each of the investment companies served by Vanguard; president and director (2017–present) of Vanguard; and president (February 2018–present) of Vanguard Marketing Corporation. Chief investment officer (2013–2017), managing director (2002–2017), head of the Retail Investor Group (2006–2012), and chief information officer (2001–2006) of Vanguard. Chairman of the board (2011–2017) and trustee (2009–2017) of the Children’s Hospital of Philadelphia; trustee (2018–present) of The Shipley School.
Independent Trustees
Emerson U. Fullwood
Born in 1948. Trustee since January 2008. Principal occupation(s) during the past five years and other experience: executive chief staff and marketing officer for North America and corporate vice president (retired 2008) of Xerox Corporation (document management products and services). Former president of the Worldwide Channels Group, Latin America, and Worldwide Customer Service and executive chief staff officer of Developing Markets of Xerox. Executive in residence and 2009–2010 Distinguished Minett Professor at the Rochester Institute of Technology. Director of SPX FLOW, Inc. (multi-industry manufacturing). Director of the University of Rochester Medical Center, the Monroe Community College Foundation, the United Way of Rochester, North Carolina A&T University, and Roberts Wesleyan College. Trustee of the University of Rochester.
Amy Gutmann
Born in 1949. Trustee since June 2006. Principal occupation(s) during the past five years and other experience: president (2004–present) of the University of Pennsylvania. Christopher H. Browne Distinguished Professor of Political Science, School of Arts and Sciences, and professor of communication, Annenberg School for Communication, with secondary faculty appointments in the Department of Philosophy, School of Arts and Sciences, and at the Graduate School of Education, University of Pennsylvania. Trustee of the National Constitution Center.
F. Joseph Loughrey
Born in 1949. Trustee since October 2009. Principal occupation(s) during the past five years and other experience: president and chief operating officer (retired 2009) and vice chairman of the board (2008–2009) of Cummins Inc. (industrial machinery). Chairman of the board of Hillenbrand, Inc. (specialized consumer services), and the Lumina Foundation.
1 Mr. Buckley is considered an “interested person,” as defined in the Investment Company Act of 1940, because he is an officer of the Vanguard funds.
Director of the V Foundation and Oxfam America. Member of the advisory council for the College of Arts and Letters and chair of the advisory board to the Kellogg Institute for International Studies, both at the University of Notre Dame.
Mark Loughridge
Born in 1953. Trustee since March 2012. Principal occupation(s) during the past five years and other experience: senior vice president and chief financial officer (retired 2013) of IBM (information technology services). Fiduciary member of IBM’s Retirement Plan Committee (2004–2013), senior vice president and general manager (2002–2004) of IBM Global Financing, vice president and controller (1998–2002) of IBM, and a variety of other prior management roles at IBM. Member of the Council on Chicago Booth.
Scott C. Malpass
Born in 1962. Trustee since March 2012. Principal occupation(s) during the past five years and other experience: chief investment officer (1989–present) and vice president (1996–present) of the University of Notre Dame. Assistant professor of finance at the Mendoza College of Business, University of Notre Dame, and member of the Notre Dame 403(b) Investment Committee. Chairman of the board of TIFF Advisory Services, Inc. Member of the board of Catholic Investment Services, Inc. (investment advisors) and the board of superintendence of the Institute for the Works of Religion.
Deanna Mulligan
Born in 1963. Trustee since January 2018. Principal occupation(s) during the past five years and other experience: president (2010–present) and chief executive officer (2011–present) of The Guardian Life Insurance Company of America. Chief operating officer (2010–2011) and executive vice president (2008–2010) of Individual Life and Disability of The Guardian Life Insurance Company of America. Member of the board of The Guardian Life Insurance Company of America, the American Council of Life Insurers, the Partnership for New York City (business leadership), and the Committee Encouraging Corporate Philanthropy. Trustee of the Economic Club of New York and the Bruce Museum (arts and science). Member of the Advisory Council for the Stanford Graduate School of Business.
André F. Perold
Born in 1952. Trustee since December 2004. Principal occupation(s) during the past five years and other experience: George Gund Professor of Finance and Banking, Emeritus at the Harvard Business School (retired 2011). Chief investment officer and co-managing partner of HighVista Strategies LLC (private investment firm). Board of advisors and investment committee member of the Museum of Fine Arts Boston. Board member (2018–present) of RIT Capital Partners (investment firm); investment committee member of Partners Health Care System.
Sarah Bloom Raskin
Born in 1961. Trustee since January 2018. Principal occupation(s) during the past five years and other experience: deputy secretary (2014–2017) of the United States Department of the Treasury. Governor (2010–2014) of the Federal Reserve Board. Commissioner (2007–2010) of financial regulation for the State of Maryland. Member of the board of directors (2012–2014) of Neighborhood Reinvestment Corporation. Director (2017–present) of i(x) Investments, LLC; director (2017–present) of Reserve Trust. Rubinstein Fellow (2017–present) of Duke University; trustee (2017–present) of Amherst College.
Peter F. Volanakis
Born in 1955. Trustee since July 2009. Principal occupation(s) during the past five years and other experience: president and chief operating officer (retired 2010) of Corning Incorporated (communications equipment) and director of Corning Incorporated (2000–2010) and Dow Corning (2001–2010). Director (2012) of SPX Corporation (multi-industry manufacturing). Overseer of the Amos Tuck School of Business Administration, Dartmouth College (2001–2013). Chairman of the board of trustees of Colby-Sawyer College. Member of the board of Hypertherm Inc. (industrial cutting systems, software, and consumables).
Executive Officers
Glenn Booraem
Born in 1967. Principal occupation(s) during the past five years and other experience: principal of Vanguard. Investment stewardship officer (2017–present), treasurer (2015–2017), controller (2010–2015), and assistant controller (2001–2010) of each of the investment companies served by Vanguard.
Christine M. Buchanan
Born in 1970. Principal occupation(s) during the past five years and other experience: principal of Vanguard and global head of Fund Administration at Vanguard. Treasurer (2017–present) of each of the investment companies served by Vanguard. Partner (2005–2017) at KPMG LLP (audit, tax, and advisory services).
Thomas J. Higgins
Born in 1957. Principal occupation(s) during the past five years and other experience: principal of Vanguard. Chief financial officer (2008–present) and treasurer (1998–2008) of each of the investment companies served by Vanguard.
Peter Mahoney
Born in 1974. Principal occupation(s) during the past five years and other experience: principal of Vanguard. Controller (2015–present) of each of the investment companies served by Vanguard. Head of International Fund Services (2008–2014) at Vanguard.
Anne E. Robinson
Born in 1970. Principal occupation(s) during the past five years and other experience: general counsel (2016–present) of Vanguard. Secretary (2016–present) of Vanguard and of each of the investment companies served by Vanguard. Managing director (2016–present) of Vanguard. Director and senior vice president (2016–2018) of Vanguard Marketing Corporation. Managing director and general counsel of Global Cards and Consumer Services (2014–2016) at Citigroup. Counsel (2003–2014) at American Express.
Michael Rollings
Born in 1963. Principal occupation(s) during the past five years and other experience: finance director (2017–present) and treasurer (2017) of each of the investment companies served by Vanguard. Managing director (2016–present) of Vanguard. Chief financial officer (2016–present) of Vanguard. Director (2016–present) of Vanguard Marketing Corporation. Executive vice president and chief financial officer (2006–2016) of MassMutual Financial Group.
John E. Schadl
Born in 1972. Principal occupation(s) during the past five years and other experience: principal of Vanguard. Chief compliance officer (2019–present) of Vanguard and of each of the investment companies served by Vanguard. Assistant vice president (May 2019–present) of Vanguard Marketing Corporation.
Vanguard Senior Management Team
Joseph Brennan | Chris D. McIsaac |
Mortimer J. Buckley | James M. Norris |
Gregory Davis | Thomas M. Rampulla |
John James | Karin A. Risi |
Martha G. King | Anne E. Robinson |
John T. Marcante | Michael Rollings |
| 
|
| |
| P.O. Box 2600 |
| Valley Forge, PA 19482-2600 |
Connect with Vanguard® > vanguard.com
Fund Information > 800-662-7447
Direct Investor Account Services > 800-662-2739
Institutional Investor Services > 800-523-1036
Text Telephone for People
Who Are Deaf or Hard of Hearing > 800-749-7273
This material may be used in conjunction with the offering of shares of any Vanguard fund only if preceded or accompanied by the fund’s current prospectus.
All comparative mutual fund data are from Morningstar, Inc., unless otherwise noted.
You can obtain a free copy of Vanguard’s proxy voting guidelines by visiting vanguard.com/proxyreporting or by calling Vanguard at 800-662-2739. The guidelines are also available from the SEC’s website, www.sec.gov. In addition, you may obtain a free report on how your fund voted the proxies for securities it owned during the 12 months ended June 30. To get the report, visit either vanguard.com/proxyreporting or www.sec.gov.
You can review information about your fund on the SEC’s website, and you can receive copies of this information, for a fee, by sending a request via email addressed to publicinfo@sec.gov.
CFA® is a registered trademark owned by CFA Institute.
| © 2019 The Vanguard Group, Inc. |
| All rights reserved. |
| Vanguard Marketing Corporation, Distributor. |
| |
| Q14960 102019 |

Annual Report | August 31, 2019 Vanguard ESG U.S. Stock ETF |
See the inside front cover for important information about access to your fund’s annual and semiannual shareholder reports. |
Important information about access to shareholder reports
Beginning on January 1, 2021, as permitted by regulations adopted by the Securities and Exchange Commission, paper copies of your fund’s annual and semiannual shareholder reports will no longer be sent to you by mail, unless you specifically request them. Instead, you will be notified by mail each time a report is posted on the website and will be provided with a link to access the report.
If you have already elected to receive shareholder reports electronically, you will not be affected by this change and do not need to take any action. You may elect to receive shareholder reports and other communications from the fund electronically by contacting your financial intermediary (such as a broker-dealer or bank) or, if you invest directly with the fund, by calling Vanguard at one of the phone numbers on the back cover of this report or by logging on to vanguard.com.
You may elect to receive paper copies of all future shareholder reports free of charge. If you invest through a financial intermediary, you can contact the intermediary to request that you continue to receive paper copies. If you invest directly with the fund, you can call Vanguard at one of the phone numbers on the back cover of this report or log on to vanguard.com. Your election to receive paper copies will apply to all the funds you hold through an intermediary or directly with Vanguard.
Contents | |
| |
A Note From Our Chairman | 1 |
Your Fund’s Performance at a Glance | 2 |
About Your Fund’s Expenses | 3 |
Performance Summary | 5 |
Financial Statements | 7 |
Trustees Approve Advisory Arrangement | 34 |
Please note: The opinions expressed in this report are just that—informed opinions. They should not be considered promises or advice. Also, please keep in mind that the information and opinions cover the period through the date on the front of this report. Of course, the risks of investing in your fund are spelled out in the prospectus.
A Note From Our Chairman

Tim Buckley
Chairman and Chief Executive Officer
Dear Shareholder,
Recent volatility in financial markets—affecting stocks, bonds, and commodities—has been a good reminder of the wise old adage, “Never keep all your eggs in one basket.” Maintaining balance and diversification in your investment portfolio can help to both limit risk and set you up for long-term success.
It’s understandable why some investors might become complacent after a long market run-up like the one that lifted stock prices, especially U.S. stock prices, in the years following the global financial crisis. But failing to rebalance regularly can leave a portfolio with a much different mix of assets than intended and, often, more risk than intended.
Balance across and diversification within asset classes are powerful tools for managing risk and achieving your investment goals. A portfolio’s allocation will determine a large portion of its long-term return and also the majority of its volatility risk. A well-diversified portfolio is less vulnerable to significant swings in the performance of any one segment of the asset classes in which it invests.
Balance and diversification will never eliminate the risk of loss, nor will they guarantee positive returns in a declining market. But they should reduce the chance that you’ll suffer disproportionate losses in one particular high-flying asset class or sector when it comes back to earth. And exposure to all key market components should give you at least some participation in the sectors that are performing best at any given time.
Vanguard is committed to helping you achieve balance and diversification in your portfolios to help meet your investment goals. We thank you for your continued loyalty.
Sincerely,

Mortimer J. Buckley
Chairman and Chief Executive Officer
October 1, 2019
1
Your Fund’s Performance at a Glance
· From its inception on September 18, 2018, to August 31, 2019, Vanguard ESG U.S. Stock ETF returned 3.40%. This result was in line with its benchmark’s return of 3.54%.
· The ETF’s investment objective is to closely track the performance of its market-capitalization-weighted benchmark index, which is composed of large-, mid-, and small-cap stocks screened for certain environmental, social, and corporate governance (ESG) criteria by the index sponsor, which is independent of Vanguard.
· During the period, investors had to contend with signs of decelerating growth, flare-ups in trade disputes, heightened international tensions with Iran, and a lack of agreement in the United Kingdom on how to exit the European Union. Stocks nevertheless finished higher as a whole, with gains from utilities, telecommunications, and consumer goods more than offsetting declines in health care, basic materials, and oil & gas.
· In June 2019, an issue in the screening methodology used by the fund’s benchmark provider, FTSE Russell, resulted in the erroneous inclusion of securities in the benchmark followed by the fund. FTSE resolved the issue and subsequently updated the benchmark. Vanguard promptly took action to sell the stocks and align the fund’s holdings with the corrected data. The fund held the stocks between June 21, 2019, and August 5, 2019. The issue and subsequent correction did not have a material impact on the fund’s performance.
Market Barometer
| | Average Annual Total Returns
Periods Ended August 31, 2019 | |
| | One Year | | Three Years | | Five Years | |
Stocks | | | | | | | |
Russell 1000 Index (Large-caps) | | 2.49% | | 12.57% | | 9.85% | |
Russell 2000 Index (Small-caps) | | -12.89 | | 7.89 | | 6.41 | |
Russell 3000 Index (Broad U.S. market) | | 1.31 | | 12.24 | | 9.60 | |
FTSE All-World ex US Index (International) | | -3.18 | | 5.97 | | 1.71 | |
| | | | | | | |
Bonds | | | | | | | |
Bloomberg Barclays U.S. Aggregate Bond Index (Broad taxable market) | | 10.17% | | 3.09% | | 3.35% | |
Bloomberg Barclays Municipal Bond Index (Broad tax-exempt market) | | 8.72 | | 3.30 | | 3.85 | |
FTSE Three-Month U.S. Treasury Bill Index | | 2.36 | | 1.47 | | 0.91 | |
| | | | | | | |
CPI | | | | | | | |
Consumer Price Index | | 1.75% | | 2.13% | | 1.53% | |
2
About Your Fund’s Expenses
As a shareholder of the fund, you incur ongoing costs, which include costs for portfolio management, administrative services, and shareholder reports (like this one), among others. Operating expenses, which are deducted from a fund’s gross income, directly reduce the investment return of the fund.
A fund’s expenses are expressed as a percentage of its average net assets. This figure is known as the expense ratio. The following examples are intended to help you understand the ongoing costs (in dollars) of investing in your fund and to compare these costs with those of other mutual funds. The examples are based on an investment of $1,000 made at the beginning of the period shown and held for the entire period.
The accompanying table illustrates your fund’s costs in two ways:
· Based on actual fund return. This section helps you to estimate the actual expenses that you paid over the period. The “Ending Account Value” shown is derived from the fund’s actual return, and the third column shows the dollar amount that would have been paid by an investor who started with $1,000 in the fund. You may use the information here, together with the amount you invested, to estimate the expenses that you paid over the period.
To do so, simply divide your account value by $1,000 (for example, an $8,600 account value divided by $1,000 = 8.6), then multiply the result by the number given for your fund under the heading “Expenses Paid During Period.”
· Based on hypothetical 5% yearly return. This section is intended to help you compare your fund’s costs with those of other mutual funds. It assumes that the fund had a yearly return of 5% before expenses, but that the expense ratio is unchanged. In this case—because the return used is not the fund’s actual return—the results do not apply to your investment. The example is useful in making comparisons because the Securities and Exchange Commission requires all mutual funds to calculate expenses based on a 5% return. You can assess your fund’s costs by comparing this hypothetical example with the hypothetical examples that appear in shareholder reports of other funds.
Note that the expenses shown in the table are meant to highlight and help you compare ongoing costs only and do not reflect transaction costs incurred by the fund for buying and selling securities. Further, the expenses do not include any purchase, redemption, or account service fees described in the fund prospectus. If such fees were applied to your account, your costs would be higher. Your fund does not carry a “sales load.”
The calculations assume no shares were bought or sold during the period. Your actual costs may have been higher or lower, depending on the amount of your investment and the timing of any purchases or redemptions.
You can find more information about the fund’s expenses, including annual expense ratios, in the Financial Statements section of this report. For additional information on operating expenses and other shareholder costs, please refer to your fund’s current prospectus.
3
Six Months Ended August 31, 2019
| Beginning | Ending | Expenses |
| Account Value | Account Value | Paid During |
ESG U.S. Stock ETF | 2/28/2019 | 8/31/2019 | Period |
Based on Actual Fund Return | $1,000.00 | $1,067.70 | $0.63 |
Based on Hypothetical 5% Yearly Return | 1,000.00 | 1,024.60 | 0.61 |
The calculations are based on expenses incurred in the most recent six-month period. The fund’s annualized six-month expense ratio for that period is 0.12%. The dollar amounts shown as “Expenses Paid” are equal to the annualized expense ratio multiplied by the average account value over the period, multiplied by the number of days in that period, then divided by the number of days in the most recent 12-month period (184/365).
4
ESG U.S. Stock ETF
Performance Summary
All of the returns in this report represent past performance, which is not a guarantee of future results that may be achieved by the fund. (Current performance may be lower or higher than the performance data cited. For performance data current to the most recent month-end, visit our website at vanguard.com/performance.) Note, too, that both investment returns and principal value can fluctuate widely, so an investor’s shares, when sold, could be worth more or less than their original cost. The returns shown do not reflect taxes that a shareholder would pay on fund distributions or on the sale of fund shares.
Cumulative Performance: September 18, 2018, Through August 31, 2019
Initial Investment of $10,000
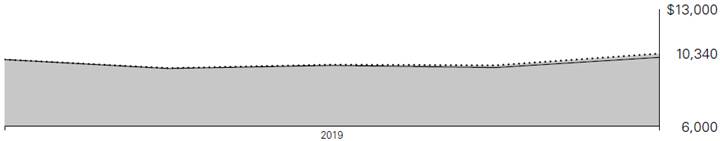
| | Total Returns
Period Ended August 31, 2019 | |
| | Since
Inception
(9/18/2018) | Final Value
of a $10,000
Investment |

| ESG U.S. Stock ETF Net Asset Value | 3.40% | $10,340 |
| ESG U.S. Stock ETF Market Price | 3.43 | 10,343 |

| FTSE US All Cap Choice Index | 3.54 | 10,354 |

| Dow Jones U.S. Total Stock Market Float Adjusted Index | 1.27 | 10,127 |
“Since Inception” performance is calculated from the ETF Shares’ inception date for both the fund and its comparative standards.
See Financial Highlights for dividend and capital gains information.
5
ESG U.S. Stock ETF
Sector Diversification
As of August 31, 2019
Basic Materials | 2.4% |
Consumer Goods | 8.2 |
Consumer Services | 14.7 |
Financials | 20.0 |
Health Care | 13.5 |
Industrials | 10.8 |
Oil & Gas | 1.3 |
Technology | 25.4 |
Telecommunications | 2.3 |
Utilities | 1.4 |
The table reflects the fund’s equity exposure, based on its investments in stocks and stock index futures. Any holdings in short-term reserves are excluded. Sector categories are based on the Industry Classification Benchmark (“ICB”), except for the “Other” category (if applicable), which includes securities that have not been provided an ICB classification as of the effective reporting period.
The Industry Classification Benchmark (“ICB”) is owned by FTSE. FTSE does not accept any liability to any person for any loss or damage arising out of any error or omission in the ICB.
6
ESG U.S. Stock ETF
Financial Statements
Statement of Net Assets
As of August 31, 2019
The fund files its complete schedule of portfolio holdings with the Securities and Exchange Commission (SEC) for the first and third quarters of each fiscal year as an exhibit to its reports on Form N-PORT. The fund’s Form N-PORT reports are available on the SEC’s website at www.sec.gov.
| | | | | | Market | |
| | | | | | Value· | |
| | | | Shares | | ($000 | ) |
Common Stocks (99.8%)1 | | | | | |
Basic Materials (2.4%) | | | | | |
| | Linde plc | | 13,482 | | 2,547 | |
| | Ecolab Inc. | | 6,221 | | 1,283 | |
| | DuPont de Nemours Inc. | | 18,886 | | 1,283 | |
| | Air Products & Chemicals Inc. | | 5,413 | | 1,223 | |
| | Newmont Goldcorp Corp. | | 20,210 | | 806 | |
| | Dow Inc. | | 18,720 | | 798 | |
| | LyondellBasell Industries NV Class A | | 7,512 | | 581 | |
| | International Paper Co. | | 10,087 | | 394 | |
| | Nucor Corp. | | 8,036 | | 394 | |
| | Celanese Corp. Class A | | 3,145 | | 357 | |
| | International Flavors & Fragrances Inc. | | 2,657 | | 292 | |
| | FMC Corp. | | 3,266 | | 282 | |
| | CF Industries Holdings Inc. | | 5,578 | | 269 | |
| | Avery Dennison Corp. | | 2,081 | | 241 | |
| | Eastman Chemical Co. | | 3,679 | | 240 | |
| | RPM International Inc. | | 3,186 | | 216 | |
| | Royal Gold Inc. | | 1,605 | | 214 | |
| | Albemarle Corp. | | 2,853 | | 176 | |
| | Reliance Steel & Aluminum Co. | | 1,656 | | 161 | |
| | Steel Dynamics Inc. | | 5,898 | | 159 | |
* | | Axalta Coating Systems Ltd. | | 5,025 | | 145 | |
| | Versum Materials Inc. | | 2,654 | | 138 | |
| | Huntsman Corp. | | 6,474 | | 129 | |
| | Ashland Global Holdings Inc. | | 1,577 | | 115 | |
| | Scotts Miracle-Gro Co. | | 1,041 | | 111 | |
| | Mosaic Co. | | 5,978 | | 110 | |
| | WR Grace & Co. | | 1,513 | | 102 | |
| | NewMarket Corp. | | 193 | | 92 | |
* | | Univar Inc. | | 4,142 | | 80 | |
* | | Ingevity Corp. | | 1,050 | | 80 | |
| | Sensient Technologies Corp. | | 1,145 | | 75 | |
| | Cabot Corp. | | 1,865 | | 75 | |
| | Balchem Corp. | | 813 | | 72 | |
* | | Element Solutions Inc. | | 7,235 | | 68 | |
| | PolyOne Corp. | | 1,939 | | 62 | |
| | Minerals Technologies Inc. | | 1,255 | | 60 | |
| | Commercial Metals Co. | | 3,779 | | 59 | |
| | HB Fuller Co. | | 1,385 | | 59 | |
| | Westlake Chemical Corp. | | 1,007 | | 59 | |
| | Carpenter Technology Corp. | | 1,141 | | 55 | |
| | Domtar Corp. | | 1,538 | | 51 | |
| | Compass Minerals International Inc. | | 961 | | 48 | |
| | Quaker Chemical Corp. | | 298 | | 47 | |
| | Stepan Co. | | 472 | | 45 | |
| | Innospec Inc. | | 524 | | 44 | |
| | Kaiser Aluminum Corp. | | 468 | | 41 | |
* | | Kraton Corp. | | 1,308 | | 36 | |
* | | Coeur Mining Inc. | | 6,320 | | 35 | |
* | | Constellium SE Class A | | 2,645 | | 32 | |
* | | Alcoa Corp. | | 1,718 | | 31 | |
| | US Silica Holdings Inc. | | 2,502 | | 25 | |
* | | AdvanSix Inc. | | 1,096 | | 24 | |
| | Neenah Inc. | | 381 | | 24 | |
| | Innophos Holdings Inc. | | 844 | | 24 | |
* | | AK Steel Holding Corp. | | 10,616 | | 23 | |
| | Hecla Mining Co. | | 12,590 | | 22 | |
| | Rayonier Advanced Materials Inc. | | 4,770 | | 17 | |
| | Tredegar Corp. | | 921 | | 16 | |
* | | Century Aluminum Co. | | 2,267 | | 12 | |
| | Schnitzer Steel Industries Inc. | | 531 | | 12 | |
| | Tronox Holdings plc Class A | | 352 | | 3 | |
| | United States Steel Corp. | | 182 | | 2 | |
| | | | | | 14,276 | |
Consumer Goods (8.2%) | | | | | |
| | Procter & Gamble Co. | | 61,477 | | 7,391 | |
| | Coca-Cola Co. | | 95,487 | | 5,256 | |
| | PepsiCo Inc. | | 34,852 | | 4,765 | |
| | NIKE Inc. Class B | | 30,977 | | 2,618 | |
| | Mondelez International Inc. Class A | | 35,115 | | 1,939 | |
| | Colgate-Palmolive Co. | | 20,892 | | 1,549 | |
| | Kimberly-Clark Corp. | | 8,483 | | 1,197 | |
| | Estee Lauder Cos. Inc. Class A | | 5,373 | | 1,064 | |
| | Activision Blizzard Inc. | | 19,093 | | 966 | |
7
ESG U.S. Stock ETF
| | | | | | Market | |
| | | | | | Value· | |
| | | | Shares | | ($000 | ) |
| | Ford Motor Co. | | 97,321 | | 892 | |
*,^ | | Tesla Inc. | | 3,565 | | 804 | |
| | General Mills Inc. | | 14,867 | | 800 | |
* | | Electronic Arts Inc. | | 7,333 | | 687 | |
| | Tyson Foods Inc. Class A | | 7,186 | | 669 | |
| | VF Corp. | | 7,849 | | 643 | |
| | Hershey Co. | | 3,582 | | 568 | |
* | | Monster Beverage Corp. | | 9,607 | | 564 | |
* | | Lululemon Athletica Inc. | | 2,995 | | 553 | |
| | Corteva Inc. | | 18,801 | | 551 | |
| | Aptiv plc | | 6,422 | | 534 | |
| | Clorox Co. | | 3,182 | | 503 | |
| | McCormick & Co. Inc. | | 3,036 | | 494 | |
| | Church & Dwight Co. Inc. | | 6,125 | | 489 | |
| | DR Horton Inc. | | 8,565 | | 424 | |
| | Kellogg Co. | | 6,174 | | 388 | |
* | | Take-Two Interactive Software Inc. | | 2,794 | | 369 | |
| | Lennar Corp. Class A | | 7,117 | | 363 | |
| | Conagra Brands Inc. | | 12,070 | | 342 | |
| | Kraft Heinz Co. | | 13,325 | | 340 | |
| | Genuine Parts Co. | | 3,535 | | 319 | |
| | Hasbro Inc. | | 2,887 | | 319 | |
| | Hormel Foods Corp. | | 6,812 | | 290 | |
| | JM Smucker Co. | | 2,742 | | 288 | |
| | Garmin Ltd. | | 3,516 | | 287 | |
| | Lamb Weston Holdings Inc. | | 3,740 | | 263 | |
| | Coca-Cola European Partners plc | | 4,314 | | 243 | |
* | | LKQ Corp. | | 8,624 | | 227 | |
* | | US Foods Holding Corp. | | 5,490 | | 222 | |
| | Whirlpool Corp. | | 1,538 | | 214 | |
| | PulteGroup Inc. | | 6,283 | | 212 | |
* | | Mohawk Industries Inc. | | 1,615 | | 192 | |
| | Pool Corp. | | 969 | | 190 | |
| | Bunge Ltd. | | 3,533 | | 189 | |
| | Campbell Soup Co. | | 4,140 | | 186 | |
| | Fortune Brands Home & Security Inc. | | 3,555 | | 182 | |
| | BorgWarner Inc. | | 5,560 | | 181 | |
| | Lear Corp. | | 1,611 | | 181 | |
| | Gentex Corp. | | 6,548 | | 174 | |
* | | Wayfair Inc. | | 1,515 | | 171 | |
* | | WABCO Holdings Inc. | | 1,277 | | 171 | |
| | Newell Brands Inc. | | 9,588 | | 159 | |
* | | Post Holdings Inc. | | 1,595 | | 159 | |
| | Autoliv Inc. | | 2,244 | | 154 | |
| | Ingredion Inc. | | 1,905 | | 147 | |
* | | Middleby Corp. | | 1,341 | | 147 | |
| | Harley-Davidson Inc. | | 4,454 | | 142 | |
| | Ralph Lauren Corp. Class A | | 1,551 | | 137 | |
| | Keurig Dr Pepper Inc. | | 4,979 | | 136 | |
| | Hanesbrands Inc. | | 9,886 | | 135 | |
| | Polaris Inc. | | 1,646 | | 135 | |
* | | Under Armour Inc. Class C | | 7,733 | | 131 | |
| | Leggett & Platt Inc. | | 3,500 | | 130 | |
| | Toll Brothers Inc. | | 3,593 | | 130 | |
* | | Zynga Inc. Class A | | 21,308 | | 122 | |
| | Brunswick Corp. | | 2,610 | | 122 | |
| | Carter’s Inc. | | 1,281 | | 117 | |
| | Flowers Foods Inc. | | 4,869 | | 111 | |
| | Valvoline Inc. | | 4,816 | | 109 | |
* | | Deckers Outdoor Corp. | | 735 | | 108 | |
* | | Skechers U.S.A. Inc. Class A | | 3,235 | | 102 | |
| | Tapestry Inc. | | 4,619 | | 95 | |
* | | Nomad Foods Ltd. | | 4,719 | | 95 | |
* | | Helen of Troy Ltd. | | 603 | | 93 | |
*,^ | | Mattel Inc. | | 9,134 | | 90 | |
* | | Darling Ingredients Inc. | | 4,626 | | 86 | |
| | Steven Madden Ltd. | | 2,582 | | 86 | |
| | Coty Inc. Class A | | 8,763 | | 84 | |
* | | Tempur Sealy International Inc. | | 1,068 | | 82 | |
| | PVH Corp. | | 1,064 | | 81 | |
| | Thor Industries Inc. | | 1,653 | | 76 | |
| | Lancaster Colony Corp. | | 512 | | 75 | |
| | Sanderson Farms Inc. | | 497 | | 74 | |
* | | Fox Factory Holding Corp. | | 1,015 | | 73 | |
| | Wolverine World Wide Inc. | | 2,811 | | 73 | |
* | | TreeHouse Foods Inc. | | 1,408 | | 71 | |
| | Herman Miller Inc. | | 1,654 | | 70 | |
| | Energizer Holdings Inc. | | 1,771 | | 68 | |
| | Columbia Sportswear Co. | | 707 | | 66 | |
| | J&J Snack Foods Corp. | | 340 | | 66 | |
| | Nu Skin Enterprises Inc. Class A | | 1,597 | | 65 | |
* | | Taylor Morrison Home Corp. Class A | | 2,679 | | 64 | |
* | | Visteon Corp. | | 895 | | 62 | |
| | MDC Holdings Inc. | | 1,535 | | 59 | |
| | Adient plc | | 2,653 | | 54 | |
* | | Welbilt Inc. | | 3,327 | | 52 | |
* | | TRI Pointe Group Inc. | | 3,697 | | 52 | |
| | KB Home | | 1,840 | | 52 | |
* | | Under Armour Inc. Class A | | 2,768 | | 52 | |
* | | Dorman Products Inc. | | 717 | | 51 | |
| | WD-40 Co. | | 279 | | 51 | |
* | | Meritage Homes Corp. | | 776 | | 51 | |
| | Spectrum Brands Holdings Inc. | | 901 | | 50 | |
| | Dana Inc. | | 3,720 | | 47 | |
* | | Cavco Industries Inc. | | 255 | | 47 | |
* | | Edgewell Personal Care Co. | | 1,648 | | 46 | |
| | LCI Industries | | 528 | | 45 | |
* | | Hain Celestial Group Inc. | | 2,287 | | 44 | |
| | Oxford Industries Inc. | | 620 | | 43 | |
* | | Crocs Inc. | | 1,927 | | 43 | |
8
ESG U.S. Stock ETF
| | | | | | Market | |
| | | | | | Value· | |
| | | | Shares | | ($000 | ) |
* | | LGI Homes Inc. | | 527 | | 43 | |
| | Coca-Cola Consolidated Inc. | | 126 | | 42 | |
* | | Avon Products Inc. | | 9,745 | | 42 | |
| | Knoll Inc. | | 1,833 | | 42 | |
* | | Veoneer Inc. | | 2,869 | | 42 | |
* | | Pilgrim’s Pride Corp. | | 1,291 | | 40 | |
| | Callaway Golf Co. | | 2,255 | | 40 | |
* | | Herbalife Nutrition Ltd. | | 1,138 | | 39 | |
* | | Capri Holdings Ltd. | | 1,479 | | 39 | |
* | | Kontoor Brands Inc. | | 1,114 | | 38 | |
| | HNI Corp. | | 1,215 | | 38 | |
| | Cooper Tire & Rubber Co. | | 1,483 | | 35 | |
| | Calavo Growers Inc. | | 386 | | 34 | |
| | Cal-Maine Foods Inc. | | 806 | | 33 | |
| | Medifast Inc. | | 317 | | 32 | |
* | | Meritor Inc. | | 1,854 | | 31 | |
* | | American Woodmark Corp. | | 365 | | 30 | |
* | | USANA Health Sciences Inc. | | 429 | | 29 | |
* | | Hostess Brands Inc. Class A | | 2,043 | | 29 | |
| | ACCO Brands Corp. | | 3,088 | | 29 | |
| | Fresh Del Monte Produce Inc. | | 1,030 | | 27 | |
^ | | B&G Foods Inc. | | 1,575 | | 27 | |
| | La-Z-Boy Inc. | | 823 | | 26 | |
* | | Central Garden & Pet Co. Class A | | 1,026 | | 25 | |
* | | Sleep Number Corp. | | 579 | | 24 | |
| | Steelcase Inc. Class A | | 1,555 | | 24 | |
| | Winnebago Industries Inc. | | 725 | | 23 | |
* | | Gentherm Inc. | | 631 | | 23 | |
* | | Modine Manufacturing Co. | | 2,161 | | 22 | |
| | Inter Parfums Inc. | | 340 | | 22 | |
| | Andersons Inc. | | 893 | | 20 | |
| | Acushnet Holdings Corp. | | 728 | | 19 | |
| | National Beverage Corp. | | 444 | | 18 | |
* | | Cooper-Standard Holdings Inc. | | 477 | | 18 | |
| | Tenneco Inc. Class A | | 2,026 | | 18 | |
* | | YETI Holdings Inc. | | 609 | | 17 | |
| | Tupperware Brands Corp. | | 1,304 | | 17 | |
| | Interface Inc. Class A | | 1,524 | | 17 | |
| | Goodyear Tire & Rubber Co. | | 1,334 | | 15 | |
* | | GoPro Inc. Class A | | 3,713 | | 14 | |
| | Ethan Allen Interiors Inc. | | 703 | | 12 | |
| | Tootsie Roll Industries Inc. | | 276 | | 10 | |
* | | Adecoagro SA | | 1,484 | | 8 | |
| | Delphi Technologies plc | | 445 | | 6 | |
| | | | | | 48,769 | |
Consumer Services (14.7%) | | | | | |
* | | Amazon.com Inc. | | 10,299 | | 18,294 | |
| | Home Depot Inc. | | 27,421 | | 6,250 | |
| | Walt Disney Co. | | 43,435 | | 5,962 | |
| | Comcast Corp. Class A | | 111,908 | | 4,953 | |
| | McDonald’s Corp. | | 19,037 | | 4,149 | |
| | Costco Wholesale Corp. | | 10,882 | | 3,208 | |
* | | Netflix Inc. | | 10,542 | | 3,097 | |
| | Starbucks Corp. | | 29,965 | | 2,893 | |
| | Lowe’s Cos. Inc. | | 20,006 | | 2,245 | |
* | | Booking Holdings Inc. | | 1,074 | | 2,112 | |
| | CVS Health Corp. | | 32,514 | | 1,981 | |
| | TJX Cos. Inc. | | 30,489 | | 1,676 | |
* | | Charter Communications Inc. Class A | | 3,977 | | 1,629 | |
| | Target Corp. | | 12,887 | | 1,379 | |
| | Dollar General Corp. | | 6,480 | | 1,011 | |
| | Walgreens Boots Alliance Inc. | | 19,266 | | 986 | |
| | Ross Stores Inc. | | 8,887 | | 942 | |
| | Sysco Corp. | | 11,814 | | 878 | |
| | eBay Inc. | | 20,445 | | 824 | |
* | | O’Reilly Automotive Inc. | | 1,902 | | 730 | |
| | McKesson Corp. | | 4,797 | | 663 | |
* | | AutoZone Inc. | | 601 | | 662 | |
* | | MercadoLibre Inc. | | 1,006 | | 598 | |
* | | Dollar Tree Inc. | | 5,873 | | 596 | |
* | | Chipotle Mexican Grill Inc. Class A | | 642 | | 538 | |
| | Kroger Co. | | 20,038 | | 474 | |
| | Expedia Group Inc. | | 3,445 | | 448 | |
| | Omnicom Group Inc. | | 5,434 | | 413 | |
| | Yum China Holdings Inc. | | 8,962 | | 407 | |
* | | Spotify Technology SA | | 2,951 | | 398 | |
| | Darden Restaurants Inc. | | 3,060 | | 370 | |
| | Best Buy Co. Inc. | | 5,721 | | 364 | |
| | CBS Corp. Class B | | 8,294 | | 349 | |
* | | CarMax Inc. | | 4,113 | | 343 | |
* | | Burlington Stores Inc. | | 1,656 | | 335 | |
* | | Ulta Beauty Inc. | | 1,402 | | 333 | |
* | | Liberty Global plc | | 12,427 | | 325 | |
| | AmerisourceBergen Corp. Class A | | 3,816 | | 314 | |
* | | Roku Inc. | | 2,018 | | 305 | |
| | Tractor Supply Co. | | 2,937 | | 299 | |
| | Tiffany & Co. | | 3,200 | | 272 | |
* | | Altice USA Inc. Class A | | 9,154 | | 264 | |
| | Aramark | | 6,232 | | 255 | |
| | FactSet Research Systems Inc. | | 932 | | 254 | |
| | Advance Auto Parts Inc. | | 1,734 | | 239 | |
* | | Discovery Communications Inc. | | 9,186 | | 239 | |
| | Delta Air Lines Inc. | | 4,091 | | 237 | |
| | Vail Resorts Inc. | | 994 | | 235 | |
| | Domino’s Pizza Inc. | | 1,028 | | 233 | |
* | | Trade Desk Inc. Class A | | 944 | | 232 | |
* | | Bright Horizons Family Solutions Inc. | | 1,377 | | 227 | |
| | Sirius XM Holdings Inc. | | 36,786 | | 227 | |
9
ESG U.S. Stock ETF
| | | | | | Market | |
| | | | | | Value· | |
| | | | Shares | | ($000 | ) |
* | | Live Nation Entertainment Inc. | | 3,222 | | 224 | |
| | Viacom Inc. Class B | | 8,945 | | 223 | |
| | Service Corp. International | | 4,311 | | 200 | |
| | Kohl’s Corp. | | 4,202 | | 199 | |
| | Interpublic Group of Cos. Inc. | | 9,668 | | 192 | |
* | | ServiceMaster Global Holdings Inc. | | 3,331 | | 190 | |
* | | DISH Network Corp. Class A | | 5,476 | | 184 | |
| | Nielsen Holdings plc | | 8,769 | | 182 | |
* | | Five Below Inc. | | 1,457 | | 179 | |
| | Southwest Airlines Co. | | 3,309 | | 173 | |
* | | Liberty Media Corp-Liberty Formula One | | 4,098 | | 171 | |
* | | IAA Inc. | | 3,432 | | 168 | |
| | Dunkin’ Brands Group Inc. | | 1,993 | | 164 | |
| | Sabre Corp. | | 6,799 | | 161 | |
* | | Liberty Media Corp-Liberty SiriusXM Class C | | 3,809 | | 155 | |
* | | Etsy Inc. | | 2,921 | | 154 | |
| | Cable One Inc. | | 118 | | 153 | |
* | | Uber Technologies Inc. | | 4,665 | | 152 | |
* | | Planet Fitness Inc. Class A | | 2,137 | | 151 | |
* | | GrubHub Inc. | | 2,504 | | 149 | |
| | Casey’s General Stores Inc. | | 884 | | 148 | |
* | | Grand Canyon Education Inc. | | 1,173 | | 147 | |
* | | Liberty Global plc Class A | | 5,506 | | 147 | |
* | | United Airlines Holdings Inc. | | 1,640 | | 138 | |
| | Williams-Sonoma Inc. | | 2,006 | | 132 | |
| | H&R Block Inc. | | 5,276 | | 128 | |
* | | Performance Food Group Co. | | 2,713 | | 127 | |
| | Rollins Inc. | | 3,637 | | 119 | |
| | Six Flags Entertainment Corp. | | 2,016 | | 119 | |
| | Foot Locker Inc. | | 3,193 | | 116 | |
* | | Chegg Inc. | | 2,915 | | 116 | |
* | | Madison Square Garden Co. Class A | | 453 | | 114 | |
| | Aaron’s Inc. | | 1,745 | | 112 | |
| | Nexstar Media Group Inc. Class A | | 1,115 | | 110 | |
* | | frontdoor Inc. | | 2,142 | | 110 | |
| | Wendy’s Co. | | 4,872 | | 107 | |
| | Cinemark Holdings Inc. | | 2,788 | | 106 | |
| | New York Times Co. Class A | | 3,596 | | 105 | |
| | L Brands Inc. | | 6,342 | | 105 | |
| | Dolby Laboratories Inc. Class A | | 1,684 | | 104 | |
* | | TripAdvisor Inc. | | 2,647 | | 101 | |
* | | Discovery Communications Inc. Class A | | 3,526 | | 97 | |
| | Tribune Media Co. Class A | | 2,053 | | 96 | |
| | Nordstrom Inc. | | 3,293 | | 95 | |
| | Texas Roadhouse Inc. Class A | | 1,799 | | 93 | |
* | | Liberty Media Corp-Liberty SiriusXM Class A | | 2,257 | | 91 | |
| | Cracker Barrel Old Country Store Inc. | | 534 | | 88 | |
| | KAR Auction Services Inc. | | 3,259 | | 87 | |
| | Strategic Education Inc. | | 510 | | 86 | |
* | | Floor & Decor Holdings Inc. Class A | | 1,690 | | 83 | |
* | | Ollie’s Bargain Outlet Holdings Inc. | | 1,463 | | 81 | |
| | Morningstar Inc. | | 499 | | 81 | |
| | World Wrestling Entertainment Inc. Class A | | 1,128 | | 81 | |
* | | Hilton Grand Vacations Inc. | | 2,338 | | 79 | |
| | American Airlines Group Inc. | | 2,962 | | 78 | |
| | Wingstop Inc. | | 772 | | 77 | |
| | Lithia Motors Inc. Class A | | 577 | | 76 | |
| | American Eagle Outfitters Inc. | | 4,357 | | 73 | |
| | TEGNA Inc. | | 5,078 | | 73 | |
| | Extended Stay America Inc. | | 5,160 | | 72 | |
* | | BJ’s Wholesale Club Holdings Inc. | | 2,745 | | 72 | |
* | | LiveRamp Holdings Inc. | | 1,648 | | 70 | |
* | | AutoNation Inc. | | 1,454 | | 69 | |
| | Macy’s Inc. | | 4,624 | | 68 | |
* | | RH | | 473 | | 68 | |
* | | Shake Shack Inc. Class A | | 666 | | 66 | |
* | | National Vision Holdings Inc. | | 2,319 | | 66 | |
| | Graham Holdings Co. Class B | | 93 | | 65 | |
| | Sinclair Broadcast Group Inc. Class A | | 1,460 | | 65 | |
* | | Cargurus Inc. | | 1,921 | | 63 | |
* | | Yelp Inc. Class A | | 1,846 | | 62 | |
| | Monro Inc. | | 781 | | 61 | |
* | | Adtalem Global Education Inc. | | 1,413 | | 60 | |
| | Dick’s Sporting Goods Inc. | | 1,755 | | 60 | |
* | | Liberty Media Corp-Liberty Formula One Class A | | 1,499 | | 59 | |
| | Jack in the Box Inc. | | 635 | | 54 | |
| | Dine Brands Global Inc. | | 744 | | 52 | |
* | | Liberty Latin America Ltd. | | 3,150 | | 52 | |
* | | AMC Networks Inc. Class A | | 1,062 | | 52 | |
* | | Sprouts Farmers Market Inc. | | 2,769 | | 50 | |
* | | Shutterfly Inc. | | 931 | | 47 | |
| | John Wiley & Sons Inc. Class A | | 1,047 | | 47 | |
| | Dave & Buster’s Entertainment Inc. | | 1,073 | | 46 | |
* | | Rent-A-Center Inc. | | 1,805 | | 46 | |
| | Alaska Air Group Inc. | | 718 | | 43 | |
| | Bloomin’ Brands Inc. | | 2,353 | | 42 | |
10
ESG U.S. Stock ETF
| | | | | | Market | |
| | | | | | Value· | |
| | | | Shares | | ($000 | ) |
* | | Simply Good Foods Co. | | 1,411 | | 42 | |
* | | Hertz Global Holdings Inc. | | 3,307 | | 40 | |
* | | Laureate Education Inc. Class A | | 2,136 | | 39 | |
| | Meredith Corp. | | 864 | | 38 | |
* | | Sotheby’s | | 651 | | 38 | |
| | Children’s Place Inc. | | 428 | | 37 | |
| | Lions Gate Entertainment Corp. Class A | | 4,091 | | 37 | |
| | Viad Corp. | | 565 | | 37 | |
| | Cheesecake Factory Inc. | | 953 | | 36 | |
| | Gap Inc. | | 2,258 | | 36 | |
| | BJ’s Restaurants Inc. | | 976 | | 36 | |
| | Core-Mark Holding Co. Inc. | | 1,092 | | 35 | |
| | Penske Automotive Group Inc. | | 809 | | 35 | |
* | | Sally Beauty Holdings Inc. | | 2,821 | | 35 | |
* | | Avis Budget Group Inc. | | 1,376 | | 34 | |
| | Brinker International Inc. | | 889 | | 34 | |
* | | Asbury Automotive Group Inc. | | 356 | | 34 | |
* | | Weight Watchers International Inc. | | 1,113 | | 33 | |
| | Caleres Inc. | | 1,616 | | 33 | |
| | Gannett Co. Inc. | | 3,083 | | 32 | |
* | | Stamps.com Inc. | | 480 | | 31 | |
* | | SeaWorld Entertainment Inc. | | 1,051 | | 30 | |
| | Papa John’s International Inc. | | 602 | | 30 | |
* | | Groupon Inc. Class A | | 11,560 | | 29 | |
| | Scholastic Corp. | | 796 | | 28 | |
* | | JetBlue Airways Corp. | | 1,553 | | 27 | |
| | Guess? Inc. | | 1,480 | | 27 | |
| | Group 1 Automotive Inc. | | 355 | | 27 | |
| | PriceSmart Inc. | | 437 | | 26 | |
* | | Herc Holdings Inc. | | 602 | | 25 | |
* | | Genesco Inc. | | 692 | | 25 | |
| | GameStop Corp. Class A | | 5,779 | | 23 | |
* | | Upwork Inc. | | 1,545 | | 22 | |
* | | MakeMyTrip Ltd. | | 970 | | 22 | |
| | Matthews International Corp. Class A | | 737 | | 22 | |
| | Dillard’s Inc. Class A | | 367 | | 21 | |
* | | IMAX Corp. | | 1,020 | | 21 | |
| | Copa Holdings SA Class A | | 198 | | 20 | |
| | EW Scripps Co. Class A | | 1,544 | | 19 | |
* | | MSG Networks Inc. | | 1,118 | | 18 | |
* | | At Home Group Inc. | | 2,658 | | 18 | |
* | | Liberty Latin America Ltd. Class A | | 1,067 | | 18 | |
* | | United Natural Foods Inc. | | 2,163 | | 17 | |
* | | Houghton Mifflin Harcourt Co. | | 2,847 | | 17 | |
| | Tailored Brands Inc. | | 3,085 | | 17 | |
* | | Spirit Airlines Inc. | | 444 | | 17 | |
^ | | Rite Aid Corp. | | 2,492 | | 16 | |
| | Chico’s FAS Inc. | | 5,012 | | 16 | |
* | | Diplomat Pharmacy Inc. | | 2,518 | | 15 | |
| | International Speedway Corp. Class A | | 322 | | 14 | |
| | Allegiant Travel Co. Class A | | 101 | | 14 | |
| | Buckle Inc. | | 591 | | 12 | |
| | New Media Investment Group Inc. | | 1,233 | | 11 | |
* | | Regis Corp. | | 623 | | 10 | |
| | Hawaiian Holdings Inc. | | 375 | | 9 | |
| | Weis Markets Inc. | | 226 | | 9 | |
| | National CineMedia Inc. | | 644 | | 5 | |
| | Hillenbrand Inc. | | 98 | | 3 | |
| | Speedway Motorsports Inc. | | 136 | | 3 | |
| | SpartanNash Co. | | 72 | | 1 | |
| | Shares | | | | | |
| | Abercrombie & Fitch Co. | | 18 | | — | |
| | | | | | 87,230 | |
Financials (20.0%) | | | | | |
| | JPMorgan Chase & Co. | | 80,234 | | 8,814 | |
| | Visa Inc. Class A | | 43,241 | | 7,819 | |
| | Mastercard Inc. Class A | | 22,307 | | 6,277 | |
| | Bank of America Corp. | | 214,080 | | 5,889 | |
| | Citigroup Inc. | | 57,521 | | 3,701 | |
| | American Tower Corp. | | 10,881 | | 2,505 | |
| | American Express Co. | | 16,902 | | 2,034 | |
| | CME Group Inc. | | 8,797 | | 1,911 | |
| | US Bancorp | | 35,759 | | 1,884 | |
| | Chubb Ltd. | | 11,309 | | 1,767 | |
| | Goldman Sachs Group Inc. | | 8,264 | | 1,685 | |
| | S&P Global Inc. | | 6,110 | | 1,590 | |
| | Crown Castle International Corp. | | 10,239 | | 1,486 | |
| | PNC Financial Services Group Inc. | | 11,171 | | 1,440 | |
| | Prologis Inc. | | 15,457 | | 1,292 | |
| | Intercontinental Exchange Inc. | | 13,763 | | 1,287 | |
| | Morgan Stanley | | 30,589 | | 1,269 | |
| | Marsh & McLennan Cos. Inc. | | 12,536 | | 1,252 | |
| | BlackRock Inc. | | 2,935 | | 1,240 | |
| | Equinix Inc. | | 2,095 | | 1,165 | |
| | Aon plc | | 5,878 | | 1,145 | |
| | Charles Schwab Corp. | | 29,829 | | 1,142 | |
| | Simon Property Group Inc. | | 7,614 | | 1,134 | |
| | American International Group Inc. | | 21,690 | | 1,129 | |
| | Progressive Corp. | | 14,451 | | 1,095 | |
| | Capital One Financial Corp. | | 11,629 | | 1,007 | |
| | Public Storage | | 3,649 | | 966 | |
11
ESG U.S. Stock ETF
| | | | | | Market | |
| | | | | | Value· | |
| | | | Shares | | ($000 | ) |
| | Travelers Cos. Inc. | | 6,454 | | 948 | |
| | Aflac Inc. | | 18,130 | | 910 | |
| | BB&T Corp. | | 18,968 | | 904 | |
| | Bank of New York Mellon Corp. | | 21,298 | | 896 | |
| | MetLife Inc. | | 20,043 | | 888 | |
| | Welltower Inc. | | 9,898 | | 886 | |
| | Moody’s Corp. | | 4,111 | | 886 | |
| | Allstate Corp. | | 8,260 | | 846 | |
| | Prudential Financial Inc. | | 10,104 | | 809 | |
| | Equity Residential | | 8,760 | | 742 | |
| | SBA Communications Corp. Class A | | 2,759 | | 724 | |
| | AvalonBay Communities Inc. | | 3,372 | | 717 | |
| | SunTrust Banks Inc. | | 10,997 | | 676 | |
| | Ventas Inc. | | 8,796 | | 646 | |
| | Discover Financial Services | | 7,998 | | 640 | |
* | | IHS Markit Ltd. | | 9,717 | | 638 | |
| | Digital Realty Trust Inc. | | 5,152 | | 637 | |
| | T. Rowe Price Group Inc. | | 5,731 | | 634 | |
| | Realty Income Corp. | | 7,628 | | 563 | |
| | Synchrony Financial | | 17,038 | | 546 | |
| | Hartford Financial Services Group Inc. | | 8,910 | | 519 | |
| | State Street Corp. | | 9,660 | | 496 | |
| | M&T Bank Corp. | | 3,336 | | 488 | |
| | Boston Properties Inc. | | 3,788 | | 486 | |
| | Fifth Third Bancorp | | 18,110 | | 479 | |
| | MSCI Inc. Class A | | 2,023 | | 475 | |
| | Northern Trust Corp. | | 4,978 | | 438 | |
* | | CBRE Group Inc. Class A | | 8,315 | | 435 | |
| | Ameriprise Financial Inc. | | 3,300 | | 426 | |
| | KeyCorp | | 24,891 | | 413 | |
| | Alexandria Real Estate Equities Inc. | | 2,731 | | 409 | |
| | Arthur J Gallagher & Co. | | 4,462 | | 405 | |
| | Cincinnati Financial Corp. | | 3,585 | | 403 | |
| | HCP Inc. | | 11,536 | | 400 | |
* | | Markel Corp. | | 346 | | 395 | |
| | Citizens Financial Group Inc. | | 11,424 | | 385 | |
| | Regions Financial Corp. | | 25,312 | | 370 | |
* | | Arch Capital Group Ltd. | | 9,362 | | 370 | |
| | First Republic Bank | | 4,113 | | 369 | |
| | Principal Financial Group Inc. | | 6,916 | | 368 | |
| | MarketAxess Holdings Inc. | | 915 | | 364 | |
| | WP Carey Inc. | | 3,961 | | 356 | |
| | Mid-America Apartment Communities Inc. | | 2,709 | | 343 | |
| | Credicorp Ltd. | | 1,621 | | 336 | |
| | Huntington Bancshares Inc. | | 25,326 | | 336 | |
| | UDR Inc. | | 6,603 | | 318 | |
| | Ally Financial Inc. | | 9,992 | | 313 | |
| | Annaly Capital Management Inc. | | 37,687 | | 313 | |
| | TD Ameritrade Holding Corp. | | 6,824 | | 303 | |
| | Host Hotels & Resorts Inc. | | 18,396 | | 295 | |
| | Fidelity National Financial Inc. | | 6,652 | | 292 | |
| | Sun Communities Inc. | | 1,970 | | 291 | |
| | Duke Realty Corp. | | 8,703 | | 290 | |
| | Invitation Homes Inc. | | 9,980 | | 287 | |
| | Nasdaq Inc. | | 2,805 | | 280 | |
| | Equity LifeStyle Properties Inc. | | 1,985 | | 267 | |
* | | Alleghany Corp. | | 354 | | 265 | |
| | Lincoln National Corp. | | 5,014 | | 265 | |
| | E*TRADE Financial Corp. | | 6,192 | | 258 | |
| | Regency Centers Corp. | | 3,996 | | 258 | |
| | Vornado Realty Trust | | 4,231 | | 256 | |
* | | SVB Financial Group | | 1,310 | | 255 | |
| | Raymond James Financial Inc. | | 3,147 | | 247 | |
| | Camden Property Trust | | 2,243 | | 243 | |
| | Western Union Co. | | 10,963 | | 242 | |
* | | Globe Life Inc. | | 2,694 | | 240 | |
| | Comerica Inc. | | 3,899 | | 240 | |
| | Everest Re Group Ltd. | | 1,019 | | 240 | |
| | WR Berkley Corp. | | 3,372 | | 240 | |
| | Reinsurance Group of America Inc. Class A | | 1,543 | | 238 | |
| | VEREIT Inc. | | 24,007 | | 234 | |
| | Iron Mountain Inc. | | 7,138 | | 227 | |
| | National Retail Properties Inc. | | 3,869 | | 217 | |
| | Brown & Brown Inc. | | 5,847 | | 216 | |
| | Omega Healthcare Investors Inc. | | 5,161 | | 210 | |
| | CyrusOne Inc. | | 2,825 | | 208 | |
| | AGNC Investment Corp. | | 13,749 | | 204 | |
| | Medical Properties Trust Inc. | | 10,491 | | 195 | |
| | RenaissanceRe Holdings Ltd. | | 1,073 | | 194 | |
| | Liberty Property Trust | | 3,679 | | 192 | |
| | Kilroy Realty Corp. | | 2,424 | | 189 | |
| | SEI Investments Co. | | 3,280 | | 189 | |
| | Assurant Inc. | | 1,531 | | 188 | |
| | Americold Realty Trust | | 5,141 | | 187 | |
| | SL Green Realty Corp. | | 2,317 | | 186 | |
| | Jones Lang LaSalle Inc. | | 1,360 | | 182 | |
| | Zions Bancorp NA | | 4,435 | | 182 | |
| | Kimco Realty Corp. | | 9,884 | | 182 | |
| | STORE Capital Corp. | | 4,810 | | 182 | |
| | Franklin Resources Inc. | | 6,902 | | 181 | |
| | American Financial Group Inc. | | 1,795 | | 181 | |
| | Voya Financial Inc. | | 3,647 | | 180 | |
12
ESG U.S. Stock ETF
| | | | | | Market | |
| | | | | | Value· | |
| | | | Shares | | ($000 | ) |
| | Douglas Emmett Inc. | | 3,967 | | 167 | |
| | CubeSmart | | 4,588 | | 165 | |
| | Invesco Ltd. | | 10,385 | | 163 | |
| | Old Republic International Corp. | | 6,903 | | 161 | |
* | | Athene Holding Ltd. Class A | | 4,111 | | 160 | |
| | Lamar Advertising Co. Class A | | 2,068 | | 158 | |
| | First American Financial Corp. | | 2,711 | | 158 | |
| | American Homes 4 Rent Class A | | 6,082 | | 156 | |
| | Starwood Property Trust Inc. | | 6,588 | | 154 | |
| | East West Bancorp Inc. | | 3,719 | | 153 | |
| | Signature Bank | | 1,308 | | 153 | |
| | LPL Financial Holdings Inc. | | 2,034 | | 152 | |
* | | GCI Liberty Inc. Class A | | 2,444 | | 152 | |
| | Healthcare Trust of America Inc. Class A | | 5,190 | | 147 | |
| | TCF Financial Corp. | | 3,809 | | 147 | |
| | AXA Equitable Holdings Inc. | | 7,024 | | 146 | |
| | Rexford Industrial Realty Inc. | | 3,301 | | 146 | |
| | EPR Properties | | 1,849 | | 145 | |
| | People’s United Financial Inc. | | 9,914 | | 142 | |
| | Commerce Bancshares Inc. | | 2,495 | | 142 | |
| | EastGroup Properties Inc. | | 1,126 | | 140 | |
| | Synovus Financial Corp. | | 3,894 | | 138 | |
| | Unum Group | | 5,423 | | 138 | |
| | New York Community Bancorp Inc. | | 11,868 | | 137 | |
| | Brixmor Property Group Inc. | | 7,379 | | 136 | |
| | Park Hotels & Resorts Inc. | | 5,682 | | 134 | |
| | Hanover Insurance Group Inc. | | 972 | | 129 | |
| | Primerica Inc. | | 1,076 | | 128 | |
| | Hudson Pacific Properties Inc. | | 3,744 | | 127 | |
| | First Industrial Realty Trust Inc. | | 3,260 | | 127 | |
* | | Howard Hughes Corp. | | 1,005 | | 127 | |
| | Life Storage Inc. | | 1,196 | | 127 | |
| | Axis Capital Holdings Ltd. | | 2,034 | | 125 | |
| | First Horizon National Corp. | | 7,880 | | 125 | |
| | Cousins Properties Inc. | | 3,592 | | 125 | |
| | JBG SMITH Properties | | 3,228 | | 123 | |
| | Cullen/Frost Bankers Inc. | | 1,485 | | 123 | |
| | Popular Inc. | | 2,341 | | 123 | |
| | Eaton Vance Corp. | | 2,843 | | 123 | |
| | Jefferies Financial Group Inc. | | 6,550 | | 122 | |
| | STAG Industrial Inc. | | 4,124 | | 120 | |
| | Affiliated Managers Group Inc. | | 1,550 | | 119 | |
* | | Brighthouse Financial Inc. | | 3,353 | | 118 | |
| | Highwoods Properties Inc. | | 2,677 | | 116 | |
| | Radian Group Inc. | | 5,052 | | 114 | |
| | MGIC Investment Corp. | | 8,866 | | 112 | |
| | CoreSite Realty Corp. | | 962 | | 112 | |
| | Prosperity Bancshares Inc. | | 1,709 | | 111 | |
| | Healthcare Realty Trust Inc. | | 3,304 | | 110 | |
* | | Essent Group Ltd. | | 2,262 | | 110 | |
| | Western Alliance Bancorp | | 2,485 | | 108 | |
| | Selective Insurance Group Inc. | | 1,343 | | 107 | |
| | FirstCash Inc. | | 1,082 | | 107 | |
| | First Citizens BancShares Inc. Class A | | 240 | | 107 | |
| | Kemper Corp. | | 1,509 | | 106 | |
| | Webster Financial Corp. | | 2,332 | | 104 | |
| | Assured Guaranty Ltd. | | 2,447 | | 104 | |
| | Equity Commonwealth | | 3,092 | | 104 | |
| | CIT Group Inc. | | 2,439 | | 104 | |
| | Agree Realty Corp. | | 1,362 | | 102 | |
| | Blackstone Mortgage Trust Inc. Class A | | 2,915 | | 101 | |
| | Spirit Realty Capital Inc. | | 2,106 | | 101 | |
| | Lazard Ltd. Class A | | 2,905 | | 100 | |
| | IBERIABANK Corp. | | 1,416 | | 98 | |
| | Physicians Realty Trust | | 5,636 | | 98 | |
| | PS Business Parks Inc. | | 540 | | 97 | |
| | Janus Henderson Group plc | | 5,066 | | 97 | |
| | Terreno Realty Corp. | | 1,903 | | 96 | |
| | International Bancshares Corp. | | 2,697 | | 96 | |
| | Outfront Media Inc. | | 3,479 | | 96 | |
| | Bank of Hawaii Corp. | | 1,155 | | 95 | |
| | RLI Corp. | | 1,042 | | 95 | |
| | United Bankshares Inc. | | 2,570 | | 95 | |
| | Pebblebrook Hotel Trust | | 3,511 | | 95 | |
| | Ryman Hospitality Properties Inc. | | 1,186 | | 94 | |
| | First Financial Bankshares Inc. | | 3,085 | | 94 | |
| | Umpqua Holdings Corp. | | 5,954 | | 94 | |
| | First Hawaiian Inc. | | 3,585 | | 92 | |
| | Wintrust Financial Corp. | | 1,457 | | 92 | |
| | Sabra Health Care REIT Inc. | | 4,221 | | 91 | |
| | Valley National Bancorp | | 8,673 | | 91 | |
| | Rayonier Inc. | | 3,391 | | 91 | |
| | Chimera Investment Corp. | | 4,731 | | 90 | |
| | Glacier Bancorp Inc. | | 2,267 | | 90 | |
| | National Health Investors Inc. | | . 1,081 | | 90 | |
| | BankUnited Inc. | | 2,786 | | 88 | |
| | FNB Corp. | | 8,175 | | 88 | |
| | Stifel Financial Corp. | | 1,627 | | 87 | |
| | Interactive Brokers Group Inc. | | 1,840 | | 87 | |
13
ESG U.S. Stock ETF
| | | | | | Market | |
| | | | | | Value· | |
| | | | Shares | | ($000 | ) |
| | Community Bank System Inc. | | 1,403 | | 86 | |
| | SLM Corp. | | 10,110 | | 85 | |
| | MFA Financial Inc. | | 11,859 | | 85 | |
| | Fulton Financial Corp. | | 5,265 | | 84 | |
| | Corporate Office Properties Trust | | 2,886 | | 83 | |
| | Evercore Inc. Class A | | 1,034 | | 82 | |
| | Weingarten Realty Investors | | 3,088 | | 82 | |
| | Federated Investors Inc. Class B | | 2,526 | | 81 | |
| | South State Corp. | | 1,097 | | 81 | |
| | Ameris Bancorp | | 2,261 | | 80 | |
| | Navient Corp. | | 6,221 | | 79 | |
| | CareTrust REIT Inc. | | 3,329 | | 79 | |
| | Bank OZK | | 3,012 | | 78 | |
| | Associated Banc-Corp | | 4,035 | | 78 | |
| | Piedmont Office Realty Trust Inc. Class A | | 3,901 | | 77 | |
| | Old National Bancorp | | 4,576 | | 77 | |
| | BancorpSouth Bank | | 2,780 | | 77 | |
| | CVB Financial Corp. | | 3,713 | | 76 | |
| | Hancock Whitney Corp. | | 2,171 | | 76 | |
| | Atlantic Union Bankshares Corp. | | 2,090 | | 75 | |
| | Legg Mason Inc. | | 2,042 | | 75 | |
| | Four Corners Property Trust Inc. | | 2,616 | | 75 | |
| | BOK Financial Corp. | | 975 | | 74 | |
| | Sunstone Hotel Investors Inc. | | 5,637 | | 74 | |
| | Columbia Banking System Inc. | | 2,133 | | 74 | |
| | PotlatchDeltic Corp. | | 1,890 | | 73 | |
| | Washington Federal Inc. | | 2,035 | | 72 | |
| | Home BancShares Inc. | | 4,088 | | 72 | |
| | UMB Financial Corp. | | 1,147 | | 71 | |
| | Paramount Group Inc. | | 5,419 | | 71 | |
| | RLJ Lodging Trust | | 4,403 | | 71 | |
| | OneMain Holdings Inc. | | 1,976 | | 71 | |
| | CenterState Bank Corp. | | 3,103 | | 70 | |
| | Brandywine Realty Trust | | 4,889 | | 70 | |
| | White Mountains Insurance Group Ltd. | | 66 | | 70 | |
* | | Texas Capital Bancshares Inc. | | 1,299 | | 70 | |
| | First Midwest Bancorp Inc. | | 3,634 | | 70 | |
| | QTS Realty Trust Inc. Class A | | 1,418 | | 70 | |
| | Apollo Commercial Real Estate Finance Inc. | | 3,738 | | 69 | |
| | Columbia Property Trust Inc. | | 3,238 | | 69 | |
| | Taubman Centers Inc. | | 1,766 | | 69 | |
| | Retail Properties of America Inc. | | 6,039 | | 69 | |
| | Investors Bancorp Inc. | | 6,089 | | 68 | |
| | Cathay General Bancorp | | 1,982 | | 66 | |
| | First Financial Bancorp | | 2,794 | | 65 | |
| | Employers Holdings Inc. | | 1,483 | | 64 | |
| | National Storage Affiliates Trust | | 1,826 | | 61 | |
| | CNO Financial Group Inc. | | 4,191 | | 61 | |
| | American Assets Trust Inc. | | 1,293 | | 61 | |
| | Washington REIT | | 2,258 | | 60 | |
| | Santander Consumer USA Holdings Inc. | | 2,247 | | 59 | |
| | Xenia Hotels & Resorts Inc. | | 2,865 | | 58 | |
| | DiamondRock Hospitality Co. | | 6,046 | | 57 | |
| | Independent Bank Corp. | | 844 | | 57 | |
| | Acadia Realty Trust | | 2,076 | | 57 | |
| | American Equity Investment Life Holding Co. | | 2,524 | | 54 | |
| | Colony Capital Inc. | | 12,044 | | 54 | |
* | | Enstar Group Ltd. | | 303 | | 54 | |
* | | LendingTree Inc. | | 173 | | 54 | |
| | ARMOUR Residential REIT Inc. | | 3,251 | | 53 | |
| | Brookfield Property REIT Inc. Class A | | 2,807 | | 53 | |
| | Invesco Mortgage Capital Inc. | | 3,510 | | 53 | |
* | | Zillow Group Inc. Class A | | 1,498 | | 51 | |
| | Virtus Investment Partners Inc. | | 475 | | 51 | |
* | | Genworth Financial Inc. Class A | | 11,423 | | 51 | |
| | Nelnet Inc. Class A | | 736 | | 49 | |
| | Tanger Factory Outlet Centers Inc. | | 3,474 | | 49 | |
| | Getty Realty Corp. | | 1,538 | | 49 | |
| | Investors Real Estate Trust | | 705 | | 49 | |
| | Argo Group International Holdings Ltd. | | 740 | | 49 | |
| | Towne Bank | | 1,821 | | 48 | |
| | Simmons First National Corp. Class A | | 1,980 | | 48 | |
| | Bank of NT Butterfield & Son Ltd. | | 1,714 | | 47 | |
| | Lexington Realty Trust | | 4,540 | | 47 | |
| | WSFS Financial Corp. | | 1,134 | | 47 | |
| | Horace Mann Educators Corp. | | 1,062 | | 47 | |
| | Hilltop Holdings Inc. | | 1,956 | | 46 | |
| | First Merchants Corp. | | 1,287 | | 46 | |
* | | PRA Group Inc. | | 1,306 | | 45 | |
| | ProAssurance Corp. | | 1,118 | | 44 | |
| | WesBanco Inc. | | 1,274 | | 44 | |
| | Macerich Co. | | 1,528 | | 44 | |
14
ESG U.S. Stock ETF
| | | | | | Market | |
| | | | | | Value· | |
| | | | Shares | | ($000 | ) |
| | Walker & Dunlop Inc. | | 777 | | 43 | |
| | Moelis & Co. Class A | | 1,254 | | 42 | |
| | First BanCorp | | 4,387 | | 42 | |
| | National General Holdings Corp. | | 1,771 | | 42 | |
| | SITE Centers Corp. | | 3,005 | | 42 | |
| | Pacific Premier Bancorp Inc. | | 1,364 | | 40 | |
| | Mack-Cali Realty Corp. | | 1,971 | | 40 | |
| | Urban Edge Properties | | 2,271 | | 40 | |
* | | Cannae Holdings Inc. | | 1,423 | | 40 | |
| | Universal Health Realty Income Trust | | 408 | | 39 | |
| | BGC Partners Inc. Class A | | 7,614 | | 39 | |
| | Banner Corp. | | 719 | | 39 | |
* | | Axos Financial Inc. | | 1,486 | | 38 | |
| | Great Western Bancorp Inc. | | 1,279 | | 38 | |
| | Alexander & Baldwin Inc. | | 1,604 | | 37 | |
| | Renasant Corp. | | 1,115 | | 37 | |
| | Trustmark Corp. | | 1,118 | | 37 | |
| | United Community Banks Inc. | | 1,371 | | 36 | |
| | Safety Insurance Group Inc. | | 361 | | 35 | |
| | Global Net Lease Inc. | | 1,805 | | 35 | |
| | Retail Opportunity Investments Corp. | | 1,970 | | 34 | |
| | Ladder Capital Corp. Class A | | 2,054 | | 34 | |
* | | Redfin Corp. | | 2,014 | | 34 | |
| | State Auto Financial Corp. | | 1,048 | | 33 | |
| | Independent Bank Group Inc. | | 684 | | 33 | |
| | LegacyTexas Financial Group Inc. | | 827 | | 33 | |
| | Office Properties Income Trust | | 1,224 | | 33 | |
| | LTC Properties Inc. | | 678 | | 33 | |
| | First Commonwealth Financial Corp. | | 2,659 | | 33 | |
| | Hope Bancorp Inc. | | 2,381 | | 32 | |
| | Provident Financial Services Inc. | | 1,324 | | 32 | |
| | Capitol Federal Financial Inc. | | 2,298 | | 31 | |
| | Westamerica Bancorporation | | 502 | | 31 | |
| | FGL Holdings | | 3,871 | | 31 | |
| | Chesapeake Lodging Trust | | 1,190 | | 31 | |
| | Summit Hotel Properties Inc. | | 2,723 | | 30 | |
| | Northwest Bancshares Inc. | | 1,901 | | 30 | |
| | Eagle Bancorp Inc. | | 727 | | 30 | |
| | CNA Financial Corp. | | 628 | | 30 | |
| | RPT Realty | | 2,417 | | 29 | |
| | Kearny Financial Corp. | | 2,268 | | 29 | |
| | ServisFirst Bancshares Inc. | | 915 | | 28 | |
| | Flagstar Bancorp Inc. | | 763 | | 28 | |
* | | Encore Capital Group Inc. | | 751 | | 28 | |
| | RMR Group Inc. Class A | | 594 | | 28 | |
| | PennyMac Mortgage Investment Trust | | 1,265 | | 28 | |
| | Mercury General Corp. | | 510 | | 27 | |
| | Heartland Financial USA Inc. | | 622 | | 27 | |
| | City Holding Co. | | 360 | | 27 | |
| | Berkshire Hills Bancorp Inc. | | 912 | | 27 | |
| | United Fire Group Inc. | | 588 | | 27 | |
| | iStar Inc. | | 2,064 | | 26 | |
| | Urstadt Biddle Properties Inc. Class A | | 1,257 | | 26 | |
* | | Marcus & Millichap Inc. | | 717 | | 26 | |
| | Clearway Energy Inc. | | 1,456 | | 26 | |
* | | MBIA Inc. | | 2,761 | | 25 | |
| | Waddell & Reed Financial Inc. Class A | | 1,498 | | 24 | |
| | Artisan Partners Asset Management Inc. Class A | | 903 | | 24 | |
| | Cohen & Steers Inc. | | 443 | | 24 | |
| | Redwood Trust Inc. | | 1,426 | | 24 | |
* | | Third Point Reinsurance Ltd. | | 2,408 | | 23 | |
| | Washington Prime Group Inc. | | 6,905 | | 22 | |
* | | LendingClub Corp. | | 1,674 | | 22 | |
| | BancFirst Corp. | | 403 | | 22 | |
| | Sandy Spring Bancorp Inc. | | 629 | | 21 | |
| | Clearway Energy Inc. Class A | | 1,256 | | 21 | |
| | TFS Financial Corp. | | 1,180 | | 21 | |
| | Front Yard Residential Corp. | | 1,844 | | 20 | |
| | NBT Bancorp Inc. | | 551 | | 19 | |
| | Saul Centers Inc. | | 376 | | 19 | |
| | WisdomTree Investments Inc. | | 3,897 | | 19 | |
| | Washington Trust Bancorp Inc. | | 389 | | 18 | |
| | Realogy Holdings Corp. | | 3,654 | | 17 | |
| | Kite Realty Group Trust | | 1,113 | | 16 | |
* | | St. Joe Co. | | 838 | | 15 | |
| | Alexander’s Inc. | | 39 | | 15 | |
| | Piper Jaffray Cos. | | 200 | | 15 | |
| | Greenhill & Co. Inc. | | 1,009 | | 14 | |
| | S&T Bancorp Inc. | | 408 | | 14 | |
| | Hersha Hospitality Trust Class A | | 958 | | 13 | |
| | Brookline Bancorp Inc. | | 909 | | 13 | |
| | Flushing Financial Corp. | | 660 | | 13 | |
| | First Financial Corp. | | 301 | | 12 | |
| | Franklin Street Properties Corp. | | 1,544 | | 12 | |
| | Boston Private Financial Holdings Inc. | | 1,032 | | 11 | |
| | Stock Yards Bancorp Inc. | | 301 | | 11 | |
| | NorthStar Realty Europe Corp. | | 638 | | 11 | |
15
ESG U.S. Stock ETF
| | | | | | Market | |
| | | | | | Value· | |
| | | | Shares | | ($000 | ) |
* | | Columbia Financial Inc. | | 696 | | 11 | |
| | Oritani Financial Corp. | | 590 | | 10 | |
| | Dime Community Bancshares Inc. | | 507 | | 10 | |
| | TrustCo Bank Corp. NY | | 1,284 | | 10 | |
| | Capstead Mortgage Corp. | | 1,350 | | 10 | |
| | 1st Source Corp. | | 200 | | 9 | |
| | FBL Financial Group Inc. Class A | | 155 | | 8 | |
| | Community Trust Bancorp Inc. | | 215 | | 8 | |
| | Republic Bancorp Inc. Class A | | 49 | | 2 | |
| | | | | | 118,689 | |
Health Care (13.4%) | | | | | |
| | Merck & Co. Inc. | | 64,266 | | 5,557 | |
| | UnitedHealth Group Inc. | | 23,514 | | 5,502 | |
| | Pfizer Inc. | | 138,709 | | 4,931 | |
| | Abbott Laboratories | | 42,734 | | 3,646 | |
| | Medtronic plc | | 33,332 | | 3,596 | |
| | Amgen Inc. | | 15,163 | | 3,163 | |
| | Thermo Fisher Scientific Inc. | | 9,930 | | 2,850 | |
| | AbbVie Inc. | | 36,985 | | 2,431 | |
| | Eli Lilly & Co. | | 21,511 | | 2,430 | |
| | Gilead Sciences Inc. | | 31,710 | | 2,015 | |
| | Bristol-Myers Squibb Co. | | 40,881 | | 1,965 | |
| | Stryker Corp. | | 8,495 | | 1,874 | |
| | Becton Dickinson and Co. | | 6,758 | | 1,716 | |
* | | Celgene Corp. | | 17,460 | | 1,690 | |
| | Anthem Inc. | | 6,396 | | 1,673 | |
| | Zoetis Inc. | | 12,028 | | 1,521 | |
* | | Intuitive Surgical Inc. | | 2,896 | | 1,481 | |
* | | Boston Scientific Corp. | | 34,493 | | 1,474 | |
| | Cigna Corp. | | 9,253 | | 1,425 | |
| | Allergan plc | | 8,294 | | 1,325 | |
* | | Vertex Pharmaceuticals Inc. | | 6,374 | | 1,147 | |
* | | Edwards Lifesciences Corp. | | 5,160 | | 1,145 | |
* | | Biogen Inc. | | 4,872 | | 1,071 | |
| | Baxter International Inc. | | 11,994 | | 1,055 | |
* | | Illumina Inc. | | 3,662 | | 1,030 | |
| | Humana Inc. | | 3,382 | | 958 | |
| | HCA Healthcare Inc. | | 6,728 | | 809 | |
| | Zimmer Biomet Holdings Inc. | | 5,105 | | 711 | |
* | | IQVIA Holdings Inc. | | 4,434 | | 688 | |
* | | IDEXX Laboratories Inc. | | 2,135 | | 619 | |
* | | Regeneron Pharmaceuticals Inc. | | 2,053 | | 595 | |
* | | Alexion Pharmaceuticals Inc. | | 5,357 | | 540 | |
| | ResMed Inc. | | 3,527 | | 491 | |
* | | Centene Corp. | | 10,485 | | 489 | |
| | Teleflex Inc. | | 1,150 | | 418 | |
* | | Laboratory Corp. of America Holdings | | 2,470 | | 414 | |
* | | DexCom Inc. | | 2,258 | | 387 | |
* | | Exact Sciences Corp. | | 3,177 | | 379 | |
| | Cooper Cos. Inc. | | 1,201 | | 372 | |
* | | Incyte Corp. | | 4,338 | | 355 | |
| | Quest Diagnostics Inc. | | 3,383 | | 346 | |
* | | WellCare Health Plans Inc. | | 1,231 | | 333 | |
* | | BioMarin Pharmaceutical Inc. | | 4,430 | | 333 | |
* | | Hologic Inc. | | 6,656 | | 329 | |
| | Cardinal Health Inc. | | 7,522 | | 324 | |
| | STERIS plc | | 2,050 | | 317 | |
| | Dentsply Sirona Inc. | | 5,774 | | 301 | |
* | | Align Technology Inc. | | 1,623 | | 297 | |
| | Universal Health Services Inc. Class B | | 2,046 | | 296 | |
| | West Pharmaceutical Services Inc. | | 1,834 | | 267 | |
* | | Elanco Animal Health Inc. | | 9,578 | | 249 | |
* | | Varian Medical Systems Inc. | | 2,285 | | 242 | |
* | | Insulet Corp. | | 1,498 | | 231 | |
* | | Henry Schein Inc. | | 3,713 | | 229 | |
* | | Neurocrine Biosciences Inc. | | 2,261 | | 225 | |
* | | Alnylam Pharmaceuticals Inc. | | 2,655 | | 214 | |
* | | Sage Therapeutics Inc. | | 1,243 | | 213 | |
* | | Molina Healthcare Inc. | | 1,591 | | 207 | |
* | | Seattle Genetics Inc. | | 2,825 | | 205 | |
* | | ICON plc | | 1,321 | | 204 | |
* | | Ionis Pharmaceuticals Inc. | | 3,165 | | 200 | |
* | | Catalent Inc. | | 3,750 | | 198 | |
* | | Novocure Ltd. | | 2,104 | | 191 | |
* | | Jazz Pharmaceuticals plc | | 1,424 | | 182 | |
* | | Bio-Rad Laboratories Inc. Class A | | 534 | | 180 | |
* | | Masimo Corp. | | 1,159 | | 178 | |
* | | DaVita Inc. | | 3,149 | | 178 | |
| | Hill-Rom Holdings Inc. | | 1,636 | | 176 | |
| | Bio-Techne Corp. | | 906 | | 174 | |
* | | Haemonetics Corp. | | 1,246 | | 166 | |
* | | Sarepta Therapeutics Inc. | | 1,845 | | 166 | |
| | Chemed Corp. | | 387 | | 166 | |
| | Perrigo Co. plc | | 3,421 | | 160 | |
* | | Charles River Laboratories International Inc. | | 1,193 | | 157 | |
* | | PRA Health Sciences Inc. | | 1,541 | | 152 | |
* | | ABIOMED Inc. | | 776 | | 150 | |
| | Encompass Health Corp. | | 2,458 | | 149 | |
* | | Exelixis Inc. | | 7,475 | | 148 | |
* | | Bluebird Bio Inc. | | 1,390 | | 144 | |
* | | Horizon Therapeutics plc | | 4,579 | | 127 | |
* | | Spark Therapeutics Inc. | | 1,246 | | 121 | |
16
ESG U.S. Stock ETF
| | | | | | Market | |
| | | | | | Value· | |
| | | | Shares | | ($000 | ) |
* | | Penumbra Inc. | | 778 | | 113 | |
* | | Integra LifeSciences Holdings Corp. | | 1,863 | | 112 | |
| | Bruker Corp. | | 2,574 | | 111 | |
* | | Repligen Corp. | | 1,161 | | 108 | |
* | | Teladoc Health Inc. | | 1,800 | | 104 | |
* | | HealthEquity Inc. | | 1,724 | | 102 | |
* | | Globus Medical Inc. | | 1,965 | | 100 | |
* | | Amedisys Inc. | | 763 | | 98 | |
* | | LivaNova plc | | 1,258 | | 98 | |
* | | Neogen Corp. | | 1,381 | | 97 | |
| | CONMED Corp. | | 959 | | 97 | |
* | | Blueprint Medicines Corp. | | 1,244 | | 95 | |
* | | Tandem Diabetes Care Inc. | | 1,294 | | 94 | |
* | | FibroGen Inc. | | 2,059 | | 92 | |
| | Cantel Medical Corp. | | 978 | | 90 | |
* | | LHC Group Inc. | | 742 | | 88 | |
* | | Alkermes plc | | 4,162 | | 87 | |
* | | NuVasive Inc. | | 1,335 | | 85 | |
* | | Ultragenyx Pharmaceutical Inc. | | 1,538 | | 84 | |
* | | HMS Holdings Corp. | | 2,219 | | 81 | |
* | | Syneos Health Inc. | | 1,480 | | 78 | |
* | | Guardant Health Inc. | | 884 | | 77 | |
* | | Medicines Co. | | 1,836 | | 77 | |
* | | Omnicell Inc. | | 1,059 | | 76 | |
* | | ACADIA Pharmaceuticals Inc. | | 2,622 | | 73 | |
* | | Halozyme Therapeutics Inc. | | 4,111 | | 68 | |
* | | Arena Pharmaceuticals Inc. | | 1,260 | | 67 | |
* | | Wright Medical Group NV | | 3,151 | | 66 | |
* | | Global Blood Therapeutics Inc. | | 1,381 | | 63 | |
* | | Amicus Therapeutics Inc. | | 6,361 | | 63 | |
* | | Acadia Healthcare Co. Inc. | | 2,324 | | 61 | |
* | | Immunomedics Inc. | | 4,758 | | 61 | |
* | | Medpace Holdings Inc. | | 745 | | 60 | |
* | | Tenet Healthcare Corp. | | 2,763 | | 60 | |
* | | CorVel Corp. | | 709 | | 60 | |
* | | PTC Therapeutics Inc. | | 1,321 | | 59 | |
| | Ensign Group Inc. | | 1,168 | | 58 | |
* | | Agios Pharmaceuticals Inc. | | 1,522 | | 58 | |
* | | Glaukos Corp. | | 895 | | 58 | |
* | | Portola Pharmaceuticals Inc. | | 1,948 | | 57 | |
* | | Nevro Corp. | | 676 | | 57 | |
* | | MyoKardia Inc. | | 1,051 | | 57 | |
* | | Quidel Corp. | | 891 | | 56 | |
* | | iRhythm Technologies Inc. | | 733 | | 56 | |
* | | Ligand Pharmaceuticals Inc. | | 586 | | 53 | |
* | | Acceleron Pharma Inc. | | 1,177 | | 53 | |
* | | MEDNAX Inc. | | 2,420 | | 51 | |
* | | Cambrex Corp. | | 840 | | 50 | |
* | | Avanos Medical Inc. | | 1,486 | | 49 | |
* | | Genomic Health Inc. | | 636 | | 49 | |
* | | Emergent BioSolutions Inc. | | 1,045 | | 46 | |
* | | Zogenix Inc. | | 1,066 | | 45 | |
* | | Select Medical Holdings Corp. | | 2,774 | | 45 | |
* | | Brookdale Senior Living Inc. | | 5,438 | | 44 | |
* | | Prestige Consumer Healthcare Inc. | | 1,368 | | 44 | |
* | | Myriad Genetics Inc. | | 1,847 | | 43 | |
* | | Xencor Inc. | | 1,160 | | 43 | |
* | | United Therapeutics Corp. | | 516 | | 43 | |
* | | Radius Health Inc. | | 1,462 | | 41 | |
* | | Enanta Pharmaceuticals Inc. | | 543 | | 38 | |
* | | Pacira BioSciences Inc. | | 1,015 | | 38 | |
* | | Supernus Pharmaceuticals Inc. | | 1,324 | | 36 | |
* | | Heron Therapeutics Inc. | | 1,932 | | 36 | |
* | | Ironwood Pharmaceuticals Inc. Class A | | 3,840 | | 36 | |
* | | Editas Medicine Inc. | | 1,420 | | 35 | |
* | | Momenta Pharmaceuticals Inc. | | 2,782 | | 35 | |
* | | Biohaven Pharmaceutical Holding Co. Ltd. | | 821 | | 32 | |
* | | REGENXBIO Inc. | | 915 | | 32 | |
| | Patterson Cos. Inc. | | 1,834 | | 31 | |
* | | Tivity Health Inc. | | 1,603 | | 29 | |
* | | Inogen Inc. | | 630 | | 29 | |
* | | Theravance Biopharma Inc. | | 1,322 | | 29 | |
* | | Allogene Therapeutics Inc. | | 1,067 | | 29 | |
* | | Magellan Health Inc. | | 454 | | 29 | |
* | | AnaptysBio Inc. | | 661 | | 27 | |
* | | Corcept Therapeutics Inc. | | 2,123 | | 27 | |
* | | ICU Medical Inc. | | 157 | | 25 | |
* | | Natus Medical Inc. | | 904 | | 25 | |
* | | Orthofix Medical Inc. | | 462 | | 23 | |
* | | Innoviva Inc. | | 1,870 | | 22 | |
| | Taro Pharmaceutical Industries Ltd. | | 276 | | 21 | |
* | | Madrigal Pharmaceuticals Inc. | | 225 | | 21 | |
* | | Varex Imaging Corp. | | 789 | | 21 | |
| | Luminex Corp. | | 1,007 | | 21 | |
* | | Spectrum Pharmaceuticals Inc. | | 2,811 | | 21 | |
* | | Aimmune Therapeutics Inc. | | 974 | | 20 | |
* | | Alder Biopharmaceuticals Inc. | | 2,145 | | 19 | |
* | | Atara Biotherapeutics Inc. | | 1,385 | | 19 | |
* | | Esperion Therapeutics Inc. | | 510 | | 19 | |
*,^ | | TherapeuticsMD Inc. | | 6,041 | | 17 | |
* | | OPKO Health Inc. | | 9,366 | | 17 | |
* | | Intra-Cellular Therapies Inc. | | 1,990 | | 17 | |
* | | Denali Therapeutics Inc. | | 888 | | 16 | |
* | | Acorda Therapeutics Inc. | | 4,917 | | 16 | |
* | | Cyclerion Therapeutics Inc. | | 1,613 | | 15 | |
17
ESG U.S. Stock ETF
| | | | | | Market | |
| | | | | | Value· | |
| | | | Shares | | ($000 | ) |
* | | Puma Biotechnology Inc. | | 1,412 | | 15 | |
* | | Mylan NV | | 750 | | 15 | |
* | | Amneal Pharmaceuticals Inc. | | 5,037 | | 13 | |
* | | Eagle Pharmaceuticals Inc. | | 212 | | 12 | |
* | | Axogen Inc. | | 596 | | 9 | |
* | | Mallinckrodt plc | | 3,335 | | 9 | |
* | | Insmed Inc. | | 504 | | 8 | |
*,^ | | Intrexon Corp. | | 1,226 | | 7 | |
| | | | | | 79,935 | |
Industrials (10.8%) | | | | | |
* | | PayPal Holdings Inc. | | 29,197 | | 3,184 | |
| | Accenture plc Class A | | 15,813 | | 3,134 | |
| | Union Pacific Corp. | | 17,590 | | 2,849 | |
| | Danaher Corp. | | 15,771 | | 2,241 | |
| | Fidelity National Information Services Inc. | | 15,159 | | 2,065 | |
| | United Parcel Service Inc. Class B | | 17,349 | | 2,059 | |
| | Automatic Data Processing Inc. | | 10,773 | | 1,830 | |
| | Caterpillar Inc. | | 13,906 | | 1,655 | |
* | | Fiserv Inc. | | 14,030 | | 1,500 | |
| | CSX Corp. | | 19,117 | | 1,281 | |
| | Waste Management Inc. | | 10,450 | | 1,247 | |
| | Deere & Co. | | 7,907 | | 1,225 | |
| | Illinois Tool Works Inc. | | 8,153 | | 1,222 | |
| | Norfolk Southern Corp. | | 6,591 | | 1,147 | |
| | Sherwin-Williams Co. | | 2,057 | | 1,083 | |
| | FedEx Corp. | | 6,082 | | 965 | |
| | Johnson Controls International plc | | 22,270 | | 951 | |
| | Ingersoll-Rand plc | | 5,948 | | 720 | |
| | Ball Corp. | | 8,135 | | 654 | |
| | Global Payments Inc. | | 3,895 | | 646 | |
| | Paychex Inc. | | 7,907 | | 646 | |
* | | FleetCor Technologies Inc. | | 2,124 | | 634 | |
| | Willis Towers Watson plc | | 3,175 | | 629 | |
| | Verisk Analytics Inc. Class A | | 3,887 | | 628 | |
| | Total System Services Inc. | | 4,333 | | 582 | |
| | Agilent Technologies Inc. | | 7,948 | | 565 | |
| | Cummins Inc. | | 3,783 | | 565 | |
| | Cintas Corp. | | 2,095 | | 553 | |
| | PACCAR Inc. | | 8,366 | | 548 | |
* | | CoStar Group Inc. | | 890 | | 547 | |
* | | Square Inc. | | 8,499 | | 526 | |
| | Fortive Corp. | | 7,322 | | 519 | |
| | Stanley Black & Decker Inc. | | 3,768 | | 501 | |
| | Republic Services Inc. Class A | | 5,134 | | 458 | |
| | Vulcan Materials Co. | | 3,241 | | 458 | |
* | | Keysight Technologies Inc. | | 4,624 | | 448 | |
| | Rockwell Automation Inc. | | 2,915 | | 445 | |
| | Fastenal Co. | | 14,198 | | 435 | |
| | Martin Marietta Materials Inc. | | 1,551 | | 394 | |
* | | Mettler-Toledo International Inc. | | 595 | | 391 | |
| | TransUnion | | 4,595 | | 384 | |
| | Broadridge Financial Solutions Inc. | | 2,891 | | 374 | |
* | | Waters Corp. | | 1,728 | | 366 | |
| | Xylem Inc. | | 4,379 | | 335 | |
| | Dover Corp. | | 3,535 | | 331 | |
| | Wabtec Corp. | | 4,680 | | 324 | |
| | Kansas City Southern | | 2,467 | | 310 | |
| | WW Grainger Inc. | | 1,117 | | 306 | |
| | Masco Corp. | | 7,473 | | 304 | |
| | IDEX Corp. | | 1,840 | | 303 | |
| | Expeditors International of Washington Inc. | | 4,187 | | 298 | |
| | CH Robinson Worldwide Inc. | | 3,310 | | 280 | |
| | Jack Henry & Associates Inc. | | 1,921 | | 278 | |
* | | Zebra Technologies Corp. | | 1,341 | | 275 | |
| | Old Dominion Freight Line Inc. | | 1,620 | | 265 | |
| | Arconic Inc. | | 10,112 | | 261 | |
| | Booz Allen Hamilton Holding Corp. Class A | | 3,375 | | 255 | |
* | | Fair Isaac Corp. | | 711 | | 251 | |
| | Packaging Corp. of America | | 2,426 | | 244 | |
| | JB Hunt Transport Services Inc. | | 2,208 | | 239 | |
| | Westrock Co. | | 6,933 | | 237 | |
* | | Trimble Inc. | | 6,160 | | 231 | |
| | PerkinElmer Inc. | | 2,782 | | 230 | |
| | Lennox International Inc. | | 899 | | 228 | |
| | Allegion plc | | 2,336 | | 225 | |
* | | WEX Inc. | | 1,082 | | 221 | |
| | Universal Display Corp. | | 1,053 | | 216 | |
* | | Crown Holdings Inc. | | 3,218 | | 212 | |
| | Spirit AeroSystems Holdings Inc. Class A | | 2,591 | | 209 | |
| | Snap-on Inc. | | 1,395 | | 207 | |
| | HEICO Corp. Class A | | 1,854 | | 205 | |
| | Nordson Corp. | | 1,454 | | 198 | |
| | Carlisle Cos. Inc. | | 1,362 | | 197 | |
| | Cognex Corp. | | 4,363 | | 197 | |
* | | Pagseguro Digital Ltd. Class A | | 3,884 | | 194 | |
* | | XPO Logistics Inc. | | 2,737 | | 194 | |
| | Graco Inc. | | 4,166 | | 190 | |
| | Toro Co. | | 2,595 | | 187 | |
* | | Euronet Worldwide Inc. | | 1,213 | | 186 | |
| | AptarGroup Inc. | | 1,509 | | 184 | |
* | | Sensata Technologies Holding plc | | 4,015 | | 183 | |
| | AO Smith Corp. | | 3,830 | | 178 | |
18
ESG U.S. Stock ETF
| | | | | | Market | |
| | | | | | Value· | |
| | | | Shares | | ($000 | ) |
| | Genpact Ltd. | | 4,314 | | 177 | |
| | Hexcel Corp. | | 2,083 | | 175 | |
| | FLIR Systems Inc. | | 3,412 | | 168 | |
* | | HD Supply Holdings Inc. | | 4,242 | | 165 | |
| | Donaldson Co. Inc. | | 3,307 | | 160 | |
| | Owens Corning | | 2,774 | | 159 | |
* | | Genesee & Wyoming Inc. Class A | | 1,422 | | 158 | |
| | Robert Half International Inc. | | 2,947 | | 158 | |
| | Sealed Air Corp. | | 3,931 | | 157 | |
* | | Alliance Data Systems Corp. | | 1,236 | | 152 | |
* | | Arrow Electronics Inc. | | 2,154 | | 149 | |
| | Woodward Inc. | | 1,341 | | 145 | |
| | HEICO Corp. | | 989 | | 143 | |
| | National Instruments Corp. | | 3,399 | | 143 | |
| | Sonoco Products Co. | | 2,451 | | 140 | |
| | Xerox Holdings Corp. | | 4,672 | | 135 | |
| | Acuity Brands Inc. | | 1,056 | | 132 | |
| | Allison Transmission Holdings Inc. | | 2,955 | | 131 | |
* | | Flex Ltd. | | 13,606 | | 131 | |
| | Watsco Inc. | | 798 | | 130 | |
| | Quanta Services Inc. | | 3,806 | | 129 | |
| | MAXIMUS Inc. | | 1,654 | | 127 | |
* | | Berry Global Group Inc. | | 3,248 | | 127 | |
* | | Trex Co. Inc. | | 1,468 | | 126 | |
| | ManpowerGroup Inc. | | 1,526 | | 125 | |
| | Avnet Inc. | | 2,904 | | 122 | |
* | | Mercury Systems Inc. | | 1,357 | | 116 | |
| | Armstrong World Industries Inc. | | 1,202 | | 115 | |
* | | Generac Holdings Inc. | | 1,471 | | 115 | |
| | Landstar System Inc. | | 1,027 | | 114 | |
| | Air Lease Corp. Class A | | 2,648 | | 110 | |
| | Jabil Inc. | | 3,800 | | 109 | |
* | | Kirby Corp. | | 1,477 | | 109 | |
* | | FTI Consulting Inc. | | 1,000 | | 108 | |
| | Graphic Packaging Holding Co. | | 7,780 | | 107 | |
| | AGCO Corp. | | 1,523 | | 105 | |
* | | RBC Bearings Inc. | | 649 | | 104 | |
| | Brink’s Co. | | 1,370 | | 103 | |
* | | CoreLogic Inc. | | 2,128 | | 103 | |
* | | Stericycle Inc. | | 2,262 | | 102 | |
| | MSA Safety Inc. | | 956 | | 101 | |
| | Littelfuse Inc. | | 646 | | 101 | |
* | | Clean Harbors Inc. | | 1,370 | | 101 | |
| | Insperity Inc. | | 978 | | 97 | |
| | Eagle Materials Inc. | | 1,131 | | 95 | |
* | | Gardner Denver Holdings Inc. | | 3,263 | | 94 | |
* | | ASGN Inc. | | 1,459 | | 91 | |
* | | Axon Enterprise Inc. | | 1,519 | | 91 | |
* | | Paylocity Holding Corp. | | 829 | | 91 | |
* | | Coherent Inc. | | 623 | | 90 | |
* | | MasTec Inc. | | 1,432 | | 90 | |
* | | SiteOne Landscape Supply Inc. | | 1,067 | | 83 | |
| | nVent Electric plc | | 4,105 | | 83 | |
| | Valmont Industries Inc. | | 611 | | 83 | |
| | Regal Beloit Corp. | | 1,161 | | 82 | |
| | MSC Industrial Direct Co. Inc. Class A | | 1,197 | | 81 | |
* | | TriNet Group Inc. | | 1,191 | | 80 | |
| | UniFirst Corp. | | 406 | | 80 | |
* | | TopBuild Corp. | | 849 | | 79 | |
| | John Bean Technologies Corp. | | 768 | | 79 | |
| | Ryder System Inc. | | 1,580 | | 76 | |
| | Simpson Manufacturing Co. Inc. | | 1,147 | | 74 | |
* | | Rexnord Corp. | | 2,683 | | 70 | |
| | Louisiana-Pacific Corp. | | 2,905 | | 70 | |
* | | Summit Materials Inc. Class A | | 3,297 | | 69 | |
* | | Cimpress NV | | 601 | | 69 | |
| | Macquarie Infrastructure Corp. | | 1,819 | | 69 | |
| | GATX Corp. | | 917 | | 68 | |
* | | Proto Labs Inc. | | 713 | | 68 | |
* | | II-VI Inc. | | 1,789 | | 67 | |
| | Brady Corp. Class A | | 1,410 | | 67 | |
* | | AMN Healthcare Services Inc. | | 1,126 | | 66 | |
* | | WESCO International Inc. | | 1,405 | | 63 | |
* | | Novanta Inc. | | 820 | | 61 | |
* | | Rogers Corp. | | 444 | | 59 | |
| | Deluxe Corp. | | 1,272 | | 59 | |
* | | Integer Holdings Corp. | | 806 | | 58 | |
| | Universal Forest Products Inc. | | 1,477 | | 58 | |
| | Trinity Industries Inc. | | 3,299 | | 58 | |
| | Korn Ferry | | 1,438 | | 56 | |
| | Cubic Corp. | | 811 | | 56 | |
| | EVERTEC Inc. | | 1,584 | | 55 | |
* | | Saia Inc. | | 642 | | 55 | |
* | | Builders FirstSource Inc. | | 2,795 | | 54 | |
* | | Itron Inc. | | 780 | | 54 | |
| | Otter Tail Corp. | | 1,051 | | 53 | |
| | Vishay Intertechnology Inc. | | 3,328 | | 53 | |
| | ESCO Technologies Inc. | | 690 | | 52 | |
| | Scorpio Tankers Inc. | | 1,989 | | 52 | |
* | | Beacon Roofing Supply Inc. | | 1,617 | | 52 | |
* | | Advanced Disposal Services Inc. | | 1,580 | | 51 | |
| | Albany International Corp. Class A | | 617 | | 51 | |
* | | ExlService Holdings Inc. | | 727 | | 49 | |
19
ESG U.S. Stock ETF
| | | | | | Market | |
| | | | | | Value· | |
| | | | Shares | | ($000 | ) |
| | Watts Water Technologies Inc. Class A | | 530 | | 49 | |
* | | BMC Stock Holdings Inc. | | 1,894 | | 48 | |
| | Mueller Industries Inc. | | 1,821 | | 48 | |
| | Terex Corp. | | 1,864 | | 46 | |
| | Belden Inc. | | 972 | | 44 | |
| | Franklin Electric Co. Inc. | | 957 | | 44 | |
| | AAON Inc. | | 913 | | 44 | |
| | Covanta Holding Corp. | | 2,502 | | 43 | |
* | | Dycom Industries Inc. | | 964 | | 43 | |
* | | Sanmina Corp. | | 1,481 | | 43 | |
| | Mueller Water Products Inc. Class A | | 4,030 | | 42 | |
* | | Plexus Corp. | | 730 | | 42 | |
* | | Anixter International Inc. | | 695 | | 42 | |
* | | Fabrinet | | 822 | | 41 | |
| | Applied Industrial Technologies Inc. | | 777 | | 41 | |
| | Comfort Systems USA Inc. | | 1,056 | | 41 | |
| | Federal Signal Corp. | | 1,361 | | 40 | |
* | | OSI Systems Inc. | | 384 | | 40 | |
| | Triton International Ltd. | | 1,252 | | 40 | |
| | Schneider National Inc. Class B | | 2,029 | | 39 | |
| | Boise Cascade Co. | | 1,253 | | 39 | |
* | | Knowles Corp. | | 1,902 | | 39 | |
| | TTEC Holdings Inc. | | 814 | | 38 | |
| | Mobile Mini Inc. | | 1,215 | | 38 | |
* | | TTM Technologies Inc. | | 3,534 | | 38 | |
| | Forward Air Corp. | | 598 | | 37 | |
| | Helios Technologies Inc. | | 865 | | 37 | |
| | Greif Inc. Class A | | 1,048 | | 37 | |
* | | FARO Technologies Inc. | | 747 | | 37 | |
* | | SPX Corp. | | 962 | | 36 | |
* | | Ambarella Inc. | | 643 | | 36 | |
* | | Hub Group Inc. Class A | | 794 | | 34 | |
| | Seaspan Corp. Class A | | 3,278 | | 34 | |
| | Lindsay Corp. | | 369 | | 33 | |
* | | Huron Consulting Group Inc. | | 526 | | 32 | |
| | AAR Corp. | | 749 | | 32 | |
* | | Harsco Corp. | | 1,786 | | 32 | |
* | | SEACOR Holdings Inc. | | 665 | | 31 | |
| | Ship Finance International Ltd. | | 2,152 | | 30 | |
| | Aircastle Ltd. | | 1,379 | | 30 | |
| | Methode Electronics Inc. | | 938 | | 30 | |
* | | Installed Building Products Inc. | | 522 | | 30 | |
* | | Gibraltar Industries Inc. | | 735 | | 30 | |
| | Tennant Co. | | 432 | | 30 | |
* | | MACOM Technology Solutions Holdings Inc. | | 1,474 | | 29 | |
* | | CBIZ Inc. | | 1,295 | | 29 | |
* | | Masonite International Corp. | | 535 | | 29 | |
| | McGrath RentCorp | | 444 | | 28 | |
* | | Sykes Enterprises Inc. | | 965 | | 28 | |
| | Apogee Enterprises Inc. | | 741 | | 27 | |
* | | JELD-WEN Holding Inc. | | 1,532 | | 26 | |
| | Werner Enterprises Inc. | | 783 | | 26 | |
| | US Ecology Inc. | | 419 | | 25 | |
| | Badger Meter Inc. | | 479 | | 25 | |
| | GrafTech International Ltd. | | 2,012 | | 24 | |
* | | TriMas Corp. | | 793 | | 23 | |
| | Advanced Drainage Systems Inc. | | 712 | | 22 | |
* | | Cardtronics plc Class A | | 749 | | 22 | |
| | CTS Corp. | | 770 | | 22 | |
| | H&E Equipment Services Inc. | | 900 | | 22 | |
* | | Manitowoc Co. Inc. | | 1,741 | | 22 | |
| | Navigant Consulting Inc. | | 774 | | 22 | |
| | Encore Wire Corp. | | 396 | | 21 | |
| | Rush Enterprises Inc. Class A | | 571 | | 21 | |
* | | Patrick Industries Inc. | | 559 | | 20 | |
| | Raven Industries Inc. | | 664 | | 19 | |
| | GasLog Ltd. | | 1,570 | | 19 | |
* | | Evolent Health Inc. Class A | | 2,607 | | 18 | |
| | Astec Industries Inc. | | 565 | | 16 | |
* | | Wesco Aircraft Holdings Inc. | | 1,334 | | 15 | |
| | Benchmark Electronics Inc. | | 550 | | 15 | |
| | Heartland Express Inc. | | 684 | | 14 | |
| | Primoris Services Corp. | | 711 | | 14 | |
* | | TrueBlue Inc. | | 655 | | 13 | |
| | Kelly Services Inc. Class A | | 466 | | 11 | |
| | Myers Industries Inc. | | 663 | | 11 | |
| | Quanex Building Products Corp. | | 594 | | 10 | |
| | Griffon Corp. | | 565 | | 10 | |
* | | Aegion Corp. Class A | | 496 | | 10 | |
| | AVX Corp. | | 643 | | 9 | |
| | Hyster-Yale Materials Handling Inc. | | 154 | | 8 | |
* | | Donnelley Financial Solutions Inc. | | 637 | | 7 | |
| | Matson Inc. | | 60 | | 2 | |
| | Caesarstone Ltd. | | 128 | | 2 | |
| | Owens-Illinois Inc. | | 120 | | 1 | |
| | | | | | 64,087 | |
Oil & Gas (1.3%) | | | | | |
| | Schlumberger Ltd. | | 36,509 | | 1,184 | |
| | Phillips 66 | | 11,420 | | 1,126 | |
| | Marathon Petroleum Corp. | | 16,777 | | 826 | |
| | Valero Energy Corp. | | 10,580 | | 797 | |
| | ONEOK Inc. | | 10,360 | | 738 | |
| | Williams Cos. Inc. | | 30,930 | | 730 | |
* | | Cheniere Energy Inc. | | 6,053 | | 361 | |
| | Baker Hughes a GE Co. Class A | | 13,846 | | 300 | |
| | Targa Resources Corp. | | 6,312 | | 228 | |
20
ESG U.S. Stock ETF
| | | | | | Market | |
| | | | | | Value· | |
| | | | Shares | | ($000 | ) |
| | OGE Energy Corp. | | 4,782 | | 205 | |
| | National Oilwell Varco Inc. | | 6,302 | | 129 | |
* | | First Solar Inc. | | 2,043 | | 127 | |
* | | SolarEdge Technologies Inc. | | 945 | | 77 | |
* | | Apergy Corp. | | 2,699 | | 70 | |
| | Delek US Holdings Inc. | | 2,068 | | 68 | |
* | | Dril-Quip Inc. | | 1,234 | | 57 | |
* | | Chart Industries Inc. | | 866 | | 54 | |
| | Archrock Inc. | | 5,550 | | 54 | |
| | Helmerich & Payne Inc. | | 1,195 | | 45 | |
* | | Cosan Ltd. | | 3,138 | | 44 | |
| | Arcosa Inc. | | 1,264 | | 41 | |
* | | Oil States International Inc. | | 2,809 | | 39 | |
* | | MRC Global Inc. | | 2,621 | | 33 | |
* | | NOW Inc. | | 2,426 | | 29 | |
* | | Newpark Resources Inc. | | 4,118 | | 27 | |
| | CVR Energy Inc. | | 668 | | 27 | |
* | | Noble Corp. plc | | 13,788 | | 22 | |
* | | Frank’s International NV | | 4,835 | | 21 | |
| | RPC Inc. | | 3,791 | | 20 | |
* | | SunPower Corp. Class A | | 1,582 | | 20 | |
| | Equitrans Midstream Corp. | | 1,227 | | 17 | |
| | Nabors Industries Ltd. | | 1,416 | | 2 | |
| | Core Laboratories NV | | 50 | | 2 | |
* | | Valaris plc Class A | | 1 | | — | |
| | | | | | 7,520 | |
Technology (25.3%) | | | | | |
| | Microsoft Corp. | | 188,105 | | 25,932 | |
| | Apple Inc. | | 114,650 | | 23,932 | |
* | | Facebook Inc. Class A | | 59,435 | | 11,035 | |
* | | Alphabet Inc. Class C | | 7,532 | | 8,949 | |
* | | Alphabet Inc. Class A | | 7,498 | | 8,927 | |
| | Intel Corp. | | 111,405 | | 5,282 | |
| | Cisco Systems Inc. | | 109,595 | | 5,130 | |
* | | Adobe Inc. | | 12,128 | | 3,451 | |
* | | salesforce.com Inc. | | 20,427 | | 3,188 | |
| | International Business Machines Corp. | | 22,060 | | 2,990 | |
| | Oracle Corp. | | 57,134 | | 2,974 | |
| | Texas Instruments Inc. | | 23,301 | | 2,883 | |
| | Broadcom Inc. | | 9,612 | | 2,717 | |
| | NVIDIA Corp. | | 14,599 | | 2,445 | |
| | QUALCOMM Inc. | | 30,236 | | 2,351 | |
| | Intuit Inc. | | 6,184 | | 1,783 | |
* | | Micron Technology Inc. | | 27,561 | | 1,248 | |
* | | ServiceNow Inc. | | 4,557 | | 1,193 | |
| | Applied Materials Inc. | | 23,613 | | 1,134 | |
| | Analog Devices Inc. | | 9,097 | | 999 | |
| | Cognizant Technology Solutions Corp. Class A | | 14,199 | | 872 | |
| | NXP Semiconductors NV | | 8,392 | | 857 | |
* | | Twitter Inc. | | 18,661 | | 796 | |
* | | Advanced Micro Devices Inc. | | 25,021 | | 787 | |
* | | Autodesk Inc. | | 5,506 | | 786 | |
| | Lam Research Corp. | | 3,703 | | 779 | |
| | Motorola Solutions Inc. | | 4,085 | | 739 | |
| | HP Inc. | | 39,077 | | 715 | |
* | | Workday Inc. Class A | | 3,978 | | 705 | |
| | Xilinx Inc. | | 6,296 | | 655 | |
| | KLA Corp. | | 4,014 | | 594 | |
| | Cerner Corp. | | 8,170 | | 563 | |
| | Corning Inc. | | 19,141 | | 533 | |
* | | Synopsys Inc. | | 3,751 | | 532 | |
* | | VeriSign Inc. | | 2,606 | | 531 | |
* | | Veeva Systems Inc. Class A | | 3,152 | | 505 | |
| | Microchip Technology Inc. | | 5,778 | | 499 | |
| | Hewlett Packard Enterprise Co. | | 35,754 | | 494 | |
* | | Cadence Design Systems Inc. | | 6,932 | | 475 | |
* | | Palo Alto Networks Inc. | | 2,309 | | 470 | |
| | Western Digital Corp. | | 7,349 | | 421 | |
* | | Splunk Inc. | | 3,747 | | 419 | |
| | CDW Corp. | | 3,585 | | 414 | |
| | Marvell Technology Group Ltd. | | 16,364 | | 392 | |
* | | Twilio Inc. Class A | | 2,870 | | 374 | |
| | Maxim Integrated Products Inc. | | 6,710 | | 366 | |
* | | Akamai Technologies Inc. | | 3,982 | | 355 | |
* | | Atlassian Corp. plc Class A | | 2,625 | | 353 | |
| | Seagate Technology plc | | 6,939 | | 348 | |
| | Symantec Corp. | | 14,711 | | 342 | |
* | | Arista Networks Inc. | | 1,480 | | 335 | |
| | Skyworks Solutions Inc. | | 4,348 | | 327 | |
* | | Check Point Software Technologies Ltd. | | 2,933 | | 316 | |
* | | Okta Inc. | | 2,496 | | 316 | |
* | | Paycom Software Inc. | | 1,204 | | 301 | |
| | Leidos Holdings Inc. | | 3,431 | | 300 | |
| | Citrix Systems Inc. | | 3,175 | | 295 | |
* | | Gartner Inc. | | 2,130 | | 285 | |
* | | Fortinet Inc. | | 3,580 | | 283 | |
* | | GoDaddy Inc. Class A | | 4,405 | | 279 | |
| | VMware Inc. Class A | | 1,927 | | 273 | |
| | SS&C Technologies Holdings Inc. | | 5,744 | | 268 | |
* | | RingCentral Inc. Class A | | 1,757 | | 248 | |
* | | Tyler Technologies Inc. | | 947 | | 243 | |
* | | EPAM Systems Inc. | | 1,261 | | 241 | |
* | | Yandex NV Class A | | 6,331 | | 235 | |
| | NetApp Inc. | | 4,847 | | 233 | |
* | | Aspen Technology Inc. | | 1,686 | | 225 | |
* | | Qorvo Inc. | | 3,124 | | 223 | |
| | Teradyne Inc. | | 4,196 | | 222 | |
21
ESG U.S. Stock ETF
| | | | | | Market | |
| | | | | | Value· | |
| | | | Shares | | ($000 | ) |
* | | Black Knight Inc. | | 3,552 | | 221 | |
| | Amdocs Ltd. | | 3,378 | | 219 | |
| | Juniper Networks Inc. | | 9,094 | | 211 | |
* | | Zendesk Inc. | | 2,616 | | 210 | |
* | | F5 Networks Inc. | | 1,617 | | 208 | |
| | Cypress Semiconductor Corp. | | 8,848 | | 204 | |
* | | Coupa Software Inc. | | 1,460 | | 203 | |
* | | HubSpot Inc. | | 1,012 | | 202 | |
* | | Guidewire Software Inc. | | 2,014 | | 194 | |
* | | Dell Technologies Inc. | | 3,713 | | 191 | |
* | | DocuSign Inc. Class A | | 4,074 | | 190 | |
* | | PTC Inc. | | 2,801 | | 183 | |
* | | ON Semiconductor Corp. | | 10,240 | | 182 | |
| | DXC Technology Co. | | 5,053 | | 168 | |
* | | Alteryx Inc. Class A | | 1,161 | | 165 | |
| | Monolithic Power Systems Inc. | | 1,064 | | 160 | |
* | | Proofpoint Inc. | | 1,396 | | 159 | |
* | | Ciena Corp. | | 3,775 | | 154 | |
| | Entegris Inc. | | 3,356 | | 144 | |
* | | InterXion Holding NV | | 1,712 | | 139 | |
* | | Medidata Solutions Inc. | | 1,488 | | 136 | |
| | Science Applications International Corp. | | 1,509 | | 133 | |
| | CDK Global Inc. | | 3,044 | | 131 | |
* | | Manhattan Associates Inc. | | 1,579 | | 130 | |
* | | RealPage Inc. | | 2,044 | | 130 | |
* | | Mellanox Technologies Ltd. | | 1,099 | | 118 | |
* | | Silicon Laboratories Inc. | | 1,078 | | 117 | |
* | | MongoDB Inc. | | 766 | | 117 | |
* | | Pure Storage Inc. Class A | | 7,120 | | 116 | |
| | Blackbaud Inc. | | 1,266 | | 115 | |
* | | ViaSat Inc. | | 1,434 | | 114 | |
* | | Cree Inc. | | 2,639 | | 113 | |
* | | Anaplan Inc. | | 2,045 | | 111 | |
* | | Wix.com Ltd. | | 778 | | 109 | |
| | MKS Instruments Inc. | | 1,382 | | 108 | |
* | | Lumentum Holdings Inc. | | 1,902 | | 106 | |
* | | Zscaler Inc. | | 1,532 | | 105 | |
* | | Ceridian HCM Holding Inc. | | 1,820 | | 105 | |
| | j2 Global Inc. | | 1,218 | | 103 | |
* | | Q2 Holdings Inc. | | 1,129 | | 102 | |
* | | NCR Corp. | | 3,186 | | 100 | |
* | | CyberArk Software Ltd. | | 871 | | 98 | |
| | Perspecta Inc. | | 3,699 | | 96 | |
* | | Teradata Corp. | | 3,093 | | 95 | |
| | Cabot Microelectronics Corp. | | 763 | | 95 | |
* | | Tech Data Corp. | | 1,008 | | 93 | |
* | | Five9 Inc. | | 1,465 | | 93 | |
| | SYNNEX Corp. | | 1,086 | | 91 | |
| | Power Integrations Inc. | | 973 | | 87 | |
* | | Elastic NV | | 979 | | 86 | |
* | | Verint Systems Inc. | | 1,590 | | 85 | |
| | LogMeIn Inc. | | 1,248 | | 83 | |
* | | Cirrus Logic Inc. | | 1,506 | | 81 | |
* | | ACI Worldwide Inc. | | 2,678 | | 80 | |
* | | Viavi Solutions Inc. | | 5,728 | | 80 | |
* | | Globant SA | | 817 | | 78 | |
* | | Envestnet Inc. | | 1,294 | | 74 | |
* | | Cornerstone OnDemand Inc. | | 1,369 | | 71 | |
* | | Qualys Inc. | | 888 | | 71 | |
* | | Semtech Corp. | | 1,681 | | 71 | |
| | Cogent Communications Holdings Inc. | | 1,145 | | 70 | |
* | | FireEye Inc. | | 5,061 | | 68 | |
* | | Box Inc. | | 4,640 | | 68 | |
| | Pegasystems Inc. | | 965 | | 68 | |
* | | Everbridge Inc. | | 772 | | 67 | |
* | | Finisar Corp. | | 2,881 | | 65 | |
* | | Rapid7 Inc. | | 1,210 | | 65 | |
* | | Lattice Semiconductor Corp. | | 3,200 | | 63 | |
* | | Acacia Communications Inc. | | 933 | | 59 | |
* | | Inphi Corp. | | 940 | | 58 | |
* | | Blackline Inc. | | 1,067 | | 54 | |
| | Brooks Automation Inc. | | 1,626 | | 54 | |
* | | Cloudera Inc. | | 7,001 | | 50 | |
* | | EchoStar Corp. Class A | | 1,114 | | 47 | |
* | | SailPoint Technologies Holding Inc. | | 2,082 | | 47 | |
* | | Varonis Systems Inc. | | 681 | | 47 | |
* | | Bottomline Technologies DE Inc. | | 1,121 | | 46 | |
| | InterDigital Inc. | | 934 | | 46 | |
* | | Advanced Energy Industries Inc. | | 829 | | 43 | |
* | | Yext Inc. | | 2,672 | | 42 | |
* | | Alarm.com Holdings Inc. | | 880 | | 42 | |
* | | Premier Inc. Class A | | 1,171 | | 41 | |
* | | Diodes Inc. | | 1,059 | | 39 | |
| | Progress Software Corp. | | 1,021 | | 39 | |
* | | Allscripts Healthcare Solutions Inc. | | 4,034 | | 37 | |
* | | NetScout Systems Inc. | | 1,653 | | 37 | |
* | | Insight Enterprises Inc. | | 757 | | 36 | |
* | | Synaptics Inc. | | 1,068 | | 34 | |
| | NIC Inc. | | 1,575 | | 33 | |
| | CSG Systems International Inc. | | 608 | | 33 | |
* | | Rambus Inc. | | 2,583 | | 32 | |
* | | NETGEAR Inc. | | 909 | | 32 | |
* | | Cray Inc. | | 879 | | 31 | |
* | | MaxLinear Inc. | | 1,509 | | 30 | |
* | | MicroStrategy Inc. Class A | | 201 | | 29 | |
| | Ebix Inc. | | 765 | | 27 | |
* | | Stratasys Ltd. | | 1,136 | | 27 | |
22
ESG U.S. Stock ETF
| | | | | | Market | |
| | | | | | Value· | |
| | | | Shares | | ($000 | ) |
* | | Infinera Corp. | | 5,042 | | 27 | |
* | | Perficient Inc. | | 708 | | 26 | |
* | | Blucora Inc. | | 1,140 | | 26 | |
* | | Virtusa Corp. | | 703 | | 25 | |
| | Kulicke & Soffa Industries Inc. | | 1,208 | | 25 | |
* | | Shutterstock Inc. | | 707 | | 25 | |
| | TiVo Corp. | | 3,119 | | 23 | |
* | | Mimecast Ltd. | | 523 | | 21 | |
* | | ScanSource Inc. | | 752 | | 21 | |
| | ADTRAN Inc. | | 2,003 | | 21 | |
* | | Amkor Technology Inc. | | 2,268 | | 20 | |
| | Monotype Imaging Holdings Inc. | | 999 | | 20 | |
| | Pitney Bowes Inc. | | 5,514 | | 20 | |
| | Xperi Corp. | | 1,027 | | 19 | |
* | | NextGen Healthcare Inc. | | 1,289 | | 18 | |
* | | SolarWinds Corp. | | 1,066 | | 18 | |
* | | Endurance International Group Holdings Inc. | | 3,091 | | 16 | |
* | | New Relic Inc. | | 216 | | 12 | |
* | | Loral Space & Communications Inc. | | 292 | | 11 | |
* | | CommScope Holding Co. Inc. | | 140 | | 1 | |
| | | | | | 150,497 | |
Telecommunications (2.3%) | | | | | |
| | AT&T Inc. | | 181,454 | | 6,398 | |
| | Verizon Communications Inc. | | 102,859 | | 5,982 | |
* | | T-Mobile US Inc. | | 7,816 | | 610 | |
| | CenturyLink Inc. | | 28,561 | | 325 | |
* | | Zayo Group Holdings Inc. | | 5,529 | | 186 | |
* | | Sprint Corp. | | 13,567 | | 92 | |
* | | Vonage Holdings Corp. | | 5,827 | | 77 | |
| | Telephone & Data Systems Inc. | | 2,580 | | 65 | |
* | | Iridium Communications Inc. | | 2,563 | | 62 | |
* | | 8x8 Inc. | | 2,117 | | 52 | |
| | Shenandoah Telecommunications Co. | | 1,038 | | 33 | |
* | | Intelsat SA | | 1,459 | | 30 | |
| | ATN International Inc. | | 373 | | 21 | |
* | | GTT Communications Inc. | | 1,709 | | 16 | |
| | Consolidated Communications Holdings Inc. | | 3,223 | | 13 | |
* | | United States Cellular Corp. | | 220 | | 8 | |
| | | | | | 13,970 | |
Utilities (1.4%) | | | | | |
| | Sempra Energy | | 6,782 | | 961 | |
| | Consolidated Edison Inc. | | 8,100 | | 720 | |
| | Edison International | | 8,615 | | 623 | |
| | Eversource Energy | | 7,709 | | 618 | |
| | American Water Works Co. Inc. | | 4,362 | | 555 | |
| | PPL Corp. | | 17,896 | | 529 | |
| | CMS Energy Corp. | | 6,802 | | 429 | |
| | CenterPoint Energy Inc. | | 12,564 | | 348 | |
| | Atmos Energy Corp. | | 2,898 | | 319 | |
| | Alliant Energy Corp. | | 5,613 | | 294 | |
| | NiSource Inc. | | 9,345 | | 276 | |
| | AES Corp. | | 16,729 | | 256 | |
| | UGI Corp. | | 5,170 | | 252 | |
| | Aqua America Inc. | | 5,288 | | 234 | |
| | Portland General Electric Co. | | 2,535 | | 144 | |
| | IDACORP Inc. | | 1,297 | | 142 | |
| | Hawaiian Electric Industries Inc. | | 3,078 | | 137 | |
| | Southwest Gas Holdings Inc. | | 1,292 | | 118 | |
| | NorthWestern Corp. | | 1,595 | | 116 | |
| | ONE Gas Inc. | | 1,216 | | 111 | |
| | New Jersey Resources Corp. | | 2,221 | | 102 | |
| | American States Water Co. | | 1,091 | | 101 | |
| | Spire Inc. | | 1,163 | | 99 | |
| | Ormat Technologies Inc. | | 1,073 | | 80 | |
| | California Water Service Group | | 1,375 | | 78 | |
| | MGE Energy Inc. | | 1,016 | | 77 | |
| | South Jersey Industries Inc. | | 2,369 | | 77 | |
| | Avista Corp. | | 1,599 | | 75 | |
| | El Paso Electric Co. | | 992 | | 66 | |
| | Avangrid Inc. | | 1,253 | | 63 | |
| | Pattern Energy Group Inc. Class A | | 2,043 | | 55 | |
| | SJW Group | | 751 | | 51 | |
| | Northwest Natural Holding Co. | | 513 | | 37 | |
* | | Evoqua Water Technologies Corp. | | 1,935 | | 30 | |
| | Atlantica Yield plc | | 1,211 | | 29 | |
| | TerraForm Power Inc. Class A | | 1,149 | | 19 | |
| | | | | | 8,221 | |
Total Common Stocks
(Cost $563,119) | | | | 593,194 | |
Temporary Cash Investment (0.2%)1 | | | | | |
Money Market Fund (0.2%) | | | | | |
2,3 | | Vanguard Market Liquidity Fund, 2.249% (Cost $1,237) | | 12,368 | | 1,237 | |
Total Investments (100.0%)
(Cost $564,356) | | | | 594,431 | |
23
ESG U.S. Stock ETF
| | Amount | |
| | ($000 | ) |
Other Assets and Liabilities (0.0%) | | | |
Other Assets | | | |
Investment in Vanguard | | 27 | |
Receivables for Accrued Income | | 714 | |
Receivables for Capital Shares Issued | | 86 | |
Other Assets4 | | 115 | |
Total Other Assets | | 942 | |
Liabilities | | | |
Payables for Investment Securities Purchased | | (7 | ) |
Collateral for Securities on Loan | | (798 | ) |
Payables to Vanguard | | (33 | ) |
Variation Margin Payable—Futures Contracts | | (1 | ) |
Total Liabilities | | (839 | ) |
Net Assets (100%) | | | |
Applicable to 11,600,000 outstanding $.001 par value shares of beneficial interest
(unlimited authorization) | | 594,534 | |
Net Asset Value Per Share | | $51.25 | |
At August 31, 2019, net assets consisted of:
| | Amount | |
| | ($000 | ) |
Paid-in Capital | | 564,704 | |
Total Distributable Earnings (Loss) | | 29,830 | |
Net Assets | | 594,534 | |
· See Note A in Notes to Financial Statements.
* Non-income-producing security.
^ Includes partial security positions on loan to broker-dealers. The total value of securities on loan is $790,000.
1 The fund invests a portion of its cash reserves in equity markets through the use of index futures contracts. After giving effect to futures investments, the fund’s effective common stock and temporary cash investment positions represent 100.0% and 0.0%, respectively, of net assets.
2 Affiliated money market fund available only to Vanguard funds and certain trusts and accounts managed by Vanguard. Rate shown is the 7-day yield.
3 Includes $798,000 of collateral received for securities on loan.
4 Cash of $44,000 has been segregated as initial margin for open futures contracts.
REIT—Real Estate Investment Trust.
Derivative Financial Instruments Outstanding as of Period End |
Futures Contracts |
| | | | | | | | ($000 | ) |
| | | | | | | | Value and | |
| | | | Number of | | | | Unrealized | |
| | | | Long (Short | ) | Notional | | Appreciation | |
| | Expiration | | Contracts | | Amount | | (Depreciation | ) |
Long Futures Contracts | | | | | | | | | |
E-mini S&P 500 Index | | September 2019 | | 7 | | 1,024 | | 10 | |
See accompanying Notes, which are an integral part of the Financial Statements.
24
ESG U.S. Stock ETF
Statement of Operations
| | September 18, 20181 to | |
| | August 31, 2019 | |
| | ($000 | ) |
Investment Income | | | |
Income | | | |
Dividends | | 4,542 | |
Interest2 | | 5 | |
Security Lending | | 2 | |
Total Income | | 4,549 | |
Expenses | | | |
The Vanguard Group—Note B | | | |
Investment Advisory Services | | 32 | |
Management and Administrative | | 220 | |
Marketing and Distribution | | 14 | |
Custodian Fees | | 28 | |
Auditing Fees | | 17 | |
Shareholders’ Reports | | 5 | |
Trustees’ Fees and Expenses | | — | |
Total Expenses | | 316 | |
Expenses Paid Indirectly | | (11 | ) |
Net Expenses | | 305 | |
Net Investment Income | | 4,244 | |
Realized Net Gain (Loss) | | | |
Investment Securities Sold2 | | (2,056 | ) |
Futures Contracts | | 5 | |
Realized Net Gain (Loss) | | (2,051 | ) |
Change in Unrealized Appreciation (Depreciation) | | | |
Investment Securities2 | | 30,075 | |
Futures Contracts | | 10 | |
Change in Unrealized Appreciation (Depreciation) | | 30,085 | |
Net Increase (Decrease) in Net Assets Resulting from Operations | | 32,278 | |
1 Inception.
2 Interest income, realized net gain (loss), and change in unrealized appreciation (depreciation) from an affiliated company of the fund were $5,000, $1,000, and ($1,000), respectively. Purchases and sales are for temporary cash investment purposes.
See accompanying Notes, which are an integral part of the Financial Statements.
25
ESG U.S. Stock ETF
Statement of Changes in Net Assets
| | September 18, 20181 to | |
| | August 31, 2019 | |
| | ($000 | ) |
Increase (Decrease) in Net Assets | | | |
Operations | | | |
Net Investment Income | | 4,244 | |
Realized Net Gain (Loss) | | (2,051 | ) |
Change in Unrealized Appreciation (Depreciation) | | 30,085 | |
Net Increase (Decrease) in Net Assets Resulting from Operations | | 32,278 | |
Distributions | | | |
Net Investment Income | | (2,448 | ) |
Realized Capital Gain | | — | |
Total Distributions | | (2,448 | ) |
Capital Share Transactions | | | |
Issued | | 564,704 | |
Issued in Lieu of Cash Distributions | | — | |
Redeemed | | — | |
Net Increase (Decrease) from Capital Share Transactions | | 564,704 | |
Total Increase (Decrease) | | 594,534 | |
Net Assets | | | |
Beginning of Period | | — | |
End of Period | | 594,534 | |
1 Inception.
See accompanying Notes, which are an integral part of the Financial Statements.
26
ESG U.S. Stock ETF
Financial Highlights
| | September 18, 20181 to | |
For a Share Outstanding Throughout the Period | | August 31, 2019 | |
Net Asset Value, Beginning of Period | | $50.00 | |
Investment Operations | | | |
Net Investment Income2 | | .792 | |
Net Realized and Unrealized Gain (Loss) on Investments | | .868 | |
Total from Investment Operations | | 1.660 | |
Distributions | | | |
Dividends from Net Investment Income | | (.410 | ) |
Distributions from Realized Capital Gains | | — | |
Total Distributions | | (.410 | ) |
Net Asset Value, End of Period | | $51.25 | |
| | | |
Total Return | | 3.40% | |
| | | |
Ratios/Supplemental Data | | | |
Net Assets, End of Period (Millions) | | $595 | |
Ratio of Total Expenses to Average Net Assets | | 0.12%3 | |
Ratio of Net Investment Income to Average Net Assets | | 1.67%3 | |
Portfolio Turnover Rate | | 6% | |
1 Inception.
2 Calculated based on average shares outstanding.
3 Annualized.
See accompanying Notes, which are an integral part of the Financial Statements.
27
ESG U.S. Stock ETF
Notes to Financial Statements
Vanguard ESG U.S.Stock ETF is registered under the Investment Company Act of 1940 as an open-end investment company, or mutual fund. ETF Shares are listed for trading on Cboe BZX Exchange; they can be purchased and sold through a broker.
A. The following significant accounting policies conform to generally accepted accounting principles for U.S. investment companies. The fund consistently follows such policies in preparing its financial statements.
1. Security Valuation: Securities are valued as of the close of trading on the New York Stock Exchange (generally 4 p.m., Eastern time) on the valuation date. Equity securities are valued at the latest quoted sales prices or official closing prices taken from the primary market in which each security trades; such securities not traded on the valuation date are valued at the mean of the latest quoted bid and asked prices. Securities for which market quotations are not readily available, or whose values have been materially affected by events occurring before the fund’s pricing time but after the close of the securities’ primary markets, are valued by methods deemed by the board of trustees to represent fair value. Investments in Vanguard Market Liquidity Fund are valued at that fund’s net asset value.
2. Futures Contracts: The fund uses index futures contracts to a limited extent, with the objectives of maintaining full exposure to the stock market, maintaining liquidity, and minimizing transaction costs. The fund may purchase futures contracts to immediately invest incoming cash in the market, or sell futures in response to cash outflows, thereby simulating a fully invested position in the underlying index while maintaining a cash balance for liquidity. The primary risks associated with the use of futures contracts are imperfect correlation between changes in market values of stocks held by the fund and the prices of futures contracts, and the possibility of an illiquid market. Counterparty risk involving futures is mitigated because a regulated clearinghouse is the counterparty instead of the clearing broker. To further mitigate counterparty risk, the fund trades futures contracts on an exchange, monitors the financial strength of its clearing brokers and clearinghouse, and has entered into clearing agreements with its clearing brokers. The clearinghouse imposes initial margin requirements to secure the fund’s performance and requires daily settlement of variation margin representing changes in the market value of each contract. Any assets pledged as initial margin for open contracts are noted in the Statement of Net Assets.
Futures contracts are valued at their quoted daily settlement prices. The notional amounts of the contracts are not recorded in the Statement of Net Assets. Fluctuations in the value of the contracts are recorded in the Statement of Net Assets as an asset (liability) and in the Statement of Operations as unrealized appreciation (depreciation) until the contracts are closed, when they are recorded as realized futures gains (losses).
During the period ended August 31, 2019, the fund’s average investments in long and short futures contracts represented less than 1% and 0% of net assets, respectively, based on the average of the notional amounts at each quarter-end during the period.
3. Federal Income Taxes: The fund intends to qualify as a regulated investment company and distribute all of its taxable income. Management has analyzed the fund’s tax positions taken for the period ended August 31, 2019, and has concluded that no provision for federal income tax is required in the fund’s financial statements.
4. Distributions: Distributions to shareholders are recorded on the ex-dividend date. Distributions are determined on a tax basis and may differ from net investment income and realized capital gains for financial reporting purposes.
28
ESG U.S. Stock ETF
5. Securities Lending: To earn additional income, the fund lends its securities to qualified institutional borrowers. Security loans are subject to termination by the fund at any time, and are required to be secured at all times by collateral in an amount at least equal to the market value of securities loaned. Daily market fluctuations could cause the value of loaned securities to be more or less than the value of the collateral received. When this occurs, the collateral is adjusted and settled before the opening of the market on the next business day. The fund further mitigates its counterparty risk by entering into securities lending transactions only with a diverse group of prequalified counter-parties, monitoring their financial strength, and entering into master securities lending agreements with its counterparties. The master securities lending agreements provide that, in the event of a counterparty’s default (including bankruptcy), the fund may terminate any loans with that borrower, determine the net amount owed, and sell or retain the collateral up to the net amount owed to the fund; however, such actions may be subject to legal proceedings. While collateral mitigates counterparty risk, in the event of a default, the fund may experience delays and costs in recovering the securities loaned. The fund invests cash collateral received in Vanguard Market Liquidity Fund, and records a liability in the Statement of Net Assets for the return of the collateral, during the period the securities are on loan. Securities lending income represents fees charged to borrowers plus income earned on invested cash collateral, less expenses associated with the loan. During the term of the loan, the fund is entitled to all distributions made on or in respect of the loaned securities.
6. Credit Facility: The fund and certain other funds managed by The Vanguard Group (“Vanguard”) participate in a $4.3 billion committed credit facility provided by a syndicate of lenders pursuant to a credit agreement that may be renewed annually; each fund is individually liable for its borrowings, if any, under the credit facility. Borrowings may be utilized for temporary and emergency purposes, and are subject to the fund’s regulatory and contractual borrowing restrictions. The participating funds are charged administrative fees and an annual commitment fee of 0.10% of the undrawn amount of the facility; these fees are allocated to the funds based on a method approved by the fund’s board of trustees and included in Management and Administrative expenses on the fund’s Statement of Operations. Any borrowings under this facility bear interest at a rate based upon the higher of the one-month London Interbank Offered Rate, federal funds effective rate, or overnight bank funding rate plus an agreed-upon spread.
The fund had no borrowings outstanding at August 31, 2019, or at any time during the period then ended.
7. Other: Dividend income is recorded on the ex-dividend date. Interest income includes income distributions received from Vanguard Market Liquidity Fund and is accrued daily. Security transactions are accounted for on the date securities are bought or sold. Costs used to determine realized gains (losses) on the sale of investment securities are those of the specific securities sold.
B. In accordance with the terms of a Funds’ Service Agreement (the “FSA”) between Vanguard and the fund, Vanguard furnishes to the fund investment advisory, corporate management, administrative, marketing, and distribution services at Vanguard’s cost of operations (as defined by the FSA). These costs of operations are allocated to the fund based on methods and guidelines approved by the board of trustees, and are generally settled twice a month.
Upon the request of Vanguard, the fund may invest up to 0.40% of its net assets as capital in Vanguard. At August 31, 2019, the fund had contributed to Vanguard capital in the amount of $27,000, representing less than 0.01% of the fund’s net assets and 0.01% of Vanguard’s capital received pursuant to the FSA. The fund’s trustees and officers are also directors and employees, respectively, of Vanguard.
29
ESG U.S. Stock ETF
C. The fund’s custodian bank has agreed to reduce its fees when the fund maintains cash on deposit in the non-interest-bearing custody account. For the period ended August 31, 2019, custodian fee offset arrangements reduced the fund’s expenses by $11,000 (an annual rate of 0.00% of average net assets).
D. Various inputs may be used to determine the value of the fund’s investments. These inputs are summarized in three broad levels for financial statement purposes. The inputs or methodologies used to value securities are not necessarily an indication of the risk associated with investing in those securities.
Level 1—Quoted prices in active markets for identical securities.
Level 2—Other significant observable inputs (including quoted prices for similar securities, interest rates, prepayment speeds, credit risk, etc.).
Level 3—Significant unobservable inputs (including the fund’s own assumptions used to determine the fair value of investments). Any investments valued with significant unobservable inputs are noted on the Statement of Net Assets.
At August 31, 2019, 100% of the market value of the fund’s investments and derivatives was determined based on Level 1 inputs.
E. Permanent differences between book-basis and tax-basis components of net assets are reclassified among capital accounts in the financial statements to reflect their tax character. These reclassifications have no effect on net assets or net asset value per share. As of period end, permanent differences primarily attributable to the accounting for passive foreign investment companies were reclassified between the individual components of total distributable earnings (loss).
| | Amount | |
| | ($000 | ) |
Paid-in Capital | | — | |
Total Distributable Earnings (Loss) | | — | |
Temporary differences between book-basis and tax-basis components of total distributable earnings (loss) arise when certain items of income, gain, or loss are recognized in different periods for financial statement and tax purposes; these differences will reverse at some time in the future. The differences are primarily related to the tax deferral on wash sales, the realization of unrealized gains or losses on certain futures contracts, and unrealized gains on passive foreign investment companies. As of period end, the tax-basis components of total distributable earnings (loss) are detailed in the table as follows:
| | Amount | |
| | ($000 | ) |
Undistributed Ordinary Income | | 1,796 | |
Undistributed Long-Term Gains | | — | |
Capital Loss Carryforwards (Non-expiring) | | (2,040 | ) |
Net Unrealized Gains (Losses) | | 30,075 | |
30
ESG U.S. Stock ETF
As of August 31, 2019, gross unrealized appreciation and depreciation for investments and derivatives based on cost for U.S. federal income tax purposes were as follows:
| | Amount | |
| | ($000 | ) |
Tax Cost | | 564,356 | |
Gross Unrealized Appreciation | | 50,266 | |
Gross Unrealized Depreciation | | (20,191 | ) |
Net Unrealized Appreciation (Depreciation) | | 30,075 | |
F. During the period ended August 31, 2019, the fund purchased $583,391,000 of investment securities and sold $18,201,000 of investment securities, other than temporary cash investments. Purchases and sales include $248,268,000 and $0, respectively, in connection with in-kind purchases and redemptions of the fund’s capital shares.
G. Capital shares issued and redeemed were:
| | September 18, 20181 to | |
| | August 31, 2019 | |
| | Shares | |
| | (000 | ) |
Issued | | 11,600 | |
Issued in Lieu of Cash Distributions | | — | |
Redeemed | | — | |
Net Increase (Decrease) in Shares Outstanding | | 11,600 | |
1 Inception.
At August 31, 2019, one shareholder was the record or beneficial owner of 39% of the fund’s net assets. If this shareholder were to redeem its investment in the fund, the redemption might result in an increase in the fund’s expense ratio, cause the fund to incur higher transaction costs, or lead to the realization of taxable capital gains.
H. Management has determined that no events or transactions occurred subsequent to August 31, 2019, that would require recognition or disclosure in these financial statements.
31
Report of Independent Registered Public Accounting Firm
To the Board of Trustees of Vanguard World Fund and Shareholders of Vanguard ESG U.S. Stock ETF
Opinion on the Financial Statements
We have audited the accompanying statement of net assets of Vanguard ESG U.S. Stock ETF (one of the funds constituting Vanguard World Fund, referred to hereafter as the “Fund”) as of August 31, 2019, and the related statements of operations and changes in net assets, including the related notes, and the financial highlights for the period September 18, 2018 (inception) through August 31, 2019 (collectively referred to as the “financial statements”). In our opinion, the financial statements present fairly, in all material respects, the financial position of the Fund as of August 31, 2019, and the results of its operations, changes in its net assets, and the financial highlights for the period September 18, 2018 (inception) through August 31, 2019 in conformity with accounting principles generally accepted in the United States of America.
Basis for Opinion
These financial statements are the responsibility of the Fund’s management. Our responsibility is to express an opinion on the Fund’s financial statements based on our audit. We are a public accounting firm registered with the Public Company Accounting Oversight Board (United States) (“PCAOB”) and are required to be independent with respect to the Fund in accordance with the U.S. federal securities laws and the applicable rules and regulations of the Securities and Exchange Commission and the PCAOB.
We conducted our audit of these financial statements in accordance with the standards of the PCAOB. Those standards require that we plan and perform the audit to obtain reasonable assurance about whether the financial statements are free of material misstatement, whether due to error or fraud.
Our audit included performing procedures to assess the risks of material misstatement of the financial statements, whether due to error or fraud, and performing procedures that respond to those risks. Such procedures included examining, on a test basis, evidence regarding the amounts and disclosures in the financial statements. Our audit also included evaluating the accounting principles used and significant estimates made by management, as well as evaluating the overall presentation of the financial statements. Our procedures included confirmation of securities owned as of August 31, 2019 by correspondence with the custodian and brokers and by agreement to the underlying ownership records of the transfer agent; when replies were not received from brokers, we performed other auditing procedures. We believe that our audit provides a reasonable basis for our opinion.
/s/PricewaterhouseCoopers LLP
Philadelphia, Pennsylvania
October 24, 2019
We have served as the auditor of one or more investment companies in The Vanguard Group of Funds since 1975.
32
Special 2019 tax information (unaudited) for Vanguard ESG U.S. Stock ETF
This information for the period ended August 31, 2019, is included pursuant to provisions of the Internal Revenue Code.
The fund distributed $2,377,000 of qualified dividend income to shareholders during the period.
For corporate shareholders, 92.2% of investment income (dividend income plus short-term gains, if any) qualifies for the dividends-received deduction.
33
Trustees Approve Advisory Arrangement
The board of trustees of Vanguard ESG U.S. Stock ETF has renewed the fund’s investment advisory arrangement with The Vanguard Group, Inc. (Vanguard), through its Equity Index Group. The board determined that continuing the fund’s internalized management structure was in the best interests of the fund and its shareholders.
The board based its decision upon an evaluation of the advisor’s investment staff, portfolio management process, and performance. This evaluation included information provided to the board by Vanguard’s Portfolio Review Department, which is responsible for fund and advisor oversight and product management. The Portfolio Review Department met regularly with the advisor and made monthly presentations to the board during the fiscal year that directed the board’s focus to relevant information and topics.
The board, or an investment committee made up of board members, also received information throughout the year during advisor presentations. For each advisor presentation, the board was provided with letters and reports that included information about, among other things, the advisory firm and the advisor’s assessment of the investment environment, portfolio performance, and portfolio characteristics.
In addition, the board received monthly reports, which included a Market and Economic Report, a Fund Dashboard Monthly Summary, and a Fund Performance Report.
Prior to their meeting, the trustees were provided with a memo and materials that summarized the information they received over the course of the year. They also considered the factors discussed below, among others. However, no single factor determined whether the board approved the arrangements. Rather, it was the totality of the circumstances that drove the board’s decision.
Nature, extent, and quality of services
The board considered the quality of the investment management services provided to the fund since its inception in 2018 and took into account the organizational depth and stability of the advisor. The board considered that Vanguard has been managing investments for more than four decades. The Equity Index Group adheres to a sound, disciplined investment management process; the team has considerable experience, stability, and depth.
The board concluded that Vanguard’s experience, stability, depth, and performance, among other factors, warranted continuation of the advisory arrangement.
Investment performance
The board considered the fund’s performance since its inception, including any periods of outperformance or underperformance compared with its target index and peer group. The board concluded that the performance was such that the advisory arrangement should continue.
Cost
The board concluded that, while the fund had not yet been in existence for a full fiscal year, the fund’s estimated expense ratio was well below the average expense ratio charged by funds in its peer group and that the fund’s estimated advisory expenses were also well below the peer-group average.
34
The board does not conduct a profitability analysis of Vanguard because of Vanguard’s unique structure. Unlike most other mutual fund management companies, Vanguard is owned by the funds it oversees.
The benefit of economies of scale
The board concluded that the fund’s arrangement with Vanguard ensures that the fund will realize economies of scale as it grows, with the cost to shareholders declining as fund assets increase.
The board will consider whether to renew the advisory arrangement again after a one-year period.
35
London Stock Exchange Group companies include FTSE International Limited (“FTSE”), Frank Russell Company (“Russell”), MTS Next Limited (“MTS”), and FTSE TMX Global Debt Capital Markets Inc. (“FTSE TMX”). All rights reserved. “FTSE®”, “Russell®”, “ MTS®”,” FTSE TMX®” and “FTSE Russell” and other service marks and trademarks related to the FTSE or Russell indexes are trademarks of the London Stock Exchange Group companies and are used by FTSE, MTS, FTSE TMX and Russell under license. All information is provided for information purposes only. Every effort is made to ensure that all information given in this publication is accurate, but no responsibility or liability can be accepted by the London Stock Exchange Group companies nor its licensors for any errors or for any loss from use of this publication. Neither the London Stock Exchange Group companies nor any of their licensors make any claim, prediction, warranty or representation whatsoever, expressly or impliedly, either as to the results to be obtained from the use of the Indices or the fitness or suitability of the Indices for any particular purpose to which they might be put. The London Stock Exchange Group companies do not provide investment advice and nothing in this document should be taken as constituting financial or investment advice. The London Stock Exchange Group companies make no representation regarding the advisability of investing in any asset. A decision to invest in any such asset should not be made in reliance on any information herein. Indexes cannot be invested in directly. Inclusion of an asset in an index is not a recommendation to buy, sell or hold that asset. The general information contained in this publication should not be acted upon without obtaining specific legal, tax, and investment advice from a licensed professional. No part of this information may be reproduced, stored in a retrieval system or transmitted in any form or by any means, electronic, mechanical, photocopying, recording or otherwise, without prior written permission of the London Stock Exchange Group companies. Distribution of the London Stock Exchange Group companies’ index values and the use of their indexes to create financial products require a license with FTSE, FTSE TMX, MTS and/or Russell and/or its licensors.
36
This page intentionally left blank.
This page intentionally left blank.
The People Who Govern Your Fund
The trustees of your mutual fund are there to see that the fund is operated and managed in your best interests since, as a shareholder, you are a part owner of the fund. Your fund’s trustees also serve on the board of directors of The Vanguard Group, Inc., which is owned by the Vanguard funds and provides services to them.
A majority of Vanguard’s board members are independent, meaning that they have no affiliation with Vanguard or the funds they oversee, apart from the sizable personal investments they have made as private individuals. The independent board members have distinguished backgrounds in business, academia, and public service. Each of the trustees and executive officers oversees 212 Vanguard funds.
Information for each trustee and executive officer of the fund appears below. The mailing address of the trustees and officers is P.O. Box 876, Valley Forge, PA 19482. More information about the trustees is in the Statement of Additional Information, which can be obtained, without charge, by contacting Vanguard at 800-662-7447, or online at vanguard.com.
Interested Trustee1
Mortimer J. Buckley
Born in 1969. Trustee since January 2018. Principal occupation(s) during the past five years and other experience: chairman of the board (January 2019–present) of Vanguard and of each of the investment companies served by Vanguard; chief executive officer (January 2018–present) of Vanguard; chief executive officer, president, and trustee (January 2018–present) of each of the investment companies served by Vanguard; president and director (2017–present) of Vanguard; and president (February 2018–present) of Vanguard Marketing Corporation. Chief investment officer (2013–2017), managing director (2002–2017), head of the Retail Investor Group (2006–2012), and chief information officer (2001–2006) of Vanguard. Chairman of the board (2011–2017) and trustee (2009–2017) of the Children’s Hospital of Philadelphia; trustee (2018–present) of The Shipley School.
Independent Trustees
Emerson U. Fullwood
Born in 1948. Trustee since January 2008. Principal occupation(s) during the past five years and other experience: executive chief staff and marketing officer for North America and corporate vice president (retired 2008) of Xerox Corporation (document management products and services). Former president of the Worldwide Channels Group, Latin America, and Worldwide Customer Service and executive chief staff officer of Developing Markets of Xerox. Executive in residence and 2009–2010 Distinguished Minett Professor at the Rochester Institute of Technology. Director of SPX FLOW, Inc. (multi-industry manufac-turing). Director of the University of Rochester Medical Center, the Monroe Community College Foundation, the United Way of Rochester, North Carolina A&T University, and Roberts Wesleyan College. Trustee of the University of Rochester.
Amy Gutmann
Born in 1949. Trustee since June 2006. Principal occupation(s) during the past five years and other experience: president (2004–present) of the University of Pennsylvania. Christopher H. Browne Distinguished Professor of Political Science, School of Arts and Sciences, and professor of communication, Annenberg School for Communication, with secondary faculty appointments in the Department of Philosophy, School of Arts and Sciences, and at the Graduate School of Education, University of Pennsylvania. Trustee of the National Constitution Center.
F. Joseph Loughrey
Born in 1949. Trustee since October 2009. Principal occupation(s) during the past five years and other experience: president and chief operating officer (retired 2009) and vice chairman of the board (2008–2009) of Cummins Inc. (industrial machinery). Chairman of the board of Hillenbrand, Inc. (specialized consumer services), and the Lumina Foundation.
1 Mr. Buckley is considered an “interested person,” as defined in the Investment Company Act of 1940, because he is an officer of the Vanguard funds.
Director of the V Foundation and Oxfam America. Member of the advisory council for the College of Arts and Letters and chair of the advisory board to the Kellogg Institute for International Studies, both at the University of Notre Dame.
Mark Loughridge
Born in 1953. Trustee since March 2012. Principal occupation(s) during the past five years and other experience: senior vice president and chief financial officer (retired 2013) of IBM (information technology services). Fiduciary member of IBM’s Retirement Plan Committee (2004–2013), senior vice president and general manager (2002–2004) of IBM Global Financing, vice president and controller (1998–2002) of IBM, and a variety of other prior management roles at IBM. Member of the Council on Chicago Booth.
Scott C. Malpass
Born in 1962. Trustee since March 2012. Principal occupation(s) during the past five years and other experience: chief investment officer (1989–present) and vice president (1996–present) of the University of Notre Dame. Assistant professor of finance at the Mendoza College of Business, University of Notre Dame, and member of the Notre Dame 403(b) Investment Committee. Chairman of the board of TIFF Advisory Services, Inc. Member of the board of Catholic Investment Services, Inc. (investment advisors) and the board of superintendence of the Institute for the Works of Religion.
Deanna Mulligan
Born in 1963. Trustee since January 2018. Principal occupation(s) during the past five years and other experience: president (2010–present) and chief executive officer (2011–present) of The Guardian Life Insurance Company of America. Chief operating officer (2010–2011) and executive vice president (2008–2010) of Individual Life and Disability of The Guardian Life Insurance Company of America. Member of the board of The Guardian Life Insurance Company of America, the American Council of Life Insurers, the Partnership for New York City (business leadership), and the Committee Encouraging Corporate Philanthropy. Trustee of the Economic Club of New York and the Bruce Museum (arts and science). Member of the Advisory Council for the Stanford Graduate School of Business.
André F. Perold
Born in 1952. Trustee since December 2004. Principal occupation(s) during the past five years and other experience: George Gund Professor of Finance and Banking, Emeritus at the Harvard Business School (retired 2011). Chief investment officer and co-managing partner of HighVista Strategies LLC (private investment firm). Board of advisors and investment committee member of the Museum of Fine Arts Boston. Board member (2018–present) of RIT Capital Partners (investment firm); investment committee member of Partners Health Care System.
Sarah Bloom Raskin
Born in 1961. Trustee since January 2018. Principal occupation(s) during the past five years and other experience: deputy secretary (2014–2017) of the United States Department of the Treasury. Governor (2010–2014) of the Federal Reserve Board. Commissioner (2007–2010) of financial regulation for the State of Maryland. Member of the board of directors (2012–2014) of Neighborhood Reinvestment Corporation. Director (2017–present) of i(x) Investments, LLC; director (2017–present) of Reserve Trust. Rubinstein Fellow (2017–present) of Duke University; trustee (2017–present) of Amherst College.
Peter F. Volanakis
Born in 1955. Trustee since July 2009. Principal occupation(s) during the past five years and other experience: president and chief operating officer (retired 2010) of Corning Incorporated (communications equipment) and director of Corning Incorporated (2000–2010) and Dow Corning (2001–2010). Director (2012) of SPX Corporation (multi-industry manufacturing). Overseer of the Amos Tuck School of Business Administration, Dartmouth College (2001–2013). Chairman of the board of trustees of Colby-Sawyer College. Member of the board of Hypertherm Inc. (industrial cutting systems, software, and consumables).
Executive Officers
Glenn Booraem
Born in 1967. Principal occupation(s) during the past five years and other experience: principal of Vanguard. Investment stewardship officer (2017–present), treasurer (2015–2017), controller (2010–2015), and assistant controller (2001–2010) of each of the investment companies served by Vanguard.
Christine M. Buchanan
Born in 1970. Principal occupation(s) during the past five years and other experience: principal of Vanguard and global head of Fund Administration at Vanguard. Treasurer (2017–present) of each of the investment companies served by Vanguard. Partner (2005–2017) at KPMG LLP (audit, tax, and advisory services).
Thomas J. Higgins
Born in 1957. Principal occupation(s) during the past five years and other experience: principal of Vanguard. Chief financial officer (2008–present) and treasurer (1998–2008) of each of the investment companies served by Vanguard.
Peter Mahoney
Born in 1974. Principal occupation(s) during the past five years and other experience: principal of Vanguard. Controller (2015–present) of each of the investment companies served by Vanguard. Head of International Fund Services (2008–2014) at Vanguard.
Anne E. Robinson
Born in 1970. Principal occupation(s) during the past five years and other experience: general counsel (2016–present) of Vanguard. Secretary (2016–present) of Vanguard and of each of the investment companies served by Vanguard. Managing director (2016–present) of Vanguard. Director and senior vice president (2016–2018) of Vanguard Marketing Corporation. Managing director and general counsel of Global Cards and Consumer Services (2014–2016) at Citigroup. Counsel (2003–2014) at American Express.
Michael Rollings
Born in 1963. Principal occupation(s) during the past five years and other experience: finance director (2017–present) and treasurer (2017) of each of the investment companies served by Vanguard. Managing director (2016–present) of Vanguard. Chief financial officer (2016–present) of Vanguard. Director (2016–present) of Vanguard Marketing Corporation. Executive vice president and chief financial officer (2006–2016) of MassMutual Financial Group.
John E. Schadl
Born in 1972. Principal occupation(s) during the past five years and other experience: principal of Vanguard. Chief compliance officer (2019–present) of Vanguard and of each of the investment companies served by Vanguard. Assistant vice president (May 2019–present) of Vanguard Marketing Corporation.
Vanguard Senior Management Team
Joseph Brennan | Chris D. McIsaac |
Mortimer J. Buckley | James M. Norris |
Gregory Davis | Thomas M. Rampulla |
John James | Karin A. Risi |
Martha G. King | Anne E. Robinson |
John T. Marcante | Michael Rollings |
| 
|
| |
| P.O. Box 2600 |
| Valley Forge, PA 19482-2600 |
Connect with Vanguard® > vanguard.com
Fund Information > 800-662-7447
Direct Investor Account Services > 800-662-2739
Institutional Investor Services > 800-523-1036
Text Telephone for People
Who Are Deaf or Hard of Hearing > 800-749-7273
This material may be used in conjunction with the offering of shares of any Vanguard fund only if preceded or accompanied by the fund’s current prospectus.
All comparative mutual fund data are from Morningstar, Inc., unless otherwise noted.
You can obtain a free copy of Vanguard’s proxy voting guidelines by visiting vanguard.com/proxyreporting or by calling Vanguard at 800-662-2739. The guidelines are also available from the SEC’s website, www.sec.gov. In addition, you may obtain a free report on how your fund voted the proxies for securities it owned during the 12 months ended June 30. To get the report, visit either vanguard.com/proxyreporting or www.sec.gov.
You can review information about your fund on the SEC’s website, and you can receive copies of this information, for a fee, by sending a request via email addressed to publicinfo@sec.gov.
Source for Bloomberg Barclays indexes: Bloomberg Index Services Limited. Copyright 2019, Bloomberg. All rights reserved.
| © 2019 The Vanguard Group, Inc. |
| All rights reserved. |
| Vanguard Marketing Corporation, Distributor. |
| |
| Q43930 102019 |

Annual Report | August 31, 2019 Vanguard ESG International Stock ETF |
See the inside front cover for important information about access to your fund’s annual and semiannual shareholder reports. |
Important information about access to shareholder reports
Beginning on January 1, 2021, as permitted by regulations adopted by the Securities and Exchange Commission, paper copies of your fund’s annual and semiannual shareholder reports will no longer be sent to you by mail, unless you specifically request them. Instead, you will be notified by mail each time a report is posted on the website and will be provided with a link to access the report.
If you have already elected to receive shareholder reports electronically, you will not be affected by this change and do not need to take any action. You may elect to receive shareholder reports and other communications from the fund electronically by contacting your financial intermediary (such as a broker-dealer or bank) or, if you invest directly with the fund, by calling Vanguard at one of the phone numbers on the back cover of this report or by logging on to vanguard.com.
You may elect to receive paper copies of all future shareholder reports free of charge. If you invest through a financial intermediary, you can contact the intermediary to request that you continue to receive paper copies. If you invest directly with the fund, you can call Vanguard at one of the phone numbers on the back cover of this report or log on to vanguard.com. Your election to receive paper copies will apply to all the funds you hold through an intermediary or directly with Vanguard.
Contents | |
| |
A Note From Our Chairman | 1 |
Your Fund’s Performance at a Glance | 2 |
About Your Fund’s Expenses | 3 |
Performance Summary | 5 |
Financial Statements | 7 |
Trustees Approve Advisory Arrangement | 64 |
Please note: The opinions expressed in this report are just that—informed opinions. They should not be considered promises or advice. Also, please keep in mind that the information and opinions cover the period through the date on the front of this report. Of course, the risks of investing in your fund are spelled out in the prospectus.
A Note From Our Chairman

Tim Buckley
Chairman and Chief Executive Officer
Dear Shareholder,
Recent volatility in financial markets—affecting stocks, bonds, and commodities—has been a good reminder of the wise old adage, “Never keep all your eggs in one basket.” Maintaining balance and diversification in your investment portfolio can help to both limit risk and set you up for long-term success.
It’s understandable why some investors might become complacent after a long market run-up like the one that lifted stock prices, especially U.S. stock prices, in the years following the global financial crisis. But failing to rebalance regularly can leave a portfolio with a much different mix of assets than intended and, often, more risk than intended.
Balance across and diversification within asset classes are powerful tools for managing risk and achieving your investment goals. A portfolio’s allocation will determine a large portion of its long-term return and also the majority of its volatility risk. A well-diversified portfolio is less vulnerable to significant swings in the performance of any one segment of the asset classes in which it invests.
Balance and diversification will never eliminate the risk of loss, nor will they guarantee positive returns in a declining market. But they should reduce the chance that you’ll suffer disproportionate losses in one particular high-flying asset class or sector when it comes back to earth. And exposure to all key market components should give you at least some participation in the sectors that are performing best at any given time.
Vanguard is committed to helping you achieve balance and diversification in your portfolios to help meet your investment goals. We thank you for your continued loyalty.
Sincerely,

Mortimer J. Buckley
Chairman and Chief Executive Officer
October 1, 2019
1
Your Fund’s Performance at a Glance
· From its inception on September 18, 2018, to August 31, 2019, Vanguard ESG International Stock ETF returned –2.36%, roughly in line with the –2.19% return of its benchmark.
· The ETF’s investment objective is to closely track the performance of its market-cap-weighted benchmark index. The index is composed of large-, mid-, and small-capitalization stocks in developed and emerging markets excluding the United States that are screened for certain environmental, social, and corporate governance criteria by the index sponsor, which is independent of Vanguard.
· International stocks were buffeted by signs of decelerating growth, flare-ups in trade disputes, heightened international tensions with Iran, and uncertainty regarding Brexit. Positive returns from utilities and consumer services were unable to offset declines in basic materials and industrials. Results from Canada and emerging markets were positive, while Europe and the Pacific finished in the red.
· In June 2019, an issue in the screening methodology used by the fund’s benchmark provider, FTSE Russell, resulted in the erroneous inclusion of securities in the benchmark followed by the fund. FTSE resolved the issue and subsequently updated the benchmark. Vanguard promptly took action to sell the stocks and align the fund’s holdings with the corrected data. The fund held the stocks between June 21, 2019, and August 5, 2019. The issue and subsequent correction did not have a material impact on the fund’s performance.
Market Barometer | | | | | | | |
| | Average Annual Total Returns | |
| | Periods Ended August 31, 2019 | |
| | One Year | | Three Years | | Five Years | |
Stocks | | | | | | | |
Russell 1000 Index (Large-caps) | | 2.49% | | 12.57% | | 9.85% | |
Russell 2000 Index (Small-caps) | | -12.89 | | 7.89 | | 6.41 | |
Russell 3000 Index (Broad U.S. market) | | 1.31 | | 12.24 | | 9.60 | |
FTSE All-World ex US Index (International) | | -3.18 | | 5.97 | | 1.71 | |
| | | | | | | |
Bonds | | | | | | | |
Bloomberg Barclays U.S. Aggregate Bond Index | | | | | | | |
(Broad taxable market) | | 10.17% | | 3.09% | | 3.35% | |
Bloomberg Barclays Municipal Bond Index | | | | | | | |
(Broad tax-exempt market) | | 8.72 | | 3.30 | | 3.85 | |
FTSE Three-Month U.S. Treasury Bill Index | | 2.36 | | 1.47 | | 0.91 | |
| | | | | | | |
CPI | | | | | | | |
Consumer Price Index | | 1.75% | | 2.13% | | 1.53% | |
2
About Your Fund’s Expenses
As a shareholder of the fund, you incur ongoing costs, which include costs for portfolio management, administrative services, and shareholder reports (like this one), among others. Operating expenses, which are deducted from a fund’s gross income, directly reduce the investment return of the fund.
A fund’s expenses are expressed as a percentage of its average net assets. This figure is known as the expense ratio. The following examples are intended to help you understand the ongoing costs (in dollars) of investing in your fund and to compare these costs with those of other mutual funds. The examples are based on an investment of $1,000 made at the beginning of the period shown and held for the entire period.
The accompanying table illustrates your fund’s costs in two ways:
· Based on actual fund return. This section helps you to estimate the actual expenses that you paid over the period. The “Ending Account Value” shown is derived from the fund’s actual return, and the third column shows the dollar amount that would have been paid by an investor who started with $1,000 in the fund. You may use the information here, together with the amount you invested, to estimate the expenses that you paid over the period.
To do so, simply divide your account value by $1,000 (for example, an $8,600 account value divided by $1,000 = 8.6), then multiply the result by the number given for your fund under the heading “Expenses Paid During Period.”
· Based on hypothetical 5% yearly return. This section is intended to help you compare your fund’s costs with those of other mutual funds. It assumes that the fund had a yearly return of 5% before expenses, but that the expense ratio is unchanged. In this case—because the return used is not the fund’s actual return—the results do not apply to your investment. The example is useful in making comparisons because the Securities and Exchange Commission requires all mutual funds to calculate expenses based on a 5% return. You can assess your fund’s costs by comparing this hypothetical example with the hypothetical examples that appear in shareholder reports of other funds.
Note that the expenses shown in the table are meant to highlight and help you compare ongoing costs only and do not reflect transaction costs incurred by the fund for buying and selling securities. Further, the expenses do not include any purchase, redemption, or account service fees described in the fund prospectus. If such fees were applied to your account, your costs would be higher. Your fund does not carry a “sales load.”
The calculations assume no shares were bought or sold during the period. Your actual costs may have been higher or lower, depending on the amount of your investment and the timing of any purchases or redemptions.
You can find more information about the fund’s expenses, including annual expense ratios, in the Financial Statements section of this report. For additional information on operating expenses and other shareholder costs, please refer to your fund’s current prospectus.
3
Six Months Ended August 31, 2019 | | | | | | | |
| | Beginning | | Ending | | Expenses | |
| | Account Value | | Account Value | | Paid During | |
ESG International Stock ETF | | 2/28/2019 | | 8/31/2019 | | Period | |
Based on Actual Fund Return | | $1,000.00 | | $999.56 | | $0.81 | |
Based on Hypothetical 5% Yearly Return | | 1,000.00 | | 1,024.40 | | 0.82 | |
The calculations are based on expenses incurred in the most recent six-month period. The fund’s annualized six-month expense ratio for that period is 0.16%. The dollar amounts shown as “Expenses Paid” are equal to the annualized expense ratio multiplied by the average account value over the period, multiplied by the number of days in that period, then divided by the number of days in the most recent 12-month period (184/365).
4
ESG International Stock ETF
Performance Summary
All of the returns in this report represent past performance, which is not a guarantee of future results that may be achieved by the fund. (Current performance may be lower or higher than the performance data cited. For performance data current to the most recent month-end, visit our website at vanguard.com/performance.) Note, too, that both investment returns and principal value can fluctuate widely, so an investor’s shares, when sold, could be worth more or less than their original cost. The returns shown do not reflect taxes that a shareholder would pay on fund distributions or on the sale of fund shares.
Cumulative Performance: September 18, 2018, Through August 31, 2019
Initial Investment of $10,000
| | | | Total Returns | | | | |
| | | | Period Ended August 31, 2019 | | | | |
| | | | | | Since | | | | Final Value |
| | | | | | Inception | | | | of a $10,000 |
| | | | | | (9/18/2018) | | | | Investment |

| | ESG International Stock ETF Net Asset Value | | | | -2.36% | | | | $9,764 |
| | ESG International Stock ETF Market Price | | | | -1.99 | | | | 9,801 |

| | FTSE Global All Cap ex US Choice Index | | | | -2.19 | | | | 9,781 |

| | FTSE Global All Cap ex US Index | | | | -2.84 | | | | 9,716 |
“Since Inception” performance is calculated from the ETF Shares’ inception date for both the fund and its comparative standards.
See Financial Highlights for dividend and capital gains information.
5
ESG International Stock ETF
Sector Diversification
As of August 31, 2019
Basic Materials | 5.3% |
Consumer Goods | 15.1 |
Consumer Services | 10.3 |
Financials | 28.7 |
Health Care | 9.4 |
Industrials | 12.2 |
Oil & Gas | 1.8 |
Technology | 10.9 |
Telecommunications | 4.4 |
Utilities | 1.9 |
The table reflects the fund’s equity exposure, based on its investments in stocks and stock index futures. Any holdings in short-term reserves are excluded. Sector categories are based on the Industry Classification Benchmark (“ICB”), except for the “Other” category (if applicable), which includes securities that have not been provided an ICB classification as of the effective reporting period.
The Industry Classification Benchmark (“ICB”) is owned by FTSE. FTSE does not accept any liability to any person for any loss or damage arising out of any error or omission in the ICB.
6
ESG International Stock ETF
Financial Statements
Statement of Net Assets
As of August 31, 2019
The fund files its complete schedule of portfolio holdings with the Securities and Exchange Commission (SEC) for the first and third quarters of each fiscal year as an exhibit to its reports on Form N-PORT. The fund’s Form N-PORT reports are available on the SEC’s website at www.sec.gov.
| | | | | | Market | |
| | | | | | Value· | |
| | | | Shares | | ($000 | ) |
Common Stocks (99.6%)1 | | | | | |
Australia (5.1%) | | | | | |
| | Commonwealth Bank of Australia | | 43,031 | | 2,289 | |
| | CSL Ltd. | | 11,466 | | 1,857 | |
| | Westpac Banking Corp. | | 84,363 | | 1,601 | |
| | Australia & New Zealand Banking Group Ltd. | | 69,530 | | 1,251 | |
| | National Australia Bank Ltd. | | 67,571 | | 1,245 | |
| | Transurban Group | | 64,388 | | 648 | |
| | Macquarie Group Ltd. | | 7,512 | | 626 | |
| | Newcrest Mining Ltd. | | 21,791 | | 545 | |
| | Goodman Group | | 48,258 | | 471 | |
| | Amcor plc | | 39,717 | | 387 | |
| | ASX Ltd. | | 6,416 | | 373 | |
| | Scentre Group | | 136,368 | | 371 | |
| | Insurance Australia Group Ltd. | | 63,627 | | 345 | |
| | Suncorp Group Ltd. | | 35,355 | | 328 | |
| | Brambles Ltd. | | 43,155 | | 328 | |
| | QBE Insurance Group Ltd. | | 37,836 | | 319 | |
| | Dexus | | 33,016 | | 287 | |
| | Telstra Corp. Ltd. | | 112,485 | | 282 | |
| | Sonic Healthcare Ltd. | | 14,014 | | 277 | |
| | GPT Group | | 62,685 | | 270 | |
| | APA Group | | 35,116 | | 260 | |
| | Cochlear Ltd. | | 1,757 | | 257 | |
| | Fortescue Metals Group Ltd. | | 45,425 | | 245 | |
| | Orica Ltd. | | 15,389 | | 223 | |
| | James Hardie Industries plc | | 14,664 | | 222 | |
| | Medibank Pvt Ltd. | | 89,696 | | 220 | |
| | Sydney Airport | | 36,588 | | 207 | |
| | Lendlease Group | | 17,852 | | 205 | |
| | SEEK Ltd. | | 14,100 | | 193 | |
| | Vicinity Centres | | 110,193 | | 192 | |
| | Ramsay Health Care Ltd. | | 4,060 | | 179 | |
| | Alumina Ltd. | | 117,052 | | 171 | |
| | Northern Star Resources Ltd. | | 20,740 | | 167 | |
| | Bendigo & Adelaide Bank Ltd. | | 21,824 | | 164 | |
| | Computershare Ltd. | | 15,692 | | 163 | |
| | BlueScope Steel Ltd. | | 18,890 | | 159 | |
| | Incitec Pivot Ltd. | | 69,874 | | 151 | |
| | Caltex Australia Ltd. | | 9,214 | | 149 | |
| | Downer EDI Ltd. | | 28,271 | | 147 | |
| | Orora Ltd. | | 69,391 | | 130 | |
| | Bank of Queensland Ltd. | | 20,411 | | 126 | |
* | | Afterpay Touch Group Ltd. | | 5,940 | | 124 | |
| | Mirvac Group | | 57,543 | | 124 | |
| | AMP Ltd. | | 107,327 | | 122 | |
| | Boral Ltd. | | 41,255 | | 118 | |
| | Stockland | | 36,209 | | 110 | |
| | Challenger Ltd. | | 17,749 | | 80 | |
| | Magellan Financial Group Ltd. | | 1,961 | | 67 | |
| | Charter Hall Group | | 7,728 | | 66 | |
| | nib holdings Ltd. | | 11,992 | | 60 | |
| | Evolution Mining Ltd. | | 16,857 | | 59 | |
* | | Xero Ltd. | | 1,338 | | 57 | |
| | REA Group Ltd. | | 810 | | 57 | |
| | Atlas Arteria Ltd. | | 9,847 | | 56 | |
| | Ansell Ltd. | | 2,932 | | 54 | |
| | ALS Ltd. | | 9,769 | | 51 | |
| | JB Hi-Fi Ltd. | | 2,216 | | 49 | |
| | Qube Holdings Ltd. | | 22,597 | | 49 | |
| | Cromwell Property Group | | 55,723 | | 46 | |
| | Qantas Airways Ltd. | | 10,685 | | 44 | |
| | Shopping Centres Australasia Property Group | | 24,723 | | 44 | |
| | Altium Ltd. | | 1,715 | | 42 | |
| | carsales.com Ltd. | | 3,967 | | 42 | |
| | AusNet Services | | 34,110 | | 41 | |
| | Steadfast Group Ltd. | | 15,232 | | 38 | |
| | Appen Ltd. | | 2,076 | | 36 | |
| | Independence Group NL | | 9,793 | | 36 | |
| | Domino’s Pizza Enterprises Ltd. | | 1,210 | | 35 | |
| | Iluka Resources Ltd. | | 7,215 | | 35 | |
7
ESG International Stock ETF
| | | | | | Market | |
| | | | | | Value· | |
| | | | Shares | | ($000 | ) |
| | OZ Minerals Ltd. | | 5,624 | | 35 | |
* | | Saracen Mineral Holdings Ltd. | | 13,963 | | 34 | |
| | Link Administration Holdings Ltd. | | 8,893 | | 33 | |
| | Flight Centre Travel Group Ltd. | | 1,027 | | 32 | |
| | Metcash Ltd. | | 16,281 | | 32 | |
| | Cleanaway Waste Management Ltd. | | 22,390 | | 31 | |
| | Harvey Norman Holdings Ltd. | | 10,504 | | 31 | |
| | Nine Entertainment Co. Holdings Ltd. | | 22,766 | | 30 | |
| | Reliance Worldwide Corp. Ltd. | | 11,532 | | 30 | |
| | Bapcor Ltd. | | 6,578 | | 30 | |
| | WiseTech Global Ltd. | | 1,165 | | 29 | |
| | IRESS Ltd. | | 3,425 | | 29 | |
| | CSR Ltd. | | 10,256 | | 27 | |
| | Pendal Group Ltd. | | 5,946 | | 27 | |
| | TPG Telecom Ltd. | | 5,848 | | 26 | |
| | Regis Resources Ltd. | | 7,440 | | 26 | |
* | | NEXTDC Ltd. | | 6,393 | | 26 | |
| | IDP Education Ltd. | | 2,294 | | 26 | |
| | Sims Metal Management Ltd. | | 3,306 | | 26 | |
| | Monadelphous Group Ltd. | | 2,354 | | 25 | |
| | Premier Investments Ltd. | | 2,430 | | 24 | |
| | Breville Group Ltd. | | 2,187 | | 24 | |
* | | Vocus Group Ltd. | | 10,984 | | 24 | |
| | St. Barbara Ltd. | | 10,452 | | 23 | |
| | Pro Medicus Ltd. | | 901 | | 22 | |
| | IPH Ltd. | | 3,562 | | 22 | |
| | GrainCorp Ltd. Class A | | 4,098 | | 22 | |
| | Southern Cross Media Group Ltd. | | 26,454 | | 22 | |
| | Perpetual Ltd. | | 906 | | 22 | |
| | Mineral Resources Ltd. | | 2,416 | | 21 | |
* | | Lynas Corp. Ltd. | | 13,034 | | 21 | |
* | | Nufarm Ltd. | | 6,358 | | 21 | |
^ | | IOOF Holdings Ltd. | | 5,818 | | 20 | |
| | Abacus Property Group | | 7,284 | | 19 | |
| | Ausdrill Ltd. | | 14,365 | | 19 | |
2 | | Viva Energy Group Ltd. | | 14,270 | | 19 | |
| | Adelaide Brighton Ltd. | | 8,530 | | 18 | |
| | Technology One Ltd. | | 3,371 | | 17 | |
| | National Storage REIT | | 13,356 | | 16 | |
| | Webjet Ltd. | | 1,973 | | 16 | |
* | | Gold Road Resources Ltd. | | 18,199 | | 16 | |
* | | nearmap Ltd. | | 8,680 | | 16 | |
| | GUD Holdings Ltd. | | 2,503 | | 15 | |
| | Healius Ltd. | | 6,810 | | 15 | |
* | | Clinuvel Pharmaceuticals Ltd. | | 794 | | 14 | |
| | NRW Holdings Ltd. | | 8,414 | | 14 | |
* | | Perseus Mining Ltd. | | 25,627 | | 13 | |
* | | Nanosonics Ltd. | | 2,892 | | 13 | |
| | Costa Group Holdings Ltd. | | 5,932 | | 13 | |
| | Platinum Asset Management Ltd. | | 4,754 | | 12 | |
| | Corporate Travel Management Ltd. | | 1,020 | | 12 | |
| | InvoCare Ltd. | | 1,072 | | 11 | |
| | Domain Holdings Australia Ltd. | | 4,494 | | 10 | |
| | G8 Education Ltd. | | 5,178 | | 9 | |
| | ERM Power Ltd. | | 5,262 | | 9 | |
* | | Westgold Resources Ltd. | | 5,456 | | 9 | |
| | Bingo Industries Ltd. | | 5,636 | | 9 | |
| | Automotive Holdings Group Ltd. | | 3,633 | | 8 | |
| | Super Retail Group Ltd. | | 1,274 | | 8 | |
* | | Mount Gibson Iron Ltd. | | 15,479 | | 7 | |
| | Vita Group Ltd. | | 8,753 | | 7 | |
* | | Resolute Mining Ltd. | | 6,399 | | 7 | |
| | Infigen Energy | | 17,920 | | 7 | |
| | Service Stream Ltd. | | 3,335 | | 6 | |
| | Collins Foods Ltd. | | 1,100 | | 6 | |
| | McMillan Shakespeare Ltd. | | 588 | | 6 | |
| | Elders Ltd. | | 1,368 | | 6 | |
| | A2B Australia Ltd. | | 6,078 | | 6 | |
| | Lovisa Holdings Ltd. | | 728 | | 6 | |
| | Blackmores Ltd. | | 119 | | 6 | |
* | | Mesoblast Ltd. | | 5,919 | | 6 | |
| | Aurelia Metals Ltd. | | 15,765 | | 6 | |
| | Western Areas Ltd. | | 3,185 | | 5 | |
* | | Myer Holdings Ltd. | | 14,953 | | 5 | |
| | Accent Group Ltd. | | 4,783 | | 5 | |
| | Sigma Healthcare Ltd. | | 11,549 | | 5 | |
| | GWA Group Ltd. | | 2,234 | | 5 | |
| | FlexiGroup Ltd. | | 3,882 | | 5 | |
| | Aveo Group | | 3,350 | | 5 | |
*,^,§ | | Pilbara Minerals Ltd. | | 19,643 | | 5 | |
* | | Liquefied Natural Gas Ltd. | | 40,540 | | 5 | |
| | HUB24 Ltd. | | 546 | | 5 | |
* | | Emeco Holdings Ltd. | | 3,482 | | 4 | |
| | Netwealth Group Ltd. | | 852 | | 4 | |
* | | Mayne Pharma Group Ltd. | | 14,606 | | 4 | |
* | | Dacian Gold Ltd. | | 5,742 | | 4 | |
| | Bega Cheese Ltd. | | 1,592 | | 4 | |
| | Sandfire Resources NL | | 1,019 | | 4 | |
| | Eclipx Group Ltd. | | 3,881 | | 4 | |
* | | Pact Group Holdings Ltd. | | 2,475 | | 4 | |
* | | Orocobre Ltd. | | 2,419 | | 4 | |
* | | Syrah Resources Ltd. | | 6,123 | | 3 | |
8
ESG International Stock ETF
| | | | | | Market | |
| | | | | | Value· | |
| | | | Shares | | ($000 | ) |
* | | Bellamy’s Australia Ltd. | | 507 | | 3 | |
| | Decmil Group Ltd. | | 3,820 | | 2 | |
| | SpeedCast International Ltd. | | 1,969 | | 1 | |
| | | | | | 21,172 | |
Austria (0.2%) | | | | | |
| | Erste Group Bank AG | | 8,836 | | 284 | |
| | Raiffeisen Bank International AG | | 5,455 | | 119 | |
| | Verbund AG | | 986 | | 59 | |
| | Wienerberger AG | | 2,114 | | 49 | |
| | IMMOFINANZ AG | | 1,648 | | 46 | |
| | CA Immobilien Anlagen AG | | 1,176 | | 41 | |
| | UNIQA Insurance Group AG | | 4,150 | | 37 | |
2 | | BAWAG Group AG | | 893 | | 34 | |
| | Oesterreichische Post AG | | 888 | | 32 | |
| | ANDRITZ AG | | 852 | | 30 | |
| | Lenzing AG | | 258 | | 24 | |
| | Telekom Austria AG Class A | | 3,162 | | 24 | |
| | DO & CO AG | | 177 | | 17 | |
| | Schoeller-Bleckmann Oilfield Equipment AG | | 215 | | 14 | |
* | | Zumtobel Group AG | | 1,379 | | 10 | |
| | | | | | 820 | |
Belgium (0.6%) | | | | | |
| | KBC Group NV | | 7,389 | | 428 | |
| | Ageas | | 6,042 | | 324 | |
| | UCB SA | | 3,576 | | 267 | |
| | Solvay SA Class A | | 2,467 | | 249 | |
| | Ackermans & van Haaren NV | | 1,358 | | 197 | |
| | Proximus SADP | �� | 6,350 | | 188 | |
* | | Argenx SE | | 1,388 | | 182 | |
| | KBC Ancora | | 3,408 | | 135 | |
| | Groupe Bruxelles Lambert SA | | 864 | | 81 | |
| | Aedifica SA | | 618 | | 70 | |
| | Cofinimmo SA | | 409 | | 57 | |
| | Gimv NV | | 870 | | 52 | |
| | Elia System Operator SA/NV | | 601 | | 50 | |
| | Telenet Group Holding NV | | 757 | | 38 | |
| | Barco NV | | 159 | | 34 | |
| | Colruyt SA | | 593 | | 30 | |
| | Ontex Group NV | | 1,398 | | 23 | |
| | D’ieteren SA/NV | | 450 | | 23 | |
| | bpost SA | | 1,995 | | 20 | |
| | Melexis NV | | 300 | | 19 | |
| | Kinepolis Group NV | | 303 | | 17 | |
* | | AGFA-Gevaert NV | | 3,906 | | 15 | |
| | Euronav NV | | 1,897 | | 15 | |
| | Econocom Group SA/NV | | 3,447 | | 10 | |
* | | Tessenderlo Chemie NV (Voting Shares) | | 292 | | 9 | |
| | Montea C.V.A | | 69 | | 6 | |
| | Bekaert SA | | 209 | | 6 | |
* | | Mithra Pharmaceuticals SA | | 173 | | 5 | |
* | | Ion Beam Applications | | 151 | | 3 | |
| | | | | | 2,553 | |
Brazil (1.9%) | | | | | |
| | Itau Unibanco Holding SA Preference Shares | | 120,500 | | 988 | |
| | Banco Bradesco SA Preference Shares | | 106,320 | | 846 | |
| | B3 SA - Brasil Bolsa Balcao | | 55,100 | | 596 | |
| | Lojas Renner SA | | 27,720 | | 338 | |
| | Banco do Brasil SA | | 28,400 | | 317 | |
| | Itausa - Investimentos Itau SA Preference Shares | | 97,700 | | 290 | |
| | Magazine Luiza SA | | 26,560 | | 233 | |
| | Localiza Rent a Car SA | | 17,275 | | 196 | |
| | Banco Bradesco SA | | 26,020 | | 190 | |
| | IRB Brasil Resseguros S/A | | 6,140 | | 161 | |
* | | BRF SA | | 16,600 | | 153 | |
| | BR Malls Participacoes SA | | 43,900 | | 143 | |
| | BB Seguridade Participacoes SA | | 17,700 | | 140 | |
* | | Rumo SA | | 25,000 | | 133 | |
| | Raia Drogasil SA | | 5,400 | | 120 | |
| | Cia de Saneamento Basico do Estado de Sao Paulo | | 9,600 | | 120 | |
| | CCR SA | | 28,900 | | 113 | |
| | Lojas Americanas SA | | 32,300 | | 112 | |
| | Ultrapar Participacoes SA | | 27,000 | | 107 | |
| | Hypera SA | | 13,700 | | 106 | |
| | Kroton Educacional SA | | 42,900 | | 104 | |
| | Petrobras Distribuidora SA | | 15,014 | | 104 | |
| | Cia Brasileira de Distribuicao Grupo Pao de Acucar Preference Shares | | 4,900 | | 104 | |
| | Banco Santander Brasil SA | | 9,900 | | 102 | |
| | Notre Dame Intermedica Participacoes SA | | 6,995 | | 95 | |
| | Cia Energetica de Minas Gerais | | 21,300 | | 90 | |
| | Suzano SA | | 12,600 | | 89 | |
| | Banco BTG Pactual SA | | 6,021 | | 85 | |
* | | Azul SA Prior Preference Shares. | | 6,900 | | 78 | |
| | Telefonica Brasil SA Preference Shares | | 5,500 | | 71 | |
| | Klabin SA | | 17,900 | | 65 | |
| | Cia Siderurgica Nacional SA | | 17,200 | | 60 | |
| | Natura Cosmeticos SA | | 3,500 | | 56 | |
| | Equatorial Energia SA | | 2,100 | | 49 | |
| | Sul America SA | | 4,000 | | 47 | |
| | TIM Participacoes SA | | 14,300 | | 42 | |
9
ESG International Stock ETF
| | | | | | Market | |
| | | | | | Value· | |
| | | | Shares | | ($000 | ) |
| | Lojas Americanas SA Preference Shares | | 8,900 | | 40 | |
| | Cielo SA | | 20,600 | | 39 | |
| | YDUQS Part | | 4,800 | | 36 | |
* | | B2W Cia Digital | | 3,200 | | 36 | |
| | TOTVS SA | | 2,647 | | 34 | |
| | Cia de Saneamento do Parana Preference Shares | | 8,100 | | 34 | |
| | WEG SA | | 6,200 | | 34 | |
| | Engie Brasil Energia SA | | 3,000 | | 33 | |
| | Cia Energetica de Minas Gerais Preference Shares | | 9,100 | | 32 | |
| | Cosan SA | | 2,600 | | 31 | |
| | EDP - Energias do Brasil SA | | 6,300 | | 31 | |
| | CVC Brasil Operadora e Agencia de Viagens SA | | 2,300 | | 29 | |
| | Light SA | | 6,000 | | 29 | |
| | MRV Engenharia e Participacoes SA | | 6,000 | | 29 | |
| | Atacadao SA | | 5,300 | | 29 | |
| | Iguatemi Empresa de Shopping Centers SA | | 2,500 | | 28 | |
| | Metalurgica Gerdau SA Preference Shares Class A | | 18,000 | | 27 | |
| | Bradespar SA Preference Shares | | 3,900 | | 27 | |
| | Qualicorp Consultoria e Corretora de Seguros SA | | 3,700 | | 26 | |
| | Cia de Saneamento de Minas Gerais-COPASA | | 1,500 | | 25 | |
| | Santos Brasil Participacoes SA | | 14,700 | | 24 | |
| | Cia Energetica de Sao Paulo Preference Shares | | 3,500 | | 24 | |
| | Porto Seguro SA | | 1,700 | | 23 | |
| | Transmissora Alianca de Energia Eletrica SA | | 3,200 | | 22 | |
| | Cia Hering | | 2,700 | | 22 | |
| | Linx SA | | 2,700 | | 21 | |
| | Multiplan Empreendimentos Imobiliarios SA | | 3,300 | | 21 | |
| | Cyrela Brazil Realty SA Empreendimentos e Participacoes | | 3,400 | | 21 | |
| | Banco do Estado do Rio Grande do Sul SA Preference Shares | | 3,700 | | 20 | |
* | | Gol Linhas Aereas Inteligentes SA Preference Shares | | 2,500 | | 20 | |
| | Fleury SA | | 3,400 | | 20 | |
| | Duratex SA | | 6,100 | | 20 | |
* | | Via Varejo SA | | 9,600 | | 18 | |
| | Cia Paranaense de Energia | | 1,300 | | 18 | |
| | Cia de Locacao das Americas | | 1,300 | | 17 | |
| | EcoRodovias Infraestrutura e Logistica SA | | 5,700 | | 17 | |
| | BK Brasil Operacao e Assessoria a Restaurantes SA | | 3,400 | | 16 | |
| | Odontoprev SA | | 3,700 | | 15 | |
| | Banco Inter SA | | 1,000 | | 15 | |
| | Anima Holding SA | | 2,900 | | 15 | |
| | Arezzo Industria e Comercio SA | | 1,200 | | 14 | |
2 | | Ser Educacional SA | | 2,500 | | 14 | |
| | Ez Tec Empreendimentos e Participacoes SA | | 1,500 | | 14 | |
| | M Dias Branco SA | | 1,600 | | 14 | |
* | | Even Construtora e Incorporadora SA | | 5,100 | | 14 | |
| | Alupar Investimento SA | | 2,100 | | 13 | |
| | Movida Participacoes SA | | 3,400 | | 13 | |
| | Cia Paranaense de Energia Preference Shares | | 1,000 | | 13 | |
* | | Marfrig Global Foods SA | | 6,100 | | 12 | |
| | Randon Participacoes SA Preference Shares | | 5,100 | | 12 | |
| | Instituto Hermes Pardini SA | | 2,000 | | 12 | |
| | Aliansce Sonae Shopping Centers sa | | 1,260 | | 11 | |
* | | Alpargatas SA Preference Shares | | 1,900 | | 11 | |
* | | Cosan Logistica SA | | 2,300 | | 11 | |
| | Marcopolo SA Preference Shares | | 12,600 | | 11 | |
| | Direcional Engenharia SA | | 3,500 | | 11 | |
| | Construtora Tenda SA | | 1,700 | | 10 | |
| | Energisa SA | | 900 | | 10 | |
| | Wiz Solucoes e Corretagem de Seguros SA | | 3,500 | | 10 | |
* | | Minerva SA | | 4,900 | | 10 | |
| | Cia de Transmissao de Energia Eletrica Paulista Preference Shares | | 1,600 | | 10 | |
| | AES Tiete Energia SA | | 3,300 | | 10 | |
| | Usinas Siderurgicas de Minas Gerais SA Preference Shares | | 4,400 | | 8 | |
| | Sao Martinho SA | | 1,300 | | 6 | |
| | Iochpe Maxion SA | | 1,100 | | 5 | |
| | Smiles Fidelidade SA | | 500 | | 4 | |
| | Unipar Carbocloro SA Preference Shares | | 583 | | 4 | |
| | SLC Agricola SA | | 1,000 | | 4 | |
10
ESG International Stock ETF
| | | | | | Market | |
| | | | | | Value· | |
| | | | Shares | | ($000 | ) |
2 | | Banco Inter SA Preference Shares | | 800 | | 4 | |
| | Valid Solucoes e Servicos de Seguranca em Meios de Pagamento e Identificacao SA | | 1,000 | | 3 | |
| | | | | | 7,959 | |
Canada (7.8%) | | | | | |
| | Royal Bank of Canada | | 33,311 | | 2,491 | |
| | Toronto-Dominion Bank | | 43,368 | | 2,352 | |
| | Enbridge Inc. | | 49,707 | | 1,663 | |
| | Canadian National Railway Co. (Toronto Shares) | | 17,297 | | 1,593 | |
| | Bank of Nova Scotia | | 28,252 | | 1,502 | |
| | TC Energy Corp. | | 23,305 | | 1,194 | |
| | Bank of Montreal | | 14,726 | | 1,009 | |
* | | Shopify Inc. Class A | | 2,565 | | 988 | |
| | Canadian Pacific Railway Ltd. | | 3,604 | | 868 | |
^ | | Manulife Financial Corp. | | 48,505 | | 805 | |
| | Canadian Imperial Bank of Commerce | | 10,169 | | 788 | |
| | Nutrien Ltd. | | 14,667 | | 739 | |
| | Alimentation Couche-Tard Inc. Class B | | 10,902 | | 686 | |
| | Waste Connections Inc. | | 6,584 | | 605 | |
^ | | Sun Life Financial Inc. | | 14,469 | | 593 | |
| | Pembina Pipeline Corp. | | 15,097 | | 553 | |
* | | CGI Inc. | | 6,481 | | 508 | |
| | Rogers Communications Inc. Class B | | 9,094 | | 450 | |
| | Fortis Inc. | | 10,859 | | 448 | |
| | Agnico Eagle Mines Ltd. | | 6,985 | | 437 | |
| | Magna International Inc. | | 8,361 | | 419 | |
| | Wheaton Precious Metals Corp. | | 13,035 | | 383 | |
| | Intact Financial Corp. | | 3,892 | | 380 | |
| | Restaurant Brands International Inc. (XTSE) | | 4,744 | | 372 | |
| | National Bank of Canada | | 7,781 | | 365 | |
| | Open Text Corp. | | 9,066 | | 355 | |
| | Thomson Reuters Corp. | | 4,981 | | 342 | |
| | Fairfax Financial Holdings Ltd. | | 750 | | 334 | |
^ | | Inter Pipeline Ltd. | | 16,322 | | 298 | |
| | Shaw Communications Inc. Class B | | 15,054 | | 286 | |
| | Loblaw Cos. Ltd. | | 5,220 | | 286 | |
| | BCE Inc. | | 5,840 | | 276 | |
�� | | Kirkland Lake Gold Ltd. | | 5,620 | | 273 | |
| | Algonquin Power & Utilities Corp. | | 19,915 | | 260 | |
| | RioCan REIT | | 12,902 | | 257 | |
| | Dollarama Inc. | | 6,680 | | 256 | |
| | Gildan Activewear Inc. | | 6,960 | | 255 | |
| | Canadian Apartment Properties REIT | | 5,937 | | 239 | |
| | H&R REIT | | 13,730 | | 233 | |
| | George Weston Ltd. | | 2,791 | | 227 | |
2 | | Hydro One Ltd. | | 11,843 | | 220 | |
| | CAE Inc. | | 8,316 | | 218 | |
| | CCL Industries Inc. Class B | | 4,665 | | 211 | |
| | Empire Co. Ltd. | | 7,620 | | 210 | |
* | | Kinross Gold Corp. | | 38,673 | | 192 | |
| | Saputo Inc. | | 6,181 | | 186 | |
| | Granite REIT | | 3,882 | | 186 | |
| | Canadian Tire Corp. Ltd. Class A | | 1,769 | | 179 | |
| | iA Financial Corp. Inc. | | 4,296 | | 179 | |
| | Ritchie Bros Auctioneers Inc. | | 4,427 | | 175 | |
| | Atco Ltd. | | 4,890 | | 175 | |
| | Choice Properties REIT | | 16,523 | | 172 | |
| | Finning International Inc. | | 9,658 | | 167 | |
| | Toromont Industries Ltd. | | 3,481 | | 167 | |
| | Chartwell Retirement Residences | | 14,846 | | 166 | |
| | Metro Inc. | | 3,520 | | 149 | |
| | Canadian Utilities Ltd. Class A | | 5,140 | | 148 | |
| | Emera Inc. | | 3,400 | | 147 | |
| | Power Financial Corp. | | 6,730 | | 144 | |
| | CI Financial Corp. | | 9,851 | | 141 | |
^ | | Great-West Lifeco Inc. | | 6,160 | | 131 | |
* | | BlackBerry Ltd. | | 18,066 | | 124 | |
| | Lundin Mining Corp. | | 25,571 | | 122 | |
| | First Quantum Minerals Ltd. | | 19,870 | | 122 | |
* | | Bombardier Inc. Class B | | 63,548 | | 82 | |
| | TELUS Corp. | | 2,210 | | 80 | |
* | | Canada Goose Holdings Inc. | | 1,925 | | 72 | |
�� | | SmartCentres REIT | | 2,900 | | 69 | |
| | TMX Group Ltd. | | 784 | | 68 | |
* | | Air Canada Class B | | 2,000 | | 67 | |
* | | B2Gold Corp. | | 18,700 | | 67 | |
| | Yamana Gold Inc. | | 18,400 | | 66 | |
| | First Capital Realty Inc. | | 3,300 | | 55 | |
| | Dream Global REIT | | 5,000 | | 54 | |
* | | Detour Gold Corp. | | 3,000 | | 54 | |
* | | IAMGOLD Corp. | | 14,345 | | 54 | |
| | Boyd Group Income Fund | | 400 | | 54 | |
* | | Descartes Systems Group Inc. | | 1,500 | | 53 | |
| | Element Fleet Management Corp. | | 6,600 | | 53 | |
| | FirstService Corp. | | 500 | | 52 | |
| | Alamos Gold Inc. Class A | | 7,300 | | 51 | |
| | Northview Apartment REIT | | 2,200 | | 49 | |
| | Quebecor Inc. Class B | | 2,100 | | 47 | |
11
ESG International Stock ETF
| | | | | | Market | |
| | | | | | Value· | |
| | | | Shares | | ($000 | ) |
| | Canadian Western Bank | | 1,800 | | 43 | |
| | Maple Leaf Foods Inc. | | 1,800 | | 43 | |
| | Innergex Renewable Energy Inc. | | 3,700 | | 41 | |
| | IGM Financial Inc. | | 1,500 | | 41 | |
| | Colliers International Group Inc. | | 600 | | 40 | |
* | | NovaGold Resources Inc. | | 5,100 | | 38 | |
| | Cominar REIT | | 4,000 | | 38 | |
| | Premium Brands Holdings Corp. | | 500 | | 37 | |
* | | First Majestic Silver Corp. | | 3,200 | | 35 | |
* | | Pretium Resources Inc. | | 2,568 | | 34 | |
| | Boardwalk REIT | | 1,000 | | 33 | |
* | | SSR Mining Inc. | | 2,000 | | 33 | |
| | WestJet Airlines Ltd. | | 1,400 | | 32 | |
| | Osisko Gold Royalties Ltd. | | 2,500 | | 32 | |
| | Eldorado Gold Corp. | | 3,400 | | 31 | |
| | Genworth MI Canada Inc. | | 800 | | 30 | |
| | BRP Inc. | | 836 | | 30 | |
* | | Ivanhoe Mines Ltd. | | 10,700 | | 30 | |
| | Gibson Energy Inc. | | 1,700 | | 29 | |
* | | Kinaxis Inc. | | 500 | | 29 | |
| | Superior Plus Corp. | | 3,300 | | 29 | |
| | West Fraser Timber Co. Ltd. | | 756 | | 27 | |
| | Laurentian Bank of Canada | | 800 | | 26 | |
* | | Alacer Gold Corp. | | 5,900 | | 26 | |
| | OceanaGold Corp. | | 10,300 | | 25 | |
| | Cogeco Communications Inc. | | 300 | | 24 | |
* | | Torex Gold Resources Inc. | | 1,400 | | 22 | |
* | | SEMAFO Inc. | | 5,600 | | 21 | |
| | Cineplex Inc. | | 1,100 | | 20 | |
| | Norbord Inc. | | 800 | | 20 | |
* | | Home Capital Group Inc. Class B | | 1,000 | | 19 | |
| | NFI Group Inc. | | 800 | | 17 | |
| | Hudbay Minerals Inc. | | 5,200 | | 17 | |
| | Corus Entertainment Inc. Class B | | 4,379 | | 17 | |
* | | Endeavour Mining Corp. | | 800 | | 16 | |
* | | Canfor Corp. | | 1,300 | | 15 | |
| | Transcontinental Inc. Class A | | 1,400 | | 15 | |
* | | Celestica Inc. | | 2,100 | | 14 | |
| | Restaurant Brands International Inc. (XNYS) | | 171 | | 13 | |
| | ECN Capital Corp. | | 3,629 | | 13 | |
| | Winpak Ltd. | | 300 | | 11 | |
| | ShawCor Ltd. | | 800 | | 10 | |
| | Enerflex Ltd. | | 1,000 | | 9 | |
| | Cascades Inc. | | 1,000 | | 8 | |
| | Pason Systems Inc. | | 700 | | 8 | |
| | Hudson’s Bay Co. | | 774 | | 6 | |
| | Secure Energy Services Inc. | | 1,400 | | 6 | |
| | Martinrea International Inc. | | 700 | | 5 | |
| | Mullen Group Ltd. | | 700 | | 5 | |
| | CES Energy Solutions Corp. | | 3,200 | | 5 | |
* | | Precision Drilling Corp. | | 3,500 | | 4 | |
| | Ensign Energy Services Inc. | | 1,400 | | 3 | |
| | | | | | 32,721 | |
Chile (0.2%) | | | | | |
| | Banco Santander Chile | | 2,239,042 | | 160 | |
| | Enel Americas SA | | 928,112 | | 152 | |
| | SACI Falabella | | 17,981 | | 101 | |
| | Banco de Chile | | 703,473 | | 100 | |
| | Empresas CMPC SA | | 34,013 | | 79 | |
| | Sociedad Quimica y Minera de Chile SA Preference Shares Class B | | 2,738 | | 68 | |
| | Latam Airlines Group SA | | 5,967 | | 50 | |
| | Banco de Credito e Inversiones SA | | 704 | | 44 | |
| | Parque Arauco SA | | 14,965 | | 42 | |
| | Itau CorpBanca | | 4,570,258 | | 35 | |
| | Cencosud SA | | 23,410 | | 35 | |
| | Enel Chile SA | | 381,975 | | 33 | |
| | Inversiones Aguas Metropolitanas SA | | 20,849 | | 29 | |
| | Aguas Andinas SA Class A | | 49,742 | | 27 | |
| | Colbun SA | | 144,982 | | 26 | |
* | | Cia Sud Americana de Vapores SA | | 662,004 | | 22 | |
| | CAP SA | | 1,975 | | 16 | |
| | SONDA SA | | 12,795 | | 15 | |
| | Empresas Tricot SA | | 8,695 | | 8 | |
| | Besalco SA | | 3,622 | | 2 | |
| | Salfacorp SA | | 2,336 | | 2 | |
| | | | | | 1,046 | |
China (5.8%) | | | | | |
| | Tencent Holdings Ltd. | | 140,700 | | 5,809 | |
* | | Alibaba Group Holding Ltd. ADR | | 30,281 | | 5,300 | |
| | China Mobile Ltd. | | 123,500 | | 1,022 | |
* | | Baidu Inc. ADR | | 7,210 | | 753 | |
* | | JD.com Inc. ADR | | 19,652 | | 599 | |
* | | New Oriental Education & Technology Group Inc. ADR | | 3,454 | | 392 | |
| | China Overseas Land & Investment Ltd. | | 124,000 | | 391 | |
| | China Resources Land Ltd. | | 84,000 | | 341 | |
| | ANTA Sports Products Ltd. | | 41,000 | | 340 | |
| | Shenzhou International Group Holdings Ltd. | | 24,800 | | 336 | |
* | | TAL Education Group ADR | | 9,099 | | 324 | |
| | Sino Biopharmaceutical Ltd. | | 198,000 | | 293 | |
12
ESG International Stock ETF
| | | | | | Market | |
| | | | | | Value· | |
| | | | Shares | | ($000 | ) |
| | PICC Property & Casualty Co. Ltd. | | 236,000 | | 270 | |
| | Sunny Optical Technology Group Co. Ltd. | | 18,000 | | 248 | |
| | ENN Energy Holdings Ltd. | | 21,600 | | 246 | |
| | Sunac China Holdings Ltd. | | 61,000 | | 243 | |
*,2 | | Wuxi Biologics Cayman Inc. | | 22,500 | | 236 | |
| | China Unicom Hong Kong Ltd. | | 236,000 | | 234 | |
| | Geely Automobile Holdings Ltd. | | 148,000 | | 228 | |
| | Country Garden Holdings Co. Ltd. | | 177,000 | | 219 | |
2 | | Longfor Group Holdings Ltd. | | 59,000 | | 210 | |
| | China Conch Venture Holdings Ltd. | | 62,000 | | 206 | |
| | China Telecom Corp. Ltd. | | 438,000 | | 196 | |
| | Hengan International Group Co. Ltd. | | 29,000 | | 191 | |
| | ZTO Express Cayman Inc. ADR | | 9,118 | | 187 | |
| | Sinopharm Group Co. Ltd. | | 48,400 | | 175 | |
| | China National Building Material Co. Ltd. | | 194,000 | | 166 | |
| | Shimao Property Holdings Ltd. | | 53,500 | | 151 | |
| | Far East Horizon Ltd. | | 169,000 | | 151 | |
* | | Autohome Inc. ADR | | 1,704 | | 148 | |
| | China Evergrande Group | | 71,000 | | 147 | |
* | | 58.com Inc. ADR | | 2,688 | | 145 | |
* | | BeiGene Ltd. ADR | | 984 | | 141 | |
| | China Taiping Insurance Holdings Co. Ltd. | | 59,200 | | 133 | |
| | Momo Inc. ADR | | 3,551 | | 131 | |
| | China Cinda Asset Management Co. Ltd. | | 609,000 | | 126 | |
* | | Vipshop Holdings Ltd. ADR | | 14,189 | | 119 | |
2 | | China Resources Pharmaceutical Group Ltd. | | 110,000 | | 113 | |
| | Zhuzhou CRRC Times Electric Co. Ltd. | | 24,700 | | 98 | |
*,2 | | 3SBio Inc. | | 63,000 | | 97 | |
* | | YY Inc. ADR | | 1,631 | | 93 | |
2 | | People’s Insurance Co. Group of China Ltd. | | 235,000 | | 92 | |
| | Li Ning Co. Ltd. | | 30,500 | | 90 | |
| | Guangdong Investment Ltd. | | 42,000 | | 88 | |
| | Kingdee International Software Group Co. Ltd. | | 98,000 | | 88 | |
| | China Resources Gas Group Ltd. | | 14,000 | | 69 | |
* | | Alibaba Health Information Technology Ltd. | | 68,000 | | 64 | |
| | Yihai International Holding Ltd. | | 9,000 | | 54 | |
| | Brilliance China Automotive Holdings Ltd. | | 48,000 | | 51 | |
* | | China Biologic Products Holdings Inc. | | 500 | | 50 | |
| | China Jinmao Holdings Group Ltd. | | 88,000 | | 49 | |
| | Beijing Enterprises Water Group Ltd. | | 92,000 | | 48 | |
| | Yangzijiang Shipbuilding Holdings Ltd. | | 70,500 | | 46 | |
| | Haier Electronics Group Co. Ltd. | | 17,000 | | 44 | |
* | | iQIYI Inc. ADR | | 2,100 | | 38 | |
| | Shandong Weigao Group Medical Polymer Co. Ltd. | | 36,000 | | 37 | |
* | | Genscript Biotech Corp. | | 16,000 | | 36 | |
| | COSCO SHIPPING Ports Ltd. | | 40,000 | | 35 | |
| | China Resources Cement Holdings Ltd. | | 38,000 | | 34 | |
| | Agile Group Holdings Ltd. | | 26,000 | | 33 | |
| | Zhongsheng Group Holdings Ltd. | | 10,500 | | 33 | |
* | | GDS Holdings Ltd. ADR | | 800 | | 32 | |
| | China Aoyuan Group Ltd. | | 27,000 | | 32 | |
* | | Kingsoft Corp. Ltd. | | 17,000 | | 31 | |
| | Huaneng Renewables Corp. Ltd. | | 104,000 | | 29 | |
| | China Everbright International Ltd. | | 36,000 | | 28 | |
| | Logan Property Holdings Co. Ltd. | | 20,000 | | 28 | |
2 | | Haidilao International Holding Ltd. | | 6,000 | | 28 | |
| | Sino-Ocean Group Holding Ltd. | | 78,000 | | 28 | |
| | Zhaojin Mining Industry Co. Ltd. | | 21,000 | | 28 | |
2 | | China Huarong Asset Management Co. Ltd. | | 175,000 | | 27 | |
2 | | China Galaxy Securities Co. Ltd. | | 57,000 | | 27 | |
2 | | Luye Pharma Group Ltd. | | 34,500 | | 27 | |
| | China Medical System Holdings Ltd. | | 21,000 | | 26 | |
| | Nine Dragons Paper Holdings Ltd. | | 33,000 | | 25 | |
13
ESG International Stock ETF
| | | | | | Market | |
| | | | | | Value· | |
| | | | Shares | | ($000 | ) |
| | China Lesso Group Holdings Ltd. | | 26,000 | | 25 | |
| | Powerlong Real Estate Holdings Ltd. | | 42,000 | | 25 | |
| | China Reinsurance Group Corp. | | 150,000 | | 24 | |
| | Fosun International Ltd. | | 19,000 | | 24 | |
| | TravelSky Technology Ltd. | | 12,000 | | 24 | |
| | Future Land Development Holdings Ltd. | | 30,000 | | 24 | |
* | | China First Capital Group Ltd. | | 60,000 | | 23 | |
* | | Zai Lab Ltd. ADR | | 700 | | 23 | |
| | China Traditional Chinese Medicine Holdings Co. Ltd. | | 48,000 | | 22 | |
| | China Communications Services Corp. Ltd. | | 40,000 | | 22 | |
2 | | Fu Shou Yuan International Group Ltd. | | 23,000 | | 22 | |
| | Dongfeng Motor Group Co. Ltd. | | 24,000 | | 22 | |
| | China Longyuan Power Group Corp. Ltd. | | 40,000 | | 22 | |
| | Fanhua Inc. ADR | | 804 | | 22 | |
| | Beijing Capital International Airport Co. Ltd. | | 26,000 | | 22 | |
| | Yuzhou Properties Co. Ltd. | | 50,000 | | 21 | |
| | Tong Ren Tang Technologies Co. Ltd. | | 19,000 | | 21 | |
| | Bosideng International Holdings Ltd. | | 60,000 | | 21 | |
| | China Hongqiao Group Ltd. | | 31,000 | | 20 | |
2 | | Sinopec Engineering Group Co. Ltd. | | 31,000 | | 20 | |
| | China Yongda Automobiles Services Holdings Ltd. | | 23,000 | | 20 | |
| | China State Construction International Holdings Ltd. | | 22,000 | | 20 | |
| | Times China Holdings Ltd. | | 13,000 | | 20 | |
| | China Oriental Group Co. Ltd. | | 50,000 | | 20 | |
* | | GOME Retail Holdings Ltd. | | 214,000 | | 19 | |
2 | | Genertec Universal Medical Group Co. Ltd. | | 27,000 | | 19 | |
| | Haitian International Holdings Ltd. | | 10,000 | | 19 | |
| | Zhejiang Expressway Co. Ltd. | | 22,000 | | 18 | |
*,^ | | Baozun Inc. ADR | | 400 | | 18 | |
| | BYD Electronic International Co. Ltd. | | 15,000 | | 18 | |
| | China SCE Group Holdings Ltd. | | 37,000 | | 18 | |
| | Sinotruk Hong Kong Ltd. | | 11,500 | | 18 | |
| | Ausnutria Dairy Corp. Ltd. | | 12,000 | | 17 | |
| | AviChina Industry & Technology Co. Ltd. | | 32,000 | | 17 | |
| | NetDragon Websoft Holdings Ltd. | | 6,500 | | 17 | |
* | | Digital China Holdings Ltd. | | 33,000 | | 17 | |
| | Chinasoft International Ltd. | | 40,000 | | 17 | |
* | | Canadian Solar Inc. | | 700 | | 16 | |
2 | | BAIC Motor Corp. Ltd. | | 29,000 | | 16 | |
| | Zhenro Properties Group Ltd. | | 26,000 | | 16 | |
| | China Overseas Property Holdings Ltd. | | 30,000 | | 15 | |
2 | | Orient Securities Co. Ltd. | | 24,800 | | 15 | |
| | Kingboard Holdings Ltd. | | 6,500 | | 15 | |
| | Jinchuan Group International Resources Co. Ltd. | | 181,000 | | 15 | |
* | | BEST Inc. ADR | | 3,300 | | 14 | |
| | Concord New Energy Group Ltd. | | 310,000 | | 14 | |
| | Sihuan Pharmaceutical Holdings Group Ltd. | | 80,000 | | 14 | |
| | China Maple Leaf Educational Systems Ltd. | | 46,000 | | 14 | |
| | Shenzhen International Holdings Ltd. | | 7,000 | | 13 | |
| | Sinotrans Ltd. | | 41,000 | | 13 | |
| | KWG Group Holdings Ltd. | | 15,000 | | 13 | |
| | China Water Affairs Group Ltd. | | 16,000 | | 13 | |
* | | Q Technology Group Co. Ltd. | | 14,000 | | 13 | |
| | China Overseas Grand Oceans Group Ltd. | | 27,000 | | 13 | |
| | Sany Heavy Equipment International Holdings Co. Ltd. | | 29,000 | | 12 | |
2 | | Hua Hong Semiconductor Ltd. | | 7,000 | | 12 | |
| | Xiamen International Port Co. Ltd. | | 95,089 | | 12 | |
2 | | China Everbright Greentech Ltd. | | 19,000 | | 12 | |
| | Wisdom Education International Holdings Co. Ltd. | | 24,000 | | 12 | |
| | Kingboard Laminates Holdings Ltd. | | 14,500 | | 11 | |
*,2 | | Haichang Ocean Park Holdings Ltd. | | 81,000 | | 11 | |
14
ESG International Stock ETF
| | | | | | Market | |
| | | | | | Value· | |
| | | | Shares | | ($000 | ) |
| | Shougang Concord International Enterprises Co. Ltd. | | 290,000 | | 11 | |
| | China Foods Ltd. | | 26,000 | | 11 | |
*,2 | | ZhongAn Online P&C Insurance Co. Ltd. | | 4,900 | | 11 | |
* | | Sohu.com Ltd. ADR | | 1,000 | | 11 | |
| | Oshidori International Holdings Ltd. | | 99,000 | | 11 | |
2 | | Qingdao Port International Co. Ltd. | | 18,000 | | 11 | |
| | Shanghai Fudan-Zhangjiang Bio-Pharmaceutical Co. Ltd. | | 14,000 | | 11 | |
* | | Sogou Inc. ADR | | 2,400 | | 11 | |
| | Health & Happiness H&H International Holdings Ltd. | | 2,500 | | 10 | |
| | China Resources Medical Holdings Co. Ltd. | | 14,500 | | 10 | |
* | | COSCO Shipping International Singapore Co. Ltd. | | 51,300 | | 10 | |
| | Dawnrays Pharmaceutical Holdings Ltd. | | 58,000 | | 10 | |
| | Colour Life Services Group Co. Ltd. | | 19,000 | | 10 | |
| | China Power International Development Ltd. | | 46,000 | | 10 | |
| | Poly Culture Group Corp. Ltd. | | 12,200 | | 10 | |
| | Hangzhou Steam Turbine Co. Ltd. Class B | | 10,700 | | 10 | |
*,2 | | Tian Ge Interactive Holdings Ltd. | | 45,000 | | 10 | |
2 | | China Railway Signal & Communication Corp. Ltd. | | 16,000 | | 10 | |
2 | | Ozner Water International Holding Ltd. | | 61,000 | | 10 | |
* | | HengTen Networks Group Ltd. | | 600,000 | | 10 | |
* | | Kasen International Holdings Ltd. | | 9,000 | | 9 | |
| | Greenland Hong Kong Holdings Ltd. | | 27,000 | | 9 | |
*,2 | | China Literature Ltd. | | 3,000 | | 9 | |
| | Jiayuan International Group Ltd. | | 22,000 | | 9 | |
* | | Capital Environment Holdings Ltd. | | 344,000 | | 9 | |
| | China Suntien Green Energy Corp. Ltd. | | 34,000 | | 9 | |
| | Tianjin Port Development Holdings Ltd. | | 100,000 | | 9 | |
| | Launch Tech Co. Ltd. | | 13,800 | | 8 | |
2 | | China Merchants Securities Co. Ltd. | | 7,400 | | 8 | |
| | CIMC Enric Holdings Ltd. | | 14,000 | | 8 | |
*,^ | | NIO Inc. ADR | | 2,800 | | 8 | |
| | Kaisa Group Holdings Ltd. | | 23,000 | | 8 | |
* | | 21Vianet Group Inc. ADR | | 1,000 | | 8 | |
| | Sinosoft Technology Group Ltd. | | 34,000 | | 8 | |
*,2 | | Cogobuy Group | | 41,000 | | 7 | |
| | Tiangong International Co. Ltd. | | 24,000 | | 7 | |
| | Ajisen China Holdings Ltd. | | 24,000 | | 7 | |
* | | Qudian Inc. ADR | | 900 | | 7 | |
| | Greatview Aseptic Packaging Co. Ltd. | | 13,000 | | 7 | |
| | Zhongyu Gas Holdings Ltd. | | 7,000 | | 7 | |
2 | | A-Living Services Co. Ltd. | | 3,500 | | 7 | |
* | | Bilibili Inc. ADR | | 482 | | 7 | |
2 | | CSC Financial Co. Ltd. | | 9,500 | | 7 | |
2 | | YiChang HEC ChangJiang Pharmaceutical Co. Ltd. | | 1,400 | | 7 | |
2 | | China Yuhua Education Corp. Ltd. | | 12,000 | | 7 | |
* | | JinkoSolar Holding Co. Ltd. ADR | | 300 | | 7 | |
| | China Grand Pharmaceutical and Healthcare Holdings Ltd. | | 12,000 | | 6 | |
| | Fufeng Group Ltd. | | 13,000 | | 6 | |
| | China Education Group Holdings Ltd. | | 4,000 | | 6 | |
* | | GCL-Poly Energy Holdings Ltd. | | 153,000 | | 6 | |
*,2 | | China Logistics Property Holdings Co. Ltd. | | 15,000 | | 6 | |
2 | | Legend Holdings Corp. | | 2,700 | | 6 | |
| | Greentown Service Group Co. Ltd. | | 6,000 | | 5 | |
| | Vinda International Holdings Ltd. | | 3,000 | | 5 | |
| | Qingling Motors Co. Ltd. | | 22,000 | | 5 | |
| | Dongyue Group Ltd. | | 11,000 | | 5 | |
| | Ronshine China Holdings Ltd. | | 4,500 | | 5 | |
| | Xtep International Holdings Ltd. | | 9,000 | | 5 | |
* | | Hi Sun Technology China Ltd. | | 30,000 | | 5 | |
| | Xinhua Winshare Publishing and Media Co. Ltd. | | 7,000 | | 5 | |
2 | | Redco Properties Group Ltd. | | 10,000 | | 5 | |
2 | | Zhou Hei Ya International Holdings Co. Ltd. | | 10,500 | | 5 | |
15
ESG International Stock ETF
| | | | | | Market | |
| | | | | | Value· | |
| | | | Shares | | ($000 | ) |
| | China BlueChemical Ltd. | | 18,000 | | 5 | |
| | Lonking Holdings Ltd. | | 20,000 | | 5 | |
| | Tianneng Power International Ltd. | | 6,000 | | 5 | |
| | Shandong Airlines Co. Ltd. Class B | | 5,000 | | 5 | |
| | China ZhengTong Auto Services Holdings Ltd. | | 13,000 | | 5 | |
| | Skyworth Group Ltd. | | 20,000 | | 5 | |
| | Skyfame Realty Holdings Ltd. | | 34,000 | | 5 | |
| | Shanghai Highly Group Co. Ltd. Class B | | 5,900 | | 4 | |
* | | Smartac Group China Holdings Ltd. | | 248,000 | | 4 | |
| | O-Net Technologies Group Ltd. | | 9,000 | | 4 | |
| | Shanghai Zhenhua Heavy Industries Co. Ltd. Class B | | 12,800 | | 4 | |
| | Comba Telecom Systems Holdings Ltd. | | 20,000 | | 4 | |
| | Huangshan Tourism Development Co. Ltd. Class B | | 4,400 | | 4 | |
* | | CAR Inc. | | 6,000 | | 4 | |
* | | Kama Co. Ltd. Class B | | 9,200 | | 4 | |
| | Xingda International Holdings Ltd. | | 16,000 | | 4 | |
* | | Lifetech Scientific Corp. | | 22,000 | | 4 | |
| | Shanghai Diesel Engine Co. Ltd. Class B | | 8,100 | | 4 | |
| | China Agri-Industries Holdings Ltd. | | 14,000 | | 4 | |
* | | China Water Industry Group Ltd. | | 60,000 | | 4 | |
* | | Bitauto Holdings Ltd. ADR | | 300 | | 4 | |
| | Consun Pharmaceutical Group Ltd. | | 7,000 | | 4 | |
* | | Leyou Technologies Holdings Ltd. | | 15,000 | | 4 | |
| | SOHO China Ltd. | | 12,500 | | 4 | |
| | China Dongxiang Group Co. Ltd. | | 34,000 | | 4 | |
| | JNBY Design Ltd. | | 2,500 | | 4 | |
2 | | Shanghai Haohai Biological Technology Co. Ltd. | | 800 | | 4 | |
| | Fang Holdings Ltd. ADR | | 1,680 | | 3 | |
* | | Beijing Gas Blue Sky Holdings Ltd. | | 136,000 | | 3 | |
* | | Beijing Enterprises Clean Energy Group Ltd. | | 280,000 | | 3 | |
| | Tongda Group Holdings Ltd. | | 50,000 | | 3 | |
* | | Wise Talent Information Technology Co. Ltd. | | 1,400 | | 3 | |
* | | Hybrid Kinetic Group Ltd. | | 1,180,000 | | 3 | |
* | | Noah Holdings Ltd. ADR | | 100 | | 3 | |
| | Texhong Textile Group Ltd. | | 3,500 | | 3 | |
2 | | Yadea Group Holdings Ltd. | | 14,000 | | 3 | |
| | SIIC Environment Holdings Ltd. | | 13,600 | | 2 | |
* | | Huayi Tencent Entertainment Co. Ltd. | | 180,000 | | 2 | |
| | | | | | 24,151 | |
Colombia (0.1%) | | | | | |
| | Bancolombia SA Preference Shares | | 23,142 | | 287 | |
| | Bancolombia SA | | 3,288 | | 38 | |
| | Interconexion Electrica SA ESP | | 6,730 | | 36 | |
| | Banco Davivienda SA Preference Shares | | 2,469 | | 30 | |
| | Grupo Aval Acciones y Valores Preference Shares | | 73,540 | | 27 | |
| | Corp Financiera Colombiana SA | | 1,554 | | 12 | |
| | Almacenes Exito SA | | 2,040 | | 10 | |
| | | | | | 440 | |
Czech Republic (0.0%) | | | | | |
| | Komercni banka as | | 5,637 | | 201 | |
| | | | | |
Denmark (1.3%) | | | | | |
| | Novo Nordisk A/S Class B | | 41,083 | | 2,140 | |
| | DSV A/S | | 5,267 | | 523 | |
| | Coloplast A/S Class B | | 3,995 | | 476 | |
| | Vestas Wind Systems A/S | | 5,726 | | 421 | |
* | | Genmab A/S | | 1,799 | | 368 | |
| | Novozymes A/S | | 5,865 | | 250 | |
| | Chr Hansen Holding A/S | | 2,866 | | 241 | |
| | GN Store Nord A/S | | 4,160 | | 174 | |
| | ISS A/S | | 6,750 | | 171 | |
| | Pandora A/S | | 2,985 | | 127 | |
^ | | Ambu A/S Class B | | 5,604 | | 96 | |
| | SimCorp A/S | | 611 | | 57 | |
| | Tryg A/S | | 1,641 | | 49 | |
* | | Demant A/S | | 1,573 | | 48 | |
| | Topdanmark A/S | | 762 | | 38 | |
| | Jyske Bank A/S | | 1,228 | | 34 | |
| | H Lundbeck A/S | | 906 | | 33 | |
| | Schouw & Co. A/S | | 372 | | 26 | |
* | | ALK-Abello A/S | | 123 | | 25 | |
| | Ringkjoebing Landbobank A/S | | 413 | | 25 | |
| | Rockwool International A/S Class B | | 101 | | 20 | |
| | Sydbank A/S | | 1,250 | | 17 | |
| | Spar Nord Bank A/S | | 1,580 | | 12 | |
16
ESG International Stock ETF
| | | | | | Market | |
| | | | | | Value· | |
| | | | Shares | | ($000 | ) |
*,2 | | Netcompany Group A/S | | 287 | | 12 | |
| | D/S Norden A/S | | 511 | | 7 | |
* | | NKT A/S | | 498 | | 6 | |
* | | Bavarian Nordic A/S | | 232 | | 6 | |
* | | Bang & Olufsen A/S | | 729 | | 5 | |
| | | | | | 5,407 | |
Egypt (0.1%) | | | | | |
| | Commercial International Bank Egypt SAE | | 52,783 | | 256 | |
| | Six of October Development & Investment | | 11,339 | | 11 | |
* | | Medinet Nasr Housing | | 33,720 | | 11 | |
| | Egyptian Financial Group-Hermes Holding Co. | | 8,534 | | 10 | |
| | Heliopolis Housing | | 5,286 | | 9 | |
| | Orascom Construction plc | | 1,345 | | 8 | |
| | Juhayna Food Industries | | 7,059 | | 4 | |
| | | | | | 309 | |
Finland (0.8%) | | | | | |
| | Nokia Oyj | | 140,153 | | 693 | |
| | Kone Oyj Class B | | 9,602 | | 556 | |
| | Nordea Bank Abp | | 75,823 | | 473 | |
| | Sampo Oyj Class A | | 10,908 | | 433 | |
| | Elisa Oyj | | 4,818 | | 242 | |
| | Stora Enso Oyj | | 18,418 | | 207 | |
| | Kesko Oyj Class B | | 3,115 | | 196 | |
| | Wartsila OYJ Abp | | 14,700 | | 181 | |
| | Nokian Renkaat Oyj | | 5,035 | | 138 | |
| | Metso Oyj | | 1,755 | | 66 | |
| | Huhtamaki Oyj | | 1,377 | | 53 | |
| | Valmet Oyj | | 1,909 | | 35 | |
| | Kemira Oyj | | 2,307 | | 33 | |
| | Tieto Oyj | | 1,319 | | 32 | |
| | DNA Oyj | | 1,175 | | 27 | |
| | Cargotec Oyj Class B | | 831 | | 24 | |
| | Metsa Board Oyj | | 3,789 | | 20 | |
| | Sanoma Oyj | | 1,656 | | 17 | |
| | Outokumpu Oyj | | 5,790 | | 17 | |
| | Ahlstrom-Munksjo Oyj | | 869 | | 14 | |
* | | Outotec Oyj | | 2,187 | | 12 | |
| | YIT Oyj | | 1,180 | | 6 | |
| | Uponor Oyj | | 441 | | 5 | |
| | Finnair Oyj | | 339 | | 2 | |
| | Cramo Oyj | | 268 | | 2 | |
| | | | | | 3,484 | |
France (5.5%) | | | | | |
| | Sanofi | | 26,679 | | 2,292 | |
| | L’Oreal SA | | 5,658 | | 1,545 | |
| | Air Liquide SA | | 9,811 | | 1,367 | |
| | Danone SA | | 13,796 | | 1,236 | |
| | BNP Paribas SA | | 25,908 | | 1,168 | |
| | EssilorLuxottica SA | | 7,162 | | 1,057 | |
| | AXA SA | | 43,206 | | 991 | |
| | Kering SA | | 1,825 | | 884 | |
| | Orange SA | | 46,543 | | 707 | |
| | Vivendi SA | | 23,237 | | 650 | |
| | Legrand SA | | 7,697 | | 543 | |
| | Cie Generale des Etablissements Michelin SCA | | 4,557 | | 480 | |
| | Societe Generale SA | | 17,919 | | 454 | |
| | Hermes International | | 616 | | 421 | |
| | TechnipFMC plc | | 16,781 | | 417 | |
| | Teleperformance | | 1,721 | | 376 | |
| | Edenred | | 7,460 | | 363 | |
| | Credit Agricole SA | | 30,443 | | 347 | |
| | Peugeot SA | | 15,497 | | 347 | |
| | Veolia Environnement SA | | 14,152 | | 338 | |
| | Sodexo SA | | 2,883 | | 327 | |
| | STMicroelectronics NV | | 18,372 | | 326 | |
| | Renault SA | | 4,977 | | 285 | |
| | Carrefour SA | | 16,037 | | 273 | |
| | Publicis Groupe SA | | 5,611 | | 269 | |
| | Gecina SA | | 1,602 | | 254 | |
| | Arkema SA | | 2,633 | | 231 | |
| | Getlink SE | | 16,116 | | 227 | |
2 | | Euronext NV | | 2,829 | | 222 | |
| | Wendel SA | | 1,551 | | 217 | |
| | Suez | | 13,802 | | 214 | |
| | Eurazeo SE | | 3,074 | | 203 | |
| | Valeo SA | | 7,345 | | 201 | |
| | Ingenico Group SA | | 1,979 | | 196 | |
| | SCOR SE | | 4,842 | | 193 | |
| | Orpea | | 1,529 | | 193 | |
| | SES SA Class A | | 11,749 | | 189 | |
| | Rubis SCA | | 3,250 | | 188 | |
| | Klepierre SA | | 6,074 | | 185 | |
| | Covivio | | 1,652 | | 176 | |
| | Rexel SA | | 15,616 | | 166 | |
| | Aeroports de Paris | | 897 | | 155 | |
| | Lagardere SCA | | 7,174 | | 153 | |
| | Eurofins Scientific SE | | 333 | | 153 | |
| | SEB SA | | 964 | | 150 | |
* | | Ubisoft Entertainment SA | | 1,595 | | 129 | |
| | Ipsen SA | | 1,099 | | 116 | |
*,2 | | Worldline SA | | 1,235 | | 85 | |
| | Natixis SA | | 21,568 | | 84 | |
| | Alstom SA | | 1,726 | | 74 | |
| | BioMerieux | | 685 | | 56 | |
| | Eutelsat Communications SA | | 2,991 | | 52 | |
2 | | Amundi SA | | 799 | | 51 | |
| | ICADE | | 548 | | 48 | |
| | Sartorius Stedim Biotech | | 306 | | 47 | |
| | Faurecia SE | | 1,058 | | 46 | |
| | Nexity SA | | 875 | | 41 | |
| | Iliad SA | | 380 | | 40 | |
17
ESG International Stock ETF
| | | | | | Market | |
| | | | | | Value· | |
| | | | Shares | | ($000 | ) |
| | JCDecaux SA | | 1,477 | | 40 | |
| | CNP Assurances | | 2,067 | | 38 | |
* | | Air France-KLM | | 3,286 | | 37 | |
^ | | Casino Guichard Perrachon SA | | 840 | | 35 | |
| | Korian SA | | 804 | | 32 | |
* | | SOITEC | | 318 | | 32 | |
| | Imerys SA | | 768 | | 31 | |
| | Sopra Steria Group | | 234 | | 30 | |
| | Gaztransport Et Technigaz SA | | 320 | | 30 | |
| | Societe BIC SA | | 461 | | 29 | |
2 | | ALD SA | | 1,798 | | 27 | |
* | | CGG SA | | 12,611 | | 26 | |
| | Cie Plastic Omnium SA | | 1,050 | | 25 | |
2 | | Elior Group SA | | 1,988 | | 25 | |
| | Metropole Television SA | | 1,352 | | 23 | |
* | | Fnac Darty SA | | 311 | | 20 | |
| | Mercialys SA | | 1,640 | | 20 | |
| | Vicat SA | | 393 | | 17 | |
2 | | Maisons du Monde SA | | 858 | | 16 | |
| | IPSOS | | 389 | | 11 | |
| | Tarkett SA | | 706 | | 10 | |
| | Television Francaise 1 | | 1,071 | | 10 | |
| | Trigano SA | | 99 | | 10 | |
| | Coface SA | | 676 | | 8 | |
* | | Virbac SA | | 38 | | 7 | |
* | | DBV Technologies SA | | 384 | | 7 | |
| | Albioma SA | | 268 | | 7 | |
| | Neopost SA | | 340 | | 7 | |
| | Akka Technologies | | 83 | | 5 | |
| | Rothschild & Co. | | 174 | | 5 | |
| | Interparfums SA | | 113 | | 5 | |
2 | | Europcar Mobility Group | | 786 | | 5 | |
| | Eramet | | 97 | | 5 | |
| | Rallye SA | | 850 | | 5 | |
| | LISI | | 162 | | 4 | |
| | Altarea SCA | | 21 | | 4 | |
| | Beneteau SA | | 430 | | 4 | |
* | | Technicolor SA | | 4,381 | | 4 | |
*,2 | | SMCP SA | | 262 | | 4 | |
* | | Bourbon Corp. | | 854 | | 3 | |
| | | | | | 22,861 | |
Germany (5.8%) | | | | | |
| | SAP SE | | 23,880 | | 2,851 | |
| | Allianz SE | | 9,978 | | 2,202 | |
| | Bayer AG | | 23,471 | | 1,745 | |
| | adidas AG | | 4,842 | | 1,435 | |
| | Daimler AG | | 21,456 | | 1,010 | |
| | Deutsche Post AG | | 26,601 | | 873 | |
| | Muenchener Rueckversicherungs-Gesellschaft AG in Muenchen | | 3,245 | | 777 | |
| | Deutsche Boerse AG | | 4,591 | | 675 | |
| | Vonovia SE | | 13,171 | | 657 | |
| | Infineon Technologies AG | | 31,067 | | 538 | |
| | Fresenius SE & Co. KGaA | | 10,513 | | 511 | |
| | Henkel AG & Co. KGaA | | 5,388 | | 499 | |
| | Wirecard AG | | 2,874 | | 461 | |
| | MTU Aero Engines AG | | 1,558 | | 426 | |
| | Merck KGaA | | 3,741 | | 401 | |
| | Deutsche Bank AG | | 53,797 | | 388 | |
| | Fresenius Medical Care AG & Co. KGaA | | 5,668 | | 381 | |
| | Continental AG | | 2,969 | | 358 | |
| | Beiersdorf AG | | 2,842 | | 358 | |
| | Symrise AG Class A | | 3,677 | | 344 | |
| | Bayerische Motoren Werke AG Preference Shares | | 6,209 | | 334 | |
| | Brenntag AG | | 6,617 | | 319 | |
| | HeidelbergCement AG | | 4,422 | | 307 | |
| | Deutsche Wohnen SE | | 7,692 | | 273 | |
| | LEG Immobilien AG | | 2,145 | | 252 | |
| | Hannover Rueck SE | | 1,552 | | 247 | |
* | | QIAGEN NV | | 7,004 | | 244 | |
| | Bayerische Motoren Werke AG | | 3,576 | | 239 | |
| | LANXESS AG | | 3,718 | | 224 | |
2 | | Covestro AG | | 4,834 | | 220 | |
| | Sartorius AG Preference Shares | | 1,045 | | 210 | |
*,2 | | Scout24 AG | | 3,531 | | 209 | |
*,2 | | Zalando SE | | 4,073 | | 202 | |
| | Puma SE | | 2,570 | | 196 | |
| | Aroundtown SA | | 22,229 | | 185 | |
* | | MorphoSys AG | | 1,511 | | 179 | |
*,2 | | Delivery Hero SE | | 3,519 | | 178 | |
| | Commerzbank AG | | 30,546 | | 173 | |
| | HUGO BOSS AG | | 2,791 | | 156 | |
| | GEA Group AG | | 5,463 | | 147 | |
| | Henkel AG & Co. KGaA Preference Shares | | 1,397 | | 140 | |
| | FUCHS PETROLUB SE | | 3,781 | | 130 | |
| | K&S AG | | 7,591 | | 120 | |
| | KION Group AG | | 2,440 | | 118 | |
| | OSRAM Licht AG | | 2,914 | | 117 | |
| | Deutsche Lufthansa AG | | 7,556 | | 117 | |
| | Carl Zeiss Meditec AG | | 999 | | 115 | |
| | ProSiebenSat.1 Media SE | | 8,397 | | 111 | |
| | United Internet AG | | 3,367 | | 111 | |
2 | | Innogy SE | | 1,296 | | 65 | |
| | Axel Springer SE | | 864 | | 59 | |
* | | Dialog Semiconductor plc | | 1,215 | | 58 | |
| | CTS Eventim AG & Co. KGaA | | 994 | | 55 | |
| | Nemetschek SE | | 1,010 | | 54 | |
| | Bechtle AG | | 521 | | 52 | |
18
ESG International Stock ETF
| | | | | | Market | |
| | | | | | Value· | |
| | | | Shares | | ($000 | ) |
| | alstria office REIT-AG | | 3,042 | | 50 | |
* | | Evotec SE | | 2,226 | | 49 | |
| | Fraport AG Frankfurt Airport Services Worldwide | | 542 | | 45 | |
2 | | Siemens Healthineers AG | | 1,137 | | 45 | |
| | TLG Immobilien AG | | 1,480 | | 44 | |
| | Freenet AG | | 2,264 | | 44 | |
| | TAG Immobilien AG | | 1,874 | | 44 | |
| | Grand City Properties SA | | 1,805 | | 42 | |
| | METRO AG | | 2,587 | | 40 | |
| | Aareal Bank AG | | 1,371 | | 39 | |
| | Gerresheimer AG | | 499 | | 38 | |
| | CANCOM SE | | 620 | | 37 | |
| | RTL Group SA | | 776 | | 36 | |
| | Rational AG | | 51 | | 36 | |
| | Stroeer SE & Co. KGaA | | 451 | | 34 | |
2 | | Deutsche Pfandbriefbank AG | | 2,681 | | 32 | |
| | GRENKE AG | | 379 | | 31 | |
* | | Varta AG | | 358 | | 30 | |
| | Software AG | | 1,055 | | 28 | |
| | Telefonica Deutschland Holding AG | | 11,048 | | 28 | |
| | Aurubis AG | | 632 | | 28 | |
| | Pfeiffer Vacuum Technology AG | | 172 | | 26 | |
2 | | Hapag-Lloyd AG | | 369 | | 26 | |
| | Talanx AG | | 604 | | 25 | |
| | CompuGroup Medical SE | | 411 | | 23 | |
| | Jenoptik AG | | 927 | | 22 | |
2 | | ADO Properties SA | | 530 | | 22 | |
| | Fuchs Petrolub SE Preference Shares | | 620 | | 22 | |
| | 1&1 Drillisch AG | | 777 | | 21 | |
| | DMG Mori AG | | 455 | | 21 | |
| | Siltronic AG | | 327 | | 21 | |
| | Duerr AG | | 811 | | 21 | |
| | DIC Asset AG | | 1,490 | | 20 | |
| | Wacker Chemie AG | | 251 | | 20 | |
| | Jungheinrich AG Preference Shares | | 905 | | 19 | |
| | PATRIZIA AG | | 1,016 | | 19 | |
| | RIB Software SE | | 812 | | 18 | |
| | Krones AG | | 316 | | 17 | |
| | Deutz AG | | 2,915 | | 17 | |
* | | AIXTRON SE | | 1,618 | | 16 | |
* | | zooplus AG | | 116 | | 15 | |
| | Schaeffler AG Preference Shares | | 2,248 | | 15 | |
* | | CECONOMY AG | | 2,885 | | 15 | |
| | CropEnergies AG | | 2,299 | | 14 | |
* | | Nordex SE | | 1,327 | | 14 | |
| | Koenig & Bauer AG | | 378 | | 13 | |
| | Suedzucker AG | | 741 | | 12 | |
| | Stabilus SA | | 270 | | 12 | |
*,2 | | Rocket Internet SE | | 409 | | 11 | |
| | KWS Saat SE & Co. KGaA | | 157 | | 11 | |
| | Wacker Neuson SE | | 574 | | 10 | |
* | | Hypoport AG | | 31 | | 8 | |
| | Isra Vision AG | | 172 | | 6 | |
| | Hornbach Holding AG & Co. KGaA | | 99 | | 5 | |
2 | | Befesa SA | | 155 | | 5 | |
*,2 | | Tele Columbus AG | | 2,274 | | 5 | |
| | Washtec AG | | 87 | | 5 | |
| | Kloeckner & Co. SE | | 727 | | 4 | |
| | Draegerwerk AG & Co. KGaA | | 110 | | 4 | |
| | Corestate Capital Holding SA | | 123 | | 4 | |
| | Takkt AG | | 303 | | 4 | |
* | | Heidelberger Druckmaschinen AG | | 2,926 | | 4 | |
| | | | | | 24,198 | |
Greece (0.1%) | | | | | |
* | | Alpha Bank AE | | 53,733 | | 96 | |
| | Eurobank Ergasias SA | | 108,045 | | 96 | |
| | Fourlis Holdings SA | | 11,757 | | 70 | |
| | Hellenic Telecommunications Organization SA | | 3,868 | | 52 | |
| | JUMBO SA | | 2,220 | | 43 | |
* | | National Bank of Greece SA | | 9,839 | | 28 | |
| | Holding Co. ADMIE IPTO SA | | 11,577 | | 27 | |
* | | Piraeus Bank SA | | 6,479 | | 22 | |
* | | Ellaktor SA | | 4,982 | | 12 | |
| | Mytilineos SA | | 1,033 | | 11 | |
| | Sarantis SA | | 1,078 | | 10 | |
| | Aegean Airlines SA | | 945 | | 8 | |
* | | GEK Terna Holding Real Estate Construction SA | | 1,145 | | 8 | |
* | | LAMDA Development SA | | 418 | | 4 | |
| | | | | | 487 | |
Hong Kong (2.5%) | | | | | |
| | AIA Group Ltd. | | 304,000 | | 2,942 | |
| | Hong Kong Exchanges & Clearing Ltd. | | 33,200 | | 1,013 | |
| | Link REIT | | 49,500 | | 555 | |
| | CK Asset Holdings Ltd. | | 76,500 | | 518 | |
| | Hang Seng Bank Ltd. | | 21,700 | | 452 | |
| | BOC Hong Kong Holdings Ltd. | | 95,000 | | 319 | |
| | China Mengniu Dairy Co. Ltd. | | 76,000 | | 301 | |
| | New World Development Co. Ltd. | | 199,000 | | 248 | |
19
ESG International Stock ETF
| | | | | | Market | |
| | | | | | Value· | |
| | | | Shares | | ($000 | ) |
| | Hang Lung Properties Ltd. | | 108,000 | | 244 | |
| | Techtronic Industries Co. Ltd. | | 31,000 | | 214 | |
| | Hysan Development Co. Ltd. | | 46,000 | | 186 | |
| | Sino Land Co. Ltd. | | 126,000 | | 180 | |
| | ASM Pacific Technology Ltd. | | 15,500 | | 177 | |
2 | | WH Group Ltd. | | 219,000 | | 175 | |
| | Lenovo Group Ltd. | | 262,000 | | 172 | |
| | PCCW Ltd. | | 289,000 | | 157 | |
| | Wheelock & Co. Ltd. | | 24,000 | | 139 | |
| | Power Assets Holdings Ltd. | | 20,000 | | 133 | |
| | Wharf Holdings Ltd. | | 60,000 | | 131 | |
| | Bank of East Asia Ltd. | | 49,600 | | 125 | |
| | Swire Properties Ltd. | | 38,200 | | 125 | |
| | CK Infrastructure Holdings Ltd. | | 18,500 | | 125 | |
| | MTR Corp. Ltd. | | 20,500 | | 119 | |
| | AAC Technologies Holdings Inc. | | 26,500 | | 114 | |
| | NWS Holdings Ltd. | | 62,000 | | 107 | |
2 | | Samsonite International SA | | 50,400 | | 96 | |
| | Swire Pacific Ltd. Class A | | 9,500 | | 93 | |
| | Wharf Real Estate Investment Co. Ltd. | | 15,000 | | 81 | |
| | Hongkong Land Holdings Ltd. | | 13,600 | | 74 | |
| | Henderson Land Development Co. Ltd. | | 15,400 | | 71 | |
| | Vitasoy International Holdings Ltd. | | 14,000 | | 65 | |
| | Jardine Strategic Holdings Ltd. | | 1,900 | | 60 | |
* | | Semiconductor Manufacturing International Corp. | | 50,500 | | 55 | |
| | Hang Lung Group Ltd. | | 19,000 | | 47 | |
| | Cafe de Coral Holdings Ltd. | | 14,000 | | 45 | |
| | Fortune REIT | | 36,000 | | 41 | |
| | Sun Art Retail Group Ltd. | | 41,000 | | 40 | |
| | Tingyi Cayman Islands Holding Corp. | | 28,000 | | 38 | |
| | Xinyi Solar Holdings Ltd. | | 60,000 | | 38 | |
| | Minth Group Ltd. | | 12,000 | | 36 | |
| | Kerry Properties Ltd. | | 10,500 | | 35 | |
| | Yue Yuen Industrial Holdings Ltd. | | 13,500 | | 34 | |
2 | | BOC Aviation Ltd. | | 3,900 | | 34 | |
| | VTech Holdings Ltd. | | 3,300 | | 26 | |
| | SITC International Holdings Co. Ltd. | | 24,000 | | 25 | |
| | HKBN Ltd. | | 13,000 | | 23 | |
* | | China Silver Group Ltd. | | 154,000 | | 23 | |
| | Great Eagle Holdings Ltd. | | 6,000 | | 22 | |
| | PRADA SPA | | 7,900 | | 22 | |
| | Uni-President China Holdings Ltd. | | 19,000 | | 21 | |
| | Cathay Pacific Airways Ltd. | | 16,000 | | 21 | |
| | Pou Sheng International Holdings Ltd. | | 61,000 | | 19 | |
| | L’Occitane International SA | | 9,250 | | 18 | |
| | Kerry Logistics Network Ltd. | | 11,500 | | 18 | |
| | TPV Technology Ltd. | | 36,000 | | 17 | |
| | Value Partners Group Ltd. | | 32,000 | | 16 | |
| | Inspur International Ltd. | | 34,000 | | 15 | |
| | Haitong International Securities Group Ltd. | | 50,000 | | 15 | |
| | Johnson Electric Holdings Ltd. | | 8,500 | | 14 | |
*,2 | | Razer Inc. | | 75,000 | | 14 | |
| | Dairy Farm International Holdings Ltd. | | 1,900 | | 14 | |
| | K Wah International Holdings Ltd. | | 26,000 | | 13 | |
| | Li & Fung Ltd. | | 116,000 | | 13 | |
| | China Harmony New Energy Auto Holding Ltd. | | 44,000 | | 13 | |
* | | Hong Kong Television Network Ltd. | | 29,000 | | 12 | |
| | Man Wah Holdings Ltd. | | 26,400 | | 12 | |
| | Pacific Basin Shipping Ltd. | | 61,000 | | 12 | |
2 | | CGN New Energy Holdings Co. Ltd. | | 102,000 | | 11 | |
* | | COFCO Meat Holdings Ltd. | | 39,000 | | 11 | |
| | China Travel International Investment Hong Kong Ltd. | | 70,000 | | 11 | |
| | Canvest Environmental Protection Group Co. Ltd. | | 22,000 | | 10 | |
* | | FIH Mobile Ltd. | | 91,000 | | 10 | |
* | | Beijing Enterprises Medical & Health Group Ltd. | | 330,000 | | 10 | |
| | Henderson Investment Ltd. | | 120,000 | | 10 | |
| | Chow Tai Fook Jewellery Group Ltd. | | 11,800 | | 10 | |
| | Ju Teng International Holdings Ltd. | | 42,000 | | 10 | |
* | | GCL New Energy Holdings Ltd. | | 284,000 | | 10 | |
| | Parkson Retail Group Ltd. | | 118,500 | | 9 | |
| | EVA Precision Industrial Holdings Ltd. | | 112,000 | | 9 | |
* | | MMG Ltd. | | 44,000 | | 9 | |
| | Towngas China Co. Ltd. | | 13,000 | | 9 | |
20
ESG International Stock ETF
| | | | | | Market | |
| | | | | | Value· | |
| | | | Shares | | ($000 | ) |
* | | New World Department Store China Ltd. | | 52,000 | | 9 | |
2 | | IMAX China Holding Inc. | | 4,100 | | 9 | |
* | | Lifestyle China Group Ltd. | | 29,500 | | 9 | |
| | Lee’s Pharmaceutical Holdings Ltd. | | 16,500 | | 8 | |
| | Hongkong & Shanghai Hotels Ltd. | | 7,500 | | 8 | |
* | | Esprit Holdings Ltd. | | 52,200 | | 8 | |
| | Nexteer Automotive Group Ltd. | | 10,000 | | 8 | |
* | | HC Group Inc. | | 25,000 | | 8 | |
| | Luk Fook Holdings International Ltd. | | 3,000 | | 7 | |
| | IGG Inc. | | 10,000 | | 7 | |
| | Asia Cement China Holdings Corp. | | 5,500 | | 6 | |
* | | Honghua Group Ltd. | | 75,000 | | 5 | |
| | Gemdale Properties & Investment Corp. Ltd. | | 44,000 | | 5 | |
| | CITIC Telecom International Holdings Ltd. | | 12,000 | | 5 | |
* | | NewOcean Energy Holdings Ltd. | | 22,000 | | 5 | |
| | Guotai Junan International Holdings Ltd. | | 25,000 | | 4 | |
| | Anton Oilfield Services Group | | 40,000 | | 4 | |
| | Mandarin Oriental International Ltd. | | 2,900 | | 4 | |
2 | | Xiabuxiabu Catering Management China Holdings Co. Ltd. | | 3,000 | | 4 | |
* | | Truly International Holdings Ltd. | | 28,000 | | 4 | |
| | Lifestyle International Holdings Ltd. | | 3,000 | | 3 | |
| | SA Sa International Holdings Ltd. | | 14,000 | | 3 | |
* | | China LNG Group Ltd. | | 42,000 | | 3 | |
| | NOVA Group Holdings Ltd. | | 10,000 | | 2 | |
*,§ | | Camsing International Holding Ltd. | | 6,000 | | 1 | |
| | | | | | 10,650 | |
Hungary (0.1%) | | | | | |
| | OTP Bank Nyrt | | 6,886 | | 274 | |
| | Richter Gedeon Nyrt | | 7,299 | | 122 | |
| | | | | | 396 | |
India (2.5%) | | | | | |
| | Housing Development Finance Corp. Ltd. | | 46,357 | | 1,408 | |
| | Infosys Ltd. | | 99,317 | | 1,134 | |
| | Tata Consultancy Services Ltd. | | 23,783 | | 752 | |
| | Hindustan Unilever Ltd. | | 19,898 | | 525 | |
| | Axis Bank Ltd. | | 54,362 | | 506 | |
| | Bajaj Finance Ltd. | | 6,561 | | 307 | |
| | HCL Technologies Ltd. | | 17,056 | | 263 | |
* | | State Bank of India | | 68,332 | | 262 | |
| | Bharti Airtel Ltd. | | 51,644 | | 251 | |
| | Asian Paints Ltd. | | 10,989 | | 249 | |
| | Sun Pharmaceutical Industries Ltd. | | 34,309 | | 216 | |
| | UltraTech Cement Ltd. | | 3,723 | | 211 | |
| | Titan Co. Ltd. | | 12,416 | | 192 | |
| | UPL Ltd. | | 23,160 | | 183 | |
| | Bajaj Finserv Ltd. | | 1,793 | | 179 | |
| | JSW Steel Ltd. | | 55,401 | | 169 | |
| | Wipro Ltd. | | 46,325 | | 165 | |
| | Hero MotoCorp Ltd. | | 4,541 | | 164 | |
| | Godrej Consumer Products Ltd. | | 17,409 | | 149 | |
| | Bharti Infratel Ltd. | | 28,086 | | 99 | |
| | Piramal Enterprises Ltd. | | 3,285 | | 93 | |
| | Eicher Motors Ltd. | | 396 | | 90 | |
| | Shriram Transport Finance Co. Ltd. | | 6,382 | | 86 | |
2 | | HDFC Life Insurance Co. Ltd. | | 10,623 | | 83 | |
| | Zee Entertainment Enterprises Ltd. | | 15,243 | | 80 | |
| | Nestle India Ltd. | | 354 | | 64 | |
2 | | SBI Life Insurance Co. Ltd. | | 5,248 | | 62 | |
| | Karnataka Bank Ltd. | | 55,236 | | 58 | |
| | Indiabulls Housing Finance Ltd. | | 9,039 | | 58 | |
* | | Tata Motors Ltd. | | 34,962 | | 57 | |
* | | IDFC First Bank Ltd. | | 90,551 | | 55 | |
| | Bajaj Consumer Care Ltd. | | 14,146 | | 50 | |
| | Dr Reddy’s Laboratories Ltd. | | 1,390 | | 50 | |
| | Bajaj Auto Ltd. | | 1,203 | | 47 | |
2 | | InterGlobe Aviation Ltd. | | 1,914 | | 45 | |
| | Dabur India Ltd. | | 7,189 | | 45 | |
| | South Indian Bank Ltd. | | 286,528 | | 44 | |
2 | | ICICI Lombard General Insurance Co. Ltd. | | 2,336 | | 41 | |
| | Info Edge India Ltd. | | 1,415 | | 40 | |
*,2 | | Avenue Supermarts Ltd. Class A | | 1,729 | | 38 | |
| | Marico Ltd. | | 6,353 | | 35 | |
| | Grasim Industries Ltd. | | 3,458 | | 34 | |
| | Yes Bank Ltd. | | 40,822 | | 34 | |
| | Aurobindo Pharma Ltd. | | 3,992 | | 34 | |
| | Petronet LNG Ltd. | | 8,665 | | 32 | |
2 | | RBL Bank Ltd. | | 6,624 | | 30 | |
| | Hindalco Industries Ltd. | | 11,451 | | 30 | |
| | Lupin Ltd. | | 2,763 | | 29 | |
21
ESG International Stock ETF
| | | | | | Market | |
| | | | | | Value· | |
| | | | Shares | | ($000 | ) |
| | Mindtree Ltd. | | 2,916 | | 28 | |
| | Havells India Ltd. | | 2,929 | | 28 | |
| | Power Grid Corp. of India Ltd. | | 9,800 | | 28 | |
| | Cipla Ltd. | | 4,106 | | 27 | |
| | Ambuja Cements Ltd. | | 9,467 | | 27 | |
2 | | ICICI Prudential Life Insurance Co. Ltd. | | 4,416 | | 26 | |
| | Britannia Industries Ltd. | | 691 | | 26 | |
| | Shree Cement Ltd. | | 99 | | 26 | |
* | | Aavas Financiers Ltd. | | 1,225 | | 26 | |
| | Apollo Hospitals Enterprise Ltd. | | 1,116 | | 24 | |
| | Federal Bank Ltd. | | 19,322 | | 22 | |
| | Page Industries Ltd. | | 84 | | 22 | |
| | Divi’s Laboratories Ltd. | | 963 | | 22 | |
* | | Future Retail Ltd. | | 3,534 | | 20 | |
| | Rajesh Exports Ltd. | | 1,924 | | 19 | |
* | | PTC India Ltd. | | 23,417 | | 19 | |
| | Container Corp. Of India Ltd. | | 2,588 | | 18 | |
2 | | AU Small Finance Bank Ltd. | | 1,918 | | 18 | |
| | Mahindra & Mahindra Financial Services Ltd. | | 3,961 | | 18 | |
| | Colgate-Palmolive India Ltd. | | 973 | | 17 | |
| | Crompton Greaves Consumer Electricals Ltd. | | 5,364 | | 17 | |
| | REC Ltd. | | 8,509 | | 17 | |
| | Gujarat Pipavav Port Ltd. | | 15,221 | | 17 | |
| | Jubilant Foodworks Ltd. | | 960 | | 16 | |
| | LIC Housing Finance Ltd. | | 2,680 | | 16 | |
| | NHPC Ltd. | | 47,292 | | 15 | |
| | GlaxoSmithKline Consumer Healthcare Ltd. | | 134 | | 15 | |
| | Bajaj Holdings & Investment Ltd. | | 333 | | 15 | |
| | Gillette India Ltd. | | 148 | | 15 | |
* | | Just Dial Ltd. | | 1,477 | | 15 | |
| | CESC Ltd. | | 1,312 | | 14 | |
| | Indian Hotels Co. Ltd. | | 7,236 | | 14 | |
| | Berger Paints India Ltd. | | 2,713 | | 14 | |
| | Mphasis Ltd. | | 1,023 | | 14 | |
| | Tata Global Beverages Ltd. | | 3,494 | | 14 | |
| | Alkem Laboratories Ltd. | | 536 | | 14 | |
| | Ashok Leyland Ltd. | | 14,824 | | 13 | |
* | | Max Financial Services Ltd. | | 2,229 | | 13 | |
* | | Adani Transmission Ltd. | | 3,985 | | 13 | |
| | Hindustan Zinc Ltd. | | 4,257 | | 13 | |
* | | Fortis Healthcare Ltd. | | 7,314 | | 13 | |
| | Voltas Ltd. | | 1,414 | | 13 | |
| | V-Mart Retail Ltd. | | 446 | | 12 | |
| | DLF Ltd. | | 5,259 | | 12 | |
| | PI Industries Ltd. | | 775 | | 12 | |
* | | Oracle Financial Services Software Ltd. | | 281 | | 12 | |
* | | Power Finance Corp. Ltd. | | 8,107 | | 12 | |
| | Torrent Pharmaceuticals Ltd. | | 493 | | 12 | |
| | ABB India Ltd. | | 626 | | 12 | |
| | Gateway Distriparks Ltd. | | 8,510 | | 12 | |
| | City Union Bank Ltd. | | 4,097 | | 12 | |
* | | Vodafone Idea Ltd. | | 155,334 | | 12 | |
| | AIA Engineering Ltd. | | 535 | | 12 | |
| | NMDC Ltd. | | 9,795 | | 11 | |
* | | Godrej Properties Ltd. | | 900 | | 11 | |
| | Castrol India Ltd. | | 6,536 | | 11 | |
* | | Bank of Baroda | | 8,486 | | 11 | |
| | Gujarat Gas Ltd. | | 4,317 | | 11 | |
2 | | Bandhan Bank Ltd. | | 1,625 | | 11 | |
| | Kansai Nerolac Paints Ltd. | | 1,648 | | 11 | |
| | Muthoot Finance Ltd. | | 1,227 | | 10 | |
*,§ | | India Infoline | | 3,227 | | 10 | |
| | TVS Motor Co. Ltd. | | 2,003 | | 10 | |
| | Natco Pharma Ltd. | | 1,306 | | 10 | |
| | Glenmark Pharmaceuticals Ltd. | | 1,823 | | 10 | |
| | Cholamandalam Financial Holdings Ltd. | | 1,545 | | 10 | |
2 | | HDFC Asset Management Co. Ltd. | | 272 | | 10 | |
| | Manappuram Finance Ltd. | | 5,742 | | 10 | |
| | Oberoi Realty Ltd. | | 1,178 | | 9 | |
| | Mahanagar Gas Ltd. | | 789 | | 9 | |
| | Gujarat State Petronet Ltd. | | 3,007 | | 9 | |
* | | VA Tech Wabag Ltd. | | 2,381 | | 9 | |
| | Ipca Laboratories Ltd. | | 686 | | 9 | |
| | Cholamandalam Investment and Finance Co. Ltd. | | 2,410 | | 9 | |
| | Apollo Tyres Ltd. | | 3,748 | | 9 | |
| | Cadila Healthcare Ltd. | | 2,846 | | 9 | |
| | Indraprastha Gas Ltd. | | 1,877 | | 9 | |
2 | | Dr Lal PathLabs Ltd. | | 496 | | 9 | |
| | Varun Beverages Ltd. | | 939 | | 9 | |
* | | RattanIndia Power Ltd. | | 605,343 | | 8 | |
* | | Aditya Birla Capital Ltd. | | 6,712 | | 8 | |
| | Phoenix Mills Ltd. | | 859 | | 8 | |
| | Reliance Home Finance Ltd. | | 104,090 | | 8 | |
| | GRUH Finance Ltd. | | 2,265 | | 8 | |
| | Supreme Industries Ltd. | | 527 | | 8 | |
* | | Punjab National Bank | | 8,972 | | 8 | |
| | Whirlpool of India Ltd. | | 375 | | 8 | |
| | Sundaram Finance Ltd. | | 378 | | 8 | |
| | L&T Finance Holdings Ltd. | | 6,036 | | 8 | |
2 | | Godrej Agrovet Ltd. | | 1,247 | | 8 | |
| | Dalmia Bharat Ltd. | | 621 | | 8 | |
| | Ramco Cements Ltd. | | 759 | | 8 | |
22
ESG International Stock ETF
| | | | | | Market | |
| | | | | | Value· | |
| | | | Shares | | ($000 | ) |
| | Astral Poly Technik Ltd. | | 413 | | 8 | |
| | Edelweiss Financial Services Ltd. | | 4,784 | | 7 | |
| | DCB Bank Ltd. | | 2,541 | | 7 | |
* | | TeamLease Services Ltd. | | 192 | | 7 | |
| | Prestige Estates Projects Ltd. | | 1,762 | | 7 | |
| | Emami Ltd. | | 1,735 | | 7 | |
| | Bata India Ltd. | | 334 | | 7 | |
| | Hexaware Technologies Ltd. | | 1,324 | | 7 | |
| | Vakrangee Ltd. | | 16,629 | | 7 | |
| | Cummins India Ltd. | | 880 | | 7 | |
| | PVR Ltd. | | 321 | | 7 | |
| | Srei Infrastructure Finance Ltd. | | 44,211 | | 7 | |
* | | 3M India Ltd. | | 24 | | 7 | |
| | Tata Communications Ltd. | | 1,129 | | 7 | |
| | Great Eastern Shipping Co. Ltd. | | 2,017 | | 7 | |
| | Exide Industries Ltd. | | 2,696 | | 7 | |
* | | Aditya Birla Fashion and Retail Ltd. | | 2,518 | | 7 | |
* | | Multi Commodity Exchange of India Ltd. | | 482 | | 7 | |
| | Pfizer Ltd. | | 160 | | 7 | |
| | Balkrishna Industries Ltd. | | 623 | | 7 | |
| | Kajaria Ceramics Ltd. | | 976 | | 6 | |
| | Godrej Industries Ltd. | | 1,095 | | 6 | |
| | WABCO India Ltd. | | 74 | | 6 | |
| | SRF Ltd. | | 162 | | 6 | |
| | Thermax Ltd. | | 447 | | 6 | |
2 | | Laurus Labs Ltd. | | 1,344 | | 6 | |
| | Sobha Ltd. | | 820 | | 6 | |
| | Jubilant Life Sciences Ltd. | | 988 | | 6 | |
| | Redington India Ltd. | | 3,906 | | 6 | |
| | Aarti Industries Ltd. | | 265 | | 6 | |
| | Sundram Fasteners Ltd. | | 990 | | 6 | |
| | GE Power India Ltd. | | 546 | | 6 | |
| | V-Guard Industries Ltd. | | 1,797 | | 6 | |
| | EIH Ltd. | | 2,553 | | 6 | |
* | | Shipping Corp. of India Ltd. | | 14,521 | | 6 | |
* | | Canara Bank | | 1,834 | | 6 | |
* | | Jaiprakash Associates Ltd. | | 185,255 | | 6 | |
| | Steel Authority of India Ltd. | | 12,672 | | 6 | |
| | Kaveri Seed Co. Ltd. | | 830 | | 6 | |
| | Coromandel International Ltd. | | 1,002 | | 5 | |
| | Escorts Ltd. | | 754 | | 5 | |
| | Alembic Pharmaceuticals Ltd. | | 764 | | 5 | |
| | Welspun India Ltd. | | 7,521 | | 5 | |
| | Ajanta Pharma Ltd. | | 367 | | 5 | |
2 | | Syngene International Ltd. | | 1,188 | | 5 | |
| | Persistent Systems Ltd. | | 672 | | 5 | |
| | Welspun Corp. Ltd. | | 2,977 | | 5 | |
| | Bayer CropScience Ltd. | | 115 | | 5 | |
| | Birlasoft Ltd. | | 5,410 | | 5 | |
| | Minda Industries Ltd. | | 1,049 | | 5 | |
| | Century Textiles & Industries Ltd. | | 410 | | 5 | |
* | | Suzlon Energy Ltd. | | 93,150 | | 5 | |
| | Indiabulls Ventures Ltd. | | 1,918 | | 5 | |
| | Cox & Kings Ltd. | | 76,541 | | 5 | |
| | Symphony Ltd. | | 269 | | 5 | |
| | Thomas Cook India Ltd. | | 2,373 | | 5 | |
| | Motilal Oswal Financial Services Ltd. | | 582 | | 5 | |
* | | McLeod Russel India Ltd. | | 27,811 | | 5 | |
* | | Chambal Fertilizers and Chemicals Ltd. | | 2,154 | | 5 | |
* | | Sintex Plastics Technology Ltd. | | 86,981 | | 5 | |
| | NCC Ltd. | | 5,933 | | 5 | |
| | KRBL Ltd. | | 1,503 | | 5 | |
* | | Jammu & Kashmir Bank Ltd. | | 7,673 | | 5 | |
*,§ | | Inox Fluorochemicals Ltd. | | 432 | | 4 | |
*,2 | | Quess Corp. Ltd. | | 673 | | 4 | |
* | | IDFC Ltd. | | 8,946 | | 4 | |
| | Mangalore Refinery & Petrochemicals Ltd. | | 6,888 | | 4 | |
* | | Equitas Holdings Ltd. | | 2,812 | | 4 | |
| | Karur Vysya Bank Ltd. | | 5,392 | | 4 | |
| | Care Ratings Ltd. | | 582 | | 4 | |
2 | | PNB Housing Finance Ltd. | | 482 | | 4 | |
* | | DEN Networks Ltd. | | 3,516 | | 4 | |
| | Strides Pharma Science Ltd. | | 811 | | 4 | |
| | Bombay Burmah Trading Co. | | 341 | | 4 | |
2 | | Endurance Technologies Ltd. | | 331 | | 4 | |
| | Finolex Cables Ltd. | | 829 | | 4 | |
| | JM Financial Ltd. | | 4,118 | | 4 | |
* | | Mahindra CIE Automotive Ltd. | | 1,942 | | 4 | |
| | Amara Raja Batteries Ltd. | | 475 | | 4 | |
| | Ceat Ltd. | | 311 | | 4 | |
| | TTK Prestige Ltd. | | 49 | | 4 | |
* | | Indian Bank | | 1,384 | | 4 | |
| | Jindal Saw Ltd. | | 3,964 | | 4 | |
* | | Oriental Bank of Commerce | | 3,711 | | 4 | |
*,2 | | Eris Lifesciences Ltd. | | 715 | | 4 | |
| | Avanti Feeds Ltd. | | 851 | | 4 | |
| | Blue Dart Express Ltd. | | 120 | | 4 | |
* | | Union Bank of India | | 4,490 | | 4 | |
* | | Andhra Bank | | 13,158 | | 4 | |
| | National Aluminium Co. Ltd. | | 6,174 | | 4 | |
* | | Indian Overseas Bank | | 24,184 | | 4 | |
| | Sintex Industries Ltd. | | 119,163 | | 4 | |
| | Jain Irrigation Systems Ltd. | | 12,682 | | 3 | |
23
ESG International Stock ETF
| | | | | | Market | |
| | | | | | Value· | |
| | | | Shares | | ($000 | ) |
| | NBCC India Ltd. | | 6,806 | | 3 | |
| | Graphite India Ltd. | | 892 | | 3 | |
| | Repco Home Finance Ltd. | | 769 | | 3 | |
2 | | Dilip Buildcon Ltd. | | 627 | | 3 | |
* | | Corp Bank | | 11,787 | | 3 | |
* | | Future Consumer Ltd. | | 7,924 | | 3 | |
* | | IRB Infrastructure Developers Ltd. | | 2,871 | | 3 | |
* | | Dewan Housing Finance Corp. Ltd. | | 4,307 | | 3 | |
| | Arvind Ltd. | | 4,177 | | 3 | |
| | eClerx Services Ltd. | | 443 | | 3 | |
| | PC Jeweller Ltd. | | 5,891 | | 3 | |
| | HEG Ltd. | | 207 | | 3 | |
* | | Housing Development & Infrastructure Ltd. | | 33,909 | | 3 | |
| | NIIT Technologies Ltd. | | 127 | | 3 | |
| | GE T&D India Ltd. | | 1,215 | | 3 | |
| | Sterlite Technologies Ltd. | | 1,514 | | 2 | |
* | | Indiabulls Real Estate Ltd. | | 1,911 | | 2 | |
* | | Reliance Communications Ltd. | | 124,474 | | 1 | |
* | | Arti Surfactants Ltd. | | 26 | | — | |
| | | | | | 10,645 | |
Indonesia (0.6%) | | | | | |
| | Bank Rakyat Indonesia Persero Tbk PT | | 1,486,500 | | 446 | |
| | Telekomunikasi Indonesia Persero Tbk PT | | 1,391,100 | | 437 | |
| | Bank Central Asia Tbk PT | | 183,700 | | 394 | |
| | Bank Mandiri Persero Tbk PT | | 548,600 | | 279 | |
| | Bank Negara Indonesia Persero Tbk PT | | 319,800 | | 173 | |
| | Unilever Indonesia Tbk PT | | 40,400 | | 139 | |
| | Charoen Pokphand Indonesia Tbk PT | | 149,200 | | 53 | |
| | Indofood CBP Sukses Makmur Tbk PT | | 55,300 | | 47 | |
| | Indofood Sukses Makmur Tbk PT | | 81,400 | | 45 | |
| | Kalbe Farma Tbk PT | | 344,000 | | 41 | |
| | Indocement Tunggal Prakarsa Tbk PT | | 16,500 | | 25 | |
| | Indah Kiat Pulp & Paper Corp. Tbk PT | | 51,500 | | 25 | |
| | Barito Pacific Tbk PT | | 384,000 | | 24 | |
| | Ciputra Development Tbk PT | | 294,200 | | 23 | |
| | Summarecon Agung Tbk PT | | 281,200 | | 21 | |
| | Pabrik Kertas Tjiwi Kimia Tbk PT | | 26,400 | | 19 | |
| | Ace Hardware Indonesia Tbk PT | | 148,900 | | 18 | |
| | Tower Bersama Infrastructure Tbk PT | | 39,000 | | 16 | |
| | Pakuwon Jati Tbk PT | | 327,100 | | 15 | |
| | Jasa Marga Persero Tbk PT | | 36,800 | | 15 | |
| | Bank Tabungan Negara Persero Tbk PT | | 94,700 | | 13 | |
* | | Sentul City Tbk PT | | 1,413,700 | | 12 | |
| | Media Nusantara Citra Tbk PT | | 126,700 | | 11 | |
* | | XL Axiata Tbk PT | | 40,000 | | 10 | |
| | Matahari Department Store Tbk PT | | 46,000 | | 10 | |
| | Surya Semesta Internusa Tbk PT | | 189,700 | | 10 | |
| | Bekasi Fajar Industrial Estate Tbk PT | | 309,100 | | 7 | |
| | Wijaya Karya Persero Tbk PT | | 39,500 | | 6 | |
* | | Agung Podomoro Land Tbk PT | | 456,400 | | 6 | |
* | | Bumi Serpong Damai Tbk PT | | 57,300 | | 5 | |
* | | Siloam International Hospitals Tbk PT | | 11,600 | | 5 | |
| | Mitra Adiperkasa Tbk PT | | 68,800 | | 5 | |
| | PP Persero Tbk PT | | 36,200 | | 5 | |
| | Waskita Karya Persero Tbk PT | | 38,300 | | 5 | |
* | | Panin Financial Tbk PT | | 210,700 | | 5 | |
* | | Kresna Graha Investama Tbk PT | | 112,700 | | 4 | |
| | Ramayana Lestari Sentosa Tbk PT | | 41,400 | | 4 | |
* | | Trada Alam Minera Tbk PT | | 477,100 | | 3 | |
| | Surya Citra Media Tbk PT | | 39,400 | | 3 | |
* | | Global Mediacom Tbk PT | | 94,100 | | 2 | |
| | | | | | 2,386 | |
Ireland (0.2%) | | | | | |
| | Kerry Group plc Class A | | 4,025 | | 479 | |
| | Kingspan Group plc | | 4,877 | | 223 | |
| | Bank of Ireland Group plc | | 31,672 | | 120 | |
| | Green REIT plc | | 22,133 | | 46 | |
| | Glanbia plc | | 2,806 | | 31 | |
| | AIB Group plc | | 11,591 | | 29 | |
| | Dalata Hotel Group plc | | 4,099 | | 20 | |
* | | Cairn Homes plc | | 15,088 | | 17 | |
| | Irish Continental Group plc | | 1,849 | | 8 | |
| | | | | | 973 | |
Israel (0.4%) | | | | | |
* | | Nice Ltd. | | 2,146 | | 329 | |
| | Bank Leumi Le-Israel BM | | 37,940 | | 259 | |
24
ESG International Stock ETF
| | | | | | Market | |
| | | | | | Value· | |
| | | | Shares | | ($000 | ) |
* | | Bank Hapoalim BM | | 30,690 | | 225 | |
| | Israel Discount Bank Ltd. Class A | | 46,841 | | 195 | |
* | | Teva Pharmaceutical Industries Ltd. | | 20,675 | | 144 | |
| | Israel Chemicals Ltd. | | 21,582 | | 97 | |
| | Mizrahi Tefahot Bank Ltd. | | 2,719 | | 63 | |
| | First International Bank Of Israel Ltd. | | 1,727 | | 45 | |
| | Strauss Group Ltd. | | 1,339 | | 40 | |
| | Azrieli Group Ltd. | | 471 | | 35 | |
* | | Tower Semiconductor Ltd. | | 1,674 | | 32 | |
| | Bezeq The Israeli Telecommunication Corp. Ltd. | | 36,574 | | 23 | |
* | | Nova Measuring Instruments Ltd. | | 680 | | 19 | |
| | Paz Oil Co. Ltd. | | 134 | | 18 | |
| | Gazit-Globe Ltd. | | 1,409 | | 14 | |
| | Shikun & Binui Ltd. | | 4,180 | | 13 | |
| | Kenon Holdings Ltd. | | 574 | | 12 | |
| | Hilan Ltd. | | 212 | | 8 | |
| | Harel Insurance Investments & Financial Services Ltd. | | 1,042 | | 8 | |
| | Reit 1 Ltd. | | 1,249 | | 7 | |
| | AudioCodes Ltd. | | 396 | | 7 | |
* | | Allot Ltd. | | 857 | | 6 | |
* | | Clal Insurance Enterprises Holdings Ltd. | | 417 | | 6 | |
| | | | | | 1,605 | |
Italy (1.6%) | | | | | |
| | Intesa Sanpaolo SPA (Registered) | | 352,060 | | 775 | |
| | UniCredit SPA | | 56,742 | | 631 | |
| | Ferrari NV | | 3,239 | | 511 | |
| | Assicurazioni Generali SPA | | 26,955 | | 490 | |
| | Fiat Chrysler Automobiles NV | | 29,270 | | 383 | |
| | Snam SPA | | 71,836 | | 364 | |
| | CNH Industrial NV | | 32,789 | | 338 | |
| | Terna Rete Elettrica Nazionale SPA | | 48,523 | | 306 | |
| | Mediobanca Banca di Credito Finanziario SPA | | 27,338 | | 272 | |
| | EXOR NV | | 3,468 | | 236 | |
| | Moncler SPA | | 5,686 | | 214 | |
| | FinecoBank Banca Fineco SPA | | 19,754 | | 205 | |
| | Telecom Italia SPA (Bearer) | | 380,481 | | 195 | |
| | Tenaris SA | | 15,534 | | 169 | |
| | Recordati SPA | | 1,553 | | 68 | |
2 | | Poste Italiane SPA | | 5,597 | | 60 | |
* | | Telecom Italia SPA (Registered) | | 92,941 | | 50 | |
| | Hera SPA | | 11,818 | | 47 | |
| | Amplifon SPA | | 1,809 | | 47 | |
| | Unipol Gruppo SPA | | 9,078 | | 46 | |
| | Cerved Group SPA | | 5,400 | | 44 | |
| | Societa Cattolica di Assicurazioni SC | | 5,056 | | 41 | |
* | | Saipem SPA | | 8,611 | | 41 | |
| | Tamburi Investment Partners SPA | | 6,237 | | 39 | |
| | Iren SPA | | 14,352 | | 39 | |
* | | Banco BPM SPA | | 19,169 | | 39 | |
| | DiaSorin SPA | | 325 | | 39 | |
| | Banca Mediolanum SPA | | 5,260 | | 38 | |
| | Banca Generali SPA | | 1,278 | | 38 | |
2 | | Infrastrutture Wireless Italiane SPA | | 3,734 | | 37 | |
| | Autogrill SPA | | 3,798 | | 37 | |
| | Interpump Group SPA | | 1,278 | | 36 | |
| | Azimut Holding SPA | | 2,030 | | 36 | |
| | Unione di Banche Italiane SPA | | 13,928 | | 36 | |
| | Buzzi Unicem SPA | | 1,643 | | 35 | |
2 | | Pirelli & C SPA | | 6,606 | | 34 | |
| | A2A SPA | | 19,170 | | 34 | |
2 | | doValue SPA | | 2,971 | | 33 | |
| | ASTM SPA | | 948 | | 29 | |
2 | | Enav SPA | | 5,137 | | 29 | |
| | Italgas SPA | | 4,404 | | 29 | |
| | Freni Brembo SPA | | 2,943 | | 27 | |
| | Salvatore Ferragamo SPA | | 1,402 | | 27 | |
| | Reply SPA | | 422 | | 25 | |
| | Banca Popolare di Sondrio SCPA | | 13,219 | | 25 | |
| | IMA Industria Macchine Automatiche SPA | | 359 | | 25 | |
| | Saras SPA | | 15,485 | | 24 | |
| | De’ Longhi SPA | | 1,201 | | 23 | |
2 | | Anima Holding SPA | | 6,173 | | 22 | |
| | BPER Banca | | 6,100 | | 22 | |
| | UnipolSai Assicurazioni SPA | | 8,031 | | 20 | |
| | Piaggio & C SPA | | 6,297 | | 20 | |
| | Brunello Cucinelli SPA | | 652 | | 20 | |
2 | | Technogym SPA | | 1,799 | | 18 | |
| | Danieli & C Officine Meccaniche SPA | | 1,043 | | 17 | |
| | ERG SPA | | 857 | | 17 | |
| | Italmobiliare SPA | | 736 | | 16 | |
^ | | Tod’s SPA | | 291 | | 15 | |
* | | Juventus Football Club SPA | | 6,788 | | 11 | |
* | | Salini Impregilo SPA | | 5,545 | | 11 | |
| | Maire Tecnimont SPA | | 3,314 | | 8 | |
| | Datalogic SPA | | 517 | | 7 | |
25
ESG International Stock ETF
| | | | | | Market | |
| | | | | | Value· | |
| | | | Shares | | ($000 | ) |
* | | Arnoldo Mondadori Editore SPA | | 4,725 | | 7 | |
| | MARR SPA | | 335 | | 7 | |
| | Biesse SPA | | 595 | | 7 | |
| | Societa Iniziative Autostradali e Servizi SPA | | 365 | | 6 | |
| | CIR-Compagnie Industriali Riunite SPA | | 5,481 | | 5 | |
*,2 | | OVS SPA | | 2,794 | | 5 | |
2 | | Gima TT SPA | | 623 | | 5 | |
* | | Banca Monte dei Paschi di Siena SPA | | 2,477 | | 4 | |
| | Buzzi Unicem SPA Saving Shares | | 265 | | 4 | |
| | Banca IFIS SPA | | 199 | | 3 | |
| | Immobiliare Grande | | | | | |
| | Distribuzione SIIQ SPA | | 436 | | 3 | |
| | | | | | 6,626 | |
Japan (19.3%) | | | | | |
| | Toyota Motor Corp. | | 61,000 | | 3,995 | |
| | SoftBank Group Corp. | | 43,700 | | 1,980 | |
| | Sony Corp. | | 32,100 | | 1,828 | |
| | Mitsubishi UFJ Financial Group Inc. | | 304,400 | | 1,465 | |
| | Takeda Pharmaceutical Co. Ltd. | | 39,257 | | 1,324 | |
| | Keyence Corp. | | 2,100 | | 1,241 | |
| | KDDI Corp. | | 43,700 | | 1,164 | |
| | Daiichi Sankyo Co. Ltd. | | 16,300 | | 1,075 | |
| | Honda Motor Co. Ltd. | | 44,100 | | 1,045 | |
| | Sumitomo Mitsui Financial Group Inc. | | 31,100 | | 1,019 | |
| | Kao Corp. | | 13,700 | | 989 | |
| | Shin-Etsu Chemical Co. Ltd. | | 9,700 | | 977 | |
| | Recruit Holdings Co. Ltd. | | 31,400 | | 951 | |
| | Tokyo Electron Ltd. | | 5,300 | | 945 | |
| | Nintendo Co. Ltd. | | 2,400 | | 908 | |
| | Nidec Corp. | | 6,800 | | 885 | |
| | Oriental Land Co. Ltd. | | 6,000 | | 873 | |
| | Tokio Marine Holdings Inc. | | 16,900 | | 869 | |
| | East Japan Railway Co. | | 9,100 | | 866 | |
| | Mizuho Financial Group Inc. | | 590,200 | | 858 | |
| | Central Japan Railway Co. | | 4,300 | | 850 | |
| | FANUC Corp. | | 4,800 | | 831 | |
| | Nippon Telegraph & Telephone Corp. | | 16,500 | | 791 | |
| | Shiseido Co. Ltd. | | 9,600 | | 785 | |
| | Seven & i Holdings Co. Ltd. | | 21,800 | | 771 | |
| | Hoya Corp. | | 9,300 | | 756 | |
| | NTT DOCOMO Inc. | | 28,700 | | 724 | |
| | Astellas Pharma Inc. | | 52,400 | | 723 | |
| | Fast Retailing Co. Ltd. | | 1,100 | | 644 | |
| | Murata Manufacturing Co. Ltd. | | 15,200 | | 632 | |
| | Mitsui Fudosan Co. Ltd. | | 25,500 | | 611 | |
| | Mitsubishi Estate Co. Ltd. | | 31,800 | | 608 | |
| | Canon Inc. | | 23,400 | | 607 | |
| | Softbank Corp. | | 41,100 | | 576 | |
| | Daiwa House Industry Co. Ltd. | | 17,300 | | 542 | |
| | West Japan Railway Co. | | 6,300 | | 531 | |
| | Secom Co. Ltd. | | 6,100 | | 520 | |
| | Terumo Corp. | | 17,300 | | 502 | |
| | ORIX Corp. | | 34,000 | | 502 | |
| | Kyocera Corp. | | 8,200 | | 487 | |
| | Chugai Pharmaceutical Co. Ltd. | | 6,600 | | 471 | |
| | Fujitsu Ltd. | | 6,100 | | 470 | |
| | Panasonic Corp. | | 60,200 | | 464 | |
| | SMC Corp. | | 1,200 | | 452 | |
| | Subaru Corp. | | 16,900 | | 452 | |
| | Kubota Corp. | | 30,800 | | 441 | |
| | Bridgestone Corp. | | 11,600 | | 439 | |
| | Denso Corp. | | 10,400 | | 436 | |
| | Shionogi & Co. Ltd. | | 8,000 | | 428 | |
| | Dai-ichi Life Holdings Inc. | | 31,100 | | 423 | |
| | Nomura Holdings Inc. | | 100,900 | | 407 | |
| | Suzuki Motor Corp. | | 10,300 | | 397 | |
| | FUJIFILM Holdings Corp. | | 9,000 | | 385 | |
^ | | Aeon Co. Ltd. | | 21,600 | | 383 | |
| | Bandai Namco Holdings Inc. | | 6,400 | | 376 | |
| | Sysmex Corp. | | 5,900 | | 376 | |
| | Eisai Co. Ltd. | | 7,200 | | 367 | |
| | Sumitomo Realty & Development Co. Ltd. | | 9,300 | | 349 | |
| | Sompo Holdings Inc. | | 8,700 | | 347 | |
| | MS&AD Insurance Group Holdings Inc. | | 10,600 | | 336 | |
| | Kintetsu Group Holdings Co. Ltd. | | 6,400 | | 319 | |
| | Toyota Industries Corp. | | 5,800 | | 318 | |
| | Pan Pacific International Holdings Corp. | | 20,000 | | 313 | |
| | Yakult Honsha Co. Ltd. | | 5,400 | | 311 | |
| | Sumitomo Electric Industries Ltd. | | 26,300 | | 309 | |
| | Omron Corp. | | 6,100 | | 301 | |
| | Rohm Co. Ltd. | | 4,200 | | 299 | |
| | Asahi Kasei Corp. | | 33,000 | | 298 | |
| | Sumitomo Mitsui Trust Holdings Inc. | | 9,100 | | 297 | |
| | Sekisui House Ltd. | | 16,400 | | 291 | |
| | M3 Inc. | | 13,700 | | 290 | |
| | Toray Industries Inc. | | 40,800 | | 290 | |
| | Unicharm Corp. | | 9,300 | | 285 | |
26
ESG International Stock ETF
| | | | | | Market | |
| | | | | | Value· | |
| | | | Shares | | ($000 | ) |
| | Ono Pharmaceutical Co. Ltd. | | 14,900 | | 275 | |
| | Nitto Denko Corp. | | 5,900 | | 274 | |
| | Ajinomoto Co. Inc. | | 15,000 | | 273 | |
| | Sumitomo Metal Mining Co. Ltd. | | 9,700 | | 273 | |
| | Nippon Paint Holdings Co. Ltd. | | 5,700 | | 269 | |
| | Santen Pharmaceutical Co. Ltd. | | 15,300 | | 268 | |
| | Advantest Corp. | | 6,500 | | 266 | |
| | NEC Corp. | | 6,200 | | 265 | |
| | NTT Data Corp. | | 20,500 | | 264 | |
| | Nissan Motor Co. Ltd. | | 42,700 | | 264 | |
| | Resona Holdings Inc. | | 67,200 | | 263 | |
| | Tokyu Corp. | | 14,600 | | 261 | |
| | Yaskawa Electric Corp. | | 7,700 | | 258 | |
| | Dai Nippon Printing Co. Ltd. | | 11,800 | | 255 | |
| | Mitsubishi Chemical Holdings Corp. | | 37,100 | | 254 | |
| | Sekisui Chemical Co. Ltd. | | 17,400 | | 250 | |
| | Yamaha Corp. | | 5,800 | | 250 | |
| | Azbil Corp. | | 9,600 | | 245 | |
| | Japan Exchange Group Inc. | | 15,400 | | 243 | |
| | Kurita Water Industries Ltd. | | 9,100 | | 236 | |
| | Sumitomo Chemical Co. Ltd. | | 53,900 | | 236 | |
| | Dentsu Inc. | | 6,900 | | 236 | |
| | Rakuten Inc. | | 25,000 | | 235 | |
| | Daiwa Securities Group Inc. | | 53,700 | | 231 | |
| | Shimano Inc. | | 1,600 | | 230 | |
| | Kajima Corp. | | 18,900 | | 230 | |
| | Keihan Holdings Co. Ltd. | | 5,400 | | 226 | |
| | Keikyu Corp. | | 12,300 | | 225 | |
| | Yamato Holdings Co. Ltd. | | 13,000 | | 225 | |
| | Toho Co. Ltd. | | 5,300 | | 225 | |
| | Tobu Railway Co. Ltd. | | 7,300 | | 224 | |
| | TDK Corp. | | 2,800 | | 222 | |
| | Nisshin Seifun Group Inc. | | 11,800 | | 222 | |
| | Nagoya Railroad Co. Ltd. | | 7,400 | | 221 | |
| | Nitori Holdings Co. Ltd. | | 1,500 | | 216 | |
| | Toyo Suisan Kaisha Ltd. | | 5,300 | | 216 | |
| | MINEBEA MITSUMI Inc. | | 14,000 | | 216 | |
| | Hamamatsu Photonics KK | | 6,100 | | 210 | |
| | NSK Ltd. | | 26,100 | | 209 | |
| | TOTO Ltd. | | 5,700 | | 206 | |
| | Konami Holdings Corp. | | 4,500 | | 204 | |
| | NH Foods Ltd. | | 5,300 | | 203 | |
| | Ricoh Co. Ltd. | | 21,900 | | 202 | |
| | Brother Industries Ltd. | | 11,700 | | 202 | |
| | Japan Post Holdings Co. Ltd. | | 22,200 | | 202 | |
| | Shimadzu Corp. | | 8,100 | | 201 | |
| | Marui Group Co. Ltd. | | 10,100 | | 201 | |
| | Mazda Motor Corp. | | 23,800 | | 199 | |
| | ANA Holdings Inc. | | 5,800 | | 198 | |
| | Sohgo Security Services Co. Ltd. | | 3,900 | | 197 | |
| | AGC Inc. | | 6,800 | | 196 | |
| | T&D Holdings Inc. | | 19,900 | | 193 | |
| | Aisin Seiki Co. Ltd. | | 6,400 | | 189 | |
| | Concordia Financial Group Ltd. | | 55,100 | | 189 | |
| | Odakyu Electric Railway Co. Ltd. | | 8,200 | | 186 | |
| | Teijin Ltd. | | 10,300 | | 185 | |
| | Japan Airlines Co. Ltd. | | 5,800 | | 181 | |
| | Alps Alpine Co. Ltd. | | 10,400 | | 181 | |
| | COMSYS Holdings Corp. | | 6,300 | | 178 | |
| | Hisamitsu Pharmaceutical Co. Inc. | | 4,400 | | 178 | |
| | Bank of Kyoto Ltd. | | 4,900 | | 176 | |
| | Yahoo Japan Corp. | | 70,400 | | 176 | |
| | Chiba Bank Ltd. | | 35,200 | | 175 | |
| | Shizuoka Bank Ltd. | | 25,900 | | 175 | |
| | Mitsubishi Materials Corp. | | 7,200 | | 174 | |
| | Pigeon Corp. | | 4,800 | | 174 | |
| | Hulic Co. Ltd. | | 18,000 | | 172 | |
| | Seiko Epson Corp. | | 12,900 | | 171 | |
| | Yamada Denki Co. Ltd. | | 35,600 | | 167 | |
| | FamilyMart Co. Ltd. | | 7,200 | | 166 | |
| | Isuzu Motors Ltd. | | 15,400 | | 165 | |
| | Air Water Inc. | | 9,700 | | 165 | |
| | Stanley Electric Co. Ltd. | | 6,600 | | 164 | |
| | CyberAgent Inc. | | 3,600 | | 162 | |
| | Kyowa Kirin Co. Ltd. | | 8,600 | | 157 | |
| | LIXIL Group Corp. | | 9,600 | | 157 | |
| | Kuraray Co. Ltd. | | 13,600 | | 155 | |
| | Alfresa Holdings Corp. | | 6,800 | | 154 | |
| | Yamaha Motor Co. Ltd. | | 9,400 | | 153 | |
| | Lion Corp. | | 7,900 | | 153 | |
| | Nikon Corp. | | 12,400 | | 153 | |
| | Kaken Pharmaceutical Co. Ltd. | | 3,200 | | 153 | |
| | Mitsui Chemicals Inc. | | 7,100 | | 151 | |
| | Oji Holdings Corp. | | 32,200 | | 150 | |
| | Taiheiyo Cement Corp. | | 5,900 | | 149 | |
| | SBI Holdings Inc. | | 7,300 | | 146 | |
| | Kobayashi Pharmaceutical Co. Ltd. | | 1,900 | | 142 | |
| | Showa Denko KK | | 5,500 | | 142 | |
| | Daito Trust Construction Co. Ltd. | | 1,100 | | 142 | |
| | Aozora Bank Ltd. | | 6,000 | | 139 | |
| | MEIJI Holdings Co. Ltd. | | 1,900 | | 132 | |
| | SUMCO Corp. | | 10,500 | | 130 | |
| | Konica Minolta Inc. | | 18,000 | | 128 | |
| | Seibu Holdings Inc. | | 7,300 | | 124 | |
27
ESG International Stock ETF
| | | | | | Market | |
| | | | | | Value· | |
| | | | Shares | | ($000 | ) |
| | Coca-Cola Bottlers Japan Holdings Inc. | | 5,700 | | 124 | |
| | Mitsubishi Tanabe Pharma Corp. | | 11,200 | | 123 | |
| | NGK Spark Plug Co. Ltd. | | 7,100 | | 122 | |
| | Haseko Corp. | | 11,300 | | 121 | |
* | | Nexon Co. Ltd. | | 8,300 | | 112 | |
| | ZOZO Inc. | | 5,600 | | 112 | |
| | Hankyu Hanshin Holdings Inc. | | 2,800 | | 106 | |
| | Makita Corp. | | 3,600 | | 106 | |
| | Fukuoka Financial Group Inc. | | 6,100 | | 105 | |
| | Anritsu Corp. | | 5,400 | | 101 | |
| | MISUMI Group Inc. | | 4,400 | | 100 | |
| | Sumitomo Dainippon Pharma Co. Ltd. | | 5,700 | | 99 | |
| | Taiyo Yuden Co. Ltd. | | 5,100 | | 95 | |
| | Hikari Tsushin Inc. | | 400 | | 94 | |
| | Keio Corp. | | 1,500 | | 94 | |
| | Disco Corp. | | 500 | | 91 | |
| | Nomura Research Institute Ltd. | | 4,500 | | 89 | |
| | SG Holdings Co. Ltd. | | 3,300 | | 88 | |
| | Kose Corp. | | 500 | | 86 | |
| | Nissin Foods Holdings Co. Ltd. | | 1,200 | | 83 | |
| | Hirose Electric Co. Ltd. | | 700 | | 79 | |
* | | Renesas Electronics Corp. | | 12,100 | | 75 | |
| | Shinsei Bank Ltd. | | 5,495 | | 75 | |
* | | PeptiDream Inc. | | 1,400 | | 73 | |
| | Daifuku Co. Ltd. | | 1,500 | | 71 | |
| | Suzuken Co. Ltd. | | 1,300 | | 70 | |
| | Ryohin Keikaku Co. Ltd. | | 4,000 | | 69 | |
| | Sugi Holdings Co. Ltd. | | 1,300 | | 68 | |
| | Nippon Shinyaku Co. Ltd. | | 800 | | 66 | |
| | Hoshizaki Corp. | | 900 | | 65 | |
| | Kansai Paint Co. Ltd. | | 3,000 | | 62 | |
| | Sony Financial Holdings Inc. | | 2,700 | | 62 | |
| | Nippon Express Co. Ltd. | | 1,200 | | 62 | |
| | GMO Payment Gateway Inc. | | 800 | | 62 | |
| | Koito Manufacturing Co. Ltd. | | 1,300 | | 61 | |
| | Tokyu Fudosan Holdings Corp. | | 9,800 | | 61 | |
| | Kagome Co. Ltd. | | 2,400 | | 61 | |
| | Otsuka Corp. | | 1,600 | | 59 | |
| | Hitachi Chemical Co. Ltd. | | 1,900 | | 59 | |
| | Hitachi High-Technologies Corp. | | 1,100 | | 59 | |
| | Nissan Chemical Corp. | | 1,400 | | 59 | |
| | Kewpie Corp. | | 2,500 | | 58 | |
| | Kakaku.com Inc. | | 2,300 | | 58 | |
| | JSR Corp. | | 3,500 | | 57 | |
| | Taisho Pharmaceutical Holdings Co. Ltd. | | 800 | | 56 | |
| | Goldwin Inc. | | 400 | | 55 | |
| | Nippon Yusen KK | | 3,700 | | 55 | |
| | DeNA Co. Ltd. | | 2,600 | | 55 | |
| | Persol Holdings Co. Ltd. | | 2,700 | | 55 | |
| | Nabtesco Corp. | | 1,900 | | 55 | |
| | Miura Co. Ltd. | | 1,900 | | 52 | |
| | Mitsui OSK Lines Ltd. | | 2,200 | | 52 | |
| | Oracle Corp. Japan | | 600 | | 52 | |
| | Nishi-Nippon Railroad Co. Ltd. | | 2,200 | | 51 | |
| | Nagase & Co. Ltd. | | 3,700 | | 50 | |
| | Rohto Pharmaceutical Co. Ltd. | | 2,000 | | 50 | |
| | Tokyo Tatemono Co. Ltd. | | 3,800 | | 49 | |
| | Wacoal Holdings Corp. | | 2,100 | | 49 | |
| | Sanwa Holdings Corp. | | 4,400 | | 49 | |
| | Nomura Real Estate Holdings Inc. | | 2,300 | | 49 | |
| | Nankai Electric Railway Co. Ltd. | | 1,900 | | 49 | |
| | Matsumotokiyoshi Holdings Co. Ltd. | | 1,300 | | 48 | |
| | Kyowa Exeo Corp. | | 2,000 | | 48 | |
| | Yokohama Rubber Co. Ltd. | | 2,500 | | 48 | |
| | Welcia Holdings Co. Ltd. | | 900 | | 47 | |
| | TIS Inc. | | 800 | | 47 | |
| | Capcom Co. Ltd. | | 1,800 | | 47 | |
| | MediPal Holdings Corp. | | 2,200 | | 47 | |
| | MonotaRO Co. Ltd. | | 1,900 | | 47 | |
| | Iwatani Corp. | | 1,400 | | 46 | |
| | Benesse Holdings Inc. | | 1,800 | | 46 | |
| | Calbee Inc. | | 1,500 | | 46 | |
| | House Foods Group Inc. | | 1,200 | | 46 | |
| | Ito En Ltd. | | 1,000 | | 46 | |
| | Sotetsu Holdings Inc. | | 1,700 | | 45 | |
| | Daiichikosho Co. Ltd. | | 1,000 | | 45 | |
| | Mitsubishi UFJ Lease & Finance Co. Ltd. | | 8,300 | | 45 | |
| | Casio Computer Co. Ltd. | | 3,200 | | 45 | |
| | Morinaga & Co. Ltd. | | 900 | | 44 | |
| | Zeon Corp. | | 3,800 | | 44 | |
| | THK Co. Ltd. | | 1,900 | | 44 | |
| | Sumitomo Rubber Industries Ltd. | | 3,900 | | 44 | |
| | Rinnai Corp. | | 700 | | 44 | |
| | AEON Financial Service Co. Ltd. | | 3,000 | | 44 | |
| | Tsumura & Co. | | 1,600 | | 44 | |
| | Iyo Bank Ltd. | | 9,200 | | 44 | |
| | Koei Tecmo Holdings Co. Ltd. | | 2,100 | | 44 | |
| | Keisei Electric Railway Co. Ltd. | | 1,100 | | 43 | |
| | Acom Co. Ltd. | | 12,200 | | 43 | |
28
ESG International Stock ETF
| | | | | | Market | |
| | | | | | Value· | |
| | | | Shares | | ($000 | ) |
| | Chugoku Bank Ltd. | | 5,100 | | 43 | |
| | Asics Corp. | | 3,300 | | 43 | |
| | Sawai Pharmaceutical Co. Ltd. | | 800 | | 42 | |
| | Hachijuni Bank Ltd. | | 11,800 | | 42 | |
| | Ushio Inc. | | 3,300 | | 42 | |
| | JTEKT Corp. | | 3,900 | | 42 | |
| | Japan Post Insurance Co. Ltd. | | 2,939 | | 42 | |
| | Toda Corp. | | 7,500 | | 42 | |
| | Sumitomo Forestry Co. Ltd. | | 3,400 | | 42 | |
| | Nichirei Corp. | | 1,800 | | 41 | |
| | Itochu Techno-Solutions Corp. | | 1,500 | | 41 | |
| | Glory Ltd. | | 1,500 | | 41 | |
| | ADEKA Corp. | | 3,400 | | 41 | |
| | Toyobo Co. Ltd. | | 3,200 | | 41 | |
| | Hiroshima Bank Ltd. | | 8,900 | | 41 | |
| | GS Yuasa Corp. | | 2,400 | | 40 | |
| | SCREEN Holdings Co. Ltd. | | 700 | | 40 | |
| | Lawson Inc. | | 800 | | 40 | |
| | DIC Corp. | | 1,500 | | 40 | |
| | SCSK Corp. | | 800 | | 39 | |
| | Toyo Ink SC Holdings Co. Ltd. | | 1,900 | | 39 | |
| | Hino Motors Ltd. | | 5,000 | | 39 | |
| | Shimamura Co. Ltd. | | 500 | | 39 | |
| | Ezaki Glico Co. Ltd. | | 900 | | 39 | |
| | Nihon Unisys Ltd. | | 1,200 | | 39 | |
| | Kokuyo Co. Ltd. | | 2,900 | | 39 | |
| | J Front Retailing Co. Ltd. | | 3,400 | | 38 | |
| | Nippon Kayaku Co. Ltd. | | 3,500 | | 38 | |
| | Daicel Corp. | | 4,900 | | 38 | |
| | Citizen Watch Co. Ltd. | | 8,300 | | 38 | |
| | Sumitomo Osaka Cement Co. Ltd. | | 900 | | 38 | |
| | NET One Systems Co. Ltd. | | 1,400 | | 37 | |
| | Seven Bank Ltd. | | 14,300 | | 37 | |
| | Hakuhodo DY Holdings Inc. | | 2,500 | | 37 | |
| | Yamazaki Baking Co. Ltd. | | 2,100 | | 36 | |
| | Amada Holdings Co. Ltd. | | 3,500 | | 36 | |
| | Tokyo Century Corp. | | 900 | | 36 | |
| | Nihon Kohden Corp. | | 1,300 | | 36 | |
| | NOK Corp. | | 2,600 | | 36 | |
| | Skylark Holdings Co. Ltd. | | 2,100 | | 36 | |
| | TS Tech Co. Ltd. | | 1,300 | | 36 | |
| | Hitachi Metals Ltd. | | 3,300 | | 35 | |
| | Dowa Holdings Co. Ltd. | | 1,100 | | 35 | |
| | Ibiden Co. Ltd. | | 1,800 | | 35 | |
| | Aeon Mall Co. Ltd. | | 2,200 | | 35 | |
| | Mitsubishi Logistics Corp. | | 1,400 | | 34 | |
| | Lasertec Corp. | | 600 | | 34 | |
| | Toagosei Co. Ltd. | | 3,500 | | 34 | |
| | Kyudenko Corp. | | 1,100 | | 34 | |
| | Daido Steel Co. Ltd. | | 900 | | 34 | |
| | Takashimaya Co. Ltd. | | 3,000 | | 34 | |
| | Toho Holdings Co. Ltd. | | 1,400 | | 33 | |
| | Nippon Electric Glass Co. Ltd. | | 1,600 | | 33 | |
| | Morinaga Milk Industry Co. Ltd. | | 800 | | 33 | |
| | Colowide Co. Ltd. | | 1,700 | | 33 | |
| | Kaneka Corp. | | 1,100 | | 33 | |
| | FP Corp. | | 500 | | 33 | |
| | Ain Holdings Inc. | | 600 | | 32 | |
| | Nishimatsu Construction Co. Ltd. | | 1,800 | | 32 | |
| | Nippo Corp. | | 1,800 | | 32 | |
| | Hitachi Capital Corp. | | 1,600 | | 32 | |
| | Sushiro Global Holdings Ltd. | | 500 | | 32 | |
| | Nippon Paper Industries Co. Ltd. | | 1,900 | | 32 | |
| | Fancl Corp. | | 1,300 | | 32 | |
| | Lintec Corp. | | 1,600 | | 31 | |
| | NHK Spring Co. Ltd. | | 4,300 | | 31 | |
| | NTN Corp. | | 11,400 | | 30 | |
| | K’s Holdings Corp. | | 2,800 | | 30 | |
| | DMG Mori Co. Ltd. | | 2,200 | | 30 | |
| | Nipro Corp. | | 2,800 | | 29 | |
| | Paramount Bed Holdings Co. Ltd. | | 800 | | 29 | |
| | Maruichi Steel Tube Ltd. | | 1,200 | | 29 | |
| | TechnoPro Holdings Inc. | | 500 | | 29 | |
| | TOKAI Holdings Corp. | | 3,100 | | 29 | |
| | Hazama Ando Corp. | | 4,300 | | 29 | |
| | Sanrio Co. Ltd. | | 1,500 | | 29 | |
| | Pola Orbis Holdings Inc. | | 1,200 | | 28 | |
| | Ulvac Inc. | | 700 | | 28 | |
| | Shimachu Co. Ltd. | | 1,200 | | 28 | |
| | Toyo Tire Corp. | | 2,300 | | 28 | |
| | Tokai Carbon Co. Ltd. | | 2,900 | | 28 | |
| | Nippon Light Metal Holdings Co. Ltd. | | 15,900 | | 28 | |
| | Tokuyama Corp. | | 1,300 | | 27 | |
| | Tsubakimoto Chain Co. | | 900 | | 27 | |
| | Tokyo Seimitsu Co. Ltd. | | 1,000 | | 26 | |
| | Japan Post Bank Co. Ltd. | | 2,900 | | 26 | |
| | Furukawa Electric Co. Ltd. | | 1,200 | | 26 | |
| | Shibusawa Warehouse Co. Ltd. | | 1,500 | | 26 | |
| | Rengo Co. Ltd. | | 3,500 | | 25 | |
| | Fuji Oil Holdings Inc. | | 900 | | 25 | |
| | Isetan Mitsukoshi Holdings Ltd. | | 3,300 | | 25 | |
| | PALTAC Corp. | | 500 | | 25 | |
| | Fuji Seal International Inc. | | 900 | | 24 | |
| | Takara Bio Inc. | | 1,100 | | 24 | |
| | Miraca Holdings Inc. | | 1,100 | | 24 | |
29
ESG International Stock ETF
| | | | | | Market | |
| | | | | | Value· | |
| | | | Shares | | ($000 | ) |
| | Toyota Boshoku Corp. | | 1,800 | | 24 | |
| | Nisshinbo Holdings Inc. | | 3,200 | | 24 | |
| | Sharp Corp. | | 2,300 | | 24 | |
| | Kiyo Bank Ltd. | | 1,700 | | 23 | |
| | Totetsu Kogyo Co. Ltd. | | 800 | | 23 | |
| | Ariake Japan Co. Ltd. | | 300 | | 23 | |
| | Fujitsu General Ltd. | | 1,400 | | 22 | |
| | Topcon Corp. | | 1,900 | | 22 | |
| | Unipres Corp. | | 1,400 | | 22 | |
| | North Pacific Bank Ltd. | | 10,800 | | 22 | |
| | Awa Bank Ltd. | | 1,000 | | 21 | |
| | Itoham Yonekyu Holdings Inc. | | 3,400 | | 21 | |
| | Morita Holdings Corp. | | 1,400 | | 21 | |
| | Nippon Suisan Kaisha Ltd. | | 3,600 | | 21 | |
| | Tokai Tokyo Financial Holdings Inc. | | 8,000 | | 21 | |
| | Unizo Holdings Co. Ltd. | | 500 | | 20 | |
| | Sankyu Inc. | | 400 | | 20 | |
| | San-In Godo Bank Ltd. | | 3,500 | | 20 | |
| | Fujikura Ltd. | | 6,200 | | 20 | |
| | Shinko Electric Industries Co. Ltd. | | 2,500 | | 20 | |
| | PC Depot Corp. | | 4,200 | | 19 | |
| | Cybozu Inc. | | 1,800 | | 19 | |
| | NEC Networks & System Integration Corp. | | 700 | | 18 | |
| | Noritake Co. Ltd. | | 500 | | 18 | |
| | Nichi-iko Pharmaceutical Co. Ltd. | | 1,700 | | 18 | |
| | Zensho Holdings Co. Ltd. | | 800 | | 18 | |
| | Nissin Corp. | | 1,300 | | 18 | |
| | Takaoka Toko Co. Ltd. | | 1,700 | | 18 | |
| | Nagaileben Co. Ltd. | | 900 | | 18 | |
| | Kato Sangyo Co. Ltd. | | 600 | | 18 | |
| | Toyo Seikan Group Holdings Ltd. | | 1,200 | | 17 | |
| | Shizuoka Gas Co. Ltd. | | 2,100 | | 17 | |
| | Japan Lifeline Co. Ltd. | | 1,100 | | 17 | |
| | Autobacs Seven Co. Ltd. | | 1,000 | | 17 | |
| | Senko Group Holdings Co. Ltd. | | 2,100 | | 17 | |
| | cocokara fine Inc. | | 300 | | 16 | |
| | Meiko Network Japan Co. Ltd. | | 1,900 | | 16 | |
| | Sanyo Denki Co. Ltd. | | 400 | | 16 | |
| | GMO internet Inc. | | 900 | | 16 | |
| | Denka Co. Ltd. | | 600 | | 16 | |
| | Nitta Corp. | | 600 | | 16 | |
| | Katakura Industries Co. Ltd. | | 1,300 | | 15 | |
| | Izumi Co. Ltd. | | 400 | | 15 | |
| | Maruwa Unyu Kikan Co. Ltd. | | 300 | | 15 | |
| | Right On Co. Ltd. | | 2,300 | | 15 | |
| | United Arrows Ltd. | | 500 | | 15 | |
| | Mitsuuroko Group Holdings Co. Ltd. | | 1,700 | | 15 | |
| | Tomy Co. Ltd. | | 1,400 | | 15 | |
| | Maruzen Showa Unyu Co. Ltd. | | 500 | | 15 | |
| | Shima Seiki Manufacturing Ltd. | | 600 | | 14 | |
| | Iriso Electronics Co. Ltd. | | 300 | | 14 | |
| | Digital Arts Inc. | | 200 | | 14 | |
| | Aica Kogyo Co. Ltd. | | 500 | | 14 | |
| | Tocalo Co. Ltd. | | 1,900 | | 14 | |
* | | Leopalace21 Corp. | | 5,200 | | 14 | |
* | | Kawasaki Kisen Kaisha Ltd. | | 1,400 | | 14 | |
| | San-Ai Oil Co. Ltd. | | 1,500 | | 14 | |
| | Kumagai Gumi Co. Ltd. | | 500 | | 14 | |
| | Mitsui-Soko Holdings Co. Ltd. | | 900 | | 14 | |
| | Systena Corp. | | 900 | | 13 | |
| | Maezawa Kasei Industries Co. Ltd. | | 1,300 | | 13 | |
| | Kintetsu World Express Inc. | | 1,000 | | 13 | |
| | Japan Transcity Corp. | | 3,200 | | 13 | |
| | Sinanen Holdings Co. Ltd. | | 800 | | 13 | |
| | Digital Garage Inc. | | 400 | | 13 | |
| | Maruha Nichiro Corp. | | 500 | | 13 | |
| | Duskin Co. Ltd. | | 500 | | 13 | |
| | SBS Holdings Inc. | | 900 | | 13 | |
| | Tokyo Rope Manufacturing Co. Ltd. | | 1,500 | | 13 | |
| | Hirata Corp. | | 200 | | 12 | |
* | | COOKPAD Inc. | | 4,400 | | 12 | |
| | Daiseki Co. Ltd. | | 500 | | 12 | |
| | Taikisha Ltd. | | 400 | | 12 | |
| | Toa Oil Co. Ltd. | | 600 | | 12 | |
| | Sumitomo Warehouse Co. Ltd. | | 900 | | 12 | |
*,^ | | Japan Display Inc. | | 19,700 | | 12 | |
| | Tsugami Corp. | | 1,500 | | 12 | |
| | Anicom Holdings Inc. | | 300 | | 12 | |
| | Fuyo General Lease Co. Ltd. | | 200 | | 11 | |
| | Daihen Corp. | | 400 | | 11 | |
| | JP-Holdings Inc. | | 4,500 | | 11 | |
| | Matsuya Co. Ltd. | | 1,600 | | 11 | |
| | Namura Shipbuilding Co. Ltd. | | 5,100 | | 11 | |
| | Takasago Thermal Engineering Co. Ltd. | | 700 | | 11 | |
| | Neturen Co. Ltd. | | 1,500 | | 11 | |
| | en-japan Inc. | | 300 | | 11 | |
| | Kureha Corp. | | 200 | | 11 | |
| | Sumitomo Bakelite Co. Ltd. | | 300 | | 11 | |
| | Nissin Electric Co. Ltd. | | 900 | | 11 | |
| | Paris Miki Holdings Inc. | | 4,100 | | 11 | |
| | Gurunavi Inc. | | 1,600 | | 10 | |
30
ESG International Stock ETF
| | | | | | Market | |
| | | | | | Value· | |
| | | | Shares | | ($000 | ) |
| | Nichiha Corp. | | 400 | | 10 | |
| | Tokyo Ohka Kogyo Co. Ltd. | | 300 | | 10 | |
| | Noevir Holdings Co. Ltd. | | 200 | | 10 | |
* | | euglena Co. Ltd. | | 1,200 | | 10 | |
| | eRex Co. Ltd. | | 900 | | 10 | |
| | CKD Corp. | | 1,000 | | 10 | |
* | | RENOVA Inc. | | 1,300 | | 10 | |
| | Mandom Corp. | | 400 | | 10 | |
| | Oki Electric Industry Co. Ltd. | | 700 | | 10 | |
| | Tsukuba Bank Ltd. | | 6,800 | | 10 | |
| | Milbon Co. Ltd. | | 200 | | 10 | |
| | Raiznext Corp. | | 900 | | 10 | |
| | Adastria Co. Ltd. | | 500 | | 10 | |
| | Shin Nippon Air Technologies Co. Ltd. | | 600 | | 10 | |
| | Japan Elevator Service Holdings Co. Ltd. | | 400 | | 10 | |
| | Teikoku Electric Manufacturing Co. Ltd. | | 900 | | 9 | |
| | Hitachi Transport System Ltd. | | 300 | | 9 | |
| | MTI Ltd. | | 1,400 | | 9 | |
| | Monogatari Corp. | | 100 | | 9 | |
| | Modec Inc. | | 400 | | 9 | |
| | Yaoko Co. Ltd. | | 200 | | 9 | |
| | Mirait Holdings Corp. | | 600 | | 9 | |
| | Jeol Ltd. | | 400 | | 9 | |
| | Fuji Soft Inc. | | 200 | | 9 | |
* | | Vision Inc. | | 200 | | 9 | |
| | Yoshinoya Holdings Co. Ltd. | | 400 | | 8 | |
| | Asahi Holdings Inc. | | 400 | | 8 | |
| | Computer Engineering & Consulting Ltd. | | 400 | | 8 | |
| | Noritsu Koki Co. Ltd. | | 500 | | 8 | |
| | ZIGExN Co. Ltd. | | 1,500 | | 8 | |
| | KH Neochem Co. Ltd. | | 400 | | 8 | |
| | DTS Corp. | | 400 | | 8 | |
| | Hokkaido Gas Co. Ltd. | | 600 | | 8 | |
| | Koshidaka Holdings Co. Ltd. | | 500 | | 8 | |
| | Central Glass Co. Ltd. | | 400 | | 8 | |
| | Idec Corp. | | 500 | | 8 | |
| | Ines Corp. | | 800 | | 8 | |
* | | KNT-CT Holdings Co. Ltd. | | 600 | | 8 | |
| | Descente Ltd. | | 600 | | 8 | |
| | Shinmaywa Industries Ltd. | | 700 | | 8 | |
| | Tonami Holdings Co. Ltd. | | 200 | | 8 | |
| | Riso Kyoiku Co. Ltd. | | 1,900 | | 8 | |
| | NS United Kaiun Kaisha Ltd. | | 400 | | 8 | |
* | | KLab Inc. | | 800 | | 8 | |
| | Kumiai Chemical Industry Co. Ltd. | | 900 | | 8 | |
| | Resorttrust Inc. | | 500 | | 8 | |
| | JCR Pharmaceuticals Co. Ltd. | | 100 | | 8 | |
| | Organo Corp. | | 200 | | 8 | |
| | Menicon Co. Ltd. | | 200 | | 8 | |
| | Kitanotatsujin Corp. | | 1,100 | | 8 | |
| | Argo Graphics Inc. | | 300 | | 8 | |
| | Kadokawa Corp. | | 500 | | 7 | |
| | Kourakuen Holdings Corp. | | 300 | | 7 | |
| | J Trust Co. Ltd. | | 2,100 | | 7 | |
* | | Istyle Inc. | | 1,200 | | 7 | |
| | H2O Retailing Corp. | | 700 | | 7 | |
| | HIS Co. Ltd. | | 300 | | 7 | |
| | Gree Inc. | | 1,600 | | 7 | |
| | Transcosmos Inc. | | 300 | | 7 | |
| | Prestige International Inc. | | 400 | | 7 | |
| | Takuma Co. Ltd. | | 600 | | 7 | |
| | Megmilk Snow Brand Co. Ltd. | | 300 | | 7 | |
| | Towa Pharmaceutical Co. Ltd. | | 300 | | 7 | |
| | Nojima Corp. | | 400 | | 7 | |
| | Toridoll Holdings Corp. | | 300 | | 7 | |
| | Ohsho Food Service Corp. | | 100 | | 7 | |
| | Pacific Industrial Co. Ltd. | | 500 | | 7 | |
* | | Tokyo Base Co. Ltd. | | 800 | | 7 | |
| | Eizo Corp. | | 200 | | 7 | |
| | Meidensha Corp. | | 400 | | 7 | |
| | Sumitomo Mitsui Construction Co. Ltd. | | 1,300 | | 6 | |
| | Sinko Industries Ltd. | | 400 | | 6 | |
| | World Co. Ltd. | | 300 | | 6 | |
| | Nextage Co. Ltd. | | 600 | | 6 | |
| | Orient Corp. | | 5,000 | | 6 | |
* | | Open Door Inc. | | 300 | | 6 | |
| | Solasto Corp. | | 500 | | 6 | |
| | NichiiGakkan Co. Ltd. | | 400 | | 6 | |
| | Japan Material Co. Ltd. | | 600 | | 6 | |
| | PAL GROUP Holdings Co. Ltd. | | 200 | | 6 | |
| | Yushin Precision Equipment Co. Ltd. | | 700 | | 6 | |
| | Canon Marketing Japan Inc. | | 300 | | 6 | |
| | KAWADA TECHNOLOGIES Inc. | | 100 | | 6 | |
| | Hiday Hidaka Corp. | | 300 | | 6 | |
| | Dai-Dan Co. Ltd. | | 300 | | 6 | |
| | Okamura Corp. | | 600 | | 6 | |
* | | M&A Capital Partners Co. Ltd. | | 100 | | 6 | |
| | Toshiba TEC Corp. | | 200 | | 6 | |
| | Fixstars Corp. | | 400 | | 6 | |
| | Nippon Shokubai Co. Ltd. | | 100 | | 6 | |
| | Seiren Co. Ltd. | | 500 | | 6 | |
* | | Medical Data Vision Co. Ltd. | | 600 | | 6 | |
| | Sangetsu Corp. | | 300 | | 6 | |
| | Shoei Foods Corp. | | 200 | | 6 | |
| | GLOBERIDE Inc. | | 200 | | 6 | |
| | Nitto Kogyo Corp. | | 300 | | 6 | |
| | Maruwa Co. Ltd. | | 100 | | 6 | |
| | | | | | | |
31
ESG International Stock ETF
| | | | | | Market | |
| | | | | | Value· | |
| | | | Shares | | ($000 | ) |
| | Chiyoda Integre Co. Ltd. | | 300 | | 6 | |
| | Chuetsu Pulp & Paper Co. Ltd. | | 400 | | 6 | |
| | LIFULL Co. Ltd. | | 900 | | 6 | |
| | SWCC Showa Holdings Co. Ltd. | | 800 | | 6 | |
| | Nitto Boseki Co. Ltd. | | 200 | | 6 | |
| | Aruhi Corp. | | 300 | | 5 | |
| | ASKUL Corp. | | 200 | | 5 | |
| | Denki Kogyo Co. Ltd. | | 200 | | 5 | |
| | Sankyo Tateyama Inc. | | 500 | | 5 | |
| | Honeys Holdings Co. Ltd. | | 400 | | 5 | |
| | Trancom Co. Ltd. | | 100 | | 5 | |
| | Nichicon Corp. | | 600 | | 5 | |
| | Raito Kogyo Co. Ltd. | | 400 | | 5 | |
| | Sanken Electric Co. Ltd. | | 300 | | 5 | |
| | COLOPL Inc. | | 800 | | 5 | |
| | Miroku Jyoho Service Co. Ltd. | | 200 | | 5 | |
| | Kanamoto Co. Ltd. | | 200 | | 5 | |
| | Shibuya Corp. | | 200 | | 5 | |
| | Showa Corp. | | 400 | | 5 | |
| | Zuken Inc. | | 300 | | 5 | |
| | Tsukishima Kikai Co. Ltd. | | 400 | | 5 | |
| | ValueCommerce Co. Ltd. | | 300 | | 5 | |
| | Ichibanya Co. Ltd. | | 100 | | 5 | |
| | Toa Corp. | | 400 | | 5 | |
| | Daio Paper Corp. | | 400 | | 5 | |
| | Earth Corp. | | 100 | | 5 | |
| | Toyo Kanetsu KK | | 300 | | 5 | |
| | Keihanshin Building Co. Ltd. | | 400 | | 5 | |
| | CAC Holdings Corp. | | 400 | | 5 | |
| | Musashi Seimitsu Industry Co. Ltd. | | 400 | | 5 | |
| | Fuji Oil Co. Ltd. | | 2,100 | | 5 | |
| | Nippon Soda Co. Ltd. | | 200 | | 5 | |
| | Hokkoku Bank Ltd. | | 200 | | 5 | |
| | SRA Holdings | | 200 | | 5 | |
| | Kanematsu Corp. | | 400 | | 5 | |
| | Eiken Chemical Co. Ltd. | | 300 | | 5 | |
| | Tachi-S Co. Ltd. | | 400 | | 4 | |
| | Sourcenext Corp. | | 1,100 | | 4 | |
| | MCJ Co. Ltd. | | 700 | | 4 | |
| | Nissha Co. Ltd. | | 500 | | 4 | |
| | Kameda Seika Co. Ltd. | | 100 | | 4 | |
| | Shiga Bank Ltd. | | 200 | | 4 | |
| | Kohnan Shoji Co. Ltd. | | 200 | | 4 | |
| | Shoei Co. Ltd. | | 100 | | 4 | |
| | Yokogawa Bridge Holdings Corp. | | 300 | | 4 | |
| | Mitsubishi Logisnext Co. Ltd. | | 400 | | 4 | |
| | Sinfonia Technology Co. Ltd. | | 400 | | 4 | |
| | Seiko Holdings Corp. | | 200 | | 4 | |
| | Press Kogyo Co. Ltd. | | 1,000 | | 4 | |
| | Gunze Ltd. | | 100 | | 4 | |
| | Taki Chemical Co. Ltd. | | 100 | | 4 | |
| | Maeda Kosen Co. Ltd. | | 300 | | 4 | |
* | | Remixpoint Inc. | | 2,000 | | 4 | |
| | Shimojima Co. Ltd. | | 400 | | 4 | |
| | Okamoto Industries Inc. | | 100 | | 4 | |
| | Sumida Corp. | | 400 | | 4 | |
| | Joshin Denki Co. Ltd. | | 200 | | 4 | |
| | Tokyo Kiraboshi Financial Group Inc. | | 300 | | 4 | |
| | Belluna Co. Ltd. | | 600 | | 4 | |
| | Tayca Corp. | | 200 | | 4 | |
| | Nippon Sheet Glass Co. Ltd. | | 600 | | 4 | |
| | Macromill Inc. | | 400 | | 3 | |
| | Toho Zinc Co. Ltd. | | 200 | | 3 | |
* | | Akebono Brake Industry Co. Ltd. | | 2,700 | | 3 | |
| | Riken Corp. | | 100 | | 3 | |
| | Future Corp. | | 200 | | 3 | |
| | Mitsuboshi Belting Ltd. | | 200 | | 3 | |
| | Futaba Industrial Co. Ltd. | | 500 | | 3 | |
| | Feed One Co. Ltd. | | 2,200 | | 3 | |
| | Mitsubishi Paper Mills Ltd. | | 700 | | 3 | |
| | Obara Group Inc. | | 100 | | 3 | |
| | Yahagi Construction Co. Ltd. | | 500 | | 3 | |
| | Teikoku Sen-I Co. Ltd. | | 200 | | 3 | |
| | Zuiko Corp. | | 100 | | 3 | |
* | | FDK Corp. | | 400 | | 3 | |
| | OPT Holding Inc. | | 200 | | 3 | |
| | Nissei ASB Machine Co. Ltd. | | 100 | | 3 | |
| | Shinnihon Corp. | | 400 | | 3 | |
| | Asahi Diamond Industrial Co. Ltd. | | 500 | | 3 | |
| | Rheon Automatic Machinery Co. Ltd. | | 200 | | 3 | |
| | IDOM Inc. | | 700 | | 3 | |
| | Toli Corp. | | 1,200 | | 3 | |
| | Wellnet Corp. | | 400 | | 3 | |
| | Ichikoh Industries Ltd. | | 400 | | 3 | |
| | Qol Holdings Co. Ltd. | | 200 | | 3 | |
* | | ARTERIA Networks Corp. | | 200 | | 3 | |
| | Nissan Shatai Co. Ltd. | | 300 | | 3 | |
| | Sanoh Industrial Co. Ltd. | | 600 | | 3 | |
| | Yamashin-Filter Corp. | | 400 | | 2 | |
* | | Sanden Holdings Corp. | | 500 | | 2 | |
| | W-Scope Corp. | | 400 | | 2 | |
| | Saibu Gas Co. Ltd. | | 100 | | 2 | |
| | Kenko Mayonnaise Co. Ltd. | | 100 | | 2 | |
| | Tamron Co. Ltd. | | 100 | | 2 | |
| | Nippon Thompson Co. Ltd. | | 500 | | 2 | |
| | Mitsubishi Steel Manufacturing Co. Ltd. | | 200 | | 2 | |
| | | | | | 80,743 | |
32
ESG International Stock ETF
| | | | | | Market | |
| | | | | | Value· | |
| | | | Shares | | ($000 | ) |
Kuwait (0.3%) | | | | | |
| | National Bank of Kuwait SAKP | | 132,115 | | 431 | |
| | Kuwait Finance House KSCP | | 63,658 | | 157 | |
| | Ahli United Bank BSC | | 125,765 | | 116 | |
| | Agility Public Warehousing Co. KSC | | 42,577 | | 106 | |
| | Mobile Telecommunications Co. KSC | | 45,146 | | 84 | |
| | Gulf Bank KSCP | | 57,803 | | 57 | |
| | National Industries Group Holding SAK | | 50,719 | | 40 | |
* | | Warba Bank KSCP | | 23,682 | | 19 | |
| | Kuwait International Bank KSCP | | 21,227 | | 19 | |
| | Alimtiaz Investment Group KSC | | 42,505 | | 18 | |
| | Mezzan Holding Co. KSCC | | 6,784 | | 13 | |
| | Integrated Holding Co. KCSC | | 8,798 | | 12 | |
| | | | | | 1,072 | |
Malaysia (0.8%) | | | | | |
| | Public Bank Bhd. (Local) | | 70,600 | | 341 | |
| | Tenaga Nasional Bhd. | | 100,248 | | 332 | |
| | Malayan Banking Bhd. | | 113,700 | | 235 | |
| | CIMB Group Holdings Bhd. | | 194,100 | | 233 | |
| | DiGi.Com Bhd. | | 149,200 | | 178 | |
| | Axiata Group Bhd. | | 144,400 | | 173 | |
| | Maxis Bhd. | | 126,600 | | 167 | |
| | Dialog Group Bhd. | | 172,300 | | 142 | |
| | AMMB Holdings Bhd. | | 138,600 | | 138 | |
| | Petronas Chemicals Group Bhd. | | 66,400 | | 109 | |
| | PPB Group Bhd. | | 24,300 | | 108 | |
| | IHH Healthcare Bhd. | | 75,200 | | 103 | |
| | Sime Darby Plantation Bhd. | | 54,200 | | 64 | |
| | Hong Leong Bank Bhd. | | 16,200 | | 64 | |
| | Alliance Bank Malaysia Bhd. | | 76,900 | | 55 | |
| | Genting Plantations Bhd. | | 17,300 | | 41 | |
| | MISC Bhd. | | 22,000 | | 38 | |
| | Press Metal Aluminium Holdings Bhd. | | 32,400 | | 38 | |
| | RHB Bank Bhd. | | 27,100 | | 37 | |
| | Gamuda Bhd. | | 42,200 | | 36 | |
| | IJM Corp. Bhd. | | 61,600 | | 33 | |
| | Petronas Gas Bhd. | | 8,600 | | 33 | |
| | Malaysia Airports Holdings Bhd. | | 16,800 | | 33 | |
| | Nestle Malaysia Bhd. | | 900 | | 32 | |
| | Top Glove Corp. Bhd. | | 27,900 | | 31 | |
| | TIME dotCom Bhd. | | 14,300 | | 31 | |
| | Bursa Malaysia Bhd. | | 20,600 | | 31 | |
| | Hartalega Holdings Bhd. | | 23,500 | | 29 | |
| | Hong Leong Financial Group Bhd. | | 7,000 | | 28 | |
| | Westports Holdings Bhd. | | 24,300 | | 24 | |
| | YTL Corp. Bhd. | | 87,400 | | 21 | |
| | Telekom Malaysia Bhd. | | 22,900 | | 20 | |
| | Inari Amertron Bhd. | | 51,600 | | 20 | |
| | Sime Darby Bhd. | | 36,400 | | 20 | |
| | HAP Seng Consolidated Bhd. | | 7,500 | | 18 | |
| | Yinson Holdings Bhd. | | 10,600 | | 17 | |
| | My EG Services Bhd. | | 50,700 | | 17 | |
| | Petronas Dagangan Bhd. | | 3,100 | | 17 | |
| | Bermaz Auto Bhd. | | 28,000 | | 15 | |
* | | WCT Holdings Bhd. | | 64,900 | | 15 | |
| | Malakoff Corp. Bhd. | | 72,600 | | 15 | |
| | Padini Holdings Bhd. | | 16,900 | | 15 | |
| | YTL Power International Bhd. | | 81,200 | | 14 | |
| | IOI Corp. Bhd. | | 13,100 | | 14 | |
| | Sime Darby Property Bhd. | | 64,800 | | 14 | |
| | Malaysian Resources Corp. Bhd. | | 69,000 | | 12 | |
* | | AirAsia X Bhd. | | 278,900 | | 12 | |
| | VS Industry Bhd. | | 38,400 | | 11 | |
| | Pos Malaysia Bhd. | | 30,600 | | 11 | |
| | Kossan Rubber Industries | | 10,500 | | 10 | |
* | | Velesto Energy Bhd. | | 144,200 | | 10 | |
| | AirAsia Group Bhd. | | 23,800 | | 10 | |
| | Sunway Construction Group Bhd. | | 20,800 | | 10 | |
| | Muhibbah Engineering M Bhd. | | 16,600 | | 10 | |
| | Supermax Corp. Bhd. | | 25,500 | | 9 | |
* | | Lafarge Malaysia Bhd. | | 10,900 | | 9 | |
* | | UEM Sunrise Bhd. | | 48,900 | | 8 | |
| | Unisem M Bhd. | | 16,500 | | 8 | |
| | UMW Holdings Bhd. | | 6,100 | | 7 | |
| | Serba Dinamik Holdings Bhd. | | 5,300 | | 6 | |
* | | Bumi Armada Bhd. | | 86,400 | | 5 | |
| | IOI Properties Group Bhd. | | 14,800 | | 4 | |
| | SP Setia Bhd Group | | 9,100 | | 3 | |
| | | | | | 3,344 | |
Mexico (0.7%) | | | | | |
| | Fomento Economico Mexicano SAB de CV | | 62,600 | | 572 | |
| | America Movil SAB de CV | | 765,300 | | 560 | |
| | Grupo Financiero Banorte SAB de CV | | 74,000 | | 398 | |
| | Cemex SAB de CV | | 520,800 | | 194 | |
| | Grupo Bimbo SAB de CV Class A | | 103,200 | | 181 | |
| | Grupo Televisa SAB | | 83,400 | | 147 | |
33
ESG International Stock ETF
| | | | | | Market | |
| | | | | | Value· | |
| | | | Shares | | ($000 | ) |
2 | | Macquarie Mexico Real Estate Management SA de CV | | 94,400 | | 114 | |
| | Grupo Elektra SAB DE CV | | 1,235 | | 86 | |
| | Grupo Aeroportuario del Pacifico SAB de CV Class B | | 6,400 | | 61 | |
| | Coca-Cola Femsa SAB de CV | | 10,100 | | 60 | |
| | Elis SA | | 3,285 | | 58 | |
| | Fibra Uno Administracion SA de CV | | 37,100 | | 51 | |
| | Kimberly-Clark de Mexico SAB de CV Class A | | 19,400 | | 40 | |
| | Grupo Aeroportuario del Sureste SAB de CV Class B | | 2,680 | | 39 | |
| | Grupo Aeroportuario del Centro Norte SAB de CV Class B | | 6,700 | | 39 | |
| | Arca Continental SAB de CV | | 7,400 | | 39 | |
| | Banco Santander Mexico SA Institucion de Banca Multiple Grupo Financiero Santand | | 29,100 | | 37 | |
* | | Infraestructura Energetica Nova SAB de CV | | 7,900 | | 33 | |
| | Grupo Financiero Inbursa SAB de CV | | 26,700 | | 33 | |
| | Mexichem SAB de CV | | 15,600 | | 29 | |
* | | Alsea SAB de CV | | 13,400 | | 29 | |
* | | Controladora Vuela Cia de Aviacion SAB de CV Class A | | 30,200 | | 27 | |
| | Regional SAB de CV | | 5,700 | | 26 | |
2 | | Concentradora Fibra Hotelera Mexicana SA de CV | | 48,900 | | 21 | |
| | Grupo Carso SAB de CV | | 7,300 | | 21 | |
| | PLA Administradora Industrial S de RL de CV | | 13,500 | | 19 | |
| | Industrias Penoles SAB de CV | | 1,555 | | 19 | |
* | | La Comer SAB de CV | | 13,200 | | 16 | |
| | Gentera SAB de CV | | 21,200 | | 16 | |
| | Grupo Cementos de Chihuahua SAB de CV | | 3,000 | | 16 | |
* | | Grupo Aeromexico SAB de CV | | 20,400 | | 16 | |
| | Bolsa Mexicana de Valores SAB de CV | | 7,100 | | 13 | |
* | | Hoteles City Express SAB de CV | | 14,100 | | 12 | |
| | Grupo Herdez SAB de CV | | 5,700 | | 12 | |
| | Grupo Comercial Chedraui SA de CV | | 7,600 | | 11 | |
2 | | GMexico Transportes SAB de CV | | 8,100 | | 9 | |
| | Prologis Property Mexico SA de CV | | 4,000 | | 8 | |
| | Credito Real SAB de CV SOFOM ER | | 6,800 | | 8 | |
| | Qualitas Controladora SAB de CV | | 2,100 | | 7 | |
* | | Genomma Lab Internacional SAB de CV Class B | | 7,800 | | 7 | |
| | Corp Inmobiliaria Vesta SAB de CV | | 3,500 | | 5 | |
| | Grupo Rotoplas SAB de CV | | 7,800 | | 5 | |
| | Grupo Lala SAB de CV | | 4,300 | | 4 | |
| | TV Azteca SAB de CV | | 76,200 | | 4 | |
* | | Axtel SAB de CV | | 29,400 | | 3 | |
| | | | | | 3,105 | |
Netherlands (2.7%) | | | | | |
| | Unilever NV | | 34,737 | | 2,155 | |
| | ASML Holding NV | | 9,588 | | 2,132 | |
| | Koninklijke Philips NV | | 23,186 | | 1,093 | |
| | ING Groep NV | | 96,808 | | 925 | |
| | Koninklijke Ahold Delhaize NV | | 28,063 | | 657 | |
| | Koninklijke DSM NV | | 4,509 | | 561 | |
| | Akzo Nobel NV | | 5,755 | | 516 | |
| | Wolters Kluwer NV | | 7,068 | | 509 | |
| | Unibail-Rodamco-Westfield | | 3,459 | | 453 | |
| | Koninklijke KPN NV | | 97,185 | | 308 | |
^ | | NN Group NV | | 7,952 | | 266 | |
| | IMCD NV | | 3,013 | | 211 | |
| | Aegon NV | | 54,283 | | 207 | |
2 | | ABN AMRO Bank NV | | 11,537 | | 205 | |
*,2 | | Adyen NV | | 278 | | 202 | |
| | Randstad NV | | 4,207 | | 196 | |
| | ASR Nederland NV | | 4,908 | | 172 | |
| | TKH Group NV | | 2,450 | | 117 | |
| | ASM International NV | | 711 | | 60 | |
*,2 | | Takeaway.com NV | | 509 | | 49 | |
2 | | Intertrust NV | | 2,233 | | 46 | |
2 | | Signify NV | | 1,579 | | 46 | |
| | SBM Offshore NV | | 2,683 | | 45 | |
| | Corbion NV | | 1,456 | | 41 | |
| | BE Semiconductor Industries NV | | 1,317 | | 39 | |
| | VEON Ltd. | | 14,068 | | 36 | |
| | Koninklijke Vopak NV | | 712 | | 34 | |
* | | OCI NV | | 1,487 | | 33 | |
| | Sligro Food Group NV | | 1,092 | | 31 | |
| | Boskalis Westminster | | 1,540 | | 31 | |
| | APERAM SA | | 1,058 | | 26 | |
| | Koninklijke BAM Groep NV | | 6,201 | | 18 | |
34
ESG International Stock ETF
| | | | | | Market | |
| | | | | | Value· | |
| | | | Shares | | ($000 | ) |
| | Wereldhave NV | | 895 | | 18 | |
| | PostNL NV | | 8,456 | | 17 | |
| | TomTom NV | | 1,236 | | 15 | |
2 | | Flow Traders | | 543 | | 15 | |
*,2 | | Basic-Fit NV | | 349 | | 11 | |
| | Accell Group NV | | 378 | | 9 | |
| | NSI NV | | 202 | | 9 | |
| | Wessanen | | 624 | | 8 | |
| | Vastned Retail NV | | 142 | | 4 | |
2 | | GrandVision NV | | 113 | | 3 | |
| | | | | | 11,529 | |
New Zealand (0.4%) | | | | | |
| | Contact Energy Ltd. | | 41,110 | | 217 | |
| | Auckland International Airport Ltd. | | 35,742 | | 217 | |
| | Spark New Zealand Ltd. | | 77,335 | | 215 | |
| | Fisher & Paykel Healthcare Corp. Ltd. | | 19,951 | | 209 | |
* | | a2 Milk Co. Ltd. | | 21,906 | | 199 | |
| | Ryman Healthcare Ltd. | | 6,130 | | 50 | |
| | Meridian Energy Ltd. | | 14,253 | | 45 | |
| | Infratil Ltd. | | 14,663 | | 42 | |
| | Mercury NZ Ltd. | | 11,981 | | 39 | |
| | Mainfreight Ltd. | | 1,339 | | 35 | |
| | Fletcher Building Ltd. | | 11,978 | | 34 | |
| | Kiwi Property Group Ltd. | | 31,736 | | 33 | |
| | Genesis Energy Ltd. | | 13,999 | | 30 | |
| | Freightways Ltd. | | 4,706 | | 24 | |
| | Precinct Properties New Zealand Ltd. | | 19,911 | | 23 | |
| | EBOS Group Ltd. | | 1,392 | | 21 | |
| | Summerset Group Holdings Ltd. | | 5,141 | | 20 | |
| | Z Energy Ltd. | | 3,990 | | 16 | |
| | Goodman Property Trust | | 8,559 | | 12 | |
* | | Synlait Milk Ltd. | | 1,759 | | 10 | |
| | Air New Zealand Ltd. | | 4,685 | | 8 | |
| | Tourism Holdings Ltd. | | 1,445 | | 3 | |
| | | | | | 1,502 | |
Norway (0.6%) | | | | | |
| | DNB ASA | | 26,690 | | 430 | |
| | Telenor ASA | | 17,775 | | 365 | |
^ | | Mowi ASA | | 12,881 | | 308 | |
| | Yara International ASA | | 5,326 | | 231 | |
| | Orkla ASA | | 25,016 | | 229 | |
| | Norsk Hydro ASA | | 48,841 | | 153 | |
| | Storebrand ASA | | 23,918 | | 138 | |
| | TGS NOPEC Geophysical Co. ASA | | 2,713 | | 65 | |
| | Schibsted ASA Class B | | 2,167 | | 63 | |
| | SpareBank 1 SMN | | 5,532 | | 58 | |
| | SpareBank 1 SR-Bank ASA | | 4,383 | | 46 | |
| | Tomra Systems ASA | | 1,547 | | 43 | |
| | Bakkafrost P/F | | 652 | | 38 | |
2 | | Entra ASA | | 2,375 | | 36 | |
| | Gjensidige Forsikring ASA | | 1,826 | | 35 | |
| | Salmar ASA | | 680 | | 32 | |
* | | Adevinta ASA Class B | | 2,167 | | 27 | |
* | | Norwegian Finans Holding ASA | | 3,286 | | 26 | |
| | Atea ASA | | 1,925 | | 25 | |
| | Leroy Seafood Group ASA | | 3,662 | | 24 | |
| | Austevoll Seafood ASA | | 1,525 | | 16 | |
* | | Frontline Ltd. | | 1,793 | | 15 | |
2 | | Scatec Solar ASA | | 1,284 | | 15 | |
| | Subsea 7 SA | | 1,488 | | 14 | |
2 | | Elkem ASA | | 4,052 | | 10 | |
*,2 | | BW LPG Ltd. | | 1,671 | | 8 | |
| | Schibsted ASA Class A | | 268 | | 8 | |
2 | | Sbanken ASA | | 1,173 | | 8 | |
| | Borregaard ASA | | 780 | | 8 | |
| | Veidekke ASA | | 714 | | 7 | |
* | | PGS ASA | | 5,895 | | 7 | |
* | | Nordic Semiconductor ASA | | 1,374 | | 6 | |
* | | Seadrill Ltd. | | 2,553 | | 6 | |
| | Hoegh LNG Holdings Ltd. | | 1,642 | | 6 | �� |
| | Grieg Seafood ASA | | 422 | | 5 | |
* | | Akastor ASA | | 3,428 | | 4 | |
*,2 | | XXL ASA | | 1,524 | | 4 | |
*,2 | | Aker Solutions ASA | | 1,196 | | 4 | |
* | | Norwegian Air Shuttle ASA | | 874 | | 4 | |
* | | Adevinta ASA Class A | | 268 | | 3 | |
| | | | | | 2,530 | |
Other (0.0%) | | | | | |
* | | B2W Cia Digital Rights Exp. 09/21/2019 | | 448 | | 1 | |
* | | Gol Linhas Aereas Inteligentes SA Preference Shares Rights Exp. 10/03/2019 | | 106 | | — | |
* | | AES Tiete Energia SA Rights Exp. 09/13/2019 | | 47 | | — | |
*,§ | | Legend Holdings Corp. Rights | | 207 | | — | |
| | | | | | 1 | |
Pakistan (0.0%) | | | | | |
* | | SUI Southern Gas Co. Ltd. | | 497,000 | | 48 | |
| | Lucky Cement Ltd. | | 16,400 | | 37 | |
| | MCB Bank Ltd. | | 25,800 | | 28 | |
| | Kot Addu Power Co. Ltd. | | 77,500 | | 14 | |
| | SUI Northern Gas Pipeline | | 41,500 | | 13 | |
| | Searle Co. Ltd. | | 10,300 | | 9 | |
| | Pakistan State Oil Co. Ltd. | | 8,200 | | 6 | |
| | Hub Power Co. Ltd. | | 14,012 | | 6 | |
| | Engro Corp. Ltd. | | 2,420 | | 4 | |
| | Bank Alfalah Ltd. | | 15,000 | | 4 | |
| | Habib Bank Ltd. | | 5,300 | | 4 | |
| | | | | | 173 | |
35
ESG International Stock ETF
| | | | | | Market | |
| | | | | | Value· | |
| | | | Shares | | ($000 | ) |
Peru (0.0%) | | | | | |
| | Cia de Minas Buenaventura SAA ADR | | 3,900 | | 59 | |
| | | | | | | |
Philippines (0.2%) | | | | | |
| | Ayala Land Inc. | | 198,300 | | 180 | |
| | BDO Unibank Inc. | | 56,200 | | 161 | |
| | Bank of the Philippine Islands | | 71,230 | | 120 | |
| | International Container Terminal Services Inc. | | 26,250 | | 68 | |
| | Metropolitan Bank & Trust Co. | | 31,290 | | 43 | |
| | PLDT Inc. | | 1,850 | | 42 | |
| | Security Bank Corp. | | 9,140 | | 36 | |
| | Manila Electric Co. | | 4,610 | | 32 | |
| | First Gen Corp. | | 51,000 | | 26 | |
| | Cebu Air Inc. | | 13,720 | | 26 | |
| | Jollibee Foods Corp. | | 5,620 | | 26 | |
| | Ayala Corp. | | 1,430 | | 25 | |
| | Globe Telecom Inc. | | 580 | | 23 | |
| | San Miguel Food and Beverage Inc. | | 10,320 | | 18 | |
| | Manila Water Co. Inc. | | 31,600 | | 14 | |
| | Aboitiz Power Corp. | | 18,100 | | 13 | |
| | Filinvest Land Inc. | | 339,000 | | 10 | |
| | Wilcon Depot Inc. | | 30,900 | | 10 | |
| | Robinsons Retail Holdings Inc. | | 5,100 | | 8 | |
| | Puregold Price Club Inc. | | 9,000 | | 8 | |
| | Nickel Asia Corp. | | 144,000 | | 7 | |
| | Pilipinas Shell Petroleum Corp. | | 11,100 | | 7 | |
| | Vista Land & Lifescapes Inc. | | 36,100 | | 5 | |
*,2 | | CEMEX Holdings Philippines Inc. | | 72,000 | | 4 | |
| | | | | | 912 | |
Poland (0.2%) | | | | | |
| | Powszechna Kasa Oszczednosci Bank Polski SA | | 27,913 | | 275 | |
| | Powszechny Zaklad Ubezpieczen SA | | 16,653 | | 156 | |
| | Bank Polska Kasa Opieki SA | | 6,209 | | 152 | |
| | CD Projekt SA | | 1,020 | | 65 | |
* | | KGHM Polska Miedz SA | | 2,047 | | 40 | |
| | Santander Bank Polska SA | | 430 | | 33 | |
*,2 | | Dino Polska SA | | 712 | | 28 | |
* | | Orange Polska SA | | 17,084 | | 27 | |
| | LPP SA | | 13 | | 24 | |
* | | Bank Millennium SA | | 10,988 | | 18 | |
* | | Alior Bank SA | | 1,754 | | 18 | |
* | | mBank SA | | 187 | | 15 | |
| | CCC SA | | 469 | | 15 | |
| | KRUK SA | | 302 | | 13 | |
| | Asseco Poland SA | | 742 | | 10 | |
| | Cyfrowy Polsat SA | | 1,253 | | 9 | |
2 | | PLAY Communications SA | | 1,010 | | 9 | |
* | | AmRest Holdings SE | | 574 | | 6 | |
| | PKP Cargo SA | | 735 | | 5 | |
| | Budimex SA | | 146 | | 5 | |
* | | Energa SA | | 2,079 | | 3 | |
| | Kernel Holding SA | | 196 | | 2 | |
| | | | | | 928 | |
Portugal (0.1%) | | | | | |
| | Jeronimo Martins SGPS SA | | 3,893 | | 64 | |
| | Banco Comercial Portugues SA | | 141,822 | | 30 | |
| | NOS SGPS SA | | 4,992 | | 29 | |
| | Sonae SGPS SA | | 24,793 | | 23 | |
| | REN - Redes Energeticas Nacionais SGPS SA | | 6,873 | | 19 | |
| | Navigator Co. SA | | 4,298 | | 15 | |
| | CTT-Correios de Portugal SA | | 6,496 | | 13 | |
| | EDP Renovaveis SA | | 1,063 | | 12 | |
| | Altri SGPS SA | | 1,635 | | 10 | |
| | | | | | 215 | |
Qatar (0.3%) | | | | | |
| | Qatar National Bank QPSC | | 105,832 | | 557 | |
| | Masraf Al Rayan QSC | | 99,907 | | 100 | |
| | Industries Qatar QSC | | 26,710 | | 80 | |
| | Qatar Fuel QSC | | 13,074 | | 78 | |
| | Commercial Bank PSQC | | 42,054 | | 55 | |
| | Qatar Gas Transport Co. Ltd. | | 77,735 | | 51 | |
| | Qatar Navigation QSC | | 21,961 | | 36 | |
| | Ooredoo QPSC | | 17,270 | | 33 | |
| | Doha Bank QPSC | | 29,858 | | 21 | |
| | United Development Co. QSC | | 49,784 | | 19 | |
| | Al Meera Consumer Goods Co. QSC | | 4,301 | | 18 | |
| | Medicare Group | | 7,879 | | 17 | |
| | Vodafone Qatar QSC | | 26,815 | | 9 | |
* | | Ezdan Holding Group QSC | | 50,710 | | 8 | |
| | | | | | 1,082 | |
Russia (0.4%) | | | | | |
| | Sberbank of Russia PJSC | | 269,320 | | 905 | |
| | Mobile TeleSystems PJSC | | 29,820 | | 119 | |
| | AK Transneft OAO Preference Shares | | 47 | | 106 | |
| | VTB Bank PJSC | | 92,410,000 | | 54 | |
| | Novolipetsk Steel PJSC | | 22,270 | | 50 | |
| | Magnit PJSC | | 850 | | 47 | |
| | Inter RAO UES PJSC | | 676,000 | | 44 | |
36
ESG International Stock ETF
| | | | | | Market | |
| | | | | | Value· | |
| | | | Shares | | ($000 | ) |
| | Moscow Exchange MICEX-RTS PJSC | | 29,100 | | 41 | |
| | Polyus PJSC GDR | | 557 | | 32 | |
| | PhosAgro PJSC | | 732 | | 28 | |
| | OGK-2 PJSC | | 2,603,000 | | 21 | |
| | Magnitogorsk Iron & Steel Works PJSC | | 28,700 | | 18 | |
| | TGC-1 PJSC | | 94,300,000 | | 15 | |
| | RusHydro PJSC | | 1,809,000 | | 15 | |
| | ROSSETI PJSC | | 835,000 | | 15 | |
| | Polyus PJSC | | 117 | | 13 | |
| | Aeroflot PJSC | | 7,410 | | 12 | |
| | Federal Grid Co. Unified Energy System PJSC | | 3,960,000 | | 11 | |
| | ENEL RUSSIA PJSC | | 546,000 | | 8 | |
| | Lenenergo PJSC Preference Shares | | 2,500 | | 4 | |
| | TMK PJSC | | 2,370 | | 2 | |
| | | | | | 1,560 | |
Singapore (1.1%) | | | | | |
| | DBS Group Holdings Ltd. | | 45,700 | | 806 | |
| | Oversea-Chinese Banking Corp. Ltd. | | 84,900 | | 651 | |
| | United Overseas Bank Ltd. | | 33,500 | | 602 | |
| | Singapore Telecommunications Ltd. | | 178,600 | | 407 | |
| | Singapore Exchange Ltd. | | 40,300 | | 238 | |
| | City Developments Ltd. | | 31,000 | | 214 | |
| | Keppel Corp. Ltd. | | 50,300 | | 211 | |
| | UOL Group Ltd. | | 37,000 | | 196 | |
| | CapitaLand Ltd. | | 75,600 | | 189 | |
| | ComfortDelGro Corp. Ltd. | | 102,800 | | 181 | |
| | Singapore Press Holdings Ltd. | | 107,500 | | 154 | |
| | Wilmar International Ltd. | | 49,500 | | 136 | |
| | Suntec REIT | | 40,900 | | 57 | |
| | Mapletree Industrial Trust | | 32,100 | | 53 | |
| | NetLink NBN Trust | | 80,700 | | 52 | |
| | Mapletree Logistics Trust | | 44,800 | | 51 | |
| | Mapletree North Asia Commercial Trust | | 44,900 | | 43 | |
| | Keppel REIT | | 46,800 | | 41 | |
| | Manulife US REIT | | 42,200 | | 38 | |
| | Sembcorp Industries Ltd. | | 24,200 | | 36 | |
| | Venture Corp. Ltd. | | 3,300 | | 36 | |
| | Hutchison Port Holdings Trust | | 129,400 | | 20 | |
| | Olam International Ltd. | | 14,300 | | 19 | |
| | Ascendas India Trust | | 18,200 | | 19 | |
* | | Sembcorp Marine Ltd. | | 22,100 | | 18 | |
| | Raffles Medical Group Ltd. | | 23,700 | | 17 | |
| | ESR-REIT | | 43,500 | | 16 | |
| | Keppel DC REIT | | 11,700 | | 15 | |
| | Golden Agri-Resources Ltd. | | 68,800 | | 13 | |
| | Ascott Residence Trust | | 13,700 | | 13 | |
| | Frasers Logistics & Industrial Trust | | 9,800 | | 9 | |
| | Lippo Malls Indonesia Retail Trust | | 32,400 | | 5 | |
* | | Yoma Strategic Holdings Ltd. | | 20,000 | | 4 | |
| | StarHub Ltd. | | 4,400 | | 4 | |
§ | | Best World International Ltd. | | 3,000 | | 3 | |
| | SATS Ltd. | | 800 | | 3 | |
| | | | | | 4,570 | |
South Africa (1.7%) | | | | | |
| | Naspers Ltd. | | 10,527 | | 2,396 | |
| | Standard Bank Group Ltd. | | 33,375 | | 390 | |
| | FirstRand Ltd. | | 81,760 | | 323 | |
| | Sanlam Ltd. | | 48,205 | | 231 | |
| | Bid Corp. Ltd. | | 10,518 | | 225 | |
| | Absa Group Ltd. | | 20,981 | | 212 | |
| | Remgro Ltd. | | 17,075 | | 193 | |
| | Nedbank Group Ltd. | | 12,122 | | 181 | |
| | Bidvest Group Ltd. | | 12,706 | | 150 | |
| | Vodacom Group Ltd. | | 17,849 | | 135 | |
| | Old Mutual Ltd. | | 112,303 | | 134 | |
| | RMB Holdings Ltd. | | 28,444 | | 134 | |
| | Clicks Group Ltd. | | 10,084 | | 132 | |
| | Gold Fields Ltd. | | 22,006 | | 130 | |
| | Redefine Properties Ltd. | | 242,699 | | 126 | |
| | Growthpoint Properties Ltd. | | 82,711 | | 125 | |
| | SPAR Group Ltd. | | 10,866 | | 124 | |
| | PSG Group Ltd. | | 8,905 | | 118 | |
| | Capitec Bank Holdings Ltd. | | 1,623 | | 117 | |
| | Foschini Group Ltd. | | 11,567 | | 115 | |
| | Shoprite Holdings Ltd. | | 14,561 | | 109 | |
| | AVI Ltd. | | 18,155 | | 99 | |
| | Mr Price Group Ltd. | | 8,657 | | 98 | |
| | Tiger Brands Ltd. | | 6,796 | | 94 | |
| | Discovery Ltd. | | 11,875 | | 90 | |
* | | Impala Platinum Holdings Ltd. | | 12,466 | | 71 | |
| | Aspen Pharmacare Holdings Ltd. | | 12,011 | | 62 | |
* | | MultiChoice Group | | 6,483 | | 57 | |
| | Anglo American Platinum Ltd. | | 879 | | 54 | |
| | NEPI Rockcastle plc | | 4,932 | | 44 | |
| | Fortress REIT Ltd. Class A | | 23,070 | | 32 | |
| | Rand Merchant Investment Holdings Ltd. | | 16,193 | | 32 | |
* | | Northam Platinum Ltd. | | 5,765 | | 30 | |
| | Barloworld Ltd. | | 3,920 | | 29 | |
| | Pick n Pay Stores Ltd. | | 7,522 | | 29 | |
| | Investec Ltd. | | 5,051 | | 27 | |
| | Pioneer Foods Group Ltd. | | 3,809 | | 26 | |
37
ESG International Stock ETF
| | | | | | Market | |
| | | | | | Value· | |
| | | | Shares | | ($000 | ) |
* | | Harmony Gold Mining Co. Ltd. | | 7,188 | | 26 | |
| | Truworths International Ltd. | | 7,419 | | 26 | |
| | Netcare Ltd. | | 23,285 | | 25 | |
| | Vukile Property Fund Ltd. | | 19,973 | | 25 | |
| | Telkom SA SOC Ltd. | | 4,621 | | 24 | |
| | Hyprop Investments Ltd. | | 5,458 | | 24 | |
| | JSE Ltd. | | 2,651 | | 23 | |
| | Sappi Ltd. | | 7,124 | | 21 | |
| | Liberty Holdings Ltd. | | 2,847 | | 21 | |
| | Reunert Ltd. | | 4,636 | | 20 | |
| | Motus Holdings Ltd. | | 3,936 | | 19 | |
| | AECI Ltd. | | 3,214 | | 19 | |
| | Kumba Iron Ore Ltd. | | 660 | | 17 | |
| | KAP Industrial Holdings Ltd. | | 42,829 | | 15 | |
2 | | Pepkor Holdings Ltd. | | 13,033 | | 14 | |
2 | | Dis-Chem Pharmacies Ltd. | | 8,756 | | 13 | |
| | Coronation Fund Managers Ltd. | | 4,546 | | 13 | |
| | Santam Ltd. | | 637 | | 12 | |
| | Momentum Metropolitan Holdings | | 10,419 | | 11 | |
| | SA Corporate Real Estate Ltd. | | 52,269 | | 11 | |
| | Assore Ltd. | | 497 | | 10 | |
* | | Nampak Ltd. | | 14,448 | | 9 | |
| | Massmart Holdings Ltd. | | 2,664 | | 8 | |
| | Resilient REIT Ltd. | | 1,780 | | 7 | |
* | | Super Group Ltd. | | 3,557 | | 7 | |
| | Imperial Logistics Ltd. | | 1,382 | | 5 | |
| | Astral Foods Ltd. | | 453 | | 5 | |
| | Oceana Group Ltd. | | 852 | | 4 | |
* | | PPC Ltd. | | 14,109 | | 4 | |
| | Lewis Group Ltd. | | 1,258 | | 3 | |
| | | | | | 7,115 | |
South Korea (3.2%) | | | | | |
| | Samsung Electronics Co. Ltd. | | 116,681 | | 4,248 | |
| | SK Hynix Inc. | | 13,497 | | 864 | |
| | Samsung Electronics Co. Ltd. Preference Shares | | 20,991 | | 640 | |
| | Shinhan Financial Group Co. Ltd. | | 12,896 | | 434 | |
| | NAVER Corp. | | 3,278 | | 397 | |
| | LG Chem Ltd. | | 1,323 | | 362 | |
| | Hyundai Mobis Co. Ltd. | | 1,724 | | 354 | |
| | KB Financial Group Inc. | | 10,603 | | 346 | |
| | Hyundai Motor Co. | | 3,127 | | 332 | |
| | LG Household & Health Care Ltd. | | 293 | | 286 | |
| | Kia Motors Corp. | | 7,543 | | 272 | |
| | Samsung SDI Co. Ltd. | | 1,176 | | 243 | |
| | Hana Financial Group Inc. | | 8,521 | | 229 | |
| | Samsung Fire & Marine Insurance Co. Ltd. | | 1,032 | | 195 | |
| | Woori Financial Group Inc. | | 17,646 | | 174 | |
| | Mirae Asset Daewoo Co. Ltd. | | 24,769 | | 152 | |
| | S-Oil Corp. | | 1,772 | | 142 | |
| | Samsung Securities Co. Ltd. | | 4,774 | | 139 | |
| | Industrial Bank of Korea | | 13,124 | | 134 | |
| | BNK Financial Group Inc. | | 23,635 | | 131 | |
| | Samsung Electro-Mechanics Co. Ltd. | | 1,654 | | 122 | |
| | Woongjin Coway Co. Ltd. | | 1,634 | | 113 | |
| | Kakao Corp. | | 940 | | 105 | |
| | SK Securities Co. Ltd. | | 204,769 | | 104 | |
| | Samsung Life Insurance Co. Ltd. | | 1,847 | | 104 | |
* | | Helixmith Co. Ltd. | | 662 | | 100 | |
| | Amorepacific Corp. Preference Shares | | 1,472 | | 88 | |
| | Lotte Chemical Corp. | | 461 | | 86 | |
* | | LG Display Co. Ltd. | | 7,361 | | 85 | |
| | CJ CheilJedang Corp. | | 439 | | 83 | |
| | DB Insurance Co. Ltd. | | 2,032 | | 80 | |
| | Fila Korea Ltd. | | 1,578 | | 75 | |
| | Lotte Shopping Co. Ltd. | | 626 | | 70 | |
| | Lotte Corp. | | 2,544 | | 70 | |
| | Hankook Tire & Technology Co. Ltd. | | 2,772 | | 67 | |
| | Hyundai Department Store Co. Ltd. | | 1,007 | | 65 | |
| | Samsung SDS Co. Ltd. | | 376 | | 61 | |
| | Green Cross Corp. | | 636 | | 57 | |
| | SK Telecom Co. Ltd. ADR | | 2,400 | | 53 | |
| | Amorepacific Corp. | | 416 | | 45 | |
* | | Korea Line Corp. | | 2,290 | | 44 | |
*,2 | | Samsung Biologics Co. Ltd. | | 195 | | 43 | |
| | Hyundai Glovis Co. Ltd. | | 321 | | 42 | |
| | Cheil Worldwide Inc. | | 1,797 | | 39 | |
| | SK Telecom Co. Ltd. | | 197 | | 39 | |
* | | Samsung Heavy Industries Co. Ltd. | | 5,878 | | 38 | |
* | | Samsung Engineering Co. Ltd. | | 2,788 | | 36 | |
| | Meritz Securities Co. Ltd. | | 8,815 | | 35 | |
| | Samsung Card Co. Ltd. | | 1,055 | | 29 | |
| | LG Uplus Corp. | | 2,581 | | 28 | |
* | | HLB Inc. | | 797 | | 28 | |
* | | Samsung Pharmaceutical Co. Ltd. | | 10,189 | | 26 | |
| | AMOREPACIFIC Group | | 524 | | 26 | |
| | Hyundai Marine & Fire Insurance Co. Ltd. | | 1,258 | | 25 | |
38
ESG International Stock ETF
| | | | | | Market | |
| | | | | | Value· | |
| | | | Shares | | ($000 | ) |
| | KCC Corp. | | 131 | | 24 | |
| | DoubleUGames Co. Ltd. | | 531 | | 24 | |
| | LG Innotek Co. Ltd. | | 288 | | 23 | |
| | Yuhan Corp. | | 111 | | 21 | |
| | Ssangyong Cement Industrial Co. Ltd. | | 4,172 | | 20 | |
* | | Eusu Holdings Co. Ltd. | | 3,146 | | 19 | |
| | Hanon Systems | | 1,909 | | 18 | |
| | Hyundai Elevator Co. Ltd. | | 280 | | 18 | |
* | | Pearl Abyss Corp. | | 111 | | 18 | |
| | Hanjin Kal Corp. | | 726 | | 18 | |
| | Kolon Industries Inc. | | 506 | | 17 | |
* | | Hansol Holdings Co. Ltd. | | 4,356 | | 16 | |
* | | COSON Co. Ltd. | | 3,236 | | 16 | |
| | POSCO Chemical Co. Ltd. | | 357 | | 16 | |
| | Com2uSCorp | | 191 | | 15 | |
| | BGF retail Co. Ltd. | | 88 | | 15 | |
| | Douzone Bizon Co. Ltd. | | 305 | | 14 | |
* | | Hyundai Merchant Marine Co. Ltd. | | 5,073 | | 14 | |
| | Korean Air Lines Co. Ltd. | | 776 | | 14 | |
| | Interpark Holdings Corp. | | 8,100 | | 14 | |
| | Hankook Shell Oil Co. Ltd. | | 52 | | 14 | |
| | i-SENS Inc. | | 589 | | 14 | |
| | LG Household & Health Care Ltd. Preference Shares | | 23 | | 14 | |
| | NS Shopping Co. Ltd. | | 1,628 | | 14 | |
* | | Komipharm International Co. Ltd. | | 1,336 | | 13 | |
* | | Hyosung Heavy Industries Corp. | | 457 | | 13 | |
* | | Leaders Cosmetics Co. Ltd. | | 2,509 | | 13 | |
* | | Oscotec Inc. | | 862 | | 13 | |
* | | CJ Logistics Corp. | | 108 | | 13 | |
| | Hyundai Steel Co. | | 409 | | 13 | |
| | Kolmar Korea Co. Ltd. | | 347 | | 12 | |
| | Meritz Fire & Marine Insurance Co. Ltd. | | 835 | | 12 | |
| | TK Corp. | | 1,400 | | 12 | |
* | | CUROCOM Co. Ltd. | | 14,268 | | 12 | |
* | | Sangsangin Co. Ltd. | | 1,251 | | 12 | |
| | iMarketKorea Inc. | | 1,222 | | 12 | |
* | | Coreana Cosmetics Co. Ltd. | | 4,004 | | 12 | |
| | Kumho Petrochemical Co. Ltd. | | 196 | | 11 | |
| | OCI Co. Ltd. | | 207 | | 11 | |
| | LOTTE Fine Chemical Co. Ltd. | | 311 | | 11 | |
* | | Asiana Airlines Inc. | | 2,347 | | 11 | |
| | NEPES Corp. | | 397 | | 11 | |
| | KISCO Corp. | | 2,576 | | 11 | |
* | | Enzychem Lifesciences Corp. | | 225 | | 11 | |
| | Hanjin Transportation Co. Ltd. | | 434 | | 11 | |
* | | Neowiz | | 774 | | 10 | |
| | Korean Reinsurance Co. | | 1,499 | | 10 | |
* | | Lutronic Corp. | | 1,359 | | 10 | |
* | | Foosung Co. Ltd. | | 1,294 | | 10 | |
* | | Anterogen Co. Ltd. | | 291 | | 10 | |
* | | Ananti Inc. | | 956 | | 10 | |
* | | CMG Pharmaceutical Co. Ltd. | | 3,943 | | 9 | |
* | | Genexine Co. Ltd. | | 211 | | 9 | |
| | Dae Hwa Pharmaceutical Co. Ltd. | | 783 | | 9 | |
| | KISWIRE Ltd. | | 452 | | 9 | |
| | Vieworks Co. Ltd. | | 424 | | 9 | |
| | Koh Young Technology Inc. | | 135 | | 9 | |
| | GOLFZON Co. Ltd. | | 155 | | 9 | |
| | Youngone Corp. | | 290 | | 8 | |
| | Korea Electric Terminal Co. Ltd. | | 215 | | 8 | |
* | | Hugel Inc. | | 27 | | 8 | |
* | | Hanall Biopharma Co. Ltd. | | 364 | | 8 | |
* | | Aprogen pharmaceuticals Inc. | | 12,249 | | 8 | |
* | | ABLBio Inc. | | 516 | | 8 | |
| | SK Gas Ltd. | | 123 | | 8 | |
| | LG Chem Ltd. Preference Shares | | 52 | | 8 | |
| | WONIK IPS Co. Ltd. | | 393 | | 8 | |
| | Cuckoo Homesys Co. Ltd. | | 224 | | 8 | |
| | Sung Kwang Bend Co. Ltd. | | 859 | | 7 | |
* | | Esmo Corp. | | 1,491 | | 7 | |
| | Chongkundang Holdings Corp. | | 97 | | 7 | |
* | | Cafe24 Corp. | | 127 | | 7 | |
| | Byucksan Corp. | | 5,036 | | 7 | |
| | E1 Corp. | | 173 | | 7 | |
| | Mando Corp. | | 242 | | 7 | |
* | | Eutilex Co. Ltd. | | 140 | | 7 | |
| | INTOPS Co. Ltd. | | 636 | | 7 | |
* | | Mezzion Pharma Co. Ltd. | | 76 | | 6 | |
| | Eo Technics Co. Ltd. | | 104 | | 6 | |
* | | Naturecell Co. Ltd. | | 1,209 | | 6 | |
* | | Webzen Inc. | | 432 | | 6 | |
| | Innocean Worldwide Inc. | | 112 | | 6 | |
| | SK Materials Co. Ltd. | | 40 | | 6 | |
* | | DIO Corp. | | 165 | | 6 | |
* | | Celltrion Pharm Inc. | | 218 | | 6 | |
| | DB HiTek Co. Ltd. | | 488 | | 6 | |
| | NICE Information Service Co. Ltd. | | 538 | | 6 | |
* | | Osstem Implant Co. Ltd. | | 154 | | 6 | |
| | Dongjin Semichem Co. Ltd. | | 516 | | 6 | |
| | JB Financial Group Co. Ltd. | | 1,277 | | 6 | |
39
ESG International Stock ETF
| | | | | | Market | |
| | | | | | Value· | |
| | | | Shares | | ($000 | ) |
| | Ahnlab Inc. | | 112 | | 6 | |
| | LS Industrial Systems Co. Ltd. | | 143 | | 5 | |
* | | HLB Life Science CO Ltd. | | 908 | | 5 | |
| | KIWOOM Securities Co. Ltd. | | 98 | | 5 | |
| | Taekwang Industrial Co. Ltd. | | 6 | | 5 | |
* | | Gamevil Inc. | | 207 | | 5 | |
* | | Able C&C Co. Ltd. | | 625 | | 5 | |
| | HS Industries Co. Ltd. | | 716 | | 5 | |
| | Dentium Co. Ltd. | | 91 | | 5 | |
* | | Iljin Materials Co. Ltd. | | 146 | | 5 | |
| | Partron Co. Ltd. | | 533 | | 5 | |
| | LEENO Industrial Inc. | | 112 | | 5 | |
| | Seoul Semiconductor Co. Ltd. | | 418 | | 5 | |
| | F&F Co. Ltd. | | 77 | | 5 | |
| | InBody Co. Ltd. | | 250 | | 5 | |
| | Mirae Asset Life Insurance Co. Ltd. | | 1,455 | | 5 | |
| | COSMAX NBT Inc. | | 780 | | 5 | |
| | SL Corp. | | 274 | | 5 | |
| | Hyundai Greenfood Co. Ltd. | | 509 | | 5 | |
| | Taeyoung Engineering & Construction Co. Ltd. | | 477 | | 5 | |
| | Halla Holdings Corp. | | 135 | | 5 | |
| | Dongwon Industries Co. Ltd. | | 25 | | 5 | |
* | | Inscobee Inc. | | 2,000 | | 5 | |
| | Hansol Chemical Co. Ltd. | | 72 | | 5 | |
| | Green Cross Holdings Corp. | | 304 | | 5 | |
| | JYP Entertainment Corp. | | 289 | | 5 | |
* | | Seegene Inc. | | 251 | | 5 | |
| | Daeduck Electronics Co. | | 574 | | 4 | |
* | | CrystalGenomics Inc. | | 405 | | 4 | |
| | Shinsegae International Inc. | | 29 | | 4 | |
| | Daewoong Pharmaceutical Co. Ltd. | | 32 | | 4 | |
| | Dae Han Flour Mills Co. Ltd. | | 30 | | 4 | |
| | Daekyo Co. Ltd. | | 867 | | 4 | |
| | Advanced Process Systems Corp. | | 198 | | 4 | |
| | Sebang Global Battery Co. Ltd. | | 134 | | 4 | |
* | | SM Entertainment Co. Ltd. | | 170 | | 4 | |
* | | Pharmicell Co. Ltd. | | 671 | | 4 | |
| | Samchully Co. Ltd. | | 60 | | 4 | |
| | GS Home Shopping Inc. | | 31 | | 4 | |
| | Hyundai Home Shopping Network Corp. | | 52 | | 4 | |
* | | GemVax & Kael Co. Ltd. | | 399 | | 4 | |
* | | BH Co. Ltd. | | 301 | | 4 | |
| | Dong-A ST Co. Ltd. | | 55 | | 4 | |
* | | G-treeBNT Co. Ltd. | | 224 | | 4 | |
| | Daea TI Co. Ltd. | | 895 | | 4 | |
| | Chong Kun Dang Pharmaceutical Corp. | | 56 | | 4 | |
* | | LegoChem Biosciences Inc. | | 101 | | 4 | |
| | Binggrae Co. Ltd. | | 81 | | 4 | |
| | Tongyang Inc. | | 2,898 | | 4 | |
| | Namyang Dairy Products Co. Ltd. | | 9 | | 4 | |
| | LF Corp. | | 230 | | 4 | |
| | Daesang Corp. | | 202 | | 4 | |
| | Samyang Holdings Corp. | | 72 | | 4 | |
* | | Dongkuk Steel Mill Co. Ltd. | | 712 | | 4 | |
* | | Amicogen Inc. | | 213 | | 4 | |
| | Handsome Co. Ltd. | | 146 | | 4 | |
* | | Seobu T&D | | 557 | | 4 | |
| | Hancom Inc. | | 421 | | 4 | |
* | | Humax Co. Ltd. | | 745 | | 4 | |
* | | NKMax Co. Ltd. | | 397 | | 3 | |
| | CJ CGV Co. Ltd. | | 124 | | 3 | |
| | Sam Chun Dang Pharm Co. Ltd. | | 130 | | 3 | |
| | Youngone Holdings Co. Ltd. | | 84 | | 3 | |
| | Bukwang Pharmaceutical Co. Ltd. | | 294 | | 3 | |
| | Soulbrain Co. Ltd. | | 60 | | 3 | |
| | Hansae Co. Ltd. | | 229 | | 3 | |
* | | Medipost Co. Ltd. | | 136 | | 3 | |
| | SK Chemicals Co. Ltd. | | 91 | | 3 | |
* | | Cellumed Co. Ltd. | | 685 | | 3 | |
* | | KONA I Co. Ltd. | | 235 | | 3 | |
* | | Telcon RF Pharmaceutical Inc. | | 768 | | 3 | |
| | Cosmax BTI Inc | | 293 | | 3 | |
* | | iNtRON Biotechnology Inc. | | 283 | | 3 | |
* | | Binex Co. Ltd. | | 446 | | 3 | |
| | Hana Tour Service Inc. | | 87 | | 3 | |
| | Wemade Co. Ltd. | | 118 | | 3 | |
* | | Ecopro Co. Ltd. | | 179 | | 3 | |
| | Modetour Network Inc. | | 241 | | 3 | |
* | | Homecast Co. Ltd. | | 757 | | 3 | |
* | | STCUBE | | 278 | | 3 | |
* | | Ssangyong Motor Co. | | 912 | | 2 | |
* | | Feelux Co. Ltd. | | 509 | | 2 | |
| | | | | | 13,520 | |
Spain (1.8%) | | | | | |
| | Banco Santander SA | | 382,074 | | 1,447 | |
| | Industria de Diseno Textil SA | | 26,428 | | 818 | |
| | Banco Bilbao Vizcaya Argentaria SA | | 165,257 | | 784 | |
| | Telefonica SA | | 109,560 | | 761 | |
| | Amadeus IT Group SA | | 10,171 | | 759 | |
| | Grifols SA | | 9,572 | | 304 | |
2 | | Aena SME SA | | 1,507 | | 272 | |
2 | | Cellnex Telecom SA | | 6,588 | | 264 | |
40
ESG International Stock ETF
| | | | | | Market | |
| | | | | | Value· | |
| | | | Shares | | ($000 | ) |
| | CaixaBank SA | | 97,867 | | 222 | |
| | Red Electrica Corp. SA | | 11,097 | | 220 | |
| | Grifols SA Preference Shares | | 8,211 | | 175 | |
| | Enagas SA | | 7,998 | | 174 | |
| | Bankinter SA | | 29,593 | | 172 | |
| | Banco de Sabadell SA | | 174,848 | | 150 | |
| | Merlin Properties Socimi SA | | 10,450 | | 140 | |
| | Bankia SA | | 57,713 | | 105 | |
| | Inmobiliaria Colonial Socimi SA | | 3,756 | | 43 | |
| | Faes Farma SA | | 8,070 | | 42 | |
| | Bolsas y Mercados Espanoles SHMSF SA | | 1,444 | | 37 | |
| | Mapfre SA | | 13,921 | | 36 | |
| | Ebro Foods SA | | 1,729 | | 36 | |
| | Corp Financiera Alba SA | | 679 | | 34 | |
* | | Masmovil Ibercom SA | | 1,471 | | 30 | |
| | Viscofan SA | | 636 | | 30 | |
| | CIE Automotive SA | | 1,156 | | 27 | |
* | | Almirall SA | | 1,397 | | 27 | |
| | Acerinox SA | | 3,193 | | 27 | |
| | Prosegur Cia de Seguridad SA | | 6,488 | | 24 | |
* | | Indra Sistemas SA | | 3,000 | | 24 | |
*,2 | | Neinor Homes SA | | 1,895 | | 23 | |
| | Zardoya Otis SA | | 3,083 | | 21 | |
| | Cia de Distribucion Integral Logista Holdings SA | | 1,020 | | 20 | |
2 | | Prosegur Cash SA | | 12,332 | | 19 | |
* | | Fluidra SA | | 1,229 | | 15 | |
2 | | Metrovacesa SA | | 937 | | 9 | |
* | | Sacyr SA | | 3,538 | | 9 | |
2 | | Euskaltel SA | | 978 | | 8 | |
* | | Fomento de Construcciones y Contratas SA | | 641 | | 8 | |
* | | Pharma Mar SA | | 3,177 | | 7 | |
2 | | Gestamp Automocion SA | | 1,513 | | 7 | |
| | Ence Energia y Celulosa SA | | 1,476 | | 6 | |
| | Construcciones y Auxiliar de Ferrocarriles SA | | 129 | | 6 | |
* | | Promotora de Informaciones SA | | 3,532 | | 5 | |
2 | | Unicaja Banco SA | | 6,305 | | 5 | |
| | | | | | 7,352 | |
Sweden (2.2%) | | | | | |
| | Telefonaktiebolaget LM Ericsson Class B | | 76,607 | | 599 | |
| | Atlas Copco AB Class A | | 20,017 | | 599 | |
| | Volvo AB Class B | | 38,091 | | 527 | |
| | Assa Abloy AB Class B | | 23,336 | | 487 | |
| | Hennes & Mauritz AB Class B | | 23,704 | | 454 | |
| | Essity AB Class B | | 14,507 | | 453 | |
| | Swedbank AB Class A | | 25,123 | | 323 | |
| | Skandinaviska Enskilda Banken AB Class A | | 35,714 | | 307 | |
| | Investor AB Class A | | 6,423 | | 298 | |
| | Svenska Handelsbanken AB Class A | | 32,861 | | 290 | |
| | Investor AB Class B | | 5,853 | | 275 | |
| | Telia Co. AB | | 61,598 | | 270 | |
| | Industrivarden AB Class A | | 11,517 | | 248 | |
| | SKF AB | | 15,176 | | 245 | |
| | Kinnevik AB | | 8,842 | | 241 | |
| | Skanska AB Class B | | 12,836 | | 241 | |
| | Boliden AB | | 10,445 | | 231 | |
| | Svenska Cellulosa AB SCA Class B | | 26,618 | | 230 | |
^ | | Tele2 AB | | 15,987 | | 226 | |
| | Castellum AB | | 8,846 | | 189 | |
| | Securitas AB Class B | | 12,095 | | 181 | |
| | Electrolux AB Class B | | 7,746 | | 173 | |
| | Trelleborg AB Class B | | 12,078 | | 165 | |
| | Elekta AB Class B | | 10,754 | | 137 | |
| | Atlas Copco AB Class B | | 5,039 | | 134 | |
* | | Swedish Orphan Biovitrum AB | | 6,725 | | 111 | |
| | Nibe Industrier AB Class B | | 5,626 | | 71 | |
| | AAK AB | | 3,156 | | 63 | |
| | Fabege AB | | 3,601 | | 60 | |
| | Pandox AB Class B | | 2,924 | | 57 | |
| | Husqvarna AB | | 6,867 | | 53 | |
| | ICA Gruppen AB | | 1,024 | | 50 | |
| | Indutrade AB | | 1,680 | | 48 | |
| | Kungsleden AB | | 5,167 | | 48 | |
| | Loomis AB Class B | | 1,400 | | 47 | |
| | Getinge AB | | 3,256 | | 45 | |
| | Axfood AB | | 2,093 | | 44 | |
| | NCC AB Class B | | 2,731 | | 44 | |
| | Wihlborgs Fastigheter AB | | 2,704 | | 44 | |
| | Holmen AB | | 1,851 | | 43 | |
| | JM AB | | 1,606 | | 40 | |
| | Hemfosa Fastigheter AB | | 3,888 | | 39 | |
2 | | Dometic Group AB | | 4,793 | | 39 | |
2 | | Thule Group AB | | 1,949 | | 39 | |
| | SSAB AB Class B | | 14,204 | | 36 | |
2 | | Bravida Holding AB | | 3,873 | | 32 | |
| | Hexpol AB | | 4,265 | | 32 | |
| | Sweco AB Class B | | 1,208 | | 32 | |
^ | | Intrum AB | | 1,213 | | 31 | |
| | Wallenstam AB | | 2,737 | | 31 | |
| | BillerudKorsnas AB | | 2,770 | | 31 | |
| | Hufvudstaden AB Class A | | 1,589 | | 29 | |
| | Nordic Entertainment Group AB Class B | | 1,163 | | 28 | |
| | Bonava AB | | 2,184 | | 25 | |
41
ESG International Stock ETF
| | | | | | Market | |
| | | | | | Value· | |
| | | | Shares | | ($000 | ) |
| | Nobia AB | | 3,638 | | 21 | |
| | Investment AB Latour Class B | | 1,517 | | 20 | |
| | Peab AB | | 2,389 | | 20 | |
| | Lindab International AB | | 1,607 | | 16 | |
| | Nolato AB Class B | | 282 | | 15 | |
| | Svenska Handelsbanken AB Class B | | 1,415 | | 13 | |
| | Beijer Ref AB | | 563 | | 13 | |
| | Vitrolife AB | | 670 | | 12 | |
| | Klovern AB Preference Shares | | 279 | | 10 | |
* | | Adapteo Oyj | | 805 | | 10 | |
| | Clas Ohlson AB | | 967 | | 10 | |
* | | SAS AB | | 6,747 | | 9 | |
| | Avanza Bank Holding AB | | 1,095 | | 9 | |
| | Industrivarden AB | | 395 | | 8 | |
* | | Nyfosa AB | | 1,076 | | 7 | |
| | Bilia AB | | 824 | | 7 | |
2 | | Resurs Holding AB | | 1,152 | | 7 | |
| | Arjo AB | | 1,525 | | 6 | |
* | | Hansa Biopharma AB | | 352 | | 6 | |
| | Mycronic AB | | 472 | | 6 | |
*,2 | | Munters Group AB | | 1,379 | | 6 | |
2 | | Attendo AB | | 1,249 | | 6 | |
| | Bure Equity AB | | 327 | | 5 | |
2 | | Scandic Hotels Group AB | | 536 | | 4 | |
| | Concentric AB | | 326 | | 4 | |
| | SkiStar AB | | 284 | | 3 | |
| | Haldex AB | | 636 | | 3 | |
| | | | | | 9,071 | |
Switzerland (6.3%) | | | | | |
| | Nestle SA | | 73,085 | | 8,213 | |
| | Roche Holding AG | | 15,664 | | 4,280 | |
| | Zurich Insurance Group AG | | 3,201 | | 1,141 | |
| | Cie Financiere Richemont SA | | 12,543 | | 975 | |
| | UBS Group AG | | 79,234 | | 841 | |
| | Credit Suisse Group AG | | 60,553 | | 708 | |
| | Swiss Re AG | | 6,459 | | 623 | |
| | Givaudan SA | | 223 | | 605 | |
| | Lonza Group AG | | 1,694 | | 601 | |
| | Roche Holding AG (Bearer) | | 1,780 | | 485 | |
| | Geberit AG | | 953 | | 434 | |
| | Swiss Life Holding AG | | 876 | | 416 | |
| | Sonova Holding AG | | 1,558 | | 362 | |
| | Partners Group Holding AG | | 437 | | 356 | |
| | Chocoladefabriken Lindt & Spruengli AG | | 47 | | 348 | |
| | Swisscom AG | | 644 | | 322 | |
| | Temenos AG | | 1,912 | | 322 | |
| | Baloise Holding AG | | 1,761 | | 301 | |
| | Adecco Group AG | | 5,655 | | 298 | |
| | Swiss Prime Site AG | | 2,991 | | 298 | |
| | Schindler Holding AG | | 1,250 | | 286 | |
| | Straumann Holding AG | | 327 | | 257 | |
| | Julius Baer Group Ltd. | | 6,445 | | 256 | |
| | Kuehne & Nagel International AG | | 1,701 | | 248 | |
| | Logitech International SA | | 5,874 | | 239 | |
| | Cembra Money Bank AG | | 1,913 | | 195 | |
| | Vifor Pharma AG | | 1,147 | | 182 | |
2 | | Galenica AG | | 3,103 | | 174 | |
| | Helvetia Holding AG | | 1,314 | | 172 | |
| | Flughafen Zurich AG | | 930 | | 171 | |
| | Georg Fischer AG | | 207 | | 170 | |
| | Mobimo Holding AG | | 597 | | 169 | |
| | Clariant AG | | 9,073 | | 168 | |
| | Dufry AG | | 1,847 | | 150 | |
2 | | Sunrise Communications Group AG | | 1,970 | | 149 | |
* | | ams AG | | 2,214 | | 89 | |
| | Allreal Holding AG | | 433 | | 83 | |
| | Chocoladefabriken Lindt & Spruengli AG (Registered) | | 1 | | 82 | |
| | PSP Swiss Property AG | | 596 | | 79 | |
| | BB Biotech AG | | 973 | | 62 | |
| | Schindler Holding AG (Registered) | | 272 | | 62 | |
| | Banque Cantonale Vaudoise | | 68 | | 52 | |
| | Tecan Group AG | | 216 | | 52 | |
| | Belimo Holding AG | | 10 | | 50 | |
* | | Idorsia Ltd. | | 1,727 | | 49 | |
| | Bucher Industries AG | | 144 | | 43 | |
| | dormakaba Holding AG | | 56 | | 38 | |
| | Landis&Gyr Group AG | | 446 | | 37 | |
| | Vontobel Holding AG | | 682 | | 36 | |
| | Valiant Holding AG | | 342 | | 36 | |
| | Forbo Holding AG | | 24 | | 35 | |
| | Siegfried Holding AG | | 79 | | 33 | |
| | Emmi AG | | 38 | | 31 | |
| | SIG Combibloc Group AG | | 2,308 | | 31 | |
| | SFS Group AG | | 377 | | 28 | |
| | Barry Callebaut AG | | 13 | | 27 | |
| | Daetwyler Holding AG | | 164 | | 26 | |
| | Valora Holding AG | | 88 | | 25 | |
| | Huber & Suhner AG | | 369 | | 24 | |
| | Conzzeta AG | | 28 | | 23 | |
| | Schweiter Technologies AG | | 21 | | 20 | |
| | Inficon Holding AG | | 30 | | 19 | |
| | Burckhardt Compression Holding AG | | 79 | | 19 | |
| | Komax Holding AG | | 96 | | 18 | |
| | Bachem Holding AG | | 118 | | 17 | |
| | HBM Healthcare Investments AG | | 83 | | 16 | |
| | Ypsomed Holding AG | | 120 | | 16 | |
42
ESG International Stock ETF
| | | | | | Market | |
| | | | | | Value· | |
| | | | Shares | | ($000 | ) |
| | Intershop Holding AG | | 28 | | 15 | |
| | Kardex AG | | 107 | | 15 | |
* | | Panalpina Welttransport Holding AG | | 64 | | 15 | |
| | LEM Holding SA | | 11 | | 14 | |
* | | Aryzta AG | | 16,722 | | 13 | |
| | VZ Holding AG | | 43 | | 13 | |
| | Zehnder Group AG | | 334 | | 12 | |
| | Interroll Holding AG | | 5 | | 9 | |
| | Berner Kantonalbank AG | | 42 | | 9 | |
| | DKSH Holding AG | | 181 | | 9 | |
* | | GAM Holding AG | | 1,791 | | 7 | |
| | Implenia AG | | 164 | | 6 | |
* | | COSMO Pharmaceuticals NV | | 59 | | 5 | |
| | St. Galler Kantonalbank AG | | 10 | | 4 | |
| | Comet Holding AG | | 53 | | 4 | |
| | u-blox Holding AG | | 59 | | 4 | |
| | Ascom Holding AG | | 373 | | 4 | |
* | | Meyer Burger Technology AG | | 7,432 | | 3 | |
| | | | | | 26,334 | |
Taiwan (4.2%) | | | | | |
| | Taiwan Semiconductor Manufacturing Co. Ltd. | | 599,000 | | 4,922 | |
| | Hon Hai Precision Industry Co. Ltd. | | 318,400 | | 752 | |
| | MediaTek Inc. | | 49,000 | | 573 | |
| | Largan Precision Co. Ltd. | | 3,000 | | 373 | |
| | Uni-President Enterprises Corp. | | 140,000 | | 341 | |
| | Formosa Plastics Corp. | | 106,000 | | 317 | |
| | Chunghwa Telecom Co. Ltd. | | 91,000 | | 316 | |
| | E.Sun Financial Holding Co. Ltd. | | 384,107 | | 309 | |
| | Delta Electronics Inc. | | 64,000 | | 298 | |
| | China Steel Corp. | | 386,000 | | 284 | |
| | ASE Technology Holding Co. Ltd. | | 118,000 | | 268 | |
| | Mega Financial Holding Co. Ltd. | | 283,000 | | 259 | |
| | Nan Ya Plastics Corp. | | 112,000 | | 245 | |
| | Hua Nan Financial Holdings Co. Ltd. | | 367,366 | | 233 | |
| | Formosa Chemicals & Fibre Corp. | | 83,000 | | 233 | |
| | First Financial Holding Co. Ltd. | | 333,200 | | 228 | |
| | Cathay Financial Holding Co. Ltd. | | 176,000 | | 225 | |
| | Taiwan Cement Corp. | | 181,497 | | 222 | |
| | Taiwan Cooperative Financial Holding Co. Ltd. | | 345,720 | | 220 | |
| | Quanta Computer Inc. | | 118,000 | | 212 | |
| | Taishin Financial Holding Co. Ltd. | | 454,983 | | 194 | |
| | CTBC Financial Holding Co. Ltd. | | 293,000 | | 190 | |
| | Pou Chen Corp. | | 151,000 | | 188 | |
* | | AGV Products Corp. | | 842,000 | | 186 | |
| | Foxconn Technology Co. Ltd. | | 85,000 | | 172 | |
| | Lite-On Technology Corp. | | 107,000 | | 170 | |
| | WPG Holdings Ltd. | | 126,680 | | 160 | |
| | Ruentex Development Co. Ltd. | | 110,000 | | 149 | |
| | United Microelectronics Corp. | | 341,000 | | 146 | |
| | Bank of Kaohsiung Co. Ltd. | | 469,000 | | 145 | |
| | Far EasTone Telecommunications Co. Ltd. | | 58,000 | | 135 | |
| | Catcher Technology Co. Ltd. | | 19,000 | | 133 | |
| | Shin Kong Financial Holding Co. Ltd. | | 433,172 | | 127 | |
| | Infortrend Technology Inc. | | 272,000 | | 113 | |
| | Hotai Motor Co. Ltd. | | 8,000 | | 113 | |
| | Synnex Technology International Corp. | | 95,000 | | 112 | |
| | Powertech Technology Inc. | | 43,000 | | 103 | |
| | SinoPac Financial Holdings Co. Ltd. | | 263,000 | | 99 | |
* | | China Life Insurance Co. Ltd. | | 118,278 | | 93 | |
| | Cheng Shin Rubber Industry Co. Ltd. | | 66,000 | | 92 | |
| | Innolux Corp. | | 382,000 | | 85 | |
| | AU Optronics Corp. | | 312,000 | | 81 | |
| | President Chain Store Corp. | | 8,000 | | 74 | |
| | Taiwan Mobile Co. Ltd. | | 20,000 | | 71 | |
| | Formosan Rubber Group Inc. | | 116,000 | | 69 | |
| | Win Semiconductors Corp. | | 8,000 | | 67 | |
| | Yuanta Financial Holding Co. Ltd. | | 115,000 | | 66 | |
| | Novatek Microelectronics Corp. | | 10,000 | | 59 | |
| | Realtek Semiconductor Corp. | | 8,000 | | 55 | |
| | Asia Cement Corp. | | 39,000 | | 53 | |
| | Chicony Electronics Co. Ltd. | | 19,000 | | 53 | |
| | Accton Technology Corp. | | 9,000 | | 47 | |
| | Asustek Computer Inc. | | 7,000 | | 45 | |
| | Taiwan Fertilizer Co. Ltd. | | 30,000 | | 43 | |
43
ESG International Stock ETF
| | | | | | Market | |
| | | | | | Value· | |
| | | | Shares | | ($000 | ) |
| | Tripod Technology Corp. | | 12,000 | | 43 | |
| | Yageo Corp. | | 6,000 | | 43 | |
| | Taiwan High Speed Rail Corp. | | 35,000 | | 42 | |
| | Giant Manufacturing Co. Ltd. | | 6,000 | | 42 | |
| | Pegatron Corp. | | 25,000 | | 42 | |
| | Sampo Corp. | | 73,000 | | 41 | |
* | | Microbio Co. Ltd. | | 90,000 | | 39 | |
| | Formosa Taffeta Co. Ltd. | | 35,000 | | 38 | |
| | Inventec Corp. | | 55,000 | | 38 | |
| | Winbond Electronics Corp. | | 69,000 | | 37 | |
| | Test Rite International Co. Ltd. | | 55,000 | | 37 | |
| | Eclat Textile Co. Ltd. | | 3,000 | | 37 | |
| | Feng TAY Enterprise Co. Ltd. | | 5,500 | | 36 | |
| | Walsin Technology Corp. | | 7,000 | | 35 | |
| | Acer Inc. | | 64,000 | | 35 | |
| | Simplo Technology Co. Ltd. | | 4,000 | | 34 | |
| | Hiwin Technologies Corp. | | 4,120 | | 33 | |
| | Zhen Ding Technology Holding Ltd. | | 9,000 | | 33 | |
| | Unimicron Technology Corp. | | 26,000 | | 32 | |
| | Micro-Star International Co. Ltd. | | 12,000 | | 32 | |
| | King’s Town Bank Co. Ltd. | | 32,000 | | 31 | |
* | | Airtac International Group | | 3,000 | | 31 | |
| | Nanya Technology Corp. | | 13,000 | | 29 | |
| | Chroma ATE Inc. | | 6,000 | | 29 | |
| | Radiant Opto-Electronics Corp. | | 8,000 | | 29 | |
| | Merida Industry Co. Ltd. | | 5,000 | | 29 | |
| | Walsin Lihwa Corp. | | 64,000 | | 28 | |
| | China Petrochemical Development Corp. | | 88,200 | | 28 | |
| | Globalwafers Co. Ltd. | | 3,000 | | 28 | |
| | Macronix International | | 31,000 | | 27 | |
| | King Yuan Electronics Co. Ltd. | | 25,000 | | 27 | |
| | International CSRC Investment Holdings Co. | | 25,990 | | 27 | |
| | Vanguard International Semiconductor Corp. | | 13,000 | | 27 | |
| | Sinbon Electronics Co. Ltd. | | 6,000 | | 26 | |
| | ITEQ Corp. | | 6,000 | | 26 | |
| | Chipbond Technology Corp. | | 13,000 | | 26 | |
* | | Tatung Co. Ltd. | | 48,000 | | 26 | |
| | ASPEED Technology Inc. | | 1,000 | | 25 | |
| | Wowprime Corp. | | 10,000 | | 24 | |
| | International Games System Co. Ltd. | | 2,000 | | 24 | |
| | TA Chen Stainless Pipe | | 19,000 | | 23 | |
* | | PharmaEssentia Corp. | | 6,000 | | 23 | |
| | TCI Co. Ltd. | | 2,297 | | 23 | |
* | | Voltronic Power Technology Corp. | | 1,000 | | 22 | |
| | Qisda Corp. | | 35,000 | | 22 | |
| | Silergy Corp. | | 1,000 | | 22 | |
| | Wistron Corp. | | 28,000 | | 22 | |
| | Eternal Materials Co. Ltd. | | 28,000 | | 22 | |
| | Weltrend Semiconductor | | 25,000 | | 22 | |
| | Sino-American Silicon Products Inc. | | 9,000 | | 21 | |
| | Elite Material Co. Ltd. | | 5,000 | | 21 | |
| | Taiwan Union Technology Corp. | | 5,000 | | 21 | |
| | Jess-Link Products Co. Ltd. | | 20,000 | | 20 | |
* | | Phihong Technology Co. Ltd. | | 68,000 | | 19 | |
| | Ichia Technologies Inc. | | 36,000 | | 19 | |
| | CyberTAN Technology Inc. | | 38,000 | | 19 | |
| | Merry Electronics Co. Ltd. | | 4,000 | | 19 | |
| | Phison Electronics Corp. | | 2,000 | | 18 | |
| | Chang Hwa Commercial Bank Ltd. | | 28,560 | | 18 | |
| | AcBel Polytech Inc. | | 26,000 | | 18 | |
| | Taiwan Business Bank | | 46,200 | | 18 | |
| | Evergreen International Storage & Transport Corp. | | 42,000 | | 18 | |
| | E Ink Holdings Inc. | | 20,000 | | 18 | |
| | Cyberlink Corp. | | 6,000 | | 18 | |
| | Nien Made Enterprise Co. Ltd. | | 2,000 | | 18 | |
| | Parade Technologies Ltd. | | 1,000 | | 17 | |
* | | PChome Online Inc. | | 4,000 | | 17 | |
| | Iron Force Industrial Co. Ltd. | | 4,000 | | 17 | |
| | Senao International Co. Ltd. | | 17,000 | | 17 | |
| | Eva Airways Corp. | | 35,862 | | 16 | |
| | ASMedia Technology Inc. | | 1,000 | | 16 | |
| | China Steel Chemical Corp. | | 4,000 | | 16 | |
| | Lotes Co. Ltd. | | 2,000 | | 16 | |
* | | Sincere Navigation Corp. | | 30,000 | | 16 | |
* | | Dynamic Electronics Co. Ltd. | | 39,000 | | 16 | |
| | China Development Financial Holding Corp. | | 54,000 | | 16 | |
| | Taiwan Glass Industry Corp. | | 42,000 | | 16 | |
| | CHC Healthcare Group | | 11,000 | | 15 | |
| | Shin Zu Shing Co. Ltd. | | 4,000 | | 15 | |
| | FSP Technology Inc. | | 25,000 | | 15 | |
| | United Integrated Services Co. Ltd. | | 3,000 | | 15 | |
| | St. Shine Optical Co. Ltd. | | 1,000 | | 15 | |
| | Zinwell Corp. | | 19,000 | | 14 | |
44
ESG International Stock ETF
| | | | | | Market | |
| | | | | | Value· | |
| | | | Shares | | ($000 | ) |
| | Taiwan Surface Mounting Technology Corp. | | 6,000 | | 14 | |
| | Kindom Construction Corp. | | 15,000 | | 14 | |
| | Brogent Technologies Inc. | | 2,100 | | 14 | |
* | | Kuo Toong International Co. Ltd. | | 24,000 | | 14 | |
| | Soft-World International Corp. | | 6,000 | | 14 | |
| | Bizlink Holding Inc. | | 2,000 | | 14 | |
* | | MIN AIK Technology Co. Ltd. | | 31,000 | | 14 | |
| | Asia Optical Co. Inc. | | 5,000 | | 14 | |
* | | OBI Pharma Inc. | | 3,000 | | 13 | |
| | Wei Chuan Foods Corp. | | 16,000 | | 13 | |
| | Poya International Co. Ltd. | | 1,000 | | 13 | |
| | Genius Electronic Optical Co. Ltd. | | 1,000 | | 13 | |
| | Makalot Industrial Co. Ltd. | | 2,100 | | 12 | |
| | KEE TAI Properties Co. Ltd. | | 34,000 | | 12 | |
| | D-Link Corp. | | 30,000 | | 12 | |
| | Teco Electric and Machinery Co. Ltd. | | 15,000 | | 12 | |
| | eMemory Technology Inc. | | 1,000 | | 12 | |
| | Pan-International Industrial Corp. | | 15,000 | | 11 | |
| | Johnson Health Tech Co. Ltd. | | 4,000 | | 11 | |
| | Taiwan Secom Co. Ltd. | | 4,000 | | 11 | |
| | Tong-Tai Machine & Tool Co. Ltd. | | 20,000 | | 11 | |
| | Taichung Commercial Bank Co. Ltd. | | 28,404 | | 11 | |
| | Yulon Motor Co. Ltd. | | 16,000 | | 11 | |
| | Long Bon International Co. Ltd. | | 22,000 | | 11 | |
| | Far Eastern Department Stores Ltd. | | 14,000 | | 11 | |
| | Formosa International Hotels Corp. | | 2,000 | | 11 | |
| | King Slide Works Co. Ltd. | | 1,000 | | 10 | |
| | Gloria Material Technology Corp. | | 16,000 | | 10 | |
| | Pixart Imaging Inc. | | 3,000 | | 10 | |
* | | Unizyx Holding Corp. | | 14,000 | | 10 | |
| | Chin-Poon Industrial Co. Ltd. | | 10,000 | | 10 | |
| | IBF Financial Holdings Co. Ltd. | | 30,300 | | 10 | |
| | HTC Corp. | | 9,000 | | 10 | |
| | China Electric Manufacturing Corp. | | 34,000 | | 10 | |
| | Cub Elecparts Inc. | | 1,049 | | 10 | |
| | Ruentex Industries Ltd. | | 4,200 | | 9 | |
| | Cathay Real Estate Development Co. Ltd. | | 14,000 | | 9 | |
| | FLEXium Interconnect Inc. | | 3,000 | | 9 | |
| | Charoen Pokphand Enterprise | | 4,000 | | 9 | |
| | Egis Technology Inc. | | 1,000 | | 9 | |
| | Sanyang Motor Co. Ltd. | | 13,000 | | 9 | |
| | Sunny Friend Environmental Technology Co. Ltd. | | 1,000 | | 8 | |
| | LandMark Optoelectronics Corp. | | 1,000 | | 8 | |
| | Yungtay Engineering Co. Ltd. | | 4,000 | | 8 | |
| | Compeq Manufacturing Co. Ltd. | | 8,000 | | 8 | |
| | Elan Microelectronics Corp. | | 3,000 | | 8 | |
| | Chaun-Choung Technology Corp. | | 1,000 | | 8 | |
* | | Taiwan Land Development Corp. | | 29,000 | | 8 | |
| | Global Unichip Corp. | | 1,000 | | 8 | |
| | Toung Loong Textile Manufacturing | | 6,000 | | 7 | |
| | Hota Industrial Manufacturing Co. Ltd. | | 2,000 | | 7 | |
| | Epistar Corp. | | 10,000 | | 7 | |
| | Nan Kang Rubber Tire Co. Ltd. | | 6,000 | | 7 | |
* | | Pharmally International Holding Co. Ltd. | | 1,000 | | 7 | |
| | Tong Yang Industry Co. Ltd. | | 5,000 | | 7 | |
| | Advanced Ceramic X Corp. | | 1,000 | | 7 | |
| | Chlitina Holding Ltd. | | 1,000 | | 7 | |
| | Sporton International Inc. | | 1,000 | | 7 | |
* | | United Renewable Energy Co. Ltd. | | 27,000 | | 7 | |
| | Gigabyte Technology Co. Ltd. | | 4,000 | | 7 | |
| | Asia Vital Components Co. Ltd. | | 5,000 | | 7 | |
| | Arcadyan Technology Corp. | | 2,000 | | 7 | |
| | General Interface Solution Holding Ltd. | | 2,000 | | 7 | |
| | Advanced International Multitech Co. Ltd. | | 5,000 | | 6 | |
* | | Mercuries & Associates Holding Ltd. | | 11,000 | | 6 | |
| | China Motor Corp. | | 8,000 | | 6 | |
| | Great Wall Enterprise Co. Ltd. | | 5,250 | | 6 | |
| | Grape King Bio Ltd. | | 1,000 | | 6 | |
| | Mitac Holdings Corp. | | 6,899 | | 6 | |
* | | CMC Magnetics Corp. | | 24,000 | | 6 | |
45
ESG International Stock ETF
| | | | | | Market | |
| | | | | | Value· | |
| | | | Shares | | ($000 | ) |
| | Visual Photonics Epitaxy Co. Ltd. | | 2,000 | | 6 | |
| | ChipMOS Technologies Inc. | | 6,000 | | 6 | |
| | Lung Yen Life Service Corp. | | 3,000 | | 6 | |
* | | Li Cheng Enterprise Co. Ltd. | | 3,000 | | 6 | |
* | | Mercuries Life Insurance Co. Ltd. | | 17,000 | | 6 | |
| | Lien Hwa Industrial Corp. | | 5,250 | | 6 | |
| | Primax Electronics Ltd. | | 3,000 | | 6 | |
| | Ginko International Co. Ltd. | | 1,000 | | 6 | |
| | Career Technology MFG. Co. Ltd. | | 5,150 | | 6 | |
| | Wan Hai Lines Ltd. | | 9,000 | | 5 | |
| | Ability Enterprise Co. Ltd. | | 10,000 | | 5 | |
| | Taiwan Cogeneration Corp. | | 6,000 | | 5 | |
| | Taiwan Paiho Ltd. | | 2,000 | | 5 | |
| | Tung Ho Steel Enterprise Corp. | | 8,000 | | 5 | |
| | Sercomm Corp. | | 2,000 | | 5 | |
| | Pan Jit International Inc. | | 6,000 | | 5 | |
* | | Federal Corp. | | 14,000 | | 5 | |
| | Sitronix Technology Corp. | | 1,000 | | 5 | |
| | Huaku Development Co. Ltd. | | 2,000 | | 5 | |
| | Wafer Works Corp. | | 5,000 | | 5 | |
* | | Via Technologies Inc. | | 5,000 | | 5 | |
| | Cheng Loong Corp. | | 9,000 | | 5 | |
| | Wistron NeWeb Corp. | | 2,000 | | 5 | |
| | Chilisin Electronics Corp. | | 2,000 | | 5 | |
| | WUS Printed Circuit Co. Ltd. | | 4,000 | | 5 | |
| | Coretronic Corp. | | 4,000 | | 5 | |
| | Clevo Co. | | 5,000 | | 5 | |
| | BES Engineering Corp. | | 20,000 | | 5 | |
| | YFY Inc. | | 13,000 | | 5 | |
| | Gourmet Master Co. Ltd. | | 1,000 | | 5 | |
| | Kenda Rubber Industrial Co. Ltd. | | 5,000 | | 5 | |
| | Jentech Precision Industrial Co. Ltd. | | 1,000 | | 5 | |
| | Getac Technology Corp. | | 3,000 | | 5 | |
| | Center Laboratories Inc. | | 2,299 | | 5 | |
* | | Asia Pacific Telecom Co. Ltd. | | 23,000 | | 4 | |
| | Shinkong Synthetic Fibers Corp. | | 12,000 | | 4 | |
| | Taiwan Semiconductor Co. Ltd. | | 3,000 | | 4 | |
| | Cheng Uei Precision Industry Co. Ltd. | | 4,000 | | 4 | |
| | Yieh Phui Enterprise Co. Ltd. | | 15,300 | | 4 | |
| | Everlight Electronics Co. Ltd. | | 5,000 | | 4 | |
| | TaiDoc Technology Corp. | | 1,000 | | 4 | |
| | Taiyen Biotech Co. Ltd. | | 4,000 | | 4 | |
| | Quanta Storage Inc. | | 3,000 | | 4 | |
* | | Grand Pacific Petrochemical | | l7,000 | | 4 | |
| | Longchen Paper & Packaging Co. Ltd. | | 9,000 | | 4 | |
| | SDI Corp. | | 2,000 | | 4 | |
* | | Medigen Biotechnology Corp. | | 2,000 | | 4 | |
| | Radium Life Tech Co. Ltd. | | 10,200 | | 4 | |
* | | Ritek Corp. | | 14,000 | | 4 | |
* | | Roo Hsing Co. Ltd. | | 10,000 | | 4 | |
* | | Lotus Pharmaceutical Co. Ltd. | | 1,000 | | 3 | |
* | | HannsTouch Solution Inc. | | 6,000 | | 3 | |
| | Nan Ya Printed Circuit Board Corp. | | 2,000 | | 3 | |
| | Swancor Holding Co. Ltd. | | 1,000 | | 3 | |
* | | Tung Thih Electronic Co. Ltd. | | 1,000 | | 2 | |
| | Advanced Wireless Semiconductor Co. | | 1,000 | | 2 | |
| | Hong Pu Real Estate Development Co. Ltd. | | 3,000 | | 2 | |
| | | | | | 17,535 | |
Thailand (1.1%) | | | | | |
| | Siam Cement PCL (Foreign) | | 22,100 | | 300 | |
| | CP ALL PCL (Foreign) | | 87,800 | | 241 | |
| | Kasikornbank PCL (Foreign) | | 43,600 | | 228 | |
| | Advanced Info Service PCL (Foreign) | | 28,900 | | 219 | |
| | Siam Commercial Bank PCL (Foreign) | | 47,500 | | 191 | |
| | Airports of Thailand PCL (Foreign) | | 74,300 | | 175 | |
| | Kiatnakin Bank (Foreign) | | 71,100 | | 168 | |
* | | CP ALL PCL (Local) | | 58,300 | | 160 | |
| | Central Pattana PCL ( Foreign) | | 68,400 | | 150 | |
| | Krung Thai Bank PCL (Foreign) | | 251,900 | | 142 | |
* | | Siam Commercial Bank PCL (Local) | | 31,700 | | 128 | |
| | Minor International PCL (Foreign) | | 98,700 | | 122 | |
* | | Minor International PCL | | 97,200 | | 120 | |
* | | Intouch Holdings | | 53,100 | | 111 | |
| | Airports of Thailand PCL | | 46,500 | | 109 | |
| | Bangkok Dusit Medical Services PCL (Foreign) | | 134,600 | | 104 | |
| | Kasikornbank PCL | | 19,700 | | 103 | |
| | Home Product Center PCL | | 168,600 | | 99 | |
* | | Bangkok Dusit Medical Services PCL | | 114,700 | | 88 | |
46
ESG International Stock ETF
| | | | | | Market | |
| | | | | | Value· | |
| | | | Shares | | ($000 | ) |
* | | PTT Global Chemical PCL | | 40,300 | | 70 | |
| | Energy Absolute PCL (Foreign) | | 44,300 | | 68 | |
| | BTS Group Holdings PCL | | 150,600 | | 66 | |
| | Intouch Holdings PCL (Foreign) | | 29,178 | | 61 | |
| | Digital Telecommunications Infrastructure Fund | | 109,863 | | 61 | |
| | Tisco Financial Group PCL (Foreign) | | 18,000 | | 60 | |
| | Ratchaburi Electricity Generating Holding PCL (Foreign) | | 23,600 | | 57 | |
| | PTT Global Chemical PCL (Foreign) | | 27,700 | | 48 | |
| | Sino-Thai Engineering & Construction PCL | | 76,000 | | 48 | |
| | Bangkok Bank PCL (Foreign) | | 7,800 | | 44 | |
| | WHA Corp. PCL | | 271,500 | | 44 | |
| | Krungthai Card PCL | | 28,600 | | 43 | |
| | Bangkok Expressway & Metro PCL | | 116,500 | | 43 | |
| | Thanachart Capital PCL | | 23,000 | | 42 | |
| | True Corp. PCL | | 197,200 | | 40 | |
| | Charoen Pokphand Foods PCL (Foreign) | | 42,000 | | 40 | |
| | Thai Oil PCL (Foreign) | | 14,000 | | 31 | |
| | Indorama Ventures PCL | | 26,800 | | 31 | |
* | | Advanced Info Service PCL (Local) | | 4,000 | | 30 | |
| | Robinson PCL | | 14,300 | | 30 | |
| | Gulf Energy Development PCL (Foreign) | | 6,300 | | 30 | |
| | Bumrungrad Hospital PCL (Foreign) | | 6,400 | | 29 | |
| | Supalai PCL | | 42,200 | | 27 | |
| | Total Access Communication PCL (Foreign) | | 13,200 | | 26 | |
| | Srisawad Corp. PCL | | 14,300 | | 26 | |
| | TMB Bank PCL | | 506,200 | | 26 | |
* | | Kiatnakin Bank | | 10,400 | | 25 | |
| | Central Plaza Hotel PCL | | 21,400 | | 22 | |
| | B Grimm Power PCL | | 16,700 | | 21 | |
| | Jasmine International PCL | | 90,700 | | 20 | |
| | WHA Premium Growth Freehold & Leasehold Real Estate Investment Trust | | 29,700 | | 18 | |
| | VGI PCL | | 51,200 | | 16 | |
* | | Siam Cement PCL | | 1,200 | | 16 | |
| | IRPC PCL (Foreign) | | 123,800 | | 16 | |
| | CK Power PCL | | 71,400 | | 14 | |
| | Jasmine Broadband Internet Infrastructure Fund | | 34,600 | | 13 | |
| | BTS Rail Mass Transit Growth Infrastructure Fund | | 35,600 | | 13 | |
| | Intouch Holdings NVDR | | 5,900 | | 12 | |
* | | Central Pattana PCL | | 5,200 | | 11 | |
* | | Thai Airways International PCL (Foreign) | | 33,800 | | 11 | |
| | Delta Electronics Thailand PCL | | 6,700 | | 11 | |
* | | Krung Thai Bank PCL | | 18,800 | | 11 | |
* | | Energy Absolute PCL | | 5,900 | | 9 | |
* | | Super Energy Corp. PCL | | 387,600 | | 8 | |
* | | Gulf Energy Development PCL | | 1,700 | | 8 | |
* | | Precious Shipping PCL | | 24,700 | | 7 | |
| | Carabao Group PCL (Foreign) | | 2,800 | | 7 | |
| | Muangthai Capital PCL | | 3,700 | | 7 | |
* | | PTG Energy PCL | | 9,000 | | 6 | |
| | Global Power Synergy PCL | | 2,600 | | 6 | |
* | | Thaifoods Group PCL | | 33,800 | | 5 | |
| | Star Petroleum Refining PCL | | 18,600 | | 5 | |
| | Siam Global House PCL | | 10,600 | | 5 | |
| | U City PCL | | 64,000 | | 5 | |
* | | Univentures PCL | | 23,700 | | 5 | |
| | Esso Thailand PCL | | 16,500 | | 5 | |
| | KCE Electronics PCL | | 8,300 | | 5 | |
| | Hana Microelectronics PCL (Foreign) | | 4,700 | | 4 | |
| | Sri Trang Agro-Industry PCL | | 12,400 | | 4 | |
* | | Thaicom PCL | | 25,100 | | 4 | |
* | | BEC World PCL | | 15,000 | | 4 | |
* | | BCPG PCL | | 6,000 | | 4 | |
* | | Taokaenoi Food & Marketing PCL | | 10,700 | | 4 | |
* | | Unique Engineering & Construction PCL | | 10,700 | | 3 | |
* | | Beauty Community PCL | | 33,200 | | 3 | |
* | | Workpoint Entertainment PCL | | 3,100 | | 2 | |
* | | Carabao Group PCL | | 900 | | 2 | |
* | | Bangkok Airways PCL | | 6,200 | | 2 | |
* | | Minor International PCL Warrants Exp. 12/31/2021 | | 3,645 | | 1 | |
| | | | | | 4,459 | |
Turkey (0.2%) | | | | | |
* | | Tat Gida Sanayi AS | | 134,749 | | 108 | |
* | | Afyon Cimento Sanayi TAS | | 146,141 | | 104 | |
* | | Turcas Petrol AS | | 300,159 | | 89 | |
47
ESG International Stock ETF
| | | | | | Market | |
| | | | | | Value· | |
| | | | Shares | | ($000 | ) |
* | | Bizim Toptan Satis Magazalari AS | | 64,202 | | 88 | |
| | Tupras Turkiye Petrol Rafinerileri AS | | 2,289 | | 50 | |
* | | Turkiye Garanti Bankasi AS | | 32,030 | | 49 | |
| | KOC Holding AS | | 16,187 | | 49 | |
* | | Akbank T.A.S. | | 39,869 | | 47 | |
| | Haci Omer Sabanci Holding AS (Bearer) | | 17,735 | | 27 | |
| | Eregli Demir ve Celik Fabrikalari TAS | | 23,491 | | 26 | |
* | | Turk Hava Yollari AO | | 10,282 | | 20 | |
* | | Yapi ve Kredi Bankasi AS | | 39,311 | | 16 | |
* | | Turkiye Is Bankasi AS | | 15,178 | | 14 | |
| | Tekfen Holding AS | | 3,446 | | 12 | |
* | | Is Gayrimenkul Yatirim Ortakligi AS | | 58,162 | | 9 | |
| | TAV Havalimanlari Holding AS | | 1,847 | | 8 | |
| | Ford Otomotiv Sanayi AS | | 719 | | 7 | |
* | | Besiktas Futbol Yatirimlari Sanayi ve Ticaret AS | | 26,105 | | 7 | |
* | | Turkiye Vakiflar Bankasi TAO | | 8,334 | | 7 | |
* | | Akenerji Elektrik Uretim AS | | 75,545 | | 6 | |
* | | Pegasus Hava Tasimaciligi AS | | 510 | | 6 | |
* | | Sok Marketler Ticaret AS | | 2,876 | | 5 | |
| | Ulker Biskuvi Sanayi AS | | 1,628 | | 5 | |
| | Tofas Turk Otomobil Fabrikasi AS | | 1,547 | | 5 | |
| | Turkiye Sise ve Cam Fabrikalari AS | | 5,701 | | 4 | |
| | Kardemir Karabuk Demir Celik Sanayi ve Ticaret AS Class A | | 11,830 | | 4 | |
* | | Arcelik AS | | 1,329 | | 4 | |
| | Soda Sanayii AS | | 3,606 | | 3 | |
* | | Vakif Gayrimenkul Yatirim Ortakligi AS | | 6,654 | | 2 | |
| | | | | | 781 | |
United Arab Emirates (0.2%) | | | | | |
| | First Abu Dhabi Bank PJSC | | 104,299 | | 433 | |
| | Abu Dhabi Commercial Bank PJSC | | 82,842 | | 196 | |
| | Emirates Telecommunications Group Co. PJSC | | 22,514 | | 104 | |
| | DP World plc | | 3,013 | | 42 | |
* | | Air Arabia PJSC | | 77,788 | | 25 | |
* | | Eshraq Properties Co. PJSC | | 188,516 | | 21 | |
* | | RAK Properties PJSC | | 147,004 | | 18 | |
| | Arabtec Holding PJSC | | 40,224 | | 18 | |
* | | DXB Entertainments PJSC | | 265,832 | | 16 | |
* | | Dubai Financial Market PJSC | | 62,719 | | 15 | |
| | Amanat Holdings PJSC | | 55,939 | | 14 | |
| | Abu Dhabi National Oil Co. for Distribution PJSC | | 18,263 | | 13 | |
| | Abu Dhabi Islamic Bank PJSC | | 5,526 | | 7 | |
| | | | | | 922 | |
United Kingdom (8.4%) | | | | | |
| | AstraZeneca plc | | 32,369 | | 2,891 | |
| | Unilever plc | | 25,828 | | 1,632 | |
| | Vodafone Group plc | | 656,000 | | 1,241 | |
| | Reckitt Benckiser Group plc | | 15,319 | | 1,197 | |
| | RELX plc | | 45,571 | | 1,094 | |
| | Prudential plc | | 63,523 | | 1,059 | |
| | Lloyds Banking Group plc | | 1,695,562 | | 1,032 | |
| | Compass Group plc | | 39,694 | | 1,007 | |
| | National Grid plc | | 79,957 | | 838 | |
| | Barclays plc | | 418,790 | | 698 | |
| | CRH plc | | 20,664 | | 692 | |
| | Experian plc | | 22,505 | | 692 | |
| | Tesco plc | | 246,160 | | 658 | |
| | London Stock Exchange Group plc | | 7,648 | | 649 | |
| | Smith & Nephew plc | | 22,773 | | 546 | |
| | Standard Chartered plc | | 69,833 | | 531 | |
| | Ferguson plc | | 6,064 | | 447 | |
| | BT Group plc | | 207,637 | | 418 | |
| | Aviva plc | | 94,806 | | 409 | |
| | WPP plc | | 33,009 | | 391 | |
| | Legal & General Group plc | | 144,560 | | 387 | |
| | Informa plc | | 35,482 | | 376 | |
| | Ashtead Group plc | | 13,290 | | 369 | |
| | 3i Group plc | | 25,251 | | 338 | |
| | Burberry Group plc | | 11,577 | | 306 | |
| | Sage Group plc | | 34,608 | | 296 | |
| | Rentokil Initial plc | | 53,252 | | 293 | |
| | Next plc | | 3,953 | | 286 | |
| | Halma plc | | 11,875 | | 285 | |
| | Segro plc | �� | 28,643 | | 274 | |
| | Smiths Group plc | | 13,008 | | 265 | |
| | DCC plc | | 3,014 | | 257 | |
| | Rightmove plc | | 39,013 | | 255 | |
| | Royal Bank of Scotland Group plc | | 113,091 | | 255 | |
| | Associated British Foods plc | | 8,997 | | 249 | |
| | Barratt Developments plc | | 32,172 | | 248 | |
| | Mondi plc | | 12,341 | | 241 | |
48
ESG International Stock ETF
| | | | | | Market | |
| | | | | | Value· | |
| | | | Shares | | ($000 | ) |
| | Bunzl plc | | 9,735 | | 239 | |
| | Spirax-Sarco Engineering plc | | 2,430 | | 238 | |
| | Smurfit Kappa Group plc | | 7,649 | | 237 | |
| | Pearson plc | | 23,023 | | 233 | |
2 | | Auto Trader Group plc | | 34,985 | | 227 | |
| | Standard Life Aberdeen plc | | 72,850 | | 222 | |
| | Persimmon plc | | 9,249 | | 215 | |
| | St. James’s Place plc | | 19,141 | | 215 | |
| | Croda International plc | | 3,575 | | 205 | |
| | Johnson Matthey plc | | 5,725 | | 204 | |
| | Whitbread plc | | 3,816 | | 203 | |
| | RSA Insurance Group plc | | 31,716 | | 202 | |
* | | Ocado Group plc | | 12,632 | | 199 | |
| | Coca-Cola HBC AG | | 5,944 | | 198 | |
| | Admiral Group plc | | 7,385 | | 194 | |
| | Berkeley Group Holdings plc | | 3,991 | | 191 | |
* | | Just Eat plc | | 19,574 | | 187 | |
| | Taylor Wimpey plc | | 103,986 | | 185 | |
| | Intermediate Capital Group plc | | 11,219 | | 183 | |
| | Bellway plc | | 5,135 | | 182 | |
| | SSP Group plc | | 21,026 | | 181 | |
| | Land Securities Group plc | | 19,170 | | 181 | |
| | Wm Morrison Supermarkets plc | | 80,858 | | 180 | |
| | Kingfisher plc | | 76,155 | | 180 | |
| | United Utilities Group plc | | 18,097 | | 179 | |
| | ITV plc | | 125,019 | | 177 | |
| | Hiscox Ltd. | | 9,290 | | 175 | |
| | DS Smith plc | | 41,420 | | 172 | |
| | Tate & Lyle plc | | 19,549 | | 171 | |
| | Severn Trent plc | | 6,665 | | 168 | |
| | Hargreaves Lansdown plc | | 7,293 | | 167 | |
| | Phoenix Group Holdings plc | | 21,223 | | 167 | |
| | British Land Co. plc | | 26,904 | | 167 | |
| | Direct Line Insurance Group plc | | 48,037 | | 166 | |
| | Howden Joinery Group plc | | 24,982 | | 164 | |
| | Britvic plc | | 15,344 | | 162 | |
| | Derwent London plc | | 4,052 | | 157 | |
| | Marks & Spencer Group plc | | 66,531 | | 156 | |
| | Spectris plc | | 5,493 | | 155 | |
| | Beazley plc | | 21,664 | | 150 | |
| | HomeServe plc | | 10,740 | | 150 | |
| | Investec plc | | 28,960 | | 149 | |
| | Micro Focus International plc | | 9,414 | | 129 | |
| | Travis Perkins plc | | 8,241 | | 126 | |
| | J Sainsbury plc | | 50,164 | | 120 | |
| | Pennon Group plc | | 12,269 | | 113 | |
| | Antofagasta plc | | 9,232 | | 98 | |
| | Polymetal International plc | | 6,670 | | 96 | |
| | UNITE Group plc | | 6,267 | | 80 | |
| | Hammerson plc | | 28,449 | | 79 | |
2 | | Merlin Entertainments plc | | 12,180 | | 67 | |
| | IWG plc | | 11,629 | | 59 | |
| | Dechra Pharmaceuticals plc | | 1,588 | | 58 | |
| | Schroders plc | | 1,669 | | 56 | |
| | B&M European Value Retail SA | | 12,727 | | 56 | |
| | Inmarsat plc | | 7,222 | | 53 | |
| | BBA Aviation plc | | 13,352 | | 52 | |
| | Electrocomponents plc | | 6,894 | | 49 | |
2 | | ConvaTec Group plc | | 22,997 | | 49 | |
| | Man Group PLC | | 23,179 | | 47 | |
| | Inchcape plc | | 6,654 | | 47 | |
| | Moneysupermarket.com Group plc | | 10,205 | | 46 | |
| | Hikma Pharmaceuticals plc | | 1,750 | | 43 | |
| | Entertainment One Ltd. | | 6,031 | | 43 | |
| | WH Smith plc | | 1,779 | | 42 | |
| | JD Sports Fashion plc | | 5,495 | | 41 | |
| | UDG Healthcare plc | | 4,303 | | 41 | |
| | Aggreko plc | | 4,403 | | 41 | |
| | Greggs plc | | 1,551 | | 40 | |
| | easyJet plc | | 3,383 | | 40 | |
| | Diploma plc | | 2,011 | | 39 | |
| | BCA Marketplace plc | | 13,082 | | 39 | |
| | Genus plc | | 1,184 | | 38 | |
| | Hays plc | | 22,154 | | 38 | |
| | Pagegroup plc | | 7,381 | | 38 | |
| | Grainger plc | | 12,196 | | 36 | |
| | Great Portland Estates plc | | 4,278 | | 36 | |
| | NMC Health plc | | 1,162 | | 35 | |
| | Assura plc | | 41,973 | | 35 | |
| | Shaftesbury plc | | 3,356 | | 35 | |
| | IG Group Holdings plc | | 5,319 | | 35 | |
| | International Consolidated Airlines Group SA (London Shares) | | 6,675 | | 34 | |
| | Victrex plc | | 1,337 | | 34 | |
2 | | Ascential plc | | 7,348 | | 34 | |
| | National Express Group plc | | 6,527 | | 34 | |
| | Close Brothers Group plc | | 2,138 | | 34 | |
* | | Firstgroup plc | | 21,078 | | 33 | |
| | Grafton Group plc | | 3,627 | | 33 | |
| | Jupiter Fund Management plc | | 7,940 | | 33 | |
| | Royal Mail plc | | 13,150 | | 33 | |
| | CYBG plc | | 19,115 | | 33 | |
| | Cineworld Group plc | | 12,357 | | 33 | |
| | Big Yellow Group plc | | 2,525 | | 33 | |
| | Savills plc | | 3,179 | | 32 | |
49
ESG International Stock ETF
| | | | | | Market | |
| | | | | | Value· | |
| | | | Shares | | ($000 | ) |
| | LondonMetric Property plc | | 12,832 | | 32 | |
2 | | John Laing Group plc | | 7,379 | | 32 | |
| | Essentra plc | | 6,453 | | 32 | |
| | Lancashire Holdings Ltd. | | 3,804 | | 32 | |
| | TP ICAP plc | | 8,767 | | 31 | |
* | | Serco Group plc | | 17,489 | | 31 | |
| | Cranswick plc | | 917 | | 31 | |
| | Safestore Holdings plc | | 3,724 | | 30 | |
| | Paragon Banking Group plc | | 5,679 | | 30 | |
| | Bovis Homes Group plc | | 2,388 | | 30 | |
| | Bodycote plc | | 3,408 | | 30 | |
| | Centamin plc | | 16,724 | | 29 | |
| | Rhi Magnesita NV | | 546 | | 29 | |
| | Capital & Counties Properties plc | | 11,716 | | 29 | |
| | Rathbone Brothers plc | | 1,068 | | 29 | |
2 | | Countryside Properties plc | | 7,827 | | 29 | |
| | Games Workshop Group plc | | 535 | | 29 | |
| | Ashmore Group plc | | 5,163 | | 28 | |
*,2 | | Wizz Air Holdings plc | | 632 | | 28 | |
| | St. Modwen Properties plc | | 5,519 | | 27 | |
| | Synthomer plc | | 7,267 | | 27 | |
| | Brewin Dolphin Holdings plc | | 7,324 | | 27 | |
2 | | Sophos Group plc | | 5,647 | | 26 | |
| | Redrow plc | | 3,916 | | 26 | |
| | Domino’s Pizza Group plc | | 8,858 | | 26 | |
| | Softcat plc | | 2,041 | | 26 | |
| | Vesuvius plc | | 4,493 | | 26 | |
| | Dixons Carphone plc | | 19,305 | | 25 | |
| | Coats Group plc | | 28,249 | | 25 | |
| | Pets at Home Group plc | | 8,785 | | 25 | |
| | Mediclinic International plc | | 5,961 | | 25 | |
| | Renishaw plc | | 553 | | 24 | |
2 | | Avast plc | | 5,155 | | 24 | |
| | Marshalls plc | | 2,809 | | 24 | |
| | Daily Mail & General Trust plc | | 2,395 | | 24 | |
| | Workspace Group plc | | 2,234 | | 23 | |
2 | | Ibstock plc | | 8,512 | | 22 | |
| | Hill & Smith Holdings plc | | 1,559 | | 22 | |
| | Fresnillo plc | | 2,428 | | 22 | |
| | Petrofac Ltd. | | 4,258 | | 22 | |
| | OneSavings Bank plc | | 5,529 | | 22 | |
| | AG Barr plc | | 2,978 | | 22 | |
| | Computacenter plc | | 1,309 | | 21 | |
| | Greencore Group plc | | 8,217 | | 21 | |
| | Polypipe Group plc | | 4,577 | | 21 | |
| | Go-Ahead Group plc | | 813 | | 21 | |
| | Drax Group plc | | 6,144 | | 20 | |
| | Provident Financial plc | | 4,090 | | 20 | |
| | Crest Nicholson Holdings plc | | 4,638 | | 20 | |
| | Plus500 Ltd. | | 2,245 | | 19 | |
| | Dunelm Group plc | | 1,737 | | 19 | |
| | SIG plc | | 11,882 | | 18 | |
| | Elementis plc | | 9,763 | | 18 | |
| | Galliford Try plc | | 2,290 | | 16 | |
2 | | Hastings Group Holdings plc | | 7,203 | | 16 | |
| | Sanne Group plc | | 2,498 | | 16 | |
| | Telecom Plus plc | | 1,118 | | 16 | |
| | IntegraFin Holdings plc | | 3,144 | | 15 | |
| | Hochschild Mining plc | | 5,483 | | 15 | |
| | Stagecoach Group plc | | 9,115 | | 14 | |
| | Bank of Georgia Group plc | | 771 | | 13 | |
| | Northgate plc | | 3,149 | | 12 | |
| | NewRiver REIT plc | | 5,722 | | 11 | |
| | Ferrexpo plc | | 4,560 | | 11 | |
| | Saga plc | | 22,318 | | 11 | |
* | | Just Group plc | | 19,181 | | 10 | |
| | TBC Bank Group plc | | 651 | | 10 | |
^ | | Kier Group plc | | 6,419 | | 9 | |
| | Stobart Group Ltd. | | 6,172 | | 9 | |
*,^ | | Sirius Minerals plc | | 71,585 | | 9 | |
* | | Metro Bank plc | | 2,707 | | 9 | |
*,2 | | Aston Martin Lagonda Global Holdings plc | | 1,484 | | 9 | |
2 | | Charter Court Financial Services Group plc | | 2,605 | | 8 | |
| | Restaurant Group plc | | 4,315 | | 8 | |
2 | | McCarthy & Stone plc | | 4,086 | | 7 | |
| | Redefine International plc | | 5,397 | | 7 | |
* | | Bank of Cyprus Holdings plc | | 3,541 | | 6 | |
* | | Acacia Mining plc | | 1,877 | | 6 | |
| | Keller Group plc | | 717 | | 6 | |
| | TalkTalk Telecom Group plc | | 4,266 | | 5 | |
| | Mitie Group plc | | 2,929 | | 5 | |
| | ITE Group plc | | 5,794 | | 5 | |
2 | | Equiniti Group plc | | 2,016 | | 5 | |
| | Card Factory plc | | 2,673 | | 5 | |
* | | Vectura Group plc | | 5,191 | | 5 | |
| | AA plc | | 6,577 | | 4 | |
| | Chesnara plc | | 1,287 | | 4 | |
2 | | Spire Healthcare Group plc | | 2,910 | | 4 | |
| | Halfords Group plc | | 1,656 | | 4 | |
| | Superdry plc | | 736 | | 4 | |
*,2 | | Funding Circle Holdings plc | | 2,197 | | 3 | |
| | Dignity plc | | 520 | | 3 | |
| | International Personal Finance plc | | 2,012 | | 2 | |
* | | AO World plc | | 1,847 | | 2 | |
| | | | | | 35,273 | |
Total Common Stocks (Cost $420,064) | | | | 416,777 | |
50
ESG International Stock ETF
| | | | | | | | Face | | Market | |
| | | | | | Maturity | | Amount | | Value· | |
| | | | Coupon | | Date | | ($000 | ) | ($000 | ) |
Convertible Bonds (0.0%) | | | | | | | | | |
§ | | Britannia Industries Ltd. (Cost $0) | | 8.000% | | 8/28/22 | | 21 | | — | |
| | | | | | | | | | | |
| | | | | | | | Shares | | | |
Temporary Cash Investments (0.7%)1 | | | | | | | | | |
Money Market Fund (0.7%) | | | | | | | | | |
3,4 | | Vanguard Market Liquidity Fund, 2.249% | | | | | | 28,248 | | 2,825 | |
| | | | | | | | | | | |
| | | | | | | | Face | | | |
| | | | | | | | Amount | | | |
| | | | | | | | | ($000 | ) | | | |
U.S. Government and Agency Obligations (0.0%) | | | | | | | | | |
5 | | United States Treasury Bill, 2.048%, 11/21/19 | | | | | | 100 | | 100 | |
Total Temporary Cash Investments (Cost $2,925) | | | | | | | | 2,925 | |
Total Investments (100.3%) (Cost $422,989) | | | | | | | | 419,702 | |
| | | | | | | | | | | |
| | | | | | | | | | Amount | |
| | | | | | | | | | ($000 | ) |
Other Assets and Liabilities (-0.3%) | | | | | | | | | |
Other Assets | | | | | | | | | |
Investment in Vanguard | | | | | | | | 18 | |
Receivables for Accrued Income | | | | | | | | 1,010 | |
Variation Margin Receivable—Futures Contracts | | | | | | | | 12 | |
Other Assets6 | | | | | | | | 844 | |
Total Other Assets | | | | | | | | 1,884 | |
Liabilities | | | | | | | | | |
Payables for Investment Securities Purchased | | | | | | | | (3 | ) |
Collateral for Securities on Loan | | | | | | | | (2,822 | ) |
Payables to Vanguard | | | | | | | | (30 | ) |
Collateral for ETF Capital Activity | | | | | | | | (317 | ) |
Total Liabilities | | | | | | | | (3,172 | ) |
Net Assets (100%) | | | | | | | | | |
Applicable to 8,700,000 outstanding $.001 par value shares of beneficial interest (unlimited authorization) | | | | | | | | 418,414 | |
Net Asset Value Per Share | | | | | | | | $48.09 | |
| | | | | | | | | | | | | |
51
ESG International Stock ETF
At August 31, 2019, net assets consisted of:
| | Amount | |
| | ($000 | ) |
Paid-in Capital | | 421,388 | |
Total Distributable Earnings (Loss) | | (2,974 | ) |
Net Assets | | 418,414 | |
· | See Note A in Notes to Financial Statements. |
* | Non-income-producing security. |
^ | Includes partial security positions on loan to broker-dealers. The total value of securities on loan is $2,475,000. |
§ | Security value determined using significant unobservable inputs. |
1 | The fund invests a portion of its cash reserves in equity markets through the use of index futures contracts. After giving effect to futures investments, the fund’s effective common stock and temporary cash investment positions represent 100.0% and 0.3%, respectively, of net assets. |
2 | Security exempt from registration under Rule 144A of the Securities Act of 1933. Such securities may be sold in transactions exempt from registration, normally to qualified institutional buyers. At August 31, 2019, the aggregate value of these securities was $6,442,000, representing 1.5% of net assets. |
3 | Affiliated money market fund available only to Vanguard funds and certain trusts and accounts managed by Vanguard. Rate shown is the 7-day yield. |
4 | Includes $2,822,000 of collateral received for securities on loan. |
5 | Securities with a value of $100,000 have been segregated as initial margin for open futures contracts. |
6 | Cash of $317,000 has been segregated as collateral for ETF capital activity. |
| ADR—American Depositary Receipt. |
| GDR—Global Depositary Receipt. |
| NVDR—Non-Voting Depository Receipt. |
| REIT—Real Estate Investment Trust. |
Derivative Financial Instruments Outstanding as of Period End
Futures Contracts | | | | | | | | |
| | | | | | ($000) |
| | | | | | | | Value and |
| | | | Number of | | | | Unrealized |
| | | | Long (Short | ) | Notional | | Appreciation |
| | Expiration | | Contracts | | Amount | | (Depreciation) |
Long Futures Contracts | | | | | | | | |
MSCI Emerging Market Index | | September 2019 | | 29 | | 1,427 | | 12 |
See accompanying Notes, which are an integral part of the Financial Statements.
52
ESG International Stock ETF
Statement of Operations
| | September 18, 20181 to | |
| | August 31, 2019 | |
| | ($000 | ) |
Investment Income | | | |
Income | | | |
Dividends2 | | 6,045 | |
Interest3 | | 47 | |
Security Lending | | 21 | |
Total Income | | 6,113 | |
Expenses | | | |
The Vanguard Group—Note B | | | |
Investment Advisory Services | | 23 | |
Management and Administrative | | 174 | |
Marketing and Distribution | | 9 | |
Custodian Fees | | 68 | |
Auditing Fees | | 17 | |
Shareholders’ Reports | | 4 | |
Trustees’ Fees and Expenses | | — | |
Total Expenses | | 295 | |
Expenses Paid Indirectly | | (29 | ) |
Net Expenses | | 266 | |
Net Investment Income | | 5,847 | |
Realized Net Gain (Loss) | | | |
Investment Securities Sold3 | | (1,764 | ) |
Futures Contracts | | 52 | |
Forward Currency Contracts | | 180 | |
Foreign Currencies | | (298 | ) |
Realized Net Gain (Loss) | | (1,830 | ) |
Change in Unrealized Appreciation (Depreciation) | | | |
Investment Securities3 | | (3,287 | ) |
Futures Contracts | | 12 | |
Foreign Currencies | | 4 | |
Change in Unrealized Appreciation (Depreciation) | | (3,271 | ) |
Net Increase (Decrease) in Net Assets Resulting from Operations | | 746 | |
1 Inception.
2 Dividends are net of foreign withholding taxes of $720,000.
3 Interest income, realized net gain (loss), and change in unrealized appreciation (depreciation) from an affiliated company of the fund were $44,000, ($1,000), and ($1,000), respectively. Purchases and sales are for temporary cash investment purposes.
See accompanying Notes, which are an integral part of the Financial Statements.
53
ESG International Stock ETF
Statement of Changes in Net Assets
| | September 18, 20181 to | |
| | August 31, 2019 | |
| | ($000 | ) |
Increase (Decrease) in Net Assets | | | |
Operations | | | |
Net Investment Income | | 5,847 | |
Realized Net Gain (Loss) | | (1,830 | ) |
Change in Unrealized Appreciation (Depreciation) | | (3,271 | ) |
Net Increase (Decrease) in Net Assets Resulting from Operations | | 746 | |
Distributions | | | |
Net Investment Income | | (3,720 | ) |
Realized Capital Gain | | — | |
Total Distributions | | (3,720 | ) |
Capital Share Transactions | | | |
Issued | | 421,388 | |
Issued in Lieu of Cash Distributions | | — | |
Redeemed | | — | |
Net Increase (Decrease) from Capital Share Transactions | | 421,388 | |
Total Increase (Decrease) | | 418,414 | |
Net Assets | | | |
Beginning of Period | | — | |
End of Period | | 418,414 | |
1 Inception. | | | |
See accompanying Notes, which are an integral part of the Financial Statements.
54
ESG International Stock ETF
Financial Highlights
| | September 18, 20181 to | |
For a Share Outstanding Throughout the Period | | August 31, 2019 | |
Net Asset Value, Beginning of Period | | $50.00 | |
Investment Operations | | | |
Net Investment Income2 | | 1.529 | |
Net Realized and Unrealized Gain (Loss) on Investments | | (2.714) | |
Total from Investment Operations | | (1.185) | |
Distributions | | | |
Dividends from Net Investment Income | | (.725) | |
Distributions from Realized Capital Gains | | — | |
Total Distributions | | (.725) | |
Net Asset Value, End of Period | | $48.09 | |
| | | |
Total Return | | -2.36% | |
| | | |
Ratios/Supplemental Data | | | |
Net Assets, End of Period (Millions) | | $418 | |
Ratio of Total Expenses to Average Net Assets | | 0.17%3,4 | |
Ratio of Net Investment Income to Average Net Assets | | 3.30%3 | |
Portfolio Turnover Rate | | 22% | |
1 Inception.
2 Calculated based on average shares outstanding.
3 Annualized.
4 The ratio of expenses to average net assets for the period net of reduction from custody fee offset arrangements was 0.15%.
See accompanying Notes, which are an integral part of the Financial Statements.
55
ESG International Stock ETF
Notes to Financial Statements
Vanguard ESG International Stock ETF is registered under the Investment Company Act of 1940 as an open-end investment company, or mutual fund. ETF Shares are listed for trading on Cboe BZX Exchange; they can be purchased and sold through a broker.
A. The following significant accounting policies conform to generally accepted accounting principles for U.S. investment companies. The fund consistently follows such policies in preparing its financial statements.
1. Security Valuation: Securities are valued as of the close of trading on the New York Stock Exchange (generally 4 p.m., Eastern time) on the valuation date. Equity securities are valued at the latest quoted sales prices or official closing prices taken from the primary market in which each security trades; such securities not traded on the valuation date are valued at the mean of the latest quoted bid and asked prices. Securities for which market quotations are not readily available, or whose values have been affected by events occurring before the fund’s pricing time but after the close of the securities’ primary markets, are valued at their fair values calculated according to procedures adopted by the board of trustees. These procedures include obtaining quotations from an independent pricing service, monitoring news to identify significant market- or security-specific events, and evaluating changes in the values of foreign market proxies (for example, ADRs, futures contracts, or exchange-traded funds), between the time the foreign markets close and the fund’s pricing time. When fair-value pricing is employed, the prices of securities used by a fund to calculate its net asset value may differ from quoted or published prices for the same securities. Investments in Vanguard Market Liquidity Fund are valued at that fund’s net asset value. Temporary cash investments are valued using the latest bid prices or using valuations based on a matrix system (which considers such factors as security prices, yields, maturities, and ratings), both as furnished by independent pricing services.
2. Foreign Currency: Securities and other assets and liabilities denominated in foreign currencies are translated into U.S. dollars using exchange rates obtained from an independent third party as of the fund’s pricing time on the valuation date. Realized gains (losses) and unrealized appreciation (depreciation) on investment securities include the effects of changes in exchange rates since the securities were purchased, combined with the effects of changes in security prices. Fluctuations in the value of other assets and liabilities resulting from changes in exchange rates are recorded as unrealized foreign currency gains (losses) until the assets or liabilities are settled in cash, at which time they are recorded as realized foreign currency gains (losses).
3. Futures and Forward Currency Contracts: The fund uses index futures contracts to a limited extent, with the objectives of maintaining full exposure to the stock market, maintaining liquidity, and minimizing transaction costs. The fund may purchase futures contracts to immediately invest incoming cash in the market, or sell futures in response to cash outflows, thereby simulating a fully invested position in the underlying index while maintaining a cash balance for liquidity. The primary risks associated with the use of futures contracts are imperfect correlation between changes in market values of stocks held by the fund and the prices of futures contracts, and the possibility of an illiquid market. Counterparty risk involving futures is mitigated because a regulated clearinghouse is the counterparty instead of the clearing broker. To further mitigate counterparty risk, the fund trades futures contracts on an exchange, monitors the financial strength of its clearing brokers and clearinghouse, and has entered into clearing agreements with its clearing brokers. The clearinghouse imposes initial margin requirements to secure the fund’s performance and requires daily settlement of variation margin representing changes in the market value of each contract. Any assets pledged as initial margin for open contracts are noted in the Statement of Net Assets.
56
ESG International Stock ETF
The fund also enters into forward currency contracts to provide the appropriate currency exposure related to any open futures contracts. The fund’s risks in using these contracts include movement in the values of the foreign currencies relative to the U.S. dollar and the ability of the counterparties to fulfill their obligations under the contracts. The fund mitigates its counterparty risk by entering into forward currency contracts only with a diverse group of prequalified counterparties, monitoring their financial strength, entering into master netting arrangements with its counterparties, and requiring its counterparties to transfer collateral as security for their performance. In the absence of a default, the collateral pledged or received by the fund cannot be repledged, resold, or rehypothecated. The master netting arrangements provide that, in the event of a counterparty’s default (including bankruptcy), the fund may terminate the forward currency contracts, determine the net amount owed by either party in accordance with its master netting arrangements, and sell or retain any collateral held up to the net amount owed to the fund under the master netting arrangements. The forward currency contracts contain provisions whereby a counterparty may terminate open contracts if the fund’s net assets decline below a certain level, triggering a payment by the fund if the fund is in a net liability position at the time of the termination. The payment amount would be reduced by any collateral the fund has pledged. Any assets pledged as collateral for open contracts are noted in the Statement of Net Assets. The value of collateral received or pledged is compared daily to the value of the forward currency contracts exposure with each counterparty, and any difference, if in excess of a specified minimum transfer amount, is adjusted and settled within two business days.
Futures contracts are valued at their quoted daily settlement prices. Forward currency contracts are valued at their quoted daily prices obtained from an independent third party, adjusted for currency risk based on the expiration date of each contract. The notional amounts of the contracts are not recorded in the Statement of Net Assets. Fluctuations in the value of the contracts are recorded in the Statement of Net Assets as an asset (liability) and in the Statement of Operations as unrealized appreciation (depreciation) until the contracts are closed, when they are recorded as realized gains (losses) on futures or forward currency contracts.
During the period ended August 31, 2019, the fund’s average investments in long and short futures contracts represented 2% and 0% of net assets, respectively, based on the average of the notional amounts at each quarter-end during the period. The fund’s average investment in forward currency contracts represented 1% of net assets, based on the average of the notional amounts at each quarter-end during the period. The fund had no open forward currency contracts at August 31, 2019.
4. Federal Income Taxes: The fund intends to qualify as a regulated investment company and distribute all of its taxable income. Management has analyzed the fund’s tax positions taken for the period ended August 31, 2019, and has concluded that no provision for federal income tax is required in the fund’s financial statements.
5. Distributions: Distributions to shareholders are recorded on the ex-dividend date. Distributions are determined on a tax basis and may differ from net investment income and realized capital gains for financial reporting purposes.
6. Securities Lending: To earn additional income, the fund lends its securities to qualified institutional borrowers. Security loans are subject to termination by the fund at any time, and are required to be secured at all times by collateral in an amount at least equal to the market value of securities loaned. Daily market fluctuations could cause the value of loaned securities to be more or less than the value of the collateral received. When this occurs, the collateral is adjusted and settled before the opening of the market on the next business day. The fund further mitigates its
57
ESG International Stock ETF
counterparty risk by entering into securities lending transactions only with a diverse group of prequalified counterparties, monitoring their financial strength, and entering into master securities lending agreements with its counterparties. The master securities lending agreements provide that, in the event of a counterparty’s default (including bankruptcy), the fund may terminate any loans with that borrower, determine the net amount owed, and sell or retain the collateral up to the net amount owed to the fund; however, such actions may be subject to legal proceedings. While collateral mitigates counterparty risk, in the event of a default, the fund may experience delays and costs in recovering the securities loaned. The fund invests cash collateral received in Vanguard Market Liquidity Fund, and records a liability in the Statement of Net Assets for the return of the collateral, during the period the securities are on loan. Securities lending income represents fees charged to borrowers plus income earned on invested cash collateral, less expenses associated with the loan. During the term of the loan, the fund is entitled to all distributions made on or in respect of the loaned securities.
7. Collateral for ETF Capital Activity: When an authorized participant fails to deliver one or more of the securities within a designated basket (in the case of a subscription), fails to deliver the fund ETF Shares (in the case of a redemption), or is required by the fund, prior to settlement, to accommodate the trading of foreign securities in local markets (in the case of redemption for an international equity ETF), the fund may require the authorized participant to deliver and maintain cash collateral in accordance with the authorized participant agreement. The fund may invest the collateral in short-term debt instruments or U.S. Treasury securities, or maintain the balance as cash. Daily market fluctuations could cause the value of the missing securities or fund ETF Shares to be more or less than the value of the collateral received; when this occurs the collateral is adjusted. The fund earns interest income from investments and/or custody fee offsets from the cash balance. The fund records an asset (cash or investment, as applicable) and a corresponding liability for the return of the collateral in the Statement of Net Assets. Interest income and custody fee offsets earned on the investment of collateral are included in the Statement of Operations.
8. Credit Facility: The fund and certain other funds managed by The Vanguard Group (“Vanguard”) participate in a $4.3 billion committed credit facility provided by a syndicate of lenders pursuant to a credit agreement that may be renewed annually; each fund is individually liable for its borrowings, if any, under the credit facility. Borrowings may be utilized for temporary and emergency purposes, and are subject to the fund’s regulatory and contractual borrowing restrictions. The participating funds are charged administrative fees and an annual commitment fee of 0.10% of the undrawn amount of the facility; these fees are allocated to the funds based on a method approved by the fund’s board of trustees and included in Management and Administrative expenses on the fund’s Statement of Operations. Any borrowings under this facility bear interest at a rate based upon the higher of the one-month London Interbank Offered Rate, federal funds effective rate, or overnight bank funding rate plus an agreed-upon spread.
The fund had no borrowings outstanding at August 31, 2019, or at any time during the period then ended.
9. Other: Dividend income is recorded on the ex-dividend date. Interest income includes income distributions received from Vanguard Market Liquidity Fund and is accrued daily. Premiums and discounts on debt securities purchased are amortized and accreted, respectively, to interest income over the lives of the respective securities. Taxes on foreign dividends and capital gains have been provided for in accordance with the fund’s understanding of the applicable countries’ tax rules and
58
ESG International Stock ETF
rates. Foreign capital gains tax is accrued daily based upon net unrealized gains. Security transactions are accounted for on the date securities are bought or sold. Costs used to determine realized gains (losses) on the sale of investment securities are those of the specific securities sold.
B. In accordance with the terms of a Funds’ Service Agreement (the “FSA”) between Vanguard and the fund, Vanguard furnishes to the fund investment advisory, corporate management, administrative, marketing, and distribution services at Vanguard’s cost of operations (as defined by the FSA). These costs of operations are allocated to the fund based on methods and guidelines approved by the board of trustees, and are generally settled twice a month.
Upon the request of Vanguard, the fund may invest up to 0.40% of its net assets as capital in Vanguard. At August 31, 2019, the fund had contributed to Vanguard capital in the amount of $18,000, representing less than 0.01% of the fund’s net assets and 0.01% of Vanguard’s capital received pursuant to the FSA. The fund’s trustees and officers are also directors and employees, respectively, of Vanguard.
C. The fund’s custodian bank has agreed to reduce its fees when the fund maintains cash on deposit in the non-interest-bearing custody account. For the period ended August 31, 2019, custodian fee offset arrangements reduced the fund’s expenses by $29,000 (an annual rate of 0.02% of average net assets).
D. Various inputs may be used to determine the value of the fund’s investments. These inputs are summarized in three broad levels for financial statement purposes. The inputs or methodologies used to value securities are not necessarily an indication of the risk associated with investing in those securities.
Level 1—Quoted prices in active markets for identical securities.
Level 2—Other significant observable inputs (including quoted prices for similar securities, interest rates, prepayment speeds, credit risk, etc.).
Level 3—Significant unobservable inputs (including the fund’s own assumptions used to determine the fair value of investments). Any investments valued with significant unobservable inputs are noted on the Statement of Net Assets.
The following table summarizes the market value of the fund’s investments and derivatives as of August 31, 2019, based on the inputs used to value them:
| Level 1 | Level 2 | Level 3 |
Investments | ($000) | ($000) | ($000) |
Common Stocks—North and South America | 45,272 | 58 | — |
Common Stocks—Other | 8,668 | 362,756 | 23 |
Convertible Bonds | — | — | — |
Temporary Cash Investments | 2,825 | 100 | — |
Futures Contracts—Assets1 | 12 | — | — |
Total | 56,777 | 362,914 | 23 |
1 Represents variation margin on the last day of the reporting period.
59
ESG International Stock ETF
E. At August 31, 2019, the fair values of derivatives were reflected in the Statement of Net Assets as follows:
| | Foreign | |
| Equity | Exchange | |
| Contracts | Contracts | Total |
Statement of Net Assets Caption | ($000) | ($000) | ($000) |
Variation Margin Receivable—Futures Contracts | 12 | — | 12 |
Unrealized Appreciation—Forwards Contracts | — | — | — |
Total Assets | 12 | — | 12 |
Realized net gain (loss) and the change in unrealized appreciation (depreciation) on derivatives for the period ended August 31, 2019, were:
| | Foreign | |
| Equity | Exchange | |
| Contracts | Contracts | Total |
Realized Net Gain (Loss) on Derivatives | ($000) | ($000) | ($000) |
Futures Contracts | 52 | — | 52 |
Forward Currency Contracts | — | 180 | 180 |
Realized Net Gain (Loss) on Derivatives | 52 | 180 | 232 |
| | | |
Change in Unrealized Appreciation (Depreciation) on Derivatives | | | |
Futures Contracts | 12 | — | 12 |
Forward Currency Contracts | — | — | — |
Change in Unrealized Appreciation (Depreciation) on Derivatives | 12 | — | 12 |
F. Permanent differences between book-basis and tax-basis components of net assets are reclassified among capital accounts in the financial statements to reflect their tax character. These reclassifications have no effect on net assets or net asset value per share. As of period end, permanent differences primarily attributable to the accounting for foreign currency transactions, passive foreign investment companies and tax expense on capital gains were reclassified between the individual components of total distributable earnings (loss).
| Amount |
| ($000) |
Paid-in Capital | — |
Total Distributable Earnings (Loss) | — |
Temporary differences between book-basis and tax-basis components of total distributable earnings (loss) arise when certain items of income, gain, or loss are recognized in different periods for financial statement and tax purposes; these differences will reverse at some time in the future. The differences are primarily related to the tax deferral on wash sales, the realization of unrealized gains or losses
60
ESG International Stock ETF
on certain futures contracts, and unrealized gains on passive foreign investment companies. As of period end, the tax-basis components of total distributable earnings (loss) are detailed in the table as follows:
| Amount |
| ($000) |
Undistributed Ordinary Income | 2,338 |
Undistributed Long-Term Gains | — |
Capital Loss Carryforwards (Non-expiring) | (1,572) |
Net Unrealized Gains (Losses) | (3,740) |
As of August 31, 2019, gross unrealized appreciation and depreciation for investments and derivatives based on cost for U.S. federal income tax purposes were as follows:
| Amount |
| ($000) |
Tax Cost | 423,445 |
Gross Unrealized Appreciation | 21,617 |
Gross Unrealized Depreciation | (25,360) |
Net Unrealized Appreciation (Depreciation) | (3,743) |
G. During the period ended August 31, 2019, the fund purchased $462,612,000 of investment securities and sold $40,787,000 of investment securities, other than temporary cash investments. Purchases and sales include $229,022,000 and $0, respectively, in connection with in-kind purchases and redemptions of the fund’s capital shares.
H. Capital shares issued and redeemed were:
| September 18, 20181 to |
| August 31, 2019 |
| Shares |
| (000) |
Issued | 8,700 |
Issued in Lieu of Cash Distributions | — |
Redeemed | — |
Net Increase (Decrease) in Shares Outstanding | 8,700 |
1 Inception.
At August 31, 2019, one shareholder was the record or beneficial owner of 50% of the fund’s net assets. If this shareholder were to redeem its investment in the fund, the redemption might result in an increase in the fund’s expense ratio, cause the fund to incur higher transaction costs, or lead to the realization of taxable capital gains.
I. Management has determined that no events or transactions occurred subsequent to August 31, 2019, that would require recognition or disclosure in these financial statements.
61
Report of Independent Registered Public Accounting Firm
To the Board of Trustees of Vanguard World Fund and Shareholders of Vanguard ESG International Stock ETF
Opinion on the Financial Statements
We have audited the accompanying statement of net assets of Vanguard ESG International Stock ETF (one of the funds constituting Vanguard World Fund, referred to hereafter as the “Fund”) as of August 31, 2019, and the related statements of operations and changes in net assets, including the related notes, and the financial highlights for the period September 18, 2018 (inception) through August 31, 2019 (collectively referred to as the “financial statements”). In our opinion, the financial statements present fairly, in all material respects, the financial position of the Fund as of August 31, 2019, and the results of its operations, changes in its net assets, and the financial highlights for the period September 18, 2018 (inception) through August 31, 2019 in conformity with accounting principles generally accepted in the United States of America.
Basis for Opinion
These financial statements are the responsibility of the Fund’s management. Our responsibility is to express an opinion on the Fund’s financial statements based on our audit. We are a public accounting firm registered with the Public Company Accounting Oversight Board (United States) (“PCAOB”) and are required to be independent with respect to the Fund in accordance with the U.S. federal securities laws and the applicable rules and regulations of the Securities and Exchange Commission and the PCAOB.
We conducted our audit of these financial statements in accordance with the standards of the PCAOB. Those standards require that we plan and perform the audit to obtain reasonable assurance about whether the financial statements are free of material misstatement, whether due to error or fraud.
Our audit included performing procedures to assess the risks of material misstatement of the financial statements, whether due to error or fraud, and performing procedures that respond to those risks. Such procedures included examining, on a test basis, evidence regarding the amounts and disclosures in the financial statements. Our audit also included evaluating the accounting principles used and significant estimates made by management, as well as evaluating the overall presentation of the financial statements. Our procedures included confirmation of securities owned as of August 31, 2019 by correspondence with the custodian and brokers and by agreement to the underlying ownership records of the transfer agent; when replies were not received from brokers, we performed other auditing procedures. We believe that our audit provides a reasonable basis for our opinion.
/s/PricewaterhouseCoopers LLP
Philadelphia, Pennsylvania
October 24, 2019
We have served as the auditor of one or more investment companies in The Vanguard Group of Funds since 1975.
62
Special 2019 tax information (unaudited) for Vanguard ESG International Stock ETF
This information for the period ended August 31, 2019, is included pursuant to provisions of the Internal Revenue Code.
The fund distributed $2,778,000 of qualified dividend income to shareholders during the period.
The fund designates to shareholders foreign source income of $6,769,000 and foreign taxes paid of $586,000. Shareholders will receive more detailed information with their Form 1099-DIV in January 2020 to determine the calendar-year amounts to be included on their 2019 tax returns.
63
Trustees Approve Advisory Arrangement
The board of trustees of Vanguard ESG International Stock ETF has renewed the fund’s investment advisory arrangement with The Vanguard Group, Inc. (Vanguard), through its Equity Index Group. The board determined that continuing the fund’s internalized management structure was in the best interests of the fund and its shareholders.
The board based its decision upon an evaluation of the advisor’s investment staff, portfolio management process, and performance. This evaluation included information provided to the board by Vanguard’s Portfolio Review Department, which is responsible for fund and advisor oversight and product management. The Portfolio Review Department met regularly with the advisor and made monthly presentations to the board during the fiscal year that directed the board’s focus to relevant information and topics.
The board, or an investment committee made up of board members, also received information throughout the year during advisor presentations. For each advisor presentation, the board was provided with letters and reports that included information about, among other things, the advisory firm and the advisor’s assessment of the investment environment, portfolio performance, and portfolio characteristics.
In addition, the board received monthly reports, which included a Market and Economic Report, a Fund Dashboard Monthly Summary, and a Fund Performance Report.
Prior to their meeting, the trustees were provided with a memo and materials that summarized the information they received over the course of the year. They also considered the factors discussed below, among others. However, no single factor determined whether the board approved the arrangements. Rather, it was the totality of the circumstances that drove the board’s decision.
Nature, extent, and quality of services
The board reviewed the quality of the investment management services provided to the fund since its inception in 2018 and took into account the organizational depth and stability of the advisor. The board considered that Vanguard has been managing investments for more than four decades. The Equity Index Group adheres to a sound, disciplined investment management process; the team has considerable experience, stability, and depth.
The board concluded that Vanguard’s experience, stability, depth, and performance, among other factors, warranted continuation of the advisory arrangement.
Investment performance
The board considered the fund’s performance since its inception, including any periods of outperformance or underperformance compared with its target index and peer group. The board concluded that the performance was such that the advisory arrangement should continue.
Cost
The board concluded that, while the fund had not yet been in existence for a full fiscal year, the fund’s estimated expense ratio was well below the average expense ratio charged by funds in its peer group and that the fund’s estimated advisory expenses were also well below the peer-group average.
64
The board does not conduct a profitability analysis of Vanguard because of Vanguard’s unique structure. Unlike most other mutual fund management companies, Vanguard is owned by the funds it oversees.
The benefit of economies of scale
The board concluded that the fund’s arrangement with Vanguard ensures that the fund will realize economies of scale as it grows, with the cost to shareholders declining as fund assets increase.
The board will consider whether to renew the advisory arrangement again after a one-year period.
65
London Stock Exchange Group companies include FTSE International Limited (“FTSE”), Frank Russell Company (“Russell”), MTS Next Limited (“MTS”), and FTSE TMX Global Debt Capital Markets Inc. (“FTSE TMX”). All rights reserved. “FTSE®”, “Russell®”, “MTS®”, “FTSE TMX®” and “FTSE Russell” and other service marks and trademarks related to the FTSE or Russell indexes are trademarks of the London Stock Exchange Group companies and are used by FTSE, MTS, FTSE TMX and Russell under license. All information is provided for information purposes only. Every effort is made to ensure that all information given in this publication is accurate, but no responsibility or liability can be accepted by the London Stock Exchange Group companies nor its licensors for any errors or for any loss from use of this publication. Neither the London Stock Exchange Group companies nor any of their licensors make any claim, prediction, warranty or representation whatsoever, expressly or impliedly, either as to the results to be obtained from the use of the Indices or the fitness or suitability of the Indices for any particular purpose to which they might be put. The London Stock Exchange Group companies do not provide investment advice and nothing in this document should be taken as constituting financial or investment advice. The London Stock Exchange Group companies make no representation regarding the advisability of investing in any asset. A decision to invest in any such asset should not be made in reliance on any information herein. Indexes cannot be invested in directly. Inclusion of an asset in an index is not a recommendation to buy, sell or hold that asset. The general information contained in this publication should not be acted upon without obtaining specific legal, tax, and investment advice from a licensed professional. No part of this information may be reproduced, stored in a retrieval system or transmitted in any form or by any means, electronic, mechanical, photocopying, recording or otherwise, without prior written permission of the London Stock Exchange Group companies. Distribution of the London Stock Exchange Group companies’ index values and the use of their indexes to create financial products require a license with FTSE, FTSE TMX, MTS and/or Russell and/or its licensors.
66
The People Who Govern Your Fund
The trustees of your mutual fund are there to see that the fund is operated and managed in your best interests since, as a shareholder, you are a part owner of the fund. Your fund’s trustees also serve on the board of directors of The Vanguard Group, Inc., which is owned by the Vanguard funds and provides services to them.
A majority of Vanguard’s board members are independent, meaning that they have no affiliation with Vanguard or the funds they oversee, apart from the sizable personal investments they have made as private individuals. The independent board members have distinguished backgrounds in business, academia, and public service. Each of the trustees and executive officers oversees 212 Vanguard funds.
Information for each trustee and executive officer of the fund appears below. The mailing address of the trustees and officers is P.O. Box 876, Valley Forge, PA 19482. More information about the trustees is in the Statement of Additional Information, which can be obtained, without charge, by contacting Vanguard at 800-662-7447, or online at vanguard.com.
Interested Trustee1
Mortimer J. Buckley
Born in 1969. Trustee since January 2018. Principal occupation(s) during the past five years and other experience: chairman of the board (January 2019–present) of Vanguard and of each of the investment companies served by Vanguard; chief executive officer (January 2018–present) of Vanguard; chief executive officer, president, and trustee (January 2018–present) of each of the investment companies served by Vanguard; president and director (2017–present) of Vanguard; and president (February 2018–present) of Vanguard Marketing Corporation. Chief investment officer (2013–2017), managing director (2002–2017), head of the Retail Investor Group (2006–2012), and chief information officer (2001–2006) of Vanguard. Chairman of the board (2011–2017) and trustee (2009–2017) of the Children’s Hospital of Philadelphia; trustee (2018–present) of The Shipley School.
Independent Trustees
Emerson U. Fullwood
Born in 1948. Trustee since January 2008. Principal occupation(s) during the past five years and other experience: executive chief staff and marketing officer for North America and corporate vice president (retired 2008) of Xerox Corporation (document management products and services). Former president of the Worldwide Channels Group, Latin America, and Worldwide Customer Service and executive chief staff officer of Developing Markets of Xerox. Executive in residence and 2009–2010 Distinguished Minett Professor at the Rochester Institute of Technology. Director of SPX FLOW, Inc. (multi-industry manufacturing). Director of the University of Rochester Medical Center, the Monroe Community College Foundation, the United Way of Rochester, North Carolina A&T University, and Roberts Wesleyan College. Trustee of the University of Rochester.
Amy Gutmann
Born in 1949. Trustee since June 2006. Principal occupation(s) during the past five years and other experience: president (2004–present) of the University of Pennsylvania. Christopher H. Browne Distinguished Professor of Political Science, School of Arts and Sciences, and professor of communication, Annenberg School for Communication, with secondary faculty appointments in the Department of Philosophy, School of Arts and Sciences, and at the Graduate School of Education, University of Pennsylvania. Trustee of the National Constitution Center.
F. Joseph Loughrey
Born in 1949. Trustee since October 2009. Principal occupation(s) during the past five years and other experience: president and chief operating officer (retired 2009) and vice chairman of the board (2008–2009) of Cummins Inc. (industrial machinery). Chairman of the board of Hillenbrand, Inc. (specialized consumer services), and the Lumina Foundation.
1 Mr. Buckley is considered an “interested person,” as defined in the Investment Company Act of 1940, because he is an officer of the Vanguard funds.
Director of the V Foundation and Oxfam America. Member of the advisory council for the College of Arts and Letters and chair of the advisory board to the Kellogg Institute for International Studies, both at the University of Notre Dame.
Mark Loughridge
Born in 1953. Trustee since March 2012. Principal occupation(s) during the past five years and other experience: senior vice president and chief financial officer (retired 2013) of IBM (information technology services). Fiduciary member of IBM’s Retirement Plan Committee (2004–2013), senior vice president and general manager (2002–2004) of IBM Global Financing, vice president and controller (1998–2002) of IBM, and a variety of other prior management roles at IBM. Member of the Council on Chicago Booth.
Scott C. Malpass
Born in 1962. Trustee since March 2012. Principal occupation(s) during the past five years and other experience: chief investment officer (1989–present) and vice president (1996–present) of the University of Notre Dame. Assistant professor of finance at the Mendoza College of Business, University of Notre Dame, and member of the Notre Dame 403(b) Investment Committee. Chairman of the board of TIFF Advisory Services, Inc. Member of the board of Catholic Investment Services, Inc. (investment advisors) and the board of superintendence of the Institute for the Works of Religion.
Deanna Mulligan
Born in 1963. Trustee since January 2018. Principal occupation(s) during the past five years and other experience: president (2010–present) and chief executive officer (2011–present) of The Guardian Life Insurance Company of America. Chief operating officer (2010–2011) and executive vice president (2008–2010) of Individual Life and Disability of The Guardian Life Insurance Company of America. Member of the board of The Guardian Life Insurance Company of America, the American Council of Life Insurers, the Partnership for New York City (business leadership), and the Committee Encouraging Corporate Philanthropy. Trustee of the Economic Club of New York and the Bruce Museum (arts and science). Member of the Advisory Council for the Stanford Graduate School of Business.
André F. Perold
Born in 1952. Trustee since December 2004. Principal occupation(s) during the past five years and other experience: George Gund Professor of Finance and Banking, Emeritus at the Harvard Business School (retired 2011). Chief investment officer and co-managing partner of HighVista Strategies LLC (private investment firm). Board of advisors and investment committee member of the Museum of Fine Arts Boston. Board member (2018–present) of RIT Capital Partners (investment firm); investment committee member of Partners Health Care System.
Sarah Bloom Raskin
Born in 1961. Trustee since January 2018. Principal occupation(s) during the past five years and other experience: deputy secretary (2014–2017) of the United States Department of the Treasury. Governor (2010–2014) of the Federal Reserve Board. Commissioner (2007–2010) of financial regulation for the State of Maryland. Member of the board of directors (2012–2014) of Neighborhood Reinvestment Corporation. Director (2017–present) of i(x) Investments, LLC; director (2017–present) of Reserve Trust. Rubinstein Fellow (2017–present) of Duke University; trustee (2017–present) of Amherst College.
Peter F. Volanakis
Born in 1955. Trustee since July 2009. Principal occupation(s) during the past five years and other experience: president and chief operating officer (retired 2010) of Corning Incorporated (communications equipment) and director of Corning Incorporated (2000–2010) and Dow Corning (2001–2010). Director (2012) of SPX Corporation (multi-industry manufacturing). Overseer of the Amos Tuck School of Business Administration, Dartmouth College (2001–2013). Chairman of the board of trustees of Colby-Sawyer College. Member of the board of Hypertherm Inc. (industrial cutting systems, software, and consumables).
Executive Officers
Glenn Booraem
Born in 1967. Principal occupation(s) during the past five years and other experience: principal of Vanguard. Investment stewardship officer (2017–present), treasurer (2015–2017), controller (2010–2015), and assistant controller (2001–2010) of each of the investment companies served by Vanguard.
Christine M. Buchanan
Born in 1970. Principal occupation(s) during the past five years and other experience: principal of Vanguard and global head of Fund Administration at Vanguard. Treasurer (2017–present) of each of the investment companies served by Vanguard. Partner (2005–2017) at KPMG LLP (audit, tax, and advisory services).
Thomas J. Higgins
Born in 1957. Principal occupation(s) during the past five years and other experience: principal of Vanguard. Chief financial officer (2008–present) and treasurer (1998–2008) of each of the investment companies served by Vanguard.
Peter Mahoney
Born in 1974. Principal occupation(s) during the past five years and other experience: principal of Vanguard. Controller (2015–present) of each of the investment companies served by Vanguard. Head of International Fund Services (2008–2014) at Vanguard.
Anne E. Robinson
Born in 1970. Principal occupation(s) during the past five years and other experience: general counsel (2016–present) of Vanguard. Secretary (2016–present) of Vanguard and of each of the investment companies served by Vanguard. Managing director (2016–present) of Vanguard. Director and senior vice president (2016–2018) of Vanguard Marketing Corporation. Managing director and general counsel of Global Cards and Consumer Services (2014–2016) at Citigroup. Counsel (2003–2014) at American Express.
Michael Rollings
Born in 1963. Principal occupation(s) during the past five years and other experience: finance director (2017–present) and treasurer (2017) of each of the investment companies served by Vanguard. Managing director (2016–present) of Vanguard. Chief financial officer (2016–present) of Vanguard. Director (2016–present) of Vanguard Marketing Corporation. Executive vice president and chief financial officer (2006–2016) of MassMutual Financial Group.
John E. Schadl
Born in 1972. Principal occupation(s) during the past five years and other experience: principal of Vanguard. Chief compliance officer (2019–present) of Vanguard and of each of the investment companies served by Vanguard. Assistant vice president (May 2019–present) of Vanguard Marketing Corporation.
Vanguard Senior Management Team
Joseph Brennan | Chris D. McIsaac |
Mortimer J. Buckley | James M. Norris |
Gregory Davis | Thomas M. Rampulla |
John James | Karin A. Risi |
Martha G. King | Anne E. Robinson |
John T. Marcante | Michael Rollings |
| | 
|
| | |
| | P.O. Box 2600 Valley Forge, PA 19482-2600 |
Connect with Vanguard® > vanguard.com
Fund Information > 800-662-7447
Direct Investor Account Services > 800-662-2739
Institutional Investor Services > 800-523-1036
Text Telephone for People
Who Are Deaf or Hard of Hearing > 800-749-7273
This material may be used in conjunction with the offering of shares of any Vanguard fund only if preceded or accompanied by the fund’s current prospectus.
All comparative mutual fund data are from Morningstar, Inc., unless otherwise noted.
You can obtain a free copy of Vanguard’s proxy voting guidelines by visiting vanguard.com/proxyreporting or by calling Vanguard at 800-662-2739. The guidelines are also available from the SEC’s website, www.sec.gov. In addition, you may obtain a free report on how your fund voted the proxies for securities it owned during the 12 months ended June 30. To get the report, visit either vanguard.com/proxyreporting or www.sec.gov.
You can review information about your fund on the SEC’s website, and you can receive copies of this information, for a fee, by sending a request via email addressed to publicinfo@sec.gov.
Source for Bloomberg Barclays indexes: Bloomberg Index Services Limited. Copyright 2019, Bloomberg. All rights reserved.
| | © 2019 The Vanguard Group, Inc. |
| | All rights reserved. |
| | Vanguard Marketing Corporation, Distributor. |
| | |
| | Q43940 102019 |
Item 2: Code of Ethics. The Registrant has adopted a code of ethics that applies to the Registrant’s principal executive officer, principal financial officer, principal accounting officer or controller or persons performing similar functions. The Code of Ethics was amended during the reporting period covered by this report to make certain technical, non-material changes.
Item 3: Audit Committee Financial Expert. All members of the Audit Committee have been determined by the Registrant’s Board of Trustees to be Audit Committee Financial Experts and to be independent: F. Joseph Loughrey, Mark Loughridge, Sarah Bloom Raskin, and Peter F. Volanakis.
Item 4: Principal Accountant Fees and Services.
(a) Audit Fees.
Audit Fees of the Registrant.
Fiscal Year Ended August 31, 2019: $685,000
Fiscal Year Ended August 31, 2018: $638,000
Aggregate Audit Fees of Registered Investment Companies in the Vanguard Group.
Fiscal Year Ended August 31, 2019: $9,568,215
Fiscal Year Ended August 31, 2018: $9,734,277
Includes fees billed in connection with audits of the Registrant, other registered investment companies in the Vanguard complex, The Vanguard Group, Inc., and Vanguard Marketing Corporation.
(b) Audit-Related Fees.
Fiscal Year Ended August 31, 2019: $3,012,031
Fiscal Year Ended August 31, 2018: $5,581,336
Includes fees billed in connection with assurance and related services provided to the Registrant, other registered investment companies in the Vanguard complex, The Vanguard Group, Inc., and Vanguard Marketing Corporation.
(c) Tax Fees.
Fiscal Year Ended August 31, 2019: $357,238
Fiscal Year Ended August 31, 2018: $347,985
Includes fees billed in connection with tax compliance, planning, and advice services provided to the Registrant, other registered investment companies in the Vanguard complex, The Vanguard Group, Inc., and Vanguard Marketing Corporation.
(d) All Other Fees.
Fiscal Year Ended August 31, 2019: $0
Fiscal Year Ended August 31, 2018: $0
Includes fees billed for services related to tax reported information provided to the Registrant, other registered investment companies in the Vanguard complex, The Vanguard Group, Inc., and Vanguard Marketing Corporation.
(e) (1) Pre-Approval Policies. The policy of the Registrant’s Audit Committee is to consider, and, if appropriate, approve before the principal accountant is engaged for such services, all specific audit and non-audit services provided to: the Registrant, other registered investment companies in the Vanguard complex, The Vanguard Group, Inc., and entities controlled by The Vanguard Group, Inc. that provide ongoing services to the Registrant. In making a determination, the Audit Committee considers whether the services are consistent with maintaining the principal accountant’s independence.
In the event of a contingency situation in which the principal accountant is needed to provide services in between scheduled Audit Committee meetings, the Chairman of the Audit Committee would be called on to consider and, if appropriate, pre-approve audit or permitted non-audit services in an amount sufficient to complete services through the next Audit Committee meeting, and to determine if such services would be consistent with maintaining the accountant’s independence. At the next scheduled Audit Committee meeting, services and fees would be presented to the Audit Committee for formal consideration, and, if appropriate, approval by the entire Audit Committee. The Audit Committee would again consider whether such services and fees are consistent with maintaining the principal accountant’s independence.
The Registrant’s Audit Committee is informed at least annually of all audit and non-audit services provided by the principal accountant to the Vanguard complex, whether such services are provided to: the Registrant, other registered investment companies in the Vanguard complex, The Vanguard Group, Inc., or other entities controlled by The Vanguard Group, Inc. that provide ongoing services to the Registrant.
(2) No percentage of the principal accountant’s fees or services were approved pursuant to the waiver provision of paragraph (c)(7)(i)(C) of Rule 2-01 of Regulation S-X.
(f) For the most recent fiscal year, over 50% of the hours worked under the principal accountant’s engagement were not performed by persons other than full-time, permanent employees of the principal accountant.
(g) Aggregate Non-Audit Fees.
Fiscal Year Ended August 31, 2019: $357,238
Fiscal Year Ended August 31, 2018: $347,985
Includes fees billed for non-audit services provided to the Registrant, other registered investment companies in the Vanguard complex, The Vanguard Group, Inc., and Vanguard Marketing Corporation.
(h) For the most recent fiscal year, the Audit Committee has determined that the provision of all non-audit services was consistent with maintaining the principal accountant’s independence.
Item 5: Audit Committee of Listed Registrants.
The Registrant is a listed issuer as defined in rule 10A-3 under the Securities Exchange Act of 1934 (“Exchange Act”). The Registrant has a separately-designated standing audit committee established in accordance with Section 3(a)(58)(A) of the Exchange Act. The Registrant’s audit committee members are: F. Joseph Loughrey, Mark Loughridge, Sarah Bloom Raskin, and Peter F. Volanakis.
Item 6: Investments.
Not applicable.
Item 7: Disclosure of Proxy Voting Policies and Procedures for Closed-End Management Investment Companies.
Not applicable.
Item 8: Portfolio Managers of Closed-End Management Investment Companies.
Not applicable.
Item 9: Purchase of Equity Securities by Closed-End Management Investment Company and Affiliated Purchasers.
Not applicable.
Item 10: Submission of Matters to a Vote of Security Holders.
Not applicable.
Item 11: Controls and Procedures.
(a) Disclosure Controls and Procedures. The Principal Executive and Financial Officers concluded that the Registrant’s Disclosure Controls and Procedures are effective based on their evaluation of the Disclosure Controls and Procedures as of a date within 90 days of the filing date of this report.
(b) Internal Control Over Financial Reporting. There were no significant changes in Registrant’s Internal Control Over Financial Reporting or in other factors that could significantly affect this control subsequent to the date of the evaluation, including any corrective actions with regard to significant deficiencies and material weaknesses.
Item 12: Disclosure of Securities Lending Activities for Closed-End Management
Investment Companies.
Not applicable.
Item 13: Exhibits.
(a) Code of Ethics.
(b) Certifications.
Pursuant to the requirements of the Securities Exchange Act of 1934 and the Investment Company Act of 1940, the registrant has duly caused this report to be signed on its behalf by the undersigned, thereunto duly authorized.
| VANGUARD WORLD FUND | |
| | |
BY: | /s/ MORTIMER J. BUCKLEY* | |
| | |
| MORTIMER J. BUCKLEY | |
| CHIEF EXECUTIVE OFFICER | |
Date: October 21, 2019
Pursuant to the requirements of the Securities Exchange Act of 1934 and the Investment Company Act of 1940, this report has been signed below by the following persons on behalf of the registrant and in the capacities and on the dates indicated.
| VANGUARD WORLD FUND | |
| | |
BY: | /s/ MORTIMER J. BUCKLEY* | |
| | |
| MORTIMER J. BUCKLEY | |
| CHIEF EXECUTIVE OFFICER | |
Date: October 21, 2019
| VANGUARD WORLD FUND | |
| | |
BY: | /s/ JOHN BENDL* | |
| | |
| JOHN BENDL | |
| CHIEF FINANCIAL OFFICER | |
Date: October 21, 2019
* By: /s/ Anne E. Robinson
Anne E. Robinson, pursuant to a Power of Attorney filed on January 18, 2018 (see file Number 33-32216) and a Power of Attorney filed on October 30, 2019 (see file Number 811-02554), Incorporated by Reference.