UNITED STATES
SECURITIES AND EXCHANGE COMMISSION
Washington, D.C. 20549
FORM N-CSR
CERTIFIED SHAREHOLDER REPORT
OF
REGISTERED MANAGEMENT INVESTMENT COMPANIES
Investment Company Act file number: 811-01027
| Name of Registrant: | Vanguard World Fund |
| Address of Registrant: | P.O. Box 2600 |
| | Valley Forge, PA 19482 |
| Name and address of agent for service: | Anne E. Robinson, Esquire |
| | P.O. Box 876 |
| | Valley Forge, PA 19482 |
Registrant’s telephone number, including area code: (610) 669-1000
Date of fiscal year end: August 31
Date of reporting period: September 1, 2019—August 31, 2020
Item 1: Reports to Shareholders

Annual Report | August 31, 2020 Vanguard U.S. Growth Fund |
See the inside front cover for important information about access to your fund’s annual and semiannual shareholder reports. |
Important information about access to shareholder reports
Beginning on January 1, 2021, as permitted by regulations adopted by the Securities and Exchange Commission, paper copies of your fund’s annual and semiannual shareholder reports will no longer be sent to you by mail, unless you specifically request them. Instead, you will be notified by mail each time a report is posted on the website and will be provided with a link to access the report.
If you have already elected to receive shareholder reports electronically, you will not be affected by this change and do not need to take any action. You may elect to receive shareholder reports and other communications from the fund electronically by contacting your financial intermediary (such as a broker-dealer or bank) or, if you invest directly with the fund, by calling Vanguard at one of the phone numbers on the back cover of this report or by logging on to vanguard.com.
You may elect to receive paper copies of all future shareholder reports free of charge. If you invest through a financial intermediary, you can contact the intermediary to request that you continue to receive paper copies. If you invest directly with the fund, you can call Vanguard at one of the phone numbers on the back cover of this report or log on to vanguard.com. Your election to receive paper copies will apply to all the funds you hold through an intermediary or directly with Vanguard.
| Contents |
| |
| Your Fund’s Performance at a Glance | 1 |
| |
| Advisors’ Report | 2 |
| |
| About Your Fund’s Expenses | 8 |
| |
| Performance Summary | 10 |
| |
| Financial Statements | 12 |
| |
| Liquidity Risk Management | 31 |
Please note: The opinions expressed in this report are just that—informed opinions. They should not be considered promises or advice. Also, please keep in mind that the information and opinions cover the period through the date on the front of this report. Of course, the risks of investing in your fund are spelled out in the prospectus.
Your Fund’s Performance at a Glance
● Vanguard U.S. Growth Fund returned 58.01% for Investor Shares and 58.17% for Admiral Shares for the 12 months ended August 31, 2020. The fund outperformed its benchmark, which returned 44.34%.
● Growth stocks outperformed value stocks and large-capitalization stocks outperformed mid- and small-cap stocks. The U.S. stock market rebounded more strongly than both developed markets outside the United States and emerging markets.
● Amid some easing in trade tensions and continuing accommodative monetary policies across much of the world, a number of stock market indexes climbed to record highs in February. Stocks plummeted worldwide during the early stages of the coronavirus in March, but the unprecedented scale of the response from policymakers, the start of trials for vaccines and treatments, and the easing of some pandemic-related restrictions helped lift investor sentiment.
● Ten of the fund’s 11 industry sectors contributed positively to performance. Consumer discretionary and information technology stocks helped performance the most. Financials was the fund’s only detractor.
Market Barometer
| | | Average Annual Total Returns |
| | | Periods Ended August 31, 2020 |
| | One Year | Three Years | Five Years |
| Stocks | | | |
| Russell 1000 Index (Large-caps) | 22.50% | 14.58% | 14.31% |
| Russell 2000 Index (Small-caps) | 6.02 | 5.03 | 7.65 |
| Russell 3000 Index (Broad U.S. market) | 21.44 | 13.95 | 13.86 |
| FTSE All-World ex US Index (International) | 8.78 | 2.92 | 6.00 |
| Bonds | | | |
| Bloomberg Barclays U.S. Aggregate Bond Index | | | |
| (Broad taxable market) | 6.47% | 5.09% | 4.33% |
| Bloomberg Barclays Municipal Bond Index | | | |
| (Broad tax-exempt market) | 3.24 | 4.09 | 3.99 |
| FTSE Three-Month U.S. Treasury Bill Index | 1.18 | 1.67 | 1.15 |
| CPI | | | |
| Consumer Price Index | 1.31% | 1.92% | 1.75% |
Advisors’ Report
For the 12 months ended August 31, 2020, Vanguard U.S. Growth Fund returned 58.01% for Investor Shares and 58.17% for Admiral Shares. It outperformed its benchmark, the Russell 1000 Growth Index, which returned 44.34%. Your fund is managed by five advisors. The use of multiple independent advisors enhances the fund’s diversification by providing exposure to distinct yet complementary investment approaches. It is not uncommon for different advisors to have different views about individual securities or the broader investment environment.
The table on page 7 presents the advisors, the percentage and amount of fund assets that each manages, and brief descriptions of their investment strategies. Each advisor has also prepared a discussion of the investment environment during the fiscal year and of how the portfolio’s positioning reflects this assessment. These reports were prepared on September 16, 2020.
Jennison Associates LLC
Portfolio Managers:
Kathleen A. McCarragher, Managing Director
Blair A. Boyer, Managing Director
Markets were extremely volatile over the period because of the coronavirus pandemic and U.S.-China trade discord. Stocks peaked in February, then dropped dramatically as the COVID-19 outbreak spread around the globe, disrupting markets and life everywhere. Markets rebounded rapidly in the period’s final months, but the pandemic’s economic damage continued.
In consumer discretionary, our portfolio benefited from our position in Tesla, which surged on growing demand, solid production, increased capacity, and strong execution. Amazon also aided performance as it continued to benefit from economies of scale and its platform-based business model.
In information technology, our portfolio benefited from the following holdings:
● Apple, which saw rapid growth in service subscriptions and favorable prospects for upcoming product cycles.
● Shopify, which benefited from its cloud-based infrastructure tools that increasingly address the growing demand for omni-channel e-commerce.
● NVIDIA, which took advantage of its graphics semiconductor expertise in key high-growth markets, including gaming, automotive, high-performance computing, and cloud and enterprise.
In communication services, our portfolio benefited from our position in Netflix, which enhanced its long-term competitive position with the industry’s largest commitment to exclusive, original content. We also benefited from exposure to Facebook, which continues to attract advertisers.
Our health care positions advanced but lagged the benchmark in this sector. Medical device makers Boston Scientific
and Edwards Lifesciences performed weakly because of concerns that elective procedures could be postponed because of the pandemic. We eliminated the position in Edwards as a result.
In industrials, we eliminated our position in Boeing, as the 737 jet recertification process took longer than anticipated and COVID-19-restricted air travel compromised the financial health of airlines. We also closed positions in commercial aircraft manufacturers Airbus and Safran.
We believe our portfolio holds fundamentally strong companies with solid long-term growth prospects. Many holdings stand to benefit from the digital transformation of the global economy. This transformation is accelerating, as social distancing and shelter-in-place directives necessitated by the pandemic have underscored the value, utility, and resilience of e-commerce, digitally enabled payment, cloud computing, and streaming business models.
Wellington Management Company LLP
Portfolio Manager:
Andrew J. Shilling, CFA, Senior Managing Director
Our investment approach is intended to produce a portfolio that seeks to outperform growth benchmarks and, in the longer term, the broader market. We employ proprietary fundamental research and a rigorous valuation discipline to invest in large-capitalization companies that have attractive growth characteristics. Because we believe that investors often underestimate the potential for growth, our approach identifies companies with a clear competitive advantage that will enable them to sustain above-average growth over the long term.
For the 12-month period ended August 31, 2020, U.S. equities, as measured by the Standard & Poor’s 500 Index, gained 21.94%. Growth stocks outperformed value stocks and large-capitalization companies outpaced their smaller-cap counterparts.
Notable contributors to performance included DocuSign, an electronic signature solutions company, and Advanced Micro Devices, a graphics chip provider. Boeing, the multinational aerospace company, was another notable contributor. We eliminated our position in January in favor of other investments.
Detractors included not owning Tesla, a manufacturer of fully electric vehicles and energy storage systems; an underweight allocation to Apple, a leader in mobile devices and digital content distribution; and an overweight position in FleetCor Technologies, a provider of fuel cards and payment services to commercial truck fleets.
Our portfolio’s biggest sector overweights were in information technology, industrials, and financials. Our largest underweights were in health care, consumer discretionary, and communication services.
We remain true to our process, seeking to invest in companies with competitive advantages, strong balance sheets, experienced and proven management, and the ability to sustain above-average growth.
Baillie Gifford Overseas Ltd.
Portfolio Managers:
Tom Slater, Investment Manager, Partner
Gary Robinson, Investment Manager, Partner
The 12 months under review saw the greatest economic and social adjustments that most of us have seen in our lifetimes. COVID-19 has forced governments to shut down large parts of their economies and restrict the movement of whole populations, and launch huge stimulus packages in response to the economic fallout.
Stock markets have responded to the acceleration of trends that had been under way before the pandemic. These include the shift to online and the reimagination of enterprise in the cloud.
Several of the portfolio’s online retailers, such as e-commerce platforms Amazon and Shopify and the home furnishings retailer Wayfair, were significant contributors to performance amid unprecedented demand for their services. But the single largest contributor was Tesla. Tesla’s operations proved to be more robust than many expected. With its cars rolling off production lines in volume, this company is beginning to manufacture its peerless electric vehicles at scale. It was alone among global carmakers in increasing sales after COVID-19 emerged.
Not all holdings fared so well. Two innovative medical equipment manufacturers, Novocure and Glaukos, faced temporary sales disruption, which weighed on their share prices.
The pandemic has made us question long-standing traditions and has accelerated the adoption of new service and business models. There are many reasons to be optimistic about truly disruptive growth companies and few of the reasons have much to do with valuation or viruses. We enter the next 12 months with a robust pipeline of investment ideas, and we are excited to find out which of these will earn a place in the portfolio.
Vanguard Quantitative Equity Group
Portfolio Managers:
James P. Stetler
Binbin Guo, Principal, Head of Alpha Equity Investments
Amid some easing in trade tensions and continuing accommodative monetary policies across much of the world, a number of stock market indexes climbed to record highs in February. Then, as the
coronavirus began to spread outside of China, lockdowns, the shuttering of nonessential businesses, and travel restrictions in many countries led to a swift, sharp downturn in global economic activity, especially in the services sector, and a spike in unemployment.
Initially, stocks plummeted worldwide, but the unprecedented scale of the response from policymakers, the start of trials for COVID-19 vaccines and treatments, and the easing of some pandemic-related restrictions helped lift investor sentiment. The U.S. stock market rebounded more strongly than both developed markets outside the United States and emerging markets. Large-capitalization stocks outperformed their mid- and small-cap counterparts, and growth outpaced value.
Although it’s important to understand how overall performance is affected by such macro factors, our approach to investing focuses on specific fundamentals, not technical analysis of stock price movements. We believe that attractive stocks exhibit five key characteristics: high quality—healthy balance sheets and steady cash-flow generation; effective management decisions—sound investment policies that favor internal over external funding; consistent earnings growth— ability to grow earnings year after year; strong market sentiment—market confirmation of our view; and reasonable valuation—shares that are not overpriced.
Using these five themes, we generate a daily composite stock ranking. We then monitor our portfolio based on those rankings and adjust when appropriate to maximize expected returns while minimizing exposure to risks that our research indicates don’t improve returns (such as industry selection and other risks relative to our benchmark).
Over the 12-month period ended August 31, 2020, our quality and sentiment models contributed to our relative performance while our valuation, management decisions, and growth models detracted.
Our strongest sector results were in information technology, primarily because of strong stock selection in IT services companies. Our portfolio also benefited from our positions in energy and materials; the latter was helped by our underweight to construction services companies. Stock selection in consumer discretionary, financials, and industrials detracted the most.
At the stock level, top contributors included overweight positions in IT companies— Advanced Micro Devices, Square, and Fortinet—as well as an overweight to Bristol-Myers Squibb in the health care sector. An underweight to NVIDIA in the information technology sector was the biggest detractor. Overweights to industrial companies SpiritAero Systems and Delta Air Lines and to consumer discretionary companies Norwegian Cruise Line and H&R Block also detracted.
Jackson Square Partners, LLC
Portfolio Managers:
Jeffrey S. Van Harte, CFA,
Chairman and Chief Investment Officer
Christopher J. Bonavico, CFA,
Equity Analyst
Christopher M. Ericksen, CFA,
Equity Analyst
Daniel J. Prislin, CFA,
Equity Analyst
The global pandemic and the significant market volatility that came with it dominated headlines throughout much of the period. We took advantage of the sharp COVID-19-related sell-off to purchase a handful of companies that we had admired but that had previously not fit our valuation discipline. We believe all these companies possess exceptional competitive moats across a wide range of industries.
Performance was driven by our stock selection. Our largest relative contributor to performance during the period was a cloud communications platform, Twilio. We believe that instant digital communication with customers and employees across any medium in any geography is a hugely complex problem that businesses increasingly need to solve. As the leading communications-as-a-service platform, Twilio is well positioned to be the primary beneficiary of that trend. The addressable market is worth tens of billions of procurement dollars and is essentially untapped by Twilio’s still negligible penetration. We believe that penetration will expand meaningfully and drive consistently high revenue growth for many years.
Constellation Brands, which produces and markets beer, wine, and spirits, was a detractor during the period. Investors became concerned about the company’s debt profile on its balance sheet as well as several unexpected anti-business initiatives from the Mexican government that hurt Constellation. We sold our position in favor of more attractive opportunities.
We remain committed to our long-held investment philosophy to own what we view as strong secular-growth companies with solid business models that have the potential to deliver shareholder value in a variety of market environments.
Vanguard U.S. Growth Fund Investment Advisors
| | Fund Assets Managed | | |
| Investment Advisor | % | $ Million | | Investment Strategy |
| Jennison Associates LLC | 27 | 10,969 | | Uses a research-driven, fundamental investment |
| | | | | approach that relies on in-depth company knowledge |
| | | | | gleaned through meetings with management, |
| | | | | customers, and suppliers. |
| Wellington Management | 26 | 10,318 | | Employs proprietary fundamental research and a |
| Company LLP | | | | rigorous valuation discipline in an effort to invest in |
| | | | | high-quality, large-cap, sustainable-growth |
| | | | | companies. The investment approach is based on the |
| | | | | belief that stock prices often overreact to short-term |
| | | | | trends and that bottom-up, intensive research |
| | | | | focused on longer-term fundamentals can be used to |
| | | | | identify stocks that will outperform the market over |
| | | | | time. |
| Baillie Gifford Overseas Ltd. | 18 | 7,409 | | Uses an active, bottom-up approach to identify |
| | | | | exceptional growth companies and own them for |
| | | | | long periods. Such companies have special cultures, |
| | | | | address large market opportunities, and enjoy |
| | | | | sustainable competitive advantages. This approach is |
| | | | | based on the belief that these factors drive long-term |
| | | | | returns, and a long investment horizon enables the |
| | | | | inherent asymmetry of equity market returns to be |
| | | | | captured. |
| Vanguard Quantitative Equity | 14 | 5,461 | | Employs a quantitative fundamental management |
| Group | | | | approach, using models that assess valuation, market |
| | | | | sentiment, earnings quality and growth, and |
| | | | | management decisions of companies versus their |
| | | | | peers. |
| Jackson Square Partners, LLC | 13 | 5,346 | | Uses a bottom-up approach, seeking companies that |
| | | | | have large end-market potential, dominant business |
| | | | | models, and strong free cash flow generation that is |
| | | | | attractively priced compared with the intrinsic value |
| | | | | of the securities. |
| Cash Investments | 2 | 767 | | These short-term reserves are invested by Vanguard |
| | | | | in equity index products to simulate investment in |
| | | | | stocks. Each advisor may also maintain a modest |
| | | | | cash position. |
About Your Fund’s Expenses
As a shareholder of the fund, you incur ongoing costs, which include costs for portfolio management, administrative services, and shareholder reports (like this one), among others. Operating expenses, which are deducted from a fund’s gross income, directly reduce the investment return of the fund.
A fund’s expenses are expressed as a percentage of its average net assets. This figure is known as the expense ratio. The following examples are intended to help you understand the ongoing costs (in dollars) of investing in your fund and to compare these costs with those of other mutual funds. The examples are based on an investment of $1,000 made at the beginning of the period shown and held for the entire period.
The accompanying table illustrates your fund’s costs in two ways:
● Based on actual fund return. This section helps you to estimate the actual expenses that you paid over the period. The ”Ending Account Value“ shown is derived from the fund‘s actual return, and the third column shows the dollar amount that would have been paid by an investor who started with $1,000 in the fund. You may use the information here, together with the amount you invested, to estimate the expenses that you paid over the period.
To do so, simply divide your account value by $1,000 (for example, an $8,600 account value divided by $1,000 = 8.6), then multiply the result by the number given for your fund under the heading ”Expenses Paid During Period.“
● Based on hypothetical 5% yearly return. This section is intended to help you compare your fund‘s costs with those of other mutual funds. It assumes that the fund had a yearly return of 5% before expenses, but that the expense ratio is unchanged. In this case—because the return used is not the fund’s actual return—the results do not apply to your investment. The example is useful in making comparisons because the Securities and Exchange Commission requires all mutual funds to calculate expenses based on a 5% return. You can assess your fund’s costs by comparing this hypothetical example with the hypothetical examples that appear in shareholder reports of other funds.
Note that the expenses shown in the table are meant to highlight and help you compare ongoing costs only and do not reflect transaction costs incurred by the fund for buying and selling securities. Further, the expenses do not include any purchase, redemption, or account service fees described in the fund prospectus. If such fees were applied to your account, your costs would be higher. Your fund does not carry a “sales load.”
The calculations assume no shares were bought or sold during the period. Your actual costs may have been higher or lower, depending on the amount of your investment and the timing of any purchases or redemptions.
You can find more information about the fund’s expenses, including annual expense ratios, in the Financial Statements section of this report. For additional information on operating expenses and other shareholder costs, please refer to your fund’s current prospectus.
Six Months Ended August 31, 2020
| | Beginning | Ending | Expenses |
| | Account Value | Account Value | Paid During |
| U.S. Growth Fund | 2/29/2020 | 8/31/2020 | Period |
| Based on Actual Fund Return | | | |
| Investor Shares | $1,000.00 | $1,471.64 | $2.42 |
| Admiral™ Shares | 1,000.00 | 1,472.41 | 1.80 |
| Based on Hypothetical 5% Yearly Return | | | |
| Investor Shares | $1,000.00 | $1,023.18 | $1.98 |
| Admiral Shares | 1,000.00 | 1,023.68 | 1.48 |
The calculations are based on expenses incurred in the most recent six-month period. The fund’s annualized six-month expense ratios for that period are 0.39% for Investor Shares and 0.29% for Admiral Shares. The dollar amounts shown as “Expenses Paid” are equal to the annualized expense ratio multiplied by the average account value over the period, multiplied by the number of days in the most recent six-month period, then divided by the number of days in the most recent 12-month period (184/366).
U.S. Growth Fund
Performance Summary
All of the returns in this report represent past performance, which is not a guarantee of future results that may be achieved by the fund. (Current performance may be lower or higher than the performance data cited. For performance data current to the most recent month-end, visit our website at vanguard.com/performance.) Note, too, that both investment returns and principal value can fluctuate widely, so an investor’s shares, when sold, could be worth more or less than their original cost. The returns shown do not reflect taxes that a shareholder would pay on fund distributions or on the sale of fund shares.
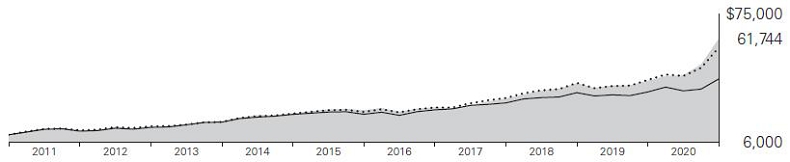
Cumulative Performance: August 31, 2010, Through August 31, 2020
Initial Investment of $10,000
| | | | | | | | | Final Value |
| | | One | | Five | | Ten | | of a $50,000 |
| | | Year | | Years | | Years | | Investment |
| U.S. Growth Fund Admiral Shares | | 58.17% | | 21.81% | | 20.12% | | $312,799 |
| Russell 1000 Growth Index | | 44.34 | | 20.66 | | 19.02 | | 285,172 |
Dow Jones U.S. Total Stock Market Float Adjusted Index | | 21.20 | | 13.77 | | 14.88 | | 200,263 |
See Financial Highlights for dividend and capital gains information.
U.S. Growth Fund
Fund Allocation
As of August 31, 2020
| Communication Services | | | 12.0 | % |
| Consumer Discretionary | | | 21.8 | |
| Consumer Staples | | | 1.5 | |
| Financials | | | 3.8 | |
| Health Care | | | 10.0 | |
| Industrials | | | 5.1 | |
| Information Technology | | | 44.0 | |
| Materials | | | 0.6 | |
| Other | | | 0.0 | |
| Real Estate | | | 1.1 | |
| Utilities | | | 0.1 | |
The table reflects the fund’s investments, except for short-term investments and derivatives. Sector categories are based on the Global Industry Classification Standard ("GICS"), except for the "Other" category (if applicable), which includes securities that have not been provided a GICS classification as of the effective report-ing period.
The Global Industry Classification Standard (“GICS”) was developed by and is the exclusive property and a service mark of MSCI Inc. (“MSCI”) and Standard and Poor’s, a division of McGraw-Hill Companies, Inc. (“S&P”), and is licensed for use by Vanguard. Neither MSCI, S&P nor any third party involved in making or compiling the GICS or any GICS classification makes any express or implied warranties or representations with respect to such standard or classification (or the results to be obtained by the use thereof), and all such parties hereby expressly disclaim all warranties of originality, accuracy, completeness, merchantability or fitness for a particular purpose with respect to any such standard or classification. Without limiting any of the foregoing, in no event shall MSCI, S&P, any of its affiliates or any third party involved in making or compiling the GICS or any GICS classification have any liability for any direct, indirect, special, punitive, consequential or any other damages (including lost profits) even if notified of the possibility of such damages.
U.S. Growth Fund
Financial Statements
Schedule of Investments
As of August 31, 2020
The fund files its complete schedule of portfolio holdings with the Securities and Exchange Commission (SEC) for the first and third quarters of each fiscal year as an exhibit to its reports on Form N-PORT. The fund’s Form N-PORT reports are available on the SEC’s website at www.sec.gov.
| | | | | | | Market | |
| | | | | | | Value• | |
| | | | | Shares | | ($000 | ) |
| Common Stocks (97.4%) | | | | | |
| Communication Services (11.8%) | | | | | |
| * | | Facebook Inc. Class A | | 3,544,092 | | 1,039,128 | |
| * | | Alphabet Inc. Class C | | 595,632 | | 973,370 | |
| * | | Netflix Inc. | | 1,740,854 | | 921,887 | |
| * | | Alphabet Inc. Class A | | 329,417 | | 536,795 | |
| * | | Match Group Inc. | | 3,289,027 | | 367,319 | |
| * | | Charter Communications Inc. Class A | | 394,234 | | 242,694 | |
| * | | Roku Inc. | | 851,641 | | 147,743 | |
| | | Tencent Holdings Ltd. | | 2,050,810 | | 140,108 | |
| | | Spotify Technology SA | | 466,084 | | 131,510 | |
| * | | Zillow Group Inc. Class A | | 852,459 | | 72,698 | |
| * | | ZoomInfo Technologies Inc. Class A | | 1,152,019 | | 44,721 | |
| | | Activision Blizzard Inc. | | 410,907 | | 34,319 | |
| * | | Zynga Inc. Class A | | 3,258,114 | | 29,518 | |
| * | | Take-Two Interactive Software Inc. | | 129,734 | | 22,209 | |
| * | | Eventbrite Inc. Class A | | 1,257,484 | | 13,518 | |
| * | | Electronic Arts Inc. | | 86,377 | | 12,047 | |
| | | | | | | 4,729,584 | |
| Consumer Discretionary (21.6%) | | | | | |
| * | | Amazon.com Inc. | | 940,903 | | 3,247,019 | |
| * | | Tesla Inc. | | 4,387,110 | | 2,186,185 | |
| * | | Wayfair Inc. | | 1,558,945 | | 462,321 | |
| | | Home Depot Inc. | | 1,437,696 | | 409,801 | |
| | | NIKE Inc. Class B | | 3,011,719 | | 336,981 | |
| | | Lululemon Athletica Inc. | | 846,968 | | 318,180 | |
| | | MercadoLibre Inc. | | 176,178 | | 205,880 | |
| * | | Alibaba Group Holding Ltd. ADR | | 713,427 | | 204,775 | |
| * | | Chegg Inc. | | 2,656,015 | | 195,855 | |
| * | | Carvana Co. Class A | | 674,273 | | 145,616 | |
| | | Starbucks Corp. | | 1,415,347 | | 119,554 | |
| | | Kering SA | | 189,825 | | 116,471 | |
| * | | Chewy Inc. | | 1,861,186 | | 113,663 | |
| | | TJX Cos. Inc. | | 1,854,910 | | 101,630 | |
| * | | O’Reilly Automotive Inc. | | 182,826 | | 85,129 | |
| * | | Vroom Inc. | | 1,140,785 | | 78,292 | |
| * | | Burlington Stores Inc. | | 310,721 | | 61,190 | |
| * | | Stitch Fix Inc. Class A | | 1,712,098 | | 41,347 | |
| | | eBay Inc. | | 707,919 | | 38,780 | |
| | | Dollar General Corp. | | 144,920 | | 29,256 | |
| | | Best Buy Co. Inc. | | 240,457 | | 26,669 | |
| | | Lowe’s Cos. Inc. | | 156,383 | | 25,755 | |
| | | Yum! Brands Inc. | | 232,580 | | 22,293 | |
| | | Tractor Supply Co. | | 136,025 | | 20,245 | |
| * | | NVR Inc. | | 4,593 | | 19,145 | |
| | | Target Corp. | | 124,390 | | 18,809 | |
| | | Hanesbrands Inc. | | 1,088,458 | | 16,643 | |
| * | | Etsy Inc. | | 88,691 | | 10,616 | |
| | | H&R Block Inc. | | 703,682 | | 10,203 | |
| * | | Booking Holdings Inc. | | 4,906 | | 9,373 | |
| | | Yum China Holdings Inc. | | 103,331 | | 5,963 | |
| | | Domino’s Pizza Inc. | | 11,298 | | 4,620 | |
| * | | frontdoor Inc. | | 96,850 | | 4,220 | |
| * | | Planet Fitness Inc. Class A | | 64,325 | | 3,910 | |
| * | | LKQ Corp. | | 108,809 | | 3,454 | |
| | | Service Corp. International | | 70,011 | | 3,196 | |
| | | Polaris Inc. | | 30,346 | | 3,066 | |
| * | | Peloton Interactive Inc. Class A | | 39,424 | | 3,023 | |
| | | | | | | 8,709,128 | |
| Consumer Staples (1.3%) | | | | | |
| | | Constellation Brands Inc. Class A | | 822,724 | | 151,776 | |
| * | | Monster Beverage Corp. | | 1,351,946 | | 113,374 | |
| | | Altria Group Inc. | | 854,617 | | 37,381 | |
| | | Clorox Co. | | 143,986 | | 32,181 | |
| | | Procter & Gamble Co. | | 220,141 | | 30,452 | |
| | | Campbell Soup Co. | | 528,741 | | 27,817 | |
| | | Hershey Co. | | 159,512 | | 23,710 | |
| | | Costco Wholesale Corp. | | 55,139 | | 19,170 | |
| | | PepsiCo Inc. | | 130,176 | | 18,232 | |
| | | Sysco Corp. | | 189,598 | | 11,402 | |
| * | | Sprouts Farmers Market Inc. | | 438,574 | | 10,241 | |
| | | Kellogg Co. | | 135,435 | | 9,604 | |
| | | Coca-Cola Co. | | 167,007 | | 8,272 | |
| * | | Herbalife Nutrition Ltd. | | 72,909 | | 3,583 | |
| | | Casey’s General Stores Inc. | | 19,572 | | 3,481 | |
| * | | Pilgrim’s Pride Corp. | | 110,934 | | 1,775 | |
| | | | | | | 502,451 | |
U.S. Growth Fund
| | | | | | | Market | |
| | | | | | | Value• | |
| | | | | Shares | | ($000 | ) |
| Financials (3.5%) | | | | | |
| | | S&P Global Inc. | | 634,996 | | 232,675 | |
| | | MarketAxess Holdings Inc. | | 364,687 | | 177,216 | |
| | | Progressive Corp. | | 1,823,782 | | 173,332 | |
| | | KKR & Co. Inc. | | 4,629,398 | | 165,825 | |
| | | First Republic Bank | | 1,041,848 | | 117,635 | |
| | | American Express Co. | | 973,068 | | 98,854 | |
| | | Goldman Sachs Group Inc. | | 469,586 | | 96,204 | |
| | | Marsh & McLennan Cos. Inc. | | 641,211 | | 73,682 | |
| * | | Markel Corp. | | 62,216 | | 67,618 | |
| *,^ | | Lemonade Inc. | | 941,310 | | 55,255 | |
| | | Blackstone Group LP Class A | | 950,138 | | 50,310 | |
| | | Interactive Brokers Group Inc. | | 925,104 | | 49,049 | |
| | | LPL Financial Holdings Inc. | | 211,836 | | 17,405 | |
| | | Lazard Ltd. Class A | | 316,079 | | 10,010 | |
| | | Synchrony Financial | | 310,554 | | 7,705 | |
| | | Virtu Financial Inc. Class A | | 205,897 | | 5,318 | |
| | | Cboe Global Markets Inc. | | 43,929 | | 4,032 | |
| | | Intercontinental Exchange Inc. | | 30,470 | | 3,237 | |
| | | Ameriprise Financial Inc. | | 5,252 | | 824 | |
| | | | | | | 1,406,186 | |
| Health Care (9.5%) | | | | | |
| * | | Illumina Inc. | | 1,054,195 | | 376,580 | |
| * | | Intuitive Surgical Inc. | | 376,068 | | 274,846 | |
| * | | ABIOMED Inc. | | 890,289 | | 273,871 | |
| * | | IQVIA Holdings Inc. | | 1,396,751 | | 228,718 | |
| | | UnitedHealth Group Inc. | | 671,671 | | 209,931 | |
| | | AstraZeneca plc ADR | | 3,172,440 | | 177,657 | |
| * | | Edwards Lifesciences Corp. | | 1,838,540 | | 157,820 | |
| | | Thermo Fisher Scientific Inc. | | 337,114 | | 144,615 | |
| | | Danaher Corp. | | 699,575 | | 144,441 | |
| * | | Teladoc Health Inc. | | 648,979 | | 139,978 | |
| * | | Vertex Pharmaceuticals Inc. | | 485,601 | | 135,541 | |
| | | Zoetis Inc. | | 823,108 | | 131,780 | |
| | | Boston Scientific Corp. | | 2,960,659 | | 121,446 | |
| * | | Penumbra Inc. | | 552,490 | | 115,553 | |
| * | | Mettler-Toledo International Inc. | | 103,356 | | 100,336 | |
| * | | Novocure Ltd. | | 1,183,144 | | 97,905 | |
| * | | Alnylam Pharmaceuticals Inc. | | 656,115 | | 87,027 | |
| | | Merck & Co. Inc. | | 1,005,853 | | 85,769 | |
| * | | Moderna Inc. | | 1,091,784 | | 70,846 | |
| | | Eli Lilly and Co. | | 442,297 | | 65,633 | |
| * | | Sarepta Therapeutics Inc. | | 429,088 | | 62,827 | |
| * | | Glaukos Corp. | | 1,208,555 | | 57,805 | |
| * | | Denali Therapeutics Inc. | | 1,735,333 | | 55,357 | |
| * | | Biogen Inc. | | 181,472 | | 52,199 | |
| * | | Seattle Genetics Inc. | | 295,504 | | 46,790 | |
| | | AbbVie Inc. | | 466,914 | | 44,716 | |
| | | Johnson & Johnson | | 277,791 | | 42,616 | |
| * | | Veeva Systems Inc. Class A | | 114,670 | | 32,368 | |
| | | Cigna Corp. | | 179,222 | | 31,789 | |
| | | Humana Inc. | | 75,755 | | 31,451 | |
| | | HCA Healthcare Inc. | | 226,521 | | 30,743 | |
| * | | PRA Health Sciences Inc. | | 218,981 | | 23,411 | |
| * | | DexCom Inc. | | 52,018 | | 22,129 | |
| | | McKesson Corp. | | 141,229 | | 21,670 | |
| | | AmerisourceBergen Corp. Class A | | 222,868 | | 21,625 | |
| * | | Charles River Laboratories International Inc. | | 94,728 | | 20,741 | |
| * | | Henry Schein Inc. | | 278,428 | | 18,499 | |
| | | Amgen Inc. | | 70,662 | | 17,900 | |
| * | | DaVita Inc. | | 153,435 | | 13,312 | |
| | | Cardinal Health Inc. | | 196,697 | | 9,984 | |
| * | | Quidel Corp. | | 43,459 | | 7,647 | |
| * | | Avantor Inc. | | 304,772 | | 6,879 | |
| | | Bruker Corp. | | 144,057 | | 6,053 | |
| * | | Align Technology Inc. | | 19,352 | | 5,747 | |
| | | Abbott Laboratories | | 44,954 | | 4,921 | |
| | | West Pharmaceutical Services Inc. | | 16,426 | | 4,664 | |
| * | | Incyte Corp. | | 31,042 | | 2,991 | |
| | | PerkinElmer Inc. | | 22,881 | | 2,694 | |
| | | Becton Dickinson and Co. | | 7,983 | | 1,938 | |
| | | | | | | 3,841,759 | |
| Industrials (4.8%) | | | | | |
| * | | Uber Technologies Inc. | | 12,281,627 | | 413,031 | |
| | | Waste Management Inc. | | 1,483,001 | | 169,062 | |
| | | TransUnion | | 1,796,960 | | 155,832 | |
| | | IHS Markit Ltd. | | 1,667,295 | | 133,250 | |
| * | | CoStar Group Inc. | | 147,876 | | 125,488 | |
| | | Lockheed Martin Corp. | | 285,784 | | 111,530 | |
| | | Equifax Inc. | | 648,486 | | 109,121 | |
| | | Northrop Grumman Corp. | | 317,848 | | 108,898 | |
| * | | Copart Inc. | | 1,046,876 | | 108,163 | |
| | | Watsco Inc. | | 441,208 | | 108,092 | |
| | | Canadian National Railway Co. | | 788,182 | | 82,428 | |
| | | JB Hunt Transport Services Inc. | | 339,978 | | 47,780 | |
| | | HEICO Corp. Class A | | 491,360 | | 43,918 | |
| | | United Parcel Service Inc. Class B | | 247,777 | | 40,541 | |
| | | Rockwell Automation Inc. | | 106,981 | | 24,662 | |
| | | IDEX Corp. | | 128,986 | | 23,247 | |
| | | Landstar System Inc. | | 143,894 | | 19,151 | |
U.S. Growth Fund
| | | | | | | Market | |
| | | | | | | Value• | |
| | | | | Shares | | ($000 | ) |
| * | | Lyft Inc. Class A | | 564,278 | | 16,742 | |
| | | Nielsen Holdings plc | | 1,067,597 | | 16,313 | |
| | | Illinois Tool Works Inc. | | 65,385 | | 12,917 | |
| | | Expeditors International of Washington Inc. | | 134,083 | | 11,852 | |
| | | WW Grainger Inc. | | 31,729 | | 11,595 | |
| | | CoreLogic Inc. | | 159,093 | | 10,564 | |
| | | Allison Transmission Holdings Inc. | | 225,525 | | 8,090 | |
| | | Armstrong World Industries Inc. | | 100,970 | | 7,446 | |
| | | Fastenal Co. | | 55,060 | | 2,690 | |
| * | | Generac Holdings Inc. | | 14,013 | | 2,662 | |
| | | Hubbell Inc. Class B | | 17,254 | | 2,500 | |
| | | KAR Auction Services Inc. | | 137,710 | | 2,388 | |
| | | | | | | 1,929,953 | |
| Information Technology (43.4%) | | | | | |
| | | Microsoft Corp. | | 11,052,827 | | 2,492,744 | |
| | | Apple Inc. | | 18,292,572 | | 2,360,474 | |
| | | Mastercard Inc. Class A | | 3,260,174 | | 1,167,762 | |
| * | | Shopify Inc. Class A | | 975,961 | | 1,040,784 | |
| | | Visa Inc. Class A | | 4,276,842 | | 906,648 | |
| * | | Adobe Inc. | | 1,614,133 | | 828,680 | |
| * | | PayPal Holdings Inc. | | 3,878,829 | | 791,824 | |
| * | | salesforce.com Inc. | | 2,874,808 | | 783,816 | |
| | | NVIDIA Corp. | | 1,320,827 | | 706,616 | |
| * | | ServiceNow Inc. | | 1,350,946 | | 651,183 | |
| * | | Workday Inc. Class A | | 2,054,464 | | 492,476 | |
| * | | Coupa Software Inc. | | 1,300,663 | | 426,279 | |
| * | | Trade Desk Inc. Class A | | 776,203 | | 373,587 | |
| * | | Twilio Inc. Class A | | 1,285,462 | | 346,766 | |
| * | | Autodesk Inc. | | 1,410,550 | | 346,572 | |
| * | | Advanced Micro Devices Inc. | | 3,341,121 | | 303,441 | |
| * | | Zoom Video Communications Inc. Class A | | 741,620 | | 241,101 | |
| 1 | | Adyen NV | | 132,144 | | 222,751 | |
| * | | Square Inc. | | 1,200,770 | | 191,595 | |
| * | | Paycom Software Inc. | | 590,158 | | 176,729 | |
| * | | FleetCor Technologies Inc. | | 700,235 | | 176,074 | |
| | | SS&C Technologies Holdings Inc. | | 2,616,573 | | 166,728 | |
| * | | Slack Technologies Inc. Class A | | 4,852,648 | | 159,361 | |
| | | Fidelity National Information Services Inc. | | 1,054,151 | | 159,019 | |
| | | Microchip Technology Inc. | | 1,309,484 | | 143,650 | |
| * | | Atlassian Corp. plc Class A | | 703,980 | | 134,995 | |
| | | Global Payments Inc. | | 730,877 | | 129,088 | |
| * | | Splunk Inc. | | 585,877 | | 128,500 | |
| * | | DocuSign Inc. Class A | | 521,186 | | 116,224 | |
| * | | Wix.com Ltd. | | 389,917 | | 114,881 | |
| | | RingCentral Inc. Class A | | 364,370 | | 105,948 | |
| | | Crowdstrike Holdings Inc. Class A | | 828,990 | | 104,229 | |
| | | CDW Corp. | | 861,255 | | 97,882 | |
| * | | Tyler Technologies Inc. | | 187,563 | | 64,767 | |
| * | | Cloudflare Inc. Class A | | 1,643,811 | | 62,892 | |
| * | | Datadog Inc. Class A | | 721,575 | | 60,288 | |
| | | Accenture plc Class A | | 246,436 | | 59,127 | |
| | | Oracle Corp. | | 977,651 | | 55,941 | |
| *,^ | | Appian Corp. Class A | | 858,444 | | 52,571 | |
| | | Texas Instruments Inc. | | 363,784 | | 51,712 | |
| | | QUALCOMM Inc. | | 398,510 | | 47,463 | |
| * | | Yext Inc. | | 2,268,597 | | 45,054 | |
| * | | Cadence Design Systems Inc. | | 359,800 | | 39,905 | |
| * | | Synopsys Inc. | | 175,900 | | 38,927 | |
| | | Booz Allen Hamilton Holding Corp. Class A | | 367,692 | | 32,379 | |
| * | | Fortinet Inc. | | 233,684 | | 30,847 | |
| * | | Manhattan Associates Inc. | | 313,387 | | 30,477 | |
| | | Teradyne Inc. | | 347,868 | | 29,558 | |
| | | Lam Research Corp. | | 82,908 | | 27,885 | |
| | | Monolithic Power Systems Inc. | | 96,915 | | 25,889 | |
| * | | Ceridian HCM Holding Inc. | | 303,641 | | 24,146 | |
| | | Jabil Inc. | | 524,083 | | 17,897 | |
| * | | GoDaddy Inc. Class A | | 203,862 | | 17,059 | |
| | | HP Inc. | | 732,129 | | 14,313 | |
| * | | Dell Technologies Inc. | | 201,128 | | 13,291 | |
| * | | Teradata Corp. | | 538,096 | | 13,103 | |
| * | | Fair Isaac Corp. | | 27,044 | | 11,380 | |
| | | Citrix Systems Inc. | | 68,961 | | 10,013 | |
| | | Broadcom Inc. | | 27,225 | | 9,451 | |
| * | | Dropbox Inc. Class A | | 308,238 | | 6,525 | |
| | | NortonLifeLock Inc. | | 225,814 | | 5,311 | |
| * | | SolarEdge Technologies Inc. | | 18,575 | | 4,108 | |
| | | Intuit Inc. | | 7,914 | | 2,733 | |
| | | | | | | 17,493,419 | |
Materials (0.5%) | | | | | |
| | | Ball Corp. | | 1,793,671 | | 144,157 | |
| * | | Element Solutions Inc. | | 1,967,114 | | 21,147 | |
| | | Scotts Miracle-Gro Co. | | 94,590 | | 15,941 | |
| * | | Crown Holdings Inc. | | 33,438 | | 2,570 | |
| | | Sealed Air Corp. | | 56,882 | | 2,235 | |
| | | | | | | 186,050 | |
Other (0.0%) | | | | | |
| *,§,2 | | The We Company Class A PP | | 19,046 | | 96 | |
| | | | | | | | |
| Real Estate (1.0%) | | | |
| * | | Redfin Corp. | | 2,750,655 | | 130,849 | |
| | | American Tower Corp. | | 470,185 | | 117,146 | |
| U.S. Growth Fund | | | | | |
| | | | | | |
| | | | | | | Market | |
| | | | | | | Value• | |
| | | | | Shares | | ($000 | ) |
| | | Equinix Inc. | | 120,411 | | 95,098 | |
| | | Iron Mountain Inc. | | 925,257 | | 27,841 | |
| | | American Homes 4 Rent Class A | | 632,747 | | 18,122 | |
| | | SBA Communications Corp. Class A | | 17,763 | | 5,437 | |
| | | | | | | 394,493 | |
| Utilities (0.0%) | | | | | |
| | | NRG Energy Inc. | | 115,956 | | 3,990 | |
| Total Common Stocks | | | | | |
| (Cost $17,748,805) | | | | 39,197,109 | |
| Preferred Stocks (0.0%) | | | | | |
| *,§,2,3 Airbnb Inc., 8.000% | | 128,123 | | 9,718 | |
| *,§,2,3 The We Company Pfd. D1 PP | | 260,418 | | 2,039 | |
| *,§,2,3 The We Company Pfd. D2 PP | | 204,614 | | 1,602 | |
| Total Preferred Stocks | | | | | |
| (Cost $19,671) | | | | 13,359 | |
| Temporary Cash Investments (2.8%) | | | |
| Money Market Fund (2.6%) | | | | | |
| 4,5 | | Vanguard Market Liquidity Fund, 0.147% | | 10,242,475 | | 1,024,247 | |
| | | | | | | | |
| | | | | Face | | | |
| | | | | Amount | | | |
| | | | | ($000 | ) | | |
| Repurchase Agreement (0.1%) | | | |
| | | Bank of America Securities, LLC 0.090%, 9/1/20 (Dated 8/31/20, Repurchase Value $42,800,000,collateralized by Government National Mortgage Assn. 3.000%, 11/20/49, with a value of $43,656,000) | | 42,800 | | 42,800 | |
| U.S. Government and Agency Obligations (0.1%) | |
| 6 | | United States Cash Management Bill, 0.210%, 9/15/20 | | 5,000 | | 5,000 | |
| 6 | | United States Cash Management Bill, 0.116%, 9/29/20 | | 4,710 | | 4,710 | |
| 6 | | United States Cash Management Bill, 0.140%, 10/13/20 | | 23,500 | | 23,498 | |
| 6 | | United States Cash Management Bill, 0.165%, 11/3/20 | | 2,590 | | 2,589 | |
| 6 | | United States Cash Management Bill, 0.145%–0.146%, 12/15/20 | | 13,300 | | 13,296 | |
| 6 | | United States Treasury Bill, 0.109%, 12/31/20 | | 7,200 | | 7,197 | |
| | | | | | | 56,290 | |
| Total Temporary Cash Investments | | | |
| (Cost $1,123,140) | | | | 1,123,337 | |
| Total Investments (100.2%) | | | | | |
| (Cost $18,891,616) | | 40,333,805 | |
| Other Assets and Liabilities—Net (-0.2%) | | (63,633 | ) |
| Net Assets (100%) | 40,270,172 | |
Cost is in $000.
| • | See Note A in Notes to Financial Statements. * Non-income-producing security. |
| ^ | Includes partial security positions on loan to broker-dealers. The total value of securities on loan is $100,381,000. |
| § | Security value determined using significant unobservable inputs. |
| 1 | Security exempt from registration under Rule 144A of the Securities Act of 1933. Such securities may be sold in transactions exempt from registration, normally to qualified institutional buyers. At August 31, 2020, the value of this security represented 0.6% of net assets. |
| 2 | Restricted securities totaling $13,455,000, representing 0.0% of net assets. See Restricted Securities table for additional information. |
| 3 | Perpetual security with no stated maturity date. |
| 4 | Affiliated money market fund available only to Vanguard funds and certain trusts and accounts managed by Vanguard. Rate shown is the 7-day yield. |
| 5 | Collateral of $101,840,000 was received for securities on loan. |
| 6 | Securities with a value of $55,520,000 have been segregated as initial margin for open futures contracts. |
ADR—American Depositary Receipt.
PP—Private Placement.
U.S. Growth Fund
| Restricted Securities as of Period End |
| | | | | Acquisition |
| | | | Acquisition | Cost |
| Security Name | | | Date | ($000) |
| The We Company Pfd. D1 PP | | December 2014 | 4,336 |
| The We Company Pfd. D2 PP | | December 2014 | 3,407 |
| The We Company Class A PP | | December 2014 | 317 |
| Airbnb Inc. | | | June 2015 | 11,928 |
| Derivative Financial Instruments Outstanding as of Period End | | | |
| | | | |
| Futures Contracts | | | | | |
| | | | | ($000) |
| | | | | | Value and |
| | | Number of | | | Unrealized |
| | | Long (Short) | Notional | | Appreciation |
| | Expiration | Contracts | Amount | (Depreciation) |
| Long Futures Contracts | | | | | |
| E-mini S&P 500 Index | September 2020 | 4,156 | 727,071 | 42,916 |
| E-mini S&P Mid-Cap 400 Index | September 2020 | 262 | 50,456 | 4,509 |
| | | | | | 47,425 |
See accompanying Notes, which are an integral part of the Financial Statements.
U.S. Growth Fund
Statement of Assets and Liabilities
As of August 31, 2020
| ($000s, except shares and per-share amounts) | Amount |
| Assets | |
| Investments in Securities, at Value | |
| Unaffiliated Issuers (Cost $17,867,562) | 39,309,558 |
| Affiliated Issuers (Cost $1,024,054) | 1,024,247 |
| Total Investments in Securities | 40,333,805 |
| Investment in Vanguard | 1,530 |
| Cash Collateral Pledged—Futures Contracts | 61 |
| Receivables for Investment Securities Sold | 91,890 |
| Receivables for Accrued Income | 17,815 |
| Receivables for Capital Shares Issued | 60,467 |
| Variation Margin Receivable—Futures Contracts | 74 |
| Total Assets | 40,505,642 |
| Liabilities | |
| Due to Custodian | 123 |
| Payables for Investment Securities Purchased | 29,537 |
| Collateral for Securities on Loan | 101,840 |
| Payables to Investment Advisor | 13,276 |
| Payables for Capital Shares Redeemed | 85,882 |
| Payables to Vanguard | 3,015 |
| Variation Margin Payable—Futures Contracts | 1,797 |
| Total Liabilities | 235,470 |
| Net Assets | 40,270,172 |
| | |
| | |
| At August 31, 2020, net assets consisted of: | |
| | |
| Paid-in Capital | 17,577,126 |
| Total Distributable Earnings (Loss) | 22,693,046 |
| Net Assets | 40,270,172 |
| | |
| Investor Shares—Net Assets | |
| Applicable to 199,244,583 outstanding $.001 par value shares of beneficial interest (unlimited authorization) | 12,409,800 |
| Net Asset Value Per Share—Investor Shares | $62.28 |
| | |
| Admiral Shares—Net Assets | |
| Applicable to 172,594,437 outstanding $.001 par value shares of | |
| beneficial interest (unlimited authorization) | 27,860,372 |
| Net Asset Value Per Share—Admiral Shares | $161.42 |
See accompanying Notes, which are an integral part of the Financial Statements.
U.S. Growth Fund
Statement of Operations
| | Year Ended |
| | August 31, 2020 |
| | ($000) |
| Investment Income | |
| Income | |
| Dividends—Unaffiliated Issuers1 | 165,954 |
| Dividends—Affiliated Issuers | 371 |
| Interest—Unaffiliated Issuers | 967 |
| Interest—Affiliated Issuers | 8,734 |
| Securities Lending—Net | 4,954 |
| Total Income | 180,980 |
| Expenses | |
| Investment Advisory Fees—Note B | |
| Basic Fee | 39,631 |
| Performance Adjustment | 6,030 |
| The Vanguard Group—Note C | |
| Management and Administrative—Investor Shares | 20,412 |
| Management and Administrative—Admiral Shares | 22,967 |
| Marketing and Distribution—Investor Shares | 723 |
| Marketing and Distribution—Admiral Shares | 855 |
| Custodian Fees | 211 |
| Auditing Fees | 36 |
| Shareholders’ Reports—Investor Shares | 200 |
| Shareholders’ Reports—Admiral Shares | 116 |
| Trustees’ Fees and Expenses | 46 |
| Total Expenses | 91,227 |
| Expenses Paid Indirectly | (494) |
| Net Expenses | 90,733 |
| Net Investment Income | 90,247 |
| Realized Net Gain (Loss) | |
| Investment Securities Sold—Unaffiliated Issuers | 1,342,892 |
| Investment Securities Sold—Affiliated Issuers | 15,064 |
| Futures Contracts | 69,852 |
| Foreign Currencies | (423) |
| Realized Net Gain (Loss) | 1,427,385 |
| Change in Unrealized Appreciation (Depreciation) | |
| Investment Securities Sold—Unaffiliated Issuers | 12,975,849 |
| Investment Securities Sold—Affiliated Issuers | (5,467) |
| Futures Contracts | 45,349 |
| Foreign Currencies | 82 |
| Change in Unrealized Appreciation (Depreciation) | 13,015,813 |
| Net Increase (Decrease) in Net Assets Resulting from Operations | 14,533,445 |
| 1 | Dividends are net of foreign withholding taxes of $444,000. |
See accompanying Notes, which are an integral part of the Financial Statements.
U.S. Growth Fund
Statement of Changes in Net Assets
| | Year Ended August 31, |
| | 2020 | 2019 |
| | ($000) | ($000) |
| Increase (Decrease) in Net Assets | | |
| Operations | | |
| Net Investment Income | 90,247 | 84,993 |
| Realized Net Gain (Loss) | 1,427,385 | 1,097,123 |
| Change in Unrealized Appreciation (Depreciation) | 13,015,813 | (357,242) |
| Net Increase (Decrease) in Net Assets Resulting from Operations | 14,533,445 | 824,874 |
| Distributions1 | | |
| Investor Shares | (357,080) | (342,379) |
| Admiral Shares | (704,493) | (477,858) |
| Total Distributions | (1,061,573) | (820,237) |
| Capital Share Transactions | | |
| Investor Shares | (747,873) | 4,292,730 |
| Admiral Shares | 1,666,649 | 10,751,352 |
| Net Increase (Decrease) from Capital Share Transactions | 918,776 | 15,044,082 |
| Total Increase (Decrease) | 14,390,648 | 15,048,719 |
| Net Assets | | |
| Beginning of Period | 25,879,524 | 10,830,805 |
| End of Period | 40,270,172 | 25,879,524 |
1 Certain prior period numbers have been reclassified to conform with current period presentation.
See accompanying Notes, which are an integral part of the Financial Statements.
U.S. Growth Fund
Financial Highlights
Investor Shares
| For a Share Outstanding | | | | | | Year Ended August 31, | |
| Throughout Each Period | | 2020 | | 2019 | | 2018 | | 2017 | | 2016 | |
| Net Asset Value, Beginning of Period | | $41.02 | | $43.31 | | $35.62 | | $30.32 | | $30.89 | |
| Investment Operations | | | | | | | | | | | |
| Net Investment Income | | .113 | 1 | .176 | 1 | .134 | 1 | .151 | 1 | .151 | |
| Net Realized and Unrealized Gain (Loss) on Investments | | 22.856 | | .771 | | 9.394 | | 5.590 | | 1.944 | |
| Total from Investment Operations | | 22.969 | | .947 | | 9.528 | | 5.741 | | 2.095 | |
| Distributions | | | | | | | | | | | |
| Dividends from Net Investment Income | | (.119 | ) | (.132 | ) | (.146 | ) | (.121 | ) | (.147 | ) |
| Distributions from Realized Capital Gains | | (1.590 | ) | (3.105 | ) | (1.692 | ) | (.320 | ) | (2.518 | ) |
| Total Distributions | | (1.709 | ) | (3.237 | ) | (1.838 | ) | (.441 | ) | (2.665 | ) |
| Net Asset Value, End of Period | | $62.28 | | $41.02 | | $43.31 | | $35.62 | | $30.32 | |
| | | | | | | | | | | | |
| Total Return2 | | 58.01% | | 3.70% | | 27.64% | | 19.24% | | 6.89% | |
| | | | | | | | | | | | |
| Ratios/Supplemental Data | | | | | | | | | | | |
| Net Assets, End of Period (Millions) | | $12,410 | | $8,819 | | $4,582 | | $4,113 | | $3,794 | |
| Ratio of Total Expenses to Average Net Assets3 | | 0.38% | | 0.39% | | 0.42% | | 0.43% | | 0.46% | |
| Ratio of Net Investment Income to Average Net Assets | | 0.25% | | 0.44% | | 0.35% | | 0.47% | | 0.50% | |
| Portfolio Turnover Rate | | 38% | | 41% | | 33% | | 27% | | 32% | |
| 1 | Calculated based on average shares outstanding. |
| 2 | Total returns do not include account service fees that may have applied in the periods shown. Fund prospectuses provide information about any applicable account service fees. |
| 3 | Includes performance-based investment advisory fee increases (decreases) of 0.02%, 0.01%, 0.01%, (0.01%), and 0.02%. |
See accompanying Notes, which are an integral part of the Financial Statements.
U.S. Growth Fund
Financial Highlights
Admiral Shares
| For a Share Outstanding | | | | | | Year Ended August 31, | |
| Throughout Each Period | | 2020 | | 2019 | | 2018 | | 2017 | | 2016 | |
| Net Asset Value, Beginning of Period | | $106.30 | | $112.28 | | $92.24 | | $78.52 | | $80.01 | |
| Investment Operations | | | | | | | | | | | |
| Net Investment Income | | .410 | 1 | .572 | 1 | .476 | 1 | .502 | 1 | .506 | |
| Net Realized and Unrealized Gain (Loss) on Investments | | 59.231 | | 1.963 | | 24.323 | | 14.480 | | 5.018 | |
| Total from Investment Operations | | 59.641 | | 2.535 | | 24.799 | | 14.982 | | 5.524 | |
| Distributions | | | | | | | | | | | |
| Dividends from Net Investment Income | | (.401 | ) | (.464 | ) | (.375 | ) | (.433 | ) | (.499 | ) |
| Distributions from Realized Capital Gains | | (4.120 | ) | (8.051 | ) | (4.384 | ) | (.829 | ) | (6.515 | ) |
| Total Distributions | | (4.521 | ) | (8.515 | ) | (4.759 | ) | (1.262 | ) | (7.014 | ) |
| Net Asset Value, End of Period | | $161.42 | | $106.30 | | $112.28 | | $92.24 | | $78.52 | |
| | | | | | | | | | | | |
| Total Return2 | | 58.17% | | 3.80% | | 27.78% | | 19.42% | | 7.03% | |
| | | | | | | | | | | | |
| Ratios/Supplemental Data | | | | | | | | | | | |
| Net Assets, End of Period (Millions) | | $27,860 | | $17,060 | | $6,249 | | $3,791 | | $3,066 | |
| Ratio of Total Expenses to Average Net Assets3 | | 0.28% | | 0.28% | | 0.30% | | 0.30% | | 0.32% | |
| Ratio of Net Investment Income to Average Net Assets | | 0.35% | | 0.55% | | 0.47% | | 0.60% | | 0.64% | |
| Portfolio Turnover Rate | | 38% | | 41% | | 33% | | 27% | | 32% | |
| 1 | Calculated based on average shares outstanding. |
| 2 | Total returns do not include account service fees that may have applied in the periods shown. Fund prospectuses provide information about any applicable account service fees. |
| 3 | Includes performance-based investment advisory fee increases (decreases) of 0.02%, 0.01%, 0.01%, (0.01%), and 0.02%. |
See accompanying Notes, which are an integral part of the Financial Statements.
U.S. Growth Fund
Notes to Financial Statements
Vanguard U.S. Growth Fund is registered under the Investment Company Act of 1940 as an open-end investment company, or mutual fund. The fund offers two classes of shares: Investor Shares and Admiral Shares. Each of the share classes has different eligibility and minimum purchase requirements, and is designed for different types of investors.
Market disruptions associated with the COVID-19 pandemic have had a global impact, and uncertainty exists as to the long-term implications. Such disruptions can adversely affect assets of the fund and thus fund performance.
A. The following significant accounting policies conform to generally accepted accounting principles for U.S. investment companies. The fund consistently follows such policies in preparing its financial statements.
1. Security Valuation: Securities are valued as of the close of trading on the New York Stock Exchange (generally 4 p.m., Eastern time) on the valuation date. Equity securities are valued at the latest quoted sales prices or official closing prices taken from the primary market in which each security trades; such securities not traded on the valuation date are valued at the mean of the latest quoted bid and asked prices. Securities for which market quotations are not readily available, or whose values have been affected by events occurring before the fund’s pricing time but after the close of the securities’ primary markets, are valued at their fair values calculated according to procedures adopted by the board of trustees. These procedures include obtaining quotations from an independent pricing service, monitoring news to identify significant market-or security-specific events, and evaluating changes in the values of foreign market proxies (for example, ADRs, futures contracts, or exchange-traded funds), between the time the foreign markets close and the fund’s pricing time. When fair-value pricing is employed, the prices of securities used by a fund to calculate its net asset value may differ from quoted or published prices for the same securities. Investments in Vanguard Market Liquidity Fund are valued at that fund’s net asset value. Temporary cash investments are valued using the latest bid prices or using valuations based on a matrix system (which considers such factors as security prices, yields, maturities, and ratings), both as furnished by independent pricing services.
2. Foreign Currency: Securities and other assets and liabilities denominated in foreign currencies are translated into U.S. dollars using exchange rates obtained from an independent third party as of the fund’s pricing time on the valuation date. Realized gains (losses) and unrealized appreciation (depreciation) on investment securities include the effects of changes in exchange rates since the securities were purchased, combined with the effects of changes in security prices. Fluctuations in the value of other assets and liabilities resulting from changes in exchange rates are recorded as unrealized foreign currency gains (losses) until the assets or liabilities are settled in cash, at which time they are recorded as realized foreign currency gains (losses).
3. Futures Contracts: The fund uses index futures contracts to a limited extent, with the objective of maintaining full exposure to the stock market while maintaining liquidity. The fund may purchase or sell futures contracts to achieve a desired level of investment, whether to accommodate portfolio turnover or cash flows from capital share transactions. The primary risks associated with the use of futures contracts are imperfect correlation between changes in market values of stocks held by the fund and the prices of futures contracts, and the possibility of an illiquid market. Counterparty risk involving futures is mitigated because a regulated clearinghouse is the counterparty instead of the clearing broker. To further mitigate counterparty risk, the fund trades futures contracts on an
U.S. Growth Fund
exchange, monitors the financial strength of its clearing brokers and clearinghouse, and has entered into clearing agreements with its clearing brokers. The clearinghouse imposes initial margin requirements to secure the fund’s performance and requires daily settlement of variation margin representing changes in the market value of each contract. Any securities pledged as initial margin for open contracts are noted in the Schedule of Investments.
Futures contracts are valued at their quoted daily settlement prices. The notional amounts of the contracts are not recorded in the Statement of Assets and Liabilities. Fluctuations in the value of the contracts are recorded in the Statement of Assets and Liabilities as an asset (liability) and in the Statement of Operations as unrealized appreciation (depreciation) until the contracts are closed, when they are recorded as realized gains (losses) on futures contracts.
During the year ended August 31, 2020, the fund’s average investments in long and short futures contracts represented 2% and 0% of net assets, respectively, based on the average of the notional amounts at each quarter-end during the period.
4. Repurchase Agreements: The fund enters into repurchase agreements with institutional counterparties. Securities pledged as collateral to the fund under repurchase agreements are held by a custodian bank until the agreements mature, and in the absence of a default, such collateral cannot be repledged, resold, or rehypothecated. Each agreement requires that the market value of the collateral be sufficient to cover payments of interest and principal. The fund further mitigates its counterparty risk by entering into repurchase agreements only with a diverse group of prequalified counterparties, monitoring their financial strength, and entering into master repurchase agreements with its counterparties. The master repurchase agreements provide that, in the event of a counterparty’s default (including bankruptcy), the fund may terminate any repurchase agreements with that counterparty, determine the net amount owed, and sell or retain the collateral up to the net amount owed to the fund. Such action may be subject to legal proceedings, which may delay or limit the disposition of collateral.
5. Federal Income Taxes: The fund intends to continue to qualify as a regulated investment company and distribute all of its taxable income. The fund’s tax returns are open to examination by the relevant tax authorities until expiration of the applicable statute of limitations, which is generally three years after the filing of the tax return. Management has analyzed the fund’s tax positions taken for all open federal and state income tax years, and has concluded that no provision for income tax is required in the fund’s financial statements.
6. Distributions: Distributions to shareholders are recorded on the ex-dividend date. Distributions are determined on a tax basis at the fiscal year-end and may differ from net investment income and realized capital gains for financial reporting purposes.
7. Securities Lending: To earn additional income, the fund lends its securities to qualified institutional borrowers. Security loans are subject to termination by the fund at any time, and are required to be secured at all times by collateral in an amount at least equal to the market value of securities loaned. Daily market fluctuations could cause the value of loaned securities to be more or less than the value of the collateral received. When this occurs, the collateral is adjusted and settled before the opening of the market on the next business day. The fund further mitigates its counterparty risk by entering into securities lending transactions only with a diverse group of prequalified counterparties, monitoring their financial strength, and entering into master securities lending agreements with its counterparties. The master securities lending agreements provide that, in the event of a
U.S. Growth Fund
counterparty’s default (including bankruptcy), the fund may terminate any loans with that borrower, determine the net amount owed, and sell or retain the collateral up to the net amount owed to the fund; however, such actions may be subject to legal proceedings. While collateral mitigates counterparty risk, in the event of a default, the fund may experience delays and costs in recovering the securities loaned. The fund invests cash collateral received in Vanguard Market Liquidity Fund, and records a liability in the Statement of Assets and Liabilities for the return of the collateral, during the period the securities are on loan. Collateral investments in Vanguard Market Liquidity Fund are subject to market appreciation or depreciation. Securities lending income represents fees charged to borrowers plus income earned on invested cash collateral, less expenses associated with the loan. During the term of the loan, the fund is entitled to all distributions made on or in respect of the loaned securities.
8. Credit Facilities and Interfund Lending Program: The fund and certain other funds managed by The Vanguard Group (“Vanguard”) participate in a $4.3 billion committed credit facility provided by a syndicate of lenders pursuant to a credit agreement and an uncommitted credit facility provided by Vanguard. Both facilities may be renewed annually. Each fund is individually liable for its borrowings, if any, under the credit facilities. Borrowings may be utilized for temporary or emergency purposes, subject to the fund’s regulatory and contractual borrowing restrictions. With respect to the committed credit facility, the participating funds are charged administrative fees and an annual commitment fee of 0.10% of the undrawn committed amount of the facility; these fees are allocated to the funds based on a method approved by the fund’s board of trustees and included in Management and Administrative expenses on the fund’s Statement of Operations. Any borrowings under either facility bear interest at a rate based upon the higher of the one-month London Interbank Offered Rate (or an acceptable alternate rate, if necessary), federal funds effective rate, or overnight bank funding rate plus an agreed-upon spread, except that borrowings under the uncommitted credit facility may bear interest based upon an alternative rate agreed to by the fund and Vanguard.
In accordance with an exemptive order (the “Order”) from the SEC, the fund may participate in a joint lending and borrowing program that allows registered open-end Vanguard funds to borrow money from and lend money to each other for temporary or emergency purposes (the “Interfund Lending Program”), subject to compliance with the terms and conditions of the Order, and to the extent permitted by the fund’s investment objective and investment policies. Interfund loans and borrowings normally extend overnight, but can have a maximum duration of seven days. Loans may be called on one business day’s notice. The interest rate to be charged is governed by the conditions of the Order and internal procedures adopted by the board of trustees. The board of trustees is responsible for overseeing the Interfund Lending Program.
For the year ended August 31, 2020, the fund did not utilize the credit facilities or the Interfund Lending Program.
9. Other: Dividend income is recorded on the ex-dividend date. Interest income includes income distributions received from Vanguard Market Liquidity Fund and is accrued daily. Premiums and discounts on debt securities are amortized and accreted, respectively, to interest income over the lives of the respective securities, except for premiums on certain callable debt securities that are amortized to the earliest call date. Security transactions are accounted for on the date securities are bought or sold. Costs used to determine realized gains (losses) on the sale of investment securities are those of the specific securities sold.
U.S. Growth Fund
Withholding taxes on foreign dividends and capital gains have been provided for in accordance with the fund’s understanding of the applicable countries’ tax rules and rates. The fund has filed tax reclaims for previously withheld taxes on dividends earned in certain European Union countries. These filings are subject to various administrative and judicial proceedings within these countries. Such tax reclaims received during the year, if any, are included in dividend income. No other amounts for additional tax reclaims are reflected in the financial statements due to their uncertainty as to the ultimate resolution of proceedings, the likelihood of receipt of these reclaims, and the potential timing of payment.
Each class of shares has equal rights as to assets and earnings, except that each class separately bears certain class-specific expenses related to maintenance of shareholder accounts (included in Management and Administrative expenses) and shareholder reporting. Marketing and distribution expenses are allocated to each class of shares based on a method approved by the board of trustees. Income, other non-class-specific expenses, and gains and losses on investments are allocated to each class of shares based on its relative net assets.
B. The investment advisory firms Jennison Associates LLC, Wellington Management Company LLP, Baillie Gifford Overseas Ltd., and Jackson Square Partners, LLC, each provide investment advisory services to a portion of the fund for a fee calculated at an annual percentage rate of average net assets managed by the advisor. The basic fees of Jennison Associates LLC, Wellington Management Company LLP, and Jackson Square Partners, LLC, are subject to quarterly adjustments based on performance relative to the Russell 1000 Growth Index for the preceding three years. The basic fee of Baillie Gifford Overseas Ltd. is subject to quarterly adjustments based on performance relative to the S&P 500 Index for the preceding three years.
Vanguard provides investment advisory services to a portion of the fund as described below; the fund paid Vanguard advisory fees of $1,288,000 for the year ended August 31, 2020.
For the year ended August 31, 2020, the aggregate investment advisory fee paid to all advisors represented an effective annual basic rate of 0.14% of the fund’s average net assets, before an increase of $6,030,000 (0.02%) based on performance.
C. In accordance with the terms of a Funds’ Service Agreement (the “FSA”) between Vanguard and the fund, Vanguard furnishes to the fund investment advisory, corporate management, administrative, marketing, distribution, and cash management services at Vanguard’s cost of operations (as defined by the FSA). These costs of operations are allocated to the fund based on methods and guidelines approved by the board of trustees and are generally settled twice a month.
Upon the request of Vanguard, the fund may invest up to 0.40% of its net assets as capital in Vanguard. At August 31, 2020, the fund had contributed to Vanguard capital in the amount of $1,530,000, representing less than 0.01% of the fund’s net assets and 0.61% of Vanguard’s capital received pursuant to the FSA. The fund’s trustees and officers are also directors and employees, respectively, of Vanguard.
D. The fund has asked its investment advisors to direct certain security trades, subject to obtaining the best price and execution, to brokers who have agreed to rebate to the fund part of the commissions generated. Such rebates are used solely to reduce the fund’s management and administrative expenses. The fund’s custodian bank has also agreed to reduce its fees when the fund maintains cash on deposit in the non-interest-bearing custody account. For the year ended
U.S. Growth Fund
August 31, 2020, these arrangements reduced the fund’s management and administrative expenses by $488,000 and custodian fees by $6,000. The total expense reduction represented an effective annual rate of less than 0.01% of the fund’s average net assets.
E. Various inputs may be used to determine the value of the fund’s investments and derivatives. These inputs are summarized in three broad levels for financial statement purposes. The inputs or methodologies used to value securities are not necessarily an indication of the risk associated with investing in those securities.
Level 1—Quoted prices in active markets for identical securities.
Level 2—Other significant observable inputs (including quoted prices for similar securities, interest rates, prepayment speeds, credit risk, etc.).
Level 3—Significant unobservable inputs (including the fund’s own assumptions used to determine the fair value of investments). Any investments and derivatives valued with significant unobservable inputs are noted on the Schedule of Investments.
The following table summarizes the market value of the fund’s investments and derivatives as of August 31, 2020, based on the inputs used to value them:
| | Level 1 | Level 2 | Level 3 | Total |
| | ($000) | ($000) | ($000) | ($000) |
| Investments | | | | |
| Assets | | | | |
| Common Stocks | 38,717,683 | 479,330 | 96 | 39,197,109 |
| Preferred Stocks | — | — | 13,359 | 13,359 |
| Temporary Cash Investments | 1,024,247 | 99,090 | — | 1,123,337 |
| Total | 39,741,930 | 578,420 | 13,455 | 40,333,805 |
| Derivative Financial Instruments | | | | |
| Assets | | | | |
| Futures Contracts1 | 74 | — | — | 74 |
| Liabilities | | | | |
| Futures Contracts1 | 1,797 | — | — | 1,797 |
1 Represents variation margin on the last day of the reporting period.
F. Permanent differences between book-basis and tax-basis components of net assets are reclassified among capital accounts in the financial statements to reflect their tax character. These reclassifications have no effect on net assets or net asset value per share. As of period end, permanent differences primarily attributable to the accounting for foreign currency transactions and distributions in connection with fund share redemptions were reclassified between the following accounts:
| | Amount |
| | ($000) |
| Paid-in Capital | 91,901 |
| Total Distributable Earnings (Loss) | (91,901) |
U.S. Growth Fund
Temporary differences between book-basis and tax-basis components of total distributable earnings (loss) arise when certain items of income, gain, or loss are recognized in different periods for financial statement and tax purposes; these differences will reverse at some time in the future. The differences are primarily related to the deferral of losses from wash sales; and the recognition of unrealized gains or losses from certain derivative contracts. As of period end, the tax-basis components of total distributable earnings (loss) are detailed in the table as follows:
| | Amount |
| | ($000) |
| Undistributed Ordinary Income | 60,368 |
| Undistributed Long-Term Gains | 1,192,031 |
| Capital Loss Carryforwards | — |
| Qualified Late-Year Losses | — |
| Net Unrealized Gains (Losses) | 21,440,647 |
The tax character of distributions paid was as follows:
| | | Year Ended August 31, |
| | | 2020 | 2019 |
| | | Amount | Amount |
| | ($000) | ($000) |
| Ordinary Income* | 146,931 | 127,237 |
| Long-Term Capital Gains | 914,642 | 693,000 |
| Total | 1,061,573 | 820,237 |
* Includes short-term capital gains, if any.
As of August 31, 2020, gross unrealized appreciation and depreciation for investments and derivatives based on cost for U.S. federal income tax purposes were as follows:
| | Amount |
| | ($000) |
| Tax Cost | 18,893,166 |
| Gross Unrealized Appreciation | 21,634,880 |
| Gross Unrealized Depreciation | (194,241) |
| Net Unrealized Appreciation (Depreciation) | 21,440,639 |
G. During the year ended August 31, 2020, the fund purchased $10,580,444,000 of investment securities and sold $10,610,228,000 of investment securities, other than temporary cash investments.
U.S. Growth Fund
H. Capital share transactions for each class of shares were:
| | | | | | Year Ended August 31, |
| | | 2020 | | | | 2019 |
| | Amount | Shares | | | Amount | Shares |
| | ($000) | (000) | ($000) | (000) |
| Investor Shares | | | | | | |
| Issued | 2,060,722 | 44,973 | | 975,070 | 24,941 |
| Issued in Connection with Acquisition of Vanguard Morgan Growth Fund | — | — | 4,276,013 | 107,224 |
| Issued in Lieu of Cash Distributions | 347,590 | 8,288 | | 333,194 | 9,768 |
| Redeemed | (3,156,185) | (69,011 | ) | (1,291,547) | (32,733) |
| Net Increase (Decrease)—Investor Shares | (747,873) | (15,750 | ) | 4,292,730 | 109,200 |
| Admiral Shares | | | | | | |
| Issued | 5,160,714 | 42,335 | | 2,236,862 | 21,975 |
| Issued in Connection with Acquisition of Vanguard Morgan Growth Fund | — | — | 10,459,067 | 101,244 |
| Issued in Lieu of Cash Distributions | 662,481 | 6,099 | | 449,504 | 5,088 |
| Redeemed | (4,156,546) | (36,332 | ) | (2,394,081) | (23,467) |
| Net Increase (Decrease)—Admiral Shares | 1,666,649 | 12,102 | | 10,751,352 | 104,840 |
I. Transactions during the period in investments where the issuer is another member of The Vanguard Group were as follows:
| | | | | | Current Period Transactions | |
| | Aug. 31, | | Proceeds | Realized | | | | Aug. 31, |
| | 2019 | | from | Net | Change in | | Capital Gain | 2020 |
| | Market | Purchases | Securities | Gain | Unrealized | | Distributions | Market |
| | Value | at Cost | Sold | (Loss) | App. (Dep.) | Income | Received | Value |
| | ($000) | ($000) | ($000) | ($000) | ($000) | ($000) | ($000) | ($000) |
| Vanguard Growth ETF | 95,486 | — | 105,127 | 15,249 | (5,608) | 371 | — | — |
| Vanguard Market Liquidity Fund | 989,536 | NA1 | NA1 | (185) | 141 | 8,734 | — | 1,024,247 |
| Total | 1,085,022 | | | 15,064 | (5,467) | 9,105 | — | 1,024,247 |
1 Not applicable—purchases and sales are for temporary cash investment purposes.
J. Management has determined that no events or transactions occurred subsequent to August 31, 2020, that would require recognition or disclosure in these financial statements.
Report of Independent Registered Public Accounting Firm
To the Board of Trustees of Vanguard World Fund and Shareholders of Vanguard U.S. Growth Fund
Opinion on the Financial Statements
We have audited the accompanying statement of assets and liabilities, including the schedule of investments, of Vanguard U.S. Growth Fund (one of the funds constituting Vanguard World Fund, referred to hereafter as the “Fund”) as of August 31, 2020, the related statement of operations for the year ended August 31, 2020, the statement of changes in net assets for each of the two years in the period ended August 31, 2020, including the related notes, and the financial highlights for each of the five years in the period ended August 31, 2020 (collectively referred to as the “financial statements”). In our opinion, the financial statements present fairly, in all material respects, the financial position of the Fund as of August 31, 2020, the results of its operations for the year then ended, the changes in its net assets for each of the two years in the period ended August 31, 2020 and the financial highlights for each of the five years in the period ended August 31, 2020 in conformity with accounting principles generally accepted in the United States of America.
Basis for Opinion
These financial statements are the responsibility of the Fund’s management. Our responsibility is to express an opinion on the Fund’s financial statements based on our audits. We are a public accounting firm registered with the Public Company Accounting Oversight Board (United States) (“PCAOB”) and are required to be independent with respect to the Fund in accordance with the U.S. federal securities laws and the applicable rules and regulations of the Securities and Exchange Commission and the PCAOB.
We conducted our audits of these financial statements in accordance with the standards of the PCAOB. Those standards require that we plan and perform the audit to obtain reasonable assurance about whether the financial statements are free of material misstatement, whether due to error or fraud.
Our audits included performing procedures to assess the risks of material misstatement of the financial statements, whether due to error or fraud, and performing procedures that respond to those risks. Such procedures included examining, on a test basis, evidence regarding the amounts and disclosures in the financial statements. Our audits also included evaluating the accounting principles used and significant estimates made by management, as well as evaluating the overall presentation of the financial statements. Our procedures included confirmation of securities owned as of August 31, 2020 by correspondence with the custodians and brokers and by agreement to the underlying ownership records of the transfer agent; when replies were not received from brokers, we performed other auditing procedures. We believe that our audits provide a reasonable basis for our opinion.
/s/PricewaterhouseCoopers LLP
Philadelphia, Pennsylvania
October 19, 2020
We have served as the auditor of one or more investment companies in The Vanguard Group of Funds since 1975.
Special 2020 tax information (unaudited) for Vanguard U.S. Growth Fund
This information for the fiscal year ended August 31, 2020, is included pursuant to provisions of the Internal Revenue Code.
The fund distributed $1,000,436,000 as capital gain dividends (20% rate gain distributions) to shareholders during the fiscal year.
For nonresident alien shareholders, 100% of short-term capital gain dividends distributed by the fund are qualified short-term capital gains.
The fund distributed $131,069,000 of qualified dividend income to shareholders during the fiscal year.
For corporate shareholders, 100% of investment income (dividend income plus short-term gains, if any) qualifies for the dividends-received deduction.
Liquidity Risk Management
Vanguard funds (except for the money market funds) have adopted and implemented a written liquidity risk management program (the “Program”) as required by Rule 22e-4 under the Investment Company Act of 1940. Rule 22e-4 requires that each fund adopt a program that is reasonably designed to assess and manage the fund’s liquidity risk, which is the risk that the fund could not meet redemption requests without significant dilution of remaining investors’ interests in the fund.
Assessment and management of a fund’s liquidity risk under the Program take into consideration certain factors, such as the fund’s investment strategy and the liquidity of its portfolio investments during normal and reasonably foreseeable stressed conditions, its short- and long-term cash-flow projections during both normal and reasonably foreseeable stressed conditions, and its cash and cash-equivalent holdings and access to other funding sources. As required by the rule, the Program includes policies and procedures for classification of fund portfolio holdings in four liquidity categories, maintaining certain levels of highly liquid investments, and limiting holdings of illiquid investments.
The board of trustees of Vanguard World Fund approved the appointment of liquidity risk management program administrators responsible for administering Vanguard U.S. Growth Fund’s Program and for carrying out the specific responsibilities set forth in the Program, including reporting to the board on at least an annual basis regarding the Program’s operation, its adequacy, and the effectiveness of its implementation for the past year (the “Program Administrator Report”). The board has reviewed the Program Administrator Report covering the period from December 1, 2018, through December 31, 2019 (the “Review Period”). The Program Administrator Report stated that during the Review Period the Program operated and was implemented effectively to manage the fund’s liquidity risk.
This page intentionally left blank.
This page intentionally left blank.
This page intentionally left blank.
The People Who Govern Your Fund
The trustees of your mutual fund are there to see that the fund is operated and managed in your best interests since, as a shareholder, you are a part owner of the fund. Your fund’s trustees also serve on the board of directors of The Vanguard Group, Inc., which is owned by the Vanguard funds and provides services to them.
A majority of Vanguard’s board members are independent, meaning that they have no affiliation with Vanguard or the funds they oversee, apart from the sizable personal investments they have made as private individuals. The independent board members have distinguished backgrounds in business, academia, and public service. Each of the trustees and executive officers oversees 212 Vanguard funds.
Information for each trustee and executive officer of the fund appears below. That information, as well as the Vanguard fund count, is as of the date on the cover of this fund report. The mailing address of the trustees and officers is P.O. Box 876, Valley Forge, PA 19482. More information about the trustees is in the Statement of Additional Information, which can be obtained, without charge, by contacting Vanguard at 800-662-7447, or online at vanguard.com.
Interested Trustee1
Mortimer J. Buckley
Born in 1969. Trustee since January 2018. Principal occupation(s) during the past five years and other experience: chairman of the board (2019–present) of Vanguard and of each of the investment companies served by Vanguard; chief executive officer (2018– present) of Vanguard; chief executive officer, president, and trustee (2018–present) of each of the investment companies served by Vanguard; president and director (2017–present) of Vanguard; and president (2018–present) of Vanguard Marketing Corporation. Chief investment officer (2013–2017), managing director (2002–2017), head of the Retail Investor Group (2006–2012), and chief information officer (2001–2006) of Vanguard. Chairman of the board (2011–2017) and trustee (2009–2017) of the Children’s Hospital of Philadelphia; and trustee (2018–present) and vice chair (2019–present) of The Shipley School.
Independent Trustees
Emerson U. Fullwood
Born in 1948. Trustee since January 2008. Principal occupation(s) during the past five years and other experience: executive chief staff and marketing officer for North America and corporate vice president (retired 2008) of Xerox Corporation (document management products and services). Former president of the Worldwide Channels Group, Latin America, and Worldwide Customer Service and executive chief staff officer of Developing Markets of Xerox. Executive in residence and 2009–2010 Distinguished Minett Professor at the Rochester Institute of Technology. Director of SPX FLOW, Inc. (multi-industry manufac-turing). Director of the University of Rochester Medical Center, the Monroe Community College Foundation, the United Way of Rochester, North Carolina A&T University, and Roberts Wesleyan College. Trustee of the University of Rochester.
Amy Gutmann
Born in 1949. Trustee since June 2006. Principal occupation(s) during the past five years and other experience: president (2004–present) of the University of Pennsylvania. Christopher H. Browne Distinguished Professor of Political Science, School of Arts and Sciences, and professor of communication, Annenberg School for Communication, with secondary faculty appointments in the Department of Philosophy, School of Arts and Sciences, and at the Graduate School of Education, University of Pennsylvania.
F. Joseph Loughrey
Born in 1949. Trustee since October 2009. Principal occupation(s) during the past five years and other experience: president and chief operating officer (retired 2009) and vice chairman of the board (2008–2009) of Cummins Inc. (industrial machinery). Chairman of the board of Hillenbrand, Inc. (specialized consumer services) and the Lumina Foundation. Director of the V Foundation. Member of the advisory
1 Mr. Buckley is considered an “interested person,” as defined in the Investment Company Act of 1940, because he is an officer of the Vanguard funds.
council for the College of Arts and Letters and chair of the advisory board to the Kellogg Institute for International Studies, both at the University of Notre Dame.
Mark Loughridge
Born in 1953. Trustee since March 2012. Principal occupation(s) during the past five years and other experience: senior vice president and chief financial officer (retired 2013) of IBM (information technology services). Fiduciary member of IBM’s Retirement Plan Committee (2004–2013), senior vice president and general manager (2002–2004) of IBM Global Financing, vice president and controller (1998–2002) of IBM, and a variety of other prior management roles at IBM. Member of the Council on Chicago Booth.
Scott C. Malpass
Born in 1962. Trustee since March 2012. Principal occupation(s) during the past five years and other experience: chief investment officer (retired June 2020) and vice president (retired June 2020) of the University of Notre Dame. Assistant professor of finance at the Mendoza College of Business, University of Notre Dame, and member of the Notre Dame 403(b) Investment Committee (retired June 2020). Member of the board of Catholic Investment Services, Inc. (investment advisors) and the board of superintendence of the Institute for the Works of Religion.
Deanna Mulligan
Born in 1963. Trustee since January 2018. Principal occupation(s) during the past five years and other experience: chief executive officer (2011–present) of The Guardian Life Insurance Company of America. President (2010–2019), chief operating officer (2010–2011), and executive vice president (2008–2010) of Individual Life and Disability of The Guardian Life Insurance Company of America. Member of the board of The Guardian Life Insurance Company of America, the American Council of Life Insurers, and the Economic Club of New York. Trustee of the Partnership for New York City (business leadership), Chief Executives for Corporate Purpose, NewYork-Presbyterian Hospital, Catalyst, and the Bruce Museum (arts and science). Member of the Advisory Council for the Stanford Graduate School of Business.
André F. Perold
Born in 1952. Trustee since December 2004. Principal occupation(s) during the past five years and other experience: George Gund Professor of Finance and Banking, Emeritus at the Harvard Business School (retired 2011). Chief investment officer and co-managing partner of HighVista Strategies (private investment firm). Member of the board of advisors and member of the investment committee of the Museum of Fine Arts Boston. Member of the board (2018–present) of RIT Capital Partners (investment firm). Member of the investment committee of Partners Health Care System.
Sarah Bloom Raskin
Born in 1961. Trustee since January 2018. Principal occupation(s) during the past five years and other experience: deputy secretary (2014–2017) of the United States Department of the Treasury. Governor (2010–2014) of the Federal Reserve Board. Commissioner (2007–2010) of financial regulation for the State of Maryland. Member of the board of directors (2012–2014) of Neighborhood Reinvestment Corporation. Director (2017–present) of i(x) Investments, LLC; director (2017–present) of Reserve Trust. Rubenstein Fellow (2017–present) of Duke University; trustee (2017–present) of Amherst College, and trustee (2019–present) of the Folger Shakespeare Library.
Peter F. Volanakis
Born in 1955. Trustee since July 2009. Principal occupation(s) during the past five years and other experience: president and chief operating officer (retired 2010) of Corning Incorporated (communications equipment) and director of Corning Incorporated (2000–2010) and Dow Corning (2001–2010). Director (2012) of SPX Corporation (multi-industry manufacturing). Overseer of the Amos Tuck School of Business Administration, Dartmouth College (2001–2013). Chairman of the board of trustees of Colby-Sawyer College. Member of the board of Hypertherm Inc. (industrial cutting systems, software, and consumables).
Executive Officers
John Bendl
Born in 1970. Principal occupation(s) during the past five years and other experience: principal of Vanguard. Chief financial officer (2019–present) of each of the investment companies served by Vanguard. Chief accounting officer, treasurer, and controller of Vanguard (2017–present). Partner (2003–2016) at KPMG (audit, tax, and advisory services).
Glenn Booraem
Born in 1967. Principal occupation(s) during the past five years and other experience: principal of Vanguard. Investment stewardship officer (2017–present), treasurer (2015–2017), controller (2010–2015), and assistant controller (2001–2010) of each of the investment companies served by Vanguard.
Christine M. Buchanan
Born in 1970. Principal occupation(s) during the past five years and other experience: principal of Vanguard. Treasurer (2017–present) of each of the investment companies served by Vanguard. Partner (2005–2017) at KPMG (audit, tax, and advisory services).
David Cermak
Born in 1960. Principal occupation(s) during the past five years and other experience: principal of Vanguard. Finance director (2019–present) of each of the investment companies served by Vanguard. Managing director and head (2017–present) of Vanguard Investments Singapore. Managing director and head (2017–2019) of Vanguard Investments Hong Kong. Representative director and head (2014–2017) of Vanguard Investments Japan.
Thomas J. Higgins
Born in 1957. Principal occupation(s) during the past five years and other experience: principal of Vanguard. Finance director (2019–present), chief financial officer (2008–2019), and treasurer (1998–2008) of each of the investment companies served by Vanguard.
Peter Mahoney
Born in 1974. Principal occupation(s) during the past five years and other experience: principal of Vanguard. Controller (2015–present) of each of the investment companies served by Vanguard. Head of International Fund Services (2008–2014) at Vanguard.
Anne E. Robinson
Born in 1970. Principal occupation(s) during the past five years and other experience: general counsel (2016–present) of Vanguard. Secretary (2016–present) of Vanguard and of each of the investment companies served by Vanguard. Managing director (2016–present) of Vanguard. Managing director and general counsel of Global Cards and Consumer Services (2014–2016) at Citigroup. Counsel (2003–2014) at American Express.
Michael Rollings
Born in 1963. Principal occupation(s) during the past five years and other experience: finance director (2017–present) and treasurer (2017) of each of the investment companies served by Vanguard. Managing director (2016–present) of Vanguard. Chief financial officer (2016–present) of Vanguard. Director (2016–present) of Vanguard Marketing Corporation. Executive vice president and chief financial officer (2006–2016) of MassMutual Financial Group.
John E. Schadl
Born in 1972. Principal occupation(s) during the past five years and other experience: principal of Vanguard. Chief compliance officer (2019–present) of Vanguard and of each of the investment companies served by Vanguard. Assistant vice president (2019–present) of Vanguard Marketing Corporation.
Vanguard Senior Management Team
| Joseph Brennan | Chris D. McIsaac |
| Mortimer J. Buckley | James M. Norris |
| Gregory Davis | Thomas M. Rampulla |
| John James | Karin A. Risi |
| Martha G. King | Anne E. Robinson |
| John T. Marcante | Michael Rollings |
Connect with Vanguard® > vanguard.com
Fund Information > 800-662-7447
Direct Investor Account Services > 800-662-2739
Institutional Investor Services > 800-523-1036
Text Telephone for People Who Are Deaf or Hard of Hearing > 800-749-7273
This material may be used in conjunction with the offering of shares of any Vanguard fund only if preceded or accompanied by the fund’s current prospectus.
All comparative mutual fund data are from Morningstar, Inc., unless otherwise noted.
You can obtain a free copy of Vanguard’s proxy voting guidelines by visiting vanguard.com/proxyreporting or by calling Vanguard at 800-662-2739. The guidelines are also available from the SEC’s website, www.sec.gov. In addition, you may obtain a free report on how your fund voted the proxies for securities it owned during the 12 months ended June 30. To get the report, visit either vanguard.com/proxyreporting or www.sec.gov.
You can review information about your fund on the SEC’s website, and you can receive copies of this information, for a fee, by sending a request via email addressed to publicinfo@sec.gov.
Source for Bloomberg Barclays indexes: Bloomberg Index Services Limited. Copyright 2020, Bloomberg. All rights reserved.
CFA® is a registered trademark owned by CFA Institute.
| | © 2020 The Vanguard Group, Inc. |
| | All rights reserved. |
| | Vanguard Marketing Corporation, Distributor. |
| | |
| | Q230 102020 |

Annual Report | August 31, 2020 Vanguard International Growth Fund |
See the inside front cover for important information about access to your fund’s annual and semiannual shareholder reports. |
Important information about access to shareholder reports
Beginning on January 1, 2021, as permitted by regulations adopted by the Securities and Exchange Commission, paper copies of your fund’s annual and semiannual shareholder reports will no longer be sent to you by mail, unless you specifically request them. Instead, you will be notified by mail each time a report is posted on the website and will be provided with a link to access the report.
If you have already elected to receive shareholder reports electronically, you will not be affected by this change and do not need to take any action. You may elect to receive shareholder reports and other communications from the fund electronically by contacting your financial intermediary (such as a broker-dealer or bank) or, if you invest directly with the fund, by calling Vanguard at one of the phone numbers on the back cover of this report or by logging on to vanguard.com.
You may elect to receive paper copies of all future shareholder reports free of charge. If you invest through a financial intermediary, you can contact the intermediary to request that you continue to receive paper copies. If you invest directly with the fund, you can call Vanguard at one of the phone numbers on the back cover of this report or log on to vanguard.com. Your election to receive paper copies will apply to all the funds you hold through an intermediary or directly with Vanguard.
| Contents |
| |
| |
| Your Fund’s Performance at a Glance | 1 |
| |
| Advisors’ Report | 2 |
| |
| About Your Fund’s Expenses | 6 |
| |
| Performance Summary | 8 |
| |
| Financial Statements | 10 |
| |
| Liquidity Risk Management | 29 |
Please note: The opinions expressed in this report are just that—informed opinions. They should not be considered promises or advice. Also, please keep in mind that the information and opinions cover the period through the date on the front of this report. Of course, the risks of investing in your fund are spelled out in the prospectus.
Your Fund’s Performance at a Glance
• For the 12 months ended August 31, 2020, Vanguard International Growth Fund returned 53.60% for Investor Shares and 53.81% for Admiral Shares. The fund significantly outperformed its benchmark.
• A number of stock market indexes across the globe hit record highs in February then fell sharply as the coronavirus spread beyond China, leading many countries to close nonessential businesses, impose lockdowns, and restrict travel. Markets rose later in the fiscal year as policymakers implemented strong responses to the economic crisis, treatments for the virus improved, vaccine trials began, and countries started to ease some pandemic-related restrictions.
• The fund outperformed its benchmark in every major global economic region in which it was invested. Stock selection was particularly strong in Europe, North America, and emerging markets.
• The fund also outpaced its benchmark in most industry sectors. Stock selection in the consumer discretionary sector, particularly in internet and direct marketing retail companies, provided the biggest boost as consumers increasingly turned to online shopping and electronic payment systems. The fund also benefited from strong selection in communication services, health care, and information technology.
Market Barometer
| | | Average Annual Total Returns | |
| | | Periods Ended August 31, 2020 | |
| | | One Year | | Three Years | | Five Years | |
| Stocks | | | | | | | |
| Russell 1000 Index (Large-caps) | | 22.50% | | 14.58% | | 14.31% | |
| Russell 2000 Index (Small-caps) | | 6.02 | | 5.03 | | 7.65 | |
| Russell 3000 Index (Broad U.S. market) | | 21.44 | | 13.95 | | 13.86 | |
| FTSE All-World ex US Index (International) | | 8.78 | | 2.92 | | 6.00 | |
| | | | | | | | |
| Bonds | | | | | | | |
| Bloomberg Barclays U.S. Aggregate Bond Index | | | | | | | |
| (Broad taxable market) | | 6.47% | | 5.09% | | 4.33% | |
| Bloomberg Barclays Municipal Bond Index | | | | | | | |
| (Broad tax-exempt market) | | 3.24 | | 4.09 | | 3.99 | |
| FTSE Three-Month U.S. Treasury Bill Index | | 1.18 | | 1.67 | | 1.15 | |
| | | | | | | | |
| CPI | | | | | | | |
| Consumer Price Index | | 1.31% | | 1.92% | | 1.75% | |
Advisors’ Report
For the 12 months ended August 31, 2020, Vanguard International Growth Fund returned 53.60% for Investor Shares and 53.81% for Admiral Shares, besting the 8.31% return of its benchmark index. Your fund is managed by two independent advisors, a strategy that enhances the fund’s diversification by providing exposure to distinct yet complementary investment approaches. It is not uncommon for advisors to have different views about individual securities or the broader investment environment.
The advisors, the amount and percentage of fund assets each manages, and brief descriptions of their investment strategies are presented in the table below. The advisors have also prepared a discussion of the investment environment that existed during the fiscal year and of how the portfolio’s positioning reflects this assessment. These comments were prepared on September 18, 2020.
Baillie Gifford Overseas Ltd.
Portfolio Managers:
James K. Anderson, Head of Global Equities
Thomas Coutts, Head of International Growth
Conviction and long-termism: Two of the key tenets that are essential to good returns. They should also ensure that
Vanguard International Growth Fund Investment Advisors
| | | Fund Assets Managed | | |
| Investment Advisor | | % | $ Million | | Investment Strategy |
| Baillie Gifford Overseas Ltd. | 66 | 37,667 | The advisor seeks stocks that can generate |
| | | | | | above-average growth in earnings and cash |
| | | | | | flow, producing a bottom-up, stock-driven |
| | | | | | approach to country and asset allocation. An |
| | | | | | in-depth view on each company is measured |
| | | | | | against the consensus view, leading to |
| | | | | | discrepancies and potential opportunities to add |
| | | | | | value. |
Schroder Investment
Management North America Inc. | 32 | 18,009 | Equity analysts located around the world and an |
| | | | | international team of global sector specialists |
| | | | | | help to identify reasonably priced companies |
| | | | | | with strong growth prospects and a sustainable |
| | | | | | competitive advantage. |
| Cash Investments | 2 | 888 | These short-term reserves are invested by |
| | | | | | Vanguard in equity index products to simulate |
| | | | | | investment in stocks. Each advisor may also |
| | | | | | maintain a modest cash position. |
capital is allocated to companies that have the vision to tackle some of the biggest problems in our world and support those companies on the inevitable bumpy market ride to success.
The events that have unfolded since our last letter a year ago could never have been imagined or modeled. Although COVID-19 has brought great sadness and economic loss, it has accelerated change in the corporate world. It has also brought into sharp relief the sectors that have been resistant to change. Our long-term approach and desire to own outliers has already helped the portfolio invest in some developing future trends. Despite strong share price performance from many companies within the fund, the long-term prospects continue to look exciting.
The portfolio has continually evolved, and you should expect that to continue. The holdings today are almost unrecognizable from ten years ago, and we have been investing increasingly in disruptive growth companies. We are now seeing an acceleration in many of these disruptive trends, ranging from online food delivery to music streaming and e-commerce.
Strong contributors to recent performance included Chinese super app Meituan-Dianping, which has the lion’s share of the food delivery market, among other segments, in China. In a country with densely populated cities and efficient delivery mechanisms, the company has grown considerably since we first held it as an unlisted security in 2015. To convey some sense of the scale of the opportunity, U.S. company Grubhub delivers 650,000 meals per day, while Meituan averages nearly 25 million.
Another standout performer was new purchase Wix, the Israeli website building platform, which offers a customizable experience to small and medium-size enterprises looking for professional, easy-to-build websites. The pandemic is accelerating digitization of business, and for Wix, the virus lockdown served to increase demand from freelance workers who have been keen to create an online presence. Recent events may well have permanently removed any objections customers had to doing business online.
Japanese medical platform M3 was also a strong contributor. Nearly half of all doctors globally are using M3’s platform, which is seeing significant growth in both domestic and overseas markets.
There weren’t many detractors, but the pandemic weighed heavily on aerospace engine producer Rolls-Royce as the outlook for global travel remains bleak.
As the pace of change creates new opportunities for business models, so it enriches our opportunity set. Areas of the economy previously resistant to change, including health care, education, and fintech, are now opening up and being adopted more rapidly. Among several new purchases and sales, we have pivoted away from core banking holdings BBVA and Svenska Handelsbanken and instead
taken positions in Australian payments business Afterpay and Dutch payment services company Adyen.
In the health care sector, we sold Elekta, a Swedish radiotherapy equipment maker, and Celltrion, a South Korean producer of biosimilar drugs, as our conviction in the upside weakened. We added Argenx, a Belgian manufacturer of antibody-based drugs, and also added to our existing private holding in CureVac as it became a listed entity.
Schroder Investment Management North America Inc.
Portfolio Manager:
Simon Webber, CFA
International equities gained over the fiscal year despite the dramatic sell-off in the early months of 2020 as the economic impact of the COVID-19 pandemic became apparent. The strength of the subsequent recovery was supported by unprecedented levels of peacetime monetary and fiscal stimulus measures by central banks and governments throughout the world.
Companies exposed to travel, retailing, banking, and energy were particularly hard hit by the effects of lockdowns, while businesses that are able to provide digital and online services flourished. The pandemic has accelerated many of the underlying structural changes that were already underway, increasing the rewards to companies that are well-invested in their digital operations.
Stock selection supported strong relative performance throughout the year, with the largest contributions from the information technology, industrial, and health care sectors. It is clear that electrification and the shift to renewable energy continues to accelerate, and our exposure to environmental technologies through Vestas Wind Systems and Schneider Electric was very supportive as investors wake up to this megatrend.
Our exposure to disruptive e-commerce platform stocks, such as Alibaba and Meituan Dianping in China and Mercado Libre in Latin America, also helped. The lockdown forced new consumers to use these platforms, and many of them are unlikely go back to historical offline consumption patterns.
Mercado Libre is Latin America’s leading e-commerce platform and remains well-positioned to benefit from increased penetration. We also believe that the company’s payment platform is emerging as a powerful business both on and off its shopping platform and is an unappreciated driver of future earnings.
U.K. hotel operator Whitbread performed poorly, as it was forced to close hotels for several months. Although the severity of the downturn is unprecedented for hotel
operators, we are confident that Whitbread, having strengthened the balance sheet, will now be in an improved competitive position.
The market dislocation in the spring gave us the opportunity to build new positions in a number of consumer companies, including Danish jewelery company Pandora, Swiss chocolate company Lindt, and U.K. retailer Next. Next has a well-established online presence, and this strong investment in its digital operations is helping it weather the crisis significantly better than many of its peers. We expect a large retrenchment in capacity from competitor retailers that will allow Next to gain market share.
Looking forward, the lifting of pandemic restrictions and the large fiscal and monetary support programs globally mean we are now in an economic recovery phase. Many people still look to the past for how quickly industries will recover. However, we believe that there have been permanent changes in the way people will work, consume, and socialize. This will mean that some industries and companies will build back faster, while others will never recover.
One example of this is the positive experience with working flexibly that many companies and employees have had. We expect this to have a major impact on where people choose to live and how much they invest in their homes as a place of work as well as shelter.
Many governments have also discovered a clear alignment between the need for investment programs to stimulate growth and their ambition to accelerate the transition away from fossil fuels. The European Union, in particular, has focused its recovery plan on expanding the use of renewable energy, upgrading building stock, and accelerating the transition to electric vehicles. We have attempted to position the portfolio well for all of these trends, and we are optimistic that this period of change and innovation will remain a robust environment for fundamental active management.
About Your Fund’s Expenses
As a shareholder of the fund, you incur ongoing costs, which include costs for portfolio management, administrative services, and shareholder reports (like this one), among others. Operating expenses, which are deducted from a fund’s gross income, directly reduce the investment return of the fund.
A fund’s expenses are expressed as a percentage of its average net assets. This figure is known as the expense ratio. The following examples are intended to help you understand the ongoing costs (in dollars) of investing in your fund and to compare these costs with those of other mutual funds. The examples are based on an investment of $1,000 made at the beginning of the period shown and held for the entire period.
The accompanying table illustrates your fund’s costs in two ways:
• Based on actual fund return. This section helps you to estimate the actual expenses that you paid over the period. The ”Ending Account Value“ shown is derived from the fund‘s actual return, and the third column shows the dollar amount that would have been paid by an investor who started with $1,000 in the fund. You may use the information here, together with the amount you invested, to estimate the expenses that you paid over the period.
To do so, simply divide your account value by $1,000 (for example, an $8,600 account value divided by $1,000 = 8.6), then multiply the result by the number given for your fund under the heading ”Expenses Paid During Period.“
• Based on hypothetical 5% yearly return. This section is intended to help you compare your fund‘s costs with those of other mutual funds. It assumes that the fund had a yearly return of 5% before expenses, but that the expense ratio is unchanged. In this case—because the return used is not the fund’s actual return—the results do not apply to your investment. The example is useful in making comparisons because the Securities and Exchange Commission requires all mutual funds to calculate expenses based on a 5% return. You can assess your fund’s costs by comparing this hypothetical example with the hypothetical examples that appear in shareholder reports of other funds.
Note that the expenses shown in the table are meant to highlight and help you compare ongoing costs only and do not reflect transaction costs incurred by the fund for buying and selling securities. Further, the expenses do not include any purchase, redemption, or account service fees described in the fund prospectus. If such fees were applied to your account, your costs would be higher. Your fund does not carry a “sales load.”
The calculations assume no shares were bought or sold during the period. Your actual costs may have been higher or lower, depending on the amount of your investment and the timing of any purchases or redemptions.
You can find more information about the fund’s expenses, including annual expense ratios, in the Financial Statements section of this report. For additional information on operating expenses and other shareholder costs, please refer to your fund’s current prospectus.
Six Months Ended August 31, 2020
| | Beginning | Ending | Expenses |
| | Account Value | Account Value | Paid During |
| International Growth Fund | 2/29/2020 | 8/31/2020 | Period |
| Based on Actual Fund Return | | | |
| Investor Shares | $1,000.00 | $1,401.89 | $2.66 |
| Admiral™ Shares | 1,000.00 | 1,403.00 | 1.99 |
| Based on Hypothetical 5% Yearly Return | | | |
| Investor Shares | $1,000.00 | $1,022.92 | $2.24 |
| Admiral Shares | 1,000.00 | 1,023.48 | 1.68 |
The calculations are based on expenses incurred in the most recent six-month period. The fund’s annualized six-month expense ratios for that period are 0.44% for Investor Shares and 0.33% for Admiral Shares. The dollar amounts shown as “Expenses Paid” are equal to the annualized expense ratio multiplied by the average account value over the period, multiplied by the number of days in the most recent six-month period, then divided by the number of days in the most recent 12-month period (184/366).
International Growth Fund
Performance Summary
All of the returns in this report represent past performance, which is not a guarantee of future results that may be achieved by the fund. (Current performance may be lower or higher than the performance data cited. For performance data current to the most recent month-end, visit our website at vanguard.com/performance.) Note, too, that both investment returns and principal value can fluctuate widely, so an investor’s shares, when sold, could be worth more or less than their original cost. The returns shown do not reflect taxes that a shareholder would pay on fund distributions or on the sale of fund shares.
Cumulative Performance: August 31, 2010, Through August 31, 2020
Initial Investment of $10,000
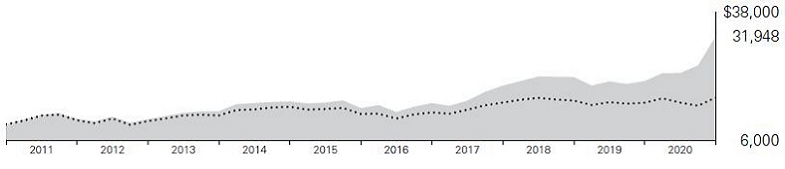
| | | Average Annual Total Returns | |
| | | Periods Ended August 31, 2020 | |
| | | | | | Final Value |
| | | One | Five | Ten | of a $10,000 |
| | | Year | Years | Years | Investment |
 | International Growth Fund Investor Shares | 53.60% | 17.88% | 12.32% | $31,948 |
 | MSCI All Country World Index ex USA | 8.31 | 5.75 | 5.26 | 16,691 |
| | | | | Final Value |
| | One | Five | Ten | of a $50,000 |
| | Year | Years | Years | Investment |
| International Growth Fund Admiral Shares | 53.81% | 18.02% | 12.46% | $161,727 |
| MSCI All Country World Index ex USA | 8.31 | 5.75 | 5.26 | 83,454 |
See Financial Highlights for dividend and capital gains information.
International Growth Fund
Fund Allocation
As of August 31, 2020
| Communication Services | 9.7% |
| Consumer Discretionary | 41.1 |
| Consumer Staples | 4.4 |
| Energy | 0.9 |
| Financials | 7.8 |
| Health Care | 11.7 |
| Industrials | 8.6 |
| Information Technology | 12.1 |
| Materials | 2.6 |
| Other | 0.4 |
| Utilities | 0.7 |
The table reflects the fund’s investments, except for short-term investments and derivatives. Sector categories are based on the Global Industry Classification Standard ("GICS"), except for the "Other" category (if applicable), which includes securities that have not been provided a GICS classification as of the effective report-ing period.
The Global Industry Classification Standard (“GICS”) was developed by and is the exclusive property and a service mark of MSCI Inc. (“MSCI”) and Standard and Poor’s, a division of McGraw-Hill Companies, Inc. (“S&P”), and is licensed for use by Vanguard. Neither MSCI, S&P nor any third party involved in making or compiling the GICS or any GICS classification makes any express or implied warranties or representations with respect to such standard or classification (or the results to be obtained by the use thereof), and all such parties hereby expressly disclaim all warranties of originality, accuracy, completeness, merchantability or fitness for a particular purpose with respect to any such standard or classification. Without limiting any of the foregoing, in no event shall MSCI, S&P, any of its affiliates or any third party involved in making or compiling the GICS or any GICS classification have any liability for any direct, indirect, special, punitive, consequential or any other damages (including lost profits) even if notified of the possibility of such damages.
International Growth Fund
Financial Statements
Schedule of Investments
As of August 31, 2020
The fund files its complete schedule of portfolio holdings with the Securities and Exchange Commission (SEC) for the first and third quarters of each fiscal year as an exhibit to its reports on Form N-PORT. The fund’s Form N-PORT reports are available on the SEC’s website at www.sec.gov.
| | | | | | | Market | |
| | | | | | | Value• | |
| | | | | Shares | | $(000 | ) |
| Common Stocks (97.1%) | | | | | |
| Australia (0.4%) | | | | | |
| * | | Afterpay Ltd. | | 3,466,679 | | 233,893 | |
| | | | | | | | |
| Austria (0.3%) | | | | | |
| * | | Erste Group Bank AG | | 7,642,788 | | 185,597 | |
| | | | | | | | |
| Belgium (1.3%) | | | | | |
| ^ | | Umicore SA | | 11,762,217 | | 539,890 | |
| | | Ucb SA | | 1,710,335 | | 202,996 | |
| | | | | | | 742,886 | |
| Brazil (0.3%) | | | | | |
| | | B3 SA - Brasil Bolsa Balcao | | 9,148,859 | | 98,193 | |
| | | Raia Drogasil SA | | 4,247,444 | | 83,577 | |
| | | | | | | 181,770 | |
| Canada (0.7%) | | | | | |
| | | Canadian National Railway Co. | | 1,983,850 | | 208,461 | |
| | | Toronto-Dominion Bank | | 3,300,276 | | 164,641 | |
| | | | | | | 373,102 | |
| China (14.4%) | | | | | |
| | | Tencent Holdings Ltd. | | 43,115,500 | | 2,945,580 | |
| * | | Meituan Dianping Class B | | 45,843,130 | | 1,511,182 | |
| * | | TAL Education Group ADR | | 18,485,132 | | 1,364,388 | |
| * | | Alibaba Group Holding Ltd. ADR | | 2,736,991 | | 785,598 | |
| *,^ | | NIO Inc. ADR | | 31,223,162 | | 594,177 | |
| | | Ping An Insurance Group Co. of China Ltd. | | 37,534,500 | | 400,733 | |
| * | | Baidu Inc. ADR | | 2,041,992 | | 254,371 | |
| | | China Mengniu Dairy Co. Ltd. | | 37,416,000 | | 183,746 | |
| * | | iQIYI Inc. ADR | | 3,074,164 | | 66,556 | |
| | | Kingdee International Software Group Co. Ltd. | | 13,068,000 | | 33,261 | |
| | | | | | | 8,139,592 | |
| Denmark (3.4)% | | | | | |
| * | | Genmab A/S | | 2,594,661 | | 979,162 | |
| | | Vestas Wind Systems A/S | | 2,404,518 | | 363,544 | |
| | | Chr Hansen Holding A/S | | 1,658,818 | | 190,395 | |
| | | Ambu A/S Class B | | 5,449,774 | | 160,392 | |
| | | Novozymes A/S | | 2,401,809 | | 141,934 | |
| | | Pandora A/S | | 1,473,925 | | 107,591 | |
| | | | | | | 1,943,018 | |
| France (6.4)% | | | | | |
| | | Kering SA | | 2,757,296 | | 1,691,792 | |
| | | L’Oreal SA | | 2,310,130 | | 766,623 | |
| | | Schneider Electric SE | | 5,538,667 | | 684,981 | |
| | | Danone SA | | 3,245,555 | | 213,418 | |
| * | | Alstom SA | | 3,040,466 | | 169,731 | |
| * | | EssilorLuxottica SA | | 577,099 | | 77,254 | |
| | | | | | | 3,603,799 | |
| Germany (8.1)% | | | | | |
| *,1 | | Zalando SE | | 10,466,867 | | 916,992 | |
| *,1 | | Delivery Hero SE | | 7,081,486 | | 761,836 | |
| *,2 | | HelloFresh SE | | 10,552,945 | | 543,702 | |
| | | SAP SE | | 2,474,941 | | 409,222 | |
| | | Infineon Technologies AG | | 13,360,922 | | 371,522 | |
| | | Bayerische Motoren Werke AG | | 4,233,608 | | 305,075 | |
| * | | adidas AG | | 824,895 | | 251,016 | |
| | | GEA Group AG | | 4,886,803 | | 178,441 | |
| | | Allianz SE | | 786,148 | | 170,586 | |
| | | Basf SE | | 2,275,881 | | 138,981 | |
| | | Continental AG | | 1,068,108 | | 117,194 | |
| | | Knorr-Bremse AG | | 757,446 | | 96,247 | |
| * | | MorphoSys AG | | 664,989 | | 84,155 | |
| *,3 | | CureVac GMBH | | 1,676,780 | | 83,121 | |
| *,1 | | Rocket Internet SE | | 2,762,933 | | 62,653 | |
| | | Jumia Technologies AG ADR | | 6,724,836 | | 61,801 | |
| *,^,2 | | Home24 SE | | 1,862,256 | | 23,358 | |
| *,^ | | CureVac NV | | 228,956 | | 12,611 | |
| | | | | | | 4,588,513 | |
International Growth Fund
| | | | | | | Market | |
| | | | | | | Value• | |
| | | | | Shares | | $(000 | ) |
| Hong Kong (6.9%) | | | | | |
| | | Alibaba Group Holding Ltd. | | 72,179,856 | | 2,589,724 | |
| | | AIA Group Ltd. | | 85,505,400 | | 875,982 | |
| | | Hong Kong Exchanges & Clearing Ltd. | | 8,559,843 | | 431,591 | |
| | | | | | | 3,897,297 | |
| India (1.0%) | | | | | |
| | | Housing Development Finance Corp. Ltd. | | 11,680,736 | | 291,365 | |
| | | HDFC Bank Ltd. | | 13,560,775 | | 205,772 | |
| | | Larsen & Toubro Ltd. | | 3,196,430 | | 41,021 | |
| *,§,3 | | ANI Technologies | | 166,185 | | 24,196 | |
| | | | | | | 562,354 | |
| Indonesia (0.3%) | | | | | |
| | | Bank Central Asia Tbk PT | | 76,464,600 | | 164,702 | |
| | | | | | | | |
| Israel (0.7%) | | | | | |
| * | | Wix.com Ltd. | | 917,880 | | 270,435 | |
| * | | Check Point Software Technologies Ltd. | | 1,056,788 | | 133,430 | |
| | | | | | | 403,865 | |
| Italy (2.2%) | | | | | |
| | | Ferrari NV | | 4,745,012 | | 926,270 | |
| * | | Intesa Sanpaolo SPA | | 79,807,944 | | 171,789 | |
| * | | Fiat Chrysler Automobiles NV | | 13,737,294 | | 152,257 | |
| | | | | | | 1,250,316 | |
| Japan (9.7%) | | | | | |
| | | M3 Inc. | | 26,545,800 | | 1,537,760 | |
| | | Nidec Corp. | | 12,010,900 | | 1,008,079 | |
| | | SMC Corp. | | 1,202,800 | | 660,961 | |
| | | SoftBank Group Corp. | | 8,401,800 | | 519,704 | |
| | | Sony Corp. | | 3,555,600 | | 278,419 | |
| | | Takeda Pharmaceutical Co. Ltd. | | 7,184,100 | | 267,875 | |
| | | Recruit Holdings Co. Ltd. | | 6,492,500 | | 246,069 | |
| | | Nintendo Co. Ltd. | | 382,000 | | 205,634 | |
| | | Pigeon Corp. | | 3,300,800 | | 150,821 | |
| | | Murata Manufacturing Co. Ltd. | | 2,359,700 | | 139,555 | |
| | | Sekisui Chemical Co. Ltd. | | 7,824,600 | | 125,181 | |
| | | Toyota Motor Corp. | | 1,817,900 | | 120,062 | |
| | | Suzuki Motor Corp. | | 2,743,900 | | 112,330 | |
| | | SBI Holdings Inc. | | 4,470,400 | | 101,634 | |
| | | | | | | 5,474,084 | |
| Netherlands (7.5%) | | | | | |
| | | ASML Holding NV | | 7,417,071 | | 2,771,829 | |
| *,1 | | Adyen NV | | 462,877 | | 780,256 | |
| * | | Argenx SE | | 1,249,105 | | 289,470 | |
| | | Koninklijke Philips NV | | 4,897,675 | | 231,765 | |
| | | Exor NV | | 3,303,396 | | 194,831 | |
| | | | | | | 4,268,151 | |
| New Zealand (0.0)% | | | | | |
| * | | Xero Ltd. | | 342,207 | | 25,440 | |
| | | | | | | | |
| Norway (0.7)% | | | | | |
| ^ | | Equinor ASA | | 13,704,027 | | 221,755 | |
| * | | Dnb ASA | | 10,818,511 | | 173,303 | |
| | | | | | | 395,058 | |
| South Korea (1.0)% | | | | | |
| | | Samsung Electronics Co. Ltd. | | 7,774,158 | | 352,995 | |
| | | Samsung SDI Co. Ltd. | | 539,871 | | 204,987 | |
| | | | | | | 557,982 | |
| Spain (1.9)% | | | | | |
| | | Industria de Diseno Textil SA | | 21,245,632 | | 597,374 | |
| * | | Iberdrola SA | | 24,784,116 | | 312,701 | |
| | | Banco Bilbao Vizcaya Argentaria SA | | 53,411,162 | | 156,416 | |
| | | | | | | 1,066,491 | |
| Sweden (4.6)% | | | | | |
| * | | Spotify Technology SA | | 4,839,569 | | 1,365,533 | |
| | | Atlas Copco AB Class A | | 12,963,440 | | 599,999 | |
| * | | Kinnevik AB (Ordinary Shares) | | 10,340,628 | | 401,088 | |
| | | Assa Abloy AB Class B | | 6,351,227 | | 147,134 | |
| * | | Svenska Handelsbanken AB Class A | | 7,153,957 | | 71,968 | |
| * | | Kinnevik AB (Redemption Shares) | | 10,340,628 | | 8,309 | |
| | | | | | | 2,594,031 | |
| Switzerland (4.7)% | | | | | |
| | | Roche Holding AG | | 1,869,402 | | 653,952 | |
| | | Nestle SA | | 4,877,671 | | 587,502 | |
| | | Lonza Group AG | | 445,275 | | 276,700 | |
| ^ | | Temenos AG | | 1,611,775 | | 260,379 | |
| | | Novartis AG | | 2,774,856 | | 239,157 | |
| | | Cie Financiere Richemont SA | | 2,434,690 | | 162,100 | |
| | | Chocoladefabriken Lindt & Spruengli AG | | 17,191 | | 146,557 | |
| | | Sika AG | | 496,377 | | 118,687 | |
| * | | Alcon Inc. | | 1,871,669 | | 106,492 | |
| | | Straumann Holding AG | | 106,125 | | 104,738 | |
| | | | | | | 2,656,264 | |
| Taiwan (1.1)% | | | | | |
| | | Taiwan Semiconductor Manufacturing Co. Ltd. | | 43,816,000 | | 638,622 | |
International Growth Fund
| | | | | | | Market | |
| | | | | | | Value• | |
| | | | | Shares | | ($000 | ) |
| United Kingdom (5.1%) | | | | | |
| * | | Ocado Group plc | | 25,241,665 | | 840,677 | |
| | | Diageo plc | | 8,929,138 | | 298,334 | |
| | | BHP Group plc | | 12,518,629 | | 284,953 | |
| | | Bunzl plc | | 5,927,725 | | 191,225 | |
| | | Royal Dutch Shell plc Class A (XETR) | | 11,500,265 | | 171,152 | |
| | | Whitbread plc | | 4,919,669 | | 165,917 | |
| | | Next plc | | 1,870,089 | | 149,845 | |
| | | Rolls-Royce Holdings plc | | 46,651,516 | | 147,312 | |
| | | Burberry Group plc | | 7,216,783 | | 137,791 | |
| | | Smith & Nephew plc | | 6,826,861 | | 137,771 | |
| | | GlaxoSmithKline plc | | 7,043,173 | | 137,577 | |
| | | Royal Dutch Shell plc Class A (XAMS) | | 7,096,095 | | 105,457 | |
| | | National Grid plc | | 7,946,156 | | 88,998 | |
| | | | | | | 2,857,009 | |
| United States (14.4%) | | | | | |
| * | | Tesla Inc. | | 6,720,660 | | 3,349,039 | |
| * | | MercadoLibre Inc. | | 1,902,576 | | 2,223,331 | |
| * | | Amazon.com Inc. | | 399,301 | | 1,377,972 | |
| * | | Illumina Inc. | | 2,850,001 | | 1,018,078 | |
| * | | Booking Holdings Inc. | | 97,417 | | 186,110 | |
| | | | | | | 8,154,530 | |
| Total Common Stocks | | | | | |
| (Cost $27,759,752) | | | | 54,958,366 | |
| Preferred Stocks (0.3%) | | | | | |
| *,§,2,3,4 You & Mr. Jones | | 44,800,000 | | 143,808 | |
| Total Preferred Stocks | | | | | |
| (Cost $44,800) | | | | 143,808 | |
| Temporary Cash Investments (3.3%) | | | |
| Money Market Fund (3.2%) | | | |
| 5,6 | | Vanguard Market Liquidity Fund, 0.147% | | 17,953,637 | | 1,795,364 | |
| | | | | Face | | | |
| | | | | Amount | | | |
| | | | | ($000 | ) | | |
| U.S. Government and Agency Obligations (0.1%) | |
| 7 | | United States Cash Management Bill, 0.210%, 9/15/20 | | 6,180 | | 6,180 | |
| 7 | | United States Cash Management Bill, 0.116%, 9/29/20 | | 23,000 | | 22,998 | |
| 7 | | United States Cash Management Bill, 0.140%,10/13/20 | | 17,000 | | 16,998 | |
| 7 | | United States Cash Management Bill, 0.145%, 12/15/20 | | 31,100 | | 31,090 | |
| 7 | | United States Treasury Bill, 0.087%, 9/24/20 | | 2,500 | | 2,500 | |
| | | | | | | 79,766 | |
| Total Temporary Cash Investments | | | |
| (Cost $1,874,942) | | | | 1,875,130 | |
| Total Investments (100.7%) | | | | | |
| (Cost $29,679,494) | | | | 56,977,304 | |
| Other Assets and Liabilities—Net (-0.7%) | | | | (413,320 | ) |
| Net Assets (100%) | | 56,563,984 | |
Cost is in $000.
| • | See Note A in Notes to Financial Statements. * Non-income-producing security. |
| ^ | Includes partial security positions on loan to broker-dealers. The total value of securities on loan is $430,637,000. |
| § | Security value determined using significant unobservable inputs. |
| 1 | Security exempt from registration under Rule 144A of the Securities Act of 1933. Such securities may be sold in transactions exempt from registration, normally to qualified institutional buyers. At August 31, 2020, the aggregate value of these securities was $2,521,737,000, representing 4.5% of net assets. |
| 2 | Considered an affiliated company of the fund as the fund owns more than 5% of the outstanding voting securities of such company. |
| 3 | Restricted securities totaling $251,125,000, representing 0.4% of net assets. See Restricted Securities table for additional information. |
| 4 | Perpetual security with no stated maturity date. |
| 5 | Affiliated money market fund available only to Vanguard funds and certain trusts and accounts managed by Vanguard. Rate shown is the 7-day yield. |
| 6 | Collateral of $439,398,000 was received for securities on loan, of which $439,221,000 is held in Vanguard Market Liquidity Fund and $177,000 is held in cash. |
| 7 | Securities with a value of $77,846,000 have been segregated as initial margin for open futures contracts.
ADR—American Depositary Receipt. |
International Growth Fund
| Restricted Securities as of Period End |
| | | | | | | | Acquisition |
| | | | | | | Acquisition | Cost |
| Security Name | | | | | | Date | ($000) |
| You & Mr. Jones | | | | | September 2015 | 44,800 |
| CureVac GmbH | | | | | October 2015 | 30,882 |
| ANI Technologies | | | | | December 2015 | 51,748 |
| | | | | | | |
| | | | |
| Derivative Financial Instruments Outstanding as of Period End | | | |
| | | | |
| Futures Contracts | | | | | | | |
| | | | | | | | ($000) |
| | | | | | | | Value and |
| | | | | Number of | | Unrealized |
| | | | | Long (Short) | Notional | Appreciation |
| | | | Expiration | Contracts | Amount | (Depreciation) |
| Long Futures Contracts | | | | | | | |
| MSCI EAFE Index | | September 2020 | | 6,248 | 593,591 | 9,427 |
| MSCI Emerging Market Index | | September 2020 | | 4,811 | 264,701 | 3,008 |
| | | | | | | | 12,435 |
| | | | | | | | |
| Forward Currency Contracts | | | | | | | |
| | Contract | | | | | Unrealized | Unrealized |
| Settlement | | Contract Amount (000) | Appreciation | (Depreciation) |
| Counterparty | Date | | Receive | | Deliver | ($000) | ($000) |
| BNP Paribas | 10/6/20 | EUR | 128,537 | USD | 145,176 | 8,337 | — |
| UBS AG | 10/6/20 | JPY | 11,426,018 | USD | 107,125 | 807 | — |
| Toronto-Dominion Bank | 10/6/20 | AUD | 102,172 | USD | 70,053 | 5,314 | — |
| Morgan Stanley Capital Services LLC | 10/6/20 | GBP | 42,819 | USD | 53,192 | 4,060 | — |
| Bank of America, N.A. | 10/6/20 | USD | 73,129 | EUR | 65,000 | — | (4,502) |
| JPMorgan Chase Bank, N.A. | 10/6/20 | USD | 71,645 | EUR | 63,537 | — | (4,238) |
| Toronto-Dominion Bank | 10/6/20 | USD | 70,234 | AUD | 102,171 | — | (5,133) |
| Citibank, N.A. | 10/6/20 | USD | 57,320 | JPY | 6,135,882 | — | (641) |
| Bank of America, N.A. | 10/6/20 | USD | 53,415 | GBP | 42,819 | — | (3,838) |
| BNP Paribas | 10/6/20 | USD | 49,286 | JPY | 5,290,139 | — | (685) |
| | | | | | | 18,518 | (19,037) |
AUD—Australian dollar.
EUR—euro.
GBP—British pound.
JPY—Japanese yen.
USD—U.S. dollar.
At August 31, 2020, the counterparties had deposited in segregated accounts securities with a value of $8,502,000 and cash of $4,100,000 in connection with open forward currency contracts.
See accompanying Notes, which are an integral part of the Financial Statements.
International Growth Fund
Statement of Assets and Liabilities
As of August 31, 2020
| ($000s, except shares and per-share amounts) | Amount |
| Assets | |
| Investments in Securities, at Value | |
| Unaffiliated Issuers (Cost $27,510,214) | 54,409,271 |
| Affiliated Issuers (Cost $2,169,280) | 2,568,033 |
| Total Investments in Securities | 56,977,304 |
| Investment in Vanguard | 2,197 |
| Foreign Currency, at Value (Cost $12,303) | 12,530 |
| Cash Collateral Pledged—Forward Currency Contracts | 12,810 |
| Receivables for Investment Securities Sold | 47,809 |
| Receivables for Accrued Income | 51,545 |
| Receivables for Capital Shares Issued | 83,224 |
| Unrealized Appreciation—Forward Currency Contracts | 18,518 |
| Other Assets | 2,630 |
| Total Assets | 57,208,567 |
| Liabilities | |
| Due to Custodian | 10,451 |
| Payables for Investment Securities Purchased | 100,217 |
| Collateral for Securities on Loan | 439,398 |
| Payables for Capital Shares Redeemed | 38,937 |
| Payables to Investment Advisor | 21,859 |
| Payables to Vanguard | 4,669 |
| Variation Margin Payable—Futures Contracts | 10,015 |
| Unrealized Depreciation—Forward Currency Contracts | 19,037 |
| Total Liabilities | 644,583 |
| Net Assets | 56,563,984 |
| | |
| At August 31, 2020, net assets consisted of: | |
| | |
| Paid-in Capital | 28,009,661 |
| Total Distributable Earnings (Loss) | 28,554,323 |
| Net Assets | 56,563,984 |
| | |
| Investor Shares—Net Assets | |
| Applicable to 224,885,735 outstanding $.001 par value shares of beneficial interest (unlimited authorization) | 9,657,539 |
| Net Asset Value Per Share—Investor Shares | $42.94 |
| | |
| Admiral Shares—Net Assets | |
| Applicable to 343,182,711 outstanding $.001 par value shares of beneficial interest (unlimited authorization) | 46,906,445 |
| Net Asset Value Per Share—Admiral Shares | $136.68 |
See accompanying Notes, which are an integral part of the Financial Statements.
International Growth Fund
Statement of Operations
| | Year Ended |
| | August 31, 2020 |
| | ($000) |
| Investment Income | |
| Income | |
| Dividends—Unaffiliated Issuers1 | 458,121 |
| Dividends—Affiliated Issuers | 397 |
| Interest—Unaffiliated Issuers | 293 |
| Interest—Affiliated Issuers | 6,713 |
| Securities Lending—Net | 18,088 |
| Total Income | 483,612 |
| Expenses | |
| Investment Advisory Fees—Note B | |
| Basic Fee | 58,605 |
| Performance Adjustment | 15,743 |
| The Vanguard Group—Note C | |
| Management and Administrative—Investor Shares | 18,317 |
| Management and Administrative—Admiral Shares | 45,662 |
| Marketing and Distribution—Investor Shares | 803 |
| Marketing and Distribution—Admiral Shares | 2,028 |
| Custodian Fees | 3,235 |
| Auditing Fees | 45 |
| Shareholders’ Reports—Investor Shares | 167 |
| Shareholders’ Reports—Admiral Shares | 319 |
| Trustees’ Fees and Expenses | 65 |
| Total Expenses | 144,989 |
| Net Investment Income | 338,623 |
| Realized Net Gain (Loss) | |
| Investment Securities Sold—Unaffiliated Issuers | 1,300,062 |
| Investment Securities Sold—Affiliated Issuers | 13,228 |
| Futures Contracts | (12,544) |
| Forward Currency Contracts | (3,179) |
| Foreign Currencies | (1,932) |
| Realized Net Gain (Loss) | 1,295,635 |
| Change in Unrealized Appreciation (Depreciation) | |
| Investment Securities—Unaffiliated Issuers | 17,261,292 |
| Investment Securities—Affiliated Issuers | 418,637 |
| Futures Contracts | 13,746 |
| Forward Currency Contracts | 4,899 |
| Foreign Currencies | 4,220 |
| Change in Unrealized Appreciation (Depreciation) | 17,702,794 |
| Net Increase (Decrease) in Net Assets Resulting from Operations | 19,337,052 |
| 1 | Dividends are net of foreign withholding taxes of $49,939,000. |
See accompanying Notes, which are an integral part of the Financial Statements.
International Growth Fund
Statement of Changes in Net Assets
| | Year Ended August 31, |
| | 2020 | 2019 |
| | ($000) | ($000) |
| Increase (Decrease) in Net Assets | | |
| Operations | | |
| Net Investment Income | 338,623 | 457,175 |
| Realized Net Gain (Loss) | 1,295,635 | (32,262) |
| Change in Unrealized Appreciation (Depreciation) | 17,702,794 | (2,156,633) |
| Net Increase (Decrease) in Net Assets Resulting from Operations | 19,337,052 | (1,731,720) |
| Distributions1 | | |
| Investor Shares | (94,219) | (336,132) |
| Admiral Shares | (424,749) | (1,277,967) |
| Total Distributions | (518,968) | (1,614,099) |
| Capital Share Transactions | | |
| Investor Shares | (760,869) | (284,833) |
| Admiral Shares | 2,901,570 | 1,992,089 |
| Net Increase (Decrease) from Capital Share Transactions | 2,140,701 | 1,707,256 |
| Total Increase (Decrease) | 20,958,785 | (1,638,563) |
| Net Assets | | |
| Beginning of Period | 35,605,199 | 37,243,762 |
| End of Period | 56,563,984 | 35,605,199 |
1 Certain prior period numbers have been reclassified to conform with current period presentation.
See accompanying Notes, which are an integral part of the Financial Statements.
International Growth Fund
Financial Highlights
Investor Shares
| For a Share Outstanding | | | | Year Ended August 31, | |
| Throughout Each Period | | 2020 | 2019 | 2018 | 2017 | 2016 | |
| Net Asset Value, Beginning of Period | | $28.30 | $31.23 | $28.38 | $22.38 | $20.83 | |
| Investment Operations | | | | | | | |
| Net Investment Income | | .2381 | .3421 | .3811 | .2401 | .304 | |
| Net Realized and Unrealized Gain (Loss) on Investments | | 14.791 | (1.941) | 2.722 | 6.028 | 1.539 | |
| Total from Investment Operations | | 15.029 | (1.599) | 3.103 | 6.268 | 1.843 | |
| Distributions | | | | | | | |
| Dividends from Net Investment Income | | (.389) | (.403) | (.253) | (.268) | (.293) | |
| Distributions from Realized Capital Gains | | — | (.928) | — | — | — | |
| Total Distributions | | (.389) | (1.331) | (.253) | (.268) | (.293) | |
| Net Asset Value, End of Period | | $42.94 | $28.30 | $31.23 | $28.38 | $22.38 | |
| | | | | | | | |
| Total Return2 | | 53.60% | -4.58% | 10.97% | 28.43% | 8.95% | |
| | | | | | | | |
| Ratios/Supplemental Data | | | | | | | |
| Net Assets, End of Period (Millions) | | $9,658 | $7,056 | $8,074 | $7,731 | $6,700 | |
| Ratio of Total Expenses to Average Net Assets3 | | 0.44% | 0.43% | 0.45% | 0.45% | 0.46% | |
| Ratio of Net Investment Income to Average Net Assets | | 0.74% | 1.23% | 1.25% | 1.01% | 1.47% | |
| Portfolio Turnover Rate | | 20% | 13% | 16% | 15% | 29% | |
| 1 | Calculated based on average shares outstanding. |
| 2 | Total returns do not include account service fees that may have applied in the periods shown. Fund prospectuses provide information about any applicable account service fees. |
| 3 | Includes performance-based investment advisory fee increases (decreases) of 0.04%, 0.03%, 0.03%, 0.03%, and 0.04%. |
See accompanying Notes, which are an integral part of the Financial Statements.
International Growth Fund
Financial Highlights
Admiral Shares
| For a Share Outstanding | | | | Year Ended August 31, | |
| Throughout Each Period | | 2020 | 2019 | 2018 | 2017 | 2016 | |
| Net Asset Value, Beginning of Period | | $90.05 | $99.45 | $90.24 | $71.19 | $66.28 | |
| Investment Operations | | | | | | | |
| Net Investment Income | | .8631 | 1.2031 | 1.3651 | .8791 | 1.062 | |
| Net Realized and Unrealized Gain (Loss) on Investments | | 47.105 | (6.230) | 8.652 | 19.127 | 4.877 | |
| Total from Investment Operations | | 47.968 | (5.027) | 10.017 | 20.006 | 5.939 | |
| Distributions | | | | | | | |
| Dividends from Net Investment Income | | (1.338) | (1.418) | (.807) | (.956) | (1.029) | |
| Distributions from Realized Capital Gains | | — | (2.955) | — | — | — | |
| Total Distributions | | (1.338) | (4.373) | (.807) | (.956) | (1.029) | |
| Net Asset Value, End of Period | | $136.68 | $90.05 | $99.45 | $90.24 | $71.19 | |
| | | | | | | | |
| Total Return2 | | 53.81% | -4.50% | 11.14% | 28.57% | 9.07% | |
| | | | | | | | |
| Ratios/Supplemental Data | | | | | | | |
| Net Assets, End of Period (Millions) | | $46,906 | $28,549 | $29,170 | $23,101 | $15,704 | |
| Ratio of Total Expenses to Average Net Assets3 | | 0.33% | 0.32% | 0.32% | 0.32% | 0.33% | |
| Ratio of Net Investment Income to Average Net Assets | | 0.83% | 1.34% | 1.38% | 1.14% | 1.60% | |
| Portfolio Turnover Rate | | 20% | 13% | 16% | 15% | 29% | |
| 1 | Calculated based on average shares outstanding. |
| 2 | Total returns do not include account service fees that may have applied in the periods shown. Fund prospectuses provide information about any applicable account service fees. |
| 3 | Includes performance-based investment advisory fee increases (decreases) of 0.04%, 0.03%, 0.03%, 0.03%, and 0.04%. |
See accompanying Notes, which are an integral part of the Financial Statements.
International Growth Fund
Notes to Financial Statements
Vanguard International Growth Fund is registered under the Investment Company Act of 1940 as an open-end investment company, or mutual fund. The fund invests in securities of foreign issuers, which may subject it to investment risks not normally associated with investing in securities of U.S. corporations. The fund offers two classes of shares: Investor Shares and Admiral Shares. Each of the share classes has different eligibility and minimum purchase requirements, and is designed for different types of investors.
Market disruptions associated with the COVID-19 pandemic have had a global impact, and uncertainty exists as to the long-term implications. Such disruptions can adversely affect assets of the fund and thus fund performance.
A. The following significant accounting policies conform to generally accepted accounting principles for U.S. investment companies. The fund consistently follows such policies in preparing its financial statements.
1. Security Valuation: Securities are valued as of the close of trading on the New York Stock Exchange (generally 4 p.m., Eastern time) on the valuation date. Equity securities are valued at the latest quoted sales prices or official closing prices taken from the primary market in which each security trades; such securities not traded on the valuation date are valued at the mean of the latest quoted bid and asked prices. Securities for which market quotations are not readily available, or whose values have been affected by events occurring before the fund’s pricing time but after the close of the securities’ primary markets, are valued at their fair values calculated according to procedures adopted by the board of trustees. These procedures include obtaining quotations from an independent pricing service, monitoring news to identify significant market- or security-specific events, and evaluating changes in the values of foreign market proxies (for example, ADRs, futures contracts, or exchange-traded funds), between the time the foreign markets close and the fund’s pricing time. When fair-value pricing is employed, the prices of securities used by a fund to calculate its net asset value may differ from quoted or published prices for the same securities. Investments in Vanguard Market Liquidity Fund are valued at that fund’s net asset value. Temporary cash investments are valued using the latest bid prices or using valuations based on a matrix system (which considers such factors as security prices, yields, maturities, and ratings), both as furnished by independent pricing services.
2. Foreign Currency: Securities and other assets and liabilities denominated in foreign currencies are translated into U.S. dollars using exchange rates obtained from an independent third party as of the fund’s pricing time on the valuation date. Realized gains (losses) and unrealized appreciation (depreciation) on investment securities include the effects of changes in exchange rates since the securities were purchased, combined with the effects of changes in security prices. Fluctuations in the value of other assets and liabilities resulting from changes in exchange rates are recorded as unrealized foreign currency gains (losses) until the assets or liabilities are settled in cash, at which time they are recorded as realized foreign currency gains (losses).
3. Futures Contracts: The fund uses index futures contracts to a limited extent, with the objective of maintaining full exposure to the stock market while maintaining liquidity. The fund may purchase or sell futures contracts to achieve a desired level of investment, whether to accommodate portfolio turnover or cash flows from capital share transactions. The primary risks associated with the use of futures contracts are imperfect correlation between changes in market values of stocks held by the fund and the prices of futures contracts, and the possibility of an illiquid market. Counterparty risk involving futures is mitigated because a regulated clearinghouse is the counterparty instead of the clearing broker. To further mitigate counterparty risk, the fund trades futures contracts on an
International Growth Fund
exchange, monitors the financial strength of its clearing brokers and clearinghouse, and has entered into clearing agreements with its clearing brokers. The clearinghouse imposes initial margin requirements to secure the fund’s performance and requires daily settlement of variation margin representing changes in the market value of each contract. Any securities pledged as initial margin for open contracts are noted in the Schedule of Investments.
Futures contracts are valued at their quoted daily settlement prices. The notional amounts of the contracts are not recorded in the Statement of Assets and Liabilities. Fluctuations in the value of the contracts are recorded in the Statement of Assets and Liabilities as an asset (liability) and in the Statement of Operations as unrealized appreciation (depreciation) until the contracts are closed, when they are recorded as realized gains (losses) on futures contracts.
During the year ended August 31, 2020, the fund’s average investments in long and short futures contracts represented less than 1% and 0% of net assets, respectively, based on the average of the notional amounts at each quarter-end during the period.
4. Forward Currency Contracts: The fund enters into forward currency contracts to provide the appropriate currency exposure related to any open futures contracts or to protect the value of securities and related receivables and payables against changes in foreign exchange rates. The fund’s risks in using these contracts include movement in the values of the foreign currencies relative to the U.S. dollar and the ability of the counterparties to fulfill their obligations under the contracts. The fund mitigates its counterparty risk by entering into forward currency contracts only with a diverse group of prequalified counterparties, monitoring their financial strength, entering into master netting arrangements with its counterparties, and requiring its counterparties to transfer collateral as security for their performance. In the absence of a default, the collateral pledged or received by the fund cannot be repledged, resold, or rehypothecated. The master netting arrangements provide that, in the event of a counterparty’s default (including bankruptcy), the fund may terminate the forward currency contracts, determine the net amount owed by either party in accordance with its master netting arrangements, and sell or retain any collateral held up to the net amount owed to the fund under the master netting arrangements. The forward currency contracts contain provisions whereby a counterparty may terminate open contracts if the fund’s net assets decline below a certain level, triggering a payment by the fund if the fund is in a net liability position at the time of the termination. The payment amount would be reduced by any collateral the fund has pledged. Any securities pledged as collateral for open contracts are noted in the Schedule of Investments. The value of collateral received or pledged is compared daily to the value of the forward currency contracts exposure with each counterparty, and any difference, if in excess of a specified minimum transfer amount, is adjusted and settled within two business days.
Forward currency contracts are valued at their quoted daily prices obtained from an independent third party, adjusted for currency risk based on the expiration date of each contract. The notional amounts of the contracts are not recorded in the Statement of Assets and Liabilities. Fluctuations in the value of the contracts are recorded in the Statement of Assets and Liabilities as an asset (liability) and in the Statement of Operations as unrealized appreciation (depreciation) until the contracts are closed, when they are recorded as realized gains (losses) on forward currency contracts.
During the year ended August 31, 2020, the fund’s average investment in forward currency contracts represented less than 1% of net assets, based on the average of notional amounts at each quarter-end during the period.
International Growth Fund
5. Federal Income Taxes: The fund intends to continue to qualify as a regulated investment company and distribute all of its taxable income. The fund’s tax returns are open to examination by the relevant tax authorities until expiration of the applicable statute of limitations, which is generally three years after the filing of the tax return. Management has analyzed the fund’s
tax positions taken for all open federal and state income tax years, and has concluded that no provision for income tax is required in the fund’s financial statements.
6. Distributions: Distributions to shareholders are recorded on the ex-dividend date. Distributions are determined on a tax basis at the fiscal year-end and may differ from net investment income and realized capital gains for financial reporting purposes.
7. Securities Lending: To earn additional income, the fund lends its securities to qualified institutional borrowers. Security loans are subject to termination by the fund at any time, and are required to be secured at all times by collateral in an amount at least equal to the market value of securities loaned. Daily market fluctuations could cause the value of loaned securities to be more or less than the value of the collateral received. When this occurs, the collateral is adjusted and settled before the opening of the market on the next business day. The fund further mitigates its counterparty risk by entering into securities lending transactions only with a diverse group of prequalified counterparties, monitoring their financial strength, and entering into master securities lending agreements with its counterparties. The master securities lending agreements provide that, in the event of a counterparty’s default (including bankruptcy), the fund may terminate any loans with that borrower, determine the net amount owed, and sell or retain the collateral up to the net amount owed to the fund; however, such actions may be subject to legal proceedings. While collateral mitigates counterparty risk, in the event of a default, the fund may experience delays and costs in recovering the securities loaned. The fund invests cash collateral received in Vanguard Market Liquidity Fund, and records a liability in the Statement of Assets and Liabilities for the return of the collateral, during the period the securities are on loan. Collateral investments in Vanguard Market Liquidity Fund are subject to market appreciation or depreciation. Securities lending income represents fees charged to borrowers plus income earned on invested cash collateral, less expenses associated with the loan. During the term of the loan, the fund is entitled to all distributions made on or in respect of the loaned securities.
8. Credit Facilities and Interfund Lending Program: The fund and certain other funds managed by The Vanguard Group (“Vanguard”) participate in a $4.3 billion committed credit facility provided by a syndicate of lenders pursuant to a credit agreement and an uncommitted credit facility provided by Vanguard. Both facilities may be renewed annually. Each fund is individually liable for its borrowings, if any, under the credit facilities. Borrowings may be utilized for temporary or emergency purposes, subject to the fund’s regulatory and contractual borrowing restrictions. With respect to the committed credit facility, the participating funds are charged administrative fees and an annual commitment fee of 0.10% of the undrawn committed amount of the facility; these fees are allocated to the funds based on a method approved by the fund’s board of trustees and included in Management and Administrative expenses on the fund’s Statement of Operations. Any borrowings under either facility bear interest at a rate based upon the higher of the one-month London Interbank Offered Rate (or an acceptable alternate rate, if necessary), federal funds effective rate, or overnight bank funding rate plus an agreed-upon spread, except that borrowings under the uncommitted credit facility may bear interest based upon an alternative rate agreed to by the fund and Vanguard.
International Growth Fund
In accordance with an exemptive order (the “Order”) from the SEC, the fund may participate in a joint lending and borrowing program that allows registered open-end Vanguard funds to borrow money from and lend money to each other for temporary or emergency purposes (the “Interfund Lending Program”), subject to compliance with the terms and conditions of the Order, and to the extent permitted by the fund’s investment objective and investment policies. Interfund loans and borrowings normally extend overnight, but can have a maximum duration of seven days. Loans may be called on one business day’s notice. The interest rate to be charged is governed by the conditions of the Order and internal procedures adopted by the board of trustees. The board of trustees is responsible for overseeing the Interfund Lending Program.
For the year ended August 31, 2020, the fund did not utilize the credit facilities or the Interfund Lending Program.
9. Other: Dividend income is recorded on the ex-dividend date. Interest income includes income distributions received from Vanguard Market Liquidity Fund and is accrued daily. Premiums and discounts on debt securities are amortized and accreted, respectively, to interest income over the lives of the respective securities, except for premiums on certain callable debt securities that are amortized to the earliest call date. Security transactions are accounted for on the date securities are bought or sold. Costs used to determine realized gains (losses) on the sale of investment securities are those of the specific securities sold.
Withholding taxes on foreign dividends and capital gains have been provided for in accordance with the fund’s understanding of the applicable countries’ tax rules and rates. Foreign capital gains tax is accrued daily based upon net unrealized gains. The fund has filed tax reclaims for previously withheld taxes on dividends earned in certain European Union countries. These filings are subject to various administrative and judicial proceedings within these countries. Such tax reclaims received during the year, if any, are included in dividend income. No other amounts for additional tax reclaims are reflected in the financial statements due to their uncertainty as to the ultimate resolution of proceedings, the likelihood of receipt of these reclaims, and the potential timing of payment.
Each class of shares has equal rights as to assets and earnings, except that each class separately bears certain class-specific expenses related to maintenance of shareholder accounts (included in Management and Administrative expenses) and shareholder reporting. Marketing and distribution expenses are allocated to each class of shares based on a method approved by the board of trustees. Income, other non-class-specific expenses, and gains and losses on investments are allocated to each class of shares based on its relative net assets.
B. The investment advisory firms Baillie Gifford Overseas Ltd. and Schroder Investment Management North America Inc. each provide investment advisory services to a portion of the fund for a fee calculated at an annual percentage rate of average net assets managed by the advisor. The basic fees of Baillie Gifford Overseas Ltd. and Schroder Investment Management North America Inc. are subject to quarterly adjustments based on performance relative to the MSCI All Country World Index ex USA for the preceding three years.
Vanguard manages the cash reserves of the fund as described below.
For the year ended August 31, 2020, the aggregate investment advisory fee represented an effective annual basic rate of 0.14% of the fund’s average net assets, before an increase of $15,743,000 (0.04%) based on performance.
International Growth Fund
C. In accordance with the terms of a Funds’ Service Agreement (the “FSA”) between Vanguard and the fund, Vanguard furnishes to the fund corporate management, administrative, marketing, distribution, and cash management services at Vanguard’s cost of operations (as defined by the FSA). These costs of operations are allocated to the fund based on methods and guidelines approved by the board of trustees and are generally settled twice a month.
Upon the request of Vanguard, the fund may invest up to 0.40% of its net assets as capital in Vanguard. At August 31, 2020, the fund had contributed to Vanguard capital in the amount of $2,197,000, representing less than 0.01% of the fund’s net assets and 0.88% of Vanguard’s capital received pursuant to the FSA. The fund’s trustees and officers are also directors and employees, respectively, of Vanguard.
D. Various inputs may be used to determine the value of the fund’s investments and derivatives. These inputs are summarized in three broad levels for financial statement purposes. The inputs or methodologies used to value securities are not necessarily an indication of the risk associated with investing in those securities.
Level 1—Quoted prices in active markets for identical securities.
Level 2—Other significant observable inputs (including quoted prices for similar securities, interest rates, prepayment speeds, credit risk, etc.).
Level 3—Significant unobservable inputs (including the fund’s own assumptions used to determine the fair value of investments). Any investments and derivatives valued with significant unobservable inputs are noted on the Schedule of Investments.
The following table summarizes the market value of the fund’s investments and derivatives as of August 31, 2020, based on the inputs used to value them:
| | Level 1 | Level 2 | Level 3 | Total |
| | ($000) | ($000) | ($000) | ($000) |
| Investments | | | | |
| Assets | | | | |
| Common Stocks—North and South America | 8,709,402 | — | — | 8,709,402 |
| Common Stocks—Other | 7,498,624 | 38,726,144 | 24,196 | 46,248,964 |
| Preferred Stocks | — | — | 143,808 | 143,808 |
| Temporary Cash Investments | 1,795,364 | 79,766 | — | 1,875,130 |
| Total | 18,003,390 | 38,805,910 | 168,004 | 56,977,304 |
| Derivative Financial Instruments | | | | |
| Assets | | | | |
| Forward Currency Contracts | — | 18,518 | — | 18,518 |
| Liabilities | | | | |
| Futures Contracts1 | 10,015 | — | — | 10,015 |
| Forward Currency Contracts | — | 19,037 | — | 19,037 |
| Total | 10,015 | 19,037 | — | 29,052 |
1 Represents variation margin on the last day of the reporting period.
International Growth Fund
E. At August 31, 2020, the fair values of derivatives were reflected in the Statement of Assets and Liabilities as follows:
| | | Foreign | |
| | Equity | Exchange | |
| | Contracts | Contracts | Total |
| Statement of Assets and Liabilities Caption | ($000) | ($000) | ($000) |
| Unrealized Appreciation—Forward Currency Contracts | — | 18,518 | 18,518 |
| Total Assets | — | 18,518 | 18,518 |
| | | | |
| Variation Margin Payable—Futures Contracts | 10,015 | — | 10,015 |
| Unrealized Depreciation—Forward Currency Contracts | — | 19,037 | 19,037 |
| Total Liabilities | 10,015 | 19,037 | 29,052 |
Realized net gain (loss) and the change in unrealized appreciation (depreciation) on derivatives for the year ended August 31, 2020, were:
| | | Foreign | |
| | Equity | Exchange | |
| | Contracts | Contracts | Total |
| Realized Net Gain (Loss) on Derivatives | ($000) | ($000) | ($000) |
| Futures Contracts | (12,544) | — | (12,544) |
| Forward Currency Contracts | — | (3,179) | (3,179) |
| Realized Net Gain (Loss) on Derivatives | (12,544) | (3,179) | (15,723) |
| | | | |
| Change in Unrealized Appreciation (Depreciation) on Derivatives | | | |
| Futures Contracts | 13,746 | — | 13,746 |
| Forward Currency Contracts | — | 4,899 | 4,899 |
| Change in Unrealized Appreciation (Depreciation) on Derivatives | 13,746 | 4,899 | 18,645 |
F. Permanent differences between book-basis and tax-basis components of net assets are reclassified among capital accounts in the financial statements to reflect their tax character. These reclassifications have no effect on net assets or net asset value per share. As of period end, permanent differences primarily attributable to the accounting for foreign currency transactions, passive foreign investment companies, distributions in connection with fund share redemptions, and tax expense on capital gains were reclassified between the following accounts:
| | Amount |
| | ($000) |
| Paid-in Capital | 15,153 |
| Total Distributable Earnings (Loss) | (15,153) |
International Growth Fund
Temporary differences between book-basis and tax-basis components of total distributable earnings (loss) arise when certain items of income, gain, or loss are recognized in different periods for financial statement and tax purposes; these differences will reverse at some time in the future. The differences are primarily related to the deferral of losses from wash sales; the recognition of unrealized gains or losses from certain derivative contracts; the recognition of unrealized gains from passive foreign investment companies; and the classification of securities for tax purposes. As of period end, the tax-basis components of total distributable earnings (loss) are detailed in the table as follows:
| | Amount |
| | ($000) |
| Undistributed Ordinary Income | 336,543 |
| Undistributed Long-Term Gains | 940,086 |
| Capital Loss Carryforwards | — |
| Qualified Late-Year Losses | — |
| Net Unrealized Gains (Losses) | 27,277,694 |
The tax character of distributions paid was as follows:
| | Year Ended August 31, |
| | 2020 | 2019 |
| | Amount | Amount |
| | ($000) | ($000) |
| Ordinary Income* | 518,968 | 530,707 |
| Long-Term Capital Gains | — | 1,083,392 |
| Total | 518,968 | 1,614,099 |
* Includes short-term capital gains, if any.
As of August 31, 2020, gross unrealized appreciation and depreciation for investments and derivatives based on cost for U.S. federal income tax purposes were as follows:
| | Amount |
| | ($000) |
| Tax Cost | 29,701,888 |
| Gross Unrealized Appreciation | 29,077,537 |
| Gross Unrealized Depreciation | (1,802,121) |
| Net Unrealized Appreciation (Depreciation) | 27,275,416 |
G. During the year ended August 31, 2020, the fund purchased $9,042,996,000 of investment securities and sold $8,135,074,000 of investment securities, other than temporary cash investments.
International Growth Fund
H. Capital share transactions for each class of shares were:
| | | | Year Ended August 31, |
| | | 2020 | | | 2019 |
| | Amount | Shares | Amount | Shares |
| | ($000) | (000) | ($000) | (000) |
| Investor Shares | | | | |
| Issued | 1,336,137 | 39,787 | 945,569 | 33,667 |
| Issued in Lieu of Cash Distributions | 90,043 | 2,857 | 322,714 | 12,842 |
| Redeemed | (2,187,049) | (67,132) | (1,553,116) | (55,661) |
| Net Increase (Decrease)—Investor Shares | (760,869) | (24,488) | (284,833) | (9,152) |
| Admiral Shares | | | | |
| Issued | 7,810,043 | 74,363 | 5,613,299 | 63,290 |
| Issued in Lieu of Cash Distributions | 382,469 | 3,816 | 1,174,401 | 14,695 |
| Redeemed | (5,290,942) | (52,026) | (4,795,611) | (54,277) |
| Net Increase (Decrease)—Admiral Shares | 2,901,570 | 26,153 | 1,992,089 | 23,708 |
I. Certain of the fund’s investments are in companies that are considered to be affiliated companies of the fund because the fund owns more than 5% of the outstanding voting securities of the company or the issuer is another member of The Vanguard Group. Transactions during the period in securities of these companies were as follows:
| | | Current Period Transactions | |
| | Aug. 31, | | Proceeds | Realized | | | | Aug. 31, |
| | 2019 | | from | Net | Change in | | Capital Gain | 2020 |
| | Market | Purchases | Securities | Gain | Unrealized | | Distributions | Market |
| | Value | at Cost | Sold | (Loss) | App. (Dep.) | Income | Received | Value |
| | ($000) | ($000) | ($000) | ($000) | ($000) | ($000) | ($000) | ($000) |
| HelloFresh SE | 137,965 | — | — | — | 405,737 | — | — | 543,702 |
| Home24 SE | 6,147 | — | — | — | 17,211 | — | — | 23,358 |
| Jumia Technologies | | | | | | | | |
| AG ADR | 74,982 | — | — | — | (13,181) | — | — | 61,801 |
| Vanguard FTSE | | | | | | | | |
| All-World ex-US ETF | 55,124 | — | 60,670 | 12,869 | (7,323) | 397 | — | — |
| Vanguard Market | | | | | | | | |
| Liquidity Fund | 1,243,718 | NA1 | NA1 | 359 | 65 | 6,713 | — | 1,795,364 |
| You & Mr. Jones | 127,680 | — | — | — | 16,128 | — | — | 143,808 |
| Total | 1,645,616 | — | 60,670 | 13,228 | 418,637 | 7,110 | — | 2,568,033 |
1 Not applicable—purchases and sales are for temporary cash investment purposes.
J. Management has determined that no events or transactions occurred subsequent to August 31, 2020, that would require recognition or disclosure in these financial statements.
Report of Independent Registered Public Accounting Firm
To the Board of Trustees of Vanguard World Fund and Shareholders of Vanguard International Growth Fund
Opinion on the Financial Statements
We have audited the accompanying statement of assets and liabilities, including the schedule of investments, of Vanguard International Growth Fund (one of the funds constituting Vanguard World Fund, referred to hereafter as the “Fund”) as of August 31, 2020, the related statement of operations for the year ended August 31, 2020, the statement of changes in net assets for each of the two years in the period ended August 31, 2020, including the related notes, and the financial highlights for each of the five years in the period ended August 31, 2020 (collectively referred to as the “financial statements”). In our opinion, the financial statements present fairly, in all material respects, the financial position of the Fund as of August 31, 2020, the results of its operations for the year then ended, the changes in its net assets for each of the two years in the period ended August 31, 2020 and the financial highlights for each of the five years in the period ended August 31, 2020 in conformity with accounting principles generally accepted in the United States of America.
Basis for Opinion
These financial statements are the responsibility of the Fund’s management. Our responsibility is to express an opinion on the Fund’s financial statements based on our audits. We are a public accounting firm registered with the Public Company Accounting Oversight Board (United States) (“PCAOB”) and are required to be independent with respect to the Fund in accordance with the U.S. federal securities laws and the applicable rules and regulations of the Securities and Exchange Commission and the PCAOB.
We conducted our audits of these financial statements in accordance with the standards of the PCAOB. Those standards require that we plan and perform the audit to obtain reasonable assurance about whether the financial statements are free of material misstatement, whether due to error or fraud.
Our audits included performing procedures to assess the risks of material misstatement of the financial statements, whether due to error or fraud, and performing procedures that respond to those risks. Such procedures included examining, on a test basis, evidence regarding the amounts and disclosures in the financial statements. Our audits also included evaluating the accounting principles used and significant estimates made by management, as well as evaluating the overall presentation of the financial statements. Our procedures included confirmation of securities owned as of August 31, 2020 by correspondence with the custodians and brokers and by agreement to the underlying ownership records of the transfer agent; when replies were not received from brokers, we performed other auditing procedures. We believe that our audits provide a reasonable basis for our opinion.
/s/PricewaterhouseCoopers LLP
Philadelphia, Pennsylvania
October 19, 2020
We have served as the auditor of one or more investment companies in The Vanguard Group of Funds since 1975.
Special 2020 tax information (unaudited) for Vanguard International Growth Fund
This information for the fiscal year ended August 31, 2020, is included pursuant to provisions of the Internal Revenue Code.
The fund distributed $435,518,000 of qualified dividend income to shareholders during the fiscal year.
The fund designates to shareholders foreign source income of $508,168,000 and foreign taxes paid of $41,218,000. Shareholders will receive more detailed information with their Form 1099-DIV in January 2021 to determine the calendar-year amounts to be included on their 2020 tax returns.
Liquidity Risk Management
Vanguard funds (except for the money market funds) have adopted and implemented a written liquidity risk management program (the “Program”) as required by Rule 22e-4 under the Investment Company Act of 1940. Rule 22e-4 requires that each fund adopt a program that is reasonably designed to assess and manage the fund’s liquidity risk, which is the risk that the fund could not meet redemption requests without significant dilution of remaining investors’ interests in the fund.
Assessment and management of a fund’s liquidity risk under the Program take into consideration certain factors, such as the fund’s investment strategy and the liquidity of its portfolio investments during normal and reasonably foreseeable stressed conditions, its short- and long-term cash-flow projections during both normal and reasonably foreseeable stressed conditions, and its cash and cash-equivalent holdings and access to other funding sources. As required by the rule, the Program includes policies and procedures for classification of fund portfolio holdings in four liquidity categories, maintaining certain levels of highly liquid investments, and limiting holdings of illiquid investments.
The board of trustees of Vanguard World Fund approved the appointment of liquidity risk management program administrators responsible for administering Vanguard International Growth Fund’s Program and for carrying out the specific responsibilities set forth in the Program, including reporting to the board on at least an annual basis regarding the Program’s operation, its adequacy, and the effectiveness of its implementation for the past year (the “Program Administrator Report”). The board has reviewed the Program Administrator Report covering the period from December 1, 2018, through December 31, 2019 (the “Review Period”). The Program Administrator Report stated that during the Review Period the Program operated and was implemented effectively to manage the fund’s liquidity risk.
This page intentionally left blank.
This page intentionally left blank.
This page intentionally left blank.
This page intentionally left blank.
This page intentionally left blank.
The People Who Govern Your Fund
The trustees of your mutual fund are there to see that the fund is operated and managed in your best interests since, as a shareholder, you are a part owner of the fund. Your fund’s trustees also serve on the board of directors of The Vanguard Group, Inc., which is owned by the Vanguard funds and provides services to them.
A majority of Vanguard’s board members are independent, meaning that they have no affiliation with Vanguard or the funds they oversee, apart from the sizable personal investments they have made as private individuals. The independent board members have distinguished backgrounds in business, academia, and public service. Each of the trustees and executive officers oversees 212 Vanguard funds.
Information for each trustee and executive officer of the fund appears below. That information, as well as the Vanguard fund count, is as of the date on the cover of this fund report. The mailing address of the trustees and officers is P.O. Box 876, Valley Forge, PA 19482. More information about the trustees is in the Statement of Additional Information, which can be obtained, without charge, by contacting Vanguard at 800-662-7447, or online at vanguard.com.
Interested Trustee1
Mortimer J. Buckley
Born in 1969. Trustee since January 2018. Principal occupation(s) during the past five years and other experience: chairman of the board (2019–present) of Vanguard and of each of the investment companies served by Vanguard; chief executive officer (2018– present) of Vanguard; chief executive officer, president, and trustee (2018–present) of each of the investment companies served by Vanguard; president and director (2017–present) of Vanguard; and president (2018–present) of Vanguard Marketing Corporation. Chief investment officer (2013–2017), managing director (2002–2017), head of the Retail Investor Group (2006–2012), and chief information officer (2001–2006) of Vanguard. Chairman of the board (2011–2017) and trustee (2009–2017) of the Children’s Hospital of Philadelphia; and trustee (2018–present) and vice chair (2019–present) of The Shipley School.
Independent Trustees
Emerson U. Fullwood
Born in 1948. Trustee since January 2008. Principal occupation(s) during the past five years and other experience: executive chief staff and marketing officer for North America and corporate vice president (retired 2008) of Xerox Corporation (document management products and services). Former president of the Worldwide Channels Group, Latin America, and Worldwide Customer Service and executive chief staff officer of Developing Markets of Xerox. Executive in residence and 2009–2010 Distinguished Minett Professor at the Rochester Institute of Technology. Director of SPX FLOW, Inc. (multi-industry manufac-turing). Director of the University of Rochester Medical Center, the Monroe Community College Foundation, the United Way of Rochester, North Carolina A&T University, and Roberts Wesleyan College. Trustee of the University of Rochester.
Amy Gutmann
Born in 1949. Trustee since June 2006. Principal occupation(s) during the past five years and other experience: president (2004–present) of the University of Pennsylvania. Christopher H. Browne Distinguished Professor of Political Science, School of Arts and Sciences, and professor of communication, Annenberg School for Communication, with secondary faculty appointments in the Department of Philosophy, School of Arts and Sciences, and at the Graduate School of Education, University of Pennsylvania.
F. Joseph Loughrey
Born in 1949. Trustee since October 2009. Principal occupation(s) during the past five years and other experience: president and chief operating officer (retired 2009) and vice chairman of the board (2008–2009) of Cummins Inc. (industrial machinery). Chairman of the board of Hillenbrand, Inc. (specialized consumer services) and the Lumina Foundation. Director of the V Foundation. Member of the advisory
1 Mr. Buckley is considered an “interested person,” as defined in the Investment Company Act of 1940, because he is an officer of the Vanguard funds.
council for the College of Arts and Letters and chair of the advisory board to the Kellogg Institute for International Studies, both at the University of Notre Dame.
Mark Loughridge
Born in 1953. Trustee since March 2012. Principal occupation(s) during the past five years and other experience: senior vice president and chief financial officer (retired 2013) of IBM (information technology services). Fiduciary member of IBM’s Retirement Plan Committee (2004–2013), senior vice president and general manager (2002–2004) of IBM Global Financing, vice president and controller (1998–2002) of IBM, and a variety of other prior management roles at IBM. Member of the Council on Chicago Booth.
Scott C. Malpass
Born in 1962. Trustee since March 2012. Principal occupation(s) during the past five years and other experience: chief investment officer (retired June 2020) and vice president (retired June 2020) of the University of Notre Dame. Assistant professor of finance at the Mendoza College of Business, University of Notre Dame, and member of the Notre Dame 403(b) Investment Committee (retired June 2020). Member of the board of Catholic Investment Services, Inc. (investment advisors) and the board of superintendence of the Institute for the Works of Religion.
Deanna Mulligan
Born in 1963. Trustee since January 2018. Principal occupation(s) during the past five years and other experience: chief executive officer (2011–present) of The Guardian Life Insurance Company of America. President (2010–2019), chief operating officer (2010–2011), and executive vice president (2008–2010) of Individual Life and Disability of The Guardian Life Insurance Company of America. Member of the board of The Guardian Life Insurance Company of America, the American Council of Life Insurers, and the Economic Club of New York. Trustee of the Partnership for New York City (business leadership), Chief Executives for Corporate Purpose, NewYork-Presbyterian Hospital, Catalyst, and the Bruce Museum (arts and science). Member of the Advisory Council for the Stanford Graduate School of Business.
André F. Perold
Born in 1952. Trustee since December 2004. Principal occupation(s) during the past five years and other experience: George Gund Professor of Finance and Banking, Emeritus at the Harvard Business School (retired 2011). Chief investment officer and co-managing partner of HighVista Strategies (private investment firm). Member of the board of advisors and member of the investment committee of the Museum of Fine Arts Boston. Member of the board (2018–present) of RIT Capital Partners (investment firm). Member of the investment committee of Partners Health Care System.
Sarah Bloom Raskin
Born in 1961. Trustee since January 2018. Principal occupation(s) during the past five years and other experience: deputy secretary (2014–2017) of the United States Department of the Treasury. Governor (2010–2014) of the Federal Reserve Board. Commissioner (2007–2010) of financial regulation for the State of Maryland. Member of the board of directors (2012–2014) of Neighborhood Reinvestment Corporation. Director (2017–present) of i(x) Investments, LLC; director (2017–present) of Reserve Trust. Rubenstein Fellow (2017–present) of Duke University; trustee (2017–present) of Amherst College, and trustee (2019–present) of the Folger Shakespeare Library.
Peter F. Volanakis
Born in 1955. Trustee since July 2009. Principal occupation(s) during the past five years and other experience: president and chief operating officer (retired 2010) of Corning Incorporated (communications equipment) and director of Corning Incorporated (2000–2010) and Dow Corning (2001–2010). Director (2012) of SPX Corporation (multi-industry manufacturing). Overseer of the Amos Tuck School of Business Administration, Dartmouth College (2001–2013). Chairman of the board of trustees of Colby-Sawyer College. Member of the board of Hypertherm Inc. (industrial cutting systems, software, and consumables).
Executive Officers
John Bendl
Born in 1970. Principal occupation(s) during the past five years and other experience: principal of Vanguard. Chief financial officer (2019–present) of each of the investment companies served by Vanguard. Chief accounting officer, treasurer, and controller of Vanguard (2017–present). Partner (2003–2016) at KPMG (audit, tax, and advisory services).
Glenn Booraem
Born in 1967. Principal occupation(s) during the past five years and other experience: principal of Vanguard. Investment stewardship officer (2017–present), treasurer (2015–2017), controller (2010–2015), and assistant controller (2001–2010) of each of the investment companies served by Vanguard.
Christine M. Buchanan
Born in 1970. Principal occupation(s) during the past five years and other experience: principal of Vanguard. Treasurer (2017–present) of each of the investment companies served by Vanguard. Partner (2005–2017) at KPMG (audit, tax, and advisory services).
David Cermak
Born in 1960. Principal occupation(s) during the past five years and other experience: principal of Vanguard. Finance director (2019–present) of each of the investment companies served by Vanguard. Managing director and head (2017–present) of Vanguard Investments Singapore. Managing director and head (2017–2019) of Vanguard Investments Hong Kong. Representative director and head (2014–2017) of Vanguard Investments Japan.
Thomas J. Higgins
Born in 1957. Principal occupation(s) during the past five years and other experience: principal of Vanguard. Finance director (2019–present), chief financial officer (2008–2019), and treasurer (1998–2008) of each of the investment companies served by Vanguard.
Peter Mahoney
Born in 1974. Principal occupation(s) during the past five years and other experience: principal of Vanguard. Controller (2015–present) of each of the investment companies served by Vanguard. Head of International Fund Services (2008–2014) at Vanguard.
Anne E. Robinson
Born in 1970. Principal occupation(s) during the past five years and other experience: general counsel (2016–present) of Vanguard. Secretary (2016–present) of Vanguard and of each of the investment companies served by Vanguard. Managing director (2016–present) of Vanguard. Managing director and general counsel of Global Cards and Consumer Services (2014–2016) at Citigroup. Counsel (2003–2014) at American Express.
Michael Rollings
Born in 1963. Principal occupation(s) during the past five years and other experience: finance director (2017–present) and treasurer (2017) of each of the investment companies served by Vanguard. Managing director (2016–present) of Vanguard. Chief financial officer (2016–present) of Vanguard. Director (2016–present) of Vanguard Marketing Corporation. Executive vice president and chief financial officer (2006–2016) of MassMutual Financial Group.
John E. Schadl
Born in 1972. Principal occupation(s) during the past five years and other experience: principal of Vanguard. Chief compliance officer (2019–present) of Vanguard and of each of the investment companies served by Vanguard. Assistant vice president (2019–present) of Vanguard Marketing Corporation.
Vanguard Senior Management Team
| Joseph Brennan | | Chris D. McIsaac |
| Mortimer J. Buckley | | James M. Norris |
| Gregory Davis | | Thomas M. Rampulla |
| John James | | Karin A. Risi |
| Martha G. King | | Anne E. Robinson |
| John T. Marcante | | Michael Rollings |
Connect with Vanguard® > vanguard.com
Fund Information > 800-662-7447
Direct Investor Account Services > 800-662-2739
Institutional Investor Services > 800-523-1036
Text Telephone for People
Who Are Deaf or Hard of Hearing > 800-749-7273
This material may be used in conjunction with the offering of shares of any Vanguard fund only if preceded or accompanied by the fund’s current prospectus.
All comparative mutual fund data are from Morningstar, Inc., unless otherwise noted.
You can obtain a free copy of Vanguard’s proxy voting guidelines by visiting vanguard.com/proxyreporting or by calling Vanguard at 800-662-2739. The guidelines are also available from the SEC’s website, www.sec.gov. In addition, you may obtain a free report on how your fund voted the proxies for securities it owned during the 12 months ended June 30. To get the report, visit either vanguard.com/proxyreporting or www.sec.gov.
You can review information about your fund on the SEC’s website, and you can receive copies of this information, for a fee, by sending a request via email addressed to publicinfo@sec.gov.
Source for Bloomberg Barclays indexes: Bloomberg Index Services Limited. Copyright 2020, Bloomberg. All rights reserved.
CFA® is a registered trademark owned by CFA Institute.
| © 2020 The Vanguard Group, Inc. |
| All rights reserved. |
| Vanguard Marketing Corporation, Distributor. |
| |
| Q810 102020 |

Annual Report | August 31, 2020 Vanguard FTSE Social Index Fund |
See the inside front cover for important information about access to your fund’s annual and semiannual shareholder reports. |
Important information about access to shareholder reports
Beginning on January 1, 2021, as permitted by regulations adopted by the Securities and Exchange Commission, paper copies of your fund’s annual and semiannual shareholder reports will no longer be sent to you by mail, unless you specifically request them. Instead, you will be notified by mail each time a report is posted on the website and will be provided with a link to access the report.
If you have already elected to receive shareholder reports electronically, you will not be affected by this change and do not need to take any action. You may elect to receive shareholder reports and other communications from the fund electronically by contacting your financial intermediary (such as a broker-dealer or bank) or, if you invest directly with the fund, by calling Vanguard at one of the phone numbers on the back cover of this report or by logging on to vanguard.com.
You may elect to receive paper copies of all future shareholder reports free of charge. If you invest through a financial intermediary, you can contact the intermediary to request that you continue to receive paper copies. If you invest directly with the fund, you can call Vanguard at one of the phone numbers on the back cover of this report or log on to vanguard.com. Your election to receive paper copies will apply to all the funds you hold through an intermediary or directly with Vanguard.
| Contents | |
| | |
| Your Fund’s Performance at a Glance | 1 |
| About Your Fund’s Expenses | 2 |
| Performance Summary | 4 |
| Financial Statements | 6 |
| Trustees Approve Advisory Arrangement | 27 |
| Liquidity Risk Management | 29 |
Please note: The opinions expressed in this report are just that—informed opinions. They should not be considered promises or advice. Also, please keep in mind that the information and opinions cover the period through the date on the front of this report. Of course, the risks of investing in your fund are spelled out in the prospectus.
Your Fund’s Performance at a Glance
· For the 12 months ended August 31, 2020, Vanguard FTSE Social Index Fund returned 27.83% for Admiral Shares and 27.86% for Institutional Shares. Those results were roughly in line with the 27.98% return of its expense-free benchmark.
· A number of stock market indexes around the world climbed to record highs in February. They then then plummeted as the coronavirus spread outside of China, leading to lockdowns, the shuttering of nonessential businesses, and travel restrictions in many countries. However, the unprecedented scale of the response from policymakers, the start of trials for vaccines and treatments, and the easing of some pandemic-related restrictions helped lift investor sentiment.
· U.S. stocks rebounded more strongly than developed markets outside the United States and emerging markets.
· For the fund’s benchmark index, 12-month performance varied greatly by sector. Technology, which accounts for the largest slice of the index, turned in a stellar performance, returning about 64%. Oil and gas, one of the smaller sectors, returned about –48%.
| Market Barometer | |
| | Average Annual Total Returns |
| | Periods Ended August 31, 2020 |
| | One Year | Three Years | Five Years |
| Stocks | | | |
| Russell 1000 Index (Large-caps) | 22.50% | 14.58% | 14.31% |
| Russell 2000 Index (Small-caps) | 6.02 | 5.03 | 7.65 |
| Russell 3000 Index (Broad U.S. market) | 21.44 | 13.95 | 13.86 |
| FTSE All-World ex US Index (International) | 8.78 | 2.92 | 6.00 |
| | | | |
| Bonds | | | |
| Bloomberg Barclays U.S. Aggregate Bond Index (Broad taxable market) | 6.47% | 5.09% | 4.33% |
| Bloomberg Barclays Municipal Bond Index (Broad tax-exempt market) | 3.24 | 4.09 | 3.99 |
| FTSE Three-Month U.S. Treasury Bill Index | 1.18 | 1.67 | 1.15 |
| | | | |
| CPI | | | |
| Consumer Price Index | 1.31% | 1.92% | 1.75% |
About Your Fund’s Expenses
As a shareholder of the fund, you incur ongoing costs, which include costs for portfolio management, administrative services, and shareholder reports (like this one), among others. Operating expenses, which are deducted from a fund’s gross income, directly reduce the investment return of the fund.
A fund’s expenses are expressed as a percentage of its average net assets. This figure is known as the expense ratio. The following examples are intended to help you understand the ongoing costs (in dollars) of investing in your fund and to compare these costs with those of other mutual funds. The examples are based on an investment of $1,000 made at the beginning of the period shown and held for the entire period.
The accompanying table illustrates your fund’s costs in two ways:
· Based on actual fund return. This section helps you to estimate the actual expenses that you paid over the period. The “Ending Account Value” shown is derived from the fund’s actual return, and the third column shows the dollar amount that would have been paid by an investor who started with $1,000 in the fund. You may use the information here, together with the amount you invested, to estimate the expenses that you paid over the period.
To do so, simply divide your account value by $1,000 (for example, an $8,600 account value divided by $1,000 = 8.6), then multiply the result by the number given for your fund under the heading “Expenses Paid During Period.”
· Based on hypothetical 5% yearly return. This section is intended to help you compare your fund’s costs with those of other mutual funds. It assumes that the fund had a yearly return of 5% before expenses, but that the expense ratio is unchanged. In this case—because the return used is not the fund’s actual return—the results do not apply to your investment. The example is useful in making comparisons because the Securities and Exchange Commission requires all mutual funds to calculate expenses based on a 5% return. You can assess your fund’s costs by comparing this hypothetical example with the hypothetical examples that appear in shareholder reports of other funds.
Note that the expenses shown in the table are meant to highlight and help you compare ongoing costs only and do not reflect transaction costs incurred by the fund for buying and selling securities. Further, the expenses do not include any purchase, redemption, or account service fees described in the fund prospectus. If such fees were applied to your account, your costs would be higher. Your fund does not carry a “sales load.”
The calculations assume no shares were bought or sold during the period. Your actual costs may have been higher or lower, depending on the amount of your investment and the timing of any purchases or redemptions.
You can find more information about the fund’s expenses, including annual expense ratios, in the Financial Statements section of this report. For additional information on operating expenses and other shareholder costs, please refer to your fund’s current prospectus.
| Six Months Ended August 31, 2020 | | | |
| | Beginning | Ending | Expenses |
| | Account Value | Account Value | Paid During |
| FTSE Social Index Fund | 2/29/2020 | 8/31/2020 | Period |
| Based on Actual Fund Return | | | |
| Admiral™ Shares | $1,000.00 | $1,231.22 | $0.79 |
| Institutional Shares | 1,000.00 | 1,231.16 | 0.67 |
| Based on Hypothetical 5% Yearly Return | | | |
| Admiral Shares | $1,000.00 | $1,024.43 | $0.71 |
| Institutional Shares | 1,000.00 | 1,024.53 | 0.61 |
The calculations are based on expenses incurred in the most recent six-month period. The fund’s annualized six-month expense ratios for that period are 0.14% for Admiral Shares and 0.12% for Institutional Shares. The dollar amounts shown as “Expenses Paid” are equal to the annualized expense ratio multiplied by the average account value over the period, multiplied by the number of days in the most recent six-month period, then divided by the number of days in the most recent 12-month period (184/366).
FTSE Social Index Fund
Performance Summary
All of the returns in this report represent past performance, which is not a guarantee of future results that may be achieved by the fund. (Current performance may be lower or higher than the performance data cited. For performance data current to the most recent month-end, visit our website at vanguard.com/performance.) Note, too, that both investment returns and principal value can fluctuate widely, so an investor’s shares, when sold, could be worth more or less than their original cost. The returns shown do not reflect taxes that a shareholder would pay on fund distributions or on the sale of fund shares.
Cumulative Performance: August 31, 2010, Through August 31, 2020
Initial Investment of $5,000,000
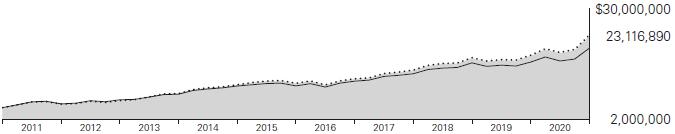
| | | Average Annual Total Returns | |
| | | Periods Ended August 31, 2020 | |
| | | | |
| | | | | | Final Value |
| | | One | Five | Ten | of a $5,000,000 |
| | | Year | Years | Years | Investment |
 | FTSE Social Index Fund Institutional Shares | 27.86% | 15.81% | 16.55% | $23,116,890 |
 | FTSE4Good US Select Index | 27.98 | 15.90 | 16.67 | 23,365,527 |
 | Dow Jones U.S. Total Stock Market Float Adjusted Index | 21.20 | 13.77 | 14.88 | 20,026,347 |
| | | Since | Final Value |
| | One | Inception | of a $10,000 |
| | Year | (2/7/2019) | Investment |
| FTSE Social Index Fund Admiral Shares | 27.83% | 24.26% | $14,041 |
| FTSE4Good US Select Index | 27.98 | 24.40 | 14,066 |
| Dow Jones U.S. Total Stock Market Float Adjusted Index | 21.20 | 19.09 | 13,138 |
“Since Inception” performance is calculated from the Admiral Shares’ inception date for both the fund and its comparative standards.
See Financial Highlights for dividend and capital gains information.
FTSE Social Index Fund
Fund Allocation
As of August 31, 2020
| Basic Materials | 1.7% |
| Consumer Goods | 8.8 |
| Consumer Services | 16.3 |
| Financials | 15.1 |
| Health Care | 13.1 |
| Industrials | 8.1 |
| Technology | 34.0 |
| Telecommunications | 2.1 |
| Utilities | 0.8 |
The table reflects the fund’s investments, except for short-term investments and derivatives. Sector categories are based on the Industry Classification Benchmark (“ICB”), except for the “Other” category (if applicable), which includes securities that have not been provided an ICB classification as of the effective reporting period.
The fund may invest in derivatives (such as futures and swap contracts) for various reasons, including, but not limited to, attempting to remain fully invested and tracking its target index as closely as possible.
The Industry Classification Benchmark (“ICB”) is owned by FTSE. FTSE does not accept any liability to any person for any loss or damage arising out of any error or omission in the ICB.
FTSE Social Index Fund
Financial Statements
Schedule of Investments
As of August 31, 2020
The fund files its complete schedule of portfolio holdings with the Securities and Exchange Commission (SEC) for the first and third quarters of each fiscal year as an exhibit to its reports on Form N-PORT. The fund’s Form N-PORT reports are available on the SEC’s website at www.sec.gov.
| | | | Market |
| | | | Value· |
| | Shares | ($000) |
| Common Stocks (99.8%) | | |
| Basic Materials (1.7%) | | |
| | Linde plc | 187,477 | 46,821 |
| | Air Products & Chemicals Inc. | 78,743 | 23,013 |
| | Newmont Corp. | 286,026 | 19,244 |
| | Dow Inc. | 263,100 | 11,871 |
| | Fastenal Co. | 203,186 | 9,928 |
| | LyondellBasell Industries NV Class A | 91,078 | 5,964 |
| | International Paper Co. | 140,400 | 5,092 |
| | FMC Corp. | 45,810 | 4,895 |
| | Nucor Corp. | 107,494 | 4,887 |
| | International Flavors & Fragrances Inc. | 38,019 | 4,706 |
| | Celanese Corp. Class A | 41,900 | 4,238 |
| | Eastman Chemical Co. | 48,700 | 3,561 |
| | Albemarle Corp. | 37,160 | 3,382 |
| | CF Industries Holdings Inc. | 74,839 | 2,442 |
| | Mosaic Co. | 124,254 | 2,265 |
| | Steel Dynamics Inc. | 70,600 | 2,084 |
| | Westlake Chemical Corp. | 11,200 | 664 |
| | | | 155,057 |
| | | | |
| | | | |
| Consumer Goods (8.8%) | | |
| * | Tesla Inc. | 263,580 | 131,347 |
| | Procter & Gamble Co. | 868,547 | 120,146 |
| | PepsiCo Inc. | 494,800 | 69,302 |
| | Coca-Cola Co. | 1,378,600 | 68,282 |
| | NIKE Inc. Class B | 431,882 | 48,323 |
| | Mondelez International Inc. Class A | 503,727 | 29,428 |
| | Colgate-Palmolive Co. | 300,866 | 23,847 |
| | Activision Blizzard Inc. | 271,799 | 22,701 |
| | Kimberly-Clark Corp. | 120,850 | 19,065 |
| | Estee Lauder Cos. Inc. Class A | 79,031 | 17,523 |
| * | Lululemon Athletica Inc. | 40,441 | 15,192 |
| * | Electronic Arts Inc. | 101,535 | 14,161 |
| | General Mills Inc. | 216,199 | 13,826 |
| * | Monster Beverage Corp. | 131,145 | 10,998 |
| | Clorox Co. | 44,942 | 10,044 |
| | Ford Motor Co. | 1,378,047 | 9,398 |
| | McCormick & Co. Inc. | 44,364 | 9,148 |
| | DR Horton Inc. | 117,812 | 8,408 |
| | Church & Dwight Co. Inc. | 87,496 | 8,385 |
| | Aptiv plc | 94,857 | 8,169 |
| | Kraft Heinz Co. | 229,873 | 8,055 |
| | Hershey Co. | 52,568 | 7,814 |
| | VF Corp. | 115,743 | 7,610 |
| | Corteva Inc. | 265,500 | 7,580 |
| | Lennar Corp. Class A | 95,841 | 7,171 |
| * | Take-Two Interactive Software Inc. | 39,800 | 6,813 |
| | Conagra Brands Inc. | 174,504 | 6,694 |
| | Tyson Foods Inc. Class A | 101,754 | 6,390 |
| | Kellogg Co. | 89,675 | 6,359 |
| | Garmin Ltd. | 53,328 | 5,525 |
| | Tiffany & Co. | 43,027 | 5,271 |
| | Hormel Foods Corp. | 98,825 | 5,038 |
| * | NVR Inc. | 1,190 | 4,960 |
| | Genuine Parts Co. | 50,109 | 4,732 |
| | J M Smucker Co. | 38,953 | 4,681 |
| | PulteGroup Inc. | 94,880 | 4,231 |
| | Keurig Dr Pepper Inc. | 139,432 | 4,159 |
| | Fortune Brands Home & Security Inc. | 49,331 | 4,148 |
| | Whirlpool Corp. | 21,718 | 3,860 |
| | Hasbro Inc. | 45,400 | 3,584 |
| * | LKQ Corp. | 108,291 | 3,437 |
| | Campbell Soup Co. | 62,408 | 3,283 |
| | Lamb Weston Holdings Inc. | 51,118 | 3,213 |
| | BorgWarner Inc. | 72,990 | 2,963 |
| | Coca-Cola European Partners plc | 70,498 | 2,902 |
| | Autoliv Inc. | 32,245 | 2,526 |
| | Lear Corp. | 21,156 | 2,410 |
| | Gentex Corp. | 88,745 | 2,401 |
| | Bunge Ltd. | 49,299 | 2,249 |
| | Newell Brands Inc. | 135,827 | 2,170 |
| | Leggett & Platt Inc. | 47,479 | 1,947 |
| | Ingredion Inc. | 23,946 | 1,926 |
| * | Mohawk Industries Inc. | 20,743 | 1,915 |
| | Hanesbrands Inc. | 121,060 | 1,851 |
| | Toll Brothers Inc. | 42,699 | 1,803 |
FTSE Social Index Fund
| | | | Market |
| | | | Value· |
| | | Shares | ($000) |
| *,^ | Herbalife Nutrition Ltd. | 36,029 | 1,771 |
| | Harley-Davidson Inc. | 55,681 | 1,543 |
| | PVH Corp. | 26,356 | 1,470 |
| | Tapestry Inc. | 99,386 | 1,464 |
| | Ralph Lauren Corp. Class A | 16,637 | 1,145 |
| * | Capri Holdings Ltd. | 54,508 | 863 |
| * | Under Armour Inc. Class A | 67,150 | 659 |
| * | Under Armour Inc. Class C | 63,737 | 564 |
| | Coty Inc. Class A | 105,500 | 378 |
| | | | 819,221 |
| Consumer Services (16.3%) | | |
| * | Amazon.com Inc. | 151,210 | 521,820 |
| | Home Depot Inc. | 382,986 | 109,166 |
| | Walt Disney Co. | 644,496 | 84,990 |
| * | Netflix Inc. | 151,661 | 80,314 |
| | Comcast Corp. Class A | 1,615,890 | 72,408 |
| | McDonald’s Corp. | 265,532 | 56,696 |
| | Costco Wholesale Corp. | 157,410 | 54,725 |
| | Lowe’s Cos. Inc. | 269,612 | 44,402 |
| | Starbucks Corp. | 417,054 | 35,229 |
| * | Charter Communications Inc. Class A | 53,340 | 32,837 |
| | CVS Health Corp. | 465,316 | 28,905 |
| * | Booking Holdings Inc. | 14,595 | 27,883 |
| | Target Corp. | 177,790 | 26,884 |
| | TJX Cos. Inc. | 427,532 | 23,424 |
| * | MercadoLibre Inc. | 16,300 | 19,048 |
| | Dollar General Corp. | 89,583 | 18,085 |
| * | Uber Technologies Inc. | 486,500 | 16,361 |
| * | Spotify Technology SA | 46,700 | 13,177 |
| | eBay Inc. | 238,300 | 13,054 |
| * | Chipotle Mexican Grill Inc. Class A | 9,904 | 12,977 |
| * | O’Reilly Automotive Inc. | 26,095 | 12,151 |
| | Ross Stores Inc. | 123,970 | 11,291 |
| | Sysco Corp. | 172,192 | 10,356 |
| | Yum! Brands Inc. | 107,200 | 10,275 |
| | Walgreens Boots Alliance Inc. | 261,580 | 9,945 |
| * | AutoZone Inc. | 8,311 | 9,943 |
| | Kroger Co. | 276,000 | 9,848 |
| | Best Buy Co. Inc. | 80,823 | 8,964 |
| | McKesson Corp. | 57,576 | 8,834 |
| * | Dollar Tree Inc. | 82,976 | 7,988 |
| * | Copart Inc. | 72,300 | 7,470 |
| | Yum China Holdings Inc. | 127,782 | 7,374 |
| * | CarMax Inc. | 58,164 | 6,219 |
| | Tractor Supply Co. | 41,238 | 6,137 |
| | Domino’s Pizza Inc. | 13,900 | 5,685 |
| | ViacomCBS Inc. Class B | 193,101 | 5,378 |
| | AmerisourceBergen Corp. Class A | 52,148 | 5,060 |
| | Expedia Group Inc. | 47,790 | 4,691 |
| * | Burlington Stores Inc. | 22,900 | 4,510 |
| * | Ulta Beauty Inc. | 19,139 | 4,444 |
| | Omnicom Group Inc. | 75,133 | 4,064 |
| | Darden Restaurants Inc. | 45,667 | 3,958 |
| | Advance Auto Parts Inc. | 23,325 | 3,646 |
| | Fox Corp. Class A | 116,330 | 3,241 |
| * | DISH Network Corp. Class A | 88,600 | 3,147 |
| * | Altice USA Inc. Class A | 113,300 | 3,125 |
| | Vail Resorts Inc. | 14,200 | 3,091 |
| * | Liberty Global plc Class C | 132,400 | 3,047 |
| | Rollins Inc. | 52,400 | 2,889 |
| * | Live Nation Entertainment Inc. | 50,800 | 2,885 |
| | Sirius XM Holdings Inc. | 425,400 | 2,497 |
| * | Lyft Inc. Class A | 83,300 | 2,471 |
| | Interpublic Group of Cos. Inc. | 135,613 | 2,408 |
| * | Discovery Communications Inc. Class C | 117,198 | 2,340 |
| * | Liberty Media Corp-Liberty SiriusXM Class C | 62,600 | 2,253 |
| | Aramark | 79,687 | 2,196 |
| | Southwest Airlines Co. | 55,172 | 2,073 |
| | Nielsen Holdings plc | 126,959 | 1,940 |
| | News Corp. Class A | 127,700 | 1,931 |
| * | Liberty Global plc Class A | 70,800 | 1,655 |
| | Fox Corp. Class B | 57,472 | 1,598 |
| | Delta Air Lines Inc. | 51,559 | 1,591 |
| | Kohl’s Corp. | 55,766 | 1,191 |
| * | Discovery Inc. Class A | 53,966 | 1,191 |
| | Gap Inc. | 65,193 | 1,134 |
| * | Liberty Media Corp-Liberty SiriusXM Class A | 29,200 | 1,060 |
| * | United Airlines Holdings Inc. | 26,341 | 948 |
| ^ | Macy’s Inc. | 116,800 | 814 |
| | News Corp. Class B | 52,500 | 791 |
| ^ | Nordstrom Inc. | 41,431 | 663 |
| | Alaska Air Group Inc. | 14,754 | 575 |
| | American Airlines Group Inc. | 42,994 | 561 |
| | | | 1,515,922 |
| Financials (15.0%) | | |
| | Visa Inc. Class A | 601,888 | 127,594 |
| | Mastercard Inc. Class A | 314,562 | 112,673 |
| | JPMorgan Chase & Co. | 1,080,018 | 108,207 |
| | Bank of America Corp. | 2,759,331 | 71,025 |
| | American Tower Corp. | 157,385 | 39,212 |
| | Citigroup Inc. | 743,177 | 37,991 |
| | S&P Global Inc. | 85,953 | 31,495 |
| | BlackRock Inc. | 52,412 | 31,143 |
| | Prologis Inc. | 261,738 | 26,661 |
| | Equinix Inc. | 31,310 | 24,728 |
FTSE Social Index Fund
| | | | Market |
| | | | Value· |
| | | Shares | ($000) |
| | Crown Castle International Corp. | 148,094 | 24,176 |
| | Goldman Sachs Group Inc. | 117,883 | 24,151 |
| | American Express Co. | 232,942 | 23,665 |
| | CME Group Inc. | 126,745 | 22,291 |
| | Marsh & McLennan Cos. Inc. | 180,591 | 20,752 |
| | Morgan Stanley | 392,986 | 20,537 |
| | Intercontinental Exchange Inc. | 192,832 | 20,485 |
| | Chubb Ltd. | 159,857 | 19,982 |
| | Progressive Corp. | 208,770 | 19,841 |
| | Truist Financial Corp. | 479,173 | 18,597 |
| | US Bancorp | 485,631 | 17,677 |
| | Moody’s Corp. | 57,780 | 17,024 |
| | PNC Financial Services Group Inc. | 151,498 | 16,847 |
| | Aon plc Class A | 81,643 | 16,328 |
| | Digital Realty Trust Inc. | 95,046 | 14,794 |
| | Charles Schwab Corp. | 410,626 | 14,590 |
| | SBA Communications Corp. Class A | 39,200 | 11,998 |
| * | CoStar Group Inc. | 13,703 | 11,628 |
| | Public Storage | 53,637 | 11,392 |
| | IHS Markit Ltd. | 141,229 | 11,287 |
| | T. Rowe Price Group Inc. | 80,498 | 11,206 |
| | Capital One Financial Corp. | 161,382 | 11,140 |
| | MSCI Inc. Class A | 29,450 | 10,993 |
| | Bank of New York Mellon Corp. | 283,562 | 10,486 |
| | MetLife Inc. | 271,620 | 10,446 |
| | Travelers Cos. Inc. | 89,905 | 10,433 |
| | Allstate Corp. | 111,998 | 10,416 |
| | Prudential Financial Inc. | 140,225 | 9,503 |
| | Willis Towers Watson plc | 45,826 | 9,419 |
| | Aflac Inc. | 252,222 | 9,161 |
| | American International Group Inc. | 306,848 | 8,942 |
| | State Street Corp. | 125,663 | 8,556 |
| | Welltower Inc. | 148,437 | 8,538 |
| | AvalonBay Communities Inc. | 49,921 | 7,890 |
| | Realty Income Corp. | 122,502 | 7,599 |
| | Alexandria Real Estate Equities Inc. | 44,380 | 7,473 |
| | Equity Residential | 131,215 | 7,407 |
| | Arthur J Gallagher & Co. | 66,989 | 7,054 |
| | Ameriprise Financial Inc. | 43,946 | 6,891 |
| | First Republic Bank | 60,537 | 6,835 |
| | MarketAxess Holdings Inc. | 13,200 | 6,414 |
| | Discover Financial Services | 110,877 | 5,885 |
| | Broadridge Financial Solutions Inc. | 41,088 | 5,645 |
| * | CBRE Group Inc. Class A | 119,074 | 5,600 |
| | Northern Trust Corp. | 67,810 | 5,553 |
| | Invitation Homes Inc. | 192,341 | 5,507 |
| | Ventas Inc. | 133,598 | 5,506 |
| | Nasdaq Inc. | 40,556 | 5,452 |
| | Healthpeak Properties Inc. | 189,550 | 5,239 |
| | Fifth Third Bancorp | 252,082 | 5,208 |
| * | Markel Corp. | 4,782 | 5,197 |
| | Hartford Financial Services Group Inc. | 127,325 | 5,150 |
| | Sun Communities Inc. | 34,000 | 5,069 |
| | Synchrony Financial | 203,753 | 5,055 |
| | Duke Realty Corp. | 130,602 | 5,035 |
| | Extra Space Storage Inc. | 45,100 | 4,805 |
| | Mid-America Apartment Communities Inc. | 41,026 | 4,805 |
| | Boston Properties Inc. | 55,267 | 4,801 |
| | M&T Bank Corp. | 45,639 | 4,713 |
| * | SVB Financial Group | 18,200 | 4,648 |
| * | Arch Capital Group Ltd. | 138,972 | 4,383 |
| | E*TRADE Financial Corp. | 78,898 | 4,268 |
| | KeyCorp | 344,773 | 4,248 |
| * | Zillow Group Inc. Class C | 49,300 | 4,228 |
| | WP Carey Inc. | 60,600 | 4,204 |
| | Cincinnati Financial Corp. | 52,851 | 4,197 |
| | Equity LifeStyle Properties Inc. | 62,200 | 4,123 |
| | Principal Financial Group Inc. | 97,845 | 4,120 |
| | Regions Financial Corp. | 342,983 | 3,965 |
| | Brown & Brown Inc. | 84,700 | 3,930 |
| | Citizens Financial Group Inc. | 149,841 | 3,876 |
| | Credicorp Ltd. | 28,600 | 3,732 |
| | Annaly Capital Management Inc. | 502,133 | 3,691 |
| | UDR Inc. | 105,033 | 3,656 |
| | Cboe Global Markets Inc. | 39,200 | 3,598 |
| | TD Ameritrade Holding Corp. | 91,560 | 3,514 |
| | Western Union Co. | 145,827 | 3,440 |
| | Huntington Bancshares Inc. | 352,237 | 3,315 |
| | Raymond James Financial Inc. | 43,666 | 3,306 |
| | Fidelity National Financial Inc. | 98,513 | 3,234 |
| | RenaissanceRe Holdings Ltd. | 17,318 | 3,182 |
| | Ally Financial Inc. | 135,948 | 3,110 |
| | Everest Re Group Ltd. | 14,101 | 3,103 |
| | Iron Mountain Inc. | 103,024 | 3,100 |
| | W R Berkley Corp. | 49,231 | 3,055 |
| | Globe Life Inc. | 36,905 | 3,044 |
| | Equitable Holdings Inc. | 143,611 | 3,043 |
FTSE Social Index Fund
| | | | Market |
| | | | Value· |
| | | Shares | ($000) |
| | AGNC Investment Corp. | 203,690 | 2,874 |
| | Host Hotels & Resorts Inc. | 247,500 | 2,779 |
| | Alleghany Corp. | 4,968 | 2,755 |
| | VEREIT Inc. | 389,994 | 2,621 |
| | Assurant Inc. | 21,418 | 2,604 |
| | Lincoln National Corp. | 68,483 | 2,469 |
| | Regency Centers Corp. | 60,402 | 2,399 |
| | Vornado Realty Trust | 64,958 | 2,327 |
| | Voya Financial Inc. | 43,753 | 2,271 |
| | Federal Realty Investment Trust | 27,300 | 2,163 |
| | Commerce Bancshares Inc. | 35,717 | 2,128 |
| | SEI Investments Co. | 40,631 | 2,127 |
| | Franklin Resources Inc. | 97,900 | 2,062 |
| | Comerica Inc. | 50,004 | 1,977 |
| | Zions Bancorp NA | 60,246 | 1,937 |
| | Kimco Realty Corp. | 153,244 | 1,837 |
| | Old Republic International Corp. | 106,200 | 1,711 |
| * | Zillow Group Inc. Class A | 19,750 | 1,684 |
| | People’s United Financial Inc. | 145,225 | 1,536 |
| | Invesco Ltd. | 136,341 | 1,391 |
| | Unum Group | 73,798 | 1,364 |
| | SL Green Realty Corp. | 28,018 | 1,310 |
| | Park Hotels & Resorts Inc. | 79,300 | 753 |
| | Santander Consumer USA Holdings Inc. | 24,498 | 422 |
| | CNA Financial Corp. | 9,000 | 290 |
| | | | 1,400,902 |
| Health Care (13.1%) | | |
| | UnitedHealth Group Inc. | 336,563 | 105,193 |
| | Merck & Co. Inc. | 900,745 | 76,807 |
| | Pfizer Inc. | 1,982,666 | 74,925 |
| | Abbott Laboratories | 616,234 | 67,459 |
| | Thermo Fisher Scientific Inc. | 140,810 | 60,405 |
| | AbbVie Inc. | 628,119 | 60,155 |
| | Amgen Inc. | 209,852 | 53,160 |
| | Medtronic plc | 478,361 | 51,409 |
| | Bristol-Myers Squibb Co. | 807,326 | 50,216 |
| | Danaher Corp. | 223,367 | 46,119 |
| | Eli Lilly and Co. | 300,353 | 44,569 |
| * | Intuitive Surgical Inc. | 41,239 | 30,139 |
| | Gilead Sciences Inc. | 446,981 | 29,836 |
| | Zoetis Inc. | 169,586 | 27,151 |
| * | Vertex Pharmaceuticals Inc. | 92,420 | 25,796 |
| | Anthem Inc. | 90,085 | 25,361 |
| | Stryker Corp. | 123,590 | 24,491 |
| | Becton Dickinson and Co. | 96,277 | 23,373 |
| | Cigna Corp. | 129,126 | 22,903 |
| * | Regeneron Pharmaceuticals Inc. | 34,549 | 21,418 |
| * | Boston Scientific Corp. | 497,475 | 20,406 |
| | Humana Inc. | 47,136 | 19,569 |
| * | Edwards Lifesciences Corp. | 219,539 | 18,845 |
| * | Illumina Inc. | 52,305 | 18,684 |
| * | Biogen Inc. | 57,985 | 16,679 |
| | Baxter International Inc. | 181,146 | 15,772 |
| * | DexCom Inc. | 32,800 | 13,953 |
| | HCA Healthcare Inc. | 94,766 | 12,862 |
| * | Centene Corp. | 204,058 | 12,513 |
| * | IDEXX Laboratories Inc. | 29,891 | 11,689 |
| | Zimmer Biomet Holdings Inc. | 73,672 | 10,379 |
| | ResMed Inc. | 50,924 | 9,206 |
| * | Alexion Pharmaceuticals Inc. | 75,898 | 8,669 |
| * | Align Technology Inc. | 27,848 | 8,270 |
| * | Seattle Genetics Inc. | 43,600 | 6,904 |
| | Teleflex Inc. | 16,500 | 6,484 |
| * | Incyte Corp. | 64,356 | 6,201 |
| * | Laboratory Corp. of America Holdings | 34,257 | 6,021 |
| * | Varian Medical Systems Inc. | 32,063 | 5,568 |
| * | Hologic Inc. | 91,727 | 5,478 |
| | Cooper Cos. Inc. | 17,219 | 5,413 |
| * | Alnylam Pharmaceuticals Inc. | 40,388 | 5,357 |
| | Quest Diagnostics Inc. | 47,897 | 5,328 |
| | Cardinal Health Inc. | 104,513 | 5,305 |
| * | BioMarin Pharmaceutical Inc. | 64,614 | 5,042 |
| * | ABIOMED Inc. | 15,780 | 4,854 |
| | STERIS plc | 30,100 | 4,805 |
| * | Elanco Animal Health Inc. | 143,000 | 4,156 |
| * | Exact Sciences Corp. | 52,600 | 3,960 |
| | Dentsply Sirona Inc. | 78,199 | 3,509 |
| * | Henry Schein Inc. | 50,154 | 3,332 |
| * | Mylan NV | 181,535 | 2,974 |
| | Universal Health Services Inc. Class B | 26,170 | 2,888 |
| * | Jazz Pharmaceuticals plc | 19,454 | 2,614 |
| * | DaVita Inc. | 29,623 | 2,570 |
| | Perrigo Co. plc | 47,608 | 2,490 |
| | | | 1,219,634 |
| Industrials (8.1%) | | |
| * | PayPal Holdings Inc. | 418,667 | 85,467 |
| | Accenture plc Class A | 227,263 | 54,527 |
| | Union Pacific Corp. | 242,089 | 46,588 |
| | United Parcel Service Inc. Class B | 251,609 | 41,168 |
| | Fidelity National Information Services Inc. | 220,207 | 33,218 |
| | Caterpillar Inc. | 193,120 | 27,483 |
| | Deere & Co. | 111,846 | 23,494 |
FTSE Social Index Fund
| | | | Market |
| | | | Value· |
| | | Shares | ($000) |
| | Illinois Tool Works Inc. | 112,334 | 22,192 |
| | Automatic Data Processing Inc. | 153,296 | 21,322 |
| | CSX Corp. | 271,326 | 20,746 |
| * | Square Inc. | 128,400 | 20,487 |
| * | Fiserv Inc. | 199,126 | 19,829 |
| | Sherwin-Williams Co. | 29,354 | 19,698 |
| | FedEx Corp. | 86,121 | 18,933 |
| | Global Payments Inc. | 106,024 | 18,726 |
| | Waste Management Inc. | 150,314 | 17,136 |
| | DuPont de Nemours Inc. | 262,700 | 14,648 |
| | Agilent Technologies Inc. | 110,025 | 11,049 |
| | Johnson Controls International plc | 263,949 | 10,751 |
| | Verisk Analytics Inc. Class A | 56,595 | 10,565 |
| | Cintas Corp. | 31,500 | 10,497 |
| | PACCAR Inc. | 120,479 | 10,342 |
| | Trane Technologies plc | 84,660 | 10,023 |
| | Rockwell Automation Inc. | 41,068 | 9,467 |
| | Stanley Black & Decker Inc. | 54,905 | 8,856 |
| | Paychex Inc. | 114,600 | 8,763 |
| * | Mettler-Toledo International Inc. | 8,387 | 8,142 |
| | Fortive Corp. | 106,376 | 7,671 |
| * | FleetCor Technologies Inc. | 29,300 | 7,367 |
| | Old Dominion Freight Line Inc. | 34,575 | 6,990 |
| | Republic Services Inc. Class A | 74,632 | 6,920 |
| * | Keysight Technologies Inc. | 66,466 | 6,548 |
| | Kansas City Southern | 33,851 | 6,162 |
| | TransUnion | 68,100 | 5,906 |
| | WW Grainger Inc. | 15,947 | 5,827 |
| | Vulcan Materials Co. | 47,106 | 5,653 |
| | Dover Corp. | 51,018 | 5,604 |
| | Masco Corp. | 94,100 | 5,486 |
| * | Zebra Technologies Corp. | 18,500 | 5,301 |
| | Expeditors International of Washington Inc. | 58,987 | 5,214 |
| | Xylem Inc. | 63,753 | 5,112 |
| | IDEX Corp. | 27,000 | 4,866 |
| * | Waters Corp. | 21,709 | 4,695 |
| * | Trimble Inc. | 88,650 | 4,646 |
| | CH Robinson Worldwide Inc. | 46,997 | 4,620 |
| | Martin Marietta Materials Inc. | 21,890 | 4,441 |
| | Wabtec Corp. | 64,401 | 4,286 |
| | JB Hunt Transport Services Inc. | 29,951 | 4,209 |
| | Allegion plc | 32,959 | 3,408 |
| | Avery Dennison Corp. | 29,240 | 3,374 |
| | Packaging Corp. of America | 33,220 | 3,363 |
| * | XPO Logistics Inc. | 32,100 | 2,833 |
| | Westrock Co. | 93,000 | 2,821 |
| | Snap-on Inc. | 18,719 | 2,775 |
| * | Arrow Electronics Inc. | 27,988 | 2,199 |
| | Sealed Air Corp. | 55,837 | 2,194 |
| | Robert Half International Inc. | 39,907 | 2,123 |
| * | Flex Ltd. | 181,100 | 1,967 |
| | MDU Resources Group Inc. | 71,715 | 1,694 |
| | Acuity Brands Inc. | 14,338 | 1,567 |
| | ManpowerGroup Inc. | 20,011 | 1,467 |
| | Alliance Data Systems Corp. | 16,800 | 758 |
| | | | 754,184 |
| Technology (34.0%) | | |
| | Apple Inc. | 5,832,364 | 752,608 |
| | Microsoft Corp. | 2,669,678 | 602,092 |
| * | Facebook Inc. Class A | 856,077 | 251,002 |
| * | Alphabet Inc. Class A | 106,991 | 174,345 |
| * | Alphabet Inc. Class C | 105,636 | 172,628 |
| | NVIDIA Corp. | 210,439 | 112,581 |
| * | Adobe Inc. | 171,560 | 88,077 |
| * | salesforce.com Inc. | 308,861 | 84,211 |
| | Intel Corp. | 1,511,287 | 77,000 |
| | Cisco Systems Inc. | 1,514,385 | 63,937 |
| | Broadcom Inc. | 139,304 | 48,359 |
| | QUALCOMM Inc. | 401,279 | 47,792 |
| | Texas Instruments Inc. | 327,495 | 46,553 |
| | Oracle Corp. | 703,751 | 40,269 |
| | International Business Machines Corp. | 316,760 | 39,060 |
| * | Advanced Micro Devices Inc. | 415,171 | 37,706 |
| * | ServiceNow Inc. | 67,733 | 32,649 |
| | Intuit Inc. | 89,938 | 31,064 |
| | Applied Materials Inc. | 325,692 | 20,063 |
| * | Autodesk Inc. | 78,304 | 19,239 |
| * | Micron Technology Inc. | 396,970 | 18,066 |
| | Lam Research Corp. | 51,771 | 17,413 |
| | Analog Devices Inc. | 130,890 | 15,298 |
| * | Workday Inc. Class A | 61,056 | 14,636 |
| * | DocuSign Inc. Class A | 62,900 | 14,027 |
| * | Veeva Systems Inc. Class A | 47,600 | 13,436 |
| | Cognizant Technology Solutions Corp. Class A | 192,637 | 12,880 |
| * | Twilio Inc. Class A | 47,676 | 12,861 |
| * | Splunk Inc. | 56,658 | 12,427 |
| | NXP Semiconductors NV | 98,748 | 12,418 |
| * | Synopsys Inc. | 53,515 | 11,843 |
| | KLA Corp. | 55,350 | 11,354 |
| * | Twitter Inc. | 273,499 | 11,099 |
| * | IQVIA Holdings Inc. | 67,767 | 11,097 |
FTSE Social Index Fund
| | | | Market |
| | | | Value· |
| | | Shares | ($000) |
| * | Cadence Design Systems Inc. | 98,000 | 10,869 |
| | HP Inc. | 510,587 | 9,982 |
| | Motorola Solutions Inc. | 60,686 | 9,391 |
| | Microchip Technology Inc. | 83,600 | 9,171 |
| | Marvell Technology Group Ltd. | 235,400 | 9,129 |
| | Xilinx Inc. | 87,175 | 9,080 |
| * | Palo Alto Networks Inc. | 34,718 | 8,937 |
| * | Okta Inc. | 41,100 | 8,852 |
| | Skyworks Solutions Inc. | 59,147 | 8,567 |
| * | Atlassian Corp. plc Class A | 44,400 | 8,514 |
| | Cerner Corp. | 108,272 | 7,944 |
| * | RingCentral Inc. Class A | 27,100 | 7,880 |
| * | VeriSign Inc. | 36,249 | 7,786 |
| * | Yandex NV Class A | 101,820 | 6,947 |
| * | Akamai Technologies Inc. | 56,803 | 6,614 |
| | Maxim Integrated Products Inc. | 94,696 | 6,481 |
| | Citrix Systems Inc. | 43,638 | 6,336 |
| * | Fortinet Inc. | 47,300 | 6,244 |
| | CDW Corp. | 50,008 | 5,683 |
| * | Qorvo Inc. | 41,000 | 5,259 |
| * | Paycom Software Inc. | 17,500 | 5,240 |
| * | GoDaddy Inc. Class A | 59,300 | 4,962 |
| * | Check Point Software Technologies Ltd. | 37,858 | 4,780 |
| * | Arista Networks Inc. | 20,742 | 4,635 |
| | NortonLifeLock Inc. | 196,883 | 4,631 |
| | Hewlett Packard Enterprise Co. | 457,961 | 4,428 |
| | Seagate Technology plc | 91,771 | 4,404 |
| * | Slack Technologies Inc. Class A | 134,100 | 4,404 |
| | Western Digital Corp. | 106,023 | 4,073 |
| * | VMware Inc. Class A | 27,974 | 4,041 |
| * | Gartner Inc. | 30,500 | 3,959 |
| | NetApp Inc. | 78,365 | 3,714 |
| * | Dell Technologies Inc. | 54,353 | 3,592 |
| * | PTC Inc. | 36,700 | 3,355 |
| | Juniper Networks Inc. | 116,625 | 2,916 |
| | Amdocs Ltd. | 46,825 | 2,867 |
| * | F5 Networks Inc. | 21,444 | 2,838 |
| | CDK Global Inc. | 43,350 | 2,021 |
| | DXC Technology Co. | 91,005 | 1,818 |
| | Xerox Holdings Corp. | 64,617 | 1,219 |
| | | | 3,163,653 |
| Telecommunications (2.0%) | | |
| | Verizon Communications Inc. | 1,476,980 | 87,540 |
| | AT&T Inc. | 2,542,580 | 75,794 |
| * | T-Mobile US Inc. | 196,123 | 22,884 |
| | CenturyLink Inc. | 387,500 | 4,166 |
| | | | 190,384 |
| Utilities (0.8%) | | |
| | Sempra Energy | 104,500 | 12,921 |
| | American Water Works Co. Inc. | 64,697 | 9,144 |
| | Consolidated Edison Inc. | 118,625 | 8,463 |
| | PPL Corp. | 274,537 | 7,586 |
| | Edison International | 127,500 | 6,691 |
| | CMS Energy Corp. | 101,105 | 6,116 |
| | Alliant Energy Corp. | 89,800 | 4,863 |
| | Atmos Energy Corp. | 43,200 | 4,312 |
| | AES Corp. | 233,900 | 4,152 |
| | CenterPoint Energy Inc. | 177,716 | 3,567 |
| | NiSource Inc. | 134,892 | 2,989 |
| | Avangrid Inc. | 19,439 | 934 |
| | | | 71,738 |
Total Common Stocks
(Cost $5,538,221) | | 9,290,695 |
| Temporary Cash Investments (0.2%) | |
| Money Market Fund (0.2%) | | |
| 1,2 | Vanguard Market Liquidity Fund, 0.147% | 196,362 | 19,636 |
| | | | |
| | | Face | |
| | | Amount | |
| | | ($000) | |
| U.S. Government and Agency Obligations (0.0%) |
| 3 | United States Cash Management Bill, 0.116%, 9/29/20 | 2,870 | 2,870 |
Total Temporary Cash Investments
(Cost $22,506) | 22,506 |
Total Investments (100.0%)
(Cost $5,560,727) | | 9,313,201 |
| Other Assets and Liabilities—Net (0.0%) | | (4,505) |
| Net Assets (100%) | | 9,308,696 |
Cost is in $000.
| · | See Note A in Notes to Financial Statements. |
| * | Non-income-producing security. |
| ^ | Includes partial security positions on loan to broker-dealers. The total value of securities on loan is $2,304,000. |
| 1 | Affiliated money market fund available only to Vanguard funds and certain trusts and accounts managed by Vanguard. Rate shown is the 7-day yield. |
| 2 | Collateral of $2,444,000 was received for securities on loan. |
| 3 | Securities with a value of $1,993,000 have been segregated as initial margin for open futures contracts. |
FTSE Social Index Fund
| Derivative Financial Instruments Outstanding as of Period End |
| Futures Contracts | | | | | | | | | |
| | | | | | | | | ($000 | ) |
| | | | | | | | | Value and | |
| | | | | Number of | | | | Unrealized | |
| | | | | Long (Short) | | Notional | | Appreciation | |
| | | Expiration | | Contracts | | Amount | | (Depreciation | ) |
| Long Futures Contracts | | | | | | | | | |
| E-mini S&P 500 Index | | September 2020 | | 85 | | 14,870 | | 271 | |
See accompanying Notes, which are an integral part of the Financial Statements.
| FTSE Social Index Fund | |
| | |
| | |
| Statement of Assets and Liabilities | |
| As of August 31, 2020 | |
| | |
| ($000s, except shares and per-share amounts) | Amount |
| Assets | |
| Investments in Securities, at Value | |
| Unaffiliated Issuers (Cost $5,541,091) | 9,293,565 |
| Affiliated Issuers (Cost $19,636) | 19,636 |
| Total Investments in Securities | 9,313,201 |
| Investment in Vanguard | 363 |
| Receivables for Accrued Income | 8,727 |
| Receivables for Capital Shares Issued | 17,436 |
| Variation Margin Receivable—Futures Contracts | 66 |
| Total Assets | 9,339,793 |
| Liabilities | |
| Due to Custodian | 115 |
| Payables for Investment Securities Purchased | 21,161 |
| Collateral for Securities on Loan | 2,444 |
| Payables for Capital Shares Redeemed | 6,797 |
| Payables to Vanguard | 580 |
| Total Liabilities | 31,097 |
| Net Assets | 9,308,696 |
| | |
| | |
| At August 31, 2020, net assets consisted of: | |
| | |
| Paid-in Capital | 5,999,743 |
| Total Distributable Earnings (Loss) | 3,308,953 |
| Net Assets | 9,308,696 |
| | |
| Admiral Shares—Net Assets | |
| Applicable to 154,803,958 outstanding $.001 par value shares of beneficial interest (unlimited authorization) | 5,305,361 |
| Net Asset Value Per Share—Admiral Shares | $34.27 |
| | |
| Institutional Shares—Net Assets | |
| Applicable to 162,271,178 outstanding $.001 par value shares of beneficial interest (unlimited authorization) | 4,003,335 |
| Net Asset Value Per Share—Institutional Shares | $24.67 |
See accompanying Notes, which are an integral part of the Financial Statements.
| FTSE Social Index Fund | |
| | |
| | |
| Statement of Operations | |
| | |
| | |
| | Year Ended |
| | August 31, 2020 |
| | ($000) |
| Investment Income | |
| Income | |
| Dividends | 127,872 |
| Interest1 | 217 |
| Securities Lending—Net | 88 |
| Total Income | 128,177 |
| Expenses | |
| The Vanguard Group—Note B | |
| Investment Advisory Services | 1,086 |
| Management and Administrative—Investor Shares | 10 |
| Management and Administrative—Admiral Shares | 4,880 |
| Management and Administrative—Institutional Shares | 3,112 |
| Marketing and Distribution—Admiral Shares | 235 |
| Marketing and Distribution—Institutional Shares | 129 |
| Custodian Fees | 71 |
| Auditing Fees | 31 |
| Shareholders’ Reports—Admiral Shares | 75 |
| Shareholders’ Reports—Institutional Shares | 67 |
| Trustees’ Fees and Expenses | 5 |
| Total Expenses | 9,701 |
| Net Investment Income | 118,476 |
| Realized Net Gain (Loss) | |
| Investment Securities Sold1 | (433,894) |
| Futures Contracts | 2,384 |
| Realized Net Gain (Loss) | (431,510) |
| Change in Unrealized Appreciation (Depreciation) | |
| Investment Securities1 | 2,226,315 |
| Futures Contracts | 112 |
| Change in Unrealized Appreciation (Depreciation) | 2,226,427 |
| Net Increase (Decrease) in Net Assets Resulting from Operations | 1,913,393 |
| 1 | Interest income, realized net gain (loss), and change in unrealized appreciation (depreciation) from an affiliated company of the fund were $207,000, $14,000, and ($1,000), respectively. Purchases and sales are for temporary cash investment purposes. |
See accompanying Notes, which are an integral part of the Financial Statements.
| FTSE Social Index Fund | | | | | | |
| | | | | | | |
| | | | | | | |
| Statement of Changes in Net Assets | | | | | | |
| | | | | | | |
| | | | | | | |
| | | Year Ended August 31, | |
| | | 2020 | | | 2019 | |
| | | | ($000 | ) | | | ($000 | ) |
| Increase (Decrease) in Net Assets | | | | | | | | |
| Operations | | | | | | | | |
| Net Investment Income | | | 118,476 | | | | 86,372 | |
| Realized Net Gain (Loss) | | | (431,510 | ) | | | 229,971 | |
| Change in Unrealized Appreciation (Depreciation) | | | 2,226,427 | | | | (79,504 | ) |
| Net Increase (Decrease) in Net Assets Resulting from Operations | | | 1,913,393 | | | | 236,839 | |
| Distributions1 | | | | | | | | |
| Investor Shares | | | (124 | ) | | | (40,288 | ) |
| Admiral Shares | | | (65,035 | ) | | | (8,771 | ) |
| Institutional Shares | | | (50,308 | ) | | | (36,429 | ) |
| Total Distributions | | | (115,467 | ) | | | (85,488 | ) |
| Capital Share Transactions | | | | | | | | |
| Investor Shares | | | (59,575 | ) | | | (2,824,591 | ) |
| Admiral Shares | | | 804,650 | | | | 3,456,334 | |
| Institutional Shares | | | 528,553 | | | | 288,120 | |
| Net Increase (Decrease) from Capital Share Transactions | | | 1,273,628 | | | | 919,863 | |
| Total Increase (Decrease) | | | 3,071,554 | | | | 1,071,214 | |
| Net Assets | | | | | | | | |
| Beginning of Period | | | 6,237,142 | | | | 5,165,928 | |
| End of Period | | | 9,308,696 | | | | 6,237,142 | |
1 Certain prior period numbers have been reclassified to conform with current period presentation.
See accompanying Notes, which are an integral part of the Financial Statements.
| FTSE Social Index Fund | | | | | |
| | | | | | |
| | | | | | |
| Financial Highlights | | | | | |
| | | | | | |
| | | | | | |
| Investor Shares | | | | | |
| | Sept. 1, | | | | |
| | 2019, to | | | | |
| For a Share Outstanding | Nov. 7, | | Year Ended August 31, |
| Throughout Each Period | 20191 | 2019 | 2018 | 2017 | 2016 |
| Net Asset Value, Beginning of Period | $19.62 | $19.27 | $16.14 | $13.95 | $12.99 |
| Investment Operations | | | | | |
| Net Investment Income | .0642 | .2932 | .2902 | .2562 | .241 |
| Net Realized and Unrealized Gain (Loss) on Investments | 1.140 | .362 | 3.108 | 2.175 | 1.025 |
| Total from Investment Operations | 1.204 | .655 | 3.398 | 2.431 | 1.266 |
| Distributions | | | | | |
| Dividends from Net Investment Income | (.084) | (.305) | (.268) | (.241) | (.306) |
| Distributions from Realized Capital Gains | — | — | — | — | — |
| Total Distributions | (.084) | (.305) | (.268) | (.241) | (.306) |
| Net Asset Value, End of Period | $20.741 | $19.62 | $19.27 | $16.14 | $13.95 |
| | | | | | |
| Total Return3 | 6.15% | 3.53% | 21.27% | 17.61% | 9.95% |
| | | | | | |
| Ratios/Supplemental Data | | | | | |
| Net Assets, End of Period (Millions) | $— | $59 | $2,817 | $1,952 | $1,435 |
| Ratio of Total Expenses to Average Net Assets | 0.18% | 0.18% | 0.18% | 0.20% | 0.22% |
| Ratio of Net Investment Income to Average Net Assets | 1.71% | 1.43% | 1.65% | 1.71% | 1.87% |
| Portfolio Turnover Rate | 18%4 | 11%5 | 8%5 | 11%5 | 16%5 |
| 1 | Net asset value as of November 7, 2019, on which date the remaining Investor Shares were converted to Admiral Shares. |
| 2 | Calculated based on average shares outstanding. |
| 3 | Total returns do not include account service fees that may have applied in the periods shown. Fund prospectuses provide information about any applicable account service fees. |
| 4 | Reflects the fund’s portfolio turnover for the fiscal year ended August 31, 2020. |
| 5 | Excludes the value of portfolio securities received or delivered as a result of in-kind purchases or redemptions of the fund’s capital shares. |
See accompanying Notes, which are an integral part of the Financial Statements.
| FTSE Social Index Fund | | | |
| | | | |
| | | | |
| Financial Highlights | | | |
| | | | |
| | | | |
| Admiral Shares | | | |
| | | | |
| | Year | Feb. 7, | |
| | Ended | 20191 to | |
| | Aug. 31, | Aug. 31, | |
| For a Share Outstanding Throughout Each Period | 2020 | 2019 | |
| Net Asset Value, Beginning of Period | $27.27 | $25.00 | |
| Investment Operations | | | |
| Net Investment Income2 | .465 | .273 | |
| Net Realized and Unrealized Gain (Loss) on Investments | 6.996 | 2.183 | |
| Total from Investment Operations | 7.461 | 2.456 | |
| Distributions | | | |
| Dividends from Net Investment Income | (.461) | (.186 | ) |
| Distributions from Realized Capital Gains | — | — | |
| Total Distributions | (.461) | (.186 | ) |
| Net Asset Value, End of Period | $34.27 | $27.27 | |
| | | | |
| Total Return3 | 27.83% | 9.85% | |
| | | | |
| Ratios/Supplemental Data | | | |
| Net Assets, End of Period (Millions) | $5,305 | $3,478 | |
| Ratio of Total Expenses to Average Net Assets | 0.14% | 0.14%4 | |
| Ratio of Net Investment Income to Average Net Assets | 1.60% | 1.79%4 | |
| Portfolio Turnover Rate | 18% | 11%5,6 | |
| 2 | Calculated based on average shares outstanding. |
| 3 | Total returns do not include account service fees that may have applied in the periods shown. Fund prospectuses provide information about any applicable account service fees. |
| 5 | Excludes the value of portfolio securities received or delivered as a result of in-kind purchases or redemptions of the fund’s capital shares. |
| 6 | Reflects the fund’s portfolio turnover for the fiscal year ended August 31, 2019. |
See accompanying Notes, which are an integral part of the Financial Statements.
| FTSE Social Index Fund | | | | | |
| | | | | | |
| | | | | | |
| Financial Highlights | | | | | |
| | | | | | |
| | | | | | |
| Institutional Shares | | | | | |
| | | | | | |
| For a Share Outstanding | | | Year Ended August 31, |
| Throughout Each Period | 2020 | 2019 | 2018 | 2017 | 2016 |
| Net Asset Value, Beginning of Period | $19.63 | $19.28 | $16.15 | $13.96 | $13.00 |
| Investment Operations | | | | | |
| Net Investment Income | .3391 | .3141 | .3051 | .2711 | .254 |
| Net Realized and Unrealized Gain (Loss) on Investments | 5.037 | .351 | 3.105 | 2.175 | 1.029 |
| Total from Investment Operations | 5.376 | .665 | 3.410 | 2.446 | 1.283 |
| Distributions | | | | | |
| Dividends from Net Investment Income | (.336) | (.315) | (.280) | (.256) | (.323) |
| Distributions from Realized Capital Gains | — | — | — | — | — |
| Total Distributions | (.336) | (.315) | (.280) | (.256) | (.323) |
| Net Asset Value, End of Period | $24.67 | $19.63 | $19.28 | $16.15 | $13.96 |
| | | | | | |
| Total Return | 27.86% | 3.58% | 21.34% | 17.72% | 10.09% |
| | | | | | |
| Ratios/Supplemental Data | | | | | |
| Net Assets, End of Period (Millions) | $4,003 | $2,701 | $2,349 | $1,443 | $876 |
| Ratio of Total Expenses to Average Net Assets | 0.12% | 0.12% | 0.12% | 0.12% | 0.12% |
| Ratio of Net Investment Income to Average Net Assets | 1.62% | 1.49% | 1.71% | 1.79% | 1.97% |
| Portfolio Turnover Rate | 18% | 11%2 | 8%2 | 11%2 | 16%2 |
| 1 | Calculated based on average shares outstanding. |
| 2 | Excludes the value of portfolio securities received or delivered as a result of in-kind purchases or redemptions of the fund’s capital shares. |
See accompanying Notes, which are an integral part of the Financial Statements.
FTSE Social Index Fund
Notes to Financial Statements
Vanguard FTSE Social Index Fund is registered under the Investment Company Act of 1940 as an open-end investment company, or mutual fund. The fund offers two classes of shares: Admiral Shares and Institutional Shares. Each of the share classes has different eligibility and minimum purchase requirements, and is designed for different types of investors. Prior to November 7, 2019, the fund offered Investor Shares. Effective at the close of business on November 7, 2019, the remaining Investor Shares were converted to Admiral Shares.
Market disruptions associated with the COVID-19 pandemic have had a global impact, and uncertainty exists as to the long-term implications. Such disruptions can adversely affect assets of the fund and thus fund performance.
A. The following significant accounting policies conform to generally accepted accounting principles for U.S. investment companies. The fund consistently follows such policies in preparing its financial statements.
1. Security Valuation: Securities are valued as of the close of trading on the New York Stock Exchange (generally 4 p.m., Eastern time) on the valuation date. Equity securities are valued at the latest quoted sales prices or official closing prices taken from the primary market in which each security trades; such securities not traded on the valuation date are valued at the mean of the latest quoted bid and asked prices. Securities for which market quotations are not readily available, or whose values have been materially affected by events occurring before the fund’s pricing time but after the close of the securities’ primary markets, are valued by methods deemed by the board of trustees to represent fair value. Investments in Vanguard Market Liquidity Fund are valued at that fund’s net asset value. Temporary cash investments are valued using the latest bid prices or using valuations based on a matrix system (which considers such factors as security prices, yields, maturities, and ratings), both as furnished by independent pricing services.
2. Futures Contracts: The fund uses index futures contracts to a limited extent, with the objectives of maintaining full exposure to the stock market, maintaining liquidity, and minimizing transaction costs. The fund may purchase futures contracts to immediately invest incoming cash in the market, or sell futures in response to cash outflows, thereby simulating a fully invested position in the underlying index while maintaining a cash balance for liquidity. The primary risks associated with the use of futures contracts are imperfect correlation between changes in market values of stocks held by the fund and the prices of futures contracts, and the possibility of an illiquid market. Counterparty risk involving futures is mitigated because a regulated clearinghouse is the counterparty instead of the clearing broker. To further mitigate counterparty risk, the fund trades futures contracts on an exchange, monitors the financial strength of its clearing brokers and clearinghouse, and has entered into clearing agreements with its clearing brokers. The clearinghouse imposes initial margin requirements to secure the fund’s performance and requires daily settlement of variation margin representing changes in the market value of each contract. Any securities pledged as initial margin for open contracts are noted in the Schedule of Investments.
Futures contracts are valued at their quoted daily settlement prices. The notional amounts of the contracts are not recorded in the Statement of Assets and Liabilities. Fluctuations in the value of the contracts are recorded in the Statement of Assets and Liabilities as an asset (liability) and in the Statement of Operations as unrealized appreciation (depreciation) until the contracts are closed, when they are recorded as realized gains (losses) on futures contracts.
FTSE Social Index Fund
During the year ended August 31, 2020, the fund’s average investments in long and short futures contracts represented less than 1% and 0% of net assets, respectively, based on the average of the notional amounts at each quarter-end during the period.
3. Federal Income Taxes: The fund intends to continue to qualify as a regulated investment company and distribute all of its taxable income. The fund’s tax returns are open to examination by the relevant tax authorities until expiration of the applicable statute of limitations, which is generally three years after the filing of the tax return. Management has analyzed the fund’s tax positions taken for all open federal and state income tax years, and has concluded that no provision for income tax is required in the fund’s financial statements.
4. Distributions: Distributions to shareholders are recorded on the ex-dividend date. Distributions are determined on a tax basis at the fiscal year-end and may differ from net investment income and realized capital gains for financial reporting purposes.
5. Securities Lending: To earn additional income, the fund lends its securities to qualified institutional borrowers. Security loans are subject to termination by the fund at any time, and are required to be secured at all times by collateral in an amount at least equal to the market value of securities loaned. Daily market fluctuations could cause the value of loaned securities to be more or less than the value of the collateral received. When this occurs, the collateral is adjusted and settled before the opening of the market on the next business day. The fund further mitigates its counterparty risk by entering into securities lending transactions only with a diverse group of prequalified counterparties, monitoring their financial strength, and entering into master securities lending agreements with its counterparties. The master securities lending agreements provide that, in the event of a counterparty’s default (including bankruptcy), the fund may terminate any loans with that borrower, determine the net amount owed, and sell or retain the collateral up to the net amount owed to the fund; however, such actions may be subject to legal proceedings. While collateral mitigates counterparty risk, in the event of a default, the fund may experience delays and costs in recovering the securities loaned. The fund invests cash collateral received in Vanguard Market Liquidity Fund, and records a liability in the Statement of Assets and Liabilities for the return of the collateral, during the period the securities are on loan. Collateral investments in Vanguard Market Liquidity Fund are subject to market appreciation or depreciation. Securities lending income represents fees charged to borrowers plus income earned on invested cash collateral, less expenses associated with the loan. During the term of the loan, the fund is entitled to all distributions made on or in respect of the loaned securities.
6. Credit Facilities and Interfund Lending Program: The fund and certain other funds managed by The Vanguard Group (“Vanguard”) participate in a $4.3 billion committed credit facility provided by a syndicate of lenders pursuant to a credit agreement and an uncommitted credit facility provided by Vanguard. Both facilities may be renewed annually. Each fund is individually liable for its borrowings, if any, under the credit facilities. Borrowings may be utilized for temporary or emergency purposes, subject to the fund’s regulatory and contractual borrowing restrictions. With respect to the committed credit facility, the participating funds are charged administrative fees and an annual commitment fee of 0.10% of the undrawn committed amount of the facility; these fees are allocated to the funds based on a method approved by the fund’s board of trustees and included in Management and Administrative expenses on the fund’s Statement of Operations. Any borrowings under either
FTSE Social Index Fund
facility bear interest at a rate based upon the higher of the one-month London Interbank Offered Rate (or an acceptable alternate rate, if necessary), federal funds effective rate, or overnight bank funding rate plus an agreed-upon spread, except that borrowings under the uncommitted credit facility may bear interest based upon an alternative rate agreed to by the fund and Vanguard.
In accordance with an exemptive order (the “Order”) from the SEC, the fund may participate in a joint lending and borrowing program that allows registered open-end Vanguard funds to borrow money from and lend money to each other for temporary or emergency purposes (the “Interfund Lending Program”), subject to compliance with the terms and conditions of the Order, and to the extent permitted by the fund’s investment objective and investment policies. Interfund loans and borrowings normally extend overnight, but can have a maximum duration of seven days. Loans may be called on one business day’s notice. The interest rate to be charged is governed by the conditions of the Order and internal procedures adopted by the board of trustees. The board of trustees is responsible for overseeing the Interfund Lending Program.
For the year ended August 31, 2020, the fund did not utilize the credit facilities or the Interfund Lending Program.
7. Other: Dividend income is recorded on the ex-dividend date. Interest income includes income distributions received from Vanguard Market Liquidity Fund and is accrued daily. Premiums and discounts on debt securities are amortized and accreted, respectively, to interest income over the lives of the respective securities, except for premiums on certain callable debt securities that are amortized to the earliest call date. Security transactions are accounted for on the date securities are bought or sold. Costs used to determine realized gains (losses) on the sale of investment securities are those of the specific securities sold.
Each class of shares has equal rights as to assets and earnings, except that each class separately bears certain class-specific expenses related to maintenance of shareholder accounts (included in Management and Administrative expenses) and shareholder reporting. Marketing and distribution expenses are allocated to each class of shares based on a method approved by the board of trustees. Income, other non-class-specific expenses, and gains and losses on investments are allocated to each class of shares based on its relative net assets.
B. In accordance with the terms of a Funds’ Service Agreement (the “FSA”) between Vanguard and the fund, Vanguard furnishes to the fund investment advisory, corporate management, administrative, marketing, and distribution services at Vanguard’s cost of operations (as defined by the FSA). These costs of operations are allocated to the fund based on methods and guidelines approved by the board of trustees and are generally settled twice a month.
Upon the request of Vanguard, the fund may invest up to 0.40% of its net assets as capital in Vanguard. At August 31, 2020, the fund had contributed to Vanguard capital in the amount of $363,000, representing less than 0.01% of the fund’s net assets and 0.15% of Vanguard’s capital received pursuant to the FSA. The fund’s trustees and officers are also directors and employees, respectively, of Vanguard.
FTSE Social Index Fund
C. Various inputs may be used to determine the value of the fund’s investments and derivatives. These inputs are summarized in three broad levels for financial statement purposes. The inputs or methodologies used to value securities are not necessarily an indication of the risk associated with investing in those securities.
Level 1—Quoted prices in active markets for identical securities.
Level 2—Other significant observable inputs (including quoted prices for similar securities, interest rates, prepayment speeds, credit risk, etc.).
Level 3—Significant unobservable inputs (including the fund’s own assumptions used to determine the fair value of investments). Any investments and derivatives valued with significant unobservable inputs are noted on the Schedule of Investments.
The following table summarizes the market value of the fund’s investments and derivatives as of August 31, 2020, based on the inputs used to value them:
| | Level 1 | Level 2 | Level 3 | Total |
| | ($000) | ($000) | ($000) | ($000) |
| Investments | | | | |
| Assets | | | | |
| Common Stocks | 9,290,695 | — | — | 9,290,695 |
| Temporary Cash Investments | 19,636 | 2,870 | — | 22,506 |
| Total | 9,310,331 | 2,870 | — | 9,313,201 |
| Derivative Financial Instruments | | | | |
| Assets | | | | |
| Futures Contracts1 | 66 | — | — | 66 |
1 Represents variation margin on the last day of the reporting period.
D. Permanent differences between book-basis and tax-basis components of net assets, if any, are reclassified among capital accounts in the financial statements to reflect their tax character. These reclassifications have no effect on net assets or net asset value per share.
| | Amount |
| | ($000) |
| Paid-in Capital | 46 |
| Total Distributable Earnings (Loss) | (46) |
Temporary differences between book-basis and tax-basis components of total distributable earnings (loss) arise when certain items of income, gain, or loss are recognized in different periods for financial statement and tax purposes; these differences will reverse at some time in the future.
FTSE Social Index Fund
The differences are primarily related to the deferral of losses from wash sales and the recognition of unrealized gains or losses from certain derivative contracts. As of period end, the tax-basis components of total distributable earnings (loss) are detailed in the table as follows:
| | Amount |
| | ($000) |
| Undistributed Ordinary Income | 23,542 |
| Undistributed Long-Term Gains | — |
| Capital Loss Carryforwards | (467,063) |
| Qualified Late-Year Losses | — |
| Net Unrealized Gains (Losses) | 3,752,474 |
The tax character of distributions paid was as follows:
| | Year Ended August 31, |
| | 2020 | 2019 |
| | Amount | Amount |
| | ($000) | ($000) |
| Ordinary Income* | 115,467 | 85,488 |
| Long-Term Capital Gains | — | — |
| Total | 115,467 | 85,488 |
* Includes short-term capital gains, if any.
As of August 31, 2020, gross unrealized appreciation and depreciation for investments and derivatives based on cost for U.S. federal income tax purposes were as follows:
| | Amount |
| | ($000) |
| Tax Cost | 5,560,727 |
| Gross Unrealized Appreciation | 3,922,688 |
| Gross Unrealized Depreciation | (170,214) |
| Net Unrealized Appreciation (Depreciation) | 3,752,474 |
E. During the year ended August 31, 2020, the fund purchased $2,582,292,000 of investment securities and sold $1,308,300,000 of investment securities, other than temporary cash investments.
FTSE Social Index Fund
F. Capital share transactions for each class of shares were:
| | Year Ended August 31, |
| | 2020 | | 2019 |
| | Amount | Shares | | Amount | Shares |
| | ($000) | (000 | ) | ($000) | (000) |
| Investor Shares | | | | | |
| Issued | 922 | 45 | | 1,047,133 | 55,926 |
| Issued in Lieu of Cash Distributions | 124 | 6 | | 35,663 | 1,980 |
| Redeemed1 | (60,621) | (3,047 | ) | (3,907,387) | (201,067) |
| Net Increase (Decrease)—Investor Shares | (59,575) | (2,996 | ) | (2,824,591) | (143,161) |
| Admiral Shares2 | | | | | |
| Issued1 | 1,697,269 | 58,728 | | 3,569,059 | 131,708 |
| Issued in Lieu of Cash Distributions | 56,851 | 2,114 | | 7,410 | 274 |
| Redeemed | (949,470) | (33,560 | ) | (120,135) | (4,460) |
| Net Increase (Decrease)—Admiral Shares | 804,650 | 27,282 | | 3,456,334 | 127,522 |
| Institutional Shares | | | | | |
| Issued | 1,143,683 | 54,448 | | 1,010,600 | 53,651 |
| Issued in Lieu of Cash Distributions | 48,991 | 2,528 | | 35,748 | 1,947 |
| Redeemed | (664,121) | (32,286 | ) | (758,228) | (39,850) |
| Net Increase (Decrease)—Institutional Shares | 528,553 | 24,690 | | 288,120 | 15,748 |
| 1 | In November 2018, the fund announced changes to the availability and minimum investment criteria of the Investor and Admiral share classes. As a result, all of the outstanding Investor Shares automatically converted to Admiral Shares beginning in April 2019. Investor Shares—Redeemed and Admiral Shares—Issued include 68,000 and 49,000 shares, respectively, in the amount of $1,355,000 from the conversion during the year ended August 31, 2020. Investor Shares—Redeemed and Admiral Shares—Issued include 160,408,000 and 115,388,000 shares, respectively, in the amount of $3,361,780,000 from the conversion during the year ended August 31, 2019. |
| 2 | Inception was February 7, 2019, for Admiral Shares. |
G. Management has determined that no events or transactions occurred subsequent to August 31, 2020, that would require recognition or disclosure in these financial statements.
Report of Independent Registered Public Accounting Firm
To the Board of Trustees of Vanguard World Fund and Shareholders of Vanguard FTSE Social Index Fund
Opinion on the Financial Statements
We have audited the accompanying statement of assets and liabilities, including the schedule of investments, of Vanguard FTSE Social Index Fund (one of the funds constituting Vanguard World Fund, referred to hereafter as the “Fund”) as of August 31, 2020, the related statement of operations for the year ended August 31, 2020, the statement of changes in net assets for each of the two years in the period ended August 31, 2020, including the related notes, and the financial highlights for each of the periods indicated therein (collectively referred to as the “financial statements”). In our opinion, the financial statements present fairly, in all material respects, the financial position of the Fund as of August 31, 2020, the results of its operations for the year then ended, the changes in its net assets for each of the two years in the period ended August 31, 2020 and the financial highlights for each of the periods indicated therein in conformity with accounting principles generally accepted in the United States of America.
Basis for Opinion
These financial statements are the responsibility of the Fund’s management. Our responsibility is to express an opinion on the Fund’s financial statements based on our audits. We are a public accounting firm registered with the Public Company Accounting Oversight Board (United States) (“PCAOB”) and are required to be independent with respect to the Fund in accordance with the U.S. federal securities laws and the applicable rules and regulations of the Securities and Exchange Commission and the PCAOB.
We conducted our audits of these financial statements in accordance with the standards of the PCAOB. Those standards require that we plan and perform the audit to obtain reasonable assurance about whether the financial statements are free of material misstatement, whether due to error or fraud.
Our audits included performing procedures to assess the risks of material misstatement of the financial statements, whether due to error or fraud, and performing procedures that respond to those risks. Such procedures included examining, on a test basis, evidence regarding the amounts and disclosures in the financial statements. Our audits also included evaluating the accounting principles used and significant estimates made by management, as well as evaluating the overall presentation of the financial statements. Our procedures included confirmation of securities owned as of August 31, 2020 by correspondence with the custodian and brokers and by agreement to the underlying ownership records of the transfer agent; when replies were not received from brokers, we performed other auditing procedures. We believe that our audits provide a reasonable basis for our opinion.
/s/PricewaterhouseCoopers LLP
Philadelphia, Pennsylvania
October 15, 2020
We have served as the auditor of one or more investment companies in The Vanguard Group of Funds since 1975.
Special 2020 tax information (unaudited) for Vanguard FTSE Social Index Fund
This information for the fiscal year ended August 31, 2020, is included pursuant to provisions of the Internal Revenue Code.
The fund distributed $115,467,000 of qualified dividend income to shareholders during the fiscal year.
For corporate shareholders, 97.2% of investment income (dividend income plus short-term gains, if any) qualifies for the dividends-received deduction.
Trustees Approve Advisory Arrangement
The board of trustees of Vanguard FTSE Social Index Fund has renewed the fund’s investment advisory arrangement with The Vanguard Group, Inc. (Vanguard), through its Equity Index Group. The board determined that continuing the fund’s internalized management structure was in the best interests of the fund and its shareholders.
The board based its decision upon an evaluation of the advisor’s investment staff, portfolio management process, and performance. This evaluation included information provided to the board by Vanguard’s Portfolio Review Department, which is responsible for fund and advisor oversight and product management. The Portfolio Review Department met regularly with the advisor and made monthly presentations to the board during the fiscal year that directed the board’s focus to relevant information and topics.
The board, or an investment committee made up of board members, also received information throughout the year through advisor presentations. For each advisor presentation, the board was provided with letters and reports that included information about, among other things, the advisory firm and the advisor’s assessment of the investment environment, portfolio performance, and portfolio characteristics.
In addition, the board received monthly reports, which included a Market and Economic Report, a Fund Dashboard Monthly Summary, and a Fund Performance Report.
Prior to their meeting, the trustees were provided with a memo and materials that summarized the information they received over the course of the year. They also considered the factors discussed below, among others. However, no single factor determined whether the board approved the arrangement. Rather, it was the totality of the circumstances that drove the board’s decision.
Nature, extent, and quality of services
The board reviewed the quality of the fund’s investment management services over both the short and long term, and took into account the organizational depth and stability of the advisor. The board considered that Vanguard has been managing investments for more than four decades. The Equity Index Group adheres to a sound, disciplined investment management process; the team has considerable experience, stability, and depth.
The board concluded that Vanguard’s experience, stability, depth, and performance, among other factors, warranted continuation of the advisory arrangement.
Investment performance
The board considered the short-and long-term performance of the fund, including any periods of outperformance or underperformance compared with its target index and peer group. The board concluded that the performance was such that the advisory arrangement should continue.
Cost
The board concluded that the fund’s expense ratio was well below the average expense ratio charged by funds in its peer group and that the fund’s advisory expenses were also well below the peer-group average.
The board does not conduct a profitability analysis of Vanguard because of Vanguard’s unique structure. Unlike most other mutual fund management companies, Vanguard is owned by the funds it oversees.
The benefit of economies of scale
The board concluded that the fund’s arrangement with Vanguard ensures that the fund will realize economies of scale as it grows, with the cost to shareholders declining as fund assets increase.
The board will consider whether to renew the advisory arrangement again after a one-year period.
Liquidity Risk Management
Vanguard funds (except for the money market funds) have adopted and implemented a written liquidity risk management program (the “Program”) as required by Rule 22e-4 under the Investment Company Act of 1940. Rule 22e-4 requires that each fund adopt a program that is reasonably designed to assess and manage the fund’s liquidity risk, which is the risk that the fund could not meet redemption requests without significant dilution of remaining investors’ interests in the fund.
Assessment and management of a fund’s liquidity risk under the Program take into consideration certain factors, such as the fund’s investment strategy and the liquidity of its portfolio investments during normal and reasonably foreseeable stressed conditions, its short- and long-term cash-flow projections during both normal and reasonably foreseeable stressed conditions, and its cash and cash-equivalent holdings and access to other funding sources. As required by the rule, the Program includes policies and procedures for classification of fund portfolio holdings in four liquidity categories, maintaining certain levels of highly liquid investments, and limiting holdings of illiquid investments.
The board of trustees of Vanguard World Fund approved the appointment of liquidity risk management program administrators responsible for administering Vanguard FTSE Social Index Fund’s Program and for carrying out the specific responsibilities set forth in the Program, including reporting to the board on at least an annual basis regarding the Program’s operation, its adequacy, and the effectiveness of its implementation for the past year (the “Program Administrator Report”). The board has reviewed the Program Administrator Report covering the period from December 1, 2018, through December 31, 2019 (the “Review Period”). The Program Administrator Report stated that during the Review Period the Program operated and was implemented effectively to manage the fund’s liquidity risk.
London Stock Exchange Group companies include FTSE International Limited (“FTSE”), Frank Russell Company (“Russell”), MTS Next Limited (“MTS”), and FTSE TMX Global Debt Capital Markets Inc. (“FTSE TMX”). All rights reserved. “FTSE®”, “Russell®”, “MTS®”, “FTSE TMX®” and “FTSE Russell” and other service marks and trademarks related to the FTSE or Russell indexes are trademarks of the London Stock Exchange Group companies and are used by FTSE, MTS, FTSE TMX and Russell under license. All information is provided for information purposes only. Every effort is made to ensure that all information given in this publication is accurate, but no responsibility or liability can be accepted by the London Stock Exchange Group companies nor its licensors for any errors or for any loss from use of this publication. Neither the London Stock Exchange Group companies nor any of their licensors make any claim, prediction, warranty or representation whatsoever, expressly or impliedly, either as to the results to be obtained from the use of the Indices or the fitness or suitability of the Indices for any particular purpose to which they might be put. The London Stock Exchange Group companies do not provide investment advice and nothing in this document should be taken as constituting financial or investment advice. The London Stock Exchange Group companies make no representation regarding the advisability of investing in any asset. A decision to invest in any such asset should not be made in reliance on any information herein. Indexes cannot be invested in directly. Inclusion of an asset in an index is not a recommendation to buy, sell or hold that asset. The general information contained in this publication should not be acted upon without obtaining specific legal, tax, and investment advice from a licensed professional. No part of this information may be reproduced, stored in a retrieval system or transmitted in any form or by any means, electronic, mechanical, photocopying, recording or otherwise, without prior written permission of the London Stock Exchange Group companies. Distribution of the London Stock Exchange Group companies’ index values and the use of their indexes to create financial products require a license with FTSE, FTSE TMX, MTS and/or Russell and/or its licensors.
The People Who Govern Your Fund
The trustees of your mutual fund are there to see that the fund is operated and managed in your best interests since, as a shareholder, you are a part owner of the fund. Your fund’s trustees also serve on the board of directors of The Vanguard Group, Inc., which is owned by the Vanguard funds and provides services to them.
A majority of Vanguard’s board members are independent, meaning that they have no affiliation with Vanguard or the funds they oversee, apart from the sizable personal investments they have made as private individuals. The independent board members have distinguished backgrounds in business, academia, and public service. Each of the trustees and executive officers oversees 212 Vanguard funds.
Information for each trustee and executive officer of the fund appears below. That information, as well as the Vanguard fund count, is as of the date on the cover of this fund report. The mailing address of the trustees and officers is P.O. Box 876, Valley Forge, PA 19482. More information about the trustees is in the Statement of Additional Information, which can be obtained, without charge, by contacting Vanguard at 800-662-7447, or online at vanguard.com.
Interested Trustee1
Mortimer J. Buckley
Born in 1969. Trustee since January 2018. Principal occupation(s) during the past five years and other experience: chairman of the board (2019–present) of Vanguard and of each of the investment companies served by Vanguard; chief executive officer (2018–present) of Vanguard; chief executive officer, president, and trustee (2018–present) of each of the investment companies served by Vanguard; president and director (2017–present) of Vanguard; and president (2018–present) of Vanguard Marketing Corporation. Chief investment officer (2013–2017), managing director (2002–2017), head of the Retail Investor Group (2006–2012), and chief information officer (2001–2006) of Vanguard. Chairman of the board (2011–2017) and trustee (2009–2017) of the Children’s Hospital of Philadelphia; and trustee (2018–present) and vice chair (2019–present) of The Shipley School.
Independent Trustees
Emerson U. Fullwood
Born in 1948. Trustee since January 2008. Principal occupation(s) during the past five years and other experience: executive chief staff and marketing officer for North America and corporate vice president (retired 2008) of Xerox Corporation (document management products and services). Former president of the Worldwide Channels Group, Latin America, and Worldwide Customer Service and executive chief staff officer of Developing Markets of Xerox. Executive in residence and 2009–2010 Distinguished Minett Professor at the Rochester Institute of Technology. Director of SPX FLOW, Inc. (multi-industry manufacturing). Director of the University of Rochester Medical Center, the Monroe Community College Foundation, the United Way of Rochester, North Carolina A&T University, and Roberts Wesleyan College. Trustee of the University of Rochester.
Amy Gutmann
Born in 1949. Trustee since June 2006. Principal occupation(s) during the past five years and other experience: president (2004–present) of the University of Pennsylvania. Christopher H. Browne Distinguished Professor of Political Science, School of Arts and Sciences, and professor of communication, Annenberg School for Communication, with secondary faculty appointments in the Department of Philosophy, School of Arts and Sciences, and at the Graduate School of Education, University of Pennsylvania.
F. Joseph Loughrey
Born in 1949. Trustee since October 2009. Principal occupation(s) during the past five years and other experience: president and chief operating officer (retired 2009) and vice chairman of the board (2008–2009) of Cummins Inc. (industrial machinery). Chairman of the board of Hillenbrand, Inc. (specialized consumer services) and the Lumina Foundation. Director of the V Foundation. Member of the advisory
| 1 | Mr. Buckley is considered an “interested person,” as defined in the Investment Company Act of 1940, because he is an officer of the Vanguard funds. |
council for the College of Arts and Letters and chair of the advisory board to the Kellogg Institute for International Studies, both at the University of Notre Dame.
Mark Loughridge
Born in 1953. Trustee since March 2012. Principal occupation(s) during the past five years and other experience: senior vice president and chief financial officer (retired 2013) of IBM (information technology services). Fiduciary member of IBM’s Retirement Plan Committee (2004–2013), senior vice president and general manager (2002–2004) of IBM Global Financing, vice president and controller (1998–2002) of IBM, and a variety of other prior management roles at IBM. Member of the Council on Chicago Booth.
Scott C. Malpass
Born in 1962. Trustee since March 2012. Principal occupation(s) during the past five years and other experience: chief investment officer (retired June 2020) and vice president (retired June 2020) of the University of Notre Dame. Assistant professor of finance at the Mendoza College of Business, University of Notre Dame, and member of the Notre Dame 403(b) Investment Committee (retired June 2020). Member of the board of Catholic Investment Services, Inc. (investment advisors) and the board of superintendence of the Institute for the Works of Religion.
Deanna Mulligan
Born in 1963. Trustee since January 2018. Principal occupation(s) during the past five years and other experience: chief executive officer (2011–present) of The Guardian Life Insurance Company of America. President (2010–2019), chief operating officer (2010–2011), and executive vice president (2008–2010) of Individual Life and Disability of The Guardian Life Insurance Company of America. Member of the board of The Guardian Life Insurance Company of America, the American Council of Life Insurers, and the Economic Club of New York. Trustee of the Partnership for New York City (business leadership), Chief Executives for Corporate Purpose, NewYork-Presbyterian Hospital, Catalyst, and the Bruce Museum (arts and science). Member of the Advisory Council for the Stanford Graduate School of Business.
André F. Perold
Born in 1952. Trustee since December 2004. Principal occupation(s) during the past five years and other experience: George Gund Professor of Finance and Banking, Emeritus at the Harvard Business School (retired 2011). Chief investment officer and co-managing partner of HighVista Strategies (private investment firm). Member of the board of advisors and member of the investment committee of the Museum of Fine Arts Boston. Member of the board (2018–present) of RIT Capital Partners (investment firm). Member of the investment committee of Partners Health Care System.
Sarah Bloom Raskin
Born in 1961. Trustee since January 2018. Principal occupation(s) during the past five years and other experience: deputy secretary (2014–2017) of the United States Department of the Treasury. Governor (2010–2014) of the Federal Reserve Board. Commissioner (2007–2010) of financial regulation for the State of Maryland. Member of the board of directors (2012–2014) of Neighborhood Reinvestment Corporation. Director (2017–present) of i(x) Investments, LLC; director (2017–present) of Reserve Trust. Rubenstein Fellow (2017–present) of Duke University; trustee (2017–present) of Amherst College, and trustee (2019–present) of the Folger Shakespeare Library.
Peter F. Volanakis
Born in 1955. Trustee since July 2009. Principal occupation(s) during the past five years and other experience: president and chief operating officer (retired 2010) of Corning Incorporated (communications equipment) and director of Corning Incorporated (2000–2010) and Dow Corning (2001–2010). Director (2012) of SPX Corporation (multi-industry manufacturing). Overseer of the Amos Tuck School of Business Administration, Dartmouth College (2001–2013). Chairman of the board of trustees of Colby-Sawyer College. Member of the board of Hypertherm Inc. (industrial cutting systems, software, and consumables).
Executive Officers
John Bendl
Born in 1970. Principal occupation(s) during the past five years and other experience: principal of Vanguard. Chief financial officer (2019–present) of each of the investment companies served by Vanguard. Chief accounting officer, treasurer, and controller of Vanguard (2017–present). Partner (2003–2016) at KPMG (audit, tax, and advisory services).
Glenn Booraem
Born in 1967. Principal occupation(s) during the past five years and other experience: principal of Vanguard. Investment stewardship officer (2017–present), treasurer (2015–2017), controller (2010–2015), and assistant controller (2001–2010) of each of the investment companies served by Vanguard.
Christine M. Buchanan
Born in 1970. Principal occupation(s) during the past five years and other experience: principal of Vanguard. Treasurer (2017–present) of each of the investment companies served by Vanguard. Partner (2005–2017) at KPMG (audit, tax, and advisory services).
David Cermak
Born in 1960. Principal occupation(s) during the past five years and other experience: principal of Vanguard. Finance director (2019–present) of each of the investment companies served by Vanguard. Managing director and head (2017–present) of Vanguard Investments Singapore. Managing director and head (2017–2019) of Vanguard Investments Hong Kong. Representative director and head (2014–2017) of Vanguard Investments Japan.
Thomas J. Higgins
Born in 1957. Principal occupation(s) during the past five years and other experience: principal of Vanguard. Finance director (2019–present), chief financial officer (2008–2019), and treasurer (1998–2008) of each of the investment companies served by Vanguard.
Peter Mahoney
Born in 1974. Principal occupation(s) during the past five years and other experience: principal of Vanguard. Controller (2015–present) of each of the investment companies served by Vanguard. Head of International Fund Services (2008–2014) at Vanguard.
Anne E. Robinson
Born in 1970. Principal occupation(s) during the past five years and other experience: general counsel (2016–present) of Vanguard. Secretary (2016–present) of Vanguard and of each of the investment companies served by Vanguard. Managing director (2016–present) of Vanguard. Managing director and general counsel of Global Cards and Consumer Services (2014–2016) at Citigroup. Counsel (2003–2014) at American Express.
Michael Rollings
Born in 1963. Principal occupation(s) during the past five years and other experience: finance director (2017–present) and treasurer (2017) of each of the investment companies served by Vanguard. Managing director (2016–present) of Vanguard. Chief financial officer (2016–present) of Vanguard. Director (2016–present) of Vanguard Marketing Corporation. Executive vice president and chief financial officer (2006–2016) of MassMutual Financial Group.
John E. Schadl
Born in 1972. Principal occupation(s) during the past five years and other experience: principal of Vanguard. Chief compliance officer (2019–present) of Vanguard and of each of the investment companies served by Vanguard. Assistant vice president (2019–present) of Vanguard Marketing Corporation.
Vanguard Senior Management Team
| Joseph Brennan | Chris D. McIsaac |
| Mortimer J. Buckley | James M. Norris |
| Gregory Davis | Thomas M. Rampulla |
| John James | Karin A. Risi |
| Martha G. King | Anne E. Robinson |
| John T. Marcante | Michael Rollings |

Connect with Vanguard® > vanguard.com
Fund Information > 800-662-7447
Direct Investor Account Services > 800-662-2739
Institutional Investor Services > 800-523-1036
Text Telephone for People
Who Are Deaf or Hard of Hearing > 800-749-7273
This material may be used in conjunction with the offering of shares of any Vanguard fund only if preceded or accompanied by the fund’s current prospectus.
All comparative mutual fund data are from Morningstar, Inc., unless otherwise noted.
You can obtain a free copy of Vanguard’s proxy voting guidelines by visiting vanguard.com/proxyreporting or by calling Vanguard at 800-662-2739. The guidelines are also available from the SEC’s website, www.sec.gov. In addition, you may obtain a free report on how your fund voted the proxies for securities it owned during the 12 months ended June 30. To get the report, visit either vanguard.com/proxyreporting or www.sec.gov.
You can review information about your fund on the SEC’s website, and you can receive copies of this information, for a fee, by sending a request via email addressed to publicinfo@sec.gov.
| | © 2020 The Vanguard Group, Inc. |
| | All rights reserved. |
| | Vanguard Marketing Corporation, Distributor. |
| | |
| | Q2130 102020 |

Annual Report | August 31, 2020 Vanguard U.S. Sector Index Funds |
Vanguard Communication Services Index Fund Vanguard Consumer Discretionary Index Fund Vanguard Consumer Staples Index Fund Vanguard Energy Index Fund Vanguard Financials Index Fund Vanguard Health Care Index Fund Vanguard Industrials Index Fund Vanguard Information Technology Index Fund Vanguard Materials Index Fund Vanguard Utilities Index Fund See the inside front cover for important information about access to your fund’s annual and semiannual shareholder reports. |
Important information about access to shareholder reports
Beginning on January 1, 2021, as permitted by regulations adopted by the Securities and Exchange Commission, paper copies of your fund’s annual and semiannual shareholder reports will no longer be sent to you by mail, unless you specifically request them. Instead, you will be notified by mail each time a report is posted on the website and will be provided with a link to access the report.
If you have already elected to receive shareholder reports electronically, you will not be affected by this change and do not need to take any action. You may elect to receive shareholder reports and other communications from the fund electronically by contacting your financial intermediary (such as a broker-dealer or bank) or, if you invest directly with the fund, by calling Vanguard at one of the phone numbers on the back cover of this report or by logging on to vanguard.com.
You may elect to receive paper copies of all future shareholder reports free of charge. If you invest through a financial intermediary, you can contact the intermediary to request that you continue to receive paper copies. If you invest directly with the fund, you can call Vanguard at one of the phone numbers on the back cover of this report or log on to vanguard.com. Your election to receive paper copies will apply to all the funds you hold through an intermediary or directly with Vanguard.
| Contents | |
| | |
| Your Fund’s Performance at a Glance | 1 |
| About Your Fund’s Expenses | 2 |
| Communication Services Index Fund | 4 |
| Consumer Discretionary Index Fund | 16 |
| Consumer Staples Index Fund | 29 |
| Energy Index Fund | 41 |
| Financials Index Fund | 54 |
| Health Care Index Fund | 68 |
| Industrials Index Fund | 83 |
| Information Technology Index Fund | 96 |
| Materials Index Fund | 109 |
| Utilities Index Fund | 121 |
| Trustees Approve Advisory Arrangements | 135 |
| Liquidity Risk Management | 136 |

Please note: The opinions expressed in this report are just that—informed opinions. They should not be considered promises or advice. Also, please keep in mind that the information and opinions cover the period through the date on the front of this report. Of course, the risks of investing in your fund are spelled out in the prospectus.
Your Fund’s Performance at a Glance
· For the 12 months ended August 31, 2020, returns for the Vanguard U.S. Sector Index Funds ranged from about –34% to more than 55%. All ten funds closely tracked their target indexes.
· A number of stock market indexes around the world climbed to record highs in February. Then they plummeted as the spread of the coronavirus outside of China led to lockdowns, the shuttering of nonessential businesses, and travel restrictions in many countries. However, the unprecedented scale of the response from policymakers, progress on vaccines and treatments, and the easing of some pandemic-related restrictions helped lift investor sentiment.
· Seven of the funds had positive returns, led by Vanguard Information Technology Index, Consumer Discretionary Index, Communication Services Index, and Health Care Index Funds. Three funds lost ground, most notably Vanguard Energy Index Fund.
| Market Barometer | |
| | Average Annual Total Returns |
| | Periods Ended August 31, 2020 |
| | One Year | Three Years | Five Years |
| Stocks | | | |
| Russell 1000 Index (Large-caps) | 22.50% | 14.58% | 14.31% |
| Russell 2000 Index (Small-caps) | 6.02 | 5.03 | 7.65 |
| Russell 3000 Index (Broad U.S. market) | 21.44 | 13.95 | 13.86 |
| FTSE All-World ex US Index (International) | 8.78 | 2.92 | 6.00 |
| | | | |
| Bonds | | | |
| Bloomberg Barclays U.S. Aggregate Bond Index (Broad taxable market) | 6.47% | 5.09% | 4.33% |
| Bloomberg Barclays Municipal Bond Index (Broad tax-exempt market) | 3.24 | 4.09 | 3.99 |
| FTSE Three-Month U.S. Treasury Bill Index | 1.18 | 1.67 | 1.15 |
| | | | |
| CPI | | | |
| Consumer Price Index | 1.31% | 1.92% | 1.75% |
About Your Fund’s Expenses
As a shareholder of the fund, you incur ongoing costs, which include costs for portfolio management, administrative services, and shareholder reports (like this one), among others. Operating expenses, which are deducted from a fund’s gross income, directly reduce the investment return of the fund.
A fund’s expenses are expressed as a percentage of its average net assets. This figure is known as the expense ratio. The following examples are intended to help you understand the ongoing costs (in dollars) of investing in your fund and to compare these costs with those of other mutual funds. The examples are based on an investment of $1,000 made at the beginning of the period shown and held for the entire period.
The accompanying table illustrates your fund’s costs in two ways:
· Based on actual fund return. This section helps you to estimate the actual expenses that you paid over the period. The “Ending Account Value” shown is derived from the fund’s actual return, and the third column shows the dollar amount that would have been paid by an investor who started with $1,000 in the fund. You may use the information here, together with the amount you invested, to estimate the expenses that you paid over the period.
To do so, simply divide your account value by $1,000 (for example, an $8,600 account value divided by $1,000 = 8.6), then multiply the result by the number given for your fund under the heading “Expenses Paid During Period.”
· Based on hypothetical 5% yearly return. This section is intended to help you compare your fund’s costs with those of other mutual funds. It assumes that the fund had a yearly return of 5% before expenses, but that the expense ratio is unchanged. In this case—because the return used is not the fund’s actual return—the results do not apply to your investment. The example is useful in making comparisons because the Securities and Exchange Commission requires all mutual funds to calculate expenses based on a 5% return. You can assess your fund’s costs by comparing this hypothetical example with the hypothetical examples that appear in shareholder reports of other funds.
Note that the expenses shown in the table are meant to highlight and help you compare ongoing costs only and do not reflect transaction costs incurred by the fund for buying and selling securities. Further, the expenses do not include any purchase, redemption, or account service fees described in the fund prospectus. If such fees were applied to your account, your costs would be higher. Your fund does not carry a “sales load.”
The calculations assume no shares were bought or sold during the period. Your actual costs may have been higher or lower, depending on the amount of your investment and the timing of any purchases or redemptions.
You can find more information about the fund’s expenses, including annual expense ratios, in the Financial Statements section of this report. For additional information on operating expenses and other shareholder costs, please refer to your fund’s current prospectus.
| Six Months Ended August 31, 2020 | | | | |
| | | Beginning | Ending | Expenses |
| | | Account Value | Account Value | Paid During |
| Index Fund | Share Class | 2/29/2020 | 8/31/2020 | Period |
| Based on Actual Fund Return | | | | |
| Communication Services | ETF | $1,000.00 | $1,216.87 | $0.56 |
| | Admiral™ | 1,000.00 | 1,216.94 | 0.56 |
| Consumer Discretionary | ETF | $1,000.00 | $1,402.07 | $0.60 |
| | Admiral | 1,000.00 | 1,402.31 | 0.60 |
| Consumer Staples | ETF | $1,000.00 | $1,150.09 | $0.54 |
| | Admiral | 1,000.00 | 1,150.25 | 0.54 |
| Energy | ETF | $1,000.00 | $804.13 | $0.45 |
| | Admiral | 1,000.00 | 804.86 | 0.45 |
| Financials | ETF | $1,000.00 | $937.28 | $0.49 |
| | Admiral | 1,000.00 | 937.45 | 0.49 |
| Health Care | ETF | $1,000.00 | $1,192.22 | $0.55 |
| | Admiral | 1,000.00 | 1,192.36 | 0.55 |
| Industrials | ETF | $1,000.00 | $1,067.75 | $0.52 |
| | Admiral | 1,000.00 | 1,067.95 | 0.52 |
| Information Technology | ETF | $1,000.00 | $1,403.40 | $0.60 |
| | Admiral | 1,000.00 | 1,403.84 | 0.60 |
| Materials | ETF | $1,000.00 | $1,193.71 | $0.55 |
| | Admiral | 1,000.00 | 1,193.87 | 0.55 |
| Utilities | ETF | $1,000.00 | $964.15 | $0.49 |
| | Admiral | 1,000.00 | 964.22 | 0.49 |
| Based on Hypothetical 5% Yearly Return | | | | |
| Communication Services | ETF | $1,000.00 | $1,024.63 | $0.51 |
| | Admiral | 1,000.00 | 1,024.63 | 0.51 |
| Consumer Discretionary | ETF | $1,000.00 | $1,024.63 | $0.51 |
| | Admiral | 1,000.00 | 1,024.63 | 0.51 |
| Consumer Staples | ETF | $1,000.00 | $1,024.63 | $0.51 |
| | Admiral | 1,000.00 | 1,024.63 | 0.51 |
| Energy | ETF | $1,000.00 | $1,024.63 | $0.51 |
| | Admiral | 1,000.00 | 1,024.63 | 0.51 |
| Financials | ETF | $1,000.00 | $1,024.63 | $0.51 |
| | Admiral | 1,000.00 | 1,024.63 | 0.51 |
| Health Care | ETF | $1,000.00 | $1,024.63 | $0.51 |
| | Admiral | 1,000.00 | 1,024.63 | 0.51 |
| Industrials | ETF | $1,000.00 | $1,024.63 | $0.51 |
| | Admiral | 1,000.00 | 1,024.63 | 0.51 |
| Information Technology | ETF | $1,000.00 | $1,024.63 | $0.51 |
| | Admiral | 1,000.00 | 1,024.63 | 0.51 |
| Materials | ETF | $1,000.00 | $1,024.63 | $0.51 |
| | Admiral | 1,000.00 | 1,024.63 | 0.51 |
| Utilities | ETF | $1,000.00 | $1,024.63 | $0.51 |
| | Admiral | 1,000.00 | 1,024.63 | 0.51 |
The calculations are based on expenses incurred in the most recent six-month period. The funds’ annualized six-month expense ratios for that period are 0.10% for the Communication Services Index Fund ETF Shares and 0.10% for the Admiral Shares; 0.10% for the Consumer Discretionary Index Fund ETF Shares and 0.10% for the Admiral Shares; 0.10% for the Consumer Staples Index Fund ETF Shares and 0.10% for the Admiral Shares; 0.10% for the Energy Index Fund ETF Shares and 0.10% for the Admiral Shares; 0.10% for the Financials Index Fund ETF Shares and 0.10% for the Admiral Shares; 0.10% for the Health Care Index Fund ETF Shares and 0.10% for the Admiral Shares; 0.10% for the Industrials Index Fund ETF Shares and 0.10% for the Admiral Shares; 0.10% for the Information Technology Index Fund ETF Shares and 0.10% for the Admiral Shares; 0.10% for the Materials Index Fund ETF Shares and 0.10% for the Admiral Shares; 0.10% for the Utilities Index Fund ETF Shares and 0.10% for the Admiral Shares. The dollar amounts shown as “Expenses Paid” are equal to the annualized expense ratio multiplied by the average account value over the period, multiplied by the number of days in the most recent six-month period, then divided by the number of days in the most recent 12-month period (184/366).
Communication Services Index Fund
Performance Summary
All of the returns in this report represent past performance, which is not a guarantee of future results that may be achieved by the fund. (Current performance may be lower or higher than the performance data cited. For performance data current to the most recent month-end, visit our website at vanguard.com/performance.) Note, too, that both investment returns and principal value can fluctuate widely, so an investor’s shares, when sold, could be worth more or less than their original cost. The returns shown do not reflect taxes that a shareholder would pay on fund distributions or on the sale of fund shares.
Cumulative Performance: August 31, 2010–August 31, 2020
Initial Investment of $10,000
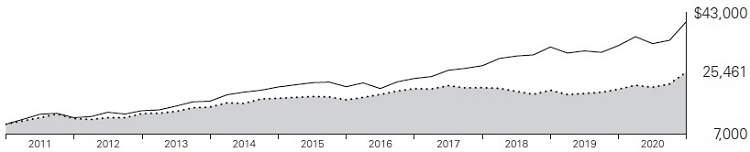
| | | | Average Annual Total Returns | Final Value |
| | | | Periods Ended August 31, 2020 | of a $10,000 |
| | | One Year | Five Years | Ten Years | Investment |
 | Communication Services Index Fund ETF Shares Net Asset Value | 25.15% | 8.21% | 9.80% | $25,461 |
| Communication Services Index Fund ETF Shares Market Price | 25.28 | 8.23 | 9.81 | 25,493 |
 | Communication Services Spliced Index | 25.23 | 8.14 | 9.80 | 25,463 |
 | MSCI US IMI/2500 | 21.48 | 13.88 | 14.99 | 40,426 |
Communication Services Spliced Index: MSCI US IMI/Telecommunication Services 25/50 through May 2, 2018; MSCI US IMI/ Communication Services 25/50 Transition Index through December 2, 2018; MSCI US IMI/Communication Services 25/50 thereafter.
| | | | | | Final Value |
| | | | | | of a $100,000 |
| | | One Year | Five Years | Ten Years | Investment |
| Communication Services Index Fund Admiral Shares | 25.16% | 8.21% | 9.81% | $254,956 |
| Communication Services Spliced Index | 25.23 | 8.14 | 9.80 | 254,628 |
| MSCI US IMI/2500 | 21.48 | 13.88 | 14.99 | 404,265 |
Cumulative Returns: ETF Shares, August 31, 2010–August 31, 2020
| | | | One Year | Five Years | Ten Years |
| Communication Services Index Fund ETF Shares Market Price | 25.28% | 48.50% | 154.93% |
| Communication Services Index Fund ETF Shares Net Asset Value | 25.15 | 48.35 | 154.61 |
| Communication Services Spliced Index | | 25.23 | 47.89 | 154.63 |
For the ETF Shares, the market price is determined by the midpoint of the bid-offer spread as of the closing time of the New York Stock Exchange (generally 4 p.m., Eastern time). The net asset value is also determined as of the NYSE closing time. For more information about how the ETF Shares’ market prices have compared with their net asset value, visit vanguard.com, select your ETF, and then select the Price and Performance tab. The ETF premium/discount analysis there shows the percentages of days on which the ETF Shares’ market price was above or below the NAV.
See Financial Highlights for dividend and capital gains information.
Communication Services Index Fund
Fund Allocation
As of August 31, 2020
| Advertising | 1.4% |
| Alternative Carriers | 3.6 |
| Broadcasting | 3.6 |
| Cable & Satellite | 11.4 |
| Integrated Telecommunication Services | 9.7 |
| Interactive Home Entertainment | 5.4 |
| Interactive Media & Services | 48.0 |
| Movies & Entertainment | 12.4 |
| Publishing | 1.5 |
| Wireless Telecommunication Services | 3.0 |
The table reflects the fund’s investments, except for short-term investments and derivatives. Sector categories are based on the Global Industry Classification Standard (“GICS”), except for the “Other” category (if applicable), which includes securities that have not been provided a GICS classification as of the effective reporting period.
The fund may invest in derivatives (such as futures and swap contracts) for various reasons, including, but not limited to, attempting to remain fully invested and tracking its target index as closely as possible.
The Global Industry Classification Standard (“GICS”) was developed by and is the exclusive property and a service mark of MSCI Inc. (“MSCI”) and Standard and Poor’s, a division of McGraw-Hill Companies, Inc. (“S&P”), and is licensed for use by Vanguard. Neither MSCI, S&P nor any third party involved in making or compiling the GICS or any GICS classification makes any express or implied warranties or representations with respect to such standard or classification (or the results to be obtained by the use thereof), and all such parties hereby expressly disclaim all warranties of originality, accuracy, completeness, merchantability or fitness for a particular purpose with respect to any such standard or classification. Without limiting any of the foregoing, in no event shall MSCI, S&P, any of its affiliates or any third party involved in making or compiling the GICS or any GICS classification have any liability for any direct, indirect, special, punitive, consequential or any other damages (including lost profits) even if notified of the possibility of such damages.
Communication Services Index Fund
Financial Statements
Schedule of Investments
As of August 31, 2020
The fund files its complete schedule of portfolio holdings with the Securities and Exchange Commission (SEC) for the first and third quarters of each fiscal year as an exhibit to its reports on Form N-PORT. The fund’s Form N-PORT reports are available on the SEC’s website at www.sec.gov.
| | | | Market |
| | | | Value· |
| | | Shares | ($000) |
| Common Stocks (99.9%) | | |
| Diversified Telecommunication Services (13.3%) |
| | Alternative Carriers (3.6%) | | |
| | CenturyLink Inc. | 1,688,650 | 18,153 |
| * | Liberty Global plc Class C | 670,143 | 15,420 |
| * | GCI Liberty Inc. Class A | 187,443 | 15,142 |
| * | Iridium Communications Inc. | 401,197 | 11,237 |
| * | Liberty Global plc Class A | 450,525 | 10,529 |
| | Cogent Communications Holdings Inc. | 142,576 | 9,590 |
| * | Bandwidth Inc. Class A | 59,800 | 9,417 |
| * | Vonage Holdings Corp. | 780,847 | 8,941 |
| * | Liberty Latin America Ltd. Class C | 391,651 | 3,736 |
| * | Anterix Inc. | 37,682 | 1,648 |
| * | Liberty Latin America Ltd. Class A | 133,254 | 1,306 |
| * | ORBCOMM Inc. | 255,254 | 1,024 |
| | | | |
| | Integrated Telecommunication Services (9.7%) |
| | Verizon Communications Inc. | 2,617,730 | 155,153 |
| | AT&T Inc. | 4,313,137 | 128,575 |
| * | Cincinnati Bell Inc. | 153,937 | 2,318 |
| | ATN International Inc. | 37,872 | 2,196 |
| * | Consolidated Communications Holdings Inc. | 242,649 | 1,888 |
| | | | 396,273 |
| Entertainment (17.7%) | | |
| | Interactive Home Entertainment (5.3%) |
| | Activision Blizzard Inc. | 772,458 | 64,516 |
| * | Electronic Arts Inc. | 328,494 | 45,815 |
| * | Take-Two Interactive Software Inc. | 166,822 | 28,558 |
| * | Zynga Inc. Class A | 1,825,325 | 16,537 |
| * | Glu Mobile Inc. | 477,799 | 3,794 |
| | | | |
| | Movies & Entertainment (12.4%) | |
| * | Netflix Inc. | 264,628 | 140,136 |
| | Walt Disney Co. | 1,003,558 | 132,339 |
| * | Roku Inc. | 136,779 | 23,728 |
| * | Live Nation Entertainment Inc. | 284,699 | 16,171 |
| * | Liberty Media Corp-Liberty Formula One Class C | 382,720 | 14,918 |
| * | Madison Square Garden Sport Corp. Class A | 52,631 | 8,631 |
| | World Wrestling Entertainment Inc. Class A | 156,341 | 6,890 |
| | Cinemark Holdings Inc. | 376,837 | 5,521 |
| * | Madison Square Garden Entertainment Corp. Class A | 52,332 | 3,934 |
| * | Liberty Media Corp-Liberty Formula One Class A | 79,914 | 2,891 |
| * | Lions Gate Entertainment Corp. Class B | 304,621 | 2,760 |
| * | Lions Gate Entertainment Corp. Class A | 278,736 | 2,715 |
| * | IMAX Corp. | 171,849 | 2,641 |
| * | Liberty Media Corp-Liberty Braves Class C | 117,755 | 2,288 |
| | Marcus Corp. | 69,337 | 1,087 |
| ^ | AMC Entertainment Holdings Inc. Class A | 175,799 | 1,034 |
| * | Liberty Media Corp- Liberty Braves Class A | 25,717 | 504 |
| * | Reading International Inc. Class A | 48,226 | 198 |
| | Warner Music Group Corp. Class A | 1,471 | 44 |
| | | | 527,650 |
| Interactive Media & Services (47.9%) | |
| * | Facebook Inc. Class A | 1,852,722 | 543,218 |
| * | Alphabet Inc. Class C | 209,865 | 342,957 |
| * | Alphabet Inc. Class A | 204,800 | 333,728 |
| * | Match Group Inc. | 325,251 | 36,324 |
| * | Twitter Inc. | 885,542 | 35,935 |
| * | Zillow Group Inc. Class C | 300,920 | 25,807 |
| * | Snap Inc. | 1,121,386 | 25,332 |
| * | Pinterest Inc. Class A | 666,012 | 24,503 |
| * | Zillow Group Inc. Class A | 161,759 | 13,795 |
| * | IAC/InterActiveCorp | 95,701 | 12,727 |
| | TripAdvisor Inc. | 333,481 | 7,794 |
| * | Cargurus Inc. | 279,700 | 6,819 |
| * | Yelp Inc. Class A | 242,429 | 5,605 |
| * | ANGI Homeservices Inc. Class A | 239,519 | 3,323 |
| * | QuinStreet Inc. | 156,966 | 2,064 |
| * | Cars.com Inc. | 224,555 | 1,949 |
| * | Eventbrite Inc. Class A | 164,393 | 1,767 |
| * | TrueCar Inc. | 324,316 | 1,534 |
| * | Meet Group Inc. | 227,933 | 1,436 |
| * | EverQuote Inc. Class A | 23,766 | 844 |
| * | Liberty TripAdvisor Holdings Inc. Class A | 240,200 | 673 |
| | | | 1,428,134 |
| Media (18.0%) | | |
| | Advertising (1.5%) | | |
| | Omnicom Group Inc. | 311,420 | 16,845 |
| | Interpublic Group of Cos. Inc. | 745,282 | 13,236 |
| *,^ | Cardlytics Inc. | 78,277 | 5,937 |
| * | TechTarget Inc. | 80,358 | 3,188 |
| * | Clear Channel Outdoor Holdings Inc. | 1,178,333 | 1,379 |
| * | Boston Omaha Corp. Class A | 51,029 | 832 |
| | National CineMedia Inc. | 219,935 | 794 |
| * | comScore Inc. | 198,757 | 523 |
| | Emerald Holding Inc. | 82,217 | 227 |
| | | | |
| | Broadcasting (3.6%) | | |
| | ViacomCBS Inc. Class B | 815,636 | 22,715 |
| | Fox Corp. Class A | 535,109 | 14,908 |
| * | Discovery Communications Inc. Class C | 670,740 | 13,395 |
| | Nexstar Media Group Inc. Class A | 125,406 | 12,040 |
| | Fox Corp. Class B | 391,732 | 10,890 |
| * | Discovery Inc. Class A | 419,525 | 9,257 |
| | TEGNA Inc. | 697,407 | 8,732 |
| * | Gray Television Inc. | 301,452 | 4,678 |
| | Sinclair Broadcast Group Inc. Class A | 171,575 | 3,570 |
| * | AMC Networks Inc. Class A | 132,423 | 3,217 |
| | EW Scripps Co. Class A | 163,002 | 1,813 |
| * | iHeartMedia Inc. Class A | 196,458 | 1,811 |
| | Entercom Communications Corp. Class A | 403,723 | 606 |
| * | Hemisphere Media Group Inc. | 56,487 | 503 |
| | Entravision Communications Corp. Class A | 202,015 | 307 |
| | | | |
| | Cable & Satellite (11.4%) | | |
| | Comcast Corp. Class A | 2,959,808 | 132,629 |
| * | Charter Communications Inc. Class A | 143,124 | 88,109 |
| * | Liberty Broadband Corp. | 132,914 | 18,620 |
| | Cable One Inc. | 9,298 | 17,111 |
| * | DISH Network Corp. Class A | 454,774 | 16,154 |
| * | Liberty Broadband Corp. Class A | 111,196 | 15,366 |
| * | Altice USA Inc. Class A | 554,609 | 15,296 |
| * | Liberty Media Corp-Liberty SiriusXM Class C | 352,974 | 12,705 |
| | Sirius XM Holdings Inc. | 1,766,100 | 10,367 |
| * | Liberty Media Corp-Liberty SiriusXM Class A | 269,153 | 9,773 |
| * | MSG Networks Inc. | 133,369 | 1,299 |
| * | WideOpenWest Inc. | 168,715 | 970 |
| | Loral Space & Communications Inc. | 40,407 | 953 |
| | | | |
| | Publishing (1.5%) | | |
| | News Corp. Class A | 933,263 | 14,111 |
| | New York Times Co. Class A | 301,577 | 13,067 |
| | News Corp. Class B | 437,299 | 6,590 |
| | John Wiley & Sons Inc. Class A | 150,699 | 4,770 |
| | Scholastic Corp. | 99,680 | 2,243 |
| | Meredith Corp. | 135,201 | 1,893 |
Communication Services Index Fund
| | | | Market |
| | | | Value· |
| | | Shares | ($000) |
| | Gannett Co. Inc. | 416,931 | 721 |
| | Tribune Publishing Co. | 41,539 | 471 |
| | | | 534,621 |
| Wireless Telecommunication Services (3.0%) |
| * | T-Mobile US Inc. | 590,093 | 68,852 |
| | Shenandoah T elecommunications Co. | 160,039 | 8,850 |
| | Telephone and Data Systems Inc. | 327,300 | 7,571 |
| * | Boingo Wireless Inc. | 141,640 | 1,840 |
| * | United States Cellular Corp. | 44,588 | 1,622 |
| *,^ | Gogo Inc. | 187,420 | 963 |
| | | | 89,698 |
Total Common Stocks
(Cost $2,537,777) | | 2,976,376 |
| Temporary Cash Investment (0.3%) | |
| Money Market Fund (0.3%) | | |
| 1,2 | Vanguard Market Liquidity Fund, 0.147% (Cost $9,462) | 94,641 | 9,464 |
Total Investments (100.2%)
(Cost $2,547,239) | | 2,985,840 |
| Other Assets and Liabilities—Net (-0.2%) | | (4,964) |
| Net Assets (100%) | | 2,980,876 |
Cost is in $000.
| · | See Note A in Notes to Financial Statements. |
| * | Non-income-producing security. |
| ^ | Includes partial security positions on loan to broker-dealers. |
| | The total value of securities on loan is $5,484,000. |
| 1 | Collateral of $5,878,000 was received for securities on loan. |
| 2 | Affiliated money market fund available only to Vanguard funds and certain trusts and accounts managed by Vanguard. Rate shown is the 7-day yield. |
| Derivative Financial Instruments Outstanding as of Period End | | |
| | | |
| Over-the-Counter Total Return Swaps | | | | | |
| | | | | Floating | | |
| | | | | Interest Rate | Value and | Value and |
| | | | Notional | Received | Unrealized | Unrealized |
| | Termination | | Amount | (Paid)1 | Appreciation | (Depreciation) |
| Reference Entity | Date | Counterparty | ($000) | (%) | ($000) | ($000) |
| Sirius XM Holdings Inc. | 2/2/21 | GSI | 3,897 | (0.161) | — | (73) |
| 1 | Based on 1-month USD London Interbank Offered Rate (LIBOR) as of the most recent payment date. Floating interest payment received/paid monthly. |
GSI—Goldman Sachs International.
See accompanying Notes, which are an integral part of the Financial Statements.
Communication Services Index Fund
Statement of Assets and Liabilities
As of August 31, 2020
| ($000s, except shares and per-share amounts) | Amount |
| Assets | |
| Investments in Securities, at Value | |
| Unaffiliated Issuers (Cost $2,537,777) | 2,976,376 |
| Affiliated Issuers (Cost $9,462) | 9,464 |
| Total Investments in Securities | 2,985,840 |
| Investment in Vanguard | 115 |
| Receivables for Investment Securities Sold | 30,840 |
| Receivables for Accrued Income | 797 |
| Receivables for Capital Shares Issued | 826 |
| Total Assets | 3,018,418 |
| Liabilities | |
| Payables for Investment Securities Purchased | 30,735 |
| Collateral for Securities on Loan | 5,878 |
| Payables for Capital Shares Redeemed | 714 |
| Payables to Vanguard | 142 |
| Unrealized Depreciation—Over-the-Counter Swap Contracts | 73 |
| Total Liabilities | 37,542 |
| Net Assets | 2,980,876 |
| | |
| | |
| At August 31, 2020, net assets consisted of: | |
| | |
| Paid-in Capital | 2,910,458 |
| Total Distributable Earnings (Loss) | 70,418 |
| Net Assets | 2,980,876 |
| | |
| ETF Shares—Net Assets | |
| Applicable to 26,966,985 outstanding $.001 par value shares of beneficial interest (unlimited authorization) | 2,913,643 |
| Net Asset Value Per Share—ETF Shares | $108.04 |
| | |
| Admiral Shares—Net Assets | |
| Applicable to 1,221,048 outstanding $.001 par value shares of beneficial interest (unlimited authorization) | 67,233 |
| Net Asset Value Per Share—Admiral Shares | $55.06 |
See accompanying Notes, which are an integral part of the Financial Statements.
Communication Services Index Fund
Statement of Operations
| | Year Ended |
| | August 31, 2020 |
| | ($000) |
| Investment Income | |
| Income | |
| Dividends | 25,836 |
| Interest1 | 41 |
| Securities Lending—Net | 951 |
| Total Income | 26,828 |
| Expenses | |
| The Vanguard Group—Note B | |
| Investment Advisory Services | 337 |
| Management and Administrative—ETF Shares | 1,489 |
| Management and Administrative—Admiral Shares | 39 |
| Marketing and Distribution—ETF Shares | 133 |
| Marketing and Distribution—Admiral Shares | 4 |
| Custodian Fees | 12 |
| Auditing Fees | 32 |
| Shareholders’ Reports—ETF Shares | 199 |
| Shareholders’ Reports—Admiral Shares | 1 |
| Trustees’ Fees and Expenses | 1 |
| Total Expenses | 2,247 |
| Net Investment Income | 24,581 |
| Realized Net Gain (Loss) | |
| Investment Securities Sold1,2 | 108,910 |
| Futures Contracts | (36) |
| Swap Contracts | (3) |
| Realized Net Gain (Loss) | 108,871 |
| Change in Unrealized Appreciation (Depreciation) | |
| Investment Securities1 | 434,938 |
| Swap Contracts | (208) |
| Change in Unrealized Appreciation (Depreciation) | 434,730 |
| Net Increase (Decrease) in Net Assets Resulting from Operations | 568,182 |
| 1 | Interest income, realized net gain (loss), and change in unrealized appreciation (depreciation) from an affiliated company of the fund were $41,000, $6,000, and $1,000, respectively. Purchases and sales are for temporary cash investment purposes. |
| 2 | Includes $133,403,000 of net gain (loss) resulting from in-kind redemptions. |
Statement of Changes in Net Assets
| | Year Ended August 31, |
| | 2020 | 2019 |
| | ($000) | ($000) |
| Increase (Decrease) in Net Assets | | |
| Operations | | |
| Net Investment Income | 24,581 | 18,049 |
| Realized Net Gain (Loss) | 108,871 | 21,279 |
| Change in Unrealized Appreciation (Depreciation) | 434,730 | (5,789) |
| Net Increase (Decrease) in Net Assets Resulting from Operations | 568,182 | 33,539 |
| Distributions1 | | |
| ETF Shares | (22,506) | (14,813) |
| Admiral Shares | (540) | (463) |
| Total Distributions | (23,046) | (15,276) |
| Capital Share Transactions | | |
| ETF Shares | 364,805 | 983,508 |
| Admiral Shares | 4,709 | 3,352 |
| Net Increase (Decrease) from Capital Share Transactions | 369,514 | 986,860 |
| Total Increase (Decrease) | 914,650 | 1,005,123 |
| Net Assets | | |
| Beginning of Period | 2,066,226 | 1,061,103 |
| End of Period | 2,980,876 | 2,066,226 |
1 Certain prior-period numbers have been reclassified to conform with current period presentation.
See accompanying Notes, which are an integral part of the Financial Statements.
Communication Services Index Fund
Financial Highlights
ETF Shares
| For a Share Outstanding | Year Ended August 31, |
| Throughout Each Period | 2020 | 2019 | 2018 | 2017 | 2016 |
| Net Asset Value, Beginning of Period | $87.24 | $86.83 | $93.54 | $95.16 | $83.80 |
| Investment Operations | | | | | |
| Net Investment Income | 1.0051 | .9171 | 3.0671 | 3.1081 | 2.622 |
| Net Realized and Unrealized Gain (Loss) on Investments | 20.743 | .316 | (6.297) | (1.587) | 12.811 |
| Total from Investment Operations | 21.748 | 1.233 | (3.230) | 1.521 | 15.433 |
| Distributions | | | | | |
| Dividends from Net Investment Income | (.948) | (.823) | (3.480) | (3.141) | (4.073) |
| Distributions from Realized Capital Gains | — | — | — | — | — |
| Total Distributions | (.948) | (.823) | (3.480) | (3.141) | (4.073) |
| Net Asset Value, End of Period | $108.04 | $87.24 | $86.83 | $93.54 | $95.16 |
| | | | | | |
| Total Return | 25.15% | 1.47% | -3.50% | 1.62% | 19.14% |
| | | | | | |
| Ratios/Supplemental Data | | | | | |
| Net Assets, End of Period (Millions) | $2,914 | $2,016 | $1,015 | $1,388 | $1,483 |
| Ratio of Total Expenses to Average Net Assets | 0.10% | 0.10% | 0.10% | 0.10% | 0.10% |
| Ratio of Net Investment Income to Average Net Assets | 1.09% | 1.09% | 3.48% | 3.26% | 3.10% |
| Portfolio Turnover Rate2 | 15% | 33% | 84% | 18% | 20% |
| 1 | Calculated based on average shares outstanding. |
| 2 | Excludes the value of portfolio securities received or delivered as a result of in-kind purchases or redemptions of the fund’s capital shares, including ETF Creation Units. |
Admiral Shares
| For a Share Outstanding | Year Ended August 31, |
| Throughout Each Period | 2020 | 2019 | 2018 | 2017 | 2016 |
| Net Asset Value, Beginning of Period | $44.46 | $44.25 | $47.67 | $48.50 | $42.71 |
| Investment Operations | | | | | |
| Net Investment Income | .5121 | .4701 | 1.5541 | 1.6011 | 1.337 |
| Net Realized and Unrealized Gain (Loss) on Investments | 10.571 | .157 | (3.199) | (.829) | 6.529 |
| Total from Investment Operations | 11.083 | .627 | (1.645) | .772 | 7.866 |
| Distributions | | | | | |
| Dividends from Net Investment Income | (.483) | (.417) | (1.775) | (1.602) | (2.076) |
| Distributions from Realized Capital Gains | — | — | — | — | — |
| Total Distributions | (.483) | (.417) | (1.775) | (1.602) | (2.076) |
| Net Asset Value, End of Period | $55.06 | $44.46 | $44.25 | $47.67 | $48.50 |
| | | | | | |
| Total Return2 | 25.16% | 1.46% | -3.48% | 1.61% | 19.14% |
| | | | | | |
| Ratios/Supplemental Data | | | | | |
| Net Assets, End of Period (Millions) | $67 | $50 | $46 | $50 | $65 |
| Ratio of Total Expenses to Average Net Assets | 0.10% | 0.10% | 0.10% | 0.10% | 0.10% |
| Ratio of Net Investment Income to Average Net Assets | 1.10% | 1.09% | 3.48% | 3.26% | 3.10% |
| Portfolio Turnover Rate3 | 15% | 33% | 84% | 18% | 20% |
| 1 | Calculated based on average shares outstanding. |
| 2 | Total returns do not include account service fees that may have applied in the periods shown. Fund prospectuses provide information about any applicable account service fees. |
| 3 | Excludes the value of portfolio securities received or delivered as a result of in-kind purchases or redemptions of the fund’s capital shares, including ETF Creation Units. |
See accompanying Notes, which are an integral part of the Financial Statements.
Communication Services Index Fund
Notes to Financial Statements
Vanguard Communication Services Index Fund is registered under the Investment Company Act of 1940 as an open-end investment company, or mutual fund. The fund offers two classes of shares: ETF Shares and Admiral Shares. Each of the share classes has different eligibility and minimum purchase requirements, and is designed for different types of investors. ETF Shares are listed for trading on NYSE Arca; they can be purchased and sold through a broker.
Market disruptions associated with the COVID-19 pandemic have had a global impact, and uncertainty exists as to the long-term implications. Such disruptions can adversely affect assets of the fund and thus fund performance.
A. The following significant accounting policies conform to generally accepted accounting principles for U.S. investment companies. The fund consistently follows such policies in preparing its financial statements.
1. Security Valuation: Securities are valued as of the close of trading on the New York Stock Exchange (generally 4 p.m., Eastern time) on the valuation date. Equity securities are valued at the latest quoted sales prices or official closing prices taken from the primary market in which each security trades; such securities not traded on the valuation date are valued at the mean of the latest quoted bid and asked prices. Securities for which market quotations are not readily available, or whose values have been materially affected by events occurring before the fund’s pricing time but after the close of the securities’ primary markets, are valued by methods deemed by the board of trustees to represent fair value. Investments in Vanguard Market Liquidity Fund are valued at that fund’s net asset value.
2. Futures Contracts: The fund uses index futures contracts to a limited extent, with the objectives of maintaining full exposure to the stock market, maintaining liquidity, and minimizing transaction costs. The fund may purchase futures contracts to immediately invest incoming cash in the market, or sell futures in response to cash outflows, thereby simulating a fully invested position in the underlying index while maintaining a cash balance for liquidity. The primary risks associated with the use of futures contracts are imperfect correlation between changes in market values of stocks held by the fund and the prices of futures contracts, and the possibility of an illiquid market. Counterparty risk involving futures is mitigated because a regulated clearinghouse is the counterparty instead of the clearing broker. To further mitigate counterparty risk, the fund trades futures contracts on an exchange, monitors the financial strength of its clearing brokers and clearinghouse, and has entered into clearing agreements with its clearing brokers. The clearinghouse imposes initial margin requirements to secure the fund’s performance and requires daily settlement of variation margin representing changes in the market value of each contract. Any securities pledged as initial margin for open contracts are noted in the Schedule of Investments.
Futures contracts are valued at their quoted daily settlement prices. The notional amounts of the contracts are not recorded in the Statement of Assets and Liabilities. Fluctuations in the value of the contracts are recorded in the Statement of Assets and Liabilities as an asset (liability) and in the Statement of Operations as unrealized appreciation (depreciation) until the contracts are closed, when they are recorded as realized gains (losses) on futures contracts.
During the year ended August 31, 2020, the fund’s average investments in long and short futures contracts represented less than 1% and 0% of net assets, respectively, based on the average of the notional amounts at each quarter-end during the period. The fund had no open futures contracts at August 31, 2020.
3. Swap Contracts: The fund has entered into equity swap contracts to earn the total return on selected reference stocks in the fund’s target index. Under the terms of the swaps, the fund receives the total return on the referenced stock (i.e., receiving the increase or paying the decrease in value of the selected reference stock and receiving the equivalent of any dividends in respect of the selected referenced stock) over a specified period of time, applied to a notional amount that represents the value of a designated number of shares of the selected reference stock at the beginning of the equity swap contract. The fund also pays a floating rate that is based on short-term interest rates, applied to the notional amount. At the same time, the fund generally invests an amount approximating the notional amount of the swap in high-quality temporary cash investments.
A risk associated with all types of swaps is the possibility that a counterparty may default on its obligation to pay net amounts due to the fund. The fund’s maximum amount subject to counterparty risk is the unrealized appreciation on the swap contract. The fund mitigates its counterparty risk by entering into swaps only with a diverse group of prequalified counterparties, monitoring their financial strength, entering into master netting arrangements with its counterparties, and requiring its counterparties to transfer collateral as security for their performance. In the absence of a default, the collateral pledged or received by the fund cannot be repledged, resold, or rehypothecated. In the event of a counterparty’s default (including bankruptcy), the fund may terminate any swap contracts with that counterparty, determine the net amount owed by either party in accordance with its master
Communication Services Index Fund
netting arrangements, and sell or retain any collateral held up to the net amount owed to the fund under the master netting arrangements. The swap contracts contain provisions whereby a counterparty may terminate open contracts if the fund’s net assets decline below a certain level, triggering a payment by the fund if the fund is in a net liability position at the time of the termination. The payment amount would be reduced by any collateral the fund has pledged. Any securities pledged as collateral for open contracts are noted in the Schedule of Investments. The value of collateral received or pledged is compared daily to the value of the swap contracts exposure with each counterparty, and any difference, if in excess of a specified minimum transfer amount, is adjusted and settled within two business days.
The notional amounts of swap contracts are not recorded in the Statement of Assets and Liabilities. Swaps are valued daily based on market quotations received from independent pricing services or recognized dealers and the change in value is recorded in the Statement of Assets and Liabilities as an asset (liability) and in the Statement of Operations as unrealized appreciation (depreciation) until periodic payments are made or the termination of the swap, at which time realized gain (loss) is recorded.
During the year ended August 31, 2020, the fund’s average amounts of investments in total return swaps represented less than 1% of net assets, based on the average of notional amounts at each quarter-end during the period.
4. Federal Income Taxes: The fund intends to continue to qualify as a regulated investment company and distribute all of its taxable income. The fund’s tax returns are open to examination by the relevant tax authorities until expiration of the applicable statute of limitations, which is generally three years after the filing of the tax return. Management has analyzed the fund’s tax positions taken for all open federal and state income tax years, and has concluded that no provision for income tax is required in the fund’s financial statements.
5. Distributions: Distributions to shareholders are recorded on the ex-dividend date. Distributions are determined on a tax basis at the fiscal year-end and may differ from net investment income and realized capital gains for financial reporting purposes.
6. Securities Lending: To earn additional income, the fund lends its securities to qualified institutional borrowers. Security loans are subject to termination by the fund at any time, and are required to be secured at all times by collateral in an amount at least equal to the market value of securities loaned. Daily market fluctuations could cause the value of loaned securities to be more or less than the value of the collateral received. When this occurs, the collateral is adjusted and settled before the opening of the market on the next business day. The fund further mitigates its counterparty risk by entering into securities lending transactions only with a diverse group of prequalified counterparties, monitoring their financial strength, and entering into master securities lending agreements with its counterparties. The master securities lending agreements provide that, in the event of a counterparty’s default (including bankruptcy), the fund may terminate any loans with that borrower, determine the net amount owed, and sell or retain the collateral up to the net amount owed to the fund; however, such actions may be subject to legal proceedings. While collateral mitigates counterparty risk, in the event of a default, the fund may experience delays and costs in recovering the securities loaned. The fund invests cash collateral received in Vanguard Market Liquidity Fund, and records a liability in the Statement of Assets and Liabilities for the return of the collateral, during the period the securities are on loan. Collateral investments in Vanguard Market Liquidity Fund are subject to market appreciation or depreciation. Securities lending income represents fees charged to borrowers plus income earned on invested cash collateral, less expenses associated with the loan. During the term of the loan, the fund is entitled to all distributions made on or in respect of the loaned securities.
7. Credit Facilities and Interfund Lending Program: The fund and certain other funds managed by The Vanguard Group (“Vanguard”) participate in a $4.3 billion committed credit facility provided by a syndicate of lenders pursuant to a credit agreement and an uncommitted credit facility provided by Vanguard. Both facilities may be renewed annually. Each fund is individually liable for its borrowings, if any, under the credit facilities. Borrowings may be utilized for temporary or emergency purposes, subject to the fund’s regulatory and contractual borrowing restrictions. With respect to the committed credit facility, the participating funds are charged administrative fees and an annual commitment fee of 0.10% of the undrawn committed amount of the facility; these fees are allocated to the funds based on a method approved by the fund’s board of trustees and included in Management and Administrative expenses on the fund’s Statement of Operations. Any borrowings under either facility bear interest at a rate based upon the higher of the one-month London Interbank Offered Rate (or an acceptable alternate rate, if necessary), federal funds effective rate, or overnight bank funding rate plus an agreed-upon spread, except that borrowings under the uncommitted credit facility may bear interest based upon an alternative rate agreed to by the fund and Vanguard.
Communication Services Index Fund
In accordance with an exemptive order (the “Order”) from the SEC, the fund may participate in a joint lending and borrowing program that allows registered open-end Vanguard funds to borrow money from and lend money to each other for temporary or emergency purposes (the ���Interfund Lending Program”), subject to compliance with the terms and conditions of the Order, and to the extent permitted by the fund’s investment objective and investment policies. Interfund loans and borrowings normally extend overnight, but can have a maximum duration of seven days. Loans may be called on one business day’s notice. The interest rate to be charged is governed by the conditions of the Order and internal procedures adopted by the board of trustees. The board of trustees is responsible for overseeing the Interfund Lending Program.
For the year ended August 31, 2020, the fund did not utilize the credit facilities or the Interfund Lending Program.
8. Other: Dividend income is recorded on the ex-dividend date. Interest income includes income distributions received from Vanguard Market Liquidity Fund and is accrued daily. Security transactions are accounted for on the date securities are bought or sold. Costs used to determine realized gains (losses) on the sale of investment securities are those of the specific securities sold.
Each class of shares has equal rights as to assets and earnings, except that each class separately bears certain class-specific expenses related to maintenance of shareholder accounts (included in Management and Administrative expenses) and shareholder reporting. Marketing and distribution expenses are allocated to each class of shares based on a method approved by the board of trustees. Income, other non-class-specific expenses, and gains and losses on investments are allocated to each class of shares based on its relative net assets.
B. In accordance with the terms of a Funds’ Service Agreement (the “FSA”) between Vanguard and the fund, Vanguard furnishes to the fund investment advisory, corporate management, administrative, marketing, and distribution services at Vanguard’s cost of operations (as defined by the FSA). These costs of operations are allocated to the fund based on methods and guidelines approved by the board of trustees and are generally settled twice a month.
Upon the request of Vanguard, the fund may invest up to 0.40% of its net assets as capital in Vanguard. At August 31, 2020, the fund had contributed to Vanguard capital in the amount of $115,000, representing less than 0.01% of the fund’s net assets and 0.05% of Vanguard’s capital received pursuant to the FSA. The fund’s trustees and officers are also directors and employees, respectively, of Vanguard.
C. Various inputs may be used to determine the value of the fund’s investments and derivatives. These inputs are summarized in three broad levels for financial statement purposes. The inputs or methodologies used to value securities are not necessarily an indication of the risk associated with investing in those securities.
Level 1—Quoted prices in active markets for identical securities.
Level 2—Other significant observable inputs (including quoted prices for similar securities, interest rates, prepayment speeds, credit risk, etc.).
Level 3—Significant unobservable inputs (including the fund’s own assumptions used to determine the fair value of investments). Any investments and derivatives valued with significant unobservable inputs are noted on the Schedule of Investments.
The following table summarizes the market value of the fund’s investments and derivatives as of August 31, 2020, based on the inputs used to value them:
| | Level 1 | | Level 2 | | Level 3 | | Total | |
| | ($000 | ) | ($000 | ) | ($000 | ) | ($000 | ) |
| Investments | | | | | | | | |
| Assets | | | | | | | | |
| Common Stocks | 2,976,376 | | — | | — | | 2,976,376 | |
| Temporary Cash Investments | 9,464 | | — | | — | | 9,464 | |
| Total | 2,985,840 | | — | | — | | 2,985,840 | |
| Derivative Financial Instruments | | | | | | | | |
| Liabilities | | | | | | | | |
| Swap Contracts | — | | 73 | | — | | 73 | |
Communication Services Index Fund
D. Permanent differences between book-basis and tax-basis components of net assets are reclassified among capital accounts in the financial statements to reflect their tax character. These reclassifications have no effect on net assets or net asset value per share. As of period end, permanent differences primarily attributable to the accounting for in-kind redemptions and swap agreements were reclassified between the following accounts:
| | Amount | |
| | ($000 | ) |
| Paid-in Capital | 133,403 | |
| Total Distributable Earnings (Loss) | (133,403 | ) |
Temporary differences between book-basis and tax-basis components of total distributable earnings (loss) arise when certain items of income, gain, or loss are recognized in different periods for financial statement and tax purposes; these differences will reverse at some time in the future. The differences are primarily related to the deferral of losses from wash sales and the recognition of unrealized gains or losses from certain derivative contracts. As of period end, the tax-basis components of total distributable earnings (loss) are detailed in the table as follows:
| | Amount | |
| | ($000 | ) |
| Undistributed Ordinary Income | 6,600 | |
| Undistributed Long-term Gains | — | |
| Capital Loss Carryforwards | (374,783 | ) |
| Qualified Late-Year Losses | — | |
| Net Unrealized Gains (Losses) | 438,601 | |
The tax character of distributions paid was as follows:
| | | Year Ended August 31, | |
| | | 2020 | | 2019 | |
| | | Amount | | Amount | |
| | | ($000 | ) | ($000 | ) |
| Ordinary Income* | | 23,046 | | 15,276 | |
| Long-Term Capital Gains | | — | | — | |
| Total | | 23,046 | | 15,276 | |
* Includes short-term capital gains, if any.
As of August 31, 2020, gross unrealized appreciation and depreciation for investments and derivatives based on cost for U.S. federal income tax purposes were as follows:
| | Amount | |
| | ($000 | ) |
| Tax Cost | 2,547,239 | |
| Gross Unrealized Appreciation | 582,580 | |
| Gross Unrealized Depreciation | (143,979 | ) |
| Net Unrealized Appreciation (Depreciation) | 438,601 | |
E. During the year ended August 31, 2020, the fund purchased $1,660,143,000 of investment securities and sold $1,290,004,000 of investment securities, other than temporary cash investments. Purchases and sales include $1,285,915,000 and $962,024,000, respectively, in connection with in-kind purchases and redemptions of the fund’s capital shares.
Communication Services Index Fund
F. Capital share transactions for each class of shares were:
| | | | | | | Year Ended August 31, | |
| | | | 2020 | | | | | 2019 | |
| | Amount | | Shares | | | Amount | | Shares | |
| | ($000 | ) | (000 | ) | | ($000 | ) | (000 | ) |
| ETF Shares | | | | | | | | | |
| Issued | 1,330,015 | | 14,802 | | | 1,833,068 | | 21,800 | |
| Issued in Lieu of Cash Distributions | — | | — | | | — | | — | |
| Redeemed | (965,210 | ) | (10,950 | ) | | (849,560 | ) | (10,375 | ) |
| Net Increase (Decrease)—ETF Shares | 364,805 | | 3,852 | | | 983,508 | | 11,425 | |
| Admiral Shares | | | | | | | | | |
| Issued | 39,541 | | 862 | | | 27,900 | | 653 | |
| Issued in Lieu of Cash Distributions | 448 | | 10 | | | 387 | | 9 | |
| Redeemed | (35,280 | ) | (771 | ) | | (24,935 | ) | (584 | ) |
| Net Increase (Decrease)—Admiral Shares | 4,709 | | 101 | | | 3,352 | | 78 | |
G. Management has determined that no events or transactions occurred subsequent to August 31, 2020, that would require recognition or disclosure in these financial statements.
Consumer Discretionary Index Fund
Performance Summary
All of the returns in this report represent past performance, which is not a guarantee of future results that may be achieved by the fund. (Current performance may be lower or higher than the performance data cited. For performance data current to the most recent month-end, visit our website at vanguard.com/performance.) Note, too, that both investment returns and principal value can fluctuate widely, so an investor’s shares, when sold, could be worth more or less than their original cost. The returns shown do not reflect taxes that a shareholder would pay on fund distributions or on the sale of fund shares.
Cumulative Performance: August 31, 2010–August 31, 2020
Initial Investment of $10,000
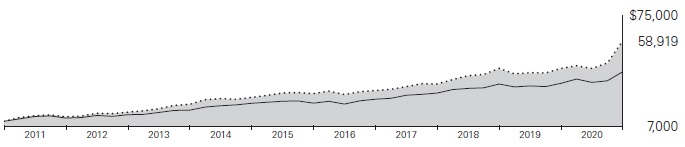
| | | | Average Annual Total Returns | Final Value |
| | | | Periods Ended August 31, 2020 | of a $10,000 |
| | | One Year | Five Years | Ten Years | Investment |
 | Consumer Discretionary Index Fund ETF Shares Net Asset Value | 39.98% | 17.04% | 19.41% | $58,919 |
| | Consumer Discretionary Index Fund ETF Shares Market Price | 40.17 | 17.05 | 19.43 | 59,031 |
 | Consumer Discretionary Spliced Index | 40.11 | 17.13 | 19.52 | 59,482 |
 | MSCI US IMI/2500 | 21.48 | 13.88 | 14.99 | 40,426 |
Consumer Discretionary Spliced Index: MSCI US IMI/Consumer Discretionary 25/50 through May 2, 2018; MSCI US IMI/Consumer Discretionary 25/50 Transition Index through December 2, 2018; MSCI US IMI/Consumer Discretionary 25/50 thereafter.
| | | | | Final Value |
| | | | | of a $100,000 |
| | One Year | Five Years | Ten Years | Investment |
| Consumer Discretionary Index Fund Admiral Shares | 40.01% | 17.05% | 19.41% | $589,303 |
| Consumer Discretionary Spliced Index | 40.11 | 17.13 | 19.52 | 594,825 |
| MSCI US IMI/2500 | 21.48 | 13.88 | 14.99 | 404,265 |
| Cumulative Returns: ETF Shares, August 31, 2010–August 31, 2020 | | |
| | | |
| | One Year | Five Years | Ten Years |
| Consumer Discretionary Index Fund ETF Shares Market Price | 40.17% | 119.73% | 490.31% |
| Consumer Discretionary Index Fund ETF Shares Net Asset Value | 39.98 | 119.64 | 489.19 |
| Consumer Discretionary Spliced Index | 40.11 | 120.44 | 494.82 |
For the ETF Shares, the market price is determined by the midpoint of the bid-offer spread as of the closing time of the New York Stock Exchange (generally 4 p.m., Eastern time). The net asset value is also determined as of the NYSE closing time. For more information about how the ETF Shares’ market prices have compared with their net asset value, visit vanguard.com, select your ETF, and then select the Price and Performance tab. The ETF premium/discount analysis there shows the percentages of days on which the ETF Shares’ market price was above or below the NAV.
See Financial Highlights for dividend and capital gains information.
Consumer Discretionary Index Fund
Fund Allocation
As of August 31, 2020
| Apparel Retail | 3.8% |
| Apparel, Accessories & Luxury Goods | 2.9 |
| Auto Parts & Equipment | 2.4 |
| Automobile Manufacturers | 8.9 |
| Automotive Retail | 3.6 |
| Casinos & Gaming | 2.0 |
| Computer & Electronics Retail | 0.8 |
| Consumer Electronics | 0.5 |
| Department Stores | 0.3 |
| Distributors | 1.0 |
| Education Services | 1.1 |
| Footwear | 3.9 |
| General Merchandise Stores | 3.9 |
| Home Furnishings | 0.6 |
| Home Improvement Retail | 10.9 |
| Homebuilding | 3.2 |
| Homefurnishing Retail | 0.8 |
| Hotels, Resorts & Cruise Lines | 2.8 |
| Household Appliances | 0.6 |
| Housewares & Specialties | 0.3 |
| Internet & Direct Marketing Retail | 29.9 |
| Leisure Facilities | 0.5 |
| Leisure Products | 1.8 |
| Motorcycle Manufacturers | 0.1 |
| Restaurants | 10.4 |
| Specialized Consumer Services | 0.8 |
| Specialty Stores | 2.0 |
| Tires & Rubber | 0.2 |
The table reflects the fund’s investments, except for short-term investments and derivatives. Sector categories are based on the Global Industry Classification Standard (“GICS”), except for the “Other” category (if applicable), which includes securities that have not been provided a GICS classification as of the effective reporting period.
The fund may invest in derivatives (such as futures and swap contracts) for various reasons, including, but not limited to, attempting to remain fully invested and tracking its target index as closely as possible.
The Global Industry Classification Standard (“GICS”) was developed by and is the exclusive property and a service mark of MSCI Inc. (“MSCI”) and Standard and Poor’s, a division of McGraw-Hill Companies, Inc. (“S&P”), and is licensed for use by Vanguard. Neither MSCI, S&P nor any third party involved in making or compiling the GICS or any GICS classification makes any express or implied warranties or representations with respect to such standard or classification (or the results to be obtained by the use thereof), and all such parties hereby expressly disclaim all warranties of originality, accuracy, completeness, merchantability or fitness for a particular purpose with respect to any such standard or classification. Without limiting any of the foregoing, in no event shall MSCI, S&P, any of its affiliates or any third party involved in making or compiling the GICS or any GICS classification have any liability for any direct, indirect, special, punitive, consequential or any other damages (including lost profits) even if notified of the possibility of such damages.
Consumer Discretionary Index Fund
Financial Statements
Schedule of Investments
As of August 31, 2020
The fund files its complete schedule of portfolio holdings with the Securities and Exchange Commission (SEC) for the first and third quarters of each fiscal year as an exhibit to its reports on Form N-PORT. The fund’s Form N-PORT reports are available on the SEC’s website at www.sec.gov.
| | | | Market |
| | | | Value• |
| | | Shares | ($000) |
| Common Stocks (98.3%) | | |
| Auto Components (2.6%) | | |
| | Aptiv plc | 294,302 | 25,345 |
| | BorgWarner Inc. | 253,076 | 10,272 |
| | Gentex Corp. | 304,890 | 8,247 |
| | Autoliv Inc. | 104,421 | 8,180 |
| | Lear Corp. | 70,565 | 8,040 |
| * | Fox Factory Holding Corp. | 58,123 | 5,859 |
| | LCI Industries | 38,829 | 4,412 |
| | Goodyear Tire & Rubber Co. | 403,262 | 3,869 |
| * | Dorman Products Inc. | 45,259 | 3,833 |
| | Cooper Tire & Rubber Co. | 104,324 | 3,607 |
| | Dana Inc. | 253,273 | 3,533 |
| * | Visteon Corp. | 46,368 | 3,498 |
| *,^ | Veoneer Inc. | 238,147 | 3,306 |
| * | Delphi Technologies plc | 189,674 | 3,295 |
| * | Gentherm Inc. | 64,941 | 2,937 |
| * | Adient plc | 168,667 | 2,925 |
| * | American Axle & Manufacturing Holdings Inc. | 303,856 | 2,364 |
| | Standard Motor Products Inc. | 51,989 | 2,362 |
| * | Stoneridge Inc. | 92,576 | 1,870 |
| * | Tenneco Inc. Class A | 212,482 | 1,728 |
| * | Motorcar Parts of America Inc. | 78,615 | 1,369 |
| * | Modine Manufacturing Co. | 200,292 | 1,356 |
| * | Cooper-Standard Holdings Inc. | 70,207 | 1,272 |
| * | Garrett Motion Inc. | 311,043 | 855 |
| | | | 114,334 |
| Automobiles (8.8%) | | |
| * | Tesla Inc. | 620,075 | 308,996 |
| | General Motors Co. | 1,376,841 | 40,796 |
| | Ford Motor Co. | 4,236,906 | 28,896 |
| | Thor Industries Inc. | 71,625 | 6,763 |
| | Harley-Davidson Inc. | 210,733 | 5,839 |
| | Winnebago Industries Inc. | 54,947 | 2,966 |
| | | | 394,256 |
| Distributors (1.0%) | | |
| | Genuine Parts Co. | 165,169 | 15,598 |
| | Pool Corp. | 46,359 | 15,198 |
| * | LKQ Corp. | 347,448 | 11,028 |
| | Core-Mark Holding Co. Inc. | 92,605 | 3,095 |
| * | Funko Inc. Class A | 78,731 | 460 |
| | | | 45,379 |
| Diversified Consumer Services (1.8%) | |
| * | Chegg Inc. | 144,954 | 10,689 |
| | Service Corp. International | 217,721 | 9,939 |
| * | Bright Horizons Family Solutions Inc. | 72,851 | 9,690 |
| * | ServiceMaster Global Holdings Inc. | 181,719 | 7,250 |
| * | Grand Canyon Education Inc. | 63,474 | 5,969 |
| * | frontdoor Inc. | 119,490 | 5,206 |
| | H&R Block Inc. | 289,372 | 4,196 |
| | Strategic Education Inc. | 35,283 | 3,619 |
| | Graham Holdings Co. Class B | 8,043 | 3,442 |
| * | K12 Inc. | 92,066 | 3,426 |
| * | Adtalem Global Education Inc. | 92,863 | 3,083 |
| * | Laureate Education Inc. Class A | 237,917 | 2,979 |
| * | WW International Inc. | 103,424 | 2,428 |
| * | Perdoceo Education Corp. | 160,149 | 2,301 |
| * | American Public Education Inc. | 54,488 | 1,713 |
| | Carriage Services Inc. Class A | 70,128 | 1,553 |
| | OneSpaWorld Holdings Ltd. | 202,286 | 1,402 |
| * | Houghton Mifflin Harcourt Co. | 443,419 | 1,002 |
| * | Regis Corp. | 103,795 | 767 |
| | | | 80,654 |
| Hotels, Restaurants & Leisure (15.5%) | | |
| | McDonald’s Corp. | 799,198 | 170,645 |
| | Starbucks Corp. | 1,272,559 | 107,493 |
| * | Chipotle Mexican Grill Inc. Class A | 28,464 | 37,296 |
| | Yum! Brands Inc. | 325,358 | 31,186 |
| | Marriott International Inc. Class A | 298,974 | 30,767 |
| | Hilton Worldwide Holdings Inc. | 302,283 | 27,314 |
| | Las Vegas Sands Corp. | 383,231 | 19,434 |
| | Domino’s Pizza Inc. | 43,651 | 17,852 |
| | Royal Caribbean Cruises Ltd. | 210,696 | 14,504 |
| | Darden Restaurants Inc. | 150,942 | 13,082 |
| | MGM Resorts International | 558,908 | 12,575 |
| | Vail Resorts Inc. | 47,929 | 10,433 |
| | Wynn Resorts Ltd. | 116,731 | 10,208 |
| * | Caesars Entertainment Inc. | 219,362 | 10,047 |
| | Carnival Corp. | 587,252 | 9,678 |
| * | Penn National Gaming Inc. | 178,692 | 9,131 |
| | Churchill Downs Inc. | 46,983 | 8,211 |
| | Aramark | 291,834 | 8,043 |
| | Dunkin’ Brands Group Inc. | 103,452 | 7,871 |
| * | Planet Fitness Inc. Class A | 107,503 | 6,535 |
| | Wingstop Inc. | 39,904 | 6,520 |
| | Wyndham Hotels & Resorts Inc. | 123,338 | 6,458 |
| *,^ | Norwegian Cruise Line Holdings Ltd. | 350,146 | 5,991 |
| | Texas Roadhouse Inc. Class A | 91,940 | 5,791 |
| | Marriott Vacations Worldwide Corp. | 57,229 | 5,418 |
| | Wendy’s Co. | 258,690 | 5,417 |
| | Choice Hotels International Inc. | 52,452 | 5,208 |
| | Cracker Barrel Old Country Store Inc. | 35,298 | 4,720 |
| | Papa John’s International Inc. | 44,470 | 4,371 |
| | Brinker International Inc. | 96,713 | 4,356 |
| * | Shake Shack Inc. Class A | 60,261 | 4,113 |
| | Boyd Gaming Corp. | 148,525 | 3,977 |
| | Wyndham Destinations Inc. | 135,726 | 3,935 |
| | Extended Stay America Inc. | 291,091 | 3,636 |
| | Hyatt Hotels Corp. Class A | 61,588 | 3,479 |
| | Jack in the Box Inc. | 40,509 | 3,338 |
| * | Hilton Grand Vacations Inc. | 147,707 | 3,236 |
| | Six Flags Entertainment Corp. | 146,279 | 3,179 |
| | Red Rock Resorts Inc. Class A | 177,876 | 3,037 |
| ^ | Cheesecake Factory Inc. | 101,935 | 3,010 |
| * | Scientific Games Corp. | 145,331 | 3,006 |
| | Bloomin’ Brands Inc. | 187,082 | 2,683 |
| | Dine Brands Global Inc. | 44,850 | 2,671 |
| * | SeaWorld Entertainment Inc. | 127,400 | 2,599 |
| | BJ’s Restaurants Inc. | 79,507 | 2,506 |
| | Dave & Buster’s Entertainment Inc. | 147,161 | 2,447 |
| * | Everi Holdings Inc. | 306,358 | 2,377 |
| * | Denny’s Corp. | 201,119 | 2,305 |
| * | Monarch Casino & Resort Inc. | 47,540 | 2,187 |
| * | Accel Entertainment Inc. | 174,807 | 2,073 |
| | Twin River Worldwide Holdings Inc. | 68,916 | 1,649 |
| * | Chuy’s Holdings Inc. | 68,954 | 1,534 |
| * | El Pollo Loco Holdings Inc. | 79,591 | 1,422 |
| | Ruth’s Hospitality Group Inc. | 134,540 | 1,382 |
| * | Lindblad Expeditions Holdings Inc. | 123,605 | 1,224 |
| * | Carrols Restaurant Group Inc. | 153,584 | 1,023 |
| * | Del Taco Restaurants Inc. | 115,915 | 975 |
| * | Golden Entertainment Inc | 75,592 | 971 |
| * | Playa Hotels & Resorts NV | 215,768 | 911 |
| * | Fiesta Restaurant Group Inc. | 80,371 | 805 |
| | BBX Capital Corp. Class A | 48,914 | 753 |
| * | Red Robin Gourmet Burgers Inc. | 44,612 | 495 |
| * | PlayAGS Inc. | 116,495 | 466 |
| * | Biglari Holdings Inc. Class B | 3,810 | 378 |
| * | Target Hospitality Corp. | 146,960 | 213 |
| | | | 690,550 |
Consumer Discretionary Index Fund
| | | | Market |
| | | | Value• |
| | | Shares | ($000) |
| Household Durables (5.1%) | | |
| | DR Horton Inc. | 381,374 | 27,219 |
| | Lennar Corp. Class A | 303,425 | 22,702 |
| | Garmin Ltd. | 161,705 | 16,754 |
| * | NVR Inc. | 3,974 | 16,565 |
| | PulteGroup Inc. | 315,519 | 14,069 |
| | Whirlpool Corp. | 74,560 | 13,251 |
| | Newell Brands Inc. | 506,242 | 8,090 |
| | Leggett & Platt Inc. | 176,635 | 7,242 |
| | Toll Brothers Inc. | 170,347 | 7,192 |
| * | Mohawk Industries Inc. | 77,824 | 7,185 |
| * | TopBuild Corp. | 46,345 | 7,128 |
| * | Helen of Troy Ltd. | 32,914 | 6,807 |
| * | Tempur Sealy International Inc. | 71,037 | 6,077 |
| * | Meritage Homes Corp. | 56,978 | 5,472 |
| * | Taylor Morrison Home Corp. Class A | 202,121 | 4,756 |
| | KB Home | 123,466 | 4,415 |
| * | LGI Homes Inc. | 36,525 | 4,086 |
| | MDC Holdings Inc. | 93,227 | 4,044 |
| * | Installed Building Products Inc. | 45,391 | 3,941 |
| * | TRI Pointe Group Inc. | 232,123 | 3,918 |
| * | iRobot Corp. | 47,139 | 3,490 |
| | Tupperware Brands Corp. | 202,738 | 3,303 |
| | La-Z-Boy Inc. | 97,362 | 3,164 |
| * | Cavco Industries Inc. | 15,945 | 3,044 |
| * | Sonos Inc. | 215,552 | 3,033 |
| * | Skyline Champion Corp. | 104,904 | 2,994 |
| * | M/I Homes Inc. | 68,844 | 2,930 |
| * | Century Communities Inc. | 73,241 | 2,613 |
| * | GoPro Inc. Class A | 415,600 | 1,908 |
| * | Universal Electronics Inc. | 44,598 | 1,832 |
| * | Green Brick Partners Inc. | 104,524 | 1,488 |
| * | Beazer Homes USA Inc. | 120,044 | 1,469 |
| | Ethan Allen Interiors Inc. | 97,941 | 1,395 |
| | Hooker Furniture Corp. | 49,213 | 1,213 |
| * | Lovesac Co. | 45,211 | 1,197 |
| * | Legacy Housing Corp. | 35,457 | 541 |
| | | | 226,527 |
| Internet & Direct Marketing Retail (29.4%) |
| * | Amazon.com Inc. | 294,313 | 1,015,662 |
| * | Booking Holdings Inc. | 45,498 | 86,922 |
| * | MercadoLibre Inc. | 47,689 | 55,729 |
| | eBay Inc. | 872,354 | 47,787 |
| * | Wayfair Inc. | 72,997 | 21,648 |
| * | Etsy Inc. | 137,339 | 16,439 |
| | Expedia Group Inc. | 155,217 | 15,234 |
| * | Overstock.com Inc. | 102,788 | 8,994 |
| * | Grubhub Inc. | 114,924 | 8,315 |
| * | Qurate Retail Group Inc. QVC Group Class A | 549,332 | 6,070 |
| * | Stamps.com Inc. | 23,281 | 5,805 |
| * | Chewy Inc. | 93,353 | 5,701 |
| | Shutterstock Inc. | 52,305 | 2,632 |
| *,^ | Stitch Fix Inc. Class A | 108,476 | 2,620 |
| * | Quotient Technology Inc. | 271,599 | 2,366 |
| * | Groupon Inc. Class A | 73,390 | 2,336 |
| * | 1-800-Flowers.com Inc. Class A | 76,569 | 2,292 |
| | PetMed Express Inc. | 60,697 | 2,110 |
| * | RealReal Inc. | 88,969 | 1,429 |
| *,^ | Revolve Group Inc. | 65,573 | 1,317 |
| * | Duluth Holdings Inc. | 84,252 | 815 |
| * | Lands’ End Inc. | 53,118 | 711 |
| | | | 1,312,934 |
| Leisure Products (1.7%) | | |
| * | Peloton Interactive Inc. Class A | 221,830 | 17,008 |
| | Hasbro Inc. | 151,328 | 11,946 |
| | Polaris Inc. | 74,840 | 7,562 |
| | Brunswick Corp. | 103,546 | 6,408 |
| * | YETI Holdings Inc. | 117,236 | 6,023 |
| * | Mattel Inc. | 501,331 | 5,387 |
| * | Vista Outdoor Inc. | 211,099 | 4,097 |
| | Callaway Golf Co. | 176,933 | 3,691 |
| * | Smith & Wesson Brands Inc. | 171,205 | 3,126 |
| | Acushnet Holdings Corp. | 77,802 | 2,746 |
| | Sturm Ruger & Co. Inc. | 37,380 | 2,649 |
| * | Malibu Boats Inc. Class A | 46,130 | 2,392 |
| | Johnson Outdoors Inc. Class A | 23,822 | 2,042 |
| * | MasterCraft Boat Holdings Inc. | 78,161 | 1,634 |
| * | American Outdoor Brands Inc. | 42,920 | 654 |
| | | | 77,365 |
| Multiline Retail (4.2%) | | |
| | Target Corp. | 538,880 | 81,484 |
| | Dollar General Corp. | 273,350 | 55,184 |
| * | Dollar Tree Inc. | 258,622 | 24,898 |
| * | Ollie’s Bargain Outlet Holdings Inc. | 73,749 | 7,046 |
| | Kohl’s Corp. | 227,763 | 4,865 |
| ^ | Macy’s Inc. | 544,848 | 3,798 |
| | Big Lots Inc. | 77,314 | 3,645 |
| ^ | Nordstrom Inc. | 200,092 | 3,201 |
| ^ | Dillard’s Inc. Class A | 35,813 | 1,082 |
| | | | 185,203 |
| Other (0.0%)1 | | |
| *,§ | Media General Inc. CVR | 69,182 | 3 |
| | | | |
| Specialty Retail (21.5%) | | |
| | Home Depot Inc. | 1,154,883 | 329,188 |
| | Lowe’s Cos. Inc. | 835,512 | 137,600 |
| | TJX Cos. Inc. | 1,279,737 | 70,117 |
| * | O’Reilly Automotive Inc. | 82,479 | 38,405 |
| | Ross Stores Inc. | 386,746 | 35,225 |
| * | AutoZone Inc. | 25,949 | 31,043 |
| | Best Buy Co. Inc. | 254,936 | 28,275 |
| | Tractor Supply Co. | 131,597 | 19,586 |
| * | CarMax Inc. | 183,140 | 19,583 |
| * | Carvana Co. Class A | 78,921 | 17,044 |
| | Tiffany & Co. | 123,379 | 15,114 |
| * | Burlington Stores Inc. | 74,870 | 14,744 |
| * | Ulta Beauty Inc. | 61,553 | 14,291 |
| | Advance Auto Parts Inc. | 79,958 | 12,498 |
| | L Brands Inc. | 334,912 | 9,846 |
| | Williams-Sonoma Inc. | 96,860 | 8,500 |
| | Lithia Motors Inc. Class A | 33,398 | 8,315 |
| * | Floor & Decor Holdings Inc. Class A | 108,656 | 7,958 |
| * | Five Below Inc. | 70,054 | 7,667 |
| * | Rh | 22,322 | 7,379 |
| | Gap Inc. | 381,953 | 6,642 |
| | Aaron’s Inc. | 104,628 | 5,848 |
| | Dick’s Sporting Goods Inc. | 106,088 | 5,741 |
| * | Murphy USA Inc. | 40,020 | 5,397 |
| * | AutoNation Inc. | 90,313 | 5,135 |
| * | National Vision Holdings Inc. | 128,850 | 4,841 |
| | Foot Locker Inc. | 156,199 | 4,738 |
| * | At Home Group Inc. | 212,500 | 4,061 |
| | Bed Bath & Beyond Inc. | 326,639 | 3,978 |
| * | Asbury Automotive Group Inc. | 36,924 | 3,906 |
| | American Eagle Outfitters Inc. | 298,594 | 3,765 |
| *,^ | Michaels Cos. Inc. | 304,053 | 3,421 |
| | Group 1 Automotive Inc. | 39,332 | 3,400 |
| * | Sleep Number Corp. | 67,396 | 3,235 |
| | Penske Automotive Group Inc. | 66,838 | 3,153 |
| * | Urban Outfitters Inc. | 133,493 | 3,142 |
| | Sonic Automotive Inc. Class A | 73,724 | 3,116 |
| | Rent-A-Center Inc. | 98,740 | 3,031 |
| | Signet Jewelers Ltd. | 175,374 | 3,029 |
| * | Lumber Liquidators Holdings Inc. | 119,258 | 2,861 |
| | Camping World Holdings Inc. Class A | 97,790 | 2,842 |
| | Monro Inc. | 61,612 | 2,840 |
| | ODP Corp. | 118,313 | 2,766 |
| * | MarineMax Inc. | 89,352 | 2,628 |
| * | Sally Beauty Holdings Inc. | 229,642 | 2,563 |
| | Abercrombie & Fitch Co. | 192,694 | 2,507 |
| * | Boot Barn Holdings Inc. | 82,994 | 2,343 |
| * | America’s Car-Mart Inc. | 23,267 | 2,338 |
| * | Hibbett Sports Inc. | 67,976 | 2,268 |
| | Buckle Inc. | 109,563 | 2,053 |
| * | Zumiez Inc. | 79,773 | 2,049 |
| | Guess? Inc. | 163,873 | 1,885 |
| | Winmark Corp. | 11,954 | 1,846 |
| | Designer Brands Inc. Class A | 251,305 | 1,772 |
| *,^ | GameStop Corp. Class A | 238,249 | 1,591 |
| | Haverty Furniture Cos. Inc. | 67,398 | 1,423 |
| | Caleres Inc. | 166,468 | 1,300 |
| | Shoe Carnival Inc. | 38,317 | 1,260 |
| * | Conn’s Inc. | 90,589 | 1,158 |
| | Children’s Place Inc. | 56,794 | 1,134 |
| * | Genesco Inc. | 57,830 | 1,128 |
| | Cato Corp. Class A | 89,223 | 714 |
| | Chico’s FAS Inc. | 478,483 | 612 |
| * | Express Inc. | 248,858 | 276 |
| | | | 958,114 |
| Textiles, Apparel & Luxury Goods (6.7%) |
| | NIKE Inc. Class B | 1,317,126 | 147,373 |
| * | Lululemon Athletica Inc. | 132,310 | 49,705 |
| | VF Corp. | 367,249 | 24,147 |
| | Hanesbrands Inc. | 494,206 | 7,556 |
| * | Deckers Outdoor Corp. | 36,356 | 7,412 |
| | PVH Corp. | 100,564 | 5,608 |
| * | Skechers USA Inc. Class A | 186,524 | 5,568 |
| | Tapestry Inc. | 376,260 | 5,542 |
| | Carter’s Inc. | 61,821 | 4,922 |
| | Ralph Lauren Corp. Class A | 69,236 | 4,766 |
| * | Crocs Inc. | 116,220 | 4,638 |
| | Columbia Sportswear Co. | 48,550 | 4,154 |
| | Wolverine World Wide Inc. | 146,922 | 3,670 |
| * | Capri Holdings Ltd. | 231,301 | 3,664 |
| * | Under Armour Inc. Class A | 348,459 | 3,418 |
| * | Under Armour Inc. Class C | 357,274 | 3,162 |
| | Steven Madden Ltd. | 146,848 | 3,107 |
| | Kontoor Brands Inc. | 132,196 | 2,922 |
| | Oxford Industries Inc. | 48,177 | 2,386 |
Consumer Discretionary Index Fund
| | | | Market |
| | | | Value• |
| | | Shares | ($000) |
| | Levi Strauss & Co. Class A | 172,883 | 2,130 |
| * | G-III Apparel Group Ltd. | 172,594 | 1,909 |
| * | Fossil Group Inc. | 200,123 | 1,288 |
| | Movado Group Inc. | 68,401 | 746 |
| * | Unifi Inc. | 57,995 | 709 |
| * | Vera Bradley Inc. | 96,530 | 509 |
| | | | 301,011 |
Total Common Stocks
(Cost $3,228,250) | | 4,386,330 |
| Temporary Cash Investment (1.6%) | | |
| 2,3 | Vanguard Market Liquidity Fund, 0.147% (Cost $72,433) | 724,497 | 72,450 |
Total Investments (99.9%)
(Cost $3,300,683) | | 4,458,780 |
| Other Assets and Liabilities—Net (0.1%) | | 4,181 |
| Net Assets (100%) | | 4,462,961 |
Cost is in $000.
| • | See Note A in Notes to Financial Statements. |
| | | |
| * | Non-income-producing security. |
| | | |
| ^ | Includes partial security positions on loan to broker-dealers. The total value of securities on loan is $15,242,000. |
| | | |
| § | Security value determined using significant unobservable inputs. |
| | | |
| 1 | “Other” represents securities that are not classified by the fund’s benchmark index. |
| | | |
| 2 | Collateral of $16,252,000 was received for securities on loan. |
| | | |
| 3 | Affiliated money market fund available only to Vanguard funds and certain trusts and accounts managed by Vanguard. Rate shown is the 7-day yield. |
| | | |
| | CVR—Contingent Value Rights. |
| Derivative Financial Instruments Outstanding as of Period End | | |
| | | |
| Futures Contracts | | | | | | |
| | | | | | | ($000) |
| | | | | | | Value and |
| | | | | Number of | | Unrealized |
| | | | | Long (Short) | Notional | Appreciation |
| | | Expiration | Contracts | Amount | (Depreciation) |
| Long Futures Contracts | | | | | | |
| E-mini S&P 500 Index | | December 2020 | 9 | 1,570 | (3) |
| Over-the-Counter Total Return Swaps | | | | | |
| | | | | Floating | | |
| | | | | Interest Rate | Value and | Value and |
| | | | Notional | Received | Unrealized | Unrealized |
| | Termination | | Amount | (Paid)1 | Appreciation | (Depreciation) |
| Reference Entity | Date | Counterparty | ($000) | (%) | ($000) | ($000) |
| Tesla Inc. | 2/2/21 | GSI | 55,069 | (0.161) | 19,676 | — |
| 1 | Based on 1-month USD London Interbank Offered Rate (LIBOR) as of the most recent payment date. Floating interest payment received/ paid monthly. |
GSI—Goldman Sachs International.
At August 31, 2020, a counterparty had deposited in a segregated account securities with a value of $11,743,000 in connection with open over-the-counter swap contracts. After August 31, 2020, the counterparty posted additional collateral of $8,310,000 in connection with open over-the-counter swap contracts as of September 1, 2020.
See accompanying Notes, which are an integral part of the Financial Statements.
Consumer Discretionary Index Fund
Statement of Assets and Liabilities
As of August 31, 2020
| ($000s, except shares and per-share amounts) | Amount |
| Assets | |
| Investments in Securities, at Value | |
| Unaffiliated Issuers (Cost $3,228,250) | 4,386,330 |
| Affiliated Issuers (Cost $72,433) | 72,450 |
| Total Investments in Securities | 4,458,780 |
| Investment in Vanguard | 165 |
| Cash Collateral Pledged—Futures Contracts | 110 |
| Receivables for Investment Securities Sold | 19,300 |
| Receivables for Accrued Income | 2,651 |
| Receivables for Capital Shares Issued | 1,461 |
| Unrealized Appreciation—Over-the-Counter Swap Contracts | 19,676 |
| Total Assets | 4,502,143 |
| Liabilities | |
| Payables for Investment Securities Purchased | 20,229 |
| Collateral for Securities on Loan | 16,252 |
| Payables for Capital Shares Redeemed | 2,487 |
| Payables to Vanguard | 211 |
| Variation Margin Payable—Futures Contracts | 3 |
| Total Liabilities | 39,182 |
| Net Assets | 4,462,961 |
| | |
| | |
| At August 31, 2020, net assets consisted of: | |
| | |
| Paid-in Capital | 3,360,485 |
| Total Distributable Earnings (Loss) | 1,102,476 |
| Net Assets | 4,462,961 |
| | |
| ETF Shares—Net Assets | |
| Applicable to 16,310,352 outstanding $.001 par value shares of beneficial interest (unlimited authorization) | 4,026,379 |
| Net Asset Value Per Share—ETF Shares | $246.86 |
| | |
| Admiral Shares—Net Assets | |
| Applicable to 3,416,728 outstanding $.001 par value shares of beneficial interest (unlimited authorization) | 436,582 |
| Net Asset Value Per Share—Admiral Shares | $127.78 |
See accompanying Notes, which are an integral part of the Financial Statements.
Consumer Discretionary Index Fund
Statement of Operations
| | Year Ended |
| | August 31, 2020 |
| | ($000) |
| Investment Income | |
| Income | |
| Dividends | 37,314 |
| Interest1 | 140 |
| Securities Lending—Net | 1,061 |
| Total Income | 38,515 |
| Expenses | |
| The Vanguard Group—Note B | |
| Investment Advisory Services | 497 |
| Management and Administrative—ETF Shares | 2,189 |
| Management and Administrative—Admiral Shares | 238 |
| Marketing and Distribution—ETF Shares | 152 |
| Marketing and Distribution—Admiral Shares | 22 |
| Custodian Fees | 23 |
| Auditing Fees | 32 |
| Shareholders’ Reports—ETF Shares | 163 |
| Shareholders’ Reports—Admiral Shares | 7 |
| Trustees’ Fees and Expenses | 2 |
| Total Expenses | 3,325 |
| Expenses Paid Indirectly | (5) |
| Net Expenses | 3,320 |
| Net Investment Income | 35,195 |
| Realized Net Gain (Loss) | |
| Investment Securities Sold1,2 | 413,684 |
| Futures Contracts | 48 |
| Swap Contracts | 48,435 |
| Realized Net Gain (Loss) | 462,167 |
| Change in Unrealized Appreciation (Depreciation) | |
| Investment Securities1 | 688,751 |
| Futures Contracts | (3) |
| Swap Contracts | 19,381 |
| Change in Unrealized Appreciation (Depreciation) | 708,129 |
| Net Increase (Decrease) in Net Assets Resulting from Operations | 1,205,491 |
| 1 | Interest income, realized net gain (loss), and change in unrealized appreciation (depreciation) from an affiliated company of the fund were $140,000, $3,000, and $15,000, respectively. Purchases and sales are for temporary cash investment purposes. |
| 2 | Includes $457,054,000 of net gain (loss) resulting from in-kind redemptions. |
Statement of Changes in Net Assets
| | Year Ended August 31, |
| | 2020 | 2019 |
| | ($000) | ($000) |
| Increase (Decrease) in Net Assets | | |
| Operations | | |
| Net Investment Income | 35,195 | 38,231 |
| Realized Net Gain (Loss) | 462,167 | 198,044 |
| Change in Unrealized Appreciation (Depreciation) | 708,129 | (297,760) |
| Net Increase (Decrease) in Net Assets Resulting from Operations | 1,205,491 | (61,485) |
| Distributions1 | | |
| ETF Shares | (36,170) | (34,304) |
| Admiral Shares | (3,859) | (3,668) |
| Total Distributions | (40,029) | (37,972) |
| Capital Share Transactions | | |
| ETF Shares | (74,809) | (55,912) |
| Admiral Shares | 2,845 | (1,729) |
| Net Increase (Decrease) from Capital Share Transactions | (71,964) | (57,641) |
| Total Increase (Decrease) | 1,093,498 | (157,098) |
| Net Assets | | |
| Beginning of Period | 3,369,463 | 3,526,561 |
| End of Period | 4,462,961 | 3,369,463 |
| 1 | Certain prior-period numbers have been reclassified to conform with current period presentation. |
See accompanying Notes, which are an integral part of the Financial Statements.
Consumer Discretionary Index Fund
Financial Highlights
| ETF Shares | | | | | |
| | | | | | |
| For a Share Outstanding | Year Ended August 31, |
| Throughout Each Period | 2020 | 2019 | 2018 | 2017 | 2016 |
| Net Asset Value, Beginning of Period | $178.51 | $180.85 | $141.74 | $126.45 | $120.80 |
| Investment Operations | | | | | |
| Net Investment Income | 1.9981 | 2.0521 | 2.0661 | 2.0681 | 1.875 |
| Net Realized and Unrealized Gain (Loss) on Investments | 68.603 | (2.391) | 39.031 | 15.248 | 6.259 |
| Total from Investment Operations | 70.601 | (.339) | 41.097 | 17.316 | 8.134 |
| Distributions | | | | | |
| Dividends from Net Investment Income | (2.251) | (2.001) | (1.987) | (2.026) | (2.484) |
| Distributions from Realized Capital Gains | — | — | — | — | — |
| Total Distributions | (2.251) | (2.001) | (1.987) | (2.026) | (2.484) |
| Net Asset Value, End of Period | $246.86 | $178.51 | $180.85 | $141.74 | $126.45 |
| | | | | | |
| Total Return | 39.98% | -0.14% | 29.22% | 13.81% | 6.84% |
| | | | | | |
| Ratios/Supplemental Data | | | | | |
| Net Assets, End of Period (Millions) | $4,026 | $3,049 | $3,199 | $2,198 | $1,926 |
| Ratio of Total Expenses to Average Net Assets | 0.10% | 0.10% | 0.10% | 0.10% | 0.10% |
| Ratio of Net Investment Income to Average Net Assets | 1.06% | 1.20% | 1.28% | 1.53% | 1.54% |
| Portfolio Turnover Rate2 | 10% | 9% | 28% | 6% | 7% |
| 1 | Calculated based on average shares outstanding. |
| 2 | Excludes the value of portfolio securities received or delivered as a result of in-kind purchases or redemptions of the fund’s capital shares, including ETF Creation Units. |
Admiral Shares
| For a Share Outstanding | Year Ended August 31, |
| Throughout Each Period | 2020 | 2019 | 2018 | 2017 | 2016 |
| Net Asset Value, Beginning of Period | $92.40 | $93.61 | $73.36 | $65.45 | $62.53 |
| Investment Operations | | | | | |
| Net Investment Income | 1.0331 | 1.0581 | 1.0731 | 1.0711 | .971 |
| Net Realized and Unrealized Gain (Loss) on Investments | 35.512 | (1.232) | 20.205 | 7.890 | 3.239 |
| Total from Investment Operations | 36.545 | (.174) | 21.278 | 8.961 | 4.210 |
| Distributions | | | | | |
| Dividends from Net Investment Income | (1.165) | (1.036) | (1.028) | (1.051) | (1.290) |
| Distributions from Realized Capital Gains | — | — | — | — | — |
| Total Distributions | (1.165) | (1.036) | (1.028) | (1.051) | (1.290) |
| Net Asset Value, End of Period | $127.78 | $92.40 | $93.61 | $73.36 | $65.45 |
| | | | | | |
| Total Return2 | 40.01% | -0.14% | 29.24% | 13.81% | 6.83% |
| | | | | | |
| Ratios/Supplemental Data | | | | | |
| Net Assets, End of Period (Millions) | $437 | $321 | $328 | $204 | $169 |
| Ratio of Total Expenses to Average Net Assets | 0.10% | 0.10% | 0.10% | 0.10% | 0.10% |
| Ratio of Net Investment Income to Average Net Assets | 1.06% | 1.20% | 1.28% | 1.53% | 1.54% |
| Portfolio Turnover Rate3 | 10% | 9% | 28% | 6% | 7% |
| 1 | Calculated based on average shares outstanding. |
| 2 | Total returns do not include account service fees that may have applied in the periods shown. Fund prospectuses provide information about any applicable account service fees. |
| 3 | Excludes the value of portfolio securities received or delivered as a result of in-kind purchases or redemptions of the fund’s capital shares, including ETF Creation Units. |
See accompanying Notes, which are an integral part of the Financial Statements.
Consumer Discretionary Index Fund
Notes to Financial Statements
Vanguard Consumer Discretionary Index Fund is registered under the Investment Company Act of 1940 as an open-end investment company, or mutual fund. The fund offers two classes of shares: ETF Shares and Admiral Shares. Each of the share classes has different eligibility and minimum purchase requirements, and is designed for different types of investors. ETF Shares are listed for trading on NYSE Arca; they can be purchased and sold through a broker.
Market disruptions associated with the COVID-19 pandemic have had a global impact, and uncertainty exists as to the long-term implications. Such disruptions can adversely affect assets of the fund and thus fund performance.
A. The following significant accounting policies conform to generally accepted accounting principles for U.S. investment companies. The fund consistently follows such policies in preparing its financial statements.
1. Security Valuation: Securities are valued as of the close of trading on the New York Stock Exchange (generally 4 p.m., Eastern time) on the valuation date. Equity securities are valued at the latest quoted sales prices or official closing prices taken from the primary market in which each security trades; such securities not traded on the valuation date are valued at the mean of the latest quoted bid and asked prices. Securities for which market quotations are not readily available, or whose values have been materially affected by events occurring before the fund’s pricing time but after the close of the securities’ primary markets, are valued by methods deemed by the board of trustees to represent fair value. Investments in Vanguard Market Liquidity Fund are valued at that fund’s net asset value.
2. Futures Contracts: The fund uses index futures contracts to a limited extent, with the objectives of maintaining full exposure to the stock market, maintaining liquidity, and minimizing transaction costs. The fund may purchase futures contracts to immediately invest incoming cash in the market, or sell futures in response to cash outflows, thereby simulating a fully invested position in the underlying index while maintaining a cash balance for liquidity. The primary risks associated with the use of futures contracts are imperfect correlation between changes in market values of stocks held by the fund and the prices of futures contracts, and the possibility of an illiquid market. Counterparty risk involving futures is mitigated because a regulated clearinghouse is the counterparty instead of the clearing broker. To further mitigate counterparty risk, the fund trades futures contracts on an exchange, monitors the financial strength of its clearing brokers and clearinghouse, and has entered into clearing agreements with its clearing brokers. The clearinghouse imposes initial margin requirements to secure the fund’s performance and requires daily settlement of variation margin representing changes in the market value of each contract. Any securities pledged as initial margin for open contracts are noted in the Schedule of Investments.
Futures contracts are valued at their quoted daily settlement prices. The notional amounts of the contracts are not recorded in the Statement of Assets and Liabilities. Fluctuations in the value of the contracts are recorded in the Statement of Assets and Liabilities as an asset (liability) and in the Statement of Operations as unrealized appreciation (depreciation) until the contracts are closed, when they are recorded as realized gains (losses) on futures contracts.
During the year ended August 31, 2020, the fund’s average investments in long and short futures contracts represented less than 1% and 0% of net assets, respectively, based on the average of the notional amounts at each quarter-end during the period.
3. Swap Contracts: The fund has entered into equity swap contracts to earn the total return on selected reference stocks in the fund’s target index. Under the terms of the swaps, the fund receives the total return on the referenced stock (i.e., receiving the increase or paying the decrease in value of the selected reference stock and receiving the equivalent of any dividends in respect of the selected referenced stock) over a specified period of time, applied to a notional amount that represents the value of a designated number of shares of the selected reference stock at the beginning of the equity swap contract. The fund also pays a floating rate that is based on short-term interest rates, applied to the notional amount. At the same time, the fund generally invests an amount approximating the notional amount of the swap in high-quality temporary cash investments.
A risk associated with all types of swaps is the possibility that a counterparty may default on its obligation to pay net amounts due to the fund. The fund’s maximum amount subject to counterparty risk is the unrealized appreciation on the swap contract. The fund mitigates its counterparty risk by entering into swaps only with a diverse group of prequalified counterparties, monitoring their financial strength, entering into master netting arrangements with its counterparties, and requiring its counterparties to transfer collateral as security for their performance. In the absence of a default,
Consumer Discretionary Index Fund
the collateral pledged or received by the fund cannot be repledged, resold, or rehypothecated. In the event of a counterparty’s default (including bankruptcy), the fund may terminate any swap contracts with that counterparty, determine the net amount owed by either party in accordance with its master netting arrangements, and sell or retain any collateral held up to the net amount owed to the fund under the master netting arrangements. The swap contracts contain provisions whereby a counterparty may terminate open contracts if the fund’s net assets decline below a certain level, triggering a payment by the fund if the fund is in a net liability position at the time of the termination. The payment amount would be reduced by any collateral the fund has pledged. Any securities pledged as collateral for open contracts are noted in the Schedule of Investments. The value of collateral received or pledged is compared daily to the value of the swap contracts exposure with each counterparty, and any difference, if in excess of a specified minimum transfer amount, is adjusted and settled within two business days.
The notional amounts of swap contracts are not recorded in the Statement of Assets and Liabilities. Swaps are valued daily based on market quotations received from independent pricing services or recognized dealers and the change in value is recorded in the Statement of Assets and Liabilities as an asset (liability) and in the Statement of Operations as unrealized appreciation (depreciation) until periodic payments are made or the termination of the swap, at which time realized gain (loss) is recorded.
During the year ended August 31, 2020, the fund’s average amounts of investments in total return swaps represented less than 1% of net assets, based on the average of notional amounts at each quarter-end during the period.
4. Federal Income Taxes: The fund intends to continue to qualify as a regulated investment company and distribute all of its taxable income. The fund’s tax returns are open to examination by the relevant tax authorities until expiration of the applicable statute of limitations, which is generally three years after the filing of the tax return. Management has analyzed the fund’s tax positions taken for all open federal and state income tax years, and has concluded that no provision for income tax is required in the fund’s financial statements.
5. Distributions: Distributions to shareholders are recorded on the ex-dividend date. Distributions are determined on a tax basis at the fiscal year-end and may differ from net investment income and realized capital gains for financial reporting purposes.
6. Securities Lending: To earn additional income, the fund lends its securities to qualified institutional borrowers. Security loans are subject to termination by the fund at any time, and are required to be secured at all times by collateral in an amount at least equal to the market value of securities loaned. Daily market fluctuations could cause the value of loaned securities to be more or less than the value of the collateral received. When this occurs, the collateral is adjusted and settled before the opening of the market on the next business day. The fund further mitigates its counterparty risk by entering into securities lending transactions only with a diverse group of prequalified counterparties, monitoring their financial strength, and entering into master securities lending agreements with its counterparties. The master securities lending agreements provide that, in the event of a counterparty’s default (including bankruptcy), the fund may terminate any loans with that borrower, determine the net amount owed, and sell or retain the collateral up to the net amount owed to the fund; however, such actions may be subject to legal proceedings. While collateral mitigates counterparty risk, in the event of a default, the fund may experience delays and costs in recovering the securities loaned. The fund invests cash collateral received in Vanguard Market Liquidity Fund, and records a liability in the Statement of Assets and Liabilities for the return of the collateral, during the period the securities are on loan. Collateral investments in Vanguard Market Liquidity Fund are subject to market appreciation or depreciation. Securities lending income represents fees charged to borrowers plus income earned on invested cash collateral, less expenses associated with the loan. During the term of the loan, the fund is entitled to all distributions made on or in respect of the loaned securities.
7. Credit Facilities and Interfund Lending Program: The fund and certain other funds managed by The Vanguard Group (“Vanguard”) participate in a $4.3 billion committed credit facility provided by a syndicate of lenders pursuant to a credit agreement and an uncommitted credit facility provided by Vanguard. Both facilities may be renewed annually. Each fund is individually liable for its borrowings, if any, under the credit facilities. Borrowings may be utilized for temporary or emergency purposes, subject to the fund’s regulatory and contractual borrowing restrictions. With respect to the committed credit facility, the participating funds are charged administrative fees and an annual commitment fee of 0.10% of the undrawn committed amount of the facility; these fees are allocated to the funds based on a method approved by the fund’s board of trustees and included in Management and
Consumer Discretionary Index Fund
Administrative expenses on the fund’s Statement of Operations. Any borrowings under either facility bear interest at a rate based upon the higher of the one-month London Interbank Offered Rate (or an acceptable alternate rate, if necessary), federal funds effective rate, or overnight bank funding rate plus an agreed-upon spread, except that borrowings under the uncommitted credit facility may bear interest based upon an alternative rate agreed to by the fund and Vanguard.
In accordance with an exemptive order (the “Order”) from the SEC, the fund may participate in a joint lending and borrowing program that allows registered open-end Vanguard funds to borrow money from and lend money to each other for temporary or emergency purposes (the “Interfund Lending Program”), subject to compliance with the terms and conditions of the Order, and to the extent permitted by the fund’s investment objective and investment policies. Interfund loans and borrowings normally extend overnight, but can have a maximum duration of seven days. Loans may be called on one business day’s notice. The interest rate to be charged is governed by the conditions of the Order and internal procedures adopted by the board of trustees. The board of trustees is responsible for overseeing the Interfund Lending Program.
For the year ended August 31, 2020, the fund did not utilize the credit facilities or the Interfund Lending Program.
8. Other: Dividend income is recorded on the ex-dividend date. Interest income includes income distributions received from Vanguard Market Liquidity Fund and is accrued daily. Security transactions are accounted for on the date securities are bought or sold. Costs used to determine realized gains (losses) on the sale of investment securities are those of the specific securities sold.
Each class of shares has equal rights as to assets and earnings, except that each class separately bears certain class-specific expenses related to maintenance of shareholder accounts (included in Management and Administrative expenses) and shareholder reporting. Marketing and distribution expenses are allocated to each class of shares based on a method approved by the board of trustees. Income, other non-class-specific expenses, and gains and losses on investments are allocated to each class of shares based on its relative net assets.
B. In accordance with the terms of a Funds’ Service Agreement (the “FSA”) between Vanguard and the fund, Vanguard furnishes to the fund investment advisory, corporate management, administrative, marketing, and distribution services at Vanguard’s cost of operations (as defined by the FSA). These costs of operations are allocated to the fund based on methods and guidelines approved by the board of trustees and are generally settled twice a month.
Upon the request of Vanguard, the fund may invest up to 0.40% of its net assets as capital in Vanguard. At August 31, 2020, the fund had contributed to Vanguard capital in the amount of $165,000, representing less than 0.01% of the fund’s net assets and 0.07% of Vanguard’s capital received pursuant to the FSA. The fund’s trustees and officers are also directors and employees, respectively, of Vanguard.
C. The fund’s custodian bank has agreed to reduce its fees when the fund maintains cash on deposit in the non-interest-bearing custody account. For the year ended August 31, 2020, custodian fee offset arrangements reduced the fund’s expenses by $5,000 (an annual rate of less than 0.01% of average net assets).
D. Various inputs may be used to determine the value of the fund’s investments and derivatives. These inputs are summarized in three broad levels for financial statement purposes. The inputs or methodologies used to value securities are not necessarily an indication of the risk associated with investing in those securities.
Level 1—Quoted prices in active markets for identical securities.
Level 2—Other significant observable inputs (including quoted prices for similar securities, interest rates, prepayment speeds, credit risk, etc.).
Level 3—Significant unobservable inputs (including the fund’s own assumptions used to determine the fair value of investments). Any investments and derivatives valued with significant unobservable inputs are noted on the Schedule of Investments.
Consumer Discretionary Index Fund
The following table summarizes the market value of the fund’s investments and derivatives as of August 31, 2020, based on the inputs used to value them:
| | Level 1 | | Level 2 | | Level 3 | | Total | |
| | ($000 | ) | ($000 | ) | ($000 | ) | ($000 | ) |
| Investments | | | | | | | | |
| Assets | | | | | | | | |
| Common Stocks | 4,386,327 | | — | | 3 | | 4,386,330 | |
| Temporary Cash Investments | 72,450 | | — | | — | | 72,450 | |
| Total | 4,458,777 | | — | | 3 | | 4,458,780 | |
| Derivative Financial Instruments | | | | | | | | |
| Assets | | | | | | | | |
| Swap Contracts | — | | 19,676 | | — | | 19,676 | |
| Liabilities | | | | | | | | |
| Futures Contracts1 | 3 | | — | | — | | 3 | |
1 Represents variation margin on the last day of the reporting period.
E. Permanent differences between book-basis and tax-basis components of net assets are reclassified among capital accounts in the financial statements to reflect their tax character. These reclassifications have no effect on net assets or net asset value per share. As of period end, permanent differences primarily attributable to the accounting for in-kind redemptions and swap agreements were reclassified between the following accounts:
| | Amount | |
| | ($000 | ) |
| Paid-in Capital | 457,054 | |
| Total Distributable Earnings (Loss) | (457,054 | ) |
Temporary differences between book-basis and tax-basis components of total distributable earnings (loss) arise when certain items of income, gain, or loss are recognized in different periods for financial statement and tax purposes; these differences will reverse at some time in the future. The differences are primarily related to the deferral of losses from wash sales and the recognition of unrealized gains or losses from certain derivative contracts. As of period end, the tax-basis components of total distributable earnings (loss) are detailed in the table as follows:
| | Amount | |
| | ($000 | ) |
| Undistributed Ordinary Income | 69,599 | |
| Undistributed Long-Term Gains | — | |
| Capital Loss Carryforwards | (121,800 | ) |
| Qualified Late-Year Losses | — | |
| Net Unrealized Gains (Losses) | 1,154,677 | |
The tax character of distributions paid was as follows:
| | Year Ended August 31, | |
| | 2020 | | 2019 | |
| | Amount | | Amount | |
| | ($000 | ) | ($000 | ) |
| Ordinary Income* | 40,029 | | 37,972 | |
| Long-Term Capital Gains | — | | — | |
| Total | 40,029 | | 37,972 | |
* Includes short-term capital gains, if any.
Consumer Discretionary Index Fund
As of August 31, 2020, gross unrealized appreciation and depreciation for investments and derivatives based on cost for U.S. federal income tax purposes were as follows:
| | Amount | |
| | ($000 | ) |
| Tax Cost | 3,304,103 | |
| Gross Unrealized Appreciation | 1,493,138 | |
| Gross Unrealized Depreciation | (338,461 | ) |
| Net Unrealized Appreciation (Depreciation) | 1,154,677 | |
F. During the year ended August 31, 2020, the fund purchased $1,258,205,000 of investment securities and sold $1,334,703,000 of investment securities, other than temporary cash investments. Purchases and sales include $889,114,000 and $995,849,000, respectively, in connection with in-kind purchases and redemptions of the fund’s capital shares.
G. Capital share transactions for each class of shares were:
| | | | | | Year Ended August 31, | |
| | | | 2020 | | | | 2019 | |
| | Amount | | Shares | | Amount | | Shares | |
| | ($000 | ) | (000 | ) | ($000 | ) | (000 | ) |
| ETF Shares | | | | | | | | |
| Issued | 928,490 | | 4,882 | | 625,380 | | 3,592 | |
| Issued in Lieu of Cash Distributions | — | | — | | — | | — | |
| Redeemed | (1,003,299 | ) | (5,650 | ) | (681,292 | ) | (4,200 | ) |
| Net Increase (Decrease)—ETF Shares | (74,809 | ) | (768 | ) | (55,912 | ) | (608 | ) |
| Admiral Shares | | | | | | | | |
| Issued | 134,048 | | 1,375 | | 108,968 | | 1,234 | |
| Issued in Lieu of Cash Distributions | 3,403 | | 36 | | 3,235 | | 36 | |
| Redeemed | (134,606 | ) | (1,465 | ) | (113,932 | ) | (1,303 | ) |
| Net Increase (Decrease)—Admiral Shares | 2,845 | | (54 | ) | (1,729 | ) | (33 | ) |
H. Management has determined that no events or transactions occurred subsequent to August 31, 2020, that would require recognition or disclosure in these financial statements.
Consumer Staples Index Fund
Performance Summary
All of the returns in this report represent past performance, which is not a guarantee of future results that may be achieved by the fund. (Current performance may be lower or higher than the performance data cited. For performance data current to the most recent month-end, visit our website at vanguard.com/performance.) Note, too, that both investment returns and principal value can fluctuate widely, so an investor’s shares, when sold, could be worth more or less than their original cost. The returns shown do not reflect taxes that a shareholder would pay on fund distributions or on the sale of fund shares.
Cumulative Performance: August 31, 2010–August 31, 2020
Initial Investment of $10,000
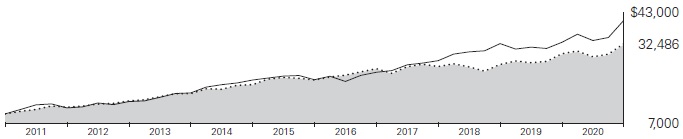
| | | | Average Annual Total Returns | Final Value |
| | | | Periods Ended August 31, 2020 | of a $10,000 |
| | | One Year | Five Years | Ten Years | Investment |
 | Consumer Staples Index Fund ETF Shares Net Asset Value | 11.01% | 9.25% | 12.50% | $32,486 |
| | Consumer Staples Index Fund ETF Shares Market Price | 11.08 | 9.26 | 12.52 | 32,540 |
 | MSCI US IMI/Consumer Staples 25/50 | 11.12 | 9.34 | 12.63 | 32,854 |
 | MSCI US IMI/2500 | 21.48 | 13.88 | 14.99 | 40,426 |
| | | | | | |
| | | | | | Final Value |
| | | | | | of a $100,000 |
| | | One Year | Five Years | Ten Years | Investment |
| Consumer Staples Index Fund Admiral Shares | 11.03% | 9.25% | 12.51% | $325,107 |
| MSCI US IMI/Consumer Staples 25/50 | 11.12 | 9.34 | 12.63 | 328,542 |
| MSCI US IMI/2500 | 21.48 | 13.88 | 14.99 | 404,265 |
Cumulative Returns: ETF Shares, August 31, 2010–August 31, 2020
| | One Year | Five Years | Ten Years |
| Consumer Staples Index Fund ETF Shares Market Price | 11.08% | 55.72% | 225.40% |
| Consumer Staples Index Fund ETF Shares Net Asset Value | 11.01 | 55.64 | 224.86 |
| MSCI US IMI/Consumer Staples 25/50 | 11.12 | 56.26 | 228.54 |
For the ETF Shares, the market price is determined by the midpoint of the bid-offer spread as of the closing time of the New York Stock Exchange (generally 4 p.m., Eastern time). The net asset value is also determined as of the NYSE closing time. For more information about how the ETF Shares’ market prices have compared with their net asset value, visit vanguard.com, select your ETF, and then select the Price and Performance tab. The ETF premium/discount analysis there shows the percentages of days on which the ETF Shares’ market price was above or below the NAV.
See Financial Highlights for dividend and capital gains information.
Consumer Staples Index Fund
Fund Allocation
As of August 31, 2020
| Agricultural Products | 2.3% |
| Brewers | 0.9 |
| Distillers & Vintners | 2.7 |
| Drug Retail | 1.6 |
| Food Distributors | 2.3 |
| Food Retail | 2.3 |
| Household Products | 25.0 |
| Hypermarkets & Super Centers | 14.0 |
| Packaged Foods & Meats | 16.9 |
| Personal Products | 3.6 |
| Soft Drinks | 20.1 |
| Tobacco | 8.3 |
The table reflects the fund’s investments, except for short-term investments and derivatives. Sector categories are based on the Global Industry Classification Standard (“GICS”), except for the “Other” category (if applicable), which includes securities that have not been provided a GICS classification as of the effective reporting period.
The fund may invest in derivatives (such as futures and swap contracts) for various reasons, including, but not limited to, attempting to remain fully invested and tracking its target index as closely as possible.
The Global Industry Classification Standard (“GICS”) was developed by and is the exclusive property and a service mark of MSCI Inc. (“MSCI”) and Standard and Poor’s, a division of McGraw-Hill Companies, Inc. (“S&P”), and is licensed for use by Vanguard. Neither MSCI, S&P nor any third party involved in making or compiling the GICS or any GICS classification makes any express or implied warranties or representations with respect to such standard or classification (or the results to be obtained by the use thereof), and all such parties hereby expressly disclaim all warranties of originality, accuracy, completeness, merchantability or fitness for a particular purpose with respect to any such standard or classification. Without limiting any of the foregoing, in no event shall MSCI, S&P, any of its affiliates or any third party involved in making or compiling the GICS or any GICS classification have any liability for any direct, indirect, special, punitive, consequential or any other damages (including lost profits) even if notified of the possibility of such damages.
Consumer Staples Index Fund
Financial Statements
Schedule of Investments
As of August 31, 2020
The fund files its complete schedule of portfolio holdings with the Securities and Exchange Commission (SEC) for the first and third quarters of each fiscal year as an exhibit to its reports on Form N-PORT. The fund’s Form N-PORT reports are available on the SEC’s website at www.sec.gov.
| | | | | Market |
| | | | | Value· |
| | | Shares | | ($000) |
| Common Stocks (99.6%) | | | |
| Beverages (23.5%) | | | |
| | Coca-Cola Co. | 12,089,815 | | 598,808 |
| | PepsiCo Inc. | 4,120,358 | | 577,097 |
| * | Monster Beverage Corp. | 1,275,415 | | 106,956 |
| | Constellation Brands Inc. Class A | 524,782 | | 96,812 |
| | Brown-Forman Corp. Class B | 982,541 | | 71,892 |
| * | Boston Beer Co. Inc. Class A | 39,427 | | 34,774 |
| | Molson Coors Beverage Co. Class B | 619,423 | | 23,315 |
| | Coca-Cola Consolidated Inc. | 28,825 | | 7,878 |
| *,^ | National Beverage Corp. | 85,140 | | 6,924 |
| | MGP Ingredients Inc. | 81,396 | | 2,894 |
| *,^ | NewAge Inc. | 702,327 | | 1,524 |
| | | | | 1,528,874 |
| Food & Staples Retailing (20.0%) | | |
| | Walmart Inc. | 4,195,928 | | 582,604 |
| | Costco Wholesale Corp. | 842,245 | | 292,815 |
| | Sysco Corp. | 1,626,475 | | 97,816 |
| | Kroger Co. | 2,695,579 | | 96,178 |
| | Walgreens Boots Alliance Inc. | 2,495,481 | | 94,878 |
| | Casey’s General Stores Inc. | 137,547 | | 24,463 |
| * | BJ’s Wholesale Club Holdings Inc. | 483,942 | | 21,492 |
| * | US Foods Holding Corp. | 727,019 | | 17,703 |
| * | Performance Food Group Co. | 428,043 | | 15,628 |
| * | Sprouts Farmers Market Inc. | 538,353 | | 12,570 |
| | PriceSmart Inc. | 117,618 | | 7,733 |
| * | United Natural Foods Inc. | 382,029 | | 6,896 |
| * | Rite Aid Corp. | 451,054 | | 5,873 |
| | Weis Markets Inc. | 115,674 | | 5,695 |
| | SpartanNash Co. | 282,871 | | 5,652 |
| | Ingles Markets Inc. Class A | 124,916 | | 5,047 |
| * | Chefs’ Warehouse Inc. | 259,970 | | 3,850 |
| | Andersons Inc. | 181,726 | | 3,222 |
| | Village Super Market Inc. Class A | 102,774 | | 2,614 |
| * | Grocery Outlet Holding Corp. | 42,248 | | 1,738 |
| | | | | 1,304,467 |
| Food Products (19.2%) | | | |
| | Mondelez International Inc. Class A | 4,501,084 | | 262,953 |
| | General Mills Inc. | 1,855,771 | | 118,677 |
| | Archer-Daniels-Midland Co. | 1,822,265 | | 81,565 |
| | Kraft Heinz Co. | 2,111,104 | | 73,973 |
| | Hershey Co. | 468,616 | | 69,655 |
| | McCormick & Co. Inc. | 313,016 | | 64,544 |
| | Conagra Brands Inc. | 1,622,718 | | 62,247 |
| | Tyson Foods Inc. Class A | 942,661 | | 59,199 |
| | Kellogg Co. | 826,648 | | 58,618 |
| | Hormel Foods Corp. | 956,295 | | 48,752 |
| | J M Smucker Co. | 365,300 | | 43,902 |
| | Lamb Weston Holdings Inc. | 482,677 | | 30,336 |
| * | Freshpet Inc. | 241,665 | | 27,453 |
| * | Darling Ingredients Inc. | 741,048 | | 23,691 |
| | Campbell Soup Co. | 425,071 | | 22,363 |
| | Bunge Ltd. | 476,713 | | 21,748 |
| * | Post Holdings Inc. | 218,722 | | 19,252 |
| | Ingredion Inc. | 237,010 | | 19,065 |
| | Flowers Foods Inc. | 690,785 | | 16,897 |
| | Lancaster Colony Corp. | 79,481 | | 14,125 |
| * | Hain Celestial Group Inc. | 392,671 | | 12,876 |
| | Sanderson Farms Inc. | 95,747 | | 11,199 |
| * | Simply Good Foods Co. | 405,622 | | 10,080 |
| | B&G Foods Inc. | 318,076 | | 9,905 |
| * | TreeHouse Foods Inc. | 214,563 | | 9,185 |
| | J&J Snack Foods Corp. | 66,809 | | 9,083 |
| * | Hostess Brands Inc. Class A | 613,955 | | 7,883 |
| * | Cal-Maine Foods Inc. | 186,640 | | 7,202 |
| | Calavo Growers Inc. | 91,805 | | 5,827 |
| * | Pilgrim’s Pride Corp. | 320,681 | | 5,131 |
| | Tootsie Roll Industries Inc. | 159,673 | | 5,108 |
| | John B Sanfilippo & Son Inc. | 58,887 | | 4,690 |
| | Fresh Del Monte Produce Inc. | 185,089 | | 4,292 |
| * | Landec Corp. | 316,961 | | 3,246 |
| * | Farmer Bros Co. | 124,338 | | 782 |
| * | Beyond Meat Inc. | 5,590 | | 759 |
| | Limoneira Co. | 16,552 | | 239 |
| | | | 1,246,502 |
| Household Products (25.0%) | | | |
| | Procter & Gamble Co. | 7,418,645 | | 1,026,221 |
| | Colgate-Palmolive Co. | 2,555,731 | | 202,567 |
| | Kimberly-Clark Corp. | 1,093,283 | | 172,476 |
| | Clorox Co. | 405,672 | | 90,668 |
| | Church & Dwight Co. Inc. | 831,805 | | 79,712 |
| | WD-40 Co. | 69,065 | | 14,115 |
| | Spectrum Brands Holdings Inc | 203,806 | | 12,147 |
| | Energizer Holdings Inc. | 259,295 | | 12,003 |
| * | Central Garden & Pet Co.Class A | 280,131 | | 10,410 |
| * | Central Garden & Pet Co. | 116,722 | | 4,749 |
| | Reynolds Consumer Products Inc. | 13,317 | | 443 |
| | | | | 1,625,511 |
| Personal Products (3.6%) | | | |
| | Estee Lauder Cos. Inc. Class A | 695,490 | | 154,204 |
| *,^ | Herbalife Nutrition Ltd. | 450,688 | | 22,151 |
| | Medifast Inc. | 110,603 | | 17,997 |
| | Nu Skin Enterprises Inc. Class A | 237,677 | | 11,235 |
| * | Edgewell Personal Care Co. | 244,197 | | 7,011 |
| | Inter Parfums Inc. | 146,664 | | 6,552 |
| * | USANA Health Sciences Inc. | 75,716 | | 5,937 |
| * | elf Beauty Inc. | 264,753 | | 5,171 |
| | Coty Inc. Class A | 1,110,954 | | 3,977 |
| * | BellRing Brands Inc. Class A | 10,691 | | 208 |
| | | | | 234,443 |
| Tobacco (8.3%) | | | |
| | Philip Morris International Inc. | 3,648,353 | | 291,102 |
| | Altria Group Inc. | 5,368,987 | | 234,840 |
| | Vector Group Ltd. | 649,080 | | 6,536 |
| | Universal Corp. | 125,816 | | 5,462 |
| | Turning Point Brands Inc. | 23,995 | | 693 |
| | | | | 538,633 |
Total Common Stocks
(Cost $5,640,230) | | | 6,478,430 |
| Temporary Cash Investment (0.4%) | | |
| 1,2 | Vanguard Market Liquidity Fund, 0.147% (Cost $27,476) | 274,793 | | 27,479 |
Total Investments (100.0%)
(Cost $5,667,706) | | | 6,505,909 |
| Other Assets and Liabilities—Net (0.0%) | | | (3,124) |
| Net Assets (100%) | | | 6,502,785 |
Cost is in $000.
| · | See Note A in Notes to Financial Statements. |
| * | Non-income-producing security. |
| ^ | Includes partial security positions on loan to broker-dealers. The total value of securities on loan is $10,485,000. |
| 1 | Affiliated money market fund available only to Vanguard funds and certain trusts and accounts managed by Vanguard. Rate shown is the 7-day yield. |
| 2 | Collateral of $10,904,000 was received for securities on loan. |
Consumer Staples Index Fund
| Derivative Financial Instruments Outstanding as of Period End |
| |
| Over-the-Counter Total Return Swaps |
| | | | | Floating | | |
| | | | | Interest Rate | Value and | Value and |
| | | | Notional | Received | Unrealized | Unrealized |
| | Termination | | Amount | (Paid)1 | Appreciation | (Depreciation) |
| Reference Entity | Date | Counterparty | ($000) | (%) | ($000) | ($000) |
| Campbell Soup Co. | 2/2/21 | GSI | (9,149) | 0.161 | 57 | — |
| McCormick & Co. Inc. | 2/2/21 | GSI | (15,172) | 0.161 | 292 | — |
| | | | | | 349 | — |
| 1 | Based on 1-month USD London Interbank Offered Rate (LIBOR) as of the most recent payment date. Floating interest payment received/ paid monthly. |
GSI—Goldman Sachs International.
At August 31, 2020, a counterparty had deposited in a segregated account securities with a value of $472,000 in connection with open over-the-counter swap contracts.
See accompanying Notes, which are an integral part of the Financial Statements.
Consumer Staples Index Fund
| Statement of Assets and Liabilities | |
| As of August 31, 2020 | |
| | |
| ($000s, except shares and per-share amounts) | Amount |
| Assets | |
| Investments in Securities, at Value | |
| Unaffiliated Issuers (Cost $5,640,230) | 6,478,430 |
| Affiliated Issuers (Cost $27,476) | 27,479 |
| Total Investments in Securities | 6,505,909 |
| Investment in Vanguard | 268 |
| Receivables for Investment Securities Sold | 5,704 |
| Receivables for Accrued Income | 8,631 |
| Receivables for Capital Shares Issued | 570 |
| Unrealized Appreciation—Over-the-Counter Swap Contracts | 349 |
| Total Assets | 6,521,431 |
| Liabilities | |
| Payables for Investment Securities Purchased | 5,706 |
| Collateral for Securities on Loan | 10,904 |
| Payables for Capital Shares Redeemed | 1,720 |
| Payables to Vanguard | 316 |
| Total Liabilities | 18,646 |
| Net Assets | 6,502,785 |
| | |
| | |
| At August 31, 2020, net assets consisted of: | |
| | |
| Paid-in Capital | 5,761,693 |
| Total Distributable Earnings (Loss) | 741,092 |
| Net Assets | 6,502,785 |
| | |
| ETF Shares—Net Assets | |
| Applicable to 34,140,925 outstanding $.001 par value shares of beneficial interest (unlimited authorization) | 5,712,080 |
| Net Asset Value Per Share—ETF Shares | $167.31 |
| | |
| Admiral Shares—Net Assets | |
| Applicable to 9,584,770 outstanding $.001 par value shares of beneficial interest (unlimited authorization) | 790,705 |
| Net Asset Value Per Share—Admiral Shares | $82.50 |
See accompanying Notes, which are an integral part of the Financial Statements.
Consumer Staples Index Fund
Statement of Operations
| | Year Ended |
| | August 31, 2020 |
| | ($000) |
| Investment Income | |
| Income | |
| Dividends | 161,760 |
| Interest1 | 160 |
| Securities Lending—Net | 676 |
| Total Income | 162,596 |
| Expenses | |
| The Vanguard Group—Note B | |
| Investment Advisory Services | 907 |
| Management and Administrative—ETF Shares | 3,747 |
| Management and Administrative—Admiral Shares | 552 |
| Marketing and Distribution—ETF Shares | 298 |
| Marketing and Distribution—Admiral Shares | 52 |
| Custodian Fees | 7 |
| Auditing Fees | 32 |
| Shareholders’ Reports—ETF Shares | 447 |
| Shareholders’ Reports—Admiral Shares | 20 |
| Trustees’ Fees and Expenses | 4 |
| Total Expenses | 6,066 |
| Expenses Paid Indirectly | (2) |
| Net Expenses | 6,064 |
| Net Investment Income | 156,532 |
| Realized Net Gain (Loss) | |
| Investment Securities Sold1,2 | 305,878 |
| Futures Contracts | 35 |
| Swap Contracts | 5,482 |
| Realized Net Gain (Loss) | 311,395 |
| Change in Unrealized Appreciation (Depreciation) | |
| Investment Securities1 | 172,262 |
| Swap Contracts | (370) |
| Change in Unrealized Appreciation (Depreciation) | 171,892 |
| Net Increase (Decrease) in Net Assets Resulting from Operations | 639,819 |
| 1 | Interest income, realized net gain (loss), and change in unrealized appreciation (depreciation) from an affiliated company of the fund were $160,000, ($2,000), and $3,000, respectively. Purchases and sales are for temporary cash investment purposes. |
| 2 | Includes $312,368,000 of net gain (loss) resulting from in-kind redemptions. |
Statement of Changes in Net Assets
| | Year Ended August 31, |
| | 2020 | 2019 |
| | ($000) | ($000) |
| Increase (Decrease) in Net Assets | | |
| Operations | | |
| Net Investment Income | 156,532 | 141,158 |
| Realized Net Gain (Loss) | 311,395 | 115,413 |
| Change in Unrealized Appreciation (Depreciation) | 171,892 | 408,242 |
| Net Increase (Decrease) in Net Assets Resulting from Operations | 639,819 | 664,813 |
| Distributions1 | | |
| ETF Shares | (139,853) | (116,549) |
| Admiral Shares | (19,295) | (15,822) |
| Total Distributions | (159,148) | (132,371) |
| Capital Share Transactions | | |
| ETF Shares | (5,661) | 844,523 |
| Admiral Shares | 22,460 | 58,390 |
| Net Increase (Decrease) from Capital Share Transactions | 16,799 | 902,913 |
| Total Increase (Decrease) | 497,470 | 1,435,355 |
| Net Assets | | |
| Beginning of Period | 6,005,315 | 4,569,960 |
| End of Period | 6,502,785 | 6,005,315 |
1 Certain prior-period numbers have been reclassified to conform with current period presentation.
See accompanying Notes, which are an integral part of the Financial Statements.
Consumer Staples Index Fund
Financial Highlights
| ETF Shares | | | | | |
| | | | | | |
| For a Share Outstanding | | | Year Ended August 31, |
| Throughout Each Period | 2020 | 2019 | 2018 | 2017 | 2016 |
| Net Asset Value, Beginning of Period | $154.72 | $140.13 | $140.15 | $139.97 | $123.72 |
| Investment Operations | | | | | |
| Net Investment Income | 3.9921 | 3.8961 | 3.6031 | 3.6511 | 3.189 |
| Net Realized and Unrealized Gain (Loss) on Investments | 12.658 | 14.346 | (.033) | .212 | 17.752 |
| Total from Investment Operations | 16.650 | 18.242 | 3.570 | 3.863 | 20.941 |
| Distributions | | | | | |
| Dividends from Net Investment Income | (4.060) | (3.652) | (3.590) | (3.683) | (4.691) |
| Distributions from Realized Capital Gains | — | — | — | — | — |
| Total Distributions | (4.060) | (3.652) | (3.590) | (3.683) | (4.691) |
| Net Asset Value, End of Period | $167.31 | $154.72 | $140.13 | $140.15 | $139.97 |
| | | | | | |
| Total Return | 11.01% | 13.24% | 2.60% | 2.83% | 17.36% |
| | | | | | |
| Ratios/Supplemental Data | | | | | |
| Net Assets, End of Period (Millions) | $5,712 | $5,296 | $3,983 | $3,780 | $3,518 |
| Ratio of Total Expenses to Average Net Assets | 0.10% | 0.10% | 0.10% | 0.10% | 0.10% |
| Ratio of Net Investment Income to Average Net Assets | 2.58% | 2.71% | 2.60% | 2.63% | 2.50% |
| Portfolio Turnover Rate2 | 3% | 6% | 8% | 5% | 6% |
| 1 | Calculated based on average shares outstanding. |
| 2 | Excludes the value of portfolio securities received or delivered as a result of in-kind purchases or redemptions of the fund’s capital shares, including ETF Creation Units. |
| Admiral Shares | | | | | |
| | | | | | |
| For a Share Outstanding | | | Year Ended August 31, |
| Throughout Each Period | 2020 | 2019 | 2018 | 2017 | 2016 |
| Net Asset Value, Beginning of Period | $76.29 | $69.09 | $69.10 | $69.02 | $61.01 |
| Investment Operations | | | | | |
| Net Investment Income | 1.9731 | 1.9231 | 1.7761 | 1.7971 | 1.575 |
| Net Realized and Unrealized Gain (Loss) on Investments | 6.239 | 7.076 | (.018) | .101 | 8.752 |
| Total from Investment Operations | 8.212 | 8.999 | 1.758 | 1.898 | 10.327 |
| Distributions | | | | | |
| Dividends from Net Investment Income | (2.002) | (1.799) | (1.768) | (1.818) | (2.317) |
| Distributions from Realized Capital Gains | — | — | — | — | — |
| Total Distributions | (2.002) | (1.799) | (1.768) | (1.818) | (2.317) |
| Net Asset Value, End of Period | $82.50 | $76.29 | $69.09 | $69.10 | $69.02 |
| | | | | | |
| Total Return2 | 11.03% | 13.24% | 2.59% | 2.81% | 17.37% |
| | | | | | |
| Ratios/Supplemental Data | | | | | |
| Net Assets, End of Period (Millions) | $791 | $710 | $587 | $742 | $728 |
| Ratio of Total Expenses to Average Net Assets | 0.10% | 0.10% | 0.10% | 0.10% | 0.10% |
| Ratio of Net Investment Income to Average Net Assets | 2.59% | 2.71% | 2.60% | 2.63% | 2.50% |
| Portfolio Turnover Rate3 | 3% | 6% | 8% | 5% | 6% |
| 1 | Calculated based on average shares outstanding. |
| 2 | Total returns do not include account service fees that may have applied in the periods shown. Fund prospectuses provide information about any applicable account service fees. |
| 3 | Excludes the value of portfolio securities received or delivered as a result of in-kind purchases or redemptions of the fund’s capital shares, including ETF Creation Units. |
See accompanying Notes, which are an integral part of the Financial Statements.
Consumer Staples Index Fund
Notes to Financial Statements
Vanguard Consumer Staples Index Fund is registered under the Investment Company Act of 1940 as an open-end investment company, or mutual fund. The fund offers two classes of shares: ETF Shares and Admiral Shares. Each of the share classes has different eligibility and minimum purchase requirements, and is designed for different types of investors. ETF Shares are listed for trading on NYSE Arca; they can be purchased and sold through a broker.
Market disruptions associated with the COVID-19 pandemic have had a global impact, and uncertainty exists as to the long-term implications. Such disruptions can adversely affect assets of the fund and thus fund performance.
A. The following significant accounting policies conform to generally accepted accounting principles for U.S. investment companies. The fund consistently follows such policies in preparing its financial statements.
1. Security Valuation: Securities are valued as of the close of trading on the New York Stock Exchange (generally 4 p.m., Eastern time) on the valuation date. Equity securities are valued at the latest quoted sales prices or official closing prices taken from the primary market in which each security trades; such securities not traded on the valuation date are valued at the mean of the latest quoted bid and asked prices. Securities for which market quotations are not readily available, or whose values have been materially affected by events occurring before the fund’s pricing time but after the close of the securities’ primary markets, are valued by methods deemed by the board of trustees to represent fair value. Investments in Vanguard Market Liquidity Fund are valued at that fund’s net asset value.
2. Futures Contracts: The fund uses index futures contracts to a limited extent, with the objectives of maintaining full exposure to the stock market, maintaining liquidity, and minimizing transaction costs. The fund may purchase futures contracts to immediately invest incoming cash in the market, or sell futures in response to cash outflows, thereby simulating a fully invested position in the underlying index while maintaining a cash balance for liquidity. The primary risks associated with the use of futures contracts are imperfect correlation between changes in market values of stocks held by the fund and the prices of futures contracts, and the possibility of an illiquid market. Counterparty risk involving futures is mitigated because a regulated clearinghouse is the counterparty instead of the clearing broker. To further mitigate counterparty risk, the fund trades futures contracts on an exchange, monitors the financial strength of its clearing brokers and clearinghouse, and has entered into clearing agreements with its clearing brokers. The clearinghouse imposes initial margin requirements to secure the fund’s performance and requires daily settlement of variation margin representing changes in the market value of each contract. Any securities pledged as initial margin for open contracts are noted in the Schedule of Investments.
Futures contracts are valued at their quoted daily settlement prices. The notional amounts of the contracts are not recorded in the Statement of Assets and Liabilities. Fluctuations in the value of the contracts are recorded in the Statement of Assets and Liabilities as an asset (liability) and in the Statement of Operations as unrealized appreciation (depreciation) until the contracts are closed, when they are recorded as realized gains (losses) on futures contracts.
During the year ended August 31, 2020, the fund’s average investments in long and short futures contracts represented less than 1% and 0% of net assets, respectively, based on the average of the notional amounts at each quarter-end during the period. The fund had no open futures contracts at August 31, 2020.
3. Swap Contracts: The fund has entered into equity swap contracts to earn the total return on selected reference stocks in the fund’s target index. Under the terms of the swaps, the fund receives the total return on the referenced stock (i.e., receiving the increase or paying the decrease in value of the selected reference stock and receiving the equivalent of any dividends in respect of the selected referenced stock) over a specified period of time, applied to a notional amount that represents the value of a designated number of shares of the selected reference stock at the beginning of the equity swap contract. The fund also pays a floating rate that is based on short-term interest rates, applied to the notional amount. At the same time, the fund generally invests an amount approximating the notional amount of the swap in high-quality temporary cash investments.
A risk associated with all types of swaps is the possibility that a counterparty may default on its obligation to pay net amounts due to the fund. The fund’s maximum amount subject to counterparty risk is the unrealized appreciation on the swap contract. The fund mitigates its counterparty risk by entering into swaps only with a diverse group of prequalified counterparties, monitoring their financial strength, entering into master netting arrangements with its counterparties, and requiring its counterparties to transfer collateral as security for their performance. In the absence of a default,
Consumer Staples Index Fund
the collateral pledged or received by the fund cannot be repledged, resold, or rehypothecated. In the event of a counterparty’s default (including bankruptcy), the fund may terminate any swap contracts with that counterparty, determine the net amount owed by either party in accordance with its master netting arrangements, and sell or retain any collateral held up to the net amount owed to the fund under the master netting arrangements. The swap contracts contain provisions whereby a counterparty may terminate open contracts if the fund’s net assets decline below a certain level, triggering a payment by the fund if the fund is in a net liability position at the time of the termination. The payment amount would be reduced by any collateral the fund has pledged. Any securities pledged as collateral for open contracts are noted in the Schedule of Investments. The value of collateral received or pledged is compared daily to the value of the swap contracts exposure with each counterparty, and any difference, if in excess of a specified minimum transfer amount, is adjusted and settled within two business days.
The notional amounts of swap contracts are not recorded in the Statement of Assets and Liabilities. Swaps are valued daily based on market quotations received from independent pricing services or recognized dealers and the change in value is recorded in the Statement of Assets and Liabilities as an asset (liability) and in the Statement of Operations as unrealized appreciation (depreciation) until periodic payments are made or the termination of the swap, at which time realized gain (loss) is recorded.
During the year ended August 31, 2020, the fund’s average amounts of investments in total return swaps represented less than 1% of net assets, based on the average of notional amounts at each quarter-end during the period.
4. Federal Income Taxes: The fund intends to continue to qualify as a regulated investment company and distribute all of its taxable income. The fund’s tax returns are open to examination by the relevant tax authorities until expiration of the applicable statute of limitations, which is generally three years after the filing of the tax return. Management has analyzed the fund’s tax positions taken for all open federal and state income tax years, and has concluded that no provision for income tax is required in the fund’s financial statements.
5. Distributions: Distributions to shareholders are recorded on the ex-dividend date. Distributions are determined on a tax basis at the fiscal year-end and may differ from net investment income and realized capital gains for financial reporting purposes.
6. Securities Lending: To earn additional income, the fund lends its securities to qualified institutional borrowers. Security loans are subject to termination by the fund at any time, and are required to be secured at all times by collateral in an amount at least equal to the market value of securities loaned. Daily market fluctuations could cause the value of loaned securities to be more or less than the value of the collateral received. When this occurs, the collateral is adjusted and settled before the opening of the market on the next business day. The fund further mitigates its counterparty risk by entering into securities lending transactions only with a diverse group of prequalified counterparties, monitoring their financial strength, and entering into master securities lending agreements with its counterparties. The master securities lending agreements provide that, in the event of a counterparty’s default (including bankruptcy), the fund may terminate any loans with that borrower, determine the net amount owed, and sell or retain the collateral up to the net amount owed to the fund; however, such actions may be subject to legal proceedings. While collateral mitigates counterparty risk, in the event of a default, the fund may experience delays and costs in recovering the securities loaned. The fund invests cash collateral received in Vanguard Market Liquidity Fund, and records a liability in the Statement of Assets and Liabilities for the return of the collateral, during the period the securities are on loan. Collateral investments in Vanguard Market Liquidity Fund are subject to market appreciation or depreciation. Securities lending income represents fees charged to borrowers plus income earned on invested cash collateral, less expenses associated with the loan. During the term of the loan, the fund is entitled to all distributions made on or in respect of the loaned securities.
7. Credit Facilities and Interfund Lending Program: The fund and certain other funds managed by The Vanguard Group (“Vanguard”) participate in a $4.3 billion committed credit facility provided by a syndicate of lenders pursuant to a credit agreement and an uncommitted credit facility provided by Vanguard. Both facilities may be renewed annually. Each fund is individually liable for its borrowings, if any, under the credit facilities. Borrowings may be utilized for temporary or emergency purposes, subject to the fund’s regulatory and contractual borrowing restrictions. With respect to the committed credit facility, the participating funds are charged administrative fees and an annual commitment fee of 0.10% of the undrawn committed amount of the facility; these fees are allocated to the funds based on a method approved by the fund’s board of trustees and included in Management and
Consumer Staples Index Fund
Administrative expenses on the fund’s Statement of Operations. Any borrowings under either facility bear interest at a rate based upon the higher of the one-month London Interbank Offered Rate (or an acceptable alternate rate, if necessary), federal funds effective rate, or overnight bank funding rate plus an agreed-upon spread, except that borrowings under the uncommitted credit facility may bear interest based upon an alternative rate agreed to by the fund and Vanguard.
In accordance with an exemptive order (the “Order”) from the SEC, the fund may participate in a joint lending and borrowing program that allows registered open-end Vanguard funds to borrow money from and lend money to each other for temporary or emergency purposes (the “Interfund Lending Program”), subject to compliance with the terms and conditions of the Order, and to the extent permitted by the fund’s investment objective and investment policies. Interfund loans and borrowings normally extend overnight, but can have a maximum duration of seven days. Loans may be called on one business day’s notice. The interest rate to be charged is governed by the conditions of the Order and internal procedures adopted by the board of trustees. The board of trustees is responsible for overseeing the Interfund Lending Program.
For the year ended August 31, 2020, the fund did not utilize the credit facilities or the Interfund Lending Program.
8. Other: Dividend income is recorded on the ex-dividend date. Interest income includes income distributions received from Vanguard Market Liquidity Fund and is accrued daily. Security transactions are accounted for on the date securities are bought or sold. Costs used to determine realized gains (losses) on the sale of investment securities are those of the specific securities sold.
Each class of shares has equal rights as to assets and earnings, except that each class separately bears certain class-specific expenses related to maintenance of shareholder accounts (included in Management and Administrative expenses) and shareholder reporting. Marketing and distribution expenses are allocated to each class of shares based on a method approved by the board of trustees. Income, other non-class-specific expenses, and gains and losses on investments are allocated to each class of shares based on its relative net assets.
B. In accordance with the terms of a Funds’ Service Agreement (the “FSA”) between Vanguard and the fund, Vanguard furnishes to the fund investment advisory, corporate management, administrative, marketing, and distribution services at Vanguard’s cost of operations (as defined by the FSA). These costs of operations are allocated to the fund based on methods and guidelines approved by the board of trustees and are generally settled twice a month.
Upon the request of Vanguard, the fund may invest up to 0.40% of its net assets as capital in Vanguard. At August 31, 2020, the fund had contributed to Vanguard capital in the amount of $268,000, representing less than 0.01% of the fund’s net assets and 0.11% of Vanguard’s capital received pursuant to the FSA. The fund’s trustees and officers are also directors and employees, respectively, of Vanguard.
C. The fund’s custodian bank has agreed to reduce its fees when the fund maintains cash on deposit in the non-interest-bearing custody account. For the year ended August 31, 2020, custodian fee offset arrangements reduced the fund’s expenses by $2,000 (an annual rate of less than 0.01% of average net assets).
D. Various inputs may be used to determine the value of the fund’s investments and derivatives. These inputs are summarized in three broad levels for financial statement purposes. The inputs or methodologies used to value securities are not necessarily an indication of the risk associated with investing in those securities.
Level 1—Quoted prices in active markets for identical securities.
Level 2—Other significant observable inputs (including quoted prices for similar securities, interest rates, prepayment speeds, credit risk, etc.).
Level 3—Significant unobservable inputs (including the fund’s own assumptions used to determine the fair value of investments). Any investments and derivatives valued with significant unobservable inputs are noted on the Schedule of Investments.
Consumer Staples Index Fund
The following table summarizes the market value of the fund’s investments and derivatives as of August 31, 2020, based on the inputs used to value them:
| | Level 1 | Level 2 | Level 3 | Total |
| | ($000) | ($000) | ($000) | ($000) |
| Investments | | | | |
| Assets | | | | |
| Common Stocks | 6,478,430 | — | — | 6,478,430 |
| Temporary Cash Investments | 27,479 | — | — | 27,479 |
| Total | 6,505,909 | — | — | 6,505,909 |
| Derivative Financial Instruments | | | | |
| Assets | | | | |
| Swap Contracts | — | 349 | — | 349 |
E. Permanent differences between book-basis and tax-basis components of net assets are reclassified among capital accounts in the financial statements to reflect their tax character. These reclassifications have no effect on net assets or net asset value per share. As of period end, permanent differences primarily attributable to the accounting for in-kind redemptions and swap agreements were reclassified between the following accounts:
| | Amount |
| | ($000) |
| Paid-in Capital | 312,347 |
| Total Distributable Earnings (Loss) | (312,347) |
Temporary differences between book-basis and tax-basis components of total distributable earnings (loss) arise when certain items of income, gain, or loss are recognized in different periods for financial statement and tax purposes; these differences will reverse at some time in the future. The differences are primarily related to the deferral of losses from wash sales and the recognition of unrealized gains or losses from certain derivative contracts. As of period end, the tax-basis components of total distributable earnings (loss) are detailed in the table as follows:
| | Amount |
| | ($000) |
| Undistributed Ordinary Income | 30,747 |
| Undistributed Long-term Gains | — |
| Capital Loss Carryforwards | (127,858) |
| Qualified Late-Year Losses | — |
| Net Unrealized Gains (Losses) | 838,203 |
The tax character of distributions paid was as follows:
| | Year Ended August 31, |
| | 2020 | 2019 |
| | Amount | Amount |
| | ($000) | ($000) |
| Ordinary Income* | 159,148 | 132,371 |
| Long-Term Capital Gains | — | — |
| Total | 159,148 | 132,371 |
* Includes short-term capital gains, if any.
Consumer Staples Index Fund
As of August 31, 2020, gross unrealized appreciation and depreciation for investments and derivatives based on cost for U.S. federal income tax purposes were as follows:
| | Amount |
| | ($000) |
| Tax Cost | 5,667,706 |
| Gross Unrealized Appreciation | 1,278,152 |
| Gross Unrealized Depreciation | (439,949) |
| Net Unrealized Appreciation (Depreciation) | 838,203 |
F. During the year ended August 31, 2020, the fund purchased $1,350,430,000 of investment securities and sold $1,333,490,000 of investment securities, other than temporary cash investments. Purchases and sales include $1,004,040,000 and $1,151,526,000, respectively, in connection with in-kind purchases and redemptions of the fund’s capital shares.
G. Capital share transactions for each class of shares were:
| | | | Year Ended August 31, |
| | | 2020 | | | 2019 |
| | Amount | Shares | | Amount | Shares |
| | ($000) | (000) | | ($000) | (000) |
| ETF Shares | | | | | |
| Issued | 1,146,786 | 7,587 | | 1,595,617 | 11,157 |
| Issued in Lieu of Cash Distributions | — | — | | — | — |
| Redeemed | (1,152,447) | (7,675) | | (751,094) | (5,350) |
| Net Increase (Decrease)—ETF Shares | (5,661) | (88) | | 844,523 | 5,807 |
| Admiral Shares | | | | | |
| Issued | 294,479 | 3,969 | | 217,155 | 3,077 |
| Issued in Lieu of Cash Distributions | 15,970 | 211 | | 13,107 | 184 |
| Redeemed | (287,989) | (3,896) | | (171,872) | (2,460) |
| Net Increase (Decrease)—Admiral Shares | 22,460 | 284 | | 58,390 | 801 |
H. Management has determined that no events or transactions occurred subsequent to August 31, 2020, that would require recognition or disclosure in these financial statements.
Energy Index Fund
Performance Summary
All of the returns in this report represent past performance, which is not a guarantee of future results that may be achieved by the fund. (Current performance may be lower or higher than the performance data cited. For performance data current to the most recent month-end, visit our website at vanguard.com/performance.) Note, too, that both investment returns and principal value can fluctuate widely, so an investor’s shares, when sold, could be worth more or less than their original cost. The returns shown do not reflect taxes that a shareholder would pay on fund distributions or on the sale of fund shares.
Cumulative Performance: August 31, 2010–August 31, 2020
Initial Investment of $10,000
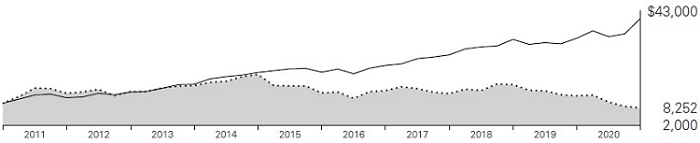
| | | | Average Annual Total Returns | Final Value |
| | | | Periods Ended August 31, 2020 | of a $10,000 |
| | | One Year | Five Years | Ten Years | Investment |
 | Energy Index Fund ETF Shares Net Asset Value | -33.87% | -9.50% | -1.90% | $8,252 |
| | Energy Index Fund ETF Shares Market Price | -33.80 | -9.49 | -1.88 | 8,268 |
 | MSCI US IMI/Energy 25/50 | -33.86 | -9.36 | -1.77 | 8,362 |
 | MSCI US IMI/2500 | 21.48 | 13.88 | 14.99 | 40,426 |
| | | | | Final Value |
| | | | | of a $100,000 |
| | One Year | Five Years | Ten Years | Investment |
| Energy Index Fund Admiral Shares | -33.82% | -9.48% | -1.89% | $82,655 |
| MSCI US IMI/Energy 25/50 | -33.86 | -9.36 | -1.77 | 83,618 |
| MSCI US IMI/2500 | 21.48 | 13.88 | 14.99 | 404,265 |
| Cumulative Returns: ETF Shares, August 31, 2010–August 31, 2020 | | |
| | | |
| | | |
| | One Year | Five Years | Ten Years |
| Energy Index Fund ETF Shares Market Price | -33.80% | -39.25% | -17.32% |
| Energy Index Fund ETF Shares Net Asset Value | -33.87 | -39.28 | -17.48 |
| MSCI US IMI/Energy 25/50 | -33.86 | -38.80 | -16.38 |
For the ETF Shares, the market price is determined by the midpoint of the bid-offer spread as of the closing time of the New York Stock Exchange (generally 4 p.m., Eastern time). The net asset value is also determined as of the NYSE closing time. For more information about how the ETF Shares’ market prices have compared with their net asset value, visit vanguard.com, select your ETF, and then select the Price and Performance tab. The ETF premium/discount analysis there shows the percentages of days on which the ETF Shares’ market price was above or below the NAV.
See Financial Highlights for dividend and capital gains information.
Energy Index Fund
Fund Allocation
As of August 31, 2020
| Coal & Consumable Fuels | 0.2% |
| Integrated Oil & Gas | 44.1 |
| Oil & Gas Drilling | 0.5 |
| Oil & Gas Equipment & Services | 9.4 |
| Oil & Gas Exploration & Production | 22.6 |
| Oil & Gas Refining & Marketing | 11.0 |
| Oil & Gas Storage & Transportation | 12.2 |
The table reflects the fund’s investments, except for short-term investments and derivatives. Sector categories are based on the Global Industry Classification Standard (“GICS”), except for the “Other” category (if applicable), which includes securities that have not been provided a GICS classification as of the effective reporting period.
The fund may invest in derivatives (such as futures and swap contracts) for various reasons, including, but not limited to, attempting to remain fully invested and tracking its target index as closely as possible.
The Global Industry Classification Standard (“GICS”) was developed by and is the exclusive property and a service mark of MSCI Inc. (“MSCI”) and Standard and Poor’s, a division of McGraw-Hill Companies, Inc. (“S&P”), and is licensed for use by Vanguard. Neither MSCI, S&P nor any third party involved in making or compiling the GICS or any GICS classification makes any express or implied warranties or representations with respect to such standard or classification (or the results to be obtained by the use thereof), and all such parties hereby expressly disclaim all warranties of originality, accuracy, completeness, merchantability or fitness for a particular purpose with respect to any such standard or classification. Without limiting any of the foregoing, in no event shall MSCI, S&P, any of its affiliates or any third party involved in making or compiling the GICS or any GICS classification have any liability for any direct, indirect, special, punitive, consequential or any other damages (including lost profits) even if notified of the possibility of such damages.
Energy Index Fund
Financial Statements
Schedule of Investments
As of August 31, 2020
The fund files its complete schedule of portfolio holdings with the Securities and Exchange Commission (SEC) for the first and third quarters of each fiscal year as an exhibit to its reports on Form N-PORT. The fund’s Form N-PORT reports are available on the SEC’s website at www.sec.gov.
| | | | Market | |
| | | | Value· | |
| | | Shares | ($000 | ) |
| Common Stocks (99.4%) | | | |
| Energy Equipment & Services (9.8%) | | | |
| | Oil & Gas Drilling (0.5%) | | | |
| | Helmerich & Payne Inc. | 469,253 | 7,733 | |
| | Patterson-UTI Energy Inc. | 909,949 | 3,503 | |
| * | Transocean Ltd. | 2,617,912 | 3,194 | |
| | Nabors Industries Ltd. | 49,986 | 1,999 | |
| | | | | |
| | Oil & Gas Equipment & Services (9.3%) | |
| | Schlumberger Ltd. | 5,401,266 | 102,678 | |
| | Halliburton Co. | 3,632,124 | 58,768 | |
| | Baker Hughes Co. Class A | 2,697,578 | 38,521 | |
| | National Oilwell Varco Inc. | 1,607,766 | 19,293 | |
| | TechnipFMC plc | 1,787,674 | 13,765 | |
| ^,* | ChampionX Corp. | 851,109 | 8,715 | |
| * | Dril-Quip Inc. | 160,861 | 5,329 | |
| | Cactus Inc. Class A | 212,657 | 4,698 | |
| | Core Laboratories NV | 199,446 | 4,174 | |
| | Archrock Inc. | 594,657 | 3,901 | |
| * | SEACOR Holdings Inc. | 91,664 | 2,898 | |
| * | ProPetro Holding Corp. | 420,409 | 2,640 | |
| | DMC Global Inc | 72,399 | 2,565 | |
| * | Oceaneering International Inc. | 471,416 | 2,541 | |
| * | Helix Energy Solutions Group Inc. | 709,187 | 2,539 | |
| | Liberty Oilfield Services Inc. Class A | 334,550 | 2,158 | |
| | NexTier Oilfield Solutions Inc. | 828,594 | 2,088 | |
| | US Silica Holdings Inc. | 439,234 | 1,959 | |
| * | Oil States International Inc. | 356,706 | 1,566 | |
| * | Select Energy Services Inc. Class A | 323,149 | 1,541 | |
| * | Tidewater Inc. | 218,806 | 1,503 | |
| * | Frank’s International NV | 630,590 | 1,457 | |
| | Solaris Oilfield Infrastructure Inc. Class A | 180,629 | 1,405 | |
| * | Matrix Service Co. | 150,824 | 1,394 | |
| * | RPC Inc. | 341,192 | 1,068 | |
| * | Newpark Resources Inc. | 533,706 | 1,041 | |
| * | Exterran Corp. | 174,521 | 803 | |
| * | SEACOR Marine Holdings Inc. | 283,838 | 761 | |
| | | | 308,198 | |
| Oil, Gas & Consumable Fuels (89.6%) | | |
| | Coal & Consumable Fuels (0.2%) | | |
| | Arch Coal Inc. Class A | 76,578 | 2,885 | |
| | Peabody Energy Corp. | 380,429 | 993 | |
| * | CONSOL Energy Inc. | 153,868 | 795 | |
| | | | | |
| | Integrated Oil & Gas (43.8%) | | |
| | Exxon Mobil Corp. | 16,914,709 | 675,573 | |
| | Chevron Corp. | 7,698,904 | 646,169 | |
| | Occidental Petroleum Corp. | 3,732,763 | 47,555 | |
| * | Occidental Petroleum Corp. Warrants Exp. 08/03/2027 | 249,356 | 736 | |
| | | | | |
| | Oil & Gas Exploration & Production (22.5%) | |
| | ConocoPhillips | 3,697,842 | 140,111 | |
| | EOG Resources Inc. | 2,388,264 | 108,284 | |
| | Pioneer Natural Resources Co. | 686,227 | 71,320 | |
| | Concho Resources Inc. | 825,373 | 42,903 | |
| | Hess Corp. | 831,637 | 38,289 | |
| | Cabot Oil & Gas Corp. | 1,679,539 | 31,861 | |
| | Diamondback Energy Inc. | 656,173 | 25,564 | |
| | Apache Corp. | 1,574,910 | 23,309 | |
| | Noble Energy Inc. | 2,022,338 | 20,122 | |
| | Marathon Oil Corp. | 3,385,978 | 17,878 | |
| | Devon Energy Corp. | 1,643,716 | 17,867 | |
| | EQT Corp. | 1,086,264 | 17,239 | |
| | Parsley Energy Inc. Class A | 1,294,984 | 13,921 | |
| | Texas Pacific Land Trust | 26,123 | 13,759 | |
| | Ovintiv Inc. | 1,108,484 | 12,282 | |
| | Cimarex Energy Co. | 431,118 | 11,976 | |
| * | WPX Energy Inc. | 1,778,102 | 9,886 | |
| * | CNX Resources Corp. | 834,543 | 9,147 | |
| | Murphy Oil Corp. | 651,118 | 8,946 | |
| | Range Resources Corp. | 1,023,977 | 7,639 | |
| * | Southwestern Energy Co. | 2,725,503 | 7,577 | |
| * | PDC Energy Inc. | 457,766 | 6,931 | |
| ^ | Continental Resources Inc. | 402,120 | 6,908 | |
| * | Matador Resources Co. | 495,930 | 4,825 | |
| * | Antero Resources Corp. | 1,148,041 | 3,697 | |
| * | Magnolia Oil & Gas Corp. Class A | 570,473 | 3,674 | |
| | Viper Energy Partners LP | 283,380 | 2,885 | |
| | Kosmos Energy Ltd. | 1,863,060 | 2,739 | |
| | Brigham Minerals Inc. Class A | 180,583 | 2,133 | |
| | QEP Resources Inc. | 1,420,671 | 1,847 | |
| * | Bonanza Creek Energy Inc. | 88,566 | 1,775 | |
| ^,* | Tellurian Inc. | 1,539,762 | 1,430 | |
| ^,* | Callon Petroleum Co. | 206,942 | 1,372 | |
| | SM Energy Co. | 532,148 | 1,293 | |
| | Berry Corp. | 324,833 | 1,280 | |
| * | W&T Offshore Inc. | 528,485 | 1,178 | |
| * | Montage Resources Corp. | 215,861 | 1,114 | |
| * | Penn Virginia Corp. | 93,440 | 1,067 | |
| ^,* | Oasis Petroleum Inc. | 1,823,530 | 1,013 | |
| * | Northern Oil and Gas Inc. | 1,379,009 | 936 | |
| * | Laredo Petroleum Inc. | 54,559 | 892 | |
| * | Talos Energy Inc. | 115,903 | 870 | |
| | Falcon Minerals Corp. | 297,462 | 836 | |
| * | Centennial Resource Development Inc. Class A | 1,136,493 | 825 | |
| ^,* | Gran Tierra Energy Inc. | 2,755,461 | 804 | |
| * | SandRidge Energy Inc. | 350,455 | 554 | |
| * | Gulfport Energy Corp. | 772,456 | 545 | |
| ^,* | Ring Energy Inc. | 601,461 | 412 | |
| | | | | |
| | Oil & Gas Refining & Marketing (11.0%) | |
| | Phillips 66 | 1,810,945 | 105,886 | |
| | Marathon Petroleum Corp. | 2,698,443 | 95,687 | |
| | Valero Energy Corp. | 1,693,202 | 89,046 | |
| | HollyFrontier Corp. | 662,472 | 15,813 | |
| | World Fuel Services Corp. | 288,372 | 7,613 | |
| * | Renewable Energy Group Inc. | 180,702 | 6,041 | |
| | Delek US Holdings Inc. | 330,247 | 5,195 | |
| | PBF Energy Inc. Class A | 488,254 | 4,179 | |
| * | Green Plains Inc. | 183,582 | 2,456 | |
| | CVR Energy Inc. | 140,276 | 2,341 | |
| * | New Fortress Energy Inc. | 84,404 | 2,260 | |
| * | Clean Energy Fuels Corp. | 822,411 | 2,171 | |
| * | REX American Resources Corp. | 29,688 | 1,834 | |
| * | Par Pacific Holdings Inc. | 196,384 | 1,705 | |
| | | | | |
| | Oil & Gas Storage & Transportation (12.1%) | |
| | Kinder Morgan Inc. | 8,367,613 | 115,640 | |
| | Williams Cos. Inc. | 4,982,352 | 103,434 | |
| | ONEOK Inc. | 1,808,442 | 49,696 | |
| * | Cheniere Energy Inc. | 949,319 | 49,412 | |
| | Equitrans Midstream Corp. | 1,760,037 | 18,093 | |
| | Targa Resources Corp. | 974,414 | 16,575 | |
| | Antero Midstream Corp. | 1,271,551 | 8,608 | |
| | Plains GP Holdings LP Class A | 751,599 | 5,494 | |
| | EnLink Midstream LLC | 1,273,415 | 3,808 | |
| | International Seaways Inc. | 118,262 | 2,006 | |
| | Rattler Midstream LP | 216,133 | 1,809 | |
| * | Dorian LPG Ltd. | 210,944 | 1,780 | |
| | Hess Midstream LP Class A | 88,017 | 1,556 | |
| * | Diamond S Shipping Inc. | 141,629 | 1,160 | |
| * | Altus Midstream Co. Class A | 39,501 | 520 | |
| | | | 2,800,239 | |
Total Common Stocks
(Cost $5,686,541) | | 3,108,437 | |
Energy Index Fund
| | | Market | |
| | | Value· | |
| | Shares | ($000 | ) |
| Temporary Cash Investment (0.4%) | | |
| Money Market Fund (0.4%) | | | |
| 1,2 | Vanguard Market Liquidity Fund, 0.147%
(Cost $11,899) | 119,057 | 11,906 | |
Total Investments (99.8%)
(Cost $5,698,440) | | 3,120,343 | |
| Other Assets and Liabilities—Net (0.2%) | 6,278 | |
| Net Assets (100%) | | 3,126,621 | |
| Cost is in $000. |
| · | See Note A in Notes to Financial Statements. |
| * | Non-income-producing security. |
| ^ | Includes partial security positions on loan to broker-dealers. The total value of securities on loan is $10,004,000. |
| 1 | Affiliated money market fund available only to Vanguard funds and certain trusts and accounts managed by Vanguard. Rate shown is the 7-day yield. |
| 2 | Collateral of $11,897,000 was received for securities on loan. |
| Derivative Financial Instruments Outstanding as of Period End | | | | | |
| | | | | | |
| Over-the-Counter Total Return Swaps | | | | | | | | | |
| | | | | | Floating | | | | | |
| | | | | | Interest Rate | | Value and | | Value and | |
| | | | Notional | | Received | | Unrealized | | Unrealized | |
| | Termination | | Amount | | (Paid | )1 | Appreciation | | (Depreciation | ) |
| Reference Entity | Date | Counterparty | ($000 | ) | (% | ) | ($000 | ) | ($000 | ) |
| Hess Corp. | 2/2/21 | GSI | 15,741 | | (0.161 | ) | — | | (1,930 | ) |
| Schlumberger Ltd. | 9/2/21 | BOANA | 5,769 | | (0.149 | ) | — | | (66 | ) |
| | | | | | | | — | | (1,996 | ) |
| 1 | Based on 1-month USD London Interbank Offered Rate (LIBOR) as of the most recent payment date. Floating interest payment received/ paid monthly. |
BOANA—Bank of America, N.A.
GSI—Goldman Sachs International.
See accompanying Notes, which are an integral part of the Financial Statements.
Energy Index Fund
Statement of Assets and Liabilities
As of August 31, 2020
| ($000s, except shares and per-share amounts) | Amount |
| Assets | |
| Investments in Securities, at Value | |
| Unaffiliated Issuers (Cost $5,686,541) | 3,108,437 |
| Affiliated Issuers (Cost $11,899) | 11,906 |
| Total Investments in Securities | 3,120,343 |
| Investment in Vanguard | 137 |
| Cash Collateral Pledged—Over-the-Counter Swap Contracts | 1,860 |
| Receivables for Investment Securities Sold | 20,231 |
| Receivables for Accrued Income | 32,460 |
| Receivables for Capital Shares Issued | 753 |
| Total Assets | 3,175,784 |
| Liabilities | |
| Due to Custodian | 13,600 |
| Payables for Investment Securities Purchased | 20,524 |
| Collateral for Securities on Loan | 11,897 |
| Payables for Capital Shares Redeemed | 985 |
| Payables to Vanguard | 161 |
| Unrealized Depreciation—Over-the-Counter Swap Contracts | 1,996 |
| Total Liabilities | 49,163 |
| Net Assets | 3,126,621 |
| At August 31, 2020, net assets consisted of: | |
| Paid-in Capital | 6,661,472 |
| Total Distributable Earnings (Loss) | (3,534,851) |
| Net Assets | 3,126,621 |
| | |
| ETF Shares—Net Assets | |
| Applicable to 56,771,113 outstanding $.001 par value shares of beneficial interest (unlimited authorization) | 2,719,549 |
| Net Asset Value Per Share—ETF Shares | $47.90 |
| | |
| Admiral Shares—Net Assets | |
| Applicable to 17,009,941 outstanding $.001 par value shares of beneficial interest (unlimited authorization) | 407,072 |
| Net Asset Value Per Share—Admiral Shares | $23.93 |
See accompanying Notes, which are an integral part of the Financial Statements.
Energy Index Fund
Statement of Operations
| | Year Ended | |
| | August 31, 2020 | |
| | ($000 | ) |
| Investment Income | | |
| Income | | |
| Dividends | 165,771 | |
| Interest1 | 283 | |
| Securities Lending—Net | 1,892 | |
| Total Income | 167,946 | |
| Expenses | | |
| The Vanguard Group—Note B | | |
| Investment Advisory Services | 502 | |
| Management and Administrative—ETF Shares | 1,963 | |
| Management and Administrative—Admiral Shares | 331 | |
| Marketing and Distribution—ETF Shares | 176 | |
| Marketing and Distribution—Admiral Shares | 31 | |
| Custodian Fees | 24 | |
| Auditing Fees | 32 | |
| Shareholders’ Reports—ETF Shares | 295 | |
| Shareholders’ Reports—Admiral Shares | 10 | |
| Trustees’ Fees and Expenses | 3 | |
| Total Expenses | 3,367 | |
| Expenses Paid Indirectly | (3 | ) |
| Net Expenses | 3,364 | |
| Net Investment Income | 164,582 | |
| Realized Net Gain (Loss) | | |
| Investment Securities Sold1,2 | (104,981 | ) |
| Futures Contracts | (58 | ) |
| Swap Contracts | (6,823 | ) |
| Realized Net Gain (Loss) | (111,862 | ) |
| Change in Unrealized Appreciation (Depreciation) | | |
| Investment Securities1 | (1,052,887 | ) |
| Swap Contracts | (2,786 | ) |
| Change in Unrealized Appreciation (Depreciation) | (1,055,673 | ) |
| Net Increase (Decrease) in Net Assets Resulting from Operations | (1,002,953 | ) |
| 1 | Interest income, realized net gain (loss), and change in unrealized appreciation (depreciation) from an affiliated company of the fund were $283,000, $5,000, and $3,000, respectively. Purchases and sales are for temporary cash investment purposes. |
| 2 | Includes $158,621,000 of net gain (loss) resulting from in-kind redemptions. |
Statement of Changes in Net Assets
| | Year Ended August 31, | |
| | 2020 | | 2019 | |
| | ($000 | ) | ($000 | ) |
| Increase (Decrease) in Net Assets | | | | |
| Operations | | | | |
| Net Investment Income | 164,582 | | 131,015 | |
| Realized Net Gain (Loss) | (111,862 | ) | (19,257 | ) |
| Change in Unrealized Appreciation (Depreciation) | (1,055,673 | ) | (1,258,888 | ) |
| Net Increase (Decrease) in Net Assets Resulting from Operations | (1,002,953 | ) | (1,147,130 | ) |
| Distributions1 | | | | |
| ETF Shares | (125,010 | ) | (112,343 | ) |
| Admiral Shares | (18,446 | ) | (16,737 | ) |
| Total Distributions | (143,456 | ) | (129,080 | ) |
| Capital Share Transactions | | | | |
| ETF Shares | 693,979 | | (148,483 | ) |
| Admiral Shares | 81,692 | | (7,983 | ) |
| Net Increase (Decrease) from Capital Share Transactions | 775,671 | | (156,466 | ) |
| Total Increase (Decrease) | (370,738 | ) | (1,432,676 | ) |
| Net Assets | | | | |
| Beginning of Period | 3,497,359 | | 4,930,035 | |
| End of Period | 3,126,621 | | 3,497,359 | |
1 Certain prior-period numbers have been reclassified to conform with current period presentation.
See accompanying Notes, which are an integral part of the Financial Statements.
Energy Index Fund
Financial Highlights
| ETF Shares | | | | | |
| | | | | | |
| For a Share Outstanding | Year Ended August 31, |
| Throughout Each Period | 2020 | 2019 | 2018 | 2017 | 2016 |
| Net Asset Value, Beginning of Period | $75.75 | $103.13 | $85.71 | $95.06 | $93.86 |
| Investment Operations | | | | | |
| Net Investment Income | 2.9571 | 2.7691 | 2.5191 | 2.8191,2 | 2.470 |
| Net Realized and Unrealized Gain (Loss) on Investments | (28.064) | (27.449) | 17.837 | (9.801) | 2.587 |
| Total from Investment Operations | (25.107) | (24.680) | 20.356 | (6.982) | 5.057 |
| Distributions | | | | | |
| Dividends from Net Investment Income | (2.743) | (2.700) | (2.936) | (2.368) | (3.857) |
| Distributions from Realized Capital Gains | — | — | — | — | — |
| Total Distributions | (2.743) | (2.700) | (2.936) | (2.368) | (3.857) |
| Net Asset Value, End of Period | $47.90 | $75.75 | $103.13 | $85.71 | $95.06 |
| | | | | | |
| Total Return | -33.87% | -24.34% | 24.06% | -7.55% | 5.82% |
| | | | | | |
| Ratios/Supplemental Data | | | | | |
| Net Assets, End of Period (Millions) | $2,720 | $3,029 | $4,288 | $3,656 | $3,944 |
| Ratio of Total Expenses to Average Net Assets | 0.10% | 0.10% | 0.10% | 0.10% | 0.10% |
| Ratio of Net Investment Income to Average Net Assets | 4.91% | 3.15% | 2.56% | 2.93%2 | 2.86% |
| Portfolio Turnover Rate3 | 8% | 7% | 5% | 11% | 15% |
| 1 | Calculated based on average shares outstanding. |
| 2 | Net investment income per share and the ratio of net investment income to average net assets include $.453 and 0.47%, respectively, from income received as a result of General Electric Co. and Baker Hughes Inc. merger in July 2017. |
| 3 | Excludes the value of portfolio securities received or delivered as a result of in-kind purchases or redemptions of the fund’s capital shares, including ETF Creation Units. |
See accompanying Notes, which are an integral part of the Financial Statements.
Energy Index Fund
Financial Highlights
| Admiral Shares | | | | | |
| | | | | | |
| For a Share Outstanding | Year Ended August 31, |
| Throughout Each Period | 2020 | 2019 | 2018 | 2017 | 2016 |
| Net Asset Value, Beginning of Period | $37.84 | $51.52 | $42.82 | $47.49 | $46.89 |
| Investment Operations | | | | | |
| Net Investment Income | 1.4611 | 1.3881 | 1.2491 | 1.3751,2 | 1.234 |
| Net Realized and Unrealized Gain (Loss) on Investments | (14.001) | (13.720) | 8.916 | (4.863) | 1.293 |
| Total from Investment Operations | (12.540) | (12.332) | 10.165 | (3.488) | 2.527 |
| Distributions | | | | | |
| Dividends from Net Investment Income | (1.370) | (1.348) | (1.465) | (1.182) | (1.927) |
| Distributions from Realized Capital Gains | — | — | — | — | — |
| Total Distributions | (1.370) | (1.348) | (1.465) | (1.182) | (1.927) |
| Net Asset Value, End of Period | $23.93 | $37.84 | $51.52 | $42.82 | $47.49 |
| | | | | | |
| Total Return3 | -33.82% | -24.33% | 24.06% | -7.56% | 5.83% |
| | | | | | |
| Ratios/Supplemental Data | | | | | |
| Net Assets, End of Period (Millions) | $407 | $468 | $642 | $523 | $894 |
| Ratio of Total Expenses to Average Net Assets | 0.10% | 0.10% | 0.10% | 0.10% | 0.10% |
| Ratio of Net Investment Income to Average Net Assets | 4.84% | 3.15% | 2.56% | 2.93%2 | 2.86% |
| Portfolio Turnover Rate4 | 8% | 7% | 5% | 11% | 15% |
| 1 | Calculated based on average shares outstanding. |
| 2 | Net investment income per share and the ratio of net investment income to average net assets include $.228 and 0.47%, respectively, from income received as a result of General Electric Co. and Baker Hughes Inc. merger in July 2017. |
| 3 | Total returns do not include account service fees that may have applied in the periods shown. Fund prospectuses provide information about any applicable account service fees. |
| 4 | Excludes the value of portfolio securities received or delivered as a result of in-kind purchases or redemptions of the fund’s capital shares, including ETF Creation Units. |
See accompanying Notes, which are an integral part of the Financial Statements.
Energy Index Fund
Notes to Financial Statements
Vanguard Energy Index Fund is registered under the Investment Company Act of 1940 as an open-end investment company, or mutual fund. The fund offers two classes of shares: ETF Shares and Admiral Shares. Each of the share classes has different eligibility and minimum purchase requirements, and is designed for different types of investors. ETF Shares are listed for trading on NYSE Arca; they can be purchased and sold through a broker.
Market disruptions associated with the COVID-19 pandemic have had a global impact, and uncertainty exists as to the long-term implications. Such disruptions can adversely affect assets of the fund and thus fund performance.
A. The following significant accounting policies conform to generally accepted accounting principles for U.S. investment companies. The fund consistently follows such policies in preparing its financial statements.
1. Security Valuation: Securities are valued as of the close of trading on the New York Stock Exchange (generally 4 p.m., Eastern time) on the valuation date. Equity securities are valued at the latest quoted sales prices or official closing prices taken from the primary market in which each security trades; such securities not traded on the valuation date are valued at the mean of the latest quoted bid and asked prices. Securities for which market quotations are not readily available, or whose values have been materially affected by events occurring before the fund’s pricing time but after the close of the securities’ primary markets, are valued by methods deemed by the board of trustees to represent fair value. Investments in Vanguard Market Liquidity Fund are valued at that fund’s net asset value.
2. Futures Contracts: The fund uses index futures contracts to a limited extent, with the objectives of maintaining full exposure to the stock market, maintaining liquidity, and minimizing transaction costs. The fund may purchase futures contracts to immediately invest incoming cash in the market, or sell futures in response to cash outflows, thereby simulating a fully invested position in the underlying index while maintaining a cash balance for liquidity. The primary risks associated with the use of futures contracts are imperfect correlation between changes in market values of stocks held by the fund and the prices of futures contracts, and the possibility of an illiquid market. Counterparty risk involving futures is mitigated because a regulated clearinghouse is the counterparty instead of the clearing broker. To further mitigate counterparty risk, the fund trades futures contracts on an exchange, monitors the financial strength of its clearing brokers and clearinghouse, and has entered into clearing agreements with its clearing brokers. The clearinghouse imposes initial margin requirements to secure the fund’s performance and requires daily settlement of variation margin representing changes in the market value of each contract. Any securities pledged as initial margin for open contracts are noted in the Schedule of Investments.
Futures contracts are valued at their quoted daily settlement prices. The notional amounts of the contracts are not recorded in the Statement of Assets and Liabilities. Fluctuations in the value of the contracts are recorded in the Statement of Assets and Liabilities as an asset (liability) and in the Statement of Operations as unrealized appreciation (depreciation) until the contracts are closed, when they are recorded as realized gains (losses) on futures contracts.
During the year ended August 31, 2020, the fund’s average investments in long and short futures contracts represented less than 1% and 0% of net assets, respectively, based on the average of the notional amounts at each quarter-end during the period. The fund had no open futures contracts at August 31, 2020.
3. Swap Contracts: The fund has entered into equity swap contracts to earn the total return on selected reference stocks in the fund’s target index. Under the terms of the swaps, the fund receives the total return on the referenced stock (i.e., receiving the increase or paying the decrease in value of the selected reference stock and receiving the equivalent of any dividends in respect of the selected referenced stock) over a specified period of time, applied to a notional amount that represents the value of a designated number of shares of the selected reference stock at the beginning of the equity swap contract. The fund also pays a floating rate that is based on short-term interest rates, applied to the notional amount. At the same time, the fund generally invests an amount approximating the notional amount of the swap in high-quality temporary cash investments.
A risk associated with all types of swaps is the possibility that a counterparty may default on its obligation to pay net amounts due to the fund. The fund’s maximum amount subject to counterparty risk is the unrealized appreciation on the swap contract. The fund mitigates its counterparty risk by entering into swaps only with a diverse group of prequalified counterparties, monitoring their financial strength, entering into master netting arrangements with its counterparties, and requiring its counterparties to transfer collateral as security for their performance. In the absence of a default,
Energy Index Fund
the collateral pledged or received by the fund cannot be repledged, resold, or rehypothecated. In the event of a counterparty’s default (including bankruptcy), the fund may terminate any swap contracts with that counterparty, determine the net amount owed by either party in accordance with its master netting arrangements, and sell or retain any collateral held up to the net amount owed to the fund under the master netting arrangements. The swap contracts contain provisions whereby a counterparty may terminate open contracts if the fund’s net assets decline below a certain level, triggering a payment by the fund if the fund is in a net liability position at the time of the termination. The payment amount would be reduced by any collateral the fund has pledged. Any securities pledged as collateral for open contracts are noted in the Schedule of Investments. The value of collateral received or pledged is compared daily to the value of the swap contracts exposure with each counterparty, and any difference, if in excess of a specified minimum transfer amount, is adjusted and settled within two business days.
The notional amounts of swap contracts are not recorded in the Statement of Assets and Liabilities. Swaps are valued daily based on market quotations received from independent pricing services or recognized dealers and the change in value is recorded in the Statement of Assets and Liabilities as an asset (liability) and in the Statement of Operations as unrealized appreciation (depreciation) until periodic payments are made or the termination of the swap, at which time realized gain (loss) is recorded.
During the year ended August 31, 2020, the fund’s average amounts of investments in total return swaps represented less than 1% of net assets, based on the average of notional amounts at each quarter-end during the period.
4. Federal Income Taxes: The fund intends to continue to qualify as a regulated investment company and distribute all of its taxable income. The fund’s tax returns are open to examination by the relevant tax authorities until expiration of the applicable statute of limitations, which is generally three years after the filing of the tax return. Management has analyzed the fund’s tax positions taken for all open federal and state income tax years, and has concluded that no provision for income tax is required in the fund’s financial statements.
5. Distributions: Distributions to shareholders are recorded on the ex-dividend date. Distributions are determined on a tax basis at the fiscal year-end and may differ from net investment income and realized capital gains for financial reporting purposes.
6. Securities Lending: To earn additional income, the fund lends its securities to qualified institutional borrowers. Security loans are subject to termination by the fund at any time, and are required to be secured at all times by collateral in an amount at least equal to the market value of securities loaned. Daily market fluctuations could cause the value of loaned securities to be more or less than the value of the collateral received. When this occurs, the collateral is adjusted and settled before the opening of the market on the next business day. The fund further mitigates its counterparty risk by entering into securities lending transactions only with a diverse group of prequalified counterparties, monitoring their financial strength, and entering into master securities lending agreements with its counterparties. The master securities lending agreements provide that, in the event of a counterparty’s default (including bankruptcy), the fund may terminate any loans with that borrower, determine the net amount owed, and sell or retain the collateral up to the net amount owed to the fund; however, such actions may be subject to legal proceedings. While collateral mitigates counterparty risk, in the event of a default, the fund may experience delays and costs in recovering the securities loaned. The fund invests cash collateral received in Vanguard Market Liquidity Fund, and records a liability in the Statement of Assets and Liabilities for the return of the collateral, during the period the securities are on loan. Collateral investments in Vanguard Market Liquidity Fund are subject to market appreciation or depreciation. Securities lending income represents fees charged to borrowers plus income earned on invested cash collateral, less expenses associated with the loan. During the term of the loan, the fund is entitled to all distributions made on or in respect of the loaned securities.
7. Credit Facilities and Interfund Lending Program: The fund and certain other funds managed by The Vanguard Group (“Vanguard”) participate in a $4.3 billion committed credit facility provided by a syndicate of lenders pursuant to a credit agreement and an uncommitted credit facility provided by Vanguard. Both facilities may be renewed annually. Each fund is individually liable for its borrowings, if any, under the credit facilities. Borrowings may be utilized for temporary or emergency purposes, subject to the fund’s regulatory and contractual borrowing restrictions. With respect to the committed credit facility, the participating funds are charged administrative fees and an annual commitment fee of 0.10% of the undrawn committed amount of the facility; these fees are allocated to the funds based on a method approved by the fund’s board of trustees and included in Management and Administrative expenses on the fund’s Statement of Operations. Any borrowings under either facility bear interest
Energy Index Fund
at a rate based upon the higher of the one-month London Interbank Offered Rate (or an acceptable alternate rate, if necessary), federal funds effective rate, or overnight bank funding rate plus an agreed-upon spread, except that borrowings under the uncommitted credit facility may bear interest based upon an alternative rate agreed to by the fund and Vanguard.
In accordance with an exemptive order (the “Order”) from the SEC, the fund may participate in a joint lending and borrowing program that allows registered open-end Vanguard funds to borrow money from and lend money to each other for temporary or emergency purposes (the “Interfund Lending Program”), subject to compliance with the terms and conditions of the Order, and to the extent permitted by the fund’s investment objective and investment policies. Interfund loans and borrowings normally extend overnight, but can have a maximum duration of seven days. Loans may be called on one business day’s notice. The interest rate to be charged is governed by the conditions of the Order and internal procedures adopted by the board of trustees. The board of trustees is responsible for overseeing the Interfund Lending Program.
For the year ended August 31, 2020, the fund did not utilize the credit facilities or the Interfund Lending Program.
8. Other: Dividend income is recorded on the ex-dividend date. Interest income includes income distributions received from Vanguard Market Liquidity Fund and is accrued daily. Security transactions are accounted for on the date securities are bought or sold. Costs used to determine realized gains (losses) on the sale of investment securities are those of the specific securities sold.
Each class of shares has equal rights as to assets and earnings, except that each class separately bears certain class-specific expenses related to maintenance of shareholder accounts (included in Management and Administrative expenses) and shareholder reporting. Marketing and distribution expenses are allocated to each class of shares based on a method approved by the board of trustees. Income, other non-class-specific expenses, and gains and losses on investments are allocated to each class of shares based on its relative net assets.
B. In accordance with the terms of a Funds’ Service Agreement (the “FSA”) between Vanguard and the fund, Vanguard furnishes to the fund investment advisory, corporate management, administrative, marketing, and distribution services at Vanguard’s cost of operations (as defined by the FSA). These costs of operations are allocated to the fund based on methods and guidelines approved by the board of trustees and are generally settled twice a month.
Upon the request of Vanguard, the fund may invest up to 0.40% of its net assets as capital in Vanguard. At August 31, 2020, the fund had contributed to Vanguard capital in the amount of $137,000, representing less than 0.01% of the fund’s net assets and 0.05% of Vanguard’s capital received pursuant to the FSA. The fund’s trustees and officers are also directors and employees, respectively, of Vanguard.
C. The fund’s custodian bank has agreed to reduce its fees when the fund maintains cash on deposit in the non-interest-bearing custody account. For the year ended August 31, 2020, custodian fee offset arrangements reduced the fund’s expenses by $3,000 (an annual rate of less than 0.01% of average net assets).
D. Various inputs may be used to determine the value of the fund’s investments and derivatives. These inputs are summarized in three broad levels for financial statement purposes. The inputs or methodologies used to value securities are not necessarily an indication of the risk associated with investing in those securities.
Level 1—Quoted prices in active markets for identical securities.
Level 2—Other significant observable inputs (including quoted prices for similar securities, interest rates, prepayment speeds, credit risk, etc.).
Level 3—Significant unobservable inputs (including the fund’s own assumptions used to determine the fair value of investments). Any investments and derivatives valued with significant unobservable inputs are noted on the Schedule of Investments.
Energy Index Fund
The following table summarizes the market value of the fund’s investments and derivatives as of August 31, 2020, based on the inputs used to value them:
| | Level 1 | Level 2 | Level 3 | Total |
| | ($000) | ($000) | ($000) | ($000) |
| Investments | | | | |
| Assets | | | | |
| Common Stocks | 3,108,437 | — | — | 3,108,437 |
| Temporary Cash Investments | 11,906 | — | — | 11,906 |
| Total | 3,120,343 | — | — | 3,120,343 |
| Derivative Financial Instruments | | | | |
| Liabilities | | | | |
| Swap Contracts | — | 1,996 | — | 1,996 |
E. Permanent differences between book-basis and tax-basis components of net assets are reclassified among capital accounts in the financial statements to reflect their tax character. These reclassifications have no effect on net assets or net asset value per share. As of period end, permanent differences primarily attributable to the accounting for in-kind redemptions and swap agreements were reclassified between the following accounts:
| | Amount |
| | ($000) |
| Paid-in Capital | 158,621 |
| Total Distributable Earnings (Loss) | (158,621) |
Temporary differences between book-basis and tax-basis components of total distributable earnings (loss) arise when certain items of income, gain, or loss are recognized in different periods for financial statement and tax purposes; these differences will reverse at some time in the future. The differences are primarily related to the deferral of losses from wash sales and the recognition of unrealized gains or losses from certain derivative contracts. As of period end, the tax-basis components of total distributable earnings (loss) are detailed in the table as follows:
| | Amount |
| | ($000) |
| Undistributed Ordinary Income | 36,041 |
| Undistributed Long-Term Gains | — |
| Capital Loss Carryforwards | (975,907) |
| Qualified Late-Year Losses | — |
| Net Unrealized Gains (Losses) | (2,594,985) |
The tax character of distributions paid was as follows:
| | Year Ended August 31, |
| | 2020 | 2019 |
| | Amount | Amount |
| | ($000) | ($000) |
| Ordinary Income* | 143,456 | 129,080 |
| Long-Term Capital Gains | — | — |
| Total | 143,456 | 129,080 |
* Includes short-term capital gains, if any.
Energy Index Fund
As of August 31, 2020, gross unrealized appreciation and depreciation for investments and derivatives based on cost for U.S. federal income tax purposes were as follows:
| | Amount |
| | ($000) |
| Tax Cost | 5,715,328 |
| Gross Unrealized Appreciation | 73,302 |
| Gross Unrealized Depreciation | (2,668,287) |
| Net Unrealized Appreciation (Depreciation) | (2,594,985) |
F. During the year ended August 31, 2020, the fund purchased $2,165,641,000 of investment securities and sold $1,378,853,000 of investment securities, other than temporary cash investments. Purchases and sales include $1,621,006,000 and $1,106,913,000, respectively, in connection with in-kind purchases and redemptions of the fund’s capital shares.
G. Capital share transactions for each class of shares were:
| | Year Ended August 31, |
| | | 2020 | | | 2019 |
| | Amount | Shares | | Amount | Shares |
| | ($000) | (000) | | ($000) | (000) |
| ETF Shares | | | | | |
| Issued | 1,802,367 | 36,134 | | 743,090 | 8,685 |
| Issued in Lieu of Cash Distributions | — | — | | — | — |
| Redeemed | (1,108,388) | (19,350) | | (891,573) | (10,275) |
| Net Increase (Decrease)—ETF Shares | 693,979 | 16,784 | | (148,483) | (1,590) |
| Admiral Shares | | | | | |
| Issued | 415,739 | 16,420 | | 174,793 | 4,125 |
| Issued in Lieu of Cash Distributions | 16,719 | 566 | | 15,012 | 333 |
| Redeemed | (350,766) | (12,349) | | (197,788) | (4,550) |
| Net Increase (Decrease)—Admiral Shares | 81,692 | 4,637 | | (7,983) | (92) |
H. Management has determined that no events or transactions occurred subsequent to August 31, 2020, that would require recognition or disclosure in these financial statements.
Financials Index Fund
Performance Summary
All of the returns in this report represent past performance, which is not a guarantee of future results that may be achieved by the fund. (Current performance may be lower or higher than the performance data cited. For performance data current to the most recent month-end, visit our website at vanguard.com/performance.) Note, too, that both investment returns and principal value can fluctuate widely, so an investor’s shares, when sold, could be worth more or less than their original cost. The returns shown do not reflect taxes that a shareholder would pay on fund distributions or on the sale of fund shares.
Cumulative Performance: August 31, 2010–August 31, 2020
Initial Investment of $10,000
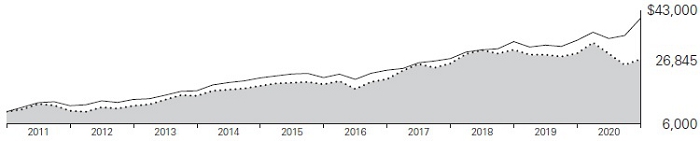
| | | | Average Annual Total Returns | Final Value |
| | | Periods Ended August 31, 2020 | of a $10,000 |
| | | One Year | Five Years | Ten Years | Investment |
 | Financials Index Fund ETF Shares Net Asset Value | -6.73% | 7.36% | 10.38% | $26,845 |
| | Financials Index Fund ETF Shares Market Price | -6.67 | 7.36 | 10.40 | 26,885 |
 | MSCI US IMI/Financials 25/50 | -6.62 | 7.47 | 10.49 | 27,109 |
 | MSCI US IMI/2500 | 21.48 | 13.88 | 14.99 | 40,426 |
| | | | | | |
| | | | | | Final Value |
| | | | | | of a $100,000 |
| | | One Year | Five Years | Ten Years | Investment |
| Financials Index Fund Admiral Shares | -6.70% | 7.37% | 10.39% | $268,659 |
| MSCI US IMI/Financials 25/50 | -6.62 | 7.47 | 10.49 | 271,093 |
| MSCI US IMI/2500 | 21.48 | 13.88 | 14.99 | 404,265 |
| | | | | | |
| | | | | | |
| Cumulative Returns: ETF Shares, August 31, 2010–August 31, 2020 | | |
| | | |
| | | | One Year | Five Years | Ten Years |
| Financials Index Fund ETF Shares Market Price | | -6.67% | 42.64% | 168.85% |
| Financials Index Fund ETF Shares Net Asset Value | | -6.73 | 42.65 | 168.45 |
| MSCI US IMI/Financials 25/50 | | -6.62 | 43.35 | 171.09 |
For the ETF Shares, the market price is determined by the midpoint of the bid-offer spread as of the closing time of the New York Stock Exchange (generally 4 p.m., Eastern time). The net asset value is also determined as of the NYSE closing time. For more information about how the ETF Shares’ market prices have compared with their net asset value, visit vanguard.com, select your ETF, and then select the Price and Performance tab. The ETF premium/discount analysis there shows the percentages of days on which the ETF Shares’ market price was above or below the NAV.
See Financial Highlights for dividend and capital gains information.
Financials Index Fund
Fund Allocation
As of August 31, 2020
| | |
| Asset Management & Custody Banks | 9.4% |
| Consumer Finance | 4.9 |
| Diversified Banks | 22.5 |
| Financial Exchanges & Data | 10.7 |
| Insurance Brokers | 4.9 |
| Investment Banking & Brokerage | 6.9 |
| Life & Health Insurance | 4.0 |
| Mortgage REITs | 1.5 |
| Multi-Line Insurance | 1.7 |
| Multi-Sector Holdings | 9.3 |
| Other Diversified Financial Services | 0.5 |
| Property & Casualty Insurance | 8.9 |
| Regional Banks | 12.6 |
| Reinsurance | 1.1 |
| Thrifts & Mortgage Finance | 1.1 |
The table reflects the fund’s investments, except for short-term investments and derivatives. Sector categories are based on the Global Industry Classification Standard (“GICS”), except for the “Other” category (if applicable), which includes securities that have not been provided a GICS classification as of the effective reporting period.
The fund may invest in derivatives (such as futures and swap contracts) for various reasons, including, but not limited to, attempting to remain fully invested and tracking its target index as closely as possible.
The Global Industry Classification Standard (“GICS”) was developed by and is the exclusive property and a service mark of MSCI Inc. (“MSCI”) and Standard and Poor’s, a division of McGraw-Hill Companies, Inc. (“S&P”), and is licensed for use by Vanguard. Neither MSCI, S&P nor any third party involved in making or compiling the GICS or any GICS classification makes any express or implied warranties or representations with respect to such standard or classification (or the results to be obtained by the use thereof), and all such parties hereby expressly disclaim all warranties of originality, accuracy, completeness, merchantability or fitness for a particular purpose with respect to any such standard or classification. Without limiting any of the foregoing, in no event shall MSCI, S&P, any of its affiliates or any third party involved in making or compiling the GICS or any GICS classification have any liability for any direct, indirect, special, punitive, consequential or any other damages (including lost profits) even if notified of the possibility of such damages.
Financials Index Fund
Financial Statements
Schedule of Investments
As of August 31, 2020
The fund files its complete schedule of portfolio holdings with the Securities and Exchange Commission (SEC) for the first and third quarters of each fiscal year as an exhibit to its reports on Form N-PORT. The fund’s Form N-PORT reports are available on the SEC’s website at www.sec.gov.
| | | | Market |
| | | | Value● |
| | | Shares | ($000) |
| Common Stocks (99.8%) | | |
| Banks (35.2%) | | |
| | JPMorgan Chase & Co. | 5,964,095 | 597,543 |
| | Bank of America Corp. | 15,283,059 | 393,386 |
| | Citigroup Inc. | 4,074,847 | 208,306 |
| | Wells Fargo & Co. | 7,624,275 | 184,126 |
| | Truist Financial Corp. | 2,637,491 | 102,361 |
| | US Bancorp | 2,653,632 | 96,592 |
| | PNC Financial Services Group Inc. | 830,428 | 92,344 |
| | First Republic Bank | 335,553 | 37,887 |
| | Fifth Third Bancorp | 1,393,544 | 28,791 |
| | M&T Bank Corp. | 251,110 | 25,930 |
| * | SVB Financial Group | 100,820 | 25,747 |
| | KeyCorp | 1,909,388 | 23,524 |
| | Regions Financial Corp. | 1,878,712 | 21,718 |
| | Citizens Financial Group Inc. | 836,174 | 21,632 |
| | Huntington Bancshares Inc. | 1,984,425 | 18,673 |
| | Commerce Bancshares Inc. | 196,311 | 11,694 |
| | Comerica Inc. | 272,213 | 10,761 |
| | Zions Bancorp NA | 321,657 | 10,344 |
| | First Horizon National Corp. | 1,076,202 | 10,278 |
| | East West Bancorp Inc. | 276,942 | 10,186 |
| | Signature Bank | 104,852 | 10,174 |
| | Prosperity Bancshares Inc. | 181,348 | 9,887 |
| | People’s United Financial Inc. | 831,101 | 8,793 |
| | Cullen/Frost Bankers Inc. | 116,052 | 8,061 |
| | TCF Financial Corp. | 298,028 | 8,011 |
| | South State Corp. | 138,818 | 7,729 |
| | First Financial Bankshares Inc. | 249,394 | 7,550 |
| | Western Alliance Bancorp | 187,512 | 6,619 |
| | United Bankshares Inc. | 252,410 | 6,598 |
| | Glacier Bancorp Inc. | 186,673 | 6,549 |
| | Synovus Financial Corp. | 288,883 | 6,318 |
| | Popular Inc. | 167,785 | 6,215 |
| | Community Bank System Inc. | 101,934 | 6,133 |
| | Pinnacle Financial Partners Inc. | 148,392 | 5,928 |
| | Valley National Bancorp | 751,794 | 5,646 |
| | Bank OZK | 239,820 | 5,525 |
| | Home BancShares Inc. | 306,628 | 4,970 |
| | Wintrust Financial Corp. | 113,020 | 4,919 |
| | Umpqua Holdings Corp. | 432,911 | 4,883 |
| | Webster Financial Corp. | 176,420 | 4,852 |
| | UMB Financial Corp. | 89,325 | 4,799 |
| | FNB Corp. | 630,941 | 4,732 |
| | CVB Financial Corp. | 251,841 | 4,586 |
| | Old National Bancorp | 323,030 | 4,516 |
| | BancorpSouth Bank | 206,916 | 4,465 |
| | Sterling Bancorp | 380,034 | 4,435 |
| | Bank of Hawaii Corp. | 78,867 | 4,341 |
| | PacWest Bancorp | 226,461 | 4,321 |
| | BankUnited Inc. | 180,870 | 4,229 |
| | First Hawaiian Inc. | 252,747 | 4,178 |
| | Independent Bank Corp. of Rockland Massachusetts | 64,422 | 4,049 |
| | Associated Banc-Corp | 298,784 | 4,016 |
| | Columbia Banking System Inc. | 141,177 | 3,940 |
| | First Citizens BancShares Inc. Class A | 9,860 | 3,876 |
| | Pacific Premier Bancorp Inc. | 167,032 | 3,773 |
| | CIT Group Inc. | 191,288 | 3,763 |
| | Cathay General Bancorp | 149,040 | 3,680 |
| | Simmons First National Corp. Class A | 213,207 | 3,639 |
| | Investors Bancorp Inc. | 465,278 | 3,606 |
| | Atlantic Union Bankshares Corp. | 153,793 | 3,577 |
| | BOK Financial Corp. | 61,755 | 3,467 |
| | Hancock Whitney Corp. | 170,008 | 3,402 |
| | Independent Bank Group Inc. | 72,266 | 3,360 |
| | International Bancshares Corp. | 105,249 | 3,324 |
| | ServisFirst Bancshares Inc. | 89,976 | 3,298 |
| | Westamerica BanCorp | 53,175 | 3,236 |
| | Ameris Bancorp | 130,074 | 3,189 |
| * | Texas Capital Bancshares Inc. | 97,896 | 3,171 |
| | Fulton Financial Corp. | 318,573 | 3,116 |
| | United Community Banks Inc. | 160,590 | 2,910 |
| | WesBanco Inc. | 130,613 | 2,902 |
| | Renasant Corp. | 109,902 | 2,788 |
| | First Midwest Bancorp Inc. | 223,767 | 2,788 |
| | Trustmark Corp. | 117,267 | 2,753 |
| | First Interstate BancSystem Inc. Class A | 83,322 | 2,733 |
| | Hilltop Holdings Inc. | 132,605 | 2,732 |
| | First Merchants Corp. | 105,863 | 2,708 |
| | First Financial Bancorp | 191,332 | 2,625 |
| | NBT Bancorp Inc. | 84,446 | 2,573 |
| | Park National Corp. | 28,446 | 2,558 |
| | Towne Bank | 144,011 | 2,553 |
| | Banner Corp. | 68,988 | 2,492 |
| | First BanCorp | 422,526 | 2,421 |
| | Cadence BanCorp Class A | 249,230 | 2,368 |
| | Lakeland Financial Corp. | 49,624 | 2,267 |
| | Heartland Financial USA Inc. | 65,794 | 2,265 |
| | Sandy Spring Bancorp Inc. | 87,650 | 2,097 |
| * | Seacoast Banking Corp. of Florida | 103,514 | 2,095 |
| | Hope Bancorp Inc. | 241,991 | 2,047 |
| | City Holding Co. | 31,470 | 2,013 |
| | Stock Yards Bancorp Inc. | 42,690 | 1,833 |
| | OceanFirst Financial Corp. | 114,673 | 1,790 |
| | Eagle Bancorp Inc. | 61,024 | 1,756 |
| | FB Financial Corp. | 64,702 | 1,747 |
| | Tompkins Financial Corp. | 26,147 | 1,730 |
| | National Bank Holdings Corp. Class A | 60,387 | 1,717 |
| | Southside Bancshares Inc. | 62,117 | 1,712 |
| | First Busey Corp. | 94,446 | 1,683 |
| | Veritex Holdings Inc. | 89,316 | 1,606 |
| | First Commonwealth Financial Corp. | 192,516 | 1,579 |
| | BancFirst Corp. | 34,810 | 1,532 |
| | Great Western Bancorp Inc. | 109,520 | 1,526 |
| | Brookline Bancorp Inc. | 153,900 | 1,477 |
| | S&T Bancorp Inc. | 73,071 | 1,476 |
| | Enterprise Financial Services Corp. | 49,165 | 1,471 |
| | TriCo Bancshares | 52,318 | 1,449 |
| | Heritage Financial Corp. | 70,625 | 1,408 |
| | German American Bancorp Inc. | 49,612 | 1,407 |
| * | Triumph Bancorp Inc. | 45,283 | 1,293 |
| | OFG Bancorp | 100,482 | 1,290 |
| | 1st Source Corp. | 37,104 | 1,278 |
| | Live Oak Bancshares Inc. | 57,091 | 1,266 |
| | First Bancorp | 56,953 | 1,165 |
| | First Foundation Inc. | 73,345 | 1,114 |
| * | Nicolet Bankshares Inc. | 18,436 | 1,107 |
| | Preferred Bank | 28,800 | 1,077 |
| | Bryn Mawr Bank Corp. | 38,845 | 1,054 |
| | Lakeland Bancorp Inc. | 98,279 | 1,045 |
| | Community Trust Bancorp Inc. | 31,038 | 1,002 |
| | ConnectOne Bancorp Inc. | 65,944 | 997 |
| | Washington Trust Bancorp Inc. | 29,834 | 996 |
| | Origin Bancorp Inc. | 40,885 | 968 |
| | Banc of California Inc. | 87,962 | 967 |
| | Camden National Corp. | 29,503 | 963 |
| | Boston Private Financial Holdings Inc. | 161,651 | 960 |
| | Allegiance Bancshares Inc. | 37,205 | 946 |
| * | Bancorp Inc. | 99,086 | 941 |
| | Univest Financial Corp. | 56,047 | 902 |
| | Horizon Bancorp Inc. | 78,832 | 881 |
| | HarborOne Bancorp Inc. | 100,921 | 873 |
| | QCR Holdings Inc. | 28,910 | 866 |
| | Central Pacific Financial Corp. | 55,335 | 857 |
| | Bank First Corp. | 13,589 | 848 |
| * | CrossFirst Bankshares Inc. | 91,505 | 845 |
| | Great Southern Bancorp Inc. | 21,857 | 842 |
| | Arrow Financial Corp. | 29,140 | 835 |
| | First Bancshares Inc. | 38,760 | 831 |
| | Heritage Commerce Corp. | 116,011 | 804 |
| | Berkshire Hills Bancorp Inc. | 87,389 | 802 |
| | Peoples Bancorp Inc. | 36,992 | 782 |
| | First Financial Corp. | 22,642 | 779 |
Financials Index Fund
| | | | Market |
| | | | Value● |
| | | Shares | ($000) |
| | Bank of Marin Bancorp | 24,026 | 765 |
| | First Mid Bancshares Inc. | 29,089 | 757 |
| * | Customers Bancorp Inc. | 57,796 | 738 |
| | First of Long Island Corp. | 46,854 | 720 |
| | Dime Community Bancshares Inc. | 53,325 | 688 |
| | Bridge Bancorp Inc. | 33,341 | 667 |
| | Mercantile Bank Corp. | 30,461 | 665 |
| | Cambridge Bancorp | 11,880 | 652 |
| | Altabancorp | 31,402 | 648 |
| * | TriState Capital Holdings Inc. | 45,296 | 630 |
| | Farmers National Banc Corp. | 53,308 | 622 |
| | Bar Harbor Bankshares | 30,664 | 621 |
| | Midland States Bancorp Inc. | 42,486 | 621 |
| | Flushing Financial Corp. | 50,149 | 608 |
| | Byline Bancorp Inc. | 48,113 | 608 |
| | First Community Bankshares Inc. | 31,607 | 608 |
| | Independent Bank Corp. | 40,700 | 607 |
| | Peapack-Gladstone Financial Corp. | 35,096 | 597 |
| | CBTX Inc. | 36,761 | 579 |
| | MidWestOne Financial Group Inc. | 30,355 | 576 |
| | West BanCorp Inc. | 31,996 | 563 |
| | Hanmi Financial Corp. | 58,403 | 557 |
| * | Amerant Bancorp Inc. | 42,247 | 556 |
| | Sierra Bancorp | 29,047 | 519 |
| | Financial Institutions Inc. | 29,705 | 512 |
| * | Atlantic Capital Bancshares Inc. | 41,755 | 482 |
| | CNB Financial Corp. | 30,038 | 479 |
| | Capital City Bank Group Inc. | 23,354 | 473 |
| | HomeTrust Bancshares Inc. | 32,416 | 455 |
| * | Equity Bancshares Inc. Class A | 28,142 | 447 |
| | Old Second Bancorp Inc. | 53,277 | 435 |
| | RBB Bancorp | 33,453 | 434 |
| | Civista Bancshares Inc. | 30,260 | 404 |
| | Century Bancorp Inc. Class A | 5,548 | 391 |
| | Macatawa Bank Corp. | 50,877 | 372 |
| | Southern National Bancorp of Virginia Inc. | 37,177 | 318 |
| | Amalgamated Bank Class A | 26,962 | 317 |
| * | Republic First Bancorp Inc. | 89,224 | 186 |
| | | | 2,313,907 |
| Capital Markets (26.9%) | | |
| | BlackRock Inc. | 298,376 | 177,292 |
| | S&P Global Inc. | 471,530 | 172,778 |
| | Goldman Sachs Group Inc. | 639,495 | 131,013 |
| | CME Group Inc. | 701,919 | 123,447 |
| | Morgan Stanley | 2,313,114 | 120,883 |
| | Intercontinental Exchange Inc. | 1,071,140 | 113,787 |
| | Moody’s Corp. | 330,325 | 97,327 |
| | Charles Schwab Corp. | 2,268,062 | 80,584 |
| | Blackstone Group LP Class A | 1,311,288 | 69,433 |
| | MSCI Inc. Class A | 166,398 | 62,111 |
| | Bank of New York Mellon Corp. | 1,560,031 | 57,690 |
| | T. Rowe Price Group Inc. | 345,390 | 48,082 |
| | State Street Corp. | 688,909 | 46,908 |
| | Ameriprise Financial Inc. | 239,475 | 37,550 |
| | MarketAxess Holdings Inc. | 74,201 | 36,057 |
| | KKR & Co. Inc. | 984,146 | 35,252 |
| | Northern Trust Corp. | 386,713 | 31,668 |
| | Nasdaq Inc. | 224,817 | 30,220 |
| | FactSet Research Systems Inc. | 74,136 | 25,977 |
| | E*TRADE Financial Corp. | 432,703 | 23,409 |
| | TD Ameritrade Holding Corp. | 529,487 | 20,322 |
| | Cboe Global Markets Inc. | 214,969 | 19,732 |
| | Raymond James Financial Inc. | 241,435 | 18,282 |
| | Apollo Global Management LLC | 335,994 | 15,748 |
| | SEI Investments Co. | 246,319 | 12,897 |
| | LPL Financial Holdings Inc. | 154,089 | 12,660 |
| | Franklin Resources Inc. | 580,382 | 12,223 |
| | Tradeweb Markets Inc. Class A | 164,289 | 9,412 |
| | Eaton Vance Corp. | 222,394 | 9,123 |
| | Ares Management Corp. Class A | 194,494 | 7,867 |
| | Invesco Ltd. | 763,970 | 7,793 |
| | Interactive Brokers Group Inc. | 143,328 | 7,599 |
| | Morningstar Inc. | 45,875 | 7,347 |
| | Carlyle Group Inc. | 273,691 | 7,064 |
| | Stifel Financial Corp. | 134,177 | 6,804 |
| | Janus Henderson Group plc | 306,567 | 6,352 |
| | Affiliated Managers Group Inc. | 92,169 | 6,327 |
| | Houlihan Lokey Inc. Class A | 96,759 | 5,670 |
| | Evercore Inc. Class A | 79,063 | 4,892 |
| | Federated Hermes Inc. Class B | 187,610 | 4,486 |
| | Artisan Partners Asset Management Inc. Class A | 112,791 | 4,366 |
| | Moelis & Co. Class A | 108,201 | 3,453 |
| | Hamilton Lane Inc. Class A | 46,502 | 3,400 |
| | Virtu Financial Inc. Class A | 118,043 | 3,049 |
| | Cohen & Steers Inc. | 46,831 | 2,833 |
| | Piper Sandler Cos. | 33,413 | 2,521 |
| | PJT Partners Inc. | 40,047 | 2,370 |
| | Virtus Investment Partners Inc. | 15,067 | 2,138 |
| | Waddell & Reed Financial Inc. Class A | 120,464 | 1,897 |
| * | StoneX Group Inc. | 32,012 | 1,815 |
| * | Focus Financial Partners Inc. Class A | 50,933 | 1,803 |
| | Brightsphere Investment Group Inc. | 125,664 | 1,742 |
| | BGC Partners Inc. Class A | 543,234 | 1,369 |
| * | Blucora Inc. | 92,615 | 1,105 |
| | Cowen Inc. Class A | 50,156 | 907 |
| | WisdomTree Investments Inc. | 242,481 | 907 |
| | B Riley Financial Inc. | 28,761 | 770 |
| | Diamond Hill Investment Group Inc. | 5,986 | 742 |
| * | Donnelley Financial Solutions Inc. | 58,912 | 642 |
| | Victory Capital Holdings Inc. Class A | 32,343 | 563 |
| | Oppenheimer Holdings Inc. Class A | 18,886 | 461 |
| | Sculptor Capital Management Inc. Class A | 32,240 | 412 |
| | Greenhill & Co. Inc. | 27,660 | 310 |
| | Associated Capital Group Inc. Class A | 6,718 | 260 |
| | Pzena Investment Management Inc. Class A | 33,763 | 167 |
| | Westwood Holdings Group Inc. | 14,600 | 166 |
| | GAMCO Investors Inc. Class A | 9,776 | 123 |
| | | | 1,764,359 |
| Consumer Finance (4.9%) | | |
| | American Express Co. | 1,339,096 | 136,039 |
| | Capital One Financial Corp. | 891,746 | 61,557 |
| | Discover Financial Services | 599,483 | 31,821 |
| | Synchrony Financial | 1,028,377 | 25,514 |
| | Ally Financial Inc. | 729,634 | 16,694 |
| *,^ | Credit Acceptance Corp. | 18,997 | 7,348 |
| * | Green Dot Corp. Class A | 98,472 | 5,126 |
| | SLM Corp. | 660,886 | 5,049 |
| | FirstCash Inc. | 81,558 | 4,873 |
| *,^ | LendingTree Inc. | 15,301 | 4,727 |
| | OneMain Holdings Inc | 158,760 | 4,617 |
| * | PRA Group Inc. | 89,544 | 4,180 |
| | Navient Corp. | 376,429 | 3,422 |
| | Santander Consumer USA Holdings Inc. | 156,493 | 2,693 |
| | Nelnet Inc. Class A | 38,654 | 2,531 |
| * | Encore Capital Group Inc. | 54,643 | 2,510 |
| * | Enova International Inc. | 58,821 | 1,005 |
| * | World Acceptance Corp. | 10,095 | 919 |
| * | LendingClub Corp. | 120,412 | 642 |
| * | EZCORP Inc. Class A | 103,583 | 557 |
| | Curo Group Holdings Corp. | 35,504 | 273 |
| | 322,097 |
| Diversified Financial Services (9.7%) | |
| * | Berkshire Hathaway Inc. Class B | 2,722,171 | 593,542 |
| | Equitable Holdings Inc. | 793,788 | 16,820 |
| | Voya Financial Inc. | 247,023 | 12,823 |
| | Jefferies Financial Group Inc. | 445,597 | 7,816 |
| * | Cannae Holdings Inc. | 158,967 | 5,998 |
| * | On Deck Capital Inc. | 100,600 | 163 |
| | | | 637,162 |
| Insurance (20.5%) | | |
| | Marsh & McLennan Cos. Inc. | 998,671 | 114,757 |
| | Chubb Ltd. | 883,463 | 110,433 |
| | Progressive Corp. | 1,145,577 | 108,876 |
| | Aon plc Class A | 452,319 | 90,459 |
| | MetLife Inc. | 1,509,948 | 58,073 |
| | Travelers Cos. Inc. | 494,876 | 57,425 |
| | Allstate Corp. | 614,817 | 57,178 |
| | Prudential Financial Inc. | 772,878 | 52,378 |
| | Willis Towers Watson plc | 251,965 | 51,786 |
| | American International Group Inc. | 1,685,862 | 49,126 |
| | Aflac Inc. | 1,334,382 | 48,465 |
| | Arthur J Gallagher & Co. | 371,083 | 39,075 |
| * | Markel Corp. | 26,963 | 29,304 |
Financials Index Fund
| | | | Market |
| | | | Value● |
| | | Shares | ($000) |
| | Hartford Financial Services Group Inc. | 700,856 | 28,350 |
| * | Arch Capital Group Ltd. | 793,985 | 25,042 |
| | Cincinnati Financial Corp. | 301,671 | 23,956 |
| | Principal Financial Group Inc. | 536,308 | 22,584 |
| | Brown & Brown Inc. | 471,317 | 21,869 |
| | RenaissanceRe Holdings Ltd. | 97,859 | 17,981 |
| | Fidelity National Financial Inc. | 544,864 | 17,888 |
| | Loews Corp. | 495,766 | 17,778 |
| | W R Berkley Corp. | 279,853 | 17,365 |
| | Everest Re Group Ltd. | 78,264 | 17,224 |
| | Globe Life Inc. | 197,919 | 16,324 |
| | Alleghany Corp. | 27,985 | 15,519 |
| | Assurant Inc. | 116,957 | 14,217 |
| | Lincoln National Corp. | 378,223 | 13,635 |
| | Reinsurance Group of America Inc. | 132,575 | 12,154 |
| | First American Financial Corp. | 218,093 | 11,465 |
| | Erie Indemnity Co. Class A | 49,727 | 10,614 |
| | American Financial Group Inc. | 149,511 | 9,995 |
| | Primerica Inc. | 79,807 | 9,964 |
| | Kemper Corp. | 121,282 | 9,419 |
| | Old Republic International Corp. | 565,473 | 9,110 |
| * | Athene Holding Ltd. Class A | 247,074 | 9,033 |
| | Kinsale Capital Group Inc. | 41,404 | 8,580 |
| | Axis Capital Holdings Ltd. | 165,059 | 7,883 |
| | Hanover Insurance Group Inc. | 74,330 | 7,618 |
| | RLI Corp. | 78,849 | 7,395 |
| | Unum Group | 399,688 | 7,386 |
| | Selective Insurance Group Inc. | 117,407 | 7,022 |
| * | Brighthouse Financial Inc. | 183,608 | 5,574 |
| | White Mountains Insurance Group Ltd. | 6,081 | 5,421 |
| | CNO Financial Group Inc. | 280,362 | 4,570 |
| | National General Holdings Corp. | 133,242 | 4,537 |
| | American Equity Investment Life Holding Co. | 180,172 | 4,308 |
| * | Enstar Group Ltd. | 23,671 | 4,237 |
| * | Palomar Holdings Inc. | 33,423 | 3,755 |
| * | Trupanion Inc. | 58,822 | 3,690 |
| | Assured Guaranty Ltd. | 170,233 | 3,652 |
| | Horace Mann Educators Corp. | 80,161 | 3,131 |
| * | Genworth Financial Inc. Class A | 1,001,056 | 3,023 |
| | Goosehead Insurance Inc. Class A | 28,259 | 2,904 |
| | James River Group Holdings Ltd. | 59,249 | 2,886 |
| * | eHealth Inc. | 45,117 | 2,848 |
| | AMERISAFE Inc. | 38,294 | 2,555 |
| | Argo Group International Holdings Ltd. | 64,936 | 2,412 |
| | Mercury General Corp. | 53,536 | 2,395 |
| | Stewart Information Services Corp. | 51,243 | 2,187 |
| | Safety Insurance Group Inc. | 28,438 | 2,059 |
| | Employers Holdings Inc. | 59,398 | 1,935 |
| | ProAssurance Corp. | 105,152 | 1,611 |
| * | Third Point Reinsurance Ltd. | 164,259 | 1,406 |
| | American National Insurance Co. | 15,535 | 1,165 |
| | Universal Insurance Holdings Inc. | 60,652 | 1,125 |
| * | Ambac Financial Group Inc. | 87,502 | 1,105 |
| | United Fire Group Inc. | 42,888 | 1,080 |
| | National Western Life Group Inc. Class A | 4,691 | 1,032 |
| * | MBIA Inc. | 125,899 | 1,021 |
| | HCI Group Inc. | 12,886 | 705 |
| | Heritage Insurance Holdings Inc. | 51,103 | 667 |
| * | Citizens Inc. Class A | 96,825 | 566 |
| * | Watford Holdings Ltd. | 32,937 | 527 |
| * | Global Indemnity Group LLC Class A | 17,526 | 407 |
| * | Greenlight Capital Re Ltd. Class A | 52,894 | 385 |
| | United Insurance Holdings Corp. | 40,754 | 309 |
| | Protective Insurance Corp. Class B | 17,136 | 246 |
| | | | 1,346,141 |
| Mortgage Real Estate Investment Trusts (REITs) (1.5%) | |
| | Annaly Capital Management Inc. | 2,797,918 | 20,565 |
| | AGNC Investment Corp. | 1,094,172 | 15,439 |
| | Starwood Property Trust Inc. | 554,293 | 8,647 |
| | New Residential Investment Corp. | 814,662 | 6,305 |
| | Hannon Armstrong Sustainable Infrastructure Capital Inc. | 143,373 | 6,088 |
| | Blackstone Mortgage Trust Inc. Class A | 253,397 | 6,023 |
| | PennyMac Mortgage Investment Trust | 195,081 | 3,344 |
| | Chimera Investment Corp. | 375,271 | 3,336 |
| | Two Harbors Investment Corp. | 533,030 | 2,905 |
| | Apollo Commercial Real Estate Finance Inc. | 290,619 | 2,598 |
| | Broadmark Realty Capital Inc. | 244,218 | 2,393 |
| | MFA Financial Inc. | 883,962 | 2,369 |
| | Arbor Realty Trust Inc. | 204,783 | 2,318 |
| | New York Mortgage Trust Inc. | 753,024 | 1,988 |
| | Redwood Trust Inc. | 226,152 | 1,567 |
| | Ladder Capital Corp. Class A | 200,487 | 1,494 |
| | ARMOUR Residential REIT Inc. | 125,801 | 1,219 |
| ^ | Invesco Mortgage Capital Inc. | 397,189 | 1,192 |
| | Capstead Mortgage Corp. | 186,474 | 1,150 |
| | KKR Real Estate Finance Trust Inc. | 61,345 | 1,116 |
| | Ellington Financial Inc. | 80,319 | 1,001 |
| | Colony Credit Real Estate Inc. | 163,176 | 982 |
| | Ready Capital Corp. | 85,049 | 870 |
| | TPG RE Finance Trust Inc. | 88,865 | 784 |
| | Granite Point Mortgage Trust Inc. | 105,564 | 701 |
| | Dynex Capital Inc. | 43,716 | 692 |
| | Orchid Island Capital Inc. | 124,220 | 635 |
| | Ares Commercial Real Estate Corp. | 61,432 | 612 |
| | Anworth Mortgage Asset Corp. | 186,220 | 322 |
| | Western Asset Mortgage Capital Corp. | 100,244 | 228 |
| ^ | AG Mortgage Investment Trust Inc. | 61,537 | 171 |
| | Exantas Capital Corp. | 60,445 | 141 |
| | | | 99,195 |
| Other (0.0%)1 | |
| *,§ | NewStar Financial Inc. CVR | 42,593 | 4 |
| *,§ | American International Group Inc. Warrants Exp. 01/19/2021 | 7,950 | — |
| | | | 4 |
| Thrifts & Mortgage Finance (1.1%) | |
| | New York Community Bancorp Inc. | 910,262 | 8,238 |
| | Essent Group Ltd. | 216,490 | 7,729 |
| | PennyMac Financial Services Inc. | 123,999 | 6,537 |
| | MGIC Investment Corp. | 662,735 | 6,077 |
| | Radian Group Inc. | 372,652 | 5,754 |
| | Washington Federal Inc. | 147,834 | 3,467 |
| | Walker & Dunlop Inc. | 57,285 | 3,138 |
| | WSFS Financial Corp. | 100,365 | 2,941 |
| * | NMI Holdings Inc. Class A | 160,290 | 2,749 |
| * | Mr Cooper Group Inc. | 146,294 | 2,681 |
| | Flagstar Bancorp Inc. | 82,916 | 2,605 |
| * | Axos Financial Inc. | 104,495 | 2,589 |
| | Capitol Federal Financial Inc. | 266,469 | 2,489 |
| | Northwest Bancshares Inc. | 239,967 | 2,426 |
| | Provident Financial Services Inc. | 137,094 | 1,807 |
| | Premier Financial Corp. | 72,276 | 1,321 |
| | HomeStreet Inc. | 46,449 | 1,271 |
| | Kearny Financial Corp. | 157,066 | 1,219 |
| | Federal Agricultural Mortgage Corp. Class C | 17,728 | 1,208 |
| | Meta Financial Group Inc. | 59,941 | 1,156 |
| | TrustCo Bank Corp. NY | 186,842 | 1,114 |
| | Meridian Bancorp Inc. | 93,303 | 1,086 |
| * | Columbia Financial Inc. | 98,626 | 1,052 |
| | Northfield Bancorp Inc. | 85,522 | 826 |
| | Waterstone Financial Inc. | 47,785 | 740 |
| | The Hingham Institution For Savings | 2,483 | 455 |
| * | Bridgewater Bancshares Inc. | 44,859 | 436 |
| | PCSB Financial Corp. | 29,944 | 380 |
| | Home Bancorp Inc. | 14,770 | 357 |
| | Merchants Bancorp | 16,288 | 332 |
| * | Ocwen Financial Corp. | 14,405 | 274 |
| | | | 74,454 |
| Road & Rail (0.0%) | | |
| * | Morgan Group Holding Co. | 153 | 1 |
Total Common Stocks
(Cost $7,205,284) | | 6,557,320 |
Financials Index Fund
| | | | Market |
| | | | Value· |
| | | Shares | ($000) |
| Temporary Cash Investments (0.2%) | |
| 2,3 | Vanguard Market Liquidity Fund, 0.147% (Cost $12,697) | 126,984 | 12,699 |
Total Investments (100.0%)
(Cost $7,217,981) | | 6,570,019 |
| Other Assets and Liabilities—Net (0.0%) | | 2,361 |
| Net Assets (100%) | | 6,572,380 |
| | | | |
Cost is in $000.
| · | See Note A in Notes to Financial Statements. |
| * | Non-income-producing security. |
| ^ | Includes partial security positions on loan to broker-dealers. The total value of securities on loan is $6,161,000. |
| § | Security value determined using significant unobservable inputs. |
| 1 | “Other” represents securities that are not classified by the fund’s benchmark index. |
| 2 | Collateral of $6,795,000 was received for securities on loan. |
| 3 | Affiliated money market fund available only to Vanguard funds and certain trusts and accounts managed by Vanguard. Rate shown is the 7-day yield. |
| | CVR—Contingent Value Rights. |
| REIT—Real Estate Investment Trust. |
| | |
| | |
| | | | | | |
| Derivative Financial Instruments Outstanding as of Period End | | | | | |
| | | | | | | | | |
| Over-the-Counter Total Return Swaps | | | | | | | | |
| | | | | | Floating | | | | | |
| | | | | | Interest Rate | | Value and | | Value and | |
| | | | Notional | | Received | | Unrealized | | Unrealized | |
| | Termination | | Amount | | (Paid) | 1 | Appreciation | | (Depreciation | ) |
| Reference Entity | Date | Counterparty | ($000 | ) | (% | ) | ($000 | ) | ($000 | ) |
| T. Rowe Price Group Inc. | 9/2/20 | BOANA | 13,810 | | (0.055 | ) | 110 | | — | |
| T. Rowe Price Group Inc. | 9/2/21 | BOANA | 13,921 | | (0.057 | ) | — | | — | |
| | | | | | | | 110 | | — | |
| 1 | Based on 1-month USD London Interbank Offered Rate (LIBOR) as of the most recent payment date. Floating interest payment received/paid monthly. |
BOANA—Bank of America, N.A.
See accompanying Notes, which are an integral part of the Financial Statements.
Financials Index Fund
Statement of Assets and Liabilities
As of August 31, 2020
| ($000s, except shares and per-share amounts) | Amount |
| Assets | |
| Investments in Securities, at Value | |
| Unaffiliated Issuers (Cost $7,205,284) | 6,557,320 |
| Affiliated Issuers (Cost $12,697) | 12,699 |
| Total Investments in Securities | 6,570,019 |
| Investment in Vanguard | 278 |
| Cash Collateral Pledged—Over-the-Counter Swap Contracts | 110 |
| Receivables for Investment Securities Sold | 21,863 |
| Receivables for Accrued Income | 9,001 |
| Receivables for Capital Shares Issued | 885 |
| Unrealized Appreciation—Over-the-Counter Swap Contracts | 110 |
| Total Assets | 6,602,266 |
| Liabilities | |
| Payables for Investment Securities Purchased | 22,210 |
| Collateral for Securities on Loan | 6,795 |
| Payables for Capital Shares Redeemed | 558 |
| Payables to Vanguard | 323 |
| Total Liabilities | 29,886 |
| Net Assets | 6,572,380 |
| At August 31, 2020, net assets consisted of: | |
| Paid-in Capital | 7,321,503 |
| Total Distributable Earnings (Loss) | (749,123) |
| Net Assets | 6,572,380 |
| | |
| ETF Shares—Net Assets | |
| Applicable to 100,361,572 outstanding $.001 par value shares of beneficial interest (unlimited authorization) | 6,140,337 |
| Net Asset Value Per Share—ETF Shares | $61.18 |
| | |
| Admiral Shares—Net Assets | |
| Applicable to 14,090,162 outstanding $.001 par value shares of beneficial interest (unlimited authorization) | 432,043 |
| Net Asset Value Per Share—Admiral Shares | $30.66 |
See accompanying Notes, which are an integral part of the Financial Statements.
Financials Index Fund
Statement of Operations
| | Year Ended |
| | August 31, 2020 |
| | ($000) |
| Investment Income | |
| Income | |
| Dividends | 187,790 |
| Interest1 | 57 |
| Securities Lending—Net | 215 |
| Total Income | 188,062 |
| Expenses | |
| The Vanguard Group—Note B | |
| Investment Advisory Services | 1,075 |
| Management and Administrative—ETF Shares | 4,797 |
| Management and Administrative—Admiral Shares | 339 |
| Marketing and Distribution—ETF Shares | 392 |
| Marketing and Distribution—Admiral Shares | 32 |
| Custodian Fees | 74 |
| Auditing Fees | 33 |
| Shareholders’ Reports—ETF Shares | 399 |
| Shareholders’ Reports—Admiral Shares | 11 |
| Trustees’ Fees and Expenses | 4 |
| Total Expenses | 7,156 |
| Expenses Paid Indirectly | (6) |
| Net Expenses | 7,150 |
| Net Investment Income | 180,912 |
| Realized Net Gain (Loss) | |
| Investment Securities Sold1,2 | 368,678 |
| Futures Contracts | 14 |
| Swap Contracts | 2,951 |
| Realized Net Gain (Loss) | 371,643 |
| Change in Unrealized Appreciation (Depreciation) | |
| Investment Securities1 | (1,036,212) |
| Swap Contracts | 110 |
| Change in Unrealized Appreciation (Depreciation) | (1,036,102) |
| Net Increase (Decrease) in Net Assets Resulting from Operations | (483,547) |
| 1 | Interest income, realized net gain (loss), and change in unrealized appreciation (depreciation) from an affiliated company of the fund were $57,000, $8,000, and $1,000, respectively. Purchases and sales are for temporary cash investment purposes. |
| 2 | Includes $460,007,000 of net gain (loss) resulting from in-kind redemptions. |
Statement of Changes in Net Assets
| | Year Ended August 31, |
| | 2020 | 2019 |
| | ($000) | ($000) |
| Increase (Decrease) in Net Assets | | |
| Operations | | |
| Net Investment Income | 180,912 | 182,504 |
| Realized Net Gain (Loss) | 371,643 | 453,254 |
| Change in Unrealized Appreciation (Depreciation) | (1,036,102) | (1,094,417) |
| Net Increase (Decrease) in Net Assets Resulting from Operations | (483,547) | (458,659) |
| Distributions1 | | |
| ETF Shares | (175,958) | (165,401) |
| Admiral Shares | (11,934) | (13,448) |
| Total Distributions | (187,892) | (178,849) |
| Capital Share Transactions | | |
| ETF Shares | (454,049) | (697,070) |
| Admiral Shares | (14,373) | (155,784) |
| Net Increase (Decrease) from Capital Share Transactions | (468,422) | (852,854) |
| Total Increase (Decrease) | (1,139,861) | (1,490,362) |
| Net Assets | | |
| Beginning of Period | 7,712,241 | 9,202,603 |
| End of Period | 6,572,380 | 7,712,241 |
| 1 | Certain prior-period numbers have been reclassified to conform with current period presentation. |
See accompanying Notes, which are an integral part of the Financial Statements.
Financials Index Fund
Financial Highlights
ETF Shares
| For a Share Outstanding | | | Year Ended August 31, |
| Throughout Each Period | 2020 | 2019 | 2018 | 2017 | 2016 |
| Net Asset Value, Beginning of Period | $67.31 | $71.60 | $62.26 | $50.81 | $47.70 |
| Investment Operations | | | | | |
| Net Investment Income | 1.6521 | 1.5391 | 1.2981 | 1.0351 | 1.108 |
| Net Realized and Unrealized Gain (Loss) on Investments | (6.081) | (4.338) | 9.307 | 11.387 | 3.070 |
| Total from Investment Operations | (4.429) | (2.799) | 10.605 | 12.422 | 4.178 |
| Distributions | | | | | |
| Dividends from Net Investment Income | (1.701) | (1.491) | (1.265) | (.972) | (1.068) |
| Distributions from Realized Capital Gains | — | — | — | — | — |
| Total Distributions | (1.701) | (1.491) | (1.265) | (.972) | (1.068) |
| Net Asset Value, End of Period | $61.18 | $67.31 | $71.60 | $62.26 | $50.81 |
| | | | | | |
| Total Return | -6.73% | -3.85% | 17.15% | 24.65% | 8.93% |
| | | | | | |
| Ratios/Supplemental Data | | | | | |
| Net Assets, End of Period (Millions) | $6,140 | $7,222 | $8,512 | $6,127 | $3,735 |
| Ratio of Total Expenses to Average Net Assets | 0.10% | 0.10% | 0.10% | 0.10% | 0.10% |
| Ratio of Net Investment Income to Average Net Assets | 2.53% | 2.30% | 1.87% | 1.75% | 2.39% |
| Portfolio Turnover Rate2 | 5% | 5% | 3% | 5% | 21% |
| 1 | Calculated based on average shares outstanding. |
| 2 | Excludes the value of portfolio securities received or delivered as a result of in-kind purchases or redemptions of the fund’s capital shares, including ETF Creation Units. |
Admiral Shares
| For a Share Outstanding | | | Year Ended August 31, |
| Throughout Each Period | 2020 | 2019 | 2018 | 2017 | 2016 |
| Net Asset Value, Beginning of Period | $33.73 | $35.88 | $31.20 | $25.47 | $23.91 |
| Investment Operations | | | | | |
| Net Investment Income | .8281 | .7711 | .6511 | .5141 | .556 |
| Net Realized and Unrealized Gain (Loss) on Investments | (3.046) | (2.174) | 4.663 | 5.704 | 1.539 |
| Total from Investment Operations | (2.218) | (1.403) | 5.314 | 6.218 | 2.095 |
| Distributions | | | | | |
| Dividends from Net Investment Income | (.852) | (.747) | (.634) | (.488) | (.535) |
| Distributions from Realized Capital Gains | — | — | — | — | — |
| Total Distributions | (.852) | (.747) | (.634) | (.488) | (.535) |
| Net Asset Value, End of Period | $30.66 | $33.73 | $35.88 | $31.20 | $25.47 |
| | | | | | |
| Total Return2 | -6.70% | -3.87% | 17.16% | 24.62% | 8.96% |
| | | | | | |
| Ratios/Supplemental Data | | | | | |
| Net Assets, End of Period (Millions) | $432 | $490 | $690 | $518 | $244 |
| Ratio of Total Expenses to Average Net Assets | 0.10% | 0.10% | 0.10% | 0.10% | 0.10% |
| Ratio of Net Investment Income to Average Net Assets | 2.53% | 2.30% | 1.87% | 1.75% | 2.39% |
| Portfolio Turnover Rate3 | 5% | 5% | 3% | 5% | 21% |
| 1 | Calculated based on average shares outstanding. |
| 2 | Total returns do not include account service fees that may have applied in the periods shown. Fund prospectuses provide information about any applicable account service fees. |
| 3 | Excludes the value of portfolio securities received or delivered as a result of in-kind purchases or redemptions of the fund’s capital shares, including ETF Creation Units. |
See accompanying Notes, which are an integral part of the Financial Statements.
Financials Index Fund
Notes to Financial Statements
Vanguard Financials Index Fund is registered under the Investment Company Act of 1940 as an open-end investment company, or mutual fund. The fund offers two classes of shares: ETF Shares and Admiral Shares. Each of the share classes has different eligibility and minimum purchase requirements, and is designed for different types of investors. ETF Shares are listed for trading on NYSE Arca; they can be purchased and sold through a broker.
Market disruptions associated with the COVID-19 pandemic have had a global impact, and uncertainty exists as to the long-term implications. Such disruptions can adversely affect assets of the fund and thus fund performance.
A. The following significant accounting policies conform to generally accepted accounting principles for U.S. investment companies. The fund consistently follows such policies in preparing its financial statements.
1. Security Valuation: Securities are valued as of the close of trading on the New York Stock Exchange (generally 4 p.m., Eastern time) on the valuation date. Equity securities are valued at the latest quoted sales prices or official closing prices taken from the primary market in which each security trades; such securities not traded on the valuation date are valued at the mean of the latest quoted bid and asked prices. Securities for which market quotations are not readily available, or whose values have been materially affected by events occurring before the fund’s pricing time but after the close of the securities’ primary markets, are valued by methods deemed by the board of trustees to represent fair value. Investments in Vanguard Market Liquidity Fund are valued at that fund’s net asset value.
2. Futures Contracts: The fund uses index futures contracts to a limited extent, with the objectives of maintaining full exposure to the stock market, maintaining liquidity, and minimizing transaction costs. The fund may purchase futures contracts to immediately invest incoming cash in the market, or sell futures in response to cash outflows, thereby simulating a fully invested position in the underlying index while maintaining a cash balance for liquidity. The primary risks associated with the use of futures contracts are imperfect correlation between changes in market values of stocks held by the fund and the prices of futures contracts, and the possibility of an illiquid market. Counterparty risk involving futures is mitigated because a regulated clearinghouse is the counterparty instead of the clearing broker. To further mitigate counterparty risk, the fund trades futures contracts on an exchange, monitors the financial strength of its clearing brokers and clearinghouse, and has entered into clearing agreements with its clearing brokers. The clearinghouse imposes initial margin requirements to secure the fund’s performance and requires daily settlement of variation margin representing changes in the market value of each contract. Any securities pledged as initial margin for open contracts are noted in the Schedule of Investments.
Futures contracts are valued at their quoted daily settlement prices. The notional amounts of the contracts are not recorded in the Statement of Assets and Liabilities. Fluctuations in the value of the contracts are recorded in the Statement of Assets and Liabilities as an asset (liability) and in the Statement of Operations as unrealized appreciation (depreciation) until the contracts are closed, when they are recorded as realized gains (losses) on futures contracts.
During the year ended August 31, 2020, the fund’s average investments in long and short futures contracts represented less than 1% and 0% of net assets, respectively, based on the average of the notional amounts at each quarter-end during the period. The fund had no open futures contracts at August 31, 2020.
3. Swap Contracts: The fund has entered into equity swap contracts to earn the total return on selected reference stocks in the fund’s target index. Under the terms of the swaps, the fund receives the total return on the referenced stock (i.e., receiving the increase or paying the decrease in value of the selected reference stock and receiving the equivalent of any dividends in respect of the selected referenced stock) over a specified period of time, applied to a notional amount that represents the value of a designated number of shares of the selected reference stock at the beginning of the equity swap contract. The fund also pays a floating rate that is based on short-term interest rates, applied to the notional amount. At the same time, the fund generally invests an amount approximating the notional amount of the swap in high-quality temporary cash investments.
A risk associated with all types of swaps is the possibility that a counterparty may default on its obligation to pay net amounts due to the fund. The fund’s maximum amount subject to counterparty risk is the unrealized appreciation on the swap contract. The fund mitigates its counterparty risk by entering into swaps only with a diverse group of prequalified counterparties, monitoring their financial strength, entering into master netting arrangements with its counterparties, and requiring its counterparties to transfer collateral as security for their performance. In the absence of a default, the collateral pledged or received by the fund cannot be repledged, resold, or rehypothecated. In the event of a counterparty’s default (including bankruptcy), the fund may terminate any swap contracts with that counterparty, determine the net amount owed by either party in accordance with its master
Financials Index Fund
netting arrangements, and sell or retain any collateral held up to the net amount owed to the fund under the master netting arrangements. The swap contracts contain provisions whereby a counterparty may terminate open contracts if the fund’s net assets decline below a certain level, triggering a payment by the fund if the fund is in a net liability position at the time of the termination. The payment amount would be reduced by any collateral the fund has pledged. Any securities pledged as collateral for open contracts are noted in the Schedule of Investments. The value of collateral received or pledged is compared daily to the value of the swap contracts exposure with each counterparty, and any difference, if in excess of a specified minimum transfer amount, is adjusted and settled within two business days.
The notional amounts of swap contracts are not recorded in the Statement of Assets and Liabilities. Swaps are valued daily based on market quotations received from independent pricing services or recognized dealers and the change in value is recorded in the Statement of Assets and Liabilities as an asset (liability) and in the Statement of Operations as unrealized appreciation (depreciation) until periodic payments are made or the termination of the swap, at which time realized gain (loss) is recorded.
During the year ended August 31, 2020, the fund’s average amounts of investments in total return swaps represented less than 1% of net assets, based on the average of notional amounts at each quarter-end during the period.
4. Federal Income Taxes: The fund intends to continue to qualify as a regulated investment company and distribute all of its taxable income. The fund’s tax returns are open to examination by the relevant tax authorities until expiration of the applicable statute of limitations, which is generally three years after the filing of the tax return. Management has analyzed the fund’s tax positions taken for all open federal and state income tax years, and has concluded that no provision for income tax is required in the fund’s financial statements.
5. Distributions: Distributions to shareholders are recorded on the ex-dividend date. Distributions are determined on a tax basis at the fiscal year-end and may differ from net investment income and realized capital gains for financial reporting purposes.
6. Securities Lending: To earn additional income, the fund lends its securities to qualified institutional borrowers. Security loans are subject to termination by the fund at any time, and are required to be secured at all times by collateral in an amount at least equal to the market value of securities loaned. Daily market fluctuations could cause the value of loaned securities to be more or less than the value of the collateral received. When this occurs, the collateral is adjusted and settled before the opening of the market on the next business day. The fund further mitigates its counterparty risk by entering into securities lending transactions only with a diverse group of prequalified counterparties, monitoring their financial strength, and entering into master securities lending agreements with its counterparties. The master securities lending agreements provide that, in the event of a counterparty’s default (including bankruptcy), the fund may terminate any loans with that borrower, determine the net amount owed, and sell or retain the collateral up to the net amount owed to the fund; however, such actions may be subject to legal proceedings. While collateral mitigates counterparty risk, in the event of a default, the fund may experience delays and costs in recovering the securities loaned. The fund invests cash collateral received in Vanguard Market Liquidity Fund, and records a liability in the Statement of Assets and Liabilities for the return of the collateral, during the period the securities are on loan. Collateral investments in Vanguard Market Liquidity Fund are subject to market appreciation or depreciation. Securities lending income represents fees charged to borrowers plus income earned on invested cash collateral, less expenses associated with the loan. During the term of the loan, the fund is entitled to all distributions made on or in respect of the loaned securities.
7. Credit Facilities and Interfund Lending Program: The fund and certain other funds managed by The Vanguard Group (“Vanguard”) participate in a $4.3 billion committed credit facility provided by a syndicate of lenders pursuant to a credit agreement and an uncommitted credit facility provided by Vanguard. Both facilities may be renewed annually. Each fund is individually liable for its borrowings, if any, under the credit facilities. Borrowings may be utilized for temporary or emergency purposes, subject to the fund’s regulatory and contractual borrowing restrictions. With respect to the committed credit facility, the participating funds are charged administrative fees and an annual commitment fee of 0.10% of the undrawn committed amount of the facility; these fees are allocated to the funds based on a method approved by the fund’s board of trustees and included in Management and Administrative expenses on the fund’s Statement of Operations. Any borrowings under either facility bear interest at a rate based upon the higher of the one-month London Interbank Offered Rate (or an acceptable alternate rate, if necessary), federal funds effective rate, or overnight bank funding rate plus an agreed-upon spread, except that borrowings under the uncommitted credit facility may bear interest based upon an alternative rate agreed to by the fund and Vanguard.
Financials Index Fund
In accordance with an exemptive order (the “Order”) from the SEC, the fund may participate in a joint lending and borrowing program that allows registered open-end Vanguard funds to borrow money from and lend money to each other for temporary or emergency purposes (the “Interfund Lending Program”), subject to compliance with the terms and conditions of the Order, and to the extent permitted by the fund’s investment objective and investment policies. Interfund loans and borrowings normally extend overnight, but can have a maximum duration of seven days. Loans may be called on one business day’s notice. The interest rate to be charged is governed by the conditions of the Order and internal procedures adopted by the board of trustees. The board of trustees is responsible for overseeing the Interfund Lending Program.
For the year ended August 31, 2020, the fund did not utilize the credit facilities or the Interfund Lending Program.
8. Other: Dividend income is recorded on the ex-dividend date. Interest income includes income distributions received from Vanguard Market Liquidity Fund and is accrued daily. Security transactions are accounted for on the date securities are bought or sold. Costs used to determine realized gains (losses) on the sale of investment securities are those of the specific securities sold.
Each class of shares has equal rights as to assets and earnings, except that each class separately bears certain class-specific expenses related to maintenance of shareholder accounts (included in Management and Administrative expenses) and shareholder reporting. Marketing and distribution expenses are allocated to each class of shares based on a method approved by the board of trustees. Income, other non-class-specific expenses, and gains and losses on investments are allocated to each class of shares based on its relative net assets.
B. In accordance with the terms of a Funds’ Service Agreement (the “FSA”) between Vanguard and the fund, Vanguard furnishes to the fund investment advisory, corporate management, administrative, marketing, and distribution services at Vanguard’s cost of operations (as defined by the FSA). These costs of operations are allocated to the fund based on methods and guidelines approved by the board of trustees and are generally settled twice a month.
Upon the request of Vanguard, the fund may invest up to 0.40% of its net assets as capital in Vanguard. At August 31, 2020, the fund had contributed to Vanguard capital in the amount of $278,000, representing less than 0.01% of the fund’s net assets and 0.11% of Vanguard’s capital received pursuant to the FSA. The fund’s trustees and officers are also directors and employees, respectively, of Vanguard.
C. The fund’s custodian bank has agreed to reduce its fees when the fund maintains cash on deposit in the non-interest-bearing custody account. For the year ended August 31, 2020, custodian fee offset arrangements reduced the fund’s expenses by $6,000 (an annual rate of less than 0.01% of average net assets).
D. Various inputs may be used to determine the value of the fund’s investments and derivatives. These inputs are summarized in three broad levels for financial statement purposes. The inputs or methodologies used to value securities are not necessarily an indication of the risk associated with investing in those securities.
Level 1—Quoted prices in active markets for identical securities.
Level 2—Other significant observable inputs (including quoted prices for similar securities, interest rates, prepayment speeds, credit risk, etc.).
Level 3—Significant unobservable inputs (including the fund’s own assumptions used to determine the fair value of investments). Any investments and derivatives valued with significant unobservable inputs are noted on the Schedule of Investments.
The following table summarizes the market value of the fund’s investments and derivatives as of August 31, 2020, based on the inputs used to value them:
| | Level 1 | Level 2 | Level 3 | Total |
| | ($000) | ($000) | ($000) | ($000) |
| Investments | | | | |
| Assets | | | | |
| Common Stocks | 6,557,316 | — | 4 | 6,557,320 |
| Temporary Cash Investments | 12,699 | — | — | 12,699 |
| Total | 6,570,015 | — | 4 | 6,570,019 |
| Derivative Financial Instruments | | | | |
| Assets | | | | |
| Swap Contracts | — | 110 | — | 110 |
Financials Index Fund
E. Permanent differences between book-basis and tax-basis components of net assets are reclassified among capital accounts in the financial statements to reflect their tax character. These reclassifications have no effect on net assets or net asset value per share. As of period end, permanent differences primarily attributable to the accounting for in-kind redemptions and swap agreements were reclassified between the following accounts:
| | Amount |
| | ($000) |
| Paid-in Capital | 460,284 |
| Total Distributable Earnings (Loss) | (460,284) |
Temporary differences between book-basis and tax-basis components of total distributable earnings (loss) arise when certain items of income, gain, or loss are recognized in different periods for financial statement and tax purposes; these differences will reverse at some time in the future. The differences are primarily related to the deferral of losses from wash sales and the recognition of unrealized gains or losses from certain derivative contracts. As of period end, the tax-basis components of total distributable earnings (loss) are detailed in the table as follows:
| | Amount |
| | ($000) |
| Undistributed Ordinary Income | 34,672 |
| Undistributed Long-term Gains | — |
| Capital Loss Carryforwards | (135,833) |
| Qualified Late-Year Losses | — |
| Net Unrealized Gains (Losses) | (647,962) |
The tax character of distributions paid was as follows:
| | Year Ended August 31, |
| | 2020 | 2019 |
| | Amount | Amount |
| | ($000) | ($000) |
| Ordinary Income* | 187,892 | 178,849 |
| Long-Term Capital Gains | — | — |
| Total | 187,892 | 178,849 |
* Includes short-term capital gains, if any.
As of August 31, 2020, gross unrealized appreciation and depreciation for investments and derivatives based on cost for U.S. federal income tax purposes were as follows:
| | Amount |
| | ($000) |
| Tax Cost | 7,217,981 |
| Gross Unrealized Appreciation | 601,186 |
| Gross Unrealized Depreciation | (1,249,148) |
| Net Unrealized Appreciation (Depreciation) | (647,962) |
F. During the year ended August 31, 2020, the fund purchased $2,181,046,000 of investment securities and sold $2,654,840,000 of investment securities, other than temporary cash investments. Purchases and sales include $1,668,113,000 and $2,311,672,000, respectively, in connection with in-kind purchases and redemptions of the fund’s capital shares.
Financials Index Fund
G. Capital share transactions for each class of shares were:
| | | | | Year Ended August 31, |
| | | 2020 | | | 2019 |
| | Amount | Shares | | Amount | Shares |
| | ($000) | (000) | | ($000) | (000) |
| ETF Shares | | | | | |
| Issued | 1,881,744 | 30,583 | | 1,423,985 | 21,039 |
| Issued in Lieu of Cash Distributions | — | — | | — | — |
| Redeemed | (2,335,793) | (37,525) | | (2,121,055) | (32,625) |
| Net Increase (Decrease)—ETF Shares | (454,049) | (6,942) | | (697,070) | (11,586) |
| Admiral Shares | | | | | |
| Issued | 245,111 | 8,139 | | 147,528 | 4,455 |
| Issued in Lieu of Cash Distributions | 10,126 | 310 | | 11,597 | 349 |
| Redeemed | (269,610) | (8,886) | | (314,909) | (9,513) |
| Net Increase (Decrease)—Admiral Shares | (14,373) | (437) | | (155,784) | (4,709) |
At August 31, 2020, one shareholder was the record or beneficial owner of 25% of the fund’s net assets. If this shareholder were to redeem its investment in the fund, the redemption might result in an increase in the fund’s expense ratio, cause the fund to incur higher transaction costs, or lead to the realization of taxable capital gains.
H. Management has determined that no events or transactions occurred subsequent to August 31, 2020, that would require recognition or disclosure in these financial statements.
Health Care Index Fund
Performance Summary
All of the returns in this report represent past performance, which is not a guarantee of future results that may be achieved by the fund. (Current performance may be lower or higher than the performance data cited. For performance data current to the most recent month-end, visit our website at vanguard.com/performance.) Note, too, that both investment returns and principal value can fluctuate widely, so an investor’s shares, when sold, could be worth more or less than their original cost. The returns shown do not reflect taxes that a shareholder would pay on fund distributions or on the sale of fund shares.
Cumulative Performance: August 31, 2010–August 31, 2020
Initial Investment of $10,000
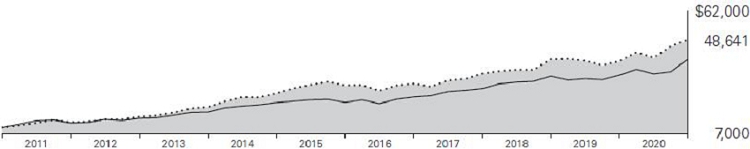
| | | Average Annual Total Returns | Final Value |
| | | Periods Ended August 31, 2020 | of a $10,000 |
| | | One Year | Five Years | Ten Years | Investment |
 | Health Care Index Fund ETF Shares Net Asset Value | 24.05% | 11.20% | 17.14% | $48,641 |
| | Health Care Index Fund ETF Shares Market Price | 24.16 | 11.21 | 17.16 | 48,713 |
 | MSCI US IMI/Health Care 25/50 | 24.10 | 11.26 | 17.23 | 49,033 |
 | MSCI US IMI/2500 | 21.48 | 13.88 | 14.99 | 40,426 |
| | | | | | |
| | | | | | Final Value |
| | | | | | of a $100,000 |
| | | One Year | Five Years | Ten Years | Investment |
| Health Care Index Fund Admiral Shares | 24.06% | 11.21% | 17.14% | $486,669 |
| MSCI US IMI/Health Care 25/50 | 24.10 | 11.26 | 17.23 | 490,332 |
| MSCI US IMI/2500 | 21.48 | 13.88 | 14.99 | 404,265 |
| | | |
| | | |
| Cumulative Returns: ETF Shares, August 31, 2010–August 31, 2020 | | |
| | | |
| | | | One Year | Five Years | Ten Years |
| Health Care Index Fund ETF Shares Market Price | 24.16% | 70.10% | 387.13% |
| Health Care Index Fund ETF Shares Net Asset Value | 24.05 | 70.07 | 386.41 |
| MSCI US IMI/Health Care 25/50 | | 24.10 | 70.48 | 390.33 |
For the ETF Shares, the market price is determined by the midpoint of the bid-offer spread as of the closing time of the New York Stock Exchange (generally 4 p.m., Eastern time). The net asset value is also determined as of the NYSE closing time. For more information about how the ETF Shares’ market prices have compared with their net asset value, visit vanguard.com, select your ETF, and then select the Price and Performance tab. The ETF premium/discount analysis there shows the percentages of days on which the ETF Shares’ market price was above or below the NAV.
See Financial Highlights for dividend and capital gains information.
Health Care Index Fund
Fund Allocation
As of August 31, 2020
| Biotechnology | 19.4% |
| Health Care Distributors | 1.4 |
| Health Care Equipment | 24.0 |
| Health Care Facilities | 1.4 |
| Health Care Services | 4.8 |
| Health Care Supplies | 2.1 |
| Health Care Technology | 2.1 |
| Life Sciences Tools & Services | 8.7 |
| Managed Health Care | 9.8 |
| Pharmaceuticals | 26.3 |
The table reflects the fund’s investments, except for short-term investments and derivatives. Sector categories are based on the Global Industry Classification Standard (“GICS”), except for the “Other” category (if applicable), which includes securities that have not been provided a GICS classification as of the effective reporting period.
The fund may invest in derivatives (such as futures and swap contracts) for various reasons, including, but not limited to, attempting to remain fully invested and tracking its target index as closely as possible.
The Global Industry Classification Standard (“GICS”) was developed by and is the exclusive property and a service mark of MSCI Inc. (“MSCI”) and Standard and Poor’s, a division of McGraw-Hill Companies, Inc. (“S&P”), and is licensed for use by Vanguard. Neither MSCI, S&P nor any third party involved in making or compiling the GICS or any GICS classification makes any express or implied warranties or representations with respect to such standard or classification (or the results to be obtained by the use thereof), and all such parties hereby expressly disclaim all warranties of originality, accuracy, completeness, merchantability or fitness for a particular purpose with respect to any such standard or classification. Without limiting any of the foregoing, in no event shall MSCI, S&P, any of its affiliates or any third party involved in making or compiling the GICS or any GICS classification have any liability for any direct, indirect, special, punitive, consequential or any other damages (including lost profits) even if notified of the possibility of such damages.
Health Care Index Fund
Financial Statements
Schedule of Investments
As of August 31, 2020
The fund files its complete schedule of portfolio holdings with the Securities and Exchange Commission (SEC) for the first and third quarters of each fiscal year as an exhibit to its reports on Form N-PORT. The fund’s Form N-PORT reports are available on the SEC’s website at www.sec.gov.
| | | | | Market |
| | | | | Value· |
| | | Shares | | ($000) |
| Common Stocks (99.8%) | | | |
| Biotechnology (19.4%) | | | |
| | AbbVie Inc. | 4,689,103 | | 449,075 |
| | Amgen Inc. | 1,620,042 | | 410,389 |
| | Gilead Sciences Inc. | 3,254,603 | | 217,245 |
| * | Vertex Pharmaceuticals Inc. | 714,019 | | 199,297 |
| * | Regeneron Pharmaceuticals Inc. | 277,789 | | 172,210 |
| * | Biogen Inc. | 449,413 | | 129,269 |
| * | Alexion Pharmaceuticals Inc. | 608,143 | | 69,462 |
| * | Seattle Genetics Inc. | 333,714 | | 52,840 |
| * | Incyte Corp. | 508,825 | | 49,025 |
| * | Moderna Inc. | 749,606 | | 48,642 |
| * | Alnylam Pharmaceuticals Inc. | 316,242 | | 41,946 |
| * | BioMarin Pharmaceutical Inc. | 498,323 | | 38,884 |
| * | Exact Sciences Corp. | 412,405 | | 31,050 |
| * | Sarepta Therapeutics Inc. | 204,055 | | 29,878 |
| * | Neurocrine Biosciences Inc. | 242,935 | | 28,283 |
| * | Immunomedics Inc. | 540,558 | | 24,087 |
| * | Ionis Pharmaceuticals Inc. | 364,482 | | 19,864 |
| * | Exelixis Inc. | 845,510 | | 18,787 |
| * | Novavax Inc. | 159,627 | | 17,613 |
| * | Momenta Pharmaceuticals Inc. | 307,631 | | 16,049 |
| * | Emergent BioSolutions Inc. | 122,739 | | 13,998 |
| * | Ultragenyx Pharmaceutical Inc. | 156,378 | | 13,302 |
| * | CRISPR Therapeutics AG | 141,478 | | 13,223 |
| * | United Therapeutics Corp. | 121,171 | | 12,960 |
| * | ACADIA Pharmaceuticals Inc. | 321,499 | | 12,728 |
| * | Acceleron Pharma Inc. | 126,020 | | 12,283 |
| * | Invitae Corp. | 344,308 | | 12,037 |
| * | Natera Inc. | 184,325 | | 11,743 |
| * | Mirati Therapeutics Inc. | 78,013 | | 11,653 |
| * | Arrowhead Pharmaceuticals Inc. | 266,604 | | 11,261 |
| * | Blueprint Medicines Corp. | 141,675 | | 10,970 |
| * | Arena Pharmaceuticals Inc. | 152,800 | | 10,669 |
| * | Bluebird Bio Inc. | 178,591 | | 10,590 |
| * | Halozyme Therapeutics Inc. | 355,511 | | 10,308 |
| * | FibroGen Inc. | 220,927 | | 9,904 |
| * | Iovance Biotherapeutics Inc. | 295,465 | | 9,848 |
| * | Global Blood Therapeutics Inc. | 151,176 | | 9,491 |
| * | Amicus Therapeutics Inc. | 638,912 | | 9,328 |
| * | Biohaven Pharmaceutical Holding Co. Ltd. | 136,757 | | 8,669 |
| * | Insmed Inc. | 278,312 | | 7,846 |
| * | PTC Therapeutics Inc. | 155,919 | | 7,706 |
| * | Sage Therapeutics Inc. | 143,008 | | 7,499 |
| * | Turning Point Therapeutics Inc. | 92,909 | | 7,264 |
| * | Alkermes plc | 438,734 | | 7,257 |
| * | Agios Pharmaceuticals Inc. | 170,223 | | 6,981 |
| * | Denali Therapeutics Inc. | 218,238 | | 6,962 |
| * | Principia Biopharma Inc. | 68,389 | | 6,840 |
| * | TG Therapeutics Inc. | 272,239 | | 6,753 |
| * | ChemoCentryx Inc. | 119,282 | | 6,382 |
| * | Fate Therapeutics Inc. | 171,283 | | 6,235 |
| * | Allakos Inc. | 67,124 | | 6,013 |
| * | Editas Medicine Inc. | 168,053 | | 5,921 |
| * | Allogene Therapeutics Inc. | 155,046 | | 5,527 |
| * | Twist Bioscience Corp. | 79,037 | | 5,527 |
| *,^ | Inovio Pharmaceuticals Inc. | 435,459 | | 5,221 |
| * | Veracyte Inc. | 156,293 | | 5,206 |
| * | Apellis Pharmaceuticals Inc. | 166,385 | | 5,130 |
| * | Xencor Inc. | 141,626 | | 5,063 |
| *,^ | Ligand Pharmaceuticals Inc. | 44,228 | | 4,511 |
| * | Deciphera Pharmaceuticals Inc. | 100,033 | | 4,503 |
| * | Ironwood Pharmaceuticals Inc. Class A | 415,006 | | 4,192 |
| * | Aimmune Therapeutics Inc. | 118,819 | | 4,066 |
| * | Cytokinetics Inc. | 164,793 | | 3,948 |
| * | CareDx Inc. | 114,582 | | 3,913 |
| *,^ | OPKO Health Inc. | 1,194,478 | | 3,870 |
| * | Akebia Therapeutics Inc. | 369,695 | | 3,849 |
| * | MacroGenics Inc. | 129,271 | | 3,741 |
| * | uniQure NV | 91,626 | | 3,736 |
| * | Sangamo Therapeutics Inc. | 330,012 | | 3,642 |
| * | Intercept Pharmaceuticals Inc. | 72,605 | | 3,622 |
| * | Kura Oncology Inc. | 135,762 | | 3,379 |
| * | Heron Therapeutics Inc. | 236,220 | | 3,378 |
| * | Kodiak Sciences Inc. | 61,350 | | 3,226 |
| * | Dicerna Pharmaceuticals Inc. | 173,053 | | 3,205 |
| * | Zymeworks Inc. | 94,146 | | 3,052 |
| * | Coherus Biosciences Inc. | 157,572 | | 2,989 |
| * | Madrigal Pharmaceuticals Inc. | 27,684 | | 2,982 |
| *,^ | Sorrento Therapeutics Inc. | 361,953 | | 2,899 |
| * | Myriad Genetics Inc. | 205,242 | | 2,744 |
| *,^ | Intellia Therapeutics Inc. | 125,458 | | 2,707 |
| * | REGENXBIO Inc. | 87,168 | | 2,660 |
| *,^ | Esperion Therapeutics Inc. | 71,671 | | 2,587 |
| * | Arcturus Therapeutics Holdings Inc. | 52,739 | | 2,544 |
| * | Epizyme Inc. | 194,784 | | 2,532 |
| * | Atara Biotherapeutics Inc. | 187,700 | | 2,530 |
| * | Karuna Therapeutics Inc. | 32,406 | | 2,476 |
| * | Enanta Pharmaceuticals Inc. | 46,739 | | 2,439 |
| * | Arcus Biosciences Inc. | 102,145 | | 2,431 |
| * | Y-mAbs Therapeutics Inc. | 54,381 | | 2,340 |
| * | Retrophin Inc. | 116,247 | | 2,277 |
| * | Karyopharm Therapeutics Inc. | 141,223 | | 2,148 |
| * | Rocket Pharmaceuticals Inc. | 83,203 | | 2,128 |
| * | Adverum Biotechnologies Inc. | 170,252 | | 2,077 |
| * | Myovant Sciences Ltd. | 99,187 | | 2,021 |
| * | Gossamer Bio Inc. | 144,742 | | 2,012 |
| * | BioCryst Pharmaceuticals Inc. | 476,842 | | 1,979 |
| * | Rhythm Pharmaceuticals Inc. | 66,715 | | 1,969 |
| * | Assembly Biosciences Inc. | 86,704 | | 1,896 |
| * | ImmunoGen Inc. | 483,861 | | 1,790 |
| * | Cortexyme Inc. | 40,533 | | 1,782 |
| * | Vericel Corp. | 111,731 | | 1,771 |
| *,^ | Geron Corp. | 846,666 | | 1,736 |
| * | Krystal Biotech Inc. | 35,155 | | 1,681 |
| *,^ | ZIOPHARM Oncology Inc. | 596,146 | | 1,675 |
| * | Corbus Pharmaceuticals Holdings Inc. | 180,069 | | 1,672 |
| * | Kadmon Holdings Inc. | 331,290 | | 1,656 |
| * | Bioxcel Therapeutics Inc. | 40,068 | | 1,633 |
| * | Translate Bio Inc. | 113,605 | | 1,601 |
| * | Spectrum Pharmaceuticals Inc. | 379,189 | | 1,596 |
| * | SpringWorks Therapeutics Inc. | 35,574 | | 1,580 |
| * | Radius Health Inc. | 127,476 | | 1,578 |
| * | Dynavax Technologies Corp. | 263,838 | | 1,578 |
| * | Alector Inc. | 119,768 | | 1,547 |
| * | Agenus Inc. | 350,981 | | 1,529 |
| * | Vanda Pharmaceuticals Inc. | 148,116 | | 1,524 |
| * | Constellation Pharmaceuticals Inc. | 72,370 | | 1,523 |
| * | Anika Therapeutics Inc. | 38,975 | | 1,494 |
| * | Castle Biosciences Inc. | 31,803 | | 1,454 |
| * | Athenex Inc. | 123,836 | | 1,423 |
| * | Flexion Therapeutics Inc. | 117,804 | | 1,374 |
| * | Akero Therapeutics Inc. | 42,011 | | 1,370 |
| * | Avrobio Inc. | 74,675 | | 1,293 |
| * | Eagle Pharmaceuticals Inc. | 32,095 | | 1,274 |
| * | Viking Therapeutics Inc. | 180,416 | | 1,207 |
| *,^ | Clovis Oncology Inc. | 230,767 | | 1,202 |
| * | G1 Therapeutics Inc. | 77,956 | | 1,197 |
| * | AnaptysBio Inc. | 67,709 | | 1,173 |
| * | Syros Pharmaceuticals Inc. | 88,267 | | 1,170 |
| * | TCR2 Therapeutics Inc. | 57,519 | | 1,163 |
| * | Eidos Therapeutics Inc. | 26,574 | | 1,150 |
| * | Kiniksa Pharmaceuticals Ltd. Class A | 64,861 | | 1,146 |
| *,^ | Precigen Inc. | 188,659 | | 1,141 |
| * | Rigel Pharmaceuticals Inc. | 457,389 | | 1,139 |
| * | Cue Biopharma Inc. | 62,826 | | 1,123 |
| *,^ | Athersys Inc. | 514,510 | | 1,122 |
Health Care Index Fund
| | | | | Market |
| | | | | Value· |
| | | Shares | | ($000) |
| * | BioSpecifics Technologies Corp. | 16,183 | | 1,044 |
| * | Atreca Inc. Class A | 72,532 | | 1,031 |
| * | Akcea Therapeutics Inc. | 55,860 | | 1,021 |
| * | PDL BioPharma Inc. | 300,150 | | 1,006 |
| * | Puma Biotechnology Inc. | 91,451 | | 941 |
| * | Xenon Pharmaceuticals Inc. | 77,108 | | 937 |
| * | Prothena Corp. plc | 71,678 | | 929 |
| * | Ardelyx Inc. | 159,454 | | 915 |
| * | Applied Therapeutics Inc. | 36,345 | | 876 |
| * | Scholar Rock Holding Corp. | 57,350 | | 866 |
| * | IGM Biosciences Inc. | 19,964 | | 858 |
| * | CytomX Therapeutics Inc. | 112,949 | | 825 |
| * | Stoke Therapeutics Inc. | 27,120 | | 797 |
| * | Replimune Group Inc. | 29,267 | | 790 |
| * | Voyager Therapeutics Inc. | 66,623 | | 786 |
| * | Homology Medicines Inc. | 66,857 | | 711 |
| * | Aprea Therapeutics Inc. | 26,133 | | 708 |
| * | Crinetics Pharmaceuticals Inc. | 43,821 | | 702 |
| * | Concert Pharmaceuticals Inc. | 69,559 | | 669 |
| * | Molecular Templates Inc. | 56,672 | | 658 |
| * | NantKwest Inc. | 81,516 | | 595 |
| * | Precision BioSciences Inc. | 99,290 | | 560 |
| * | Morphic Holding Inc. | 21,033 | | 557 |
| * | MediciNova Inc. | 105,228 | | 551 |
| * | Merus NV | 43,987 | | 531 |
| * | MeiraGTx Holdings plc | 39,875 | | 519 |
| * | KalVista Pharmaceuticals Inc. | 35,528 | | 465 |
| * | Mirum Pharmaceuticals Inc. | 17,528 | | 455 |
| * | RAPT Therapeutics Inc. | 16,790 | | 447 |
| * | Rubius Therapeutics Inc. | 88,470 | | 426 |
| * | Prevail Therapeutics Inc. | 33,149 | | 406 |
| *,^ | Verastem Inc. | 306,253 | | 386 |
| * | Cyclerion Therapeutics Inc. | 53,381 | | 364 |
| * | Harpoon Therapeutics Inc. | 24,133 | | 332 |
| * | Frequency Therapeutics Inc. | 17,101 | | 331 |
| * | Five Prime Therapeutics Inc. | 77,394 | | 330 |
| * | NextCure Inc. | 33,729 | | 303 |
| * | Minerva Neurosciences Inc. | 90,005 | | 286 |
| * | GlycoMimetics Inc. | 72,142 | | 266 |
| *,^ | Lexicon Pharmaceuticals Inc. | 107,802 | | 189 |
| * | Gritstone Oncology Inc. | 54,599 | | 181 |
| * | Calyxt Inc. | 32,161 | | 175 |
| *,1 | Alder BioPharmaceuticals CVR Exp. 12/31/2024 | 157,578 | | 139 |
| * | PhaseBio Pharmaceuticals Inc. | 35,723 | | 138 |
| * | Solid Biosciences Inc. | 57,648 | | 138 |
| *,^ | Marker Therapeutics Inc. | 70,114 | | 126 |
| * | Acorda Therapeutics Inc. | 133,392 | | 74 |
| * | Geron Corp. Warrants Exp. 12/31/2025 | 152,449 | | 57 |
| * | Advaxis Inc. Warrants Exp. 09/11/2024 | 7,710 | | — |
| *,1 | Stemline Therapeutics Inc. CVR | 102 | | — |
| | | 2,598,857 |
| Health Care Equipment & Supplies (26.0%) | | |
| | Abbott Laboratories | 4,871,446 | | 533,277 |
| | Medtronic plc | 3,693,314 | | 396,920 |
| | Danaher Corp. | 1,755,957 | | 362,552 |
| * | Intuitive Surgical Inc. | 321,153 | | 234,711 |
| | Becton Dickinson and Co. | 798,071 | | 193,748 |
| | Stryker Corp. | 930,409 | | 184,370 |
| * | Boston Scientific Corp. | 3,934,705 | | 161,402 |
| * | Edwards Lifesciences Corp. | 1,706,519 | | 146,488 |
| | Baxter International Inc. | 1,401,382 | | 122,018 |
| * | DexCom Inc. | 254,326 | | 108,193 |
| * | IDEXX Laboratories Inc. | 233,901 | | 91,469 |
| | Zimmer Biomet Holdings Inc. | 569,518 | | 80,234 |
| | ResMed Inc. | 398,429 | | 72,028 |
| * | Align Technology Inc. | 206,058 | | 61,195 |
| | West Pharmaceutical Services Inc. | 202,707 | | 57,561 |
| | Teleflex Inc. | 127,857 | | 50,241 |
| | Cooper Cos. Inc. | 146,883 | | 46,177 |
| * | Varian Medical Systems Inc. | 250,104 | | 43,436 |
| * | Hologic Inc. | 710,922 | | 42,456 |
| * | Insulet Corp. | 180,269 | | 39,344 |
| * | ABIOMED Inc. | 123,807 | | 38,085 |
| | STERIS plc | 233,884 | | 37,337 |
| * | Masimo Corp. | 141,592 | | 31,717 |
| | Dentsply Sirona Inc. | 603,372 | | 27,073 |
| * | Penumbra Inc. | 93,737 | | 19,605 |
| * | Novocure Ltd. | 235,144 | | 19,458 |
| * | Quidel Corp. | 103,984 | | 18,297 |
| * | Tandem Diabetes Care Inc. | 157,258 | | 17,726 |
| | Hill-Rom Holdings Inc. | 183,315 | | 17,193 |
| * | iRhythm Technologies Inc. | 74,479 | | 16,399 |
| * | Haemonetics Corp. | 138,865 | | 12,451 |
| * | Nevro Corp. | 88,964 | | 12,236 |
| * | Globus Medical Inc. | 206,382 | | 11,665 |
| * | Neogen Corp. | 145,410 | | 11,080 |
| * | ICU Medical Inc. | 54,518 | | 10,917 |
| * | Wright Medical Group NV | 355,055 | | 10,733 |
| * | Envista Holdings Corp. | 439,528 | | 10,544 |
| * | Integra LifeSciences Holdings Corp. | 198,162 | | 9,470 |
| * | NuVasive Inc. | 141,175 | | 7,359 |
| | CONMED Corp. | 78,680 | | 6,791 |
| * | Merit Medical Systems Inc. | 137,203 | | 6,737 |
| * | Integer Holdings Corp. | 90,581 | | 6,274 |
| * | LivaNova plc | 133,635 | | 6,267 |
| * | CryoPort Inc. | 104,979 | | 5,824 |
| | Cantel Medical Corp. | 104,454 | | 5,482 |
| * | AtriCure Inc. | 121,631 | | 5,441 |
| * | Glaukos Corp. | 109,652 | | 5,245 |
| * | STAAR Surgical Co. | 93,663 | | 4,491 |
| * | Silk Road Medical Inc. | 73,597 | | 4,488 |
| * | Shockwave Medical Inc. | 70,217 | | 4,462 |
| * | Avanos Medical Inc. | 131,381 | | 4,257 |
| * | Cardiovascular Systems Inc. | 107,357 | | 3,507 |
| | Mesa Laboratories Inc. | 13,024 | | 3,203 |
| * | Cerus Corp. | 448,495 | | 2,857 |
| | Atrion Corp. | 4,054 | | 2,561 |
| * | Heska Corp. | 24,613 | | 2,550 |
| * | Axonics Modulation Technologies Inc. | 58,828 | | 2,486 |
| * | Lantheus Holdings Inc. | 175,858 | | 2,360 |
| * | OraSure Technologies Inc. | 192,328 | | 2,254 |
| * | GenMark Diagnostics Inc. | 172,517 | | 2,238 |
| * | CryoLife Inc. | 104,150 | | 2,106 |
| * | Tactile Systems Technology Inc. | 52,903 | | 2,033 |
| * | Natus Medical Inc. | 94,582 | | 1,718 |
| * | Surmodics Inc. | 37,348 | | 1,690 |
| * | Meridian Bioscience Inc. | 117,818 | | 1,666 |
| * | OrthoPediatrics Corp. | 31,970 | | 1,611 |
| * | Inogen Inc. | 51,611 | | 1,560 |
| * | Orthofix Medical Inc. | 50,314 | | 1,526 |
| | LeMaitre Vascular Inc. | 46,621 | | 1,505 |
| *,^ | SmileDirectClub Inc. | 164,604 | | 1,337 |
| * | SI-BONE Inc. | 58,750 | | 1,282 |
| * | Varex Imaging Corp. | 109,943 | | 1,219 |
| * | TransMedics Group Inc. | 67,392 | | 1,202 |
| * | Antares Pharma Inc. | 424,414 | | 1,201 |
| * | Vapotherm Inc. | 37,845 | | 1,177 |
| * | Axogen Inc. | 98,412 | | 1,168 |
| * | Establishment Labs Holdings Inc. | 58,820 | | 1,075 |
| *,^ | Accelerate Diagnostics Inc. | 83,256 | | 1,014 |
| * | AngioDynamics Inc. | 103,998 | | 974 |
| * | Oxford Immunotec Global plc | 64,998 | | 885 |
| * | Zynex Inc. | 50,361 | | 745 |
| *,^ | Co-Diagnostics Inc. | 68,081 | | 742 |
| *,^ | ViewRay Inc. | 264,323 | | 719 |
| | Invacare Corp. | 93,189 | | 632 |
| * | Repro-Med Systems Inc. | 71,207 | | 619 |
| * | Accuray Inc. | 246,435 | | 574 |
| *,1 | Lantheus Holdings CVR | 215,826 | | — |
| | | 3,488,920 |
| Health Care Providers & Services (17.3%) | | |
| | UnitedHealth Group Inc. | 2,611,895 | | 816,348 |
| | CVS Health Corp. | 3,599,966 | | 223,630 |
| | Anthem Inc. | 694,361 | | 195,477 |
| | Cigna Corp. | 1,016,241 | | 180,251 |
| | Humana Inc. | 364,106 | | 151,166 |
| | HCA Healthcare Inc. | 743,905 | | 100,963 |
| * | Centene Corp. | 1,595,076 | | 97,810 |
| | McKesson Corp. | 445,791 | | 68,402 |
| * | Laboratory Corp. of America Holdings | 267,736 | | 47,055 |
| | Quest Diagnostics Inc. | 368,386 | | 40,979 |
| | Cardinal Health Inc. | 804,388 | | 40,831 |
| | AmerisourceBergen Corp. Class A | 420,269 | | 40,779 |
| * | Molina Healthcare Inc. | 162,939 | | 30,139 |
| * | Henry Schein Inc. | 393,277 | | 26,129 |
| | Universal Health Services Inc. Class B | 213,976 | | 23,612 |
| | Chemed Corp. | 43,735 | | 22,616 |
| * | Amedisys Inc. | 89,225 | | 21,584 |
| * | DaVita Inc. | 234,536 | | 20,348 |
| | Encompass Health Corp. | 273,930 | | 17,871 |
| * | LHC Group Inc. | 82,646 | | 17,227 |
| * | Guardant Health Inc. | 156,039 | | 14,902 |
| * | HealthEquity Inc. | 196,731 | | 11,308 |
| | Ensign Group Inc. | 140,389 | | 8,218 |
| * | AMN Healthcare Services Inc. | 129,350 | | 6,964 |
| | Patterson Cos. Inc. | 237,855 | | 6,900 |
| * | Tenet Healthcare Corp. | 244,765 | | 6,897 |
| * | Acadia Healthcare Co. Inc. | 220,141 | | 6,805 |
| | Premier Inc. Class A | 197,143 | | 6,456 |
| * | Covetrus Inc. | 277,594 | | 6,360 |
| * | Select Medical Holdings Corp. | 294,235 | | 5,905 |
| * | Magellan Health Inc. | 61,972 | | 4,676 |
| * | MEDNAX Inc. | 235,415 | | 4,374 |
| * | R1 RCM Inc. | 268,573 | | 3,894 |
| * | Addus HomeCare Corp. | 40,813 | | 3,823 |
| * | BioTelemetry Inc. | 93,849 | | 3,715 |
| | US Physical Therapy Inc. | 35,267 | | 3,135 |
| * | Providence Service Corp. | 33,854 | | 3,135 |
Health Care Index Fund
| | | | | Market |
| | | | | Value· |
| | | Shares | | ($000) |
| * | Pennant Group Inc. | 73,090 | | 2,707 |
| * | CorVel Corp. | 27,254 | | 2,263 |
| | National HealthCare Corp. | 33,853 | | 2,156 |
| | National Research Corp. | 37,850 | | 2,120 |
| * | Hanger Inc. | 103,083 | | 2,037 |
| * | PetIQ Inc. Class A | 57,116 | | 2,009 |
| * | RadNet Inc. | 118,098 | | 1,703 |
| * | Tivity Health Inc. | 93,711 | | 1,533 |
| * | Apollo Medical Holdings Inc. | 80,150 | | 1,514 |
| ^ | Ontrak Inc. | 18,443 | | 1,345 |
| * | Progyny Inc. | 46,803 | | 1,336 |
| * | Brookdale Senior Living Inc. | 483,433 | | 1,329 |
| * | Community Health Systems Inc. | 244,661 | | 1,265 |
| * | Triple-S Management Corp. Class B | 64,689 | | 1,203 |
| * | Surgery Partners Inc. | 62,153 | | 1,186 |
| * | Option Care Health Inc. | 96,931 | | 1,126 |
| * | Fulgent Genetics Inc. | 26,925 | | 796 |
| * | Cross Country Healthcare Inc. | 94,608 | | 605 |
| * | Avalon GloboCare Corp. | 68,848 | | 98 |
| | | | | 2,319,015 |
| Health Care Technology (2.1%) | | |
| * | Veeva Systems Inc. Class A | 371,364 | | 104,825 |
| | Cerner Corp. | 838,101 | | 61,491 |
| * | Teladoc Health Inc. | 194,809 | | 42,018 |
| * | Livongo Health Inc. | 107,908 | | 14,816 |
| * | Change Healthcare Inc. | 624,201 | | 8,832 |
| * | Inspire Medical Systems Inc. | 66,128 | | 7,899 |
| * | Omnicell Inc. | 117,464 | | 7,833 |
| * | HMS Holdings Corp. | 243,215 | | 6,783 |
| * | Inovalon Holdings Inc. Class A | 198,464 | | 4,911 |
| * | Allscripts Healthcare Solutions Inc. | 448,367 | | 4,004 |
| * | Tabula Rasa HealthCare Inc. | 60,290 | | 3,051 |
| * | Evolent Health Inc. Class A | 212,872 | | 3,050 |
| | Simulations Plus Inc. | 43,015 | | 2,563 |
| * | Vocera Communications Inc. | 88,742 | | 2,484 |
| * | NextGen Healthcare Inc. | 145,112 | | 1,924 |
| * | Phreesia Inc. | 57,086 | | 1,801 |
| * | HealthStream Inc. | 75,935 | | 1,573 |
| * | Health Catalyst Inc. | 41,068 | | 1,281 |
| | Computer Programs and Systems Inc. | 35,666 | | 976 |
| * | Castlight Health Inc. Class B | 267,355 | | 369 |
| | | | | 282,484 |
| Life Sciences Tools & Services (8.7%) | | |
| | Thermo Fisher Scientific Inc. | 1,087,701 | | 466,602 |
| * | Illumina Inc. | 404,845 | | 144,619 |
| * | IQVIA Holdings Inc. | 525,903 | | 86,117 |
| | Agilent Technologies Inc. | 852,786 | | 85,637 |
| * | Mettler-Toledo International Inc. | 65,842 | | 63,918 |
| * | Waters Corp. | 170,513 | | 36,875 |
| | PerkinElmer Inc. | 306,772 | | 36,113 |
| * | Bio-Rad Laboratories Inc. Class A | 60,900 | | 30,973 |
| * | Charles River Laboratories International Inc. | 136,297 | | 29,842 |
| * | Avantor Inc. | 1,267,683 | | 28,612 |
| | Bio-Techne Corp. | 105,286 | | 26,896 |
| * | Repligen Corp. | 136,934 | | 21,212 |
| * | PRA Health Sciences Inc. | 175,245 | | 18,735 |
| * | 10X Genomics Inc. Class A | 127,649 | | 14,631 |
| | Bruker Corp. | 297,375 | | 12,496 |
| * | NeoGenomics Inc. | 287,189 | | 11,186 |
| * | Syneos Health Inc. | 171,774 | | 10,839 |
| * | Medpace Holdings Inc. | 77,992 | | 10,123 |
| * | Adaptive Biotechnologies Corp. | 210,148 | | 8,744 |
| * | PPD Inc. | 192,478 | | 6,610 |
| * | NanoString Technologies Inc. | 103,984 | | 4,209 |
| | Luminex Corp. | 118,202 | | 3,155 |
| * | Pacific Biosciences of California Inc. | 452,631 | | 2,987 |
| * | Codexis Inc. | 153,460 | | 2,118 |
| * | Quanterix Corp. | 54,123 | | 1,927 |
| * | Personalis Inc. | 48,119 | | 1,098 |
| | | | | 1,166,274 |
| Pharmaceuticals (26.3%) | | | |
| | Johnson & Johnson | 7,255,715 | | 1,113,099 |
| | Merck & Co. Inc. | 6,951,471 | | 592,752 |
| | Pfizer Inc. | 15,298,508 | | 578,131 |
| | Bristol-Myers Squibb Co. | 6,231,530 | | 387,601 |
| | Eli Lilly and Co. | 2,372,168 | | 352,006 |
| | Zoetis Inc. | 1,308,001 | | 209,411 |
| * | Catalent Inc. | 426,639 | | 39,464 |
| * | Horizon Therapeutics plc | 498,949 | | 37,481 |
| * | Elanco Animal Health Inc. | 1,098,321 | | 31,917 |
| * | Mylan NV | 1,423,837 | | 23,322 |
| * | Jazz Pharmaceuticals plc | 152,403 | | 20,481 |
| | Perrigo Co. plc | 375,455 | | 19,636 |
| * | MyoKardia Inc. | 137,974 | | 15,100 |
| * | Royalty Pharma plc Class A | 251,967 | | 10,426 |
| * | Nektar Therapeutics Class A | 490,420 | | 9,485 |
| * | Reata Pharmaceuticals Inc. Class A | 65,981 | | 6,925 |
| * | Pacira BioSciences Inc. | 110,287 | | 6,895 |
| * | Axsome Therapeutics Inc. | 76,471 | | 5,606 |
| * | Prestige Consumer Healthcare Inc. | 137,512 | | 5,010 |
| * | Revance Therapeutics Inc. | 141,498 | | 4,136 |
| * | Corcept Therapeutics Inc. | 300,697 | | 3,819 |
| * | Zogenix Inc. | 144,984 | | 3,432 |
| * | Supernus Pharmaceuticals Inc. | 144,893 | | 3,186 |
| * | Intra-Cellular Therapies Inc. | 164,996 | | 3,006 |
| * | Theravance Biopharma Inc. | 121,608 | | 2,229 |
| * | Innoviva Inc. | 182,027 | | 2,132 |
| * | Amphastar Pharmaceuticals Inc. | 101,310 | | 2,065 |
| * | Cara Therapeutics Inc. | 122,469 | | 1,898 |
| * | Endo International plc | 626,292 | | 1,885 |
| *,^ | Omeros Corp. | 151,538 | | 1,811 |
| * | Collegium Pharmaceutical Inc. | 86,151 | | 1,642 |
| * | Intersect ENT Inc. | 81,062 | | 1,628 |
| * | Provention Bio Inc. | 106,481 | | 1,389 |
| * | Arvinas Inc. | 53,358 | | 1,385 |
| | Phibro Animal Health Corp. Class A | 56,144 | | 1,205 |
| * | Aerie Pharmaceuticals Inc. | 109,026 | | 1,199 |
| * | Relmada Therapeutics Inc. | 32,971 | | 1,176 |
| * | Amneal Pharmaceuticals Inc. | 264,628 | | 1,088 |
| * | Cymabay Therapeutics Inc. | 164,516 | | 1,064 |
| * | SIGA Technologies Inc. | 145,960 | | 1,014 |
| *,^ | TherapeuticsMD Inc. | 670,698 | | 979 |
| *,^ | Tilray Inc. Class 2 | 134,130 | | 900 |
| * | AMAG Pharmaceuticals Inc. | 84,488 | | 875 |
| * | Tricida Inc. | 82,171 | | 869 |
| * | ANI Pharmaceuticals Inc. | 26,746 | | 839 |
| * | Kala Pharmaceuticals Inc. | 90,501 | | 806 |
| * | Phathom Pharmaceuticals Inc. | 19,978 | | 734 |
| * | WaVe Life Sciences Ltd. | 57,092 | | 715 |
| * | Odonate Therapeutics Inc. | 40,236 | | 650 |
| *,^ | Xeris Pharmaceuticals Inc. | 112,013 | | 527 |
| * | Satsuma Pharmaceuticals Inc. | 21,581 | | 497 |
| *,^ | Mallinckrodt plc | 216,420 | | 342 |
| * | Optinose Inc. | 69,940 | | 318 |
| *,^ | Evolus Inc. | 64,793 | | 250 |
| *,^ | Verrica Pharmaceuticals Inc. | 25,139 | | 231 |
| *,^ | Eloxx Pharmaceuticals Inc. | 66,334 | | 205 |
| *,1 | Clinical Data CVR | 8,685 | | — |
| | | | | 3,516,874 |
Total Common Stocks
(Cost $9,997,916) | | | 13,372,424 |
| Temporary Cash Investments (0.3%) | | |
| Money Market Fund (0.3%) | | | |
| 2,3 | Vanguard Market Liquidity Fund, 0.147% (Cost $49,068) | 490,782 | | 49,078 |
Total Investments (100.1%)
(Cost $10,046,984) | | | 13,421,502 |
| Other Assets and Liabilities—Net (-0.1%) | | | (20,933) |
| Net Assets (100%) | | | 13,400,569 |
Cost is in $000.
| · | See Note A in Notes to Financial Statements. |
| * | Non-income-producing security. |
| ^ | Includes partial security positions on loan to broker-dealers. The total value of securities on loan is $29,729,000. |
| 1 | Security value determined using significant unobservable inputs. |
| 2 | Affiliated money market fund available only to Vanguard funds and certain trusts and accounts managed by Vanguard. Rate shown is the 7-day yield. |
| 3 | Collateral of $32,401,000 was received for securities on loan. |
| | CVR—Contingent Value Rights. |
Health Care Index Fund
| Derivative Financial Instruments Outstanding as of Period End | | |
| | | | | |
| Over-the-Counter Total Return Swaps | | | | |
| | | | | Floating | | |
| | | | | Interest Rate | Value and | Value and |
| | | | Notional | Received | Unrealized | Unrealized |
| | Termination | | Amount | (Paid)1 | Appreciation | (Depreciation) |
| Reference Entity | Date | Counterparty | ($000) | (%) | ($000) | ($000) |
| Abbvie Inc. | 2/2/21 | GSI | 16,861 | (0.161) | — | 102 |
| Gilead Sciences | 9/2/21 | BOANA | 14,176 | (0.149) | — | 828 |
| | | | | | — | 930 |
| 1 | Based on 1-month USD London Interbank Offered Rate (LIBOR) as of the most recent payment date. Floating interest payment received/ paid monthly. |
BOANA—Bank of America, N.A.
GSI—Goldman Sachs International.
See accompanying Notes, which are an integral part of the Financial Statements.
Health Care Index Fund
Statement of Assets and Liabilities
As of August 31, 2020
| ($000s, except shares and per-share amounts) | Amount |
| Assets | |
| Investments in Securities, at Value | |
| Unaffiliated Issuers (Cost $9,997,916) | 13,372,424 |
| Affiliated Issuers (Cost $49,068) | 49,078 |
| Total Investments in Securities | 13,421,502 |
| Investment in Vanguard | 559 |
| Cash Collateral Pledged–Over-the-Counter Swap Contracts | 1,120 |
| Receivables for Investment Securities Sold | 58,796 |
| Receivables for Accrued Income | 18,956 |
| Receivables for Capital Shares Issued | 2,023 |
| Total Assets | 13,502,956 |
| Liabilities | |
| Payables for Investment Securities Purchased | 46,944 |
| Payables for Capital Shares Redeemed | 21,459 |
| Payables to Vanguard | 653 |
| Collateral for Securities on Loan | 32,401 |
| Unrealized Depreciation–Over-the-Counter Swap Contracts | 930 |
| Total Liabilities | 102,387 |
| Net Assets | 13,400,569 |
| | |
| | |
| At August 31, 2020, net assets consisted of: | |
| | |
| Paid-in Capital | 10,255,819 |
| Total Distributable Earnings (Loss) | 3,144,750 |
| Net Assets | 13,400,569 |
| | |
| ETF Shares—Net Assets | |
| Applicable to 56,462,970 outstanding $.001 par value shares of beneficial interest (unlimited authorization) | 11,724,492 |
| Net Asset Value Per Share—ETF Shares | $207.65 |
| | |
| Admiral Shares—Net Assets | |
| Applicable to 16,135,948 outstanding $.001 par value shares of beneficial interest (unlimited authorization) | 1,676,077 |
| Net Asset Value Per Share—Admiral Shares | $103.87 |
See accompanying Notes, which are an integral part of the Financial Statements.
Health Care Index Fund
Statement of Operations
| | Year Ended |
| | August 31, 2020 |
| | ($000) |
| Investment Income | |
| Income | |
| Dividends | 173,826 |
| Interest1 | 59 |
| Securities Lending—Net | 3,349 |
| Total Income | 177,234 |
| Expenses | |
| The Vanguard Group—Note B | |
| Investment Advisory Services | 1,688 |
| Management and Administrative—ETF Shares | 7,488 |
| Management and Administrative—Admiral Shares | 1,115 |
| Marketing and Distribution—ETF Shares | 488 |
| Marketing and Distribution—Admiral Shares | 102 |
| Custodian Fees | 71 |
| Auditing Fees | 32 |
| Shareholders’ Reports—ETF Shares | 407 |
| Shareholders’ Reports—Admiral Shares | 16 |
| Trustees’ Fees and Expenses | 8 |
| Total Expenses | 11,415 |
| Net Investment Income | 165,819 |
| Realized Net Gain (Loss) | |
| Investment Securities Sold1,2 | 473,975 |
| Futures Contracts | (2) |
| Swap Contracts | 4,500 |
| Realized Net Gain (Loss) | 478,473 |
| Change in Unrealized Appreciation (Depreciation) | |
| Investment Securities1 | 1,845,456 |
| Swap Contracts | (1,254) |
| Change in Unrealized Appreciation (Depreciation) | 1,844,202 |
| Net Increase (Decrease) in Net Assets Resulting from Operations | 2,488,494 |
| 1 | Interest income, realized net gain (loss), and change in unrealized appreciation (depreciation) from affiliated companies of the fund were $59,000, $6,000, and $5,000, respectively. |
| 2 | Includes $604,319,000 of net gain (loss) resulting from in-kind redemptions. |
Statement of Changes in Net Assets
| | Year Ended August 31, |
| | 2020 | 2019 |
| | ($000) | ($000) |
| Increase (Decrease) in Net Assets | | |
| Operations | | |
| Net Investment Income | 165,819 | 216,225 |
| Realized Net Gain (Loss) | 478,473 | 426,803 |
| Change in Unrealized Appreciation (Depreciation) | 1,844,202 | (874,477) |
| Net Increase (Decrease) in Net Assets Resulting from Operations | 2,488,494 | (231,449) |
| Distributions1 | | |
| ETF Shares | (136,385) | (183,804) |
| Admiral Shares | (19,956) | (26,640) |
| Total Distributions | (156,341) | (210,444) |
| Capital Share Transactions | | |
| ETF Shares | 790,421 | 692,430 |
| Admiral Shares | 63,737 | 121,577 |
| Net Increase (Decrease) from Capital Share Transactions | 854,158 | 814,007 |
| Total Increase (Decrease) | 3,186,311 | 372,114 |
| Net Assets | | |
| Beginning of Period | 10,214,258 | 9,842,144 |
| End of Period | 13,400,569 | 10,214,258 |
1 Certain prior-period numbers have been reclassified to conform with current period presentation.
See accompanying Notes, which are an integral part of the Financial Statements.
Health Care Index Fund
Financial Highlights
ETF Shares
| For a Share Outstanding | Year Ended August 31, |
| Throughout Each Period | 2020 | 2019 | 2018 | 2017 | 2016 |
| Net Asset Value, Beginning of Period | $169.74 | $177.07 | $151.13 | $133.25 | $132.34 |
| Investment Operations | | | | | |
| Net Investment Income | 2.7021 | 3.6001,2 | 2.1941 | 1.9941 | 1.795 |
| Net Realized and Unrealized Gain (Loss) on Investments | 37.758 | (7.457) | 25.846 | 17.846 | 1.559 |
| Total from Investment Operations | 40.460 | (3.857) | 28.040 | 19.840 | 3.354 |
| Distributions | | | | | |
| Dividends from Net Investment Income | (2.550) | (3.473) | (2.100) | (1.960) | (2.444) |
| Distributions from Realized Capital Gains | — | — | — | — | — |
| Total Distributions | (2.550) | (3.473) | (2.100) | (1.960) | (2.444) |
| Net Asset Value, End of Period | $207.65 | $169.74 | $177.07 | $151.13 | $133.25 |
| | | | | | |
| Total Return | 24.05% | -2.22% | 18.75% | 15.06% | 2.61% |
| | | | | | |
| Ratios/Supplemental Data | | | | | |
| Net Assets, End of Period (Millions) | $11,724 | $8,899 | $8,594 | $7,002 | $5,708 |
| Ratio of Total Expenses to Average Net Assets | 0.10% | 0.10% | 0.10% | 0.10% | 0.10% |
| Ratio of Net Investment Income to Average Net Assets | 1.45% | 2.12%2 | 1.38% | 1.46% | 1.40% |
| Portfolio Turnover Rate3 | 7% | 5% | 6% | 4% | 7% |
| 1 | Calculated based on average shares outstanding. |
| 2 | Net investment income per share and the ratio of net investment income to average net assets include $1.132 and 0.67%, respectively, resulting from a cash payment received in connection with the merger of Cigna Corp. and Express Scripts Holding Co. in December 2018. |
| 3 | Excludes the value of portfolio securities received or delivered as a result of in-kind purchases or redemptions of the fund’s capital shares, including ETF Creation Units. |
See accompanying Notes, which are an integral part of the Financial Statements.
Health Care Index Fund
Financial Highlights
Admiral Shares
| For a Share Outstanding | Year Ended August 31, |
| Throughout Each Period | 2020 | 2019 | 2018 | 2017 | 2016 |
| Net Asset Value, Beginning of Period | $84.91 | $88.57 | $75.60 | $66.65 | $66.20 |
| Investment Operations | | | | | |
| Net Investment Income | 1.3511 | 1.8041,2 | 1.1011 | .9961 | .898 |
| Net Realized and Unrealized Gain (Loss) on Investments | 18.884 | (3.727) | 12.920 | 8.934 | .774 |
| Total from Investment Operations | 20.235 | (1.923) | 14.021 | 9.930 | 1.672 |
| Distributions | | | | | |
| Dividends from Net Investment Income | (1.275) | (1.737) | (1.051) | (.980) | (1.222) |
| Distributions from Realized Capital Gains | — | — | — | — | — |
| Total Distributions | (1.275) | (1.737) | (1.051) | (.980) | (1.222) |
| Net Asset Value, End of Period | $103.87 | $84.91 | $88.57 | $75.60 | $66.65 |
| | | | | | |
| Total Return3 | 24.06% | -2.21% | 18.74% | 15.07% | 2.61% |
| | | | | | |
| Ratios/Supplemental Data | | | | | |
| Net Assets, End of Period (Millions) | $1,676 | $1,316 | $1,248 | $924 | $800 |
| Ratio of Total Expenses to Average Net Assets | 0.10% | 0.10% | 0.10% | 0.10% | 0.10% |
| Ratio of Net Investment Income to Average Net Assets | 1.45% | 2.12%2 | 1.38% | 1.46% | 1.40% |
| Portfolio Turnover Rate4 | 7% | 5% | 6% | 4% | 7% |
| 1 | Calculated based on average shares outstanding. |
| 2 | Net investment income per share and the ratio of net investment income to average net assets include $.566 and 0.67%, respectively, resulting from a cash payment received in connection with the merger of Cigna Corp. and Express Scripts Holding Co. in December 2018. |
| 3 | Total returns do not include account service fees that may have applied in the periods shown. Fund prospectuses provide information about any applicable account service fees. |
| 4 | Excludes the value of portfolio securities received or delivered as a result of in-kind purchases or redemptions of the fund’s capital shares, including ETF Creation Units. |
See accompanying Notes, which are an integral part of the Financial Statements.
Health Care Index Fund
Notes to Financial Statements
Vanguard Health Care Index Fund is registered under the Investment Company Act of 1940 as an open-end investment company, or mutual fund. The fund offers two classes of shares: ETF Shares and Admiral Shares. Each of the share classes has different eligibility and minimum purchase requirements, and is designed for different types of investors. ETF Shares are listed for trading on NYSE Arca; they can be purchased and sold through a broker.
Market disruptions associated with the COVID-19 pandemic have had a global impact, and uncertainty exists as to the long-term implications. Such disruptions can adversely affect assets of the fund and thus fund performance.
A. The following significant accounting policies conform to generally accepted accounting principles for U.S. investment companies. The fund consistently follows such policies in preparing its financial statements.
1. Security Valuation: Securities are valued as of the close of trading on the New York Stock Exchange (generally 4 p.m., Eastern time) on the valuation date. Equity securities are valued at the latest quoted sales prices or official closing prices taken from the primary market in which each security trades; such securities not traded on the valuation date are valued at the mean of the latest quoted bid and asked prices. Securities for which market quotations are not readily available, or whose values have been materially affected by events occurring before the fund’s pricing time but after the close of the securities’ primary markets, are valued by methods deemed by the board of trustees. Investments in Vanguard Market Liquidity Fund are valued at that fund’s net asset value.
2. Futures Contracts: The fund uses index futures contracts to a limited extent, with the objectives of maintaining full exposure to the stock market, maintaining liquidity, and minimizing transaction costs. The fund may purchase futures contracts to immediately invest incoming cash in the market, or sell futures in response to cash outflows, thereby simulating a fully invested position in the underlying index while maintaining a cash balance for liquidity. The primary risks associated with the use of futures contracts are imperfect correlation between changes in market values of stocks held by the fund and the prices of futures contracts, and the possibility of an illiquid market. Counterparty risk involving futures is mitigated because a regulated clearinghouse is the counterparty instead of the clearing broker. To further mitigate counterparty risk, the fund trades futures contracts on an exchange, monitors the financial strength of its clearing brokers and clearinghouse, and has entered into clearing agreements with its clearing brokers. The clearinghouse imposes initial margin requirements to secure the fund’s performance and requires daily settlement of variation margin representing changes in the market value of each contract. Any securities pledged as initial margin for open contracts are noted in the Schedule of Investments.
Futures contracts are valued at their quoted daily settlement prices. The notional amounts of the contracts are not recorded in the Statement of Assets and Liabilities. Fluctuations in the value of the contracts are recorded in the Statement of Assets and Liabilities as an asset (liability) and in the Statement of Operations as unrealized appreciation (depreciation) until the contracts are closed, when they are recorded as realized gains (losses) on futures contracts.
During the year ended August 31, 2020, the fund’s average investments in long and short futures contracts represented less than 1% and 0% of net assets, respectively, based on the average of the notional amounts at each quarter-end during the period. The fund had no open futures contracts at August 31, 2020.
3. Swap Contracts: The fund has entered into equity swap contracts to earn the total return on selected reference stocks in the fund’s target index. Under the terms of the swaps, the fund receives the total return on the referenced stock (i.e., receiving the increase or paying the decrease in value of the selected reference stock and receiving the equivalent of any dividends in respect of the selected referenced stock) over a specified period of time, applied to a notional amount that represents the value of a designated number of shares of the selected reference stock at the beginning of the equity swap contract. The fund also pays a floating rate that is based on short-term interest rates, applied to the notional amount. At the same time, the fund generally invests an amount approximating the notional amount of the swap in high-quality temporary cash investments.
A risk associated with all types of swaps is the possibility that a counterparty may default on its obligation to pay net amounts due to the fund. The fund’s maximum amount subject to counterparty risk is the unrealized appreciation on the swap contract. The fund mitigates its counterparty risk by entering into swaps only with a diverse group of prequalified counterparties, monitoring their financial strength, entering into master netting arrangements with its counterparties, and requiring its counterparties to transfer collateral as security for their performance. In the absence of a default, the collateral pledged or received by the fund cannot be repledged, resold, or rehypothecated. In the event of a counterparty’s default (including bankruptcy), the fund may terminate any swap contracts with that counterparty, determine the net amount owed by either party in accordance with its master
Health Care Index Fund
netting arrangements, and sell or retain any collateral held up to the net amount owed to the fund under the master netting arrangements. The swap contracts contain provisions whereby a counterparty may terminate open contracts if the fund’s net assets decline below a certain level, triggering a payment by the fund if the fund is in a net liability position at the time of the termination. The payment amount would be reduced by any collateral the fund has pledged. Any securities pledged as collateral for open contracts are noted in the Schedule of Investments. The value of collateral received or pledged is compared daily to the value of the swap contracts exposure with each counterparty, and any difference, if in excess of a specified minimum transfer amount, is adjusted and settled within two business days.
The notional amounts of swap contracts are not recorded in the Statement of Assets and Liabilities. Swaps are valued daily based on market quotations received from independent pricing services or recognized dealers and the change in value is recorded in the Statement of Assets and Liabilities as an asset (liability) and in the Statement of Operations as unrealized appreciation (depreciation) until periodic payments are made or the termination of the swap, at which time realized gain (loss) is recorded.
During the year ended August 31, 2020, the fund’s average amounts of investments in total return swaps represented less than 1% of net assets, based on the average of notional amounts at each quarter-end during the period.
4. Federal Income Taxes: The fund intends to continue to qualify as a regulated investment company and distribute all of its taxable income. The fund’s tax returns are open to examination by the relevant tax authorities until expiration of the applicable statute of limitations, which is generally three years after the filing of the tax return. Management has analyzed the fund’s tax positions taken for all open federal and state income tax years, and has concluded that no provision for income tax is required in the fund’s financial statements.
5. Distributions: Distributions to shareholders are recorded on the ex-dividend date. Distributions are determined on a tax basis at the fiscal year-end and may differ from net investment income and realized capital gains for financial reporting purposes.
6. Securities Lending: To earn additional income, the fund lends its securities to qualified institutional borrowers. Security loans are subject to termination by the fund at any time, and are required to be secured at all times by collateral in an amount at least equal to the market value of securities loaned. Daily market fluctuations could cause the value of loaned securities to be more or less than the value of the collateral received. When this occurs, the collateral is adjusted and settled before the opening of the market on the next business day. The fund further mitigates its counterparty risk by entering into securities lending transactions only with a diverse group of prequalified counterparties, monitoring their financial strength, and entering into master securities lending agreements with its counterparties. The master securities lending agreements provide that, in the event of a counterparty’s default (including bankruptcy), the fund may terminate any loans with that borrower, determine the net amount owed, and sell or retain the collateral up to the net amount owed to the fund; however, such actions may be subject to legal proceedings. While collateral mitigates counterparty risk, in the event of a default, the fund may experience delays and costs in recovering the securities loaned. The fund invests cash collateral received in Vanguard Market Liquidity Fund, and records a liability in the Statement of Assets and Liabilities for the return of the collateral, during the period the securities are on loan. Collateral investments in Vanguard Market Liquidity Fund are subject to market appreciation or depreciation. Securities lending income represents fees charged to borrowers plus income earned on invested cash collateral, less expenses associated with the loan. During the term of the loan, the fund is entitled to all distributions made on or in respect of the loaned securities.
7. Credit Facilities and Interfund Lending Program: The fund and certain other funds managed by The Vanguard Group (“Vanguard”) participate in a $4.3 billion committed credit facility provided by a syndicate of lenders pursuant to a credit agreement and an uncommitted credit facility provided by Vanguard. Both facilities may be renewed annually. Each fund is individually liable for its borrowings, if any, under the credit facilities. Borrowings may be utilized for temporary or emergency purposes, subject to the fund’s regulatory and contractual borrowing restrictions. With respect to the committed credit facility, the participating funds are charged administrative fees and an annual commitment fee of 0.10% of the undrawn committed amount of the facility; these fees are allocated to the funds based on a method approved by the fund’s board of trustees and included in Management and Administrative expenses on the fund’s Statement of Operations. Any borrowings under either facility bear interest at a rate based upon the higher of the one-month London Interbank Offered Rate (or an acceptable alternate rate, if necessary), federal funds effective rate, or overnight bank funding rate plus an agreed-upon spread, except that borrowings under the uncommitted credit facility may bear interest based upon an alternative rate agreed to by the fund and Vanguard.
Health Care Index Fund
In accordance with an exemptive order (the “Order”) from the SEC, the fund may participate in a joint lending and borrowing program that allows registered open-end Vanguard funds to borrow money from and lend money to each other for temporary or emergency purposes (the “Interfund Lending Program”), subject to compliance with the terms and conditions of the Order, and to the extent permitted by the fund’s investment objective and investment policies. Interfund loans and borrowings normally extend overnight, but can have a maximum duration of seven days. Loans may be called on one business days’ notice. The interest rate to be charged is governed by the conditions of the Order and internal procedures adopted by the board of trustees. The board of trustees is responsible for overseeing the Interfund Lending Program.
For the year ended August 31, 2020, the fund did not utilize the credit facilities or the Interfund Lending Program.
8. Other: Dividend income is recorded on the ex-dividend date. Interest income includes income distributions received from Vanguard Market Liquidity Fund and is accrued daily. Security transactions are accounted for on the date securities are bought or sold. Costs used to determine realized gains (losses) on the sale of investment securities are those of the specific securities sold.
Each class of shares has equal rights as to assets and earnings, except that each class separately bears certain class-specific expenses related to maintenance of shareholder accounts (included in Management and Administrative expenses) and shareholder reporting. Marketing and distribution expenses are allocated to each class of shares based on a method approved by the board of trustees. Income, other non-class-specific expenses, and gains and losses on investments are allocated to each class of shares based on its relative net assets.
B. In accordance with the terms of a Funds’ Service Agreement (the “FSA”) between Vanguard and the fund, Vanguard furnishes to the fund investment advisory, corporate management, administrative, marketing, and distribution services at Vanguard’s cost of operations (as defined by the FSA). These costs of operations are allocated to the fund based on methods and guidelines approved by the board of trustees and are generally settled twice a month.
Upon the request of Vanguard, the fund may invest up to 0.40% of its net assets as capital in Vanguard. At August 31, 2020, the fund had contributed to Vanguard capital in the amount of $559,000, representing less than 0.01% of the fund’s net assets and 0.22% of Vanguard’s capital received pursuant to the FSA. The fund’s trustees and officers are also directors and employees, respectively, of Vanguard.
C. Various inputs may be used to determine the value of the fund’s investments and derivatives. These inputs are summarized in three broad levels for financial statement purposes. The inputs or methodologies used to value securities are not necessarily an indication of the risk associated with investing in those securities.
Level 1—Quoted prices in active markets for identical securities.
Level 2—Other significant observable inputs (including quoted prices for similar securities, interest rates, prepayment speeds, credit risk, etc.).
Level 3—Significant unobservable inputs (including the fund’s own assumptions used to determine the fair value of investments). Any investments and derivatives valued with significant unobservable inputs are noted on the Schedule of Investments.
The following table summarizes the market value of the fund’s investments and derivatives as of August 31, 2020, based on the inputs used to value them:
| | Level 1 | Level 2 | Level 3 | Total |
| | ($000) | ($000) | ($000) | ($000) |
| Investments | | | | |
| Assets | | | | |
| Common Stocks | 13,372,285 | — | 139 | 13,372,424 |
| Temporary Cash Investments | 49,078 | — | — | 49,078 |
| Total | 13,421,363 | — | 139 | 13,421,502 |
| Derivative Financial Instruments | | | | |
| Liabilities | | | | |
| Swap Contracts | — | 930 | — | 930 |
Health Care Index Fund
D. Permanent differences between book-basis and tax-basis components of net assets are reclassified among capital accounts in the financial statements to reflect their tax character. These reclassifications have no effect on net assets or net asset value per share. As of period end, permanent differences primarily attributable to the accounting for in-kind redemptions, passive foreign investment companies, and swap agreements were reclassified between the following accounts:
| | Amount |
| | ($000) |
| Paid-in Capital | 604,271 |
| Total Distributable Earnings (Loss) | (604,271) |
Temporary differences between book-basis and tax-basis components of total distributable earnings (loss) arise when certain items of income, gain, or loss are recognized in different periods for financial statement and tax purposes; these differences will reverse at some time in the future. The differences are primarily related to the deferral of losses from wash sales; the recognition of unrealized gains or losses from certain derivative contracts; and the recognition of unrealized gains from passive foreign investment companies. As of period end, the tax-basis components of total distributable earnings (loss) are detailed in the table as follows:
| | Amount |
| | ($000) |
| Undistributed Ordinary Income | 41,791 |
| Undistributed Long-Term Gains | — |
| Capital Loss Carryforwards | (270,629) |
| Qualified Late-Year Losses | — |
| Net Unrealized Gains (Losses) | 3,374,437 |
The tax character of distributions paid was as follows:
| | Year Ended August 31, |
| | 2020 | 2019 |
| | Amount | Amount |
| | ($000) | ($000) |
| Ordinary Income* | 156,341 | 210,444 |
| Long-Term Capital Gains | — | — |
| Total | 156,341 | 210,444 |
* Includes short-term capital gains, if any.
As of August 31, 2020, gross unrealized appreciation and depreciation for investments and derivatives based on cost for U.S. federal income tax purposes were as follows:
| | Amount |
| | ($000) |
| Tax Cost | 10,047,065 |
| Gross Unrealized Appreciation | 3,898,934 |
| Gross Unrealized Depreciation | (524,497) |
| Net Unrealized Appreciation (Depreciation) | 3,374,437 |
E. During the year ended August 31, 2020, the fund purchased $3,144,266,000 of investment securities and sold $2,299,434,000 of investment securities, other than temporary cash investments. Purchases and sales include $2,139,364,000 and $1,462,710,000, respectively, in connection with in-kind purchases and redemptions of the fund’s capital shares.
Health Care Index Fund
F. Capital share transactions for each class of shares were:
| | | | | Year Ended August 31, |
| | | 2020 | | | 2019 |
| | Amount | Shares | | Amount | Shares |
| | ($000) | (000) | | ($000) | (000) |
| ETF Shares | | | | | |
| Issued | 2,267,426 | 12,263 | | 1,841,149 | 10,713 |
| Issued in Lieu of Cash Distributions | — | — | | — | — |
| Redeemed | (1,477,005) | (8,225) | | (1,148,719) | (6,825) |
| Net Increase (Decrease)—ETF Shares | 790,421 | 4,038 | | 692,430 | 3,888 |
| Admiral Shares | | | | | |
| Issued | 453,890 | 4,915 | | 463,889 | 5,465 |
| Issued in Lieu of Cash Distributions | 17,644 | 194 | | 23,415 | 269 |
| Redeemed | (407,797) | (4,469) | | (365,727) | (4,327) |
| Net Increase (Decrease)—Admiral Shares | 63,737 | 640 | | 121,577 | 1,407 |
G. Management has determined that no events or transactions occurred subsequent to August 31, 2020, that would require recognition or disclosure in these financial statements.
Industrials Index Fund
Performance Summary
All of the returns in this report represent past performance, which is not a guarantee of future results that may be achieved by the fund. (Current performance may be lower or higher than the performance data cited. For performance data current to the most recent month-end, visit our website at vanguard.com/performance.) Note, too, that both investment returns and principal value can fluctuate widely, so an investor’s shares, when sold, could be worth more or less than their original cost. The returns shown do not reflect taxes that a shareholder would pay on fund distributions or on the sale of fund shares.
Cumulative Performance: August 31, 2010–August 31, 2020
Initial Investment of $10,000
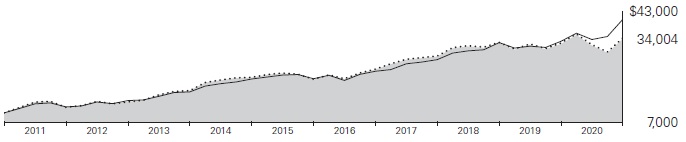
| | | Average Annual Total Returns | Final Value |
| | | Periods Ended August 31, 2020 | of a $10,000 |
| | | One Year | Five Years | Ten Years | Investment |
 | Industrials Index Fund ETF Shares Net Asset Value | 4.96% | 10.35% | 13.02% | $34,004 |
| | Industrials Index Fund ETF Shares Market Price | 5.06 | 10.37 | 13.04 | 34,062 |
| | MSCI US IMI/Industrials 25/50 | 5.10 | 10.44 | 13.14 | 34,375 |
 | MSCI US IMI/2500 | 21.48 | 13.88 | 14.99 | 40,426 |
| | | | | Final Value |
| | | | | of a $100,000 |
| | One Year | Five Years | Ten Years | Investment |
| Industrials Index Fund Admiral Shares | 4.98% | 10.35% | 13.03% | $340,259 |
| MSCI US IMI/Industrials 25/50 | 5.10 | 10.44 | 13.14 | 343,753 |
| MSCI US IMI/2500 | 21.48 | 13.88 | 14.99 | 404,265 |
Cumulative Returns: ETF Shares, August 31, 2010–August 31, 2020
| | One Year | Five Years | Ten Years |
| Industrials Index Fund ETF Shares Market Price | 5.06% | 63.76% | 240.62% |
| Industrials Index Fund ETF Shares Net Asset Value | 4.96 | 63.64 | 240.04 |
| MSCI US IMI/Industrials 25/50 | 5.10 | 64.31 | 243.75 |
For the ETF Shares, the market price is determined by the midpoint of the bid-offer spread as of the closing time of the New York Stock Exchange (generally 4 p.m., Eastern time). The net asset value is also determined as of the NYSE closing time. For more information about how the ETF Shares’ market prices have compared with their net asset value, visit vanguard.com, select your ETF, and then select the Price and Performance tab. The ETF premium/discount analysis there shows the percentages of days on which the ETF Shares’ market price was above or below the NAV.
See Financial Highlights for dividend and capital gains information.
Industrials Index Fund
Fund Allocation
As of August 31, 2020
| Aerospace & Defense | 17.3% |
| Agricultural & Farm Machinery | 2.5 |
| Air Freight & Logistics | 6.9 |
| Airlines | 2.3 |
| Airport Services | 0.1 |
| Building Products | 6.2 |
| Commercial Printing | 0.2 |
| Construction & Engineering | 1.7 |
| Construction Machinery & Heavy Trucks | 5.7 |
| Diversified Support Services | 2.3 |
| Electrical Components & Equipment | 6.3 |
| Environmental & Facilities Services | 4.3 |
| Heavy Electrical Equipment | 0.1 |
| Human Resource & Employment Services | 0.8 |
| Industrial Conglomerates | 10.6 |
| Industrial Machinery | 11.6 |
| Marine | 0.1 |
| Office Services & Supplies | 0.4 |
| Railroads | 8.7 |
| Research & Consulting Services | 5.2 |
| Security & Alarm Services | 0.1 |
| Trading Companies & Distributors | 3.5 |
| Trucking | 3.1 |
The table reflects the fund’s investments, except for short-term investments and derivatives. Sector categories are based on the Global Industry Classification Standard (“GICS”), except for the “Other” category (if applicable), which includes securities that have not been provided a GICS classification as of the effective reporting period.
The fund may invest in derivatives (such as futures and swap contracts) for various reasons, including, but not limited to, attempting to remain fully invested and tracking its target index as closely as possible.
The Global Industry Classification Standard (“GICS”) was developed by and is the exclusive property and a service mark of MSCI Inc. (“MSCI”) and Standard and Poor’s, a division of McGraw-Hill Companies, Inc. (“S&P”), and is licensed for use by Vanguard. Neither MSCI, S&P nor any third party involved in making or compiling the GICS or any GICS classification makes any express or implied warranties or representations with respect to such standard or classification (or the results to be obtained by the use thereof), and all such parties hereby expressly disclaim all warranties of originality, accuracy, completeness, merchantability or fitness for a particular purpose with respect to any such standard or classification. Without limiting any of the foregoing, in no event shall MSCI, S&P, any of its affiliates or any third party involved in making or compiling the GICS or any GICS classification have any liability for any direct, indirect, special, punitive, consequential or any other damages (including lost profits) even if notified of the possibility of such damages.
Industrials Index Fund
Financial Statements
Schedule of Investments
As of August 31, 2020
The fund files its complete schedule of portfolio holdings with the Securities and Exchange Commission (SEC) for the first and third quarters of each fiscal year as an exhibit to its reports on Form N-PORT. The fund’s Form N-PORT reports are available on the SEC’s website at www.sec.gov.
| | | | Market |
| | | | Value· |
| | | Shares | ($000) |
| Common Stocks (99.6%) | | |
| Aerospace & Defense (17.2%) | |
| | Lockheed Martin Corp. | 275,577 | 107,547 |
| | Raytheon Technologies Corp. | 1,652,700 | 100,815 |
| | Boeing Co. | 585,438 | 100,590 |
| | Northrop Grumman Corp. | 172,925 | 59,246 |
| | General Dynamics Corp. | 266,324 | 39,775 |
| | L3Harris Technologies Inc. | 211,769 | 38,275 |
| | TransDigm Group Inc. | 56,115 | 28,039 |
| * | Teledyne Technologies Inc. | 40,001 | 12,545 |
| | Textron Inc. | 248,174 | 9,785 |
| | Howmet Aerospace Inc. | 428,194 | 7,502 |
| | HEICO Corp. Class A | 79,043 | 7,065 |
| | Huntington Ingalls Industries Inc. | 44,186 | 6,695 |
| | BWX Technologies Inc. | 103,913 | 5,779 |
| * | Axon Enterprise Inc. | 65,274 | 5,593 |
| | HEICO Corp. | 47,343 | 5,204 |
| | Curtiss-Wright Corp. | 45,423 | 4,648 |
| * | Mercury Systems Inc. | 60,708 | 4,598 |
| | Hexcel Corp. | 91,200 | 3,592 |
| * | Aerojet Rocketdyne Holdings Inc. | 72,888 | 3,015 |
| * | Kratos Defense & Security Solutions Inc. | 130,943 | 2,560 |
| *,^ | Virgin Galactic Holdings Inc. | 140,582 | 2,516 |
| | Spirit AeroSystems Holdings Inc. Class A | 115,104 | 2,367 |
| | Moog Inc. Class A | 32,718 | 1,973 |
| * | AeroVironment Inc. | 24,970 | 1,907 |
| | Cubic Corp. | 34,327 | 1,616 |
| | Maxar Technologies Inc. | 65,235 | 1,510 |
| | Kaman Corp. | 25,538 | 1,181 |
| * | Parsons Corp. | 27,735 | 922 |
| | AAR Corp. | 36,623 | 739 |
| | National Presto Industries Inc. | 5,415 | 487 |
| * | Ducommun Inc. | 12,098 | 452 |
| | Triumph Group Inc. | 58,324 | 422 |
| * | Astronics Corp. | 25,367 | 229 |
| | Park Aerospace Corp. | 19,171 | 213 |
| | | | 569,402 |
| Air Freight & Logistics (6.8%) | | |
| | United Parcel Service Inc. Class B | 768,874 | 125,803 |
| | FedEx Corp. | 271,083 | 59,595 |
| | Expeditors International of Washington Inc. | 181,649 | 16,056 |
| * | XPO Logistics Inc. | 99,436 | 8,777 |
| | CH Robinson Worldwide Inc. | 76,924 | 7,562 |
| * | Hub Group Inc. Class A | 36,381 | 1,959 |
| | Forward Air Corp. | 30,360 | 1,791 |
| * | Air Transport Services Group Inc. | 65,118 | 1,655 |
| * | Atlas Air Worldwide Holdings Inc. | 28,525 | 1,608 |
| * | Echo Global Logistics Inc. | 29,046 | 794 |
| * | Radiant Logistics Inc. | 39,485 | 208 |
| | | | 225,808 |
| Airlines (2.3%) | | |
| | Southwest Airlines Co. | 611,099 | 22,965 |
| | Delta Air Lines Inc. | 628,004 | 19,374 |
| * | United Airlines Holdings Inc. | 301,071 | 10,839 |
| ^ | American Airlines Group Inc. | 542,694 | 7,082 |
| | Alaska Air Group Inc. | 133,891 | 5,215 |
| * | JetBlue Airways Corp. | 294,503 | 3,393 |
| | SkyWest Inc. | 54,506 | 1,834 |
| | Allegiant Travel Co. Class A | 14,120 | 1,816 |
| *,^ | Spirit Airlines Inc. | 94,148 | 1,683 |
| | Hawaiian Holdings Inc. | 49,591 | 666 |
| | | | 74,867 |
| Building Products (6.2%) | | |
| | Johnson Controls International plc | 813,113 | 33,118 |
| | Trane Technologies plc | 260,055 | 30,788 |
| | Carrier Global Corp. | 898,991 | 26,835 |
| | Masco Corp. | 287,822 | 16,780 |
| | Fortune Brands Home & Security Inc. | 150,520 | 12,656 |
| | Lennox International Inc. | 37,555 | 10,528 |
| | Allegion plc | 100,624 | 10,403 |
| * | Trex Co. Inc. | 63,128 | 9,437 |
| | Owens Corning | 117,535 | 7,950 |
| | A O Smith Corp. | 147,384 | 7,217 |
| | Simpson Manufacturing Co. Inc. | 42,689 | 4,198 |
| | UFP Industries Inc. | 66,677 | 3,957 |
| * | Builders FirstSource Inc. | 127,234 | 3,896 |
| | Armstrong World Industries Inc. | 52,338 | 3,859 |
| | Advanced Drainage Systems Inc. | 56,298 | 3,123 |
| | AAON Inc. | 45,336 | 2,581 |
| * | Masonite International Corp. | 25,319 | 2,311 |
| * | Gibraltar Industries Inc. | 35,372 | 2,209 |
| * | Resideo Technologies Inc. | 128,035 | 1,711 |
| * | JELD-WEN Holding Inc. | 77,332 | 1,628 |
| * | American Woodmark Corp. | 17,653 | 1,545 |
| | Patrick Industries Inc. | 24,381 | 1,370 |
| | CSW Industrials Inc. | 16,034 | 1,158 |
| * | PGT Innovations Inc. | 63,691 | 1,155 |
| | Griffon Corp. | 45,134 | 981 |
| | Quanex Building Products Corp. | 36,637 | 616 |
| | Apogee Enterprises Inc. | 26,882 | 563 |
| * | Cornerstone Building Brands Inc. | 54,251 | 432 |
| | Insteel Industries Inc. | 20,387 | 376 |
| | | | 203,381 |
| Commercial Services & Supplies (7.2%) |
| | Waste Management Inc. | 460,980 | 52,552 |
| | Cintas Corp. | 96,640 | 32,204 |
| | Waste Connections Inc. | 287,220 | 28,731 |
| * | Copart Inc. | 230,920 | 23,859 |
| | Republic Services Inc. Class A | 243,200 | 22,549 |
| | Rollins Inc. | 160,999 | 8,877 |
| * | IAA Inc. | 146,150 | 7,647 |
| * | Stericycle Inc. | 99,759 | 6,396 |
| | Tetra Tech Inc. | 58,963 | 5,443 |
| | MSA Safety Inc. | 40,298 | 5,076 |
| * | Clean Harbors Inc. | 57,605 | 3,520 |
| | UniFirst Corp. | 16,664 | 3,210 |
| * | Casella Waste Systems Inc. Class A | 51,664 | 2,901 |
| | ABM Industries Inc. | 72,749 | 2,775 |
| | Brink’s Co. | 55,072 | 2,663 |
| * | Advanced Disposal Service Inc. | 84,060 | 2,533 |
| | Brady Corp. Class A | 52,871 | 2,479 |
| | KAR Auction Services Inc. | 140,982 | 2,445 |
| * | Cimpress plc | 19,814 | 1,837 |
| | ADT Inc. | 164,857 | 1,756 |
| | McGrath RentCorp | 26,207 | 1,739 |
| | Healthcare Services Group Inc. | 80,656 | 1,678 |
| | Herman Miller Inc. | 63,783 | 1,520 |
| | HNI Corp. | 46,665 | 1,486 |
| | Deluxe Corp. | 45,934 | 1,304 |
| | Covanta Holding Corp. | 129,597 | 1,223 |
| * | Harsco Corp. | 85,609 | 1,211 |
| | US Ecology Inc. | 31,203 | 1,159 |
| | Pitney Bowes Inc. | 189,983 | 1,043 |
| | Steelcase Inc. Class A | 91,701 | 958 |
| | Knoll Inc. | 56,089 | 722 |
| | Matthews International Corp. Class A | 32,049 | 702 |
| | ACCO Brands Corp. | 102,494 | 664 |
| | Ennis Inc. | 28,658 | 525 |
| * | SP Plus Corp. | 23,549 | 483 |
| | Viad Corp. | 22,233 | 476 |
| | Interface Inc. Class A | 62,882 | 475 |
| | Kimball International Inc. Class B | 40,095 | 449 |
| * | BrightView Holdings Inc. | 33,591 | 412 |
| | VSE Corp. | 9,619 | 279 |
| * | Heritage-Crystal Clean Inc. | 16,321 | 240 |
| * | Team Inc. | 31,328 | 200 |
| * | Civeo Corp. | 145,706 | 127 |
| | Quad/Graphics Inc. | 35,697 | 125 |
| | RR Donnelley & Sons Co. | 74,609 | 98 |
| | | | 238,751 |
| Construction & Engineering (1.7%) | |
| | Jacobs Engineering Group Inc. | 142,343 | 12,849 |
| | Quanta Services Inc. | 150,141 | 7,695 |
| * | Aecom | 174,574 | 6,897 |
| | EMCOR Group Inc. | 59,792 | 4,485 |
| | WillScot Mobile Mini Holdings Corp. Class A | 186,747 | 3,343 |
| * | MasTec Inc. | 64,326 | 2,972 |
Industrials Index Fund
| | | | Market |
| | | | Value· |
| | | Shares | ($000) |
| | Valmont Industries Inc. | 23,289 | 2,959 |
| | Arcosa Inc. | 52,641 | 2,437 |
| * | Dycom Industries Inc. | 34,513 | 2,123 |
| | Comfort Systems USA Inc. | 40,014 | 2,028 |
| | Fluor Corp. | 146,359 | 1,393 |
| | Granite Construction Inc. | 51,486 | 957 |
| | Primoris Services Corp. | 49,875 | 951 |
| * | Ameresco Inc. Class A | 22,564 | 770 |
| * | MYR Group Inc. | 18,335 | 712 |
| | Argan Inc. | 16,315 | 691 |
| * | Great Lakes Dredge & Dock Corp. | 69,597 | 652 |
| * | NV5 Global Inc. | 11,158 | 578 |
| * | Tutor Perini Corp. | 44,540 | 559 |
| * | Aegion Corp. Class A | 33,270 | 538 |
| * | Construction Partners Inc. Class A | 26,801 | 501 |
| | | | 56,090 |
| Electrical Equipment (6.4%) | | |
| | Emerson Electric Co. | 652,609 | 45,337 |
| | Eaton Corp. plc | 436,885 | 44,606 |
| | Rockwell Automation Inc. | 126,540 | 29,171 |
| | AMETEK Inc. | 250,684 | 25,244 |
| * | Generac Holdings Inc. | 68,401 | 12,995 |
| | Hubbell Inc. Class B | 59,204 | 8,580 |
| * | Sensata Technologies Holding plc | 171,284 | 7,132 |
| * | Sunrun Inc. | 91,909 | 5,198 |
| | Acuity Brands Inc. | 43,181 | 4,719 |
| * | Plug Power Inc. | 353,860 | 4,593 |
| | Regal Beloit Corp. | 44,304 | 4,380 |
| | nVent Electric plc | 176,110 | 3,367 |
| | EnerSys | 45,995 | 3,311 |
| * | Vicor Corp. | 20,513 | 1,785 |
| * | Vivint Solar Inc. | 54,415 | 1,680 |
| *,^ | Bloom Energy Corp.Class A | 97,444 | 1,526 |
| * | Atkore International Group Inc. | 51,751 | 1,383 |
| | Encore Wire Corp. | 22,358 | 1,154 |
| * | TPI Composites Inc. | 33,102 | 1,017 |
| | AZZ Inc. | 28,202 | 979 |
| | GrafTech International Ltd. | 87,242 | 581 |
| * | Thermon Group Holdings Inc. | 35,639 | 469 |
| | Allied Motion Technologies Inc. | 8,360 | 356 |
| | Powell Industries Inc. | 9,988 | 270 |
| | | | 209,833 |
| Industrial Conglomerates (10.5%) | |
| | Honeywell International Inc. | 766,508 | 126,896 |
| | 3M Co. | 628,112 | 102,395 |
| | General Electric Co. | 9,554,430 | 60,575 |
| | Roper Technologies Inc. | 114,008 | 48,703 |
| | Carlisle Cos. Inc. | 59,911 | 7,845 |
| | Raven Industries Inc. | 39,353 | 978 |
| | | | 347,392 |
| Machinery (19.8%) | | |
| | Caterpillar Inc. | 591,019 | 84,108 |
| | Deere & Co. | 324,539 | 68,173 |
| | Illinois Tool Works Inc. | 344,914 | 68,138 |
| | Cummins Inc. | 161,136 | 33,395 |
| | PACCAR Inc. | 377,650 | 32,417 |
| | Parker-Hannifin Corp. | 140,100 | 28,862 |
| | Otis Worldwide Corp. | 449,441 | 28,270 |
| | Stanley Black & Decker Inc. | 168,382 | 27,160 |
| | Fortive Corp. | 331,245 | 23,886 |
| | Dover Corp. | 157,051 | 17,250 |
| | Xylem Inc. | 196,292 | 15,739 |
| | IDEX Corp. | 82,441 | 14,858 |
| * | Ingersoll Rand Inc. | 386,501 | 13,551 |
| | Wabtec Corp. | 197,227 | 13,125 |
| | Nordson Corp. | 59,714 | 11,136 |
| | Graco Inc. | 181,978 | 10,558 |
| | Toro Co. | 116,866 | 8,798 |
| | Snap-on Inc. | 56,322 | 8,351 |
| | Pentair plc | 180,808 | 8,162 |
| | Donaldson Co. Inc. | 138,313 | 6,965 |
| | Lincoln Electric Holdings Inc. | 61,550 | 5,952 |
| * | Middleby Corp. | 60,631 | 5,936 |
| | ITT Inc. | 94,135 | 5,913 |
| | Oshkosh Corp. | 74,418 | 5,731 |
| | Woodward Inc. | 64,575 | 5,533 |
| | AGCO Corp. | 69,598 | 4,948 |
| | Allison Transmission Holdings Inc. | 123,447 | 4,428 |
| | Flowserve Corp. | 141,904 | 4,212 |
| * | Proto Labs Inc. | 27,627 | 4,061 |
| | Timken Co. | 74,370 | 4,030 |
| | Rexnord Corp. | 130,608 | 3,782 |
| * | RBC Bearings Inc. | 27,369 | 3,614 |
| | John Bean Technologies Corp. | 34,661 | 3,553 |
| * | Colfax Corp. | 103,252 | 3,436 |
| | Crane Co. | 50,556 | 2,858 |
| | Altra Industrial Motion Corp. | 70,531 | 2,754 |
| | Watts Water Technologies Inc. Class A | 28,571 | 2,736 |
| | Kennametal Inc. | 90,445 | 2,625 |
| | Hillenbrand Inc. | 81,579 | 2,587 |
| * | Chart Industries Inc. | 39,224 | 2,578 |
| | ESCO Technologies Inc. | 28,407 | 2,554 |
| | Franklin Electric Co. Inc. | 42,858 | 2,544 |
| | Federal Signal Corp. | 65,372 | 2,100 |
| | Trinity Industries Inc. | 102,320 | 2,094 |
| | Barnes Group Inc. | 52,185 | 2,067 |
| * | SPX Corp. | 48,601 | 2,033 |
| * | SPX FLOW Inc. | 46,587 | 2,026 |
| * | Evoqua Water Technologies Corp. | 95,223 | 1,948 |
| | Mueller Water Products Inc. Class A | 164,575 | 1,777 |
| | Albany International Corp. Class A | 33,626 | 1,745 |
| * | Meritor Inc. | 74,804 | 1,703 |
| | Mueller Industries Inc. | 55,375 | 1,645 |
| * | Navistar International Corp. | 49,057 | 1,569 |
| | Terex Corp. | 75,559 | 1,479 |
| | Kadant Inc. | 12,455 | 1,450 |
| | Helios Technologies Inc. | 33,499 | 1,377 |
| | Enerpac Tool Group Corp. Class A | 64,942 | 1,351 |
| | Tennant Co. | 19,115 | 1,271 |
| | EnPro Industries Inc. | 21,289 | 1,246 |
| | Alamo Group Inc. | 11,032 | 1,223 |
| | Lindsay Corp. | 11,909 | 1,190 |
| * | TriMas Corp. | 46,902 | 1,186 |
| | Astec Industries Inc. | 21,958 | 1,158 |
| * | Welbilt Inc. | 146,695 | 1,083 |
| | Greenbrier Cos. Inc. | 35,804 | 974 |
| | Douglas Dynamics Inc. | 25,231 | 969 |
| | Columbus McKinnon Corp. | 26,265 | 955 |
| | Standex International Corp. | 13,724 | 794 |
| * | Gates Industrial Corp. plc | 63,851 | 721 |
| | Wabash National Corp. | 57,370 | 700 |
| * | CIRCOR International Inc. | 19,878 | 589 |
| | Gorman-Rupp Co. | 18,244 | 583 |
| | Luxfer Holdings plc | 30,894 | 439 |
| * | Lydall Inc. | 19,856 | 373 |
| * | Manitowoc Co. Inc. | 37,928 | 357 |
| * | Energy Recovery Inc. | 41,626 | 354 |
| | Hyster-Yale Materials Handling Inc. | 7,208 | 291 |
| | REV Group Inc. | 29,699 | 230 |
| | NN Inc. | 40,159 | 183 |
| * | Blue Bird Corp. | 15,010 | 171 |
| | Park-Ohio Holdings Corp. | 8,887 | 141 |
| | Titan International Inc. | 55,019 | 131 |
| | | | 652,943 |
| Marine (0.1%) | | |
| * | Kirby Corp. | 62,410 | 2,649 |
| | Matson Inc. | 47,185 | 1,891 |
| | Genco Shipping & Trading Ltd. | 18,994 | 135 |
| *,^ | Eagle Bulk Shipping Inc. | 37,634 | 99 |
| | | | 4,774 |
| Professional Services (6.0%) | | |
| * | CoStar Group Inc. | 42,989 | 36,480 |
| | IHS Markit Ltd. | 413,958 | 33,084 |
| | Verisk Analytics Inc. Class A | 168,396 | 31,434 |
| | Equifax Inc. | 132,454 | 22,288 |
| | TransUnion | 207,099 | 17,960 |
| | Robert Half International Inc. | 125,649 | 6,685 |
| | Nielsen Holdings plc | 388,919 | 5,943 |
| | CoreLogic Inc. | 86,654 | 5,754 |
| * | FTI Consulting Inc. | 40,483 | 4,646 |
| | ManpowerGroup Inc. | 63,300 | 4,641 |
| | Exponent Inc. | 56,236 | 4,524 |
| * | ASGN Inc. | 57,422 | 4,121 |
| * | TriNet Group Inc. | 47,728 | 3,238 |
| | Insperity Inc. | 40,019 | 2,696 |
| * | Dun & Bradstreet Holdings Inc. | 90,040 | 2,283 |
| | Korn Ferry | 60,421 | 1,843 |
| | ICF International Inc. | 20,667 | 1,412 |
| * | CBIZ Inc. | 56,147 | 1,366 |
| * | Upwork Inc. | 81,647 | 1,243 |
| * | Huron Consulting Group Inc. | 24,935 | 1,082 |
| | Kforce Inc. | 21,569 | 741 |
| | Kelly Services Inc. Class A | 37,015 | 703 |
| * | TrueBlue Inc. | 39,436 | 667 |
| | Barrett Business Services Inc. | 8,254 | 475 |
| | Heidrick & Struggles International Inc. | 20,447 | 442 |
| * | Forrester Research Inc. | 12,314 | 437 |
| | Resources Connection Inc. | 33,560 | 412 |
| | CRA International Inc. | 8,611 | 366 |
| * | Willdan Group Inc. | 12,043 | 339 |
| * | Mistras Group Inc. | 19,780 | 94 |
| | | | 197,399 |
| Road & Rail (11.8%) | | |
| | Union Pacific Corp. | 740,961 | 142,591 |
| | CSX Corp. | 836,084 | 63,927 |
| | Norfolk Southern Corp. | 279,832 | 59,473 |
| * | Uber Technologies Inc. | 1,041,611 | 35,029 |
| | Old Dominion Freight Line Inc. | 102,980 | 20,820 |
Industrials Index Fund
| | | | Market |
| | | | Value· |
| | | Shares | ($000) |
| | Kansas City Southern | 103,871 | 18,909 |
| | JB Hunt Transport Services Inc. | 92,099 | 12,944 |
| | Knight-Swift Transportation Holdings Inc. | 139,051 | 6,321 |
| | Landstar System Inc. | 41,896 | 5,576 |
| * | Saia Inc. | 28,456 | 3,819 |
| | Amerco | 10,701 | 3,798 |
| | Werner Enterprises Inc. | 67,729 | 3,116 |
| * | Lyft Inc. Class A | 81,238 | 2,410 |
| | Ryder System Inc. | 58,691 | 2,400 |
| * | Avis Budget Group Inc. | 60,705 | 2,071 |
| | Schneider National Inc. Class B | 56,649 | 1,533 |
| | Marten Transport Ltd. | 66,853 | 1,214 |
| | Heartland Express Inc. | 48,413 | 1,001 |
| | ArcBest Corp. | 27,833 | 941 |
| * | Daseke Inc. | 49,043 | 302 |
| * | Covenant Transportation Group Inc. Class A | 12,296 | 225 |
| * | US Xpress Enterprises Inc. Class A | 22,690 | 217 |
| | Universal Logistics Holdings Inc. | 5,893 | 127 |
| | | | 388,764 |
| Trading Companies & Distributors (3.5%) |
| | Fastenal Co. | 625,730 | 30,573 |
| | WW Grainger Inc. | 49,586 | 18,120 |
| * | United Rentals Inc. | 78,801 | 13,952 |
| | Watsco Inc. | 35,742 | 8,756 |
| * | HD Supply Holdings Inc. | 176,686 | 7,007 |
| * | SiteOne Landscape Supply Inc. | 45,669 | 5,711 |
| | Air Lease Corp. Class A | 117,781 | 3,661 |
| * | Univar Solutions Inc. | 184,193 | 3,350 |
| | MSC Industrial Direct Co. Inc. Class A | 49,552 | 3,265 |
| * | BMC Stock Holdings Inc. | 69,415 | 2,771 |
| * | WESCO International Inc. | 54,765 | 2,566 |
| | Applied Industrial Technologies Inc. | 42,131 | 2,537 |
| | GATX Corp. | 34,315 | 2,295 |
| | Triton International Ltd. | 57,511 | 2,074 |
| * | Beacon Roofing Supply Inc. | 60,275 | 2,043 |
| | Rush Enterprises Inc. Class A | 30,205 | 1,459 |
| * | GMS Inc. | 46,014 | 1,219 |
| * | Herc Holdings Inc. | 22,382 | 917 |
| * | NOW Inc. | 119,092 | 866 |
| | H&E Equipment Services Inc. | 35,590 | 721 |
| * | MRC Global Inc. | 91,501 | 521 |
| * | Foundation Building Materials Inc. | 23,257 | 377 |
| * | CAI International Inc. | 16,679 | 364 |
| * | DXP Enterprises Inc. | 18,740 | 361 |
| | Systemax Inc. | 14,197 | 315 |
| * | Titan Machinery Inc. | 20,537 | 277 |
| * | Veritiv Corp. | 13,494 | 235 |
| * | EVI Industries Inc. | 5,665 | 139 |
| | | | 116,452 |
| Transportation Infrastructure (0.1%) | |
| | Macquarie Infrastructure Corp. | 80,565 | 2,257 |
Total Common Stocks
(Cost $3,170,675) | | 3,288,113 |
| Temporary Cash Investment (0.5%) | |
| 1,2 | Vanguard Market Liquidity Fund, 0.147% (Cost $16,658) | 166,587 | 16,659 |
Total Investments (100.1%)
(Cost $3,187,333) | | 3,304,772 |
| Other Assets and Liabilities—Net (-0.1%) | | (4,829) |
| Net Assets (100%) | | 3,299,943 |
Cost is in $000.
| · | See Note A in Notes to Financial Statements. |
| * | Non-income-producing security. |
| ^ | Includes partial security positions on loan to broker-dealers. The total value of securities on loan is $11,662,000. |
| 1 | Affiliated money market fund available only to Vanguard funds and certain trusts and accounts managed by Vanguard. Rate shown is the 7-day yield. |
| 2 | Collateral of $12,356,000 was received for securities on loan, of which $11,152,000 is held in Vanguard Market Liquidity Fund and $1,204,000 is held in cash. |
| Derivative Financial Instruments Outstanding as of Period End | | |
| | | | | | |
| Over-the-Counter Total Return Swaps | | | | | |
| | | | | Floating | | |
| | | | | Interest Rate | Value and | Value and |
| | | | Notional | Received | Unrealized | Unrealized |
| | Termination | | Amount | (Paid)1 | Appreciation | (Depreciation) |
| Reference Entity | Date | Counterparty | ($000) | (%) | ($000) | ($000) |
| CH Robinson Worldwide Inc. | 2/2/21 | GSI | 6,670 | (0.161) | 211 | — |
| L3Harris Technologies Inc. | 9/2/20 | BOANA | 4,040 | (0.155) | 297 | — |
| L3Harris Technologies Inc. | 9/2/21 | BOANA | 4,338 | (0.160) | — | — |
| | | | | | 508 | — |
| 1 | Based on 1-month USD London Interbank Offered Rate (LIBOR) as of the most recent payment date. Floating interest payment received/ paid monthly. |
GSI—Goldman Sachs International.
BOANA—Bank of America, N.A.
At August 31, 2020, a counterparty had deposited in segregated account securities with a value of $16,000 in connection with open over-the-counter swap contracts.
See accompanying Notes, which are an integral part of the Financial Statements.
Industrials Index Fund
Statement of Assets and Liabilities
As of August 31, 2020
| ($000s, except shares and per-share amounts) | Amount |
| Assets | |
| Investments in Securities, at Value | |
| Unaffiliated Issuers (Cost $3,170,675) | 3,288,113 |
| Affiliated Issuers (Cost $16,658) | 16,659 |
| Total Investments in Securities | 3,304,772 |
| Investment in Vanguard | 130 |
| Cash | 1,204 |
| Receivables for Investment Securities Sold | 13,729 |
| Receivables for Accrued Income | 7,364 |
| Receivables for Capital Shares Issued | 1,054 |
| Unrealized Appreciation—Over-the-Counter Swap Contracts | 508 |
| Total Assets | 3,328,761 |
| Liabilities | |
| Payables for Investment Securities Purchased | 16,035 |
| Collateral for Securities on Loan | 12,356 |
| Payables for Capital Shares Redeemed | 266 |
| Payables to Vanguard | 161 |
| Total Liabilities | 28,818 |
| Net Assets | 3,299,943 |
| | |
| | |
| At August 31, 2020, net assets consisted of: | |
| | |
| Paid-in Capital | 3,244,548 |
| Total Distributable Earnings (Loss) | 55,395 |
| Net Assets | 3,299,943 |
| | |
| ETF Shares—Net Assets | |
| Applicable to 21,038,562 outstanding $.001 par value shares of beneficial interest (unlimited authorization) | 3,090,410 |
| Net Asset Value Per Share—ETF Shares | $146.89 |
| | |
| Admiral Shares—Net Assets | |
| Applicable to 2,776,597 outstanding $.001 par value shares of beneficial interest (unlimited authorization) | 209,533 |
| Net Asset Value Per Share—Admiral Shares | $75.46 |
See accompanying Notes, which are an integral part of the Financial Statements.
Industrials Index Fund
Statement of Operations
| | Year Ended |
| | August 31, 2020 |
| | ($000) |
| Investment Income | |
| Income | |
| Dividends | 59,655 |
| Interest1 | 30 |
| Securities Lending—Net | 254 |
| Total Income | 59,939 |
| Expenses | |
| The Vanguard Group—Note B | |
| Investment Advisory Services | 499 |
| Management and Administrative—ETF Shares | 2,200 |
| Management and Administrative—Admiral Shares | 145 |
| Marketing and Distribution—ETF Shares | 169 |
| Marketing and Distribution—Admiral Shares | 14 |
| Custodian Fees | 24 |
| Auditing Fees | 32 |
| Shareholders’ Reports—ETF Shares | 253 |
| Shareholders’ Reports—Admiral Shares | 6 |
| Trustees’ Fees and Expenses | 2 |
| Total Expenses | 3,344 |
| Net Investment Income | 56,595 |
| Realized Net Gain (Loss) | |
| Investment Securities Sold1,2 | 269,893 |
| Futures Contracts | 19 |
| Swap Contracts | 808 |
| Realized Net Gain (Loss) | 270,720 |
| Change in Unrealized Appreciation (Depreciation) | |
| Investment Securities1 | (170,083) |
| Swap Contracts | 407 |
| Change in Unrealized Appreciation (Depreciation) | (169,676) |
| Net Increase (Decrease) in Net Assets Resulting from Operations | 157,639 |
| 1 | Interest income, realized net gain (loss), and change in unrealized appreciation (depreciation) from an affiliated company of the fund were $30,000, ($1,000), and $1,000, respectively. Purchases and sales are for temporary cash investment purposes. |
| 2 | Includes $301,712,000 of net gain (loss) resulting from in-kind redemptions. |
Statement of Changes in Net Assets
| | Year Ended August 31, |
| | 2020 | 2019 |
| | ($000) | ($000) |
| Increase (Decrease) in Net Assets | | |
| Operations | | |
| Net Investment Income | 56,595 | 69,081 |
| Realized Net Gain (Loss) | 270,720 | 268,524 |
| Change in Unrealized Appreciation (Depreciation) | (169,676) | (460,158) |
| Net Increase (Decrease) in Net Assets Resulting from Operations | 157,639 | (122,553) |
| Distributions1 | | |
| ETF Shares | (58,321) | (62,999) |
| Admiral Shares | (3,648) | (3,522) |
| Total Distributions | (61,969) | (66,521) |
| Capital Share Transactions | | |
| ETF Shares | (457,228) | (317,178) |
| Admiral Shares | 2,094 | (4,653) |
| Net Increase (Decrease) from Capital Share Transactions | (455,134) | (321,831) |
| Total Increase (Decrease) | (359,464) | (510,905) |
| Net Assets | | |
| Beginning of Period | 3,659,407 | 4,170,312 |
| End of Period | 3,299,943 | 3,659,407 |
1 Certain prior-period numbers have been reclassified to conform with current period presentation.
See accompanying Notes, which are an integral part of the Financial Statements.
Industrials Index Fund
Financial Highlights
| ETF Shares | | | | | |
| | | | | | |
| For a Share Outstanding | | | Year Ended August 31, |
| Throughout Each Period | 2020 | 2019 | 2018 | 2017 | 2016 |
| Net Asset Value, Beginning of Period | $142.53 | $146.12 | $128.70 | $111.57 | $99.23 |
| Investment Operations | | | | | |
| Net Investment Income | 2.3661 | 2.5971 | 2.2631 | 2.3831 | 2.083 |
| Net Realized and Unrealized Gain (Loss) on Investments | 4.554 | (3.754) | 17.412 | 16.998 | 13.204 |
| Total from Investment Operations | 6.920 | (1.157) | 19.675 | 19.381 | 15.287 |
| Distributions | | | | | |
| Dividends from Net Investment Income | (2.560) | (2.433) | (2.255) | (2.251) | (2.947) |
| Distributions from Realized Capital Gains | — | — | — | — | — |
| Total Distributions | (2.560) | (2.433) | (2.255) | (2.251) | (2.947) |
| Net Asset Value, End of Period | $146.89 | $142.53 | $146.12 | $128.70 | $111.57 |
| | | | | | |
| Total Return | 4.96% | -0.73% | 15.41% | 17.55% | 15.78% |
| | | | | | |
| Ratios/Supplemental Data | | | | | |
| Net Assets, End of Period (Millions) | $3,090 | $3,457 | $3,957 | $3,202 | $2,338 |
| Ratio of Total Expenses to Average Net Assets | 0.10% | 0.10% | 0.10% | 0.10% | 0.10% |
| Ratio of Net Investment Income to Average Net Assets | 1.69% | 1.87% | 1.62% | 1.95% | 2.08% |
| Portfolio Turnover Rate2 | 4% | 4% | 4% | 5% | 8% |
| 1 | Calculated based on average shares outstanding. |
| 2 | Excludes the value of portfolio securities received or delivered as a result of in-kind purchases or redemptions of the fund’s capital shares, including ETF Creation Units. |
| Admiral Shares | | | | | |
| | | | | | |
| For a Share Outstanding | | | Year Ended August 31, |
| Throughout Each Period | 2020 | 2019 | 2018 | 2017 | 2016 |
| Net Asset Value, Beginning of Period | $73.22 | $75.07 | $66.12 | $57.32 | $50.98 |
| Investment Operations | | | | | |
| Net Investment Income | 1.2211 | 1.3401 | 1.1541 | 1.2371 | 1.069 |
| Net Realized and Unrealized Gain (Loss) on Investments | 2.336 | (1.941) | 8.955 | 8.721 | 6.783 |
| Total from Investment Operations | 3.557 | (.601) | 10.109 | 9.958 | 7.852 |
| Distributions | | | | | |
| Dividends from Net Investment Income | (1.317) | (1.249) | (1.159) | (1.158) | (1.512) |
| Distributions from Realized Capital Gains | — | — | — | — | — |
| Total Distributions | (1.317) | (1.249) | (1.159) | (1.158) | (1.512) |
| Net Asset Value, End of Period | $75.46 | $73.22 | $75.07 | $66.12 | $57.32 |
| | | | | | |
| Total Return2 | 4.98% | -0.75% | 15.41% | 17.55% | 15.77% |
| | | | | | |
| Ratios/Supplemental Data | | | | | |
| Net Assets, End of Period (Millions) | $210 | $202 | $213 | $176 | $77 |
| Ratio of Total Expenses to Average Net Assets | 0.10% | 0.10% | 0.10% | 0.10% | 0.10% |
| Ratio of Net Investment Income to Average Net Assets | 1.71% | 1.87% | 1.62% | 1.95% | 2.08% |
| Portfolio Turnover Rate3 | 4% | 4% | 4% | 5% | 8% |
| 1 | Calculated based on average shares outstanding. |
| 2 | Total returns do not include account service fees that may have applied in the periods shown. Fund prospectuses provide information about any applicable account service fees. |
| 3 | Excludes the value of portfolio securities received or delivered as a result of in-kind purchases or redemptions of the fund’s capital shares, including ETF Creation Units. |
See accompanying Notes, which are an integral part of the Financial Statements.
Industrials Index Fund
Notes to Financial Statements
Vanguard Industrials Index Fund is registered under the Investment Company Act of 1940 as an open-end investment company, or mutual fund. The fund offers two classes of shares: ETF Shares and Admiral Shares. Each of the share classes has different eligibility and minimum purchase requirements, and is designed for different types of investors. ETF Shares are listed for trading on NYSE Arc; they can be purchased and sold through a broker.
Market disruptions associated with the COVID-19 pandemic have had a global impact, and uncertainty exists as to the long-term implications. Such disruptions can adversely affect assets of the fund and thus fund performance.
A. The following significant accounting policies conform to generally accepted accounting principles for U.S. investment companies. The fund consistently follows such policies in preparing its financial statements.
1. Security Valuation: Securities are valued as of the close of trading on the New York Stock Exchange (generally 4 p.m., Eastern time) on the valuation date. Equity securities are valued at the latest quoted sales prices or official closing prices taken from the primary market in which each security trades; such securities not traded on the valuation date are valued at the mean of the latest quoted bid and asked prices. Securities for which market quotations are not readily available, or whose values have been materially affected by events occurring before the fund’s pricing time but after the close of the securities’ primary markets, are valued by methods deemed by the board of trustees to represent fair value. Investments in Vanguard Market Liquidity Fund are valued at that fund’s net asset value.
2. Futures Contracts: The fund uses index futures contracts to a limited extent, with the objectives of maintaining full exposure to the stock market, maintaining liquidity, and minimizing transaction costs. The fund may purchase futures contracts to immediately invest incoming cash in the market, or sell futures in response to cash outflows, thereby simulating a fully invested position in the underlying index while maintaining a cash balance for liquidity. The primary risks associated with the use of futures contracts are imperfect correlation between changes in market values of stocks held by the fund and the prices of futures contracts, and the possibility of an illiquid market. Counterparty risk involving futures is mitigated because a regulated clearinghouse is the counterparty instead of the clearing broker. To further mitigate counterparty risk, the fund trades futures contracts on an exchange, monitors the financial strength of its clearing brokers and clearinghouse, and has entered into clearing agreements with its clearing brokers. The clearinghouse imposes initial margin requirements to secure the fund’s performance and requires daily settlement of variation margin representing changes in the market value of each contract. Any securities pledged as initial margin for open contracts are noted in the Schedule of Investments.
Futures contracts are valued at their quoted daily settlement prices. The notional amounts of the contracts are not recorded in the Statement of Assets and Liabilities. Fluctuations in the value of the contracts are recorded in the Statement of Assets and Liabilities as an asset (liability) and in the Statement of Operations as unrealized appreciation (depreciation) until the contracts are closed, when they are recorded as realized gains (losses) on futures contracts.
During the year ended August 31, 2020, the fund’s average investments in long and short futures contracts represented less than 1% and 0% of net assets, respectively, based on the average of the notional amounts at each quarter-end during the period. The fund had no open futures contracts at August 31, 2020.
3. Swap Contracts: The fund has entered into equity swap contracts to earn the total return on selected reference stocks in the fund’s target index. Under the terms of the swaps, the fund receives the total return on the referenced stock (i.e., receiving the increase or paying the decrease in value of the selected reference stock and receiving the equivalent of any dividends in respect of the selected referenced stock) over a specified period of time, applied to a notional amount that represents the value of a designated number of shares of the selected reference stock at the beginning of the equity swap contract. The fund also pays a floating rate that is based on short-term interest rates, applied to the notional amount. At the same time, the fund generally invests an amount approximating the notional amount of the swap in high-quality temporary cash investments.
A risk associated with all types of swaps is the possibility that a counterparty may default on its obligation to pay net amounts due to the fund. The fund’s maximum amount subject to counterparty risk is the unrealized appreciation on the swap contract. The fund mitigates its counterparty risk by entering into swaps only with a diverse group of prequalified counterparties, monitoring their financial strength, entering into master netting arrangements with its counterparties, and requiring its counterparties to transfer collateral as security for their performance. In the absence of a default, the collateral pledged or received by the fund cannot be repledged, resold, or rehypothecated. In the event of a counterparty’s default (including bankruptcy), the fund may terminate any swap contracts with that counterparty, determine the net amount owed by either party in accordance with its master
Industrials Index Fund
netting arrangements, and sell or retain any collateral held up to the net amount owed to the fund under the master netting arrangements. The swap contracts contain provisions whereby a counterparty may terminate open contracts if the fund’s net assets decline below a certain level, triggering a payment by the fund if the fund is in a net liability position at the time of the termination. The payment amount would be reduced by any collateral the fund has pledged. Any securities pledged as collateral for open contracts are noted in the Schedule of Investments. The value of collateral received or pledged is compared daily to the value of the swap contracts exposure with each counterparty, and any difference, if in excess of a specified minimum transfer amount, is adjusted and settled within two business days.
The notional amounts of swap contracts are not recorded in the Statement of Assets and Liabilities. Swaps are valued daily based on market quotations received from independent pricing services or recognized dealers and the change in value is recorded in the Statement of Assets and Liabilities as an asset (liability) and in the Statement of Operations as unrealized appreciation (depreciation) until periodic payments are made or the termination of the swap, at which time realized gain (loss) is recorded.
During the year ended August 31, 2020, the fund’s average amounts of investments in total return swaps represented less than 1% of net assets, based on the average of notional amounts at each quarter-end during the period.
4. Federal Income Taxes: The fund intends to continue to qualify as a regulated investment company and distribute all of its taxable income. The fund’s tax returns are open to examination by the relevant tax authorities until expiration of the applicable statute of limitations, which is generally three years after the filing of the tax return. Management has analyzed the fund’s tax positions taken for all open federal and state income tax years, and has concluded that no provision for income tax is required in the fund’s financial statements.
5. Distributions: Distributions to shareholders are recorded on the ex-dividend date. Distributions are determined on a tax basis at the fiscal year-end and may differ from net investment income and realized capital gains for financial reporting purposes.
6. Securities Lending: To earn additional income, the fund lends its securities to qualified institutional borrowers. Security loans are subject to termination by the fund at any time, and are required to be secured at all times by collateral in an amount at least equal to the market value of securities loaned. Daily market fluctuations could cause the value of loaned securities to be more or less than the value of the collateral received. When this occurs, the collateral is adjusted and settled before the opening of the market on the next business day. The fund further mitigates its counterparty risk by entering into securities lending transactions only with a diverse group of prequalified counterparties, monitoring their financial strength, and entering into master securities lending agreements with its counterparties. The master securities lending agreements provide that, in the event of a counterparty’s default (including bankruptcy), the fund may terminate any loans with that borrower, determine the net amount owed, and sell or retain the collateral up to the net amount owed to the fund; however, such actions may be subject to legal proceedings. While collateral mitigates counterparty risk, in the event of a default, the fund may experience delays and costs in recovering the securities loaned. The fund invests cash collateral received in Vanguard Market Liquidity Fund, and records a liability in the Statement of Assets and Liabilities for the return of the collateral, during the period the securities are on loan. Collateral investments in Vanguard Market Liquidity Fund are subject to market appreciation or depreciation. Securities lending income represents fees charged to borrowers plus income earned on invested cash collateral, less expenses associated with the loan. During the term of the loan, the fund is entitled to all distributions made on or in respect of the loaned securities.
7. Credit Facilities and Interfund Lending Program: The fund and certain other funds managed by The Vanguard Group (“Vanguard”) participate in a $4.3 billion committed credit facility provided by a syndicate of lenders pursuant to a credit agreement and an uncommitted credit facility provided by Vanguard. Both facilities may be renewed annually. Each fund is individually liable for its borrowings, if any, under the credit facilities. Borrowings may be utilized for temporary or emergency purposes, subject to the fund’s regulatory and contractual borrowing restrictions. With respect to the committed credit facility, the participating funds are charged administrative fees and an annual commitment fee of 0.10% of the undrawn committed amount of the facility; these fees are allocated to the funds based on a method approved by the fund’s board of trustees and included in Management and Administrative expenses on the fund’s Statement of Operations. Any borrowings under either facility bear interest at a rate based upon the higher of the one-month London Interbank Offered Rate (or an acceptable alternate rate, if necessary), federal funds effective rate, or overnight bank funding rate plus an agreed-upon spread, except that borrowings under the uncommitted credit facility may bear interest based upon an alternative rate agreed to by the fund and Vanguard.
Industrials Index Fund
In accordance with an exemptive order (the “Order”) from the SEC, the fund may participate in a joint lending and borrowing program that allows registered open-end Vanguard funds to borrow money from and lend money to each other for temporary or emergency purposes (the “Interfund Lending Program”), subject to compliance with the terms and conditions of the Order, and to the extent permitted by the fund’s investment objective and investment policies. Interfund loans and borrowings normally extend overnight, but can have a maximum duration of seven days. Loans may be called on one business day’s notice. The interest rate to be charged is governed by the conditions of the Order and internal procedures adopted by the board of trustees. The board of trustees is responsible for overseeing the Interfund Lending Program.
For the year ended August 31, 2020, the fund did not utilize the credit facilities or the Interfund Lending Program.
8. Other: Dividend income is recorded on the ex-dividend date. Interest income includes income distributions received from Vanguard Market Liquidity Fund and is accrued daily. Security transactions are accounted for on the date securities are bought or sold. Costs used to determine realized gains (losses) on the sale of investment securities are those of the specific securities sold.
Each class of shares has equal rights as to assets and earnings, except that each class separately bears certain class-specific expenses related to maintenance of shareholder accounts (included in Management and Administrative expenses) and shareholder reporting. Marketing and distribution expenses are allocated to each class of shares based on a method approved by the board of trustees. Income, other non-class-specific expenses, and gains and losses on investments are allocated to each class of shares based on its relative net assets.
B. In accordance with the terms of a Funds’ Service Agreement (the “FSA”) between Vanguard and the fund, Vanguard furnishes to the fund investment advisory, corporate management, administrative, marketing, and distribution services at Vanguard’s cost of operations (as defined by the FSA). These costs of operations are allocated to the fund based on methods and guidelines approved by the board of trustees and are generally settled twice a month.
Upon the request of Vanguard, the fund may invest up to 0.40% of its net assets as capital in Vanguard. At August 31, 2020, the fund had contributed to Vanguard capital in the amount of $130,000, representing less than 0.01% of the fund’s net assets and 0.05% of Vanguard’s capital received pursuant to the FSA. The fund’s trustees and officers are also directors and employees, respectively, of Vanguard.
C. Various inputs may be used to determine the value of the fund’s investments and derivatives. These inputs are summarized in three broad levels for financial statement purposes. The inputs or methodologies used to value securities are not necessarily an indication of the risk associated with investing in those securities.
Level 1—Quoted prices in active markets for identical securities.
Level 2—Other significant observable inputs (including quoted prices for similar securities, interest rates, prepayment speeds, credit risk, etc.).
Level 3—Significant unobservable inputs (including the fund’s own assumptions used to determine the fair value of investments). Any investments and derivatives valued with significant unobservable inputs are noted on the Schedule of Investments.
The following table summarizes the market value of the fund’s investments and derivatives as of August 31, 2020, based on the inputs used to value them:
| | Level 1 | Level 2 | Level 3 | Total |
| | ($000) | ($000) | ($000) | ($000) |
| Investments | | | | |
| Assets | | | | |
| Common Stocks | 3,288,113 | — | — | 3,288,113 |
| Temporary Cash Investments | 16,659 | — | — | 16,659 |
| Total | 3,304,772 | — | — | 3,304,772 |
| Derivative Financial Instruments | | | | |
| Assets | | | | |
| Swap Contracts | — | 508 | — | 508 |
Industrials Index Fund
D. Permanent differences between book-basis and tax-basis components of net assets are reclassified among capital accounts in the financial statements to reflect their tax character. These reclassifications have no effect on net assets or net asset value per share. As of period end, permanent differences primarily attributable to the accounting for in-kind redemptions, passive foreign investment companies, and swap agreements were reclassified between the following accounts:
| | Amount |
| | ($000) |
| Paid-in Capital | 301,585 |
| Total Distributable Earnings (Loss) | (301,585) |
Temporary differences between book-basis and tax-basis components of total distributable earnings (loss) arise when certain items of income, gain, or loss are recognized in different periods for financial statement and tax purposes; these differences will reverse at some time in the future. The differences are primarily related to the deferral of losses from wash sales and the recognition of unrealized gains or losses from certain derivative contracts. As of period end, the tax-basis components of total distributable earnings (loss) are detailed in the table as follows:
| | Amount |
| | ($000) |
| Undistributed Ordinary Income | 12,771 |
| Undistributed Long-Term Gains | — |
| Capital Loss Carryforwards | (74,815) |
| Qualified Late-Year Losses | — |
| Net Unrealized Gains (Losses) | 117,439 |
The tax character of distributions paid was as follows:
| | Year Ended August 31, |
| | 2020 | 2019 |
| | Amount | Amount |
| | ($000) | ($000) |
| Ordinary Income * | 61,969 | 66,521 |
| Long-Term Capital Gains | — | — |
| Total | 61,969 | 66,521 |
* Includes short-term capital gains, if any.
As of August 31, 2020, gross unrealized appreciation and depreciation for investments and derivatives based on cost for U.S. federal income tax purposes were as follows:
| | Amount |
| | ($000) |
| Tax Cost | 3,187,333 |
| Gross Unrealized Appreciation | 630,953 |
| Gross Unrealized Depreciation | (513,514) |
| Net Unrealized Appreciation (Depreciation) | 117,439 |
E. During the year ended August 31, 2020, the fund purchased $785,519,000 of investment securities and sold $1,252,467,000 of investment securities, other than temporary cash investments. Purchases and sales include $601,165,000 and $1,108,880,000, respectively, in connection with in-kind purchases and redemptions of the fund’s capital shares.
Industrials Index Fund
F. Capital share transactions for each class of shares were:
| | | | | Year Ended August 31, |
| | | 2020 | | | 2019 |
| | Amount | Shares | | Amount | Shares |
| | ($000) | (000) | | ($000) | (000) |
| ETF Shares | | | | | |
| Issued | 651,928 | 5,081 | | 613,810 | 4,352 |
| Issued in Lieu of Cash Distributions | — | — | | — | — |
| Redeemed | (1,109,156) | (8,300) | | (930,988) | (7,175) |
| Net Increase (Decrease)—ETF Shares | (457,228) | (3,219) | | (317,178) | (2,823) |
| Admiral Shares | | | | | |
| Issued | 99,484 | 1,405 | | 68,108 | 955 |
| Issued in Lieu of Cash Distributions | 3,135 | 44 | | 2,995 | 42 |
| Redeemed | (100,525) | (1,432) | | (75,756) | (1,078) |
| Net Increase (Decrease)—Admiral Shares | 2,094 | 17 | | (4,653) | (81) |
At August 31, 2020, one shareholder was the record or beneficial owner of 41% of the fund’s net assets. If this shareholder were to redeem its investment in the fund, the redemption might result in an increase in the fund’s expense ratio, cause the fund to incur higher transaction costs, or lead to the realization of taxable capital gains.
G. Management has determined that no events or transactions occurred subsequent to August 31, 2020, that would require recognition or disclosure in these financial statements.
Information Technology Index Fund
Performance Summary
All of the returns in this report represent past performance, which is not a guarantee of future results that may be achieved by the fund. (Current performance may be lower or higher than the performance data cited. For performance data current to the most recent month-end, visit our website at vanguard.com/performance.) Note, too, that both investment returns and principal value can fluctuate widely, so an investor’s shares, when sold, could be worth more or less than their original cost. The returns shown do not reflect taxes that a shareholder would pay on fund distributions or on the sale of fund shares.
Cumulative Performance: August 31, 2010–August 31, 2020
Initial Investment of $10,000
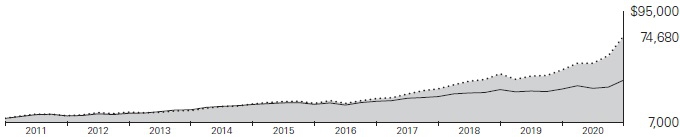
| | | | Average Annual Total Returns | Final Value |
| | | | Periods Ended August 31, 2020 | of a $10,000 |
| | | One Year | Five Years | Ten Years | Investment |
 | Information Technology Index Fund ETF Shares Net Asset Value | 55.72% | 28.01% | 22.27% | $74,680 |
| | Information Technology Index Fund ETF Shares Market Price | 55.96 | 28.03 | 22.29 | 74,800 |
 | Information Technology Spliced Index | 55.98 | 28.15 | 22.42 | 75,617 |
 | MSCI US IMI/2500 | 21.48 | 13.88 | 14.99 | 40,426 |
Information Technology Spliced Index: MSCI US IMI/Information Technology through February 28, 2010; MSCI US IMI/Information Technology 25/50 through May 2, 2018; MSCI US IMI/ Information Technology 25/50 Transition Index through December 2, 2018; MSCI US IMI/ Information Technology 25/50 thereafter.
| | | | | Final Value |
| | | | | of a $100,000 |
| | One Year | Five Years | Ten Years | Investment |
| Information Technology Index Fund Admiral Shares | 55.78% | 28.02% | 22.28% | $747,384 |
| Information Technology Spliced Index | 55.98 | 28.15 | 22.42 | 756,168 |
| MSCI US IMI/2500 | 21.48 | 13.88 | 14.99 | 404,265 |
Cumulative Returns: ETF Shares, August 31, 2010–August 31, 2020
| | One Year | Five Years | Ten Years |
| Information Technology Index Fund ETF Shares Market Price | 55.96% | 243.94% | 648.00% |
| Information Technology Index Fund ETF Shares Net Asset Value | 55.72 | 243.71 | 646.80 |
| Information Technology Spliced Index | 55.98 | 245.61 | 656.17 |
For the ETF Shares, the market price is determined by the midpoint of the bid-offer spread as of the closing time of the New York Stock Exchange (generally 4 p.m., Eastern time). The net asset value is also determined as of the NYSE closing time. For more information about how the ETF Shares’ market prices have compared with their net asset value, visit vanguard.com, select your ETF, and then select the Price and Performance tab. The ETF premium/discount analysis there shows the percentages of days on which the ETF Shares’ market price was above or below the NAV.
See Financial Highlights for dividend and capital gains information.
Information Technology Index Fund
Fund Allocation
As of August 31, 2020
| Application Software | 13.6% |
| Communications Equipment | 2.8 |
| Data Processing & Outsourced Services | 13.9 |
| Electronic Components | 0.8 |
| Electronic Equipment & Instruments | 0.9 |
| Electronic Manufacturing Services | 0.6 |
| Internet Software & Services | 1.4 |
| IT Consulting & Other Services | 4.0 |
| Semiconductor Equipment | 2.2 |
| Semiconductors | 14.6 |
| Systems Software | 20.5 |
| Technology Distributors | 0.4 |
| Technology Hardware, Storage & Peripherals | 24.3 |
The table reflects the fund’s investments, except for short-term investments and derivatives. Sector categories are based on the Global Industry Classification Standard (“GICS”), except for the “Other” category (if applicable), which includes securities that have not been provided a GICS classification as of the effective reporting period.
The fund may invest in derivatives (such as futures and swap contracts) for various reasons, including, but not limited to, attempting to remain fully invested and tracking its target index as closely as possible.
The Global Industry Classification Standard (“GICS”) was developed by and is the exclusive property and a service mark of MSCI Inc. (“MSCI”) and Standard and Poor’s, a division of McGraw-Hill Companies, Inc. (“S&P”), and is licensed for use by Vanguard. Neither MSCI, S&P nor any third party involved in making or compiling the GICS or any GICS classification makes any express or implied warranties or representations with respect to such standard or classification (or the results to be obtained by the use thereof), and all such parties hereby expressly disclaim all warranties of originality, accuracy, completeness, merchantability or fitness for a particular purpose with respect to any such standard or classification. Without limiting any of the foregoing, in no event shall MSCI, S&P, any of its affiliates or any third party involved in making or compiling the GICS or any GICS classification have any liability for any direct, indirect, special, punitive, consequential or any other damages (including lost profits) even if notified of the possibility of such damages.
Information Technology Index Fund
Financial Statements
Schedule of Investments
As of August 31, 2020
The fund files its complete schedule of portfolio holdings with the Securities and Exchange Commission (SEC) for the first and third quarters of each fiscal year as an exhibit to its reports on Form N-PORT. The fund’s Form N-PORT reports are available on the SEC’s website at www.sec.gov.
| | | | Market |
| | | | Value· |
| | | Shares | ($000) |
| Common Stocks (99.6%) | | |
| Communications Equipment (2.8%) | |
| | Cisco Systems Inc. | 19,208,703 | 810,992 |
| | Motorola Solutions Inc. | 773,009 | 119,623 |
| * | Arista Networks Inc. | 258,134 | 57,680 |
| * | Ciena Corp. | 698,982 | 39,681 |
| | Juniper Networks Inc. | 1,506,435 | 37,661 |
| * | F5 Networks Inc. | 276,711 | 36,617 |
| * | Lumentum Holdings Inc. | 341,709 | 29,387 |
| * | Viavi Solutions Inc. | 1,039,628 | 13,863 |
| * | Acacia Communications Inc. | 168,779 | 11,389 |
| * | CommScope Holding Co. Inc. | 877,716 | 9,041 |
| | InterDigital Inc. | 138,372 | 8,462 |
| * | ViaSat Inc. | 209,832 | 8,343 |
| * | NetScout Systems Inc. | 332,977 | 7,705 |
| * | EchoStar Corp. Class A | 214,576 | 6,304 |
| * | Infinera Corp. | 791,225 | 5,768 |
| * | Calix Inc. | 230,093 | 4,475 |
| * | NETGEAR Inc. | 132,746 | 4,427 |
| *,^ | Inseego Corp. | 279,021 | 3,203 |
| * | Harmonic Inc. | 415,041 | 2,449 |
| | ADTRAN Inc. | 216,630 | 2,402 |
| * | Extreme Networks Inc. | 535,722 | 2,341 |
| | Plantronics Inc. | 152,959 | 1,891 |
| | Comtech Telecommunications Corp. | 99,190 | 1,647 |
| * | Ribbon Communications Inc. | 380,805 | 1,630 |
| * | CalAmp Corp. | 154,456 | 1,262 |
| *,^ | Applied Optoelectronics Inc. | 86,588 | 1,007 |
| * | Casa Systems Inc. | 133,691 | 608 |
| | | | 1,229,858 |
| Electronic Equipment, Instruments & Components (2.6%) | |
| | Amphenol Corp. Class A | 1,345,445 | 147,730 |
| | TE Connectivity Ltd. | 1,500,040 | 144,904 |
| | Corning Inc. | 3,459,511 | 112,296 |
| * | Keysight Technologies Inc. | 847,809 | 83,526 |
| | CDW Corp. | 647,297 | 73,565 |
| * | Zebra Technologies Corp. | 241,452 | 69,183 |
| * | Trimble Inc. | 1,131,759 | 59,316 |
| | Cognex Corp. | 777,705 | 53,809 |
| * | Arrow Electronics Inc. | 357,677 | 28,099 |
| * | IPG Photonics Corp. | 169,634 | 27,435 |
| | SYNNEX Corp. | 200,108 | 25,444 |
| * | Flex Ltd. | 2,264,274 | 24,590 |
| | FLIR Systems Inc. | 595,355 | 21,969 |
| | Jabil Inc. | 616,540 | 21,055 |
| | National Instruments Corp. | 569,583 | 20,442 |
| | Dolby Laboratories Inc. Class A | 291,406 | 20,355 |
| * | II-VI Inc. | 454,714 | 20,235 |
| | Littelfuse Inc. | 110,027 | 19,897 |
| * | Novanta Inc. | 158,942 | 17,034 |
| | Avnet Inc. | 451,104 | 12,410 |
| * | Coherent Inc. | 108,879 | 12,266 |
| * | Fabrinet | 166,787 | 11,638 |
| | Vishay Intertechnology Inc. | 669,996 | 10,713 |
| * | Itron Inc. | 171,014 | 10,187 |
| * | Plexus Corp. | 132,922 | 10,111 |
| * | Rogers Corp. | 83,854 | 9,502 |
| * | Insight Enterprises Inc. | 158,692 | 9,491 |
| * | Sanmina Corp. | 318,185 | 9,005 |
| | Badger Meter Inc. | 131,849 | 8,134 |
| | Belden Inc. | 204,866 | 6,900 |
| * | Fitbit Inc. Class A | 1,010,873 | 6,429 |
| * | Knowles Corp. | 412,111 | 6,206 |
| * | OSI Systems Inc. | 78,021 | 6,144 |
| * | TTM Technologies Inc. | 452,536 | 5,186 |
| | Methode Electronics Inc. | 166,315 | 4,708 |
| * | ePlus Inc. | 61,007 | 4,680 |
| * | FARO Technologies Inc. | 79,412 | 4,487 |
| * | nLight Inc. | 153,273 | 3,580 |
| | Benchmark Electronics Inc. | 166,392 | 3,263 |
| * | ScanSource Inc. | 114,378 | 2,824 |
| | CTS Corp. | 131,822 | 2,755 |
| | PC Connection Inc. | 57,177 | 2,532 |
| | MTS Systems Corp. | 86,425 | 2,109 |
| * | Arlo Technologies Inc. | 327,741 | 1,878 |
| * | Kimball Electronics Inc. | 112,693 | 1,520 |
| * | Vishay Precision Group Inc. | 48,283 | 1,203 |
| | Daktronics Inc. | 173,658 | 768 |
| | | | 1,161,513 |
| IT Services (19.2%) | | |
| | Visa Inc. Class A | 7,173,392 | 1,520,687 |
| | Mastercard Inc. Class A | 4,065,408 | 1,456,188 |
| * | PayPal Holdings Inc. | 5,074,355 | 1,035,879 |
| | Accenture plc Class A | 2,897,151 | 695,113 |
| | International Business Machines Corp. | 4,042,104 | 498,432 |
| | Fidelity National Information Services Inc. | 2,812,773 | 424,307 |
| | Automatic Data Processing Inc. | 1,958,215 | 272,368 |
| * | Square Inc. | 1,653,152 | 263,777 |
| * | Fiserv Inc. | 2,586,353 | 257,549 |
| | Global Payments Inc. | 1,359,434 | 240,103 |
| | Cognizant Technology Solutions Corp. Class A | 2,457,192 | 164,288 |
| * | Twilio Inc. Class A | 555,742 | 149,917 |
| * | Okta Inc. | 527,845 | 113,682 |
| | Paychex Inc. | 1,466,978 | 112,180 |
| * | VeriSign Inc. | 472,636 | 101,522 |
| * | FleetCor Technologies Inc. | 381,003 | 95,803 |
| * | Akamai Technologies Inc. | 737,195 | 85,832 |
| * | EPAM Systems Inc. | 253,008 | 82,759 |
| | Broadridge Financial Solutions Inc. | 521,125 | 71,603 |
| * | GoDaddy Inc. Class A | 755,921 | 63,255 |
| * | Black Knight Inc. | 685,439 | 57,645 |
| | Jack Henry & Associates Inc. | 347,512 | 57,485 |
| | Leidos Holdings Inc. | 614,304 | 55,588 |
| | Booz Allen Hamilton Holding Corp. Class A | 626,875 | 55,203 |
| * | Gartner Inc. | 404,919 | 52,567 |
| * | MongoDB Inc. | 218,360 | 51,053 |
| | Western Union Co. | 1,861,872 | 43,922 |
| * | WEX Inc. | 198,093 | 31,637 |
| * | Fastly Inc. Class A | 323,434 | 30,028 |
| * | CACI International Inc. Class A | 114,111 | 26,724 |
| * | Euronet Worldwide Inc. | 239,271 | 24,736 |
| | DXC Technology Co. | 1,143,594 | 22,849 |
| | MAXIMUS Inc. | 278,801 | 21,621 |
| | Science Applications International Corp. | 239,187 | 19,963 |
| * | LiveRamp Holdings Inc. | 295,538 | 16,503 |
| | KBR Inc. | 639,364 | 15,978 |
| | Perspecta Inc. | 654,897 | 13,602 |
| * | ExlService Holdings Inc. | 160,076 | 10,195 |
| | Sabre Corp. | 1,419,624 | 9,923 |
| | EVERTEC Inc. | 276,021 | 9,666 |
| | Alliance Data Systems Corp. | 203,831 | 9,195 |
| | ManTech International Corp. Class A | 121,639 | 9,105 |
| | NIC Inc. | 300,686 | 6,429 |
| * | Perficient Inc. | 148,145 | 6,357 |
| | CSG Systems International Inc. | 148,332 | 6,315 |
| * | Verra Mobility Corp. Class A | 574,413 | 6,069 |
| * | Sykes Enterprises Inc. | 177,758 | 5,885 |
| * | Evo Payments Inc. Class A | 186,056 | 5,345 |
| | Switch Inc. | 306,232 | 5,267 |
| * | Virtusa Corp. | 127,893 | 5,057 |
| * | Repay Holdings Corp. Class A | 199,285 | 5,042 |
| | TTEC Holdings Inc. | 83,286 | 4,721 |
| * | Cardtronics plc Class A | 170,772 | 3,707 |
| * | Unisys Corp. | 276,009 | 3,218 |
| * | Limelight Networks Inc. | 548,370 | 3,109 |
| * | Conduent Inc. | 764,591 | 2,584 |
| * | Tucows Inc. Class A | 40,862 | 2,583 |
| * | Endurance International Group Holdings Inc. | 364,176 | 2,371 |
| | Cass Information Systems Inc. | 55,824 | 2,186 |
| * | International Money Express Inc. | 103,318 | 1,748 |
| | Hackett Group Inc. | 114,822 | 1,448 |
| * | GreenSky Inc. Class A | 210,801 | 917 |
| * | Paysign Inc. | 129,949 | 837 |
| *,^ | GTT Communications Inc. | 114,137 | 568 |
| | | | 8,432,195 |
| Information Technology Index Fund | | | |
| | | | |
| | | | |
| | | | Market | |
| | | | Value· | |
| | | Shares | ($000 | ) |
| | | |
| Semiconductors & Semiconductor | | |
| Equipment (16.7%) | | | |
| | NVIDIA Corp. | 2,797,611 | 1,496,666 | |
| | Intel Corp. | 19,259,207 | 981,257 | |
| | Broadcom Inc. | 1,819,560 | 631,660 | |
| | QUALCOMM Inc. | 5,118,751 | 609,643 | |
| | Texas Instruments Inc. | 4,174,575 | 593,416 | |
| * | Advanced Micro Devices Inc. | 5,329,750 | 484,048 | |
| | Applied Materials Inc. | 4,179,827 | 257,477 | |
| * | Micron Technology Inc. | 5,054,024 | 230,009 | |
| | Lam Research Corp. | 659,708 | 221,886 | |
| | Analog Devices Inc. | 1,674,168 | 195,677 | |
| | NXP Semiconductors NV | 1,268,262 | 159,497 | |
| | KLA Corp. | 704,650 | 144,552 | |
| | Microchip Technology Inc. | 1,115,016 | 122,317 | |
| | Marvell Technology Group Ltd. | 3,023,283 | 117,243 | |
| | Xilinx Inc. | 1,105,068 | 115,104 | |
| | Skyworks Solutions Inc. | 758,264 | 109,835 | |
| | Maxim Integrated Products Inc. | 1,211,648 | 82,925 | |
| * | Qorvo Inc. | 521,364 | 66,875 | |
| | Teradyne Inc. | 753,619 | 64,035 | |
| | Monolithic Power Systems Inc. | 192,885 | 51,525 | |
| * | SolarEdge Technologies Inc. | 225,578 | 49,887 | |
| | Entegris Inc. | 611,909 | 40,931 | |
| * | ON Semiconductor Corp. | 1,872,763 | 40,021 | |
| | Universal Display Corp. | 193,944 | 34,037 | |
| * | Enphase Energy Inc. | 428,075 | 33,060 | |
| * | Cree Inc. | 493,321 | 31,129 | |
| | MKS Instruments Inc. | 248,809 | 29,740 | |
| * | First Solar Inc. | 362,412 | 27,757 | |
| * | Inphi Corp. | 219,209 | 24,985 | |
| * | Silicon Laboratories Inc. | 199,561 | 20,437 | |
| | Cabot Microelectronics Corp. | 132,268 | 20,143 | |
| * | Lattice Semiconductor Corp. | 619,915 | 17,730 | |
| * | Semtech Corp. | 296,533 | 17,392 | |
| | Brooks Automation Inc. | 331,763 | 17,129 | |
| * | Cirrus Logic Inc. | 262,625 | 15,912 | |
| | Power Integrations Inc. | 267,942 | 14,997 | |
| * | Synaptics Inc. | 152,902 | 13,047 | |
| * | Advanced Energy Industries Inc. | 172,773 | 12,806 | |
| * | Diodes Inc. | 195,704 | 9,562 | |
| * | FormFactor Inc. | 341,696 | 8,929 | |
| * | Ambarella Inc. | 160,037 | 8,434 | |
| * | MaxLinear Inc. | 308,290 | 7,507 | |
| * | MACOM Technology Solutions Holdings Inc. | 208,980 | 7,446 | |
| * | Onto Innovation Inc. | 226,207 | 7,067 | |
| | Kulicke & Soffa Industries Inc. | 293,284 | 7,033 | |
| * | Rambus Inc. | 515,941 | 6,929 | |
| * | Amkor Technology Inc. | 489,290 | 5,967 | |
| *,^ | SunPower Corp. | 417,367 | 4,670 | |
| * | ACM Research Inc. Class A | 51,382 | 4,563 | |
| * | Ultra Clean Holdings Inc. | 179,645 | 4,405 | |
| * | CEVA Inc. | 97,582 | 4,123 | |
| * | Axcelis Technologies Inc. | 146,389 | 3,459 | |
| | Cohu Inc. | 186,325 | 3,205 | |
| * | Photronics Inc. | 298,826 | 2,997 | |
| * | PDF Solutions Inc. | 129,032 | 2,671 | |
| * | Veeco Instruments Inc. | 221,317 | 2,631 | |
| * | Ichor Holdings Ltd. | 102,264 | 2,573 | |
| * | Impinj Inc. | 74,981 | 1,833 | |
| * | SMART Global Holdings Inc. | 62,974 | 1,587 | |
| * | NeoPhotonics Corp. | 219,666 | 1,463 | |
| | NVE Corp. | 23,027 | 1,230 | |
| * | Alpha & Omega Semiconductor Ltd. | 89,923 | 1,218 | |
| *,^ | Maxeon Solar Technologies Ltd. | 9 | — | |
| | | | 7,308,289 | |
| Software (34.1%) | | | |
| | Microsoft Corp. | 32,764,996 | 7,389,490 | |
| * | Adobe Inc. | 2,191,602 | 1,125,147 | |
| * | salesforce.com Inc. | 4,091,573 | 1,115,567 | |
| | Oracle Corp. | 9,324,472 | 533,546 | |
| * | ServiceNow Inc. | 868,040 | 418,413 | |
| | Intuit Inc. | 1,187,130 | 410,023 | |
| * | Autodesk Inc. | 997,957 | 245,198 | |
| * | Zoom Video Communications Inc. Class A | 665,617 | 216,392 | |
| * | Workday Inc. Class A | 790,521 | 189,496 | |
| * | DocuSign Inc. Class A | 790,504 | 176,282 | |
| * | Splunk Inc. | 721,770 | 158,306 | |
| * | Synopsys Inc. | 684,966 | 151,583 | |
| * | Cadence Design Systems Inc. | 1,268,168 | 140,653 | |
| * | ANSYS Inc. | 388,873 | 131,832 | |
| * | Palo Alto Networks Inc. | 438,298 | 112,822 | |
| * | Coupa Software Inc. | 302,601 | 99,174 | |
| * | RingCentral Inc. Class A | 332,449 | 96,666 | |
| * | Trade Desk Inc. Class A | 185,834 | 89,442 | |
| * | Fortinet Inc. | 624,412 | 82,426 | |
| * | Crowdstrike Holdings Inc. Class A | 647,644 | 81,428 | |
| | Citrix Systems Inc. | 532,754 | 77,356 | |
| * | Paycom Software Inc. | 226,246 | 67,752 | |
| | SS&C Technologies Holdings Inc. | 1,049,247 | 66,858 | |
| * | Tyler Technologies Inc. | 180,512 | 62,333 | |
| | NortonLifeLock Inc. | 2,542,451 | 59,798 | |
| * | Slack Technologies Inc. Class A | 1,739,071 | 57,111 | |
| * | HubSpot Inc. | 188,997 | 56,639 | |
| * | Fair Isaac Corp. | 131,438 | 55,308 | |
| *,^ | VMware Inc. Class A | 381,237 | 55,066 | |
| * | Datadog Inc. Class A | 599,596 | 50,096 | |
| * | Zendesk Inc. | 519,091 | 50,030 | |
| * | Avalara Inc. | 360,634 | 47,752 | |
| * | Zscaler Inc. | 326,214 | 46,760 | |
| * | PTC Inc. | 499,257 | 45,637 | |
| * | Guidewire Software Inc. | 377,446 | 42,391 | |
| * | Ceridian HCM Holding Inc. | 526,411 | 41,860 | |
| * | Aspen Technology Inc. | 306,725 | 38,963 | |
| * | Nuance Communications Inc. | 1,277,732 | 38,281 | |
| * | Dynatrace Inc. | 829,553 | 36,691 | |
| * | Five9 Inc. | 281,511 | 35,876 | |
| * | Anaplan Inc. | 498,764 | 30,549 | |
| * | Alteryx Inc. Class A | 239,367 | 28,923 | |
| * | Proofpoint Inc. | 261,524 | 28,681 | |
| * | Manhattan Associates Inc. | 287,303 | 27,940 | |
| * | Smartsheet Inc. Class A | 486,602 | 26,534 | |
| * | Elastic NV | 241,413 | 26,213 | |
| * | RealPage Inc. | 416,750 | 26,097 | |
| | CDK Global Inc. | 552,229 | 25,745 | |
| * | Dropbox Inc. Class A | 1,128,677 | 23,894 | |
| * | Paylocity Holding Corp. | 159,700 | 23,516 | |
| | Pegasystems Inc. | 182,745 | 23,477 | |
| * | Nutanix Inc. | 817,636 | 23,474 | |
| * | Everbridge Inc. | 156,914 | 23,319 | |
| * | Bill.com Holdings Inc. | 228,622 | 22,629 | |
| * | Q2 Holdings Inc. | 217,646 | 21,175 | |
| * | Envestnet Inc. | 243,182 | 20,182 | |
| * | Cloudflare Inc. Class A | 524,215 | 20,056 | |
| * | Blackline Inc. | 218,011 | 19,048 | |
| | LogMeIn Inc. | 218,729 | 18,822 | |
| * | Varonis Systems Inc. | 143,175 | 17,686 | |
| * | LivePerson Inc. | 283,289 | 16,901 | |
| * | Sailpoint Technologies Holdings Inc. | 415,439 | 16,298 | |
| * | Qualys Inc. | 150,403 | 15,964 | |
| * | ACI Worldwide Inc. | 534,966 | 15,717 | |
| * | FireEye Inc. | 1,003,658 | 14,734 | |
| * | J2 Global Inc. | 208,378 | 14,584 | |
| | Blackbaud Inc. | 227,966 | 14,556 | |
| * | New Relic Inc. | 233,671 | 14,354 | |
| * | Rapid7 Inc. | 221,750 | 14,318 | |
| * | Verint Systems Inc. | 291,606 | 13,869 | |
| * | Box Inc. | 698,225 | 13,706 | |
| * | Mimecast Ltd. | 276,456 | 13,613 | |
| * | 2U Inc. | 323,538 | 13,391 | |
| * | SPS Commerce Inc. | 158,655 | 12,673 | |
| * | SVMK Inc. | 502,541 | 12,508 | |
| * | Cloudera Inc. | 940,584 | 12,425 | |
| * | Medallia Inc. | 342,077 | 12,380 | |
| * | Teradata Corp. | 488,656 | 11,899 | |
| * | Alarm.com Holdings Inc. | 197,382 | 11,817 | |
| * | Appfolio Inc. | 68,988 | 11,592 | |
| * | Tenable Holdings Inc. | 256,239 | 9,645 | |
| * | Bottomline Technologies DE Inc. | 198,182 | 9,439 | |
| * | Cornerstone OnDemand Inc. | 266,323 | 9,393 | |
| * | Workiva Inc. Class A | 155,200 | 9,157 | |
| * | Pluralsight Inc. Class A | 468,723 | 8,971 | |
| * | Cerence Inc. | 163,974 | 8,723 | |
| * | CommVault Systems Inc. | 199,241 | 8,613 | |
| * | Digital Turbine Inc. | 352,339 | 8,523 | |
| * | Altair Engineering Inc. Class A | 183,368 | 7,705 | |
| | Progress Software Corp. | 203,166 | 7,698 | |
| *,^ | Appian Corp. Class A | 125,539 | 7,688 | |
| * | Yext Inc. | 385,913 | 7,664 | |
| * | 8x8 Inc. | 438,512 | 7,402 | |
| * | PROS Holdings Inc. | 188,017 | 7,333 | |
| * | Zuora Inc. Class A | 468,941 | 6,373 | |
| | Xperi Holding Corp. | 489,136 | 6,129 | |
| * | Avaya Holdings Corp. | 377,590 | 5,860 | |
| * | Ping Identity Holding Corp. | 162,923 | 5,616 | |
| * | MicroStrategy Inc. Class A | 36,098 | 5,214 | |
| * | Model N Inc. | 122,818 | 4,829 | |
| * | Upland Software Inc. | 112,078 | 4,396 | |
| * | Domo Inc. | 94,362 | 3,842 | |
| * | PagerDuty Inc. | 104,422 | 3,411 | |
| * | Sprout Social Inc. Class A | 87,474 | 3,390 | |
| * | OneSpan Inc. | 145,213 | 3,129 | |
| * | Rosetta Stone Inc. | 99,561 | 3,025 | |
| | Ebix Inc. | 109,869 | 2,535 | |
| * | MobileIron Inc. | 382,176 | 2,496 | |
| | QAD Inc. Class A | 53,355 | 2,427 | |
| * | Agilysys Inc. | 90,644 | 2,300 | |
Information Technology Index Fund
| | | | Market | |
| | | | Value· | |
| | | Shares | ($000 | ) |
| | American Software Inc. Class A | 144,715 | 2,049 | |
| * | A10 Networks Inc. | 227,611 | 1,946 | |
| * | Benefitfocus Inc. | 133,208 | 1,377 | |
| *,^ | Intelligent Systems Corp. | 30,251 | 1,137 | |
| *,^ | ShotSpotter Inc. | 33,905 | 1,016 | |
| | | | 14,942,154 | |
| Technology Hardware, Storage & Peripherals (24.2%) | | |
| | Apple Inc. | 78,853,131 | 10,175,208 | |
| | HP Inc. | 6,498,987 | 127,055 | |
| * | Dell Technologies Inc. | 1,097,536 | 72,525 | |
| | Hewlett Packard Enterprise Co. | 5,838,015 | 56,454 | |
| | Western Digital Corp. | 1,357,521 | 52,156 | |
| | Seagate Technology plc | 1,050,575 | 50,417 | |
| | NetApp Inc. | 1,005,426 | 47,647 | |
| * | Pure Storage Inc. Class A | 1,089,967 | 16,633 | |
| | Xerox Holdings Corp. | 814,528 | 15,362 | |
| * | NCR Corp. | 575,234 | 11,758 | |
| *,^ | 3D Systems Corp. | 534,449 | 2,934 | |
| * | Diebold Nixdorf Inc. | 312,676 | 2,608 | |
| | | | 10,630,757 | |
Total Common Stocks
(Cost $25,148,053) | | 43,704,766 | |
| Temporary Cash Investments (0.4%) | | |
| 1,2 | Vanguard Market Liquidity Fund, 0.147% | 1,726,276 | 172,628 | |
| | | Face | | Market | |
| | | Amount | | Value· | |
| | | ($000 | ) | ($000 | ) |
| U.S. Government and Agency Obligations (0.0%) | |
| 3 | United States Cash Management Bill, 0.165%, 11/3/20 | 2,040 | | 2,039 | |
| | United States Cash Management Bill, 0.210%, 9/15/20 | 26 | | 26 | |
| 3 | United States Cash Management Bill, 0.116%, 9/29/20 | 1,020 | | 1,020 | |
| 3 | United States Treasury Bill, 0.087%, 9/24/20 | 1,000 | | 1,000 | |
| | | | | 4,085 | |
Total Temporary Cash Investments
(Cost $176,667) | | 176,713 | |
Total Investments (100.0%)
(Cost $25,324,720) | | | 43,881,479 | |
| Other Assets and Liabilities—Net (0.0%) | | | (21,321 | ) |
| Net Assets (100%) | | | 43,860,158 | |
Cost is in $000.
| · | See Note A in Notes to Financial Statements. |
| * | Non-income-producing security. |
| ^ | Includes partial security positions on loan to broker-dealers. The total value of securities on loan is $37,987,000. |
| 1 | Affiliated money market fund available only to Vanguard funds and certain trusts and accounts managed by Vanguard. Rate shown is the 7-day yield. |
| 2 | Collateral of $39,414,000 was received for securities on loan. |
| 3 | Securities with a value of $3,756,000 have been segregated as initial margin for open futures contracts. |
| Derivative Financial Instruments Outstanding as of Period End | | | | |
| | | | | |
| Futures Contracts | | | | | | |
| | | | | | ($000 | ) |
| | | | | | Value and | |
| | | Number of | | | Unrealized | |
| | | Long (Short | ) | Notional | Appreciation | |
| | Expiration | Contracts | | Amount | (Depreciation | ) |
| Long Futures Contracts | | | | | | |
| E-mini NASDAQ 100 Index | September 2020 | 232 | | 56,209 | 3,280 | |
| Over-the-Counter Total Return Swaps | | | | | | | | |
| | | | | | Floating | | | | | |
| | | | | | Interest Rate | | Value and | | Value and | |
| | | | Notional | | Received | | Unrealized | | Unrealized | |
| | Termination | | Amount | | (Paid | )1 | Appreciation | | (Depreciation | ) |
| Reference Entity | Date | Counterparty | ($000 | ) | (% | ) | ($000 | ) | ($000 | ) |
| Visa Inc. Class A | 9/2/20 | BOANA | 95,200 | | (0.055 | ) | 10,941 | | — | |
| Visa Inc. Class A | 9/2/21 | BOANA | 105,995 | | (0.057 | ) | — | | — | |
| | | | | | | | 10,941 | | — | |
| 1 | Based on 1-month USD London Interbank Offered Rate (LIBOR) as of the most recent payment date. Floating interest payment received/ paid monthly. |
BOANA—Bank of America, N.A.
At August 31, 2020, a counterparty had deposited in a segregated account securities with a value of $12,860,000 in connection with open over-the-counter swap contracts.
Information Technology Index Fund
Statement of Assets and Liabilities
As of August 31, 2020
| ($000s, except shares and per-share amounts) | Amount |
| Assets | |
| Investments in Securities, at Value | �� |
| Unaffiliated Issuers (Cost $25,152,138) | 43,708,851 |
| Affiliated Issuers (Cost $172,582) | 172,628 |
| Total Investments in Securities | 43,881,479 |
| Investment in Vanguard | 1,658 |
| Receivables for Investment Securities Sold | 238,406 |
| Receivables for Accrued Income | 39,242 |
| Receivables for Capital Shares Issued | 20,433 |
| Variation Margin Receivable—Futures Contracts | 567 |
| Unrealized Appreciation—Over-the-Counter Swap Contracts | 10,941 |
| Total Assets | 44,192,726 |
| Liabilities | |
| Due to Custodian | 70 |
| Payables for Investment Securities Purchased | 283,991 |
| Collateral for Securities on Loan | 39,414 |
| Payables for Capital Shares Redeemed | 7,042 |
| Payables to Vanguard | 2,051 |
| Total Liabilities | 332,568 |
| Net Assets | 43,860,158 |
| At August 31, 2020, net assets consisted of: | |
| Paid-in Capital | 25,489,483 |
| Total Distributable Earnings (Loss) | 18,370,675 |
| Net Assets | 43,860,158 |
| | |
| ETF Shares—Net Assets | |
| Applicable to 117,827,985 outstanding $.001 par value shares of beneficial interest (unlimited authorization) | 38,710,667 |
| Net Asset Value Per Share—ETF Shares | $328.54 |
| | |
| Admiral Shares—Net Assets | |
| Applicable to 30,610,500 outstanding $.001 par value shares of beneficial interest (unlimited authorization) | 5,149,491 |
| Net Asset Value Per Share—Admiral Shares | $168.23 |
See accompanying Notes, which are an integral part of the Financial Statements.
Information Technology Index Fund
Statement of Operations
| | Year Ended |
| | August 31, 2020 |
| | ($000) |
| Investment Income | |
| Income | |
| Dividends | 381,727 |
| Interest1 | 1,250 |
| Securities Lending—Net | 702 |
| Total Income | 383,679 |
| Expenses | |
| The Vanguard Group—Note B | |
| Investment Advisory Services | 2,574 |
| Management and Administrative—ETF Shares | 22,130 |
| Management and Administrative—Admiral Shares | 2,758 |
| Marketing and Distribution—ETF Shares | 1,246 |
| Marketing and Distribution—Admiral Shares | 233 |
| Custodian Fees | 138 |
| Auditing Fees | 32 |
| Shareholders’ Reports—ETF Shares | 1,030 |
| Shareholders’ Reports—Admiral Shares | 27 |
| Trustees’ Fees and Expenses | 18 |
| Total Expenses | 30,186 |
| Expenses Paid Indirectly | (28) |
| Net Expenses | 30,158 |
| Net Investment Income | 353,521 |
| Realized Net Gain (Loss) | |
| Investment Securities Sold1,2 | 1,435,566 |
| Futures Contracts | 11,433 |
| Swap Contracts | 4,241 |
| Realized Net Gain (Loss) | 1,451,240 |
| Change in Unrealized Appreciation (Depreciation) | |
| Investment Securities1 | 12,987,770 |
| Futures Contracts | 2,757 |
| Swap Contracts | 10,941 |
| Change in Unrealized Appreciation (Depreciation) | 13,001,468 |
| Net Increase (Decrease) in Net Assets Resulting from Operations | 14,806,229 |
| 1 | Interest income, realized net gain (loss), and change in unrealized appreciation (depreciation) from an affiliated company of the fund were $1,237,000, ($42,000), and $35,000, respectively. Purchases and sales are for temporary cash investment purposes. |
| 2 | Includes $1,597,685,000 of net gain (loss) resulting from in-kind redemptions. |
Statement of Changes in Net Assets
| | Year Ended August 31, |
| | 2020 | 2019 |
| | ($000) | ($000) |
| Increase (Decrease) in Net Assets | | |
| Operations | | |
| Net Investment Income | 353,521 | 288,885 |
| Realized Net Gain (Loss) | 1,451,240 | 2,703,211 |
| Change in Unrealized Appreciation (Depreciation) | 13,001,468 | (1,981,325) |
| Net Increase (Decrease) in Net Assets Resulting from Operations | 14,806,229 | 1,010,771 |
| Distributions1 | | |
| ETF Shares | (318,133) | (260,834) |
| Admiral Shares | (38,529) | (26,967) |
| Total Distributions | (356,662) | (287,801) |
| Capital Share Transactions | | |
| ETF Shares | 5,140,709 | (2,459,914) |
| Admiral Shares | 1,061,125 | 317,194 |
| Net Increase (Decrease) from Capital Share Transactions | 6,201,834 | (2,142,720) |
| Total Increase (Decrease) | 20,651,401 | (1,419,750) |
| Net Assets | | |
| Beginning of Period | 23,208,757 | 24,628,507 |
| End of Period | 43,860,158 | 23,208,757 |
1 Certain prior-period numbers have been reclassified to conform with current period presentation.
See accompanying Notes, which are an integral part of the Financial Statements.
Information Technology Index Fund
Financial Highlights
| ETF Shares | | | | | |
| | | | | | |
| For a Share Outstanding | | | Year Ended August 31, |
| Throughout Each Period | 2020 | 2019 | 2018 | 2017 | 2016 |
| Net Asset Value, Beginning of Period | $213.66 | $202.82 | $151.19 | $117.82 | $102.35 |
| Investment Operations | | | | | |
| Net Investment Income | 2.9261 | 2.5721 | 1.9211 | 1.6461 | 1.566 |
| Net Realized and Unrealized Gain (Loss) on Investments | 114.955 | 10.792 | 51.430 | 33.329 | 16.049 |
| Total from Investment Operations | 117.881 | 13.364 | 53.351 | 34.975 | 17.615 |
| Distributions | | | | | |
| Dividends from Net Investment Income | (3.001) | (2.524) | (1.721) | (1.605) | (2.145) |
| Distributions from Realized Capital Gains | — | — | — | — | — |
| Total Distributions | (3.001) | (2.524) | (1.721) | (1.605) | (2.145) |
| Net Asset Value, End of Period | $328.54 | $213.66 | $202.82 | $151.19 | $117.82 |
| | | | | | |
| Total Return | 55.72% | 6.70% | 35.52% | 29.93% | 17.48% |
| | | | | | |
| Ratios/Supplemental Data | | | | | |
| Net Assets, End of Period (Millions) | $38,711 | $20,738 | $22,595 | $14,638 | $9,429 |
| Ratio of Total Expenses to Average Net Assets | 0.10% | 0.10% | 0.10% | 0.10% | 0.10% |
| Ratio of Net Investment Income to Average Net Assets | 1.17% | 1.32% | 1.10% | 1.24% | 1.50% |
| Portfolio Turnover Rate2 | 5% | 5% | 7% | 6% | 5% |
| 1 | Calculated based on average shares outstanding. |
| 2 | Excludes the value of portfolio securities received or delivered as a result of in-kind purchases or redemptions of the fund’s capital shares, including ETF Creation Units. |
| Admiral Shares | | | | | |
| | | | | | |
| For a Share Outstanding | | | Year Ended August 31, |
| Throughout Each Period | 2020 | 2019 | 2018 | 2017 | 2016 |
| Net Asset Value, Beginning of Period | $109.40 | $103.86 | $77.42 | $60.33 | $52.41 |
| Investment Operations | | | | | |
| Net Investment Income | 1.5041 | 1.3261 | 1.0011 | .8501 | .802 |
| Net Realized and Unrealized Gain (Loss) on Investments | 58.864 | 5.509 | 26.324 | 17.062 | 8.216 |
| Total from Investment Operations | 60.368 | 6.835 | 27.325 | 17.912 | 9.018 |
| Distributions | | | | | |
| Dividends from Net Investment Income | (1.538) | (1.295) | (.885) | (.822) | (1.098) |
| Distributions from Realized Capital Gains | — | — | — | — | — |
| Total Distributions | (1.538) | (1.295) | (.885) | (.822) | (1.098) |
| Net Asset Value, End of Period | $168.23 | $109.40 | $103.86 | $77.42 | $60.33 |
| | | | | | |
| Total Return2 | 55.78% | 6.70% | 35.54% | 29.94% | 17.49% |
| | | | | | |
| Ratios/Supplemental Data | | | | | |
| Net Assets, End of Period (Millions) | $5,149 | $2,470 | $2,033 | $933 | $456 |
| Ratio of Total Expenses to Average Net Assets | 0.10% | 0.10% | 0.10% | 0.10% | 0.10% |
| Ratio of Net Investment Income to Average Net Assets | 1.17% | 1.32% | 1.10% | 1.24% | 1.50% |
| Portfolio Turnover Rate3 | 5% | 5% | 7% | 6% | 5% |
| 1 | Calculated based on average shares outstanding. |
| 2 | Total returns do not include account service fees that may have applied in the periods shown. Fund prospectuses provide information about any applicable account service fees. |
| 3 | Excludes the value of portfolio securities received or delivered as a result of in-kind purchases or redemptions of the fund’s capital shares, including ETF Creation Units. |
See accompanying Notes, which are an integral part of the Financial Statements.
Information Technology Index Fund
Notes to Financial Statements
Vanguard Information Technology Index Fund is registered under the Investment Company Act of 1940 as an open-end investment company, or mutual fund. The fund offers two classes of shares: ETF Shares and Admiral Shares. Each of the share classes has different eligibility and minimum purchase requirements, and is designed for different types of investors. ETF Shares are listed for trading on NYSE Arca; they can be purchased and sold through a broker.
Market disruptions associated with the COVID-19 pandemic have had a global impact, and uncertainty exists as to the long-term implications. Such disruptions can adversely affect assets of the fund and thus fund performance.
A. The following significant accounting policies conform to generally accepted accounting principles for U.S. investment companies. The fund consistently follows such policies in preparing its financial statements.
1. Security Valuation: Securities are valued as of the close of trading on the New York Stock Exchange (generally 4 p.m., Eastern time) on the valuation date. Equity securities are valued at the latest quoted sales prices or official closing prices taken from the primary market in which each security trades; such securities not traded on the valuation date are valued at the mean of the latest quoted bid and asked prices. Securities for which market quotations are not readily available, or whose values have been materially affected by events occurring before the fund’s pricing time but after the close of the securities’ primary markets, are valued by methods deemed by the board of trustees to represent fair value. Investments in Vanguard Market Liquidity Fund are valued at that fund’s net asset value. Temporary cash investments are valued using the latest bid prices or using valuations based on a matrix system (which considers such factors as security prices, yields, maturities, and ratings), both as furnished by independent pricing services.
2. Futures Contracts: The fund uses index futures contracts to a limited extent, with the objectives of maintaining full exposure to the stock market, maintaining liquidity, and minimizing transaction costs. The fund may purchase futures contracts to immediately invest incoming cash in the market, or sell futures in response to cash outflows, thereby simulating a fully invested position in the underlying index while maintaining a cash balance for liquidity. The primary risks associated with the use of futures contracts are imperfect correlation between changes in market values of stocks held by the fund and the prices of futures contracts, and the possibility of an illiquid market. Counterparty risk involving futures is mitigated because a regulated clearinghouse is the counterparty instead of the clearing broker. To further mitigate counterparty risk, the fund trades futures contracts on an exchange, monitors the financial strength of its clearing brokers and clearinghouse, and has entered into clearing agreements with its clearing brokers. The clearinghouse imposes initial margin requirements to secure the fund’s performance and requires daily settlement of variation margin representing changes in the market value of each contract. Any securities pledged as initial margin for open contracts are noted in the Schedule of Investments.
Futures contracts are valued at their quoted daily settlement prices. The notional amounts of the contracts are not recorded in the Statement of Assets and Liabilities. Fluctuations in the value of the contracts are recorded in the Statement of Assets and Liabilities as an asset (liability) and in the Statement of Operations as unrealized appreciation (depreciation) until the contracts are closed, when they are recorded as realized gains (losses) on futures contracts.
During the year ended August 31, 2020, the fund’s average investments in long and short futures contracts represented less than 1% and 0% of net assets, respectively, based on the average of the notional amounts at each quarter-end during the period.
3. Swap Contracts: The fund has entered into equity swap contracts to earn the total return on selected reference stocks in the fund’s target index. Under the terms of the swaps, the fund receives the total return on the referenced stock (i.e., receiving the increase or paying the decrease in value of the selected reference stock and receiving the equivalent of any dividends in respect of the selected referenced stock) over a specified period of time, applied to a notional amount that represents the value of a designated number of shares of the selected reference stock at the beginning of the equity swap contract. The fund also pays a floating rate that is based on short-term interest rates, applied to the notional amount. At the same time, the fund generally invests an amount approximating the notional amount of the swap in high-quality temporary cash investments.
A risk associated with all types of swaps is the possibility that a counterparty may default on its obligation to pay net amounts due to the fund. The fund’s maximum amount subject to counterparty risk is the unrealized appreciation on the swap contract. The fund mitigates its counterparty risk by entering into swaps only with a diverse group of prequalified counterparties, monitoring their financial strength, entering into master netting arrangements with its counterparties, and requiring
Information Technology Index Fund
its counterparties to transfer collateral as security for their performance. In the absence of a default, the collateral pledged or received by the fund cannot be repledged, resold, or rehypothecated. In the event of a counterparty’s default (including bankruptcy), the fund may terminate any swap contracts with that counterparty, determine the net amount owed by either party in accordance with its master netting arrangements, and sell or retain any collateral held up to the net amount owed to the fund under the master netting arrangements. The swap contracts contain provisions whereby a counterparty may terminate open contracts if the fund’s net assets decline below a certain level, triggering a payment by the fund if the fund is in a net liability position at the time of the termination. The payment amount would be reduced by any collateral the fund has pledged. Any securities pledged as collateral for open contracts are noted in the Schedule of Investments. The value of collateral received or pledged is compared daily to the value of the swap contracts exposure with each counterparty, and any difference, if in excess of a specified minimum transfer amount, is adjusted and settled within two business days.
The notional amounts of swap contracts are not recorded in the Statement of Assets and Liabilities. Swaps are valued daily based on market quotations received from independent pricing services or recognized dealers and the change in value is recorded in the Statement of Assets and Liabilities as an asset (liability) and in the Statement of Operations as unrealized appreciation (depreciation) until periodic payments are made or the termination of the swap, at which time realized gain (loss) is recorded.
During the year ended August 31, 2020, the fund’s average amounts of investments in total return swaps represented less than 1% of net assets, based on the average of notional amounts at each quarter-end during the period.
4. Federal Income Taxes: The fund intends to continue to qualify as a regulated investment company and distribute all of its taxable income. The fund’s tax returns are open to examination by the relevant tax authorities until expiration of the applicable statute of limitations, which is generally three years after the filing of the tax return. Management has analyzed the fund’s tax positions taken for all open federal and state income tax years, and has concluded that no provision for income tax is required in the fund’s financial statements.
5. Distributions: Distributions to shareholders are recorded on the ex-dividend date. Distributions are determined on a tax basis at the fiscal year-end and may differ from net investment income and realized capital gains for financial reporting purposes.
6. Securities Lending: To earn additional income, the fund lends its securities to qualified institutional borrowers. Security loans are subject to termination by the fund at any time, and are required to be secured at all times by collateral in an amount at least equal to the market value of securities loaned. Daily market fluctuations could cause the value of loaned securities to be more or less than the value of the collateral received. When this occurs, the collateral is adjusted and settled before the opening of the market on the next business day. The fund further mitigates its counterparty risk by entering into securities lending transactions only with a diverse group of prequalified counterparties, monitoring their financial strength, and entering into master securities lending agreements with its counterparties. The master securities lending agreements provide that, in the event of a counterparty’s default (including bankruptcy), the fund may terminate any loans with that borrower, determine the net amount owed, and sell or retain the collateral up to the net amount owed to the fund; however, such actions may be subject to legal proceedings. While collateral mitigates counterparty risk, in the event of a default, the fund may experience delays and costs in recovering the securities loaned. The fund invests cash collateral received in Vanguard Market Liquidity Fund, and records a liability in the Statement of Assets and Liabilities for the return of the collateral, during the period the securities are on loan. Collateral investments in Vanguard Market Liquidity Fund are subject to market appreciation or depreciation. Securities lending income represents fees charged to borrowers plus income earned on invested cash collateral, less expenses associated with the loan. During the term of the loan, the fund is entitled to all distributions made on or in respect of the loaned securities.
7. Credit Facilities and Interfund Lending Program: The fund and certain other funds managed by The Vanguard Group (“Vanguard”) participate in a $4.3 billion committed credit facility provided by a syndicate of lenders pursuant to a credit agreement and an uncommitted credit facility provided by Vanguard. Both facilities may be renewed annually. Each fund is individually liable for its borrowings, if any, under the credit facilities. Borrowings may be utilized for temporary or emergency purposes, subject to the fund’s regulatory and contractual borrowing restrictions. With respect to the committed credit facility, the participating funds are charged administrative fees and an annual commitment fee of 0.10% of the undrawn committed amount of the facility; these fees are allocated to the funds based on a method approved by the fund’s board of trustees and included in Management and
Information Technology Index Fund
Administrative expenses on the fund’s Statement of Operations. Any borrowings under either facility bear interest at a rate based upon the higher of the one-month London Interbank Offered Rate (or an acceptable alternate rate, if necessary), federal funds effective rate, or overnight bank funding rate plus an agreed-upon spread, except that borrowings under the uncommitted credit facility may bear interest based upon an alternative rate agreed to by the fund and Vanguard.
In accordance with an exemptive order (the “Order”) from the SEC, the fund may participate in a joint lending and borrowing program that allows registered open-end Vanguard funds to borrow money from and lend money to each other for temporary or emergency purposes (the “Interfund Lending Program”), subject to compliance with the terms and conditions of the Order, and to the extent permitted by the fund’s investment objective and investment policies. Interfund loans and borrowings normally extend overnight, but can have a maximum duration of seven days. Loans may be called on one business day’s notice. The interest rate to be charged is governed by the conditions of the Order and internal procedures adopted by the board of trustees. The board of trustees is responsible for overseeing the Interfund Lending Program.
For the year ended August 31, 2020, the fund did not utilize the credit facilities or the Interfund Lending Program.
8. Other: Dividend income is recorded on the ex-dividend date. Interest income includes income distributions received from Vanguard Market Liquidity Fund and is accrued daily. Premiums and discounts on debt securities are amortized and accreted, respectively, to interest income over the lives of the respective securities, except for premiums on certain callable debt securities that are amortized to the earliest call date. Security transactions are accounted for on the date securities are bought or sold. Costs used to determine realized gains (losses) on the sale of investment securities are those of the specific securities sold.
Each class of shares has equal rights as to assets and earnings, except that each class separately bears certain class-specific expenses related to maintenance of shareholder accounts (included in Management and Administrative expenses) and shareholder reporting. Marketing and distribution expenses are allocated to each class of shares based on a method approved by the board of trustees. Income, other non-class-specific expenses, and gains and losses on investments are allocated to each class of shares based on its relative net assets.
B. In accordance with the terms of a Funds’ Service Agreement (the “FSA”) between Vanguard and the fund, Vanguard furnishes to the fund investment advisory, corporate management, administrative, marketing, and distribution services at Vanguard’s cost of operations (as defined by the FSA). These costs of operations are allocated to the fund based on methods and guidelines approved by the board of trustees and are generally settled twice a month.
Upon the request of Vanguard, the fund may invest up to 0.40% of its net assets as capital in Vanguard. At August 31, 2020, the fund had contributed to Vanguard capital in the amount of $1,658,000, representing less than 0.01% of the fund’s net assets and 0.66% of Vanguard’s capital received pursuant to the FSA. The fund’s trustees and officers are also directors and employees, respectively, of Vanguard.
C. The fund’s custodian bank has agreed to reduce its fees when the fund maintains cash on deposit in the non-interest-bearing custody account. For the year ended August 31, 2020, custodian fee offset arrangements reduced the fund’s expenses by $28,000 (an annual rate of less than 0.01% of average net assets).
D. Various inputs may be used to determine the value of the fund’s investments and derivatives. These inputs are summarized in three broad levels for financial statement purposes. The inputs or methodologies used to value securities are not necessarily an indication of the risk associated with investing in those securities.
Level 1—Quoted prices in active markets for identical securities.
Level 2—Other significant observable inputs (including quoted prices for similar securities, interest rates, prepayment speeds, credit risk, etc.).
Level 3—Significant unobservable inputs (including the fund’s own assumptions used to determine the fair value of investments). Any investments and derivatives valued with significant unobservable inputs are noted on the Schedule of Investments.
Information Technology Index Fund
The following table summarizes the market value of the fund’s investments and derivatives as of August 31, 2020, based on the inputs used to value them:
| | Level 1 | Level 2 | Level 3 | Total |
| | ($000) | ($000) | ($000) | ($000) |
| Investments | | | | |
| Assets | | | | |
| Common Stocks | 43,704,766 | — | — | 43,704,766 |
| Temporary Cash Investments | 172,628 | 4,085 | — | 176,713 |
| Total | 43,877,394 | 4,085 | — | 43,881,479 |
| Derivative Financial Instruments | | | | |
| Assets | | | | |
| Futures Contracts1 | 567 | — | — | 567 |
| Swap Contracts | — | 10,941 | — | 10,941 |
| Total | 567 | 10,941 | — | 11,508 |
1 Represents variation margin on the last day of the reporting period.
E. Permanent differences between book-basis and tax-basis components of net assets are reclassified among capital accounts in the financial statements to reflect their tax character. These reclassifications have no effect on net assets or net asset value per share. As of period end, permanent differences primarily attributable to the accounting for in-kind redemptions and swap agreements were reclassified between the following accounts:
| | Amount |
| | ($000) |
| Paid-in Capital | 1,597,685 |
| Total Distributable Earnings (Loss) | (1,597,685) |
Temporary differences between book-basis and tax-basis components of total distributable earnings (loss) arise when certain items of income, gain, or loss are recognized in different periods for financial statement and tax purposes; these differences will reverse at some time in the future. The differences are primarily related to the deferral of losses from wash sales and the recognition of unrealized gains or losses from certain derivative contracts. As of period end, the tax-basis components of total distributable earnings (loss) are detailed in the table as follows:
| | Amount |
| | ($000) |
| Undistributed Ordinary Income | 94,128 |
| Undistributed Long-Term Gains | — |
| Capital Loss Carryforwards | (280,212) |
| Qualified Late-Year Losses | — |
| Net Unrealized Gains (Losses) | 18,556,759 |
The tax character of distributions paid was as follows:
| | Year Ended August 31, |
| | 2020 | 2019 |
| | Amount | Amount |
| | ($000) | ($000) |
| Ordinary Income* | 356,662 | 287,801 |
| Long-Term Capital Gains | — | — |
| Total | 356,662 | 287,801 |
* Includes short-term capital gains, if any.
Information Technology Index Fund
As of August 31, 2020, gross unrealized appreciation and depreciation for investments and derivatives based on cost for U.S. federal income tax purposes were as follows:
| | Amount |
| | ($000) |
| Tax Cost | 25,324,720 |
| Gross Unrealized Appreciation | 19,160,007 |
| Gross Unrealized Depreciation | (603,248) |
| Net Unrealized Appreciation (Depreciation) | 18,556,759 |
F. During the year ended August 31, 2020, the fund purchased $10,422,796,000 of investment securities and sold $4,223,807,000 of investment securities, other than temporary cash investments. Purchases and sales include $7,587,984,000 and $2,764,555,000, respectively, in connection with in-kind purchases and redemptions of the fund’s capital shares.
G. Capital share transactions for each class of shares were:
| | | | Year Ended August 31, |
| | | 2020 | | | 2019 |
| | Amount | Shares | | Amount | Shares |
| | ($000) | (000) | | ($000) | (000) |
| ETF Shares | | | | | |
| Issued | 7,928,607 | 32,065 | | 2,875,252 | 14,358 |
| Issued in Lieu of Cash Distributions | — | — | | — | — |
| Redeemed | (2,787,898) | (11,300) | | (5,335,166) | (28,700) |
| Net Increase (Decrease)—ETF Shares | 5,140,709 | 20,765 | | (2,459,914) | (14,342) |
| Admiral Shares | | | | | |
| Issued | 2,339,727 | 18,276 | | 952,910 | 9,462 |
| Issued in Lieu of Cash Distributions | 35,023 | 293 | | 24,513 | 243 |
| Redeemed | (1,313,625) | (10,540) | | (660,229) | (6,699) |
| Net Increase (Decrease)—Admiral Shares | 1,061,125 | 8,029 | | 317,194 | 3,006 |
H. Management has determined that no events or transactions occurred subsequent to August 31, 2020, that would require recognition or disclosure in these financial statements.
Materials Index Fund
Performance Summary
All of the returns in this report represent past performance, which is not a guarantee of future results that may be achieved by the fund. (Current performance may be lower or higher than the performance data cited. For performance data current to the most recent month-end, visit our website at vanguard.com/performance.) Note, too, that both investment returns and principal value can fluctuate widely, so an investor’s shares, when sold, could be worth more or less than their original cost. The returns shown do not reflect taxes that a shareholder would pay on fund distributions or on the sale of fund shares.
Cumulative Performance: August 31, 2010–August 31, 2020
Initial Investment of $10,000
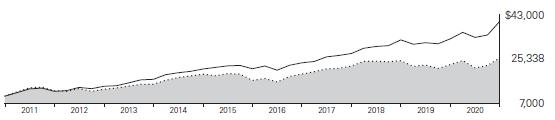
| | | | Average Annual Total Returns | Final Value |
| | | | Periods Ended August 31, 2020 | of a $10,000 |
| | | One Year | Five Years | Ten Years | Investment |
 | Materials Index Fund ETF Shares Net Asset Value | 12.12% | 9.28% | 9.74% | $25,338 |
| | Materials Index Fund ETF Shares Market Price | 12.23 | 9.29 | 9.75 | 25,362 |
 | MSCI US IMI/Materials 25/50 | 12.22 | 9.35 | 9.85 | 25,583 |
 | MSCI US IMI/2500 | 21.48 | 13.88 | 14.99 | 40,426 |
| | | | | Final Value |
| | | | | of a $100,000 |
| | One Year | Five Years | Ten Years | Investment |
| Materials Index Fund Admiral Shares | 12.14% | 9.27% | 9.75% | $253,520 |
| MSCI US IMI/Materials 25/50 | 12.22 | 9.35 | 9.85 | 255,826 |
| MSCI US IMI/2500 | 21.48 | 13.88 | 14.99 | 404,265 |
| Cumulative Returns: ETF Shares, August 31, 2010–August 31, 2020 | | |
| | | |
| | One Year | Five Years | Ten Years |
| Materials Index Fund ETF Shares Market Price | 12.23% | 55.94% | 153.62% |
| Materials Index Fund ETF Shares Net Asset Value | 12.12 | 55.84 | 153.38 |
| MSCI US IMI/Materials 25/50 | 12.22 | 56.33 | 155.83 |
For the ETF Shares, the market price is determined by the midpoint of the bid-offer spread as of the closing time of the New York Stock Exchange (generally 4 p.m., Eastern time). The net asset value is also determined as of the NYSE closing time. For more information about how the ETF Shares’ market prices have compared with their net asset value, visit vanguard.com, select your ETF, and then select the Price and Performance tab. The ETF premium/discount analysis there shows the percentages of days on which the ETF Shares’ market price was above or below the NAV.
See Financial Highlights for dividend and capital gains information.
Materials Index Fund
Fund Allocation
As of August 31, 2020
| Aluminum | 0.7% |
| Commodity Chemicals | 7.2 |
| Construction Materials | 3.8 |
| Copper | 2.5 |
| Diversified Chemicals | 1.9 |
| Diversified Metals & Mining | 0.3 |
| Fertilizers & Agricultural Chemicals | 6.2 |
| Forest Products | 0.6 |
| Gold | 7.2 |
| Industrial Gases | 21.5 |
| Metal & Glass Containers | 6.3 |
| Paper Packaging | 7.9 |
| Paper Products | 0.6 |
| Silver | 0.4 |
| Specialty Chemicals | 28.6 |
| Steel | 4.3 |
The table reflects the fund’s investments, except for short-term investments and derivatives. Sector categories are based on the Global Industry Classification Standard (“GICS”), except for the “Other” category (if applicable), which includes securities that have not been provided a GICS classification as of the effective reporting period.
The fund may invest in derivatives (such as futures and swap contracts) for various reasons, including, but not limited to, attempting to remain fully invested and tracking its target index as closely as possible.
The Global Industry Classification Standard (“GICS”) was developed by and is the exclusive property and a service mark of MSCI Inc. (“MSCI”) and Standard and Poor’s, a division of McGraw-Hill Companies, Inc. (“S&P”), and is licensed for use by Vanguard. Neither MSCI, S&P nor any third party involved in making or compiling the GICS or any GICS classification makes any express or implied warranties or representations with respect to such standard or classification (or the results to be obtained by the use thereof), and all such parties hereby expressly disclaim all warranties of originality, accuracy, completeness, merchantability or fitness for a particular purpose with respect to any such standard or classification. Without limiting any of the foregoing, in no event shall MSCI, S&P, any of its affiliates or any third party involved in making or compiling the GICS or any GICS classification have any liability for any direct, indirect, special, punitive, consequential or any other damages (including lost profits) even if notified of the possibility of such damages.
Materials Index Fund
Financial Statements
Schedule of Investments
As of August 31, 2020
The fund files its complete schedule of portfolio holdings with the Securities and Exchange Commission (SEC) for the first and third quarters of each fiscal year as an exhibit to its reports on Form N-PORT. The fund’s Form N-PORT reports are available on the SEC’s website at www.sec.gov.
| | | | Market |
| | | | Value• |
| | | Shares | ($000) |
| Common Stocks (99.6%) | | |
| Chemicals (65.2%) | | |
| | Linde plc | 1,301,314 | 324,990 |
| | Air Products & Chemicals Inc. | 547,233 | 159,934 |
| | Sherwin-Williams Co. | 202,488 | 135,879 |
| | Ecolab Inc. | 631,847 | 124,524 |
| | DuPont de Nemours Inc. | 1,818,250 | 101,386 |
| | Dow Inc. | 1,835,396 | 82,813 |
| | PPG Industries Inc. | 584,576 | 70,383 |
| | Corteva Inc. | 1,854,352 | 52,942 |
| | LyondellBasell Industries NV Class A | 661,511 | 43,316 |
| | FMC Corp. | 320,737 | 34,274 |
| | Celanese Corp. Class A | 292,957 | 29,633 |
| | RPM International Inc. | 320,853 | 27,199 |
| | Eastman Chemical Co. | 336,727 | 24,618 |
| | Albemarle Corp. | 263,433 | 23,975 |
| | International Flavors & Fragrances Inc. | 186,801 | 23,124 |
| | Scotts Miracle-Gro Co. | 103,138 | 17,382 |
| | CF Industries Holdings Inc. | 529,782 | 17,287 |
| | Mosaic Co. | 892,190 | 16,265 |
| * | Axalta Coating Systems Ltd. | 524,690 | 12,514 |
| | Huntsman Corp. | 491,822 | 10,633 |
| | Ashland Global Holdings Inc. | 134,815 | 9,934 |
| | Valvoline Inc. | 458,487 | 9,353 |
| | Chemours Co. | 406,863 | 8,406 |
| | NewMarket Corp. | 21,682 | 8,076 |
| | Balchem Corp. | 80,063 | 7,822 |
| | Quaker Chemical Corp. | 32,996 | 6,269 |
| | HB Fuller Co. | 127,374 | 6,136 |
| * | Element Solutions Inc. | 554,668 | 5,963 |
| | Sensient Technologies Corp. | 104,942 | 5,795 |
| | Stepan Co. | 50,179 | 5,785 |
| | Avient Corp. | 226,320 | 5,776 |
| * | Ingevity Corp. | 102,113 | 5,736 |
| | W R Grace & Co. | 139,380 | 5,674 |
| | Westlake Chemical Corp. | 94,906 | 5,630 |
| | Cabot Corp. | 139,609 | 5,167 |
| | Innospec Inc. | 60,848 | 4,545 |
| | Olin Corp. | 391,081 | 4,400 |
| | Minerals Technologies Inc. | 84,507 | 4,289 |
| * | Livent Corp. | 362,492 | 3,074 |
| * | GCP Applied Technologies Inc. | 117,069 | 3,051 |
| * | Ferro Corp. | 183,321 | 2,286 |
| | Tronox Holdings plc Class A | 230,843 | 2,068 |
| | Trinseo SA | 76,108 | 1,896 |
| | Chase Corp. | 18,799 | 1,834 |
| | Orion Engineered Carbons SA | 149,558 | 1,817 |
| * | Koppers Holdings Inc. | 51,888 | 1,248 |
| | Hawkins Inc. | 23,578 | 1,184 |
| | Tredegar Corp. | 66,245 | 1,121 |
| * | Kraton Corp. | 78,449 | 1,101 |
| | American Vanguard Corp. | 67,429 | 954 |
| * | AdvanSix Inc. | 70,011 | 891 |
| | FutureFuel Corp. | 65,189 | 789 |
| | Kronos Worldwide Inc. | 58,115 | 726 |
| * | Rayonier Advanced Materials Inc. | 147,118 | 465 |
| * | Venator Materials plc | 147,760 | 318 |
| | Intrepid Potash Inc. | 23,973 | 224 |
| | | | 1,472,874 |
| Construction Materials (3.7%) | |
| | Vulcan Materials Co. | 328,150 | 39,378 |
| | Martin Marietta Materials Inc. | 154,226 | 31,288 |
| | Eagle Materials Inc. | 97,965 | 8,011 |
| * | Summit Materials Inc. Class A | 282,751 | 4,210 |
| * | US Concrete Inc. | 39,186 | 1,046 |
| * | Forterra Inc. | 48,917 | 648 |
| | | | 84,581 |
| Containers & Packaging (14.1%) | |
| | Ball Corp. | 807,801 | 64,923 |
| | Amcor plc | 3,426,172 | 37,894 |
| | International Paper Co. | 925,204 | 33,557 |
| * | Crown Holdings Inc. | 333,716 | 25,646 |
| | Avery Dennison Corp. | 206,509 | 23,829 |
| | Packaging Corp. of America | 234,995 | 23,791 |
| | Westrock Co. | 642,414 | 19,484 |
| | AptarGroup Inc. | 159,043 | 18,829 |
| * | Berry Global Group Inc. | 328,296 | 16,920 |
| | Sealed Air Corp. | 385,697 | 15,158 |
| | Sonoco Products Co. | 248,578 | 13,182 |
| | Graphic Packaging Holding Co. | 692,040 | 9,675 |
| | Silgan Holdings Inc. | 192,280 | 7,318 |
| | O-I Glass Inc. | 368,510 | 4,009 |
| | Greif Inc. Class A | 61,851 | 2,279 |
| | Myers Industries Inc. | 75,456 | 1,155 |
| * | UFP Technologies Inc. | 16,518 | 681 |
| | | | 318,330 |
| Metals & Mining (15.4%) | | |
| | Newmont Corp. | 1,988,657 | 133,797 |
| | Freeport-McMoRan Inc. | 3,597,673 | 56,160 |
| | Nucor Corp. | 746,174 | 33,921 |
| | Royal Gold Inc. | 162,500 | 22,152 |
| | Reliance Steel & Aluminum Co. | 157,698 | 16,538 |
| | Steel Dynamics Inc. | 521,168 | 15,385 |
| | Hecla Mining Co. | 1,303,455 | 7,847 |
| * | Alcoa Corp. | 460,715 | 6,736 |
| | Cleveland-Cliffs Inc. | 987,663 | 6,499 |
| | Commercial Metals Co. | 294,972 | 6,156 |
| * | Arconic Corp. | 243,168 | 5,410 |
| * | Coeur Mining Inc. | 603,408 | 5,105 |
| | Compass Minerals International Inc. | 84,126 | 4,789 |
| | United States Steel Corp. | 546,114 | 4,276 |
| | Worthington Industries Inc. | 96,337 | 4,001 |
| | Materion Corp. | 50,435 | 2,753 |
| * | Allegheny Technologies Inc. | 313,855 | 2,614 |
| | Kaiser Aluminum Corp. | 39,017 | 2,508 |
| | Carpenter Technology Corp. | 118,568 | 2,493 |
| | Warrior Met Coal Inc. | 126,710 | 1,960 |
| * | Century Aluminum Co. | 133,832 | 1,321 |
| | Schnitzer Steel Industries Inc. | 66,087 | 1,305 |
| *,^ | McEwen Mining Inc. | 843,172 | 1,062 |
| | SunCoke Energy Inc. | 205,175 | 734 |
| | Haynes International Inc. | 30,819 | 578 |
| * | TimkenSteel Corp. | 87,041 | 328 |
| * | Ryerson Holding Corp. | 42,231 | 233 |
| * | Contura Energy Inc. | 46,792 | 194 |
| | | | 346,855 |
| Paper & Forest Products (1.2%) | |
| | Louisiana-Pacific Corp. | 277,921 | 9,154 |
| | Boise Cascade Co. | 97,051 | 4,445 |
| | Domtar Corp. | 136,702 | 3,899 |
| | Schweitzer-Mauduit International Inc. | 77,217 | 2,342 |
| | Neenah Inc. | 41,553 | 1,840 |
| | P H Glatfelter Co. | 110,131 | 1,651 |
| * | Clearwater Paper Corp. | 41,317 | 1,391 |
| | Verso Corp. | 74,051 | 971 |
| | Mercer International Inc. | 107,192 | 898 |
| | | | 26,591 |
Total Common Stocks (Cost $2,369,839) | | 2,249,231 |
| Temporary Cash Investment (0.2%) | |
| 1,2 | Vanguard Market Liquidity Fund, 0.147% (Cost $4,303) | 43,032 | 4,303 |
Total Investments (99.8%) (Cost $2,374,142) | | 2,253,534 |
| Other Assets and Liabilities—Net (0.2%) | | 5,012 |
| Net Assets (100%) | | 2,258,546 |
Cost is in $000.
| · | See Note A in Notes to Financial Statements. |
| * | Non-income-producing security. |
| ^ | Includes partial security positions on loan to broker-dealers. The total value of securities on loan is $627,000. |
| 1 | Affiliated money market fund available only to Vanguard funds and certain trusts and accounts managed by Vanguard. Rate shown is the 7-day yield. |
| 2 | Collateral of $995,000 was received for securities on loan. |
Materials Index Fund
| Derivative Financial Instruments Outstanding as of Period End | | |
| | | |
| Over-the-Counter Total Return Swaps | | | | | |
| | | | | Floating | | |
| | | | | Interest Rate | Value and | Value and |
| | | | Notional | Received | Unrealized | Unrealized |
| | Termination | | Amount | (Paid)1 | Appreciation | (Depreciation) |
| Reference Entity | Date | Counterparty | ($000) | (%) | ($000) | ($000) |
| Amcor plc | 9/2/20 | BOANA | 4,893 | (0.155) | 361 | — |
| Amcor plc | 9/2/21 | BOANA | 5,254 | (0.157) | — | — |
| International Flavors & Fragrances Inc. | 2/2/21 | GSI | 3,082 | (0.161) | 12 | — |
| | | | | | 373 | — |
| 1 | Based on 1-month USD London Interbank Offered Rate (LIBOR) as of the most recent payment date. Floating interest payment received/ paid monthly. |
BOANA—Bank of America, N.A.
GSI—Goldman Sachs International.
See accompanying Notes, which are an integral part of the Financial Statements.
Materials Index Fund
Statement of Assets and Liabilities
As of August 31, 2020
| ($000s, except shares and per-share amounts) | Amount |
| Assets | |
| Investments in Securities, at Value | |
| Unaffiliated Issuers (Cost $2,369,839) | 2,249,231 |
| Affiliated Issuers (Cost $4,303) | 4,303 |
| Total Investments in Securities | 2,253,534 |
| Investment in Vanguard | 92 |
| Receivables for Investment Securities Sold | 7,907 |
| Receivables for Accrued Income | 5,526 |
| Receivables for Capital Shares Issued | 419 |
| Unrealized Appreciation—Over-the-Counter Swap Contracts | 373 |
| Total Assets | 2,267,851 |
| Liabilities | |
| Payables for Investment Securities Purchased | 7,903 |
| Collateral for Securities on Loan | 995 |
| Payables for Capital Shares Redeemed | 296 |
| Payables to Vanguard | 111 |
| Total Liabilities | 9,305 |
| Net Assets | 2,258,546 |
| | |
| At August 31, 2020, net assets consisted of: | |
| | |
| Paid-in Capital | 2,457,073 |
| Total Distributable Earnings (Loss) | (198,527) |
| Net Assets | 2,258,546 |
| | |
| ETF Shares—Net Assets | |
| Applicable to 12,426,411 outstanding $.001 par value shares of beneficial interest (unlimited authorization) | 1,675,593 |
| Net Asset Value Per Share—ETF Shares | $134.84 |
| | |
| Admiral Shares—Net Assets | |
| Applicable to 8,485,213 outstanding $.001 par value shares of beneficial interest (unlimited authorization) | 582,953 |
| Net Asset Value Per Share—Admiral Shares | $68.70 |
See accompanying Notes, which are an integral part of the Financial Statements.
Materials Index Fund
Statement of Operations
| Year Ended |
| | August 31, 2020 |
| | ($000) |
| Investment Income | |
| Income | |
| Dividends | 47,689 |
| Interest1 | 28 |
| Securities Lending—Net | 215 |
| Total Income | 47,932 |
| Expenses | |
| The Vanguard Group—Note B | |
| Investment Advisory Services | 332 |
| Management and Administrative—ETF Shares | 1,089 |
| Management and Administrative—Admiral Shares | 379 |
| Marketing and Distribution—ETF Shares | 103 |
| Marketing and Distribution—Admiral Shares | 36 |
| Custodian Fees | 13 |
| Auditing Fees | 32 |
| Shareholders’ Reports—ETF Shares | 228 |
| Shareholders’ Reports—Admiral Shares | 9 |
| Trustees’ Fees and Expenses | 2 |
| Total Expenses | 2,223 |
| Net Investment Income | 45,709 |
| Realized Net Gain (Loss) | |
| Investment Securities Sold1,2 | 56,456 |
| Futures Contracts | 37 |
| Swap Contracts | 338 |
| Realized Net Gain (Loss) | 56,831 |
| Change in Unrealized Appreciation (Depreciation) | |
| Investment Securities1 | 119,355 |
| Swap Contracts | 396 |
| Change in Unrealized Appreciation (Depreciation) | 119,751 |
| Net Increase (Decrease) in Net Assets Resulting from Operations | 222,291 |
| 1 | Interest income, realized net gain (loss), and change in unrealized appreciation (depreciation) from an affiliated company of the fund were $28,000, ($7,000), and $1,000, respectively. Purchases and sales are for temporary cash investment purposes. |
| 2 | Includes $80,716,000 of net gain (loss) resulting from in-kind redemptions. |
Statement of Changes in Net Assets
| | Year Ended August 31, |
| | 2020 | 2019 |
| | ($000) | ($000) |
| Increase (Decrease) in Net Assets | | |
| Operations | | |
| Net Investment Income | 45,709 | 52,576 |
| Realized Net Gain (Loss) | 56,831 | 118,154 |
| Change in Unrealized Appreciation (Depreciation) | 119,751 | (439,986) |
| Net Increase (Decrease) in Net Assets Resulting from Operations | 222,291 | (269,256) |
| Distributions1 | | |
| ETF Shares | (36,101) | (44,813) |
| Admiral Shares | (10,501) | (9,048) |
| Total Distributions | (46,602) | (53,861) |
| Capital Share Transactions | | |
| ETF Shares | (371,010) | (545,088) |
| Admiral Shares | 50,384 | 70,433 |
| Net Increase (Decrease) from Capital Share Transactions | (320,626) | (474,655) |
| Total Increase (Decrease) | (144,937) | (797,772) |
| Net Assets | | |
| Beginning of Period | 2,403,483 | 3,201,255 |
| End of Period | 2,258,546 | 2,403,483 |
1 Certain prior-period numbers have been reclassified to conform with current period presentation.
See accompanying Notes, which are an integral part of the Financial Statements.
Materials Index Fund
Financial Highlights
| ETF Shares | | | | | |
| | | | | | |
| For a Share Outstanding | | | Year Ended August 31, |
| Throughout Each Period | 2020 | 2019 | 2018 | 2017 | 2016 |
| Net Asset Value, Beginning of Period | $122.80 | $134.33 | $124.29 | $108.16 | $96.39 |
| Investment Operations | | | | | |
| Net Investment Income | 2.5221 | 2.5011 | 2.2851 | 2.1751 | 1.980 |
| Net Realized and Unrealized Gain (Loss) on Investments | 12.053 | (11.541) | 9.961 | 16.072 | 12.770 |
| Total from Investment Operations | 14.575 | (9.040) | 12.246 | 18.247 | 14.750 |
| Distributions | | | | | |
| Dividends from Net Investment Income | (2.535) | (2.490) | (2.206) | (2.117) | (2.980) |
| Distributions from Realized Capital Gains | — | — | — | — | — |
| Total Distributions | (2.535) | (2.490) | (2.206) | (2.117) | (2.980) |
| Net Asset Value, End of Period | $134.84 | $122.80 | $134.33 | $124.29 | $108.16 |
| | | | | | |
| Total Return | 12.12% | -6.73% | 9.91% | 17.06% | 15.83% |
| | | | | | |
| Ratios/Supplemental Data | | | | | |
| Net Assets, End of Period (Millions) | $1,676 | $1,921 | $2,749 | $1,913 | $1,448 |
| Ratio of Total Expenses to Average Net Assets | 0.10% | 0.10% | 0.10% | 0.10% | 0.10% |
| Ratio of Net Investment Income to Average Net Assets | 2.05% | 2.04% | 1.71% | 1.87% | 2.06% |
| Portfolio Turnover Rate2 | 4% | 4% | 5% | 5% | 6% |
| 1 | Calculated based on average shares outstanding. |
| 2 | Excludes the value of portfolio securities received or delivered as a result of in-kind purchases or redemptions of the fund’s capital shares, including ETF Creation Units. |
| Admiral Shares | | | | | |
| | | | | | |
| For a Share Outstanding | | | Year Ended August 31, |
| Throughout Each Period | 2020 | 2019 | 2018 | 2017 | 2016 |
| Net Asset Value, Beginning of Period | $62.57 | $68.45 | $63.33 | $55.11 | $49.12 |
| Investment Operations | | | | | |
| Net Investment Income | 1.2941 | 1.2821 | 1.1591 | 1.1041 | 1.008 |
| Net Realized and Unrealized Gain (Loss) on Investments | 6.130 | (5.892) | 5.084 | 8.195 | 6.505 |
| Total from Investment Operations | 7.424 | (4.610) | 6.243 | 9.299 | 7.513 |
| Distributions | | | | | |
| Dividends from Net Investment Income | (1.294) | (1.270) | (1.123) | (1.079) | (1.523) |
| Distributions from Realized Capital Gains | — | — | — | — | — |
| Total Distributions | (1.294) | (1.270) | (1.123) | (1.079) | (1.523) |
| Net Asset Value, End of Period | $68.70 | $62.57 | $68.45 | $63.33 | $55.11 |
| | | | | | |
| Total Return2 | 12.14% | -6.74% | 9.91% | 17.06% | 15.80% |
| | | | | | |
| Ratios/Supplemental Data | | | | | |
| Net Assets, End of Period (Millions) | $583 | $482 | $452 | $372 | $235 |
| Ratio of Total Expenses to Average Net Assets | 0.10% | 0.10% | 0.10% | 0.10% | 0.10% |
| Ratio of Net Investment Income to Average Net Assets | 2.08% | 2.04% | 1.71% | 1.87% | 2.06% |
| Portfolio Turnover Rate3 | 4% | 4% | 5% | 5% | 6% |
| 1 | Calculated based on average shares outstanding. |
| 2 | Total returns do not include account service fees that may have applied in the periods shown. Fund prospectuses provide information about any applicable account service fees. |
| 3 | Excludes the value of portfolio securities received or delivered as a result of in-kind purchases or redemptions of the fund’s capital shares, including ETF Creation Units. |
See accompanying Notes, which are an integral part of the Financial Statements.
Materials Index Fund
Notes to Financial Statements
Vanguard Materials Index Fund is registered under the Investment Company Act of 1940 as an open-end investment company, or mutual fund. The fund offers two classes of shares: ETF Shares and Admiral Shares. Each of the share classes has different eligibility and minimum purchase requirements, and is designed for different types of investors. ETF Shares are listed for trading on NYSE Arca; they can be purchased and sold through a broker.
Market disruptions associated with the COVID-19 pandemic have had a global impact, and uncertainty exists as to the long-term implications. Such disruptions can adversely affect assets of the fund and thus fund performance.
A. The following significant accounting policies conform to generally accepted accounting principles for U.S. investment companies. The fund consistently follows such policies in preparing its financial statements.
1. Security Valuation: Securities are valued as of the close of trading on the New York Stock Exchange (generally 4 p.m., Eastern time) on the valuation date. Equity securities are valued at the latest quoted sales prices or official closing prices taken from the primary market in which each security trades; such securities not traded on the valuation date are valued at the mean of the latest quoted bid and asked prices. Securities for which market quotations are not readily available, or whose values have been materially affected by events occurring before the fund’s pricing time but after the close of the securities’ primary markets, are valued at their fair values calculated according to procedures adopted by the board of trustees. Investments in Vanguard Market Liquidity Fund are valued at that fund’s net asset value.
2. Futures Contracts: The fund uses index futures contracts to a limited extent, with the objectives of maintaining full exposure to the stock market, maintaining liquidity, and minimizing transaction costs. The fund may purchase futures contracts to immediately invest incoming cash in the market, or sell futures in response to cash outflows, thereby simulating a fully invested position in the underlying index while maintaining a cash balance for liquidity. The primary risks associated with the use of futures contracts are imperfect correlation between changes in market values of stocks held by the fund and the prices of futures contracts, and the possibility of an illiquid market. Counterparty risk involving futures is mitigated because a regulated clearinghouse is the counterparty instead of the clearing broker. To further mitigate counterparty risk, the fund trades futures contracts on an exchange, monitors the financial strength of its clearing brokers and clearinghouse, and has entered into clearing agreements with its clearing brokers. The clearinghouse imposes initial margin requirements to secure the fund’s performance and requires daily settlement of variation margin representing changes in the market value of each contract. Any securities pledged as initial margin for open contracts are noted in the Schedule of Investments.
Futures contracts are valued at their quoted daily settlement prices. The notional amounts of the contracts are not recorded in the Statement of Assets and Liabilities. Fluctuations in the value of the contracts are recorded in the Statement of Assets and Liabilities as an asset (liability) and in the Statement of Operations as unrealized appreciation (depreciation) until the contracts are closed, when they are recorded as realized gains (losses) on futures contracts.
During the year ended August 31, 2020, the fund’s average investments in long and short futures contracts each represented less than 1% and 0% of net assets, respectively, based on the average of the notional amounts at each quarter-end during the period. The fund had no open futures contracts at August 31, 2020.
3. Swap Contracts: The fund has entered into equity swap contracts to earn the total return on selected reference stocks in the fund’s target index. Under the terms of the swaps, the fund receives the total return on the referenced stock (i.e., receiving the increase or paying the decrease in value of the selected reference stock and receiving the equivalent of any dividends in respect of the selected referenced stock) over a specified period of time, applied to a notional amount that represents the value of a designated number of shares of the selected reference stock at the beginning of the equity swap contract. The fund also pays a floating rate that is based on short-term interest rates, applied to the notional amount. At the same time, the fund generally invests an amount approximating the notional amount of the swap in high-quality temporary cash investments.
A risk associated with all types of swaps is the possibility that a counterparty may default on its obligation to pay net amounts due to the fund. The fund’s maximum amount subject to counterparty risk is the unrealized appreciation on the swap contract. The fund mitigates its counterparty risk by entering into swaps only with a diverse group of prequalified counterparties, monitoring their financial strength, entering into master netting arrangements with its counterparties, and requiring its counterparties to transfer collateral as security for their performance. In the absence of a default, the collateral pledged or received by the fund cannot be repledged, resold, or rehypothecated. In the event of a counterparty’s default (including bankruptcy), the fund may terminate any swap contracts
Materials Index Fund
with that counterparty, determine the net amount owed by either party in accordance with its master netting arrangements, and sell or retain any collateral held up to the net amount owed to the fund under the master netting arrangements. The swap contracts contain provisions whereby a counterparty may terminate open contracts if the fund’s net assets decline below a certain level, triggering a payment by the fund if the fund is in a net liability position at the time of the termination. The payment amount would be reduced by any collateral the fund has pledged. Any securities pledged as collateral for open contracts are noted in the Schedule of Investments. The value of collateral received or pledged is compared daily to the value of the swap contracts exposure with each counterparty, and any difference, if in excess of a specified minimum transfer amount, is adjusted and settled within two business days.
The notional amounts of swap contracts are not recorded in the Statement of Assets and Liabilities. Swaps are valued daily based on market quotations received from independent pricing services or recognized dealers and the change in value is recorded in the Statement of Assets and Liabilities as an asset (liability) and in the Statement of Operations as unrealized appreciation (depreciation) until periodic payments are made or the termination of the swap, at which time realized gain (loss) is recorded.
During the year ended August 31, 2020, the fund’s average amounts of investments in total return swaps represented less than 1% of net assets, based on the average of notional amounts at each quarter-end during the period.
4. Federal Income Taxes: The fund intends to continue to qualify as a regulated investment company and distribute all of its taxable income. The fund’s tax returns are open to examination by the relevant tax authorities until expiration of the applicable statute of limitations, which is generally three years after the filing of the tax return. Management has analyzed the fund’s tax positions taken for all open federal and state income tax years, and has concluded that no provision for income tax is required in the fund’s financial statements.
5. Distributions: Distributions to shareholders are recorded on the ex-dividend date. Distributions are determined on a tax basis at the fiscal year-end and may differ from net investment income and realized capital gains for financial reporting purposes.
6. Securities Lending: To earn additional income, the fund lends its securities to qualified institutional borrowers. Security loans are subject to termination by the fund at any time, and are required to be secured at all times by collateral in an amount at least equal to the market value of securities loaned. Daily market fluctuations could cause the value of loaned securities to be more or less than the value of the collateral received. When this occurs, the collateral is adjusted and settled before the opening of the market on the next business day. The fund further mitigates its counterparty risk by entering into securities lending transactions only with a diverse group of prequalified counterparties, monitoring their financial strength, and entering into master securities lending agreements with its counterparties. The master securities lending agreements provide that, in the event of a counterparty’s default (including bankruptcy), the fund may terminate any loans with that borrower, determine the net amount owed, and sell or retain the collateral up to the net amount owed to the fund; however, such actions may be subject to legal proceedings. While collateral mitigates counterparty risk, in the event of a default, the fund may experience delays and costs in recovering the securities loaned. The fund invests cash collateral received in Vanguard Market Liquidity Fund, and records a liability in the Statement of Assets and Liabilities for the return of the collateral, during the period the securities are on loan. Collateral investments in Vanguard Market Liquidity Fund are subject to market appreciation or depreciation. Securities lending income represents fees charged to borrowers plus income earned on invested cash collateral, less expenses associated with the loan. During the term of the loan, the fund is entitled to all distributions made on or in respect of the loaned securities.
7. Credit Facilities and Interfund Lending Program: The fund and certain other funds managed by The Vanguard Group (“Vanguard”) participate in a $4.3 billion committed credit facility provided by a syndicate of lenders pursuant to a credit agreement and an uncommitted credit facility provided by Vanguard. Both facilities may be renewed annually. Each fund is individually liable for its borrowings, if any, under the credit facilities. Borrowings may be utilized for temporary or emergency purposes, subject to the fund’s regulatory and contractual borrowing restrictions. With respect to the committed credit facility, the participating funds are charged administrative fees and an annual commitment fee of 0.10% of the undrawn committed amount of the facility; these fees are allocated to the funds based on a method approved by the fund’s board of trustees and included in Management and Administrative expenses on the fund’s Statement of Operations. Any borrowings under either facility bear interest at a rate based upon the higher of the one-month London Interbank Offered Rate (or an acceptable alternate rate, if necessary), federal funds effective rate, or overnight bank funding rate plus an agreed-upon spread, except that borrowings under the uncommitted credit facility may bear interest based upon an alternative rate agreed to by the fund and Vanguard.
Materials Index Fund
In accordance with an exemptive order (the “Order”) from the SEC, the fund may participate in a joint lending and borrowing program that allows registered open-end Vanguard funds to borrow money from and lend money to each other for temporary or emergency purposes (the “Interfund Lending Program”), subject to compliance with the terms and conditions of the Order, and to the extent permitted by the fund’s investment objective and investment policies. Interfund loans and borrowings normally extend overnight, but can have a maximum duration of seven days. Loans may be called on one business day’s notice. The interest rate to be charged is governed by the conditions of the Order and internal procedures adopted by the board of trustees. The board of trustees is responsible for overseeing the Interfund Lending Program.
For the year ended August 31, 2020, the fund did not utilize the credit facilities or the Interfund Lending Program.
8. Other: Dividend income is recorded on the ex-dividend date. Interest income includes income distributions received from Vanguard Market Liquidity Fund and is accrued daily. Security transactions are accounted for on the date securities are bought or sold. Costs used to determine realized gains (losses) on the sale of investment securities are those of the specific securities sold.
Each class of shares has equal rights as to assets and earnings, except that each class separately bears certain class-specific expenses related to maintenance of shareholder accounts (included in Management and Administrative expenses) and shareholder reporting. Marketing and distribution expenses are allocated to each class of shares based on a method approved by the board of trustees. Income, other non-class-specific expenses, and gains and losses on investments are allocated to each class of shares based on its relative net assets.
B. In accordance with the terms of a Funds’ Service Agreement (the “FSA”) between Vanguard and the fund, Vanguard furnishes to the fund investment advisory, corporate management, administrative, marketing, and distribution services at Vanguard’s cost of operations (as defined by the FSA). These costs of operations are allocated to the fund based on methods and guidelines approved by the board of trustees and are generally settled twice a month.
Upon the request of Vanguard, the fund may invest up to 0.40% of its net assets as capital in Vanguard. At August 31, 2020, the fund had contributed to Vanguard capital in the amount of $92,000, representing less than 0.01% of the fund’s net assets and 0.04% of Vanguard’s capital received pursuant to the FSA. The fund’s trustees and officers are also directors and employees, respectively, of Vanguard.
C. Various inputs may be used to determine the value of the fund’s investments and derivatives. These inputs are summarized in three broad levels for financial statement purposes. The inputs or methodologies used to value securities are not necessarily an indication of the risk associated with investing in those securities.
Level 1—Quoted prices in active markets for identical securities.
Level 2—Other significant observable inputs (including quoted prices for similar securities, interest rates, prepayment speeds, credit risk, etc.).
Level 3—Significant unobservable inputs (including the fund’s own assumptions used to determine the fair value of investments). Any investments and derivatives valued with significant unobservable inputs are noted on the Schedule of Investments.
The following table summarizes the market value of the fund’s investments and derivatives as of August 31, 2020, based on the inputs used to value them:
| | Level 1 | Level 2 | Level 3 | Total |
| | ($000) | ($000) | ($000) | ($000) |
| Investments | | | | |
| Assets | | | | |
| Common Stocks | 2,249,231 | — | — | 2,249,231 |
| Temporary Cash Investments | 4,303 | — | — | 4,303 |
| Total | 2,253,534 | — | — | 2,253,534 |
| Derivative Financial Instruments | | | | |
| Assets | | | | |
| Swap Contracts | — | 373 | — | 373 |
Materials Index Fund
D. Permanent differences between book-basis and tax-basis components of net assets are reclassified among capital accounts in the financial statements to reflect their tax character. These reclassifications have no effect on net assets or net asset value per share. As of period end, permanent differences primarily attributable to the accounting for in-kind redemptions and swap agreements were reclassified between the following accounts:
| | | Amount | |
| | | ($000 | ) |
| Paid-in Capital | | 80,716 | |
| Total Distributable Earnings (Loss) | | (80,716 | ) |
Temporary differences between book-basis and tax-basis components of total distributable earnings (loss) arise when certain items of income, gain, or loss are recognized in different periods for financial statement and tax purposes; these differences will reverse at some time in the future. The differences are primarily related to the deferral of losses from wash sales; and the recognition of unrealized gains or losses from certain derivative contracts. As of period end, the tax-basis components of total distributable earnings (loss) are detailed in the table as follows:
| | | Amount | |
| | | ($000 | ) |
| Undistributed Ordinary Income | | 8,346 | |
| Undistributed Long-Term Gains | | — | |
| Capital Loss Carryforwards | | (86,265 | ) |
| Qualified Late-Year Losses | | — | |
| Net Unrealized Gains (Losses) | | (120,608 | ) |
The tax character of distributions paid was as follows:
| | | Year Ended August 31, | |
| | | 2020 | | | 2019 | |
| | | Amount | | | Amount | |
| | | ($000 | ) | | ($000 | ) |
| Ordinary Income* | | 46,602 | | | 53,861 | |
| Long-Term Capital Gains | | — | | | — | |
| Total | | 46,602 | | | 53,861 | |
* Includes short-term capital gains, if any.
As of August 31, 2020, gross unrealized appreciation and depreciation for investments and derivatives based on cost for U.S. federal income tax purposes were as follows:
| | | Amount | |
| | | ($000 | ) |
| Tax Cost | | 2,374,142 | |
| Gross Unrealized Appreciation | | 345,808 | |
| Gross Unrealized Depreciation | | (466,416 | ) |
| Net Unrealized Appreciation (Depreciation) | | (120,608 | ) |
E. During the year ended August 31, 2020, the fund purchased $574,904,000 of investment securities and sold $900,220,000 of investment securities, other than temporary cash investments. Purchases and sales include $420,819,000 and $820,359,000, respectively, in connection with in-kind purchases and redemptions of the fund’s capital shares.
Materials Index Fund
F. Capital share transactions for each class of shares were:
| | | | | | | | | Year Ended August 31, | |
| | | | | | 2020 | | | | | | 2019 | |
| | | Amount | | | Shares | | | Amount | | | Shares | |
| | | ($000 | ) | | (000 | ) | | ($000 | ) | | (000 | ) |
| ETF Shares | | | | | | | | | | | | |
| Issued | | 449,882 | | | 3,931 | | | 662,298 | | | 5,428 | |
| Issued in Lieu of Cash Distributions | | — | | | — | | | — | | | — | |
| Redeemed | | (820,892 | ) | | (7,150 | ) | | (1,207,386 | ) | | (10,250 | ) |
| Net Increase (Decrease)—ETF Shares | | (371,010 | ) | | (3,219 | ) | | (545,088 | ) | | (4,822 | ) |
| Admiral Shares | | | | | | | | | | | | |
| Issued | | 170,584 | | | 2,794 | | | 165,502 | | | 2,647 | |
| Issued in Lieu of Cash Distributions | | 9,703 | | | 159 | | | 8,315 | | | 131 | |
| Redeemed | | (129,903 | ) | | (2,174 | ) | | (103,384 | ) | | (1,673 | ) |
| Net Increase (Decrease)—Admiral Shares | | 50,384 | | | 779 | | | 70,433 | | | 1,105 | |
G. Management has determined that no events or transactions occurred subsequent to August 31, 2020, that would require recognition or disclosure in these financial statements.
Utilities Index Fund
Performance Summary
All of the returns in this report represent past performance, which is not a guarantee of future results that may be achieved by the fund. (Current performance may be lower or higher than the performance data cited. For performance data current to the most recent month-end, visit our website at vanguard.com/performance.) Note, too, that both investment returns and principal value can fluctuate widely, so an investor’s shares, when sold, could be worth more or less than their original cost. The returns shown do not reflect taxes that a shareholder would pay on fund distributions or on the sale of fund shares.
Cumulative Performance: August 31, 2010–August 31, 2020
Initial Investment of $10,000
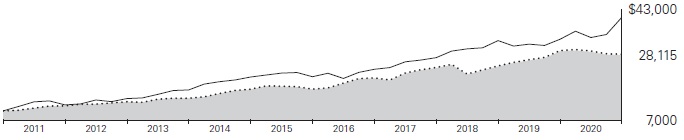
| | | | | | Average Annual Total Returns | | Final Value |
| | | | | | Periods Ended August 31, 2020 | | of a $10,000 |
| | | | One Year | | Five Years | | Ten Years | | Investment |
 | Utilities Index Fund ETF Shares Net Asset Value | | -4.08% | | 10.67% | | 10.89% | | $28,115 |
| | Utilities Index Fund ETF Shares Market Price | | -4.04 | | 10.68 | | 10.90 | | 28,136 |
 | MSCI US IMI/Utilities 25/50 | | -3.97 | | 10.75 | | 11.01 | | 28,431 |
 | MSCI US IMI/2500 | | 21.48 | | 13.88 | | 14.99 | | 40,426 |
| | | | | | | | | Final Value |
| | | | | | | | | of a $100,000 |
| | | One Year | | Five Years | | Ten Years | | Investment |
| Utilities Index Fund Admiral Shares | | -4.05% | | 10.68% | | 10.90% | | $281,368 |
| MSCI US IMI/Utilities 25/50 | | -3.97 | | 10.75 | | 11.01 | | 284,314 |
| MSCI US IMI/2500 | | 21.48 | | 13.88 | | 14.99 | | 404,265 |
Cumulative Returns: ETF Shares, August 31, 2010–August 31, 2020
| | | One Year | | Five Years | | Ten Years |
| Utilities Index Fund ETF Shares Market Price | | -4.04% | | 66.11% | | 181.36% |
| Utilities Index Fund ETF Shares Net Asset Value | | -4.08 | | 66.05 | | 181.15 |
| MSCI US IMI/Utilities 25/50 | | -3.97 | | 66.64 | | 184.31 |
For the ETF Shares, the market price is determined by the midpoint of the bid-offer spread as of the closing time of the New York Stock Exchange (generally 4 p.m., Eastern time). The net asset value is also determined as of the NYSE closing time. For more information about how the ETF Shares’ market prices have compared with their net asset value, visit vanguard.com, select your ETF, and then select the Price and Performance tab. The ETF premium/discount analysis there shows the percentages of days on which the ETF Shares’ market price was above or below the NAV.
See Financial Highlights for dividend and capital gains information.
Utilities Index Fund
Fund Allocation
As of August 31, 2020
| Electric Utilities | | 58.3 | % |
| Gas Utilities | | 4.5 | |
| Independent Power and Renewable Electricity | | 3.3 | |
| Multi-Utilities | | 29.2 | |
| Water Utilities | | 4.7 | |
The table reflects the fund’s investments, except for short-term investments and derivatives. Sector categories are based on the Global Industry Classification Standard (“GICS”), except for the “Other” category (if applicable), which includes securities that have not been provided a GICS classification as of the effective reporting period.
The fund may invest in derivatives (such as futures and swap contracts) for various reasons, including, but not limited to, attempting to remain fully invested and tracking its target index as closely as possible.
The Global Industry Classification Standard (“GICS”) was developed by and is the exclusive property and a service mark of MSCI Inc. (“MSCI”) and Standard and Poor’s, a division of McGraw-Hill Companies, Inc. (“S&P”), and is licensed for use by Vanguard. Neither MSCI, S&P nor any third party involved in making or compiling the GICS or any GICS classification makes any express or implied warranties or representations with respect to such standard or classification (or the results to be obtained by the use thereof), and all such parties hereby expressly disclaim all warranties of originality, accuracy, completeness, merchantability or fitness for a particular purpose with respect to any such standard or classification. Without limiting any of the foregoing, in no event shall MSCI, S&P, any of its affiliates or any third party involved in making or compiling the GICS or any GICS classification have any liability for any direct, indirect, special, punitive, consequential or any other damages (including lost profits) even if notified of the possibility of such damages.
Utilities Index Fund
Financial Statements
Schedule of Investments
As of August 31, 2020
The fund files its complete schedule of portfolio holdings with the Securities and Exchange Commission (SEC) for the first and third quarters of each fiscal year as an exhibit to its reports on Form N-PORT. The fund’s Form N-PORT reports are available on the SEC’s website at www.sec.gov.
| | | | Market |
| | | | Value• |
| | | Shares | ($000) |
| Common Stocks (99.7%) |
| Electric Utilities (58.1%) | | |
| | NextEra Energy Inc. | 2,784,702 | 777,405 |
| | Duke Energy Corp. | 4,180,929 | 335,896 |
| | Southern Co. | 6,007,814 | 313,488 |
| | American Electric Power Co. Inc. | 2,819,617 | 222,270 |
| | Xcel Energy Inc. | 2,987,908 | 207,585 |
| | Exelon Corp. | 5,543,801 | 204,622 |
| | Eversource Energy | 1,914,238 | 164,069 |
| | PPL Corp. | 4,373,864 | 120,850 |
| | Entergy Corp. | 1,138,796 | 112,900 |
| | Edison International | 2,150,481 | 112,857 |
| | FirstEnergy Corp. | 3,082,213 | 88,120 |
| | Alliant Energy Corp. | 1,419,613 | 76,872 |
| | Evergy Inc. | 1,289,994 | 68,654 |
| | NRG Energy Inc. | 1,388,722 | 47,786 |
| | Pinnacle West Capital Corp. | 640,035 | 46,947 |
| | OGE Energy Corp. | 1,138,861 | 36,284 |
| | IDACORP Inc. | 287,048 | 25,806 |
| | Hawaiian Electric Industries Inc. | 620,957 | 21,491 |
| | Portland General Electric Co. | 508,849 | 19,413 |
| | PNM Resources Inc. | 430,498 | 18,804 |
| | Avangrid Inc. | 351,578 | 16,890 |
| | ALLETE Inc. | 294,986 | 15,917 |
| | MGE Energy Inc. | 205,726 | 13,370 |
| | Otter Tail Corp. | 207,382 | 8,057 |
| | Spark Energy Inc. Class A | 66,416 | 610 |
| | | | 3,076,963 |
| Gas Utilities (4.5%) | | |
| | Atmos Energy Corp. | 695,884 | 69,463 |
| | UGI Corp. | 1,184,891 | 40,914 |
| | ONE Gas Inc. | 300,728 | 22,290 |
| | National Fuel Gas Co. | 466,727 | 21,301 |
| | Southwest Gas Holdings Inc. | 313,654 | 19,720 |
| | Spire Inc. | 291,333 | 16,959 |
| | New Jersey Resources Corp. | 545,233 | 16,433 |
| | South Jersey Industries Inc. | 525,960 | 11,650 |
| | Northwest Natural Holding Co. | 173,947 | 8,891 |
| | Chesapeake Utilities Corp. | 93,336 | 7,635 |
| | Star Group LP | 244,121 | 2,392 |
| | | 237,648 |
| Independent Power and Renewable Electricity Producers (3.3%) | | |
| | AES Corp. | 3,782,815 | 67,145 |
| | Vistra Corp. | 2,501,692 | 48,108 |
| ^ | NextEra Energy Partners LP | 354,125 | 21,361 |
| | Ormat Technologies Inc. | 232,216 | 14,135 |
| | Clearway Energy Inc. | 380,261 | 9,700 |
| * | Sunnova Energy International Inc. | 276,437 | 6,557 |
| | Clearway Energy Inc. Class A | 238,563 | 5,761 |
| | | | 172,767 |
| Multi-Utilities (29.1%) | | |
| | Dominion Energy Inc. | 4,774,879 | 374,541 |
| | Sempra Energy | 1,584,360 | 195,906 |
| | WEC Energy Group Inc. | 1,794,662 | 168,842 |
| | Public Service Enterprise Group Inc. | 2,876,739 | 150,281 |
| | Consolidated Edison Inc. | 1,900,868 | 135,608 |
| | DTE Energy Co. | 1,095,862 | 130,046 |
| | Ameren Corp. | 1,304,669 | 103,212 |
| | CMS Energy Corp. | 1,628,494 | 98,508 |
| | CenterPoint Energy Inc. | 2,859,862 | 57,397 |
| | NiSource Inc. | 2,177,958 | 48,264 |
| | MDU Resources Group Inc. | 1,140,855 | 26,947 |
| | Black Hills Corp. | 357,012 | 20,021 |
| | NorthWestern Corp. | 287,159 | 14,829 |
| | Avista Corp. | 382,847 | 14,112 |
| | Unitil Corp. | 84,800 | 3,579 |
| | | | 1,542,093 |
| Water Utilities (4.7%) | | |
| | American Water Works Co. Inc. | 1,029,895 | 145,565 |
| | Essential Utilities Inc. | 1,324,519 | 56,292 |
| | American States Water Co. | 209,785 | 15,960 |
| | California Water Service Group | 277,080 | 12,563 |
| | SJW Group | 146,357 | 9,152 |
| | Middlesex Water Co. | 99,323 | 6,370 |
| | York Water Co. | 73,918 | 3,371 |
| | | | 249,273 |
Total Common Stocks
(Cost $5,141,659) | | 5,278,744 |
| Temporary Cash Investments (0.0%) | |
| Money Market Fund (0.0%) | | |
| 1,2 | Vanguard Market Liquidity Fund, 0.147% (Cost $2,135) | 21,347 | 2,135 |
Total Investments (99.7%)
(Cost $5,143,794) | | 5,280,879 |
| Other Assets and Liabilities—Net (0.3%) | | 14,385 |
| Net Assets (100%) | | 5,295,264 |
Cost is in $000.
| · | See Note A in Notes to Financial Statements. |
| * | Non-income-producing security. |
| ^ | Includes partial security positions on loan to broker-dealers. The total value of securities on loan is $2,075,000. |
| 1 | Affiliated money market fund available only to Vanguard funds and certain trusts and accounts managed by Vanguard. Rate shown is the 7-day yield. |
| 2 | Collateral of $2,133,000 was received for securities on loan. |
Utilities Index Fund
| Derivative Financial Instruments Outstanding as of Period End |
Over-the-Counter Total Return Swaps
| | | | | Floating | | |
| | | | | Interest Rate | Value and | Value and |
| | | | Notional | Received | Unrealized | Unrealized |
| | Termination | | Amount | (Paid)1 | Appreciation | (Depreciation) |
| Reference Entity | Date | Counterparty | ($000) | (%) | ($000) | ($000) |
| Ameren Corp. | 2/2/21 | GSI | 8,143 | (0.161) | — | (232) |
| Sempra Energy | 9/2/21 | BOANA | 10,002 | (0.149) | — | (111) |
| | | | | | — | (343) |
| 1 | Based on 1-month USD London Interbank Offered Rate (LIBOR) as of the most recent payment date. Floating interest payment received/ paid monthly. |
BOANA—Bank of America, N.A.
GSI—Goldman Sachs International.
See accompanying Notes, which are an integral part of the Financial Statements.
Utilities Index Fund
Statement of Assets and Liabilities
As of August 31, 2020
| ($000s, except shares and per-share amounts) | Amount |
| Assets | |
| Investments in Securities, at Value | |
| Unaffiliated Issuers (Cost $5,141,659) | 5,278,744 |
| Affiliated Issuers (Cost $2,135) | 2,135 |
| Total Investment in Securities | 5,280,879 |
| Investment in Vanguard | 231 |
| Receivables for Investment Securities Sold | 11,888 |
| Receivables for Accrued Income | 25,283 |
| Receivables for Capital Shares Issued | 1,285 |
| Total Assets | 5,319,566 |
| Liabilities | |
| Due to Custodian | 5,363 |
| Payables for Investment Securities Purchased | 11,939 |
| Collateral for Securities on Loan | 2,133 |
| Payables for Capital Shares Redeemed | 4,262 |
| Payables to Vanguard | 262 |
| Unrealized Depreciation—Over-the-Counter Swap Contracts | 343 |
| Total Liabilities | 24,302 |
| Net Assets | 5,295,264 |
| At August 31, 2020, net assets consisted of: | |
| | |
| Paid-in Capital | 5,281,473 |
| Total Distributable Earnings (Loss) | 13,791 |
| Net Assets | 5,295,264 |
| | |
| ETF Shares—Net Assets | |
| Applicable to 31,032,538 outstanding $.001 par value shares of beneficial interest (unlimited authorization) | 4,013,970 |
| Net Asset Value Per Share—ETF Shares | $129.35 |
| | |
| Admiral Shares—Net Assets | |
| Applicable to 19,744,301 outstanding $.001 par value shares of beneficial interest (unlimited authorization) | 1,281,294 |
| Net Asset Value Per Share—Admiral Shares | $64.89 |
See accompanying Notes, which are an integral part of the Financial Statements.
Utilities Index Fund
Statement of Operations
| | Year Ended |
| | August 31, 2020 |
| | ($000) |
| Investment Income | |
| Income | |
| Dividends | 180,091 |
| Interest1 | 174 |
| Securities Lending—Net | 5 |
| Total Income | 180,270 |
| Expenses | |
| The Vanguard Group—Note B | |
| Investment Advisory Services | 826 |
| Management and Administrative—ETF Shares | 3,011 |
| Management and Administrative—Admiral Shares | 1,002 |
| Marketing and Distribution—ETF Shares | 255 |
| Marketing and Distribution—Admiral Shares | 94 |
| Custodian Fees | 39 |
| Auditing Fees | 32 |
| Shareholders’ Reports—ETF Shares | 224 |
| Shareholders’ Reports—Admiral Shares | 19 |
| Trustees’ Fees and Expenses | 4 |
| Total Expenses | 5,506 |
| Net Investment Income | 174,764 |
| Realized Net Gain (Loss) | |
| Investment Securities Sold1,2 | 226,800 |
| Futures Contracts | (22) |
| Swap Contracts | (400) |
| Realized Net Gain (Loss) | 226,378 |
| Change in Unrealized Appreciation (Depreciation) | |
| Investment Securities1 | (672,465) |
| Swap Contracts | (424) |
| Change in Unrealized Appreciation (Depreciation) | (672,889) |
| Net Increase (Decrease) in Net Assets Resulting from Operations | (271,747) |
| 1 | Interest income, realized net gain (loss), and change in unrealized appreciation (depreciation) from an affiliated company of the fund were $174,000, $10,000, and $1,000, respectively. Purchases and sales are for temporary cash investment purposes. |
| 2 | Includes $240,123,000 of net gain (loss) resulting from in-kind redemptions; such gain (loss) is not taxable to the fund. |
Statement of Changes in Net Assets
| | Year Ended August 31, |
| | 2020 | 2019 |
| | ($000) | ($000) |
| Increase (Decrease) in Net Assets | | |
| Operations | | |
| Net Investment Income | 174,764 | 142,287 |
| Realized Net Gain (Loss) | 226,378 | 122,862 |
| Change in Unrealized Appreciation (Depreciation) | (672,889) | 585,241 |
| Net Increase (Decrease) in Net Assets Resulting from Operations | (271,747) | 850,390 |
| Distributions1 | | |
| ETF Shares | (131,064) | (103,410) |
| Admiral Shares | (41,364) | (31,297) |
| Total Distributions | (172,428) | (134,707) |
| Capital Share Transactions | | |
| ETF Shares | 241,730 | 749,411 |
| Admiral Shares | 124,351 | 230,614 |
| Net Increase (Decrease) from Capital Share Transactions | 366,081 | 980,025 |
| Total Increase (Decrease) | (78,094) | 1,695,708 |
| Net Assets | | |
| Beginning of Period | 5,373,358 | 3,677,650 |
| End of Period | 5,295,264 | 5,373,358 |
| 1 | Certain prior-period numbers have been reclassified to conform with current period presentation. |
See accompanying Notes, which are an integral part of the Financial Statements.
Utilities Index Fund
Financial Highlights
| ETF Shares | | | | | |
| | | | | | |
| For a Share Outstanding | | | Year Ended August 31, |
| Throughout Each Period | 2020 | 2019 | 2018 | 2017 | 2016 |
| Net Asset Value, Beginning of Period | $139.09 | $119.32 | $120.75 | $107.35 | $91.41 |
| Investment Operations | | | | | |
| Net Investment Income | 4.3061 | 4.0871 | 3.7571 | 3.6971 | 3.355 |
| Net Realized and Unrealized Gain (Loss) on Investments | (9.802) | 19.562 | (1.434) | 13.374 | 15.889 |
| Total from Investment Operations | (5.496) | 23.649 | 2.323 | 17.071 | 19.244 |
| Distributions | | | | | |
| Dividends from Net Investment Income | (4.244) | (3.879) | (3.753) | (3.671) | (3.304) |
| Distributions from Realized Capital Gains | — | — | — | — | — |
| Total Distributions | (4.244) | (3.879) | (3.753) | (3.671) | (3.304) |
| Net Asset Value, End of Period | $129.35 | $139.09 | $119.32 | $120.75 | $107.35 |
| | | | | | |
| Total Return | -4.08% | 20.17% | 2.05% | 16.27% | 21.40% |
| | | | | | |
| Ratios/Supplemental Data | | | | | |
| Net Assets, End of Period (Millions) | $4,014 | $4,107 | $2,809 | $2,689 | $2,249 |
| Ratio of Total Expenses to Average Net Assets | 0.10% | 0.10% | 0.10% | 0.10% | 0.10% |
| Ratio of Net Investment Income to Average Net Assets | 3.18% | 3.22% | 3.25% | 3.33% | 3.38% |
| Portfolio Turnover Rate2 | 5% | 4% | 4% | 4% | 3% |
| 1 | Calculated based on average shares outstanding. |
| 2 | Excludes the value of portfolio securities received or delivered as a result of in-kind purchases or redemptions of the fund’s capital shares, including ETF Creation Units. |
| Admiral Shares | | | | | |
| | | | | | |
| For a Share Outstanding | | | Year Ended August 31, |
| Throughout Each Period | 2020 | 2019 | 2018 | 2017 | 2016 |
| Net Asset Value, Beginning of Period | $69.78 | $59.86 | $60.58 | $53.86 | $45.86 |
| Investment Operations | | | | | |
| Net Investment Income | 2.1631 | 2.0381 | 1.8831 | 1.8631 | 1.683 |
| Net Realized and Unrealized Gain (Loss) on Investments | (4.924) | 9.828 | (.719) | 6.698 | 7.974 |
| Total from Investment Operations | (2.761) | 11.866 | 1.164 | 8.561 | 9.657 |
| Distributions | | | | | |
| Dividends from Net Investment Income | (2.129) | (1.946) | (1.884) | (1.841) | (1.657) |
| Distributions from Realized Capital Gains | — | — | — | — | — |
| Total Distributions | (2.129) | (1.946) | (1.884) | (1.841) | (1.657) |
| Net Asset Value, End of Period | $64.89 | $69.78 | $59.86 | $60.58 | $53.86 |
| | | | | | |
| Total Return2 | -4.05% | 20.19% | 2.04% | 16.24% | 21.42% |
| | | | | | |
| Ratios/Supplemental Data | | | | | |
| Net Assets, End of Period (Millions) | $1,281 | $1,266 | $868 | $845 | $704 |
| Ratio of Total Expenses to Average Net Assets | 0.10% | 0.10% | 0.10% | 0.10% | 0.10% |
| Ratio of Net Investment Income to Average Net Assets | 3.18% | 3.22% | 3.25% | 3.33% | 3.38% |
| Portfolio Turnover Rate3 | 5% | 4% | 4% | 4% | 3% |
| 1 | Calculated based on average shares outstanding. |
| 2 | Total returns do not include account service fees that may have applied in the periods shown. Fund prospectuses provide information about any applicable account service fees. |
| 3 | Excludes the value of portfolio securities received or delivered as a result of in-kind purchases or redemptions of the fund’s capital shares, including ETF Creation Units. |
See accompanying Notes, which are an integral part of the Financial Statements.
Utilities Index Fund
Notes to Financial Statements
Vanguard Utilities Index Fund is registered under the Investment Company Act of 1940 as an open-end investment company, or mutual fund. The fund offers two classes of shares: ETF Shares and Admiral Shares. Each of the share classes has different eligibility and minimum purchase requirements, and is designed for different types of investors. ETF Shares are listed for trading on NYSE Arca; they can be purchased and sold through a broker.
Market disruptions associated with the COVID-19 pandemic have had a global impact, and uncertainty exists as to the long-term implications. Such disruptions can adversely affect assets of the fund and thus fund performance.
A. The following significant accounting policies conform to generally accepted accounting principles for U.S. investment companies. The fund consistently follows such policies in preparing its financial statements.
1. Security Valuation: Securities are valued as of the close of trading on the New York Stock Exchange (generally 4 p.m., Eastern time) on the valuation date. Equity securities are valued at the latest quoted sales prices or official closing prices taken from the primary market in which each security trades; such securities not traded on the valuation date are valued at the mean of the latest quoted bid and asked prices. Securities for which market quotations are not readily available, or whose values have been materially affected by events occurring before the fund’s pricing time but after the close of the securities’ primary markets, are valued by methods deemed by the board of trustees to represent fair value. Investments in Vanguard Market Liquidity Fund are valued at that fund’s net asset value.
2. Futures Contracts: The fund uses index futures contracts to a limited extent, with the objectives of maintaining full exposure to the stock market, maintaining liquidity, and minimizing transaction costs. The fund may purchase futures contracts to immediately invest incoming cash in the market, or sell futures in response to cash outflows, thereby simulating a fully invested position in the underlying index while maintaining a cash balance for liquidity. The primary risks associated with the use of futures contracts are imperfect correlation between changes in market values of stocks held by the fund and the prices of futures contracts, and the possibility of an illiquid market. Counterparty risk involving futures is mitigated because a regulated clearinghouse is the counterparty instead of the clearing broker. To further mitigate counterparty risk, the fund trades futures contracts on an exchange, monitors the financial strength of its clearing brokers and clearinghouse, and has entered into clearing agreements with its clearing brokers. The clearinghouse imposes initial margin requirements to secure the fund’s performance and requires daily settlement of variation margin representing changes in the market value of each contract. Any securities pledged as initial margin for open contracts are noted in the Schedule of Investments.
Futures contracts are valued at their quoted daily settlement prices. The notional amounts of the contracts are not recorded in the Statement of Assets and Liabilities. Fluctuations in the value of the contracts are recorded in the Statement of Assets and Liabilities as an asset (liability) and in the Statement of Operations as unrealized appreciation (depreciation) until the contracts are closed, when they are recorded as realized gains (losses) on futures contracts.
During the year ended August 31, 2020, the fund’s average investments in long and short futures contracts represented less than 1% and 0% of net assets, respectively, based on the average of the notional amounts at each quarter-end during the period. The fund had no open futures contracts at August 31, 2020.
3. Swap Contracts: The fund has entered into equity swap contracts to earn the total return on selected reference stocks in the fund’s target index. Under the terms of the swaps, the fund receives the total return on the referenced stock (i.e., receiving the increase or paying the decrease in value of the selected reference stock and receiving the equivalent of any dividends in respect of the selected referenced stock) over a specified period of time, applied to a notional amount that represents the value of a designated number of shares of the selected reference stock at the beginning of the equity swap contract. The fund also pays a floating rate that is based on short-term interest rates, applied to the notional amount. At the same time, the fund generally invests an amount approximating the notional amount of the swap in high-quality temporary cash investments.
A risk associated with all types of swaps is the possibility that a counterparty may default on its obligation to pay net amounts due to the fund. The fund’s maximum amount subject to counterparty risk is the unrealized appreciation on the swap contract. The fund mitigates its counterparty risk by entering into swaps only with a diverse group of prequalified counterparties, monitoring their financial strength, entering into master netting arrangements with its counterparties, and requiring its counterparties to transfer collateral as security for their performance. In the absence of a default, the collateral pledged or received by the fund cannot be repledged, resold, or rehypothecated. In the event of a counterparty’s default (including bankruptcy), the fund may terminate any swap contracts with that counterparty, determine the net amount owed by either party in accordance with its master
Utilities Index Fund
netting arrangements, and sell or retain any collateral held up to the net amount owed to the fund under the master netting arrangements. The swap contracts contain provisions whereby a counterparty may terminate open contracts if the fund’s net assets decline below a certain level, triggering a payment by the fund if the fund is in a net liability position at the time of the termination. The payment amount would be reduced by any collateral the fund has pledged. Any securities pledged as collateral for open contracts are noted in the Schedule of Investments. The value of collateral received or pledged is compared daily to the value of the swap contracts exposure with each counterparty, and any difference, if in excess of a specified minimum transfer amount, is adjusted and settled within two business days.
The notional amounts of swap contracts are not recorded in the Statement of Assets and Liabilities. Swaps are valued daily based on market quotations received from independent pricing services or recognized dealers and the change in value is recorded in the Statement of Assets and Liabilities as an asset (liability) and in the Statement of Operations as unrealized appreciation (depreciation) until periodic payments are made or the termination of the swap, at which time realized gain (loss) is recorded.
During the year ended August 31, 2020, the fund’s average amounts of investments in total return swaps represented less than 1% of net assets, based on the average of notional amounts at each quarter-end during the period.
4. Federal Income Taxes: The fund intends to continue to qualify as a regulated investment company and distribute all of its taxable income. The fund’s tax returns are open to examination by the relevant tax authorities until expiration of the applicable statute of limitations, which is generally three years after the filing of the tax return. Management has analyzed the fund’s tax positions taken for all open federal and state income tax years, and has concluded that no provision for income tax is required in the fund’s financial statements.
5. Distributions: Distributions to shareholders are recorded on the ex-dividend date. Distributions are determined on a tax basis at the fiscal year-end and may differ from net investment income and realized capital gains for financial reporting purposes.
6. Securities Lending: To earn additional income, the fund lends its securities to qualified institutional borrowers. Security loans are subject to termination by the fund at any time, and are required to be secured at all times by collateral in an amount at least equal to the market value of securities loaned. Daily market fluctuations could cause the value of loaned securities to be more or less than the value of the collateral received. When this occurs, the collateral is adjusted and settled before the opening of the market on the next business day. The fund further mitigates its counterparty risk by entering into securities lending transactions only with a diverse group of prequalified counterparties, monitoring their financial strength, and entering into master securities lending agreements with its counterparties. The master securities lending agreements provide that, in the event of a counterparty’s default (including bankruptcy), the fund may terminate any loans with that borrower, determine the net amount owed, and sell or retain the collateral up to the net amount owed to the fund; however, such actions may be subject to legal proceedings. While collateral mitigates counterparty risk, in the event of a default, the fund may experience delays and costs in recovering the securities loaned. The fund invests cash collateral received in Vanguard Market Liquidity Fund, and records a liability in the Statement of Assets and Liabilities for the return of the collateral, during the period the securities are on loan. Collateral investments in Vanguard Market Liquidity Fund are subject to market appreciation or depreciation. Securities lending income represents fees charged to borrowers plus income earned on invested cash collateral, less expenses associated with the loan. During the term of the loan, the fund is entitled to all distributions made on or in respect of the loaned securities.
7. Credit Facilities and Interfund Lending Program: The fund and certain other funds managed by The Vanguard Group (“Vanguard”) participate in a $4.3 billion committed credit facility provided by a syndicate of lenders pursuant to a credit agreement and an uncommitted credit facility provided by Vanguard. Both facilities may be renewed annually. Each fund is individually liable for its borrowings, if any, under the credit facilities. Borrowings may be utilized for temporary or emergency purposes, subject to the fund’s regulatory and contractual borrowing restrictions. With respect to the committed credit facility, the participating funds are charged administrative fees and an annual commitment fee of 0.10% of the undrawn committed amount of the facility; these fees are allocated to the funds based on a method approved by the fund’s board of trustees and included in Management and Administrative expenses on the fund’s Statement of Operations. Any borrowings under either facility bear interest at a rate based upon the higher of the one-month London Interbank Offered Rate (or an acceptable alternate rate, if necessary), federal funds effective rate, or overnight bank funding rate plus an agreed-upon spread, except that borrowings under the uncommitted credit facility may bear interest based upon an alternative rate agreed to by the fund and Vanguard.
Utilities Index Fund
In accordance with an exemptive order (the “Order”) from the SEC, the fund may participate in a joint lending and borrowing program that allows registered open-end Vanguard funds to borrow money from and lend money to each other for temporary or emergency purposes (the “Interfund Lending Program”), subject to compliance with the terms and conditions of the Order, and to the extent permitted by the fund’s investment objective and investment policies. Interfund loans and borrowings normally extend overnight, but can have a maximum duration of seven days. Loans may be called on one business day’s notice. The interest rate to be charged is governed by the conditions of the Order and internal procedures adopted by the board of trustees. The board of trustees is responsible for overseeing the Interfund Lending Program.
For the year ended August 31, 2020, the fund did not utilize the credit facilities or the Interfund Lending Program.
8. Other: Dividend income is recorded on the ex-dividend date. Interest income includes income distributions received from Vanguard Market Liquidity Fund and is accrued daily. Security transactions are accounted for on the date securities are bought or sold. Costs used to determine realized gains (losses) on the sale of investment securities are those of the specific securities sold.
Each class of shares has equal rights as to assets and earnings, except that each class separately bears certain class-specific expenses related to maintenance of shareholder accounts (included in Management and Administrative expenses) and shareholder reporting. Marketing and distribution expenses are allocated to each class of shares based on a method approved by the board of trustees. Income, other non-class-specific expenses, and gains and losses on investments are allocated to each class of shares based on its relative net assets.
B. In accordance with the terms of a Funds’ Service Agreement (the “FSA”) between Vanguard and the fund, Vanguard furnishes to the fund investment advisory, corporate management, administrative, marketing, and distribution services at Vanguard’s cost of operations (as defined by the FSA). These costs of operations are allocated to the fund based on methods and guidelines approved by the board of trustees and are generally settled twice a month.
Upon the request of Vanguard, the fund may invest up to 0.40% of its net assets as capital in Vanguard. At August 31, 2020, the fund had contributed to Vanguard capital in the amount of $231,000, representing less than 0.01% of the fund’s net assets and 0.09% of Vanguard’s capital received pursuant to the FSA. The fund’s trustees and officers are also directors and employees, respectively, of Vanguard.
C. Various inputs may be used to determine the value of the fund’s investments and derivatives. These inputs are summarized in three broad levels for financial statement purposes. The inputs or methodologies used to value securities are not necessarily an indication of the risk associated with investing in those securities.
Level 1—Quoted prices in active markets for identical securities.
Level 2—Other significant observable inputs (including quoted prices for similar securities, interest rates, prepayment speeds, credit risk, etc.).
Level 3—Significant unobservable inputs (including the fund’s own assumptions used to determine the fair value of investments). Any investments and derivatives valued with significant unobservable inputs are noted on the Schedule of Investments.
The following table summarizes the market value of the fund’s investments and derivatives as of August 31, 2020, based on the inputs used to value them:
| | Level 1 | Level 2 | Level 3 | Total |
| | ($000) | ($000) | ($000) | ($000) |
| Investments | | | | |
| Assets | | | | |
| Common Stocks | 5,278,744 | — | — | 5,278,744 |
| Temporary Cash Investments | 2,135 | — | — | 2,135 |
| Total | 5,280,879 | — | — | 5,280,879 |
| Derivative Financial Instruments | | | | |
| Liabilities | | | | |
| Swap Contracts | — | 343 | — | 343 |
Utilities Index Fund
D. Permanent differences between book-basis and tax-basis components of net assets are reclassified among capital accounts in the financial statements to reflect their tax character. These reclassifications have no effect on net assets or net asset value per share. As of period end, permanent differences primarily attributable to the accounting for in-kind redemptions and swap agreements were reclassified between the following accounts:
| | Amount |
| | ($000) |
| Paid-in Capital | 240,123 |
| Total Distributable Earnings (Loss) | (240,123) |
Temporary differences between book-basis and tax-basis components of total distributable earnings (loss) arise when certain items of income, gain, or loss are recognized in different periods for financial statement and tax purposes; these differences will reverse at some time in the future. The differences are primarily related to the deferral of losses from wash sales; and the recognition of unrealized gains or losses from certain derivative contracts. As of period end, the tax-basis components of total distributable earnings (loss) are detailed in the table as follows:
| | Amount |
| | ($000) |
| Undistributed Ordinary Income | 30,758 |
| Undistributed Long-Term Gains | — |
| Capital Loss Carryforwards | (145,656) |
| Qualified Late-Year Losses | — |
| Net Unrealized Gains (Losses) | 128,689 |
The tax character of distributions paid was as follows:
| | Year Ended August 31, |
| | 2020 | 2019 |
| | Amount | Amount |
| | ($000) | ($000) |
| Ordinary Income * | 172,428 | 134,707 |
| Long-Term Capital Gains | — | — |
| Total | 172,428 | 134,707 |
* Includes short-term capital gains, if any.
As of August 31, 2020, gross unrealized appreciation and depreciation for investments and derivatives based on cost for U.S. federal income tax purposes were as follows:
| | Amount |
| | ($000) |
| Tax Cost | 5,152,190 |
| Gross Unrealized Appreciation | 566,448 |
| Gross Unrealized Depreciation | (437,759) |
| Net Unrealized Appreciation (Depreciation) | 128,689 |
E. During the year ended August 31, 2020, the fund purchased $1,669,874,000 of investment securities and sold $1,312,767,000 of investment securities, other than temporary cash investments. Purchases and sales include $1,130,723,000 and $1,024,963,000, respectively, in connection with in-kind purchases and redemptions of the fund’s capital shares.
Utilities Index Fund
F. Capital share transactions for each class of shares were:
| | | | | Year Ended August 31, |
| | | 2020 | | | 2019 |
| | Amount | Shares | | Amount | Shares |
| | ($000) | (000 | ) | ($000) | (000) |
| ETF Shares | | | | | |
| Issued | 1,271,911 | 9,330 | | 1,761,117 | 13,983 |
| Issued in Lieu of Cash Distributions | — | — | | — | — |
| Redeemed | (1,030,181) | (7,825 | ) | (1,011,706) | (8,000) |
| Net Increase (Decrease)—ETF Shares | 241,730 | 1,505 | | 749,411 | 5,983 |
| Admiral Shares | | | | | |
| Issued | 569,278 | 8,372 | | 452,254 | 7,138 |
| Issued in Lieu of Cash Distributions | 33,444 | 493 | | 25,301 | 397 |
| Redeemed | (478,371) | (7,268 | ) | (246,941) | (3,895) |
| Net Increase (Decrease)—Admiral Shares | 124,351 | 1,597 | | 230,614 | 3,640 |
G. Management has determined that no events or transactions occurred subsequent to August 31, 2020, that would require recognition or disclosure in these financial statements.
Report of Independent Registered Public Accounting Firm
To the Board of Trustees of Vanguard World Fund and Shareholders of Vanguard Communication Services Index Fund, Vanguard Consumer Discretionary Index Fund, Vanguard Consumer Staples Index Fund, Vanguard Energy Index Fund, Vanguard Financials Index Fund, Vanguard Health Care Index Fund, Vanguard Industrials Index Fund, Vanguard Information Technology Index Fund, Vanguard Materials Index Fund and Vanguard Utilities Index Fund
Opinions on the Financial Statements
We have audited the accompanying statements of assets and liabilities, including the schedules of investments, of Vanguard Communication Services Index Fund, Vanguard Consumer Discretionary Index Fund, Vanguard Consumer Staples Index Fund, Vanguard Energy Index Fund, Vanguard Financials Index Fund, Vanguard Health Care Index Fund, Vanguard Industrials Index Fund, Vanguard Information Technology Index Fund, Vanguard Materials Index Fund and Vanguard Utilities Index Fund (ten of the funds constituting Vanguard World Fund, hereafter collectively referred to as the “Funds”) as of August 31, 2020, the related statements of operations for the year ended August 31, 2020, the statements of changes in net assets for each of the two years in the period ended August 31, 2020, including the related notes, and the financial highlights for each of the five years in the period ended August 31, 2020 (collectively referred to as the “financial statements”). In our opinion, the financial statements present fairly, in all material respects, the financial position of each of the Funds as of August 31, 2020, the results of each of their operations for the year then ended, the changes in each of their net assets for each of the two years in the period ended August 31, 2020 and each of the financial highlights for each of the five years in the period ended August 31, 2020 in conformity with accounting principles generally accepted in the United States of America.
Basis for Opinions
These financial statements are the responsibility of the Funds’ management. Our responsibility is to express an opinion on the Funds’ financial statements based on our audits. We are a public accounting firm registered with the Public Company Accounting Oversight Board (United States) (“PCAOB”) and are required to be independent with respect to the Funds in accordance with the U.S. federal securities laws and the applicable rules and regulations of the Securities and Exchange Commission and the PCAOB.
We conducted our audits of these financial statements in accordance with the standards of the PCAOB. Those standards require that we plan and perform the audit to obtain reasonable assurance about whether the financial statements are free of material misstatement, whether due to error or fraud.
Our audits included performing procedures to assess the risks of material misstatement of the financial statements, whether due to error or fraud, and performing procedures that respond to those risks. Such procedures included examining, on a test basis, evidence regarding the amounts and disclosures in the financial statements. Our audits also included evaluating the accounting principles used and significant estimates made by management, as well as evaluating the overall presentation of the financial statements. Our procedures included confirmation of securities owned as of August 31, 2020 by correspondence with the custodian and brokers and by agreement to the underlying ownership records of the transfer agent; when replies were not received from brokers, we performed other auditing procedures. We believe that our audits provide a reasonable basis for our opinions.
/s/PricewaterhouseCoopers LLP
Philadelphia, Pennsylvania
October 15, 2020
We have served as the auditor of one or more investment companies in The Vanguard Group of Funds since 1975.
Special 2020 tax information (unaudited) for Vanguard U.S. Sector Index Funds
This information for the fiscal year ended August 31, 2020, is included pursuant to provisions of the Internal Revenue Code.
The funds distributed qualified dividend income to shareholders during the fiscal year as follows:
| Fund | ($000) |
| Communication Services Index Fund | 23,046 |
| Consumer Discretionary Index Fund | 29,851 |
| Consumer Staples Index Fund | 158,853 |
| Energy Index Fund | 143,456 |
| Financials Index Fund | 184,799 |
| Health Care Index Fund | 156,341 |
| Industrials Index Fund | 61,970 |
| Information Technology Index Fund | 356,662 |
| Materials Index Fund | 46,602 |
| Utilities Index Fund | 172,428 |
For corporate shareholders, the percentage of investment income (dividend income plus short-term gains, if any) that qualifies for the dividends-received deduction is as follows:
| Fund | Percentage |
| Communication Services Index Fund | 100.0% |
| Consumer Discretionary Index Fund | 34.8 |
| Consumer Staples Index Fund | 99.4 |
| Energy Index Fund | 100.0 |
| Financials Index Fund | 94.1 |
| Health Care Index Fund | 97.2 |
| Industrials Index Fund | 97.0 |
| Information Technology Index Fund | 100.0 |
| Materials Index Fund | 81.5 |
| Utilities Index Fund | 100.0 |
The funds distributed qualified business income to shareholders during the fiscal year as follows:
| Fund | ($000) |
| Communication Services Index Fund | — |
| Consumer Discretionary Index Fund | — |
| Consumer Staples Index Fund | — |
| Energy Index Fund | — |
| Financials Index Fund | 3,094 |
| Health Care Index Fund | — |
| Industrials Index Fund | — |
| Information Technology Index Fund | — |
| Materials Index Fund | — |
| Utilities Index Fund | — |
Trustees Approve Advisory Arrangements
The board of trustees of Vanguard Communication Services Index Fund, Vanguard Consumer Discretionary Index Fund, Vanguard Consumer Staples Index Fund, Vanguard Energy Index Fund, Vanguard Financials Index Fund, Vanguard Health Care Index Fund, Vanguard Industrials Index Fund, Vanguard Information Technology Index Fund, Vanguard Materials Index Fund, and Vanguard Utilities Index Fund has renewed each fund’s investment advisory arrangement with The Vanguard Group, Inc. (Vanguard), through its Equity Index Group. The board determined that continuing each fund’s internalized management structure was in the best interests of the fund and its shareholders.
The board based its decision upon an evaluation of the advisor’s investment staff, portfolio management process, and performance. This evaluation included information provided to the board by Vanguard’s Portfolio Review Department, which is responsible for fund and advisor oversight and product management. The Portfolio Review Department met regularly with the advisor and made monthly presentations to the board during the fiscal year that directed the board’s focus to relevant information and topics.
The board, or an investment committee made up of board members, also received information throughout the year through advisor presentations. For each advisor presentation, the board was provided with letters and reports that included information about, among other things, the advisory firm and the advisor’s assessment of the investment environment, portfolio performance, and portfolio characteristics.
In addition, the board received monthly reports, which included a Market and Economic Report, a Fund Dashboard Monthly Summary, and a Fund Performance Report.
Prior to their meeting, the trustees were provided with a memo and materials that summarized the information they received over the course of the year. They also considered the factors discussed below, among others. However, no single factor determined whether the board approved the arrangements. Rather, it was the totality of the circumstances that drove the board’s decision.
Nature, extent, and quality of services
The board reviewed the quality of each fund’s investment management services over both the short and long term and took into account the organizational depth and stability of the advisor. The board considered that Vanguard has been managing investments for more than four decades. The Equity Index Group adheres to a sound, disciplined investment management process; the team has considerable experience, stability, and depth.
The board concluded that Vanguard’s experience, stability, depth, and performance, among other factors, warranted continuation of each advisory arrangement.
Investment performance
The board considered the short- and long-term performance of each fund, including any periods of outperformance or underperformance compared with its target index and peer group. The board concluded that the performance was such that each advisory arrangement should continue.
Cost
The board concluded that each fund’s expense ratio was well below the average expense ratio charged by funds in its peer group and that each fund’s advisory expenses were also well below the peer-group average.
The board does not conduct a profitability analysis of Vanguard because of Vanguard’s unique structure. Unlike most other mutual fund management companies, Vanguard is owned by the funds it oversees.
The benefit of economies of scale
The board concluded that each fund’s arrangement with Vanguard ensures that the funds will realize economies of scale as they grow, with the cost to shareholders declining as fund assets increase.
The board will consider whether to renew the advisory arrangements again after a one-year period.
Liquidity Risk Management
Vanguard funds (except for the money market funds) have adopted and implemented a written liquidity risk management program (the “Program”) as required by Rule 22e-4 under the Investment Company Act of 1940. Rule 22e-4 requires that each fund adopt a program that is reasonably designed to assess and manage the fund’s liquidity risk, which is the risk that the fund could not meet redemption requests without significant dilution of remaining investors’ interests in the fund.
Assessment and management of a fund’s liquidity risk under the Program take into consideration certain factors, such as the fund’s investment strategy and the liquidity of its portfolio investments during normal and reasonably foreseeable stressed conditions, its short- and long-term cash-flow projections during both normal and reasonably foreseeable stressed conditions, and its cash and cash-equivalent holdings and access to other funding sources. As required by the rule, the Program includes policies and procedures for classification of fund portfolio holdings in four liquidity categories, maintaining certain levels of highly liquid investments, and limiting holdings of illiquid investments.
The board of trustees of Vanguard World Fund approved the appointment of liquidity risk management program administrators responsible for administering the Program for Vanguard Communication Services Index Fund, Vanguard Consumer Discretionary Index Fund, Vanguard Consumer Staples Index Fund, Vanguard Energy Index Fund, Vanguard Financials Index Fund, Vanguard Health Care Index Fund, Vanguard Industrials Index Fund, Vanguard Information Technology Index Fund, Vanguard Materials Index Fund, and Vanguard Utilities Index Fund, and for carrying out the specific responsibilities set forth in the Program, including reporting to the board on at least an annual basis regarding the Program’s operation, its adequacy, and the effectiveness of its implementation for the past year (the “Program Administrator Report”). The board has reviewed the Program Administrator Report covering the period from December 1, 2018, through December 31, 2019 (the “Review Period”). The Program Administrator Report stated that during the Review Period the Program operated and was implemented effectively to manage the funds’ liquidity risk.
THESE FUNDS ARE NOT SPONSORED, ENDORSED, SOLD OR PROMOTED BY MSCI INC. (“MSCI”), ANY OF ITS AFFILIATES, ANY OF ITS DIRECT OR INDIRECT INFORMATION PROVIDERS OR ANY OTHER THIRD PARTY INVOLVED IN, OR RELATED TO, COMPILING, COMPUTING OR CREATING ANY MSCI INDEX (COLLECTIVELY, THE “MSCI PARTIES”). THE MSCI INDEXES ARE THE EXCLUSIVE PROPERTY OF MSCI. MSCI AND THE MSCI INDEX NAMES ARE SERVICE MARK(S) OF MSCI OR ITS AFFILIATES AND HAVE BEEN LICENSED FOR USE FOR CERTAIN PURPOSES BY VANGUARD. NONE OF THE MSCI PARTIES MAKES ANY REPRESENTATION OR WARRANTY, EXPRESS OR IMPLIED, TO THE OWNERS OF THESE FUNDS OR ANY MEMBER OF THE PUBLIC REGARDING THE ADVISABILITY OF INVESTING IN FUNDS GENERALLY OR IN THESE FUNDS PARTICULARLY OR THE ABILITY OF ANY MSCI INDEX TO TRACK CORRESPONDING STOCK MARKET PERFORMANCE. MSCI OR ITS AFFILIATES ARE THE LICENSORS OF CERTAIN TRADEMARKS, SERVICE MARKS AND TRADE NAMES AND OF THE MSCI INDEXES WHICH ARE DETERMINED, COMPOSED AND CALCULATED BY MSCI WITHOUT REGARD TO THESE FUNDS OR THE ISSUER OR OWNER OF THESE FUNDS. NONE OF THE MSCI PARTIES HAS ANY OBLIGATION TO TAKE THE NEEDS OF THE ISSUERS OR OWNERS OF THESE FUNDS INTO CONSIDERATION IN DETERMINING, COMPOSING OR CALCULATING THE MSCI INDEXES. NONE OF THE MSCI PARTIES IS RESPONSIBLE FOR OR HAS PARTICIPATED IN THE DETERMINATION OF THE TIMING OF, PRICES AT, OR QUANTITIES OF THESE FUNDS TO BE ISSUED OR IN THE DETERMINATION OR CALCULATION OF THE CONSIDERATION INTO WHICH THESE FUNDS ARE REDEEMABLE. NONE OF THE MSCI PARTIES HAS ANY OBLIGATION OR LIABILITY TO THE OWNERS OF THESE FUNDS IN CONNECTION WITH THE ADMINISTRATION, MARKETING OR OFFERING OF THESE FUNDS.
ALTHOUGH MSCI SHALL OBTAIN INFORMATION FOR INCLUSION IN OR FOR USE IN THE CALCULATION OF THE MSCI INDEXES FROM SOURCES WHICH MSCI CONSIDERS RELIABLE, NONE OF THE MSCI PARTIES WARRANTS OR GUARANTEES THE ORIGINALITY, ACCURACY AND/OR THE COMPLETENESS OF ANY MSCI INDEX OR ANY DATA INCLUDED THEREIN. NONE OF THE MSCI PARTIES MAKES ANY WARRANTY, EXPRESS OR IMPLIED, AS TO RESULTS TO BE OBTAINED BY LICENSEE, LICENSEE’S CUSTOMERS OR COUNTERPARTIES, ISSUERS OF THE FUNDS, OWNERS OF THE FUNDS, OR ANY OTHER PERSON OR ENTITY, FROM THE USE OF ANY MSCI INDEX OR ANY DATA INCLUDED THEREIN IN CONNECTION WITH THE RIGHTS LICENSED HEREUNDER OR FOR ANY OTHER USE. NONE OF THE MSCI PARTIES SHALL HAVE ANY LIABILITY FOR ANY ERRORS, OMISSIONS OR INTERRUPTIONS OF OR IN CONNECTION WITH ANY MSCI INDEX OR ANY DATA INCLUDED THEREIN. FURTHER, NONE OF THE MSCI PARTIES MAKES ANY EXPRESS OR IMPLIED WARRANTIES OF ANY KIND, AND THE MSCI PARTIES HEREBY EXPRESSLY DISCLAIM ALL WARRANTIES OF MERCHANTABILITY OR FITNESS FOR A PARTICULAR PURPOSE, WITH RESPECT TO ANY MSCI INDEX AND ANY DATA INCLUDED THEREIN. WITHOUT LIMITING ANY OF THE FOREGOING, IN NO EVENT SHALL ANY OF THE MSCI PARTIES HAVE ANY LIABILITY FOR ANY DIRECT, INDIRECT, SPECIAL, PUNITIVE, CONSEQUENTIAL OR ANY OTHER DAMAGES (INCLUDING WITHOUT LIMITATION LOST PROFITS) EVEN IF NOTIFIED OF THE POSSIBILITY OF SUCH DAMAGES.
This page intentionally left blank.
This page intentionally left blank.
The People Who Govern Your Fund
The trustees of your mutual fund are there to see that the fund is operated and managed in your best interests since, as a shareholder, you are a part owner of the fund. Your fund’s trustees also serve on the board of directors of The Vanguard Group, Inc., which is owned by the Vanguard funds and provides services to them.
A majority of Vanguard’s board members are independent, meaning that they have no affiliation with Vanguard or the funds they oversee, apart from the sizable personal investments they have made as private individuals. The independent board members have distinguished backgrounds in business, academia, and public service. Each of the trustees and executive officers oversees 212 Vanguard funds.
Information for each trustee and executive officer of the fund appears below. That information, as well as the Vanguard fund count, is as of the date on the cover of this fund report. The mailing address of the trustees and officers is P.O. Box 876, Valley Forge, PA 19482. More information about the trustees is in the Statement of Additional Information, which can be obtained, without charge, by contacting Vanguard at 800-662-7447, or online at vanguard.com.
Interested Trustee1
Mortimer J. Buckley
Born in 1969. Trustee since January 2018. Principal occupation(s) during the past five years and other experience: chairman of the board (2019–present) of Vanguard and of each of the investment companies served by Vanguard; chief executive officer (2018– present) of Vanguard; chief executive officer, president, and trustee (2018–present) of each of the investment companies served by Vanguard; president and director (2017–present) of Vanguard; and president (2018–present) of Vanguard Marketing Corporation. Chief investment officer (2013–2017), managing director (2002–2017), head of the Retail Investor Group (2006–2012), and chief information officer (2001–2006) of Vanguard. Chairman of the board (2011–2017) and trustee (2009–2017) of the Children’s Hospital of Philadelphia; and trustee (2018–present) and vice chair (2019–present) of The Shipley School.
Independent Trustees
Emerson U. Fullwood
Born in 1948. Trustee since January 2008. Principal occupation(s) during the past five years and other experience: executive chief staff and marketing officer for North America and corporate vice president (retired 2008) of Xerox Corporation (document management products and services). Former president of the Worldwide Channels Group, Latin America, and Worldwide Customer Service and executive chief staff officer of Developing Markets of Xerox. Executive in residence and 2009–2010 Distinguished Minett Professor at the Rochester Institute of Technology. Director of SPX FLOW, Inc. (multi-industry manufacturing). Director of the University of Rochester Medical Center, the Monroe Community College Foundation, the United Way of Rochester, North Carolina A&T University, and Roberts Wesleyan College. Trustee of the University of Rochester.
Amy Gutmann
Born in 1949. Trustee since June 2006. Principal occupation(s) during the past five years and other experience: president (2004–present) of the University of Pennsylvania. Christopher H. Browne Distinguished Professor of Political Science, School of Arts and Sciences, and professor of communication, Annenberg School for Communication, with secondary faculty appointments in the Department of Philosophy, School of Arts and Sciences, and at the Graduate School of Education, University of Pennsylvania.
F. Joseph Loughrey
Born in 1949. Trustee since October 2009. Principal occupation(s) during the past five years and other experience: president and chief operating officer (retired 2009) and vice chairman of the board (2008–2009) of Cummins Inc. (industrial machinery). Chairman of the board of Hillenbrand, Inc. (specialized consumer services) and the Lumina Foundation. Director of the V Foundation. Member of the advisory council for the College of Arts and Letters and chair of the advisory board to the Kellogg Institute for International Studies, both at the University of Notre Dame.
Mark Loughridge
Born in 1953. Trustee since March 2012. Principal occupation(s) during the past five years and other experience: senior vice president and chief financial officer (retired 2013) of IBM (information technology services). Fiduciary member of IBM’s Retirement Plan Committee (2004–2013), senior vice president and general manager (2002–2004) of IBM Global Financing, vice president and controller (1998–2002) of IBM, and a variety of other prior management roles at IBM. Member of the Council on Chicago Booth.
Scott C. Malpass
Born in 1962. Trustee since March 2012. Principal occupation(s) during the past five years and other experience: chief investment officer (retired June 2020) and vice president (retired June 2020) of the University of Notre Dame. Assistant professor of finance at the Mendoza College of Business, University of Notre Dame, and member of the Notre Dame 403(b) Investment Committee (retired June 2020). Member of the board of Catholic Investment Services, Inc. (investment advisors) and the board of superintendence of the Institute for the Works of Religion.
Deanna Mulligan
Born in 1963. Trustee since January 2018. Principal occupation(s) during the past five years and other experience: chief executive officer (2011–present) of The Guardian Life Insurance Company of America. President (2010–2019), chief operating officer (2010–2011), and executive vice president (2008–2010) of Individual Life and Disability of The Guardian Life Insurance Company of America. Member of the board of The Guardian Life Insurance Company of America, the American Council of Life Insurers, and the Economic Club of New York. Trustee of the Partnership for New York City (business leadership), Chief Executives for Corporate Purpose, NewYork- Presbyterian Hospital, Catalyst, and the Bruce Museum (arts and science). Member of the Advisory Council for the Stanford Graduate School of Business.
André F. Perold
Born in 1952. Trustee since December 2004. Principal occupation(s) during the past five years and other experience: George Gund Professor of Finance and Banking, Emeritus at the Harvard Business School (retired 2011). Chief investment officer and co-managing partner of HighVista Strategies (private investment firm). Member of the board of advisors and member of the investment committee of the Museum of Fine Arts Boston. Member of the board (2018–present) of RIT Capital Partners (investment firm). Member of the investment committee of Partners Health Care System.
Sarah Bloom Raskin
Born in 1961. Trustee since January 2018. Principal occupation(s) during the past five years and other experience: deputy secretary (2014–2017) of the United States Department of the Treasury. Governor (2010–2014) of the Federal Reserve Board. Commissioner (2007–2010) of financial regulation for the State of Maryland. Member of the board of directors (2012–2014) of Neighborhood Reinvestment Corporation. Director (2017–present) of i(x) Investments, LLC; director (2017–present) of Reserve Trust. Rubenstein Fellow (2017–present) of Duke University; trustee (2017–present) of Amherst College, and trustee (2019–present) of the Folger Shakespeare Library.
Peter F. Volanakis
Born in 1955. Trustee since July 2009. Principal occupation(s) during the past five years and other experience: president and chief operating officer (retired 2010) of Corning Incorporated (communications equipment) and director of Corning Incorporated (2000–2010) and Dow Corning (2001–2010). Director (2012) of SPX Corporation (multi-industry
| 1 | Mr. Buckley is considered an “interested person,” as defined in the Investment Company Act of 1940, because he is an officer of the Vanguard funds. |
manufacturing). Overseer of the Amos Tuck School of Business Administration, Dartmouth College (2001–2013). Chairman of the board of trustees of Colby-Sawyer College. Member of the board of Hypertherm Inc. (industrial cutting systems, software, and consumables).
Executive Officers
John Bendl
Born in 1970. Principal occupation(s) during the past five years and other experience: principal of Vanguard. Chief financial officer (2019–present) of each of the investment companies served by Vanguard. Chief accounting officer, treasurer, and controller of Vanguard (2017–present). Partner (2003–2016) at KPMG (audit, tax, and advisory services).
Glenn Booraem
Born in 1967. Principal occupation(s) during the past five years and other experience: principal of Vanguard. Investment stewardship officer (2017–present), treasurer (2015–2017), controller (2010–2015), and assistant controller (2001–2010) of each of the investment companies served by Vanguard.
Christine M. Buchanan
Born in 1970. Principal occupation(s) during the past five years and other experience: principal of Vanguard. Treasurer (2017–present) of each of the investment companies served by Vanguard. Partner (2005–2017) at KPMG (audit, tax, and advisory services).
David Cermak
Born in 1960. Principal occupation(s) during the past five years and other experience: principal of Vanguard. Finance director (2019–present) of each of the investment companies served by Vanguard. Managing director and head (2017–present) of Vanguard Investments Singapore. Managing director and head (2017–2019) of Vanguard Investments Hong Kong. Representative director and head (2014–2017) of Vanguard Investments Japan.
Thomas J. Higgins
Born in 1957. Principal occupation(s) during the past five years and other experience: principal of Vanguard. Finance director (2019–present), chief financial officer (2008–2019), and treasurer (1998–2008) of each of the investment companies served by Vanguard.
Peter Mahoney
Born in 1974. Principal occupation(s) during the past five years and other experience: principal of Vanguard. Controller (2015–present) of each of the investment companies served by Vanguard. Head of International Fund Services (2008–2014) at Vanguard.
Anne E. Robinson
Born in 1970. Principal occupation(s) during the past five years and other experience: general counsel (2016–present) of Vanguard. Secretary (2016–present) of Vanguard and of each of the investment companies served by Vanguard. Managing director (2016–present) of Vanguard. Managing director and general counsel of Global Cards and Consumer Services (2014–2016) at Citigroup. Counsel (2003–2014) at American Express.
Michael Rollings
Born in 1963. Principal occupation(s) during the past five years and other experience: finance director (2017–present) and treasurer (2017) of each of the investment companies served by Vanguard. Managing director (2016–present) of Vanguard. Chief financial officer (2016–present) of Vanguard. Director (2016–present) of Vanguard Marketing Corporation. Executive vice president and chief financial officer (2006-2016) of MassMutual Financial Group.
John E. Schadl
Born in 1972. Principal occupation(s) during the past five years and other experience: principal of Vanguard. Chief compliance officer (2019–present) of Vanguard and of each of the investment companies served by Vanguard. Assistant vice president (2019–present) of Vanguard Marketing Corporation.
Vanguard Senior Management Team
| Joseph Brennan | Chris D. McIsaac |
| Mortimer J. Buckley | James M. Norris |
| Gregory Davis | Thomas M. Rampulla |
| John James | Karin A. Risi |
| Martha G. King | Anne E. Robinson |
| John T. Marcante | Michael Rollings |

Connect with Vanguard® > vanguard.com
Fund Information > 800-662-7447
Direct Investor Account Services > 800-662-2739
Institutional Investor Services > 800-523-1036
Text Telephone for People
Who Are Deaf or Hard of Hearing > 800-749-7273
This material may be used in conjunction with the offering of shares of any Vanguard fund only if preceded or accompanied by the fund’s current prospectus.
All comparative mutual fund data are from Morningstar, Inc., unless otherwise noted.
You can obtain a free copy of Vanguard’s proxy voting guidelines by visiting vanguard.com/proxyreporting or by calling Vanguard at 800-662-2739. The guidelines are also available from the SEC’s website, www.sec.gov. In addition, you may obtain a free report on how your fund voted the proxies for securities it owned during the 12 months ended June 30. To get the report, visit either vanguard.com/proxyreporting or www.sec.gov.
You can review information about your fund on the SEC’s website, and you can receive copies of this information, for a fee, by sending a request via email addressed to publicinfo@sec.gov.
Source for Bloomberg Barclays indexes: Bloomberg Index Services Limited. Copyright 2020, Bloomberg. All rights reserved.
© 2020 The Vanguard Group, Inc.
All rights reserved.
U.S. Patent Nos. 6,879,964; 7,337,138; 7,720,749;
7,925,573; 8,090,646; 8,417,623; and 8,626,636.
Vanguard Marketing Corporation, Distributor.
Q4830 102020

| | |
| | |
| | |
| | |
| Annual Report | August 31, 2020 | |
| | |
| | |
| Vanguard Extended Duration Treasury Index Fund |
| | |
| | |
| | |
| | |
| | |
| | |
| | |
| | |
| | |
| | |
| | |
| | |
| | |
| | |
| | |
| | |
| | |
| | |
| | |
| | |
| | |
| | |
| | |
| | |
| | |
| | |
| | |
| | |
| | |
| | |
| | |
| | |
| | |
| See the inside front cover for important information about access to your fund’s annual and semiannual shareholder reports. |
| | |
| | |
Important information about access to shareholder reports
Beginning on January 1, 2021, as permitted by regulations adopted by the Securities and Exchange Commission, paper copies of your fund’s annual and semiannual shareholder reports will no longer be sent to you by mail, unless you specifically request them. Instead, you will be notified by mail each time a report is posted on the website and will be provided with a link to access the report.
If you have already elected to receive shareholder reports electronically, you will not be affected by this change and do not need to take any action. You may elect to receive shareholder reports and other communications from the fund electronically by contacting your financial intermediary (such as a broker-dealer or bank) or, if you invest directly with the fund, by calling Vanguard at one of the phone numbers on the back cover of this report or by logging on to vanguard.com.
You may elect to receive paper copies of all future shareholder reports free of charge. If you invest through a financial intermediary, you can contact the intermediary to request that you continue to receive paper copies. If you invest directly with the fund, you can call Vanguard at one of the phone numbers on the back cover of this report or log on to vanguard.com. Your election to receive paper copies will apply to all the funds you hold through an intermediary or directly with Vanguard.
| Contents | |
| | |
| | |
| Your Fund’s Performance at a Glance | 1 |
| | |
| About Your Fund’s Expenses | 2 |
| | |
| Performance Summary | 4 |
| | |
| Financial Statements | 7 |
| | |
| Trustees Approve Advisory Arrangement | 23 |
| | |
| Liquidity Risk Management | 25 |
Please note: The opinions expressed in this report are just that—informed opinions. They should not be considered promises or advice. Also, please keep in mind that the information and opinions cover the period through the date on the front of this report. Of course, the risks of investing in your fund are spelled out in the prospectus.
Your Fund’s Performance at a Glance
· Vanguard Extended Duration Treasury Index Fund returned about 15% for Institutional, Institutional Plus, and ETF Shares for the 12 months ended August 31, 2020, less than the fund’s benchmark index, which returned more than 16%.
· Bond yields fell and prices rose amid unprecedented actions from policymakers and the far dimmer outlook for economic activity following the pandemic.
· The yield of the 30-year U.S. Treasury bond dropped from 1.96% to 1.47%. Inflation remained low. Long-term Treasuries outperformed their short-term counterparts and long-term corporates.
· Because the fund invests in zero-coupon U.S. Treasuries with maturities ranging from 20 to 30 years, and the prices of such securities are very sensitive to interest rate changes, its interest rate risk is extremely high. As a result, the fund may exhibit substantial short-term volatility and is best used by long-term investors.
| Market Barometer | | | |
| | | Average Annual Total Returns |
| | | Periods Ended August 31, 2020 |
| | One Year | Three Years | Five Years |
| Stocks | | | |
| Russell 1000 Index (Large-caps) | 22.50% | 14.58% | 14.31% |
| Russell 2000 Index (Small-caps) | 6.02 | 5.03 | 7.65 |
| Russell 3000 Index (Broad U.S. market) | 21.44 | 13.95 | 13.86 |
| FTSE All-World ex US Index (International) | 8.78 | 2.92 | 6.00 |
| | | | |
| Bonds | | | |
| Bloomberg Barclays U.S. Aggregate Bond Index (Broad taxable market) | 6.47% | 5.09% | 4.33% |
| Bloomberg Barclays Municipal Bond Index (Broad tax-exempt market) | 3.24 | 4.09 | 3.99 |
| FTSE Three-Month U.S. Treasury Bill Index | 1.18 | 1.67 | 1.15 |
| | | | |
| CPI | | | |
| Consumer Price Index | 1.31% | 1.92% | 1.75% |
Fund returns are adjusted to reflect the 0.50% fee on purchases of fund shares. The fee does not apply to the ETF Shares.
About Your Fund’s Expenses
As a shareholder of the fund, you incur ongoing costs, which include costs for portfolio management, administrative services, and shareholder reports (like this one), among others. Operating expenses, which are deducted from a fund’s gross income, directly reduce the investment return of the fund.
A fund’s expenses are expressed as a percentage of its average net assets. This figure is known as the expense ratio. The following examples are intended to help you understand the ongoing costs (in dollars) of investing in your fund and to compare these costs with those of other mutual funds. The examples are based on an investment of $1,000 made at the beginning of the period shown and held for the entire period.
The accompanying table illustrates your fund’s costs in two ways:
· Based on actual fund return. This section helps you to estimate the actual expenses that you paid over the period. The “Ending Account Value” shown is derived from the fund’s actual return, and the third column shows the dollar amount that would have been paid by an investor who started with $1,000 in the fund. You may use the information here, together with the amount you invested, to estimate the expenses that you paid over the period.
To do so, simply divide your account value by $1,000 (for example, an $8,600 account value divided by $1,000 = 8.6), then multiply the result by the number given for your fund under the heading “Expenses Paid During Period.”
· Based on hypothetical 5% yearly return. This section is intended to help you compare your fund’s costs with those of other mutual funds. It assumes that the fund had a yearly return of 5% before expenses, but that the expense ratio is unchanged. In this case—because the return used is not the fund’s actual return—the results do not apply to your investment. The example is useful in making comparisons because the Securities and Exchange Commission requires all mutual funds to calculate expenses based on a 5% return. You can assess your fund’s costs by comparing this hypothetical example with the hypothetical examples that appear in shareholder reports of other funds.
Note that the expenses shown in the table are meant to highlight and help you compare ongoing costs only and do not reflect transaction costs incurred by the fund for buying and selling securities. Further, the expenses do not include any purchase, redemption, or account service fees described in the fund prospectus. If such fees were applied to your account, your costs would be higher. Your fund does not carry a “sales load.”
The calculations assume no shares were bought or sold during the period. Your actual costs may have been higher or lower, depending on the amount of your investment and the timing of any purchases or redemptions.
You can find more information about the fund’s expenses, including annual expense ratios, in the Financial Statements section of this report. For additional information on operating expenses and other shareholder costs, please refer to your fund’s current prospectus.
| Six Months Ended August 31, 2020 | | | |
| | Beginning | Ending | Expenses |
| | Account Value | Account Value | Paid During |
| Extended Duration Treasury Index Fund | 2/29/2020 | 8/31/2020 | Period |
| Based on Actual Fund Return | | | |
| ETF Shares | $1,000.00 | $1,061.14 | $0.36 |
| Institutional Shares | 1,000.00 | 1,060.97 | 0.31 |
| Institutional Plus Shares | 1,000.00 | 1,061.26 | 0.21 |
| Based on Hypothetical 5% Yearly Return | | | |
| ETF Shares | $1,000.00 | $1,024.92 | $0.36 |
| Institutional Shares | 1,000.00 | 1,024.97 | 0.31 |
| Institutional Plus Shares | 1,000.00 | 1,025.07 | 0.20 |
The calculations are based on expenses incurred in the most recent six-month period. The fund’s annualized six-month expense ratios for that period are 0.07% for ETF Shares, 0.06% for Institutional Shares, and 0.04% for Institutional Plus Shares. The dollar amounts shown as “Expenses Paid” are equal to the annualized expense ratio multiplied by the average account value over the period, multiplied by the number of days in the most recent six-month period, then divided by the number of days in the most recent 12-month period (184/366).
Extended Duration Treasury Index Fund
Performance Summary
All of the returns in this report represent past performance, which is not a guarantee of future results that may be achieved by the fund. (Current performance may be lower or higher than the performance data cited. For performance data current to the most recent month-end, visit our website at vanguard.com/performance.) Note, too, that both investment returns and principal value can fluctuate widely, so an investor’s shares, when sold, could be worth more or less than their original cost. The returns shown do not reflect taxes that a shareholder would pay on fund distributions or on the sale of fund shares.
Cumulative Performance: August 31, 2010, Through August 31, 2020
Initial Investment of $10,000
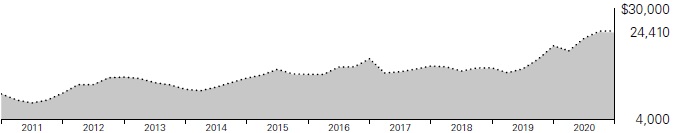
| | | Average Annual Total Returns | |
| | | Periods Ended August 31, 2020 | |
| | | | | | Final Value |
| | | One | Five | Ten | of a $10,000 |
| | | Year | Years | Years | Investment |
 | Extended Duration Treasury Index Fund ETF Shares Net Asset Value | 14.98% | 11.05% | 9.33% | $24,410 |
| | Extended Duration Treasury Index Fund ETF Shares Market Price | 14.76 | 10.96 | 9.30 | 24,329 |
 | Bloomberg Barclays U.S. Treasury STRIPS 20–30 Year Equal Par Bond Index | 16.39 | 11.15 | 9.50 | 24,776 |
| | | | | Final Value |
| | One | Five | Ten | of a $5,000,000 |
| | Year | Years | Years | Investment |
| Extended Duration Treasury Index Fund Institutional Shares | 14.41% | 10.95% | 9.30% | $12,226,848 |
| Bloomberg Barclays U.S. Treasury STRIPS 20–30 Year Equal Par Bond Index | 16.39 | 11.15 | 9.50 | 12,387,766 |
Vanguard fund returns are adjusted to reflect the 0.50% fee on purchases of fund shares. The fee does not apply to the ETF Shares.
See Financial Highlights for dividend and capital gains information.
| Extended Duration Treasury Index Fund | | |
| | | |
| | Average Annual Total Returns | |
| | Periods Ended August 31, 2020 | |
| | | | Since | Final Value |
| | One | Five | Inception | of a $100,000,000 |
| | Year | Years | (8/28/2013) | Investment |
| Extended Duration Treasury Index Fund Institutional Plus Shares | 14.44% | 10.97% | 12.24% | $225,717,600 |
| Bloomberg Barclays U.S. Treasury STRIPS 20–30 Year Equal Par Bond Index | 16.39 | 11.15 | 12.52 | 228,577,931 |
“Since Inception” performance is calculated from the Institutional Plus Shares’ inception date for both the fund and its comparative standards.
| Cumulative Returns of ETF Shares: August 31, 2010, Through August 31, 2020 | |
| | |
| | One | Five | Ten |
| | Year | Years | Years |
| Extended Duration Treasury Index Fund ETF Shares Market Price | 14.76% | 68.21% | 143.29% |
| Extended Duration Treasury Index Fund ETF Shares Net Asset Value | 14.98 | 68.88 | 144.10 |
| Bloomberg Barclays U.S. Treasury STRIPS 20–30 Year Equal Par Bond Index | 16.39 | 69.62 | 147.76 |
For the ETF Shares, the market price is determined by the midpoint of the bid-offer spread as of the closing time of the New York Stock Exchange (generally 4 p.m., Eastern time). The net asset value is also determined as of the NYSE closing time. For more information about how the ETF Shares’ market prices have compared with their net asset value, visit vanguard.com, select your ETF, and then select the Price and Performance tab. The ETF premium/discount analysis there shows the percentages of days on which the ETF Shares’ market price was above or below the NAV.
Vanguard fund returns are adjusted to reflect the 0.50% fee on purchases of fund shares. The fee does not apply to the ETF Shares.
Extended Duration Treasury Index Fund
| Distribution by Stated Maturity |
| As of August 31, 2020 | |
| | |
| 15–20 Years | 0.1% |
| 20–25 Years | 50.9 |
| 25–30 Years | 49.0 |
The table reflects the fund’s investments, except for short-term investments.
Extended Duration Treasury Index Fund
Financial Statements
Schedule of Investments
As of August 31, 2020
The fund files its complete schedule of portfolio holdings with the Securities and Exchange Commission (SEC) for the first and third quarters of each fiscal year as an exhibit to its reports on Form N-PORT. The fund’s Form N-PORT reports are available on the SEC’s website at www.sec.gov.
| | | | Face | | Market | |
| | | Maturity | Amount | | Value· | |
| | Coupon | Date | ($000 | ) | ($000 | ) |
| U.S. Government and Agency Obligations (100.0%) | | | | | |
| U.S. Government Securities (100.0%) | | | | | | |
| United States Treasury Strip Coupon | 0.000% | 8/15/40 | 2,309 | | 1,738 | |
| United States Treasury Strip Coupon | 0.000% | 11/15/40 | 81,453 | | 60,937 | |
| United States Treasury Strip Coupon | 0.000% | 2/15/41 | 79,089 | | 58,921 | |
| United States Treasury Strip Coupon | 0.000% | 5/15/41 | 85,309 | | 63,082 | |
| United States Treasury Strip Coupon | 0.000% | 8/15/41 | 77,476 | | 57,042 | |
| United States Treasury Strip Coupon | 0.000% | 11/15/41 | 68,403 | | 50,046 | |
| United States Treasury Strip Coupon | 0.000% | 2/15/42 | 75,622 | | 55,051 | |
| United States Treasury Strip Coupon | 0.000% | 5/15/42 | 69,435 | | 50,178 | |
| United States Treasury Strip Coupon | 0.000% | 8/15/42 | 76,221 | | 54,832 | |
| United States Treasury Strip Coupon | 0.000% | 11/15/42 | 75,797 | | 54,165 | |
| United States Treasury Strip Coupon | 0.000% | 2/15/43 | 67,384 | | 47,880 | |
| United States Treasury Strip Coupon | 0.000% | 5/15/43 | 71,227 | | 50,254 | |
| United States Treasury Strip Coupon | 0.000% | 8/15/43 | 72,159 | | 50,590 | |
| United States Treasury Strip Coupon | 0.000% | 11/15/43 | 65,424 | | 45,557 | |
| United States Treasury Strip Coupon | 0.000% | 2/15/44 | 65,545 | | 45,375 | |
| United States Treasury Strip Coupon | 0.000% | 5/15/44 | 72,877 | | 50,143 | |
| United States Treasury Strip Coupon | 0.000% | 8/15/44 | 66,651 | | 45,588 | |
| United States Treasury Strip Coupon | 0.000% | 11/15/44 | 55,968 | | 38,071 | |
| United States Treasury Strip Coupon | 0.000% | 2/15/45 | 56,915 | | 38,457 | |
| United States Treasury Strip Coupon | 0.000% | 5/15/45 | 64,217 | | 43,171 | |
| United States Treasury Strip Coupon | 0.000% | 8/15/45 | 60,251 | | 40,321 | |
| United States Treasury Strip Coupon | 0.000% | 11/15/45 | 63,895 | | 42,545 | |
| United States Treasury Strip Coupon | 0.000% | 2/15/46 | 71,804 | | 47,610 | |
| United States Treasury Strip Coupon | 0.000% | 5/15/46 | 72,979 | | 48,103 | |
| United States Treasury Strip Coupon | 0.000% | 8/15/46 | 70,792 | | 46,485 | |
| United States Treasury Strip Coupon | 0.000% | 11/15/46 | 75,691 | | 49,382 | |
| United States Treasury Strip Coupon | 0.000% | 2/15/47 | 73,438 | | 47,666 | |
| United States Treasury Strip Coupon | 0.000% | 5/15/47 | 63,283 | | 40,931 | |
| United States Treasury Strip Coupon | 0.000% | 8/15/47 | 79,893 | | 51,593 | |
| United States Treasury Strip Coupon | 0.000% | 11/15/47 | 69,684 | | 44,853 | |
| United States Treasury Strip Coupon | 0.000% | 2/15/48 | 85,115 | | 54,526 | |
| United States Treasury Strip Coupon | 0.000% | 5/15/48 | 70,253 | | 44,913 | |
| United States Treasury Strip Coupon | 0.000% | 8/15/48 | 65,692 | | 41,786 | |
| United States Treasury Strip Coupon | 0.000% | 11/15/48 | 51,898 | | 32,850 | |
| United States Treasury Strip Coupon | 0.000% | 2/15/49 | 40,334 | | 25,477 | |
| United States Treasury Strip Coupon | 0.000% | 5/15/49 | 50,177 | | 31,549 | |
| United States Treasury Strip Coupon | 0.000% | 8/15/49 | 29,269 | | 18,350 | |
Extended Duration Treasury Index Fund
| | | | Face | Market | |
| | | Maturity | Amount | Value· | |
| | Coupon | Date | ($000) | ($000 | ) |
| United States Treasury Strip Coupon | 0.000% | 11/15/49 | 2,547 | 1,595 | |
| United States Treasury Strip Coupon | 0.000% | 2/15/50 | 1,007 | 627 | |
| United States Treasury Strip Coupon | 0.000% | 5/15/50 | 1,146 | 713 | |
| United States Treasury Strip Coupon | 0.000% | 8/15/50 | 1,007 | 625 | |
| United States Treasury Strip Principal | 0.000% | 11/15/40 | 65,742 | 50,703 | |
| United States Treasury Strip Principal | 0.000% | 2/15/41 | 59,828 | 45,928 | |
| United States Treasury Strip Principal | 0.000% | 5/15/41 | 61,572 | 46,833 | |
| United States Treasury Strip Principal | 0.000% | 8/15/41 | 31,956 | 24,152 | |
| United States Treasury Strip Principal | 0.000% | 11/15/41 | 26,994 | 20,262 | |
| United States Treasury Strip Principal | 0.000% | 2/15/42 | 46,214 | 34,549 | |
| United States Treasury Strip Principal | 0.000% | 5/15/42 | 44,570 | 33,003 | |
| United States Treasury Strip Principal | 0.000% | 8/15/42 | 56,080 | 41,280 | |
| United States Treasury Strip Principal | 0.000% | 11/15/42 | 48,802 | 35,606 | |
| United States Treasury Strip Principal | 0.000% | 2/15/43 | 49,172 | 35,642 | |
| United States Treasury Strip Principal | 0.000% | 5/15/43 | 49,352 | 35,549 | |
| United States Treasury Strip Principal | 0.000% | 8/15/43 | 47,611 | 34,094 | |
| United States Treasury Strip Principal | 0.000% | 11/15/43 | 49,228 | 35,017 | |
| United States Treasury Strip Principal | 0.000% | 2/15/44 | 55,122 | 38,934 | |
| United States Treasury Strip Principal | 0.000% | 5/15/44 | 57,047 | 40,080 | |
| United States Treasury Strip Principal | 0.000% | 8/15/44 | 50,008 | 34,932 | |
| United States Treasury Strip Principal | 0.000% | 11/15/44 | 45,868 | 31,864 | |
| United States Treasury Strip Principal | 0.000% | 2/15/45 | 56,610 | 39,087 | |
| United States Treasury Strip Principal | 0.000% | 5/15/45 | 53,791 | 36,969 | |
| United States Treasury Strip Principal | 0.000% | 8/15/45 | 46,470 | 31,785 | |
| United States Treasury Strip Principal | 0.000% | 11/15/45 | 56,143 | 38,265 | |
| United States Treasury Strip Principal | 0.000% | 2/15/46 | 44,728 | 30,310 | |
| United States Treasury Strip Principal | 0.000% | 5/15/46 | 56,277 | 37,970 | |
| United States Treasury Strip Principal | 0.000% | 8/15/46 | 64,519 | 43,349 | |
| United States Treasury Strip Principal | 0.000% | 11/15/46 | 55,396 | 37,055 | |
| United States Treasury Strip Principal | 0.000% | 2/15/47 | 61,805 | 41,192 | |
| United States Treasury Strip Principal | 0.000% | 5/15/47 | 76,722 | 50,888 | |
| United States Treasury Strip Principal | 0.000% | 8/15/47 | 87,630 | 57,890 | |
| United States Treasury Strip Principal | 0.000% | 11/15/47 | 71,994 | 47,381 | |
| United States Treasury Strip Principal | 0.000% | 2/15/48 | 85,548 | 55,994 | |
| United States Treasury Strip Principal | 0.000% | 5/15/48 | 87,420 | 56,987 | |
| United States Treasury Strip Principal | 0.000% | 8/15/48 | 25,847 | 16,782 | |
| United States Treasury Strip Principal | 0.000% | 11/15/48 | 48,366 | 31,325 | |
| United States Treasury Strip Principal | 0.000% | 2/15/49 | 66,603 | 42,918 | |
| United States Treasury Strip Principal | 0.000% | 5/15/49 | 87,892 | 56,409 | |
| United States Treasury Strip Principal | 0.000% | 8/15/49 | 107,965 | 68,987 | |
| United States Treasury Strip Principal | 0.000% | 11/15/49 | 113,048 | 71,989 | |
| United States Treasury Strip Principal | 0.000% | 2/15/50 | 75,900 | 48,214 | |
| United States Treasury Strip Principal | 0.000% | 5/15/50 | 120,050 | 76,101 | |
| United States Treasury Strip Principal | 0.000% | 8/15/50 | 125,050 | 78,704 | |
| Total U.S. Government and Agency Obligations (Cost $2,829,428) | | 3,388,557 | |
Extended Duration Treasury Index Fund
| | | | Market | |
| | | | Value· | |
| | Coupon | Shares | ($000 | ) |
| Temporary Cash Investment (0.0%) | | | | |
| Money Market Fund (0.0%) | | | | |
| 1 | Vanguard Market Liquidity Fund (Cost $776) | 0.147% | 7,765 | 776 | |
| Total Investments (100.0%) (Cost $2,830,204) | | | 3,389,333 | |
| Other Assets and Liabilities—Net (0.0%) | | | (422 | ) |
| Net Assets (100%) | | | 3,388,911 | |
Cost is in $000.
| • | See Note A in Notes to Financial Statements. |
| | |
| 1 | Affiliated money market fund available only to Vanguard funds and certain trusts and accounts managed by Vanguard. Rate shown is the 7-day yield. |
See accompanying Notes, which are an integral part of the Financial Statements.
Extended Duration Treasury Index Fund
Statement of Assets and Liabilities
As of August 31, 2020
| ($000s, except shares and per-share amounts) | Amount |
| Assets | |
| Investments in Securities, at Value | |
| Unaffiliated Issuers (Cost $2,829,428) | 3,388,557 |
| Affiliated Issuers (Cost $776) | 776 |
| Total Investments in Securities | 3,389,333 |
| Investment in Vanguard | 157 |
| Cash | 1 |
| Receivables for Investment Securities Sold | 89,430 |
| Receivables for Capital Shares Issued | 26 |
| Total Assets | 3,478,947 |
| Liabilities | |
| Payables for Investment Securities Purchased | 89,933 |
| Payables to Vanguard | 103 |
| Total Liabilities | 90,036 |
| Net Assets | 3,388,911 |
| At August 31, 2020, net assets consisted of: | |
| | |
| Paid-in Capital | 2,728,622 |
| Total Distributable Earnings (Loss) | 660,289 |
| Net Assets | 3,388,911 |
| | |
| ETF Shares—Net Assets | |
| Applicable to 11,100,000 outstanding $.001 par value shares of beneficial interest (unlimited authorization) | 1,810,471 |
| Net Asset Value Per Share—ETF Shares | $163.11 |
| | |
| Institutional Shares—Net Assets | |
| Applicable to 18,051,063 outstanding $.001 par value shares of beneficial interest (unlimited authorization) | 889,454 |
| Net Asset Value Per Share—Institutional Shares | $49.27 |
| | |
| Institutional Plus Shares—Net Assets | |
| Applicable to 5,569,914 outstanding $.001 par value shares of beneficial interest (unlimited authorization) | 688,986 |
| Net Asset Value Per Share—Institutional Plus Shares | $123.70 |
See accompanying Notes, which are an integral part of the Financial Statements.
Extended Duration Treasury Index Fund
Statement of Operations
| | | Year Ended | |
| | | August 31, 2020 | |
| | | ($000 | ) |
| Investment Income | | | |
| Income | | | |
| Interest1 | | 65,647 | |
| Total Income | | 65,647 | |
| Expenses | | | |
| The Vanguard Group—Note B | | | |
| Investment Advisory Services | | 89 | |
| Management and Administrative—ETF Shares | | 788 | |
| Management and Administrative—Institutional Shares | | 461 | |
| Management and Administrative—Institutional Plus Shares | | 265 | |
| Marketing and Distribution—ETF Shares | | 87 | |
| Marketing and Distribution—Institutional Shares | | 24 | |
| Marketing and Distribution—Institutional Plus Shares | | 9 | |
| Custodian Fees | | 6 | |
| Auditing Fees | | 35 | |
| Shareholders’ Reports—ETF Shares | | 62 | |
| Shareholders’ Reports—Institutional Shares | | — | |
| Shareholders’ Reports—Institutional Plus Shares | | — | |
| Trustees’ Fees and Expenses | | 2 | |
| Total Expenses | | 1,828 | |
| Net Investment Income | | 63,819 | |
| Realized Net Gain (Loss) | | | |
| Investment Securities Sold1,2 | | 405,593 | |
| Futures Contracts | | — | |
| Realized Net Gain (Loss) | | 405,593 | |
| Change in Unrealized Appreciation (Depreciation) of Investment Securities1 | | (49,993 | ) |
| Net Increase (Decrease) in Net Assets Resulting from Operations | | 419,419 | |
| 1 | Interest income, realized net gain (loss), and change in unrealized appreciation (depreciation) from an affiliated company of the fund were $13,000, $1,000, and ($1,000), respectively. Purchases and sales are for temporary cash investment purposes. |
| | |
| 2 | Includes $284,726,000 of net gain (loss) resulting from in-kind redemptions. |
See accompanying Notes, which are an integral part of the Financial Statements.
Extended Duration Treasury Index Fund
Statement of Changes in Net Assets
| | | Year Ended August 31, | |
| | | 2020 | | 2019 | |
| | | ($000 | ) | ($000 | ) |
| Increase (Decrease) in Net Assets | | | | | |
| Operations | | | | | |
| Net Investment Income | | 63,819 | | 63,738 | |
| Realized Net Gain (Loss) | | 405,593 | | 44,663 | |
| Change in Unrealized Appreciation (Depreciation) | | (49,993 | ) | 616,956 | |
| Net Increase (Decrease) in Net Assets Resulting from Operations | | 419,419 | | 725,357 | |
| Distributions1 | | | | | |
| ETF Shares | | (39,381 | ) | (23,240) | |
| Institutional Shares | | (26,547 | ) | (22,154 | ) |
| Institutional Plus Shares | | (23,883 | ) | (16,154 | ) |
| Total Distributions | | (89,811 | ) | (61,548 | ) |
| Capital Share Transactions | | | | | |
| ETF Shares | | 343,500 | | 389,756 | |
| Institutional Shares | | (76,455 | ) | (129,112 | ) |
| Institutional Plus Shares | | (182,509 | ) | 72,452 | |
| Net Increase (Decrease) from Capital Share Transactions | | 84,536 | | 333,096 | |
| Total Increase (Decrease) | | 414,144 | | 996,905 | |
| Net Assets | | | | | |
| Beginning of Period | | 2,974,767 | | 1,977,862 | |
| End of Period | | 3,388,911 | | 2,974,767 | |
| 1 | Certain prior period numbers have been reclassified to conform with current period presentation. |
See accompanying Notes, which are an integral part of the Financial Statements.
Extended Duration Treasury Index Fund
Financial Highlights
| ETF Shares | | | | | |
| | | | | | |
| For a Share Outstanding | | | Year Ended August 31, |
| Throughout Each Period | 2020 | 2019 | 2018 | 2017 | 2016 |
| Net Asset Value, Beginning of Period | $146.43 | $113.39 | $120.92 | $139.77 | $116.00 |
| Investment Operations | | | | | |
| Net Investment Income | 3.1461 | 3.3471 | 3.3531 | 3.3831 | 3.420 |
| Net Realized and Unrealized Gain (Loss) on Investments2 | 18.113 | 32.972 | (7.272) | (16.377) | 25.019 |
| Total from Investment Operations | 21.259 | 36.319 | (3.919) | (12.994) | 28.439 |
| Distributions | | | | | |
| Dividends from Net Investment Income | (3.329) | (3.279) | (3.314) | (3.402) | (3.414) |
| Distributions from Realized Capital Gains | (1.250) | — | (.297) | (2.454) | (1.255) |
| Total Distributions | (4.579) | (3.279) | (3.611) | (5.856) | (4.669) |
| Net Asset Value, End of Period | $163.11 | $146.43 | $113.39 | $120.92 | $139.77 |
| | | | | | |
| Total Return | 14.98% | 32.92% | -3.24% | -8.86% | 25.30% |
| | | | | | |
| Ratios/Supplemental Data | | | | | |
| Net Assets, End of Period (Millions) | $1,810 | $1,333 | $658 | $623 | $615 |
| Ratio of Total Expenses to Average Net Assets | 0.07% | 0.07% | 0.07% | 0.07% | 0.07% |
| Ratio of Net Investment Income to Average Net Assets | 2.06% | 2.87% | 2.93% | 2.90% | 2.77% |
| Portfolio Turnover Rate3 | 17% | 20% | 18% | 18% | 20% |
| 1 | Calculated based on average shares outstanding. |
| 2 | Includes increases from purchase and redemption fees of $0.07, $0.04, $0.07, $0.16, and $0.06. |
| 3 | Excludes the value of portfolio securities received or delivered as a result of in-kind purchases or redemptions of the fund’s capital shares, including ETF Creation Units. |
See accompanying Notes, which are an integral part of the Financial Statements.
Extended Duration Treasury Index Fund
Financial Highlights
| Institutional Shares | | | | | |
| | | | | | |
| For a Share Outstanding | | | Year Ended August 31, |
| Throughout Each Period | 2020 | 2019 | 2018 | 2017 | 2016 |
| Net Asset Value, Beginning of Period | $44.24 | $34.25 | $36.52 | $42.20 | $35.02 |
| Investment Operations | | | | | |
| Net Investment Income | .9591 | 1.0151 | 1.0161 | 1.0241 | 1.036 |
| Net Realized and Unrealized Gain (Loss) on Investments2 | 5.459 | 9.967 | (2.191) | (4.934) | 7.558 |
| Total from Investment Operations | 6.418 | 10.982 | (1.175) | (3.910) | 8.594 |
| Distributions | | | | | |
| Dividends from Net Investment Income | (1.010) | (.992) | (1.005) | (1.030) | (1.035) |
| Distributions from Realized Capital Gains | (.378) | — | (.090) | (.740) | (.379) |
| Total Distributions | (1.388) | (.992) | (1.095) | (1.770) | (1.414) |
| Net Asset Value, End of Period | $49.27 | $44.24 | $34.25 | $36.52 | $42.20 |
| | | | | | |
| Total Return3 | 14.98% | 32.94% | -3.23% | -8.86% | 25.33% |
| | | | | | |
| Ratios/Supplemental Data | | | | | |
| Net Assets, End of Period (Millions) | $889 | $862 | $787 | $682 | $660 |
| Ratio of Total Expenses to Average Net Assets | 0.06% | 0.06% | 0.06% | 0.06% | 0.06% |
| Ratio of Net Investment Income to Average Net Assets | 2.10% | 2.88% | 2.94% | 2.91% | 2.78% |
| Portfolio Turnover Rate4 | 17% | 20% | 18% | 18% | 20% |
| 1 | Calculated based on average shares outstanding. |
| 2 | Includes increases from purchase and redemption fees of $0.02, $0.01, $0.02, $0.05, and $0.02. |
| 3 | Total returns do not include transaction fees that may have applied in the periods shown. Fund prospectuses provide information about any applicable transaction fees. |
| 4 | Excludes the value of portfolio securities received or delivered as a result of in-kind purchases or redemptions of the fund’s capital shares, including ETF Creation Units. |
See accompanying Notes, which are an integral part of the Financial Statements.
Extended Duration Treasury Index Fund
Financial Highlights
| Institutional Plus Shares | | | | | |
| | | | | | |
| For a Share Outstanding | | | Year Ended August 31, |
| Throughout Each Period | 2020 | 2019 | 2018 | 2017 | 2016 |
| Net Asset Value, Beginning of Period | $111.06 | $85.99 | $91.68 | $105.93 | $87.92 |
| Investment Operations | | | | | |
| Net Investment Income | 2.4321 | 2.5641 | 2.5681 | 2.5881 | 2.620 |
| Net Realized and Unrealized Gain (Loss) on Investments2 | 13.716 | 25.015 | (5.492) | (12.375) | 18.958 |
| Total from Investment Operations | 16.148 | 27.579 | (2.924) | (9.787) | 21.578 |
| Distributions | | | | | |
| Dividends from Net Investment Income | (2.560) | (2.509) | (2.541) | (2.603) | (2.616) |
| Distributions from Realized Capital Gains | (.948) | — | (.225) | (1.860) | (.952) |
| Total Distributions | (3.508) | (2.509) | (2.766) | (4.463) | (3.568) |
| Net Asset Value, End of Period | $123.70 | $111.06 | $85.99 | $91.68 | $105.93 |
| | | | | | |
| Total Return3 | 15.02% | 32.95% | -3.20% | -8.84% | 25.34% |
| | | | | | |
| Ratios/Supplemental Data | | | | | |
| Net Assets, End of Period (Millions) | $689 | $780 | $533 | $367 | $258 |
| Ratio of Total Expenses to Average Net Assets | 0.04% | 0.04% | 0.04% | 0.04% | 0.04% |
| Ratio of Net Investment Income to Average Net Assets | 2.12% | 2.90% | 2.96% | 2.93% | 2.80% |
| Portfolio Turnover Rate4 | 17% | 20% | 18% | 18% | 20% |
| 1 | Calculated based on average shares outstanding. |
| 2 | Includes increases from purchase and redemption fees of $0.05, $0.03, $0.06, $0.12, and $0.05. |
| 3 | Total returns do not include transaction fees that may have applied in the periods shown. Fund prospectuses provide information about any applicable transaction fees. |
| 4 | Excludes the value of portfolio securities received or delivered as a result of in-kind purchases or redemptions of the fund’s capital shares, including ETF Creation Units. |
See accompanying Notes, which are an integral part of the Financial Statements.
Extended Duration Treasury Index Fund
Notes to Financial Statements
Vanguard Extended Duration Treasury Index Fund is registered under the Investment Company Act of 1940 as an open-end investment company, or mutual fund. The fund offers three classes of shares: ETF Shares, Institutional Shares, and Institutional Plus Shares. Each of the share classes has different eligibility and minimum purchase requirements, and is designed for different types of investors. ETF Shares are listed for trading on NYSE Arca; they can be purchased and sold through a broker.
Market disruptions associated with the COVID-19 pandemic have had a global impact, and uncertainty exists as to the long-term implications. Such disruptions can adversely affect assets of the fund and thus fund performance.
A. The following significant accounting policies conform to generally accepted accounting principles for U.S. investment companies. The fund consistently follows such policies in preparing its financial statements.
1. Security Valuation: Securities are valued as of the close of trading on the New York Stock Exchange (generally 4 p.m., Eastern time) on the valuation date. Bonds and temporary cash investments are valued using the latest bid prices or using valuations based on a matrix system (which considers such factors as security prices, yields, maturities, and ratings), both as furnished by independent pricing services. Investments in Vanguard Market Liquidity Fund are valued at that fund’s net asset value. Securities for which market quotations are not readily available, or whose values have been affected by events occurring before the fund’s pricing time but after the close of the securities’ primary markets, are valued by methods deemed by the board of trustees to represent fair value.
2. Futures Contracts: The fund uses futures contracts to invest in fixed income asset classes with greater efficiency and lower cost than is possible through direct investment, to add value when these instruments are attractively priced, or to adjust sensitivity to changes in interest rates. The primary risks associated with the use of futures contracts are imperfect correlation between changes in market values of bonds held by the fund and the prices of futures contracts, and the possibility of an illiquid market. Counterparty risk involving futures is mitigated because a regulated clearinghouse is the counterparty instead of the clearing broker. To further mitigate counterparty risk, the fund trades futures contracts on an exchange, monitors the financial strength of its clearing brokers and clearinghouse, and has entered into clearing agreements with its clearing brokers. The clearinghouse imposes initial margin requirements to secure the fund’s performance and requires daily settlement of variation margin representing changes in the market value of each contract. Any securities pledged as initial margin for open contracts are noted in the Schedule of Investments.
Futures contracts are valued at their quoted daily settlement prices. The notional amounts of the contracts are not recorded in the Statement of Assets and Liabilities. Fluctuations in the value of the contracts are recorded in the Statement of Assets and Liabilities as an asset (liability) and in the Statement of Operations as unrealized appreciation (depreciation) until the contracts are closed, when they are recorded as realized gains (losses) on futures contracts.
During the year ended August 31, 2020, the fund’s average investments in long and short futures contracts represented less than 1% and 0% of net assets, respectively, based on the average of the notional amounts at each quarter-end during the period. The fund had no open futures contracts at August 31, 2020.
Extended Duration Treasury Index Fund
3. Federal Income Taxes: The fund intends to continue to qualify as a regulated investment company and distribute all of its taxable income. The fund’s tax returns are open to examination by the relevant tax authorities until expiration of the applicable statute of limitations, which is generally three years after the filing of the tax return. Management has analyzed the fund’s tax positions taken for all open federal and state income tax years, and has concluded that no provision for income tax is required in the fund’s financial statements.
4. Distributions: Distributions to shareholders are recorded on the ex-dividend date. Distributions are determined on a tax basis at the fiscal year-end and may differ from net investment income and realized capital gains for financial reporting purposes.
5. Credit Facilities and Interfund Lending Program: The fund and certain other funds managed by The Vanguard Group (“Vanguard”) participate in a $4.3 billion committed credit facility provided by a syndicate of lenders pursuant to a credit agreement and an uncommitted credit facility provided by Vanguard. Both facilities may be renewed annually. Each fund is individually liable for its borrowings, if any, under the credit facilities. Borrowings may be utilized for temporary or emergency purposes, subject to the fund’s regulatory and contractual borrowing restrictions. With respect to the committed credit facility, the participating funds are charged administrative fees and an annual commitment fee of 0.10% of the undrawn committed amount of the facility; these fees are allocated to the funds based on a method approved by the fund’s board of trustees and included in Management and Administrative expenses on the fund’s Statement of Operations. Any borrowings under either facility bear interest at a rate based upon the higher of the one-month London Interbank Offered Rate (or an acceptable alternate rate, if necessary), federal funds effective rate, or overnight bank funding rate plus an agreed-upon spread, except that borrowings under the uncommitted credit facility may bear interest based upon an alternative rate agreed to by the fund and Vanguard.
In accordance with an exemptive order (the “Order”) from the SEC, the fund may participate in a joint lending and borrowing program that allows registered open-end Vanguard funds to borrow money from and lend money to each other for temporary or emergency purposes (the “Interfund Lending Program”), subject to compliance with the terms and conditions of the Order, and to the extent permitted by the fund’s investment objective and investment policies. Interfund loans and borrowings normally extend overnight, but can have a maximum duration of seven days. Loans may be called on one business day’s notice. The interest rate to be charged is governed by the conditions of the Order and internal procedures adopted by the board of trustees. The board of trustees is responsible for overseeing the Interfund Lending Program.
For the year ended August 31, 2020, the fund did not utilize the credit facilities or the Interfund Lending Program.
6. Other: Interest income includes income distributions received from Vanguard Market Liquidity Fund and is accrued daily. Premiums and discounts on debt securities are amortized and accreted, respectively, to interest income over the lives of the respective securities, except for premiums on certain callable debt securities that are amortized to the earliest call date. Security transactions are accounted for on the date securities are bought or sold. Costs used to determine realized gains (losses) on the sale of investment securities are those of the specific securities sold. Fees assessed on capital share transactions are credited to paid-in capital.
Extended Duration Treasury Index Fund
Each class of shares has equal rights as to assets and earnings, except that each class separately bears certain class-specific expenses related to maintenance of shareholder accounts (included in Management and Administrative expenses) and shareholder reporting. Marketing and distribution expenses are allocated to each class of shares based on a method approved by the board of trustees. Income, other non-class-specific expenses, and gains and losses on investments are allocated to each class of shares based on its relative net assets.
B. In accordance with the terms of a Funds’ Service Agreement (the “FSA”) between Vanguard and the fund, Vanguard furnishes to the fund investment advisory, corporate management, administrative, marketing, and distribution services at Vanguard’s cost of operations (as defined by the FSA). These costs of operations are allocated to the fund based on methods and guidelines approved by the board of trustees and are generally settled twice a month.
Upon the request of Vanguard, the fund may invest up to 0.40% of its net assets as capital in Vanguard. At August 31, 2020, the fund had contributed to Vanguard capital in the amount of $157,000, representing less than 0.01% of the fund’s net assets and 0.06% of Vanguard’s capital received pursuant to the FSA. The fund’s trustees and officers are also directors and employees, respectively, of Vanguard.
C. Various inputs may be used to determine the value of the fund’s investments. These inputs are summarized in three broad levels for financial statement purposes. The inputs or methodologies used to value securities are not necessarily an indication of the risk associated with investing in those securities.
Level 1—Quoted prices in active markets for identical securities.
Level 2—Other significant observable inputs (including quoted prices for similar securities, interest rates, prepayment speeds, credit risk, etc.).
Level 3—Significant unobservable inputs (including the fund’s own assumptions used to determine the fair value of investments). Any investments valued with significant unobservable inputs are noted on the Schedule of Investments.
The following table summarizes the market value of the fund’s investments as of August 31, 2020, based on the inputs used to value them:
| | Level 1 | Level 2 | Level 3 | Total | |
| | ($000) | ($000) | ($000) | ($000 | ) |
| Investments | | | | | |
| Assets | | | | | |
| U.S. Government and Agency Obligations | — | 3,388,557 | — | 3,388,557 | |
| Temporary Cash Investments | 776 | — | — | 776 | |
| Total | 776 | 3,388,557 | — | 3,389,333 | |
Extended Duration Treasury Index Fund
D. Permanent differences between book-basis and tax-basis components of net assets are reclassified among capital accounts in the financial statements to reflect their tax character. These reclassifications have no effect on net assets or net asset value per share. As of period end, permanent differences primarily attributable to the accounting for in-kind redemptions and distributions in connection with fund share redemptions were reclassified between the following accounts:
| | Amount |
| | ($000) |
| Paid-in Capital | 308,206 |
| Total Distributable Earnings (Loss) | (308,206) |
Temporary differences between book-basis and tax-basis components of total distributable earnings (loss) arise when certain items of income, gain, or loss are recognized in different periods for financial statement and tax purposes; these differences will reverse at some time in the future. The differences are primarily related to the deferral of losses from wash sales. As of period end, the tax-basis components of total distributable earnings (loss) are detailed in the table as follows:
| | Amount |
| | ($000) |
| Undistributed Ordinary Income | 33,342 |
| Undistributed Long-Term Gains | 67,817 |
| Capital Loss Carryforwards | — |
| Qualified Late-Year Losses | — |
| Net Unrealized Gains (Losses) | 559,129 |
| The tax character of distributions paid was as follows: | | |
| | | |
| | Year Ended August 31, |
| | 2020 | 2019 |
| | Amount | Amount |
| | ($000) | ($000) |
| Ordinary Income* | 75,429 | 61,548 |
| Long-Term Capital Gains | 14,382 | — |
| Total | 89,811 | 61,548 |
* Includes short-term capital gains, if any.
As of August 31, 2020, gross unrealized appreciation and depreciation for investments based on cost for U.S. federal income tax purposes were as follows:
| | Amount |
| | ($000) |
| Tax Cost | 2,830,204 |
| Gross Unrealized Appreciation | 590,410 |
| Gross Unrealized Depreciation | (31,281) |
| Net Unrealized Appreciation (Depreciation) | 559,129 |
Extended Duration Treasury Index Fund
E. During the year ended August 31, 2020, the fund purchased $1,847,991,000 of investment securities and sold $1,854,860,000 of investment securities, other than temporary cash investments. Purchases and sales include $1,323,381,000 and $1,061,648,000, respectively, in connection with in-kind purchases and redemptions of the fund’s capital shares.
F. Capital share transactions for each class of shares were:
| | | | | Year Ended August 31, |
| | | 2020 | | | 2019 |
| | Amount | Shares | | Amount | Shares |
| | ($000) | (000) | | ($000) | (000) |
| ETF Shares | | | | | |
| Issued1 | 1,411,503 | 8,875 | | 607,253 | 5,250 |
| Issued in Lieu of Cash Distributions | — | — | | — | — |
| Redeemed | (1,068,003) | (6,875) | | (217,497) | (1,950) |
| Net Increase (Decrease)—ETF Shares | 343,500 | 2,000 | | 389,756 | 3,300 |
| Institutional Shares | | | | | |
| Issued1 | 166,646 | 3,592 | | 63,167 | 1,842 |
| Issued in Lieu of Cash Distributions | 26,362 | 611 | | 22,033 | 644 |
| Redeemed | (269,463) | (5,642) | | (214,312) | (5,975) |
| Net Increase (Decrease)—Institutional Shares | (76,455) | (1,439) | | (129,112) | (3,489) |
| Institutional Plus Shares | | | | | |
| Issued | 332 | — | | 64,883 | 720 |
| Issued in Lieu of Cash Distributions | 23,883 | 221 | | 16,154 | 187 |
| Redeemed | (206,724) | (1,674) | | (8,585) | (83) |
| Net Increase (Decrease)—Institutional Plus Shares | (182,509) | (1,453) | | 72,452 | 824 |
1 Includes purchase fees for fiscal 2020 and 2019 of $1,324,000 and $716,000, respectively (fund totals).
G. Management has determined that no events or transactions occurred subsequent to August 31, 2020, that would require recognition or disclosure in these financial statements.
Report of Independent Registered Public Accounting Firm
To the Board of Trustees of Vanguard World Fund and Shareholders of Vanguard Extended Duration Treasury Index Fund
Opinion on the Financial Statements
We have audited the accompanying statement of assets and liabilities, including the schedule of investments, of Vanguard Extended Duration Treasury Index Fund (one of the funds constituting Vanguard World Fund, referred to hereafter as the “Fund”) as of August 31, 2020, the related statement of operations for the year ended August 31, 2020, the statement of changes in net assets for each of the two years in the period ended August 31, 2020, including the related notes, and the financial highlights for each of the five years in the period ended August 31, 2020 (collectively referred to as the “financial statements”). In our opinion, the financial statements present fairly, in all material respects, the financial position of the Fund as of August 31, 2020, the results of its operations for the year then ended, the changes in its net assets for each of the two years in the period ended August 31, 2020 and the financial highlights for each of the five years in the period ended August 31, 2020 in conformity with accounting principles generally accepted in the United States of America.
Basis for Opinion
These financial statements are the responsibility of the Fund’s management. Our responsibility is to express an opinion on the Fund’s financial statements based on our audits. We are a public accounting firm registered with the Public Company Accounting Oversight Board (United States) (“PCAOB”) and are required to be independent with respect to the Fund in accordance with the U.S. federal securities laws and the applicable rules and regulations of the Securities and Exchange Commission and the PCAOB.
We conducted our audits of these financial statements in accordance with the standards of the PCAOB. Those standards require that we plan and perform the audit to obtain reasonable assurance about whether the financial statements are free of material misstatement, whether due to error or fraud.
Our audits included performing procedures to assess the risks of material misstatement of the financial statements, whether due to error or fraud, and performing procedures that respond to those risks. Such procedures included examining, on a test basis, evidence regarding the amounts and disclosures in the financial statements. Our audits also included evaluating the accounting principles used and significant estimates made by management, as well as evaluating the overall presentation of the financial statements. Our procedures included confirmation of securities owned as of August 31, 2020 by correspondence with the custodian, transfer agent and brokers; when replies were not received from brokers, we performed other auditing procedures. We believe that our audits provide a reasonable basis for our opinion.
/s/PricewaterhouseCoopers LLP
Philadelphia, Pennsylvania
October 15, 2020
We have served as the auditor of one or more investment companies in The Vanguard Group of Funds since 1975.
Special 2020 tax information (unaudited) for Vanguard Extended Duration Treasury Index Fund
This information for the fiscal year ended August 31, 2020, is included pursuant to provisions of the Internal Revenue Code.
The fund distributed $31,337,000 as capital gain dividends (20% rate gain distributions) to shareholders during the fiscal year.
For nonresident alien shareholders, 100% of short-term capital gain dividends distributed by the fund are qualified short-term capital gains.
For nonresident alien shareholders, 100% of income dividends are interest-related dividends.
Trustees Approve Advisory Arrangement
The board of trustees of Vanguard Extended Duration Treasury Index Fund has renewed the fund’s investment advisory arrangement with The Vanguard Group, Inc. (Vanguard), through its Fixed Income Group. The board determined that continuing the fund’s internalized management structure was in the best interests of the fund and its shareholders.
The board based its decision upon an evaluation of the advisor’s investment staff, portfolio management process, and performance. This evaluation included information provided to the board by Vanguard’s Portfolio Review Department, which is responsible for fund and advisor oversight and product management. The Portfolio Review Department met regularly with the advisor and made monthly presentations to the board during the fiscal year that directed the board’s focus to relevant information and topics.
The board, or an investment committee made up of board members, also received information throughout the year through advisor presentations. For each advisor presentation, the board was provided with letters and reports that included information about, among other things, the advisory firm and the advisor’s assessment of the investment environment, portfolio performance, and portfolio characteristics.
In addition, the board received monthly reports, which included a Market and Economic Report, a Fund Dashboard Monthly Summary, and a Fund Performance Report.
Prior to their meeting, the trustees were provided with a memo and materials that summarized the information they received over the course of the year. They also considered the factors discussed below, among others. However, no single factor determined whether the board approved the arrangement. Rather, it was the totality of the circumstances that drove the board’s decision.
Nature, extent, and quality of services
The board reviewed the quality of the fund’s investment management services over both the short and long term, and took into account the organizational depth and stability of the advisor. The board considered that Vanguard has been managing investments for more than four decades. The Fixed Income Group adheres to a sound, disciplined investment management process; the team has considerable experience, stability, and depth.
The board concluded that Vanguard’s experience, stability, depth, and performance, among other factors, warranted continuation of the advisory arrangement.
Investment performance
The board considered the short- and long-term performance of the fund, including any periods of outperformance or underperformance compared with its target index and peer group. The board concluded that the performance was such that the advisory arrangement should continue.
Cost
The board concluded that the fund’s expense ratio was well below the average expense ratio charged by funds in its peer group and that the fund’s advisory expenses were also well below the peer-group average.
The board does not conduct a profitability analysis of Vanguard because of Vanguard’s unique structure. Unlike most other mutual fund management companies, Vanguard is owned by the funds it oversees.
The benefit of economies of scale
The board concluded that the fund’s arrangement with Vanguard ensures that the fund will realize economies of scale as it grows, with the cost to shareholders declining as fund assets increase.
The board will consider whether to renew the advisory arrangement again after a one-year period.
Liquidity Risk Management
Vanguard funds (except for the money market funds) have adopted and implemented a written liquidity risk management program (the “Program”) as required by Rule 22e-4 under the Investment Company Act of 1940. Rule 22e-4 requires that each fund adopt a program that is reasonably designed to assess and manage the fund’s liquidity risk, which is the risk that the fund could not meet redemption requests without significant dilution of remaining investors’ interests in the fund.
Assessment and management of a fund’s liquidity risk under the Program take into consideration certain factors, such as the fund’s investment strategy and the liquidity of its portfolio investments during normal and reasonably foreseeable stressed conditions, its short- and long-term cash-flow projections during both normal and reasonably foreseeable stressed conditions, and its cash and cash-equivalent holdings and access to other funding sources. As required by the rule, the Program includes policies and procedures for classification of fund portfolio holdings in four liquidity categories, maintaining certain levels of highly liquid investments, and limiting holdings of illiquid investments.
The board of trustees of Vanguard World Fund approved the appointment of liquidity risk management program administrators responsible for administering Vanguard Extended Duration Treasury Index Fund’s Program and for carrying out the specific responsibilities set forth in the Program, including reporting to the board on at least an annual basis regarding the Program’s operation, its adequacy, and the effectiveness of its implementation for the past year (the “Program Administrator Report”). The board has reviewed the Program Administrator Report covering the period from December 1, 2018, through December 31, 2019 (the “Review Period”). The Program Administrator Report stated that during the Review Period the Program operated and was implemented effectively to manage the fund’s liquidity risk.
BLOOMBERG is a trademark and service mark of Bloomberg Finance L.P. BARCLAYS is a trademark and service mark of Barclays Bank Plc, used under license. Bloomberg Finance L.P. and its affiliates, including Bloomberg Index Services Limited (BISL) (collectively, Bloomberg), or Bloomberg’s licensors, own all proprietary rights in the Bloomberg Barclays U.S. Treasury STRIPS 20–30 Year Equal Par Bond Index (the Index or Bloomberg Barclays Index).
Neither Barclays Bank Plc, Barclays Capital Inc., or any affiliate (collectively Barclays) or Bloomberg is the issuer or producer of the Extended Duration Treasury Index Fund and neither Bloomberg nor Barclays has any responsibilities, obligations or duties to investors in the Extended Duration Treasury Index Fund. The Index is licensed for use by The Vanguard Group, Inc. (Vanguard) as the sponsor of the Extended Duration Treasury Index Fund. Bloomberg and Barclays’ only relationship with Vanguard in respect to the Index is the licensing of the Index, which is determined, composed and calculated by BISL, or any successor thereto, without regard to the Issuer or the Extended Duration Treasury Index Fund or the owners of the Extended Duration Treasury Index Fund.
Additionally, Vanguard may for itself execute transaction(s) with Barclays in or relating to the Index in connection with the Extended Duration Treasury Index Fund. Investors acquire the Extended Duration Treasury Index Fund from Vanguard and investors neither acquire any interest in the Index nor enter into any relationship of any kind whatsoever with Bloomberg or Barclays upon making an investment in the Extended Duration Treasury Index Fund. The Extended Duration Treasury Index Fund is not sponsored, endorsed, sold or promoted by Bloomberg or Barclays. Neither Bloomberg nor Barclays makes any representation or warranty, express or implied regarding the advisability of investing in the Extended Duration Treasury Index Fund or the advisability of investing in securities generally or the ability of the Index to track corresponding or relative market performance. Neither Bloomberg nor Barclays has passed on the legality or suitability of the Extended Duration Treasury Index Fund with respect to any person or entity. Neither Bloomberg nor Barclays is responsible for and has not participated in the determination of the timing of, prices at, or quantities of the Extended Duration Treasury Index Fund to be issued. Neither Bloomberg nor Barclays has any obligation to take the needs of the Issuer or the owners of the Extended Duration Treasury Index Fund or any other third party into consideration in determining, composing or calculating the Index. Neither Bloomberg nor Barclays has any obligation or liability in connection with administration, marketing or trading of the Extended Duration Treasury Index Fund.
The licensing agreement between Bloomberg and Barclays is solely for the benefit of Bloomberg and Barclays and not for the benefit of the owners of the Extended Duration Treasury Index Fund, investors or other third parties. In addition, the licensing agreement between Vanguard and Bloomberg is solely for the benefit of Vanguard and Bloomberg and not for the benefit of the owners of the Extended Duration Treasury Index Fund, investors or other third parties.
NEITHER BLOOMBERG NOR BARCLAYS SHALL HAVE ANY LIABILITY TO THE ISSUER, INVESTORS OR TO OTHER THIRD PARTIES FOR THE QUALITY, ACCURACY AND/OR COMPLETENESS OF THE BLOOMBERG BARCLAYS INDEX OR ANY DATA INCLUDED THEREIN OR FOR INTERRUPTIONS IN THE DELIVERY OF THE BLOOMBERG BARCLAYS INDEX. NEITHER BLOOMBERG NOR BARCLAYS MAKES ANY WARRANTY, EXPRESS OR IMPLIED, AS TO RESULTS TO BE OBTAINED BY THE ISSUER, THE INVESTORS OR ANY OTHER PERSON OR ENTITY FROM THE USE OF THE BLOOMBERG BARCLAYS INDEX OR ANY DATA INCLUDED THEREIN. NEITHER BLOOMBERG NOR BARCLAYS MAKES ANY EXPRESS OR IMPLIED WARRANTIES, AND EACH HEREBY EXPRESSLY DISCLAIMS ALL WARRANTIES OF MERCHANTABILITY OR FITNESS FOR A PARTICULAR PURPOSE OR USE WITH RESPECT TO THE BLOOMBERG BARCLAYS INDEX OR ANY DATA INCLUDED THEREIN. BLOOMBERG RESERVES THE RIGHT TO CHANGE THE METHODS OF CALCULATION OR PUBLICATION, OR TO CEASE THE CALCULATION OR PUBLICATION OF THE BLOOMBERG BARCLAYS INDEX, AND NEITHER BLOOMBERG NOR BARCLAYS SHALL BE LIABLE FOR ANY MISCALCULATION OF OR ANY INCORRECT, DELAYED OR INTERRUPTED PUBLICATION WITH RESPECT TO THE BLOOMBERG BARCLAYS INDEX. NEITHER BLOOMBERG NOR BARCLAYS SHALL BE LIABLE FOR ANY DAMAGES, INCLUDING, WITHOUT LIMITATION, ANY SPECIAL, INDIRECT OR CONSEQUENTIAL DAMAGES, OR ANY LOST PROFITS AND EVEN IF ADVISED OF THE POSSIBILITY OF SUCH, RESULTING FROM THE USE OF A BLOOMBERG BARCLAYS INDEX OR ANY DATA INCLUDED THEREIN OR WITH RESPECT TO THE EXTENDED DURATION TREASURY INDEX FUND.
None of the information supplied by Bloomberg or Barclays and used in this publication may be reproduced in any manner without the prior written permission of both Bloomberg and Barclays Capital, the investment banking division of Barclays Bank Plc. Barclays Bank Plc is registered in England No. 1026167. Registered office 1 Churchill Place London E14 5HP.
© 2020 Bloomberg. Used with Permission.
Source: Bloomberg Index Services Limited. Copyright 2020, Bloomberg. All rights reserved.
This page intentionally left blank.
This page intentionally left blank.
This page intentionally left blank.
The People Who Govern Your Fund
The trustees of your mutual fund are there to see that the fund is operated and managed in your best interests since, as a shareholder, you are a part owner of the fund. Your fund’s trustees also serve on the board of directors of The Vanguard Group, Inc., which is owned by the Vanguard funds and provides services to them.
A majority of Vanguard’s board members are independent, meaning that they have no affiliation with Vanguard or the funds they oversee, apart from the sizable personal investments they have made as private individuals. The independent board members have distinguished backgrounds in business, academia, and public service. Each of the trustees and executive officers oversees 212 Vanguard funds.
Information for each trustee and executive officer of the fund appears below. That information, as well as the Vanguard fund count, is as of the date on the cover of this fund report. The mailing address of the trustees and officers is P.O. Box 876, Valley Forge, PA 19482. More information about the trustees is in the Statement of Additional Information, which can be obtained, without charge, by contacting Vanguard at 800-662-7447, or online at vanguard.com.
Interested Trustee1
Mortimer J. Buckley
Born in 1969. Trustee since January 2018. Principal occupation(s) during the past five years and other experience: chairman of the board (2019–present) of Vanguard and of each of the investment companies served by Vanguard; chief executive officer (2018–present) of Vanguard; chief executive officer, president, and trustee (2018–present) of each of the investment companies served by Vanguard; president and director (2017–present) of Vanguard; and president (2018–present) of Vanguard Marketing Corporation. Chief investment officer (2013–2017), managing director (2002–2017), head of the Retail Investor Group (2006–2012), and chief information officer (2001–2006) of Vanguard. Chairman of the board (2011–2017) and trustee (2009–2017) of the Children’s Hospital of Philadelphia; and trustee (2018–present) and vice chair (2019–present) of The Shipley School.
Independent Trustees
Emerson U. Fullwood
Born in 1948. Trustee since January 2008. Principal occupation(s) during the past five years and other experience: executive chief staff and marketing officer for North America and corporate vice president (retired 2008) of Xerox Corporation (document management products and services). Former president of the Worldwide Channels Group, Latin America, and Worldwide Customer Service and executive chief staff officer of Developing Markets of Xerox. Executive in residence and 2009–2010 Distinguished Minett Professor at the Rochester Institute of Technology. Director of SPX FLOW, Inc. (multi-industry manufacturing). Director of the University of Rochester Medical Center, the Monroe Community College Foundation, the United Way of Rochester, North Carolina A&T University, and Roberts Wesleyan College. Trustee of the University of Rochester.
Amy Gutmann
Born in 1949. Trustee since June 2006. Principal occupation(s) during the past five years and other experience: president (2004–present) of the University of Pennsylvania. Christopher H. Browne Distinguished Professor of Political Science, School of Arts and Sciences, and professor of communication, Annenberg School for Communication, with secondary faculty appointments in the Department of Philosophy, School of Arts and Sciences, and at the Graduate School of Education, University of Pennsylvania.
F. Joseph Loughrey
Born in 1949. Trustee since October 2009. Principal occupation(s) during the past five years and other experience: president and chief operating officer (retired 2009) and vice chairman of the board (2008–2009) of Cummins Inc. (industrial machinery). Chairman of the board of Hillenbrand, Inc. (specialized consumer services) and the Lumina Foundation. Director of the V Foundation. Member of the advisory
| 1 | Mr. Buckley is considered an “interested person,” as defined in the Investment Company Act of 1940, because he is an officer of the Vanguard funds. |
council for the College of Arts and Letters and chair of the advisory board to the Kellogg Institute for International Studies, both at the University of Notre Dame.
Mark Loughridge
Born in 1953. Trustee since March 2012. Principal occupation(s) during the past five years and other experience: senior vice president and chief financial officer (retired 2013) of IBM (information technology services). Fiduciary member of IBM’s Retirement Plan Committee (2004–2013), senior vice president and general manager (2002–2004) of IBM Global Financing, vice president and controller (1998–2002) of IBM, and a variety of other prior management roles at IBM. Member of the Council on Chicago Booth.
Scott C. Malpass
Born in 1962. Trustee since March 2012. Principal occupation(s) during the past five years and other experience: chief investment officer (retired June 2020) and vice president (retired June 2020) of the University of Notre Dame. Assistant professor of finance at the Mendoza College of Business, University of Notre Dame, and member of the Notre Dame 403(b) Investment Committee (retired June 2020). Member of the board of Catholic Investment Services, Inc. (investment advisors) and the board of superintendence of the Institute for the Works of Religion.
Deanna Mulligan
Born in 1963. Trustee since January 2018. Principal occupation(s) during the past five years and other experience: chief executive officer (2011–present) of The Guardian Life Insurance Company of America. President (2010–2019), chief operating officer (2010–2011), and executive vice president (2008–2010) of Individual Life and Disability of The Guardian Life Insurance Company of America. Member of the board of The Guardian Life Insurance Company of America, the American Council of Life Insurers, and the Economic Club of New York. Trustee of the Partnership for New York City (business leadership), Chief Executives for Corporate Purpose, NewYork-Presbyterian Hospital, Catalyst, and the Bruce Museum (arts and science). Member of the Advisory Council for the Stanford Graduate School of Business.
André F. Perold
Born in 1952. Trustee since December 2004. Principal occupation(s) during the past five years and other experience: George Gund Professor of Finance and Banking, Emeritus at the Harvard Business School (retired 2011). Chief investment officer and co-managing partner of HighVista Strategies (private investment firm). Member of the board of advisors and member of the investment committee of the Museum of Fine Arts Boston. Member of the board (2018–present) of RIT Capital Partners (investment firm). Member of the investment committee of Partners Health Care System.
Sarah Bloom Raskin
Born in 1961. Trustee since January 2018. Principal occupation(s) during the past five years and other experience: deputy secretary (2014–2017) of the United States Department of the Treasury. Governor (2010–2014) of the Federal Reserve Board. Commissioner (2007–2010) of financial regulation for the State of Maryland. Member of the board of directors (2012–2014) of Neighborhood Reinvestment Corporation. Director (2017–present) of i(x) Investments, LLC; director (2017–present) of Reserve Trust. Rubenstein Fellow (2017–present) of Duke University; trustee (2017–present) of Amherst College, and trustee (2019–present) of the Folger Shakespeare Library.
Peter F. Volanakis
Born in 1955. Trustee since July 2009. Principal occupation(s) during the past five years and other experience: president and chief operating officer (retired 2010) of Corning Incorporated (communications equipment) and director of Corning Incorporated (2000–2010) and Dow Corning (2001–2010). Director (2012) of SPX Corporation (multi-industry manufacturing). Overseer of the Amos Tuck School of Business Administration, Dartmouth College (2001–2013). Chairman of the board of trustees of Colby-Sawyer College. Member of the board of Hypertherm Inc. (industrial cutting systems, software, and consumables).
Executive Officers
John Bendl
Born in 1970. Principal occupation(s) during the past five years and other experience: principal of Vanguard. Chief financial officer (2019–present) of each of the investment companies served by Vanguard. Chief accounting officer, treasurer, and controller of Vanguard (2017–present). Partner (2003–2016) at KPMG (audit, tax, and advisory services).
Glenn Booraem
Born in 1967. Principal occupation(s) during the past five years and other experience: principal of Vanguard. Investment stewardship officer (2017–present), treasurer (2015–2017), controller (2010–2015), and assistant controller (2001–2010) of each of the investment companies served by Vanguard.
Christine M. Buchanan
Born in 1970. Principal occupation(s) during the past five years and other experience: principal of Vanguard. Treasurer (2017–present) of each of the investment companies served by Vanguard. Partner (2005–2017) at KPMG (audit, tax, and advisory services).
David Cermak
Born in 1960. Principal occupation(s) during the past five years and other experience: principal of Vanguard. Finance director (2019–present) of each of the investment companies served by Vanguard. Managing director and head (2017–present) of Vanguard Investments Singapore. Managing director and head (2017–2019) of Vanguard Investments Hong Kong. Representative director and head (2014–2017) of Vanguard Investments Japan.
Thomas J. Higgins
Born in 1957. Principal occupation(s) during the past five years and other experience: principal of Vanguard. Finance director (2019–present), chief financial officer (2008–2019), and treasurer (1998–2008) of each of the investment companies served by Vanguard.
Peter Mahoney
Born in 1974. Principal occupation(s) during the past five years and other experience: principal of Vanguard. Controller (2015–present) of each of the investment companies served by Vanguard. Head of International Fund Services (2008–2014) at Vanguard.
Anne E. Robinson
Born in 1970. Principal occupation(s) during the past five years and other experience: general counsel (2016–present) of Vanguard. Secretary (2016–present) of Vanguard and of each of the investment companies served by Vanguard. Managing director (2016–present) of Vanguard. Managing director and general counsel of Global Cards and Consumer Services (2014–2016) at Citigroup. Counsel (2003–2014) at American Express.
Michael Rollings
Born in 1963. Principal occupation(s) during the past five years and other experience: finance director (2017–present) and treasurer (2017) of each of the investment companies served by Vanguard. Managing director (2016–present) of Vanguard. Chief financial officer (2016–present) of Vanguard. Director (2016–present) of Vanguard Marketing Corporation. Executive vice president and chief financial officer (2006–2016) of MassMutual Financial Group.
John E. Schadl
Born in 1972. Principal occupation(s) during the past five years and other experience: principal of Vanguard. Chief compliance officer (2019–present) of Vanguard and of each of the investment companies served by Vanguard. Assistant vice president (2019–present) of Vanguard Marketing Corporation.
| Vanguard Senior Management Team |
| | |
| Joseph Brennan | Chris D. McIsaac |
| Mortimer J. Buckley | James M. Norris |
| Gregory Davis | Thomas M. Rampulla |
| John James | Karin A. Risi |
| Martha G. King | Anne E. Robinson |
| John T. Marcante | Michael Rollings |

Connect with Vanguard® > vanguard.com
Fund Information > 800-662-7447
Direct Investor Account Services > 800-662-2739
Institutional Investor Services > 800-523-1036
Text Telephone for People
Who Are Deaf or Hard of Hearing > 800-749-7273
This material may be used in conjunction with the offering of shares of any Vanguard fund only if preceded or accompanied by the fund’s current prospectus.
All comparative mutual fund data are from Morningstar, Inc., unless otherwise noted.
You can obtain a free copy of Vanguard’s proxy voting guidelines by visiting vanguard.com/proxyreporting or by calling Vanguard at 800-662-2739. The guidelines are also available from the SEC’s website, www.sec.gov. In addition, you may obtain a free report on how your fund voted the proxies for securities it owned during the 12 months ended June 30. To get the report, visit either vanguard.com/proxyreporting or www.sec.gov.
You can review information about your fund on the SEC’s website, and you can receive copies of this information, for a fee, by sending a request via email addressed to publicinfo@sec.gov.
| | © 2020 The Vanguard Group, Inc. |
| | All rights reserved. |
| | U.S. Patent Nos. 6,879,964; 7,337,138; |
| | 7,720,749; 7,925,573; 8,090,646;8,417,623; and 8,626,636. |
| | Vanguard Marketing Corporation, Distributor. |
| | |
| | Q12750 102020 |

| | |
| | |
| | |
| | |
| Annual Report | August 31, 2020 | |
| | |
| | |
| Vanguard Mega Cap Index Funds |
| | |
| | |
| | |
| | |
| | |
| | |
| | |
| | |
| | |
| | |
| | |
| Vanguard Mega Cap Index Fund | |
| | |
| Vanguard Mega Cap Growth Index Fund | |
| | |
| Vanguard Mega Cap Value Index Fund | |
| | |
| | |
| | |
| | |
| | |
| | |
| | |
| | |
| | |
| | |
| | |
| | |
| | |
| | |
| | |
| | |
| | |
| | |
| | |
| | |
| | |
| See the inside front cover for important information about access to your fund’s annual and semiannual shareholder reports. |
| | |
Important information about access to shareholder reports
Beginning on January 1, 2021, as permitted by regulations adopted by the Securities and Exchange Commission, paper copies of your fund’s annual and semiannual shareholder reports will no longer be sent to you by mail, unless you specifically request them. Instead, you will be notified by mail each time a report is posted on the website and will be provided with a link to access the report.
If you have already elected to receive shareholder reports electronically, you will not be affected by this change and do not need to take any action. You may elect to receive shareholder reports and other communications from the fund electronically by contacting your financial intermediary (such as a broker-dealer or bank) or, if you invest directly with the fund, by calling Vanguard at one of the phone numbers on the back cover of this report or by logging on to vanguard.com.
You may elect to receive paper copies of all future shareholder reports free of charge. If you invest through a financial intermediary, you can contact the intermediary to request that you continue to receive paper copies. If you invest directly with the fund, you can call Vanguard at one of the phone numbers on the back cover of this report or log on to vanguard.com. Your election to receive paper copies will apply to all the funds you hold through an intermediary or directly with Vanguard.
| Contents | |
| | |
| Your Fund’s Performance at a Glance | 1 |
| | |
| About Your Fund’s Expenses | 2 |
| | |
| Mega Cap Index Fund | 4 |
| | |
| Mega Cap Growth Index Fund | 22 |
| | |
| Mega Cap Value Index Fund | 39 |
| | |
| Trustees Approve Advisory Arrangements | 58 |
| | |
| Liquidity Risk Management | 60 |
Please note: The opinions expressed in this report are just that—informed opinions. They should not be considered promises or advice. Also, please keep in mind that the information and opinions cover the period through the date on the front of this report. Of course, the risks of investing in your fund are spelled out in the prospectus.
Your Fund’s Performance at a Glance
· For the 12 months ended August 31, 2020, returns for the three Vanguard Mega Cap Index Funds ranged from about 3% for Vanguard Value Index Fund to about 50% for Vanguard Growth Index Fund. Vanguard Mega Cap Index Fund returned about 26%. Each fund closely tracked its target index.
· The period was marked by historic levels of volatility. After falling from highs in the early part of 2020, the broad U.S. stock market began a rebound. In August, it climbed to a record high as the response of some major central banks and governments to the spread of the coronavirus and vaccine hopes lifted investor sentiment. U.S. stocks rebounded more strongly than developed markets outside the United States and emerging markets.
· Large-capitalization stocks outperformed their mid- and small-cap counterparts for the period, and growth stocks surpassed value.
· Information technology stocks, a top contributor to returns for all three funds, benefited from the pandemic-induced online environment and the increased use of digital services.
· Oil and gas stocks were among the weakest performers for all three funds as the pandemic severely reduced global demand for oil.
| Market Barometer | | | |
| | | | |
| | | Average Annual Total Returns |
| | | Periods Ended August 31, 2020 |
| | One Year | Three Years | Five Years |
| Stocks | | | |
| Russell 1000 Index (Large-caps) | 22.50% | 14.58% | 14.31% |
| Russell 2000 Index (Small-caps) | 6.02 | 5.03 | 7.65 |
| Russell 3000 Index (Broad U.S. market) | 21.44 | 13.95 | 13.86 |
| FTSE All-World ex US Index (International) | 8.78 | 2.92 | 6.00 |
| | | | |
| Bonds | | | |
Bloomberg Barclays U.S. Aggregate Bond Index
(Broad taxable market) | 6.47% | 5.09% | 4.33% |
Bloomberg Barclays Municipal Bond Index
(Broad tax-exempt market) | 3.24 | 4.09 | 3.99 |
| FTSE Three-Month U.S. Treasury Bill Index | 1.18 | 1.67 | 1.15 |
| | | | |
| CPI | | | |
| Consumer Price Index | 1.31% | 1.92% | 1.75% |
About Your Fund’s Expenses
As a shareholder of the fund, you incur ongoing costs, which include costs for portfolio management, administrative services, and shareholder reports (like this one), among others. Operating expenses, which are deducted from a fund’s gross income, directly reduce the investment return of the fund.
A fund’s expenses are expressed as a percentage of its average net assets. This figure is known as the expense ratio. The following examples are intended to help you understand the ongoing costs (in dollars) of investing in your fund and to compare these costs with those of other mutual funds. The examples are based on an investment of $1,000 made at the beginning of the period shown and held for the entire period.
The accompanying table illustrates your fund’s costs in two ways:
· Based on actual fund return. This section helps you to estimate the actual expenses that you paid over the period. The “Ending Account Value” shown is derived from the fund’s actual return, and the third column shows the dollar amount that would have been paid by an investor who started with $1,000 in the fund. You may use the information here, together with the amount you invested, to estimate the expenses that you paid over the period.
To do so, simply divide your account value by $1,000 (for example, an $8,600 account value divided by $1,000 = 8.6), then multiply the result by the number given for your fund under the heading “Expenses Paid During Period.”
· Based on hypothetical 5% yearly return. This section is intended to help you compare your fund’s costs with those of other mutual funds. It assumes that the fund had a yearly return of 5% before expenses, but that the expense ratio is unchanged. In this case—because the return used is not the fund’s actual return—the results do not apply to your investment. The example is useful in making comparisons because the Securities and Exchange Commission requires all mutual funds to calculate expenses based on a 5% return. You can assess your fund’s costs by comparing this hypothetical example with the hypothetical examples that appear in shareholder reports of other funds.
Note that the expenses shown in the table are meant to highlight and help you compare ongoing costs only and do not reflect transaction costs incurred by the fund for buying and selling securities. Further, the expenses do not include any purchase, redemption, or account service fees described in the fund prospectus. If such fees were applied to your account, your costs would be higher. Your fund does not carry a “sales load.”
The calculations assume no shares were bought or sold during the period. Your actual costs may have been higher or lower, depending on the amount of your investment and the timing of any purchases or redemptions.
You can find more information about the fund’s expenses, including annual expense ratios, in the Financial Statements section of this report. For additional information on operating expenses and other shareholder costs, please refer to your fund’s current prospectus.
| Six Months Ended August 31, 2020 | | | |
| | | | |
| | Beginning | Ending | Expenses |
| | Account Value | Account Value | Paid During |
| | 2/29/2020 | 8/31/2020 | Period |
| Based on Actual Fund Return | | | |
| Mega Cap Index Fund | | | |
| ETF Shares | $1,000.00 | $1,226.95 | $0.39 |
| Institutional Shares | 1,000.00 | 1,227.41 | 0.34 |
| Mega Cap Growth Index Fund | | | |
| ETF Shares | $1,000.00 | $1,396.98 | $0.42 |
| Institutional Shares | 1,000.00 | 1,397.18 | 0.36 |
| Mega Cap Value Index Fund | | | |
| ETF Shares | $1,000.00 | $1,044.88 | $0.36 |
| Institutional Shares | 1,000.00 | 1,045.48 | 0.31 |
| Based on Hypothetical 5% Yearly Return | | | |
| Mega Cap Index Fund | | | |
| ETF Shares | $1,000.00 | $1,024.78 | $0.36 |
| Institutional Shares | 1,000.00 | 1,024.83 | 0.31 |
| Mega Cap Growth Index Fund | | | |
| ETF Shares | $1,000.00 | $1,024.78 | $0.36 |
| Institutional Shares | 1,000.00 | 1,024.83 | 0.31 |
| Mega Cap Value Index Fund | | | |
| ETF Shares | $1,000.00 | $1,024.78 | $0.36 |
| Institutional Shares | 1,000.00 | 1,024.83 | 0.31 |
The calculations are based on expenses incurred in the most recent six-month period. The funds’ annualized six-month expense ratios for that period are: for the Mega Cap Index Fund, 0.07% for ETF Shares and 0.06% for Institutional Shares; for the Mega Cap Growth Index Fund, 0.07% for ETF Shares and 0.06% for Institutional Shares; and for the Mega Cap Value Index Fund, 0.07% for ETF Shares and 0.06% for Institutional Shares. The dollar amounts shown as “Expenses Paid” are equal to the annualized expense ratio multiplied by the average account value over the period, multiplied by the number of days in the most recent six-month period, then divided by the number of days in the most recent 12-month period (184/366).
Mega Cap Index Fund
Performance Summary
All of the returns in this report represent past performance, which is not a guarantee of future results that may be achieved by the fund. (Current performance may be lower or higher than the performance data cited. For performance data current to the most recent month-end, visit our website at vanguard.com/performance.) Note, too, that both investment returns and principal value can fluctuate widely, so an investor’s shares, when sold, could be worth more or less than their original cost. The returns shown do not reflect taxes that a shareholder would pay on fund distributions or on the sale of fund shares.
Cumulative Performance: August 31, 2010, Through August 31, 2020
Initial Investment of $10,000
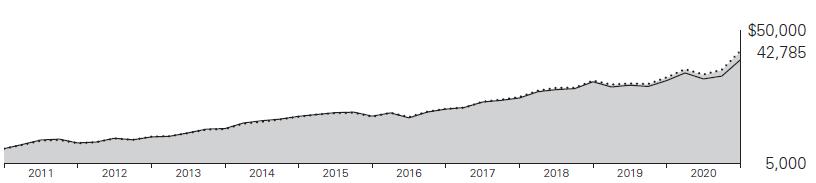
| | | Average Annual Total Returns | |
| | | Periods Ended August 31, 2020 | |
| | | | | | Final Value |
| | | One | Five | Ten | of a $10,000 |
| | | Year | Years | Years | Investment |
 | Mega Cap Index Fund ETF Shares Net Asset Value | 26.14% | 15.60% | 15.65% | $42,785 |
| | Mega Cap Index Fund ETF Shares Market Price | 26.31 | 15.61 | 15.67 | 42,860 |
 | Spliced Mega Cap Index | 26.25 | 15.65 | 15.73 | 43,090 |
 | Dow Jones U.S. Total Stock Market Float Adjusted Index | 21.20 | 13.77 | 14.88 | 40,053 |
Spliced Mega Cap Index: MSCI US Large Cap 300 Index through January 30, 2013; CRSP US Mega Cap Index thereafter.
| | | | | Final Value |
| | One | Five | Ten | of a $5,000,000 |
| | Year | Years | Years | Investment |
| Mega Cap Index Fund Institutional Shares | 26.19% | 15.61% | 15.67% | $21,437,860 |
| Spliced Mega Cap Index | 26.25 | 15.65 | 15.73 | 21,544,783 |
| Dow Jones U.S. Total Stock Market Float Adjusted Index | 21.20 | 13.77 | 14.88 | 20,026,347 |
See Financial Highlights for dividend and capital gains information.
Mega Cap Index Fund
Cumulative Returns of ETF Shares: August 31, 2010, Through August 31, 2020
| | One | Five | Ten |
| | Year | Years | Years |
| Mega Cap Index Fund ETF Shares Market Price | 26.31% | 106.50% | 328.60% |
| Mega Cap Index Fund ETF Shares Net Asset Value | 26.14 | 106.39 | 327.85 |
| Spliced Mega Cap Index | 26.25 | 106.87 | 330.90 |
For the ETF Shares, the market price is determined by the midpoint of the bid-offer spread as of the closing time of the New York Stock Exchange (generally 4 p.m., Eastern time). The net asset value is also determined as of the NYSE closing time. For more information about how the ETF Shares’ market prices have compared with their net asset value, visit vanguard.com, select your ETF, and then select the Price and Performance tab. The ETF premium/discount analysis there shows the percentages of days on which the ETF Shares’ market price was above or below the NAV.
Mega Cap Index Fund
Fund Allocation
As of August 31, 2020
| Basic Materials | 1.4% |
| Consumer Goods | 8.3 |
| Consumer Services | 15.8 |
| Financials | 13.7 |
| Health Care | 13.4 |
| Industrials | 9.8 |
| Oil & Gas | 2.2 |
| Technology | 31.2 |
| Telecommunications | 2.1 |
| Utilities | 2.1 |
The table reflects the fund’s investments, except for short-term investments and derivatives. Sector categories are based on the Industry Classification Benchmark (“ICB”), except for the “Other” category (if applicable), which includes securities that have not been provided a ICB classification as of the effective reporting period.
The fund may invest in derivatives (such as futures and swap contracts) for various reasons, including, but not limited to, attempting to remain fully invested and tracking its target index as closely as possible.
The Industry Classification Benchmark (“ICB”) is owned by FTSE. FTSE does not accept any liability to any person for any loss or damage arising out of any error or omission in the ICB.
Mega Cap Index Fund
Financial Statements
Schedule of Investments
As of August 31, 2020
The fund files its complete schedule of portfolio holdings with the Securities and Exchange Commission (SEC) for the first and third quarters of each fiscal year as an exhibit to its reports on Form N-PORT. The fund’s Form N-PORT reports are available on the SEC’s website at www.sec.gov.
| | | | | Market |
| | | | | Value· |
| | | Shares | | ($000) |
| Common Stocks (99.6%) | | | |
| Basic Materials (1.4%) | | | |
| | Linde plc | 66,180 | | 16,528 |
| | Air Products & Chemicals Inc. | 27,869 | | 8,145 |
| | Ecolab Inc. | 32,258 | | 6,358 |
| | Dow Inc. | 93,576 | | 4,222 |
| | PPG Industries Inc. | 29,770 | | 3,584 |
| | Newmont Corp. | 50,496 | | 3,397 |
| | LyondellBasell Industries NV Class A | 31,537 | | 2,065 |
| | | | | 44,299 |
| Consumer Goods (8.3%) | | | |
| * | Tesla Inc. | 93,622 | | 46,654 |
| | Procter & Gamble Co. | 311,884 | | 43,143 |
| | PepsiCo Inc. | 174,830 | | 24,487 |
| | Coca-Cola Co. | 487,067 | | 24,124 |
| | NIKE Inc. Class B | 156,185 | | 17,475 |
| | Philip Morris International Inc. | 196,187 | | 15,654 |
| | Mondelez International Inc. Class A | 179,852 | | 10,507 |
| | Altria Group Inc. | 234,166 | | 10,242 |
| | Colgate-Palmolive Co. | 107,982 | | 8,559 |
| | Activision Blizzard Inc. | 97,050 | | 8,106 |
| | Kimberly-Clark Corp. | 42,945 | | 6,775 |
| | Estee Lauder Cos. Inc. Class A | 25,522 | | 5,659 |
| * | Electronic Arts Inc. | 36,279 | | 5,060 |
| | General Mills Inc. | 76,378 | | 4,884 |
| | General Motors Co. | 162,323 | | 4,810 |
| * | Monster Beverage Corp. | 46,434 | | 3,894 |
| | Constellation Brands Inc. Class A | 20,092 | | 3,707 |
| | Ford Motor Co. | 492,316 | | 3,358 |
| | Archer-Daniels-Midland Co. | 70,194 | | 3,142 |
| | Kraft Heinz Co. | 84,641 | | 2,966 |
| | Brown-Forman Corp. Class B | 38,944 | | 2,849 |
| | Hershey Co. | 18,539 | | 2,756 |
| | VF Corp. | 39,182 | | 2,576 |
| | Keurig Dr Pepper Inc. | 53,153 | | 1,585 |
| | Corteva Inc. | 47,218 | | 1,348 |
| | Tyson Foods Inc. Class A | 18,540 | | 1,164 |
| | Kellogg Co. | 16,208 | | 1,149 |
| | | | | 266,633 |
| Consumer Services (15.7%) | | | |
| * | Amazon.com Inc. | 53,455 | | 184,471 |
| | Home Depot Inc. | 135,495 | | 38,622 |
| | Walt Disney Co. | 227,532 | | 30,005 |
| * | Netflix Inc. | 55,388 | | 29,331 |
| | Comcast Corp. Class A | 573,923 | | 25,718 |
| | Walmart Inc. | 178,507 | | 24,786 |
| | McDonald’s Corp. | 93,700 | | 20,007 |
| | Costco Wholesale Corp. | 55,655 | | 19,349 |
| | Lowe’s Cos. Inc. | 95,147 | | 15,670 |
| | Starbucks Corp. | 147,241 | | 12,438 |
| * | Charter Communications Inc. Class A | 18,237 | | 11,227 |
| | CVS Health Corp. | 164,668 | | 10,229 |
| * | Booking Holdings Inc. | 5,136 | | 9,812 |
| | Target Corp. | 63,052 | | 9,534 |
| | TJX Cos. Inc. | 136,017 | | 7,452 |
| | Dollar General Corp. | 31,764 | | 6,413 |
| * | Uber Technologies Inc. | 141,995 | | 4,775 |
| | eBay Inc. | 84,158 | | 4,610 |
| * | O’Reilly Automotive Inc. | 9,285 | | 4,323 |
| | Ross Stores Inc. | 44,625 | | 4,064 |
| | Yum! Brands Inc. | 38,082 | | 3,650 |
| | Sysco Corp. | 60,476 | | 3,637 |
| | Walgreens Boots Alliance Inc. | 93,775 | | 3,565 |
| | Kroger Co. | 94,168 | | 3,360 |
| | Marriott International Inc. Class A | 30,645 | | 3,154 |
Mega Cap Index Fund
| | | | | Market |
| | | | | Value· |
| | | Shares | | ($000) |
| | Hilton Worldwide Holdings Inc. | 34,730 | | 3,138 |
| | McKesson Corp. | 20,356 | | 3,123 |
| | Southwest Airlines Co. | 74,212 | | 2,789 |
| | Las Vegas Sands Corp. | 47,998 | | 2,434 |
| * | AutoZone Inc. | 1,515 | | 1,812 |
| | Delta Air Lines Inc. | 40,192 | | 1,240 |
| | Sirius XM Holdings Inc. | 136,085 | | 799 |
| | Fox Corp. Class A | 18,936 | | 528 |
| | Fox Corp. Class B | 12,748 | | 354 |
| | | | | 506,419 |
| Financials (13.7%) | | | |
| * | Berkshire Hathaway Inc. | | | |
| | Class B | 230,727 | | 50,308 |
| | Visa Inc. Class A | 212,581 | | 45,065 |
| | Mastercard Inc. Class A | 112,628 | | 40,342 |
| | JPMorgan Chase & Co. | 364,702 | | 36,539 |
| | Bank of America Corp. | 983,898 | | 25,326 |
| | American Tower Corp. | 55,859 | | 13,917 |
| | Citigroup Inc. | 262,283 | | 13,408 |
| | Wells Fargo & Co. | 464,501 | | 11,218 |
| | S&P Global Inc. | 30,368 | | 11,127 |
| | BlackRock Inc. | 18,295 | | 10,871 |
| | Prologis Inc. | 93,041 | | 9,477 |
| | Goldman Sachs Group Inc. | 43,336 | | 8,878 |
| | Equinix Inc. | 11,127 | | 8,788 |
| | Crown Castle International Corp. | 52,527 | | 8,575 |
| | CME Group Inc. | 45,215 | | 7,952 |
| | Morgan Stanley | 148,960 | | 7,785 |
| | American Express Co. | 76,042 | | 7,725 |
| | Marsh & McLennan Cos. Inc. | 64,326 | | 7,392 |
| | Intercontinental Exchange Inc. | 68,950 | | 7,325 |
| | Progressive Corp. | 73,692 | | 7,004 |
| | Truist Financial Corp. | 169,758 | | 6,588 |
| | US Bancorp | 170,804 | | 6,217 |
| | Chubb Ltd. | 48,285 | | 6,036 |
| | Moody’s Corp. | 20,033 | | 5,903 |
| | Aon plc Class A | 29,148 | | 5,829 |
| | PNC Financial Services Group Inc. | 50,780 | | 5,647 |
| | Charles Schwab Corp. | 146,023 | | 5,188 |
| | Blackstone Group LP Class A | 84,462 | | 4,472 |
| | Public Storage | 18,754 | | 3,983 |
| | Capital One Financial Corp. | 57,370 | | 3,960 |
| | T. Rowe Price Group Inc. | 27,195 | | 3,786 |
| | Bank of New York Mellon Corp. | 100,452 | | 3,715 |
| | Travelers Cos. Inc. | 31,804 | | 3,691 |
| | Allstate Corp. | 39,578 | | 3,681 |
| | Prudential Financial Inc. | 49,670 | | 3,366 |
| | MetLife Inc. | 85,876 | | 3,303 |
| | American International Group Inc. | 108,751 | | 3,169 |
| | Aflac Inc. | 85,860 | | 3,118 |
| | Welltower Inc. | 52,617 | | 3,027 |
| | State Street Corp. | 42,171 | | 2,871 |
| | Equity Residential | 46,915 | | 2,648 |
| | Simon Property Group Inc. | 38,514 | | 2,613 |
| * | Berkshire Hathaway Inc. Class A | 5 | | 1,638 |
| | TD Ameritrade Holding Corp. | 34,362 | | 1,319 |
| | Discover Financial Services | 19,305 | | 1,025 |
| | Northern Trust Corp. | 12,484 | | 1,022 |
| | Ventas Inc. | 23,560 | | 971 |
| | Fifth Third Bancorp | 44,886 | | 927 |
| | Boston Properties Inc. | 8,798 | | 764 |
| * | Rocket Cos. Inc. Class A | 12,572 | | 352 |
| | | | | 439,851 |
| Health Care (13.3%) | | | |
| | Johnson & Johnson | 331,921 | | 50,920 |
| | UnitedHealth Group Inc. | 119,524 | | 37,357 |
| | Merck & Co. Inc. | 317,999 | | 27,116 |
| | Pfizer Inc. | 699,889 | | 26,449 |
| | Abbott Laboratories | 222,814 | | 24,391 |
| | Thermo Fisher Scientific Inc. | 49,741 | | 21,338 |
| | AbbVie Inc. | 221,994 | | 21,260 |
| | Amgen Inc. | 74,161 | | 18,786 |
| | Medtronic plc | 168,800 | | 18,141 |
| | Bristol-Myers Squibb Co. | 285,162 | | 17,737 |
| | Danaher Corp. | 80,237 | | 16,567 |
| | Eli Lilly and Co. | 108,474 | | 16,096 |
| * | Intuitive Surgical Inc. | 14,675 | | 10,725 |
| | Gilead Sciences Inc. | 158,071 | | 10,551 |
| | Zoetis Inc. | 59,829 | | 9,579 |
| * | Vertex Pharmaceuticals Inc. | 32,686 | | 9,123 |
| | Becton Dickinson and Co. | 37,184 | | 9,027 |
| | Anthem Inc. | 31,754 | | 8,939 |
| | Stryker Corp. | 42,575 | | 8,437 |
| | Cigna Corp. | 46,460 | | 8,241 |
| * | Regeneron Pharmaceuticals Inc. | 12,079 | | 7,488 |
| * | Boston Scientific Corp. | 179,513 | | 7,364 |
| | Humana Inc. | 16,646 | | 6,911 |
| * | Edwards Lifesciences Corp. | 78,220 | | 6,714 |
| * | Illumina Inc. | 18,525 | | 6,618 |
Mega Cap Index Fund
| | | | | Market |
| | | | | Value· |
| | | Shares | | ($000) |
| * | Biogen Inc. | 20,591 | | 5,923 |
| | Baxter International Inc. | 63,957 | | 5,569 |
| | HCA Healthcare Inc. | 34,034 | | 4,619 |
| | Zimmer Biomet Holdings Inc. | 26,028 | | 3,667 |
| * | Alexion Pharmaceuticals Inc. | 26,385 | | 3,014 |
| | | | | 428,667 |
| Industrials (9.7%) | | | |
| * | PayPal Holdings Inc. | 147,947 | | 30,202 |
| | Accenture plc Class A | 80,220 | | 19,247 |
| | Union Pacific Corp. | 85,468 | | 16,447 |
| | Honeywell International Inc. | 88,426 | | 14,639 |
| | United Parcel Service Inc. Class B | 88,723 | | 14,517 |
| | 3M Co. | 72,473 | | 11,815 |
| | Fidelity National Information Services Inc. | 77,813 | | 11,738 |
| | Lockheed Martin Corp. | 30,076 | | 11,737 |
| | Raytheon Technologies Corp. | 190,992 | | 11,651 |
| | Boeing Co. | 67,518 | | 11,601 |
| | Caterpillar Inc. | 68,170 | | 9,701 |
| | Deere & Co. | 39,417 | | 8,280 |
| | CSX Corp. | 96,456 | | 7,375 |
| | Automatic Data Processing Inc. | 51,436 | | 7,154 |
| * | Fiserv Inc. | 71,652 | | 7,135 |
| | Illinois Tool Works Inc. | 35,796 | | 7,071 |
| | General Electric Co. | 1,102,072 | | 6,987 |
| | Sherwin-Williams Co. | 10,247 | | 6,876 |
| | Norfolk Southern Corp. | 32,307 | | 6,866 |
| | Global Payments Inc. | 37,712 | | 6,661 |
| | FedEx Corp. | 29,598 | | 6,507 |
| | Northrop Grumman Corp. | 18,962 | | 6,497 |
| | Waste Management Inc. | 53,387 | | 6,086 |
| | Emerson Electric Co. | 75,267 | | 5,229 |
| | Eaton Corp. plc | 50,441 | | 5,150 |
| | DuPont de Nemours Inc. | 92,272 | | 5,145 |
| | General Dynamics Corp. | 30,672 | | 4,581 |
| | TE Connectivity Ltd. | 41,699 | | 4,028 |
| | Agilent Technologies Inc. | 38,836 | | 3,900 |
| | Cummins Inc. | 18,588 | | 3,852 |
| | Johnson Controls International plc | 93,728 | | 3,818 |
| | PACCAR Inc. | 43,553 | | 3,739 |
| * | Square Inc. | 22,859 | | 3,647 |
| | Trane Technologies plc | 30,132 | | 3,567 |
| | Parker-Hannifin Corp. | 16,154 | | 3,328 |
| | Stanley Black & Decker Inc. | 20,128 | | 3,247 |
| | Paychex Inc. | 40,689 | | 3,111 |
| | Fortive Corp. | 38,233 | | 2,757 |
| | Republic Services Inc. Class A | 25,935 | | 2,405 |
| | Otis Worldwide Corp. | 27,243 | | 1,714 |
| | Rockwell Automation Inc. | 7,329 | | 1,690 |
| | Corning Inc. | 48,031 | | 1,559 |
| | | | | 313,257 |
| Oil & Gas (2.1%) | | | |
| | Exxon Mobil Corp. | 532,843 | | 21,282 |
| | Chevron Corp. | 235,232 | | 19,743 |
| | ConocoPhillips | 135,236 | | 5,124 |
| | Kinder Morgan Inc. | 242,391 | | 3,350 |
| | EOG Resources Inc. | 73,388 | | 3,327 |
| | Schlumberger Ltd. | 174,956 | | 3,326 |
| | Phillips 66 | 54,807 | | 3,205 |
| | Williams Cos. Inc. | 152,988 | | 3,176 |
| | Marathon Petroleum Corp. | 81,983 | | 2,907 |
| | Valero Energy Corp. | 51,196 | | 2,692 |
| | Pioneer Natural Resources Co. | 10,454 | | 1,086 |
| | | | | 69,218 |
| Technology (31.2%) | | | |
| | Apple Inc. | 1,965,944 | | 253,685 |
| | Microsoft Corp. | 955,461 | | 215,485 |
| * | Facebook Inc. Class A | 302,938 | | 88,821 |
| * | Alphabet Inc. Class A | 37,508 | | 61,120 |
| * | Alphabet Inc. Class C | 36,262 | | 59,259 |
| | NVIDIA Corp. | 73,618 | | 39,384 |
| * | Adobe Inc. | 60,741 | | 31,184 |
| * | salesforce.com Inc. | 107,554 | | 29,325 |
| | Intel Corp. | 533,496 | | 27,182 |
| | Cisco Systems Inc. | 478,881 | | 20,218 |
| | QUALCOMM Inc. | 141,702 | | 16,877 |
| | Broadcom Inc. | 47,839 | | 16,607 |
| | Texas Instruments Inc. | 115,595 | | 16,432 |
| | Oracle Corp. | 258,276 | | 14,779 |
| | International Business Machines Corp. | 111,823 | | 13,789 |
| * | Advanced Micro Devices Inc. | 147,381 | | 13,385 |
| * | ServiceNow Inc. | 24,049 | | 11,592 |
| | Intuit Inc. | 31,239 | | 10,790 |
| | Applied Materials Inc. | 115,449 | | 7,112 |
| * | Autodesk Inc. | 27,636 | | 6,790 |
| * | Micron Technology Inc. | 140,147 | | 6,378 |
| | Lam Research Corp. | 18,319 | | 6,161 |
| | Roper Technologies Inc. | 13,138 | | 5,612 |
| | Analog Devices Inc. | 46,443 | | 5,428 |
| * | Workday Inc. Class A | 21,906 | | 5,251 |
| | L3Harris Technologies Inc. | 27,247 | | 4,925 |
Mega Cap Index Fund
| | | | | Market |
| | | | | Value· |
| | | Shares | | ($000) |
| | Cognizant Technology Solutions Corp. Class A | 68,142 | | 4,556 |
| | HP Inc. | 180,131 | | 3,522 |
| * | Zoom Video Communications Inc. Class A | 10,000 | | 3,251 |
| * | Dell Technologies Inc. | 30,346 | | 2,005 |
| * | VMware Inc. Class A | 9,780 | | 1,413 |
| | | | | 1,002,318 |
| Telecommunications (2.1%) | | | |
| | Verizon Communications Inc. | 521,439 | | 30,906 |
| | AT&T Inc. | 897,768 | | 26,762 |
| * | T-Mobile US Inc. | 78,898 | | 9,206 |
| | | | | 66,874 |
| Utilities (2.1%) | | | |
| | NextEra Energy Inc. | 61,639 | | 17,208 |
| | Dominion Energy Inc. | 105,726 | | 8,293 |
| | Duke Energy Corp. | 92,593 | | 7,439 |
| | Southern Co. | 133,200 | | 6,950 |
| | American Electric Power Co. Inc. | 62,468 | | 4,924 |
| | Xcel Energy Inc. | 66,159 | | 4,597 |
| | Sempra Energy | 36,804 | | 4,551 |
| | Exelon Corp. | 122,659 | | 4,527 |
| | Public Service Enterprise Group Inc. | 63,719 | | 3,329 |
| | Consolidated Edison Inc. | 42,067 | | 3,001 |
| | PPL Corp. | 96,812 | | 2,675 |
| | Edison International | 23,862 | | 1,252 |
| | | | | 68,746 |
Total Common Stocks
(Cost $2,054,406) | | | 3,206,282 |
| Temporary Cash Investments (0.1%) | | |
| Money Market Fund (0.1%) | | | |
| 1 | Vanguard Market Liquidity Fund, 0.147% | 13,603 | | 1,360 |
| | | Face | | |
| | | Amount | | |
| | | ($000) | | |
| U.S. Government and Agency Obligations (0.0%) |
| 2 | United States Cash Management Bill, 0.116%, 9/29/20 | 50 | | 50 |
| 2 | United States Cash Management Bill, 0.140%,10/13/20 | 600 | | 600 |
| | | | | 650 |
Total Temporary Cash Investments
(Cost $2,010) | | 2,010 |
Total Investments (99.7%)
(Cost $2,056,416) | | 3,208,292 |
| Other Assets and Liabilities—Net (0.3%) | | 8,094 |
| Net Assets (100%) | | 3,216,386 |
Cost is in $000.
| · | See Note A in Notes to Financial Statements. |
| * | Non-income-producing security. |
| 1 | Affiliated money market fund available only to Vanguard funds and certain trusts and accounts managed by Vanguard. Rate shown is the 7-day yield. |
| 2 | Securities with a value of $650,000 have been segregated as initial margin for open futures contracts. |
| Derivative Financial Instruments Outstanding as of Period End | | |
| Futures Contracts | | | | |
| | | | | ($000) |
| | | | | Value and |
| | | Number of | | Unrealized |
| | | Long (Short) | Notional | Appreciation |
| | Expiration | Contracts | Amount | (Depreciation) |
| Long Futures Contracts | | | | |
| E-mini S&P 500 Index | September 2020 | 58 | 10,147 | 456 |
See accompanying Notes, which are an integral part of the Financial Statements.
Mega Cap Index Fund
Statement of Assets and Liabilities
As of August 31, 2020
| ($000s, except shares and per-share amounts) | Amount |
| Assets | |
| Investments in Securities, at Value | |
| Unaffiliated Issuers (Cost $2,055,056) | 3,206,932 |
| Affiliated Issuers (Cost $1,360) | 1,360 |
| Total Investment in Securities | 3,208,292 |
| Investment in Vanguard | 125 |
| Cash | 37 |
| Receivables for Accrued Income | 4,917 |
| Receivables for Capital Shares Issued | 3,137 |
| Total Assets | 3,216,508 |
| Liabilities | |
| Payables to Vanguard | 107 |
| Variation Margin Payable—Futures Contracts | 15 |
| Total Liabilities | 122 |
| Net Assets | 3,216,386 |
| | |
| At August 31, 2020, net assets consisted of: | |
| | |
| Paid-in Capital | 2,085,822 |
| Total Distributable Earnings (Loss) | 1,130,564 |
| Net Assets | 3,216,386 |
| | |
| ETF Shares—Net Assets | |
| Applicable to 24,200,000 outstanding $.001 par value shares of beneficial interest (unlimited authorization) | 3,036,324 |
| Net Asset Value Per Share—ETF Shares | $125.47 |
| | |
| Institutional Shares—Net Assets | |
| Applicable to 727,866 outstanding $.001 par value shares of beneficial interest (unlimited authorization) | 180,062 |
| Net Asset Value Per Share—Institutional Shares | $247.38 |
See accompanying Notes, which are an integral part of the Financial Statements.
Mega Cap Index Fund
Statement of Operations
| | Year Ended |
| | August 31, 2020 |
| | ($000) |
| Investment Income | |
| Income | |
| Dividends | 47,659 |
| Interest1 | 107 |
| Securities Lending—Net | 37 |
| Total Income | 47,803 |
| Expenses | |
| The Vanguard Group—Note B | |
| Investment Advisory Services | 372 |
| Management and Administrative—ETF Shares | 1,017 |
| Management and Administrative—Institutional Shares | 64 |
| Marketing and Distribution—ETF Shares | 116 |
| Marketing and Distribution—Institutional Shares | 5 |
| Custodian Fees | 18 |
| Auditing Fees | 32 |
| Shareholders’ Reports—ETF Shares | 111 |
| Shareholders’ Reports—Institutional Shares | — |
| Trustees’ Fees and Expenses | 1 |
| Total Expenses | 1,736 |
| Expenses Paid Indirectly | (10) |
| Net Expenses | 1,726 |
| Net Investment Income | 46,077 |
| Realized Net Gain (Loss) | |
| Investment Securities Sold1,2 | 122,758 |
| Futures Contracts | (1,205) |
| Realized Net Gain (Loss) | 121,553 |
| Change in Unrealized Appreciation (Depreciation) | |
| Investment Securities1 | 472,415 |
| Futures Contracts | 449 |
| Change in Unrealized Appreciation (Depreciation) | 472,864 |
| Net Increase (Decrease) in Net Assets Resulting from Operations | 640,494 |
| 1 | Interest income, realized net gain (loss), and change in unrealized appreciation (depreciation) from an affiliated company of the fund were $100,000, ($7,000), and ($1,000), respectively. Purchases and sales are for temporary cash investment purposes. |
| 2 | Includes $134,469,000 of net gain (loss) resulting from in-kind redemptions; such gain (loss) is not taxable to the fund. |
See accompanying Notes, which are an integral part of the Financial Statements.
Mega Cap Index Fund
Statement of Changes in Net Assets
| | Year Ended August 31, |
| | 2020 | 2019 |
| | ($000) | ($000) |
| Increase (Decrease) in Net Assets | | |
| Operations | | |
| Net Investment Income | 46,077 | 37,926 |
| Realized Net Gain (Loss) | 121,553 | 17,415 |
| Change in Unrealized Appreciation (Depreciation) | 472,864 | 21,521 |
| Net Increase (Decrease) in Net Assets Resulting from Operations | 640,494 | 76,862 |
| Distributions1 | | |
| ETF Shares | (41,365) | (34,093) |
| Institutional Shares | (2,886) | (2,519) |
| Total Distributions | (44,251) | (36,612) |
| Capital Share Transactions | | |
| ETF Shares | 532,703 | 364,632 |
| Institutional Shares | (5,958) | 25,154 |
| Net Increase (Decrease) from Capital Share Transactions | 526,745 | 389,786 |
| Total Increase (Decrease) | 1,122,988 | 430,036 |
| Net Assets | | |
| Beginning of Period | 2,093,398 | 1,663,362 |
| End of Period | 3,216,386 | 2,093,398 |
| 1 | Certain prior period numbers have been reclassified to conform with current period presentation. |
See accompanying Notes, which are an integral part of the Financial Statements.
Mega Cap Index Fund
Financial Highlights
| ETF Shares | | | | | |
| | | | | | |
| For a Share Outstanding | Year Ended August 31, |
| Throughout Each Period | 2020 | 2019 | 2018 | 2017 | 2016 |
| Net Asset Value, Beginning of Period | $101.36 | $100.26 | $85.02 | $74.19 | $67.35 |
| Investment Operations | | | | | |
| Net Investment Income | 1.9921 | 2.0451 | 1.7901 | 1.6761 | 1.582 |
| Net Realized and Unrealized Gain (Loss) on Investments | 24.065 | 1.052 | 15.214 | 10.788 | 6.793 |
| Total from Investment Operations | 26.057 | 3.097 | 17.004 | 12.464 | 8.375 |
| Distributions | | | | | |
| Dividends from Net Investment Income | (1.947) | (1.997) | (1.764) | (1.634) | (1.535) |
| Distributions from Realized Capital Gains | — | — | — | — | — |
| Total Distributions | (1.947) | (1.997) | (1.764) | (1.634) | (1.535) |
| Net Asset Value, End of Period | $125.47 | $101.36 | $100.26 | $85.02 | $74.19 |
| | | | | | |
| Total Return | 26.14% | 3.26% | 20.25% | 17.01% | 12.61% |
| | | | | | |
| Ratios/Supplemental Data | | | | | |
| Net Assets, End of Period (Millions) | $3,036 | $1,944 | $1,542 | $1,233 | $1,057 |
| Ratio of Total Expenses to Average Net Assets | 0.07% | 0.07% | 0.07% | 0.07% | 0.07% |
| Ratio of Net Investment Income to Average Net Assets | 1.85% | 2.10% | 1.93% | 2.12% | 2.23% |
| Portfolio Turnover Rate2 | 4% | 4% | 4% | 6% | 7% |
| 1 | Calculated based on average shares outstanding. |
| 2 | Excludes the value of portfolio securities received or delivered as a result of in-kind purchases or redemptions of the fund’s capital shares, including ETF Creation Units. |
See accompanying Notes, which are an integral part of the Financial Statements.
Mega Cap Index Fund
Financial Highlights
| Institutional Shares | | | | | |
| | | | | | |
| For a Share Outstanding | Year Ended August 31, |
| Throughout Each Period | 2020 | 2019 | 2018 | 2017 | 2016 |
| Net Asset Value, Beginning of Period | $199.84 | $197.68 | $167.62 | $146.25 | $132.77 |
| Investment Operations | | | | | |
| Net Investment Income | 3.9431 | 4.0531 | 3.5131 | 3.3621 | 3.117 |
| Net Realized and Unrealized Gain (Loss) on Investments | 47.454 | 2.062 | 30.038 | 21.220 | 13.419 |
| Total from Investment Operations | 51.397 | 6.115 | 33.551 | 24.582 | 16.536 |
| Distributions | | | | | |
| Dividends from Net Investment Income | (3.857) | (3.955) | (3.491) | (3.212) | (3.056) |
| Distributions from Realized Capital Gains | — | — | — | — | — |
| Total Distributions | (3.857) | (3.955) | (3.491) | (3.212) | (3.056) |
| Net Asset Value, End of Period | $247.38 | $199.84 | $197.68 | $167.62 | $146.25 |
| | | | | | |
| Total Return | 26.19% | 3.25% | 20.26% | 17.02% | 12.63% |
| | | | | | |
| Ratios/Supplemental Data | | | | | |
| Net Assets, End of Period (Millions) | $180 | $150 | $122 | $132 | $133 |
| Ratio of Total Expenses to Average Net Assets | 0.06% | 0.06% | 0.06% | 0.06% | 0.06% |
| Ratio of Net Investment Income to Average Net Assets | 1.86% | 2.11% | 1.94% | 2.13% | 2.24% |
| Portfolio Turnover Rate2 | 4% | 4% | 4% | 6% | 7% |
| 1 | Calculated based on average shares outstanding. |
| 2 | Excludes the value of portfolio securities received or delivered as a result of in-kind purchases or redemptions of the fund's capital shares, including ETF Creation Units. |
See accompanying Notes, which are an integral part of the Financial Statements.
Mega Cap Index Fund
Notes to Financial Statements
Vanguard Mega Cap Index Fund is registered under the Investment Company Act of 1940 as an open-end investment company, or mutual fund. The fund offers two classes of shares: ETF Shares and Institutional Shares. Each of the share classes has different eligibility and minimum purchase requirements, and is designed for different types of investors. ETF Shares are listed for trading on NYSE Arca; they can be purchased and sold through a broker.
Market disruptions associated with the COVID-19 pandemic have had a global impact, and uncertainty exists as to the long-term implications. Such disruptions can adversely affect assets of the fund and thus fund performance.
A. The following significant accounting policies conform to generally accepted accounting principles for U.S. investment companies. The fund consistently follows such policies in preparing its financial statements.
1. Security Valuation: Securities are valued as of the close of trading on the New York Stock Exchange (generally 4 p.m., Eastern time) on the valuation date. Equity securities are valued at the latest quoted sales prices or official closing prices taken from the primary market in which each security trades; such securities not traded on the valuation date are valued at the mean of the latest quoted bid and asked prices. Securities for which market quotations are not readily available, or whose values have been materially affected by events occurring before the fund’s pricing time but after the close of the securities’ primary markets, are valued by methods deemed by the board of trustees to represent fair value. Investments in Vanguard Market Liquidity Fund are valued at that fund’s net asset value. Temporary cash investments are valued using the latest bid prices or using valuations based on a matrix system (which considers such factors as security prices, yields, maturities, and ratings), both as furnished by independent pricing services.
2. Futures Contracts: The fund uses index futures contracts to a limited extent, with the objectives of maintaining full exposure to the stock market, maintaining liquidity, and minimizing transaction costs. The fund may purchase futures contracts to immediately invest incoming cash in the market, or sell futures in response to cash outflows, thereby simulating a fully invested position in the underlying index while maintaining a cash balance for liquidity. The primary risks associated with the use of futures contracts are imperfect correlation between changes in market values of stocks held by the fund and the prices of futures contracts, and the possibility of an illiquid market. Counterparty risk involving futures is mitigated because a regulated clearinghouse is the counterparty instead of the clearing broker. To further mitigate counterparty risk, the fund trades futures contracts on an exchange, monitors the financial strength of its clearing brokers and clearinghouse, and has entered into clearing agreements with its clearing brokers. The clearinghouse imposes initial margin requirements to secure the fund’s performance and requires daily settlement of variation margin representing changes in the market value of each contract. Any securities pledged as initial margin for open contracts are noted in the Schedule of Investments.
Futures contracts are valued at their quoted daily settlement prices. The notional amounts of the contracts are not recorded in the Statement of Assets and Liabilities. Fluctuations in the value of the contracts are recorded in the Statement of Assets and Liabilities as an asset (liability) and in the Statement of Operations as unrealized appreciation (depreciation) until the contracts are closed, when they are recorded as realized gains (losses) on futures contracts.
Mega Cap Index Fund
During the year ended August 31, 2020, the fund’s average investments in long and short futures contracts represented less than 1% and 0% of net assets, respectively, based on the average of the notional amounts at each quarter-end during the period.
3. Federal Income Taxes: The fund intends to continue to qualify as a regulated investment company and distribute all of its taxable income. The fund’s tax returns are open to examination by the relevant tax authorities until expiration of the applicable statute of limitations, which is generally three years after the filing of the tax return. Management has analyzed the fund’s tax positions taken for all open federal and state income tax years, and has concluded that no provision for income tax is required in the fund’s financial statements.
4. Distributions: Distributions to shareholders are recorded on the ex-dividend date. Distributions are determined on a tax basis at the fiscal year-end and may differ from net investment income and realized capital gains for financial reporting purposes.
5. Securities Lending: To earn additional income, the fund lends its securities to qualified institutional borrowers. Security loans are subject to termination by the fund at any time, and are required to be secured at all times by collateral in an amount at least equal to the market value of securities loaned. Daily market fluctuations could cause the value of loaned securities to be more or less than the value of the collateral received. When this occurs, the collateral is adjusted and settled before the opening of the market on the next business day. The fund further mitigates its counterparty risk by entering into securities lending transactions only with a diverse group of prequalified counterparties, monitoring their financial strength, and entering into master securities lending agreements with its counterparties. The master securities lending agreements provide that, in the event of a counterparty’s default (including bankruptcy), the fund may terminate any loans with that borrower, determine the net amount owed, and sell or retain the collateral up to the net amount owed to the fund; however, such actions may be subject to legal proceedings. While collateral mitigates counterparty risk, in the event of a default, the fund may experience delays and costs in recovering the securities loaned. The fund invests cash collateral received in Vanguard Market Liquidity Fund, and records a liability in the Statement of Assets and Liabilities for the return of the collateral, during the period the securities are on loan. Collateral investments in Vanguard Market Liquidity Fund are subject to market appreciation or depreciation. Securities lending income represents fees charged to borrowers plus income earned on invested cash collateral, less expenses associated with the loan. During the term of the loan, the fund is entitled to all distributions made on or in respect of the loaned securities.
6. Credit Facilities and Interfund Lending Program: The fund and certain other funds managed by The Vanguard Group (“Vanguard”) participate in a $4.3 billion committed credit facility provided by a syndicate of lenders pursuant to a credit agreement and an uncommitted credit facility provided by Vanguard. Both facilities may be renewed annually. Each fund is individually liable for its borrowings, if any, under the credit facilities. Borrowings may be utilized for temporary or emergency purposes, subject to the fund’s regulatory and contractual borrowing restrictions. With respect to the committed credit facility, the participating funds are charged administrative fees and an annual commitment fee of 0.10% of the undrawn committed amount of the facility; these fees are allocated to the funds based on a method approved by the fund’s board of trustees and included in Management and Administrative expenses on the fund’s Statement of Operations. Any borrowings under either
Mega Cap Index Fund
facility bear interest at a rate based upon the higher of the one-month London Interbank Offered Rate (or an acceptable alternate rate, if necessary), federal funds effective rate, or overnight bank funding rate plus an agreed-upon spread, except that borrowings under the uncommitted credit facility may bear interest based upon an alternative rate agreed to by the fund and Vanguard.
In accordance with an exemptive order (the “Order”) from the SEC, the fund may participate in a joint lending and borrowing program that allows registered open-end Vanguard funds to borrow money from and lend money to each other for temporary or emergency purposes (the “Interfund Lending Program”), subject to compliance with the terms and conditions of the Order, and to the extent permitted by the fund’s investment objective and investment policies. Interfund loans and borrowings normally extend overnight, but can have a maximum duration of seven days. Loans may be called on one business day’s notice. The interest rate to be charged is governed by the conditions of the Order and internal procedures adopted by the board of trustees. The board of trustees is responsible for overseeing the Interfund Lending Program.
For the year ended August 31, 2020, the fund did not utilize the credit facilities or the Interfund Lending Program.
7. Other: Dividend income is recorded on the ex-dividend date. Interest income includes income distributions received from Vanguard Market Liquidity Fund and is accrued daily. Premiums and discounts on debt securities are amortized and accreted, respectively, to interest income over the lives of the respective securities, except for premiums on certain callable debt securities that are amortized to the earliest call date. Security transactions are accounted for on the date securities are bought or sold. Costs used to determine realized gains (losses) on the sale of investment securities are those of the specific securities sold.
Each class of shares has equal rights as to assets and earnings, except that each class separately bears certain class-specific expenses related to maintenance of shareholder accounts (included in Management and Administrative expenses) and shareholder reporting. Marketing and distribution expenses are allocated to each class of shares based on a method approved by the board of trustees. Income, other non-class-specific expenses, and gains and losses on investments are allocated to each class of shares based on its relative net assets.
B. In accordance with the terms of a Funds’ Service Agreement (the “FSA”) between Vanguard and the fund, Vanguard furnishes to the fund investment advisory, corporate management, administrative, marketing, and distribution services at Vanguard’s cost of operations (as defined by the FSA). These costs of operations are allocated to the fund based on methods and guidelines approved by the board of trustees and are generally settled twice a month.
Upon the request of Vanguard, the fund may invest up to 0.40% of its net assets as capital in Vanguard. At August 31, 2020, the fund had contributed to Vanguard capital in the amount of $125,000, representing less than 0.01% of the fund’s net assets and 0.05% of Vanguard’s capital received pursuant to the FSA. The fund’s trustees and officers are also directors and employees, respectively, of Vanguard.
Mega Cap Index Fund
C. The fund’s custodian bank has agreed to reduce its fees when the fund maintains cash on deposit in the non-interest-bearing custody account. For the year ended August 31, 2020, custodian fee offset arrangements reduced the fund’s expenses by $10,000 (an annual rate of less than 0.01% of average net assets).
D. Various inputs may be used to determine the value of the fund’s investments and derivatives. These inputs are summarized in three broad levels for financial statement purposes. The inputs or methodologies used to value securities are not necessarily an indication of the risk associated with investing in those securities.
Level 1—Quoted prices in active markets for identical securities.
Level 2—Other significant observable inputs (including quoted prices for similar securities, interest rates, prepayment speeds, credit risk, etc.).
Level 3—Significant unobservable inputs (including the fund’s own assumptions used to determine the fair value of investments). Any investments and derivatives valued with significant unobservable inputs are noted on the Schedule of Investments.
The following table summarizes the market value of the fund’s investments and derivatives as of August 31, 2020, based on the inputs used to value them:
| | Level 1 | Level 2 | Level 3 | Total |
| | ($000) | ($000) | ($000) | ($000) |
| Investments | | | | |
| Assets | | | | |
| Common Stocks | 3,206,282 | — | — | 3,206,282 |
| Temporary Cash Investments | 1,360 | 650 | — | 2,010 |
| Total | 3,207,642 | 650 | — | 3,208,292 |
| Derivative Financial Instruments | | | | |
| Liabilities | | | | |
| Futures Contracts1 | 15 | — | — | 15 |
1 Represents variation margin on the last day of the reporting period.
E. Permanent differences between book-basis and tax-basis components of net assets are reclassified among capital accounts in the financial statements to reflect their tax character. These reclassifications have no effect on net assets or net asset value per share. As of period end, permanent differences primarily attributable to the accounting for in-kind redemptions were reclassified between the following accounts:
| | | Amount | |
| | | ($000 | ) |
| Paid-in Capital | | 134,470 | |
| Total Distributable Earnings (Loss) | | (134,470 | ) |
Mega Cap Index Fund
Temporary differences between book-basis and tax-basis components of total distributable earnings (loss) arise when certain items of income, gain, or loss are recognized in different periods for financial statement and tax purposes; these differences will reverse at some time in the future. The differences are primarily related to the deferral of losses from wash sales and the recognition of unrealized gains or losses from certain derivative contracts. As of period end, the tax-basis components of total distributable earnings (loss) are detailed in the table as follows:
| | Amount |
| | ($000) |
| Undistributed Ordinary Income | 9,422 |
| Undistributed Long-Term Gains | — |
| Capital Loss Carryforwards | (30,734) |
| Qualified Late-Year Losses | — |
| Net Unrealized Gains (Losses) | 1,151,876 |
The tax character of distributions paid was as follows:
| | Year Ended August 31, |
| | 2020 | 2019 |
| | Amount | Amount |
| | ($000) | ($000) |
| Ordinary Income * | 44,251 | 36,612 |
| Long-Term Capital Gains | — | — |
| Total | 44,251 | 36,612 |
* Includes short-term capital gains, if any.
As of August 31, 2020, gross unrealized appreciation and depreciation for investments and derivatives based on cost for U.S. federal income tax purposes were as follows:
| | Amount |
| | ($000) |
| Tax Cost | 2,056,416 |
| Gross Unrealized Appreciation | 1,268,952 |
| Gross Unrealized Depreciation | (117,076) |
| Net Unrealized Appreciation (Depreciation) | 1,151,876 |
F. During the year ended August 31, 2020, the fund purchased $854,724,000 of investment securities and sold $327,671,000 of investment securities, other than temporary cash investments. Purchases and sales include $737,310,000 and $234,675,000, respectively, in connection with in-kind purchases and redemptions of the fund’s capital shares.
Mega Cap Index Fund
The fund purchased securities from and sold securities to other Vanguard funds or accounts managed by Vanguard or its affiliates, in accordance with procedures adopted by the board of trustees in compliance with Rule 17a-7 of the Investment Company Act of 1940. For the year ended August 31, 2020, such purchases and sales were $32,514,000 and $39,782,000, respectively; these amounts, other than temporary cash investments, are included in the purchases and sales of investment securities noted above.
G. Capital share transactions for each class of shares were:
| | Year Ended August 31, |
| | 2020 | | | 2019 |
| | Amount | Shares | | Amount | Shares |
| | ($000) | (000) | | ($000) | (000) |
| ETF Shares | | | | | |
| Issued | 767,900 | 7,475 | | 389,257 | 4,050 |
| Issued in Lieu of Cash Distributions | — | — | | — | — |
| Redeemed | (235,197) | (2,450) | | (24,625) | (250) |
| Net Increase (Decrease)—ETF Shares | 532,703 | 5,025 | | 364,632 | 3,800 |
| Institutional Shares | | | | | |
| Issued | 14,779 | 73 | | 38,620 | 203 |
| Issued in Lieu of Cash Distributions | 1,311 | 7 | | 753 | 4 |
| Redeemed | (22,048) | (102) | | (14,219) | (73) |
| Net Increase (Decrease)—Institutional Shares | (5,958) | (22) | | 25,154 | 134 |
H. Management has determined that no events or transactions occurred subsequent to August 31, 2020, that would require recognition or disclosure in these financial statements.
Mega Cap Growth Index Fund
Performance Summary
All of the returns in this report represent past performance, which is not a guarantee of future results that may be achieved by the fund. (Current performance may be lower or higher than the performance data cited. For performance data current to the most recent month-end, visit our website at vanguard.com/performance.) Note, too, that both investment returns and principal value can fluctuate widely, so an investor’s shares, when sold, could be worth more or less than their original cost. The returns shown do not reflect taxes that a shareholder would pay on fund distributions or on the sale of fund shares.
Cumulative Performance: August 31, 2010, Through August 31, 2020
Initial Investment of $10,000
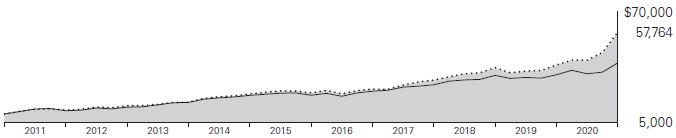
| | | Average Annual Total Returns | |
| | | Periods Ended August 31, 2020 | |
| | | | |
| | | | | | Final Value |
| | | One | Five | Ten | of a $10,000 |
| | | Year | Years | Years | Investment |
 | Mega Cap Growth Index Fund ETF Shares Net Asset Value | 49.84% | 21.04% | 19.17% | $57,764 |
| | Mega Cap Growth Index Fund ETF Shares Market Price | 50.04 | 21.05 | 19.19 | 57,859 |
 | Spliced Mega Cap Growth Index | 49.93 | 21.10 | 19.26 | 58,203 |
 | Dow Jones U.S. Total Stock Market Float Adjusted Index | 21.20 | 13.77 | 14.88 | 40,053 |
Spliced Mega Cap Growth Index: MSCI US Large Cap Growth Index through April 16, 2013; CRSP US Mega Cap Growth Index thereafter.
| | | | | Final Value |
| | One | Five | Ten | of a $5,000,000 |
| | Year | Years | Years | Investment |
| Mega Cap Growth Index Fund Institutional Shares | 49.87% | 21.05% | 19.19% | $28,919,462 |
| Spliced Mega Cap Growth Index | 49.93 | 21.10 | 19.26 | 29,101,568 |
| Dow Jones U.S. Total Stock Market Float Adjusted Index | 21.20 | 13.77 | 14.88 | 20,026,347 |
See Financial Highlights for dividend and capital gains information.
Mega Cap Growth Index Fund
Cumulative Returns of ETF Shares: August 31, 2010, Through August 31, 2020
| | | One | | | Five | | | Ten |
| | | Year | | | Years | | | Years |
| Mega Cap Growth Index Fund ETF Shares Market Price | | 50.04% | | | 159.87% | | | 478.59% |
| Mega Cap Growth Index Fund ETF Shares Net Asset Value | | 49.84 | | | 159.80 | | | 477.64 |
| Spliced Mega Cap Growth Index | | 49.93 | | | 160.48 | | | 482.03 |
For the ETF Shares, the market price is determined by the midpoint of the bid-offer spread as of the closing time of the New York Stock Exchange (generally 4 p.m., Eastern time). The net asset value is also determined as of the NYSE closing time. For more information about how the ETF Shares’ market prices have compared with their net asset value, visit vanguard.com, select your ETF, and then select the Price and Performance tab. The ETF premium/discount analysis there shows the percentages of days on which the ETF Shares’ market price was above or below the NAV.
Mega Cap Growth Index Fund
Fund Allocation
As of August 31, 2020
| Basic Materials | | 1.4% |
| Consumer Goods | | 5.4 |
| Consumer Services | | 20.8 |
| Financials | | 9.5 |
| Health Care | | 6.3 |
| Industrials | | 8.3 |
| Oil & Gas | | 0.2 |
| Technology | | 47.6 |
| Telecommunications | | 0.5 |
The table reflects the fund’s investments, except for short-term investments and derivatives. Sector categories are based on the Industry Classification Benchmark (“ICB”), except for the “Other” category (if applicable), which includes securities that have not been provided a ICB classification as of the effective reporting period.
The fund may invest in derivatives (such as futures and swap contracts) for various reasons, including, but not limited to, at-tempting to remain fully invested and tracking its target index as closely as possible.
The Industry Classification Benchmark (“ICB”) is owned by FTSE. FTSE does not accept any liability to any person for any loss or damage arising out of any error or omission in the ICB.
Mega Cap Growth Index Fund
Financial Statements
Schedule of Investments
As of August 31, 2020
The fund files its complete schedule of portfolio holdings with the Securities and Exchange Commission (SEC) for the first and third quarters of each fiscal year as an exhibit to its reports on Form N-PORT. The fund’s Form N-PORT reports are available on the SEC’s website at www.sec.gov.
| | | | Market | |
| | | | Value· | |
| | | Shares | ($000 | ) |
| Common Stocks (100.0%) | | | |
| Basic Materials (1.4%) | | | |
| | Linde plc | 359,996 | 89,905 | |
| | Ecolab Inc. | 175,412 | 34,570 | |
| | Newmont Corp. | 273,808 | 18,422 | |
| | | | 142,897 | |
| Consumer Goods (5.4%) | | | |
| * | Tesla Inc. | 508,866 | 253,578 | |
| | NIKE Inc. Class B | 849,853 | 95,090 | |
| | Colgate-Palmolive Co. | 586,806 | 46,510 | |
| | Activision Blizzard Inc. | 528,192 | 44,115 | |
| | Estee Lauder Cos. Inc. Class A | 138,591 | 30,729 | |
| * | Electronic Arts Inc. | 197,848 | 27,594 | |
| * | Monster Beverage Corp. | 252,807 | 21,200 | |
| | Brown-Forman Corp. Class B | 212,018 | 15,513 | |
| | Hershey Co. | 100,922 | 15,001 | |
| | Keurig Dr Pepper Inc. | 289,190 | 8,627 | |
| | | | 557,957 | |
| Consumer Services (20.8%) | | | |
| * | Amazon.com Inc. | 290,644 | 1,003,001 | |
| | Home Depot Inc. | 737,188 | 210,128 | |
| * | Netflix Inc. | 301,480 | 159,652 | |
| | McDonald’s Corp. | 509,619 | 108,814 | |
| | Costco Wholesale Corp. | 302,591 | 105,199 | |
| | Lowe’s Cos. Inc. | 517,511 | 85,229 | |
| | Comcast Corp. Class A | 1,560,752 | 69,937 | |
| | Starbucks Corp. | 800,743 | 67,639 | |
| * | Charter Communications Inc. Class A | 99,013 | 60,953 | |
| * | Booking Holdings Inc. | 27,962 | 53,420 | |
| | TJX Cos. Inc. | 738,946 | 40,487 | |
| | Dollar General Corp. | 172,472 | 34,819 | |
| * | Uber Technologies Inc. | 772,923 | 25,993 | |
| * | O’Reilly Automotive Inc. | 50,879 | 23,691 | |
| | Ross Stores Inc. | 243,443 | 22,173 | |
| | Yum! Brands Inc. | 206,162 | 19,761 | |
| | Hilton Worldwide Holdings Inc. | 190,026 | 17,171 | |
| * | AutoZone Inc. | 8,035 | 9,612 | |
| | Marriott International Inc. Class A | 83,476 | 8,590 | |
| | Sirius XM Holdings Inc. | 750,973 | 4,408 | |
| | | | 2,130,677 | |
| Financials (9.5%) | | | |
| | Visa Inc. Class A | 1,156,317 | 245,128 | |
| | Mastercard Inc. Class A | 612,524 | 219,400 | |
| | American Tower Corp. | 303,784 | 75,688 | |
| | S&P Global Inc. | 165,124 | 60,505 | |
| | Prologis Inc. | 506,288 | 51,570 | |
| | Equinix Inc. | 60,679 | 47,923 | |
| | Crown Castle International Corp. | 285,648 | 46,632 | |
| | Marsh & McLennan Cos. Inc. | 349,655 | 40,179 | |
| | Intercontinental Exchange Inc. | 375,001 | 39,836 | |
| | Moody’s Corp. | 109,231 | 32,184 | |
| | Aon plc Class A | 158,430 | 31,684 | |
| | Blackstone Group LP Class A | 459,031 | 24,306 | |
| | Public Storage | 101,822 | 21,627 | |
| | Charles Schwab Corp. | 397,072 | 14,108 | |
| | T. Rowe Price Group Inc. | 73,979 | 10,299 | |
| | Simon Property Group Inc. | 104,809 | 7,111 | |
| | Boston Properties Inc. | 23,921 | 2,078 | |
| | | | 970,258 | |
| Health Care (6.3%) | | | |
| | Thermo Fisher Scientific Inc. | 270,643 | 116,101 | |
| * | Intuitive Surgical Inc. | 79,910 | 58,401 | |
| | Zoetis Inc. | 325,494 | 52,112 | |
| * | Vertex Pharmaceuticals Inc. | 177,835 | 49,637 | |
| | Becton Dickinson and Co. | 202,089 | 49,061 | |
Mega Cap Growth Index Fund
| | | | Market | |
| | | | Value· | |
| | | Shares | ($000 | ) |
| | Bristol-Myers Squibb Co. | 775,344 | 48,226 | |
| | Stryker Corp. | 231,572 | 45,888 | |
| | Danaher Corp. | 218,283 | 45,069 | |
| * | Regeneron Pharmaceuticals Inc. | 65,690 | 40,723 | |
| * | Boston Scientific Corp. | 976,597 | 40,060 | |
| * | Edwards Lifesciences Corp. | 424,774 | 36,463 | |
| * | Illumina Inc. | 100,697 | 35,971 | |
| * | Alexion Pharmaceuticals Inc. | 143,818 | 16,427 | |
| | Baxter International Inc. | 173,645 | 15,119 | |
| | | | 649,258 | |
| Industrials (8.3%) | | | |
| * | PayPal Holdings Inc. | 804,774 | 164,287 | |
| | Accenture plc Class A | 436,521 | 104,735 | |
| | Union Pacific Corp. | 465,044 | 89,493 | |
| | Fidelity National Information Services Inc. | 423,466 | 63,880 | |
| | Lockheed Martin Corp. | 163,403 | 63,770 | |
| | Boeing Co. | 367,391 | 63,125 | |
| | United Parcel Service Inc. Class B | 241,244 | 39,472 | |
| | Automatic Data Processing Inc. | 279,812 | 38,919 | |
| * | Fiserv Inc. | 390,053 | 38,841 | |
| | Illinois Tool Works Inc. | 194,829 | 38,488 | |
| | Sherwin-Williams Co. | 56,017 | 37,590 | |
| | Global Payments Inc. | 205,054 | 36,217 | |
| | Agilent Technologies Inc. | 211,313 | 21,220 | |
| * | Square Inc. | 124,463 | 19,859 | |
| | Paychex Inc. | 221,272 | 16,921 | |
| | Rockwell Automation Inc. | 39,683 | 9,148 | |
| | Fortive Corp. | 103,929 | 7,494 | |
| | | | 853,459 | |
| Oil & Gas (0.2%) | | | |
| | EOG Resources Inc. | 398,791 | 18,081 | |
| | Pioneer Natural Resources Co. | 56,586 | 5,881 | |
| | | | 23,962 | |
| Technology (47.6%) | | | |
| | Apple Inc. | 10,694,356 | 1,380,000 | |
| | Microsoft Corp. | 5,197,655 | 1,172,227 | |
| * | Facebook Inc. Class A | 1,648,065 | 483,213 | |
| * | Alphabet Inc. Class A | 205,021 | 334,088 | |
| * | Alphabet Inc. Class C | 196,432 | 321,005 | |
| | NVIDIA Corp. | 400,450 | 214,233 | |
| * | Adobe Inc. | 330,274 | 169,559 | |
| * | salesforce.com Inc. | 585,243 | 159,566 | |
| | Broadcom Inc. | 260,301 | 90,363 | |
| | Texas Instruments Inc. | 628,945 | 89,405 | |
| * | Advanced Micro Devices Inc. | 801,273 | 72,772 | |
| * | ServiceNow Inc. | 130,690 | 62,995 | |
| | Intuit Inc. | 169,755 | 58,632 | |
| | Applied Materials Inc. | 628,384 | 38,708 | |
| * | Autodesk Inc. | 150,315 | 36,932 | |
| * | Micron Technology Inc. | 762,475 | 34,700 | |
| | Lam Research Corp. | 99,491 | 33,463 | |
| | Roper Technologies Inc. | 71,548 | 30,565 | |
| | Analog Devices Inc. | 252,636 | 29,528 | |
| * | Workday Inc. Class A | 119,363 | 28,613 | |
| | L3Harris Technologies Inc. | 148,061 | 26,761 | |
| * | Zoom Video Communications Inc. Class A | 54,291 | 17,650 | |
| * | VMware Inc. Class A | 53,139 | 7,675 | |
| | | | 4,892,653 | |
| Telecommunications (0.5%) | | | |
| * | T-Mobile US Inc. | 430,631 | 50,246 | |
Total Common Stocks
(Cost $6,033,981) | | 10,271,367 | |
| Temporary Cash Investments (0.0%) | | |
| Money Market Fund (0.0%) | | | |
| 1 | Vanguard Market Liquidity Fund, 0.147% | 6 | 1 | |
| | | Face | | | |
| | | Amount | | | |
| | | ($000 | ) | | |
| U.S. Government and Agency Obligations (0.0%) | |
| 2 | United States Cash Management Bill, 0.210%, 9/15/20 | 475 | | 475 | |
Total Temporary Cash Investments
(Cost $476) | | 476 | |
Total Investments (100.0%)
(Cost $6,034,457) | | 10,271,843 | |
| Other Assets and Liabilities—Net (0.0%) | | 1,986 | |
| Net Assets (100%) | | 10,273,829 | |
Cost is in $000.
| · | See Note A in Notes to Financial Statements. |
| * | Non-income-producing security. |
| 1 | Affiliated money market fund available only to Vanguard funds and certain trusts and accounts managed by Vanguard. Rate shown is the 7-day yield. |
| 2 | Securities with a value of $110,000 have been segregated as initial margin for open futures contracts. |
| Mega Cap Growth Index Fund | | | | |
| | | | | |
| | | | | |
| Derivative Financial Instruments Outstanding as of Period End | | |
| Futures Contracts | | | | |
| | | | | | | ($000 | ) |
| | | | | | | Value and | |
| | | Number of | | | | Unrealized | |
| | | Long (Short | ) | Notional | | Appreciation | |
| | Expiration | Contracts | | Amount | | (Depreciation | ) |
| Long Futures Contracts | | | | | | | |
| E-mini NASDAQ 100 Index | September 2020 | 7 | | 1,696 | | 11 | |
| E-mini S&P 500 Index | September 2020 | 4 | | 700 | | 10 | |
| | | | | | | 21 | |
See accompanying Notes, which are an integral part of the Financial Statements.
| Mega Cap Growth Index Fund | |
| | |
| | |
| Statement of Assets and Liabilities | |
| As of August 31, 2020 | |
| ($000s, except shares and per-share amounts) | Amount |
| Assets | |
| Investments in Securities, at Value | |
| Unaffiliated Issuers (Cost $6,034,456) | 10,271,842 |
| Affiliated Issuers (Cost $1) | 1 |
| Total Investment in Securities | 10,271,843 |
| Investment in Vanguard | 374 |
| Receivables for Accrued Income | 5,872 |
| Receivables for Capital Shares Issued | 38 |
| Variation Margin Receivable—Futures Contracts | 11 |
| Total Assets | 10,278,138 |
| Liabilities | |
| Due to Custodian | 3,974 |
| Payables for Capital Shares Redeemed | 5 |
| Payables to Vanguard | 329 |
| Variation Margin Payable—Futures Contracts | 1 |
| Total Liabilities | 4,309 |
| Net Assets | 10,273,829 |
| At August 31, 2020, net assets consisted of: | |
| | |
| Paid-in Capital | 6,222,371 |
| Total Distributable Earnings (Loss) | 4,051,458 |
| Net Assets | 10,273,829 |
| ETF Shares—Net Assets | |
| Applicable to 51,939,192 outstanding $.001 par value shares of beneficial interest (unlimited authorization) | 10,192,836 |
| Net Asset Value Per Share—ETF Shares | $196.25 |
| | |
| Institutional Shares—Net Assets | |
| Applicable to 207,789 outstanding $.001 par value shares of beneficial interest (unlimited authorization) | 80,993 |
| Net Asset Value Per Share—Institutional Shares | $389.78 |
See accompanying Notes, which are an integral part of the Financial Statements.
Mega Cap Growth Index Fund
Statement of Operations
| | Year Ended |
| | August 31, 2020 |
| | ($000) |
| Investment Income | |
| Income | |
| Dividends | 59,245 |
| Interest1 | 121 |
| Securities Lending—Net | 67 |
| Total Income | 59,433 |
| Expenses | |
| The Vanguard Group—Note B | |
| Investment Advisory Services | 918 |
| Management and Administrative—ETF Shares | 2,725 |
| Management and Administrative—Institutional Shares | 23 |
| Marketing and Distribution—ETF Shares | 299 |
| Marketing and Distribution—Institutional Shares | 2 |
| Custodian Fees | 41 |
| Auditing Fees | 32 |
| Shareholders’ Reports—ETF Shares | 235 |
| Shareholders’ Reports—Institutional Shares | — |
| Trustees’ Fees and Expenses | 4 |
| Total Expenses | 4,279 |
| Net Investment Income | 55,154 |
| Realized Net Gain (Loss) | |
| Investment Securities Sold1,2 | 261,096 |
| Futures Contracts | 2,675 |
| Realized Net Gain (Loss) | 263,771 |
| Change in Unrealized Appreciation (Depreciation) | |
| Investment Securities1 | 2,767,396 |
| Futures Contracts | 38 |
| Change in Unrealized Appreciation (Depreciation) | 2,767,434 |
| Net Increase (Decrease) in Net Assets Resulting from Operations | 3,086,359 |
| 1 | Interest income, realized net gain (loss), and change in unrealized appreciation (depreciation) from an affiliated company of the fund were $119,000, ($16,000), and $1,000, respectively. Purchases and sales are for temporary cash investment purposes. |
| 2 | Includes $315,426,000 of net gain (loss) resulting from in-kind redemptions; such gain (loss) is not taxable to the fund. |
See accompanying Notes, which are an integral part of the Financial Statements.
Mega Cap Growth Index Fund
Statement of Changes in Net Assets
| | Year Ended August 31, |
| | 2020 | 2019 |
| | ($000) | ($000) |
| Increase (Decrease) in Net Assets | | |
| Operations | | |
| Net Investment Income | 55,154 | 53,105 |
| Realized Net Gain (Loss) | 263,771 | 150,409 |
| Change in Unrealized Appreciation (Depreciation) | 2,767,434 | (20,819) |
| Net Increase (Decrease) in Net Assets Resulting from Operations | 3,086,359 | 182,695 |
| Distributions1 | | |
| ETF Shares | (51,457) | (33,904) |
| Institutional Shares | (515) | (331) |
| Total Distributions | (51,972) | (34,235) |
| Capital Share Transactions | | |
| ETF Shares | 2,801,123 | 89,447 |
| Institutional Shares | 6,716 | (1,367) |
| Net Increase (Decrease) from Capital Share Transactions | 2,807,839 | 88,080 |
| Total Increase (Decrease) | 5,842,226 | 236,540 |
| Net Assets | | |
| Beginning of Period | 4,431,603 | 4,195,063 |
| End of Period | 10,273,829 | 4,431,603 |
1 Certain prior period numbers have been reclassified to conform with current period presentation.
See accompanying Notes, which are an integral part of the Financial Statements.
Mega Cap Growth Index Fund
Financial Highlights
ETF Shares
| For a Share Outstanding | | | Year Ended August 31, |
| Throughout Each Period | 2020 | 2019 | 2018 | 2017 | 2016 |
| Net Asset Value, Beginning of Period | $132.22 | $127.79 | $104.09 | $87.15 | $80.22 |
| Investment Operations | | | | | |
| Net Investment Income | 1.3581 | 1.5881 | 1.4851 | 1.3511 | 1.269 |
| Net Realized and Unrealized Gain (Loss) on Investments | 64.007 | 3.860 | 23.677 | 16.920 | 6.897 |
| Total from Investment Operations | 65.365 | 5.448 | 25.162 | 18.271 | 8.166 |
| Distributions | | | | | |
| Dividends from Net Investment Income | (1.335) | (1.018) | (1.462) | (1.331) | (1.236) |
| Distributions from Realized Capital Gains | — | — | — | — | — |
| Total Distributions | (1.335) | (1.018) | (1.462) | (1.331) | (1.236) |
| Net Asset Value, End of Period | $196.25 | $132.22 | $127.79 | $104.09 | $87.15 |
| | | | | | |
| Total Return | 49.84% | 4.32% | 24.38% | 21.17% | 10.28% |
| | | | | | |
| Ratios/Supplemental Data | | | | | |
| Net Assets, End of Period (Millions) | $10,193 | $4,388 | $4,152 | $3,135 | $2,247 |
| Ratio of Total Expenses to Average Net Assets | 0.07% | 0.07% | 0.07% | 0.07% | 0.07% |
| Ratio of Net Investment Income to Average Net Assets | 0.90% | 1.30% | 1.29% | 1.43% | 1.55% |
| Portfolio Turnover Rate2 | 6% | 14% | 9% | 8% | 12% |
| 1 | Calculated based on average shares outstanding. |
| 2 | Excludes the value of portfolio securities received or delivered as a result of in-kind purchases or redemptions of the fund’s capital shares, including ETF Creation Units. |
See accompanying Notes, which are an integral part of the Financial Statements.
Mega Cap Growth Index Fund
Financial Highlights
Institutional Shares
| For a Share Outstanding | | | Year Ended August 31, |
| Throughout Each Period | 2020 | 2019 | 2018 | 2017 | 2016 |
| Net Asset Value, Beginning of Period | $262.63 | $253.80 | $206.74 | $173.07 | $159.31 |
| Investment Operations | | | | | |
| Net Investment Income | 2.7071 | 3.1841 | 2.9631 | 2.6991 | 2.528 |
| Net Realized and Unrealized Gain (Loss) on Investments | 127.126 | 7.684 | 47.023 | 33.622 | 13.693 |
| Total from Investment Operations | 129.833 | 10.868 | 49.986 | 36.321 | 16.221 |
| Distributions | | | | | |
| Dividends from Net Investment Income | (2.683) | (2.038) | (2.926) | (2.651) | (2.461) |
| Distributions from Realized Capital Gains | — | — | — | — | — |
| Total Distributions | (2.683) | (2.038) | (2.926) | (2.651) | (2.461) |
| Net Asset Value, End of Period | $389.78 | $262.63 | $253.80 | $206.74 | $173.07 |
| | | | | | |
| Total Return | 49.87% | 4.34% | 24.39% | 21.20% | 10.28% |
| | | | | | |
| Ratios/Supplemental Data | | | | | |
| Net Assets, End of Period (Millions) | $81 | $43 | $43 | $35 | $30 |
| Ratio of Total Expenses to Average Net Assets | 0.06% | 0.06% | 0.06% | 0.06% | 0.06% |
| Ratio of Net Investment Income to Average Net Assets | 0.91% | 1.31% | 1.30% | 1.44% | 1.56% |
| Portfolio Turnover Rate2 | 6% | 14% | 9% | 8% | 12% |
| 1 | Calculated based on average shares outstanding. |
| 2 | Excludes the value of portfolio securities received or delivered as a result of in-kind purchases or redemptions of the fund’s capital shares, including ETF Creation Units. |
See accompanying Notes, which are an integral part of the Financial Statements.
Mega Cap Growth Index Fund
Notes to Financial Statements
Vanguard Mega Cap Growth Index Fund is registered under the Investment Company Act of 1940 as an open-end investment company, or mutual fund. The fund offers two classes of shares: ETF Shares and Institutional Shares. Each of the share classes has different eligibility and minimum purchase requirements, and is designed for different types of investors. ETF Shares are listed for trading on NYSE Arca; they can be purchased and sold through a broker.
Market disruptions associated with the COVID-19 pandemic have had a global impact, and uncertainty exists as to the long-term implications. Such disruptions can adversely affect assets of the fund and thus fund performance.
A. The following significant accounting policies conform to generally accepted accounting principles for U.S. investment companies. The fund consistently follows such policies in preparing its financial statements.
1. Security Valuation: Securities are valued as of the close of trading on the New York Stock Exchange (generally 4 p.m., Eastern time) on the valuation date. Equity securities are valued at the latest quoted sales prices or official closing prices taken from the primary market in which each security trades; such securities not traded on the valuation date are valued at the mean of the latest quoted bid and asked prices. Securities for which market quotations are not readily available, or whose values have been materially affected by events occurring before the fund’s pricing time but after the close of the securities’ primary markets, are valued by methods deemed by the board of trustees to represent fair value. Investments in Vanguard Market Liquidity Fund are valued at that fund’s net asset value. Temporary cash investments are valued using the latest bid prices or using valuations based on a matrix system (which considers such factors as security prices, yields, maturities, and ratings), both as furnished by independent pricing services.
2. Futures Contracts: The fund uses index futures contracts to a limited extent, with the objectives of maintaining full exposure to the stock market, maintaining liquidity, and minimizing transaction costs. The fund may purchase futures contracts to immediately invest incoming cash in the market, or sell futures in response to cash outflows, thereby simulating a fully invested position in the underlying index while maintaining a cash balance for liquidity. The primary risks associated with the use of futures contracts are imperfect correlation between changes in market values of stocks held by the fund and the prices of futures contracts, and the possibility of an illiquid market. Counterparty risk involving futures is mitigated because a regulated clearinghouse is the counterparty instead of the clearing broker. To further mitigate counterparty risk, the fund trades futures contracts on an exchange, monitors the financial strength of its clearing brokers and clearinghouse, and has entered into clearing agreements with its clearing brokers. The clearinghouse imposes initial margin requirements to secure the fund’s performance and requires daily settlement of variation margin representing changes in the market value of each contract. Any securities pledged as initial margin for open contracts are noted in the Schedule of Investments.
Futures contracts are valued at their quoted daily settlement prices. The notional amounts of the contracts are not recorded in the Statement of Assets and Liabilities. Fluctuations in the value of the contracts are recorded in the Statement of Assets and Liabilities as an asset (liability) and in the Statement of Operations as unrealized appreciation (depreciation) until the contracts are closed, when they are recorded as realized gains (losses) on futures contracts.
Mega Cap Growth Index Fund
During the year ended August 31, 2020, the fund’s average investments in long and short futures contracts represented less than 1% and 0% of net assets, respectively, based on the average of the notional amounts at each quarter-end during the period.
3. Federal Income Taxes: The fund intends to continue to qualify as a regulated investment company and distribute all of its taxable income. The fund’s tax returns are open to examination by the relevant tax authorities until expiration of the applicable statute of limitations, which is generally three years after the filing of the tax return. Management has analyzed the fund’s tax positions taken for all open federal and state income tax years, and has concluded that no provision for income tax is required in the fund’s financial statements.
4. Distributions: Distributions to shareholders are recorded on the ex-dividend date. Distributions are determined on a tax basis at the fiscal year-end and may differ from net investment income and realized capital gains for financial reporting purposes.
5. Securities Lending: To earn additional income, the fund lends its securities to qualified institutional borrowers. Security loans are subject to termination by the fund at any time, and are required to be secured at all times by collateral in an amount at least equal to the market value of securities loaned. Daily market fluctuations could cause the value of loaned securities to be more or less than the value of the collateral received. When this occurs, the collateral is adjusted and settled before the opening of the market on the next business day. The fund further mitigates its counterparty risk by entering into securities lending transactions only with a diverse group of prequalified counterparties, monitoring their financial strength, and entering into master securities lending agreements with its counterparties. The master securities lending agreements provide that, in the event of a counterparty’s default (including bankruptcy), the fund may terminate any loans with that borrower, determine the net amount owed, and sell or retain the collateral up to the net amount owed to the fund; however, such actions may be subject to legal proceedings. While collateral mitigates counterparty risk, in the event of a default, the fund may experience delays and costs in recovering the securities loaned. The fund invests cash collateral received in Vanguard Market Liquidity Fund, and records a liability in the Statement of Assets and Liabilities for the return of the collateral, during the period the securities are on loan. Collateral investments in Vanguard Market Liquidity Fund are subject to market appreciation or depreciation. Securities lending income represents fees charged to borrowers plus income earned on invested cash collateral, less expenses associated with the loan. During the term of the loan, the fund is entitled to all distributions made on or in respect of the loaned securities.
6. Credit Facilities and Interfund Lending Program: The fund and certain other funds managed by The Vanguard Group (“Vanguard”) participate in a $4.3 billion committed credit facility provided by a syndicate of lenders pursuant to a credit agreement and an uncommitted credit facility provided by Vanguard. Both facilities may be renewed annually. Each fund is individually liable for its borrowings, if any, under the credit facilities. Borrowings may be utilized for temporary or emergency purposes, subject to the fund’s regulatory and contractual borrowing restrictions. With respect to the committed credit facility, the participating funds are charged administrative fees and an annual commitment fee of 0.10% of the undrawn committed amount of the facility; these fees are allocated to the funds
Mega Cap Growth Index Fund
based on a method approved by the fund’s board of trustees and included in Management and Administrative expenses on the fund’s Statement of Operations. Any borrowings under either facility bear interest at a rate based upon the higher of the one-month London Interbank Offered Rate (or an acceptable alternate rate, if necessary), federal funds effective rate, or overnight bank funding rate plus an agreed-upon spread, except that borrowings under the uncommitted credit facility may bear interest based upon an alternative rate agreed to by the fund and Vanguard.
In accordance with an exemptive order (the “Order”) from the SEC, the fund may participate in a joint lending and borrowing program that allows registered open-end Vanguard funds to borrow money from and lend money to each other for temporary or emergency purposes (the “Interfund Lending Program”), subject to compliance with the terms and conditions of the Order, and to the extent permitted by the fund’s investment objective and investment policies. Interfund loans and borrowings normally extend overnight, but can have a maximum duration of seven days. Loans may be called on one business day’s notice. The interest rate to be charged is governed by the conditions of the Order and internal procedures adopted by the board of trustees. The board of trustees is responsible for overseeing the Interfund Lending Program.
For the year ended August 31, 2020, the fund did not utilize the credit facilities or the Interfund Lending Program.
7. Other: Dividend income is recorded on the ex-dividend date. Interest income includes income distributions received from Vanguard Market Liquidity Fund and is accrued daily. Premiums and discounts on debt securities are amortized and accreted, respectively, to interest income over the lives of the respective securities, except for premiums on certain callable debt securities that are amortized to the earliest call date. Security transactions are accounted for on the date securities are bought or sold. Costs used to determine realized gains (losses) on the sale of investment securities are those of the specific securities sold.
Each class of shares has equal rights as to assets and earnings, except that each class separately bears certain class-specific expenses related to maintenance of shareholder accounts (included in Management and Administrative expenses) and shareholder reporting. Marketing and distribution expenses are allocated to each class of shares based on a method approved by the board of trustees. Income, other non-class-specific expenses, and gains and losses on investments are allocated to each class of shares based on its relative net assets.
B. In accordance with the terms of a Funds’ Service Agreement (the “FSA”) between Vanguard and the fund, Vanguard furnishes to the fund investment advisory, corporate management, administrative, marketing, and distribution services at Vanguard’s cost of operations (as defined by the FSA). These costs of operations are allocated to the fund based on methods and guidelines approved by the board of trustees and are generally settled twice a month.
Upon the request of Vanguard, the fund may invest up to 0.40% of its net assets as capital in Vanguard. At August 31, 2020, the fund had contributed to Vanguard capital in the amount of $374,000, representing less than 0.01% of the fund’s net assets and 0.15% of Vanguard’s capital received pursuant to the FSA. The fund’s trustees and officers are also directors and employees, respectively, of Vanguard.
Mega Cap Growth Index Fund
C. Various inputs may be used to determine the value of the fund’s investments and derivatives. These inputs are summarized in three broad levels for financial statement purposes. The inputs or methodologies used to value securities are not necessarily an indication of the risk associated with investing in those securities.
Level 1—Quoted prices in active markets for identical securities.
Level 2—Other significant observable inputs (including quoted prices for similar securities, interest rates, prepayment speeds, credit risk, etc.).
Level 3—Significant unobservable inputs (including the fund’s own assumptions used to determine the fair value of investments). Any investments and derivatives valued with significant unobservable inputs are noted on the Schedule of Investments.
The following table summarizes the market value of the fund’s investments and derivatives as of August 31, 2020, based on the inputs used to value them:
| | Level 1 | Level 2 | Level 3 | Total |
| | ($000) | ($000) | ($000) | ($000) |
| Investments | | | | |
| Assets | | | | |
| Common Stocks | 10,271,367 | — | — | 10,271,367 |
| Temporary Cash Investments | 1 | 475 | — | 476 |
| Total | 10,271,368 | 475 | — | 10,271,843 |
| Derivative Financial Instruments | | | | |
| Assets | | | | |
| Futures Contracts1 | 11 | — | — | 11 |
| Liabilities | | | | |
| Futures Contracts1 | 1 | — | — | 1 |
1 Represents variation margin on the last day of the reporting period.
D. Permanent differences between book-basis and tax-basis components of net assets are reclassified among capital accounts in the financial statements to reflect their tax character. These reclassifications have no effect on net assets or net asset value per share. As of period end, permanent differences primarily attributable to the accounting for in-kind redemptions were reclassified between the following accounts:
| | Amount |
| | ($000) |
| Paid-in Capital | 315,440 |
| Total Distributable Earnings (Loss) | (315,440) |
Mega Cap Growth Index Fund
Temporary differences between book-basis and tax-basis components of total distributable earnings (loss) arise when certain items of income, gain, or loss are recognized in different periods for financial statement and tax purposes; these differences will reverse at some time in the future. The differences are primarily related to the deferral of losses from wash sales and the recognition of unrealized gains or losses from certain derivative contracts. As of period end, the tax-basis components of total distributable earnings (loss) are detailed in the table as follows:
| | Amount |
| | ($000) |
| Undistributed Ordinary Income | 12,633 |
| Undistributed Long-Term Gains | — |
| Capital Loss Carryforwards | (198,561) |
| Qualified Late-Year Losses | — |
| Net Unrealized Gains (Losses) | 4,237,386 |
The tax character of distributions paid was as follows:
| | Year Ended August 31, |
| | 2020 | 2019 |
| | Amount | Amount |
| | ($000) | ($000) |
| Ordinary Income * | 51,972 | 34,235 |
| Long-Term Capital Gains | — | — |
| Total | 51,972 | 34,235 |
* Includes short-term capital gains, if any.
As of August 31, 2020, gross unrealized appreciation and depreciation for investments and derivatives based on cost for U.S. federal income tax purposes were as follows:
| | Amount |
| | ($000) |
| Tax Cost | 6,034,457 |
| Gross Unrealized Appreciation | 4,292,810 |
| Gross Unrealized Depreciation | (55,424) |
| Net Unrealized Appreciation (Depreciation) | 4,237,386 |
E. During the year ended August 31, 2020, the fund purchased $3,774,706,000 of investment securities and sold $952,417,000 of investment securities, other than temporary cash investments. Purchases and sales include $3,327,882,000 and $570,205,000, respectively, in connection with in-kind purchases and redemptions of the fund’s capital shares.
Mega Cap Growth Index Fund
The fund purchased securities from and sold securities to other Vanguard funds or accounts managed by Vanguard or its affiliates, in accordance with procedures adopted by the board of trustees in compliance with Rule 17a-7 of the Investment Company Act of 1940. For the year ended August 31, 2020, such purchases and sales were $147,720,000 and $290,047,000, respectively; these amounts, other than temporary cash investments, are included in the purchases and sales of investment securities noted above.
F. Capital share transactions for each class of shares were:
| | | | | | Year Ended August 31, |
| | | | 2020 | | | | 2019 |
| | Amount | | Shares | | Amount | | Shares |
| | ($000 | ) | (000 | ) | ($000 | ) | (000) |
| ETF Shares | | | | | | | |
| Issued | 3,379,154 | | 22,750 | | 602,968 | | 4,900 |
| Issued in Lieu of Cash Distributions | — | | — | | — | | — |
| Redeemed | (578,031 | ) | (4,000 | ) | (513,521 | ) | (4,200) |
| Net Increase (Decrease)—ETF Shares | 2,801,123 | | 18,750 | | 89,447 | | 700 |
| Institutional Shares | | | | | | | |
| Issued | 41,327 | | 157 | | 21,064 | | 89 |
| Issued in Lieu of Cash Distributions | 515 | | 2 | | 290 | | 1 |
| Redeemed | (35,126 | ) | (116 | ) | (22,721 | ) | (97) |
| Net Increase (Decrease)—Institutional Shares | 6,716 | | 43 | | (1,367 | ) | (7) |
G. Management has determined that no events or transactions occurred subsequent to August 31, 2020, that would require recognition or disclosure in these financial statements.
Mega Cap Value Index Fund
Performance Summary
All of the returns in this report represent past performance, which is not a guarantee of future results that may be achieved by the fund. (Current performance may be lower or higher than the performance data cited. For performance data current to the most recent month-end, visit our website at vanguard.com/performance.) Note, too, that both investment returns and principal value can fluctuate widely, so an investor’s shares, when sold, could be worth more or less than their original cost. The returns shown do not reflect taxes that a shareholder would pay on fund distributions or on the sale of fund shares.
Cumulative Performance: August 31, 2010, Through August 31, 2020
Initial Investment of $10,000
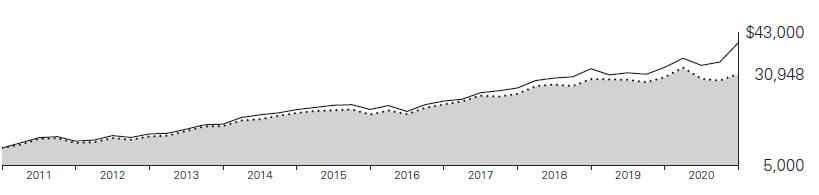
| | | Average Annual Total Returns | |
| | | Periods Ended August 31, 2020 | |
| | | | | | Final Value |
| | | One | Five | Ten | of a $10,000 |
| | | Year | Years | Years | Investment |
| Mega Cap Value Index Fund ETF Shares Net Asset Value | 2.94% | 9.71% | 11.96% | $30,948 |
| Mega Cap Value Index Fund ETF Shares Market Price | 3.02 | 9.71 | 11.97 | 30,986 |
| Spliced Mega Cap Value Index | 3.02 | 9.75 | 12.03 | 31,130 |
| Dow Jones U.S. Total Stock Market Float Adjusted Index | 21.20 | 13.77 | 14.88 | 40,053 |
Spliced Mega Cap Value Index: MSCI US Large Cap Value Index through April 16, 2013; CRSP US Mega Cap Value Index thereafter.
| | | | | Final Value |
| | One | Five | Ten | of a $5,000,000 |
| | Year | Years | Years | Investment |
| Mega Cap Value Index Fund Institutional Shares | 3.00% | 9.72% | 11.98% | $15,506,595 |
| Spliced Mega Cap Value Index | 3.02 | 9.75 | 12.03 | 15,565,163 |
| Dow Jones U.S. Total Stock Market Float Adjusted Index | 21.20 | 13.77 | 14.88 | 20,026,347 |
See Financial Highlights for dividend and capital gains information.
Mega Cap Value Index Fund
Cumulative Returns of ETF Shares: August 31, 2010, Through August 31, 2020
| | One | Five | Ten |
| | Year | Years | Years |
| Mega Cap Value Index Fund ETF Shares Market Price | 3.02% | 58.93% | 209.86% |
| Mega Cap Value Index Fund ETF Shares Net Asset Value | 2.94 | 58.92 | 209.48 |
| Spliced Mega Cap Value Index | 3.02 | 59.20 | 211.30 |
For the ETF Shares, the market price is determined by the midpoint of the bid-offer spread as of the closing time of the New York Stock Exchange (generally 4 p.m., Eastern time). The net asset value is also determined as of the NYSE closing time. For more information about how the ETF Shares’ market prices have compared with their net asset value, visit vanguard.com, select your ETF, and then select the Price and Performance tab. The ETF premium/discount analysis there shows the percentages of days on which the ETF Shares’ market price was above or below the NAV.
Mega Cap Value Index Fund
Fund Allocation
As of August 31, 2020
| Basic Materials | 1.4% |
| Consumer Goods | 12.4 |
| Consumer Services | 8.7 |
| Financials | 19.8 |
| Health Care | 23.4 |
| Industrials | 11.9 |
| Oil & Gas | 4.9 |
| Technology | 7.9 |
| Telecommunications | 4.4 |
| Utilities | 5.2 |
The table reflects the fund’s investments, except for short-term investments and derivatives. Sector categories are based on the Industry Classification Benchmark (“ICB”), except for the “Other” category (if applicable), which includes securities that have not been provided a ICB classification as of the effective reporting period.
The fund may invest in derivatives (such as futures and swap contracts) for various reasons, including, but not limited to, at-tempting to remain fully invested and tracking its target index as closely as possible.
The Industry Classification Benchmark (“ICB”) is owned by FTSE. FTSE does not accept any liability to any person for any loss or damage arising out of any error or omission in the ICB.
Mega Cap Value Index Fund
Financial Statements
Schedule of Investments
As of August 31, 2020
The fund files its complete schedule of portfolio holdings with the Securities and Exchange Commission (SEC) for the first and third quarters of each fiscal year as an exhibit to its reports on Form N-PORT. The fund’s Form N-PORT reports are available on the SEC’s website at www.sec.gov.
| | | | Market | |
| | | | Value• | |
| | | Shares | ($000 | ) |
| Common Stocks (99.8%) | | | |
| Basic Materials (1.4%) | | | |
| | Air Products & Chemicals Inc. | 66,040 | 19,301 | |
| | Dow Inc. | 222,060 | 10,019 | |
| | PPG Industries Inc. | 70,540 | 8,493 | |
| | LyondellBasell Industries NV Class A | 74,770 | 4,896 | |
| | | | 42,709 | |
| Consumer Goods (12.4%) | | | |
| | Procter & Gamble Co. | 740,324 | 102,409 | |
| | PepsiCo Inc. | 414,977 | 58,122 | |
| | Coca-Cola Co. | 1,155,964 | 57,255 | |
| | Philip Morris International Inc. | 465,633 | 37,153 | |
| | Mondelez International Inc. Class A | 426,889 | 24,939 | |
| | Altria Group Inc. | 555,722 | 24,307 | |
| | Kimberly-Clark Corp. | 101,795 | 16,059 | |
| | General Mills Inc. | 181,262 | 11,592 | |
| | General Motors Co. | 385,202 | 11,414 | |
| | Constellation Brands Inc. Class A | 47,632 | 8,787 | |
| | Ford Motor Co. | 1,169,083 | 7,973 | |
| | Archer-Daniels-Midland Co. | 165,829 | 7,422 | |
| | Kraft Heinz Co. | 201,006 | 7,043 | |
| | VF Corp. | 92,851 | 6,105 | |
| | Corteva Inc. | 112,202 | 3,203 | |
| | Tyson Foods Inc. Class A | 43,880 | 2,756 | |
| | Kellogg Co. | 38,410 | 2,724 | |
| | | | 389,263 | |
| Consumer Services (8.7%) | | | |
| | Walt Disney Co. | 540,194 | 71,235 | |
| | Walmart Inc. | 423,730 | 58,835 | |
| | Comcast Corp. Class A | 681,084 | 30,519 | |
| | CVS Health Corp. | 390,852 | 24,280 | |
| | Target Corp. | 149,532 | 22,611 | |
| | eBay Inc. | 199,704 | 10,940 | |
| | Sysco Corp. | 143,982 | 8,659 | |
| | Walgreens Boots Alliance Inc. | 223,081 | 8,481 | |
| | Kroger Co. | 223,571 | 7,977 | |
| | McKesson Corp. | 48,364 | 7,421 | |
| | Southwest Airlines Co. | 175,992 | 6,614 | |
| | Las Vegas Sands Corp. | 114,328 | 5,798 | |
| | Marriott International Inc. Class A | 36,281 | 3,734 | |
| | Delta Air Lines Inc. | 95,218 | 2,937 | |
| | Fox Corp. Class A | 53,801 | 1,499 | |
| | Fox Corp. Class B | 20,617 | 573 | |
| | | | 272,113 | |
| Financials (19.8%) | | | |
| * | Berkshire Hathaway Inc. Class B | 563,521 | 122,870 | |
| | JPMorgan Chase & Co. | 865,684 | 86,733 | |
| | Bank of America Corp. | 2,335,078 | 60,105 | |
| | Citigroup Inc. | 622,614 | 31,828 | |
| | Wells Fargo & Co. | 1,102,519 | 26,626 | |
| | BlackRock Inc. | 43,337 | 25,750 | |
| | Goldman Sachs Group Inc. | 102,849 | 21,071 | |
| | CME Group Inc. | 107,319 | 18,874 | |
| | Morgan Stanley | 353,499 | 18,474 | |
| | American Express Co. | 180,630 | 18,350 | |
| | Progressive Corp. | 175,042 | 16,636 | |
| | Truist Financial Corp. | 402,902 | 15,637 | |
| | US Bancorp | 405,411 | 14,757 | |
| | Chubb Ltd. | 114,735 | 14,342 | |
| | PNC Financial Services Group Inc. | 120,529 | 13,403 | |
| | Capital One Financial Corp. | 136,358 | 9,413 | |
Mega Cap Value Index Fund
| | | | Market | |
| | | | Value• | |
| | | Shares | ($000 | ) |
| | Bank of New York Mellon Corp. | 238,477 | 8,819 | |
| | Travelers Cos. Inc. | 75,685 | 8,782 | |
| | Allstate Corp. | 93,982 | 8,740 | |
| | Prudential Financial Inc. | 118,195 | 8,010 | |
| | MetLife Inc. | 203,741 | 7,836 | |
| | American International Group Inc. | 257,705 | 7,509 | |
| | Aflac Inc. | 204,000 | 7,409 | |
| | Welltower Inc. | 125,003 | 7,190 | |
| | State Street Corp. | 99,886 | 6,801 | |
| | Equity Residential | 111,208 | 6,278 | |
| | Charles Schwab Corp. | 173,024 | 6,148 | |
| | T. Rowe Price Group Inc. | 32,340 | 4,502 | |
| | TD Ameritrade Holding Corp. | 80,728 | 3,098 | |
| | Simon Property Group Inc. | 45,663 | 3,098 | |
| | Discover Financial Services | 45,747 | 2,428 | |
| | Northern Trust Corp. | 29,486 | 2,415 | |
| | Ventas Inc. | 55,715 | 2,296 | |
| | Fifth Third Bancorp | 106,142 | 2,193 | |
| | Boston Properties Inc. | 10,429 | 906 | |
| *,^ | Rocket Cos. Inc. Class A | 29,889 | 837 | |
| * | Berkshire Hathaway Inc. Class A | 1 | 328 | |
| | | | 620,492 | |
| Health Care (23.4%) | | | |
| | Johnson & Johnson | 787,840 | 120,863 | |
| | UnitedHealth Group Inc. | 283,628 | 88,648 | |
| | Merck & Co. Inc. | 754,780 | 64,360 | |
| | Pfizer Inc. | 1,661,058 | 62,771 | |
| | Abbott Laboratories | 528,919 | 57,901 | |
| | AbbVie Inc. | 527,009 | 50,472 | |
| | Amgen Inc. | 175,880 | 44,554 | |
| | Medtronic plc | 400,726 | 43,066 | |
| | Eli Lilly and Co. | 257,438 | 38,201 | |
| | Gilead Sciences Inc. | 375,062 | 25,035 | |
| | Anthem Inc. | 75,388 | 21,223 | |
| | Bristol-Myers Squibb Co. | 338,332 | 21,044 | |
| | Danaher Corp. | 95,255 | 19,667 | |
| | Cigna Corp. | 110,364 | 19,575 | |
| | Humana Inc. | 39,496 | 16,398 | |
| * | Biogen Inc. | 48,845 | 14,050 | |
| | HCA Healthcare Inc. | 80,855 | 10,974 | |
| | Zimmer Biomet Holdings Inc. | 61,839 | 8,712 | |
| | Baxter International Inc. | 75,896 | 6,608 | |
| | | | 734,122 | |
| Industrials (11.8%) | | | |
| | Honeywell International Inc. | 209,871 | 34,744 | |
| | 3M Co. | 171,954 | 28,032 | |
| | Raytheon Technologies Corp. | 453,389 | 27,657 | |
| | Caterpillar Inc. | 161,830 | 23,030 | |
| | Deere & Co. | 93,561 | 19,653 | |
| | CSX Corp. | 228,860 | 17,499 | |
| | United Parcel Service Inc. Class B | 105,307 | 17,230 | |
| | General Electric Co. | 2,615,589 | 16,583 | |
| | Norfolk Southern Corp. | 76,545 | 16,268 | |
| | FedEx Corp. | 70,274 | 15,449 | |
| | Northrop Grumman Corp. | 44,837 | 15,362 | |
| | Waste Management Inc. | 126,776 | 14,452 | |
| | Emerson Electric Co. | 178,690 | 12,414 | |
| | DuPont de Nemours Inc. | 219,445 | 12,236 | |
| | Eaton Corp. plc | 119,586 | 12,210 | |
| | General Dynamics Corp. | 72,933 | 10,893 | |
| | TE Connectivity Ltd. | 98,606 | 9,525 | |
| | Cummins Inc. | 44,161 | 9,152 | |
| | Johnson Controls International plc | 222,564 | 9,065 | |
| | PACCAR Inc. | 103,359 | 8,872 | |
| | Trane Technologies plc | 71,627 | 8,480 | |
| | Parker-Hannifin Corp. | 38,293 | 7,889 | |
| | Stanley Black & Decker Inc. | 47,715 | 7,696 | |
| | Republic Services Inc. Class A | 61,798 | 5,730 | |
| | Otis Worldwide Corp. | 64,844 | 4,079 | |
| | Corning Inc. | 113,530 | 3,685 | |
| | Fortive Corp. | 45,264 | 3,264 | |
| | | | 371,149 | |
| Oil & Gas (4.9%) | | | |
| | Exxon Mobil Corp. | 1,264,443 | 50,502 | |
| | Chevron Corp. | 558,319 | 46,860 | |
| | ConocoPhillips | 320,677 | 12,150 | |
| | Kinder Morgan Inc. | 574,495 | 7,939 | |
| | Schlumberger Ltd. | 414,394 | 7,878 | |
| | Phillips 66 | 130,432 | 7,626 | |
| | Williams Cos. Inc. | 363,051 | 7,537 | |
| | Marathon Petroleum Corp. | 194,601 | 6,901 | |
| | Valero Energy Corp. | 122,127 | 6,423 | |
| | | | 153,816 | |
| Technology (7.8%) | | | |
| | Intel Corp. | 1,266,143 | 64,510 | |
| | Cisco Systems Inc. | 1,136,354 | 47,977 | |
| | QUALCOMM Inc. | 336,392 | 40,064 | |
| | Oracle Corp. | 612,995 | 35,076 | |
| | International Business Machines Corp. | 265,528 | 32,742 | |
| | Cognizant Technology Solutions Corp. Class A | 161,709 | 10,812 | |
| | HP Inc. | 428,064 | 8,369 | |
| * | Dell Technologies Inc. | 71,950 | 4,754 | |
| | | | 244,304 | |
| Mega Cap Value Index Fund | | | |
| | | | |
| | | | |
| | | | Market | |
| | | | Value• | |
| | | Shares | ($000 | ) |
| Telecommunications (4.4%) | | | |
| | Verizon Communications Inc. | 1,237,551 | 73,350 | |
| | AT&T Inc. | 2,130,658 | 63,515 | |
| | | | 136,865 | |
| Utilities (5.2%) | | | |
| | NextEra Energy Inc. | 146,357 | 40,858 | |
| | Dominion Energy Inc. | 250,889 | 19,680 | |
| | Duke Energy Corp. | 219,759 | 17,655 | |
| | Southern Co. | 316,011 | 16,489 | |
| | American Electric Power Co. Inc. | 148,226 | 11,685 | |
| | Xcel Energy Inc. | 157,146 | 10,918 | |
| | Sempra Energy | 87,391 | 10,806 | |
| | Exelon Corp. | 291,228 | 10,749 | |
| | Public Service Enterprise Group Inc. | 151,315 | 7,905 | |
| | Consolidated Edison Inc. | 100,067 | 7,139 | |
| | PPL Corp. | 229,373 | 6,338 | |
| | Edison International | 56,413 | 2,960 | |
| | | | 163,182 | |
Total Common Stocks
(Cost $2,727,317) | | 3,128,015 | |
| | | | | | |
| Temporary Cash Investments (0.0%) | | | |
| Money Market Fund (0.0%) | | | | |
| 1,2 | Vanguard Market Liquidity Fund, 0.147% | 8,224 | | 822 | |
| | | Face | | | |
| | | Amount | | | |
| | | ($000 | ) | | |
| U.S. Government and Agency Obligations (0.0%) | |
| 3 | United States Cash Management Bill, 0.140%, 10/13/20 | 450 | | 450 | |
Total Temporary Cash Investments
(Cost $1,272) | | 1,272 | |
Total Investments (99.8%)
(Cost $2,728,589) | | | 3,129,287 | |
| Other Assets and Liabilities—Net (0.2%) | | | 4,705 | |
| Net Assets (100%) | | | 3,133,992 | |
Cost is in $000.
| · | See Note A in Notes to Financial Statements. |
| * | Non-income-producing security. |
| ^ | Includes partial security positions on loan to broker-dealers. The total value of securities on loan is $792,000. |
| 1 | Affiliated money market fund available only to Vanguard funds and certain trusts and accounts managed by Vanguard. Rate shown is the 7-day yield. |
| 2 | Collateral of $821,000 was received for securities on loan. |
| 3 | Securities with a value of $424,000 have been segregated as initial margin for open futures contracts. |
| Derivative Financial Instruments Outstanding as of Period End | | | | |
| | | | | |
| Futures Contracts | | | | | | |
| | | | | | ($000 | ) |
| | | | | | Value and | |
| | | Number of | | | Unrealized | |
| | | Long (Short | ) | Notional | Appreciation | |
| | Expiration | Contracts | | Amount | (Depreciation | ) |
| Long Futures Contracts | | | | | | |
| E-mini S&P 500 Index | September 2020 | 34 | | 5,948 | 224 | |
See accompanying Notes, which are an integral part of the Financial Statements.
Mega Cap Value Index Fund
Statement of Assets and Liabilities
As of August 31, 2020
| ($000s, except shares and per-share amounts) | Amount |
| Assets | |
| Investments in Securities, at Value | |
| Unaffiliated Issuers (Cost $2,727,767) | 3,128,465 |
| Affiliated Issuers (Cost $822) | 822 |
| Total Investment in Securities | 3,129,287 |
| Investment in Vanguard | 124 |
| Receivables for Accrued Income | 8,934 |
| Receivables for Capital Shares Issued | 12 |
| Total Assets | 3,138,357 |
| Liabilities | |
| Due to Custodian | 3,355 |
| Collateral for Securities on Loan | 821 |
| Payables for Capital Shares Redeemed | 75 |
| Payables to Vanguard | 105 |
| Variation Margin Payable—Futures Contracts | 9 |
| Total Liabilities | 4,365 |
| Net Assets | 3,133,992 |
At August 31, 2020, net assets consisted of:
| Paid-in Capital | 2,783,015 |
| Total Distributable Earnings (Loss) | 350,977 |
| Net Assets | 3,133,992 |
| | |
| ETF Shares—Net Assets | |
| Applicable to 38,209,807 outstanding $.001 par value shares of beneficial interest (unlimited authorization) | 3,016,861 |
| Net Asset Value Per Share—ETF Shares | $78.96 |
| | |
| Institutional Shares—Net Assets | |
| Applicable to 748,143 outstanding $.001 par value shares of beneficial interest (unlimited authorization) | 117,131 |
| Net Asset Value Per Share—Institutional Shares | $156.56 |
See accompanying Notes, which are an integral part of the Financial Statements.
Mega Cap Value Index Fund
Statement of Operations
| | Year Ended |
| | August 31, 2020 |
| | ($000) |
| Investment Income | |
| Income | |
| Dividends | 82,216 |
| Interest1 | 37 |
| Securities Lending—Net | 43 |
| Total Income | 82,296 |
| Expenses | |
| The Vanguard Group—Note B | |
| Investment Advisory Services | 416 |
| Management and Administrative—ETF Shares | 1,193 |
| Management and Administrative—Institutional Shares | 50 |
| Marketing and Distribution—ETF Shares | 139 |
| Marketing and Distribution—Institutional Shares | 3 |
| Custodian Fees | 25 |
| Auditing Fees | 32 |
| Shareholders’ Reports—ETF Shares | 69 |
| Shareholders’ Reports—Institutional Shares | 2 |
| Trustees’ Fees and Expenses | 2 |
| Total Expenses | 1,931 |
| Net Investment Income | 80,365 |
| Realized Net Gain (Loss) | |
| Investment Securities Sold1,2 | 21,105 |
| Futures Contracts | 609 |
| Realized Net Gain (Loss) | 21,714 |
| Change in Unrealized Appreciation (Depreciation) | |
| Investment Securities1 | 18,119 |
| Futures Contracts | 143 |
| Change in Unrealized Appreciation (Depreciation) | 18,262 |
| Net Increase (Decrease) in Net Assets Resulting from Operations | 120,341 |
| 1 | Interest income, realized net gain (loss), and change in unrealized appreciation (depreciation) from an affiliated company of the fund were $34,000, ($10,000), and $1,000, respectively. Purchases and sales are for temporary cash investment purposes. |
| 2 | Includes $56,212,000 of net gain (loss) resulting from in-kind redemptions; such gain (loss) is not taxable to the fund. |
See accompanying Notes, which are an integral part of the Financial Statements.
Mega Cap Value Index Fund
Statement of Changes in Net Assets
| | Year Ended August 31, |
| | 2020 | 2019 |
| | ($000) | ($000) |
| Increase (Decrease) in Net Assets | | |
| Operations | | |
| Net Investment Income | 80,365 | 69,674 |
| Realized Net Gain (Loss) | 21,714 | 194,851 |
| Change in Unrealized Appreciation (Depreciation) | 18,262 | (221,389) |
| Net Increase (Decrease) in Net Assets Resulting from Operations | 120,341 | 43,136 |
| Distributions1 | | |
| ETF Shares | (74,008) | (64,527) |
| Institutional Shares | (3,648) | (3,466) |
| Total Distributions | (77,656) | (67,993) |
| Capital Share Transactions | | |
| ETF Shares | 526,191 | 351,597 |
| Institutional Shares | (17,219) | 5,455 |
| Net Increase (Decrease) from Capital Share Transactions | 508,972 | 357,052 |
| Total Increase (Decrease) | 551,657 | 332,195 |
| Net Assets | | |
| Beginning of Period | 2,582,335 | 2,250,140 |
| End of Period | 3,133,992 | 2,582,335 |
| 1 | Certain prior period numbers have been reclassified to conform with current period presentation. |
See accompanying Notes, which are an integral part of the Financial Statements.
Mega Cap Value Index Fund
Financial Highlights
ETF Shares
| For a Share Outstanding | | | Year Ended August 31, |
| Throughout Each Period | 2020 | 2019 | 2018 | 2017 | 2016 |
| Net Asset Value, Beginning of Period | $78.94 | $79.89 | $70.19 | $63.52 | $56.89 |
| Investment Operations | | | | | |
| Net Investment Income | 2.2711 | 2.2611 | 1.8931 | 1.8431 | 1.638 |
| Net Realized and Unrealized Gain (Loss) on Investments | (.044) | (1.027) | 9.668 | 6.557 | 6.583 |
| Total from Investment Operations | 2.227 | 1.234 | 11.561 | 8.400 | 8.221 |
| Distributions | | | | | |
| Dividends from Net Investment Income | (2.207) | (2.184) | (1.861) | (1.730) | (1.591) |
| Distributions from Realized Capital Gains | — | — | — | — | — |
| Total Distributions | (2.207) | (2.184) | (1.861) | (1.730) | (1.591) |
| Net Asset Value, End of Period | $78.96 | $78.94 | $79.89 | $70.19 | $63.52 |
| | | | | | |
| Total Return | 2.94% | 1.69% | 16.71% | 13.40% | 14.71% |
| | | | | | |
| Ratios/Supplemental Data | | | | | |
| Net Assets, End of Period (Millions) | $3,017 | $2,448 | $2,120 | $1,717 | $1,322 |
| Ratio of Total Expenses to Average Net Assets | 0.07% | 0.07% | 0.07% | 0.07% | 0.07% |
| Ratio of Net Investment Income to Average Net Assets | 2.90% | 2.90% | 2.50% | 2.73% | 2.84% |
| Portfolio Turnover Rate2 | 9% | 10% | 8% | 8% | 8% |
| 1 | Calculated based on average shares outstanding. |
| 2 | Excludes the value of portfolio securities received or delivered as a result of in-kind purchases or redemptions of the fund’s capital shares, including ETF Creation Units. |
See accompanying Notes, which are an integral part of the Financial Statements.
Mega Cap Value Index Fund
Financial Highlights
Institutional Shares
| For a Share Outstanding | | | Year Ended August 31, |
| Throughout Each Period | 2020 | 2019 | 2018 | 2017 | 2016 |
| Net Asset Value, Beginning of Period | $156.53 | $158.41 | $139.18 | $125.94 | $112.80 |
| Investment Operations | | | | | |
| Net Investment Income | 4.5221 | 4.4671 | 3.7431 | 3.5961 | 3.259 |
| Net Realized and Unrealized Gain (Loss) on Investments | (.102) | (2.002) | 19.188 | 13.077 | 13.063 |
| Total from Investment Operations | 4.420 | 2.465 | 22.931 | 16.673 | 16.322 |
| Distributions | | | | | |
| Dividends from Net Investment Income | (4.390) | (4.345) | (3.701) | (3.433) | (3.182) |
| Distributions from Realized Capital Gains | — | — | — | — | — |
| Total Distributions | (4.390) | (4.345) | (3.701) | (3.433) | (3.182) |
| Net Asset Value, End of Period | $156.56 | $156.53 | $158.41 | $139.18 | $125.94 |
| | | | | | |
| Total Return | 3.00% | 1.68% | 16.71% | 13.41% | 14.72% |
| | | | | | |
| Ratios/Supplemental Data | | | | | |
| Net Assets, End of Period (Millions) | $117 | $134 | $131 | $125 | $207 |
| Ratio of Total Expenses to Average Net Assets | 0.06% | 0.06% | 0.06% | 0.06% | 0.06% |
| Ratio of Net Investment Income to Average Net Assets | 2.89% | 2.91% | 2.51% | 2.74% | 2.85% |
| Portfolio Turnover Rate2 | 9% | 10% | 8% | 8% | 8% |
| 1 | Calculated based on average shares outstanding. |
| 2 | Excludes the value of portfolio securities received or delivered as a result of in-kind purchases or redemptions of the fund’s capital shares, including ETF Creation Units. |
See accompanying Notes, which are an integral part of the Financial Statements.
Mega Cap Value Index Fund
Notes to Financial Statements
Vanguard Mega Cap Value Index Fund is registered under the Investment Company Act of 1940 as an open-end investment company, or mutual fund. The fund offers two classes of shares: ETF Shares and Institutional Shares. Each of the share classes has different eligibility and minimum purchase requirements, and is designed for different types of investors. ETF Shares are listed for trading on NYSE Arca; they can be purchased and sold through a broker.
Market disruptions associated with the COVID-19 pandemic have had a global impact, and uncertainty exists as to the long-term implications. Such disruptions can adversely affect assets of the fund and thus fund performance.
A. The following significant accounting policies conform to generally accepted accounting principles for U.S. investment companies. The fund consistently follows such policies in preparing its financial statements.
1. Security Valuation: Securities are valued as of the close of trading on the New York Stock Exchange (generally 4 p.m., Eastern time) on the valuation date. Equity securities are valued at the latest quoted sales prices or official closing prices taken from the primary market in which each security trades; such securities not traded on the valuation date are valued at the mean of the latest quoted bid and asked prices. Securities for which market quotations are not readily available, or whose values have been materially affected by events occurring before the fund’s pricing time but after the close of the securities’ primary markets, are valued by methods deemed by the board of trustees to represent fair value. Investments in Vanguard Market Liquidity Fund are valued at that fund’s net asset value. Temporary cash investments are valued using the latest bid prices or using valuations based on a matrix system (which considers such factors as security prices, yields, maturities, and ratings), both as furnished by independent pricing services.
2. Futures Contracts: The fund uses index futures contracts to a limited extent, with the objectives of maintaining full exposure to the stock market, maintaining liquidity, and minimizing transaction costs. The fund may purchase futures contracts to immediately invest incoming cash in the market, or sell futures in response to cash outflows, thereby simulating a fully invested position in the underlying index while maintaining a cash balance for liquidity. The primary risks associated with the use of futures contracts are imperfect correlation between changes in market values of stocks held by the fund and the prices of futures contracts, and the possibility of an illiquid market. Counterparty risk involving futures is mitigated because a regulated clearinghouse is the counterparty instead of the clearing broker. To further mitigate counterparty risk, the fund trades futures contracts on an exchange, monitors the financial strength of its clearing brokers and clearinghouse, and has entered into clearing agreements with its clearing brokers. The clearinghouse imposes initial margin requirements to secure the fund’s performance and requires daily settlement of variation margin representing changes in the market value of each contract. Any securities pledged as initial margin for open contracts are noted in the Schedule of Investments.
Futures contracts are valued at their quoted daily settlement prices. The notional amounts of the contracts are not recorded in the Statement of Assets and Liabilities. Fluctuations in the value of the contracts are recorded in the Statement of Assets and Liabilities as an asset (liability) and in the Statement of Operations as unrealized appreciation (depreciation) until the contracts are closed, when they are recorded as realized gains (losses) on futures contracts.
Mega Cap Value Index Fund
During the year ended August 31, 2020, the fund’s average investments in long and short futures contracts represented less than 1% and 0% of net assets, respectively, based on the average of the notional amounts at each quarter-end during the period.
3. Federal Income Taxes: The fund intends to continue to qualify as a regulated investment company and distribute all of its taxable income. The fund’s tax returns are open to examination by the relevant tax authorities until expiration of the applicable statute of limitations, which is generally three years after the filing of the tax return. Management has analyzed the fund’s tax positions taken for all open federal and state income tax years, and has concluded that no provision for income tax is required in the fund’s financial statements.
4. Distributions: Distributions to shareholders are recorded on the ex-dividend date. Distributions are determined on a tax basis at the fiscal year-end and may differ from net investment income and realized capital gains for financial reporting purposes.
5. Securities Lending: To earn additional income, the fund lends its securities to qualified institutional borrowers. Security loans are subject to termination by the fund at any time, and are required to be secured at all times by collateral in an amount at least equal to the market value of securities loaned. Daily market fluctuations could cause the value of loaned securities to be more or less than the value of the collateral received. When this occurs, the collateral is adjusted and settled before the opening of the market on the next business day. The fund further mitigates its counterparty risk by entering into securities lending transactions only with a diverse group of prequalified counterparties, monitoring their financial strength, and entering into master securities lending agreements with its counterparties. The master securities lending agreements provide that, in the event of a counterparty’s default (including bankruptcy), the fund may terminate any loans with that borrower, determine the net amount owed, and sell or retain the collateral up to the net amount owed to the fund; however, such actions may be subject to legal proceedings. While collateral mitigates counterparty risk, in the event of a default, the fund may experience delays and costs in recovering the securities loaned. The fund invests cash collateral received in Vanguard Market Liquidity Fund, and records a liability in the Statement of Assets and Liabilities for the return of the collateral, during the period the securities are on loan. Collateral investments in Vanguard Market Liquidity Fund are subject to market appreciation or depreciation. Securities lending income represents fees charged to borrowers plus income earned on invested cash collateral, less expenses associated with the loan. During the term of the loan, the fund is entitled to all distributions made on or in respect of the loaned securities.
6. Credit Facilities and Interfund Lending Program: The fund and certain other funds managed by The Vanguard Group (“Vanguard”) participate in a $4.3 billion committed credit facility provided by a syndicate of lenders pursuant to a credit agreement and an uncommitted credit facility provided by Vanguard. Both facilities may be renewed annually. Each fund is individually liable for its borrowings, if any, under the credit facilities. Borrowings may be utilized for temporary or emergency purposes, subject to the fund’s regulatory and contractual borrowing restrictions. With respect to the committed credit facility, the participating funds are charged administrative fees and an annual commitment fee of 0.10% of the undrawn committed amount of the facility; these fees are allocated to the funds based on a method approved by the fund’s board of trustees and included in Management
Mega Cap Value Index Fund
and Administrative expenses on the fund’s Statement of Operations. Any borrowings under either facility bear interest at a rate based upon the higher of the one-month London Interbank Offered Rate (or an acceptable alternate rate, if necessary), federal funds effective rate, or overnight bank funding rate plus an agreed-upon spread, except that borrowings under the uncommitted credit facility may bear interest based upon an alternative rate agreed to by the fund and Vanguard.
In accordance with an exemptive order (the “Order”) from the SEC, the fund may participate in a joint lending and borrowing program that allows registered open-end Vanguard funds to borrow money from and lend money to each other for temporary or emergency purposes (the “Interfund Lending Program”), subject to compliance with the terms and conditions of the Order, and to the extent permitted by the fund’s investment objective and investment policies. Interfund loans and borrowings normally extend overnight, but can have a maximum duration of seven days. Loans may be called on one business day’s notice. The interest rate to be charged is governed by the conditions of the Order and internal procedures adopted by the board of trustees. The board of trustees is responsible for overseeing the Interfund Lending Program.
For the year ended August 31, 2020, the fund did not utilize the credit facilities or the Interfund Lending Program.
7. Other: Dividend income is recorded on the ex-dividend date. Interest income includes income distributions received from Vanguard Market Liquidity Fund and is accrued daily. Premiums and discounts on debt securities are amortized and accreted, respectively, to interest income over the lives of the respective securities, except for premiums on certain callable debt securities that are amortized to the earliest call date. Security transactions are accounted for on the date securities are bought or sold. Costs used to determine realized gains (losses) on the sale of investment securities are those of the specific securities sold.
Each class of shares has equal rights as to assets and earnings, except that each class separately bears certain class-specific expenses related to maintenance of shareholder accounts (included in Management and Administrative expenses) and shareholder reporting. Marketing and distribution expenses are allocated to each class of shares based on a method approved by the board of trustees. Income, other non-class-specific expenses, and gains and losses on investments are allocated to each class of shares based on its relative net assets.
B. In accordance with the terms of a Funds’ Service Agreement (the “FSA”) between Vanguard and the fund, Vanguard furnishes to the fund investment advisory, corporate management, administrative, marketing, and distribution services at Vanguard’s cost of operations (as defined by the FSA). These costs of operations are allocated to the fund based on methods and guidelines approved by the board of trustees and are generally settled twice a month.
Upon the request of Vanguard, the fund may invest up to 0.40% of its net assets as capital in Vanguard. At August 31, 2020, the fund had contributed to Vanguard capital in the amount of $124,000, representing less than 0.01% of the fund’s net assets and 0.05% of Vanguard’s capital received pursuant to the FSA. The fund’s trustees and officers are also directors and employees, respectively, of Vanguard.
Mega Cap Value Index Fund
C. Various inputs may be used to determine the value of the fund’s investments and derivatives. These inputs are summarized in three broad levels for financial statement purposes. The inputs or methodologies used to value securities are not necessarily an indication of the risk associated with investing in those securities.
Level 1—Quoted prices in active markets for identical securities.
Level 2—Other significant observable inputs (including quoted prices for similar securities, interest rates, prepayment speeds, credit risk, etc.).
Level 3—Significant unobservable inputs (including the fund’s own assumptions used to determine the fair value of investments). Any investments and derivatives valued with significant unobservable inputs are noted on the Schedule of Investments.
The following table summarizes the market value of the fund’s investments and derivatives as of August 31, 2020, based on the inputs used to value them:
| | Level 1 | Level 2 | Level 3 | Total |
| | ($000) | ($000) | ($000) | ($000) |
| Investments | | | | |
| Assets | | | | |
| Common Stocks | 3,128,015 | — | — | 3,128,015 |
| Temporary Cash Investments | 822 | 450 | — | 1,272 |
| Total | 3,128,837 | 450 | — | 3,129,287 |
| Derivative Financial Instruments | | | | |
| Liabilities | | | | |
| Futures Contracts1 | 9 | — | — | 9 |
1 Represents variation margin on the last day of the reporting period.
D. Permanent differences between book-basis and tax-basis components of net assets are reclassified among capital accounts in the financial statements to reflect their tax character. These reclassifications have no effect on net assets or net asset value per share. As of period end, permanent differences primarily attributable to the accounting for in-kind redemptions were reclassified between the following accounts:
| | Amount |
| | ($000) |
| Paid-in Capital | 56,215 |
| Total Distributable Earnings (Loss) | (56,215) |
Mega Cap Value Index Fund
Temporary differences between book-basis and tax-basis components of total distributable earnings (loss) arise when certain items of income, gain, or loss are recognized in different periods for financial statement and tax purposes; these differences will reverse at some time in the future. The differences are primarily related to the deferral of losses from wash sales and the recognition of unrealized gains or losses from certain derivative contracts. As of period end, the tax-basis components of total distributable earnings (loss) are detailed in the table as follows:
| | | Amount |
| | | ($000) |
| Undistributed Ordinary Income | | 16,445 |
| Undistributed Long-Term Gains | | — |
| Capital Loss Carryforwards | | (66,166) |
| Qualified Late-Year Losses | | — |
| Net Unrealized Gains (Losses) | | 400,698 |
The tax character of distributions paid was as follows:
| | Year Ended August 31, |
| | 2020 | 2019 |
| | Amount | Amount |
| | ($000) | ($000) |
| Ordinary Income * | 77,656 | 67,993 |
| Long-Term Capital Gains | — | — |
| Total | 77,656 | 67,993 |
* Includes short-term capital gains, if any.
As of August 31, 2020, gross unrealized appreciation and depreciation for investments and derivatives based on cost for U.S. federal income tax purposes were as follows:
| | Amount |
| | ($000) |
| Tax Cost | 2,728,589 |
| Gross Unrealized Appreciation | 624,821 |
| Gross Unrealized Depreciation | (224,123) |
| Net Unrealized Appreciation (Depreciation) | 400,698 |
Mega Cap Value Index Fund
E. During the year ended August 31, 2020, the fund purchased $901,674,000 of investment securities and sold $389,318,000 of investment securities, other than temporary cash investments. Purchases and sales include $608,473,000 and $144,076,000, respectively, in connection with in-kind purchases and redemptions of the fund’s capital shares.
The fund purchased securities from and sold securities to other Vanguard funds or accounts managed by Vanguard or its affiliates, in accordance with procedures adopted by the board of trustees in compliance with Rule 17a-7 of the Investment Company Act of 1940. For the year ended August 31, 2020, such purchases and sales were $104,294,000 and $88,501,000, respectively; these amounts, other than temporary cash investments, are included in the purchases and sales of investment securities noted above.
F. Capital share transactions for each class of shares were:
| | | | | Year Ended August 31, |
| | | 2020 | | | 2019 |
| | Amount | Shares | | Amount | Shares |
| | ($000) | (000) | | ($000) | (000) |
| ETF Shares | | | | | |
| Issued | 673,200 | 9,075 | | 828,137 | 10,705 |
| Issued in Lieu of Cash Distributions | — | — | | — | — |
| Redeemed | (147,009) | (1,875) | | (476,540) | (6,225) |
| Net Increase (Decrease)—ETF Shares | 526,191 | 7,200 | | 351,597 | 4,480 |
| Institutional Shares | | | | | |
| Issued | 7,676 | 51 | | 24,632 | 157 |
| Issued in Lieu of Cash Distributions | 2,292 | 15 | | 1,944 | 13 |
| Redeemed | (27,187) | (177) | | (21,121) | (136) |
| Net Increase (Decrease)—Institutional Shares | (17,219) | (111) | | 5,455 | 34 |
At August 31, 2020, one shareholder was the record or beneficial owner of 26% of the fund’s net assets. If this shareholder were to redeem its investment in the fund, the redemption might result in an increase in the fund’s expense ratio, cause the fund to incur higher transaction costs, or lead to the realization of taxable capital gains.
G. Management has determined that no events or transactions occurred subsequent to August 31, 2020, that would require recognition or disclosure in these financial statements.
Report of Independent Registered Public Accounting Firm
To the Board of Trustees of Vanguard World Fund and Shareholders of Vanguard Mega Cap Index Fund, Vanguard Mega Cap Growth Index Fund and Vanguard Mega Cap Value Index Fund
Opinions on the Financial Statements
We have audited the accompanying statements of assets and liabilities, including the schedules of investments, of Vanguard Mega Cap Index Fund, Vanguard Mega Cap Growth Index Fund and Vanguard Mega Cap Value Index Fund (three of the funds constituting Vanguard World Fund, hereafter collectively referred to as the “Funds”) as of August 31, 2020, the related statements of operations for the year ended August 31, 2020, the statements of changes in net assets for each of the two years in the period ended August 31, 2020, including the related notes, and the financial highlights for each of the five years in the period ended August 31, 2020 (collectively referred to as the “financial statements”). In our opinion, the financial statements present fairly, in all material respects, the financial position of each of the Funds as of August 31, 2020, the results of each of their operations for the year then ended, the changes in each of their net assets for each of the two years in the period ended August 31, 2020 and each of the financial highlights for each of the five years in the period ended August 31, 2020 in conformity with accounting principles generally accepted in the United States of America.
Basis for Opinions
These financial statements are the responsibility of the Funds’ management. Our responsibility is to express an opinion on the Funds’ financial statements based on our audits. We are a public accounting firm registered with the Public Company Accounting Oversight Board (United States) (“PCAOB”) and are required to be independent with respect to the Funds in accordance with the U.S. federal securities laws and the applicable rules and regulations of the Securities and Exchange Commission and the PCAOB.
We conducted our audits of these financial statements in accordance with the standards of the PCAOB. Those standards require that we plan and perform the audit to obtain reasonable assurance about whether the financial statements are free of material misstatement, whether due to error or fraud.
Our audits included performing procedures to assess the risks of material misstatement of the financial statements, whether due to error or fraud, and performing procedures that respond to those risks. Such procedures included examining, on a test basis, evidence regarding the amounts and disclosures in the financial statements. Our audits also included evaluating the accounting principles used and significant estimates made by management, as well as evaluating the overall presentation of the financial statements. Our procedures included confirmation of securities owned as of August 31, 2020 by correspondence with the custodian and brokers and by agreement to the underlying ownership records of the transfer agent; when replies were not received from brokers, we performed other auditing procedures. We believe that our audits provide a reasonable basis for our opinions.
/s/PricewaterhouseCoopers LLP
Philadelphia, Pennsylvania
October 15, 2020
We have served as the auditor of one or more investment companies in The Vanguard Group of Funds since 1975.
Special 2020 tax information (unaudited) for Vanguard Mega Cap Index Funds
This This information for the fiscal year ended August 31, 2020, is included pursuant to provisions of the Internal Revenue Code.
The funds distributed qualified dividend income to shareholders during the fiscal year as follows:
| Fund | ($000) |
| Mega Cap Index Fund | 44,252 |
| Mega Cap Growth Index Fund | 51,973 |
| Mega Cap Value Index Fund | 77,657 |
For corporate shareholders, the percentage of investment income (dividend income plus short-term gains, if any) that qualifies for the dividends-received deduction is as follows:
| Fund | Percentage |
| Mega Cap Index Fund | 97.9% |
| Mega Cap Growth Index Fund | 95.6 |
| Mega Cap Value Index Fund | 99.1 |
Trustees Approve Advisory Arrangements
The board of trustees of Vanguard Mega Cap Index Fund, Vanguard Mega Cap Growth Index Fund, and Vanguard Mega Cap Value Index Fund has renewed each fund’s investment advisory arrangement with The Vanguard Group, Inc. (Vanguard), through its Equity Index Group. The board determined that continuing each fund’s internalized management structure was in the best interests of the fund and its shareholders.
The board based its decision upon an evaluation of the advisor’s investment staff, portfolio management process, and performance. This evaluation included information provided to the board by Vanguard’s Portfolio Review Department, which is responsible for fund and advisor oversight and product management. The Portfolio Review Department met regularly with the advisor and made monthly presentations to the board during the fiscal year that directed the board’s focus to relevant information and topics.
The board, or an investment committee made up of board members, also received information throughout the year through advisor presentations. For each advisor presentation, the board was provided with letters and reports that included information about, among other things, the advisory firm and the advisor’s assessment of the investment environment, portfolio performance, and portfolio characteristics.
In addition, the board received monthly reports, which included a Market and Economic Report, a Fund Dashboard Monthly Summary, and a Fund Performance Report.
Prior to their meeting, the trustees were provided with a memo and materials that summarized the information they received over the course of the year. They also considered the factors discussed below, among others. However, no single factor determined whether the board approved the arrangements. Rather, it was the totality of the circumstances that drove the board’s decision.
Nature, extent, and quality of services
The board reviewed the quality of each fund’s investment management services over both the short and long term, and took into account the organizational depth and stability of the advisor. The board considered that Vanguard has been managing investments for more than four decades. The Equity Index Group adheres to a sound, disciplined investment management process; the team has considerable experience, stability, and depth.
The board concluded that Vanguard’s experience, stability, depth, and performance, among other factors, warranted continuation of each advisory arrangement.
Investment performance
The board considered the short- and long-term performance of each fund, including any periods of outperformance or underperformance compared with its target index and peer group. The board concluded that the performance was such that each advisory arrangement should continue.
Cost
The board concluded that each fund’s expense ratio was well below the average expense ratio charged by funds in its peer group and that each fund’s advisory expenses were also well below the peer-group average.
The board does not conduct a profitability analysis of Vanguard because of Vanguard’s unique structure. Unlike most other mutual fund management companies, Vanguard is owned by the funds it oversees.
The benefit of economies of scale
The board concluded that each fund’s arrangement with Vanguard ensures that the funds will realize economies of scale as they grow, with the cost to shareholders declining as fund assets increase.
The board will consider whether to renew the advisory arrangements again after a one-year period.
Liquidity Risk Management
Vanguard funds (except for the money market funds) have adopted and implemented a written liquidity risk management program (the “Program”) as required by Rule 22e-4 under the Investment Company Act of 1940. Rule 22e-4 requires that each fund adopt a program that is reasonably designed to assess and manage the fund’s liquidity risk, which is the risk that the fund could not meet redemption requests without significant dilution of remaining investors’ interests in the fund.
Assessment and management of a fund’s liquidity risk under the Program take into consideration certain factors, such as the fund’s investment strategy and the liquidity of its portfolio investments during normal and reasonably foreseeable stressed conditions, its short- and long-term cash-flow projections during both normal and reasonably foreseeable stressed conditions, and its cash and cash-equivalent holdings and access to other funding sources. As required by the rule, the Program includes policies and procedures for classification of fund portfolio holdings in four liquidity categories, maintaining certain levels of highly liquid investments, and limiting holdings of illiquid investments.
The board of trustees of Vanguard World Fund approved the appointment of liquidity risk management program administrators responsible for administering the Program for Vanguard Mega Cap Index Fund, Vanguard Mega Cap Growth Index Fund, and Vanguard Mega Cap Value Index Fund, and for carrying out the specific responsibilities set forth in the Program, including reporting to the board on at least an annual basis regarding the Program’s operation, its adequacy, and the effectiveness of its implementation for the past year (the “Program Administrator Report”). The board has reviewed the Program Administrator Report covering the period from December 1, 2018, through December 31, 2019 (the “Review Period”). The Program Administrator Report stated that during the Review Period the Program operated and was implemented effectively to manage the funds’ liquidity risk.
The CRSP US Mega Cap Index, CRSP US Mega Cap Growth Index, and CRSP US Mega Cap Value Index (the “Indexes”) are products of the Center for Research in Security Prices (“CRSP”) at the Booth School of Business of the University of Chicago (“University”), and have been licensed for use by Vanguard. CRSP® is a trademark of the University and has been licensed by the University for use for certain purposes by Vanguard. Vanguard Mega Cap Index Fund, Mega Cap Growth Index Fund, and Mega Cap Value Index Fund are not sponsored, endorsed, sold or promoted by the University. The University makes no representation or warranty, express or implied, to the owners of Vanguard Mega Cap Index Fund, Mega Cap Growth Index Fund, and Mega Cap Value Index Fund or any member of the public regarding the advisability of investing in securities generally or in Vanguard Mega Cap Index Fund, Mega Cap Growth Index Fund, and Mega Cap Value Index Fund particularly or the ability of the Indexes to track general market performance. The Indexes are determined, composed and calculated without regard to Vanguard or Vanguard Mega Cap Index Fund, Mega Cap Growth Index Fund, and Mega Cap Value Index Fund. The University has no obligation to take the needs of Vanguard or the owners of Vanguard Mega Cap Index Fund, Mega Cap Growth Index Fund, and Mega Cap Value Index Fund into consideration in determining, composing or calculating the Index. The University is not responsible for and has not participated in the determination of the prices, and amount of Vanguard Mega Cap Index Fund, Mega Cap Growth Index Fund, and Mega Cap Value Index Fund or the timing of the issuance or sale of Vanguard Mega Cap Index Fund, Mega Cap Growth Index Fund, and Mega Cap Value Index Fund or in the determination or calculation of the equation by which Vanguard Mega Cap Index Fund, Mega Cap Growth Index Fund, and Mega Cap Value Index Fund are to be converted into cash, surrendered or redeemed, as the case may be. The University has no obligation or liability in connection with the administration, marketing or trading of Vanguard Mega Cap Index Fund, Mega Cap Growth Index Fund, and Mega Cap Value Index Fund. There is no assurance that investment products based on the Indexes will accurately track index performance or provide positive investment returns. The University is not an investment advisor. Inclusion of a security within an index is not a recommendation by the University to buy, sell, or hold such security, nor is it considered to be investment advice.
THE UNIVERSITY DOES NOT GUARANTEE THE ADEQUACY, ACCURACY, TIMELINESS AND/OR THE COMPLETENESS OF THE INDEXES OR ANY DATA RELATED THERETO OR ANY COMMUNICATION, INCLUDING BUT NOT LIMITED TO, ORAL OR WRITTEN COMMUNICATION (INCLUDING ELECTRONIC COMMUNICATIONS) WITH RESPECT THERETO. THE UNIVERSITY SHALL NOT BE SUBJECT TO ANY DAMAGES OR LIABILITY FOR ANY ERRORS, OMISSIONS, OR DELAYS THEREIN. THE UNIVERSITY MAKES NO EXPRESS OR IMPLIED WARRANTIES, AND EXPRESSLY DISCLAIMS ALL WARRANTIES, OF MERCHANTABILITY OR FITNESS FOR A PARTICULAR PURPOSE OR USE OR AS TO RESULTS TO BE OBTAINED BY VANGUARD, OWNERS OF VANGUARD MEGA CAP INDEX FUND, MEGA CAP GROWTH INDEX FUND, AND MEGA CAP VALUE INDEX FUND, OR ANY OTHER PERSON OR ENTITY FROM THE USE OF THE INDEXES OR WITH RESPECT TO ANY DATA RELATED THERETO. WITHOUT LIMITING ANY OF THE FOREGOING, IN NO EVENT WHATSOEVER SHALL THE UNIVERSITY BE LIABLE FOR ANY INDIRECT, SPECIAL, INCIDENTAL, PUNITIVE, OR CONSEQUENTIAL DAMAGES INCLUDING BUT NOT LIMITED TO, LOSS OF PROFITS, TRADING LOSSES, LOST TIME OR GOODWILL, EVEN IF IT HAS BEEN ADVISED OF THE POSSIBILITY OF SUCH DAMAGES, WHETHER IN CONTRACT, TORT, STRICT LIABILITY, OR OTHERWISE. THERE ARE NO THIRD PARTY BENEFICIARIES OF ANY AGREEMENTS OR ARRANGEMENTS BETWEEN THE UNIVERSITY AND VANGUARD, OTHER THAN THE LICENSORS, IF ANY, OF THE UNIVERSITY.
This page intentionally left blank.
The People Who Govern Your Fund
The trustees of your mutual fund are there to see that the fund is operated and managed in your best interests since, as a shareholder, you are a part owner of the fund. Your fund’s trustees also serve on the board of directors of The Vanguard Group, Inc., which is owned by the Vanguard funds and provides services to them.
A majority of Vanguard’s board members are independent, meaning that they have no affiliation with Vanguard or the funds they oversee, apart from the sizable personal investments they have made as private individuals. The independent board members have distinguished backgrounds in business, academia, and public service. Each of the trustees and executive officers oversees 212 Vanguard funds.
Information for each trustee and executive officer of the fund appears below. That information, as well as the Vanguard fund count, is as of the date on the cover of this fund report. The mailing address of the trustees and officers is P.O. Box 876, Valley Forge, PA 19482. More information about the trustees is in the Statement of Additional Information, which can be obtained, without charge, by contacting Vanguard at 800-662-7447, or online at vanguard.com.
Interested Trustee1
Mortimer J. Buckley
Born in 1969. Trustee since January 2018. Principal occupation(s) during the past five years and other experience: chairman of the board (2019–present) of Vanguard and of each of the investment companies served by Vanguard; chief executive officer (2018–present) of Vanguard; chief executive officer, president, and trustee (2018–present) of each of the investment companies served by Vanguard; president and director (2017–present) of Vanguard; and president (2018–present) of Vanguard Marketing Corporation. Chief investment officer (2013–2017), managing director (2002–2017), head of the Retail Investor Group (2006–2012), and chief information officer (2001–2006) of Vanguard. Chairman of the board (2011–2017) and trustee (2009–2017) of the Children’s Hospital of Philadelphia; and trustee (2018–present) and vice chair (2019–present) of The Shipley School.
Independent Trustees
Emerson U. Fullwood
Born in 1948. Trustee since January 2008. Principal occupation(s) during the past five years and other experience: executive chief staff and marketing officer for North America and corporate vice president (retired 2008) of Xerox Corporation (document management products and services). Former president of the Worldwide Channels Group, Latin America, and Worldwide Customer Service and executive chief staff officer of Developing Markets of Xerox. Executive in residence and 2009–2010 Distinguished Minett Professor at the Rochester Institute of Technology. Director of SPX FLOW, Inc. (multi-industry manufacturing). Director of the University of Rochester Medical Center, the Monroe Community College Foundation, the United Way of Rochester, North Carolina A&T University, and Roberts Wesleyan College. Trustee of the University of Rochester.
Amy Gutmann
Born in 1949. Trustee since June 2006. Principal occupation(s) during the past five years and other experience: president (2004–present) of the University of Pennsylvania. Christopher H. Browne Distinguished Professor of Political Science, School of Arts and Sciences, and professor of communication, Annenberg School for Communication, with secondary faculty appointments in the Department of Philosophy, School of Arts and Sciences, and at the Graduate School of Education, University of Pennsylvania.
F. Joseph Loughrey
Born in 1949. Trustee since October 2009. Principal occupation(s) during the past five years and other experience: president and chief operating officer (retired 2009) and vice chairman of the board (2008–2009) of Cummins Inc. (industrial machinery). Chairman of the board of Hillenbrand, Inc. (specialized consumer services) and the Lumina Foundation. Director of the V Foundation. Member of the advisory
| 1 | Mr. Buckley is considered an “interested person,” as defined in the Investment Company Act of 1940, because he is an officer of the Vanguard funds. |
council for the College of Arts and Letters and chair of the advisory board to the Kellogg Institute for International Studies, both at the University of Notre Dame.
Mark Loughridge
Born in 1953. Trustee since March 2012. Principal occupation(s) during the past five years and other experience: senior vice president and chief financial officer (retired 2013) of IBM (information technology services). Fiduciary member of IBM’s Retirement Plan Committee (2004–2013), senior vice president and general manager (2002–2004) of IBM Global Financing, vice president and controller (1998–2002) of IBM, and a variety of other prior management roles at IBM. Member of the Council on Chicago Booth.
Scott C. Malpass
Born in 1962. Trustee since March 2012. Principal occupation(s) during the past five years and other experience: chief investment officer (retired June 2020) and vice president (retired June 2020) of the University of Notre Dame. Assistant professor of finance at the Mendoza College of Business, University of Notre Dame, and member of the Notre Dame 403(b) Investment Committee (retired June 2020). Member of the board of Catholic Investment Services, Inc. (investment advisors) and the board of superintendence of the Institute for the Works of Religion.
Deanna Mulligan
Born in 1963. Trustee since January 2018. Principal occupation(s) during the past five years and other experience: chief executive officer (2011–present) of The Guardian Life Insurance Company of America. President (2010–2019), chief operating officer (2010–2011), and executive vice president (2008–2010) of Individual Life and Disability of The Guardian Life Insurance Company of America. Member of the board of The Guardian Life Insurance Company of America, the American Council of Life Insurers, and the Economic Club of New York. Trustee of the Partnership for New York City (business leadership), Chief Executives for Corporate Purpose, NewYork-Presbyterian Hospital, Catalyst, and the Bruce Museum (arts and science). Member of the Advisory Council for the Stanford Graduate School of Business.
André F. Perold
Born in 1952. Trustee since December 2004. Principal occupation(s) during the past five years and other experience: George Gund Professor of Finance and Banking, Emeritus at the Harvard Business School (retired 2011). Chief investment officer and co-managing partner of HighVista Strategies (private investment firm). Member of the board of advisors and member of the investment committee of the Museum of Fine Arts Boston. Member of the board (2018–present) of RIT Capital Partners (investment firm). Member of the investment committee of Partners Health Care System.
Sarah Bloom Raskin
Born in 1961. Trustee since January 2018. Principal occupation(s) during the past five years and other experience: deputy secretary (2014–2017) of the United States Department of the Treasury. Governor (2010–2014) of the Federal Reserve Board. Commissioner (2007–2010) of financial regulation for the State of Maryland. Member of the board of directors (2012–2014) of Neighborhood Reinvestment Corporation. Director (2017–present) of i(x) Investments, LLC; director (2017–present) of Reserve Trust. Rubenstein Fellow (2017–present) of Duke University; trustee (2017–present) of Amherst College, and trustee (2019–present) of the Folger Shakespeare Library.
Peter F. Volanakis
Born in 1955. Trustee since July 2009. Principal occupation(s) during the past five years and other experience: president and chief operating officer (retired 2010) of Corning Incorporated (communications equipment) and director of Corning Incorporated (2000–2010) and Dow Corning (2001–2010). Director (2012) of SPX Corporation (multi-industry manufacturing). Overseer of the Amos Tuck School of Business Administration, Dartmouth College (2001–2013). Chairman of the board of trustees of Colby-Sawyer College. Member of the board of Hypertherm Inc. (industrial cutting systems, software, and consumables).
Executive Officers
John Bendl
Born in 1970. Principal occupation(s) during the past five years and other experience: principal of Vanguard. Chief financial officer (2019–present) of each of the investment companies served by Vanguard. Chief accounting officer, treasurer, and controller of Vanguard (2017–present). Partner (2003–2016) at KPMG (audit, tax, and advisory services).
Glenn Booraem
Born in 1967. Principal occupation(s) during the past five years and other experience: principal of Vanguard. Investment stewardship officer (2017–present), treasurer (2015–2017), controller (2010–2015), and assistant controller (2001–2010) of each of the investment companies served by Vanguard.
Christine M. Buchanan
Born in 1970. Principal occupation(s) during the past five years and other experience: principal of Vanguard. Treasurer (2017–present) of each of the investment companies served by Vanguard. Partner (2005–2017) at KPMG (audit, tax, and advisory services).
David Cermak
Born in 1960. Principal occupation(s) during the past five years and other experience: principal of Vanguard. Finance director (2019–present) of each of the investment companies served by Vanguard. Managing director and head (2017–present) of Vanguard Investments Singapore. Managing director and head (2017–2019) of Vanguard Investments Hong Kong. Representative director and head (2014–2017) of Vanguard Investments Japan.
Thomas J. Higgins
Born in 1957. Principal occupation(s) during the past five years and other experience: principal of Vanguard. Finance director (2019–present), chief financial officer (2008–2019), and treasurer (1998–2008) of each of the investment companies served by Vanguard.
Peter Mahoney
Born in 1974. Principal occupation(s) during the past five years and other experience: principal of Vanguard. Controller (2015–present) of each of the investment companies served by Vanguard. Head of International Fund Services (2008–2014) at Vanguard.
Anne E. Robinson
Born in 1970. Principal occupation(s) during the past five years and other experience: general counsel (2016–present) of Vanguard. Secretary (2016–present) of Vanguard and of each of the investment companies served by Vanguard. Managing director (2016–present) of Vanguard. Managing director and general counsel of Global Cards and Consumer Services (2014–2016) at Citigroup. Counsel (2003–2014) at American Express.
Michael Rollings
Born in 1963. Principal occupation(s) during the past five years and other experience: finance director (2017–present) and treasurer (2017) of each of the investment companies served by Vanguard. Managing director (2016–present) of Vanguard. Chief financial officer (2016–present) of Vanguard. Director (2016–present) of Vanguard Marketing Corporation. Executive vice president and chief financial officer (2006–2016) of MassMutual Financial Group.
John E. Schadl
Born in 1972. Principal occupation(s) during the past five years and other experience: principal of Vanguard. Chief compliance officer (2019–present) of Vanguard and of each of the investment companies served by Vanguard. Assistant vice president (2019–present) of Vanguard Marketing Corporation.
| Vanguard Senior Management Team |
| |
| Joseph Brennan | Chris D. McIsaac |
| Mortimer J. Buckley | James M. Norris |
| Gregory Davis | Thomas M. Rampulla |
| John James | Karin A. Risi |
| Martha G. King | Anne E. Robinson |
| John T. Marcante | Michael Rollings |
Connect with Vanguard® > vanguard.com
Fund Information > 800-662-7447
Direct Investor Account Services > 800-662-2739
Institutional Investor Services > 800-523-1036
Text Telephone for People
Who Are Deaf or Hard of Hearing > 800-749-7273
This material may be used in conjunction with the offering of shares of any Vanguard fund only if preceded or accompanied by the fund’s current prospectus.
All comparative mutual fund data are from Morningstar, Inc., unless otherwise noted.
You can obtain a free copy of Vanguard’s proxy voting guidelines by visiting vanguard.com/proxyreporting or by calling Vanguard at 800-662-2739. The guidelines are also available from the SEC’s website, www.sec.gov. In addition, you may obtain a free report on how your fund voted the proxies for securities it owned during the 12 months ended June 30. To get the report, visit either vanguard.com/proxyreporting or www.sec.gov.
You can review information about your fund on the SEC’s website, and you can receive copies of this information, for a fee, by sending a request via email addressed to publicinfo@sec.gov.
Source for Bloomberg Barclays indexes: Bloomberg Index Services Limited. Copyright 2020, Bloomberg. All rights reserved.
© 2020 The Vanguard Group, Inc.
All rights reserved.
U.S. Patent Nos. 6,879,964; 7,337,138;
7,720,749; 7,925,573; 8,090,646; 8,417,623; and 8,626,636.
Vanguard Marketing Corporation, Distributor.
Q8280 102020

Annual Report | August 31, 2020 Vanguard Global Wellington™ Fund |
See the inside front cover for important information about access to your fund’s annual and semiannual shareholder reports. |
Important information about access to shareholder reports
Beginning on January 1, 2021, as permitted by regulations adopted by the Securities and Exchange Commission, paper copies of your fund’s annual and semiannual shareholder reports will no longer be sent to you by mail, unless you specifically request them. Instead, you will be notified by mail each time a report is posted on the website and will be provided with a link to access the report.
If you have already elected to receive shareholder reports electronically, you will not be affected by this change and do not need to take any action. You may elect to receive shareholder reports and other communications from the fund electronically by contacting your financial intermediary (such as a broker-dealer or bank) or, if you invest directly with the fund, by calling Vanguard at one of the phone numbers on the back cover of this report or by logging on to vanguard.com.
You may elect to receive paper copies of all future shareholder reports free of charge. If you invest through a financial intermediary, you can contact the intermediary to request that you continue to receive paper copies. If you invest directly with the fund, you can call Vanguard at one of the phone numbers on the back cover of this report or log on to vanguard.com. Your election to receive paper copies will apply to all the funds you hold through an intermediary or directly with Vanguard.
| Contents |
| |
| |
| Your Fund’s Performance at a Glance | 1 |
| |
| Advisors’ Report | 2 |
| |
| About Your Fund’s Expenses | 6 |
| |
| Performance Summary | 8 |
| |
| Financial Statements | 10 |
| |
| Liquidity Risk Management | 29 |
Please note: The opinions expressed in this report are just that—informed opinions. They should not be considered promises or advice. Also, please keep in mind that the information and opinions cover the period through the date on the front of this report. Of course, the risks of investing in your fund are spelled out in the prospectus.
Your Fund’s Performance at a Glance
• For the 12 months ended August 31, 2020, Vanguard Global Wellington Fund returned 6.22% for Investor Shares and 6.38% for Admiral Shares. Its benchmark returned 13.30%.
• Stock market indexes across the globe hit record highs in February, then fell sharply as the coronavirus spread beyond China, leading many countries to close nonessential businesses, impose lockdowns, and restrict travel. Markets rose later in the fiscal year as policymakers implemented strong responses to the ensuing economic crisis, treatments for the virus improved, vaccine trials began, and many countries started to ease pandemic-related restrictions.
• In the bond markets, volatility rose and liquidity fell as the pandemic spread in March. Nonetheless, by the end of the period, bond yields were significantly lower and bond prices were higher.
• The fund underperformed its stock benchmark in seven of the 11 industry sectors. It was most hampered by stock selection in consumer discretionary, technology, and health care. By region, selection in emerging markets was a bright spot.
• The fund outperformed its fixed income benchmark, thanks in part to security selection in industrial sectors, particularly communications and technology.
Market Barometer
| | | Average Annual Total Returns | |
| | | Periods Ended August 31, 2020 | |
| | | One Year | | Three Years | | Five Years | |
| Stocks | | | | | | | |
| Russell 1000 Index (Large-caps) | | 22.50% | | 14.58% | | 14.31% | |
| Russell 2000 Index (Small-caps) | | 6.02 | | 5.03 | | 7.65 | |
| Russell 3000 Index (Broad U.S. market) | | 21.44 | | 13.95 | | 13.86 | |
| FTSE All-World ex US Index (International) | | 8.78 | | 2.92 | | 6.00 | |
| | | | | | | | |
| Bonds | | | | | | | |
| Bloomberg Barclays U.S. Aggregate Bond Index | | | | | | | |
| (Broad taxable market) | | 6.47% | | 5.09% | | 4.33% | |
| Bloomberg Barclays Municipal Bond Index | | | | | | | |
| (Broad tax-exempt market) | | 3.24 | | 4.09 | | 3.99 | |
| FTSE Three-Month U.S. Treasury Bill Index | | 1.18 | | 1.67 | | 1.15 | |
| | | | | | | | |
| CPI | | | | | | | |
| Consumer Price Index | | 1.31% | | 1.92% | | 1.75% | |
Advisor’s Report
Vanguard Global Wellington Fund returned 6.22% for Investor Shares and 6.38% for Admiral Shares for the year ended August 31, 2020. The fund underperformed the 13.30% return of its custom benchmark, which is weighted 65% in the FTSE Developed Index (net of tax) and 35% in the Bloomberg Barclays Fixed Income Composite Index. The composite index consists of 80% Bloomberg Barclays Global Aggregate Credit Index (USD Hedged), 10% Bloomberg Barclays Global Aggregate Treasury Index (USD Hedged), and 10% Bloomberg Barclays Global Aggregate Securitized Index (USD Hedged).
Investment environment
For the fiscal year, the Standard & Poor’s 500 Index returned 21.94%, the MSCI World Index returned 17.41%, and the MSCI EAFE Index Gross returned 6.60%. The U.S. fixed income market advanced, with the Bloomberg Barclays U.S. Aggregate Index returning 6.47%. Non-U.S. bonds returned 0.72%, as measured by the Bloomberg Barclays Global Aggregate ex-USD Hedged Index, and the higher-quality Bloomberg Barclays U.S. Credit A or Better Index returned 7.45%. The yield on the 10-year U.S. Treasury began the period at 1.50% and finished at 0.72%.
In late 2019, the U.S. canceled scheduled tariffs in an effort to secure a phase-one trade deal with China. U.K. equities rose after the Conservative Party’s victory in the general election lifted uncertainty about the country’s departure from the European Union (EU) and concerns about the Labor Party’s plans to nationalize large swaths of the nation’s economy.
Global equities ended the first quarter of 2020 sharply lower as the COVID-19 pandemic caused unprecedented disruption to financial markets and economies. Market volatility remained extremely high, and liquidity plunged to record lows. Oil prices fell to their lowest level since 2002 as the world’s largest oil producers failed to agree on whether to reduce output as demand collapsed. The U.K. officially departed the EU on January 31, and the pandemic delayed U.K.-EU trade agreement discussions.
Global equities surged during the second quarter of 2020 and continued to rise toward the end of the period, supported by ongoing fiscal and monetary stimulus, encouraging COVID-19 vaccine trials, and further evidence of an acceleration in the global economy. However, a rising wave of infections pressured the recovery.
Absolute returns across most major (U.S.) fixed income spread sectors were positive for the 12 months. On an excess return basis, most spread sectors posted negative returns. Sovereign yields also declined to historic lows in several developed markets.
Monetary policy had taken a dovish pivot in 2019 because of tepid economic data, trade policy uncertainty, and stubbornly low inflation. But in response to the COVID-19 pandemic, the U.S. Federal Reserve cut
rates to near zero and committed to buying unlimited amounts of Treasury and agency mortgage-backed securities. The Fed increased the size and scope of its asset purchase program to include corporate bonds, agency commercial mortgage-backed securities, and commercial paper, while also lending support to the municipal funding market.
Global central banks added extraordinary monetary stimulus to support global economies. The European Central Bank (ECB) expanded its massive asset purchase program, which included non-financial commercial paper for the first time, and eased collateral rules. Credit spreads widened as the pandemic led to a flight to safety in U.S. Treasuries.
Toward the end of the fiscal year, the Fed announced a policy shift to an average inflation target. It also modified its employment objective to indicate that maximum employment is a “broad-based” and “inclusive” goal and noted that policy will respond to “shortfalls” from maximum employment rather than “deviations.” We interpret this to suggest that the Fed may adopt an asymmetrical approach and allow the unemployment rate to remain quite low for a sustained period unless inflation increases.
The U.S. dollar (USD) generated mixed results against global currencies, while emerging-market and commodity-linked currencies lagged on recession fears stemming from the pandemic and a collapse in OPEC+ talks early in 2020. The euro performed well, driven by the proposal of and subsequent agreement on the Next Generation EU plan.
The fund’s shortfalls
In the equity portfolio, security selection was the primary driver of relative underperformance, particularly in consumer discretionary and information technology. An underweight to information technology and an overweight to energy also detracted.
In information technology, not holding Apple was the top detractor from relative returns as anticipation of the upcoming iPhone refresh cycle propelled the stock to peak valuation. We do not hold it in the portfolio because of concerns about the long-term investment outlook related to the commoditizing nature of the smartphone industry beyond the 5G refresh cycle and the valuation premium the market has placed on Apple’s business model transformation.
In consumer discretionary, not holding Amazon also detracted from relative returns as the shutdown of the physical economy created an extremely favorable environment for the company’s retail and AWS businesses. We believe these trends will normalize with the reopening of physical retail and return to physical places of work. Amazon is a high price-to-earnings non-yielder that is taking on increasingly complicated end markets. Because it does not fit our investment approach, we chose not to own shares.
Our overweight to Suncor Energy was another top detractor because of the deep correction in oil prices set off by the failed OPEC supply agreement and severely reduced demand amid restricted global economic activity. We reduced our position but continue to hold the stock because of its efficient operating model and financial flexibility. We believe the company’s diversified cash flow stream stemming from its integrated model can help it weather the downturn.
In the fixed income portfolio, an overweight to and security selection in the banking sector detracted the most from returns. In securitized sectors, positioning in asset-backed securities (ABS) slightly hindered performance. An overweight to and security selection in local authority bonds also detracted.
The fund’s successes
While security selection and sector allocation detracted from relative returns overall, they were partially offset by positive impacts from security selection in industrials and materials and an overweight to health care.
Taiwan Semiconductor, one of the strongest competitors in the semiconductor supply chain, performed well as demand remained strong during the shutdown. The company’s new technology ramp supported this demand, and its customers proved resilient. Its balance of quality with strong dividend income and a fortress balance sheet are attractive.
Shandong Weigao rose sharply as its product portfolio gained traction in China and profitability improved on better execution in product development. Increased demand for its products and profitability improvements caused the company’s sales and earnings to grow faster than expected. Positive changes in corporate governance also contributed to the more favorable valuation. While we still view the company positively, the rapid expansion in valuation led us to eliminate the position.
In the fixed income portfolio, security selection in industrial sectors, particularly communications and technology, contributed to relative outperformance. The fund’s positioning in local agency and supranationals, and within securitized sectors, particularly an underweight to and security selection in mortgage-backed passthroughs, aided relative performance. Duration and yield curve positioning also contributed.
The fund’s positioning and outlook
In the equity portfolio, our largest overweights were in industrials, financials, and health care. Our largest underweights were in information technology, communication services, and materials. By region, the portfolio was overweighted in Europe and emerging markets and underweighted in North America and Asia Pacific ex-Japan.
With global economies reopening, we are focused on stimulus programs, central bank actions, and developments in health care. We believe these factors will drive company fundamentals in 2021 and beyond, informing our long-term views and positioning for a cyclical improvement in economic activity.
In the near term, we are mindful of risks and volatility in global equity markets amid policy uncertainty surrounding elections in the U.S. and Japan and Brexit, and have positioned the portfolio for a range of outcomes. We are leaning into the downside support of stronger balance sheets and dividend compounding and the potential upside of depressed valuations, primarily among economically depressed sectors.
With a historically low number of stocks driving the majority of global equity returns and elevated valuations, we believe our differentiated focus on valuation and dividends should provide downside protection and attractive returns. We are finding significant investment opportunity in the current valuation of leading dividend-paying franchises that are mispriced because of pandemic-induced shutdowns.
We have increased positions in industry leaders whose earnings have declined but whose long-term earnings power and competitive position are expected to improve. We believe the compounding value of their expected dividends will be an important contributor to total return in this low-interest-rate environment. The markets are currently seeking safety in a narrow group of highly valued, predominantly non-dividend-paying stocks whose fundamentals are less impaired, and in some cases enhanced, by mandated shutdowns.
We continue to maintain a modestly pro-cyclical risk posture. Our base case is for an improving economy and elevated volatility as the path of COVID-19 develops. Significant policy changes post-U.S. elections remain a key risk, along with a potential second wave of COVID-19.
We expect the Fed to maintain its current trajectory and U.S. rates to remain low and range-bound. We have positioned the fixed income portfolio with close-to-benchmark-neutral duration. Credit remains the main investment focus. Despite compression pushing spreads to more normal levels, Fed purchases remain a tailwind and likely to further support spread levels.
We are underweighted in credit risk globally, driven by an underweight to richly valued supranationals, partly offset by an overweight to corporates and taxable municipals. We favor USD-denominated corporates and focus on higher-quality, less-cyclical sectors. We expect our significant positioning there to benefit from supportive global central bank policy and search for yield.
We are overweighted in euro-denominated corporate risk and underweighted in euro-denominated supranationals. We view ECB bond purchases as very supportive of euro-denominated assets. We remain underweighted in U.K. credit risk as we do not believe the market is compensating for Brexit uncertainties and the longer-term economic impacts. We are also underweighted in emerging markets, focusing instead on countries that are better able to cope with the economic and health care impacts of COVID-19.
We believe credit fundamentals will remain strained in the medium term; however, liquidity is robust and spread widening is likely an opportunity for long-term investors. On an industry basis, the portfolio is overweighted in less-cyclical sectors such as communications and electric utilities. We are cautious about more cyclical sectors such as energy and seek opportunities to move up in credit quality.
We are also overweighted in traditional sectors of ABS, which remain well-protected from defaults. In agency MBS, we are underweighted in agency pass-throughs overall but overweighted in low-coupon to-be-announced (TBA) securities to maintain carry and liquidity. We favor collateralized mortgage obligations and delegated underwriting and servicing (DUS) bonds for their stable cash flows. We hold adequate liquidity in the fixed income portion of the fund, notably government bonds as our “all-weather” liquidity buffer.
Nataliya Kofman
Managing Director and
Equity Portfolio Manager
Michael E. Stack, CFA
Senior Managing Director and
Fixed Income Portfolio Manager
Loren L. Moran, CFA
Senior Managing Director and
Fixed Income Portfolio Manager
Wellington Management Company LLP
September 11, 2020
About Your Fund’s Expenses
As a shareholder of the fund, you incur ongoing costs, which include costs for portfolio management, administrative services, and shareholder reports (like this one), among others. Operating expenses, which are deducted from a fund’s gross income, directly reduce the investment return of the fund.
A fund’s expenses are expressed as a percentage of its average net assets. This figure is known as the expense ratio. The following examples are intended to help you understand the ongoing costs (in dollars) of investing in your fund and to compare these costs with those of other mutual funds. The examples are based on an investment of $1,000 made at the beginning of the period shown and held for the entire period.
The accompanying table illustrates your fund’s costs in two ways:
• Based on actual fund return. This section helps you to estimate the actual expenses that you paid over the period. The ”Ending Account Value“ shown is derived from the fund‘s actual return, and the third column shows the dollar amount that would have been paid by an investor who started with $1,000 in the fund. You may use the information here, together with the amount you invested, to estimate the expenses that you paid over the period.
To do so, simply divide your account value by $1,000 (for example, an $8,600 account value divided by $1,000 = 8.6), then multiply the result by the number given for your fund under the heading ”Expenses Paid During Period.“
• Based on hypothetical 5% yearly return. This section is intended to help you compare your fund‘s costs with those of other mutual funds. It assumes that the fund had a yearly return of 5% before expenses, but that the expense ratio is unchanged. In this case—because the return used is not the fund’s actual return—the results do not apply to your investment. The example is useful in making comparisons because the Securities and Exchange Commission requires all mutual funds to calculate expenses based on a 5% return. You can assess your fund’s costs by comparing this hypothetical example with the hypothetical examples that appear in shareholder reports of other funds.
Note that the expenses shown in the table are meant to highlight and help you compare ongoing costs only and do not reflect transaction costs incurred by the fund for buying and selling securities. Further, the expenses do not include any purchase, redemption, or account service fees described in the fund prospectus. If such fees were applied to your account, your costs would be higher. Your fund does not carry a “sales load.”
The calculations assume no shares were bought or sold during the period. Your actual costs may have been higher or lower, depending on the amount of your investment and the timing of any purchases or redemptions.
You can find more information about the fund’s expenses, including annual expense ratios, in the Financial Statements section of this report. For additional information on operating expenses and other shareholder costs, please refer to your fund’s current prospectus.
Six Months Ended August 31, 2020
| | Beginning | Ending | Expenses |
| | Account Value | Account Value | Paid During |
| Global Wellington Fund | 2/29/2020 | 8/31/2020 | Period |
| Based on Actual Fund Return | | | |
| Investor Shares | $1,000.00 | $1,054.00 | $2.17 |
| Admiral™ Shares | 1,000.00 | 1,054.72 | 1.65 |
| Based on Hypothetical 5% Yearly Return | | | |
| Investor Shares | $1,000.00 | $1,023.03 | $2.14 |
| Admiral Shares | 1,000.00 | 1,023.53 | 1.63 |
The calculations are based on expenses incurred in the most recent six-month period. The fund’s annualized six-month expense ratios for the period are 0.42% for Investor Shares and 0.32% for Admiral Shares. The dollar amounts shown as “Expenses Paid” are equal to the annualized expense ratio multiplied by the average account value over the period, multiplied by the number of days in the most recent six-month period, then divided by the number of days in the most recent 12-month period (184/366).
Global Wellington Fund
Performance Summary
All of the returns in this report represent past performance, which is not a guarantee of future results that may be achieved by the fund. (Current performance may be lower or higher than the performance data cited. For performance data current to the most recent month-end, visit our website at vanguard.com/performance.) Note, too, that both investment returns and principal value can fluctuate widely, so an investor’s shares, when sold, could be worth more or less than their original cost. The returns shown do not reflect taxes that a shareholder would pay on fund distributions or on the sale of fund shares.
Cumulative Performance: November 2, 2017, Through August 31, 2020
Initial Investment of $10,000
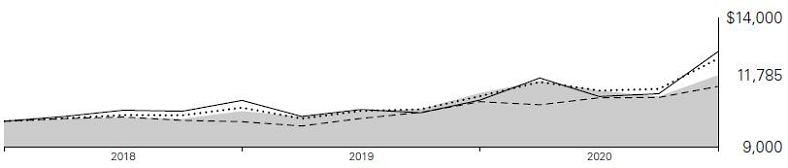
| | | Average Annual Total Returns | |
| | | Periods Ended August 31, 2020 | |
| | | | Since | Final Value |
| | | One | Inception | of a $10,000 |
| | | Year | (11/2/2017) | Investment |
 | Global Wellington Fund Investor Shares | 6.22% | 5.98% | $11,785 |
 | Global Wellington Composite Index | 13.30 | 8.00 | 12,432 |
 | Bloomberg Barclays Global Aggregate Bond Index | 5.54 | 4.59 | 11,353 |
 | FTSE Developed Net Tax Index | 17.41 | 8.84 | 12,706 |
Global Wellington Composite Index: 65% FTSE Developed Index (net of tax) and 35% Bloomberg Barclays Fixed Income Composite Index, composed of 80% Bloomberg Barclays Global Aggregate Credit Index (USD Hedged), 10% Bloomberg Barclays Global Aggregate Treasury Index (USD Hedged), and 10% Bloomberg Barclays Global Aggregate Securitized Index (USD Hedged).
"Since Inception" performance is calculated from the Investor Shares’ inception date for both the fund and its comparative standards.
See Financial Highlights for dividend and capital gains information.
Global Wellington Fund
| | Average Annual Total Returns | |
| | Periods Ended August 31, 2020 | |
| | | Since | Final Value |
| | One | Inception | of a $50,000 |
| | Year | (11/2/2017) | Investment |
| Global Wellington Fund Admiral Shares | 6.38% | 6.09% | $59,098 |
| Global Wellington Composite Index | 13.30 | 8.00 | 62,161 |
| Bloomberg Barclays Global Aggregate Bond Index | 5.54 | 4.59 | 56,766 |
| FTSE Developed Net Tax Index | 17.41 | 8.84 | 63,531 |
"Since Inception" performance is calculated from the Admiral Shares’ inception date for both the fund and its comparative standards.
Global Wellington Fund
Fund Allocation
As of August 31, 2020
| Canada | 2.1% |
| France | 5.8 |
| Germany | 1.6 |
| Japan | 6.8 |
| South Korea | 1.0 |
| Spain | 2.1 |
| Switzerland | 4.6 |
| Taiwan | 1.6 |
| United Kingdom | 7.5 |
| United States | 60.9 |
| Other | 6.0 |
The table reflects the fund’s investments, except for short-term investments and derivatives.
Global Wellington Fund
Financial Statements
Schedule of Investments
As of August 31, 2020
The fund files its complete schedule of portfolio holdings with the Securities and Exchange Commission (SEC) for the first and third quarters of each fiscal year as an exhibit to its reports on Form N-PORT. The fund’s Form N-PORT reports are available on the SEC’s website at www.sec.gov.
| | | | | | | Market | |
| | | | | | Value• | |
| | | | | Shares | | ($000 | ) |
| Common Stocks (65.1%) | | | | | |
| Canada (1.0%) | | | | | |
| | | Dollarama Inc. | | 184,999 | | 7,222 | |
| | | Suncor Energy Inc. | | 363,209 | | 5,828 | |
| | | | | | | 13,050 | |
| France (3.8%) | | | | | |
| | | Vinci SA | | 114,810 | | 10,757 | |
| | | TOTAL SE | | 238,583 | | 9,465 | |
| * | | Engie SA | | 675,822 | | 9,402 | |
| | | Arkema SA | | 77,458 | | 8,576 | |
| * | | BNP Paribas SA | | 133,337 | | 5,809 | |
| | | Schneider Electric SE | | 23,663 | | 2,926 | |
| | | Legrand SA | | 30,864 | | 2,576 | |
| | | | | | | 49,511 | |
| Germany (0.5%) | | | | | |
| | | Bayerische Motoren Werke AG | | 82,024 | | 5,911 | |
| | | | | | | | |
| Hong Kong (0.5%) | | | | | |
| | | CK Asset Holdings Ltd. | | 1,107,240 | | 6,010 | |
| | | | | | | | |
| Italy (0.1%) | | | | | |
| | | Assicurazioni Generali SPA | | 73,777 | | 1,146 | |
| | | | | | | | |
| Japan (5.8%) | | | | | |
| | | Tokio Marine Holdings Inc. | | 294,697 | | 13,601 | |
| | | Marui Group Co. Ltd. | | 567,365 | | 10,352 | |
| | | Isuzu Motors Ltd. | | 934,614 | | 9,235 | |
| | | Nippon Telegraph & Telephone Corp. | | 388,344 | | 8,837 | |
| | | Astellas Pharma Inc. | | 500,000 | | 7,844 | |
| | | Honda Motor Co. Ltd. | | 262,700 | | 6,688 | |
| | | Sumitomo Mitsui Financial Group Inc. | | 178,901 | | 5,261 | |
| | | Mitsubishi Estate Co. Ltd. | | 326,800 | | 5,114 | |
| | | Mitsubishi UFJ Financial Group Inc. | | 1,205,322 | | 5,029 | |
| | | Seven & i Holdings Co. Ltd. | | 114,283 | | 3,687 | |
| | | | | | | 75,648 | |
| Netherlands (0.2%) | | | | | |
| * | | ING Groep NV | | 382,265 | | 3,120 | |
| | | | | | | | |
| South Korea (1.0%) | | | | | |
| | | Samsung Electronics Co. Ltd. | | 275,646 | | 12,516 | |
Global Wellington Fund
| | | | | | | Market | |
| | | | | | | Value• | |
| | | | | Shares | | ($000 | ) |
| Spain (1.5%) | | | | | |
| * | | Iberdrola SA | | 1,153,139 | | 14,549 | |
| | | CaixaBank SA | | 2,610,041 | | 5,734 | |
| | | | | | | 20,283 | |
| Sweden (0.5%) | | | | | |
| | | Lundin Energy AB | | 269,562 | | 6,598 | |
| | | | | | | | |
| Switzerland (4.2%) | | | | | |
| | | Novartis AG | | 273,741 | | 23,593 | |
| | | Nestle SA | | 143,620 | | 17,299 | |
| | | Zurich Insurance Group AG | | 20,108 | | 7,435 | |
| | | Julius Baer Group Ltd. | | 137,032 | | 6,570 | |
| | | | | | | 54,897 | |
| Taiwan (1.6%) | | | | | |
| | | Taiwan Semiconductor Manufacturing Co. Ltd. | | 1,428,175 | | 20,816 | |
| | | | | | | | |
| United Kingdom (5.2%) | | | | | |
| | | Diageo plc | | 421,779 | | 14,092 | |
| | | Prudential plc | | 746,290 | | 12,032 | |
| | | AstraZeneca plc ADR | | 190,553 | | 10,671 | |
| | | BAE Systems plc | | 1,274,842 | | 8,850 | |
| | | WPP plc | | 970,252 | | 8,218 | |
| | | Rotork plc | | 2,043,186 | | 8,186 | |
| | | Derwent London plc | | 176,401 | | 6,656 | |
| | | | | | | 68,705 | |
| United States (39.2%) | | | | | |
| | | Microsoft Corp. | | 110,166 | | 24,846 | |
| | | Johnson & Johnson | | 156,886 | | 24,068 | |
| | | United Parcel Service Inc. Class B | | 142,558 | | 23,325 | |
| | | Deere & Co. | | 107,568 | | 22,596 | |
| | | Cisco Systems Inc. | | 502,596 | | 21,220 | |
| | | McDonald’s Corp. | | 92,808 | | 19,816 | |
| | | Bank of America Corp. | | 665,616 | | 17,133 | |
| | | Medtronic plc | | 158,381 | | 17,021 | |
| | | Merck & Co. Inc. | | 197,724 | | 16,860 | |
| | | Mondelez International Inc. Class A | | 282,110 | | 16,481 | |
| | | Comcast Corp. Class A | | 359,083 | | 16,091 | |
| | | Chubb Ltd. | | 122,043 | | 15,255 | |
| | | Linde plc | | 60,506 | | 15,228 | |
| | | PepsiCo Inc. | | 105,277 | | 14,745 | |
| | | Lockheed Martin Corp. | | 36,799 | | 14,361 | |
| | | TJX Cos. Inc. | | 238,749 | | 13,081 | |
| | | Sempra Energy | | 103,681 | | 12,820 | |
| | | UnitedHealth Group Inc. | | 40,954 | | 12,800 | |
| | | Autoliv Inc. | | 158,633 | | 12,427 | |
| | | American Express Co. | | 115,516 | | 11,735 | |
| | | General Dynamics Corp. | | 78,478 | | 11,721 | |
| | | Texas Instruments Inc. | | 81,984 | | 11,654 | |
| | | Raytheon Technologies Corp. | | 182,975 | | 11,162 | |
| | | JPMorgan Chase & Co. | | 109,796 | | 11,000 | |
| | | Union Pacific Corp. | | 49,425 | | 9,511 | |
| | | General Motors Co. | | 298,784 | | 8,853 | |
| | | Verizon Communications Inc. | | 148,911 | | 8,826 | |
Global Wellington Fund
| | | | | | Market | |
| | | | | | Value• | |
| | | | Shares | | ($000 | ) |
| | | PNC Financial Services Group Inc. | | 77,144 | | 8,578 | |
| | | Broadcom Inc. | | 22,792 | | 7,912 | |
| * | | Alphabet Inc. Class A | | 4,726 | | 7,701 | |
| | | American Tower Corp. | | 29,695 | | 7,399 | |
| | | Caterpillar Inc. | | 50,287 | | 7,156 | |
| | | Gilead Sciences Inc. | | 102,680 | | 6,854 | |
| | | Honeywell International Inc. | | 39,034 | | 6,462 | |
| | | RenaissanceRe Holdings Ltd. | | 33,834 | | 6,217 | |
| | | KLA Corp. | | 27,092 | | 5,558 | |
| | | Northrop Grumman Corp. | | 15,321 | | 5,249 | |
| | | BlackRock Inc. | | 7,916 | | 4,704 | |
| | | EOG Resources Inc. | | 96,910 | | 4,394 | |
| | | Abbott Laboratories | | 39,668 | | 4,342 | |
| | | Intel Corp. | | 75,204 | | 3,832 | |
| | | Accenture plc Class A | | 14,300 | | 3,431 | |
| | | Colgate-Palmolive Co. | | 39,842 | | 3,158 | |
| | | Otis Worldwide Corp. | | 37,616 | | 2,366 | |
| | | Marsh & McLennan Cos. Inc. | | 19,470 | | 2,237 | |
| | | Schlumberger Ltd. | | 109,405 | | 2,080 | |
| | | | | | | 514,266 | |
| Total Common Stocks (Cost $760,875) | | | | 852,477 | |
| | | | | | Face | | | |
| | | | | Maturity | Amount | | | |
| | | | Coupon | Date | ($000 | ) | | |
| U.S. Government and Agency Obligations (4.7%) | | | | | |
| United States (4.7%) | | | | | | |
| 1,2 | | Fannie Mae Pool | 3.070% | 2/1/25 | 150 | | 163 | |
| 1,2 | | Fannie Mae Pool | 2.780% | 6/1/26 | 330 | | 363 | |
| 1,2 | | Fannie Mae REMICS | 2.000% | 9/25/40 | 117 | | 120 | |
| 1,2 | | Fannie Mae REMICS | 3.500% | 6/25/44–6/25/59 | 2,275 | | 2,437 | |
| 1,2 | | Fannie Mae REMICS | 2.500% | 5/25/45–3/25/53 | 887 | | 928 | |
| 1,2 | | Fannie Mae REMICS | 3.000% | 2/25/49 | 203 | | 211 | |
| 1,2 | | Freddie Mac REMICS | 4.000% | 12/15/39–8/15/40 | 1,040 | | 1,159 | |
| 1,2 | | Freddie Mac REMICS | 3.500% | 9/15/40–11/15/40 | 292 | | 299 | |
| 1,2 | | Freddie Mac REMICS | 1.750% | 9/15/42 | 1,003 | | 1,032 | |
| 1 | | Ginnie Mae II Pool | 3.000% | 7/20/50 | 2,394 | | 2,525 | |
| 1 | | Ginnie Mae REMICS | 2.750% | 9/20/44 | 198 | | 203 | |
| ¤,1,2 | | UMBS Pool | 2.500% | 8/1/35–9/1/50 | 8,500 | | 8,946 | |
| ¤,1,2 | | UMBS Pool | 1.500% | 9/1/35 | 1,200 | | 1,228 | |
| ¤,1,2 | | UMBS Pool | 2.000% | 9/1/35 | 5,425 | | 5,645 | |
| 3,4 | | United States Treasury Note/Bond | 0.125% | 5/31/22 | 5,855 | | 5,853 | |
| | | United States Treasury Note/Bond | 0.125% | 5/15/23 | 595 | | 595 | |
| | | United States Treasury Note/Bond | 0.125% | 8/15/23 | 3,000 | | 2,998 | |
| | | United States Treasury Note/Bond | 0.250% | 5/31/25 | 9,115 | | 9,112 | |
| | | United States Treasury Note/Bond | 0.250% | 7/31/25 | 1,750 | | 1,748 | |
| | | United States Treasury Note/Bond | 0.250% | 8/31/25 | 8,595 | | 8,586 | |
| | | United States Treasury Note/Bond | 1.500% | 2/15/30 | 335 | | 360 | |
| 4 | | United States Treasury Note/Bond | 0.625% | 5/15/30 | 2,005 | | 1,991 | |
| | | United States Treasury Note/Bond | 1.125% | 8/15/40 | 600 | | 586 | |
| 3 | | United States Treasury Note/Bond | 2.750% | 11/15/47 | 550 | | 710 | |
| | | United States Treasury Note/Bond | 2.250% | 8/15/49 | 140 | | 166 | |
Global Wellington Fund
| | | | | | Face | | Market | |
| | | | | Maturity | Amount | | Value• | |
| | | | Coupon | Date | ($000 | ) | ($000 | ) |
| 3 | | United States Treasury Note/Bond | 2.000% | 2/15/50 | 3,428 | | 3,856 | |
| | | United States Treasury Note/Bond | 1.250% | 5/15/50 | 295 | | 278 | |
| Total U.S. Government and Agency Obligations (Cost $61,684) | | | | 62,098 | |
| Asset-Backed/Commercial Mortgage-Backed Securities (1.1%) | | | | | |
| Australia (0.0%) | | | | | | |
| 5 | | National Australia Bank Ltd. | 2.400% | 12/7/21 | 575 | | 590 | |
| | | | | | | | | |
| Bermuda (0.0%) | | | | | | |
| 1,5 | | START Ireland | 4.089% | 3/15/44 | 165 | | 150 | |
| | | | | | | | | |
| Canada (0.2%) | | | | | | |
| 1,5 | | Chesapeake Funding II LLC 2018-2A | 3.230% | 8/15/30 | 451 | | 458 | |
| 5,6 | | Ford Auto Securitization Trust | 2.354% | 6/15/23 | 1,777 | | 1,369 | |
| 1,5,7 | | Master Credit Card Trust II Series 2018-1A, 1M USD LIBOR + 0.490% | 0.661% | 7/21/24 | 765 | | 756 | |
| | | | | | | | 2,583 | |
| Cayman Islands (0.5%) | | | | | | |
| 1,5,7 | | Atlas Senior Loan Fund V Ltd., 3M USD LIBOR + 1.260% | 1.531% | 7/16/29 | 742 | | 737 | |
| 1,5,7 | | KKR CLO 16 Ltd., 3M USD LIBOR + 1.250% | 1.522% | 1/20/29 | 360 | | 355 | |
| 1,5,7 | | KKR CLO 17 Ltd., 3M USD LIBOR + 1.340% | 1.615% | 4/15/29 | 730 | | 729 | |
| 1,5,7 | | Madison Park Funding XVIII Ltd., 3M USD LIBOR + 1.190% | 1.461% | 10/21/30 | 730 | | 725 | |
| 1,5,7 | | Madison Park Funding XXX Ltd., 3M USD LIBOR + 0.750% | 1.025% | 4/15/29 | 1,400 | | 1,369 | |
| 1,5,7 | | Magnetite VII Ltd., 3M USD LIBOR + 0.800% | 1.075% | 1/15/28 | 1,375 | | 1,361 | |
| 1,5,7 | | Race Point IX CLO Ltd., 3M USD LIBOR + 1.210% | 1.485% | 10/15/30 | 726 | | 720 | |
| | | | | | | | 5,996 | |
| United States (0.4%) | | | | | | |
| 1,5 | | Aaset 2019-1 Trust | 3.844% | 5/15/39 | 222 | | 202 | |
| 1,5 | | Angel Oak Mortgage Trust I LLC 2018-3 | 3.649% | 9/25/48 | 297 | | 297 | |
| 1,5 | | ARI Fleet Lease Trust 2018-A | 2.550% | 10/15/26 | 39 | | 39 | |
| 1,5 | | Castlelake Aircraft Securitization Trust 2019-1 | 3.967% | 4/15/39 | 235 | | 213 | |
| 1,5 | | CF Hippolyta LLC | 1.690% | 7/15/60 | 820 | | 832 | |
| 1,5 | | Chesapeake Funding II LLC 2017-2A | 1.990% | 5/15/29 | 90 | | 90 | |
| 1,5 | | COLT 2018-3 Mortgage Loan Trust | 3.692% | 10/26/48 | 75 | | 76 | |
| 1,5 | | DB Master Finance LLC | 3.787% | 5/20/49 | 144 | | 149 | |
| 1,5 | | DB Master Finance LLC | 4.021% | 5/20/49 | 124 | | 131 | |
| 1,5 | | Deephaven Residential Mortgage Trust 2018-1 | 2.976% | 12/25/57 | 107 | | 107 | |
| 1,5 | | Enterprise Fleet Financing LLC Series 2018-1 | 2.870% | 10/20/23 | 183 | | 184 | |
| 1,5 | | First Investors Auto Owner Trust | 2.410% | 12/15/22 | 11 | | 11 | |
| 1 | | Ford Credit Floorplan Master Owner Trust 2019-A | 2.440% | 9/15/26 | 255 | | 272 | |
| 1,2 | | Freddie Mac Multifamily Structured Pass Through Certificates | 2.282% | 7/25/26 | 285 | | 308 | |
| 1,5 | | GreatAmerica Leasing Receivables Funding LLC Series 2018-1 | 2.600% | 6/15/21 | 60 | | 60 | |
| 1,5 | | GreatAmerica Leasing Receivables Funding LLC Series 2018-1 | 2.830% | 6/17/24 | 167 | | 170 | |
| 1,5 | | Horizon Aircraft Finance Ltd. | 3.721% | 7/15/39 | 236 | | 219 | |
| 1,5 | | MMAF Equipment Finance LLC 2017-B | 2.210% | 10/17/22 | 69 | | 70 | |
Global Wellington Fund
| | | | | | Face | | Market | |
| | | | | Maturity | Amount | | Value• | |
| | | | Coupon | Date | ($000 | ) | ($000 | ) |
| 1,2 | | Seasoned Credit Risk Transfer Trust Series 2018-4 | 3.500% | 3/25/58 | 99 | | 106 | |
| 1,2 | | Seasoned Credit Risk Transfer Trust Series 2019-1 | 3.500% | 7/25/58 | 101 | | 109 | |
| 1,2 | | Seasoned Credit Risk Transfer Trust Series 2019-3 | 3.500% | 10/25/58 | 267 | | 289 | |
| 1,5 | | SoFi Consumer Loan Program 2019-3 Trust | 2.900% | 5/25/28 | 638 | | 646 | |
| 1,5 | | Towd Point Mortgage Trust 2018-1 | 3.000% | 1/25/58 | 208 | | 214 | |
| 1,5 | | Vantage Data Centers LLC 2018-1A | 4.072% | 2/16/43 | 292 | | 300 | |
| 1,5 | | Vantage Data Centers LLC 2019-1A | 3.188% | 7/15/44 | 193 | | 196 | |
| 1,5 | | Verus Securitization Trust 2019-2 | 3.211% | 5/25/59 | 236 | | 241 | |
| | | | | | | | 5,531 | |
| Total Asset-Backed/Commercial Mortgage-Backed Securities (Cost $14,850) | | | 14,850 | |
| Corporate Bonds (21.7%) | | | | | | |
| Australia (0.2%) | | | | | | |
| 1,5 | | Macquarie Group Ltd. | 4.150% | 3/27/24 | 1,025 | | 1,102 | |
| 5 | | National Australia Bank Ltd. | 2.332% | 8/21/30 | 285 | | 286 | |
| 1,5 | | National Australia Bank Ltd. | 3.933% | 8/2/34 | 1,050 | | 1,167 | |
| 5 | | Scentre Group Trust 1 / Scentre Group Trust 2 | 3.625% | 1/28/26 | 555 | | 593 | |
| | | | | | | | 3,148 | |
| Belgium (0.3%) | | | | | | |
| | | Anheuser-Busch Cos. LLC / Anheuser-Busch InBev Worldwide Inc. | 4.900% | 2/1/46 | 925 | | 1,140 | |
| 8 | | Anheuser-Busch InBev SA | 1.750% | 3/7/25 | 375 | | 520 | |
| 9 | | Anheuser-Busch InBev SA | 2.000% | 3/17/28 | 650 | | 858 | |
| 9 | | Anheuser-Busch InBev SA | 2.875% | 4/2/32 | 625 | | 885 | |
| | | Anheuser-Busch InBev Worldwide Inc. | 4.375% | 4/15/38 | 670 | | 769 | |
| | | Anheuser-Busch InBev Worldwide Inc. | 4.600% | 4/15/48 | 170 | | 201 | |
| | | | | | | | 4,373 | |
| Canada (0.5%) | | | | | | |
| | | Bank of Nova Scotia | 2.700% | 8/3/26 | 1,205 | | 1,335 | |
| 6 | | Bell Canada Inc. | 3.350% | 3/22/23 | 975 | | 789 | |
| 7 | | Canadian Imperial Bank of Commerce, 3M USD LIBOR + 0.720% | 1.041% | 6/16/22 | 570 | | 575 | |
| | | Emera US Finance LP | 2.700% | 6/15/21 | 400 | | 406 | |
| | | Fortis Inc. | 3.055% | 10/4/26 | 775 | | 845 | |
| | | Nutrien Ltd. | 4.125% | 3/15/35 | 650 | | 746 | |
| 6 | | Royal Bank of Canada | 2.949% | 5/1/23 | 1,875 | | 1,523 | |
| | | TransCanada PipeLines Ltd. | 4.875% | 1/15/26 | 400 | | 475 | |
| | | | | | | | 6,694 | |
| Chile (0.2%) | | | | | | |
| 5 | | Banco Santander Chile | 2.700% | 1/10/25 | 1,825 | | 1,925 | |
| | | | | | | | | |
| China (0.3%) | | | | | | |
| | | Alibaba Group Holding Ltd. | 3.125% | 11/28/21 | 825 | | 847 | |
| | | Alibaba Group Holding Ltd. | 3.400% | 12/6/27 | 660 | | 743 | |
| 5 | | Tencent Holdings Ltd. | 3.595% | 1/19/28 | 1,035 | | 1,148 | |
| 5 | | Tencent Holdings Ltd. | 3.975% | 4/11/29 | 445 | | 512 | |
| | | | | | | | 3,250 | |
| Denmark (0.2%) | | | | | | |
| 1,9 | | Danske Bank A/S | 0.500% | 8/27/25 | 2,450 | | 2,906 | |
Global Wellington Fund
| | | | | | Face | | Market | |
| | | | | Maturity | Amount | | Value• | |
| | | | Coupon | Date | ($000 | ) | ($000 | ) |
| France (1.8%) | | | | | | |
| 9 | | Airbus SE | 2.375% | 4/7/32 | 1,750 | | 2,273 | |
| 1,9 | | AXA SA | 5.125% | 7/4/43 | 600 | | 802 | |
| 9 | | BNP Paribas SA | 1.500% | 11/17/25 | 1,625 | | 2,050 | |
| 1,5 | | BNP Paribas SA | 2.819% | 11/19/25 | 470 | | 500 | |
| 1,5 | | BNP Paribas SA | 2.219% | 6/9/26 | 1,095 | | 1,143 | |
| 9 | | BNP Paribas SA | 0.125% | 9/4/26 | 600 | | 699 | |
| 9 | | BPCE SA | 1.125% | 1/18/23 | 700 | | 854 | |
| 5 | | BPCE SA | 3.250% | 1/11/28 | 525 | | 579 | |
| 9 | | Cie de Saint-Gobain | 2.375% | 10/4/27 | 1,000 | | 1,342 | |
| 9 | | Credit Mutuel Arkea SA | 1.625% | 4/15/26 | 1,500 | | 1,899 | |
| 5 | | Danone SA | 2.947% | 11/2/26 | 555 | | 614 | |
| 9 | | Engie SA | 0.000% | 3/4/27 | 1,300 | | 1,537 | |
| 9 | | Engie SA | 1.750% | 3/27/28 | 1,000 | | 1,322 | |
| 9 | | Orange SA | 1.000% | 5/12/25 | 1,300 | | 1,617 | |
| 9 | | Orange SA | 2.000% | 1/15/29 | 500 | | 679 | |
| 9 | | Orange SA | 0.500% | 9/4/32 | 1,000 | | 1,169 | |
| 9 | | RCI Banque SA | 0.750% | 9/26/22 | 500 | | 591 | |
| 9 | | RCI Banque SA | 1.375% | 3/8/24 | 800 | | 957 | |
| 9 | | Veolia Environnement SA | 1.590% | 1/10/28 | 400 | | 520 | |
| 9 | | Veolia Environnement SA | 1.940% | 1/7/30 | 800 | | 1,069 | |
| 5 | | WEA Finance LLC | 4.125% | 9/20/28 | 885 | | 906 | |
| 5 | | WEA Finance LLC | 4.625% | 9/20/48 | 200 | | 194 | |
| | | | | | | | 23,316 | |
| Germany (1.1%) | | | | | | |
| 5 | | Bayer US Finance II LLC | 4.250% | 12/15/25 | 1,000 | | 1,149 | |
| 5 | | Bayer US Finance LLC | 3.375% | 10/8/24 | 770 | | 839 | |
| 8 | | Deutsche Telekom AG | 3.125% | 2/6/34 | 775 | | 1,201 | |
| 8 | | E.ON International Finance BV | 5.875% | 10/30/37 | 250 | | 520 | |
| 9 | | E.ON SE | 1.625% | 5/22/29 | 1,265 | | 1,661 | |
| 8 | | innogy Finance BV | 4.750% | 1/31/34 | 600 | | 1,068 | |
| 5 | | Siemens Financieringsmaatschappij NV | 2.900% | 5/27/22 | 650 | | 678 | |
| 9 | | Volkswagen Leasing GmbH | 2.625% | 1/15/24 | 425 | | 539 | |
| 9 | | Volkswagen Leasing GmbH | 1.375% | 1/20/25 | 3,100 | | 3,770 | |
| 9 | | Wintershall Dea Finance BV | 0.840% | 9/25/25 | 2,600 | | 3,024 | |
| | | | | | | | 14,449 | |
| Hong Kong (0.0%) | | | | | | |
| 5 | | AIA Group Ltd. | 3.375% | 4/7/30 | 260 | | 291 | |
| | | | | | | | | |
| Ireland (0.3%) | | | | | | |
| 9 | | CRH Finance DAC | 3.125% | 4/3/23 | 1,634 | | 2,102 | |
| 9 | | CRH SMW Finance DAC | 1.250% | 11/5/26 | 1,200 | | 1,502 | |
| | | | | | | | 3,604 | |
| Japan (0.2%) | | | | | | |
| 9 | | Takeda Pharmaceutical Co. Ltd. | 1.375% | 7/9/32 | 850 | | 1,048 | |
| | | Takeda Pharmaceutical Co. Ltd. | 3.025% | 7/9/40 | 200 | | 207 | |
| 10 | | Toyota Finance Australia Ltd. | 2.500% | 12/7/20 | 1,625 | | 1,204 | |
| | | | | | | | 2,459 | |
| Mexico (0.1%) | | | | | | |
| | | America Movil SAB de CV | 3.625% | 4/22/29 | 275 | | 310 | |
| | | America Movil SAB de CV | 6.375% | 3/1/35 | 350 | | 510 | |
| 5 | | Infraestructura Energetica Nova SAB de CV | 4.875% | 1/14/48 | 980 | | 984 | |
| | | | | | | | 1,804 | |
Global Wellington Fund
| | | | | | Face | | Market | |
| | | | | Maturity | Amount | | Value• | |
| | | | Coupon | Date | ($000 | ) | ($000 | ) |
| Netherlands (0.3%) | | | | | | |
| 9 | | ABN AMRO Bank NV | 2.500% | 11/29/23 | 1,330 | | 1,719 | |
| 8 | | Cooperatieve Rabobank UA | 4.625% | 5/23/29 | 200 | | 330 | |
| 9 | | Heineken NV | 1.500% | 10/3/29 | 1,325 | | 1,742 | |
| | | Shell International Finance BV | 4.000% | 5/10/46 | 300 | | 356 | |
| | | | | | | | 4,147 | |
| Norway (0.1%) | | | | | | |
| 5 | | Aker BP ASA | 3.750% | 1/15/30 | 950 | | 942 | |
| | | | | | | | | |
| South Korea (0.0%) | | | | | | |
| 5 | | SK Telecom Co. Ltd. | 3.750% | 4/16/23 | 200 | | 215 | |
| | | | | | | | | |
| Spain (0.4%) | | | | | | |
| 9 | | Abertis Infraestructuras SA | 1.125% | 3/26/28 | 1,600 | | 1,833 | |
| 9 | | Iberdrola Finanzas SA | 1.250% | 10/28/26 | 1,300 | | 1,653 | |
| | | Telefonica Emisiones SAU | 4.665% | 3/6/38 | 1,055 | | 1,222 | |
| | | | | | | | 4,708 | |
| Switzerland (0.3%) | | | | | | |
| 5 | | Alcon Finance Corp. | 3.000% | 9/23/29 | 1,280 | | 1,383 | |
| 5 | | Alcon Finance Corp. | 2.600% | 5/27/30 | 625 | | 661 | |
| 1,9 | | Credit Suisse Group AG | 1.250% | 7/17/25 | 675 | | 830 | |
| 1,5 | | Credit Suisse Group AG | 2.593% | 9/11/25 | 500 | | 522 | |
| | | | | | | | 3,396 | |
| United Kingdom (1.6%) | | | | | | |
| | | AstraZeneca plc | 4.000% | 1/17/29 | 755 | | 899 | |
| 5 | | BAE Systems plc | 3.400% | 4/15/30 | 200 | | 225 | |
| 1 | | Barclays plc | 3.932% | 5/7/25 | 860 | | 932 | |
| | | BAT Capital Corp. | 3.557% | 8/15/27 | 1,240 | | 1,349 | |
| | | BP Capital Markets plc | 3.814% | 2/10/24 | 475 | | 523 | |
| 6 | | BP Capital Markets plc | 3.470% | 5/15/25 | 1,350 | | 1,126 | |
| 5 | | CK Hutchison International 17 II Ltd. | 2.750% | 3/29/23 | 1,275 | | 1,326 | |
| 8 | | CPUK Finance Ltd. | 3.588% | 8/28/25 | 1,400 | | 1,895 | |
| 9 | | FCE Bank plc | 0.869% | 9/13/21 | 1,800 | | 2,106 | |
| 1 | | HSBC Holdings plc | 4.041% | 3/13/28 | 1,160 | | 1,304 | |
| 1 | | HSBC Holdings plc | 2.357% | 8/18/31 | 805 | | 817 | |
| 7 | | HSBC Holdings plc, 3M USD LIBOR + 1.000% | 1.270% | 5/18/24 | 245 | | 245 | |
| 9 | | Imperial Brands Finance plc | 2.250% | 2/26/21 | 1,825 | | 2,190 | |
| | | Prudential plc | 3.125% | 4/14/30 | 540 | | 598 | |
| 5 | | Sky plc | 3.125% | 11/26/22 | 725 | | 767 | |
| 1,5 | | Standard Chartered plc | 2.744% | 9/10/22 | 1,095 | | 1,108 | |
| 9 | | Vodafone Group plc | 1.625% | 11/24/30 | 2,675 | | 3,492 | |
| | | Vodafone Group plc | 5.250% | 5/30/48 | 400 | | 514 | |
| | | | | | | | 21,416 | |
| United States (13.8%) | | | | | | |
| 5 | | AbbVie Inc. | 3.800% | 3/15/25 | 1,060 | | 1,183 | |
| 5 | | AbbVie Inc. | 4.050% | 11/21/39 | 275 | | 322 | |
| 5 | | AbbVie Inc. | 4.750% | 3/15/45 | 225 | | 279 | |
| | | Alabama Power Co. | 4.300% | 7/15/48 | 255 | | 323 | |
| | | Allstate Corp. | 3.850% | 8/10/49 | 495 | | 596 | |
| 9 | | Altria Group Inc. | 2.200% | 6/15/27 | 435 | | 559 | |
| | | Altria Group Inc. | 5.800% | 2/14/39 | 560 | | 713 | |
| | | Altria Group Inc. | 3.875% | 9/16/46 | 400 | | 416 | |
Global Wellington Fund
| | | | | | Face | | Market | |
| | | | | Maturity | Amount | | Value• | |
| | | | Coupon | Date | ($000 | ) | ($000 | ) |
| | | Amazon.com Inc. | 4.800% | 12/5/34 | 300 | | 410 | |
| | | American Electric Power Co. Inc. | 3.200% | 11/13/27 | 950 | | 1,038 | |
| 9 | | American Express Credit Corp. | 0.625% | 11/22/21 | 1,900 | | 2,286 | |
| 9 | | American International Group Inc. | 1.500% | 6/8/23 | 975 | | 1,202 | |
| | | American International Group Inc. | 4.250% | 3/15/29 | 502 | | 586 | |
| | | American International Group Inc. | 4.500% | 7/16/44 | 73 | | 86 | |
| | | American International Group Inc. | 4.750% | 4/1/48 | 45 | | 55 | |
| | | American Tower Corp. | 5.000% | 2/15/24 | 380 | | 434 | |
| | | American Tower Corp. | 4.400% | 2/15/26 | 300 | | 348 | |
| | | Amgen Inc. | 3.625% | 5/22/24 | 275 | | 303 | |
| | | Amgen Inc. | 4.663% | 6/15/51 | 350 | | 462 | |
| | | Anthem Inc. | 3.500% | 8/15/24 | 275 | | 302 | |
| | | Anthem Inc. | 2.250% | 5/15/30 | 1,010 | | 1,043 | |
| | | Anthem Inc. | 4.375% | 12/1/47 | 500 | | 625 | |
| | | AT&T Inc. | 2.300% | 6/1/27 | 230 | | 244 | |
| 9 | | AT&T Inc. | 1.600% | 5/19/28 | 1,325 | | 1,674 | |
| 9 | | AT&T Inc. | 2.050% | 5/19/32 | 975 | | 1,260 | |
| 9 | | AT&T Inc. | 2.450% | 3/15/35 | 730 | | 963 | |
| 9 | | AT&T Inc. | 3.150% | 9/4/36 | 350 | | 491 | |
| | | AutoZone Inc. | 3.125% | 4/21/26 | 1,525 | | 1,679 | |
| | | Bank of America Corp. | 3.300% | 1/11/23 | 570 | | 607 | |
| 1 | | Bank of America Corp. | 3.593% | 7/21/28 | 1,885 | | 2,132 | |
| 1 | | Bank of America Corp. | 4.271% | 7/23/29 | 1,640 | | 1,936 | |
| 1 | | Bank of America Corp. | 2.496% | 2/13/31 | 770 | | 808 | |
| 7 | | Bank of New York Mellon Corp., 3M USD LIBOR + 1.050% | 1.318% | 10/30/23 | 415 | | 422 | |
| | | Berkshire Hathaway Energy Co. | 5.150% | 11/15/43 | 10 | | 14 | |
| | | Boeing Co. | 3.250% | 3/1/28 | 632 | | 628 | |
| | | Boeing Co. | 3.450% | 11/1/28 | 230 | | 230 | |
| | | Boeing Co. | 3.375% | 6/15/46 | 225 | | 189 | |
| 5 | | Boston Gas Co. | 3.001% | 8/1/29 | 130 | | 145 | |
| | | Boston Scientific Corp. | 4.000% | 3/1/29 | 60 | | 70 | |
| | | Boston Scientific Corp. | 4.550% | 3/1/39 | 600 | | 743 | |
| | | Brandywine Operating Partnership LP | 3.950% | 11/15/27 | 890 | | 923 | |
| | | Broadcom Corp. / Broadcom Cayman Finance Ltd. | 3.875% | 1/15/27 | 555 | | 615 | |
| | | Broadcom Inc. | 4.700% | 4/15/25 | 1,510 | | 1,725 | |
| | | Broadcom Inc. | 4.250% | 4/15/26 | 65 | | 73 | |
| | | Broadcom Inc. | 4.110% | 9/15/28 | 1,252 | | 1,394 | |
| | | Broadcom Inc. | 4.150% | 11/15/30 | 250 | | 279 | |
| 5 | | Brooklyn Union Gas Co. | 4.273% | 3/15/48 | 965 | | 1,215 | |
| 5 | | Cargill Inc. | 4.760% | 11/23/45 | 340 | | 441 | |
| 5 | | Carrier Global Corp. | 2.722% | 2/15/30 | 648 | | 679 | |
| 5 | | Carrier Global Corp. | 3.377% | 4/5/40 | 250 | | 257 | |
| | | Charles Schwab Corp. | 4.625% | 3/22/30 | 750 | | 954 | |
| | | Charter Communications Operating LLC / Charter Communications Operating Capital | 5.050% | 3/30/29 | 595 | | 719 | |
| | | Charter Communications Operating LLC / Charter Communications Operating Capital | 6.384% | 10/23/35 | 355 | | 486 | |
| | | Charter Communications Operating LLC / Charter Communications Operating Capital | 3.700% | 4/1/51 | 195 | | 193 | |
Global Wellington Fund
| | | | | Face | Market |
| | | | Maturity | Amount | Value• |
| | | Coupon | Date | ($000) | ($000) |
| 9 | Chubb INA Holdings Inc. | 0.875% | 6/15/27 | 1,455 | 1,782 |
| 9 | Chubb INA Holdings Inc. | 1.400% | 6/15/31 | 525 | 668 |
| | Cigna Corp. | 4.375% | 10/15/28 | 420 | 502 |
| | Cigna Corp. | 2.400% | 3/15/30 | 310 | 324 |
| | Cimarex Energy Co. | 4.375% | 6/1/24 | 1,040 | 1,117 |
| | Citigroup Inc. | 2.700% | 3/30/21 | 345 | 350 |
| | Citigroup Inc. | 4.600% | 3/9/26 | 535 | 621 |
| 8 | Citigroup Inc. | 1.750% | 10/23/26 | 1,000 | 1,376 |
| | Cleco Corporate Holdings LLC | 3.743% | 5/1/26 | 1,185 | 1,260 |
| | Cleco Corporate Holdings LLC | 3.375% | 9/15/29 | 325 | 331 |
| | Cleco Corporate Holdings LLC | 4.973% | 5/1/46 | 660 | 731 |
| | Comcast Corp. | 3.950% | 10/15/25 | 250 | 288 |
| 9 | Comcast Corp. | 0.250% | 5/20/27 | 1,050 | 1,256 |
| 8 | Comcast Corp. | 1.500% | 2/20/29 | 630 | 861 |
| | Comcast Corp. | 6.500% | 11/15/35 | 885 | 1,348 |
| | Comcast Corp. | 4.000% | 3/1/48 | 40 | 48 |
| | Comcast Corp. | 4.700% | 10/15/48 | 140 | 188 |
| | Comcast Corp. | 3.999% | 11/1/49 | 120 | 145 |
| | Comcast Corp. | 4.049% | 11/1/52 | 20 | 24 |
| | Comcast Corp. | 2.650% | 8/15/62 | 70 | 66 |
| | CommonSpirit Health | 4.200% | 8/1/23 | 770 | 834 |
| | CommonSpirit Health | 3.347% | 10/1/29 | 355 | 374 |
| | CommonSpirit Health | 4.187% | 10/1/49 | 435 | 461 |
| | Commonwealth Edison Co. | 3.650% | 6/15/46 | 35 | 41 |
| | Commonwealth Edison Co. | 4.000% | 3/1/48 | 245 | 302 |
| | Conagra Brands Inc. | 4.600% | 11/1/25 | 200 | 232 |
| | Consolidated Edison Co. of New York Inc. | 6.300% | 8/15/37 | 75 | 109 |
| | Consolidated Edison Co. of New York Inc. | 4.625% | 12/1/54 | 290 | 372 |
| | Constellation Brands Inc. | 2.875% | 5/1/30 | 115 | 124 |
| | Cottage Health Obligated Group | 3.304% | 11/1/49 | 290 | 319 |
| 5 | Cox Communications Inc. | 3.500% | 8/15/27 | 1,420 | 1,592 |
| 5 | Cox Communications Inc. | 4.800% | 2/1/35 | 100 | 126 |
| 5 | Cox Communications Inc. | 4.600% | 8/15/47 | 300 | 374 |
| | CSX Corp. | 4.300% | 3/1/48 | 495 | 622 |
| | CVS Health Corp. | 4.100% | 3/25/25 | 285 | 324 |
| | CVS Health Corp. | 2.875% | 6/1/26 | 1,455 | 1,581 |
| | CVS Health Corp. | 4.300% | 3/25/28 | 511 | 598 |
| | CVS Health Corp. | 4.125% | 4/1/40 | 235 | 273 |
| | CVS Health Corp. | 5.050% | 3/25/48 | 125 | 162 |
| 9 | Danaher Corp. | 2.100% | 9/30/26 | 1,550 | 2,039 |
| | Dignity Health | 3.812% | 11/1/24 | 594 | 620 |
| | Dignity Health | 4.500% | 11/1/42 | 166 | 177 |
| | Discover Bank | 4.200% | 8/8/23 | 575 | 633 |
| | Discovery Communications LLC | 3.625% | 5/15/30 | 785 | 864 |
| | Discovery Communications LLC | 4.650% | 5/15/50 | 445 | 506 |
| | Dominion Energy Gas Holdings LLC | 4.600% | 12/15/44 | 660 | 815 |
| | Dominion Energy Inc. | 2.715% | 8/15/21 | 140 | 143 |
| | Dominion Energy South Carolina Inc. | 6.625% | 2/1/32 | 156 | 224 |
| | Dominion Energy South Carolina Inc. | 5.300% | 5/15/33 | 113 | 151 |
| | Dominion Energy South Carolina Inc. | 5.450% | 2/1/41 | 300 | 416 |
| | Dominion Energy South Carolina Inc. | 4.600% | 6/15/43 | 230 | 301 |
Global Wellington Fund
| | | | | Face | Market |
| | | | Maturity | Amount | Value• |
| | | Coupon | Date | ($000) | ($000) |
| | Energy Transfer Operating LP | 4.900% | 3/15/35 | 1,075 | 1,070 |
| | Energy Transfer Operating LP | 5.000% | 5/15/50 | 80 | 77 |
| | Enterprise Products Operating LLC | 3.900% | 2/15/24 | 535 | 587 |
| 5 | Equitable Financial Life Global Funding | 1.400% | 7/7/25 | 150 | 154 |
| 5 | Equitable Financial Life Global Funding | 1.400% | 8/27/27 | 775 | 775 |
| 5 | ERAC USA Finance LLC | 3.300% | 12/1/26 | 300 | 326 |
| 5 | ERAC USA Finance LLC | 4.500% | 2/15/45 | 930 | 1,033 |
| | Evergy Inc. | 2.900% | 9/15/29 | 580 | 627 |
| | Evergy Metro Inc. | 2.250% | 6/1/30 | 245 | 261 |
| | Exxon Mobil Corp. | 2.275% | 8/16/26 | 1,075 | 1,161 |
| | Exxon Mobil Corp. | 2.610% | 10/15/30 | 190 | 206 |
| | FedEx Corp. | 4.100% | 2/1/45 | 85 | 95 |
| | FedEx Corp. | 4.750% | 11/15/45 | 227 | 275 |
| | FedEx Corp. | 4.550% | 4/1/46 | 117 | 138 |
| | FedEx Corp. | 4.050% | 2/15/48 | 33 | 37 |
| 9 | Fidelity National Information Services Inc. | 1.500% | 5/21/27 | 1,820 | 2,314 |
| 9 | Fidelity National Information Services Inc. | 2.000% | 5/21/30 | 835 | 1,101 |
| | Fifth Third Bancorp | 2.550% | 5/5/27 | 555 | 600 |
| | Fiserv Inc. | 3.200% | 7/1/26 | 355 | 398 |
| 8 | Fiserv Inc. | 3.000% | 7/1/31 | 775 | 1,164 |
| 8 | Ford Motor Credit Co. LLC | 4.535% | 3/6/25 | 875 | 1,165 |
| | Fox Corp. | 4.030% | 1/25/24 | 160 | 177 |
| 9 | General Mills Inc. | 0.450% | 1/15/26 | 1,275 | 1,530 |
| | General Motors Co. | 4.200% | 10/1/27 | 475 | 506 |
| | General Motors Co. | 5.000% | 10/1/28 | 935 | 1,042 |
| | General Motors Financial Co. Inc. | 3.450% | 4/10/22 | 1,310 | 1,346 |
| | Georgia Power Co. | 4.300% | 3/15/42 | 860 | 1,003 |
| | Goldman Sachs Group Inc. | 2.625% | 4/25/21 | 575 | 582 |
| 1 | Goldman Sachs Group Inc. | 3.272% | 9/29/25 | 1,375 | 1,496 |
| | HCA Inc. | 5.250% | 6/15/49 | 575 | 717 |
| | Healthpeak Properties Inc. | 4.000% | 6/1/25 | 850 | 955 |
| | Healthpeak Properties Inc. | 3.500% | 7/15/29 | 335 | 372 |
| | Healthpeak Properties Inc. | 3.000% | 1/15/30 | 420 | 451 |
| | Hess Corp. | 7.300% | 8/15/31 | 555 | 678 |
| | Humana Inc. | 2.900% | 12/15/22 | 590 | 619 |
| | Intercontinental Exchange Inc. | 3.000% | 9/15/60 | 645 | 666 |
| | International Business Machines Corp. | 3.300% | 5/15/26 | 550 | 624 |
| | International Business Machines Corp. | 1.950% | 5/15/30 | 1,510 | 1,560 |
| | International Business Machines Corp. | 4.250% | 5/15/49 | 420 | 529 |
| | International Paper Co. | 4.350% | 8/15/48 | 605 | 723 |
| 5 | ITC Holdings Corp. | 2.950% | 5/14/30 | 965 | 1,044 |
| | John Deere Capital Corp. | 3.450% | 3/13/25 | 985 | 1,107 |
| | Johnson Controls International plc | 4.950% | 7/2/64 | 692 | 848 |
| 9 | JPMorgan Chase & Co. | 3.875% | 9/23/20 | 1,300 | 1,555 |
| 1 | JPMorgan Chase & Co. | 3.782% | 2/1/28 | 1,890 | 2,153 |
| 1 | JPMorgan Chase & Co. | 3.964% | 11/15/48 | 975 | 1,189 |
| | Kaiser Foundation Hospitals | 4.875% | 4/1/42 | 45 | 61 |
| 5 | KeySpan Gas East Corp. | 2.742% | 8/15/26 | 400 | 436 |
| | Lowe’s Cos. Inc. | 4.550% | 4/5/49 | 525 | 664 |
| | Marathon Oil Corp. | 6.600% | 10/1/37 | 1,220 | 1,311 |
| | Marsh & McLennan Cos. Inc. | 4.375% | 3/15/29 | 1,010 | 1,224 |
Global Wellington Fund
| | | | | Face | Market |
| | | | Maturity | Amount | Value• |
| | | Coupon | Date | ($000) | ($000) |
| 5 | Massachusetts Mutual Life Insurance Co. | 3.375% | 4/15/50 | 550 | 567 |
| | McCormick & Co. Inc. | 2.500% | 4/15/30 | 180 | 193 |
| | McDonald’s Corp. | 4.450% | 9/1/48 | 475 | 590 |
| | McDonald’s Corp. | 3.625% | 9/1/49 | 50 | 56 |
| 9 | Medtronic Global Holdings SCA | 1.125% | 3/7/27 | 1,595 | 2,012 |
| 9 | Medtronic Global Holdings SCA | 1.625% | 3/7/31 | 785 | 1,047 |
| | Memorial Sloan-Kettering Cancer Center | 2.955% | 1/1/50 | 235 | 254 |
| | Memorial Sloan-Kettering Cancer Center | 4.125% | 7/1/52 | 150 | 194 |
| | Merck & Co. Inc. | 3.400% | 3/7/29 | 545 | 635 |
| | Mercy Health | 3.555% | 8/1/27 | 410 | 442 |
| | Mercy Health | 4.302% | 7/1/28 | 370 | 424 |
| 5 | Metropolitan Life Global Funding I | 3.000% | 9/19/27 | 775 | 856 |
| | Microsoft Corp. | 3.700% | 8/8/46 | 1,125 | 1,402 |
| 5 | Mid-Atlantic Interstate Transmission LLC | 4.100% | 5/15/28 | 1,145 | 1,295 |
| | MidAmerican Energy Co. | 4.250% | 5/1/46 | 10 | 13 |
| 6 | Molson Coors International LP | 2.840% | 7/15/23 | 1,875 | 1,480 |
| | Morgan Stanley | 2.750% | 5/19/22 | 1,375 | 1,429 |
| | Morgan Stanley | 3.125% | 7/27/26 | 1,850 | 2,064 |
| 1 | Morgan Stanley | 3.772% | 1/24/29 | 570 | 655 |
| | MPLX LP | 3.500% | 12/1/22 | 1,405 | 1,472 |
| | National Retail Properties Inc. | 3.900% | 6/15/24 | 805 | 875 |
| | NextEra Energy Capital Holdings Inc. | 3.250% | 4/1/26 | 100 | 113 |
| | NextEra Energy Capital Holdings Inc. | 3.500% | 4/1/29 | 155 | 177 |
| | NextEra Energy Capital Holdings Inc. | 2.750% | 11/1/29 | 130 | 142 |
| | NextEra Energy Capital Holdings Inc. | 2.250% | 6/1/30 | 1,520 | 1,592 |
| 5 | Niagara Mohawk Power Corp. | 1.960% | 6/27/30 | 985 | 1,016 |
| | Noble Energy Inc. | 3.850% | 1/15/28 | 625 | 706 |
| | Norfolk Southern Corp. | 2.550% | 11/1/29 | 1,165 | 1,273 |
| 5 | Northwestern Mutual Life Insurance Co. | 3.850% | 9/30/47 | 230 | 257 |
| 5 | Northwestern Mutual Life Insurance Co. | 3.625% | 9/30/59 | 36 | 39 |
| | NVIDIA Corp. | 3.500% | 4/1/40 | 445 | 511 |
| 1,5 | Oglethorpe Power Corp. | 6.191% | 1/1/31 | 210 | 262 |
| | Oglethorpe Power Corp. | 5.050% | 10/1/48 | 161 | 192 |
| 5 | Oglethorpe Power Corp. | 3.750% | 8/1/50 | 415 | 416 |
| | Oglethorpe Power Corp. | 5.250% | 9/1/50 | 350 | 411 |
| | Oracle Corp. | 3.400% | 7/8/24 | 575 | 631 |
| | Oracle Corp. | 3.600% | 4/1/50 | 660 | 736 |
| 5 | Otis Worldwide Corp. | 2.565% | 2/15/30 | 85 | 91 |
| 5 | Otis Worldwide Corp. | 3.112% | 2/15/40 | 195 | 209 |
| 5 | Otis Worldwide Corp. | 3.362% | 2/15/50 | 335 | 365 |
| | PacifiCorp | 2.700% | 9/15/30 | 205 | 227 |
| 5 | Penske Truck Leasing Co. LP / PTL Finance Corp. | 3.375% | 2/1/22 | 145 | 150 |
| 5 | Penske Truck Leasing Co. LP / PTL Finance Corp. | 4.250% | 1/17/23 | 1,405 | 1,513 |
| 5 | Penske Truck Leasing Co. LP / PTL Finance Corp. | 2.700% | 11/1/24 | 170 | 180 |
| 5 | Penske Truck Leasing Co. LP / PTL Finance Corp. | 3.950% | 3/10/25 | 1,120 | 1,243 |
| 5 | Penske Truck Leasing Co. LP / PTL Finance Corp. | 4.000% | 7/15/25 | 180 | 202 |
Global Wellington Fund
| | | | | Face | Market |
| | | | Maturity | Amount | Value• |
| | | Coupon | Date | ($000) | ($000) |
| | Pfizer Inc. | 1.700% | 5/28/30 | 275 | 284 |
| | Philip Morris International Inc. | 2.500% | 11/2/22 | 575 | 600 |
| 9 | Philip Morris International Inc. | 2.875% | 3/3/26 | 725 | 982 |
| | Phillips 66 Partners LP | 3.750% | 3/1/28 | 500 | 526 |
| | PNC Bank NA | 3.250% | 1/22/28 | 910 | 1,036 |
| 1 | Providence St. Joseph Health Obligated Group | 3.930% | 10/1/48 | 225 | 266 |
| | Raytheon Technologies Corp. | 3.950% | 8/16/25 | 285 | 325 |
| | Raytheon Technologies Corp. | 4.450% | 11/16/38 | 725 | 895 |
| | Republic Services Inc. | 2.300% | 3/1/30 | 1,290 | 1,365 |
| 5 | Royalty Pharma plc | 3.300% | 9/2/40 | 315 | 307 |
| 5 | Royalty Pharma plc | 3.550% | 9/2/50 | 400 | 387 |
| | Santander Holdings USA Inc. | 3.700% | 3/28/22 | 2,400 | 2,493 |
| 5 | SBA Tower Trust | 3.448% | 3/15/23 | 675 | 706 |
| 5 | SBA Tower Trust | 1.884% | 1/15/26 | 245 | 248 |
| | Sempra Energy | 3.250% | 6/15/27 | 1,050 | 1,154 |
| | Sierra Pacific Power Co. | 2.600% | 5/1/26 | 149 | 162 |
| | Simon Property Group LP | 2.450% | 9/13/29 | 375 | 374 |
| | Southern California Edison Co. | 3.700% | 8/1/25 | 30 | 33 |
| | Southern Co. | 4.400% | 7/1/46 | 5 | 6 |
| 1,5 | Sprint Spectrum Co. LLC / Sprint Spectrum Co. II LLC / Sprint Spectrum Co. III LLC | 4.738% | 3/20/25 | 805 | 875 |
| | SSM Health Care Corp. | 3.823% | 6/1/27 | 320 | 351 |
| | Starbucks Corp. | 4.500% | 11/15/48 | 730 | 888 |
| | Starbucks Corp. | 3.350% | 3/12/50 | 60 | 62 |
| | Sunoco Logistics Partners Operations LP | 5.350% | 5/15/45 | 400 | 381 |
| | Synchrony Bank | 3.000% | 6/15/22 | 450 | 463 |
| 5 | T-Mobile USA Inc. | 2.050% | 2/15/28 | 1,745 | 1,789 |
| 5 | Teachers Insurance & Annuity Assn. of America | 4.900% | 9/15/44 | 860 | 1,086 |
| | TJX Cos. Inc. | 3.875% | 4/15/30 | 515 | 609 |
| | Toledo Hospital | 5.325% | 11/15/28 | 555 | 608 |
| | Toledo Hospital | 5.750% | 11/15/38 | 210 | 249 |
| | Trinity Acquisition plc | 4.400% | 3/15/26 | 1,274 | 1,468 |
| | Truist Bank | 3.300% | 5/15/26 | 450 | 505 |
| | Truist Financial Corp. | 3.200% | 9/3/21 | 510 | 523 |
| | Truist Financial Corp. | 2.200% | 3/16/23 | 875 | 912 |
| | Truist Financial Corp. | 3.700% | 6/5/25 | 970 | 1,104 |
| | Union Pacific Corp. | 3.700% | 3/1/29 | 210 | 245 |
| | Union Pacific Corp. | 3.250% | 2/5/50 | 35 | 38 |
| | Union Pacific Corp. | 3.750% | 2/5/70 | 675 | 761 |
| 1 | United Airlines 2018-1 Class B Pass Through Trust | 4.600% | 3/1/26 | 61 | 48 |
| | UnitedHealth Group Inc. | 3.850% | 6/15/28 | 820 | 963 |
| | UnitedHealth Group Inc. | 2.000% | 5/15/30 | 240 | 251 |
| | UnitedHealth Group Inc. | 4.625% | 7/15/35 | 75 | 99 |
| | UnitedHealth Group Inc. | 4.200% | 1/15/47 | 65 | 81 |
| 5 | Upjohn Inc. | 3.850% | 6/22/40 | 565 | 613 |
| | VEREIT Operating Partnership LP | 3.400% | 1/15/28 | 535 | 555 |
| | Verizon Communications Inc. | 3.500% | 11/1/24 | 275 | 305 |
| 9 | Verizon Communications Inc. | 1.250% | 4/8/30 | 1,100 | 1,386 |
| 8 | Verizon Communications Inc. | 3.375% | 10/27/36 | 400 | 657 |
Global Wellington Fund
| | | | | Face | Market |
| | | | Maturity | Amount | Value• |
| | | Coupon | Date | ($000) | ($000) |
| | Verizon Communications Inc. | 4.522% | 9/15/48 | 915 | 1,199 |
| | Verizon Communications Inc. | 5.012% | 8/21/54 | 475 | 684 |
| | VF Corp. | 2.800% | 4/23/27 | 185 | 200 |
| | VF Corp. | 2.950% | 4/23/30 | 1,765 | 1,912 |
| 9 | Wells Fargo & Co. | 2.250% | 9/3/20 | 2,500 | 2,984 |
| 6 | Wells Fargo & Co. | 2.975% | 5/19/26 | 625 | 507 |
| | Wells Fargo & Co. | 4.100% | 6/3/26 | 920 | 1,037 |
| | Wells Fargo & Co. | 4.300% | 7/22/27 | 275 | 316 |
| 1 | Wells Fargo & Co. | 2.879% | 10/30/30 | 435 | 467 |
| | Wells Fargo & Co. | 4.750% | 12/7/46 | 800 | 1,012 |
| | Welltower Inc. | 4.000% | 6/1/25 | 275 | 309 |
| | Westar Energy Inc. | 3.250% | 9/1/49 | 235 | 259 |
| | Zimmer Biomet Holdings Inc. | 3.050% | 1/15/26 | 1,695 | 1,866 |
| | Zimmer Biomet Holdings Inc. | 3.550% | 3/20/30 | 475 | 529 |
| | | | | | 181,400 |
| Total Corporate Bonds (Cost $262,810) | | | | 284,443 |
| Sovereign Bonds (3.5%) | | | | |
| Australia (0.5%) | | | | |
| 10 | Commonwealth of Australia | 2.750% | 11/21/27 | 135 | 114 |
| 10 | Commonwealth of Australia | 2.250% | 5/21/28 | 1,195 | 976 |
| 10 | Commonwealth of Australia | 2.500% | 5/21/30 | 6,745 | 5,673 |
| | | | | | 6,763 |
| Bermuda (0.0%) | | | | |
| 1,5 | Bermuda | 2.375% | 8/20/30 | 200 | 203 |
| 1,5 | Bermuda | 3.375% | 8/20/50 | 200 | 205 |
| | | | | | 408 |
| Canada (0.4%) | | | | |
| 6 | City of Montreal | 3.150% | 12/1/36 | 750 | 657 |
| 6 | City of Montreal | 3.500% | 12/1/38 | 410 | 375 |
| 6 | City of Toronto | 3.200% | 8/1/48 | 1,000 | 899 |
| 6 | Province of Ontario | 2.900% | 6/2/28 | 1,910 | 1,652 |
| 11 | Province of Ontario | 0.250% | 6/28/29 | 985 | 1,112 |
| | | | | | 4,695 |
| Chile (0.1%) | | | | |
| | Corp. Nacional del Cobre de Chile | 3.625% | 8/1/27 | 650 | 709 |
| | | | | | |
| China (0.3%) | | | | |
| 5 | Sinopec Group Overseas Development 2017 Ltd. | 3.000% | 4/12/22 | 1,025 | 1,057 |
| 5 | State Grid Overseas Investment 2016 Ltd. | 2.750% | 5/4/22 | 2,135 | 2,196 |
| | | | | | 3,253 |
| Colombia (0.1%) | | | | |
| 1 | Republic of Columbia | 4.000% | 2/26/24 | 1,350 | 1,439 |
| | | �� | | | |
| France (0.1%) | | | | |
| 9 | RTE Reseau de Transport d’Electricite SADIR | 1.875% | 10/23/37 | 600 | 848 |
| | | | | | |
| Hungary (0.1%) | | | | |
| 9 | Republic of Hungary | 1.625% | 4/28/32 | 1,125 | 1,421 |
| Global Wellington Fund | | | | | | | |
| | | | | | | | |
| | | | | Face | | | Market | |
| | | | Maturity | Amount | | | Value• | |
| | | Coupon | Date | ($000 | ) | | ($000 | ) |
| Japan (0.6%) | | | | | | | |
| 12 | Japan | 0.100% | 12/20/28 | 619,050 | | | 5,895 | |
| 12 | Japan | 0.100% | 3/20/29 | 158,800 | | | 1,511 | |
| 12 | Japan | 0.100% | 6/20/29 | 40,250 | | | 383 | |
| | | | | | | | 7,789 | |
| Norway (0.1%) | | | | | | | |
| | Equinor ASA | 3.000% | 4/6/27 | 1,545 | | | 1,713 | |
| | | | | | | | | |
| Panama (0.0%) | | | | | | | |
| 1,5 | Empresa de Transmision Electrica SA | 5.125% | 5/2/49 | 470 | | | 553 | |
| | | | | | | | | |
| Qatar (0.2%) | | | | | | | |
| 5 | State of Qatar | 2.375% | 6/2/21 | 1,400 | | | 1,416 | |
| 5 | State of Qatar | 3.875% | 4/23/23 | 550 | | | 592 | |
| 5 | State of Qatar | 5.103% | 4/23/48 | 255 | | | 362 | |
| 5 | State of Qatar | 4.400% | 4/16/50 | 265 | | | 344 | |
| | | | | | | | 2,714 | |
| Romania (0.1%) | | | | | | | |
| 9 | Republic of Romania | 2.500% | 2/8/30 | 1,225 | | | 1,477 | |
| | | | | | | | | |
| Saudi Arabia (0.3%) | | | | | | | |
| 5 | Kingdom of Saudi Arabia | 2.875% | 3/4/23 | 2,020 | | | 2,103 | |
| 5 | Saudi Arabian Oil Co. | 2.875% | 4/16/24 | 500 | | | 526 | |
| 5 | Saudi Arabian Oil Co. | 3.500% | 4/16/29 | 680 | | | 745 | |
| | | | | | | | 3,374 | |
| Singapore (0.0%) | | | | | | | |
| 5 | Temasek Financial I Ltd. | 3.625% | 8/1/28 | 510 | | | 603 | |
| | | | | | | | | |
| Spain (0.1%) | | | | | | | |
| 5,9 | Kingdom of Spain | 0.600% | 10/31/29 | 1,050 | | | 1,288 | |
| | | | | | | | | |
| Switzerland (0.0%) | | | | | | | |
| 5 | Syngenta Finance NV | 5.182% | 4/24/28 | 550 | | | 604 | |
| | | | | | | | | |
| United Arab Emirates (0.1%) | | | | | | | |
| | Emirate of Abu Dhabi | 3.125% | 10/11/27 | 1,235 | | | 1,373 | |
| | | | | | | | | |
| United Kingdom (0.4%) | | | | | | | |
| 8 | United Kingdom | 0.625% | 6/7/25 | 700 | | | 964 | |
| 8 | United Kingdom | 1.250% | 7/22/27 | 155 | | | 224 | |
| 8 | United Kingdom | 0.875% | 10/22/29 | 1,100 | | | 1,551 | |
| 8 | United Kingdom | 3.500% | 1/22/45 | 1,110 | | | 2,335 | |
| | | | | | | | 5,074 | |
| Total Sovereign Bonds (Cost $42,984) | | | | | | 46,098 | |
| Taxable Municipal Bonds (0.9%) | | | | | | | |
| | Bay Area Toll Authority California Toll Bridge Revenue (San Francisco Bay Area) | 2.574% | 4/1/31 | 230 | | | 251 | |
| | Broward County FL Airport System Revenue | 3.477% | 10/1/43 | 100 | | | 103 | |
| | California GO | 7.350% | 11/1/39 | 35 | | | 58 | |
| Global Wellington Fund | | | | | | | |
| | | | | | | | |
| | | | | Face | | | Market | |
| | | | Maturity | Amount | | | Value• | |
| | | Coupon | Date | ($000 | ) | | ($000 | ) |
| | California State University Revenue | 2.897% | 11/1/51 | 365 | | | 364 | |
| | Chicago IL Transit Authority Sales & Transfer Tax Receipts Revenue | 6.300% | 12/1/21 | 40 | | | 41 | |
| | Chicago IL Transit Authority Sales & Transfer Tax Receipts Revenue | 6.899% | 12/1/40 | 55 | | | 79 | |
| | Chicago IL Transit Authority Sales & Transfer Tax Receipts Revenue | 6.899% | 12/1/40 | 805 | | | 1,152 | |
| | Dallas/Fort Worth TX International Airport Revenue | 3.089% | 11/1/40 | 90 | | | 91 | |
| | Dallas/Fort Worth TX International Airport Revenue | 2.919% | 11/1/50 | 100 | | | 100 | |
| | Foothill-Eastern Transportation Corridor Agency California Toll Road Revenue | 4.094% | 1/15/49 | 55 | | | 58 | |
| 13 | Foothill-Eastern Transportation Corridor Agency California Toll Road Revenue | 3.924% | 1/15/53 | 405 | | | 432 | |
| | Georgia Municipal Electric Power Authority Revenue | 6.637% | 4/1/57 | 855 | | | 1,262 | |
| | Georgia Municipal Electric Power Authority Revenue | 6.655% | 4/1/57 | 93 | | | 137 | |
| | Grand Parkway Transportation Corp. Texas Revenue | 3.236% | 10/1/52 | 290 | | | 305 | |
| | Illinois GO | 5.100% | 6/1/33 | 660 | | | 676 | |
| 13 | Kansas Development Finance Authority Revenue | 5.371% | 5/1/26 | 610 | | | 698 | |
| | Massachusetts School Building Authority Dedicated Sales Tax Revenue | 3.395% | 10/15/40 | 175 | | | 188 | |
| | Metropolitan Transportation Authority New York Revenue | 6.200% | 11/15/26 | 20 | | | 22 | |
| | Metropolitan Transportation Authority New York Revenue | 6.668% | 11/15/39 | 170 | | | 221 | |
| | Metropolitan Transportation Authority New York Revenue | 5.175% | 11/15/49 | 445 | | | 516 | |
| | New York State Dormitory Authority Revenue (Personal Income Tax) | 3.110% | 2/15/39 | 285 | | | 316 | |
| | North Texas Tollway Authority System Revenue | 6.718% | 1/1/49 | 125 | | | 225 | |
| 14 | Philadelphia PA Authority for Industrial Development Revenue | 6.550% | 10/15/28 | 635 | | | 822 | |
| | Port Authority of New York & New Jersey Revenue | 4.458% | 10/1/62 | 305 | | | 398 | |
| | Sales Tax Securitization Corp. Illinois Revenue | 4.787% | 1/1/48 | 650 | | | 806 | |
| | South Carolina Public Service Authority Revenue | 2.388% | 12/1/23 | 690 | | | 715 | |
| | State of Connecticut GO | 2.000% | 7/1/23 | 190 | | | 197 | |
| | State of Connecticut GO | 5.770% | 3/15/25 | 275 | | | 329 | |
| | University of California Revenue | 1.316% | 5/15/27 | 155 | | | 158 | |
| | University of California Revenue | 1.614% | 5/15/30 | 260 | | | 265 | |
| | University of Virginia Revenue | 2.256% | 9/1/50 | 200 | | | 195 | |
| Total Taxable Municipal Bonds (Cost $10,255) | | | | | | 11,180 | |
| Global Wellington Fund | | | | |
| | | | | |
| | | | | Market | |
| | | | | Value• | |
| | | Coupon | Shares | ($000 | ) |
| Temporary Cash Investment (3.6%) | | | | |
| Money Market Fund (3.6%) | | | | |
| 15 | Vanguard Market Liquidity Fund | | | | |
| | (Cost $47,347) | 0.147% | 473,675 | 47,367 | |
| Total Investments (100.6%) (Cost $1,200,805) | | | 1,318,513 | |
| Other Assets and Liabilities—Net (-0.6%) | | | (7,916 | ) |
| Net Assets (100%) | | | 1,310,597 | |
Cost is in $000.
• See Note A in Notes to Financial Statements.
* Non-income-producing security.
| ¤ | Includes securities purchased on a when-issued or delayed-delivery basis for which the fund has not taken delivery as of August 31, 2020. |
| 1 | The average or expected maturity is shorter than the final maturity shown because of the possibility of interim principal payments and prepayments or the possibility of the issue being called. |
| 2 | The issuer was placed under federal conservatorship in September 2008; since that time, its daily operations have been managed by the Federal Housing Finance Agency and it receives capital from the U.S. Treasury, as needed to maintain a positive net worth, in exchange for senior preferred stock. |
| 3 | Securities with a value of $663,000 have been segregated as initial margin for open futures contracts. |
| 4 | Securities with a value of $2,411,000 have been segregated as collateral for certain open To Be Announced (TBA) transactions. |
| 5 | Security exempt from registration under Rule 144A of the Securities Act of 1933. Such securities may be sold in transactions exempt from registration, normally to qualified institutional buyers. At August 31, 2020, the aggregate value of these securities was $73,375,000, representing 5.6% of net assets. |
| 6 | Face amount denominated in Canadian dollars. |
| 7 | Adjustable-rate security; rate shown is effective rate at period end. Certain adjustable-rate securities are not based on a published reference rate and spread but are determined by the issuer or agent based on current market conditions. |
| 8 | Face amount denominated in British pounds. |
| 9 | Face amount denominated in euro. |
| 10 | Face amount denominated in Australian dollars. |
| 11 | Face amount denominated in Swiss francs. |
| 12 | Face amount denominated in Japanese yen. |
| 13 | Scheduled principal and interest payments are guaranteed by AGM (Assured Guaranty Municipal Corporation). |
| 14 | Scheduled principal and interest payments are guaranteed by National Public Finance Guarantee Corp. |
| 15 | Affiliated money market fund available only to Vanguard funds and certain trusts and accounts managed by Vanguard. Rate shown is the 7-day yield. |
ADR—American Depositary Receipt.
GO—General Obligation Bond.
LIBOR—London Interbank Offered Rate.
REMICS—Real Estate Mortgage Investment Conduits.
UMBS—Uniform Mortgage-Backed Securities.
Global Wellington Fund
Derivative Financial Instruments Outstanding as of Period End
Futures Contracts
| | | | | | | | | | | | ($000 | ) |
| | | | | | | | | | | | Value and | |
| | | | | | | Number of | | | | Unrealized | |
| | | | | | | Long (Short | ) | Notional | | Appreciation | |
| | | | | Expiration | | Contracts | | Amount | | (Depreciation | ) |
| Long Futures Contracts | | | | | | | | | | | | |
| Euro-Schatz | | | September 2020 | | | 94 | | 12,565 | | (4 | ) |
| Euro-Bobl | | | September 2020 | | | 58 | | 9,318 | | 19 | |
| Euro-Buxl | | | September 2020 | | | 21 | | 5,436 | | 81 | |
| Long Gilt | | | December 2020 | | | 21 | | 3,790 | | (18 | ) |
| Euro OAT | | | September 2020 | | | 14 | | 2,798 | | 39 | |
| Euro-BTP | | | September 2020 | | | 12 | | 2,094 | | 63 | |
| | | | | | | | | | | | 180 | |
| | | | | | | | | | | | | |
| Short Futures Contracts | | | | | | | | | | | | |
| 10-Year U.S. Treasury Note | | | December 2020 | | | (145 | ) | (20,191 | ) | (41 | ) |
| Euro-Bund | | | September 2020 | | | (60 | ) | (12,570 | ) | 28 | |
| 30-Year U.S. Treasury Bond | | | December 2020 | | | (4 | ) | (703 | ) | 1 | |
| | | | | | | | | | | | (12 | ) |
| | | | | | | | | | | | 168 | |
| | | | | | | | | | | | | |
| Forward Currency Contracts | | | | | | | | | | | | |
| | Contract | | | | | | | | Unrealized | | Unrealized | |
| Settlement | | Contract Amount (000 | ) | Appreciation | | (Depreciation | ) |
| Counterparty | Date | | Receive | | Deliver | | ($000 | ) | ($000 | ) |
| J.P. Morgan Securities LLC | 9/30/20 | | USD | 91,765 | | EUR | 77,601 | | — | | (903 | ) |
| J.P. Morgan Securities LLC | 9/30/20 | | USD | 17,362 | | GBP | 13,241 | | — | | (342 | ) |
| J.P. Morgan Securities LLC | 9/30/20 | | USD | 10,685 | | CAD | 14,041 | | — | | (81 | ) |
| J.P. Morgan Securities LLC | 9/30/20 | | USD | 9,035 | | JPY | 959,273 | | — | | (25 | ) |
| Goldman Sachs International | 9/30/20 | | USD | 8,020 | | AUD | 11,082 | | — | | (155 | ) |
| J.P. Morgan Securities LLC | 9/30/20 | | USD | 1,575 | | CHF | 1,434 | | — | | (12 | ) |
| | | | | | | | | | — | | (1,518 | ) |
AUD—Australian dollar.
CAD—Canadian dollar.
CHF—Swiss franc.
EUR—euro.
GBP—British pound.
JPY—Japanese yen.
USD—U.S. dollar.
See accompanying Notes, which are an integral part of the Financial Statements.
Global Wellington Fund
Statement of Assets and Liabilities
As of August 31, 2020
| ($000s, except shares and per-share amounts) | Amount |
| Assets | |
| Investments in Securities, at Value | |
| Unaffiliated Issuers (Cost $1,153,458) | 1,271,146 |
| Affiliated Issuers (Cost $47,347) | 47,367 |
| Total Investments in Securities | 1,318,513 |
| Investment in Vanguard | 53 |
| Cash | 11 |
| Foreign Currency, at Value (Cost $8,433) | 8,733 |
| Receivables for Investment Securities Sold | 1,802 |
| Receivables for Accrued Income | 5,642 |
| Receivables for Capital Shares Issued | 2,372 |
| Variation Margin Receivable—Futures Contracts | 45 |
| Total Assets | 1,337,171 |
| Liabilities | |
| Payables for Investment Securities Purchased | 23,014 |
| Payables for Capital Shares Redeemed | 1,478 |
| Payables to Investment Advisor | 366 |
| Payables to Vanguard | 136 |
| Variation Margin Payable—Futures Contracts | 62 |
| Unrealized Depreciation—Forward Currency Contracts | 1,518 |
| Total Liabilities | 26,574 |
| Net Assets | 1,310,597 |
| | |
| | |
| At August 31, 2020, net assets consisted of: | |
| | |
| Paid-in Capital | 1,204,171 |
| Total Distributable Earnings (Loss) | 106,426 |
| Net Assets | 1,310,597 |
| | |
| Investor Shares—Net Assets | |
| Applicable to 8,131,716 outstanding $.001 par value shares of beneficial interest (unlimited authorization) | 181,289 |
| Net Asset Value Per Share—Investor Shares | $22.29 |
| | |
| Admiral Shares—Net Assets | |
| Applicable to 40,516,737 outstanding $.001 par value shares of beneficial interest (unlimited authorization) | 1,129,308 |
| Net Asset Value Per Share—Admiral Shares | $27.87 |
See accompanying Notes, which are an integral part of the Financial Statements.
Global Wellington Fund
Statement of Operations
| | Year Ended | |
| | August 31, 2020 | |
| | ($000 | ) |
| Investment Income | | |
| Income | | |
| Dividends1 | 18,896 | |
| Interest2 | 9,473 | |
| Securities Lending—Net | 30 | |
| Total Income | 28,399 | |
| Expenses | | |
| Investment Advisory Fees—Note B | | |
| Basic Fee | 1,740 | |
| Performance Adjustment | (127 | ) |
| The Vanguard Group—Note C | | |
| Management and Administrative—Investor Shares | 489 | |
| Management and Administrative—Admiral Shares | 1,807 | |
| Marketing and Distribution—Investor Shares | 27 | |
| Marketing and Distribution—Admiral Shares | 69 | |
| Custodian Fees | 42 | |
| Auditing Fees | 38 | |
| Shareholders’ Reports—Investor Shares | 18 | |
| Shareholders’ Reports—Admiral Shares | 12 | |
| Trustees’ Fees and Expenses | 2 | |
| Total Expenses | 4,117 | |
| Net Investment Income | 24,282 | |
| Realized Net Gain (Loss) | | |
| Investment Securities Sold2 | (2,340 | ) |
| Futures Contracts | (345 | ) |
| Forward Currency Contracts | (4,732 | ) |
| Foreign Currencies | (42 | ) |
| Realized Net Gain (Loss) | (7,459 | ) |
| Change in Unrealized Appreciation (Depreciation) | | |
| Investment Securities2 | 60,063 | |
| Futures Contracts | (400 | ) |
| Forward Currency Contracts | (2,124 | ) |
| Foreign Currencies | 460 | |
| Change in Unrealized Appreciation (Depreciation) | 57,999 | |
| Net Increase (Decrease) in Net Assets Resulting from Operations | 74,822 | |
| 1 | Dividends are net of foreign withholding taxes of $1,148,000. |
| 2 | Interest income, realized net gain (loss), and change in unrealized appreciation (depreciation) from an affiliated company of the fund were $388,000, $36,000, and $21,000, respectively. Purchases and sales are for temporary cash investment purposes. |
See accompanying Notes, which are an integral part of the Financial Statements.
Global Wellington Fund
Statement of Changes in Net Assets
| | Year Ended August 31, | |
| | 2020 | | 2019 | |
| | ($000 | ) | ($000 | ) |
| Increase (Decrease) in Net Assets | | | | |
| Operations | | | | |
| Net Investment Income | 24,282 | | 20,611 | |
| Realized Net Gain (Loss) | (7,459 | ) | (5,890 | ) |
| Change in Unrealized Appreciation (Depreciation) | 57,999 | | 49,342 | |
| Net Increase (Decrease) in Net Assets Resulting from Operations | 74,822 | | 64,063 | |
| Distributions1 | | | | |
| Investor Shares | (3,574 | ) | (3,787 | ) |
| Admiral Shares | (19,722 | ) | (17,340 | ) |
| Total Distributions | (23,296 | ) | (21,127 | ) |
| Capital Share Transactions | | | | |
| Investor Shares | (728 | ) | (2,831 | ) |
| Admiral Shares | 257,012 | | 75,712 | |
| Net Increase (Decrease) from Capital Share Transactions | 256,284 | | 72,881 | |
| Total Increase (Decrease) | 307,810 | | 115,817 | |
| Net Assets | | | | |
| Beginning of Period | 1,002,787 | | 886,970 | |
| End of Period | 1,310,597 | | 1,002,787 | |
1 Certain prior period numbers have been reclassified to conform with current period presentation.
See accompanying Notes, which are an integral part of the Financial Statements.
Global Wellington Fund
Financial Highlights
Investor Shares
| | | | | | Oct. 18, | |
| | Year Ended | | 20171 to | |
| | August 31, | | Aug. 31, | |
| For a Share Outstanding Throughout Each Period | 2020 | | 2019 | | 2018 | |
| Net Asset Value, Beginning of Period | $21.41 | | $20.51 | | $20.00 | |
| Investment Operations | | | | | | |
| Net Investment Income2 | .430 | | .443 | | .392 | |
| Net Realized and Unrealized Gain (Loss) on Investments | .874 | | .920 | | .379 | |
| Total from Investment Operations | 1.304 | | 1.363 | | .771 | |
| Distributions | | | | | | |
| Dividends from Net Investment Income | (.389 | ) | (.426 | ) | (.261 | ) |
| Distributions from Realized Capital Gains | (.035 | ) | (.037 | ) | — | |
| Total Distributions | (.424 | ) | (.463 | ) | (.261 | ) |
| Net Asset Value, End of Period | $22.29 | | $21.41 | | $20.51 | |
| | | | | | | |
| Total Return3 | 6.22% | | 6.80% | | 3.88% | |
| | | | | | | |
| Ratios/Supplemental Data | | | | | | |
| Net Assets, End of Period (Millions) | $181 | | $176 | | $172 | |
| Ratio of Total Expenses to Average Net Assets | 0.44%4 | | 0.46%4 | | 0.46%5,6 | |
| Ratio of Net Investment Income to Average Net Assets | 2.01% | | 2.19% | | 2.32%6 | |
| Portfolio Turnover Rate | 58%7 | | 54% | | 44% | |
| 1 | Subscription period for the fund was October 18, 2017, to November 1, 2017, during which time all assets were held in cash. Performance measurement began November 2, 2017, the first business day after the subscription period, at a net asset value of $20.00. |
| 2 | Calculated based on average shares outstanding. |
| 3 | Total returns do not include account service fees that may have applied in the periods shown. Fund prospectuses provide information about any applicable account service fees. |
| 4 | Includes performance-based investment advisory fee increases (decreases) of (0.01%) for 2020 and 0.01% for 2019. |
| 5 | The ratio of expenses to average net assets for the period net of reduction from custody fee offset arrangements was 0.45%. |
| 6 | Annualized. |
| 7 | Includes 10% attributable to mortgage-dollar-roll activity. |
See accompanying Notes, which are an integral part of the Financial Statements.
Global Wellington Fund
Financial Highlights
Admiral Shares
| | | | | | Oct. 18, | |
| | Year Ended | | 20171 to | |
| | August 31, | | Aug. 31, | |
| For a Share Outstanding Throughout Each Period | 2020 | | 2019 | | 2018 | |
| Net Asset Value, Beginning of Period | $26.76 | | $25.65 | | $25.00 | |
| Investment Operations | | | | | | |
| Net Investment Income2 | .564 | | .583 | | .511 | |
| Net Realized and Unrealized Gain (Loss) on Investments | 1.104 | | 1.132 | | .480 | |
| Total from Investment Operations | 1.668 | | 1.715 | | .991 | |
| Distributions | | | | | | |
| Dividends from Net Investment Income | (.514 | ) | (.559 | ) | (.341 | ) |
| Distributions from Realized Capital Gains | (.044 | ) | (.046 | ) | — | |
| Total Distributions | (.558 | ) | (.605 | ) | (.341 | ) |
| Net Asset Value, End of Period | $27.87 | | $26.76 | | $25.65 | |
| | | | | | | |
| Total Return3 | 6.38% | | 6.85% | | 3.99% | |
| | | | | | | |
| Ratios/Supplemental Data | | | | | | |
| Net Assets, End of Period (Millions) | $1,129 | | $826 | | $715 | |
| Ratio of Total Expenses to Average Net Assets | 0.34%4 | | 0.36%4 | | 0.36%5,6 | |
| Ratio of Net Investment Income to Average Net Assets | 2.11% | | 2.29% | | 2.42%6 | |
| Portfolio Turnover Rate | 58%7 | | 54% | | 44% | |
| 1 | Subscription period for the fund was October 18, 2017, to November 1, 2017, during which time all assets were held in cash. Performance measurement began November 2, 2017, the first business day after the subscription period, at a net asset value of $25.00. |
| 2 | Calculated based on average shares outstanding. |
| 3 | Total returns do not include account service fees that may have applied in the periods shown. Fund prospectuses provide information about any applicable account service fees. |
| 4 | Includes performance-based investment advisory fee increases (decreases) of (0.01%) for 2020 and 0.01% for 2019. |
| 5 | The ratio of expenses to average net assets for the period net of reduction from custody fee offset arrangements was 0.35%. |
| 6 | Annualized. |
| 7 | Includes 10% attributable to mortgage-dollar-roll activity. |
See accompanying Notes, which are an integral part of the Financial Statements.
Global Wellington Fund
Notes to Financial Statements
Vanguard Global Wellington Fund is registered under the Investment Company Act of 1940 as an open-end investment company, or mutual fund. The fund offers two classes of shares: Investor Shares and Admiral Shares. Each of the share classes has different eligibility and minimum purchase requirements, and is designed for different types of investors.
Certain of the fund’s investments are in corporate debt instruments; the issuers’ abilities to meet their obligations may be affected by economic developments in their respective industries. The fund invests in securities of foreign issuers, which may subject it to investment risks not normally associated with investing in securities of U.S. corporations. To minimize the currency risk associated with investment in securities denominated in currencies other than the U.S. dollar, the fund attempts to hedge its currency exposures. Market disruptions associated with the COVID-19 pandemic have had a global impact, and uncertainty exists as to the long-term implications. Such disruptions can adversely affect assets of the fund and thus fund performance.
A. The following significant accounting policies conform to generally accepted accounting principles for U.S. investment companies. The fund consistently follows such policies in preparing its financial statements.
1. Security Valuation: Securities are valued as of the close of trading on the New York Stock Exchange (generally 4 p.m., Eastern time) on the valuation date. Equity securities are valued at the latest quoted sales prices or official closing prices taken from the primary market in which each security trades; such securities not traded on the valuation date are valued at the mean of the latest quoted bid and asked prices. Bonds and temporary cash investments are valued using the latest bid prices or using valuations based on a matrix system (which considers such factors as security prices, yields, maturities, and ratings), both as furnished by independent pricing services. Structured debt securities, including mortgages and asset-backed securities, are valued using the latest bid prices or using valuations based on a matrix system that considers such factors as issuer, tranche, nominal or option-adjusted spreads, weighted average coupon, weighted average maturity, credit enhancements, and collateral. Investments in Vanguard Market Liquidity Fund are valued at that fund’s net asset value. Securities for which market quotations are not readily available, or whose values have been affected by events occurring before the fund’s pricing time but after the close of the securities’ primary markets, are valued at their fair values calculated according to procedures adopted by the board of trustees. These procedures include obtaining quotations from an independent pricing service, monitoring news to identify significant market- or security-specific events, and evaluating changes in the values of foreign market proxies (for example, ADRs, futures contracts, or exchange-traded funds), between the time the foreign markets close and the fund’s pricing time. When fair-value pricing is employed, the prices of securities used by a fund to calculate its net asset value may differ from quoted or published prices for the same securities.
2. Foreign Currency: Securities and other assets and liabilities denominated in foreign currencies are translated into U.S. dollars using exchange rates obtained from an independent third party as of the fund’s pricing time on the valuation date. Realized gains (losses) and unrealized appreciation (depreciation) on investment securities include the effects of changes in exchange rates since the securities were purchased, combined with the effects of changes in security prices. Fluctuations in the value of other assets and liabilities resulting from changes in exchange rates are recorded as unrealized foreign currency gains (losses) until the assets or liabilities are settled in cash, at which time they are recorded as realized foreign currency gains (losses).
Global Wellington Fund
3. Futures Contracts: The fund uses futures contracts to invest in fixed income asset classes with greater efficiency and lower cost than is possible through direct investment, to add value when these instruments are attractively priced, or to adjust sensitivity to changes in interest rates. The primary risks associated with the use of futures contracts are imperfect correlation between changes in market values of bonds held by the fund and the prices of futures contracts, and the possibility of an illiquid market. Counterparty risk involving futures is mitigated because a regulated clearinghouse is the counterparty instead of the clearing broker. To further mitigate counterparty risk, the fund trades futures contracts on an exchange, monitors the financial strength of its clearing brokers and clearinghouse, and has entered into clearing agreements with its clearing brokers. The clearinghouse imposes initial margin requirements to secure the fund’s performance and requires daily settlement of variation margin representing changes in the market value of each contract. Any securities pledged as initial margin for open contracts are noted in the Schedule of Investments.
Futures contracts are valued at their quoted daily settlement prices. The notional amounts of the contracts are not recorded in the Statement of Assets and Liabilities. Fluctuations in the value of the contracts are recorded in the Statement of Assets and Liabilities as an asset (liability) and in the Statement of Operations as unrealized appreciation (depreciation) until the contracts are closed, when they are recorded as realized gains (losses) on futures contracts.
During the year ended August 31, 2020, the fund’s average investments in long and short futures contracts each represented 2% of net assets, based on the average of the notional amounts at each quarter-end during the period.
4. Forward Currency Contracts: The fund enters into forward currency contracts to protect the value of securities and related receivables and payables against changes in future foreign exchange rates. The fund’s risks in using these contracts include movement in the values of the foreign currencies relative to the U.S. dollar and the ability of the counterparties to fulfill their obligations under the contracts. The fund mitigates its counterparty risk by entering into forward currency contracts only with a diverse group of prequalified counterparties, monitoring their financial strength, entering into master netting arrangements with its counterparties, and requiring its counterparties to transfer collateral as security for their performance. In the absence of a default, the collateral pledged or received by the fund cannot be repledged, resold, or rehypothecated. The master netting arrangements provide that, in the event of a counterparty’s default (including bankruptcy), the fund may terminate the forward currency contracts, determine the net amount owed by either party in accordance with its master netting arrangements, and sell or retain any collateral held up to the net amount owed to the fund under the master netting arrangements. The forward currency contracts contain provisions whereby a counterparty may terminate open contracts if the fund’s net assets decline below a certain level, triggering a payment by the fund if the fund is in a net liability position at the time of the termination. The payment amount would be reduced by any collateral the fund has pledged. Any securities pledged as collateral for open contracts are noted in the Schedule of Investments. The value of collateral received or pledged is compared daily to the value of the forward currency contracts exposure with each counterparty, and any difference, if in excess of a specified minimum transfer amount, is adjusted and settled within two business days.
Global Wellington Fund
Forward currency contracts are valued at their quoted daily prices obtained from an independent third party, adjusted for currency risk based on the expiration date of each contract. The notional amounts of the contracts are not recorded in the Statement of Assets and Liabilities. Fluctuations in the value of the contracts are recorded in the Statement of Assets and Liabilities as an asset (liability) and in the Statement of Operations as unrealized appreciation (depreciation) until the contracts are closed, when they are recorded as realized gains (losses) on forward currency contracts.
During the year ended August 31, 2020, the fund’s average investment in forward currency contracts represented 11% of net assets, based on the average of notional amounts at each quarter-end during the period.
5. To Be Announced (TBA) Transactions: A TBA transaction is an agreement to buy or sell mortgage-backed securities with agreed-upon characteristics (face amount, coupon, maturity) for settlement at a future date. The fund may be a seller of TBA transactions to reduce its exposure to the mortgage-backed securities market or in order to sell mortgage-backed securities it owns under delayed-delivery arrangements. When the fund is a buyer of TBA transactions, it maintains cash or short-term investments in an amount sufficient to meet the purchase price at the settlement date of the TBA transaction. The primary risk associated with TBA transactions is that a counterparty may default on its obligations. The fund mitigates its counterparty risk by, among other things, performing a credit analysis of counterparties, allocating transactions among numerous counterparties, and monitoring its exposure to each counterparty. The fund may also enter into a Master Securities Forward Transaction Agreement (MSFTA) with certain counterparties and require them to transfer collateral as security for their performance. In the absence of a default, the collateral pledged or received by the fund cannot be repledged, resold, or rehypothecated. Under an MSFTA, upon a counterparty default (including bankruptcy), the fund may terminate any TBA transactions with that counterparty, determine the net amount owed by either party in accordance with its master netting arrangements, and sell or retain any collateral held up to the net amount owed to the fund under the master netting arrangements.
6. Mortgage Dollar Rolls: The fund enters into mortgage-dollar-roll transactions, in which the fund sells mortgage-backed securities to a dealer and simultaneously agrees to purchase similar securities in the future at a predetermined price. The proceeds of the securities sold in mortgage-dollar-roll transactions are typically invested in high-quality short-term fixed income securities. The fund forgoes principal and interest paid on the securities sold, and is compensated by interest earned on the proceeds of the sale and by a lower price on the securities to be repurchased. The fund has also entered into mortgage-dollar-roll transactions in which the fund buys mortgage-backed securities from a dealer pursuant to a TBA transaction and simultaneously agrees to sell similar securities in the future at a predetermined price. The securities bought in mortgage-dollar-roll transactions are used to cover an open TBA sell position. The fund continues to earn interest on mortgage-backed security pools already held and receives a lower price on the securities to be sold in the future. The fund accounts for mortgage-dollar-roll transactions as purchases and sales; as such, these transactions may increase the fund’s portfolio turnover rate. Amounts to be received or paid in connection with open mortgage dollar rolls are included in Receivables for Investment Securities Sold or Payables for Investment Securities Purchased in the Statement of Assets and Liabilities.
Global Wellington Fund
7. Federal Income Taxes: The fund intends to continue to qualify as a regulated investment company and distribute all of its taxable income. The fund’s tax returns are open to examination by the relevant tax authorities until expiration of the applicable statute of limitations, which is generally three years after the filing of the tax return. Management has analyzed the fund’s tax positions taken for all open federal and state income tax years, and has concluded that no provision for income tax is required in the fund’s financial statements.
8. Distributions: Distributions to shareholders are recorded on the ex-dividend date. Distributions are determined on a tax basis at the fiscal year-end and may differ from net investment income and realized capital gains for financial reporting purposes.
9. Securities Lending: To earn additional income, the fund lends its securities to qualified institutional borrowers. Security loans are subject to termination by the fund at any time, and are required to be secured at all times by collateral in an amount at least equal to the market value of securities loaned. Daily market fluctuations could cause the value of loaned securities to be more or less than the value of the collateral received. When this occurs, the collateral is adjusted and settled before the opening of the market on the next business day. The fund further mitigates its counterparty risk by entering into securities lending transactions only with a diverse group of prequalified counterparties, monitoring their financial strength, and entering into master securities lending agreements with its counterparties. The master securities lending agreements provide that, in the event of a counterparty’s default (including bankruptcy), the fund may terminate any loans with that borrower, determine the net amount owed, and sell or retain the collateral up to the net amount owed to the fund; however, such actions may be subject to legal proceedings. While collateral mitigates counterparty risk, in the event of a default, the fund may experience delays and costs in recovering the securities loaned. The fund invests cash collateral received in Vanguard Market Liquidity Fund, and records a liability in the Statement of Assets and Liabilities for the return of the collateral, during the period the securities are on loan. Collateral investments in Vanguard Market Liquidity Fund are subject to market appreciation or depreciation. Securities lending income represents fees charged to borrowers plus income earned on invested cash collateral, less expenses associated with the loan. During the term of the loan, the fund is entitled to all distributions made on or in respect of the loaned securities.
10. Credit Facilities and Interfund Lending Program: The fund and certain other funds managed by The Vanguard Group (“Vanguard”) participate in a $4.3 billion committed credit facility provided by a syndicate of lenders pursuant to a credit agreement and an uncommitted credit facility provided by Vanguard. Both facilities may be renewed annually. Each fund is individually liable for its borrowings, if any, under the credit facilities. Borrowings may be utilized for temporary or emergency purposes, subject to the fund’s regulatory and contractual borrowing restrictions. With respect to the committed credit facility, the participating funds are charged administrative fees and an annual commitment fee of 0.10% of the undrawn committed amount of the facility; these fees are allocated to the funds based on a method approved by the fund’s board of trustees and included in Management and Administrative expenses on the fund’s Statement of Operations. Any borrowings under either facility bear interest at a rate based upon the higher of the one-month London Interbank Offered Rate (or
Global Wellington Fund
an acceptable alternate rate, if necessary), federal funds effective rate, or overnight bank funding rate plus an agreed-upon spread, except that borrowings under the uncommitted credit facility may bear interest based upon an alternative rate agreed to by the fund and Vanguard.
In accordance with an exemptive order (the “Order”) from the SEC, the fund may participate in a joint lending and borrowing program that allows registered open-end Vanguard funds to borrow money from and lend money to each other for temporary or emergency purposes (the “Interfund Lending Program”), subject to compliance with the terms and conditions of the Order, and to the extent permitted by the fund’s investment objective and investment policies. Interfund loans and borrowings normally extend overnight, but can have a maximum duration of seven days. Loans may be called on one business day’s notice. The interest rate to be charged is governed by the conditions of the Order and internal procedures adopted by the board of trustees. The board of trustees is responsible for overseeing the Interfund Lending Program.
For the year ended August 31, 2020, the fund did not utilize the credit facilities or the Interfund Lending Program.
11. Other: Dividend income is recorded on the ex-dividend date. Interest income includes income distributions received from Vanguard Market Liquidity Fund and is accrued daily. Premiums and discounts on debt securities are amortized and accreted, respectively, to interest income over the lives of the respective securities, except for premiums on certain callable debt securities that are amortized to the earliest call date. Security transactions are accounted for on the date securities are bought or sold. Costs used to determine realized gains (losses) on the sale of investment securities are those of the specific securities sold.
Each class of shares has equal rights as to assets and earnings, except that each class separately bears certain class-specific expenses related to maintenance of shareholder accounts (included in Management and Administrative expenses) and shareholder reporting. Marketing and distribution expenses are allocated to each class of shares based on a method approved by the board of trustees. Income, other non-class-specific expenses, and gains and losses on investments are allocated to each class of shares based on its relative net assets.
B. Wellington Management Company LLP provides investment advisory services to the fund for a fee calculated at an annual percentage rate of average net assets. The basic fee is subject to quarterly adjustments based on the fund’s performance relative to the Global Wellington Composite Index, comprising the FTSE Developed Index and the Bloomberg Barclays Fixed Income Composite Index, since December 1, 2017. For the year ended August 31, 2020, the investment advisory fee represented an effective annual basic rate of 0.15% of the fund’s average net assets before a decrease of $127,000 (0.01%) based on performance.
C. In accordance with the terms of a Funds’ Service Agreement (the “FSA”) between Vanguard and the fund, Vanguard furnishes to the fund corporate management, administrative, marketing, and distribution services at Vanguard’s cost of operations (as defined by the FSA). These costs of operations are allocated to the fund based on methods and guidelines approved by the board of trustees and are generally settled twice a month.
Global Wellington Fund
Upon the request of Vanguard, the fund may invest up to 0.40% of its net assets as capital in Vanguard. At August 31, 2020, the fund had contributed to Vanguard capital in the amount of $53,000, representing less than 0.01% of the fund’s net assets and 0.02% of Vanguard’s capital received pursuant to the FSA. The fund’s trustees and officers are also directors and employees, respectively, of Vanguard.
D. Various inputs may be used to determine the value of the fund’s investments and derivatives. These inputs are summarized in three broad levels for financial statement purposes. The inputs or methodologies used to value securities are not necessarily an indication of the risk associated with investing in those securities.
Level 1—Quoted prices in active markets for identical securities.
Level 2—Other significant observable inputs (including quoted prices for similar securities, interest rates, prepayment speeds, credit risk, etc.).
Level 3—Significant unobservable inputs (including the fund’s own assumptions used to determine the fair value of investments). Any investments and derivatives valued with significant unobservable inputs are noted on the Schedule of Investments.
The following table summarizes the market value of the fund’s investments and derivatives as of August 31, 2020, based on the inputs used to value them:
| | Level 1 | Level 2 | Level 3 | Total |
| | ($000) | ($000) | ($000) | ($000) |
| Investments | | | | |
| Assets | | | | |
| Common Stocks | 522,759 | 329,718 | — | 852,477 |
| U.S. Government and Agency Obligations | — | 62,098 | — | 62,098 |
| Asset-Backed/Commercial Mortgage-Backed Securities | — | 14,850 | — | 14,850 |
| Corporate Bonds | — | 284,443 | — | 284,443 |
| Sovereign Bonds | — | 46,098 | — | 46,098 |
| Taxable Municipal Bonds | — | 11,180 | — | 11,180 |
| Temporary Cash Investments | 47,367 | — | — | 47,367 |
| Total Assets | 570,126 | 748,387 | — | 1,318,513 |
| Derivative Financial Instruments | | | | |
| Assets | | | | |
| Futures Contracts1 | 45 | — | — | 45 |
| Liabilities | | | | |
| Futures Contracts1 | 62 | — | — | 62 |
| Forward Currency Contracts | — | 1,518 | — | 1,518 |
| Total Liabilities | 62 | 1,518 | — | 1,580 |
1 Represents variation margin on the last day of the reporting period.
Global Wellington Fund
E. At August 31, 2020, the fair values of derivatives were reflected in the Statement of Assets and Liabilities as follows:
| | Interest | Foreign | |
| | Rate | Exchange | |
| | Contracts | Contracts | Total |
| Statement of Net Assets Caption | ($000) | ($000) | ($000) |
| Variation Margin Receivable—Futures Contracts | 45 | — | 45 |
| | | | |
| Variation Margin Payable—Futures Contracts | 62 | — | 62 |
| Unrealized Depreciation—Forward Currency Contracts | — | 1,518 | 1,518 |
| Total Liabilities | 62 | 1,518 | 1,580 |
Realized net gain (loss) and the change in unrealized appreciation (depreciation) on derivatives for the year ended August 31, 2020, were:
| | Interest | Foreign | |
| | Rate | Exchange | |
| | Contracts | Contracts | Total |
| Realized Net Gain (Loss) on Derivatives | ($000) | ($000) | ($000) |
| Futures Contracts | (345) | — | (345) |
| Forward Currency Contracts | — | (4,732) | (4,732) |
| Realized Net Gain (Loss) on Derivatives | (345) | (4,732) | (5,077) |
| | | | |
| Change in Unrealized Appreciation (Depreciation) on Derivatives | | | |
| Futures Contracts | (400) | — | (400) |
| Forward Currency Contracts | — | (2,124) | (2,124) |
| Change in Unrealized Appreciation (Depreciation) on Derivatives | (400) | (2,124) | (2,524) |
F. Permanent differences between book-basis and tax-basis components of net assets are reclassified among capital accounts in the financial statements to reflect their tax character. These reclassifications have no effect on net assets or net asset value per share. As of period end, permanent differences primarily attributable to the accounting for foreign currency transactions and designation of dividends paid were reclassified between the individual components of total distributable earnings (loss).
Global Wellington Fund
Temporary differences between book-basis and tax-basis components of total distributable earnings (loss) arise when certain items of income, gain, or loss are recognized in different periods for financial statement and tax purposes; these differences will reverse at some time in the future. The differences are primarily related to the deferral of losses from wash sales; the deferral of losses from straddles; and the recognition of unrealized gains or losses from certain derivative contracts. As of period end, the tax-basis components of total distributable earnings (loss) are detailed in the table as follows:
| | Amount |
| | ($000) |
| Undistributed Ordinary Income | 3,181 |
| Undistributed Long-Term Gains | — |
| Capital Loss Carryforwards | (14,718) |
| Qualified Late-Year Losses | — |
| Net Unrealized Gains (Losses) | 117,963 |
The tax character of distributions paid was as follows:
| | | August 31, |
| | 2020 | 2019 |
| | Amount | Amount |
| | ($000) | ($000) |
| Ordinary Income * | 23,296 | 19,512 |
| Long-Term Capital Gains | — | 1,615 |
| Total | 23,296 | 21,127 |
* Includes short-term capital gains, if any.
As of August 31, 2020, gross unrealized appreciation and depreciation for investments and derivatives based on cost for U.S. federal income tax purposes were as follows:
| | Amount |
| | ($000) |
| Tax Cost | 1,200,980 |
| Gross Unrealized Appreciation | 171,105 |
| Gross Unrealized Depreciation | (53,572) |
| Net Unrealized Appreciation (Depreciation) | 117,533 |
G. During the year ended August 31, 2020, the fund purchased $605,946,000 of investment securities and sold $407,539,000 of investment securities, other than U.S. government securities and temporary cash investments. Purchases and sales of U.S. government securities were $261,740,000 and $243,671,000, respectively.
Global Wellington Fund
H. Capital share transactions for each class of shares were:
| | | | | Year Ended August 31, | |
| | | 2020 | | | | 2019 | |
| | Amount | | Shares | | | Amount | | Shares | |
| | ($000 | ) | (000 | ) | | ($000 | ) | (000 | ) |
| Investor Shares | | | | | | | | | |
| Issued | 69,272 | | 3,217 | | | 57,984 | | 2,861 | |
| Issued in Lieu of Cash Distributions | 3,177 | | 151 | | | 3,350 | | 166 | |
| Redeemed | (73,177 | ) | (3,475 | ) | | (64,165 | ) | (3,183 | ) |
| Net Increase (Decrease)—Investor Shares | (728 | ) | (107 | ) | | (2,831 | ) | (156 | ) |
| Admiral Shares | | | | | | | | | |
| Issued | 572,797 | | 21,800 | | | 372,819 | | 14,761 | |
| Issued in Lieu of Cash Distributions | 17,237 | | 659 | | | 14,816 | | 586 | |
| Redeemed | (333,022 | ) | (12,820 | ) | | (311,923 | ) | (12,339 | ) |
| Net Increase (Decrease)—Admiral Shares | 257,012 | | 9,639 | | | 75,712 | | 3,008 | |
I. Management has determined that no events or transactions occurred subsequent to August 31, 2020, that would require recognition or disclosure in these financial statements.
Report of Independent Registered Public Accounting Firm
To the Board of Trustees of Vanguard World Fund and Shareholders of Vanguard Global Wellington Fund
Opinion on the Financial Statements
We have audited the accompanying statement of assets and liabilities, including the schedule of investments, of Vanguard Global Wellington Fund (one of the funds constituting Vanguard World Fund, referred to hereafter as the “Fund”) as of August 31, 2020, the related statement of operations for the year ended August 31, 2020, the statement of changes in net assets for each of the two years in the period ended August 31, 2020, including the related notes, and the financial highlights for each of the periods indicated therein (collectively referred to as the “financial statements”). In our opinion, the financial statements present fairly, in all material respects, the financial position of the Fund as of August 31, 2020, the results of its operations for the year then ended, the changes in its net assets for each of the two years in the period ended August 31, 2020 and the financial highlights for each of the periods indicated therein in conformity with accounting principles generally accepted in the United States of America.
Basis for Opinion
These financial statements are the responsibility of the Fund’s management. Our responsibility is to express an opinion on the Fund’s financial statements based on our audits. We are a public accounting firm registered with the Public Company Accounting Oversight Board (United States) (“PCAOB”) and are required to be independent with respect to the Fund in accordance with the U.S. federal securities laws and the applicable rules and regulations of the Securities and Exchange Commission and the PCAOB.
We conducted our audits of these financial statements in accordance with the standards of the PCAOB. Those standards require that we plan and perform the audit to obtain reasonable assurance about whether the financial statements are free of material misstatement, whether due to error or fraud.
Our audits included performing procedures to assess the risks of material misstatement of the financial statements, whether due to error or fraud, and performing procedures that respond to those risks. Such procedures included examining, on a test basis, evidence regarding the amounts and disclosures in the financial statements. Our audits also included evaluating the accounting principles used and significant estimates made by management, as well as evaluating the overall presentation of the financial statements. Our procedures included confirmation of securities owned as of August 31, 2020 by correspondence with the custodian, transfer agent and brokers; when replies were not received from brokers, we performed other auditing procedures. We believe that our audits provide a reasonable basis for our opinion.
/s/PricewaterhouseCoopers LLP
Philadelphia, Pennsylvania
October 19, 2020
We have served as the auditor of one or more investment companies in The Vanguard Group of Funds since 1975.
Special 2020 tax information (unaudited) for Vanguard Global Wellington Fund
This information for the fiscal year ended August 31, 2020, is included pursuant to provisions of the Internal Revenue Code.
The fund distributed $16,363,000 of qualified dividend income to shareholders during the fiscal year.
For corporate shareholders, 38.8% of investment income (dividend income plus short-term gains, if any) qualifies for the dividends-received deduction.
Liquidity Risk Management
Vanguard funds (except for the money market funds) have adopted and implemented a written liquidity risk management program (the “Program”) as required by Rule 22e-4 under the Investment Company Act of 1940. Rule 22e-4 requires that each fund adopt a program that is reasonably designed to assess and manage the fund’s liquidity risk, which is the risk that the fund could not meet redemption requests without significant dilution of remaining investors’ interests in the fund.
Assessment and management of a fund’s liquidity risk under the Program take into consideration certain factors, such as the fund’s investment strategy and the liquidity of its portfolio investments during normal and reasonably foreseeable stressed conditions, its short- and long-term cash-flow projections during both normal and reasonably foreseeable stressed conditions, and its cash and cash-equivalent holdings and access to other funding sources. As required by the rule, the Program includes policies and procedures for classification of fund portfolio holdings in four liquidity categories, maintaining certain levels of highly liquid investments, and limiting holdings of illiquid investments.
The board of trustees of Vanguard World Fund approved the appointment of liquidity risk management program administrators responsible for administering Vanguard Global Wellington Fund’s Program and for carrying out the specific responsibilities set forth in the Program, including reporting to the board on at least an annual basis regarding the Program’s operation, its adequacy, and the effectiveness of its implementation for the past year (the “Program Administrator Report”). The board has reviewed the Program Administrator Report covering the period from December 1, 2018, through December 31, 2019 (the “Review Period”). The Program Administrator Report stated that during the Review Period the Program operated and was implemented effectively to manage the fund’s liquidity risk.
BLOOMBERG is a trademark and service mark of Bloomberg Finance L.P. BARCLAYS is a trademark and service mark of Barclays Bank Plc, used under license. Bloomberg Finance L.P. and its affiliates, including Bloomberg Index Services Limited BISL) (collectively, Bloomberg), or Bloomberg’s licensors, own all proprietary rights in the Bloomberg Barclays Fixed Income Composite Index, which is composed of 80% Bloomberg Barclays Global Aggregate Credit Index (USD Hedged), 10% Bloomberg Barclays Global Aggregate Treasury Index (USD Hedged), and 10% Bloomberg Barclays Global Aggregate Securitized Index (USD Hedged) (the Indices or Bloomberg Barclays Indices).
Neither Barclays Bank Plc, Barclays Capital Inc., or any affiliate (collectively Barclays) or Bloomberg is the issuer or producer of the Global Wellington Fund and neither Bloomberg nor Barclays has any responsibilities, obligations or duties to investors in the Global Wellington Fund. The Indices are licensed for use by The Vanguard Group, Inc. (Vanguard) as the sponsor of the Global Wellington Fund. Bloomberg and Barclays’ only relationship with Vanguard in respect to the Indices is the licensing of the Indices, which are determined, composed and calculated by BISL, or any successor thereto, without regard to the Issuer or the Global Wellington Fund or the owners of the Global Wellington Fund.
Additionally, Vanguard may for itself execute transaction(s) with Barclays in or relating to the Indices in connection with the Global Wellington Fund. Investors acquire the Global Wellington Fund from Vanguard and investors neither acquire any interest in the Indices nor enter into any relationship of any kind whatsoever with Bloomberg or Barclays upon making an investment in the Global Wellington Fund. The Global Wellington Fund is not sponsored, endorsed, sold or promoted by Bloomberg or Barclays. Neither Bloomberg nor Barclays makes any representation or warranty, express or implied regarding the advisability of investing in the Global Wellington Fund or the advisability of investing in securities generally or the ability of the Indices to track corresponding or relative market performance. Neither Bloomberg nor Barclays has passed on the legality or suitability of the Global Wellington Fund with respect to any person or entity. Neither Bloomberg nor Barclays is responsible for and has not participated in the determination of the timing of, prices at, or quantities of the Global Wellington Fund to be issued. Neither Bloomberg nor Barclays has any obligation to take the needs of the Issuer or the owners of the Global Wellington Fund or any other third party into consideration in determining, composing or calculating the Indices. Neither Bloomberg nor Barclays has any obligation or liability in connection with administration, marketing or trading of the Global Wellington Fund.
The licensing agreement between Bloomberg and Barclays is solely for the benefit of Bloomberg and Barclays and not for the benefit of the owners of the Global Wellington Fund, investors or other third parties. In addition, the licensing agreement between Vanguard and Bloomberg is solely for the benefit of Vanguard and Bloomberg and not for the benefit of the owners of the Global Wellington Fund, investors or other third parties.
NEITHER BLOOMBERG NOR BARCLAYS SHALL HAVE ANY LIABILITY TO THE ISSUER, INVESTORS OR TO OTHER THIRD PARTIES FOR THE QUALITY, ACCURACY AND/OR COMPLETENESS OF THE BLOOMBERG BARCLAYS INDICES OR ANY DATA INCLUDED THEREIN OR FOR INTERRUPTIONS IN THE DELIVERY OF THE BLOOMBERG BARCLAYS INDICES. NEITHER BLOOMBERG NOR BARCLAYS MAKES ANY WARRANTY, EXPRESS OR IMPLIED, AS TO RESULTS TO BE OBTAINED BY THE ISSUER, THE INVESTORS OR ANY OTHER PERSON OR ENTITY FROM THE USE OF THE BLOOMBERG BARCLAYS INDICES OR ANY DATA INCLUDED THEREIN. NEITHER BLOOMBERG NOR BARCLAYS MAKES ANY EXPRESS OR IMPLIED WARRANTIES, AND EACH HEREBY EXPRESSLY DISCLAIMS ALL WARRANTIES OF MERCHANTABILITY OR FITNESS FOR A PARTICULAR PURPOSE OR USE WITH RESPECT TO THE BLOOMBERG BARCLAYS INDICES OR ANY DATA INCLUDED THEREIN. BLOOMBERG RESERVES THE RIGHT TO CHANGE THE METHODS OF CALCULATION OR PUBLICATION, OR TO CEASE THE CALCULATION OR PUBLICATION OF THE BLOOMBERG BARCLAYS INDICES, AND NEITHER BLOOMBERG NOR BARCLAYS SHALL BE LIABLE FOR ANY MISCALCULATION OF OR ANY INCORRECT, DELAYED OR INTERRUPTED PUBLICATION WITH RESPECT TO ANY OF THE BLOOMBERG BARCLAYS INDICES. NEITHER BLOOMBERG NOR BARCLAYS SHALL BE LIABLE FOR ANY DAMAGES, INCLUDING, WITHOUT LIMITATION, ANY SPECIAL, INDIRECT OR CONSEQUENTIAL DAMAGES, OR ANY LOST PROFITS AND EVEN IF ADVISED OF THE POSSIBILITY OF SUCH, RESULTING FROM THE USE OF THE BLOOMBERG BARCLAYS INDICES OR ANY DATA INCLUDED THEREIN OR WITH RESPECT TO THE GLOBAL WELLINGTON FUND.
None of the information supplied by Bloomberg or Barclays and used in this publication may be reproduced in any manner without the prior written permission of both Bloomberg and Barclays Capital, the investment banking division of Barclays Bank Plc. Barclays Bank Plc is registered in England No. 1026167. Registered office 1 Churchill Place London E14 5HP.
© 2020 Bloomberg. Used with Permission.
Source: Bloomberg Index Services Limited. Copyright 2020, Bloomberg. All rights reserved.
This page intentionally left blank.
This page intentionally left blank.
This page intentionally left blank.
The People Who Govern Your Fund
The trustees of your mutual fund are there to see that the fund is operated and managed in your best interests since, as a shareholder, you are a part owner of the fund. Your fund’s trustees also serve on the board of directors of The Vanguard Group, Inc., which is owned by the Vanguard funds and provides services to them.
A majority of Vanguard’s board members are independent, meaning that they have no affiliation with Vanguard or the funds they oversee, apart from the sizable personal investments they have made as private individuals. The independent board members have distinguished backgrounds in business, academia, and public service. Each of the trustees and executive officers oversees 212 Vanguard funds.
Information for each trustee and executive officer of the fund appears below. That information, as well as the Vanguard fund count, is as of the date on the cover of this fund report. The mailing address of the trustees and officers is P.O. Box 876, Valley Forge, PA 19482. More information about the trustees is in the Statement of Additional Information, which can be obtained, without charge, by contacting Vanguard at 800-662-7447, or online at vanguard.com.
Interested Trustee1
Mortimer J. Buckley
Born in 1969. Trustee since January 2018. Principal occupation(s) during the past five years and other experience: chairman of the board (2019–present) of Vanguard and of each of the investment companies served by Vanguard; chief executive officer (2018– present) of Vanguard; chief executive officer, president, and trustee (2018–present) of each of the investment companies served by Vanguard; president and director (2017–present) of Vanguard; and president (2018–present) of Vanguard Marketing Corporation. Chief investment officer (2013–2017), managing director (2002–2017), head of the Retail Investor Group (2006–2012), and chief information officer (2001–2006) of Vanguard. Chairman of the board (2011–2017) and trustee (2009–2017) of the Children’s Hospital of Philadelphia; and trustee (2018–present) and vice chair (2019–present) of The Shipley School.
Independent Trustees
Emerson U. Fullwood
Born in 1948. Trustee since January 2008. Principal occupation(s) during the past five years and other experience: executive chief staff and marketing officer for North America and corporate vice president (retired 2008) of Xerox Corporation (document management products and services). Former president of the Worldwide Channels Group, Latin America, and
Worldwide Customer Service and executive chief staff officer of Developing Markets of Xerox. Executive in residence and 2009–2010 Distinguished Minett Professor at the Rochester Institute of Technology. Director of SPX FLOW, Inc. (multi-industry manufac-turing). Director of the University of Rochester Medical Center, the Monroe Community College Foundation, the United Way of Rochester, North Carolina A&T University, and Roberts Wesleyan College. Trustee of the University of Rochester.
Amy Gutmann
Born in 1949. Trustee since June 2006. Principal occupation(s) during the past five years and other experience: president (2004–present) of the University of Pennsylvania. Christopher H. Browne Distinguished Professor of Political Science, School of Arts and Sciences, and professor of communication, Annenberg School for Communication, with secondary faculty appointments in the Department of Philosophy, School of Arts and Sciences, and at the Graduate School of Education, University of Pennsylvania.
F. Joseph Loughrey
Born in 1949. Trustee since October 2009. Principal occupation(s) during the past five years and other experience: president and chief operating officer (retired 2009) and vice chairman of the board (2008–2009) of Cummins Inc. (industrial machinery). Chairman of the board of Hillenbrand, Inc. (specialized consumer services) and the Lumina Foundation. Director of the V Foundation. Member of the advisory
1 Mr. Buckley is considered an “interested person,” as defined in the Investment Company Act of 1940, because he is an officer of the Vanguard funds.
council for the College of Arts and Letters and chair of the advisory board to the Kellogg Institute for International Studies, both at the University of Notre Dame.
Mark Loughridge
Born in 1953. Trustee since March 2012. Principal occupation(s) during the past five years and other experience: senior vice president and chief financial officer (retired 2013) of IBM (information technology services). Fiduciary member of IBM’s Retirement Plan Committee (2004–2013), senior vice president and general manager (2002–2004) of IBM Global Financing, vice president and controller (1998–2002) of IBM, and a variety of other prior management roles at IBM. Member of the Council on Chicago Booth.
Scott C. Malpass
Born in 1962. Trustee since March 2012. Principal occupation(s) during the past five years and other experience: chief investment officer (retired June 2020) and vice president (retired June 2020) of the University of Notre Dame. Assistant professor of finance at the Mendoza College of Business, University of Notre Dame, and member of the Notre Dame 403(b) Investment Committee (retired June 2020). Member of the board of Catholic Investment Services, Inc. (investment advisors) and the board of superintendence of the Institute for the Works of Religion.
Deanna Mulligan
Born in 1963. Trustee since January 2018. Principal occupation(s) during the past five years and other experience: chief executive officer (2011–present) of The Guardian Life Insurance Company of America. President (2010–2019), chief operating officer (2010–2011), and executive vice president (2008–2010) of Individual Life and Disability of The Guardian Life Insurance Company of America. Member of the board of The Guardian Life Insurance Company of America, the American Council of Life Insurers, and the Economic Club of New York. Trustee of the Partnership for New York City (business leadership), Chief Executives for Corporate Purpose, NewYork-Presbyterian Hospital, Catalyst, and the Bruce Museum (arts and science). Member of the Advisory Council for the Stanford Graduate School of Business.
André F. Perold
Born in 1952. Trustee since December 2004. Principal occupation(s) during the past five years and other experience: George Gund Professor of Finance and Banking, Emeritus at the Harvard Business School (retired 2011). Chief investment officer and co-managing partner of HighVista Strategies (private investment firm). Member of the board of advisors and member of the investment committee of the Museum of Fine Arts Boston. Member of the board (2018–present) of RIT Capital Partners (investment firm). Member of the investment committee of Partners Health Care System.
Sarah Bloom Raskin
Born in 1961. Trustee since January 2018. Principal occupation(s) during the past five years and other experience: deputy secretary (2014–2017) of the United States Department of the Treasury. Governor (2010–2014) of the Federal Reserve Board. Commissioner (2007–2010) of financial regulation for the State of Maryland. Member of the board of directors (2012–2014) of Neighborhood Reinvestment Corporation. Director (2017–present) of i(x) Investments, LLC; director (2017–present) of Reserve Trust. Rubenstein Fellow (2017–present) of Duke University; trustee (2017–present) of Amherst College, and trustee (2019–present) of the Folger Shakespeare Library.
Peter F. Volanakis
Born in 1955. Trustee since July 2009. Principal occupation(s) during the past five years and other experience: president and chief operating officer (retired 2010) of Corning Incorporated (communications equipment) and director of Corning Incorporated (2000–2010) and Dow Corning (2001–2010). Director (2012) of SPX Corporation (multi-industry manufacturing). Overseer of the Amos Tuck School of Business Administration, Dartmouth College (2001–2013). Chairman of the board of trustees of Colby-Sawyer College. Member of the board of Hypertherm Inc. (industrial cutting systems, software, and consumables).
Executive Officers
John Bendl
Born in 1970. Principal occupation(s) during the past five years and other experience: principal of Vanguard. Chief financial officer (2019–present) of each of the investment companies served by Vanguard. Chief accounting officer, treasurer, and controller of Vanguard (2017–present). Partner (2003–2016) at KPMG (audit, tax, and advisory services).
Glenn Booraem
Born in 1967. Principal occupation(s) during the past five years and other experience: principal of Vanguard. Investment stewardship officer (2017–present), treasurer (2015–2017), controller (2010–2015), and assistant controller (2001–2010) of each of the investment companies served by Vanguard.
Christine M. Buchanan
Born in 1970. Principal occupation(s) during the past five years and other experience: principal of Vanguard. Treasurer (2017–present) of each of the investment companies served by Vanguard. Partner (2005–2017) at KPMG (audit, tax, and advisory services).
David Cermak
Born in 1960. Principal occupation(s) during the past five years and other experience: principal of Vanguard. Finance director (2019–present) of each of the investment companies served by Vanguard. Managing director and head (2017–present) of Vanguard Investments Singapore. Managing director and head (2017–2019) of Vanguard Investments Hong Kong. Representative director and head (2014–2017) of Vanguard Investments Japan.
Thomas J. Higgins
Born in 1957. Principal occupation(s) during the past five years and other experience: principal of Vanguard. Finance director (2019–present), chief financial officer (2008–2019), and treasurer (1998–2008) of each of the investment companies served by Vanguard.
Peter Mahoney
Born in 1974. Principal occupation(s) during the past five years and other experience: principal of Vanguard. Controller (2015–present) of each of the investment companies served by Vanguard. Head of International Fund Services (2008–2014) at Vanguard.
Anne E. Robinson
Born in 1970. Principal occupation(s) during the past five years and other experience: general counsel (2016–present) of Vanguard. Secretary (2016–present) of Vanguard and of each of the investment companies served by Vanguard. Managing director (2016–present) of Vanguard. Managing director and general counsel of Global Cards and Consumer Services (2014–2016) at Citigroup. Counsel (2003–2014) at American Express.
Michael Rollings
Born in 1963. Principal occupation(s) during the past five years and other experience: finance director (2017–present) and treasurer (2017) of each of the investment companies served by Vanguard. Managing director (2016–present) of Vanguard. Chief financial officer (2016–present) of Vanguard. Director (2016–present) of Vanguard Marketing Corporation. Executive vice president and chief financial officer (2006–2016) of MassMutual Financial Group.
John E. Schadl
Born in 1972. Principal occupation(s) during the past five years and other experience: principal of Vanguard. Chief compliance officer (2019–present) of Vanguard and of each of the investment companies served by Vanguard. Assistant vice president (2019–present) of Vanguard Marketing Corporation.
Vanguard Senior Management Team
| Joseph Brennan | | Chris D. McIsaac |
| Mortimer J. Buckley | | James M. Norris |
| Gregory Davis | | Thomas M. Rampulla |
| John James | | Karin A. Risi |
| Martha G. King | | Anne E. Robinson |
| John T. Marcante | | Michael Rollings |
Connect with Vanguard® > vanguard.com
Fund Information > 800-662-7447
Direct Investor Account Services > 800-662-2739
Institutional Investor Services > 800-523-1036
Text Telephone for People
Who Are Deaf or Hard of Hearing > 800-749-7273
This material may be used in conjunction with the offering of shares of any Vanguard fund only if preceded or accompanied by the fund’s current prospectus.
All comparative mutual fund data are from Morningstar, Inc., unless otherwise noted.
You can obtain a free copy of Vanguard’s proxy voting guidelines by visiting vanguard.com/proxyreporting or by calling Vanguard at 800-662-2739. The guidelines are also available from the SEC’s website, www.sec.gov. In addition, you may obtain a free report on how your fund voted the proxies for securities it owned during the 12 months ended June 30. To get the report, visit either vanguard.com/proxyreporting or www.sec.gov.
You can review information about your fund on the SEC’s website, and you can receive copies of this information, for a fee, by sending a request via email addressed to publicinfo@sec.gov.
CFA® is a registered trademark owned by CFA Institute.
| | © 2020 The Vanguard Group, Inc. |
| | All rights reserved. |
| | Vanguard Marketing Corporation, Distributor. |
| | |
| | Q15670 102020 |

| Annual Report | August 31, 2020 Vanguard Global Wellesley® Income Fund |
| See the inside front cover for important information about access to your fund’s annual and semiannual shareholder reports. |
Important information about access to shareholder reports
Beginning on January 1, 2021, as permitted by regulations adopted by the Securities and Exchange Commission, paper copies of your fund’s annual and semiannual shareholder reports will no longer be sent to you by mail, unless you specifically request them. Instead, you will be notified by mail each time a report is posted on the website and will be provided with a link to access the report.
If you have already elected to receive shareholder reports electronically, you will not be affected by this change and do not need to take any action. You may elect to receive shareholder reports and other communications from the fund electronically by contacting your financial intermediary (such as a broker-dealer or bank) or, if you invest directly with the fund, by calling Vanguard at one of the phone numbers on the back cover of this report or by logging on to vanguard.com.
You may elect to receive paper copies of all future shareholder reports free of charge. If you invest through a financial intermediary, you can contact the intermediary to request that you continue to receive paper copies. If you invest directly with the fund, you can call Vanguard at one of the phone numbers on the back cover of this report or log on to vanguard.com. Your election to receive paper copies will apply to all the funds you hold through an intermediary or directly with Vanguard.
| Contents | |
| | |
| Your Fund’s Performance at a Glance | 1 |
| Advisor’s Report | 2 |
| About Your Fund’s Expenses | 7 |
| Performance Summary | 9 |
| Financial Statements | 12 |
| Liquidity Risk Management | 42 |
Please note: The opinions expressed in this report are just that—informed opinions. They should not be considered promises or advice. Also, please keep in mind that the information and opinions cover the period through the date on the front of this report. Of course, the risks of investing in your fund are spelled out in the prospectus.
Your Fund’s Performance at a Glance
● For the 12 months ended August 31, 2020, Vanguard Global Wellesley Income Fund returned 3.66% for Investor Shares and 3.79% for Admiral Shares. Its composite benchmark index returned 3.69%.
● Stock market indexes across the globe hit record highs in February, then fell sharply as the coronavirus spread beyond China, leading many countries to close nonessential businesses, impose lockdowns, and restrict travel. Markets rose later in the period as policymakers implemented strong responses to the ensuing economic crisis, treatments for the virus improved, vaccine trials began, and many countries started to ease pandemic-related restrictions.
● In the bond markets, volatility rose and liquidity fell in March as the pandemic spread. By the end of the period, however, bond yields were significantly lower and bond prices were higher.
● The fund’s stock portfolio outperformed its benchmark. Strong stock selection in the information technology sector helped returns. By region, emerging markets and North America performed best.
● The fixed income portfolio outperformed its benchmark, thanks in part to security selection within industrial sectors, particularly communications and technology.
Market Barometer
| | Average Annual Total Returns |
| | Periods Ended August 31, 2020 |
| | One Year | Three Years | Five Years |
| Stocks | | | |
| Russell 1000 Index (Large-caps) | 22.50% | 14.58% | 14.31% |
| Russell 2000 Index (Small-caps) | 6.02 | 5.03 | 7.65 |
| Russell 3000 Index (Broad U.S. market) | 21.44 | 13.95 | 13.86 |
| FTSE All-World ex US Index (International) | 8.78 | 2.92 | 6.00 |
| | | | |
| Bonds | | | |
| Bloomberg Barclays U.S. Aggregate Bond Index | | | |
| (Broad taxable market) | 6.47% | 5.09% | 4.33% |
| Bloomberg Barclays Municipal Bond Index | | | |
| (Broad tax-exempt market) | 3.24 | 4.09 | 3.99 |
| FTSE Three-Month U.S. Treasury Bill Index | 1.18 | 1.67 | 1.15 |
| | | | |
| CPI | | | |
| Consumer Price Index | 1.31% | 1.92% | 1.75% |
Advisor’s Report
Vanguard Global Wellesley Income Fund returned 3.66% for Investor Shares and 3.79% for Admiral Shares for the 12 months ended August 31, 2020. The fund’s composite benchmark returned 3.69%. It is weighted 65% Bloomberg Barclays Fixed Income Composite Index— made up of 80% Bloomberg Barclays Global Aggregate Credit Index (USD Hedged), 10% Bloomberg Barclays Global Aggregate Treasury Index (USD Hedged), and 10% Bloomberg Barclays Global Aggregate Securitized Index (USD Hedged)—and 35% FTSE Developed High Dividend Yield Index (net of tax).
The investment environment
For the period, the Standard & Poor’s 500 Index returned 21.94%, the MSCI World Index returned 17.41%, and the MSCI EAFE Index returned 6.13%. The U.S. fixed income market advanced, with the Bloomberg Barclays U.S. Aggregate Bond Index returning 6.47%. In contrast, non-U.S. bonds returned 0.72%, as measured by the Bloomberg Barclays Global Aggregate ex-USD Hedged Index, and the higher-quality Bloomberg Barclays U.S. Credit A or Better Index returned 7.45%. The yield on the 10-year U.S. Treasury began the period at 1.50% and finished at 0.70%.
In late 2019, the U.S. canceled scheduled tariffs in an effort to secure a phase-one trade deal with China. U.K. equities rose after the Conservative Party’s victory in the general election lifted uncertainty about the country’s departure from the European Union (EU) and concerns about the Labor Party’s plans to nationalize large swaths of the economy.
Global equities ended the first quarter of 2020 sharply lower as the COVID-19 pandemic caused unprecedented disruption to financial markets and economies. Market volatility remained extremely high, and liquidity plunged to record lows. With the world’s largest oil producers failing to agree on whether to reduce output as demand collapsed, oil prices fell to their lowest level since 2002. The U.K. officially departed the EU on January 31, and the pandemic delayed U.K.-EU trade agreement discussions.
During the second quarter, global equities surged. They continued to rise toward the end of the period, supported by ongoing fiscal and monetary stimulus, encouraging COVID-19 vaccine trials, and further evidence of an acceleration in the global economy. On the other hand, a rising wave of infections pressured this recovery.
On the fixed income side, absolute returns across most major (U.S.) fixed income spread sectors were positive for the 12 months. On an excess return basis, most spread sectors posted negative returns. Sovereign yields also declined to historic lows in several developed markets.
Monetary policy had taken a dovish pivot in 2019 because of tepid economic data, trade policy uncertainty, and stubbornly
low inflation. But beginning in March, in response to the COVID-19 pandemic, the U.S. Federal Reserve cut rates to near zero and committed to buying unlimited amounts of U.S. Treasury and agency mortgage-backed securities (MBS). The Fed increased the size and scope of its asset purchase program to include corporate bonds, agency commercial mortgage-backed securities, and commercial paper, while also lending support to the municipal funding market.
Central banks added extraordinary monetary stimulus to support global economies amid the crisis. The European Central Bank (ECB) expanded its massive asset purchase program, which included non-financial commercial paper for the first time, and eased collateral rules. Credit spreads widened as the pandemic led to a flight to safety in U.S. Treasuries.
Toward the end of the fiscal year, the Fed announced a policy shift to an average inflation target. It also modified its employment objective to indicate that maximum employment is a “broad-based” and “inclusive” goal and noted that policy will respond to “shortfalls” from maximum employment rather than “deviations.” We interpret all of this as suggesting that the Fed may adopt an asymmetrical approach to its employment objective and allow the unemployment rate to remain quite low for a sustained period unless inflation increases.
The U.S. dollar (USD) generated mixed results against global currencies, while emerging market and commodity-linked currencies lagged on recession fears stemming from the pandemic and a collapse in OPEC+ talks early in 2020. The euro performed well, driven by the proposal and subsequent agreement on the Next Generation EU plan.
The fund’s successes
The fund’s equity portfolio outperformed its benchmark, driven by strong stock selection in energy, information technology, and financials. Its overweight to information technology also contributed. Top relative contributors included Taiwan Semiconductor (information technology, Taiwan) and Microsoft (information technology, U.S.).
On the fixed income side, security selection within industrial sectors, particularly communications and technology, contributed the most to relative outperformance. Positioning in local agency and supranationals and in securitized sectors—especially an underweight to and security selection in mortgage-backed pass-throughs— also helped. Duration and yield curve positioning was a positive contributor to results overall.
The fund’s shortfalls
Sector allocation detracted from relative returns, particularly underweights to industrials and health care. Weak stock
selection in industrials and real estate also detracted. Top relative detractors included ABN AMRO Bank (financials, Netherlands), Millicom International Cellular (communication services, U.S.), and Boeing (industrials, U.S.).
In fixed income, an overweight to and security selection within the banking sector hurt results. In securitized sectors, positioning within asset-backed securities (ABS) slightly hindered performance. An overweight to and selection within local authority bonds also detracted.
The fund’s positioning
We continue to maintain a modestly pro-cyclical risk posture. Our base case is for an improving economy and elevated volatility as the path of COVID-19 develops.
We expect the Fed to maintain its current trajectory and U.S. rates to remain low and range-bound. We have positioned the fixed income portfolio with close-to-benchmark-neutral duration. Credit remains the main investment focus. Despite credit spread compression pushing spreads to more normal levels, Fed purchases remain a tailwind and likely to further support spread levels.
We are underweighted in credit risk globally. This underweight is driven by an underweight to richly valued supranationals and partly offset by an overweight to corporates and taxable municipals. We favor USD-denominated corporates and focus on higher-quality and less-cyclical sectors. We expect our significant positioning there to benefit from supportive global central bank policy and the global search for yield.
We are also overweight in euro-denominated corporate risk and underweight in euro-denominated supranationals. We view ECB bond purchases as very supportive of euro-denominated assets. We remain underweight in U.K. credit risk as we do not view market levels as compensating for Brexit uncertainties and the longer-term economic impacts. We are also underweight in emerging markets, focusing instead on countries that are better able to cope with the economic and health care impacts of COVID-19.
We believe credit fundamentals will remain strained in the medium term; however, liquidity is robust, and spread widening is likely an opportunity for long-term investors. On an industry basis, the fixed income portfolio is overweight in less-cyclical sectors such as communications and electric utilities. We are cautious about sectors that are more cyclical, such as energy, and we are seeking opportunities to move up in credit quality.
We are also overweight traditional sectors of ABS, which remain well-protected from defaults. Within agency MBS, we remain underweight in agency pass-throughs overall but overweight in low-coupon to-be-announced (TBA) securities to maintain carry and liquidity. Instead, we favor
CMOs (collateralized mortgage obligations) and DUS (delegated underwriting and servicing) for their stable cash flows. We continue to hold adequate liquidity in the fixed income portion of the fund, with government bonds serving as our “all-weather” liquidity buffer.
On the equity side, we have seen the worst quarter in history, followed by one of the all-time strongest recoveries, which was led by a narrow selection of growth and tech stocks. Valuations have risen significantly, and much of the recovery is priced in. We believe there is still much uncertainty ahead and that, given the possible “second wave” of infections and the disjointed reopening of economies, the market has not discounted many of the potential risks linked directly or indirectly to the pandemic.
We wait to fully understand the lasting macroeconomic impact of the global shutdowns, central bank interventions, and ballooning public deficits. We are also aware that the buildup to the U.S. election, and its results, will have far-reaching implications for the U.S.-China trade war and the United States’ future domestically and internationally.
We maintain our cautious approach and believe that negatively skewed risks remain highly elevated around the world. We remain focused on a company’s long-term ability and willingness to pay dividends and offer attractive total returns, particularly across this highly uncertain and diverging period. We continue to look for opportunities where market narrowness and a myopic focus has left some stocks overlooked in the recovery.
While some portfolio companies have suspended dividends in the short term because of political pressure (and, in some cases, an abundance of caution), the overall impact to the portfolio has been relatively minor. We are confident that our holdings that suspended dividends will resume them soon.
Over the 12 months, we have made several changes to the equity portfolio’s overall positioning. We have moved from an underweight to an overweight allocation in real estate and decreased our exposure to communication services. These investment decisions stem from bottom-up risk-return considerations at the individual stock level.
Regionally, the equity portfolio’s largest allocations are to North America and Europe. Within Europe, the portfolio is most overweight euro zone countries, including France, Norway, and Portugal. The fund’s largest overweighting is emerging markets; its largest under-weighting is Asia Pacific ex-Japan. Most of these weightings are a function of domi-cile of global companies, rather than reflecting our views of local economies.
At the end of the fiscal year, the equity portfolio’s largest overweights were in communication services, consumer discretionary, and real estate. In all these
sectors we have found many attractively valued companies that present good absolute upside as well as reasonable downside protection through an economic cycle. The largest underweights were in consumer staples, materials, and industrials. We initiated new positions in Progressive, Nexity, BAE Systems, Exelon, and DNB. We eliminated our holdings in BT Group, Baxter International, Public Storage, Koninklijke Philips, and Unilever.
Loren L. Moran, CFA
Senior Managing Director and
Fixed Income Portfolio Manager
Michael E. Stack, CFA
Senior Managing Director and
Fixed Income Portfolio Manager
Andre J. Desautels, CFA
Senior Managing Director and
Equity Portfolio Manager
Wellington Management Company llp
September 11, 2020
About Your Fund’s Expenses
As a shareholder of the fund, you incur ongoing costs, which include costs for portfolio management, administrative services, and shareholder reports (like this one), among others. Operating expenses, which are deducted from a fund’s gross income, directly reduce the investment return of the fund.
A fund’s expenses are expressed as a percentage of its average net assets. This figure is known as the expense ratio. The following examples are intended to help you understand the ongoing costs (in dollars) of investing in your fund and to compare these costs with those of other mutual funds. The examples are based on an investment of $1,000 made at the beginning of the period shown and held for the entire period.
The accompanying table illustrates your fund’s costs in two ways:
• Based on actual fund return. This section helps you to estimate the actual expenses that you paid over the period. The ”Ending Account Value“ shown is derived from the fund‘s actual return, and the third column shows the dollar amount that would have been paid by an investor who started with $1,000 in the fund. You may use the information here, together with the amount you invested, to estimate the expenses that you paid over the period.
To do so, simply divide your account value by $1,000 (for example, an $8,600 account value divided by $1,000 = 8.6), then multiply the result by the number given for your fund under the heading ”Expenses Paid During Period.“
• Based on hypothetical 5% yearly return. This section is intended to help you compare your fund‘s costs with those of other mutual funds. It assumes that the fund had a yearly return of 5% before expenses, but that the expense ratio is unchanged. In this case—because the return used is not the fund’s actual return—the results do not apply to your investment. The example is useful in making comparisons because the Securities and Exchange Commission requires all mutual funds to calculate expenses based on a 5% return. You can assess your fund’s costs by comparing this hypothetical example with the hypothetical examples that appear in shareholder reports of other funds.
Note that the expenses shown in the table are meant to highlight and help you compare ongoing costs only and do not reflect transaction costs incurred by the fund for buying and selling securities. Further, the expenses do not include any purchase, redemption, or account service fees described in the fund prospectus. If such fees were applied to your account, your costs would be higher. Your fund does not carry a “sales load.”
The calculations assume no shares were bought or sold during the period. Your actual costs may have been higher or lower, depending on the amount of your investment and the timing of any purchases or redemptions.
You can find more information about the fund’s expenses, including annual expense ratios, in the Financial Statements section of this report. For additional information on operating expenses and other shareholder costs, please refer to your fund’s current prospectus.
Six Months Ended August 31, 2020
| | Beginning | Ending | Expenses |
| | Account Value | Account Value | Paid During |
| Global Wellesley Income Fund | 2/29/2020 | 8/31/2020 | Period |
| Based on Actual Fund Return | | | |
| Investor Shares | $1,000.00 | $1,023.86 | $2.14 |
| Admiral™ Shares | 1,000.00 | 1,024.44 | 1.63 |
| Based on Hypothetical 5% Yearly Return | | | |
| Investor Shares | $1,000.00 | $1,023.03 | $2.14 |
| Admiral Shares | 1,000.00 | 1,023.53 | 1.63 |
The calculations are based on expenses incurred in the most recent six-month period. The fund’s annualized six-month expense ratios for the period are 0.42% for Investor Shares and 0.32% for Admiral Shares. The dollar amounts shown as “Expenses Paid” are equal to the annualized expense ratio multiplied by the average account value over the period, multiplied by the number of days in the most recent six-month period, then divided by the number of days in the most recent 12-month period (184/366).
Global Wellesley Income Fund
Performance Summary
All of the returns in this report represent past performance, which is not a guarantee of future results that may be achieved by the fund. (Current performance may be lower or higher than the performance data cited. For performance data current to the most recent month-end, visit our website at vanguard.com/performance.) Note, too, that both investment returns and principal value can fluctuate widely, so an investor’s shares, when sold, could be worth more or less than their original cost. The returns shown do not reflect taxes that a shareholder would pay on fund distributions or on the sale of fund shares.
Cumulative Performance: November 2, 2017, Through August 31, 2020
Initial Investment of $10,000
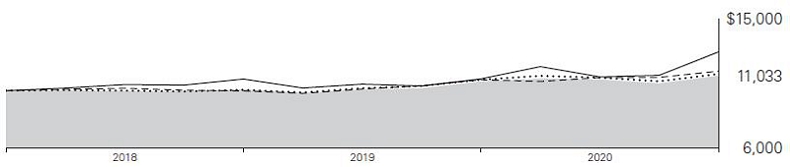
| | | Average Annual Total Returns | |
| | | Periods Ended August 31, 2020 | |
| | | | Since | Final Value |
| | | One | Inception | of a $10,000 |
| | | Year | (11/2/2017) | Investment |
 | Global Wellesley Income Fund Investor Shares | 3.66% | 3.54% | $11,033 |
 | Global Wellesley Income Composite Index | 3.69 | 3.95 | 11,159 |
 | Bloomberg Barclays Global Aggregate Bond Index | 5.54 | 4.59 | 11,353 |
 | FTSE Developed Net Tax Index | 17.41 | 8.84 | 12,706 |
Global Wellesley Income Composite Index: Weighted 65% Bloomberg Barclays Fixed Income Composite Index (composed of 80% Bloomberg Barclays Global Aggregate Credit Index (USD Hedged), 10% Bloomberg Barclays Global Aggregate Treasury Index (USD Hedged), and 10% Bloomberg Barclays Global Aggregate Securitized Index (USD Hedged)), and 35% FTSE Developed High Dividend Yield Index (net of tax).
"Since Inception" performance is calculated from the Investor Shares’ inception date for both the fund and its comparative standards.
See Financial Highlights for dividend and capital gains information.
Global Wellesley Income Fund
| | Average Annual Total Returns | |
| | Periods Ended August 31, 2020 | |
| | | Since | Final Value |
| | One | Inception | of a $50,000 |
| | Year | (11/2/2017) | Investment |
| Global Wellesley Income Fund Admiral Shares | 3.79% | 3.64% | $55,326 |
| Global Wellesley Income Composite Index | 3.69 | 3.95 | 55,795 |
| Bloomberg Barclays Global Aggregate Bond Index | 5.54 | 4.59 | 56,766 |
| FTSE Developed Net Tax Index | 17.41 | 8.84 | 63,531 |
"Since Inception" performance is calculated from the Admiral Shares’ inception date for both the fund and its comparative standards.
Global Wellesley Income Fund
Fund Allocation
As of August 31, 2020
| Australia | 1.6% |
| Canada | 5.6 |
| Cayman Islands | 1.5 |
| China | 1.6 |
| France | 7.3 |
| Germany | 3.3 |
| Hong Kong | 1.2 |
| Japan | 4.5 |
| Netherlands | 1.5 |
| Norway | 1.2 |
| Spain | 1.5 |
| Switzerland | 2.8 |
| Taiwan | 1.3 |
| United Kingdom | 7.1 |
| United States | 52.5 |
| Other | 5.5 |
The table reflects the fund’s investments, except for short-term investments and derivatives.
Global Wellesley Income Fund
Financial Statements
Schedule of Investments
As of August 31, 2020
The fund files its complete schedule of portfolio holdings with the Securities and Exchange Commission (SEC) for the first and third quarters of each fiscal year as an exhibit to its reports on Form N-PORT. The fund’s Form N-PORT reports are available on the SEC’s website at www.sec.gov.
| | | | | Face | Market |
| | | | Maturity | Amount | Value• |
| | | Coupon | Date | ($000) | ($000) |
| U.S. Government and Agency Obligations (6.2%) | | | |
| United States (6.2%) | | | | |
| 1,2 | Fannie Mae Pool | 3.070% | 2/1/25 | 125 | 136 |
| 1,2 | Fannie Mae Pool | 2.780% | 6/1/26 | 275 | 302 |
| 1,2 | Fannie Mae REMICS | 2.000% | 9/25/40 | 142 | 146 |
| 1,2 | Fannie Mae REMICS | 3.500% | 6/25/44–6/25/59 | 1,670 | 1,778 |
| 1,2 | Fannie Mae REMICS | 2.500% | 5/25/45–3/25/53 | 900 | 943 |
| 1,2 | Fannie Mae REMICS | 3.000% | 2/25/49 | 149 | 155 |
| 1,2 | Freddie Mac REMICS | 4.000% | 12/15/39–8/15/40 | 1,254 | 1,396 |
| 1,2 | Freddie Mac REMICS | 3.500% | 9/15/40–11/15/40 | 350 | 360 |
| 1,2 | Freddie Mac REMICS | 1.750% | 9/15/42 | 1,181 | 1,214 |
| 1 | Ginnie Mae II Pool | 3.000% | 7/20/50 | 3,292 | 3,472 |
| 1 | Ginnie Mae REMICS | 2.750% | 9/20/44 | 235 | 241 |
| ¤,1,2 | UMBS Pool | 2.000% | 9/1/35 | 3,525 | 3,668 |
| ¤,1,2 | UMBS Pool | 2.500% | 9/1/50 | 4,000 | 4,210 |
| | United States Treasury Note/Bond | 1.125% | 2/28/25 | 1,135 | 1,180 |
| | United States Treasury Note/Bond | 0.250% | 5/31/25 | 225 | 225 |
| | United States Treasury Note/Bond | 0.250% | 7/31/25 | 1,315 | 1,314 |
| | United States Treasury Note/Bond | 0.250% | 8/31/25 | 2,855 | 2,852 |
| | United States Treasury Note/Bond | 1.500% | 2/15/30 | 275 | 296 |
| | United States Treasury Note/Bond | 0.625% | 5/15/30 | 1,480 | 1,470 |
| 3 | United States Treasury Note/Bond | 2.875% | 5/15/49 | 370 | 493 |
| 4 | United States Treasury Note/Bond | 2.000% | 2/15/50 | 2,287 | 2,573 |
| 3 | United States Treasury Note/Bond | 1.250% | 5/15/50 | 703 | 662 |
| Total U.S. Government and Agency Obligations (Cost $28,699) | | 29,086 |
| Asset-Backed/Commercial Mortgage-Backed Securities (2.9%) | | |
| Bermuda (0.0%) | | | | |
| 1,5 | START Ireland | 4.089% | 3/15/44 | 165 | 150 |
| | | | | | |
| Canada (0.3%) | | | | |
| 1,5 | Chesapeake Funding II LLC 2018-2A | 3.230% | 8/15/30 | 448 | 456 |
| 5,6 | Ford Auto Securitization Trust | 2.354% | 6/15/23 | 1,541 | 1,187 |
| | | | | | 1,643 |
| Cayman Islands (1.5%) | | | | |
| 1,5,7 | Atlas Senior Loan Fund V Ltd., 3M USD LIBOR + 1.260% | 1.531% | 7/16/29 | 890 | 884 |
| 1,5,7 | KKR CLO 16 Ltd., 3M USD LIBOR + 1.250% | 1.522% | 1/20/29 | 435 | 429 |
| 1,5,7 | KKR CLO 17 Ltd., 3M USD LIBOR + 1.340% | 1.615% | 4/15/29 | 875 | 874 |
| 1,5,7 | Madison Park Funding XVIII Ltd., 3M USD LIBOR + 1.190% | 1.461% | 10/21/30 | 875 | 869 |
Global Wellesley Income Fund
| | | | | Face | Market |
| | | | Maturity | Amount | Value• |
| | | Coupon | Date | ($000) | ($000) |
| 1,5,7 | Madison Park Funding XXX Ltd., 3M USD LIBOR + 0.750% | 1.025% | 4/15/29 | 1,570 | 1,535 |
| 1,5,7 | Magnetite VII Ltd., 3M USD LIBOR + 0.800% | 1.075% | 1/15/28 | 1,510 | 1,495 |
| 1,5,7 | Race Point IX CLO Ltd., 3M USD LIBOR + 1.210% | 1.485% | 10/15/30 | 865 | 858 |
| | | | | | 6,944 |
| United States (1.1%) | | | | |
| 1,5 | Angel Oak Mortgage Trust I LLC 2018-3 | 3.649% | 9/25/48 | 311 | 311 |
| 1,5 | ARI Fleet Lease Trust 2018-A | 2.550% | 10/15/26 | 42 | 42 |
| 1,5 | Castlelake Aircraft Securitization Trust 2019-1 | 3.967% | 4/15/39 | 218 | 197 |
| 1,5 | CF Hippolyta LLC | 1.690% | 7/15/60 | 558 | 566 |
| 1,5 | Chesapeake Funding II LLC 2017-2A | 1.990% | 5/15/29 | 100 | 100 |
| 1,5 | COLT 2018-3 Mortgage Loan Trust | 3.692% | 10/26/48 | 78 | 79 |
| 1,5 | DB Master Finance LLC | 3.787% | 5/20/49 | 129 | 134 |
| 1,5 | DB Master Finance LLC | 4.021% | 5/20/49 | 114 | 121 |
| 1,5 | Deephaven Residential Mortgage Trust 2018-1 | 2.976% | 12/25/57 | 117 | 117 |
| 1,5 | Enterprise Fleet Financing LLC Series 2018-1 | 2.870% | 10/20/23 | 201 | 201 |
| 1,5 | First Investors Auto Owner Trust | 2.410% | 12/15/22 | 13 | 13 |
| 1 | Ford Credit Floorplan Master Owner Trust 2019-A | 2.440% | 9/15/26 | 210 | 224 |
| 1,2 | Freddie Mac Multifamily Structured Pass Through Certificates | 2.282% | 7/25/26 | 235 | 254 |
| 1,5 | GreatAmerica Leasing Receivables Funding LLC Series 2018-1 | 2.600% | 6/15/21 | 60 | 60 |
| 1,5 | GreatAmerica Leasing Receivables Funding LLC Series 2018-1 | 2.830% | 6/17/24 | 183 | 186 |
| 1,5 | MMAF Equipment Finance LLC 2017-B | 2.210% | 10/17/22 | 84 | 84 |
| 1,2 | Seasoned Credit Risk Transfer Trust Series 2018-4 | 3.500% | 3/25/58 | 217 | 233 |
| 1,2 | Seasoned Credit Risk Transfer Trust Series 2019-1 | 3.500% | 7/25/58 | 222 | 240 |
| 1,2 | Seasoned Credit Risk Transfer Trust Series 2019-3 | 3.500% | 10/25/58 | 340 | 368 |
| 1,5 | SoFi Consumer Loan Program 2019-3 Trust | 2.900% | 5/25/28 | 582 | 589 |
| 1,5 | Towd Point Mortgage Trust 2018-1 | 3.000% | 1/25/58 | 226 | 233 |
| 1,5 | Vantage Data Centers LLC 2018-1A | 4.072% | 2/16/43 | 322 | 330 |
| 1,5 | Vantage Data Centers LLC 2019-1A | 3.188% | 7/15/44 | 139 | 141 |
| 1,5 | Verus Securitization Trust 2019-2 | 3.211% | 5/25/59 | 215 | 219 |
| | | | | | 5,042 |
| Total Asset-Backed/Commercial Mortgage-Backed Securities (Cost $13,763) | | 13,779 |
| Corporate Bonds (41.7%) | | | | |
| Australia (0.6%) | | | | |
| 1,5 | Macquarie Group Ltd. | 4.150% | 3/27/24 | 1,125 | 1,209 |
| 5 | National Australia Bank Ltd. | 2.332% | 8/21/30 | 250 | 251 |
| 1,5 | National Australia Bank Ltd. | 3.933% | 8/2/34 | 850 | 945 |
| 5 | Scentre Group Trust 1 / Scentre Group Trust 2 | 3.625% | 1/28/26 | 380 | 406 |
| | | | | | 2,811 |
| Belgium (0.8%) | | | | |
| | Anheuser-Busch Cos. LLC / Anheuser-Busch InBev Worldwide Inc. | 4.900% | 2/1/46 | 700 | 862 |
| 8 | Anheuser-Busch InBev SA | 1.750% | 3/7/25 | 325 | 451 |
| 9 | Anheuser-Busch InBev SA | 2.000% | 3/17/28 | 500 | 660 |
Global Wellesley Income Fund
| | | | | Face | Market |
| | | | Maturity | Amount | Value• |
| | | Coupon | Date | ($000) | ($000) |
| 9 | Anheuser-Busch InBev SA | 2.875% | 4/2/32 | 450 | 637 |
| | Anheuser-Busch InBev Worldwide Inc. | 4.375% | 4/15/38 | 480 | 551 |
| | Anheuser-Busch InBev Worldwide Inc. | 4.600% | 4/15/48 | 300 | 355 |
| | | | | | 3,516 |
| Canada (1.2%) | | | | |
| | Bank of Nova Scotia | 2.700% | 8/3/26 | 990 | 1,096 |
| 6 | Bell Canada Inc. | 3.350% | 3/22/23 | 950 | 769 |
| | Fortis Inc. | 3.055% | 10/4/26 | 625 | 682 |
| | Nutrien Ltd. | 4.125% | 3/15/35 | 750 | 861 |
| 6 | Royal Bank of Canada | 2.949% | 5/1/23 | 1,825 | 1,482 |
| | TransCanada PipeLines Ltd. | 4.875% | 1/15/26 | 475 | 564 |
| | | | | | 5,454 |
| Chile (0.2%) | | | | |
| 5 | Banco Santander Chile | 2.700% | 1/10/25 | 1,050 | 1,108 |
| | | | | | |
| China (0.4%) | | | | |
| | Alibaba Group Holding Ltd. | 3.400% | 12/6/27 | 690 | 777 |
| 5 | Tencent Holdings Ltd. | 3.595% | 1/19/28 | 690 | 765 |
| 5 | Tencent Holdings Ltd. | 3.975% | 4/11/29 | 405 | 466 |
| | | | | | 2,008 |
| Denmark (0.4%) | | | | |
| 1,9 | Danske Bank A/S | 0.500% | 8/27/25 | 1,650 | 1,957 |
| | | | | | |
| France (3.8%) | | | | |
| 9 | Airbus SE | 2.375% | 4/7/32 | 1,225 | 1,591 |
| 1,9 | AXA SA | 5.125% | 7/4/43 | 750 | 1,003 |
| 9 | BNP Paribas SA | 1.500% | 11/17/25 | 800 | 1,009 |
| 1,5 | BNP Paribas SA | 2.819% | 11/19/25 | 360 | 383 |
| 1,5 | BNP Paribas SA | 2.219% | 6/9/26 | 770 | 804 |
| 9 | BNP Paribas SA | 0.125% | 9/4/26 | 400 | 466 |
| 9 | BPCE SA | 1.125% | 1/18/23 | 900 | 1,097 |
| 5 | BPCE SA | 3.250% | 1/11/28 | 500 | 552 |
| 9 | Cie de Saint-Gobain | 2.375% | 10/4/27 | 700 | 939 |
| 9 | Credit Mutuel Arkea SA | 1.625% | 4/15/26 | 1,100 | 1,392 |
| 5 | Danone SA | 2.947% | 11/2/26 | 285 | 315 |
| 9 | Engie SA | 0.000% | 3/4/27 | 1,000 | 1,182 |
| 9 | Engie SA | 1.750% | 3/27/28 | 600 | 794 |
| 9 | Orange SA | 1.000% | 5/12/25 | 1,200 | 1,492 |
| 9 | Orange SA | 2.000% | 1/15/29 | 300 | 407 |
| 9 | Orange SA | 0.500% | 9/4/32 | 700 | 818 |
| 9 | RCI Banque SA | 0.750% | 9/26/22 | 625 | 739 |
| 9 | RCI Banque SA | 1.375% | 3/8/24 | 575 | 688 |
| 9 | Veolia Environnement SA | 1.590% | 1/10/28 | 400 | 520 |
| 9 | Veolia Environnement SA | 1.940% | 1/7/30 | 700 | 936 |
| 5 | WEA Finance LLC | 4.125% | 9/20/28 | 605 | 620 |
| 5 | WEA Finance LLC | 4.625% | 9/20/48 | 210 | 204 |
| | | | | | 17,951 |
| Germany (2.0%) | | | | |
| 5 | Bayer US Finance II LLC | 4.250% | 12/15/25 | 660 | 758 |
| 5 | Bayer US Finance LLC | 3.375% | 10/8/24 | 765 | 834 |
| 8 | Deutsche Telekom AG | 3.125% | 2/6/34 | 500 | 775 |
| 8 | E.ON International Finance BV | 5.875% | 10/30/37 | 200 | 416 |
| 9 | E.ON SE | 1.625% | 5/22/29 | 550 | 722 |
Global Wellesley Income Fund
| | | | | Face | Market |
| | | | Maturity | Amount | Value• |
| | | Coupon | Date | ($000) | ($000) |
| 8 | innogy Finance BV | 4.750% | 1/31/34 | 400 | 712 |
| 5 | Volkswagen Group of America Finance LLC | 3.350% | 5/13/25 | 200 | 220 |
| 9 | Volkswagen Leasing GmbH | 2.625% | 1/15/24 | 525 | 666 |
| 9 | Volkswagen Leasing GmbH | 1.375% | 1/20/25 | 1,825 | 2,219 |
| 9 | Wintershall Dea Finance BV | 0.840% | 9/25/25 | 1,900 | 2,210 |
| | | | | | 9,532 |
| Hong Kong (0.1%) | | | | |
| 5 | AIA Group Ltd. | 3.375% | 4/7/30 | 200 | 224 |
| | | | | | |
| Ireland (0.5%) | | | | |
| 9 | CRH Finance DAC | 3.125% | 4/3/23 | 1,177 | 1,514 |
| 9 | CRH SMW Finance DAC | 1.250% | 11/5/26 | 800 | 1,001 |
| | | | | | 2,515 |
| Japan (0.5%) | | | | |
| 9 | Takeda Pharmaceutical Co. Ltd. | 1.375% | 7/9/32 | 575 | 709 |
| | Takeda Pharmaceutical Co. Ltd. | 3.025% | 7/9/40 | 200 | 207 |
| 10 | Toyota Finance Australia Ltd. | 2.500% | 12/7/20 | 2,075 | 1,538 |
| | | | | | 2,454 |
| Mexico (0.1%) | | | | |
| 5 | Infraestructura Energetica Nova SAB de CV | 4.875% | 1/14/48 | 585 | 587 |
| | | | | | |
| Netherlands (0.7%) | | | | |
| 9 | ABN AMRO Bank NV | 2.500% | 11/29/23 | 1,025 | 1,325 |
| 8 | Cooperatieve Rabobank UA | 4.625% | 5/23/29 | 200 | 330 |
| 9 | Heineken NV | 1.500% | 10/3/29 | 950 | 1,249 |
| | Shell International Finance BV | 4.000% | 5/10/46 | 275 | 326 |
| | | | | | 3,230 |
| Norway (0.2%) | | | | |
| 5 | Aker BP ASA | 3.750% | 1/15/30 | 700 | 694 |
| | | | | | |
| South Korea (0.0%) | | | | |
| 5 | SK Telecom Co. Ltd. | 3.750% | 4/16/23 | 200 | 215 |
| | | | | | |
| Spain (0.8%) | | | | |
| 9 | Abertis Infraestructuras SA | 1.125% | 3/26/28 | 1,100 | 1,260 |
| 9 | Iberdrola Finanzas SA | 1.250% | 10/28/26 | 1,000 | 1,272 |
| | Telefonica Emisiones SAU | 4.665% | 3/6/38 | 845 | 978 |
| | | | | | 3,510 |
| Switzerland (0.5%) | | | | |
| 5 | Alcon Finance Corp. | 3.000% | 9/23/29 | 1,005 | 1,086 |
| 1,9 | Credit Suisse Group AG | 1.250% | 7/17/25 | 600 | 738 |
| 1,5 | Credit Suisse Group AG | 2.593% | 9/11/25 | 410 | 428 |
| | | | | | 2,252 |
| United Kingdom (3.6%) | | | | |
| | AstraZeneca plc | 4.000% | 1/17/29 | 720 | 858 |
| 5 | BAE Systems plc | 3.400% | 4/15/30 | 200 | 225 |
| 1 | Barclays plc | 3.932% | 5/7/25 | 785 | 851 |
| | BAT Capital Corp. | 3.557% | 8/15/27 | 1,210 | 1,316 |
| 6 | BP Capital Markets plc | 3.470% | 5/15/25 | 1,325 | 1,105 |
| 5 | CK Hutchison International 17 II Ltd. | 2.750% | 3/29/23 | 975 | 1,014 |
| 8 | CPUK Finance Ltd. | 3.588% | 8/28/25 | 1,200 | 1,625 |
| 9 | FCE Bank plc | 0.869% | 9/13/21 | 500 | 585 |
Global Wellesley Income Fund
| | | | | Face | Market |
| | | | Maturity | Amount | Value• |
| | | Coupon | Date | ($000) | ($000) |
| 1,8 | HSBC Holdings plc | 2.256% | 11/13/26 | 550 | 759 |
| 1 | HSBC Holdings plc | 2.357% | 8/18/31 | 600 | 609 |
| 7 | HSBC Holdings plc, 3M USD LIBOR + 1.000% | 1.270% | 5/18/24 | 255 | 255 |
| 9 | Imperial Brands Finance plc | 2.250% | 2/26/21 | 2,525 | 3,029 |
| | Prudential plc | 3.125% | 4/14/30 | 430 | 476 |
| 5 | Sky plc | 3.125% | 11/26/22 | 825 | 872 |
| 1,5 | Standard Chartered plc | 2.744% | 9/10/22 | 905 | 916 |
| 9 | Vodafone Group plc | 1.625% | 11/24/30 | 1,825 | 2,383 |
| | | | | | 16,878 |
| United States (25.3%) | | | | |
| 5 | AbbVie Inc. | 3.800% | 3/15/25 | 550 | 614 |
| 5 | AbbVie Inc. | 4.050% | 11/21/39 | 210 | 246 |
| 5 | AbbVie Inc. | 4.750% | 3/15/45 | 275 | 341 |
| | Alabama Power Co. | 4.300% | 7/15/48 | 275 | 348 |
| | Allstate Corp. | 3.850% | 8/10/49 | 390 | 470 |
| 9 | Altria Group Inc. | 2.200% | 6/15/27 | 385 | 495 |
| | Amazon.com Inc. | 4.800% | 12/5/34 | 150 | 205 |
| 9 | American International Group Inc. | 1.500% | 6/8/23 | 875 | 1,079 |
| | American International Group Inc. | 4.250% | 3/15/29 | 650 | 758 |
| | American Tower Corp. | 5.000% | 2/15/24 | 200 | 228 |
| | American Tower Corp. | 4.400% | 2/15/26 | 325 | 376 |
| | Amgen Inc. | 4.663% | 6/15/51 | 350 | 462 |
| | Anthem Inc. | 3.500% | 8/15/24 | 325 | 357 |
| 9 | AT&T Inc. | 1.600% | 5/19/28 | 600 | 758 |
| 9 | AT&T Inc. | 2.050% | 5/19/32 | 700 | 905 |
| 9 | AT&T Inc. | 2.450% | 3/15/35 | 380 | 501 |
| 9 | AT&T Inc. | 3.150% | 9/4/36 | 250 | 351 |
| | AT&T Inc. | 4.900% | 8/15/37 | 200 | 246 |
| | AutoZone Inc. | 3.125% | 4/21/26 | 425 | 468 |
| | Bank of America Corp. | 3.300% | 1/11/23 | 700 | 745 |
| 1 | Bank of America Corp. | 3.593% | 7/21/28 | 1,550 | 1,753 |
| 1 | Bank of America Corp. | 4.271% | 7/23/29 | 980 | 1,157 |
| 1 | Bank of America Corp. | 2.496% | 2/13/31 | 300 | 315 |
| | Boeing Co. | 3.250% | 3/1/28 | 567 | 564 |
| | Boeing Co. | 3.450% | 11/1/28 | 175 | 175 |
| | Boeing Co. | 3.375% | 6/15/46 | 130 | 109 |
| 5 | Boston Gas Co. | 3.001% | 8/1/29 | 105 | 117 |
| | Boston Scientific Corp. | 4.000% | 3/1/29 | 55 | 64 |
| | Boston Scientific Corp. | 4.550% | 3/1/39 | 550 | 681 |
| | Brandywine Operating Partnership LP | 3.950% | 11/15/27 | 800 | 830 |
| | Broadcom Corp. / Broadcom Cayman Finance Ltd. | 3.875% | 1/15/27 | 400 | 443 |
| | Broadcom Inc. | 4.700% | 4/15/25 | 1,190 | 1,360 |
| | Broadcom Inc. | 4.250% | 4/15/26 | 60 | 68 |
| | Broadcom Inc. | 4.110% | 9/15/28 | 894 | 995 |
| | Broadcom Inc. | 4.150% | 11/15/30 | 170 | 190 |
| 5 | Brooklyn Union Gas Co. | 4.273% | 3/15/48 | 760 | 957 |
| 5 | Cargill Inc. | 4.760% | 11/23/45 | 275 | 356 |
| | Charles Schwab Corp. | 4.625% | 3/22/30 | 590 | 751 |
| | Charter Communications Operating LLC / Charter Communications Operating Capital | 5.050% | 3/30/29 | 435 | 526 |
| | Charter Communications Operating LLC / Charter Communications Operating Capital | 6.384% | 10/23/35 | 305 | 417 |
Global Wellesley Income Fund
| | | | | Face | Market |
| | | | Maturity | Amount | Value• |
| | | Coupon | Date | ($000) | ($000) |
| | Charter Communications Operating LLC /Charter Communications Operating Capital | 3.700% | 4/1/51 | 110 | 109 |
| 9 | Chubb INA Holdings Inc. | 0.875% | 6/15/27 | 1,010 | 1,237 |
| 9 | Chubb INA Holdings Inc. | 1.400% | 6/15/31 | 1,125 | 1,431 |
| | Cigna Corp. | 4.375% | 10/15/28 | 435 | 520 |
| | Cigna Corp. | 2.400% | 3/15/30 | 220 | 230 |
| | Cimarex Energy Co. | 4.375% | 6/1/24 | 859 | 922 |
| 8 | Citigroup Inc. | 1.750% | 10/23/26 | 375 | 516 |
| 1 | Citigroup Inc. | 3.520% | 10/27/28 | 1,105 | 1,233 |
| | Cleco Corporate Holdings LLC | 3.743% | 5/1/26 | 1,140 | 1,212 |
| | Cleco Corporate Holdings LLC | 3.375% | 9/15/29 | 270 | 275 |
| | Cleco Corporate Holdings LLC | 4.973% | 5/1/46 | 395 | 438 |
| | Comcast Corp. | 3.950% | 10/15/25 | 255 | 294 |
| 8 | Comcast Corp. | 1.500% | 2/20/29 | 465 | 635 |
| | Comcast Corp. | 6.500% | 11/15/35 | 775 | 1,181 |
| | Comcast Corp. | 4.000% | 3/1/48 | 20 | 24 |
| | Comcast Corp. | 4.049% | 11/1/52 | 10 | 12 |
| | Comcast Corp. | 2.650% | 8/15/62 | 285 | 270 |
| | CommonSpirit Health | 4.200% | 8/1/23 | 895 | 970 |
| | CommonSpirit Health | 3.347% | 10/1/29 | 145 | 153 |
| | CommonSpirit Health | 4.187% | 10/1/49 | 175 | 185 |
| | Constellation Brands Inc. | 2.875% | 5/1/30 | 90 | 97 |
| | Cottage Health Obligated Group | 3.304% | 11/1/49 | 215 | 236 |
| 5 | Cox Communications Inc. | 4.600% | 8/15/47 | 650 | 811 |
| | CSX Corp. | 4.300% | 3/1/48 | 405 | 509 |
| | CVS Health Corp. | 4.100% | 3/25/25 | 329 | 374 |
| | CVS Health Corp. | 2.875% | 6/1/26 | 1,000 | 1,087 |
| | CVS Health Corp. | 4.300% | 3/25/28 | 435 | 509 |
| 9 | Danaher Corp. | 2.100% | 9/30/26 | 1,225 | 1,612 |
| | Dignity Health | 3.812% | 11/1/24 | 659 | 687 |
| | Dignity Health | 4.500% | 11/1/42 | 202 | 215 |
| | Discover Bank | 4.200% | 8/8/23 | 700 | 771 |
| | Discovery Communications LLC | 3.625% | 5/15/30 | 565 | 622 |
| | Dominion Energy Gas Holdings LLC | 4.600% | 12/15/44 | 625 | 771 |
| | Dominion Energy Inc. | 2.715% | 8/15/21 | 125 | 128 |
| | Dominion Energy South Carolina Inc. | 6.625% | 2/1/32 | 156 | 224 |
| | Dominion Energy South Carolina Inc. | 5.300% | 5/15/33 | 129 | 172 |
| | Dominion Energy South Carolina Inc. | 5.450% | 2/1/41 | 250 | 347 |
| | Dominion Energy South Carolina Inc. | 4.600% | 6/15/43 | 280 | 366 |
| | Duke Energy Progress LLC | 4.200% | 8/15/45 | 350 | 436 |
| | Energy Transfer Operating LP | 4.900% | 3/15/35 | 975 | 970 |
| | Energy Transfer Operating LP | 5.000% | 5/15/50 | 60 | 58 |
| 5 | Equitable Financial Life Global Funding | 1.400% | 7/7/25 | 100 | 103 |
| 5 | Equitable Financial Life Global Funding | 1.400% | 8/27/27 | 530 | 530 |
| 5 | ERAC USA Finance LLC | 3.300% | 12/1/26 | 235 | 255 |
| 5 | ERAC USA Finance LLC | 4.500% | 2/15/45 | 720 | 800 |
| | Evergy Inc. | 2.900% | 9/15/29 | 480 | 519 |
| | Evergy Metro Inc. | 2.250% | 6/1/30 | 180 | 191 |
| | Exxon Mobil Corp. | 2.275% | 8/16/26 | 865 | 935 |
| | FedEx Corp. | 4.100% | 2/1/45 | 65 | 73 |
| | FedEx Corp. | 4.750% | 11/15/45 | 187 | 227 |
| | FedEx Corp. | 4.550% | 4/1/46 | 95 | 112 |
| | FedEx Corp. | 4.050% | 2/15/48 | 28 | 31 |
| | FedEx Corp. | 4.950% | 10/17/48 | 175 | 218 |
Global Wellesley Income Fund
| | | | | Face | Market |
| | | | Maturity | Amount | Value• |
| | | Coupon | Date | ($000) | ($000) |
| 9 | Fidelity National Information Services Inc. | 1.500% | 5/21/27 | 1,405 | 1,787 |
| 9 | Fidelity National Information Services Inc. | 2.000% | 5/21/30 | 645 | 850 |
| | Fiserv Inc. | 3.200% | 7/1/26 | 320 | 358 |
| 8 | Fiserv Inc. | 3.000% | 7/1/31 | 525 | 788 |
| 8 | Ford Motor Credit Co. LLC | 4.535% | 3/6/25 | 575 | 766 |
| | Fox Corp. | 4.030% | 1/25/24 | 145 | 160 |
| 9 | General Mills Inc. | 0.450% | 1/15/26 | 900 | 1,080 |
| | General Motors Co. | 4.200% | 10/1/27 | 550 | 586 |
| | General Motors Co. | 5.000% | 10/1/28 | 1,095 | 1,220 |
| | General Motors Financial Co. Inc. | 3.450% | 4/10/22 | 1,535 | 1,577 |
| | Georgia Power Co. | 4.300% | 3/15/42 | 500 | 583 |
| | Georgia Power Co. | 3.700% | 1/30/50 | 35 | 39 |
| 1 | Goldman Sachs Group Inc. | 3.272% | 9/29/25 | 1,425 | 1,551 |
| 1 | Goldman Sachs Group Inc. | 3.814% | 4/23/29 | 235 | 269 |
| 1 | Goldman Sachs Group Inc. | 4.223% | 5/1/29 | 285 | 333 |
| | Healthpeak Properties Inc. | 4.000% | 6/1/25 | 475 | 534 |
| | Healthpeak Properties Inc. | 3.000% | 1/15/30 | 315 | 338 |
| | Hess Corp. | 7.300% | 8/15/31 | 515 | 629 |
| | Intercontinental Exchange Inc. | 3.000% | 9/15/60 | 435 | 449 |
| | International Business Machines Corp. | 3.300% | 5/15/26 | 500 | 568 |
| | International Business Machines Corp. | 1.950% | 5/15/30 | 570 | 589 |
| | International Business Machines Corp. | 4.250% | 5/15/49 | 315 | 397 |
| | International Paper Co. | 4.350% | 8/15/48 | 475 | 568 |
| 5 | ITC Holdings Corp. | 2.950% | 5/14/30 | 690 | 747 |
| | John Deere Capital Corp. | 3.450% | 3/13/25 | 830 | 933 |
| 9 | JPMorgan Chase & Co. | 3.875% | 9/23/20 | 1,400 | 1,674 |
| 1 | JPMorgan Chase & Co. | 3.782% | 2/1/28 | 1,200 | 1,367 |
| 1 | JPMorgan Chase & Co. | 3.964% | 11/15/48 | 850 | 1,036 |
| | Kaiser Foundation Hospitals | 4.875% | 4/1/42 | 55 | 75 |
| 5 | KeySpan Gas East Corp. | 2.742% | 8/15/26 | 500 | 546 |
| | Lowe’s Cos. Inc. | 4.550% | 4/5/49 | 440 | 556 |
| | Marathon Oil Corp. | 6.600% | 10/1/37 | 830 | 892 |
| | Marsh & McLennan Cos. Inc. | 4.375% | 3/15/29 | 705 | 855 |
| 5 | Massachusetts Mutual Life Insurance Co. | 3.375% | 4/15/50 | 140 | 144 |
| | McCormick & Co. Inc. | 2.500% | 4/15/30 | 140 | 150 |
| | McDonald’s Corp. | 4.450% | 9/1/48 | 250 | 310 |
| | McDonald’s Corp. | 3.625% | 9/1/49 | 40 | 45 |
| 9 | Medtronic Global Holdings SCA | 1.125% | 3/7/27 | 1,275 | 1,608 |
| 9 | Medtronic Global Holdings SCA | 1.625% | 3/7/31 | 360 | 480 |
| | Memorial Sloan-Kettering Cancer Center | 2.955% | 1/1/50 | 195 | 211 |
| | Merck & Co. Inc. | 3.400% | 3/7/29 | 500 | 583 |
| | Mercy Health | 3.555% | 8/1/27 | 535 | 576 |
| 5 | Metropolitan Life Global Funding I | 3.000% | 9/19/27 | 700 | 773 |
| | Microsoft Corp. | 3.700% | 8/8/46 | 650 | 810 |
| 5 | Mid-Atlantic Interstate Transmission LLC | 4.100% | 5/15/28 | 778 | 880 |
| 6 | Molson Coors International LP | 2.840% | 7/15/23 | 1,825 | 1,441 |
| | Morgan Stanley | 3.125% | 7/27/26 | 2,100 | 2,343 |
| 1 | Morgan Stanley | 3.772% | 1/24/29 | 175 | 201 |
| | MPLX LP | 3.500% | 12/1/22 | 1,325 | 1,388 |
| | National Retail Properties Inc. | 3.900% | 6/15/24 | 400 | 435 |
| | NextEra Energy Capital Holdings Inc. | 3.250% | 4/1/26 | 90 | 102 |
| | NextEra Energy Capital Holdings Inc. | 3.500% | 4/1/29 | 140 | 160 |
| | NextEra Energy Capital Holdings Inc. | 2.750% | 11/1/29 | 255 | 278 |
| | NextEra Energy Capital Holdings Inc. | 2.250% | 6/1/30 | 435 | 456 |
| Global Wellesley Income Fund | | | | |
| | | | | Face | Market |
| | | | Maturity | Amount | Value• |
| | | Coupon | Date | ($000) | ($000) |
| 5 | Niagara Mohawk Power Corp. | 1.960% | 6/27/30 | 670 | 691 |
| | Norfolk Southern Corp. | 2.550% | 11/1/29 | 915 | 1,000 |
| 5 | Northwestern Mutual Life Insurance Co. | 3.850% | 9/30/47 | 280 | 312 |
| 5 | Northwestern Mutual Life Insurance Co. | 3.625% | 9/30/59 | 12 | 13 |
| 1,5 | Oglethorpe Power Corp. | 6.191% | 1/1/31 | 285 | 355 |
| | Oglethorpe Power Corp. | 4.550% | 6/1/44 | 20 | 21 |
| | Oglethorpe Power Corp. | 4.250% | 4/1/46 | 81 | 89 |
| 5 | Oglethorpe Power Corp. | 3.750% | 8/1/50 | 260 | 261 |
| | Oglethorpe Power Corp. | 5.250% | 9/1/50 | 250 | 293 |
| | Oracle Corp. | 4.000% | 11/15/47 | 265 | 311 |
| | Oracle Corp. | 3.600% | 4/1/50 | 260 | 290 |
| 5 | Otis Worldwide Corp. | 2.565% | 2/15/30 | 65 | 69 |
| 5 | Otis Worldwide Corp. | 3.112% | 2/15/40 | 140 | 150 |
| 5 | Otis Worldwide Corp. | 3.362% | 2/15/50 | 250 | 272 |
| | PacifiCorp | 2.700% | 9/15/30 | 160 | 177 |
| 5 | Penske Truck Leasing Co. LP / PTL Finance Corp. | 3.950% | 3/10/25 | 740 | 821 |
| 5 | Penske Truck Leasing Co. LP/ PTL Finance Corp. | 4.250% | 1/17/23 | 1,125 | 1,212 |
| 5 | Penske Truck Leasing Co. LP/ PTL Finance Corp. | 2.700% | 11/1/24 | 180 | 190 |
| 5 | Penske Truck Leasing Co. LP/ PTL Finance Corp. | 4.000% | 7/15/25 | 140 | 157 |
| | Pfizer Inc. | 1.700% | 5/28/30 | 195 | 201 |
| 9 | Philip Morris International Inc. | 2.875% | 3/3/26 | 500 | 677 |
| | Phillips 66 Partners LP | 3.750% | 3/1/28 | 400 | 421 |
| | PNC Bank NA | 3.250% | 1/22/28 | 600 | 683 |
| 1 | Providence St. Joseph Health Obligated Group | 3.930% | 10/1/48 | 245 | 290 |
| | Raytheon Technologies Corp. | 3.950% | 8/16/25 | 310 | 354 |
| | Raytheon Technologies Corp. | 4.450% | 11/16/38 | 550 | 679 |
| 5 | Royalty Pharma plc | 3.300% | 9/2/40 | 210 | 205 |
| 5 | Royalty Pharma plc | 3.550% | 9/2/50 | 270 | 261 |
| | Santander Holdings USA Inc. | 3.700% | 3/28/22 | 1,700 | 1,766 |
| 5 | SBA Tower Trust | 3.448% | 3/15/23 | 755 | 790 |
| 5 | SBA Tower Trust | 1.884% | 1/15/26 | 110 | 111 |
| | Sempra Energy | 3.250% | 6/15/27 | 1,000 | 1,099 |
| | Sierra Pacific Power Co. | 2.600% | 5/1/26 | 180 | 196 |
| | Simon Property Group LP | 2.450% | 9/13/29 | 310 | 309 |
| | Southern California Edison Co. | 3.700% | 8/1/25 | 30 | 33 |
| 1,5 | Sprint Spectrum Co LLC / Sprint Spectrum Co II LLC / Sprint Spectrum Co III LLC | 4.738% | 3/20/25 | 1,100 | 1,195 |
| | SSM Health Care Corp. | 3.823% | 6/1/27 | 380 | 417 |
| | Starbucks Corp. | 4.500% | 11/15/48 | 335 | 408 |
| | Starbucks Corp. | 3.350% | 3/12/50 | 90 | 92 |
| | Sunoco Logistics Partners Operations LP | 5.350% | 5/15/45 | 175 | 167 |
| | Synchrony Bank | 3.000% | 6/15/22 | 550 | 566 |
| 5 | T-Mobile USA Inc. | 2.050% | 2/15/28 | 1,185 | 1,215 |
| 5 | Teachers Insurance & Annuity Assn. of America | 4.900% | 9/15/44 | 635 | 802 |
| | TJX Cos. Inc. | 3.875% | 4/15/30 | 405 | 479 |
| | Toledo Hospital | 5.325% | 11/15/28 | 410 | 449 |
| | Toledo Hospital | 5.750% | 11/15/38 | 155 | 184 |
| | Trinity Acquisition plc | 4.400% | 3/15/26 | 888 | 1,023 |
| | Truist Bank | 3.300% | 5/15/26 | 975 | 1,095 |
| Global Wellesley Income Fund | | | | |
| | | | | Face | Market |
| | | | Maturity | Amount | Value• |
| | | Coupon | Date | ($000) | ($000) |
| | Union Pacific Corp. | 3.700% | 3/1/29 | 190 | 222 |
| | Union Pacific Corp. | 3.750% | 2/5/70 | 265 | 299 |
| 1 | United Airlines 2018-1 Class B Pass Through Trust | 4.600% | 3/1/26 | 65 | 52 |
| | UnitedHealth Group Inc. | 3.850% | 6/15/28 | 415 | 488 |
| | UnitedHealth Group Inc. | 2.000% | 5/15/30 | 215 | 224 |
| | UnitedHealth Group Inc. | 4.625% | 7/15/35 | 90 | 119 |
| 5 | Upjohn Inc. | 3.850% | 6/22/40 | 385 | 417 |
| | VEREIT Operating Partnership LP | 3.400% | 1/15/28 | 365 | 378 |
| 9 | Verizon Communications Inc. | 1.250% | 4/8/30 | 750 | 945 |
| 8 | Verizon Communications Inc. | 3.375% | 10/27/36 | 300 | 493 |
| | Verizon Communications Inc. | 4.522% | 9/15/48 | 740 | 969 |
| | Verizon Communications Inc. | 5.012% | 8/21/54 | 250 | 360 |
| | VF Corp. | 2.800% | 4/23/27 | 145 | 157 |
| | VF Corp. | 2.950% | 4/23/30 | 875 | 948 |
| 6 | Wells Fargo & Co. | 2.975% | 5/19/26 | 600 | 487 |
| | Wells Fargo & Co. | 4.300% | 7/22/27 | 325 | 374 |
| | Wells Fargo & Co. | 4.750% | 12/7/46 | 700 | 885 |
| | Welltower Inc. | 4.000% | 6/1/25 | 325 | 365 |
| | Zimmer Biomet Holdings Inc. | 3.550% | 3/20/30 | 1,025 | 1,142 |
| | | | | | 118,873 |
| Total Corporate Bonds (Cost $180,118) | | | | 195,769 |
| Sovereign Bonds (6.7%) | | | | |
| Australia (1.0%) | | | | |
| 10 | Commonwealth of Australia | 2.750% | 11/21/27 | 160 | 134 |
| 10 | Commonwealth of Australia | 2.250% | 5/21/28 | 870 | 711 |
| 10 | Commonwealth of Australia | 2.500% | 5/21/30 | 4,430 | 3,726 |
| | | | | | 4,571 |
| Bermuda (0.0%) | | | | |
| 1,5 | Bermuda | 2.375% | 8/20/30 | 200 | 203 |
| | | | | | |
| Canada (0.8%) | | | | |
| 6 | City of Montreal | 3.500% | 12/1/38 | 910 | 832 |
| 6 | City of Toronto | 3.200% | 8/1/48 | 1,000 | 899 |
| 6 | Province of Ontario | 2.900% | 6/2/28 | 815 | 705 |
| 11 | Province of Ontario | 0.250% | 6/28/29 | 1,075 | 1,213 |
| | | | | | 3,649 |
| Chile (0.2%) | | | | |
| | Corp. Nacional del Cobre de Chile | 3.625% | 8/1/27 | 800 | 873 |
| | | | | | |
| China (0.2%) | | | | |
| 5 | State Grid Overseas Investment 2016 Ltd. | 2.750% | 5/4/22 | 1,110 | 1,142 |
| | | | | | |
| Colombia (0.2%) | | | | |
| 1 | Republic of Columbia | 4.000% | 2/26/24 | 1,045 | 1,114 |
| | | | | | |
| France (0.2%) | | | | |
| 9 | RTE Reseau de Transport d’Electricite SADIR | 1.875% | 10/23/37 | 500 | 706 |
| | | | | | |
| Hungary (0.2%) | | | | |
| 9 | Republic of Hungary | 1.625% | 4/28/32 | 775 | 979 |
| Global Wellesley Income Fund | | | | |
| | | | | Face | Market |
| | | | Maturity | Amount | Value• |
| | | Coupon | Date | ($000) | ($000) |
| Japan (1.3%) | | | | |
| 12 | Japan | 0.100% | 12/20/28 | 601,350 | 5,727 |
| 12 | Japan | 0.100% | 3/20/29 | 42,600 | 405 |
| 12 | Japan | 0.100% | 6/20/29 | 12,000 | 114 |
| | | | | | 6,246 |
| Norway (0.3%) | | | | |
| | Equinor ASA | 3.000% | 4/6/27 | 1,215 | 1,347 |
| | | | | | |
| Panama (0.1%) | | | | |
| 1,5 | Empresa de Transmision Electrica SA | 5.125% | 5/2/49 | 415 | 489 |
| | | | | | |
| Qatar (0.3%) | | | | |
| 5 | State of Qatar | 3.875% | 4/23/23 | 785 | 845 |
| 5 | State of Qatar | 5.103% | 4/23/48 | 285 | 405 |
| 5 | State of Qatar | 4.400% | 4/16/50 | 205 | 266 |
| | | | | | 1,516 |
| Romania (0.2%) | | | | |
| 9 | Republic of Romania | 2.500% | 2/8/30 | 850 | 1,025 |
| | | | | | |
| Saudi Arabia (0.4%) | | | | |
| 5 | Kingdom of Saudi Arabia | 2.875% | 3/4/23 | 955 | 994 |
| 5 | Saudi Arabian Oil Co. | 3.500% | 4/16/29 | 585 | 641 |
| | | | | | 1,635 |
| Spain (0.2%) | | | | |
| 5,9 | Kingdom of Spain | 0.600% | 10/31/29 | 775 | 951 |
| | | | | | |
| Switzerland (0.1%) | | | | |
| 5 | Syngenta Finance NV | 5.182% | 4/24/28 | 400 | 439 |
| | | | | | |
| United Arab Emirates (0.3%) | | | | |
| | Emirate of Abu Dhabi | 3.125% | 10/11/27 | 1,435 | 1,595 |
| | | | | | |
| United Kingdom (0.7%) | | | | |
| 8 | United Kingdom | 1.250% | 7/22/27 | 445 | 641 |
| 8 | United Kingdom | 3.500% | 1/22/45 | 1,240 | 2,609 |
| | | | | | 3,250 |
| Total Sovereign Bonds (Cost $29,316) | | | | 31,730 |
| Taxable Municipal Bonds (1.9%) | | | | |
| | Bay Area Toll Authority California Toll Bridge Revenue (San Francisco Bay Area) | 2.574% | 4/1/31 | 190 | 207 |
| | Broward County FL Airport System Revenue | 3.477% | 10/1/43 | 80 | 83 |
| | California State University Revenue | 2.897% | 11/1/51 | 250 | 249 |
| | Chicago IL Transit Authority Sales & Transfer Tax Receipts Revenue | 6.300% | 12/1/21 | 45 | 47 |
| | Chicago IL Transit Authority Sales & Transfer Tax Receipts Revenue | 6.899% | 12/1/40 | 40 | 57 |
| | Chicago IL Transit Authority Sales & Transfer Tax Receipts Revenue | 6.899% | 12/1/40 | 645 | 923 |
| | Dallas/Fort Worth International Airport Revenue | 3.089% | 11/1/40 | 60 | 60 |
| | Dallas/Fort Worth International Airport Revenue | 2.919% | 11/1/50 | 55 | 55 |
| Global Wellesley Income Fund | | | | |
| | | | | Face | Market |
| | | | Maturity | Amount | Value• |
| | | Coupon | Date | ($000) | ($000) |
| | Foothill-Eastern Transportation Corridor Agency CA Toll Road Revenue | 4.094% | 1/15/49 | 45 | 48 |
| 13 | Foothill-Eastern Transportation Corridor Agency CA Toll Road Revenue | 3.924% | 1/15/53 | 315 | 336 |
| | Georgia Municipal Electric Power Authority Revenue | 6.637% | 4/1/57 | 658 | 971 |
| | Georgia Municipal Electric Power Authority Revenue | 6.655% | 4/1/57 | 99 | 146 |
| | Grand Parkway Transportation Corp. Texas Revenue | 3.236% | 10/1/52 | 210 | 221 |
| | Illinois GO | 5.100% | 6/1/33 | 515 | 527 |
| 13 | Kansas Development Finance Authority Revenue | 5.371% | 5/1/26 | 755 | 863 |
| | Massachusetts School Building Authority Dedicated Sales Tax Revenue | 3.395% | 10/15/40 | 135 | 145 |
| | Metropolitan Transportation Authority New York Revenue | 6.200% | 11/15/26 | 15 | 17 |
| | Metropolitan Transportation Authority New York Revenue | 6.668% | 11/15/39 | 155 | 202 |
| | Metropolitan Transportation Authority New York Revenue | 5.175% | 11/15/49 | 315 | 365 |
| | New York State Dormitory Authority Revenue (Personal Income Tax) | 3.110% | 2/15/39 | 210 | 233 |
| | North Texas Tollway Authority System Revenue | 6.718% | 1/1/49 | 75 | 135 |
| 14 | Philadelphia PA Authority for Industrial Development Revenue | 6.550% | 10/15/28 | 525 | 679 |
| | Sales Tax Securitization Corp. Illinois Revenue | 4.787% | 1/1/48 | 545 | 676 |
| | South Carolina Public Service Authority Revenue | 2.388% | 12/1/23 | 770 | 798 |
| | State of Connecticut GO | 2.000% | 7/1/23 | 135 | 140 |
| | State of Connecticut GO | 5.770% | 3/15/25 | 250 | 299 |
| | University of California Revenue | 1.316% | 5/15/27 | 105 | 107 |
| | University of California Revenue | 1.614% | 5/15/30 | 180 | 183 |
| | University of Virginia Revenue | 2.256% | 9/1/50 | 95 | 93 |
| Total Taxable Municipal Bonds (Cost $8,091) | | | | 8,865 |
| | | | Shares | |
| Common Stocks (37.8%) | | | | |
| Canada (3.2%) | | | | |
| | TC Energy Corp. | | | 94,621 | 4,424 |
| | Bank of Nova Scotia | | | 91,920 | 3,973 |
| | Royal Bank of Canada | | | 45,696 | 3,480 |
| | Enbridge Inc. | | | 95,769 | 3,064 |
| | | | | | 14,941 |
| China (0.8%) | | | | |
| | ENN Energy Holdings Ltd. | | | 195,300 | 2,164 |
| | Guangdong Investment Ltd. | | | 1,138,000 | 1,774 |
| | | | | | 3,938 |
| Global Wellesley Income Fund | | |
| | | | Market |
| | | | Value• |
| | | Shares | ($000) |
| France (3.2%) | | |
| | TOTAL SE | 107,054 | 4,247 |
| | Axa SA | 197,901 | 4,038 |
| | Vinci SA | 37,441 | 3,508 |
| | Nexity SA | 90,732 | 3,115 |
| | | | 14,908 |
| Germany (1.2%) | | |
| * | Volkswagen AG Preference Shares | 19,258 | 3,221 |
| | E.On Se | 195,144 | 2,311 |
| | | | 5,532 |
| Greece (0.7%) | | |
| | Hellenic Telecommunications Organization SA | 199,774 | 3,260 |
| | | | |
| Hong Kong (1.1%) | | |
| | AIA Group Ltd. | 292,600 | 2,997 |
| | Sands China Ltd. | 527,200 | 2,321 |
| | | | 5,318 |
| Japan (2.6%) | | |
| | Tokio Marine Holdings Inc. | 74,400 | 3,434 |
| | KDDI Corp. | 109,000 | 3,169 |
| | Mitsubishi UFJ Financial Group Inc. | 724,800 | 3,024 |
| | Isuzu Motors Ltd. | 241,100 | 2,382 |
| | | | 12,009 |
| Netherlands (0.7%) | | |
| | Koninklijke KPN NV | 1,333,384 | 3,499 |
| | | | |
| Norway (0.7%) | | |
| * | Dnb ASA | 206,294 | 3,305 |
| | | | |
| Portugal (0.5%) | | |
| | Galp Energia SGPS SA | 237,640 | 2,552 |
| | | | |
| Spain (0.5%) | | |
| | Industria de Diseno Textil SA | 89,965 | 2,530 |
| | | | |
| Switzerland (2.2%) | | |
| | Novartis AG | 48,298 | 4,163 |
| | UBS Group AG | 311,205 | 3,786 |
| | Nestle SA | 18,592 | 2,239 |
| | | | 10,188 |
| Taiwan (1.2%) | | |
| | Taiwan Semiconductor Manufacturing Co. Ltd. | 396,000 | 5,772 |
| | | | |
| United Kingdom (2.6%) | | |
| | AstraZeneca plc | 33,674 | 3,738 |
| | BAE Systems plc | 435,111 | 3,020 |
| | National Grid plc | 258,018 | 2,890 |
| * | Standard Chartered plc | 483,756 | 2,521 |
| | | | 12,169 |
Global Wellesley Income Fund
| | | | Market |
| | | | Value· |
| | | Shares | ($000) |
| United States (16.6%) | | |
| | Progressive Corp. | 59,880 | 5,691 |
| | Philip Morris International Inc. | 62,987 | 5,026 |
| | Verizon Communications Inc. | 80,055 | 4,745 |
| | Comcast Corp. Class A | 98,563 | 4,417 |
| | Pfizer Inc. | 115,733 | 4,373 |
| | Microsoft Corp. | 19,006 | 4,286 |
| | Cisco Systems Inc. | 100,744 | 4,253 |
| | Bank of America Corp. | 158,842 | 4,089 |
| | Lockheed Martin Corp. | 8,089 | 3,157 |
| | Kellogg Co. | 44,484 | 3,154 |
| | FMC Corp. | 29,367 | 3,138 |
| | Texas Instruments Inc. | 21,777 | 3,096 |
| | Anthem Inc. | 10,570 | 2,976 |
| | Home Depot Inc. | 10,278 | 2,930 |
| | Medtronic plc | 26,533 | 2,851 |
| | Merck & Co. Inc. | 32,518 | 2,773 |
| | Exelon Corp. | 73,521 | 2,714 |
| | Emerson Electric Co. | 38,151 | 2,650 |
| | TJX Cos. Inc. | 47,884 | 2,623 |
| | Edison International | 46,730 | 2,452 |
| | VF Corp. | 35,995 | 2,367 |
| | Medical Properties Trust Inc. | 114,105 | 2,120 |
| | Boston Properties Inc. | 22,236 | 1,932 |
| | | | 77,813 |
| Total Common Stocks (Cost $171,457) | | 177,734 |
| Global Wellesley Income Fund | | | |
| | | | Market |
| | | | Value· |
| | Coupon | Shares | ($000) |
| Temporary Cash Investment (3.4%) | | | |
| Money Market Fund (3.4%) | | | |
| 15 Vanguard Market Liquidity Fund (Cost $15,915) | 0.147% | 159,151 | 15,915 |
| Total Investments (100.6%) (Cost $447,359) | | | 472,878 |
| Other Assets and Liabilities—Net (-0.6%) | | | (2,950) |
| Net Assets (100%) | | | 469,928 |
Cost is in $000.
| • | See Note A in Notes to Financial Statements. |
| ¤ | Includes securities purchased on a when-issued or delayed-delivery basis for which the fund has not taken delivery as of August 31, 2020. |
| * | Non-income-producing security. |
| 1 | The average or expected maturity is shorter than the final maturity shown because of the possibility of interim principal payments and prepayments or the possibility of the issue being called. |
| 2 | The issuer was placed under federal conservatorship in September 2008; since that time, its daily operations have been managed by the Federal Housing Finance Agency and it receives capital from the U.S. Treasury, as needed to maintain a positive net worth, in exchange for senior preferred stock. |
| 3 | Securities with a value of $363,000 have been segregated as initial margin for open futures contracts. |
| 4 | Securities with a value of $1,364,000 have been segregated as collateral for open forward currency contracts. |
| 5 | Security exempt from registration under Rule 144A of the Securities Act of 1933. Such securities may be sold in transactions exempt from registration, normally to qualified institutional buyers. At August 31, 2020, the aggregate value of these securities was $52,655,000, representing 11.2% of net assets. |
| 6 | Face amount denominated in Canadian dollars. |
| 7 | Adjustable-rate security; rate shown is effective rate at period end. Certain adjustable-rate securities are not based on a published reference rate and spread but are determined by the issuer or agent based on current market conditions. |
| 8 | Face amount denominated in British pounds. |
| 9 | Face amount denominated in euro. |
| 10 | Face amount denominated in Australian dollars. |
| 11 | Face amount denominated in Swiss francs. |
| 12 | Face amount denominated in Japanese yen. |
| 13 | Scheduled principal and interest payments are guaranteed by AGM (Assured Guaranty Municipal Corporation). |
| 14 | Scheduled principal and interest payments are guaranteed by National Public Finance Guarantee Corp. |
| 15 | Affiliated money market fund available only to Vanguard funds and certain trusts and accounts managed by Vanguard. Rate shown is the 7-day yield. |
GO—General Obligation Bond.
LIBOR—London Interbank Offered Rate.
REMICS—Real Estate Mortgage Investment Conduits.
UMBS—Uniform Mortgage-Backed Securities.
Global Wellesley Income Fund
| Derivative Financial Instruments Outstanding as of Period End | | | |
| | | | | | | | | | |
| Futures Contracts | | | | | | | | | |
| | | | | | | | | | ($000) |
| | | | | | | | | | Value and |
| | | | | | Number of | | | Unrealized |
| | | | | | Long (Short | ) | Notional | Appreciation |
| | | | | Expiration | Contracts | | Amount | (Depreciation) |
| Long Futures Contracts | | | | | | | | | |
| Euro-Schatz | | | September 2020 | | 87 | | 11,630 | (6) |
| Euro-Bobl | | | September 2020 | | 29 | | 4,659 | 9 |
| Euro-Buxl | | | September 2020 | | 14 | | 3,624 | 48 |
| Euro-OAT | | | September 2020 | | 10 | | 1,999 | 28 |
| Euro-BTP | | | September 2020 | | 8 | | 1,396 | 42 |
| Long Gilt | | | December 2020 | | 3 | | 541 | (2) |
| | | | | | | | | | 119 |
| | | | | | | | | | |
| Short Futures Contracts | | | | | | | | | |
| 10-Year U.S. Treasury Note | | | December 2020 | | (112) | | (15,596) | (32) |
| Euro-Bund | | | September 2020 | | (46) | | (9,637) | 28 |
| 10-Year Canadian Government Bond | | December 2020 | | (7) | | (810) | 5 |
| | | | | | | | | | 1 |
| | | | | | | | | | 120 |
| | | | | | | | | | |
| | | | | | | | | | |
| Forward Currency Contracts | | | | | | | | | |
| | Contract | | | | | | | Unrealized | Unrealized |
| Settlement | | | Contract Amount (000) | | Appreciation | (Depreciation) |
| Counterparty | Date | | | Receive | | Deliver | | ($000) | ($000) |
| J.P. Morgan Securities LLC | 9/30/20 | | USD | 65,507 | EUR | 55,396 | | — | (644) |
| J.P. Morgan Securities LLC | 9/30/20 | | USD | 12,417 | GBP | 9,470 | | — | (245) |
| J.P. Morgan Securities LLC | 9/30/20 | | USD | 9,370 | CAD | 12,313 | | — | (71) |
| J.P. Morgan Securities LLC | 9/30/20 | | USD | 6,265 | JPY | 665,157 | | — | (18) |
| Goldman Sachs International | 9/30/20 | | USD | 6,124 | AUD | 8,462 | | — | (118) |
| J.P. Morgan Securities LLC | 9/30/20 | | USD | 1,156 | CHF | 1,052 | | — | (9) |
| | | | | | | | | — | (1,105) |
AUD—Australian dollar.
CAD—Canadian dollar.
CHF—Swiss franc.
EUR—euro.
GBP—British pound.
JPY—Japanese yen.
USD—U.S. dollar.
See accompanying Notes, which are an integral part of the Financial Statements.
Global Wellesley Income Fund
Statement of Assets and Liabilities
As of August 31, 2020
| ($000s, except shares and per-share amounts) | Amount |
| Assets | |
| Investments in Securities, at Value | |
| Unaffiliated Issuers (Cost $431,444) | 456,963 |
| Affiliated Issuers (Cost $15,915) | 15,915 |
| Total Investments in Securities | 472,878 |
| Investment in Vanguard | 20 |
| Cash | 5 |
| Foreign Currency, at Value (Cost $6,974) | 7,145 |
| Receivables for Investment Securities Sold | 52 |
| Receivables for Accrued Income | 2,747 |
| Receivables for Capital Shares Issued | 630 |
| Variation Margin Receivable—Futures Contracts | 26 |
| Total Assets | 483,503 |
| Liabilities | |
| Payables for Investment Securities Purchased | 11,512 |
| Payables to Investment Advisor | 132 |
| Payables for Capital Shares Redeemed | 732 |
| Payables to Vanguard | 50 |
| Variation Margin Payable—Futures Contracts | 44 |
| Unrealized Depreciation—Forward Currency Contracts | 1,105 |
| Total Liabilities | 13,575 |
| Net Assets | 469,928 |
| | |
| | |
| At August 31, 2020, net assets consisted of: | |
| | |
| Paid-in Capital | 468,160 |
| Total Distributable Earnings (Loss) | 1,768 |
| Net Assets | 469,928 |
| | |
| Investor Shares—Net Assets | |
| Applicable to 3,974,945 outstanding $.001 par value shares of beneficial interest (unlimited authorization) | 81,170 |
| Net Asset Value Per Share—Investor Shares | $20.42 |
| | |
| Admiral Shares—Net Assets | |
| Applicable to 15,227,999 outstanding $.001 par value shares of beneficial interest (unlimited authorization) | 388,758 |
| Net Asset Value Per Share—Admiral Shares | $25.53 |
See accompanying Notes, which are an integral part of the Financial Statements.
Global Wellesley Income Fund
Statement of Operations
| | Year Ended |
| | August 31, 2020 |
| | ($000) |
| Investment Income | |
| Income | |
| Dividends1 | 5,352 |
| Interest2 | 7,192 |
| Securities Lending—Net | 29 |
| Total Income | 12,573 |
| Expenses | |
| Investment Advisory Fees—Note B | |
| Basic Fee | 563 |
| Performance Adjustment | (37) |
| The Vanguard Group—Note C | |
| Management and Administrative—Investor Shares | 218 |
| Management and Administrative—Admiral Shares | 688 |
| Marketing and Distribution—Investor Shares | 12 |
| Marketing and Distribution—Admiral Shares | 27 |
| Custodian Fees | 36 |
| Auditing Fees | 35 |
| Shareholders’ Reports—Investor Shares | 9 |
| Shareholders’ Reports—Admiral Shares | 6 |
| Trustees’ Fees and Expenses | 1 |
| Total Expenses | 1,558 |
| Expenses Paid Indirectly | (10) |
| Net Expenses | 1,548 |
| Net Investment Income | 11,025 |
| Realized Net Gain (Loss) | |
| Investment Securities Sold2 | (5,787) |
| Futures Contracts | (307) |
| Forward Currency Contracts | (3,046) |
| Foreign Currencies | (38) |
| Realized Net Gain (Loss) | (9,178) |
| Change in Unrealized Appreciation (Depreciation) | |
| Investment Securities2 | 13,118 |
| Futures Contracts | (284) |
| Forward Currency Contracts | (1,792) |
| Foreign Currencies | 261 |
| Change in Unrealized Appreciation (Depreciation) | 11,303 |
| Net Increase (Decrease) in Net Assets Resulting from Operations | 13,150 |
| 1 | Dividends are net of foreign withholding taxes of $518,000. |
| 2 | Interest income, realized net gain (loss), and change in unrealized appreciation (depreciation) from an affiliated company of the fund were $184,000, $15,000, and ($1,000), respectively. Purchases and sales are for temporary cash investment purposes. |
See accompanying Notes, which are an integral part of the Financial Statements.
Global Wellesley Income Fund
Statement of Changes in Net Assets
| | | | Year Ended August 31, |
| | 2020 | 2019 |
| | ($000) | ($000) |
| Increase (Decrease) in Net Assets | | |
| Operations | | |
| Net Investment Income | 11,025 | 12,355 |
| Realized Net Gain (Loss) | (9,178) | (14,891) |
| Change in Unrealized Appreciation (Depreciation) | 11,303 | 25,885 |
| Net Increase (Decrease) in Net Assets Resulting from Operations | 13,150 | 23,349 |
| Distributions1 | | |
| Investor Shares | (1,891) | (3,267) |
| Admiral Shares | (9,124) | (14,576) |
| Total Distributions | (11,015) | (17,843) |
| Capital Share Transactions | | |
| Investor Shares | (4,268) | (8,902) |
| Admiral Shares | 7,647 | (33,414) |
| Net Increase (Decrease) from Capital Share Transactions | 3,379 | (42,316) |
| Total Increase (Decrease) | 5,514 | (36,810) |
| Net Assets | | |
| Beginning of Period | 464,414 | 501,224 |
| End of Period | 469,928 | 464,414 |
| 1 | Certain prior period numbers have been reclassified to conform with current period presentation. |
See accompanying Notes, which are an integral part of the Financial Statements.
Global Wellesley Income Fund
Financial Highlights
Investor Shares
| | | Oct. 18, |
| | | Year Ended | 20171 to |
| | | | August 31, | | Aug. 31, |
| For a Share Outstanding Throughout Each Period | 2020 | 2019 | 2018 |
| Net Asset Value, Beginning of Period | $20.16 | $19.87 | $20.00 |
| Investment Operations | | | |
| Net Investment Income2 | .453 | .513 | .443 |
| Net Realized and Unrealized Gain (Loss) on Investments | .263 | .529 | (.269) |
| Total from Investment Operations | .716 | 1.042 | .174 |
| Distributions | | | |
| Dividends from Net Investment Income | (.456) | (.473) | (.304) |
| Distributions from Realized Capital Gains | — | (.279) | — |
| Total Distributions | (.456) | (.752) | (.304) |
| Net Asset Value, End of Period | $20.42 | $20.16 | $19.87 |
| | | | |
| Total Return3 | 3.66% | 5.50% | 0.88% |
| | | | |
| Ratios/Supplemental Data | | | |
| Net Assets, End of Period (Millions) | $81 | $85 | $93 |
| Ratio of Total Expenses to Average Net Assets | 0.41%4 | 0.42%4 | 0.43%5,6 |
| Ratio of Net Investment Income to Average Net Assets | 2.27% | 2.63% | 2.68%6 |
| Portfolio Turnover Rate | 72%7 | 90% | 39% |
| 1 | Subscription period for the fund was October 18, 2017, to November 1, 2017, during which time all assets were held in cash. |
| | Performance measurement began November 2, 2017, the first business day after the subscription period, at a net asset value of $20.00. |
| 2 | Calculated based on average shares outstanding. |
| 3 | Total returns do not include account service fees that may have applied in the periods shown. Fund prospectuses provide information about any applicable account service fees. |
| 4 | Includes performance-based investment advisory fee increases (decreases) of (0.01%) and (0.01%). |
| 5 | The ratio of expenses to average net assets for the period net of reduction from custody fee offset arrangements was 0.42%. |
| 7 | Includes 1% attributable to mortgage-dollar-roll activity. |
See accompanying Notes, which are an integral part of the Financial Statements.
Global Wellesley Income Fund
Financial Highlights
Admiral Shares
| | | | Oct. 18, |
| | | Year Ended | 20171 to |
| | | | August 31, | | Aug. 31, |
| For a Share Outstanding Throughout Each Period | 2020 | 2019 | 2018 |
| Net Asset Value, Beginning of Period | $25.20 | $24.84 | $25.00 |
| Investment Operations | | | |
| Net Investment Income2 | .592 | .666 | .577 |
| Net Realized and Unrealized Gain (Loss) on Investments | .334 | .658 | (.341) |
| Total from Investment Operations | .926 | 1.324 | .236 |
| Distributions | | | |
| Dividends from Net Investment Income | (.596) | (.616) | (.396) |
| Distributions from Realized Capital Gains | — | (.348) | — |
| Total Distributions | (.596) | (.964) | (.396) |
| Net Asset Value, End of Period | $25.53 | $25.20 | $24.84 |
| | | | |
| Total Return3 | 3.79% | 5.60% | 0.96% |
| | | | |
| Ratios/Supplemental Data | | | |
| Net Assets, End of Period (Millions) | $389 | $379 | $408 |
| Ratio of Total Expenses to Average Net Assets | 0.31%4 | 0.32%4 | 0.33%5,6 |
| Ratio of Net Investment Income to Average Net Assets | 2.37% | 2.73% | 2.78%6 |
| Portfolio Turnover Rate | 72%7 | 90% | 39% |
| 1 | Subscription period for the fund was October 18, 2017, to November 1, 2017, during which time all assets were held in cash. |
| | Performance measurement began November 2, 2017, the first business day after the subscription period, at a net asset value of $25.00. |
| 2 | Calculated based on average shares outstanding. |
| 3 | Total returns do not include account service fees that may have applied in the periods shown. Fund prospectuses provide information about any applicable account service fees. |
| 4 | Includes performance-based investment advisory fee increases (decreases) of (0.01%) and (0.01%). |
| 5 | The ratio of expenses to average net assets for the period net of reduction from custody fee offset arrangements was 0.32%. |
| 7 | Includes 1% attributable to mortgage-dollar-roll activity. |
See accompanying Notes, which are an integral part of the Financial Statements.
Global Wellesley Income Fund
Notes to Financial Statements
Vanguard Global Wellesley Income Fund is registered under the Investment Company Act of 1940 as an open-end investment company, or mutual fund. The fund offers two classes of shares: Investor Shares and Admiral Shares. Each of the share classes has different eligibility and minimum purchase requirements, and is designed for different types of investors.
Certain of the fund’s investments are in corporate debt instruments; the issuers’ abilities to meet their obligations may be affected by economic developments in their respective industries. The fund invests in securities of foreign issuers, which may subject it to investment risks not normally associated with investing in securities of U.S. corporations. To minimize the currency risk associated with investment in securities denominated in currencies other than the U.S. dollar, the fund attempts to hedge its currency exposures. Market disruptions associated with the COVID-19 pandemic have had a global impact, and uncertainty exists as to the long-term implications. Such disruptions can adversely affect assets of the fund and thus fund performance.
A. The following significant accounting policies conform to generally accepted accounting principles for U.S. investment companies. The fund consistently follows such policies in preparing its financial statements.
1. Security Valuation: Securities are valued as of the close of trading on the New York Stock Exchange (generally 4 p.m., Eastern time) on the valuation date. Equity securities are valued at the latest quoted sales prices or official closing prices taken from the primary market in which each security trades; such securities not traded on the valuation date are valued at the mean of the latest quoted bid and asked prices. Bonds and temporary cash investments are valued using the latest bid prices or using valuations based on a matrix system (which considers such factors as security prices, yields, maturities, and ratings), both as furnished by independent pricing services. Structured debt securities, including mortgages and asset-backed securities, are valued using the latest bid prices or using valuations based on a matrix system that considers such factors as issuer, tranche, nominal or option-adjusted spreads, weighted average coupon, weighted average maturity, credit enhancements, and collateral. Investments in Vanguard Market Liquidity Fund are valued at that fund’s net asset value. Securities for which market quotations are not readily available, or whose values have been affected by events occurring before the fund’s pricing time but after the close of the securities’ primary markets, are valued at their fair values calculated according to procedures adopted by the board of trustees. These procedures include obtaining quotations from an independent pricing service, monitoring news to identify significant market- or security-specific events, and evaluating changes in the values of foreign market proxies (for example, ADRs, futures contracts, or exchange-traded funds), between the time the foreign markets close and the fund’s pricing time. When fair-value pricing is employed, the prices of securities used by a fund to calculate its net asset value may differ from quoted or published prices for the same securities.
2. Foreign Currency: Securities and other assets and liabilities denominated in foreign currencies are translated into U.S. dollars using exchange rates obtained from an independent third party as of the fund’s pricing time on the valuation date. Realized gains (losses) and unrealized appreciation (depreciation) on investment securities include the effects of changes in exchange rates since the securities were purchased, combined with the effects of changes in security prices. Fluctuations in the value of other assets and liabilities resulting from changes in exchange rates are recorded as unrealized foreign currency gains (losses) until the assets or liabilities are settled in cash, at which time they are recorded as realized foreign currency gains (losses).
Global Wellesley Income Fund
3. Futures Contracts: The fund uses futures contracts to invest in fixed income asset classes with greater efficiency and lower cost than is possible through direct investment, to add value when these instruments are attractively priced, or to adjust sensitivity to changes in interest rates. The primary risks associated with the use of futures contracts are imperfect correlation between changes in market values of bonds held by the fund and the prices of futures contracts, and the possibility of an illiquid market. Counterparty risk involving futures is mitigated because a regulated clearinghouse is the counterparty instead of the clearing broker. To further mitigate counterparty risk, the fund trades futures contracts on an exchange, monitors the financial strength of its clearing brokers and clearinghouse, and has entered into clearing agreements with its clearing brokers. The clearinghouse imposes initial margin requirements to secure the fund’s performance and requires daily settlement of variation margin representing changes in the market value of each contract. Any securities pledged as initial margin for open contracts are noted in the Schedule of Investments.
Futures contracts are valued at their quoted daily settlement prices. The notional amounts of the contracts are not recorded in the Statement of Assets and Liabilities. Fluctuations in the value of the contracts are recorded in the Statement of Assets and Liabilities as an asset (liability) and in the Statement of Operations as unrealized appreciation (depreciation) until the contracts are closed, when they are recorded as realized gains (losses) on futures contracts.
During the year ended August 31, 2020, the fund’s average investments in long and short futures contracts represented 4% and 3% of net assets, respectively, based on the average of the notional amounts at each quarter-end during the period.
4. Forward Currency Contracts: The fund enters into forward currency contracts to protect the value of securities and related receivables and payables against changes in future foreign exchange rates. The fund’s risks in using these contracts include movement in the values of the foreign currencies relative to the U.S. dollar and the ability of the counterparties to fulfill their obligations under the contracts. The fund mitigates its counterparty risk by entering into forward currency contracts only with a diverse group of prequalified counterparties, monitoring their financial strength, entering into master netting arrangements with its counterparties, and requiring its counterparties to transfer collateral as security for their performance. In the absence of a default, the collateral pledged or received by the fund cannot be repledged, resold, or rehypothecated. The master netting arrangements provide that, in the event of a counterparty’s default (including bankruptcy), the fund may terminate the forward currency contracts, determine the net amount owed by either party in accordance with its master netting arrangements, and sell or retain any collateral held up to the net amount owed to the fund under the master netting arrangements. The forward currency contracts contain provisions whereby a counterparty may terminate open contracts if the fund’s net assets decline below a certain level, triggering a payment by the fund if the fund is in a net liability position at the time of the termination. The payment amount would be reduced by any collateral the fund has pledged. Any securities pledged as collateral for open contracts are noted in the Schedule of Investments. The value of collateral received or pledged is compared daily to the value of the forward currency contracts exposure with each counterparty, and any difference, if in excess of a specified minimum transfer amount, is adjusted and settled within two business days.
Forward currency contracts are valued at their quoted daily prices obtained from an independent third party, adjusted for currency risk based on the expiration date of each contract. The notional amounts of the contracts are not recorded in the Statement of Assets and Liabilities. Fluctuations
Global Wellesley Income Fund
in the value of the contracts are recorded in the Statement of Assets and Liabilities as an asset (liability) and in the Statement of Operations as unrealized appreciation (depreciation) until the contracts are closed, when they are recorded as realized gains (losses) on forward currency contracts.
During the year ended August 31, 2020, the fund’s average investment in forward currency contracts represented 21% of net assets, based on the average of notional amounts at each quarter-end during the period.
5. To Be Announced (TBA) Transactions: A TBA transaction is an agreement to buy or sell mortgage-backed securities with agreed-upon characteristics (face amount, coupon, maturity) for settlement at a future date. The fund may be a seller of TBA transactions to reduce its exposure to the mortgage-backed securities market or in order to sell mortgage-backed securities it owns under delayed-delivery arrangements. When the fund is a buyer of TBA transactions, it maintains cash or short-term investments in an amount sufficient to meet the purchase price at the settlement date of the TBA transaction. The primary risk associated with TBA transactions is that a counterparty may default on its obligations. The fund mitigates its counterparty risk by, among other things, performing a credit analysis of counterparties, allocating transactions among numerous counterparties, and monitoring its exposure to each counterparty. The fund may also enter into a Master Securities Forward Transaction Agreement (MSFTA) with certain counterparties and require them to transfer collateral as security for their performance. In the absence of a default, the collateral pledged or received by the fund cannot be repledged, resold, or rehypothecated. Under an MSFTA, upon a counterparty default (including bankruptcy), the fund may terminate any TBA transactions with that counterparty, determine the net amount owed by either party in accordance with its master netting arrangements, and sell or retain any collateral held up to the net amount owed to the fund under the master netting arrangements.
6. Mortgage Dollar Rolls: The fund enters into mortgage-dollar-roll transactions, in which the fund sells mortgage-backed securities to a dealer and simultaneously agrees to purchase similar securities in the future at a predetermined price. The proceeds of the securities sold in mortgage-dollar-roll transactions are typically invested in high-quality short-term fixed income securities. The fund forgoes principal and interest paid on the securities sold, and is compensated by interest earned on the proceeds of the sale and by a lower price on the securities to be repurchased. The fund has also entered into mortgage-dollar-roll transactions in which the fund buys mortgage-backed securities from a dealer pursuant to a TBA transaction and simultaneously agrees to sell similar securities in the future at a predetermined price. The securities bought in mortgage-dollar-roll transactions are used to cover an open TBA sell position. The fund continues to earn interest on mortgage-backed security pools already held and receives a lower price on the securities to be sold in the future. The fund accounts for mortgage-dollar-roll transactions as purchases and sales; as such, these transactions may increase the fund’s portfolio turnover rate. Amounts to be received or paid in connection with open mortgage dollar rolls are included in Receivables for Investment Securities Sold or Payables for Investment Securities Purchased in the Statement of Assets and Liabilities.
7. Federal Income Taxes: The fund intends to continue to qualify as a regulated investment company and distribute all of its taxable income. The fund’s tax returns are open to examination by the relevant tax authorities until expiration of the applicable statute of limitations, which is generally three years after the filing of the tax return. Management has analyzed the fund’s tax positions taken for all open federal and state income tax years, and has concluded that no provision for income tax is required in the fund’s financial statements.
Global Wellesley Income Fund
8. Distributions: Distributions to shareholders are recorded on the ex-dividend date. Distributions are determined on a tax basis at the fiscal year-end and may differ from net investment income and realized capital gains for financial reporting purposes.
9. Securities Lending: To earn additional income, the fund lends its securities to qualified institutional borrowers. Security loans are subject to termination by the fund at any time, and are required to be secured at all times by collateral in an amount at least equal to the market value of securities loaned. Daily market fluctuations could cause the value of loaned securities to be more or less than the value of the collateral received. When this occurs, the collateral is adjusted and settled before the opening of the market on the next business day. The fund further mitigates its counterparty risk by entering into securities lending transactions only with a diverse group of prequalified counterparties, monitoring their financial strength, and entering into master securities lending agreements with its counterparties. The master securities lending agreements provide that, in the event of a counterparty’s default (including bankruptcy), the fund may terminate any loans with that borrower, determine the net amount owed, and sell or retain the collateral up to the net amount owed to the fund; however, such actions may be subject to legal proceedings. While collateral mitigates counterparty risk, in the event of a default, the fund may experience delays and costs in recovering the securities loaned. The fund invests cash collateral received in Vanguard Market Liquidity Fund, and records a liability in the Statement of Assets and Liabilities for the return of the collateral, during the period the securities are on loan. Collateral investments in Vanguard Market Liquidity Fund are subject to market appreciation or depreciation. Securities lending income represents fees charged to borrowers plus income earned on invested cash collateral, less expenses associated with the loan. During the term of the loan, the fund is entitled to all distributions made on or in respect of the loaned securities.
10. Credit Facilities and Interfund Lending Program: The fund and certain other funds managed by The Vanguard Group (“Vanguard”) participate in a $4.3 billion committed credit facility provided by a syndicate of lenders pursuant to a credit agreement and an uncommitted credit facility provided by Vanguard. Both facilities may be renewed annually. Each fund is individually liable for its borrowings, if any, under the credit facilities. Borrowings may be utilized for temporary or emergency purposes, subject to the fund’s regulatory and contractual borrowing restrictions. With respect to the committed credit facility, the participating funds are charged administrative fees and an annual commitment fee of 0.10% of the undrawn committed amount of the facility; these fees are allocated to the funds based on a method approved by the fund’s board of trustees and included in Management and Administrative expenses on the fund’s Statement of Operations. Any borrowings under either facility bear interest at a rate based upon the higher of the one-month London Interbank Offered Rate (or an acceptable alternate rate, if necessary), federal funds effective rate, or overnight bank funding rate plus an agreed-upon spread, except that borrowings under the uncommitted credit facility may bear interest based upon an alternative rate agreed to by the fund and Vanguard.
In accordance with an exemptive order (the “Order”) from the SEC, the fund may participate in a joint lending and borrowing program that allows registered open-end Vanguard funds to borrow money from and lend money to each other for temporary or emergency purposes (the “Interfund Lending Program”), subject to compliance with the terms and conditions of the Order, and to the extent permitted by the fund’s investment objective and investment policies. Interfund loans and borrowings normally extend overnight, but can have a maximum duration of seven days. Loans may be called on one business day’s notice. The interest rate to be charged is governed by the conditions of the Order and internal procedures adopted by the board of trustees. The board of trustees is responsible for overseeing the Interfund Lending Program.
Global Wellesley Income Fund
For the year ended August 31, 2020, the fund did not utilize the credit facilities or the Interfund Lending Program.
11. Other: Dividend income is recorded on the ex-dividend date. Interest income includes income distributions received from Vanguard Market Liquidity Fund and is accrued daily. Premiums and discounts on debt securities are amortized and accreted, respectively, to interest income over the lives of the respective securities, except for premiums on certain callable debt securities that are amortized to the earliest call date. Security transactions are accounted for on the date securities are bought or sold. Costs used to determine realized gains (losses) on the sale of investment securities are those of the specific securities sold.
Each class of shares has equal rights as to assets and earnings, except that each class separately bears certain class-specific expenses related to maintenance of shareholder accounts (included in Management and Administrative expenses) and shareholder reporting. Marketing and distribution expenses are allocated to each class of shares based on a method approved by the board of trustees. Income, other non-class-specific expenses, and gains and losses on investments are allocated to each class of shares based on its relative net assets.
B. Wellington Management Company LLP provides investment advisory services to the fund for a fee calculated at an annual percentage rate of average net assets. The basic fee is subject to quarterly adjustments based on the fund’s performance relative to the Global Wellesley Income Composite Index, comprising the FTSE Developed High Dividend Yield Index (net of tax) and the Bloomberg Barclays Fixed Income Composite index, since December 1, 2017. For the year ended August 31, 2020, the investment advisory fee represented an effective annual basic rate of 0.12% of the fund’s average net assets before a decrease of $37,000 (0.01%) based on performance.
C. In accordance with the terms of a Funds’ Service Agreement (the “FSA”) between Vanguard and the fund, Vanguard furnishes to the fund corporate management, administrative, marketing, and distribution services at Vanguard’s cost of operations (as defined by the FSA). These costs of operations are allocated to the fund based on methods and guidelines approved by the board of trustees and are generally settled twice a month.
Upon the request of Vanguard, the fund may invest up to 0.40% of its net assets as capital in Vanguard. At August 31, 2020, the fund had contributed to Vanguard capital in the amount of $20,000, representing less than 0.01% of the fund’s net assets and 0.01% of Vanguard’s capital received pursuant to the FSA. The fund’s trustees and officers are also directors and employees, respectively, of Vanguard.
D. The fund’s custodian bank has agreed to reduce its fees when the fund maintains cash on deposit in the non-interest-bearing custody account. For the year ended August 31, 2020, custodian fee offset arrangements reduced the fund’s expenses by $10,000 (an annual rate of less than 0.01% of average net assets).
E. Various inputs may be used to determine the value of the fund’s investments and derivatives. These inputs are summarized in three broad levels for financial statement purposes. The inputs or methodologies used to value securities are not necessarily an indication of the risk associated with investing in those securities.
Global Wellesley Income Fund
Level 1—Quoted prices in active markets for identical securities.
Level 2—Other significant observable inputs (including quoted prices for similar securities, interest rates, prepayment speeds, credit risk, etc.).
Level 3—Significant unobservable inputs (including the fund’s own assumptions used to determine the fair value of investments). Any investments and derivatives valued with significant unobservable inputs are noted on the Schedule of Investments.
The following table summarizes the market value of the fund’s investments and derivatives as of August 31, 2020, based on the inputs used to value them:
| | Level 1 | Level 2 | Level 3 | Total |
| | ($000) | ($000) | ($000) | ($000) |
| Investments | | | | |
| Assets | | | | |
| U.S. Government and Agency Obligations | — | 29,086 | — | 29,086 |
| Asset-Backed/Commercial Mortgage-Backed Securities | — | 13,779 | — | 13,779 |
| Corporate Bonds | — | 195,769 | — | 195,769 |
| Sovereign Bonds | — | 31,730 | — | 31,730 |
| Taxable Municipal Bonds | — | 8,865 | — | 8,865 |
| Common Stocks | 92,754 | 84,980 | — | 177,734 |
| Temporary Cash Investments | 15,915 | — | — | 15,915 |
| Total | 108,669 | 364,209 | — | 472,878 |
| Derivative Financial Instruments | | | | |
| Assets | | | | |
| Futures Contracts1 | 26 | — | — | 26 |
| Liabilities | | | | |
| Futures Contracts1 | 44 | — | — | 44 |
| Forward Currency Contracts | — | 1,105 | — | 1,105 |
| Total | 44 | 1,105 | — | 1,149 |
1 Represents variation margin on the last day of the reporting period.
F. At August 31, 2020, the fair values of derivatives were reflected in the Statement of Assets and Liabilities as follows:
| | | Foreign | |
| | Interest Rate | Exchange | |
| | Contracts | Contracts | Total |
| Statement of Assets and Liabilities Caption | ($000) | ($000) | ($000) |
| Variation Margin Receivable—Futures Contracts | 26 | — | 26 |
| Total Assets | 26 | — | 26 |
| | | | |
| Variation Margin Payable—Futures Contracts | 44 | — | 44 |
| Unrealized Depreciation—Forward Currency Contracts | — | 1,105 | 1,105 |
| Total Liabilities | 44 | 1,105 | 1,149 |
Global Wellesley Income Fund
Realized net gain (loss) and the change in unrealized appreciation (depreciation) on derivatives for the year ended August 31, 2020, were:
| | | Foreign | |
| Interest Rate | Exchange | |
| | Contracts | Contracts | Total |
| Realized Net Gain (Loss) on Derivatives | ($000) | ($000) | ($000) |
| Futures Contracts | (307) | — | (307) |
| Forward Currency Contracts | — | (3,046) | (3,046) |
| Realized Net Gain (Loss) on Derivatives | (307) | (3,046) | (3,353) |
| | | | |
| Change in Unrealized Appreciation (Depreciation) on Derivatives | | | |
| Futures Contracts | (284) | — | (284) |
| Forward Currency Contracts | — | (1,792) | (1,792) |
| Change in Unrealized Appreciation (Depreciation) on Derivatives | (284) | (1,792) | (2,076) |
G. Permanent differences between book-basis and tax-basis components of net assets are reclassified among capital accounts in the financial statements to reflect their tax character. These reclassifications have no effect on net assets or net asset value per share. As of period end, permanent differences primarily attributable to the accounting for foreign currency transactions were reclassified between the individual components of total distributable earnings (loss).
Temporary differences between book-basis and tax-basis components of total distributable earnings (loss) arise when certain items of income, gain, or loss are recognized in different periods for financial statement and tax purposes; these differences will reverse at some time in the future. The differences are primarily related to the deferral of losses from wash sales; the deferral of losses from straddles; and the recognition of unrealized gains or losses from certain derivative contracts. As of period end, the tax-basis components of total distributable earnings (loss) are detailed in the table as follows:
| | Amount |
| | ($000) |
| Undistributed Ordinary Income | 444 |
| Undistributed Long-Term Gains | — |
| Capital Loss Carryforwards | (24,042) |
| Qualified Late-Year Losses | — |
| Net Unrealized Gains (Losses) | 25,366 |
Global Wellesley Income Fund
The tax character of distributions paid was as follows:
| | Year Ended August 31, | |
| | 2020 | | 2019 | |
| | Amount | | Amount | |
| | ($000 | ) | ($000 | ) |
| Ordinary Income* | 11,015 | | 13,924 | |
| Long-Term Capital Gains | — | | 3,919 | |
| Total | 11,015 | | 17,843 | |
* Includes short-term capital gains, if any.
As of August 31, 2020, gross unrealized appreciation and depreciation for investments and derivatives based on cost for U.S. federal income tax purposes were as follows:
| | Amount | |
| | ($000 | ) |
| Tax Cost | 447,753 | |
| Gross Unrealized Appreciation | 37,293 | |
| Gross Unrealized Depreciation | (12,163 | ) |
| Net Unrealized Appreciation (Depreciation) | 25,130 | |
H. During the year ended August 31, 2020, the fund purchased $179,592,000 of investment securities and sold $185,366,000 of investment securities, other than U.S. government securities and temporary cash investments. Purchases and sales of U.S. government securities were $151,385,000 and $151,679,000, respectively.
I. Capital share transactions for each class of shares were:
| | | | | | Year Ended August 31, | |
| | | | 2020 | | | | 2019 | |
| | Amount | | Shares | | Amount | | Shares | |
| | ($000 | ) | (000 | ) | ($000 | ) | (000 | ) |
| Investor Shares | | | | | | | | |
| Issued | 34,659 | | 1,733 | | 29,050 | | 1,497 | |
| Issued in Lieu of Cash Distributions | 1,619 | | 82 | | 2,809 | | 147 | |
| Redeemed | (40,546 | ) | (2,058 | ) | (40,761 | ) | (2,103 | ) |
| Net Increase (Decrease)—Investor Shares | (4,268 | ) | (243 | ) | (8,902 | ) | (459 | ) |
| Admiral Shares | | | | | | | | |
| Issued | 164,236 | | 6,588 | | 143,988 | | 5,941 | |
| Issued in Lieu of Cash Distributions | 7,760 | | 316 | | 12,597 | | 527 | |
| Redeemed | (164,349 | ) | (6,729 | ) | (189,999 | ) | (7,853 | ) |
| Net Increase (Decrease)—Admiral Shares | 7,647 | | 175 | | (33,414 | ) | (1,385 | ) |
J. Management has determined that no events or transactions occurred subsequent to August 31, 2020, that would require recognition or disclosure in these financial statements.
Report of Independent Registered
Public Accounting Firm
To the Board of Trustees of Vanguard World Fund and Shareholders of Vanguard Global Wellesley Income Fund
Opinion on the Financial Statements
We have audited the accompanying statement of assets and liabilities, including the schedule of investments, of Vanguard Global Wellesley Income Fund (one of the funds constituting Vanguard World Fund, referred to hereafter as the “Fund”) as of August 31, 2020, the related statement of operations for the year ended August 31, 2020, the statement of changes in net assets for each of the two years in the period ended August 31, 2020, including the related notes, and the financial highlights for each of the periods indicated therein (collectively referred to as the “financial statements”). In our opinion, the financial statements present fairly, in all material respects, the financial position of the Fund as of August 31, 2020, the results of its operations for the year then ended, the changes in its net assets for each of the two years in the period ended August 31, 2020 and the financial highlights for each of the periods indicated therein in conformity with accounting principles generally accepted in the United States of America.
Basis for Opinion
These financial statements are the responsibility of the Fund’s management. Our responsibility is to express an opinion on the Fund’s financial statements based on our audits. We are a public accounting firm registered with the Public Company Accounting Oversight Board (United States) (“PCAOB”) and are required to be independent with respect to the Fund in accordance with the U.S. federal securities laws and the applicable rules and regulations of the Securities and Exchange Commission and the PCAOB.
We conducted our audits of these financial statements in accordance with the standards of the PCAOB. Those standards require that we plan and perform the audit to obtain reasonable assurance about whether the financial statements are free of material misstatement, whether due to error or fraud.
Our audits included performing procedures to assess the risks of material misstatement of the financial statements, whether due to error or fraud, and performing procedures that respond to those risks. Such procedures included examining, on a test basis, evidence regarding the amounts and disclosures in the financial statements. Our audits also included evaluating the accounting principles used and significant estimates made by management, as well as evaluating the overall presentation of the financial statements. Our procedures included confirmation of securities owned as of August 31, 2020 by correspondence with the custodian, transfer agent and brokers; when replies were not received from brokers, we performed other auditing procedures. We believe that our audits provide a reasonable basis for our opinion.
/s/PricewaterhouseCoopers LLP
Philadelphia, Pennsylvania
October 19, 2020
We have served as the auditor of one or more investment companies in The Vanguard Group of Funds since 1975.
Special 2020 tax information (unaudited) for Vanguard Global Wellesley Income Fund
This information for the fiscal year ended August 31, 2020, is included pursuant to provisions of the Internal Revenue Code.
The fund distributed $5,634,000 of qualified dividend income to shareholders during the fiscal year.
For corporate shareholders, 19.0% of investment income (dividend income plus short-term gains, if any) qualifies for the dividends-received deduction.
Liquidity Risk Management
Vanguard funds (except for the money market funds) have adopted and implemented a written liquidity risk management program (the “Program”) as required by Rule 22e-4 under the Investment Company Act of 1940. Rule 22e-4 requires that each fund adopt a program that is reasonably designed to assess and manage the fund’s liquidity risk, which is the risk that the fund could not meet redemption requests without significant dilution of remaining investors’ interests in the fund.
Assessment and management of a fund’s liquidity risk under the Program take into consideration certain factors, such as the fund’s investment strategy and the liquidity of its portfolio investments during normal and reasonably foreseeable stressed conditions, its short- and long-term cash-flow projections during both normal and reasonably foreseeable stressed conditions, and its cash and cash-equivalent holdings and access to other funding sources. As required by the rule, the Program includes policies and procedures for classification of fund portfolio holdings in four liquidity categories, maintaining certain levels of highly liquid investments, and limiting holdings of illiquid investments.
The board of trustees of Vanguard World Fund approved the appointment of liquidity risk management program administrators responsible for administering Vanguard Global Wellesley Income Fund’s Program and for carrying out the specific responsibilities set forth in the Program, including reporting to the board on at least an annual basis regarding the Program’s operation, its adequacy, and the effectiveness of its implementation for the past year (the “Program Administrator Report”). The board has reviewed the Program Administrator Report covering the period from December 1, 2018, through December 31, 2019 (the “Review Period”). The Program Administrator Report stated that during the Review Period the Program operated and was implemented effectively to manage the fund’s liquidity risk.
BLOOMBERG is a trademark and service mark of Bloomberg Finance L.P. BARCLAYS is a trademark and service mark of Barclays Bank Plc, used under license. Bloomberg Finance L.P. and its affiliates, including Bloomberg Index Services Limited (BISL) (collectively, Bloomberg), or Bloomberg’s licensors, own all proprietary rights in the Bloomberg Barclays Fixed Income Composite Index, which is composed of 80% Bloomberg Barclays Global Aggregate Credit Index (USD Hedged), 10% Bloomberg Barclays Global Aggregate Treasury Index (USD Hedged), and 10% Bloomberg Barclays Global Aggregate Securitized Index (USD Hedged) (the Indices or Bloomberg Barclays Indices).
Neither Barclays Bank Plc, Barclays Capital Inc., or any affiliate (collectively Barclays) or Bloomberg is the issuer or producer of the Global Wellesley Income Fund and neither Bloomberg nor Barclays has any responsibilities, obligations or duties to investors in the Global Wellesley Income Fund. The Indices are licensed for use by The Vanguard Group, Inc. (Vanguard) as the sponsor of the Global Wellesley Income Fund. Bloomberg and Barclays’ only relationship with Vanguard in respect to the Indices is the licensing of the Indices, which are determined, composed and calculated by BISL, or any successor thereto, without regard to the Issuer or the Global Wellesley Income Fund or the owners of the Global Wellesley Income Fund.
Additionally, Vanguard may for itself execute transaction(s) with Barclays in or relating to the Indices in connection with the Global Wellesley Income Fund. Investors acquire the Global Wellesley Income Fund from Vanguard and investors neither acquire any interest in the Indices nor enter into any relationship of any kind whatsoever with Bloomberg or Barclays upon making an investment in the Global Wellesley Income Fund. The Global Wellesley Income Fund is not sponsored, endorsed, sold or promoted by Bloomberg or Barclays. Neither Bloomberg nor Barclays makes any representation or warranty, express or implied regarding the advisability of investing in the Global Wellesley Income Fund or the advisability of investing in securities generally or the ability of the Indices to track corresponding or relative market performance. Neither Bloomberg nor Barclays has passed on the legality or suitability of the Global Wellesley Income Fund with respect to any person or entity. Neither Bloomberg nor Barclays is responsible for and has not participated in the determination of the timing of, prices at, or quantities of the Global Wellesley Income Fund to be issued. Neither Bloomberg nor Barclays has any obligation to take the needs of the Issuer or the owners of the Global Wellesley Income Fund or any other third party into consideration in determining, composing or calculating the Indices. Neither Bloomberg nor Barclays has any obligation or liability in connection with administration, marketing or trading of the Global Wellesley Income Fund.
The licensing agreement between Bloomberg and Barclays is solely for the benefit of Bloomberg and Barclays and not for the benefit of the owners of the Global Wellesley Income Fund, investors or other third parties. In addition, the licensing agreement between Vanguard and Bloomberg is solely for the benefit of Vanguard and Bloomberg and not for the benefit of the owners of the Global Wellesley Income Fund, investors or other third parties.
NEITHER BLOOMBERG NOR BARCLAYS SHALL HAVE ANY LIABILITY TO THE ISSUER, INVESTORS OR TO OTHER THIRD PARTIES FOR THE QUALITY, ACCURACY AND/OR COMPLETENESS OF THE BLOOMBERG BARCLAYS INDICES OR ANY DATA INCLUDED THEREIN OR FOR INTERRUPTIONS IN THE DELIVERY OF THE BLOOMBERG BARCLAYS INDICES. NEITHER BLOOMBERG NOR BARCLAYS MAKES ANY WARRANTY, EXPRESS OR IMPLIED, AS TO RESULTS TO BE OBTAINED BY THE ISSUER, THE INVESTORS OR ANY OTHER PERSON OR ENTITY FROM THE USE OF THE BLOOMBERG BARCLAYS INDICES OR ANY DATA INCLUDED THEREIN. NEITHER BLOOMBERG NOR BARCLAYS MAKES ANY EXPRESS OR IMPLIED WARRANTIES, AND EACH HEREBY EXPRESSLY DISCLAIMS ALL WARRANTIES OF MERCHANTABILITY OR FITNESS FOR A PARTICULAR PURPOSE OR USE WITH RESPECT TO THE BLOOMBERG BARCLAYS INDICES OR ANY DATA INCLUDED THEREIN. BLOOMBERG RESERVES THE RIGHT TO CHANGE THE METHODS OF CALCULATION OR PUBLICATION, OR TO CEASE THE CALCULATION OR PUBLICATION OF THE BLOOMBERG BARCLAYS INDICES, AND NEITHER BLOOMBERG NOR BARCLAYS SHALL BE LIABLE FOR ANY MISCALCULATION OF OR ANY INCORRECT, DELAYED OR INTERRUPTED PUBLICATION WITH RESPECT TO ANY OF THE BLOOMBERG BARCLAYS INDICES. NEITHER BLOOMBERG NOR BARCLAYS SHALL BE LIABLE FOR ANY DAMAGES, INCLUDING, WITHOUT LIMITATION, ANY SPECIAL, INDIRECT OR CONSEQUENTIAL DAMAGES, OR ANY LOST PROFITS AND EVEN IF ADVISED OF THE POSSIBILITY OF SUCH, RESULTING FROM THE USE OF THE BLOOMBERG BARCLAYS INDICES OR ANY DATA INCLUDED THEREIN OR WITH RESPECT TO THE VANGUARD GLOBAL WELLESLEY INCOME FUND.
None of the information supplied by Bloomberg or Barclays and used in this publication may be reproduced in any manner without the prior written permission of both Bloomberg and Barclays Capital, the investment banking division of Barclays Bank Plc. Barclays Bank Plc is registered in England No. 1026167. Registered office 1 Churchill Place London E14 5HP.
© 2020 Bloomberg. Used with Permission.
Source: Bloomberg Index Services Limited. Copyright 2020, Bloomberg. All rights reserved.
This page intentionally left blank.
This page intentionally left blank.
The People Who Govern Your Fund
The trustees of your mutual fund are there to see that the fund is operated and managed in your best interests since, as a shareholder, you are a part owner of the fund. Your fund’s trustees also serve on the board of directors of The Vanguard Group, Inc., which is owned by the Vanguard funds and provides services to them.
A majority of Vanguard’s board members are independent, meaning that they have no affiliation with Vanguard or the funds they oversee, apart from the sizable personal investments they have made as private individuals. The independent board members have distinguished backgrounds in business, academia, and public service. Each of the trustees and executive officers oversees 212 Vanguard funds.
Information for each trustee and executive officer of the fund appears below. That information, as well as the Vanguard fund count, is as of the date on the cover of this fund report. The mailing address of the trustees and officers is P.O. Box 876, Valley Forge, PA 19482. More information about the trustees is in the Statement of Additional Information, which can be obtained, without charge, by contacting Vanguard at 800-662-7447, or online at vanguard.com.
Interested Trustee1
Mortimer J. Buckley
Born in 1969. Trustee since January 2018. Principal occupation(s) during the past five years and other experience: chairman of the board (2019–present) of Vanguard and of each of the investment companies served by Vanguard; chief executive officer (2018– present) of Vanguard; chief executive officer, president, and trustee (2018–present) of each of the investment companies served by Vanguard; president and director (2017–present) of Vanguard; and president (2018–present) of Vanguard Marketing Corporation. Chief investment officer (2013–2017), managing director (2002–2017), head of the Retail Investor Group (2006–2012), and chief information officer (2001–2006) of Vanguard. Chairman of the board (2011–2017) and trustee (2009–2017) of the Children’s Hospital of Philadelphia; and trustee (2018–present) and vice chair (2019–present) of The Shipley School.
Independent Trustees
Emerson U. Fullwood
Born in 1948. Trustee since January 2008. Principal occupation(s) during the past five years and other experience: executive chief staff and marketing officer for North America and corporate vice president (retired 2008) of Xerox Corporation (document management products and services). Former president of the Worldwide Channels Group, Latin America, and Worldwide Customer Service and executive chief staff officer of Developing Markets of Xerox. Executive in residence and 2009–2010 Distinguished Minett Professor at the Rochester Institute of Technology. Director of SPX FLOW, Inc. (multi-industry manufac-turing). Director of the University of Rochester Medical Center, the Monroe Community College Foundation, the United Way of Rochester, North Carolina A&T University, and Roberts Wesleyan College. Trustee of the University of Rochester.
Amy Gutmann
Born in 1949. Trustee since June 2006. Principal occupation(s) during the past five years and other experience: president (2004–present) of the University of Pennsylvania. Christopher H. Browne Distinguished Professor of Political Science, School of Arts and Sciences, and professor of communication, Annenberg School for Communication, with secondary faculty appointments in the Department of Philosophy, School of Arts and Sciences, and at the Graduate School of Education, University of Pennsylvania.
F. Joseph Loughrey
Born in 1949. Trustee since October 2009. Principal occupation(s) during the past five years and other experience: president and chief operating officer (retired 2009) and vice chairman of the board (2008–2009) of Cummins Inc. (industrial machinery). Chairman of the board of Hillenbrand, Inc. (specialized consumer services) and the Lumina Foundation. Director of the V Foundation. Member of the advisory
| 1 | Mr. Buckley is considered an “interested person,” as defined in the Investment Company Act of 1940, because he is an officer of the Vanguard funds. |
council for the College of Arts and Letters and chair of the advisory board to the Kellogg Institute for International Studies, both at the University of Notre Dame.
Mark Loughridge
Born in 1953. Trustee since March 2012. Principal occupation(s) during the past five years and other experience: senior vice president and chief financial officer (retired 2013) of IBM (information technology services). Fiduciary member of IBM’s Retirement Plan Committee (2004–2013), senior vice president and general manager (2002–2004) of IBM Global Financing, vice president and controller (1998–2002) of IBM, and a variety of other prior management roles at IBM. Member of the Council on Chicago Booth.
Scott C. Malpass
Born in 1962. Trustee since March 2012. Principal occupation(s) during the past five years and other experience: chief investment officer (retired June 2020) and vice president (retired June 2020) of the University of Notre Dame. Assistant professor of finance at the Mendoza College of Business, University of Notre Dame, and member of the Notre Dame 403(b) Investment Committee (retired June 2020). Member of the board of Catholic Investment Services, Inc. (investment advisors) and the board of superintendence of the Institute for the Works of Religion.
Deanna Mulligan
Born in 1963. Trustee since January 2018. Principal occupation(s) during the past five years and other experience: chief executive officer (2011–present) of The Guardian Life Insurance Company of America. President (2010–2019), chief operating officer (2010–2011), and executive vice president (2008–2010) of Individual Life and Disability of The Guardian Life Insurance Company of America. Member of the board of The Guardian Life Insurance Company of America, the American Council of Life Insurers, and the Economic Club of New York. Trustee of the Partnership for New York City (business leadership), Chief Executives for Corporate Purpose, NewYork-Presbyterian Hospital, Catalyst, and the Bruce Museum (arts and science). Member of the Advisory Council for the Stanford Graduate School of Business.
André F. Perold
Born in 1952. Trustee since December 2004. Principal occupation(s) during the past five years and other experience: George Gund Professor of Finance and Banking, Emeritus at the Harvard Business School (retired 2011). Chief investment officer and co-managing partner of HighVista Strategies (private investment firm). Member of the board of advisors and member of the investment committee of the Museum of Fine Arts Boston. Member of the board (2018–present) of RIT Capital Partners (investment firm). Member of the investment committee of Partners Health Care System.
Sarah Bloom Raskin
Born in 1961. Trustee since January 2018. Principal occupation(s) during the past five years and other experience: deputy secretary (2014–2017) of the United States Department of the Treasury. Governor (2010–2014) of the Federal Reserve Board. Commissioner (2007–2010) of financial regulation for the State of Maryland. Member of the board of directors (2012–2014) of Neighborhood Reinvestment Corporation. Director (2017–present) of i(x) Investments, LLC; director (2017–present) of Reserve Trust. Rubenstein Fellow (2017–present) of Duke University; trustee (2017–present) of Amherst College, and trustee (2019–present) of the Folger Shakespeare Library.
Peter F. Volanakis
Born in 1955. Trustee since July 2009. Principal occupation(s) during the past five years and other experience: president and chief operating officer (retired 2010) of Corning Incorporated (communications equipment) and director of Corning Incorporated (2000–2010) and Dow Corning (2001–2010). Director (2012) of SPX Corporation (multi-industry manufacturing). Overseer of the Amos Tuck School of Business Administration, Dartmouth College (2001–2013). Chairman of the board of trustees of Colby-Sawyer College. Member of the board of Hypertherm Inc. (industrial cutting systems, software, and consumables).
Executive Officers
John Bendl
Born in 1970. Principal occupation(s) during the past five years and other experience: principal of Vanguard. Chief financial officer (2019–present) of each of the investment companies served by Vanguard. Chief accounting officer, treasurer, and controller of Vanguard (2017–present). Partner (2003–2016) at KPMG (audit, tax, and advisory services).
Glenn Booraem
Born in 1967. Principal occupation(s) during the past five years and other experience: principal of Vanguard. Investment stewardship officer (2017–present), treasurer (2015–2017), controller (2010–2015), and assistant controller (2001–2010) of each of the investment companies served by Vanguard.
Christine M. Buchanan
Born in 1970. Principal occupation(s) during the past five years and other experience: principal of Vanguard. Treasurer (2017–present) of each of the investment companies served by Vanguard. Partner (2005–2017) at KPMG (audit, tax, and advisory services).
David Cermak
Born in 1960. Principal occupation(s) during the past five years and other experience: principal of Vanguard. Finance director (2019–present) of each of the investment companies served by Vanguard. Managing director and head (2017–present) of Vanguard Investments Singapore. Managing director and head (2017–2019) of Vanguard Investments Hong Kong. Representative director and head (2014–2017) of Vanguard Investments Japan.
Thomas J. Higgins
Born in 1957. Principal occupation(s) during the past five years and other experience: principal of Vanguard. Finance director (2019–present), chief financial officer (2008–2019), and treasurer (1998–2008) of each of the investment companies served by Vanguard.
Peter Mahoney
Born in 1974. Principal occupation(s) during the past five years and other experience: principal of Vanguard. Controller (2015–present) of each of the investment companies served by Vanguard. Head of International Fund Services (2008–2014) at Vanguard.
Anne E. Robinson
Born in 1970. Principal occupation(s) during the past five years and other experience: general counsel (2016–present) of Vanguard. Secretary (2016–present) of Vanguard and of each of the investment companies served by Vanguard. Managing director (2016–present) of Vanguard. Managing director and general counsel of Global Cards and Consumer Services (2014–2016) at Citigroup. Counsel (2003–2014) at American Express.
Michael Rollings
Born in 1963. Principal occupation(s) during the past five years and other experience: finance director (2017–present) and treasurer (2017) of each of the investment companies served by Vanguard. Managing director (2016–present) of Vanguard. Chief financial officer (2016–present) of Vanguard. Director (2016–present) of Vanguard Marketing Corporation. Executive vice president and chief financial officer (2006–2016) of MassMutual Financial Group.
John E. Schadl
Born in 1972. Principal occupation(s) during the past five years and other experience: principal of Vanguard. Chief compliance officer (2019–present) of Vanguard and of each of the investment companies served by Vanguard. Assistant vice president (2019–present) of Vanguard Marketing Corporation.
Vanguard Senior Management Team
| Joseph Brennan | Chris D. McIsaac |
| Mortimer J. Buckley | James M. Norris |
| Gregory Davis | Thomas M. Rampulla |
| John James | Karin A. Risi |
| Martha G. King | Anne E. Robinson |
| John T. Marcante | Michael Rollings |
Connect with Vanguard® > vanguard.com
| Fund Information > 800-662-7447 |
Direct Investor Account Services > 800-662-2739
Institutional Investor Services > 800-523-1036
Text Telephone for People
Who Are Deaf or Hard of Hearing > 800-749-7273
This material may be used in conjunction with the offering of shares of any Vanguard fund only if preceded or accompanied by the fund’s current prospectus.
All comparative mutual fund data are from Morningstar, Inc., unless otherwise noted.
You can obtain a free copy of Vanguard’s proxy voting guidelines by visiting vanguard.com/proxyreporting or by calling Vanguard at 800-662-2739. The guidelines are also available from the SEC’s website, www.sec.gov. In addition, you may obtain a free report on how your fund voted the proxies for securities it owned during the 12 months ended June 30. To get the report, visit either vanguard.com/proxyreporting or www.sec.gov.
You can review information about your fund on the SEC’s website, and you can receive copies of this information, for a fee, by sending a request via email addressed to publicinfo@sec.gov.
CFA® is a registered trademark owned by CFA Institute.
© 2020 The Vanguard Group, Inc.
All rights reserved.
Vanguard Marketing Corporation, Distributor.
Q14960 102020
Annual Report | August 31, 2020
Vanguard ESG U.S. Stock ETF
See the inside front cover for important information about access to your fund’s annual and semiannual shareholder reports.
Important information about access to shareholder reports
Beginning on January 1, 2021, as permitted by regulations adopted by the Securities and Exchange Commission, paper copies of your fund’s annual and semiannual shareholder reports will no longer be sent to you by mail, unless you specifically request them. Instead, you will be notified by mail each time a report is posted on the website and will be provided with a link to access the report.
If you have already elected to receive shareholder reports electronically, you will not be affected by this change and do not need to take any action. You may elect to receive shareholder reports and other communications from the fund electronically by contacting your financial intermediary (such as a broker-dealer or bank) or, if you invest directly with the fund, by calling Vanguard at one of the phone numbers on the back cover of this report or by logging on to vanguard.com.
You may elect to receive paper copies of all future shareholder reports free of charge. If you invest through a financial intermediary, you can contact the intermediary to request that you continue to receive paper copies. If you invest directly with the fund, you can call Vanguard at one of the phone numbers on the back cover of this report or log on to vanguard.com. Your election to receive paper copies will apply to all the funds you hold through an intermediary or directly with Vanguard.
Contents
Please note: The opinions expressed in this report are just that—informed opinions. They should not be considered promises or advice. Also, please keep in mind that the information and opinions cover the period through the date on the front of this report. Of course, the risks of investing in your fund are spelled out in the prospectus.
Your Fund’s Performance at a Glance
| • | Vanguard ESG U.S. Stock ETF returned 27.60% for the 12 months ended August 31, 2020, roughly in line with the expense-free 27.71% return of its benchmark index. |
| • | A number of stock market indexes around the world climbed to record highs in February and then plummeted as the spread of the coronavirus beyond China led to lockdowns, the shuttering of nonessential businesses, and travel restrictions in many countries. However, the unprecedented scale of the response from policymakers, the start of trials for vaccines and treatments, and the easing of some pandemic-related restrictions helped lift investor sentiment. |
| • | U.S. stocks rebounded more strongly than both developed markets outside the United States and emerging markets. |
| • | For the fund’s benchmark, industry sector performances varied greatly over the 12 months. Technology, which accounts for the largest slice of the index, turned in a stellar performance of more than 60%. Consumer goods and consumer services also performed well. Utilities and oil and gas, the two smallest sectors, lagged, with returns in the red. Financials also turned in a negative performance. |
Market Barometer
| | Average Annual Total Returns
Periods Ended August 31, 2020 |
| | One Year | Three Years | Five Years |
| Stocks | | | |
| Russell 1000 Index (Large-caps) | 22.50% | 14.58% | 14.31% |
| Russell 2000 Index (Small-caps) | 6.02 | 5.03 | 7.65 |
| Russell 3000 Index (Broad U.S. market) | 21.44 | 13.95 | 13.86 |
| FTSE All-World ex US Index (International) | 8.78 | 2.92 | 6.00 |
| Bonds | | | |
| Bloomberg Barclays U.S. Aggregate Bond Index (Broad taxable market) | 6.47% | 5.09% | 4.33% |
| Bloomberg Barclays Municipal Bond Index (Broad tax-exempt market) | 3.24 | 4.09 | 3.99 |
| FTSE Three-Month U.S. Treasury Bill Index | 1.18 | 1.67 | 1.15 |
| CPI | | | |
| Consumer Price Index | 1.31% | 1.92% | 1.75% |
About Your Fund’s Expenses
As a shareholder of the fund, you incur ongoing costs, which include costs for portfolio management, administrative services, and shareholder reports (like this one), among others. Operating expenses, which are deducted from a fund’s gross income, directly reduce the investment return of the fund.
A fund‘s expenses are expressed as a percentage of its average net assets. This figure is known as the expense ratio. The following examples are intended to help you understand the ongoing costs (in dollars) of investing in your fund and to compare these costs with those of other mutual funds. The examples are based on an investment of $1,000 made at the beginning of the period shown and held for the entire period.
The accompanying table illustrates your fund’s costs in two ways:
| • | Based on actual fund return. This section helps you to estimate the actual expenses that you paid over the period. The ”Ending Account Value“ shown is derived from the fund’s actual return, and the third column shows the dollar amount that would have been paid by an investor who started with $1,000 in the fund. You may use the information here, together with the amount you invested, to estimate the expenses that you paid over the period. |
To do so, simply divide your account value by $1,000 (for example, an $8,600 account value divided by $1,000 = 8.6), then multiply the result by the number given for your fund under the heading ”Expenses Paid During Period.“
| • | Based on hypothetical 5% yearly return. This section is intended to help you compare your fund‘s costs with those of other mutual funds. It assumes that the fund had a yearly return of 5% before expenses, but that the expense ratio is unchanged. In this case—because the return used is not the fund’s actual return—the results do not apply to your investment. The example is useful in making comparisons because the Securities and Exchange Commission requires all mutual funds to calculate expenses based on a 5% return. You can assess your fund’s costs by comparing this hypothetical example with the hypothetical examples that appear in shareholder reports of other funds. |
Note that the expenses shown in the table are meant to highlight and help you compare ongoing costs only and do not reflect transaction costs incurred by the fund for buying and selling securities. Further, the expenses do not include any purchase, redemption, or account service fees described in the fund prospectus. If such fees were applied to your account, your costs would be higher. Your fund does not carry a “sales load.”
The calculations assume no shares were bought or sold during the period. Your actual costs may have been higher or lower, depending on the amount of your investment and the timing of any purchases or redemptions.
You can find more information about the fund’s expenses, including annual expense ratios, in the Financial Statements section of this report. For additional information on operating expenses and other shareholder costs, please refer to your fund’s current prospectus.
| Six Months Ended August 31, 2020 | | | |
| ESG U.S. Stock ETF | Beginning
Account Value
2/29/2020 | Ending
Account Value
8/31/2020 | Expenses
Paid During
Period |
| Based on Actual Fund Return | 1,000.00 | 1,239.20 | 0.68 |
| Based on Hypothetical 5% Yearly Return | 1,000.00 | 1,024.53 | 0.61 |
The calculations are based on expenses incurred in the most recent six-month period. The fund's annualized six-month expense ratio for that period is 0.12%. The dollar amounts shown as ”Expenses Paid” are equal to the annualized expense ratio multiplied by the average account value over the period, multiplied by the number of days in the most recent six-month period, then divided by the number of days in the most recent 12-month period (184/366).
All of the returns in this report represent past performance, which is not a guarantee of future results that may be achieved by the fund. (Current performance may be lower or higher than the performance data cited. For performance data current to the most recent month-end, visit our website at vanguard.com/performance.) Note, too, that both investment returns and principal value can fluctuate widely, so an investor’s shares, when sold, could be worth more or less than their original cost. The returns shown do not reflect taxes that a shareholder would pay on fund distributions or on the sale of fund shares.
Cumulative Performance: September 18, 2018, Through August 31, 2020
Initial Investment of $10,000
| | | | Average Annual Total Returns
Periods Ended August 31, 2020 |
| | | One
Year | Since
Inception
(9/18/2018) | Final Value
of a $10,000
Investment |
 | ESG U.S. Stock ETF Net Asset Value | 27.60% | 15.26% | $13,194 |
| | ESG U.S. Stock ETF Market Price | 27.71 | 15.33 | 13,209 |
 | FTSE US All Cap Choice Index | 27.71 | 15.39 | 13,223 |
 | Dow Jones U.S. Total Stock Market Float Adjusted Index | 21.20 | 11.07 | 12,274 |
“Since Inception” performance is calculated from the ETF Shares’ inception date for both the fund and its comparative standards.
See Financial Highlights for dividend and capital gains information.
| Cumulative Returns of ETF Shares: September 18, 2018, Through August 31, 2020 |
| | One
Year | Since
Inception
(9/18/2018) |
| ESG U.S. Stock ETF Market Price | 27.71% | 32.09% |
| ESG U.S. Stock ETF Net Asset Value | 27.60 | 31.94 |
| FTSE US All Cap Choice Index | 27.71 | 32.23 |
"Since Inception" performance is calculated from the ETF Shares’ inception date for both the fund and its comparative standards.
The market price is determined by the midpoint of the bid-offer spread as of the closing time of the New York Stock Exchange (generally 4 p.m., Eastern time). The net asset value is also determined as of the NYSE closing time. For more information about how the ETF Shares' market prices have compared with their net asset value, visit vanguard.com, select your ETF, and then select the Price and Performance tab. The ETF premium/discount analysis there shows the percentages of days on which the ETF Shares' market price was above or below the NAV.
| Basic Materials | 2.0% |
| Consumer Goods | 8.7 |
| Consumer Services | 15.9 |
| Financials | 15.6 |
| Health Care | 13.7 |
| Industrials | 8.8 |
| Oil & Gas | 0.1 |
| Technology | 32.3 |
| Telecommunications | 1.9 |
| Utilities | 1.0 |
The table reflects the fund’s investments, except for short-term investments and derivatives. Sector categories are based on the Industry Classification Benchmark (“ICB”), except for the “Other” category (if applicable), which includes securities that have not been provided an ICB classification as of the effective reporting period.
The fund may invest in derivatives (such as futures and swap contracts) for various reasons, including, but not limited to, attempting to remain fully invested and tracking its target index as closely as possible.
The Industry Classification Benchmark (“ICB”) is owned by FTSE. FTSE does not accept any liability to any person for any loss or damage arising out of any error or omission in the ICB.
The fund files its complete schedule of portfolio holdings with the Securities and Exchange Commission (SEC) for the first and third quarters of each fiscal year as an exhibit to its reports on Form N-PORT. The fund’s Form N-PORT reports are available on the SEC’s website at www.sec.gov.
| | | | | | Shares | Market
Value•
($000) |
| Common Stocks (99.8%) |
| Basic Materials (2.0%) |
| | Linde plc | 35,491 | 8,864 |
| | Air Products & Chemicals Inc. | 14,892 | 4,352 |
| | Newmont Corp. | 54,115 | 3,641 |
| | DuPont de Nemours Inc. | 49,766 | 2,775 |
| | Dow Inc. | 50,328 | 2,271 |
| | Fastenal Co. | 38,638 | 1,888 |
| | LyondellBasell Industries NV Class A | 17,386 | 1,138 |
| | International Paper Co. | 27,040 | 981 |
| | Nucor Corp. | 20,697 | 941 |
| | FMC Corp. | 8,722 | 932 |
| | International Flavors & Fragrances Inc. | 7,225 | 894 |
| | Celanese Corp. Class A | 7,767 | 786 |
| | RPM International Inc. | 8,434 | 715 |
| | Eastman Chemical Co. | 9,020 | 660 |
| | Albemarle Corp. | 7,163 | 652 |
| | Royal Gold Inc. | 4,502 | 614 |
| | CF Industries Holdings Inc. | 14,597 | 476 |
| | Scotts Miracle-Gro Co. | 2,678 | 451 |
| | Reliance Steel & Aluminum Co. | 4,214 | 442 |
| | Mosaic Co. | 24,161 | 441 |
| | Steel Dynamics Inc. | 13,638 | 403 |
| * | Axalta Coating Systems Ltd. | 14,398 | 343 |
| | Huntsman Corp. | 13,907 | 301 |
| | Ashland Global Holdings Inc. | 3,802 | 280 |
| | UFP Industries Inc. | 4,463 | 265 |
| | Valvoline Inc. | 12,626 | 258 |
| | Balchem Corp. | 2,235 | 218 |
| | Hecla Mining Co. | 35,337 | 213 |
| * | Univar Solutions Inc. | 11,664 | 212 |
| * | Alcoa Corp. | 13,284 | 194 |
| | HB Fuller Co. | 3,909 | 188 |
| | Cleveland-Cliffs Inc. | 28,446 | 187 |
| | Sensient Technologies Corp. | 3,197 | 177 |
| | Quaker Chemical Corp. | 910 | 173 |
| | Stepan Co. | 1,497 | 173 |
| | Avient Corp. | 6,672 | 170 |
| | | | | | Shares | Market
Value•
($000) |
| * | Ingevity Corp. | 2,976 | 167 |
| * | Element Solutions Inc. | 15,286 | 164 |
| | Cabot Corp. | 4,395 | 163 |
| | NewMarket Corp. | 438 | 163 |
| | W R Grace & Co. | 3,854 | 157 |
| * | Coeur Mining Inc. | 16,408 | 139 |
| | Westlake Chemical Corp. | 2,317 | 137 |
| | Compass Minerals International Inc. | 2,128 | 121 |
| | United States Steel Corp. | 14,906 | 117 |
| | Innospec Inc. | 1,500 | 112 |
| | Domtar Corp. | 3,795 | 108 |
| | Minerals Technologies Inc. | 2,104 | 107 |
| * | GCP Applied Technologies Inc. | 3,005 | 78 |
| | Kaiser Aluminum Corp. | 1,030 | 66 |
| * | Ferro Corp. | 4,354 | 54 |
| | Trinseo SA | 2,143 | 53 |
| * | Constellium SE Class A | 6,520 | 52 |
| | Schweitzer-Mauduit International Inc. | 1,627 | 49 |
| | Tronox Holdings plc Class A | 4,829 | 43 |
| | Neenah Inc. | 871 | 39 |
| | Orion Engineered Carbons SA | 3,241 | 39 |
| * | Century Aluminum Co. | 3,626 | 36 |
| * | Kraton Corp. | 1,701 | 24 |
| | Tredegar Corp. | 1,326 | 22 |
| | Nexa Resources SA | 2,107 | 17 |
| | | | | | | 39,896 |
| Consumer Goods (8.7%) |
| * | Tesla Inc. | 50,120 | 24,976 |
| | Procter & Gamble Co. | 165,005 | 22,825 |
| | PepsiCo Inc. | 93,933 | 13,156 |
| | Coca-Cola Co. | 262,059 | 12,980 |
| | NIKE Inc. Class B | 82,036 | 9,179 |
| | Mondelez International Inc. Class A | 95,622 | 5,586 |
| | Colgate-Palmolive Co. | 56,973 | 4,516 |
| | Activision Blizzard Inc. | 51,604 | 4,310 |
| | Kimberly-Clark Corp. | 22,918 | 3,616 |
| | | | | | Shares | Market
Value•
($000) |
| | Estee Lauder Cos. Inc. Class A | 14,999 | 3,326 |
| * | Lululemon Athletica Inc. | 7,708 | 2,896 |
| * | Electronic Arts Inc. | 19,284 | 2,690 |
| | General Mills Inc. | 41,138 | 2,631 |
| * | Monster Beverage Corp. | 24,985 | 2,095 |
| | Clorox Co. | 8,499 | 1,900 |
| | Ford Motor Co. | 263,775 | 1,799 |
| | McCormick & Co. Inc. (Non-Voting) | 8,355 | 1,723 |
| | Stanley Black & Decker Inc. | 10,500 | 1,694 |
| | Church & Dwight Co. Inc. | 16,700 | 1,600 |
| | DR Horton Inc. | 22,328 | 1,594 |
| | Aptiv plc | 18,225 | 1,570 |
| | Kraft Heinz Co. | 43,944 | 1,540 |
| | Hershey Co. | 9,969 | 1,482 |
| | Corteva Inc. | 50,986 | 1,456 |
| | VF Corp. | 22,130 | 1,455 |
| | Lennar Corp. Class A | 18,342 | 1,372 |
| * | Take-Two Interactive Software Inc. | 7,529 | 1,289 |
| | Conagra Brands Inc. | 32,808 | 1,258 |
| | Tyson Foods Inc. Class A | 19,482 | 1,223 |
| | Kellogg Co. | 16,986 | 1,204 |
| | Garmin Ltd. | 10,243 | 1,061 |
| | Tiffany & Co. | 8,258 | 1,012 |
| | Hormel Foods Corp. | 18,904 | 964 |
| * | NVR Inc. | 220 | 917 |
| | Genuine Parts Co. | 9,460 | 893 |
| | J M Smucker Co. | 7,433 | 893 |
| | Pool Corp. | 2,600 | 852 |
| | PulteGroup Inc. | 17,901 | 798 |
| | Fortune Brands Home & Security Inc. | 9,405 | 791 |
| | Keurig Dr Pepper Inc. | 26,032 | 777 |
| | Whirlpool Corp. | 4,164 | 740 |
| | Hasbro Inc. | 8,574 | 677 |
| * | LKQ Corp. | 20,124 | 639 |
| | Campbell Soup Co. | 11,837 | 623 |
| | Lamb Weston Holdings Inc. | 9,839 | 618 |
| | BorgWarner Inc. | 13,957 | 566 |
| | Coca-Cola European Partners plc | 13,726 | 565 |
| * | Zynga Inc. Class A | 59,406 | 538 |
| * | Beyond Meat Inc. | 3,659 | 497 |
| | Autoliv Inc. | 6,013 | 471 |
| | Lear Corp. | 4,093 | 466 |
| | Gentex Corp. | 16,387 | 443 |
| | Bunge Ltd. | 9,353 | 427 |
| | Newell Brands Inc. | 26,138 | 418 |
| * | Deckers Outdoor Corp. | 1,912 | 390 |
| * | Post Holdings Inc. | 4,411 | 388 |
| | Leggett & Platt Inc. | 9,160 | 376 |
| * | Helen of Troy Ltd. | 1,794 | 371 |
| | Ingredion Inc. | 4,580 | 368 |
| * | US Foods Holding Corp. | 15,074 | 367 |
| | | | | | Shares | Market
Value•
($000) |
| | Hanesbrands Inc. | 23,392 | 358 |
| * | Mohawk Industries Inc. | 3,774 | 348 |
| | Thor Industries Inc. | 3,689 | 348 |
| * | Darling Ingredients Inc. | 10,617 | 339 |
| *,1 | Herbalife Nutrition Ltd. | 6,899 | 339 |
| | Toll Brothers Inc. | 7,829 | 331 |
| | Flowers Foods Inc. | 13,297 | 325 |
| * | Freshpet Inc. | 2,677 | 304 |
| | Harley-Davidson Inc. | 10,537 | 292 |
| | Tapestry Inc. | 19,153 | 282 |
| * | Tempur Sealy International Inc. | 3,285 | 281 |
| * | Nomad Foods Ltd. | 11,379 | 281 |
| | PVH Corp. | 4,990 | 278 |
| * | Fox Factory Holding Corp. | 2,748 | 277 |
| * | Skechers U.S.A. Inc. Class A | 9,023 | 269 |
| * | YETI Holdings Inc. | 5,175 | 266 |
| * | Mattel Inc. | 23,912 | 257 |
| * | Meritage Homes Corp. | 2,634 | 253 |
| | Carter's Inc. | 3,056 | 243 |
| | Ralph Lauren Corp. Class A | 3,296 | 227 |
| | Lancaster Colony Corp. | 1,237 | 220 |
| | KB Home | 6,152 | 220 |
| * | Taylor Morrison Home Corp. Class A | 9,215 | 217 |
| | LCI Industries | 1,892 | 215 |
| | Energizer Holdings Inc. | 4,492 | 208 |
| | WD-40 Co. | 963 | 197 |
| * | Hain Celestial Group Inc. | 5,757 | 189 |
| | Spectrum Brands Holdings Inc. | 3,049 | 182 |
| * | Under Armour Inc. Class A | 18,510 | 182 |
| * | Crocs Inc. | 4,502 | 180 |
| | Columbia Sportswear Co. | 2,082 | 178 |
| * | TreeHouse Foods Inc. | 4,002 | 171 |
| * | LGI Homes Inc. | 1,522 | 170 |
| | Nu Skin Enterprises Inc. Class A | 3,561 | 168 |
| | Goodyear Tire & Rubber Co. | 17,296 | 166 |
| | Sanderson Farms Inc. | 1,375 | 161 |
| | J & J Snack Foods Corp. | 1,174 | 160 |
| | MDC Holdings Inc. | 3,536 | 153 |
| * | Capri Holdings Ltd. | 9,637 | 153 |
| * | iRobot Corp. | 1,990 | 147 |
| * | Dorman Products Inc. | 1,705 | 144 |
| * | Visteon Corp. | 1,890 | 143 |
| | B&G Foods Inc. | 4,155 | 129 |
| * | TRI Pointe Group Inc. | 7,606 | 128 |
| | Callaway Golf Co. | 6,073 | 127 |
| | Winnebago Industries Inc. | 2,322 | 125 |
| | Medifast Inc. | 765 | 124 |
| | Dana Inc. | 8,427 | 118 |
| | Wolverine World Wide Inc. | 4,680 | 117 |
| | Cooper Tire & Rubber Co. | 3,327 | 115 |
| * | Edgewell Personal Care Co. | 3,881 | 111 |
| | Steven Madden Ltd. | 5,224 | 111 |
| | | | | | Shares | Market
Value•
($000) |
| * | Delphi Technologies plc | 5,864 | 102 |
| * | Cavco Industries Inc. | 532 | 102 |
| * | Central Garden & Pet Co. Class A | 2,706 | 101 |
| * | Hostess Brands Inc. Class A | 7,826 | 100 |
| * | Adient plc | 5,600 | 97 |
| | Reynolds Consumer Products Inc. | 2,900 | 96 |
| | Herman Miller Inc. | 3,804 | 91 |
| | Coca-Cola Consolidated Inc. | 332 | 91 |
| * | Sleep Number Corp. | 1,895 | 91 |
| * | Cal-Maine Foods Inc. | 2,199 | 85 |
| * | Gentherm Inc. | 1,876 | 85 |
| * | American Woodmark Corp. | 952 | 83 |
| * | Knowles Corp. | 5,464 | 82 |
| * | Veoneer Inc. | 5,910 | 82 |
| | La-Z-Boy Inc. | 2,438 | 79 |
| | HNI Corp. | 2,453 | 78 |
| | Acushnet Holdings Corp. | 2,065 | 73 |
| | Kontoor Brands Inc. | 3,288 | 73 |
| | Coty Inc. Class A | 16,932 | 61 |
| * | Under Armour Inc. Class C | 6,936 | 61 |
| * | USANA Health Sciences Inc. | 722 | 57 |
| | Calavo Growers Inc. | 892 | 57 |
| | Signet Jewelers Ltd. | 2,884 | 50 |
| | Steelcase Inc. Class A | 4,831 | 50 |
| * | National Beverage Corp. | 593 | 48 |
| | Oxford Industries Inc. | 941 | 47 |
| * | Pilgrim's Pride Corp. | 2,937 | 47 |
| * | American Axle & Manufacturing Holdings Inc. | 5,865 | 46 |
| | Inter Parfums Inc. | 995 | 44 |
| | Fresh Del Monte Produce Inc. | 1,720 | 40 |
| | Knoll Inc. | 2,738 | 35 |
| | ACCO Brands Corp. | 5,086 | 33 |
| | Tootsie Roll Industries Inc. | 950 | 30 |
| | Andersons Inc. | 1,643 | 29 |
| * | Tenneco Inc. Class A | 3,284 | 27 |
| * | G-III Apparel Group Ltd. | 2,485 | 27 |
| * | Adecoagro SA | 5,204 | 26 |
| | Interface Inc. Class A | 3,346 | 25 |
| | | | | | | 171,305 |
| Consumer Services (15.8%) |
| * | Amazon.com Inc. | 28,754 | 99,229 |
| | Home Depot Inc. | 72,707 | 20,724 |
| | Walt Disney Co. | 122,482 | 16,152 |
| * | Netflix Inc. | 28,815 | 15,259 |
| | Comcast Corp. Class A | 306,906 | 13,752 |
| | McDonald's Corp. | 50,505 | 10,784 |
| | Costco Wholesale Corp. | 29,870 | 10,385 |
| | Lowe's Cos. Inc. | 51,164 | 8,426 |
| | Starbucks Corp. | 79,348 | 6,703 |
| | | | | | Shares | Market
Value•
($000) |
| * | Charter Communications Inc. Class A | 10,111 | 6,224 |
| | CVS Health Corp. | 88,451 | 5,495 |
| * | Booking Holdings Inc. | 2,754 | 5,261 |
| | Target Corp. | 33,781 | 5,108 |
| | TJX Cos. Inc. | 80,875 | 4,431 |
| * | MercadoLibre Inc. | 3,187 | 3,724 |
| | Dollar General Corp. | 17,006 | 3,433 |
| * | Uber Technologies Inc. | 92,463 | 3,110 |
| * | Chipotle Mexican Grill Inc. Class A | 1,919 | 2,514 |
| * | Spotify Technology SA | 8,875 | 2,504 |
| | eBay Inc. | 45,188 | 2,475 |
| * | O'Reilly Automotive Inc. | 4,918 | 2,290 |
| | Ross Stores Inc. | 23,628 | 2,152 |
| | Sysco Corp. | 32,684 | 1,966 |
| | Yum! Brands Inc. | 20,278 | 1,944 |
| | Walgreens Boots Alliance Inc. | 49,641 | 1,887 |
| * | AutoZone Inc. | 1,568 | 1,876 |
| | Kroger Co. | 52,221 | 1,863 |
| | Best Buy Co. Inc. | 15,373 | 1,705 |
| | McKesson Corp. | 10,930 | 1,677 |
| * | Dollar Tree Inc. | 15,898 | 1,531 |
| * | Copart Inc. | 13,712 | 1,417 |
| | Yum China Holdings Inc. | 24,374 | 1,407 |
| * | Wayfair Inc. Class A | 4,532 | 1,344 |
| * | CarMax Inc. | 10,975 | 1,174 |
| | Tractor Supply Co. | 7,790 | 1,159 |
| | Domino's Pizza Inc. | 2,605 | 1,065 |
| | ViacomCBS Inc. Class B | 36,864 | 1,027 |
| | AmerisourceBergen Corp. Class A | 9,924 | 963 |
| * | Etsy Inc. | 7,999 | 957 |
| | Expedia Group Inc. | 9,146 | 898 |
| | FactSet Research Systems Inc. | 2,477 | 868 |
| * | Burlington Stores Inc. | 4,394 | 865 |
| * | Ulta Beauty Inc. | 3,668 | 852 |
| | Omnicom Group Inc. | 14,501 | 784 |
| | Darden Restaurants Inc. | 8,842 | 766 |
| | Advance Auto Parts Inc. | 4,576 | 715 |
| | Cable One Inc. | 362 | 666 |
| * | Chegg Inc. | 8,301 | 612 |
| * | Altice USA Inc. Class A | 21,932 | 605 |
| * | DISH Network Corp. Class A | 16,859 | 599 |
| * | Liberty Media Corp.-Liberty Formula One Class C | 15,103 | 589 |
| | Vail Resorts Inc. | 2,689 | 585 |
| * | Liberty Global plc Class C | 24,927 | 574 |
| | Rollins Inc. | 10,267 | 566 |
| | Fox Corp. Class A | 20,189 | 562 |
| | Service Corp. International | 12,158 | 555 |
| * | Live Nation Entertainment Inc. | 9,553 | 543 |
| | | | | | Shares | Market
Value•
($000) |
| * | Bright Horizons Family Solutions Inc. | 4,032 | 536 |
| * | Liberty Media Corp.-Liberty SiriusXM Class A | 14,455 | 525 |
| | News Corp. Class A | 32,625 | 493 |
| | New York Times Co. Class A | 11,067 | 480 |
| | Sirius XM Holdings Inc. | 81,222 | 477 |
| * | Lyft Inc. Class A | 16,064 | 477 |
| * | IAA Inc. | 9,081 | 475 |
| | L Brands Inc. | 16,120 | 474 |
| | Interpublic Group of Cos. Inc. | 26,575 | 472 |
| | Williams-Sonoma Inc. | 5,208 | 457 |
| * | Grubhub Inc. | 6,225 | 450 |
| | Casey's General Stores Inc. | 2,516 | 447 |
| * | Floor & Decor Holdings Inc. Class A | 5,847 | 428 |
| | Aramark | 15,499 | 427 |
| | Dunkin' Brands Group Inc. | 5,598 | 426 |
| * | BJ's Wholesale Club Holdings Inc. | 9,253 | 411 |
| * | Five Below Inc. | 3,718 | 407 |
| * | Discovery Inc. Class A | 18,153 | 401 |
| | Southwest Airlines Co. | 10,665 | 401 |
| | Lithia Motors Inc. Class A | 1,551 | 386 |
| * | SiteOne Landscape Supply Inc. | 3,038 | 380 |
| | Fox Corp. Class B | 13,412 | 373 |
| | Nielsen Holdings plc | 24,290 | 371 |
| * | RH | 1,118 | 370 |
| * | ServiceMaster Global Holdings Inc. | 9,031 | 360 |
| * | Ollie's Bargain Outlet Holdings Inc. | 3,662 | 350 |
| | Delta Air Lines Inc. | 11,177 | 345 |
| | Wingstop Inc. | 2,042 | 334 |
| * | Planet Fitness Inc. Class A | 5,475 | 333 |
| * | Performance Food Group Co. | 8,880 | 324 |
| * | Liberty Global plc Class A | 13,792 | 322 |
| | Dolby Laboratories Inc. Class A | 4,387 | 306 |
| * | Grand Canyon Education Inc. | 3,090 | 291 |
| | Nexstar Media Group Inc. Class A | 2,954 | 284 |
| | Texas Roadhouse Inc. Class A | 4,500 | 283 |
| * | Stamps.com Inc. | 1,104 | 275 |
| * | Discovery Inc. Class C | 13,599 | 272 |
| | Aaron's Inc. | 4,799 | 268 |
| * | frontdoor Inc. | 5,945 | 259 |
| | Wendy's Co. | 12,332 | 258 |
| * | LiveRamp Holdings Inc. | 4,578 | 256 |
| | Dick's Sporting Goods Inc. | 4,392 | 238 |
| | Kohl's Corp. | 11,040 | 236 |
| * | AutoNation Inc. | 4,109 | 234 |
| | Morningstar Inc. | 1,445 | 231 |
| | | | | | Shares | Market
Value•
($000) |
| | Cracker Barrel Old Country Store Inc. | 1,698 | 227 |
| | Foot Locker Inc. | 7,407 | 225 |
| | Gap Inc. | 12,916 | 225 |
| | Papa John's International Inc. | 2,267 | 223 |
| * | Madison Square Garden Sports Corp. | 1,297 | 213 |
| * | National Vision Holdings Inc. | 5,561 | 209 |
| | H&R Block Inc. | 13,662 | 198 |
| * | Grocery Outlet Holding Corp. | 4,788 | 197 |
| | TEGNA Inc. | 15,477 | 194 |
| * | 2U Inc. | 4,628 | 192 |
| * | Sprouts Farmers Market Inc. | 8,014 | 187 |
| * | United Airlines Holdings Inc. | 4,908 | 177 |
| | Strategic Education Inc. | 1,611 | 165 |
| | Macy's Inc. | 23,182 | 162 |
| | Extended Stay America Inc. | 12,870 | 161 |
| | TripAdvisor Inc. | 6,768 | 158 |
| | KAR Auction Services Inc. | 8,898 | 154 |
| * | Cargurus Inc. Class A | 6,002 | 146 |
| * | Asbury Automotive Group Inc. | 1,371 | 145 |
| | World Wrestling Entertainment Inc. Class A | 3,266 | 144 |
| * | Shake Shack Inc. Class A | 2,113 | 144 |
| | Sabre Corp. | 20,141 | 141 |
| | Graham Holdings Co. Class B | 320 | 137 |
| * | Simply Good Foods Co. | 5,406 | 134 |
| * | Liberty Latin America Ltd. Class C | 13,052 | 125 |
| | Jack in the Box Inc. | 1,489 | 123 |
| | Brinker International Inc. | 2,635 | 119 |
| | Big Lots Inc. | 2,491 | 117 |
| * | Hilton Grand Vacations Inc. | 5,215 | 114 |
| | American Eagle Outfitters Inc. | 8,623 | 109 |
| * | Avis Budget Group Inc. | 3,199 | 109 |
| | Nordstrom Inc. | 6,741 | 108 |
| * | Liberty Media Corp.-Liberty SiriusXM Class C | 2,897 | 104 |
| | Core-Mark Holding Co. Inc. | 3,105 | 104 |
| * | Yelp Inc. Class A | 4,391 | 102 |
| | Group 1 Automotive Inc. | 1,184 | 102 |
| | Cinemark Holdings Inc. | 6,894 | 101 |
| | Bed Bath & Beyond Inc. | 8,315 | 101 |
| | PriceSmart Inc. | 1,498 | 99 |
| | American Airlines Group Inc. | 7,490 | 98 |
| * | Adtalem Global Education Inc. | 2,907 | 97 |
| | Six Flags Entertainment Corp. | 4,425 | 96 |
| | Monro Inc. | 2,061 | 95 |
| * | Lions Gate Entertainment Corp. Class B | 10,337 | 94 |
| | | | | | Shares | Market
Value•
($000) |
| * | Urban Outfitters Inc. | 3,827 | 90 |
| | Rush Enterprises Inc. Class A | 1,790 | 87 |
| | Rent-A-Center Inc. | 2,771 | 85 |
| * | Upwork Inc. | 5,566 | 85 |
| | Penske Automotive Group Inc. | 1,738 | 82 |
| | John Wiley & Sons Inc. Class A | 2,532 | 80 |
| * | Laureate Education Inc. Class A | 6,262 | 78 |
| * | Gray Television Inc. | 4,975 | 77 |
| * | WW International Inc. | 3,210 | 75 |
| * | Sally Beauty Holdings Inc. | 6,538 | 73 |
| | Alaska Air Group Inc. | 1,837 | 72 |
| | ODP Corp. | 2,997 | 70 |
| * | SeaWorld Entertainment Inc. | 3,322 | 68 |
| | Cheesecake Factory Inc. | 2,276 | 67 |
| | Bloomin' Brands Inc. | 4,639 | 67 |
| * | Michaels Cos. Inc. | 5,213 | 59 |
| * | AMC Networks Inc. Class A | 2,317 | 56 |
| | Dine Brands Global Inc. | 864 | 51 |
| | Dave & Buster's Entertainment Inc. | 2,739 | 46 |
| * | JetBlue Airways Corp. | 3,921 | 45 |
| * | IMAX Corp. | 2,925 | 45 |
| | Abercrombie & Fitch Co. Class A | 3,406 | 44 |
| * | Liberty Media Corp.-Liberty Braves Class C | 2,161 | 42 |
| * | MakeMyTrip Ltd. | 2,496 | 42 |
| * | Groupon Inc. Class A | 1,233 | 39 |
| | Allegiant Travel Co. Class A | 283 | 36 |
| | Matthews International Corp. Class A | 1,638 | 36 |
| | Scholastic Corp. | 1,547 | 35 |
| | Meredith Corp. | 2,344 | 33 |
| | BJ's Restaurants Inc. | 1,021 | 32 |
| | EW Scripps Co. Class A | 2,870 | �� 32 |
| | Buckle Inc. | 1,669 | 31 |
| | Weis Markets Inc. | 628 | 31 |
| | SkyWest Inc. | 892 | 30 |
| | News Corp. Class B | 1,976 | 30 |
| * | Cars.com Inc. | 3,358 | 29 |
| | Guess? Inc. | 2,538 | 29 |
| | Designer Brands Inc. Class A | 3,597 | 25 |
| * | Lions Gate Entertainment Corp. Class A | 2,342 | 23 |
| | Caleres Inc. | 2,899 | 23 |
| * | MSG Networks Inc. Class A | 2,400 | 23 |
| | Copa Holdings SA Class A | 435 | 23 |
| | Viad Corp. | 1,049 | 22 |
| * | Spirit Airlines Inc. | 1,137 | 20 |
| * | Genesco Inc. | 1,031 | 20 |
| | Children's Place Inc. | 818 | 16 |
| | Hawaiian Holdings Inc. | 1,117 | 15 |
| | | | | | Shares | Market
Value•
($000) |
| * | Regis Corp. | 1,950 | 14 |
| * | Houghton Mifflin Harcourt Co. | 5,886 | 13 |
| | Gannett Co. Inc. | 6,395 | 11 |
| * | Liberty Media Corp.-Liberty Braves Class A | 435 | 9 |
| * | Hertz Global Holdings Inc. | 5,132 | 7 |
| * | Liberty Latin America Ltd. Class A | 449 | 4 |
| | | | | | | 312,556 |
| Financials (15.6%) |
| | Visa Inc. Class A | 114,370 | 24,245 |
| | Mastercard Inc. Class A | 59,775 | 21,411 |
| | JPMorgan Chase & Co. | 205,044 | 20,543 |
| | Bank of America Corp. | 522,839 | 13,458 |
| | American Tower Corp. | 29,870 | 7,442 |
| | Citigroup Inc. | 141,057 | 7,211 |
| | S&P Global Inc. | 16,316 | 5,979 |
| | BlackRock Inc. | 9,973 | 5,926 |
| | Prologis Inc. | 49,901 | 5,083 |
| | Equinix Inc. | 5,906 | 4,664 |
| | Goldman Sachs Group Inc. | 22,425 | 4,594 |
| | Crown Castle International Corp. | 28,057 | 4,580 |
| | American Express Co. | 44,274 | 4,498 |
| | CME Group Inc. | 23,999 | 4,221 |
| | Marsh & McLennan Cos. Inc. | 34,304 | 3,942 |
| | Morgan Stanley | 74,714 | 3,905 |
| | Intercontinental Exchange Inc. | 36,627 | 3,891 |
| | Chubb Ltd. | 30,492 | 3,812 |
| | Progressive Corp. | 39,539 | 3,758 |
| | Truist Financial Corp. | 90,919 | 3,529 |
| | US Bancorp | 91,488 | 3,330 |
| | Moody's Corp. | 10,970 | 3,232 |
| | PNC Financial Services Group Inc. | 28,547 | 3,174 |
| | Aon plc Class A | 15,479 | 3,096 |
| | Digital Realty Trust Inc. | 18,018 | 2,805 |
| | Charles Schwab Corp. | 78,237 | 2,780 |
| | SBA Communications Corp. Class A | 7,466 | 2,285 |
| * | CoStar Group Inc. | 2,605 | 2,211 |
| | Public Storage | 10,305 | 2,189 |
| | IHS Markit Ltd. | 26,712 | 2,135 |
| | Capital One Financial Corp. | 30,921 | 2,134 |
| | T. Rowe Price Group Inc. | 15,301 | 2,130 |
| | MSCI Inc. Class A | 5,664 | 2,114 |
| | Bank of New York Mellon Corp. | 54,211 | 2,005 |
| | MetLife Inc. | 51,963 | 1,999 |
| | Travelers Cos. Inc. | 17,082 | 1,982 |
| | Allstate Corp. | 21,233 | 1,975 |
| | Prudential Financial Inc. | 26,852 | 1,820 |
| | Willis Towers Watson plc | 8,627 | 1,773 |
| | | | | | Shares | Market
Value•
($000) |
| | Aflac Inc. | 47,935 | 1,741 |
| | American International Group Inc. | 58,311 | 1,699 |
| | Welltower Inc. | 28,282 | 1,627 |
| | State Street Corp. | 23,781 | 1,619 |
| | AvalonBay Communities Inc. | 9,539 | 1,508 |
| | Realty Income Corp. | 23,298 | 1,445 |
| | Alexandria Real Estate Equities Inc. | 8,417 | 1,417 |
| | Equity Residential | 24,768 | 1,398 |
| | Arthur J Gallagher & Co. | 12,744 | 1,342 |
| | Ameriprise Financial Inc. | 8,323 | 1,305 |
| | First Republic Bank | 11,471 | 1,295 |
| | MarketAxess Holdings Inc. | 2,486 | 1,208 |
| | Discover Financial Services | 20,939 | 1,111 |
| | Broadridge Financial Solutions Inc. | 7,784 | 1,070 |
| | Invitation Homes Inc. | 36,908 | 1,057 |
| | Northern Trust Corp. | 12,905 | 1,057 |
| * | CBRE Group Inc. Class A | 22,292 | 1,048 |
| | Ventas Inc. | 25,257 | 1,041 |
| | Nasdaq Inc. | 7,720 | 1,038 |
| * | Markel Corp. | 941 | 1,023 |
| | Healthpeak Properties Inc. | 36,861 | 1,019 |
| | Fifth Third Bancorp | 48,240 | 997 |
| | Sun Communities Inc. | 6,629 | 988 |
| | Synchrony Financial | 39,520 | 981 |
| | Hartford Financial Services Group Inc. | 24,078 | 974 |
| | Duke Realty Corp. | 25,052 | 966 |
| | Boston Properties Inc. | 10,769 | 936 |
| | Mid-America Apartment Communities Inc. | 7,789 | 912 |
| | M&T Bank Corp. | 8,694 | 898 |
| | Extra Space Storage Inc. | 8,382 | 893 |
| * | SVB Financial Group | 3,465 | 885 |
| * | Arch Capital Group Ltd. | 26,704 | 842 |
| | KeyCorp | 66,022 | 813 |
| | Cincinnati Financial Corp. | 10,216 | 811 |
| | WP Carey Inc. | 11,663 | 809 |
| | E*TRADE Financial Corp. | 14,794 | 800 |
| * | Zillow Group Inc. Class A | 9,195 | 784 |
| | Equity LifeStyle Properties Inc. | 11,710 | 776 |
| | Principal Financial Group Inc. | 18,299 | 771 |
| | Regions Financial Corp. | 64,651 | 747 |
| | Citizens Financial Group Inc. | 28,616 | 740 |
| | Brown & Brown Inc. | 15,602 | 724 |
| | Annaly Capital Management Inc. | 97,847 | 719 |
| | Credicorp Ltd. | 5,500 | 718 |
| | UDR Inc. | 19,973 | 695 |
| | Cboe Global Markets Inc. | 7,395 | 679 |
| | TD Ameritrade Holding Corp. | 17,527 | 673 |
| | Medical Properties Trust Inc. | 35,110 | 652 |
| | Western Union Co. | 27,499 | 649 |
| | | | | | Shares | Market
Value•
($000) |
| | Huntington Bancshares Inc. | 68,152 | 641 |
| | CyrusOne Inc. | 7,663 | 640 |
| | Raymond James Financial Inc. | 8,270 | 626 |
| | RenaissanceRe Holdings Ltd. | 3,304 | 607 |
| | Fidelity National Financial Inc. | 18,379 | 603 |
| | Everest Re Group Ltd. | 2,674 | 589 |
| | Ally Financial Inc. | 25,648 | 587 |
| | Iron Mountain Inc. | 19,254 | 579 |
| | Camden Property Trust | 6,347 | 577 |
| | W R Berkley Corp. | 9,301 | 577 |
| | Globe Life Inc. | 6,990 | 577 |
| | Equitable Holdings Inc. | 27,195 | 576 |
| | AGNC Investment Corp. | 38,582 | 544 |
| | Host Hotels & Resorts Inc. | 47,670 | 535 |
| | Alleghany Corp. | 965 | 535 |
| | Americold Realty Trust | 13,406 | 514 |
| | American Homes 4 Rent Class A | 17,910 | 513 |
| | VEREIT Inc. | 73,408 | 493 |
| | Assurant Inc. | 3,979 | 484 |
| | Lincoln National Corp. | 13,189 | 475 |
| | Omega Healthcare Investors Inc. | 15,173 | 470 |
| | Kilroy Realty Corp. | 7,837 | 459 |
| | Regency Centers Corp. | 11,270 | 448 |
| | Voya Financial Inc. | 8,455 | 439 |
| | LPL Financial Holdings Inc. | 5,319 | 437 |
| | Vornado Realty Trust | 11,907 | 427 |
| | Reinsurance Group of America Inc. | 4,599 | 422 |
| | STORE Capital Corp. Class A | 15,169 | 410 |
| | National Retail Properties Inc. | 11,484 | 407 |
| | SEI Investments Co. | 7,726 | 405 |
| | CubeSmart | 12,787 | 404 |
| | Lamar Advertising Co. Class A | 5,766 | 399 |
| | Commerce Bancshares Inc. | 6,633 | 395 |
| | Federal Realty Investment Trust | 4,975 | 394 |
| | First American Financial Corp. | 7,376 | 388 |
| | Healthcare Trust of America Inc. Class A | 14,423 | 381 |
| | Rexford Industrial Realty Inc. | 7,914 | 380 |
| | Comerica Inc. | 9,593 | 379 |
| | Franklin Resources Inc. | 17,981 | 379 |
| | First Horizon National Corp. | 38,089 | 364 |
| | Jones Lang LaSalle Inc. | 3,510 | 362 |
| | Apartment Investment & Management Co. Class A | 9,934 | 358 |
| | First Industrial Realty Trust Inc. | 8,374 | 357 |
| | EastGroup Properties Inc. | 2,606 | 347 |
| | | | | | Shares | Market
Value•
($000) |
| | East West Bancorp Inc. | 9,409 | 346 |
| | Zions Bancorp NA | 10,650 | 343 |
| | Signature Bank | 3,483 | 338 |
| | STAG Industrial Inc. | 10,466 | 338 |
| | Kimco Realty Corp. | 28,114 | 337 |
| | Kemper Corp. | 4,332 | 336 |
| | Life Storage Inc. | 3,185 | 336 |
| | Prosperity Bancshares Inc. | 6,100 | 333 |
| * | Zillow Group Inc. Class C | 3,842 | 330 |
| | American Financial Group Inc. | 4,925 | 329 |
| | Primerica Inc. | 2,616 | 327 |
| | CoreSite Realty Corp. | 2,652 | 325 |
| | Douglas Emmett Inc. | 11,431 | 319 |
| | Eaton Vance Corp. | 7,675 | 315 |
| | Kinsale Capital Group Inc. | 1,517 | 314 |
| | Old Republic International Corp. | 19,379 | 312 |
| * | Redfin Corp. | 6,495 | 309 |
| | People's United Financial Inc. | 28,353 | 300 |
| | Cousins Properties Inc. | 9,970 | 298 |
| | Starwood Property Trust Inc. | 18,661 | 291 |
| * | Athene Holding Ltd. Class A | 7,889 | 288 |
| | South State Corp. | 5,112 | 285 |
| | Rayonier Inc. | 9,646 | 282 |
| | New York Community Bancorp Inc. | 31,054 | 281 |
| | TCF Financial Corp. | 10,327 | 278 |
| | First Financial Bankshares Inc. | 9,070 | 275 |
| | Axis Capital Holdings Ltd. | 5,739 | 274 |
| | Cullen/Frost Bankers Inc. | 3,922 | 272 |
| | Ares Management Corp. Class A | 6,641 | 269 |
| | Invesco Ltd. | 26,265 | 268 |
| | Essent Group Ltd. | 7,440 | 266 |
| | QTS Realty Trust Inc. Class A | 3,910 | 265 |
| | Terreno Realty Corp. | 4,448 | 265 |
| | Highwoods Properties Inc. | 7,074 | 264 |
| | Healthcare Realty Trust Inc. | 9,083 | 262 |
| | Unum Group | 14,078 | 260 |
| | Spirit Realty Capital Inc. | 7,309 | 260 |
| | Hanover Insurance Group Inc. | 2,521 | 258 |
| | RLI Corp. | 2,690 | 252 |
| | SL Green Realty Corp. | 5,354 | 250 |
| | Interactive Brokers Group Inc. Class A | 4,701 | 249 |
| | Selective Insurance Group Inc. | 4,147 | 248 |
| | Physicians Realty Trust | 13,616 | 247 |
| | Equity Commonwealth | 7,788 | 244 |
| | Agree Realty Corp. | 3,613 | 242 |
| | Brixmor Property Group Inc. | 20,398 | 241 |
| | Western Alliance Bancorp | 6,803 | 240 |
| | | | | | Shares | Market
Value•
($000) |
| | Hudson Pacific Properties Inc. | 10,189 | 239 |
| | Stifel Financial Corp. | 4,675 | 237 |
| | Synovus Financial Corp. | 10,726 | 235 |
| | JBG SMITH Properties | 8,441 | 234 |
| | Affiliated Managers Group Inc. | 3,307 | 227 |
| | Glacier Bancorp Inc. | 6,453 | 226 |
| | United Bankshares Inc. | 8,663 | 226 |
| | Janus Henderson Group plc | 10,897 | 226 |
| | White Mountains Insurance Group Ltd. | 250 | 223 |
| | Lazard Ltd. Class A | 7,033 | 223 |
| | PotlatchDeltic Corp. | 4,828 | 222 |
| | Hannon Armstrong Sustainable Infrastructure Capital Inc. | 5,165 | 219 |
| | Popular Inc. | 5,846 | 217 |
| | Community Bank System Inc. | 3,584 | 216 |
| | Blackstone Mortgage Trust Inc. Class A | 9,065 | 215 |
| | Valley National Bancorp | 28,253 | 212 |
| * | Cannae Holdings Inc. | 5,543 | 209 |
| | MGIC Investment Corp. | 22,688 | 208 |
| * | Brighthouse Financial Inc. | 6,814 | 207 |
| | Radian Group Inc. | 13,232 | 204 |
| | Bank OZK | 8,738 | 201 |
| | Lexington Realty Trust | 17,627 | 200 |
| | National Health Investors Inc. | 3,203 | 199 |
| | SLM Corp. | 25,596 | 196 |
| | FNB Corp. | 25,851 | 194 |
| | Corporate Office Properties Trust | 7,785 | 192 |
| | Home BancShares Inc. | 11,831 | 192 |
| | Old National Bancorp | 13,565 | 190 |
| | UMB Financial Corp. | 3,496 | 188 |
| | Evercore Inc. Class A | 3,011 | 186 |
| | Webster Financial Corp. | 6,766 | 186 |
| | PS Business Parks Inc. | 1,461 | 184 |
| * | WillScot Mobile Mini Holdings Corp. Class A | 10,112 | 181 |
| | EPR Properties | 5,564 | 180 |
| | Wintrust Financial Corp. | 4,102 | 179 |
| | Outfront Media Inc. | 10,521 | 178 |
| | CNO Financial Group Inc. | 10,834 | 177 |
| | CVB Financial Corp. | 9,444 | 172 |
| | Associated Banc-Corp | 12,785 | 172 |
| | Federated Hermes Inc. Class B | 7,095 | 170 |
| | Houlihan Lokey Inc. Class A | 2,852 | 167 |
| | First Citizens BancShares Inc. Class A | 423 | 166 |
| * | Howard Hughes Corp. | 2,807 | 166 |
| | Bank of Hawaii Corp. | 2,992 | 165 |
| | | | | | Shares | Market
Value•
($000) |
| | FirstCash Inc. | 2,757 | 165 |
| | Park Hotels & Resorts Inc. | 17,315 | 164 |
| | BankUnited Inc. | 6,980 | 163 |
| | First Hawaiian Inc. | 9,840 | 163 |
| | BancorpSouth Bank | 7,510 | 162 |
| | Piedmont Office Realty Trust Inc. Class A | 10,427 | 160 |
| | Cathay General Bancorp | 6,451 | 159 |
| * | Enstar Group Ltd. | 889 | 159 |
| | Columbia Banking System Inc. | 5,659 | 158 |
| | Taubman Centers Inc. | 4,106 | 157 |
| | Weingarten Realty Investors | 8,824 | 154 |
| | Independent Bank Corp. | 2,439 | 153 |
| | CIT Group Inc. | 7,714 | 152 |
| | National General Holdings Corp. | 4,442 | 151 |
| | Washington REIT | 6,720 | 147 |
| | American Equity Investment Life Holding Co. | 6,144 | 147 |
| | Hancock Whitney Corp. | 7,143 | 143 |
| * | PRA Group Inc. | 3,036 | 142 |
| | Chimera Investment Corp. | 15,827 | 141 |
| | Washington Federal Inc. | 5,980 | 140 |
| | Sunstone Hotel Investors Inc. | 16,597 | 138 |
| | Uniti Group Inc. | 13,537 | 133 |
| | Artisan Partners Asset Management Inc. Class A | 3,436 | 133 |
| | National Storage Affiliates Trust | 3,770 | 129 |
| | Assured Guaranty Ltd. | 5,984 | 128 |
| | Kennedy-Wilson Holdings Inc. | 8,515 | 122 |
| | OneMain Holdings Inc. | 4,188 | 122 |
| | PennyMac Financial Services Inc. | 2,297 | 121 |
| | Ryman Hospitality Properties Inc. | 3,096 | 118 |
| | CareTrust REIT Inc. | 6,012 | 116 |
| | Brandywine Realty Trust | 10,367 | 115 |
| | Pacific Premier Bancorp Inc. | 5,109 | 115 |
| | Investors Bancorp Inc. | 14,756 | 114 |
| | BOK Financial Corp. | 1,980 | 111 |
| * | Texas Capital Bancshares Inc. | 3,424 | 111 |
| | Atlantic Union Bankshares Corp. | 4,767 | 111 |
| | Four Corners Property Trust Inc. | 4,374 | 110 |
| | ServisFirst Bancshares Inc. | 3,006 | 110 |
| * | eHealth Inc. | 1,702 | 107 |
| | Simmons First National Corp. Class A | 6,264 | 107 |
| | Essential Properties Realty Trust Inc. | 6,246 | 106 |
| | Navient Corp. | 11,598 | 105 |
| | | | | | Shares | Market
Value•
($000) |
| | Horace Mann Educators Corp. | 2,690 | 105 |
| | International Bancshares Corp. | 3,253 | 103 |
| | Pebblebrook Hotel Trust | 8,199 | 103 |
| | Ameris Bancorp | 4,190 | 103 |
| | Independent Bank Group Inc. | 2,204 | 103 |
| | PennyMac Mortgage Investment Trust | 5,975 | 102 |
| | Moelis & Co. Class A | 3,152 | 101 |
| * | Encore Capital Group Inc. | 2,178 | 100 |
| | Global Net Lease Inc. | 5,742 | 100 |
| | Walker & Dunlop Inc. | 1,809 | 99 |
| | Virtu Financial Inc. Class A | 3,741 | 97 |
| | Fulton Financial Corp. | 9,770 | 96 |
| * | Axos Financial Inc. | 3,824 | 95 |
| * | Cushman & Wakefield plc | 8,175 | 95 |
| | Hilltop Holdings Inc. | 4,570 | 94 |
| | RLJ Lodging Trust | 9,972 | 94 |
| | Trustmark Corp. | 4,018 | 94 |
| | WSFS Financial Corp. | 3,195 | 94 |
| * | Genworth Financial Inc. Class A | 30,645 | 93 |
| | Cohen & Steers Inc. | 1,498 | 91 |
| | Westamerica Bancorp | 1,473 | 90 |
| | Paramount Group Inc. | 11,988 | 89 |
| | Realogy Holdings Corp. | 8,037 | 89 |
| | First Midwest Bancorp Inc. | 7,102 | 89 |
| | Apollo Commercial Real Estate Finance Inc. | 9,861 | 88 |
| | SITE Centers Corp. | 11,535 | 87 |
| | First Bancorp | 15,161 | 87 |
| | WesBanco Inc. | 3,920 | 87 |
| | First Merchants Corp. | 3,371 | 86 |
| | First Financial Bancorp | 6,106 | 84 |
| | NBT Bancorp Inc. | 2,771 | 84 |
| | Columbia Property Trust Inc. | 7,039 | 83 |
| | Retail Properties of America Inc. Class A | 13,184 | 83 |
| | United Community Banks Inc. | 4,575 | 83 |
| | Banner Corp. | 2,238 | 81 |
| | Heartland Financial USA Inc. | 2,311 | 80 |
| * | NMI Holdings Inc. Class A | 4,690 | 80 |
| | LTC Properties Inc. | 2,153 | 79 |
| | Retail Opportunity Investments Corp. | 7,113 | 79 |
| | Santander Consumer USA Holdings Inc. | 4,605 | 79 |
| | Argo Group International Holdings Ltd. | 2,121 | 79 |
| | Colony Capital Inc. | 28,807 | 78 |
| | Urban Edge Properties | 7,412 | 78 |
| | Northwest Bancshares Inc. | 7,717 | 78 |
| | Renasant Corp. | 3,089 | 78 |
| | | | | | Shares | Market
Value•
($000) |
| | MFA Financial Inc. | 28,593 | 77 |
| | American Assets Trust Inc. | 3,016 | 77 |
| | Piper Sandler Cos. | 1,026 | 77 |
| | Towne Bank | 4,281 | 76 |
| | Cadence Bancorp Class A | 7,883 | 75 |
| | Flagstar Bancorp Inc. | 2,368 | 74 |
| | Macerich Co. | 9,197 | 73 |
| | Bank of NT Butterfield & Son Ltd. | 2,902 | 73 |
| | Capitol Federal Financial Inc. | 7,716 | 72 |
| | Mercury General Corp. | 1,608 | 72 |
| | Mack-Cali Realty Corp. | 5,610 | 71 |
| | Nelnet Inc. Class A | 1,013 | 66 |
| | Sandy Spring Bancorp Inc. | 2,776 | 66 |
| | Hope Bancorp Inc. | 7,675 | 65 |
| | Safety Insurance Group Inc. | 864 | 63 |
| | Provident Financial Services Inc. | 4,670 | 62 |
| | Xenia Hotels & Resorts Inc. | 6,755 | 61 |
| | Acadia Realty Trust | 5,295 | 60 |
| | Virtus Investment Partners Inc. | 424 | 60 |
| | Waddell & Reed Financial Inc. Class A | 3,771 | 59 |
| | DiamondRock Hospitality Co. | 10,879 | 58 |
| | Employers Holdings Inc. | 1,786 | 58 |
| | Alexander & Baldwin Inc. | 4,730 | 57 |
| | ProAssurance Corp. | 3,665 | 56 |
| | Investors Real Estate Trust | 789 | 56 |
| | Kite Realty Group Trust | 5,000 | 56 |
| | City Holding Co. | 856 | 55 |
| | First Commonwealth Financial Corp. | 6,656 | 55 |
| | S&T Bancorp Inc. | 2,658 | 54 |
| | Getty Realty Corp. | 1,826 | 53 |
| | CNA Financial Corp. | 1,634 | 53 |
| | Brookline Bancorp Inc. | 5,453 | 52 |
| | Brightsphere Investment Group Inc. | 3,693 | 51 |
| | Universal Health Realty Income Trust | 745 | 50 |
| | Eagle Bancorp Inc. | 1,706 | 49 |
| | Ladder Capital Corp. Class A | 6,572 | 49 |
| 1 | Brookfield Property REIT Inc. Class A | 4,069 | 47 |
| | Stock Yards Bancorp Inc. | 1,092 | 47 |
| * | St. Joe Co. | 1,911 | 44 |
| | BancFirst Corp. | 986 | 43 |
| | BGC Partners Inc. Class A | 16,709 | 42 |
| | TFS Financial Corp. | 2,736 | 42 |
| | Redwood Trust Inc. | 6,005 | 42 |
| | Capstead Mortgage Corp. | 6,290 | 39 |
| | Great Western Bancorp Inc. | 2,822 | 39 |
| | Kearny Financial Corp. | 4,949 | 38 |
| | | | | | Shares | Market
Value•
($000) |
| | American National Group Inc. | 500 | 38 |
| | 1st Source Corp. | 1,086 | 37 |
| | Newmark Group Inc. Class A | 8,236 | 36 |
| | ARMOUR Residential REIT Inc. | 3,571 | 35 |
| * | Marcus & Millichap Inc. | 1,257 | 35 |
| * | Third Point Reinsurance Ltd. | 4,039 | 35 |
| | Summit Hotel Properties Inc. | 5,824 | 34 |
| | TrustCo Bank Corp. | 5,383 | 32 |
| | Invesco Mortgage Capital Inc. | 10,074 | 30 |
| | United Fire Group Inc. | 1,210 | 30 |
| * | Columbia Financial Inc. | 2,704 | 29 |
| * | MBIA Inc. | 3,581 | 29 |
| | Tanger Factory Outlet Centers Inc. | 4,800 | 27 |
| | Alexander's Inc. | 107 | 27 |
| | RPT Realty | 4,523 | 27 |
| | Washington Trust Bancorp Inc. | 806 | 27 |
| | WisdomTree Investments Inc. | 7,328 | 27 |
| | Colony Credit Real Estate Inc. | 4,384 | 26 |
| | Boston Private Financial Holdings Inc. | 4,238 | 25 |
| | Front Yard Residential Corp. | 2,530 | 25 |
| | RMR Group Inc. Class A | 891 | 25 |
| | Community Trust Bancorp Inc. | 749 | 24 |
| | Franklin Street Properties Corp. | 5,439 | 24 |
| | FBL Financial Group Inc. Class A | 613 | 23 |
| | Berkshire Hills Bancorp Inc. | 2,180 | 20 |
| | Dime Community Bancshares Inc. | 1,490 | 19 |
| * | LendingClub Corp. | 3,551 | 19 |
| | Saul Centers Inc. | 684 | 19 |
| | State Auto Financial Corp. | 1,014 | 16 |
| | Flushing Financial Corp. | 1,260 | 15 |
| | Urstadt Biddle Properties Inc. Class A | 1,622 | 15 |
| | Republic Bancorp Inc. Class A | 448 | 14 |
| | CorePoint Lodging Inc. | 2,228 | 13 |
| 1 | Washington Prime Group Inc. | 10,693 | 7 |
| | | | | | | 308,241 |
| Health Care (13.7%) |
| | UnitedHealth Group Inc. | 63,898 | 19,971 |
| | Merck & Co. Inc. | 171,217 | 14,600 |
| | Pfizer Inc. | 376,862 | 14,242 |
| | Abbott Laboratories | 117,053 | 12,814 |
| | Thermo Fisher Scientific Inc. | 26,779 | 11,488 |
| | | | | | Shares | Market
Value•
($000) |
| | AbbVie Inc. | 119,367 | 11,432 |
| | Amgen Inc. | 39,872 | 10,100 |
| | Medtronic plc | 90,998 | 9,780 |
| | Bristol-Myers Squibb Co. | 153,367 | 9,539 |
| | Danaher Corp. | 42,358 | 8,746 |
| | Eli Lilly & Co. | 57,085 | 8,471 |
| * | Intuitive Surgical Inc. | 7,814 | 5,711 |
| | Gilead Sciences Inc. | 85,126 | 5,682 |
| | Zoetis Inc. Class A | 32,211 | 5,157 |
| * | Vertex Pharmaceuticals Inc. | 17,465 | 4,875 |
| | Anthem Inc. | 17,063 | 4,804 |
| | Stryker Corp. | 23,404 | 4,638 |
| | Becton Dickinson & Co. | 18,246 | 4,430 |
| | Cigna Corp. | 24,479 | 4,342 |
| * | Regeneron Pharmaceuticals Inc. | 6,575 | 4,076 |
| * | Boston Scientific Corp. | 94,882 | 3,892 |
| | Humana Inc. | 8,960 | 3,720 |
| * | Edwards Lifesciences Corp. | 41,840 | 3,592 |
| * | Illumina Inc. | 9,955 | 3,556 |
| * | Biogen Inc. | 11,018 | 3,169 |
| | Baxter International Inc. | 34,462 | 3,001 |
| * | DexCom Inc. | 6,182 | 2,630 |
| | HCA Healthcare Inc. | 17,957 | 2,437 |
| * | Centene Corp. | 38,685 | 2,372 |
| * | IDEXX Laboratories Inc. | 5,720 | 2,237 |
| | Zimmer Biomet Holdings Inc. | 13,984 | 1,970 |
| | ResMed Inc. | 9,653 | 1,745 |
| * | Alexion Pharmaceuticals Inc. | 14,368 | 1,641 |
| * | Align Technology Inc. | 5,242 | 1,557 |
| | West Pharmaceutical Services Inc. | 4,954 | 1,407 |
| * | Seattle Genetics Inc. | 8,174 | 1,294 |
| | Teleflex Inc. | 3,202 | 1,258 |
| * | Incyte Corp. | 12,290 | 1,184 |
| * | Moderna Inc. | 18,080 | 1,173 |
| * | Laboratory Corp. of America Holdings | 6,603 | 1,160 |
| * | Varian Medical Systems Inc. | 6,120 | 1,063 |
| * | Teladoc Health Inc. | 4,919 | 1,061 |
| * | Alnylam Pharmaceuticals Inc. | 7,812 | 1,036 |
| * | Hologic Inc. | 17,234 | 1,029 |
| | Cooper Cos. Inc. | 3,262 | 1,025 |
| | Cardinal Health Inc. | 20,042 | 1,017 |
| | Quest Diagnostics Inc. | 9,046 | 1,006 |
| * | Horizon Therapeutics plc | 13,191 | 991 |
| * | Catalent Inc. | 10,410 | 963 |
| * | BioMarin Pharmaceutical Inc. | 12,249 | 956 |
| * | ABIOMED Inc. | 2,986 | 919 |
| | STERIS plc | 5,697 | 909 |
| | PerkinElmer Inc. | 7,323 | 862 |
| * | Elanco Animal Health Inc. | 27,069 | 787 |
| * | Exact Sciences Corp. | 10,113 | 761 |
| * | Masimo Corp. | 3,343 | 749 |
| | | | | | Shares | Market
Value•
($000) |
| * | Charles River Laboratories International Inc. | 3,360 | 736 |
| * | Bio-Rad Laboratories Inc. Class A | 1,445 | 735 |
| * | Molina Healthcare Inc. | 3,955 | 732 |
| * | Sarepta Therapeutics Inc. | 4,968 | 727 |
| * | Neurocrine Biosciences Inc. | 6,191 | 721 |
| * | Avantor Inc. | 30,146 | 680 |
| | DENTSPLY SIRONA Inc. | 14,721 | 661 |
| | Bio-Techne Corp. | 2,556 | 653 |
| * | ICON plc | 3,475 | 648 |
| * | Henry Schein Inc. | 9,594 | 637 |
| * | Immunomedics Inc. | 13,844 | 617 |
| * | Mylan NV | 35,209 | 577 |
| * | Novocure Ltd. | 6,801 | 563 |
| * | Repligen Corp. | 3,568 | 553 |
| | Universal Health Services Inc. Class B | 4,972 | 549 |
| | Chemed Corp. | 1,040 | 538 |
| * | Amedisys Inc. | 2,181 | 528 |
| * | Jazz Pharmaceuticals plc | 3,828 | 514 |
| | Perrigo Co. plc | 9,304 | 487 |
| * | DaVita Inc. | 5,521 | 479 |
| * | Guardant Health Inc. | 5,012 | 479 |
| * | Ionis Pharmaceuticals Inc. | 8,763 | 478 |
| * | PRA Health Sciences Inc. | 4,306 | 460 |
| * | Penumbra Inc. | 2,193 | 459 |
| * | Exelixis Inc. | 20,491 | 455 |
| * | Tandem Diabetes Care Inc. | 4,002 | 451 |
| * | LHC Group Inc. | 2,115 | 441 |
| * | Quidel Corp. | 2,502 | 440 |
| | Encompass Health Corp. | 6,591 | 430 |
| * | Momenta Pharmaceuticals Inc. | 8,125 | 424 |
| | Hill-Rom Holdings Inc. | 4,484 | 421 |
| * | iRhythm Technologies Inc. | 1,865 | 411 |
| * | MyoKardia Inc. | 3,427 | 375 |
| * | Mirati Therapeutics Inc. | 2,450 | 366 |
| * | Emergent BioSolutions Inc. | 3,155 | 360 |
| * | Acceleron Pharma Inc. | 3,371 | 329 |
| * | Ultragenyx Pharmaceutical Inc. | 3,846 | 327 |
| * | United Therapeutics Corp. | 3,035 | 325 |
| * | CRISPR Therapeutics AG | 3,378 | 316 |
| * | Natera Inc. | 4,801 | 306 |
| * | Nevro Corp. | 2,218 | 305 |
| * | Haemonetics Corp. | 3,396 | 304 |
| * | Iovance Biotherapeutics Inc. | 8,983 | 299 |
| | Bruker Corp. | 6,949 | 292 |
| * | ACADIA Pharmaceuticals Inc. | 7,379 | 292 |
| * | Arrowhead Pharmaceuticals Inc. | 6,808 | 288 |
| * | HealthEquity Inc. | 4,950 | 284 |
| * | Arena Pharmaceuticals Inc. | 4,011 | 280 |
| * | Halozyme Therapeutics Inc. | 9,644 | 280 |
| | | | | | Shares | Market
Value•
($000) |
| * | NeoGenomics Inc. | 7,195 | 280 |
| * | Blueprint Medicines Corp. | 3,594 | 278 |
| * | Neogen Corp. | 3,618 | 276 |
| * | Globus Medical Inc. Class A | 4,864 | 275 |
| * | Invitae Corp. | 7,881 | 275 |
| * | Syneos Health Inc. | 4,273 | 270 |
| * | FibroGen Inc. | 5,964 | 267 |
| * | Bluebird Bio Inc. | 4,420 | 262 |
| * | Amicus Therapeutics Inc. | 17,908 | 261 |
| * | Envista Holdings Corp. | 10,877 | 261 |
| * | ICU Medical Inc. | 1,246 | 249 |
| * | Wright Medical Group NV | 8,206 | 248 |
| * | Global Blood Therapeutics Inc. | 3,945 | 248 |
| * | Integra LifeSciences Holdings Corp. | 5,008 | 239 |
| * | Medpace Holdings Inc. | 1,777 | 231 |
| | Ensign Group Inc. | 3,757 | 220 |
| * | PTC Therapeutics Inc. | 4,409 | 218 |
| * | Biohaven Pharmaceutical Holding Co. Ltd. | 3,264 | 207 |
| * | Tenet Healthcare Corp. | 7,116 | 200 |
| * | Acadia Healthcare Co. Inc. | 6,452 | 199 |
| * | Omnicell Inc. | 2,958 | 197 |
| * | Sage Therapeutics Inc. | 3,736 | 196 |
| * | Insmed Inc. | 6,894 | 194 |
| * | Merit Medical Systems Inc. | 3,934 | 193 |
| * | Alkermes plc | 11,442 | 189 |
| * | NuVasive Inc. | 3,576 | 186 |
| * | HMS Holdings Corp. | 6,496 | 181 |
| * | Reata Pharmaceuticals Inc. Class A | 1,667 | 175 |
| * | Agios Pharmaceuticals Inc. | 4,240 | 174 |
| * | Integer Holdings Corp. | 2,423 | 168 |
| | Patterson Cos. Inc. | 5,762 | 167 |
| * | ChemoCentryx Inc. | 3,092 | 165 |
| * | LivaNova plc | 3,471 | 163 |
| * | Pacira BioSciences Inc. | 2,545 | 159 |
| | CONMED Corp. | 1,801 | 155 |
| * | Turning Point Therapeutics Inc. | 1,916 | 150 |
| * | Select Medical Holdings Corp. | 7,426 | 149 |
| * | PPD Inc. | 4,300 | 148 |
| | Cantel Medical Corp. | 2,685 | 141 |
| * | Allakos Inc. | 1,559 | 140 |
| * | Axsome Therapeutics Inc. | 1,870 | 137 |
| * | Prestige Consumer Healthcare Inc. | 3,661 | 133 |
| * | Vir Biotechnology Inc. | 3,163 | 128 |
| * | Denali Therapeutics Inc. | 3,859 | 123 |
| * | Glaukos Corp. | 2,551 | 122 |
| * | Allogene Therapeutics Inc. | 3,358 | 120 |
| * | Editas Medicine Inc. | 3,355 | 118 |
| * | Deciphera Pharmaceuticals Inc. | 2,600 | 117 |
| | | | | | Shares | Market
Value•
($000) |
| * | Xencor Inc. | 3,264 | 117 |
| * | uniQure NV | 2,653 | 108 |
| * | Kodiak Sciences Inc. | 2,008 | 106 |
| * | Magellan Health Inc. | 1,388 | 105 |
| * | Ironwood Pharmaceuticals Inc. Class A | 10,128 | 102 |
| * | Avanos Medical Inc. | 3,066 | 99 |
| * | MEDNAX Inc. | 5,318 | 99 |
| * | Intercept Pharmaceuticals Inc. | 1,972 | 98 |
| | Healthcare Services Group Inc. | 4,574 | 95 |
| * | Ligand Pharmaceuticals Inc. | 874 | 89 |
| * | OPKO Health Inc. | 26,954 | 87 |
| * | Aimmune Therapeutics Inc. | 2,468 | 84 |
| * | BioTelemetry Inc. | 2,062 | 82 |
| * | Corcept Therapeutics Inc. | 6,420 | 82 |
| * | Evolent Health Inc. Class A | 5,475 | 78 |
| * | Zogenix Inc. | 3,300 | 78 |
| * | Heron Therapeutics Inc. | 5,355 | 77 |
| | Luminex Corp. | 2,882 | 77 |
| * | Myriad Genetics Inc. | 5,144 | 69 |
| * | Pennant Group Inc. | 1,870 | 69 |
| * | Epizyme Inc. | 5,266 | 68 |
| * | REGENXBIO Inc. | 2,234 | 68 |
| * | Intra-Cellular Therapies Inc. | 3,597 | 66 |
| *,1 | Esperion Therapeutics Inc. | 1,657 | 60 |
| * | Supernus Pharmaceuticals Inc. | 2,699 | 59 |
| * | Madrigal Pharmaceuticals Inc. | 538 | 58 |
| * | Enanta Pharmaceuticals Inc. | 1,042 | 54 |
| * | Tivity Health Inc. | 3,054 | 50 |
| * | Theravance Biopharma Inc. | 2,679 | 49 |
| * | Atara Biotherapeutics Inc. | 3,442 | 46 |
| * | CorVel Corp. | 543 | 45 |
| * | Innoviva Inc. | 3,512 | 41 |
| * | Viela Bio Inc. | 1,203 | 41 |
| * | Taro Pharmaceutical Industries Ltd. | 652 | 40 |
| * | 1Life Healthcare Inc. | 1,300 | 38 |
| * | Endo International plc | 12,405 | 37 |
| * | Natus Medical Inc. | 1,838 | 33 |
| * | Inogen Inc. | 1,025 | 31 |
| * | Precigen Inc. | 5,156 | 31 |
| * | Radius Health Inc. | 2,420 | 30 |
| * | Orthofix Medical Inc. | 932 | 28 |
| * | Amneal Pharmaceuticals Inc. | 6,469 | 27 |
| * | Brookdale Senior Living Inc. | 9,530 | 26 |
| * | Eagle Pharmaceuticals Inc. | 649 | 26 |
| * | Aerie Pharmaceuticals Inc. | 2,257 | 25 |
| * | Varex Imaging Corp. | 2,049 | 23 |
| * | Axogen Inc. | 1,811 | 21 |
| *,1 | TherapeuticsMD Inc. | 11,844 | 17 |
| | | | | | Shares | Market
Value•
($000) |
| * | Tricida Inc. | 1,144 | 12 |
| *,2 | Alder Biopharmaceuticals Inc. CVR Exp. 12/31/2024 | 767 | 1 |
| | | | | | | 270,343 |
| Industrials (8.8%) |
| * | PayPal Holdings Inc. | 79,529 | 16,235 |
| | Accenture plc Class A | 43,143 | 10,351 |
| | Union Pacific Corp. | 45,984 | 8,849 |
| | United Parcel Service Inc. Class B | 47,777 | 7,817 |
| | Fidelity National Information Services Inc. | 41,819 | 6,308 |
| | Caterpillar Inc. | 36,663 | 5,218 |
| | Deere & Co. | 21,204 | 4,454 |
| | Illinois Tool Works Inc. | 21,277 | 4,203 |
| | Automatic Data Processing Inc. | 29,169 | 4,057 |
| | CSX Corp. | 51,374 | 3,928 |
| * | Square Inc. Class A | 24,434 | 3,899 |
| | Sherwin-Williams Co. | 5,598 | 3,757 |
| * | Fiserv Inc. | 37,674 | 3,752 |
| | FedEx Corp. | 16,414 | 3,608 |
| | Global Payments Inc. | 20,183 | 3,565 |
| | Waste Management Inc. | 28,584 | 3,259 |
| | Agilent Technologies Inc. | 20,861 | 2,095 |
| | Johnson Controls International plc | 50,508 | 2,057 |
| | Verisk Analytics Inc. Class A | 10,699 | 1,997 |
| | Cintas Corp. | 5,917 | 1,972 |
| | PACCAR Inc. | 22,792 | 1,956 |
| | Trane Technologies plc | 16,165 | 1,914 |
| | Rockwell Automation Inc. | 7,837 | 1,807 |
| | Paychex Inc. | 21,696 | 1,659 |
| * | Mettler-Toledo International Inc. | 1,565 | 1,519 |
| | Fortive Corp. | 20,123 | 1,451 |
| * | FleetCor Technologies Inc. | 5,632 | 1,416 |
| | Old Dominion Freight Line Inc. | 6,656 | 1,346 |
| | Republic Services Inc. Class A | 14,410 | 1,336 |
| * | Keysight Technologies Inc. | 12,599 | 1,241 |
| | Kansas City Southern | 6,463 | 1,177 |
| | WW Grainger Inc. | 3,064 | 1,120 |
| | TransUnion | 12,902 | 1,119 |
| | Vulcan Materials Co. | 8,984 | 1,078 |
| | Dover Corp. | 9,765 | 1,073 |
| | Masco Corp. | 17,540 | 1,023 |
| * | Zebra Technologies Corp. Class A | 3,512 | 1,006 |
| | Expeditors International of Washington Inc. | 11,155 | 986 |
| | Xylem Inc. | 12,112 | 971 |
| | IDEX Corp. | 5,067 | 913 |
| * | Waters Corp. | 4,196 | 907 |
| | | | | | Shares | Market
Value•
($000) |
| * | Trimble Inc. | 16,716 | 876 |
| | CH Robinson Worldwide Inc. | 8,857 | 871 |
| | Jack Henry & Associates Inc. | 5,253 | 869 |
| | Martin Marietta Materials Inc. | 4,275 | 867 |
| * | Fair Isaac Corp. | 1,946 | 819 |
| * | Ingersoll Rand Inc. | 23,126 | 811 |
| | Westinghouse Air Brake Technologies Corp. | 12,154 | 809 |
| | JB Hunt Transport Services Inc. | 5,584 | 785 |
| | Cognex Corp. | 11,262 | 779 |
| * | Generac Holdings Inc. | 4,081 | 775 |
| | Nordson Corp. | 3,790 | 707 |
| * | Crown Holdings Inc. | 8,631 | 663 |
| | Lennox International Inc. | 2,333 | 654 |
| | Graco Inc. | 11,130 | 646 |
| | Avery Dennison Corp. | 5,578 | 644 |
| | Allegion plc | 6,190 | 640 |
| | Packaging Corp. of America | 6,263 | 634 |
| * | StoneCo Ltd. Class A | 12,052 | 615 |
| * | Trex Co. Inc. | 3,865 | 578 |
| | Toro Co. | 7,255 | 546 |
| | Watsco Inc. | 2,229 | 546 |
| * | XPO Logistics Inc. | 6,129 | 541 |
| | Snap-on Inc. | 3,635 | 539 |
| | Genpact Ltd. | 12,632 | 533 |
| | Westrock Co. | 17,531 | 532 |
| | AptarGroup Inc. | 4,250 | 503 |
| | Owens Corning | 7,416 | 502 |
| | Universal Display Corp. | 2,826 | 496 |
| * | Pagseguro Digital Ltd. Class A | 11,660 | 491 |
| * | WEX Inc. | 3,026 | 483 |
| * | Berry Global Group Inc. | 8,899 | 459 |
| | Donaldson Co. Inc. | 8,687 | 438 |
| | A O Smith Corp. | 8,857 | 434 |
| * | HD Supply Holdings Inc. | 10,769 | 427 |
| * | Arrow Electronics Inc. | 5,345 | 420 |
| | Sealed Air Corp. | 10,282 | 404 |
| | Robert Half International Inc. | 7,560 | 402 |
| * | Stericycle Inc. | 6,228 | 399 |
| * | Flex Ltd. | 34,853 | 379 |
| * | Axon Enterprise Inc. | 4,363 | 374 |
| | Sonoco Products Co. | 7,049 | 374 |
| * | Middleby Corp. | 3,763 | 368 |
| | CoreLogic Inc. | 5,365 | 356 |
| * | Euronet Worldwide Inc. | 3,437 | 355 |
| * | TopBuild Corp. | 2,247 | 346 |
| | Landstar System Inc. | 2,557 | 340 |
| | Brunswick Corp. | 5,339 | 330 |
| | MAXIMUS Inc. | 4,193 | 325 |
| | MDU Resources Group Inc. | 13,309 | 314 |
| | MSA Safety Inc. | 2,482 | 313 |
| | Littelfuse Inc. | 1,707 | 309 |
| | AGCO Corp. | 4,236 | 301 |
| | | | | | Shares | Market
Value•
($000) |
| | ManpowerGroup Inc. | 3,998 | 293 |
| | Simpson Manufacturing Co. Inc. | 2,958 | 291 |
| * | FTI Consulting Inc. | 2,496 | 286 |
| | Acuity Brands Inc. | 2,587 | 283 |
| | Regal Beloit Corp. | 2,811 | 278 |
| | Louisiana-Pacific Corp. | 8,239 | 271 |
| * | Proto Labs Inc. | 1,840 | 271 |
| | Allison Transmission Holdings Inc. | 7,400 | 265 |
| * | ASGN Inc. | 3,680 | 264 |
| | Graphic Packaging Holding Co. | 18,411 | 257 |
| * | Builders FirstSource Inc. | 8,385 | 257 |
| * | Novanta Inc. | 2,380 | 255 |
| | Armstrong World Industries Inc. | 3,312 | 244 |
| | Eagle Materials Inc. | 2,973 | 243 |
| * | Saia Inc. | 1,806 | 242 |
| * | ACI Worldwide Inc. | 8,095 | 238 |
| | John Bean Technologies Corp. | 2,313 | 237 |
| * | Clean Harbors Inc. | 3,722 | 227 |
| | Air Lease Corp. Class A | 7,180 | 223 |
| | Rexnord Corp. | 7,530 | 218 |
| | Franklin Electric Co. Inc. | 3,547 | 211 |
| | Avnet Inc. | 7,477 | 206 |
| | MSC Industrial Direct Co. Inc. Class A | 3,055 | 201 |
| | nVent Electric plc | 10,520 | 201 |
| | Valmont Industries Inc. | 1,566 | 199 |
| | Werner Enterprises Inc. | 4,305 | 198 |
| | Advanced Drainage Systems Inc. | 3,556 | 197 |
| | UniFirst Corp. | 1,015 | 196 |
| * | Fabrinet | 2,793 | 195 |
| * | Casella Waste Systems Inc. Class A | 3,450 | 194 |
| | Watts Water Technologies Inc. Class A | 2,027 | 194 |
| * | TriNet Group Inc. | 2,850 | 193 |
| * | MasTec Inc. | 4,062 | 188 |
| | ESCO Technologies Inc. | 2,078 | 187 |
| | Hillenbrand Inc. | 5,814 | 184 |
| | Brady Corp. Class A | 3,846 | 180 |
| * | Green Dot Corp. Class A | 3,422 | 178 |
| | Insperity Inc. | 2,645 | 178 |
| | Applied Industrial Technologies Inc. | 2,916 | 176 |
| | Brink's Co. | 3,630 | 176 |
| | GATX Corp. | 2,637 | 176 |
| | AAON Inc. | 3,090 | 176 |
| * | Itron Inc. | 2,942 | 175 |
| * | Kirby Corp. | 4,134 | 175 |
| * | AMN Healthcare Services Inc. | 3,181 | 171 |
| | | | | | Shares | Market
Value•
($000) |
| * | BMC Stock Holdings Inc. | 4,154 | 166 |
| | Ryder System Inc. | 4,032 | 165 |
| * | ExlService Holdings Inc. | 2,590 | 165 |
| | Vishay Intertechnology Inc. | 10,285 | 164 |
| * | Advanced Disposal Services Inc. | 5,160 | 155 |
| * | WESCO International Inc. | 3,260 | 153 |
| * | Rogers Corp. | 1,351 | 153 |
| * | Chart Industries Inc. | 2,296 | 151 |
| | Macquarie Infrastructure Corp. | 5,362 | 150 |
| | Alliance Data Systems Corp. | 3,149 | 142 |
| * | Masonite International Corp. | 1,531 | 140 |
| | Trinity Industries Inc. | 6,695 | 137 |
| | EVERTEC Inc. | 3,843 | 135 |
| * | Gibraltar Industries Inc. | 2,106 | 132 |
| * | Sanmina Corp. | 4,554 | 129 |
| * | Installed Building Products Inc. | 1,454 | 126 |
| | Federal Signal Corp. | 3,833 | 123 |
| * | Dycom Industries Inc. | 1,987 | 122 |
| * | Hub Group Inc. Class A | 2,259 | 122 |
| * | Plexus Corp. | 1,602 | 122 |
| * | Summit Materials Inc. Class A | 7,844 | 117 |
| * | Beacon Roofing Supply Inc. | 3,412 | 116 |
| | O-I Glass Inc. | 10,612 | 115 |
| | Boise Cascade Co. | 2,460 | 113 |
| | Badger Meter Inc. | 1,804 | 111 |
| * | Ambarella Inc. | 2,110 | 111 |
| | Albany International Corp. Class A | 2,125 | 110 |
| | Comfort Systems USA Inc. | 2,174 | 110 |
| * | Meritor Inc. | 4,809 | 109 |
| * | Pluralsight Inc. Class A | 5,628 | 108 |
| * | MACOM Technology Solutions Holdings Inc. | 3,003 | 107 |
| | Triton International Ltd. | 2,932 | 106 |
| * | SPX Corp. | 2,482 | 104 |
| | Schneider National Inc. Class B | 3,754 | 102 |
| * | Cimpress plc | 1,102 | 102 |
| | Mueller Industries Inc. | 3,375 | 100 |
| | McGrath RentCorp | 1,510 | 100 |
| | Otter Tail Corp. | 2,581 | 100 |
| * | Bill.com Holdings Inc. | 1,000 | 99 |
| * | JELD-WEN Holding Inc. | 4,635 | 98 |
| | Korn Ferry | 3,162 | 96 |
| | Forward Air Corp. | 1,633 | 96 |
| | Belden Inc. | 2,729 | 92 |
| * | Sykes Enterprises Inc. | 2,677 | 89 |
| * | Verra Mobility Corp. Class A | 8,271 | 87 |
| | Helios Technologies Inc. | 2,077 | 85 |
| | Deluxe Corp. | 2,964 | 84 |
| | Terex Corp. | 4,181 | 82 |
| | Astec Industries Inc. | 1,460 | 77 |
| | | | | | Shares | Market
Value•
($000) |
| * | OSI Systems Inc. | 959 | 76 |
| | US Ecology Inc. | 1,998 | 74 |
| | TTEC Holdings Inc. | 1,270 | 72 |
| | Patrick Industries Inc. | 1,258 | 71 |
| | Encore Wire Corp. | 1,352 | 70 |
| | Tennant Co. | 1,046 | 70 |
| * | Welbilt Inc. | 9,414 | 69 |
| * | CBIZ Inc. | 2,822 | 69 |
| * | Huron Consulting Group Inc. | 1,590 | 69 |
| * | FARO Technologies Inc. | 1,192 | 67 |
| | ADT Inc. | 6,030 | 64 |
| | Covanta Holding Corp. | 6,811 | 64 |
| | Lindsay Corp. | 628 | 63 |
| * | TTM Technologies Inc. | 5,406 | 62 |
| * | Harsco Corp. | 4,253 | 60 |
| * | TriMas Corp. | 2,347 | 59 |
| | Primoris Services Corp. | 3,014 | 57 |
| | Granite Construction Inc. | 2,997 | 56 |
| | Heartland Express Inc. | 2,580 | 53 |
| * | Herc Holdings Inc. | 1,287 | 53 |
| | Greif Inc. Class A | 1,382 | 51 |
| | Atlas Corp. | 5,916 | 51 |
| | SFL Corp. Ltd. | 5,559 | 49 |
| | AAR Corp. | 2,383 | 48 |
| | Greenbrier Cos. Inc. | 1,762 | 48 |
| * | Cardtronics plc Class A | 2,062 | 45 |
| | Benchmark Electronics Inc. | 1,989 | 39 |
| | CTS Corp. | 1,750 | 37 |
| * | SEACOR Holdings Inc. | 1,166 | 37 |
| | Scorpio Tankers Inc. | 3,099 | 37 |
| | Kelly Services Inc. Class A | 1,864 | 35 |
| | H&E Equipment Services Inc. | 1,659 | 34 |
| | Myers Industries Inc. | 2,223 | 34 |
| * | TrueBlue Inc. | 1,941 | 33 |
| | Apogee Enterprises Inc. | 1,489 | 31 |
| * | Conduent Inc. | 8,867 | 30 |
| * | Tutor Perini Corp. | 1,837 | 23 |
| | Hyster-Yale Materials Handling Inc. | 512 | 21 |
| | Matson Inc. | 519 | 21 |
| * | Manitowoc Co. Inc. | 1,800 | 17 |
| | GasLog Ltd. | 2,965 | 9 |
| | | | | | | 173,974 |
| Oil & Gas (0.1%) |
| * | SolarEdge Technologies Inc. | 3,283 | 726 |
| * | Enphase Energy Inc. | 7,127 | 550 |
| * | First Solar Inc. | 5,624 | 431 |
| | Arcosa Inc. | 3,590 | 166 |
| * | SunPower Corp. | 4,070 | 45 |
| * | Maxeon Solar Technologies Ltd. | 509 | 11 |
| | | | | | | 1,929 |
| Technology (32.2%) |
| | Apple Inc. | 1,108,088 | 142,988 |
| | | | | | Shares | Market
Value•
($000) |
| | Microsoft Corp. | 507,208 | 114,392 |
| * | Facebook Inc. Class A | 162,714 | 47,708 |
| * | Alphabet Inc. Class C | 21,834 | 35,681 |
| * | Alphabet Inc. Class A | 18,520 | 30,179 |
| | NVIDIA Corp. | 39,981 | 21,389 |
| * | Adobe Inc. | 32,532 | 16,702 |
| * | salesforce.com Inc. | 58,651 | 15,991 |
| | Intel Corp. | 287,111 | 14,628 |
| | Cisco Systems Inc. | 287,495 | 12,138 |
| | Broadcom Inc. | 26,468 | 9,188 |
| | QUALCOMM Inc. | 76,275 | 9,084 |
| | Texas Instruments Inc. | 62,148 | 8,834 |
| | Oracle Corp. | 133,709 | 7,651 |
| | International Business Machines Corp. | 60,263 | 7,431 |
| * | Advanced Micro Devices Inc. | 78,878 | 7,164 |
| * | ServiceNow Inc. | 12,837 | 6,188 |
| | Intuit Inc. | 17,113 | 5,911 |
| | Applied Materials Inc. | 61,791 | 3,806 |
| * | Autodesk Inc. | 14,849 | 3,648 |
| * | Micron Technology Inc. | 75,048 | 3,415 |
| | Lam Research Corp. | 9,834 | 3,308 |
| | Analog Devices Inc. | 24,891 | 2,909 |
| * | Workday Inc. Class A | 11,613 | 2,784 |
| * | DocuSign Inc. Class A | 11,940 | 2,663 |
| * | Veeva Systems Inc. Class A | 9,072 | 2,561 |
| | Cognizant Technology Solutions Corp. Class A | 36,598 | 2,447 |
| * | Twilio Inc. Class A | 9,047 | 2,440 |
| * | Splunk Inc. | 10,780 | 2,364 |
| | NXP Semiconductors NV | 18,800 | 2,364 |
| * | Synopsys Inc. | 10,170 | 2,251 |
| | KLA Corp. | 10,503 | 2,155 |
| * | Twitter Inc. | 52,259 | 2,121 |
| * | IQVIA Holdings Inc. | 12,759 | 2,089 |
| * | Cadence Design Systems Inc. | 18,657 | 2,069 |
| | HP Inc. | 96,611 | 1,889 |
| | Motorola Solutions Inc. | 11,509 | 1,781 |
| | Microchip Technology Inc. | 15,979 | 1,753 |
| | Marvell Technology Group Ltd. | 44,517 | 1,726 |
| | Xilinx Inc. | 16,512 | 1,720 |
| * | Okta Inc. Class A | 7,848 | 1,690 |
| * | Palo Alto Networks Inc. | 6,548 | 1,686 |
| | Skyworks Solutions Inc. | 11,338 | 1,642 |
| * | Atlassian Corp. plc Class A | 8,420 | 1,615 |
| | Cerner Corp. | 20,545 | 1,507 |
| * | RingCentral Inc. Class A | 5,134 | 1,493 |
| * | Coupa Software Inc. | 4,543 | 1,489 |
| * | VeriSign Inc. | 6,930 | 1,489 |
| * | Yandex NV Class A | 19,414 | 1,325 |
| * | Akamai Technologies Inc. | 10,835 | 1,261 |
| | Maxim Integrated Products Inc. | 18,026 | 1,234 |
| | Citrix Systems Inc. | 8,357 | 1,213 |
| | | | | | Shares | Market
Value•
($000) |
| * | Fortinet Inc. | 9,075 | 1,198 |
| * | EPAM Systems Inc. | 3,580 | 1,171 |
| | CDW Corp. | 9,713 | 1,104 |
| * | Paycom Software Inc. | 3,395 | 1,017 |
| * | Qorvo Inc. | 7,762 | 996 |
| * | Pinterest Inc. Class A | 27,035 | 995 |
| * | Wix.com Ltd. | 3,247 | 957 |
| | Teradyne Inc. | 11,034 | 938 |
| * | GoDaddy Inc. Class A | 11,088 | 928 |
| * | Check Point Software Technologies Ltd. | 7,197 | 909 |
| * | Arista Networks Inc. | 4,029 | 900 |
| | NortonLifeLock Inc. | 37,522 | 882 |
| | Hewlett Packard Enterprise Co. | 88,388 | 855 |
| | Seagate Technology plc | 17,421 | 836 |
| * | HubSpot Inc. | 2,776 | 832 |
| * | Slack Technologies Inc. Class A | 25,146 | 826 |
| * | Black Knight Inc. | 9,638 | 811 |
| * | VMware Inc. Class A | 5,438 | 785 |
| | Western Digital Corp. | 20,390 | 783 |
| | Monolithic Power Systems Inc. | 2,889 | 772 |
| * | Gartner Inc. | 5,882 | 764 |
| * | Avalara Inc. | 5,463 | 723 |
| * | Zendesk Inc. | 7,488 | 722 |
| | NetApp Inc. | 15,024 | 712 |
| * | Zscaler Inc. | 4,703 | 674 |
| * | Dell Technologies Inc. Class C | 10,122 | 669 |
| * | MongoDB Inc. Class A | 2,775 | 649 |
| * | PTC Inc. | 7,053 | 645 |
| * | Guidewire Software Inc. | 5,623 | 632 |
| | Entegris Inc. | 9,178 | 614 |
| * | Ceridian HCM Holding Inc. | 7,470 | 594 |
| * | ON Semiconductor Corp. | 27,674 | 591 |
| * | Aspen Technology Inc. | 4,606 | 585 |
| * | Ciena Corp. | 10,112 | 574 |
| * | Nuance Communications Inc. | 18,690 | 560 |
| | Juniper Networks Inc. | 22,035 | 551 |
| * | Anaplan Inc. | 8,858 | 543 |
| * | F5 Networks Inc. | 4,062 | 538 |
| | Amdocs Ltd. | 8,706 | 533 |
| * | Five9 Inc. | 4,091 | 521 |
| * | Dynatrace Inc. | 11,757 | 520 |
| * | Cree Inc. | 7,331 | 463 |
| | MKS Instruments Inc. | 3,748 | 448 |
| * | Lumentum Holdings Inc. | 5,106 | 439 |
| * | Alteryx Inc. Class A | 3,584 | 433 |
| * | Globant SA | 2,405 | 427 |
| * | Proofpoint Inc. | 3,764 | 413 |
| * | Manhattan Associates Inc. | 4,223 | 411 |
| * | Smartsheet Inc. Class A | 7,417 | 404 |
| * | Elastic NV | 3,670 | 398 |
| | | | | | Shares | Market
Value•
($000) |
| | CDK Global Inc. | 8,390 | 391 |
| | SYNNEX Corp. | 2,954 | 376 |
| * | RealPage Inc. | 5,915 | 370 |
| * | Inphi Corp. | 3,152 | 359 |
| | Pegasystems Inc. | 2,783 | 358 |
| | DXC Technology Co. | 17,889 | 357 |
| * | Dropbox Inc. Class A | 16,551 | 350 |
| * | Nutanix Inc. Class A | 12,073 | 347 |
| * | Everbridge Inc. | 2,270 | 337 |
| * | Q2 Holdings Inc. | 3,261 | 317 |
| | National Instruments Corp. | 8,651 | 310 |
| * | Silicon Laboratories Inc. | 3,014 | 309 |
| | Cabot Microelectronics Corp. | 1,966 | 299 |
| * | Blackline Inc. | 3,408 | 298 |
| * | Envestnet Inc. | 3,563 | 296 |
| * | Varonis Systems Inc. | 2,220 | 274 |
| * | CyberArk Software Ltd. | 2,461 | 272 |
| * | Lattice Semiconductor Corp. | 9,479 | 271 |
| | Brooks Automation Inc. | 5,167 | 267 |
| * | LivePerson Inc. | 4,393 | 262 |
| * | Semtech Corp. | 4,438 | 260 |
| * | Pure Storage Inc. Class A | 16,905 | 258 |
| * | Sailpoint Technologies Holdings Inc. | 6,446 | 253 |
| * | Qualys Inc. | 2,364 | 251 |
| * | Cirrus Logic Inc. | 4,129 | 250 |
| * | Rapid7 Inc. | 3,784 | 244 |
| * | FireEye Inc. | 15,737 | 231 |
| | Blackbaud Inc. | 3,591 | 229 |
| * | Viavi Solutions Inc. | 17,170 | 229 |
| | Xerox Holdings Corp. | 12,165 | 229 |
| | Power Integrations Inc. | 4,092 | 229 |
| * | J2 Global Inc. | 3,182 | 223 |
| * | Verint Systems Inc. | 4,458 | 212 |
| * | SVMK Inc. | 8,364 | 208 |
| * | Box Inc. Class A | 10,491 | 206 |
| * | Advanced Energy Industries Inc. | 2,745 | 203 |
| | Cogent Communications Holdings Inc. | 3,003 | 202 |
| * | SPS Commerce Inc. | 2,508 | 200 |
| * | Mimecast Ltd. | 3,986 | 196 |
| * | Alarm.com Holdings Inc. | 3,207 | 192 |
| * | Synaptics Inc. | 2,243 | 191 |
| * | Cloudera Inc. | 14,068 | 186 |
| * | Teradata Corp. | 7,598 | 185 |
| * | NCR Corp. | 8,900 | 182 |
| * | Acacia Communications Inc. | 2,678 | 181 |
| * | ViaSat Inc. | 4,409 | 175 |
| * | Tenable Holdings Inc. | 4,504 | 170 |
| * | Covetrus Inc. | 7,110 | 163 |
| * | Diodes Inc. | 3,222 | 157 |
| * | Cornerstone OnDemand Inc. | 4,325 | 153 |
| * | CommScope Holding Co. Inc. | 14,566 | 150 |
| | | | | | Shares | Market
Value•
($000) |
| * | Bottomline Technologies DE Inc. | 3,078 | 147 |
| * | Premier Inc. Class A | 4,309 | 141 |
| * | Workiva Inc. Class A | 2,313 | 136 |
| * | Insight Enterprises Inc. | 2,213 | 132 |
| * | Yext Inc. | 6,208 | 123 |
| * | CommVault Systems Inc. | 2,762 | 119 |
| * | Cerence Inc. | 2,203 | 117 |
| * | MaxLinear Inc. Class A | 4,461 | 109 |
| | InterDigital Inc. | 1,755 | 107 |
| * | NetScout Systems Inc. | 4,518 | 105 |
| | Kulicke & Soffa Industries Inc. | 4,305 | 103 |
| * | Allscripts Healthcare Solutions Inc. | 11,368 | 101 |
| | Progress Software Corp. | 2,666 | 101 |
| * | Avaya Holdings Corp. | 6,391 | 99 |
| | CSG Systems International Inc. | 2,322 | 99 |
| * | Perficient Inc. | 2,280 | 98 |
| * | Rambus Inc. | 7,144 | 96 |
| | NIC Inc. | 4,461 | 95 |
| * | PROS Holdings Inc. | 2,368 | 92 |
| | Xperi Holding Corp. | 6,862 | 86 |
| * | Amkor Technology Inc. | 6,724 | 82 |
| * | EchoStar Corp. Class A | 2,745 | 81 |
| * | Virtusa Corp. | 2,037 | 81 |
| * | MicroStrategy Inc. Class A | 497 | 72 |
| * | NETGEAR Inc. | 1,679 | 56 |
| | Pitney Bowes Inc. | 9,620 | 53 |
| | Shutterstock Inc. | 1,058 | 53 |
| * | SolarWinds Corp. | 2,525 | 53 |
| * | Schrodinger Inc. | 865 | 52 |
| * | NextGen Healthcare Inc. | 3,132 | 42 |
| * | Stratasys Ltd. | 2,784 | 41 |
| * | ScanSource Inc. | 1,396 | 34 |
| * | 3D Systems Corp. | 6,276 | 34 |
| | Ebix Inc. | 1,336 | 31 |
| * | Endurance International Group Holdings Inc. | 4,723 | 31 |
| * | Blucora Inc. | 2,524 | 30 |
| | Plantronics Inc. | 1,841 | 23 |
| | Loral Space & Communications Inc. | 924 | 22 |
| * | Forrester Research Inc. | 569 | 20 |
| | | | | | | 636,314 |
| Telecommunications (1.9%) |
| | Verizon Communications Inc. | 280,203 | 16,608 |
| | AT&T Inc. | 483,048 | 14,400 |
| * | T-Mobile US Inc. | 37,001 | 4,317 |
| | CenturyLink Inc. | 74,926 | 805 |
| * | Iridium Communications Inc. | 8,357 | 234 |
| | Shenandoah Telecommunications Co. | 3,539 | 196 |
| * | Vonage Holdings Corp. | 16,734 | 192 |
| | | | | | Shares | Market
Value•
($000) |
| | Telephone & Data Systems Inc. | 7,870 | 182 |
| * | 8x8 Inc. | 6,040 | 102 |
| | ATN International Inc. | 557 | 32 |
| * | United States Cellular Corp. | 866 | 31 |
| *,1 | GTT Communications Inc. | 1,798 | 9 |
| | | | | | | 37,108 |
| Utilities (1.0%) |
| | Sempra Energy | 19,879 | 2,458 |
| | American Water Works Co. Inc. | 12,262 | 1,733 |
| | Consolidated Edison Inc. | 22,729 | 1,621 |
| | PPL Corp. | 51,908 | 1,434 |
| | Edison International | 24,083 | 1,264 |
| | CMS Energy Corp. | 19,164 | 1,159 |
| | Alliant Energy Corp. | 16,577 | 898 |
| | Atmos Energy Corp. | 8,203 | 819 |
| | AES Corp. | 44,587 | 791 |
| | Essential Utilities Inc. | 16,269 | 691 |
| | CenterPoint Energy Inc. | 33,709 | 677 |
| | NiSource Inc. | 24,989 | 554 |
| | UGI Corp. | 14,159 | 489 |
| * | Sunrun Inc. | 7,918 | 448 |
| | OGE Energy Corp. | 13,060 | 416 |
| | IDACORP Inc. | 3,326 | 299 |
| | ONE Gas Inc. | 3,578 | 265 |
| | Hawaiian Electric Industries Inc. | 7,314 | 253 |
| | Southwest Gas Holdings Inc. | 3,859 | 243 |
| | Portland General Electric Co. | 5,899 | 225 |
| | New Jersey Resources Corp. | 6,889 | 208 |
| | Spire Inc. | 3,562 | 207 |
| | American States Water Co. | 2,666 | 203 |
| | Avangrid Inc. | 4,098 | 197 |
| | NorthWestern Corp. | 3,598 | 186 |
| | Avista Corp. | 4,868 | 179 |
| | MGE Energy Inc. | 2,708 | 176 |
| | Ormat Technologies Inc. | 2,779 | 169 |
| | California Water Service Group | 3,709 | 168 |
| | Clearway Energy Inc. Class C | 6,425 | 164 |
| | South Jersey Industries Inc. | 7,081 | 157 |
| | Atlantica Sustainable Infrastructure plc | 3,747 | 112 |
| | SJW Group | 1,768 | 111 |
| * | Evoqua Water Technologies Corp. | 5,109 | 105 |
| | Northwest Natural Holding Co. | 1,950 | 100 |
| | Clearway Energy Inc. Class A | 1,924 | 46 |
| | | | | | | 19,225 |
Total Common Stocks
(Cost $1,574,081) | 1,970,891 |
| | | | | | Shares | Market
Value•
($000) |
| Temporary Cash Investments (0.1%) |
| Money Market Fund (0.1%) |
| 3,4 | Vanguard Market Liquidity Fund, 0.147%
(Cost $1,828) | 18,279 | 1,828 |
Total Investments (99.9%)
(Cost $1,575,909) | | 1,972,719 |
| Other Assets and Liabilities—Net (0.1%) | | 1,624 |
| Net Assets (100%) | | 1,974,343 |
| Cost is in $000. |
| • | See Note A in Notes to Financial Statements. |
| * | Non-income-producing security. |
| 1 | Includes partial security positions on loan to broker-dealers. The total value of securities on loan is $318,000. |
| 2 | Security value determined using significant unobservable inputs. |
| 3 | Affiliated money market fund available only to Vanguard funds and certain trusts and accounts managed by Vanguard. Rate shown is the 7-day yield. |
| 4 | Collateral of $335,000 was received for securities on loan. |
| | CVR—Contingent Value Rights. |
| | REIT—Real Estate Investment Trust. |
Derivative Financial Instruments Outstanding as of Period End
| Futures Contracts |
| | | | ($000) |
| | Expiration | Number of
Long (Short)
Contracts | Notional
Amount | Value and
Unrealized
Appreciation
(Depreciation) |
| Long Futures Contracts | | | | |
| E-mini S&P 500 Index | September 2020 | 17 | 2,974 | 219 |
See accompanying Notes, which are an integral part of the Financial Statements.
Statement of Assets and Liabilities
|
| ($000s, except shares and per-share amounts) | Amount |
| Assets | |
| Investments in Securities, at Value | |
| Unaffiliated Issuers (Cost $1,574,081) | 1,970,891 |
| Affiliated Issuers (Cost $1,828) | 1,828 |
| Total Investments in Securities | 1,972,719 |
| Investment in Vanguard | 76 |
| Cash | 9 |
| Cash Collateral Pledged—Futures Contracts | 205 |
| Receivables for Investment Securities Sold | 1 |
| Receivables for Accrued Income | 1,785 |
| Total Assets | 1,974,795 |
| Liabilities | |
| Collateral for Securities on Loan | 335 |
| Payables to Vanguard | 113 |
| Variation Margin Payable—Futures Contracts | 4 |
| Total Liabilities | 452 |
| Net Assets | 1,974,343 |
| At August 31, 2020, net assets consisted of: | |
| | |
| Paid-in Capital | 1,595,940 |
| Total Distributable Earnings (Loss) | 378,403 |
| Net Assets | 1,974,343 |
| | |
| Net Assets | |
| Applicable to 30,625,000 outstanding $.001 par value shares of beneficial interest (unlimited authorization) | 1,974,343 |
| Net Asset Value Per Share | $64.47 |
See accompanying Notes, which are an integral part of the Financial Statements.
|
| | Year Ended
August 31, 2020 |
| | ($000) |
| Investment Income | |
| Income | |
| Dividends | 18,449 |
| Interest1 | 14 |
| Securities Lending—Net | 32 |
| Total Income | 18,495 |
| Expenses | |
| The Vanguard Group—Note B | |
| Investment Advisory Services | 167 |
| Management and Administrative | 1,032 |
| Marketing and Distribution | 68 |
| Custodian Fees | 35 |
| Auditing Fees | 34 |
| Shareholders’ Reports | 15 |
| Trustees’ Fees and Expenses | 1 |
| Total Expenses | 1,352 |
| Expenses Paid Indirectly | (14) |
| Net Expenses | 1,338 |
| Net Investment Income | 17,157 |
| Realized Net Gain (Loss) | |
| Investment Securities Sold1,2 | (16,739) |
| Futures Contracts | 414 |
| Realized Net Gain (Loss) | (16,325) |
| Change in Unrealized Appreciation (Depreciation) | |
| Investment Securities1 | 366,735 |
| Futures Contracts | 209 |
| Change in Unrealized Appreciation (Depreciation) | 366,944 |
| Net Increase (Decrease) in Net Assets Resulting from Operations | 367,776 |
| 1 | Interest income, realized net gain (loss), and change in unrealized appreciation (depreciation) from an affiliated company of the fund were $14,000, $0, and $0, respectively. Purchases and sales are for temporary cash investment purposes. |
| 2 | Includes $5,025,000 of the net gain (loss) resulting from in-kind redemptions. |
See accompanying Notes, which are an integral part of the Financial Statements.
Statement of Changes in Net Assets
|
| | Year Ended August 31, | | September 18, 20181 to August 31, |
| | 2020 | | 2019 |
| | ($000) | | ($000) |
| Increase (Decrease) in Net Assets | | | |
| Operations | | | |
| Net Investment Income | 17,157 | | 4,244 |
| Realized Net Gain (Loss) | (16,325) | | (2,051) |
| Change in Unrealized Appreciation (Depreciation) | 366,944 | | 30,085 |
| Net Increase (Decrease) in Net Assets Resulting from Operations | 367,776 | | 32,278 |
| Distributions2 | | | |
| Total Distributions | (14,177) | | (2,448) |
| Capital Share Transactions | | | |
| Issued | 1,046,350 | | 564,704 |
| Issued in Lieu of Cash Distributions | — | | — |
| Redeemed | (20,140) | | — |
| Net Increase (Decrease) from Capital Share Transactions | 1,026,210 | | 564,704 |
| Total Increase (Decrease) | 1,379,809 | | 594,534 |
| Net Assets | | | |
| Beginning of Period | 594,534 | | — |
| End of Period | 1,974,343 | | 594,534 |
| 1 | Inception. |
| 2 | Certain prior period numbers have been reclassed to conform with current period presentation. |
See accompanying Notes, which are an integral part of the Financial Statements.
| | Year
Ended
August 31,
2020 | September 18,
20181 to
August 31,
2019 |
For a Share Outstanding
Throughout Each Period | | |
| Net Asset Value, Beginning of Period | $51.25 | $50.00 |
| Investment Operations | | |
| Net Investment Income2 | .846 | .792 |
| Net Realized and Unrealized Gain (Loss) on Investments | 13.146 | .868 |
| Total from Investment Operations | 13.992 | 1.660 |
| Distributions | | |
| Dividends from Net Investment Income | (.772) | (.410) |
| Distributions from Realized Capital Gains | — | — |
| Total Distributions | (.772) | (.410) |
| Net Asset Value, End of Period | $64.47 | $51.25 |
| Total Return | 27.60% | 3.40% |
| Ratios/Supplemental Data | | |
| Net Assets, End of Period (Millions) | $1,974 | $595 |
| Ratio of Total Expenses to Average Net Assets | 0.12% | 0.12%3 |
| Ratio of Net Investment Income to Average Net Assets | 1.54% | 1.67%3 |
| Portfolio Turnover Rate | 6% | 6% |
| 1 | Inception. |
| 2 | Calculated based on average shares outstanding. |
| 3 | Annualized. |
See accompanying Notes, which are an integral part of the Financial Statements.
Notes to Financial Statements
Vanguard ESG U.S. Stock ETF is registered under the Investment Company Act of 1940 as an open-end investment company, or mutual fund. ETF Shares are listed for trading on Cboe BZX Exchange; they can be purchased and sold through a broker. Market disruptions associated with the COVID-19 pandemic have had a global impact, and uncertainty exists as to the long-term implications. Such disruptions can adversely affect assets of the fund and thus fund performance.
A. The following significant accounting policies conform to generally accepted accounting principles for U.S. investment companies. The fund consistently follows such policies in preparing its financial statements.
1. Security Valuation: Securities are valued as of the close of trading on the New York Stock Exchange (generally 4 p.m., Eastern time) on the valuation date. Equity securities are valued at the latest quoted sales prices or official closing prices taken from the primary market in which each security trades; such securities not traded on the valuation date are valued at the mean of the latest quoted bid and asked prices. Securities for which market quotations are not readily available, or whose values have been materially affected by events occurring before the fund's pricing time but after the close of the securities’ primary markets, are valued by methods deemed by the board of trustees to represent fair value. Investments in Vanguard Market Liquidity Fund are valued at that fund's net asset value.
2. Futures Contracts: The fund uses index futures contracts to a limited extent, with the objectives of maintaining full exposure to the stock market, maintaining liquidity, and minimizing transaction costs. The fund may purchase futures contracts to immediately invest incoming cash in the market, or sell futures in response to cash outflows, thereby simulating a fully invested position in the underlying index while maintaining a cash balance for liquidity. The primary risks associated with the use of futures contracts are imperfect correlation between changes in market values of stocks held by the fund and the prices of futures contracts, and the possibility of an illiquid market. Counterparty risk involving futures is mitigated because a regulated clearinghouse is the counterparty instead of the clearing broker. To further mitigate counterparty risk, the fund trades futures contracts on an exchange, monitors the financial strength of its clearing brokers and clearinghouse, and has entered into clearing agreements with its clearing brokers. The clearinghouse imposes initial margin requirements to secure the fund’s performance and requires daily settlement of variation margin representing changes in the market value of each contract. Any securities pledged as initial margin for open contracts are noted in the Schedule of Investments.
Futures contracts are valued at their quoted daily settlement prices. The notional amounts of the contracts are not recorded in the Statement of Assets and Liabilities. Fluctuations in the value of the contracts are recorded in the Statement of Assets and Liabilities as an asset (liability) and in the Statement of Operations as unrealized appreciation (depreciation) until the contracts are closed, when they are recorded as realized gains (losses) on futures contracts.
During the year ended August 31, 2020, the fund’s average investments in long and short futures contracts represented less than 1% and 0% of net assets, respectively, based on the average of the notional amounts at each quarter-end during the period.
3. Federal Income Taxes: The fund intends to continue to qualify as a regulated investment company and distribute all of its taxable income. The fund’s tax returns are open to examination by the relevant tax authorities until expiration of the applicable statute of limitations, which is
generally three years after the filing of the tax return. Management has analyzed the fund’s tax positions taken for all open federal and state income tax years, and has concluded that no provision for income tax is required in the fund’s financial statements.
4. Distributions: Distributions to shareholders are recorded on the ex-dividend date. Distributions are determined on a tax basis at the fiscal year-end and may differ from net investment income and realized capital gains for financial reporting purposes.
5. Securities Lending: To earn additional income, the fund lends its securities to qualified institutional borrowers. Security loans are subject to termination by the fund at any time, and are required to be secured at all times by collateral in an amount at least equal to the market value of securities loaned. Daily market fluctuations could cause the value of loaned securities to be more or less than the value of the collateral received. When this occurs, the collateral is adjusted and settled before the opening of the market on the next business day. The fund further mitigates its counterparty risk by entering into securities lending transactions only with a diverse group of prequalified counterparties, monitoring their financial strength, and entering into master securities lending agreements with its counterparties. The master securities lending agreements provide that, in the event of a counterparty’s default (including bankruptcy), the fund may terminate any loans with that borrower, determine the net amount owed, and sell or retain the collateral up to the net amount owed to the fund; however, such actions may be subject to legal proceedings. While collateral mitigates counterparty risk, in the event of a default, the fund may experience delays and costs in recovering the securities loaned. The fund invests cash collateral received in Vanguard Market Liquidity Fund, and records a liability in the Statement of Assets and Liabilities for the return of the collateral, during the period the securities are on loan. Collateral investments in Vanguard Market Liquidity Fund are subject to market appreciation or depreciation. Securities lending income represents fees charged to borrowers plus income earned on invested cash collateral, less expenses associated with the loan. During the term of the loan, the fund is entitled to all distributions made on or in respect of the loaned securities.
6. Credit Facilities and Interfund Lending Program: The fund and certain other funds managed by The Vanguard Group ("Vanguard") participate in a $4.3 billion committed credit facility provided by a syndicate of lenders pursuant to a credit agreement and an uncommitted credit facility provided by Vanguard. Both facilities may be renewed annually. Each fund is individually liable for its borrowings, if any, under the credit facilities. Borrowings may be utilized for temporary or emergency purposes, subject to the fund’s regulatory and contractual borrowing restrictions. With respect to the committed credit facility, the participating funds are charged administrative fees and an annual commitment fee of 0.10% of the undrawn committed amount of the facility; these fees are allocated to the funds based on a method approved by the fund’s board of trustees and included in Management and Administrative expenses on the fund’s Statement of Operations. Any borrowings under either facility bear interest at a rate based upon the higher of the one-month London Interbank Offered Rate (or an acceptable alternate rate, if necessary), federal funds effective rate, or overnight bank funding rate plus an agreed-upon spread, except that borrowings under the uncommitted credit facility may bear interest based upon an alternative rate agreed to by the fund and Vanguard.
In accordance with an exemptive order (the “Order”) from the SEC, the fund may participate in a joint lending and borrowing program that allows registered open-end Vanguard funds to borrow money from and lend money to each other for temporary or emergency purposes (the “Interfund Lending Program”), subject to compliance with the terms and conditions of the Order, and to the extent permitted by the fund’s investment objective and investment policies. Interfund loans and
borrowings normally extend overnight, but can have a maximum duration of seven days. Loans may be called on one business day’s notice. The interest rate to be charged is governed by the conditions of the Order and internal procedures adopted by the board of trustees. The board of trustees is responsible for overseeing the Interfund Lending Program.
For the year ended August 31, 2020, the fund did not utilize the credit facilities or the Interfund Lending Program.
7. Other: Dividend income is recorded on the ex-dividend date. Interest income includes income distributions received from Vanguard Market Liquidity Fund and is accrued daily. Security transactions are accounted for on the date securities are bought or sold. Costs used to determine realized gains (losses) on the sale of investment securities are those of the specific securities sold.
B. In accordance with the terms of a Funds’ Service Agreement (the “FSA”) between Vanguard and the fund, Vanguard furnishes to the fund investment advisory, corporate management, administrative, marketing, and distribution services at Vanguard’s cost of operations (as defined by the FSA). These costs of operations are allocated to the fund based on methods and guidelines approved by the board of trustees and are generally settled twice a month.
Upon the request of Vanguard, the fund may invest up to 0.40% of its net assets as capital in Vanguard. At August 31, 2020, the fund had contributed to Vanguard capital in the amount of $76,000, representing less than 0.01% of the fund’s net assets and 0.03% of Vanguard’s capital received pursuant to the FSA. The fund’s trustees and officers are also directors and employees, respectively, of Vanguard.
C. The fund’s custodian bank has agreed to reduce its fees when the fund maintains cash on deposit in the non-interest-bearing custody account. For the year ended August 31, 2020, custodian fee offset arrangements reduced the fund’s expenses by $14,000 (an annual rate of less than 0.01% of average net assets).
D. Various inputs may be used to determine the value of the fund’s investments and derivatives. These inputs are summarized in three broad levels for financial statement purposes. The inputs or methodologies used to value securities are not necessarily an indication of the risk associated with investing in those securities.
Level 1—Quoted prices in active markets for identical securities.
Level 2—Other significant observable inputs (including quoted prices for similar securities, interest rates, prepayment speeds, credit risk, etc.).
Level 3—Significant unobservable inputs (including the fund’s own assumptions used to determine the fair value of investments). Any investments and derivatives valued with significant unobservable inputs are noted on the Schedule of Investments.
The following table summarizes the market value of the fund's investments and derivatives as of August 31, 2020, based on the inputs used to value them:
| | Level 1
($000) | Level 2
($000) | Level 3
($000) | Total
($000) |
| Investments | | | | |
| Assets | | | | |
| Common Stocks | 1,970,890 | — | 1 | 1,970,891 |
| Temporary Cash Investments | 1,828 | — | — | 1,828 |
| Total | 1,972,718 | — | 1 | 1,972,719 |
| | | | |
| Derivative Financial Instruments | | | | |
| Liabilities | | | | |
| Futures Contracts1 | 4 | — | — | 4 |
| 1 | Represents variation margin on the last day of the reporting period. |
E. Permanent differences between book-basis and tax-basis components of net assets are reclassified among capital accounts in the financial statements to reflect their tax character. These reclassifications have no effect on net assets or net asset value per share. As of period end, permanent differences primarily attributable to the accounting for in-kind redemptions and passive foreign investment companies were reclassified between the following accounts:
| | Amount
($000) |
| Paid-in Capital | 5,026 |
| Total Distributable Earnings (Loss) | (5,026) |
Temporary differences between book-basis and tax-basis components of total distributable earnings (losses) arise when certain items of income, gain, or loss are recognized in different periods for financial statement and tax purposes; these differences will reverse at some time in the future. The differences are primarily related to the deferral of losses from wash sales; the recognition of unrealized gains or losses from certain derivative contracts; and the classification of securities for tax purposes. As of period end, the tax-basis components of total distributable earnings (losses) are detailed in the table as follows:
| | Amount
($000) |
| Undistributed Ordinary Income | 4,781 |
| Undistributed Long-Term Gains | — |
| Capital Loss Carryforwards | (21,769) |
| Qualified Late-Year Losses | — |
| Net Unrealized Gains (Losses) | 395,391 |
The tax character of distributions paid was as follows:
| | Year Ended
August 31, 2020 | | Period Ended
August 31, 2019 |
| | Amount
($000) | | Amount
($000) |
| Ordinary Income* | 14,177 | | 2,448 |
| Long-Term Capital Gains | — | | — |
| Total | 14,177 | | 2,448 |
| * | Includes short-term capital gains, if any. |
As of August 31, 2020, gross unrealized appreciation and depreciation for investments and derivatives based on cost for U.S. federal income tax purposes were as follows:
| | Amount
($000) |
| Tax Cost | 1,577,328 |
| Gross Unrealized Appreciation | 454,928 |
| Gross Unrealized Depreciation | (59,537) |
| Net Unrealized Appreciation (Depreciation) | 395,391 |
F. During the year ended August 31, 2020, the fund purchased $1,113,727,000 of investment securities and sold $86,172,000 of investment securities, other than temporary cash investments. Purchases and sales include $856,802,000 and $18,717,000, respectively, in connection with in-kind purchases and redemptions of the fund’s capital shares.
The fund purchased securities from and sold securities to other Vanguard funds or accounts managed by Vanguard or its affiliates, in accordance with procedures adopted by the board of trustees in compliance with Rule 17a-7 of the Investment Company Act of 1940. For the year ended August 31, 2020, such purchases and sales were $25,209,000 and $9,131,000, respectively; these amounts, other than temporary cash investments, are included in the purchases and sales of investment securities noted above.
G. Capital shares issued and redeemed were:
| | Year Ended
August 31, 2020 | | September 18, 20181 to
August 31, 2019 |
| | Shares
(000) | | Shares
(000) |
| Issued | 19,400 | | 11,600 |
| Issued in Lieu of Cash Distributions | — | | — |
| Redeemed | (375) | | — |
| Net Increase (Decrease) in Shares Outstanding | 19,025 | | 11,600 |
H. Management has determined that no events or transactions occurred subsequent to August 31, 2020, that would require recognition or disclosure in these financial statements.
Report of Independent Registered
Public Accounting Firm
To the Board of Trustees of Vanguard World Fund and Shareholders of Vanguard ESG U.S .Stock ETF
Opinion on the Financial Statements
We have audited the accompanying statement of assets and liabilities, including the schedule of investments, of Vanguard ESG U.S. Stock ETF (one of the funds constituting Vanguard World Fund, referred to hereafter as the "Fund”) as of August 31, 2020, the related statement of operations for the year ended August 31, 2020 and the statement of changes in net assets and the financial highlights for the year ended August 31, 2020 and for the period September 18, 2018 (inception) through August 31, 2019, including the related notes (collectively referred to as the “financial statements”). In our opinion, the financial statements present fairly, in all material respects, the financial position of the Fund as of August 31, 2020, the results of its operations for the year ended August 31, 2020, and the changes in its net assets and the financial highlights for the year ended August 31, 2020 and for the period September 18, 2018 (inception) through August 31, 2019 in conformity with accounting principles generally accepted in the United States of America.
Basis for Opinion
These financial statements are the responsibility of the Fund’s management. Our responsibility is to express an opinion on the Fund’s financial statements based on our audits. We are a public accounting firm registered with the Public Company Accounting Oversight Board (United States) (“PCAOB”) and are required to be independent with respect to the Fund in accordance with the U.S. federal securities laws and the applicable rules and regulations of the Securities and Exchange Commission and the PCAOB.
We conducted our audits of these financial statements in accordance with the standards of the PCAOB. Those standards require that we plan and perform the audit to obtain reasonable assurance about whether the financial statements are free of material misstatement, whether due to error or fraud.
Our audits included performing procedures to assess the risks of material misstatement of the financial statements, whether due to error or fraud, and performing procedures that respond to those risks. Such procedures included examining, on a test basis, evidence regarding the amounts and disclosures in the financial statements. Our audits also included evaluating the accounting principles used and significant estimates made by management, as well as evaluating the overall presentation of the financial statements. Our procedures included confirmation of securities owned as of August 31, 2020 by correspondence with the custodian and brokers and by agreement to the underlying ownership records of the transfer agent; when replies were not received from brokers, we performed other auditing procedures. We believe that our audits provide a reasonable basis for our opinion.
/s/PricewaterhouseCoopers LLP
Philadelphia, Pennsylvania
October 19, 2020
We have served as the auditor of one or more investment companies in The Vanguard Group of Funds since 1975.
Special 2020 tax information (unaudited) for Vanguard ESG U.S. Stock ETF
This information for the fiscal year ended August 31, 2020, is included pursuant to provisions of the Internal Revenue Code.
The fund distributed $13,691,000 of qualified dividend income to shareholders during the fiscal year.
The fund distributed $228,000 of qualified business income to shareholders during the fiscal year.
For corporate shareholders, 94.3% of investment income (dividend income plus short-term gains, if any) qualifies for the dividends-received deduction.
Trustees Approve Advisory Arrangements
The board of trustees of Vanguard ESG U.S. Stock ETF has renewed the fund’s investment advisory arrangement with The Vanguard Group, Inc. (Vanguard), through its Equity Index Group. The board determined that continuing the fund’s internalized management structure was in the best interests of the fund and its shareholders.
The board based its decision upon an evaluation of the advisor’s investment staff, portfolio management process, and performance. This evaluation included information provided to the board by Vanguard’s Portfolio Review Department, which is responsible for fund and advisor oversight and product management. The Portfolio Review Department met regularly with the advisor and made monthly presentations to the board during the fiscal year that directed the board’s focus to relevant information and topics.
The board, or an investment committee made up of board members, also received information throughout the year during advisor presentations. For each advisor presentation, the board was provided with letters and reports that included information about, among other things, the advisory firm and the advisor’s assessment of the investment environment, portfolio performance, and portfolio characteristics.
In addition, the board received monthly reports, which included a Market and Economic Report, a Fund Dashboard Monthly Summary, and a Fund Performance Report.
Prior to their meeting, the trustees were provided with a memo and materials that summarized the information they received over the course of the year. They also considered the factors discussed below, among others. However, no single factor determined whether the board approved the arrangements. Rather, it was the totality of the circumstances that drove the board’s decision.
Nature, extent, and quality of services
The board considered the quality of the investment management services provided to the fund since its inception in 2018 and took into account the organizational depth and stability of the advisor. The board considered that Vanguard has been managing investments for more than four decades. The Equity Index Group adheres to a sound, disciplined investment management process; the team has considerable experience, stability, and depth.
The board concluded that Vanguard’s experience, stability, depth, and performance, among other factors, warranted continuation of the advisory arrangement.
Investment performance
The board considered the fund’s performance since its inception, including any periods of outperformance or underperformance compared with its target index and peer group. The board concluded that the performance was such that the advisory arrangement should continue.
Cost
The board concluded that the fund’s estimated expense ratio for the current fiscal year was well below the average expense ratio charged by funds in its peer group and that the fund’s estimated advisory expenses for the current fiscal year were also well below the peer-group average.
The board does not conduct a profitability analysis of Vanguard because of Vanguard’s unique structure. Unlike most other mutual fund management companies, Vanguard is owned by the funds it oversees.
The benefit of economies of scale
The board concluded that the fund’s arrangement with Vanguard ensures that the fund will realize economies of scale as it grows, with the cost to shareholders declining as fund assets increase.
The board will consider whether to renew the advisory arrangement again after a one-year period.
Liquidity Risk Management
Vanguard funds (except for the money market funds) have adopted and implemented a written liquidity risk management program (the “Program”) as required by Rule 22e-4 under the Investment Company Act of 1940. Rule 22e-4 requires that each fund adopt a program that is reasonably designed to assess and manage the fund’s liquidity risk, which is the risk that the fund could not meet redemption requests without significant dilution of remaining investors’ interests in the fund.
Assessment and management of a fund’s liquidity risk under the Program take into consideration certain factors, such as the fund’s investment strategy and the liquidity of its portfolio investments during normal and reasonably foreseeable stressed conditions, its short- and long-term cash-flow projections during both normal and reasonably foreseeable stressed conditions, and its cash and cash-equivalent holdings and access to other funding sources. As required by the rule, the Program includes policies and procedures for classification of fund portfolio holdings in four liquidity categories, maintaining certain levels of highly liquid investments, and limiting holdings of illiquid investments.
The board of trustees of Vanguard World Fund approved the appointment of liquidity risk management program administrators responsible for administering Vanguard ESG U.S. Stock ETF’s Program and for carrying out the specific responsibilities set forth in the Program, including reporting to the board on at least an annual basis regarding the Program’s operation, its adequacy, and the effectiveness of its implementation for the past year (the “Program Administrator Report”). The board has reviewed the Program Administrator Report covering the period from December 1, 2018, through December 31, 2019 (the “Review Period”). The Program Administrator Report stated that during the Review Period the Program operated and was implemented effectively to manage the fund’s liquidity risk.
London Stock Exchange Group companies include FTSE International Limited (“FTSE”), Frank Russell Company (“Russell”), MTS Next Limited (“MTS”), and FTSE TMX Global Debt Capital Markets Inc. (“FTSE TMX”). All rights reserved. “FTSE®”, “Russell®”, “MTS®”, “FTSE TMX®” and “FTSE Russell” and other service marks and trademarks related to the FTSE or Russell indexes are trademarks of the London Stock Exchange Group companies and are used by FTSE, MTS, FTSE TMX and Russell under license. All information is provided for information purposes only. Every effort is made to ensure that all information given in this publication is accurate, but no responsibility or liability can be accepted by the London Stock Exchange Group companies nor its licensors for any errors or for any loss from use of this publication. Neither the London Stock Exchange Group companies nor any of their licensors make any claim, prediction, warranty or representation whatsoever, expressly or impliedly, either as to the results to be obtained from the use of the Indices or the fitness or suitability of the Indices for any particular purpose to which they might be put. The London Stock Exchange Group companies do not provide investment advice and nothing in this document should be taken as constituting financial or investment advice. The London Stock Exchange Group companies make no representation regarding the advisability of investing in any asset. A decision to invest in any such asset should not be made in reliance on any information herein. Indexes cannot be invested in directly. Inclusion of an asset in an index is not a recommendation to buy, sell or hold that asset. The general information contained in this publication should not be acted upon without obtaining specific legal, tax, and investment advice from a licensed professional. No part of this information may be reproduced, stored in a retrieval system or transmitted in any form or by any means, electronic, mechanical, photocopying, recording or otherwise, without prior written permission of the London Stock Exchange Group companies. Distribution of the London Stock Exchange Group companies’ index values and the use of their indexes to create financial products require a license with FTSE, FTSE TMX, MTS and/or Russell and/or its licensors.
This page intentionally left blank.
The People Who Govern Your Fund
The trustees of your mutual fund are there to see that the fund is operated and managed in your best interests since, as a shareholder, you are a part owner of the fund. Your fund’s trustees also serve on the board of directors of The Vanguard Group, Inc., which is owned by the Vanguard funds and provides services to them.
A majority of Vanguard’s board members are independent, meaning that they have no affiliation with Vanguard or the funds they oversee, apart from the sizable personal investments they have made as private individuals. The independent board members have distinguished backgrounds in business, academia, and public service. Each of the trustees and executive officers oversees 212 Vanguard funds.
Information for each trustee and executive officer of the fund appears below. That information, as well as the Vanguard fund count, is as of the date on the cover of this fund report. The mailing address of the trustees and officers is P.O. Box 876, Valley Forge, PA 19482. More information about the trustees is in the Statement of Additional Information, which can be obtained, without charge, by contacting Vanguard at 800-662-7447, or online at vanguard.com.
Interested Trustee1
Mortimer J. Buckley
Born in 1969. Trustee since January 2018. Principal occupation(s) during the past five years and other experience: chairman of the board (2019–present) of Vanguard and of each of the investment companies served by Vanguard; chief executive officer (2018–present) of Vanguard; chief executive officer, president, and trustee (2018–present) of each of the investment companies served by Vanguard; president and director (2017–present) of Vanguard; and president (2018–present) of Vanguard Marketing Corporation. Chief investment officer (2013–2017), managing director (2002–2017), head of the Retail Investor Group (2006–2012), and chief information officer (2001–2006) of Vanguard. Chairman of the board (2011–2017) and trustee (2009–2017) of the Children’s Hospital of Philadelphia; and trustee (2018–present) and vice chair (2019–present) of The Shipley School.
Independent Trustees
Emerson U. Fullwood
Born in 1948. Trustee since January 2008. Principal occupation(s) during the past five years and other experience: executive chief staff and marketing officer for North America and corporate vice president (retired 2008) of Xerox Corporation (document management products and services). Former president of the Worldwide Channels Group, Latin America, andWorldwide Customer Service and executive chief staff officer of Developing Markets of Xerox. Executive in residence and 2009–2010 Distinguished Minett Professor at the Rochester Institute of Technology. Director of SPX FLOW, Inc. (multi-industry manufacturing). Director of the University of Rochester Medical Center, the Monroe Community College Foundation, the United Way of Rochester, North Carolina A&T University, and Roberts Wesleyan College. Trustee of the University of Rochester.
Amy Gutmann
Born in 1949. Trustee since June 2006. Principal occupation(s) during the past five years and other experience: president (2004–present) of the University of Pennsylvania. Christopher H. Browne Distinguished Professor of Political Science, School of Arts and Sciences, and professor of communication, Annenberg School for Communication, with secondary faculty appointments in the Department of Philosophy, School of Arts and Sciences, and at the Graduate School of Education, University of Pennsylvania.
1 Mr. Buckley is considered “interested person,” as defined in the Investment Company Act of 1940, because he is an officer of the Vanguard funds.
F. Joseph Loughrey
Born in 1949. Trustee since October 2009. Principal occupation(s) during the past five years and other experience: president and chief operating officer (retired 2009) and vice chairman of the board (2008–2009) of Cummins Inc. (industrial machinery). Chairman of the board of Hillenbrand, Inc. (specialized consumer services) and the Lumina Foundation. Director of the V Foundation. Member of the advisory council for the College of Arts and Letters and chair of the advisory board to the Kellogg Institute for International Studies, both at the University of Notre Dame.
Mark Loughridge
Born in 1953. Trustee since March 2012. Principal occupation(s) during the past five years and other experience: senior vice president and chief financial officer (retired 2013) of IBM (information technology services). Fiduciary member of IBM’s Retirement Plan Committee (2004–2013), senior vice president and general manager (2002–2004) of IBM Global Financing, vice president and controller (1998–2002) of IBM, and a variety of other prior management roles at IBM. Member of the Council on Chicago Booth.
Scott C. Malpass
Born in 1962. Trustee since March 2012. Principal occupation(s) during the past five years and other experience: chief investment officer (retired June 2020) and vice president (retired June 2020) of the University of Notre Dame. Assistant professor of finance at the Mendoza College of Business, University of Notre Dame, and member of the Notre Dame 403(b) Investment Committee (retired June 2020). Member of the board of Catholic Investment Services, Inc. (investment advisors) and the board of superintendence of the Institute for the Works of Religion.
Deanna Mulligan
Born in 1963. Trustee since January 2018. Principal occupation(s) during the past five years and other experience: chief executive officer (2011–present) of The Guardian Life Insurance Company of America. President (2010–2019), chief operating officer (2010–2011), and executive vice president (2008–2010) of Individual Life and Disability of The Guardian Life Insurance Company of America. Member of the board of The Guardian Life Insurance Company of America, the American Council of Life Insurers, and the Economic Club of New York. Trustee of the Partnership for New York City (business leadership), Chief Executives for Corporate Purpose, NewYork-Presbyterian Hospital, Catalyst, and the Bruce Museum (arts and science). Member of the Advisory Council for the Stanford Graduate School of Business.
André F. Perold
Born in 1952. Trustee since December 2004. Principal occupation(s) during the past five years and other experience: George Gund Professor of Finance and Banking, Emeritus at the Harvard Business School (retired 2011). Chief investment officer and co-managing partner of HighVista Strategies (private investment firm). Member of the board of advisors and member of the investment committee of the Museum of Fine Arts Boston. Member of the board (2018–present) of RIT Capital Partners (investment firm). Member of the investment committee of Partners Health Care System.
Sarah Bloom Raskin
Born in 1961. Trustee since January 2018. Principal occupation(s) during the past five years and other experience: deputy secretary (2014–2017) of the United States Department of the Treasury. Governor (2010–2014) of the Federal Reserve Board. Commissioner (2007–2010) of financial regulation for the State of Maryland. Member of the board of directors (2012–2014) of Neighborhood Reinvestment Corporation. Director (2017–present) of i(x) Investments, LLC; director (2017–present) of Reserve Trust. Rubenstein Fellow (2017–present) of Duke University; trustee (2017–present) of Amherst College, and trustee (2019–present) of the Folger Shakespeare Library.
Peter F. Volanakis
Born in 1955. Trustee since July 2009. Principal occupation(s) during the past five years and other experience: president and chief operating officer (retired 2010) of Corning Incorporated (communications equipment) and director of Corning Incorporated (2000–2010) and Dow Corning (2001–2010). Director (2012) of SPX Corporation (multi-industry manufacturing). Overseer of the Amos Tuck School of Business Administration, Dartmouth College (2001–2013). Chairman of the board of trustees of Colby-Sawyer College. Member of the board of Hypertherm Inc. (industrial cutting systems, software, and consumables).
Executive Officers
John Bendl
Born in 1970. Principal occupation(s) during the past five years and other experience: principal of Vanguard. Chief financial officer (2019–present) of each of the investment companies served by Vanguard. Chief accounting officer, treasurer, and controller of Vanguard (2017–present). Partner (2003–2016) at KPMG (audit, tax, and advisory services).
Glenn Booraem
Born in 1967. Principal occupation(s) during the past five years and other experience: principal of Vanguard. Investment stewardship officer (2017–present), treasurer (2015–2017), controller (2010–2015), and assistant controller (2001–2010) of each of the investment companies served by Vanguard.
Christine M. Buchanan
Born in 1970. Principal occupation(s) during the past five years and other experience: principal of Vanguard. Treasurer (2017–present) of each of the investment companies served by Vanguard. Partner (2005–2017) at KPMG (audit, tax, and advisory services).
David Cermak
Born in 1960. Principal occupation(s) during the past five years and other experience: principal of Vanguard. Finance director (2019–present) of each of the investment companies served by Vanguard. Managing director and head (2017–present) of Vanguard Investments Singapore. Managing director and head (2017–2019) of Vanguard Investments Hong Kong. Representative director and head (2014–2017) of Vanguard Investments Japan.
Thomas J. Higgins
Born in 1957. Principal occupation(s) during the past five years and other experience: principal of Vanguard. Finance director (2019–present), chief financial officer (2008–2019), and treasurer (1998–2008) of each of the investment companies served by Vanguard.
Peter Mahoney
Born in 1974. Principal occupation(s) during the past five years and other experience: principal of Vanguard. Controller (2015–present) of each of the investment companies served by Vanguard. Head of International Fund Services (2008–2014) at Vanguard.
Anne E. Robinson
Born in 1970. Principal occupation(s) during the past five years and other experience: general counsel (2016–present) of Vanguard. Secretary (2016–present) of Vanguard and of each of the investment companies served by Vanguard. Managing director (2016–present) of Vanguard. Managing director and general counsel of Global Cards and Consumer Services (2014–2016) at Citigroup. Counsel (2003–2014) at American Express.
Michael Rollings
Born in 1963. Principal occupation(s) during the past five years and other experience: finance director (2017–present) and treasurer (2017) of each of the investment companies served by Vanguard. Managing director (2016–present) of Vanguard. Chief financial officer (2016–present) of Vanguard. Director (2016–present) of Vanguard Marketing Corporation. Executive vice president and chief financial officer (2006–2016) of MassMutual Financial Group.
John E. Schadl
Born in 1972. Principal occupation(s) during the past five years and other experience: principal of Vanguard. Chief compliance officer (2019–present) of Vanguard and of each of the investment companies served by Vanguard. Assistant vice president (2019–present) of Vanguard Marketing Corporation.
Vanguard Senior Management Team
| Joseph Brennan | Chris D. McIsaac |
| Mortimer J. Buckley | James M. Norris |
| Gregory Davis | Thomas M. Rampulla |
| John James | Karin A. Risi |
| Martha G. King | Anne E. Robinson |
| John T. Marcante | Michael Rollings |
Connect with Vanguard®>vanguard.com
Fund Information > 800-662-7447
Direct Investor Account Services > 800-662-2739
Institutional Investor Services > 800-523-1036
Text Telephone for People
Who Are Deaf or Hard of Hearing > 800-749-7273
This material may be used in conjunction with the offering of shares of any Vanguard fund only if preceded or accompanied by the fund’s current prospectus.
All comparative mutual fund data are from Lipper, a Thomson Reuters Company, or Morningstar, Inc., unless otherwise noted.
You can obtain a free copy of Vanguard’s proxy voting guidelines by visiting vanguard.com/proxyreporting or by calling Vanguard at 800-662-2739. The guidelines are also available from the SEC’s website, sec.gov. In addition, you may obtain a free report on how your fund voted the proxies for securities it owned during the 12 months ended June 30. To get the report, visit either vanguard.com/proxyreporting or sec.gov.
You can review information about your fund on the SEC’s website, and you can receive copies of this information, for a fee, by sending a request via email addressed to publicinfo@sec.gov.
Source for Bloomberg Barclays indexes: Bloomberg Index Services Limited. Copyright 2020, Bloomberg. All rights reserved.
© 2020 The Vanguard Group, Inc.
All rights reserved.
Vanguard Marketing Corporation, Distributor.
Q43930 102020
Annual Report | August 31, 2020
Vanguard ESG International Stock ETF
See the inside front cover for important information about access to your fund’s annual and semiannual shareholder reports.
Important information about access to shareholder reports
Beginning on January 1, 2021, as permitted by regulations adopted by the Securities and Exchange Commission, paper copies of your fund’s annual and semiannual shareholder reports will no longer be sent to you by mail, unless you specifically request them. Instead, you will be notified by mail each time a report is posted on the website and will be provided with a link to access the report.
If you have already elected to receive shareholder reports electronically, you will not be affected by this change and do not need to take any action. You may elect to receive shareholder reports and other communications from the fund electronically by contacting your financial intermediary (such as a broker-dealer or bank) or, if you invest directly with the fund, by calling Vanguard at one of the phone numbers on the back cover of this report or by logging on to vanguard.com.
You may elect to receive paper copies of all future shareholder reports free of charge. If you invest through a financial intermediary, you can contact the intermediary to request that you continue to receive paper copies. If you invest directly with the fund, you can call Vanguard at one of the phone numbers on the back cover of this report or log on to vanguard.com. Your election to receive paper copies will apply to all the funds you hold through an intermediary or directly with Vanguard.
Contents
Please note: The opinions expressed in this report are just that—informed opinions. They should not be considered promises or advice. Also, please keep in mind that the information and opinions cover the period through the date on the front of this report. Of course, the risks of investing in your fund are spelled out in the prospectus.
Your Fund’s Performance at a Glance
| • | Vanguard ESG International Stock ETF returned 11.23% for the 12 months ended August 31, 2020, roughly in line with the expense-free 11.55% return of its benchmark index. |
| • | A number of stock market indexes around the world climbed to record highs in February and then plummeted as the spread of the coronavirus beyond China led to lockdowns, the shuttering of nonessential businesses, and travel restrictions in many countries. However, the unprecedented scale of the response from policymakers, the start of trials for vaccines and treatments, and the easing of some pandemic-related restrictions helped lift investor sentiment. |
| • | U.S. stocks rebounded more strongly than both developed markets outside the United States and emerging markets. |
| • | For the fund’s benchmark, industry sector performances varied greatly over the 12 months. Technology turned in a stellar performance of more than 40%. Financials and telecommunications lagged, with returns in the red. |
| • | Although there wasn’t a wide divergence by region, emerging markets produced the best regional performance for the period, in part because of strong results from China and Taiwan. Singapore, Australia, and Hong Kong detracted from the Pacific region’s performance. |
Market Barometer
| | Average Annual Total Returns
Periods Ended August 31, 2020 |
| | One Year | Three Years | Five Years |
| Stocks | | | |
| Russell 1000 Index (Large-caps) | 22.50% | 14.58% | 14.31% |
| Russell 2000 Index (Small-caps) | 6.02 | 5.03 | 7.65 |
| Russell 3000 Index (Broad U.S. market) | 21.44 | 13.95 | 13.86 |
| FTSE All-World ex US Index (International) | 8.78 | 2.92 | 6.00 |
| Bonds | | | |
| Bloomberg Barclays U.S. Aggregate Bond Index (Broad taxable market) | 6.47% | 5.09% | 4.33% |
| Bloomberg Barclays Municipal Bond Index (Broad tax-exempt market) | 3.24 | 4.09 | 3.99 |
| FTSE Three-Month U.S. Treasury Bill Index | 1.18 | 1.67 | 1.15 |
| CPI | | | |
| Consumer Price Index | 1.31% | 1.92% | 1.75% |
About Your Fund’s Expenses
As a shareholder of the fund, you incur ongoing costs, which include costs for portfolio management, administrative services, and shareholder reports (like this one), among others. Operating expenses, which are deducted from a fund’s gross income, directly reduce the investment return of the fund.
A fund‘s expenses are expressed as a percentage of its average net assets. This figure is known as the expense ratio. The following examples are intended to help you understand the ongoing costs (in dollars) of investing in your fund and to compare these costs with those of other mutual funds. The examples are based on an investment of $1,000 made at the beginning of the period shown and held for the entire period.
The accompanying table illustrates your fund’s costs in two ways:
| • | Based on actual fund return. This section helps you to estimate the actual expenses that you paid over the period. The ”Ending Account Value“ shown is derived from the fund’s actual return, and the third column shows the dollar amount that would have been paid by an investor who started with $1,000 in the fund. You may use the information here, together with the amount you invested, to estimate the expenses that you paid over the period. |
To do so, simply divide your account value by $1,000 (for example, an $8,600 account value divided by $1,000 = 8.6), then multiply the result by the number given for your fund under the heading ”Expenses Paid During Period.“
| • | Based on hypothetical 5% yearly return. This section is intended to help you compare your fund‘s costs with those of other mutual funds. It assumes that the fund had a yearly return of 5% before expenses, but that the expense ratio is unchanged. In this case—because the return used is not the fund’s actual return—the results do not apply to your investment. The example is useful in making comparisons because the Securities and Exchange Commission requires all mutual funds to calculate expenses based on a 5% return. You can assess your fund’s costs by comparing this hypothetical example with the hypothetical examples that appear in shareholder reports of other funds. |
Note that the expenses shown in the table are meant to highlight and help you compare ongoing costs only and do not reflect transaction costs incurred by the fund for buying and selling securities. Further, the expenses do not include any purchase, redemption, or account service fees described in the fund prospectus. If such fees were applied to your account, your costs would be higher. Your fund does not carry a “sales load.”
The calculations assume no shares were bought or sold during the period. Your actual costs may have been higher or lower, depending on the amount of your investment and the timing of any purchases or redemptions.
You can find more information about the fund’s expenses, including annual expense ratios, in the Financial Statements section of this report. For additional information on operating expenses and other shareholder costs, please refer to your fund’s current prospectus.
| Six Months Ended August 31, 2020 | | | |
| ESG International Stock ETF | Beginning
Account Value
2/29/2020 | Ending
Account Value
8/31/2020 | Expenses
Paid During
Period |
| Based on Actual Fund Return | 1,000.00 | 1,085.70 | 0.79 |
| Based on Hypothetical 5% Yearly Return | 1,000.00 | 1,024.38 | 0.76 |
The calculations are based on expenses incurred in the most recent six-month period. The fund's annualized six-month expense ratio for that period is 0.15%. The dollar amounts shown as ”Expenses Paid” are equal to the annualized expense ratio multiplied by the average account value over the period, multiplied by the number of days in the most recent six-month period, then divided by the number of days in the most recent 12-month period (184/366).
ESG International Stock ETF
All of the returns in this report represent past performance, which is not a guarantee of future results that may be achieved by the fund. (Current performance may be lower or higher than the performance data cited. For performance data current to the most recent month-end, visit our website at vanguard.com/performance.) Note, too, that both investment returns and principal value can fluctuate widely, so an investor’s shares, when sold, could be worth more or less than their original cost. The returns shown do not reflect taxes that a shareholder would pay on fund distributions or on the sale of fund shares.
Cumulative Performance: September 18, 2018, Through August 31, 2020
Initial Investment of $10,000
| | | | Average Annual Total Returns
Periods Ended August 31, 2020 |
| | | One
Year | Since
Inception
(9/18/2018) | Final Value
of a $10,000
Investment |
 | ESG International Stock ETF Net Asset Value | 11.23% | 4.32% | $10,861 |
| | ESG International Stock ETF Market Price | 10.96 | 4.39 | 10,875 |
 | FTSE Global All Cap ex US Choice Index | 11.55 | 4.57 | 10,911 |
 | FTSE Global All Cap ex US Index | 8.85 | 2.91 | 10,576 |
“Since Inception” performance is calculated from the ETF Shares’ inception date for both the fund and its comparative standards.
See Financial Highlights for dividend and capital gains information.
ESG International Stock ETF
| Cumulative Returns of ETF Shares: September 18, 2018, Through August 31, 2020 |
| | One
Year | Since
Inception
(9/18/2018) |
| ESG International Stock ETF Market Price | 10.96% | 8.75% |
| ESG International Stock ETF Net Asset Value | 11.23 | 8.61 |
| FTSE Global All Cap ex US Choice Index | 11.55 | 9.11 |
"Since Inception" performance is calculated from the ETF Shares’ inception date for both the fund and its comparative standards.
The market price is determined by the midpoint of the bid-offer spread as of the closing time of the New York Stock Exchange (generally 4 p.m., Eastern time). The net asset value is also determined as of the NYSE closing time. For more information about how the ETF Shares' market prices have compared with their net asset value, visit vanguard.com, select your ETF, and then select the Price and Performance tab. The ETF premium/discount analysis there shows the percentages of days on which the ETF Shares' market price was above or below the NAV.
ESG International Stock ETF
| Basic Materials | 5.9% |
| Consumer Goods | 14.0 |
| Consumer Services | 11.5 |
| Financials | 25.0 |
| Health Care | 11.2 |
| Industrials | 12.2 |
| Oil & Gas | 0.3 |
| Technology | 14.3 |
| Telecommunications | 3.8 |
| Utilities | 1.8 |
The table reflects the fund’s investments, except for short-term investments and derivatives. Sector categories are based on the Industry Classification Benchmark (“ICB”), except for the “Other” category (if applicable), which includes securities that have not been provided an ICB classification as of the effective reporting period.
The fund may invest in derivatives (such as futures and swap contracts) for various reasons, including, but not limited to, attempting to remain fully invested and tracking its target index as closely as possible.
The Industry Classification Benchmark (“ICB”) is owned by FTSE. FTSE does not accept any liability to any person for any loss or damage arising out of any error or omission in the ICB.
ESG International Stock ETF
The fund files its complete schedule of portfolio holdings with the Securities and Exchange Commission (SEC) for the first and third quarters of each fiscal year as an exhibit to its reports on Form N-PORT. The fund’s Form N-PORT reports are available on the SEC’s website at www.sec.gov.
| | | | | | Shares | Market
Value•
($000) |
| Common Stocks (99.5%) |
| Australia (4.6%) |
| | CSL Ltd. | 28,403 | 5,960 |
| | Commonwealth Bank of Australia | 109,810 | 5,519 |
| | Westpac Banking Corp. | 223,621 | 2,856 |
| | National Australia Bank Ltd. | 196,481 | 2,587 |
| | Australia & New Zealand Banking Group Ltd. | 174,467 | 2,351 |
| | Macquarie Group Ltd. | 19,018 | 1,788 |
| | Goodman Group | 124,110 | 1,671 |
| | Transurban Group | 165,732 | 1,639 |
| | Fortescue Metals Group Ltd. | 105,692 | 1,351 |
| | Newcrest Mining Ltd. | 52,433 | 1,235 |
| | Amcor plc | 96,945 | 1,081 |
| | ASX Ltd. | 15,421 | 993 |
| | Brambles Ltd. | 111,280 | 908 |
| | Sonic Healthcare Ltd. | 38,014 | 897 |
| * | Afterpay Ltd. | 13,041 | 880 |
| | QBE Insurance Group Ltd. | 111,291 | 861 |
| | James Hardie Industries plc | 35,572 | 807 |
| | Ramsay Health Care Ltd. | 14,623 | 702 |
| | Cochlear Ltd. | 4,839 | 684 |
| | Telstra Corp. Ltd. | 288,860 | 614 |
| | Suncorp Group Ltd. | 88,560 | 606 |
| | Dexus | 92,194 | 600 |
| | Scentre Group | 357,031 | 594 |
| | SEEK Ltd. | 38,196 | 580 |
| | Insurance Australia Group Ltd. | 162,502 | 569 |
| | Orica Ltd. | 44,064 | 563 |
| | Northern Star Resources Ltd. | 48,795 | 492 |
| | Medibank Pvt Ltd. | 242,557 | 488 |
| | GPT Group | 170,560 | 481 |
| | Computershare Ltd. | 46,800 | 458 |
| | Lendlease Corp. Ltd. | 53,611 | 458 |
| | Sydney Airport | 106,884 | 449 |
| | BlueScope Steel Ltd. | 47,492 | 444 |
| | | | | | Shares | Market
Value•
($000) |
| | Stockland | 148,852 | 434 |
| | Incitec Pivot Ltd. | 269,500 | 418 |
| * | Xero Ltd. | 5,246 | 390 |
| | Vicinity Centres | 342,085 | 365 |
| | Mirvac Group | 222,160 | 345 |
| | Alumina Ltd. | 289,919 | 335 |
| | Magellan Financial Group Ltd. | 7,629 | 333 |
| * | AMP Ltd. | 292,384 | 330 |
| | OZ Minerals Ltd. | 30,511 | 328 |
| | Aurizon Holdings Ltd. | 101,718 | 325 |
| | Bendigo & Adelaide Bank Ltd. | 66,188 | 319 |
| | Boral Ltd. | 106,974 | 316 |
| | Bank of Queensland Ltd. | 64,731 | 292 |
| | Downer EDI Ltd. | 87,370 | 289 |
| * | Saracen Mineral Holdings Ltd. | 73,556 | 283 |
| | Orora Ltd. | 157,022 | 259 |
| | Evolution Mining Ltd. | 61,956 | 253 |
| | Atlas Arteria Ltd. | 50,478 | 242 |
| | JB Hi-Fi Ltd. | 6,057 | 223 |
| * | NEXTDC Ltd. | 24,854 | 223 |
| | Charter Hall Group | 23,452 | 216 |
| | Domino's Pizza Enterprises Ltd. | 3,218 | 191 |
| | Ansell Ltd. | 5,876 | 167 |
| | Challenger Ltd. | 52,587 | 158 |
| | REA Group Ltd. | 1,745 | 147 |
| | Appen Ltd. | 5,680 | 145 |
| | Metcash Ltd. | 65,541 | 141 |
| | ALS Ltd. | 21,740 | 139 |
| | Breville Group Ltd. | 6,626 | 132 |
| | Qube Holdings Ltd. | 64,402 | 130 |
| | nib holdings Ltd. | 38,009 | 129 |
| | Altium Ltd. | 4,653 | 125 |
| * | Zip Co. Ltd. | 17,507 | 118 |
| | Steadfast Group Ltd. | 42,779 | 113 |
| | Iluka Resources Ltd. | 14,670 | 109 |
| | Cleanaway Waste Management Ltd. | 56,397 | 107 |
| | St. Barbara Ltd. | 41,818 | 106 |
ESG International Stock ETF
| | | | | | Shares | Market
Value•
($000) |
| | IDP Education Ltd. | 7,091 | 105 |
| | AusNet Services | 78,429 | 105 |
| * | Mesoblast Ltd. | 26,194 | 102 |
| | Mineral Resources Ltd. | 4,763 | 102 |
| | Reliance Worldwide Corp. Ltd. | 34,103 | 96 |
| | Domain Holdings Australia Ltd. | 34,966 | 96 |
| | WiseTech Global Ltd. | 4,414 | 92 |
| | Qantas Airways Ltd. | 31,471 | 91 |
| * | United Malt Grp Ltd. | 31,690 | 91 |
| * | TPG Telecom Ltd. | 14,611 | 89 |
| | Regis Resources Ltd. | 22,666 | 88 |
| | carsales.com Ltd. | 5,175 | 79 |
| | CIMIC Group Ltd. | 5,063 | 79 |
| * | Megaport Ltd. | 6,095 | 76 |
| | Bapcor Ltd. | 14,467 | 74 |
| | IGO Ltd. | 22,032 | 72 |
| | Flight Centre Travel Group Ltd. | 7,310 | 71 |
| * | Perseus Mining Ltd. | 66,708 | 71 |
| | National Storage REIT | 50,824 | 71 |
| | Shopping Centres Australasia Property Group | 40,478 | 67 |
| | Eagers Automotive Ltd. | 10,159 | 67 |
| * | Vocus Group Ltd. | 26,521 | 65 |
| | Nine Entertainment Co. Holdings Ltd. | 52,381 | 64 |
| 1 | IOOF Holdings Ltd. | 18,178 | 63 |
| | Healius Ltd. | 25,476 | 62 |
| | GDI Property Group | 76,620 | 61 |
| | Ramelius Resources Ltd. | 39,283 | 60 |
| | Cromwell Property Group | 87,056 | 58 |
| | Premier Investments Ltd. | 4,095 | 57 |
| | Link Administration Holdings Ltd. | 19,153 | 57 |
| * | Gold Road Resources Ltd. | 48,819 | 56 |
| | Super Retail Group Ltd. | 6,758 | 53 |
| * | Lynas Corp. Ltd. | 27,555 | 49 |
| | Collins Foods Ltd. | 5,870 | 45 |
| | Pendal Group Ltd. | 10,644 | 45 |
| | CSR Ltd. | 16,151 | 44 |
| | Credit Corp. Group Ltd. | 3,178 | 44 |
| | Corporate Travel Management Ltd. | 3,590 | 42 |
| | InvoCare Ltd. | 5,597 | 41 |
| * | Champion Iron Ltd. | 18,328 | 41 |
| | AUB Group Ltd. | 3,556 | 41 |
| * | Resolute Mining Ltd. | 48,975 | 40 |
| | Perpetual Ltd. | 1,744 | 40 |
| * | nearmap Ltd. | 17,505 | 40 |
| | Perenti Global Ltd. | 44,483 | 39 |
| | Webjet Ltd. | 13,692 | 38 |
| | Elders Ltd. | 5,001 | 37 |
| | | | | | Shares | Market
Value•
($000) |
| | Harvey Norman Holdings Ltd. | 11,121 | 36 |
| | Ingenia Communities Group | 10,518 | 36 |
| | Costa Group Holdings Ltd. | 13,659 | 35 |
| | MyState Ltd. | 11,946 | 35 |
| | Adbri Ltd. | 18,110 | 34 |
| * | GrainCorp Ltd. Class A | 10,221 | 32 |
| * | Nufarm Ltd. | 10,332 | 31 |
| | Omni Bridgeway Ltd. | 9,325 | 31 |
| | NRW Holdings Ltd. | 18,524 | 30 |
| * | PolyNovo Ltd. | 18,603 | 30 |
| * | EML Payments Ltd. | 11,481 | 29 |
| | Data#3 Ltd. | 6,045 | 28 |
| | IRESS Ltd. | 3,425 | 27 |
| * | Nanosonics Ltd. | 6,179 | 27 |
| | Codan Ltd. | 3,471 | 27 |
| | Bega Cheese Ltd. | 6,696 | 26 |
| | oOh!media Ltd. | 33,518 | 26 |
| | Arena REIT | 13,290 | 25 |
| | Netwealth Group Ltd. | 2,459 | 25 |
| * | Westgold Resources Ltd. | 15,645 | 25 |
| | G8 Education Ltd. | 31,289 | 24 |
| | ARB Corp. Ltd. | 1,254 | 24 |
| * | Pilbara Minerals Ltd. | 90,001 | 23 |
| * | Starpharma Holdings Ltd. | 19,552 | 22 |
| | Bingo Industries Ltd. | 13,363 | 22 |
| | GUD Holdings Ltd. | 2,503 | 21 |
| | Sigma Healthcare Ltd. | 41,235 | 21 |
| | Aurelia Metals Ltd. | 53,779 | 21 |
| | Blackmores Ltd. | 424 | 20 |
| | Technology One Ltd. | 3,371 | 20 |
| | Monadelphous Group Ltd. | 2,354 | 20 |
| | Sims Ltd. | 3,306 | 20 |
| | Pro Medicus Ltd. | 946 | 18 |
| | Sandfire Resources Ltd. | 5,249 | 18 |
| * | Mayne Pharma Group Ltd. | 73,358 | 18 |
| * | Orocobre Ltd. | 9,541 | 18 |
| | IPH Ltd. | 3,562 | 18 |
| * | Eclipx Group Ltd. | 16,401 | 18 |
| | Vita Group Ltd. | 18,632 | 16 |
| | HUB24 Ltd. | 1,345 | 16 |
| | Aventus Group | 9,152 | 16 |
| | Abacus Property Group | 7,284 | 15 |
| | Jupiter Mines Ltd. | 74,019 | 15 |
| * | Bubs Australia Ltd. | 22,302 | 15 |
| | SeaLink Travel Group Ltd. | 4,015 | 14 |
| | Asaleo Care Ltd. | 17,354 | 14 |
| | Centuria Capital Group | 9,333 | 14 |
| * | Australian Agricultural Co. Ltd. | 16,440 | 13 |
| | Platinum Asset Management Ltd. | 4,754 | 13 |
| | HT&E Ltd. | 13,045 | 13 |
| * | Avita Therapeutics Inc. | 2,425 | 13 |
| | Bravura Solutions Ltd. | 4,686 | 13 |
ESG International Stock ETF
| | | | | | Shares | Market
Value•
($000) |
| | Macmahon Holdings Ltd. | 69,732 | 13 |
| | Clinuvel Pharmaceuticals Ltd. | 794 | 12 |
| | BWX Ltd. | 3,321 | 12 |
| | Select Harvests Ltd. | 2,684 | 11 |
| 1 | Freedom Foods Group Ltd. | 4,398 | 10 |
| | Mount Gibson Iron Ltd. | 15,479 | 9 |
| | Southern Cross Media Group Ltd. | 72,749 | 9 |
| * | Dacian Gold Ltd. | 28,853 | 7 |
| | Genworth Mortgage Insurance Australia Ltd. | 6,053 | 7 |
| | Accent Group Ltd. | 4,783 | 6 |
| | Western Areas Ltd. | 3,185 | 5 |
| | Service Stream Ltd. | 3,335 | 5 |
| | GWA Group Ltd. | 2,234 | 4 |
| | McMillan Shakespeare Ltd. | 588 | 4 |
| * | Pact Group Holdings Ltd. | 2,475 | 4 |
| | Lovisa Holdings Ltd. | 728 | 4 |
| | FlexiGroup Ltd. (XASX) | 3,882 | 3 |
| * | Myer Holdings Ltd. | 14,953 | 3 |
| | Decmil Group Ltd. | 68,190 | 2 |
| * | Emeco Holdings Ltd. (XASX) | 3,820 | 2 |
| * | Syrah Resources Ltd. | 7,019 | 2 |
| * | Tuas Ltd. | 6,005 | 2 |
| * | FlexiGroup Ltd. | 1,213 | 1 |
| * | Emeco Holdings Ltd. | 1,819 | 1 |
| *,1 | SpeedCast International Ltd. | 2,489 | — |
| | | | | | | 55,206 |
| Austria (0.2%) |
| * | Erste Group Bank AG | 24,869 | 604 |
| | Raiffeisen Bank International AG | 20,416 | 365 |
| * | Verbund AG | 3,733 | 200 |
| * | Wienerberger AG | 5,337 | 144 |
| * | ANDRITZ AG | 3,805 | 127 |
| *,2 | BAWAG Group AG | 3,351 | 126 |
| * | CA Immobilien Anlagen AG | 3,326 | 104 |
| * | IMMOFINANZ AG | 4,293 | 71 |
| * | Oesterreichische Post AG | 888 | 30 |
| * | Lenzing AG | 567 | 29 |
| * | UNIQA Insurance Group AG | 4,150 | 28 |
| * | Telekom Austria AG Class A | 3,162 | 23 |
| * | Vienna Insurance Group AG Wiener Versicherung Gruppe | 905 | 22 |
| | Strabag SE | 534 | 16 |
| * | Zumtobel Group AG | 1,379 | 11 |
| | Porr AG | 657 | 9 |
| | | | | | Shares | Market
Value•
($000) |
| | DO & CO AG | 177 | 8 |
| | Kapsch TrafficCom AG | 473 | 8 |
| | | | | | | 1,925 |
| Belgium (0.6%) |
| | KBC Group NV | 18,362 | 1,049 |
| | UCB SA | 8,361 | 992 |
| * | Argenx SE | 2,884 | 668 |
| * | Ageas SA/NV | 14,043 | 585 |
| | Groupe Bruxelles Lambert SA | 5,493 | 507 |
| | Solvay SA Class A | 5,496 | 473 |
| | Ackermans & van Haaren NV | 3,102 | 440 |
| | KBC Ancora | 9,128 | 332 |
| | Proximus SADP | 12,326 | 243 |
| | Sofina SA | 679 | 203 |
| | Elia Group SA/NV | 1,814 | 195 |
| | Colruyt SA | 2,869 | 181 |
| | Cofinimmo SA | 1,010 | 148 |
| | Aedifica SA | 1,116 | 131 |
| | Euronav NV | 8,722 | 79 |
| | Telenet Group Holding NV | 1,974 | 77 |
| | Montea C.V.A | 558 | 66 |
| | Barco NV | 2,559 | 54 |
| | Ontex Group NV | 3,969 | 53 |
| | Fagron | 2,283 | 52 |
| | Gimv NV | 870 | 49 |
| | D'ieteren SA/NV | 712 | 46 |
| | Melexis NV | 489 | 39 |
| | bpost SA | 3,487 | 35 |
| * | Retail Estates NV | 370 | 26 |
| | Bekaert SA | 956 | 19 |
| * | AGFA-Gevaert NV | 3,906 | 16 |
| * | Kinepolis Group NV | 303 | 12 |
| | Befimmo SA | 223 | 11 |
| * | Tessenderlo Group SA | 292 | 11 |
| | Econocom Group SA/NV | 3,447 | 10 |
| * | Wereldhave Belgium Comm VA | 164 | 9 |
| * | Mithra Pharmaceuticals SA | 173 | 4 |
| * | Ion Beam Applications | 151 | 2 |
| | | | | | | 6,817 |
| Brazil (1.3%) |
| | B3 SA - Brasil Bolsa Balcao | 128,854 | 1,383 |
| | Itau Unibanco Holding SA Preference Shares | 249,978 | 1,075 |
| | Banco Bradesco SA Preference Shares | 263,859 | 999 |
| * | Magazine Luiza SA | 40,559 | 690 |
| | WEG SA | 46,331 | 546 |
| | Itausa SA Preference Shares | 278,900 | 480 |
| * | Natura & Co. Holding SA | 46,835 | 422 |
ESG International Stock ETF
| | | | | | Shares | Market
Value•
($000) |
| | Lojas Renner SA | 49,720 | 394 |
| | Notre Dame Intermedica Participacoes SA | 28,607 | 387 |
| * | Suzano SA | 37,164 | 341 |
| | Itau Unibanco Holding SA | 80,500 | 331 |
| * | Banco do Brasil SA | 53,204 | 317 |
| * | Rumo SA | 76,079 | 314 |
| * | Lojas Americanas SA | 59,835 | 299 |
| * | Localiza Rent a Car SA | 33,521 | 295 |
| | Raia Drogasil SA | 13,644 | 268 |
| * | B2W Cia Digital | 12,913 | 264 |
| * | Equatorial Energia SA | 54,400 | 230 |
| * | Via Varejo SA | 58,627 | 219 |
| | Gerdau SA Preference Shares | 62,200 | 217 |
| | BB Seguridade Participacoes SA | 40,900 | 197 |
| | Banco Bradesco SA | 56,112 | 195 |
| * | Cia de Saneamento Basico do Estado de Sao Paulo | 21,130 | 184 |
| | Telefonica Brasil SA Preference Shares | 19,600 | 171 |
| | CCR SA | 69,358 | 169 |
| | TOTVS SA | 28,841 | 152 |
| | Klabin SA | 32,400 | 152 |
| * | Sul America SA | 19,000 | 150 |
| | BR Malls Participacoes SA | 87,300 | 148 |
| * | Lojas Americanas SA Preference Shares | 24,748 | 146 |
| * | TIM Participacoes SA | 55,300 | 145 |
| * | Hypera SA | 24,700 | 143 |
| * | BRF SA | 37,884 | 135 |
| | Cogna Educacao | 125,930 | 131 |
| | Cia Brasileira de Distribuicao | 10,600 | 123 |
| * | Cia Energetica de Minas Gerais | 59,777 | 115 |
| | Energisa SA | 13,400 | 106 |
| | Cia Siderurgica Nacional SA | 37,334 | 104 |
| * | Bradespar SA Preference Shares | 13,000 | 104 |
| | Banco Santander Brasil SA | 19,332 | 100 |
| | YDUQS Participacoes SA | 17,800 | 88 |
| * | Marfrig Global Foods SA | 24,805 | 81 |
| * | Atacadao SA | 21,900 | 78 |
| | Alpargatas SA Preference Shares | 10,500 | 71 |
| * | Banco Inter SA | 19,441 | 71 |
| | Cyrela Brazil Realty SA Empreendimentos e Participacoes | 16,000 | 70 |
| | Qualicorp Consultoria e Corretora de Seguros SA | 12,100 | 69 |
| | | | | | Shares | Market
Value•
($000) |
| | Transmissora Alianca de Energia Eletrica SA | 13,200 | 68 |
| * | Azul SA Preference Shares | 16,463 | 67 |
| * | IRB Brasil Resseguros SA (BVMF) | 50,942 | 66 |
| | Engie Brasil Energia SA | 8,100 | 63 |
| | Metalurgica Gerdau SA Preference Shares | 37,500 | 60 |
| | EDP - Energias do Brasil SA | 17,600 | 60 |
| * | Cia Energetica de Minas Gerais Preference Shares | 30,609 | 59 |
| | Cia Energetica de Sao Paulo Preference Shares Class B | 10,500 | 58 |
| | Linx SA | 8,700 | 56 |
| * | Multiplan Empreendimentos Imobiliarios SA | 14,300 | 54 |
| * | Light SA | 19,100 | 53 |
| | Alupar Investimento SA | 12,500 | 53 |
| | Porto Seguro SA | 5,200 | 50 |
| | Sao Martinho SA | 11,300 | 50 |
| | MRV Engenharia e Participacoes SA | 15,100 | 50 |
| | Cielo SA | 59,800 | 50 |
| | Telefonica Brasil SA | 5,700 | 50 |
| * | Duratex SA | 16,900 | 49 |
| * | Omega Geracao SA | 6,300 | 47 |
| | Fleury SA | 9,600 | 46 |
| | AES Tiete Energia SA | 16,947 | 46 |
| | Braskem SA Preference Shares Class A | 11,700 | 45 |
| * | CPFL Energia SA | 8,500 | 45 |
| * | Cia Paranaense de Energia Preference Shares Class B | 3,800 | 43 |
| * | M Dias Branco SA | 6,600 | 43 |
| * | BK Brasil Operacao e Assessoria a Restaurantes SA | 20,200 | 41 |
| | Cia de Transmissao de Energia Eletrica Paulista Preference Shares | 10,200 | 40 |
| | Santos Brasil Participacoes SA | 41,200 | 39 |
| | Banco do Estado do Rio Grande do Sul SA Preference Shares Class B | 15,700 | 38 |
| * | Neoenergia SA | 11,200 | 38 |
| * | Cia de Saneamento do Parana | 7,500 | 37 |
| * | Camil Alimentos SA | 16,000 | 37 |
ESG International Stock ETF
| | | | | | Shares | Market
Value•
($000) |
| * | Cia de Saneamento do Parana Preference Shares | 37,400 | 36 |
| | SLC Agricola SA | 7,800 | 36 |
| | Ez Tec Empreendimentos e Participacoes SA | 5,100 | 36 |
| | Banco Pan SA Preference Shares | 23,300 | 36 |
| | Usinas Siderurgicas de Minas Gerais SA Usiminas Preference Shares Class A | 18,900 | 35 |
| | Grendene SA | 25,000 | 35 |
| | LOG Commercial Properties e Participacoes SA | 6,167 | 35 |
| | Odontoprev SA | 14,600 | 34 |
| * | Minerva SA | 13,907 | 33 |
| * | Anima Holding SA | 6,000 | 33 |
| * | Cosan Logistica SA | 8,400 | 33 |
| * | Movida Participacoes SA | 9,900 | 29 |
| | JHSF Participacoes SA | 22,500 | 29 |
| * | Cia Paranaense de Energia | 2,500 | 28 |
| | Cia Hering | 8,400 | 28 |
| | Construtora Tenda SA | 5,000 | 28 |
| | Arezzo Industria e Comercio SA | 2,700 | 28 |
| * | Gol Linhas Aereas Inteligentes SA Preference Shares | 8,181 | 27 |
| | Direcional Engenharia SA | 10,100 | 27 |
| * | Randon SA Implementos e Participacoes Preference Shares | 13,200 | 26 |
| * | Grupo SBF SA | 4,700 | 26 |
| * | Guararapes Confeccoes SA | 7,800 | 25 |
| * | Mahle-Metal Leve SA | 8,100 | 25 |
| * | Cia de Saneamento de Minas Gerais-COPASA | 2,900 | 25 |
| | Wiz Solucoes e Corretagem de Seguros SA | 12,700 | 25 |
| | Iguatemi Empresa de Shopping Centers SA | 4,000 | 24 |
| | Even Construtora e Incorporadora SA | 10,200 | 24 |
| * | EcoRodovias Infraestrutura e Logistica SA | 10,300 | 24 |
| * | IRB Brasil Resseguros SA | 17,065 | 22 |
| * | Tupy SA | 6,700 | 21 |
| | JSL SA | 3,700 | 21 |
| | Instituto Hermes Pardini SA | 4,200 | 20 |
| *,2 | Banco Inter SA Preference Shares | 4,800 | 20 |
| | | | | | Shares | Market
Value•
($000) |
| * | Valid Solucoes e Servicos de Seguranca em Meios de Pagamento e Identificacao SA | 9,400 | 18 |
| | BR Properties SA | 10,881 | 18 |
| | Iochpe Maxion SA | 7,700 | 16 |
| | Marcopolo SA Preference Shares | 26,100 | 13 |
| | Unipar Carbocloro SA Preference Shares | 2,383 | 13 |
| * | Banco Inter SA | 1,000 | 12 |
| 2 | Ser Educacional SA | 4,000 | 10 |
| | Alliar Medicos A Frente SA | 3,300 | 7 |
| * | Smiles Fidelidade SA | 2,000 | 5 |
| * | Banco Inter SA (Subscription Receipts) | 10 | — |
| * | Banco Inter SA | 2 | — |
| | | | | | | 15,516 |
| Canada (6.5%) |
| * | Shopify Inc. Class A (XNYS) | 6,308 | 6,738 |
| | Royal Bank of Canada | 87,706 | 6,679 |
| | Toronto-Dominion Bank | 111,309 | 5,553 |
| | Canadian National Railway Co. | 43,061 | 4,525 |
| | Bank of Nova Scotia | 73,204 | 3,164 |
| | Canadian Pacific Railway Ltd. | 8,972 | 2,654 |
| | Bank of Montreal | 38,124 | 2,420 |
| | Canadian Imperial Bank of Commerce | 26,317 | 2,089 |
| | Franco-Nevada Corp. | 12,110 | 1,821 |
| | Manulife Financial Corp. | 117,531 | 1,734 |
| | Waste Connections Inc. | 16,586 | 1,659 |
| | Alimentation Couche-Tard Inc. Class B | 50,696 | 1,655 |
| | Wheaton Precious Metals Corp. | 28,923 | 1,545 |
| | Sun Life Financial Inc. | 34,118 | 1,424 |
| | Nutrien Ltd. | 36,297 | 1,344 |
| | Agnico Eagle Mines Ltd. | 15,928 | 1,313 |
| | National Bank of Canada | 20,879 | 1,148 |
| * | CGI Inc. | 16,255 | 1,142 |
| | Fortis Inc. | 27,234 | 1,089 |
| | Intact Financial Corp. | 9,190 | 984 |
| | Thomson Reuters Corp. | 12,730 | 973 |
| | Open Text Corp. | 21,110 | 957 |
| | Magna International Inc. | 19,406 | 945 |
| | Restaurant Brands International Inc. (XTSE) | 17,305 | 938 |
| | Kirkland Lake Gold Ltd. | 17,160 | 914 |
| | Rogers Communications Inc. Class B | 21,448 | 892 |
| | Dollarama Inc. | 20,422 | 797 |
| * | Kinross Gold Corp. | 81,799 | 726 |
ESG International Stock ETF
| | | | | | Shares | Market
Value•
($000) |
| | Shaw Communications Inc. Class B | 36,691 | 686 |
| | Ritchie Bros Auctioneers Inc. | 11,289 | 661 |
| | Loblaw Cos. Ltd. | 12,648 | 654 |
| | Algonquin Power & Utilities Corp. | 46,363 | 643 |
| 2 | Hydro One Ltd. | 30,095 | 623 |
| | BCE Inc. | 14,323 | 616 |
| | Metro Inc. Class A | 11,946 | 540 |
| | Canadian Apartment Properties REIT | 15,614 | 539 |
| | George Weston Ltd. | 6,722 | 486 |
| | Emera Inc. | 11,663 | 476 |
| | Toromont Industries Ltd. | 8,419 | 476 |
| | Lundin Mining Corp. | 71,316 | 447 |
| | Granite REIT | 7,513 | 447 |
| | Saputo Inc. | 17,620 | 440 |
| | Empire Co. Ltd. Class A | 16,860 | 439 |
| | CCL Industries Inc. Class B | 11,518 | 426 |
| | RioCan REIT | 36,440 | 425 |
| | B2Gold Corp. | 62,346 | 419 |
| | First Quantum Minerals Ltd. | 40,796 | 404 |
| | Yamana Gold Inc. | 62,278 | 386 |
| | CI Financial Corp. | 24,541 | 348 |
| * | Shopify Inc. Class A (XTSE) | 323 | 344 |
| | Atco Ltd. | 10,740 | 327 |
| | Canadian Utilities Ltd. Class A | 12,968 | 326 |
| | CAE Inc. | 20,478 | 325 |
| | TELUS Corp. | 17,174 | 316 |
| | TMX Group Ltd. | 2,946 | 310 |
| | Gildan Activewear Inc. | 15,328 | 297 |
| | Great-West Lifeco Inc. | 13,398 | 273 |
| | Finning International Inc. | 17,572 | 268 |
| | Alamos Gold Inc. Class A | 25,302 | 265 |
| | Choice Properties REIT | 24,891 | 242 |
| * | Kinaxis Inc. | 1,583 | 241 |
| * | Descartes Systems Group Inc. | 3,569 | 218 |
| * | BlackBerry Ltd. | 40,804 | 213 |
| | H&R REIT | 27,466 | 212 |
| * | Alacer Gold Corp. | 30,281 | 209 |
| | iA Financial Corp. Inc. | 5,785 | 208 |
| | FirstService Corp. | 1,595 | 200 |
| | Chartwell Retirement Residences | 24,865 | 199 |
| * | Novagold Resources Inc. | 18,432 | 196 |
| * | Endeavour Mining Corp. | 6,985 | 194 |
| | AltaGas Ltd. | 14,261 | 184 |
| * | First Majestic Silver Corp. | 14,502 | 180 |
| | | | | | Shares | Market
Value•
($000) |
| | Element Fleet Management Corp. | 21,790 | 179 |
| | Quebecor Inc. Class B | 6,714 | 166 |
| | Centerra Gold Inc. | 12,126 | 158 |
| * | SSR Mining Inc. | 7,098 | 152 |
| | Boyd Group Services Inc. | 920 | 147 |
| | BRP Inc. | 2,560 | 139 |
| | West Fraser Timber Co. Ltd. | 2,529 | 136 |
| * | Canada Goose Holdings Inc. | 5,310 | 130 |
| * | Pretium Resources Inc. | 9,539 | 122 |
| * | IAMGOLD Corp. | 26,774 | 115 |
| | Primo Water Corp. | 8,302 | 114 |
| | Osisko Gold Royalties Ltd. | 9,083 | 111 |
| * | Lightspeed POS Inc. | 2,958 | 103 |
| | Innergex Renewable Energy Inc. | 5,823 | 101 |
| * | Eldorado Gold Corp. | 8,820 | 101 |
| * | Ivanhoe Mines Ltd. Class A | 24,214 | 96 |
| | Colliers International Group Inc. | 1,515 | 96 |
| * | Air Canada Class A | 7,003 | 94 |
| | Capital Power Corp. | 4,259 | 93 |
| | First Capital REIT | 8,545 | 90 |
| * | OceanaGold Corp. | 36,379 | 84 |
| | IGM Financial Inc. | 3,371 | 82 |
| | Canadian Western Bank | 3,518 | 75 |
| | Methanex Corp. | 3,244 | 72 |
| * | Torex Gold Resources Inc. | 4,656 | 72 |
| | Norbord Inc. | 2,072 | 71 |
| | Premium Brands Holdings Corp. | 959 | 71 |
| | SmartCentres REIT | 4,040 | 64 |
| | Cascades Inc. | 5,488 | 58 |
| | Northview Apartment REIT | 2,200 | 58 |
| | Linamar Corp. | 1,805 | 57 |
| | Maple Leaf Foods Inc. | 2,473 | 55 |
| | Stella-Jones Inc. | 1,340 | 47 |
| | NFI Group Inc. | 3,429 | 46 |
| | Genworth MI Canada Inc. | 1,595 | 44 |
| | Hudbay Minerals Inc. | 9,677 | 43 |
| * | Bombardier Inc. Class B | 130,941 | 41 |
| | Cominar REIT | 7,440 | 40 |
| * | Celestica Inc. | 4,318 | 34 |
| * | Home Capital Group Inc. Class B | 2,031 | 34 |
| | Winpak Ltd. | 1,013 | 34 |
| | Mullen Group Ltd. | 3,433 | 26 |
| | Boardwalk REIT | 1,070 | 25 |
| | Cogeco Communications Inc. | 300 | 22 |
| | Martinrea International Inc. | 2,613 | 20 |
ESG International Stock ETF
| | | | | | Shares | Market
Value•
($000) |
| | Cineplex Inc. | 2,692 | 20 |
| | Laurentian Bank of Canada | 800 | 17 |
| | Restaurant Brands International Inc. (XNYS) | 322 | 17 |
| * | Canfor Corp. | 1,300 | 17 |
| | Transcontinental Inc. Class A | 1,400 | 16 |
| | Artis REIT | 2,222 | 15 |
| | Dream Office REIT | 1,021 | 15 |
| | ECN Capital Corp. | 3,629 | 14 |
| | Corus Entertainment Inc. Class B | 4,379 | 11 |
| | | | | | | 78,010 |
| Chile (0.2%) |
| | Enel Americas SA | 1,834,599 | 264 |
| | Banco de Chile | 2,709,247 | 226 |
| | Banco Santander Chile | 3,948,702 | 152 |
| | Falabella SA | 45,894 | 145 |
| | Empresas CMPC SA | 66,821 | 139 |
| | Sociedad Quimica y Minera de Chile SA Preference Shares Class B | 4,049 | 127 |
| | Cencosud SA | 70,890 | 105 |
| | Sociedad Quimica y Minera de Chile SA ADR | 3,183 | 100 |
| | Enel Chile SA | 1,293,387 | 99 |
| | Banco de Credito e Inversiones SA | 3,115 | 98 |
| | Colbun SA | 454,772 | 70 |
| | Empresa Nacional de Telecomunicaciones SA | 10,887 | 66 |
| | Parque Arauco SA | 37,544 | 58 |
| | Besalco SA | 84,046 | 47 |
| | Aguas Andinas SA Class A | 138,009 | 41 |
| | Engie Energia Chile SA | 30,271 | 41 |
| | Itau CorpBanca Chile SA | 13,509,484 | 41 |
| | SONDA SA | 51,002 | 39 |
| * | CAP SA | 4,116 | 36 |
| * | Cia Sud Americana de Vapores SA | 1,292,701 | 35 |
| | Cencosud Shopping SA | 22,751 | 34 |
| | SMU SA | 192,059 | 32 |
| | Salfacorp SA | 53,808 | 30 |
| * | Latam Airlines Group SA | 17,367 | 29 |
| | Ripley Corp. SA | 75,579 | 28 |
| | Forus SA | 18,698 | 24 |
| | Plaza SA | 12,416 | 20 |
| | Inversiones La Construccion SA | 2,854 | 19 |
| | Embotelladora Andina SA Preference Shares Class B | 8,340 | 18 |
| | | | | | Shares | Market
Value•
($000) |
| | Inversiones Aguas Metropolitanas SA | 20,849 | 17 |
| * | Cia Sud Americana de Vapores SA Rights Exp. 09/25/2020 | 510,203 | 2 |
| | | | | | | 2,182 |
| China (12.3%) |
| * | Alibaba Group Holding Ltd. ADR | 111,080 | 31,883 |
| | Tencent Holdings Ltd. | 361,400 | 24,690 |
| * | Meituan Dianping Class B | 225,800 | 7,443 |
| * | JD.com Inc. ADR | 53,361 | 4,196 |
| | China Construction Bank Corp. Class H | 5,756,000 | 4,056 |
| | Ping An Insurance Group Co. of China Ltd. Class H | 357,000 | 3,811 |
| | Industrial & Commercial Bank of China Ltd. Class H | 4,797,000 | 2,674 |
| | China Mobile Ltd. | 326,500 | 2,285 |
| *,2 | Xiaomi Corp. Class B | 725,200 | 2,246 |
| * | Baidu Inc. ADR | 17,963 | 2,238 |
| *,2 | Wuxi Biologics Cayman Inc. | 68,579 | 1,776 |
| * | TAL Education Group ADR | 22,913 | 1,691 |
| * | Pinduoduo Inc. ADR | 17,230 | 1,532 |
| * | Bank of China Ltd. Class H | 4,654,000 | 1,513 |
| * | New Oriental Education & Technology Group Inc. ADR | 9,443 | 1,385 |
| | China Merchants Bank Co. Ltd. Class H | 273,500 | 1,305 |
| | China Life Insurance Co. Ltd. Class H | 431,000 | 1,050 |
| * | NIO Inc. ADR | 55,017 | 1,047 |
| | Shenzhou International Group Holdings Ltd. | 63,200 | 1,018 |
| | China Resources Land Ltd. | 206,000 | 952 |
| | China Overseas Land & Investment Ltd. | 311,500 | 901 |
| | Sino Biopharmaceutical Ltd. | 779,000 | 896 |
| | Geely Automobile Holdings Ltd. | 413,900 | 881 |
| * | CSPC Pharmaceutical Group Ltd. | 384,800 | 850 |
| | Longfor Group Holdings Ltd. | 155,500 | 823 |
| | ZTO Express Cayman Inc. ADR | 23,738 | 796 |
| | Sunac China Holdings Ltd. | 188,300 | 790 |
| | Sunny Optical Technology Group Co. Ltd. | 53,100 | 786 |
| | ENN Energy Holdings Ltd. | 65,000 | 720 |
ESG International Stock ETF
| | | | | | Shares | Market
Value•
($000) |
| | ANTA Sports Products Ltd. | 71,000 | 700 |
| * | Alibaba Health Information Technology Ltd. | 290,000 | 699 |
| | Country Garden Holdings Co. Ltd. | 552,000 | 683 |
| | Li Ning Co. Ltd. | 159,000 | 672 |
| | China Conch Venture Holdings Ltd. | 151,500 | 656 |
| * | Kingdee International Software Group Co. Ltd. | 256,000 | 652 |
| | Shimao Group Holdings Ltd. | 142,500 | 640 |
| | China National Building Material Co. Ltd. Class H | 418,000 | 587 |
| | Hengan International Group Co. Ltd. | 73,000 | 575 |
| | BYD Co. Ltd. Class H | 54,000 | 563 |
| *,2 | Innovent Biologics Inc. | 80,500 | 535 |
| 2 | China Tower Corp. Ltd. Class H | 2,758,000 | 525 |
| | PICC Property & Casualty Co. Ltd. Class H | 658,000 | 507 |
| * | Country Garden Services Holdings Co. Ltd. | 72,000 | 502 |
| | Anhui Conch Cement Co. Ltd. Class H | 68,000 | 492 |
| * | 58.com Inc. ADR | 8,771 | 486 |
| * | Vipshop Holdings Ltd. ADR | 29,173 | 482 |
| | Agricultural Bank of China Ltd. Class H | 1,413,000 | 472 |
| * | China Unicom Hong Kong Ltd. | 658,000 | 467 |
| | China Evergrande Group | 192,000 | 448 |
| * | Yihai International Holding Ltd. | 28,000 | 439 |
| | China Gas Holdings Ltd. | 159,200 | 436 |
| | Agricultural Bank of China Ltd. Class A | 915,000 | 428 |
| * | Bilibili Inc. ADR | 8,796 | 416 |
| * | JOYY Inc. ADR | 4,785 | 409 |
| * | GDS Holdings Ltd. ADR | 5,027 | 407 |
| | China Telecom Corp. Ltd. Class H | 1,188,000 | 388 |
| | Sinopharm Group Co. Ltd. Class H | 156,500 | 384 |
| | Autohome Inc. ADR | 4,738 | 380 |
| | Far East Horizon Ltd. | 387,000 | 342 |
| | China Cinda Asset Management Co. Ltd. Class H | 1,690,000 | 322 |
| | Shandong Weigao Group Medical Polymer Co. Ltd. Class H | 136,000 | 317 |
| *,2 | Ping An Healthcare & Technology Co. Ltd. | 21,400 | 312 |
| | | | | | Shares | Market
Value•
($000) |
| | Industrial & Commercial Bank of China Ltd. Class A | 416,000 | 301 |
| | China Taiping Insurance Holdings Co. Ltd. | 184,200 | 292 |
| | Ping An Insurance Group Co. of China Ltd. Class A | 26,100 | 292 |
| * | iQIYI Inc. ADR | 13,387 | 290 |
| | China Pacific Insurance Group Co. Ltd. Class H | 103,800 | 288 |
| | CITIC Securities Co. Ltd. Class H | 118,500 | 284 |
| | BYD Electronic International Co. Ltd. | 65,500 | 277 |
| * | Zai Lab Ltd. ADR | 3,466 | 275 |
| * | Kingsoft Corp. Ltd. | 49,000 | 262 |
| | China Vanke Co. Ltd. Class H | 82,700 | 257 |
| | China Merchants Bank Co. Ltd. Class A | 46,600 | 256 |
| | China Pacific Insurance Group Co. Ltd. Class A | 55,600 | 250 |
| | Guangdong Investment Ltd. | 154,000 | 240 |
| | Zhuzhou CRRC Times Electric Co. Ltd. Class H | 74,700 | 240 |
| | China Resources Gas Group Ltd. | 50,000 | 235 |
| | People's Insurance Co. Group of China Ltd. Class H | 709,000 | 231 |
| | Luxshare Precision Industry Co. Ltd. Class A | 28,499 | 229 |
| *,3 | GSX Techedu Inc. ADR | 2,656 | 227 |
| | China Minsheng Banking Corp. Ltd. Class A | 270,200 | 219 |
| | Zhongsheng Group Holdings Ltd. | 35,000 | 218 |
| | CITIC Securities Co. Ltd. Class A | 46,700 | 217 |
| | Momo Inc. ADR | 10,600 | 216 |
| | Bank of Communications Co. Ltd. Class A | 298,300 | 206 |
| | China Life Insurance Co. Ltd. Class A | 32,200 | 205 |
| | Shanghai Fosun Pharmaceutical Group Co. Ltd. Class A | 25,400 | 203 |
| | Haier Electronics Group Co. Ltd. | 59,000 | 202 |
| | China CITIC Bank Corp. Ltd. Class A | 249,700 | 190 |
| | China Jinmao Holdings Group Ltd. | 302,000 | 189 |
| | Muyuan Foodstuff Co. Ltd. Class A | 14,380 | 184 |
| | China Vanke Co. Ltd. Class A | 45,100 | 179 |
ESG International Stock ETF
| | | | | | Shares | Market
Value•
($000) |
| | Huatai Securities Co. Ltd. Class A | 56,700 | 177 |
| *,2 | 3SBio Inc. | 146,000 | 171 |
| | Weichai Power Co. Ltd. Class A | 77,500 | 167 |
| 2 | WuXi AppTec Co. Ltd. Class H | 10,880 | 161 |
| 2 | China Resources Pharmaceutical Group Ltd. | 278,000 | 157 |
| | Anhui Conch Cement Co. Ltd. Class A | 17,700 | 157 |
| | Bank of China Ltd. Class A | 318,600 | 152 |
| | Industrial Bank Co. Ltd. Class A | 64,500 | 152 |
| | Brilliance China Automotive Holdings Ltd. | 164,000 | 148 |
| | Shanghai Pudong Development Bank Co. Ltd. Class A | 96,500 | 146 |
| | Ping An Bank Co. Ltd. Class A | 63,300 | 139 |
| | Haitong Securities Co. Ltd. Class A | 60,300 | 133 |
| | China Resources Cement Holdings Ltd. | 90,000 | 131 |
| | CRRC Corp. Ltd. Class A | 153,800 | 131 |
| * | Baozun Inc. ADR | 3,070 | 127 |
| * | Daqo New Energy Corp. ADR | 1,115 | 126 |
| | China Minsheng Banking Corp. Ltd. Class H | 202,000 | 123 |
| *,2 | ZhongAn Online P&C Insurance Co. Ltd. Class H | 18,700 | 123 |
| | WuXi AppTec Co. Ltd. Class A | 7,620 | 122 |
| * | China Biologic Products Holdings Inc. | 1,157 | 122 |
| * | KWG Group Holdings Ltd. | 63,500 | 121 |
| * | China Longyuan Power Group Corp. Ltd. Class H | 185,000 | 117 |
| | Bank of Communications Co. Ltd. Class H | 215,000 | 112 |
| | China Merchants Securities Co. Ltd. Class A | 35,620 | 112 |
| * | JD.com Inc. Class A | 2,686 | 108 |
| | Huangshan Tourism Development Co. Ltd. Class B | 134,500 | 107 |
| * | 21Vianet Group Inc. ADR | 4,597 | 107 |
| * | ZTE Corp. Class A | 18,700 | 107 |
| | China Yangtze Power Co. Ltd. Class A | 37,900 | 107 |
| | | | | | Shares | Market
Value•
($000) |
| | LONGi Green Energy Technology Co. Ltd. Class A | 11,600 | 107 |
| | Weichai Power Co. Ltd. Class H | 53,000 | 106 |
| * | Henan Shuanghui Investment & Development Co. Ltd. Class A | 11,500 | 106 |
| * | Canadian Solar Inc. | 3,242 | 105 |
| | TravelSky Technology Ltd. Class H | 50,000 | 104 |
| * | Alibaba Pictures Group Ltd. | 730,000 | 103 |
| * | Weibo Corp. ADR | 2,774 | 103 |
| * | ZTE Corp. Class H | 35,400 | 103 |
| | Wanhua Chemical Group Co. Ltd. Class A | 9,400 | 100 |
| | Tianneng Power International Ltd. | 46,000 | 99 |
| | China Everbright Bank Co. Ltd. Class A | 176,800 | 99 |
| * | Great Wall Motor Co. Ltd. Class A | 48,900 | 99 |
| 2 | China Merchants Securities Co. Ltd. Class H | 75,660 | 98 |
| | Dongfeng Motor Group Co. Ltd. Class H | 140,000 | 97 |
| | Sinotruk Hong Kong Ltd. | 37,500 | 97 |
| | Huaneng Power International Inc. Class A | 120,700 | 97 |
| * | BOE Technology Group Co. Ltd. Class A | 119,600 | 96 |
| * | Tongcheng-Elong Holdings Ltd. | 46,400 | 91 |
| * | GOME Retail Holdings Ltd. | 626,000 | 90 |
| * | Beijing Enterprises Water Group Ltd. | 226,000 | 89 |
| * | Genscript Biotech Corp. | 46,000 | 89 |
| | China Meidong Auto Holdings Ltd. | 26,000 | 88 |
| * | HUYA Inc. ADR | 3,002 | 86 |
| * | Great Wall Motor Co. Ltd. Class H | 78,500 | 85 |
| | China Hongqiao Group Ltd. | 127,500 | 82 |
| * | Rongan Property Co. Ltd. Class A | 155,400 | 82 |
| * | Inner Mongolia Yili Industrial Group Co. Ltd. Class A | 13,200 | 81 |
| | Contemporary Amperex Technology Co. Ltd. Class A | 2,600 | 80 |
| | China Construction Bank Corp. Class A | 88,600 | 80 |
ESG International Stock ETF
| | | | | | Shares | Market
Value•
($000) |
| | China Everbright International Ltd. | 131,000 | 79 |
| | China Communications Services Corp. Ltd. Class H | 118,000 | 77 |
| * | Fuyao Glass Industry Group Co. Ltd. Class A | 18,300 | 77 |
| | China Railway Tielong Container Logistics Co. Ltd. Class A | 93,200 | 77 |
| | Nine Dragons Paper Holdings Ltd. | 69,000 | 76 |
| | GF Securities Co. Ltd. Class A | 32,300 | 76 |
| | CSC Financial Co. Ltd. Class A | 9,800 | 75 |
| | Shanghai Mechanical & Electrical Industry Co. Ltd. Class B | 57,700 | 74 |
| | Shanghai Pharmaceuticals Holding Co. Ltd. Class A | 22,600 | 73 |
| | Kingboard Holdings Ltd. | 22,500 | 72 |
| | Guangzhou Automobile Group Co. Ltd. Class H | 84,000 | 72 |
| *,2 | Hua Hong Semiconductor Ltd. | 20,000 | 72 |
| * | Chinasoft International Ltd. | 102,000 | 72 |
| | Shenzhen Kangtai Biological Products Co. Ltd. Class A | 2,500 | 72 |
| * | HengTen Networks Group Ltd. | 2,248,000 | 72 |
| *,2 | China Literature Ltd. | 11,400 | 71 |
| | GoerTek Inc. Class A | 11,800 | 71 |
| * | DouYu International Holdings Ltd. ADR | 4,261 | 71 |
| 2 | Dali Foods Group Co. Ltd. | 114,000 | 70 |
| | Shaanxi International Trust Co. Ltd. Class A | 118,700 | 70 |
| 2 | Shandong Gold Mining Co. Ltd. Class H | 24,600 | 69 |
| *,2 | Koolearn Technology Holding Ltd. | 14,500 | 69 |
| | China Everbright Ltd. | 44,000 | 68 |
| | Haitian International Holdings Ltd. | 28,000 | 68 |
| | New Hope Liuhe Co. Ltd. Class A | 12,200 | 68 |
| | BYD Co. Ltd. Class A | 5,400 | 68 |
| 2 | China Huarong Asset Management Co. Ltd. Class H | 588,000 | 67 |
| * | China Aoyuan Group Ltd. | 58,000 | 67 |
| | Guangzhou Automobile Group Co. Ltd. Class A | 44,100 | 67 |
| | China Galaxy Securities Co. Ltd. Class A | 33,800 | 67 |
| | | | | | Shares | Market
Value•
($000) |
| | Bank of Shanghai Co. Ltd. Class A | 53,800 | 66 |
| | SAIC Motor Corp. Ltd. Class A | 24,100 | 66 |
| | China Molybdenum Co. Ltd. Class A | 104,300 | 65 |
| | China Merchants Port Holdings Co. Ltd. | 56,000 | 64 |
| | China Medical System Holdings Ltd. | 57,000 | 64 |
| * | Hangzhou Steam Turbine Co. Ltd. Class B | 59,000 | 64 |
| | Logan Group Co. Ltd. | 34,000 | 63 |
| | Zhaojin Mining Industry Co. Ltd. Class H | 56,500 | 63 |
| | China Overseas Property Holdings Ltd. | 70,000 | 63 |
| | China State Construction International Holdings Ltd. | 80,000 | 62 |
| | Yangzijiang Shipbuilding Holdings Ltd. | 92,600 | 62 |
| | Agile Group Holdings Ltd. | 44,000 | 61 |
| | Zoomlion Heavy Industry Science & Technology Co. Ltd. Class H | 61,400 | 61 |
| | Citic Pacific Special Steel Group Co. Ltd. Class A | 22,400 | 59 |
| | Beijing Capital International Airport Co. Ltd. Class H | 82,000 | 58 |
| * | Shenwan Hongyuan Group Co. Ltd. Class A | 71,000 | 58 |
| | Haitong Securities Co. Ltd. Class H | 62,800 | 57 |
| * | Ausnutria Dairy Corp. Ltd. | 35,000 | 57 |
| | Times China Holdings Ltd. | 37,000 | 57 |
| * | Seazen Group Ltd. | 63,360 | 57 |
| | China Traditional Chinese Medicine Holdings Co. Ltd. | 132,000 | 56 |
| | Digital China Holdings Ltd. | 69,000 | 56 |
| * | Sohu.com Ltd. ADR | 2,756 | 56 |
| 2 | China Yuhua Education Corp. Ltd. | 58,000 | 56 |
| 2 | AK Medical Holdings Ltd. | 22,000 | 56 |
| | China Grand Pharmaceutical & Healthcare Holdings Ltd. | 60,000 | 55 |
| | Huaxia Bank Co. Ltd. Class A | 58,800 | 55 |
| | Shanghai Lujiazui Finance & Trade Zone Development Co. Ltd. Class A | 30,200 | 55 |
| * | Kama Co. Ltd. Class B | 127,000 | 54 |
| | Shenzhen Airport Co. Ltd. Class A | 39,900 | 54 |
ESG International Stock ETF
| | | | | | Shares | Market
Value•
($000) |
| 2 | Yadea Group Holdings Ltd. | 54,000 | 54 |
| | Bank of Chongqing Co. Ltd. Class H | 95,000 | 53 |
| | Southwest Securities Co. Ltd. Class A | 65,200 | 53 |
| | Shanghai AJ Group Co. Ltd. Class A | 41,100 | 53 |
| * | Ever Sunshine Lifestyle Services Group Ltd. | 26,000 | 53 |
| | Ganfeng Lithium Co. Ltd. Class A | 7,000 | 52 |
| | Shanxi Securities Co. Ltd. Class A | 43,300 | 52 |
| | Jinduicheng Molybdenum Co. Ltd. Class A | 57,200 | 52 |
| | Everbright Securities Co. Ltd. Class A | 16,300 | 52 |
| | Shenzhen International Holdings Ltd. | 32,000 | 51 |
| | Chongqing Rural Commercial Bank Co. Ltd. Class H | 125,000 | 51 |
| | NAURA Technology Group Co. Ltd. Class A | 1,904 | 51 |
| | Tongwei Co. Ltd. Class A | 14,200 | 51 |
| * | Noah Holdings Ltd. ADR | 1,795 | 50 |
| | Yuexiu REIT | 103,000 | 50 |
| | Shandong Nanshan Aluminum Co. Ltd. Class A | 128,400 | 50 |
| | Vinda International Holdings Ltd. | 14,000 | 48 |
| | Shanghai International Airport Co. Ltd. Class A | 4,277 | 48 |
| | Jiangsu Expressway Co. Ltd. Class A | 33,900 | 48 |
| 2 | Zhou Hei Ya International Holdings Co. Ltd. | 42,000 | 48 |
| | China South Publishing & Media Group Co. Ltd. Class A | 28,800 | 47 |
| * | Alibaba Group Holding Ltd. | 1,300 | 47 |
| | Guotai Junan Securities Co. Ltd. Class A | 16,700 | 47 |
| | China Yongda Automobiles Services Holdings Ltd. | 38,500 | 46 |
| | Greentown Service Group Co. Ltd. | 34,000 | 46 |
| | Tianjin Capital Environmental Protection Group Co. Ltd. Class A | 42,700 | 46 |
| | Kingboard Laminates Holdings Ltd. | 36,000 | 45 |
| * | China Galaxy Securities Co. Ltd. Class H | 75,000 | 45 |
| | Zhejiang Hailiang Co. Ltd. Class A | 35,700 | 45 |
| | | | | | Shares | Market
Value•
($000) |
| 2 | Luye Pharma Group Ltd. | 83,000 | 45 |
| | Powerlong Real Estate Holdings Ltd. | 61,000 | 44 |
| | Bank of Zhengzhou Co. Ltd. Class A | 78,210 | 44 |
| | Shandong Gold Mining Co. Ltd. Class A | 10,360 | 44 |
| | Dalian Port PDA Co. Ltd. Class A | 149,600 | 44 |
| | China CITIC Bank Corp. Ltd. Class H | 103,000 | 43 |
| | Skyworth Group Ltd. | 124,000 | 43 |
| * | Shang Gong Group Co. Ltd. Class B | 108,322 | 43 |
| | China United Network Communications Ltd. Class A | 57,200 | 43 |
| | Fanhua Inc. ADR | 2,063 | 42 |
| | Sichuan Expressway Co. Ltd. Class H | 184,000 | 42 |
| | Greentown China Holdings Ltd. | 32,000 | 42 |
| | Sinotrans Ltd. Class A | 78,400 | 42 |
| | Sinoma International Engineering Co. Class A | 46,000 | 42 |
| * | Dashang Co. Ltd. Class A | 11,600 | 42 |
| | Beijing North Star Co. Ltd. Class A | 103,700 | 42 |
| 2 | BAIC Motor Corp. Ltd. Class H | 84,500 | 41 |
| | Shanghai Jin Jiang Capital Co. Ltd. Class H | 238,000 | 41 |
| | China Education Group Holdings Ltd. | 21,000 | 41 |
| | Central China Securities Co. Ltd. Class A | 48,600 | 41 |
| | Zhejiang Expressway Co. Ltd. Class H | 60,000 | 40 |
| | Shandong Chenming Paper Holdings Ltd. Class B | 112,800 | 40 |
| | China Dongxiang Group Co. Ltd. | 308,000 | 40 |
| | Changjiang Securities Co. Ltd. Class A | 31,900 | 40 |
| | Western Securities Co. Ltd. Class A | 27,900 | 40 |
| | Bosideng International Holdings Ltd. | 138,000 | 39 |
| | Health & Happiness H&H International Holdings Ltd. | 9,000 | 39 |
| | Fu Shou Yuan International Group Ltd. | 38,000 | 39 |
| | China Water Affairs Group Ltd. | 46,000 | 38 |
ESG International Stock ETF
| | | | | | Shares | Market
Value•
($000) |
| * | Beijing Oriental Yuhong Waterproof Technology Co. Ltd. Class A | 4,400 | 38 |
| | Guangdong Haid Group Co. Ltd. Class A | 3,700 | 38 |
| *,2 | China Logistics Property Holdings Co. Ltd. | 83,000 | 38 |
| | Qinhuangdao Port Co. Ltd. Class A | 95,000 | 38 |
| | Air China Ltd. Class A | 36,300 | 38 |
| * | Xingda International Holdings Ltd. | 149,000 | 37 |
| | O-Net Technologies Group Ltd. | 46,000 | 37 |
| | Suning.com Co. Ltd. Class A | 25,800 | 37 |
| | Livzon Pharmaceutical Group Inc. Class A | 4,700 | 37 |
| | China Southern Airlines Co. Ltd. Class A | 43,500 | 37 |
| * | BEST Inc. ADR | 9,006 | 36 |
| | Anhui Expressway Co. Ltd. Class H | 74,000 | 36 |
| | Hopson Development Holdings Ltd. | 18,000 | 36 |
| * | Tiangong International Co. Ltd. | 106,000 | 36 |
| | Sealand Securities Co. Ltd. Class A | 44,000 | 36 |
| | Shenzhen Expressway Co. Ltd. Class A | 27,700 | 36 |
| *,2 | Hope Education Group Co. Ltd. | 116,000 | 36 |
| | Shanghai Zhenhua Heavy Industries Co. Ltd. Class B | 140,900 | 35 |
| * | Lonking Holdings Ltd. | 121,000 | 35 |
| 2 | Beijing Urban Construction Design & Development Group Co. Ltd. Class H | 117,000 | 35 |
| * | Shanghai Fudan Microelectronics Group Co. Ltd. Class H | 16,000 | 35 |
| | E-House China Enterprise Holdings Ltd. | 29,100 | 34 |
| | Anhui Expressway Co. Ltd. Class A | 43,500 | 34 |
| | China Reinsurance Group Corp. Class H | 315,000 | 34 |
| * | Grandjoy Holdings Group Co. Ltd. Class A | 42,900 | 34 |
| | Zoomlion Heavy Industry Science & Technology Co. Ltd. Class A | 27,000 | 34 |
| | Jiangxi Copper Co. Ltd. Class A | 14,800 | 34 |
| | Cinda Real Estate Co. Ltd. Class A | 47,600 | 34 |
| | | | | | Shares | Market
Value•
($000) |
| | Shoucheng Holdings Ltd. | 123,600 | 34 |
| | China Everbright Bank Co. Ltd. Class H | 91,000 | 33 |
| | China Overseas Grand Oceans Group Ltd. | 51,000 | 33 |
| | China Suntien Green Energy Corp. Ltd. Class H | 122,000 | 33 |
| 2 | CSC Financial Co. Ltd. Class H | 22,500 | 33 |
| | SooChow Securities Co. Ltd. Class A | 20,800 | 33 |
| | Shenzhen Gas Corp. Ltd. Class A | 30,200 | 33 |
| | China Molybdenum Co. Ltd. Class H | 78,000 | 32 |
| | Sany Heavy Equipment International Holdings Co. Ltd. | 57,000 | 32 |
| | TCL Technology Group Corp. Class A | 31,400 | 32 |
| *,2 | Haichang Ocean Park Holdings Ltd. | 407,000 | 32 |
| | Yonghui Superstores Co. Ltd. Class A | 24,400 | 32 |
| * | Lifetech Scientific Corp. | 108,000 | 32 |
| | Orient Securities Co. Ltd. Class A | 18,500 | 32 |
| | CNHTC Jinan Truck Co. Ltd. Class A | 5,800 | 32 |
| | Oshidori International Holdings Ltd. | 291,000 | 32 |
| | China Maple Leaf Educational Systems Ltd. | 80,000 | 31 |
| | China Zhonghua Geotechnical Engineering Group Co. Ltd. Class A | 55,700 | 31 |
| * | Zhejiang Dingli Machinery Co. Ltd. Class A | 2,000 | 31 |
| | Lee & Man Paper Manufacturing Ltd. | 50,000 | 30 |
| * | Shanghai Phoenix Enterprise Group Co. Ltd. Class B | 62,900 | 30 |
| * | China Fangda Group Co. Ltd. Class B | 71,800 | 30 |
| | Guangshen Railway Co. Ltd. Class A | 83,800 | 30 |
| * | Concord New Energy Group Ltd. | 680,000 | 30 |
| 2 | Genertec Universal Medical Group Co. Ltd. | 43,500 | 30 |
| | Greatview Aseptic Packaging Co. Ltd. | 69,000 | 29 |
| | Wuhu Sanqi Interactive Entertainment Network Technology Group Co. Ltd. Class A | 4,400 | 29 |
ESG International Stock ETF
| | | | | | Shares | Market
Value•
($000) |
| * | Shenzhen Overseas Chinese Town Co. Ltd. Class A | 28,200 | 29 |
| | China SCE Group Holdings Ltd. | 56,000 | 29 |
| * | China Eastern Airlines Corp. Ltd. Class A | 39,100 | 29 |
| | China Power International Development Ltd. | 146,000 | 28 |
| * | JinkoSolar Holding Co. Ltd. ADR | 1,221 | 28 |
| | Yuexiu Transport Infrastructure Ltd. | 48,000 | 28 |
| * | COSCO SHIPPING Holdings Co. Ltd. Class H | 56,500 | 28 |
| * | COSCO SHIPPING Holdings Co. Ltd. Class A | 35,500 | 28 |
| | China Resources Medical Holdings Co. Ltd. | 38,500 | 28 |
| * | Beijing Gas Blue Sky Holdings Ltd. | 1,704,000 | 28 |
| * | SOHO China Ltd. | 86,500 | 27 |
| 2 | Huatai Securities Co. Ltd. Class H | 15,400 | 27 |
| | NetDragon Websoft Holdings Ltd. | 10,500 | 27 |
| | Skyfame Realty Holdings Ltd. | 210,000 | 27 |
| | Huayu Automotive Systems Co. Ltd. Class A | 7,500 | 27 |
| * | Guangxi Liugong Machinery Co. Ltd. Class A | 25,800 | 27 |
| 2 | Ganfeng Lithium Co. Ltd. Class H | 5,400 | 27 |
| | Comba Telecom Systems Holdings Ltd. | 60,000 | 26 |
| | Qingling Motors Co. Ltd. Class H | 144,000 | 26 |
| | INESA Intelligent Tech Inc. Class B | 50,600 | 26 |
| | Angang Steel Co. Ltd. Class A | 67,400 | 26 |
| | Zhongyu Gas Holdings Ltd. | 28,000 | 26 |
| | Industrial Securities Co. Ltd. Class A | 21,600 | 26 |
| | Shengyi Technology Co. Ltd. Class A | 7,200 | 26 |
| | SDIC Capital Co. Ltd. Class A | 11,700 | 26 |
| * | Tongdao Liepin Group | 10,200 | 26 |
| | Sinopec Engineering Group Co. Ltd. Class H | 55,500 | 25 |
| | Wisdom Education International Holdings Co. Ltd. | 48,000 | 25 |
| | | | | | Shares | Market
Value•
($000) |
| | Anhui Xinhua Media Co. Ltd. Class A | 28,500 | 25 |
| * | Grand Baoxin Auto Group Ltd. | 162,000 | 25 |
| | Chongqing Changan Automobile Co. Ltd. Class B | 44,400 | 24 |
| * | Shenzhen Expressway Co. Ltd. Class H | 26,000 | 24 |
| | Oceanwide Holdings Co. Ltd. Class A | 40,600 | 24 |
| *,2 | Yixin Group Ltd. | 93,500 | 24 |
| * | Pangang Group Vanadium Titanium & Resources Co. Ltd. Class A | 75,200 | 24 |
| | COSCO SHIPPING Ports Ltd. | 40,000 | 23 |
| | Yuexiu Property Co. Ltd. | 118,000 | 23 |
| * | Tianjin Port Development Holdings Ltd. | 316,000 | 23 |
| * | Fantasia Holdings Group Co. Ltd. | 114,000 | 23 |
| | Yuzhou Group Holdings Co. Ltd. | 50,000 | 23 |
| | Centre Testing International Group Co. Ltd. Class A | 5,800 | 23 |
| | Greenland Hong Kong Holdings Ltd. | 70,000 | 23 |
| * | Shanghai Environment Group Co. Ltd. Class A | 12,500 | 23 |
| | Red Star Macalline Group Corp. Ltd. Class A | 16,280 | 23 |
| | Jiayuan International Group Ltd. | 46,000 | 22 |
| | Shenzhen Investment Ltd. | 66,000 | 22 |
| | China Oriental Group Co. Ltd. | 78,000 | 22 |
| * | COSCO Shipping International Singapore Co. Ltd. | 150,600 | 22 |
| * | Hi Sun Technology China Ltd. | 183,000 | 22 |
| * | GCL-Poly Energy Holdings Ltd. | 547,000 | 22 |
| | Xtep International Holdings Ltd. | 67,500 | 22 |
| | Chaowei Power Holdings Ltd. | 51,000 | 22 |
| | Beijing Shiji Information Technology Co. Ltd. Class A | 4,500 | 22 |
| | China Merchants Shekou Industrial Zone Holdings Co. Ltd. Class A | 9,000 | 22 |
| | CMBC Capital Holdings Ltd. | 1,250,000 | 22 |
| | BBMG Corp. Class A | 45,100 | 22 |
ESG International Stock ETF
| | | | | | Shares | Market
Value•
($000) |
| *,2 | China Railway Signal & Communication Corp. Ltd. Class H | 55,000 | 22 |
| | YTO Express Group Co. Ltd. Class A | 9,300 | 22 |
| | Winning Health Technology Group Co. Ltd. Class A | 7,150 | 22 |
| | Shandong Airlines Co. Ltd. Class B | 27,000 | 21 |
| * | Sogou Inc. ADR | 2,400 | 21 |
| | CPMC Holdings Ltd. | 49,000 | 21 |
| | Hisense Home Appliances Group Co. Ltd. Class A | 10,400 | 21 |
| | Xiamen Tungsten Co. Ltd. Class A | 9,600 | 21 |
| * | Leyou Technologies Holdings Ltd. | 50,000 | 21 |
| | Nanjing Iron & Steel Co. Ltd. Class A | 44,500 | 21 |
| | JNBY Design Ltd. | 20,500 | 21 |
| | China Aluminum International Engineering Corp. Ltd. Class A | 33,900 | 21 |
| | Shanghai Chlor-Alkali Chemical Co. Ltd. Class B | 43,500 | 20 |
| | Ajisen China Holdings Ltd. | 127,000 | 20 |
| | Iflytek Co. Ltd. Class A | 3,700 | 20 |
| | Yunnan Baiyao Group Co. Ltd. Class A | 1,200 | 20 |
| * | Zhejiang Weiming Environment Protection Co. Ltd. Class A | 5,590 | 20 |
| * | First Tractor Co. Ltd. Class H | 48,000 | 19 |
| | Wasion Holdings Ltd. | 64,000 | 19 |
| | China Tian Lun Gas Holdings Ltd. | 24,500 | 19 |
| | China Merchants Land Ltd. | 124,000 | 19 |
| | Shanghai Mechanical & Electrical Industry Co. Ltd. Class A | 7,200 | 19 |
| | Sino-Ocean Group Holding Ltd. | 78,000 | 18 |
| | Jiangxi Copper Co. Ltd. Class H | 15,000 | 18 |
| | Beijing Jingneng Clean Energy Co. Ltd. Class H | 66,000 | 18 |
| * | Siasun Robot & Automation Co. Ltd. Class A | 7,600 | 18 |
| | Rainbow Digital Commercial Co. Ltd. Class A | 11,200 | 18 |
| | Hunan Valin Steel Co. Ltd. Class A | 25,300 | 18 |
| | | | | | Shares | Market
Value•
($000) |
| * | Guangzhou Shiyuan Electronic Technology Co. Ltd. Class A | 1,200 | 18 |
| | Beijing Tiantan Biological Products Corp. Ltd. Class A | 2,880 | 18 |
| | Shanghai Dazhong Public Utilities Group Co. Ltd. Class A | 25,900 | 18 |
| * | Q Technology Group Co. Ltd. | 14,000 | 18 |
| * | BAIC BluePark New Energy Technology Co. Ltd. Class A | 18,800 | 18 |
| | Air China Ltd. Class H | 24,000 | 17 |
| | Shanghai Waigaoqiao Free Trade Zone Group Co. Ltd. Class B | 16,700 | 17 |
| | PAX Global Technology Ltd. | 29,000 | 17 |
| * | Chengdu Xingrong Environment Co. Ltd. Class A | 22,200 | 17 |
| | Apeloa Pharmaceutical Co. Ltd. Class A | 4,000 | 17 |
| | Meinian Onehealth Healthcare Holdings Co. Ltd. Class A | 6,500 | 17 |
| | Shandong Sinocera Functional Material Co. Ltd. Class A | 2,800 | 17 |
| | Xinyu Iron & Steel Co. Ltd. Class A | 27,300 | 17 |
| | Gemdale Corp. Class A | 8,100 | 17 |
| * | Joincare Pharmaceutical Group Industry Co. Ltd. Class A | 5,900 | 17 |
| 2 | Redco Properties Group Ltd. | 34,000 | 17 |
| | Jiangsu Expressway Co. Ltd. Class H | 16,000 | 16 |
| | Zheshang Securities Co. Ltd. Class A | 7,400 | 16 |
| | Chongqing Fuling Zhacai Group Co. Ltd. Class A | 2,100 | 16 |
| | Shanghai Jahwa United Co. Ltd. Class A | 2,700 | 16 |
| * | China National Medicines Corp. Ltd. Class A | 2,500 | 16 |
| | Sichuan Expressway Co. Ltd. Class A | 30,600 | 16 |
| | Laobaixing Pharmacy Chain JSC Class A | 1,260 | 16 |
| | China International Marine Containers Group Co. Ltd. Class A | 12,600 | 16 |
| * | CCOOP Group Co. Ltd. Class A | 32,900 | 16 |
ESG International Stock ETF
| | | | | | Shares | Market
Value•
($000) |
| | Chongqing Dima Industry Co. Ltd. Class A | 35,500 | 16 |
| * | Chongqing Rural Commercial Bank Co. Ltd. Class A | 20,400 | 16 |
| * | Bitauto Holdings Ltd. ADR | 959 | 15 |
| | TCL Electronics Holdings Ltd. | 22,000 | 15 |
| | Tong Ren Tang Technologies Co. Ltd. Class H | 19,000 | 15 |
| | Dawnrays Pharmaceutical Holdings Ltd. | 126,000 | 15 |
| * | Fufeng Group Ltd. | 46,000 | 15 |
| | Shanghai Pharmaceuticals Holding Co. Ltd. Class H | 8,300 | 15 |
| | Lomon Billions Group Co. Ltd. Class A | 4,300 | 15 |
| * | STO Express Co. Ltd. Class A | 6,300 | 15 |
| * | Zhenro Properties Group Ltd. | 26,000 | 15 |
| | Weihai Guangwei Composites Co. Ltd. Class A | 1,300 | 15 |
| | China Merchants Energy Shipping Co. Ltd. Class A | 15,500 | 15 |
| * | So-Young International Inc. ADR | 1,203 | 15 |
| | Bank of Xi'an Co. Ltd. Class A | 17,900 | 15 |
| * | XPeng Inc. ADR | 749 | 15 |
| | Xinhua Winshare Publishing & Media Co. Ltd. Class H | 22,000 | 14 |
| | China South City Holdings Ltd. | 134,000 | 14 |
| * | Yunnan Tin Co. Ltd. Class A | 10,200 | 14 |
| * | Anhui Zhongding Sealing Parts Co. Ltd. Class A | 9,000 | 14 |
| | Tus Environmental Science & Technology Development Co. Ltd. Class A | 10,800 | 14 |
| | Suzhou Gold Mantis Construction Decoration Co. Ltd. Class A | 9,000 | 14 |
| | Zhejiang Dahua Technology Co. Ltd. Class A | 4,100 | 14 |
| | Heilongjiang Agriculture Co. Ltd. Class A | 4,800 | 14 |
| * | Sailun Group Co. Ltd. Class A | 21,800 | 14 |
| | Huaneng Power International Inc. Class H | 32,000 | 13 |
| * | Zhuguang Holdings Group Co. Ltd. | 94,000 | 13 |
| | | | | | Shares | Market
Value•
($000) |
| * | Shanghai Greencourt Investment Group Co. Ltd. Class B | 43,300 | 13 |
| | Dongyue Group Ltd. | 30,000 | 13 |
| * | China Modern Dairy Holdings Ltd. | 88,000 | 13 |
| | West China Cement Ltd. | 72,000 | 13 |
| * | Unisplendour Corp. Ltd. Class A | 2,660 | 13 |
| | Tianqi Lithium Corp. Class A | 4,000 | 13 |
| * | OFILM Group Co. Ltd. Class A | 4,800 | 13 |
| | Jointown Pharmaceutical Group Co. Ltd. Class A | 5,000 | 13 |
| 2 | YiChang HEC ChangJiang Pharmaceutical Co. Ltd. Class H | 8,800 | 13 |
| | Xinhua Winshare Publishing & Media Co. Ltd. Class A | 7,700 | 13 |
| | Tianfeng Securities Co. Ltd. Class A | 12,400 | 13 |
| * | Universal Scientific Industrial Shanghai Co. Ltd. Class A | 3,800 | 13 |
| | Gansu Qilianshan Cement Group Co. Ltd. Class A | 4,300 | 13 |
| | Central China Real Estate Ltd. | 29,000 | 13 |
| * | CITIC Guoan Information Industry Co. Ltd. Class A | 28,700 | 12 |
| * | Visionox Technology Inc. Class A | 5,000 | 12 |
| | Zhejiang Huayou Cobalt Co. Ltd. Class A | 2,100 | 12 |
| | Consun Pharmaceutical Group Ltd. | 28,000 | 12 |
| | Oriental Pearl Group Co. Ltd. Class A | 7,400 | 12 |
| | Fiberhome Telecommunication Technologies Co. Ltd. Class A | 3,100 | 12 |
| * | Beijing Enterprises Clean Energy Group Ltd. | 2,000,000 | 12 |
| | Accelink Technologies Co. Ltd. Class A | 2,600 | 12 |
| | Shenzhen Kaifa Technology Co. Ltd. Class A | 3,300 | 12 |
| * | MLS Co. Ltd. Class A | 5,400 | 12 |
| | Avary Holding Shenzhen Co. Ltd. Class A | 1,700 | 12 |
| | Shanxi Taigang Stainless Steel Co. Ltd. Class A | 22,700 | 12 |
| | Eastern Communications Co. Ltd. Class B | 24,000 | 11 |
ESG International Stock ETF
| | | | | | Shares | Market
Value•
($000) |
| | Tongda Group Holdings Ltd. | 180,000 | 11 |
| * | Qudian Inc. ADR | 7,035 | 11 |
| * | Sinofert Holdings Ltd. | 114,000 | 11 |
| | Inspur Electronic Information Industry Co. Ltd. Class A | 2,100 | 11 |
| *,2 | Qingdao Port International Co. Ltd. Class H | 18,000 | 11 |
| | Chongqing Water Group Co. Ltd. Class A | 14,300 | 11 |
| * | Ronshine China Holdings Ltd. | 14,000 | 11 |
| | Chongqing Changan Automobile Co. Ltd. Class A | 6,600 | 11 |
| * | Guangxi Wuzhou Zhongheng Group Co. Ltd. Class A | 21,800 | 11 |
| * | Sichuan Languang Development Co. Ltd. Class A | 14,000 | 11 |
| | Shandong Minhe Animal Husbandry Co. Ltd. Class A | 3,300 | 11 |
| | Sihuan Pharmaceutical Holdings Group Ltd. | 80,000 | 10 |
| * | Beijing North Star Co. Ltd. Class H | 44,000 | 10 |
| | Sinotrans Ltd. Class H | 41,000 | 10 |
| | Phoenix Media Investment Holdings Ltd. | 194,000 | 10 |
| | WUS Printed Circuit Kunshan Co. Ltd. Class A | 3,400 | 10 |
| * | Yango Group Co. Ltd. Class A | 10,200 | 10 |
| | Bluefocus Intelligent Communications Group Co. Ltd. Class A | 8,800 | 10 |
| | DHC Software Co. Ltd. Class A | 5,800 | 10 |
| | Zhejiang Wolwo Bio-Pharmaceutical Co. Ltd. Class A | 1,200 | 10 |
| | Central China Securities Co. Ltd. Class H | 48,000 | 10 |
| * | Colour Life Services Group Co. Ltd. | 19,000 | 10 |
| | Guangzhou Baiyunshan Pharmaceutical Holdings Co. Ltd. Class A | 2,100 | 10 |
| * | CAR Inc. | 32,000 | 10 |
| | Hengdian Group DMEGC Magnetics Co. Ltd. Class A | 5,700 | 10 |
| | Shanghai Industrial Urban Development Group Ltd. | 80,000 | 9 |
| | | | | | Shares | Market
Value•
($000) |
| | Shanghai Fudan-Zhangjiang Bio-Pharmaceutical Co. Ltd. Class H | 14,000 | 9 |
| | Beijing Capital Land Ltd. Class H | 46,000 | 9 |
| | Shanghai Industrial Development Co. Ltd. Class A | 10,300 | 9 |
| | Focused Photonics Hangzhou Inc. Class A | 4,000 | 9 |
| | Hengtong Optic-electric Co. Ltd. Class A | 3,600 | 9 |
| | Weiqiao Textile Co. Class H | 36,000 | 8 |
| | China Lilang Ltd. | 13,000 | 8 |
| | 361 Degrees International Ltd. | 60,000 | 8 |
| | Xinjiang Goldwind Science & Technology Co. Ltd. Class H | 9,800 | 8 |
| 2 | China Everbright Greentech Ltd. | 19,000 | 8 |
| | Tianjin Development Holdings Ltd. | 34,000 | 7 |
| * | China Eastern Airlines Corp. Ltd. Class H | 18,000 | 7 |
| | China Shineway Pharmaceutical Group Ltd. | 10,000 | 7 |
| | China Zhongwang Holdings Ltd. | 31,200 | 7 |
| | Yunda Holding Co. Ltd. Class A | 2,400 | 7 |
| * | Guorui Properties Ltd. | 47,000 | 7 |
| *,2 | Shanghai Haohai Biological Technology Co. Ltd. Class H | 800 | 6 |
| | China ZhengTong Auto Services Holdings Ltd. | 41,000 | 5 |
| | Shandong Yisheng Livestock & Poultry Breeding Co. Ltd. Class A | 2,200 | 5 |
| *,2 | Tian Ge Interactive Holdings Ltd. | 45,000 | 5 |
| * | Ruhnn Holding Ltd. ADR | 1,799 | 5 |
| * | Kasen International Holdings Ltd. | 30,000 | 4 |
| | Maoye International Holdings Ltd. | 79,000 | 4 |
| | China BlueChemical Ltd. Class H | 18,000 | 3 |
| | Texhong Textile Group Ltd. | 3,500 | 3 |
ESG International Stock ETF
| | | | | | Shares | Market
Value•
($000) |
| *,2 | China Metal Resources Utilization Ltd. | 52,000 | 2 |
| *,1 | Legend Holdings Corp. Rights Exp. 12/31/2020 | 207 | — |
| | | | | | | 148,285 |
| Colombia (0.1%) |
| | Bancolombia SA Preference Shares | 35,690 | 255 |
| | Interconexion Electrica SA ESP | 25,550 | 143 |
| | Grupo Energia Bogota SA ESP | 169,160 | 111 |
| | Grupo Aval Acciones y Valores SA Preference Shares | 253,464 | 63 |
| | Grupo de Inversiones Suramericana SA | 10,779 | 61 |
| | Banco Davivienda SA Preference Shares | 7,478 | 58 |
| | Bancolombia SA | 7,783 | 54 |
| * | Corp. Financiera Colombiana SA | 6,390 | 46 |
| | Grupo de Inversiones Suramericana SA Preference Shares | 7,835 | 38 |
| | | | | | | 829 |
| Czech Republic (0.0%) |
| * | Komercni banka A/S | 14,206 | 342 |
| 2 | Moneta Money Bank A/S | 15,973 | 40 |
| | | | | | | 382 |
| Denmark (1.6%) |
| | Novo Nordisk A/S Class B | 100,307 | 6,632 |
| | Vestas Wind Systems A/S | 13,643 | 2,063 |
| | DSV PANALPINA A/S | 13,059 | 2,039 |
| * | Genmab A/S | 4,157 | 1,569 |
| | Coloplast A/S Class B | 8,977 | 1,523 |
| | Novozymes A/S Class B | 15,615 | 923 |
| | Chr Hansen Holding A/S | 7,241 | 831 |
| | GN Store Nord A/S | 11,268 | 817 |
| | Pandora A/S | 6,892 | 503 |
| | Ambu A/S Class B | 11,717 | 345 |
| * | ISS A/S | 14,893 | 229 |
| | SimCorp A/S | 1,788 | 227 |
| | Tryg A/S | 5,264 | 162 |
| * | Demant A/S | 4,069 | 121 |
| *,2 | Netcompany Group A/S | 1,386 | 120 |
| * | Bavarian Nordic A/S | 2,778 | 98 |
| | Ringkjoebing Landbobank A/S | 1,120 | 84 |
| * | ALK-Abello A/S Class B | 244 | 82 |
| * | Jyske Bank A/S (Registered) | 2,593 | 77 |
| | H Lundbeck A/S | 1,927 | 63 |
| * | Zealand Pharma A/S | 1,498 | 57 |
| | Topdanmark A/S | 1,298 | 56 |
| * | Sydbank A/S | 3,162 | 53 |
| | | | | | Shares | Market
Value•
($000) |
| | ROCKWOOL International A/S Class B | 101 | 38 |
| | Schouw & Co. A/S | 372 | 36 |
| * | NKT A/S | 498 | 16 |
| * | Spar Nord Bank A/S | 1,580 | 13 |
| * | D/S Norden A/S | 511 | 8 |
| | | | | | | 18,785 |
| Egypt (0.0%) |
| | Commercial International Bank Egypt SAE | 77,501 | 330 |
| | Six of October Development & Investment | 72,335 | 56 |
| | Egyptian Financial Group-Hermes Holding Co. | 49,292 | 44 |
| | Medinet Nasr Housing | 177,880 | 37 |
| | Heliopolis Housing | 77,079 | 32 |
| * | Palm Hills Developments SAE | 300,010 | 29 |
| | Orascom Construction plc | 5,783 | 27 |
| * | Oriental Weavers | 46,027 | 16 |
| * | Pioneers Holding for Financial Investments SAE | 49,653 | 13 |
| * | Ezz Steel Co. SAE | 26,700 | 12 |
| | Telecom Egypt Co. | 14,362 | 12 |
| | | | | | | 608 |
| Finland (0.9%) |
| | Kone OYJ Class B | 23,521 | 2,017 |
| | Nokia OYJ | 348,741 | 1,700 |
| * | Nordea Bank Abp | 191,001 | 1,539 |
| * | Sampo OYJ Class A | 30,811 | 1,241 |
| | Elisa OYJ | 12,537 | 738 |
| * | Stora Enso OYJ | 45,530 | 672 |
| | Kesko OYJ Class B | 23,693 | 526 |
| | Nokian Renkaat OYJ | 13,384 | 373 |
| | Wartsila OYJ Abp | 37,009 | 317 |
| | Orion OYJ Class B | 5,991 | 281 |
| | Kojamo OYJ | 9,492 | 230 |
| * | Huhtamaki OYJ | 4,445 | 215 |
| * | Valmet OYJ | 7,367 | 202 |
| * | TietoEVRY OYJ | 3,505 | 106 |
| | Cargotec OYJ Class B | 1,530 | 48 |
| | Kemira OYJ | 2,307 | 32 |
| ���* | Metsa Board OYJ | 3,789 | 31 |
| * | F-Secure OYJ | 6,729 | 24 |
| | YIT OYJ | 3,951 | 24 |
| | Uponor OYJ | 1,222 | 22 |
| | Sanoma OYJ | 1,656 | 22 |
| | Raisio OYJ | 4,240 | 16 |
| | Ahlstrom-Munksjo OYJ | 869 | 15 |
| * | Finnair OYJ | 21,568 | 11 |
| | Oriola OYJ Class B | 4,424 | 10 |
| | | | | | | 10,412 |
ESG International Stock ETF
| | | | | | Shares | Market
Value•
($000) |
| France (4.5%) |
| | Sanofi | 67,710 | 6,858 |
| * | L'Oreal SA | 10,122 | 3,359 |
| * | BNP Paribas SA | 67,027 | 2,920 |
| | Kering SA | 4,485 | 2,752 |
| * | Danone SA | 36,933 | 2,429 |
| * | EssilorLuxottica SA | 17,962 | 2,404 |
| * | AXA SA | 116,096 | 2,369 |
| | Legrand SA | 18,972 | 1,584 |
| | Hermes International | 1,825 | 1,568 |
| * | L'Oreal SA (Registered) | 4,639 | 1,539 |
| | Vivendi SA | 53,365 | 1,519 |
| | STMicroelectronics NV | 44,116 | 1,334 |
| * | Cie Generale des Etablissements Michelin SCA | 11,557 | 1,309 |
| * | Teleperformance | 4,052 | 1,249 |
| | Orange SA | 108,713 | 1,214 |
| | Edenred | 18,443 | 952 |
| | Veolia Environnement SA | 36,527 | 881 |
| *,2 | Worldline SA | 8,682 | 799 |
| * | Societe Generale SA | 46,298 | 749 |
| * | Credit Agricole SA | 71,447 | 732 |
| | Eurofins Scientific SE | 902 | 726 |
| | Ingenico Group SA | 4,159 | 710 |
| | Carrefour SA | 43,788 | 704 |
| | Arkema SA | 6,044 | 669 |
| * | Getlink SE | 42,601 | 652 |
| 2 | Euronext NV | 5,220 | 636 |
| | Suez SA | 36,418 | 629 |
| * | Peugeot SA | 36,357 | 627 |
| | Alstom SA | 10,920 | 610 |
| | Gecina SA | 4,352 | 598 |
| * | Valeo SA | 17,244 | 530 |
| | Publicis Groupe SA | 14,111 | 493 |
| * | Sartorius Stedim Biotech | 1,352 | 483 |
| | Orpea | 3,883 | 466 |
| * | Ubisoft Entertainment SA | 5,347 | 440 |
| | Sodexo SA | 6,099 | 435 |
| * | Wendel SE | 4,062 | 417 |
| | BioMerieux | 2,420 | 366 |
| | Rexel SA | 25,643 | 343 |
| * | SCOR SE | 12,578 | 337 |
| * | Eurazeo SE | 5,772 | 305 |
| | Renault SA | 10,451 | 298 |
| | Covivio | 3,801 | 281 |
| * | Ipsen SA | 2,648 | 273 |
| | SEB SA | 1,379 | 242 |
| *,2 | Amundi SA | 3,111 | 242 |
| | Aeroports de Paris | 2,249 | 235 |
| | Klepierre SA | 13,621 | 224 |
| | SES SA Class A FDR | 28,309 | 201 |
| * | Lagardere SCA | 9,250 | 183 |
| | Iliad SA | 791 | 169 |
| * | Elis SA | 11,838 | 153 |
| | | | | | Shares | Market
Value•
($000) |
| * | SEB SA (Registered) | 842 | 148 |
| * | Faurecia SE | 3,157 | 138 |
| * | Natixis SA | 47,070 | 130 |
| * | Sodexo SA | 1,731 | 124 |
| * | SOITEC | 833 | 111 |
| * | CNP Assurances | 7,952 | 107 |
| | Sopra Steria Group | 571 | 93 |
| | Eutelsat Communications SA | 8,559 | 86 |
| | Korian SA | 2,206 | 85 |
| | ICADE | 1,205 | 78 |
| * | Casino Guichard Perrachon SA | 2,164 | 56 |
| | Nexity SA | 1,451 | 50 |
| | Trigano SA | 369 | 47 |
| | Societe BIC SA | 755 | 44 |
| | IPSOS | 1,643 | 43 |
| * | Virbac SA | 183 | 41 |
| | Albioma SA | 770 | 41 |
| | Cie Plastic Omnium SA | 1,741 | 39 |
| 2 | Maisons du Monde SA | 2,012 | 33 |
| | Imerys SA | 768 | 31 |
| *,2 | Neoen SA | 566 | 31 |
| * | Air France-KLM | 6,207 | 28 |
| * | JCDecaux SA | 1,477 | 28 |
| * | Carmila SA | 2,200 | 25 |
| * | Coface SA | 3,001 | 23 |
| * | Interparfums SA | 419 | 21 |
| 2 | ALD SA | 1,798 | 18 |
| * | Metropole Television SA | 1,352 | 17 |
| | Akka Technologies | 864 | 17 |
| | Robertet SA | 14 | 16 |
| *,2 | Verallia SA | 477 | 16 |
| | Vicat SA | 393 | 14 |
| * | Fnac Darty SA | 311 | 14 |
| 2 | Elior Group SA | 1,988 | 12 |
| | Mercialys SA | 1,640 | 10 |
| * | Albioma SA | 187 | 10 |
| | Tarkett SA | 706 | 9 |
| * | DBV Technologies SA | 1,791 | 8 |
| * | Television Francaise 1 | 1,071 | 7 |
| * | Rothschild & Co. | 174 | 5 |
| | Quadient SA | 340 | 5 |
| * | Rallye SA | 850 | 4 |
| * | LISI | 162 | 4 |
| | Beneteau SA | 430 | 4 |
| * | Eramet SA | 97 | 3 |
| *,2 | SMCP SA | 262 | 1 |
| *,2 | Europcar Mobility Group | 786 | 1 |
| | | | | | | 54,073 |
| Germany (6.0%) |
| | SAP SE | 70,227 | 11,612 |
| | Allianz SE (Registered) | 25,532 | 5,540 |
| | Bayer AG (Registered) | 61,124 | 4,065 |
| * | adidas AG | 11,905 | 3,623 |
ESG International Stock ETF
| | | | | | Shares | Market
Value•
($000) |
| * | Deutsche Post AG (Registered) | 65,631 | 2,992 |
| * | Daimler AG (Registered) | 50,035 | 2,565 |
| | Muenchener Rueckversicherungs-Gesellschaft AG in Muenchen (Registered) | 8,392 | 2,424 |
| * | Vonovia SE | 33,171 | 2,374 |
| | Infineon Technologies AG | 80,076 | 2,227 |
| | Deutsche Boerse AG | 11,142 | 2,108 |
| * | Symrise AG Class A | 9,669 | 1,337 |
| | Merck KGaA | 9,811 | 1,333 |
| * | Henkel AG & Co. KGaA | 14,183 | 1,276 |
| * | Fresenius Medical Care AG & Co. KGaA | 14,543 | 1,236 |
| * | Deutsche Bank AG (Registered) | 128,135 | 1,229 |
| * | Fresenius SE & Co. KGaA | 26,388 | 1,224 |
| | Bayerische Motoren Werke AG Preference Shares | 19,853 | 1,119 |
| *,2 | Zalando SE | 12,305 | 1,078 |
| * | Sartorius AG Preference Shares | 2,524 | 1,071 |
| | Deutsche Wohnen SE | 19,942 | 1,064 |
| *,2 | Delivery Hero SE | 8,634 | 929 |
| 2 | Scout24 AG | 9,742 | 906 |
| | Beiersdorf AG | 7,717 | 892 |
| | Brenntag AG | 14,066 | 881 |
| * | LEG Immobilien AG | 5,847 | 859 |
| * | HeidelbergCement AG | 13,103 | 831 |
| * | Continental AG | 7,162 | 786 |
| * | QIAGEN NV | 15,238 | 774 |
| | Hannover Rueck SE | 4,052 | 691 |
| *,2 | Covestro AG | 13,084 | 624 |
| * | KION Group AG | 7,315 | 619 |
| * | Puma SE | 7,027 | 582 |
| | GEA Group AG | 15,868 | 579 |
| * | LANXESS AG | 9,536 | 558 |
| * | Commerzbank AG | 83,546 | 485 |
| * | HelloFresh SE | 8,969 | 462 |
| | Knorr-Bremse AG | 3,304 | 420 |
| | FUCHS PETROLUB SE | 11,384 | 412 |
| * | MorphoSys AG | 3,053 | 386 |
| | Bayerische Motoren Werke AG | 5,288 | 381 |
| | Aroundtown SA | 68,796 | 377 |
| 2 | Siemens Healthineers AG | 6,549 | 298 |
| | Bechtle AG | 1,399 | 283 |
| * | Henkel AG & Co. KGaA Preference Shares | 2,750 | 281 |
| | ProSiebenSat.1 Media SE | 21,718 | 247 |
| | United Internet AG (Registered) | 4,954 | 244 |
| * | Nemetschek SE | 2,805 | 223 |
| *,3 | Varta AG | 1,357 | 212 |
| | | | | | Shares | Market
Value•
($000) |
| | Evonik Industries AG | 6,980 | 203 |
| *,3 | Deutsche Lufthansa AG (Registered) | 18,626 | 195 |
| | HUGO BOSS AG | 6,956 | 185 |
| * | TAG Immobilien AG | 5,599 | 168 |
| * | Dialog Semiconductor plc | 3,875 | 168 |
| * | Carl Zeiss Meditec AG | 1,451 | 164 |
| * | Evotec SE | 6,077 | 163 |
| * | K+S AG (Registered) | 23,216 | 162 |
| * | CTS Eventim AG & Co. KGaA | 3,009 | 150 |
| | Gerresheimer AG | 1,208 | 143 |
| | Freenet AG | 6,499 | 140 |
| * | OSRAM Licht AG | 2,524 | 132 |
| * | alstria office REIT-AG | 8,080 | 121 |
| * | Siltronic AG | 1,206 | 112 |
| | CANCOM SE | 1,946 | 107 |
| * | Hypoport SE | 170 | 103 |
| * | Software AG | 2,017 | 101 |
| | Aurubis AG | 1,399 | 101 |
| | Grand City Properties SA | 3,826 | 98 |
| 2 | ADO Properties SA | 3,078 | 95 |
| | CompuGroup Medical SE & Co. KGaA | 1,023 | 92 |
| * | Rational AG | 137 | 88 |
| | Stroeer SE & Co. KGaA | 1,124 | 88 |
| *,3 | GRENKE AG | 1,175 | 86 |
| | METRO AG | 8,318 | 82 |
| | Encavis AG | 4,314 | 79 |
| * | Fraport AG Frankfurt Airport Services Worldwide | 1,716 | 78 |
| | Hella GmbH & Co. KGaA | 1,507 | 74 |
| * | S&T AG | 2,569 | 72 |
| | 1&1 Drillisch AG | 2,461 | 70 |
| | Telefonica Deutschland Holding AG | 24,368 | 67 |
| * | zooplus AG | 349 | 66 |
| | Duerr AG | 1,970 | 65 |
| * | AIXTRON SE | 5,420 | 63 |
| * | Jungheinrich AG Preference Shares | 1,938 | 62 |
| * | Aareal Bank AG | ���2,751 | 62 |
| * | Wacker Chemie AG | 587 | 57 |
| 2 | DWS Group GmbH & Co. KGaA | 1,444 | 57 |
| | Fielmann AG | 747 | 54 |
| | Suedzucker AG | 2,594 | 53 |
| | Pfeiffer Vacuum Technology AG | 249 | 49 |
| * | Norma Group SE | 1,475 | 48 |
| | Stabilus SA | 907 | 48 |
| 2 | Befesa SA | 1,070 | 45 |
| * | CECONOMY AG | 9,012 | 41 |
| | Talanx AG | 1,046 | 39 |
ESG International Stock ETF
| | | | | | Shares | Market
Value•
($000) |
| 2 | Deutsche Pfandbriefbank AG | 5,268 | 38 |
| | CropEnergies AG | 2,396 | 35 |
| * | Nordex SE | 2,538 | 33 |
| * | PATRIZIA AG | 1,016 | 30 |
| * | Traton SE | 1,482 | 30 |
| * | RTL Group SA | 776 | 26 |
| | Deutsche EuroShop AG | 1,677 | 25 |
| * | BayWa AG | 684 | 24 |
| *,2 | Rocket Internet SE | 1,067 | 24 |
| | Krones AG | 316 | 21 |
| * | Draegerwerk AG & Co. KGaA Preference Shares | 235 | 20 |
| * | DIC Asset AG | 1,490 | 20 |
| | New Work SE | 68 | 20 |
| * | Salzgitter AG | 1,047 | 17 |
| * | TLG Immobilien AG | 776 | 16 |
| * | Deutz AG | 2,915 | 16 |
| | Schaeffler AG Preference Shares | 2,248 | 15 |
| | KWS Saat SE & Co. KGaA | 157 | 14 |
| * | Leoni AG | 1,986 | 14 |
| * | Wacker Neuson SE | 574 | 11 |
| | Hornbach Holding AG & Co. KGaA | 99 | 11 |
| | FUCHS PETROLUB SE Preference Shares | 203 | 10 |
| * | Koenig & Bauer AG | 378 | 8 |
| * | Draegerwerk AG & Co. KGaA | 110 | 8 |
| * | Washtec AG | 87 | 4 |
| * | Takkt AG | 303 | 4 |
| * | Kloeckner & Co. SE | 727 | 4 |
| * | Heidelberger Druckmaschinen AG | 2,926 | 2 |
| * | Corestate Capital Holding SA | 123 | 2 |
| | | | | | | 71,717 |
| Greece (0.1%) |
| | Hellenic Telecommunications Organization SA | 12,218 | 199 |
| * | Eurobank Ergasias Services & Holdings SA | 347,155 | 168 |
| | JUMBO SA | 6,366 | 111 |
| * | Alpha Bank AE | 162,829 | 109 |
| * | Fourlis Holdings SA | 11,757 | 56 |
| * | National Bank of Greece SA | 27,566 | 38 |
| | Holding Co. ADMIE IPTO SA | 11,577 | 31 |
| * | Piraeus Bank SA | 10,710 | 16 |
| | Sarantis SA | 1,078 | 11 |
| * | GEK Terna Holding Real Estate Construction SA | 1,145 | 8 |
| * | Ellaktor SA | 4,982 | 7 |
| | | | | | Shares | Market
Value•
($000) |
| * | LAMDA Development SA | 930 | 6 |
| | Aegean Airlines SA | 945 | 4 |
| | | | | | | 764 |
| Hong Kong (2.4%) |
| | AIA Group Ltd. | 750,400 | 7,688 |
| | Hong Kong Exchanges & Clearing Ltd. | 78,200 | 3,943 |
| | Sun Hung Kai Properties Ltd. | 91,500 | 1,228 |
| | Techtronic Industries Co. Ltd. | 93,500 | 1,184 |
| | CK Asset Holdings Ltd. | 198,500 | 1,077 |
| * | China Mengniu Dairy Co. Ltd. | 201,000 | 987 |
| | Link REIT | 120,400 | 958 |
| | Hang Seng Bank Ltd. | 56,800 | 893 |
| | BOC Hong Kong Holdings Ltd. | 269,500 | 764 |
| | New World Development Co. Ltd. | 137,750 | 714 |
| | Hang Lung Properties Ltd. | 236,000 | 665 |
| * | Semiconductor Manufacturing International Corp. | 194,000 | 613 |
| 2 | WH Group Ltd. | 656,500 | 566 |
| | Lenovo Group Ltd. | 762,000 | 508 |
| | PCCW Ltd. | 702,000 | 440 |
| | Sino Land Co. Ltd. | 368,000 | 428 |
| | Power Assets Holdings Ltd. | 71,000 | 406 |
| | ASM Pacific Technology Ltd. | 35,700 | 384 |
| | Wharf Real Estate Investment Co. Ltd. | 91,000 | 378 |
| | AAC Technologies Holdings Inc. | 58,000 | 365 |
| | Hysan Development Co. Ltd. | 114,000 | 360 |
| | Swire Properties Ltd. | 107,400 | 291 |
| | Bank of East Asia Ltd. | 128,000 | 288 |
| | Xinyi Solar Holdings Ltd. | 220,000 | 277 |
| | MTR Corp. Ltd. | 48,000 | 250 |
| | Wharf Holdings Ltd. | 119,000 | 232 |
| | Hongkong Land Holdings Ltd. | 53,000 | 203 |
| | Tingyi Cayman Islands Holding Corp. | 106,000 | 199 |
| | Sun Art Retail Group Ltd. | 126,000 | 164 |
| | Vitasoy International Holdings Ltd. | 46,000 | 164 |
| | NWS Holdings Ltd. | 187,000 | 159 |
| 2 | Samsonite International SA | 112,800 | 130 |
| | Minth Group Ltd. | 38,000 | 128 |
| | Microport Scientific Corp. | 28,000 | 127 |
| | Henderson Land Development Co. Ltd. | 28,400 | 112 |
ESG International Stock ETF
| | | | | | Shares | Market
Value•
($000) |
| | CK Infrastructure Holdings Ltd. | 21,000 | 111 |
| * | PRADA SpA | 25,700 | 101 |
| | Swire Pacific Ltd. Class B | 105,000 | 95 |
| | Man Wah Holdings Ltd. | 64,800 | 90 |
| | SITC International Holdings Co. Ltd. | 54,000 | 71 |
| | Yue Yuen Industrial Holdings Ltd. | 32,000 | 55 |
| * | Hong Kong Television Network Ltd. | 40,000 | 54 |
| | Swire Pacific Ltd. Class A | 9,500 | 52 |
| | IGG Inc. | 43,000 | 50 |
| | Hang Lung Group Ltd. | 19,000 | 49 |
| 2 | BOC Aviation Ltd. | 6,300 | 47 |
| | Uni-President China Holdings Ltd. | 48,000 | 44 |
| *,2 | Razer Inc. | 213,000 | 42 |
| | Dairy Farm International Holdings Ltd. | 9,900 | 41 |
| | HKBN Ltd. | 21,500 | 40 |
| | Gemdale Properties & Investment Corp. Ltd. | 220,000 | 39 |
| * | COFCO Meat Holdings Ltd. | 82,000 | 38 |
| | China Travel International Investment Hong Kong Ltd. | 228,000 | 34 |
| | Chow Tai Fook Jewellery Group Ltd. | 30,600 | 34 |
| | Johnson Electric Holdings Ltd. | 16,000 | 32 |
| | Cafe de Coral Holdings Ltd. | 14,000 | 32 |
| | VTech Holdings Ltd. | 5,300 | 31 |
| | Fortune REIT | 36,000 | 31 |
| | Pou Sheng International Holdings Ltd. | 120,000 | 30 |
| | L'Occitane International SA | 17,750 | 30 |
| *,2 | Xiabuxiabu Catering Management China Holdings Co. Ltd. | 23,500 | 29 |
| * | MMG Ltd. | 104,000 | 28 |
| * | Ju Teng International Holdings Ltd. | 92,000 | 28 |
| | Kerry Properties Ltd. | 10,500 | 27 |
| | BOE Varitronix Ltd. | 89,000 | 27 |
| | Champion REIT | 50,000 | 26 |
| | Cathay Pacific Airways Ltd. | 26,181 | 21 |
| | First Pacific Co. Ltd. | 72,000 | 20 |
| | Nexteer Automotive Group Ltd. | 30,000 | 20 |
| * | Towngas China Co. Ltd. | 45,000 | 20 |
| | Prosperity REIT | 65,000 | 20 |
| | | | | | Shares | Market
Value•
($000) |
| | China Harmony Auto Holding Ltd. | 44,000 | 20 |
| | United Laboratories International Holdings Ltd. | 16,000 | 19 |
| * | China Silver Group Ltd. | 154,000 | 19 |
| | Kerry Logistics Network Ltd. | 11,500 | 19 |
| | CGN New Energy Holdings Co. Ltd. | 102,000 | 18 |
| 2 | FIT Hon Teng Ltd. | 45,000 | 18 |
| | Xinyi Energy Holdings Ltd. | 52,000 | 18 |
| | Value Partners Group Ltd. | 32,000 | 15 |
| * | Asia Cement China Holdings Corp. | 15,000 | 15 |
| 2 | IMAX China Holding Inc. | 9,500 | 15 |
| | Henderson Investment Ltd. | 259,000 | 14 |
| | Haitong International Securities Group Ltd. | 50,000 | 13 |
| | Lee's Pharmaceutical Holdings Ltd. | 16,500 | 13 |
| | K Wah International Holdings Ltd. | 26,000 | 12 |
| * | Truly International Holdings Ltd. | 80,000 | 10 |
| * | Goodbaby International Holdings Ltd. | 70,000 | 10 |
| * | FIH Mobile Ltd. | 91,000 | 10 |
| * | KuangChi Science Ltd. | 120,000 | 10 |
| | Canvest Environmental Protection Group Co. Ltd. | 22,000 | 10 |
| | Pacific Basin Shipping Ltd. | 61,000 | 9 |
| * | New World Department Store China Ltd. | 52,000 | 9 |
| * | China LNG Group Ltd. | 276,000 | 9 |
| | Inspur International Ltd. | 34,000 | 9 |
| | Giordano International Ltd. | 48,000 | 8 |
| | Beijing Tong Ren Tang Chinese Medicine Co. Ltd. | 7,000 | 8 |
| | Luk Fook Holdings International Ltd. | 3,000 | 7 |
| | EVA Precision Industrial Holdings Ltd. | 112,000 | 7 |
| * | Esprit Holdings Ltd. | 52,700 | 6 |
| * | Lifestyle China Group Ltd. | 29,500 | 5 |
| * | GCL New Energy Holdings Ltd. | 284,000 | 5 |
| * | Parkson Retail Group Ltd. | 118,500 | 4 |
| | CITIC Telecom International Holdings Ltd. | 12,000 | 4 |
| | Guotai Junan International Holdings Ltd. | 25,000 | 4 |
| * | HC Group Inc. | 25,000 | 4 |
ESG International Stock ETF
| | | | | | Shares | Market
Value•
($000) |
| | Lifestyle International Holdings Ltd. | 3,000 | 3 |
| | Sa Sa International Holdings Ltd. | 14,000 | 2 |
| * | NewOcean Energy Holdings Ltd. | 22,000 | 2 |
| *,1 | Camsing International Holding Ltd. | 6,000 | 1 |
| | NOVA Group Holdings Ltd. Class A | 60,000 | 1 |
| | | | | | | 29,197 |
| Hungary (0.1%) |
| * | OTP Bank Nyrt. | 17,838 | 601 |
| | Richter Gedeon Nyrt. | 19,063 | 464 |
| | | | | | | 1,065 |
| India (2.2%) |
| | Infosys Ltd. | 225,996 | 2,847 |
| | Housing Development Finance Corp. Ltd. | 109,442 | 2,730 |
| | Hindustan Unilever Ltd. | 55,746 | 1,604 |
| * | Bharti Airtel Ltd. | 143,527 | 1,000 |
| | Axis Bank Ltd. | 143,342 | 968 |
| | Maruti Suzuki India Ltd. | 7,314 | 678 |
| | HCL Technologies Ltd. | 65,956 | 622 |
| | Bajaj Finance Ltd. | 11,055 | 525 |
| | Sun Pharmaceutical Industries Ltd. | 66,079 | 467 |
| | Asian Paints Ltd. | 17,201 | 444 |
| | UltraTech Cement Ltd. | 6,364 | 337 |
| | Nestle India Ltd. | 1,453 | 315 |
| *,2 | HDFC Life Insurance Co. Ltd. | 40,393 | 315 |
| * | State Bank of India | 103,954 | 300 |
| | Hero MotoCorp Ltd. | 7,286 | 299 |
| | Wipro Ltd. | 79,104 | 292 |
| | Dr Reddy's Laboratories Ltd. | 4,796 | 278 |
| *,2 | Avenue Supermarts Ltd. | 8,892 | 272 |
| | Power Grid Corp. of India Ltd. | 109,494 | 266 |
| | Titan Co. Ltd. | 17,537 | 262 |
| 2 | Bandhan Bank Ltd. | 62,526 | 260 |
| *,2 | SBI Life Insurance Co. Ltd. | 21,949 | 247 |
| | Eicher Motors Ltd. | 7,590 | 216 |
| * | UPL Ltd. | 31,210 | 215 |
| 2 | ICICI Lombard General Insurance Co. Ltd. | 12,583 | 215 |
| | Dabur India Ltd. | 32,552 | 210 |
| | Godrej Consumer Products Ltd. | 23,625 | 209 |
| | Bajaj Auto Ltd. | 5,170 | 208 |
| | ICICI Bank Ltd. | 37,829 | 201 |
| | Bajaj Finserv Ltd. | 2,356 | 198 |
| | Divi's Laboratories Ltd. | 4,361 | 185 |
| | Aurobindo Pharma Ltd. | 16,643 | 182 |
| | | | | | Shares | Market
Value•
($000) |
| | Britannia Industries Ltd. | 3,448 | 175 |
| | Cipla Ltd. | 17,986 | 174 |
| | Info Edge India Ltd. | 3,554 | 158 |
| | Lupin Ltd. | 12,067 | 152 |
| | Grasim Industries Ltd. | 16,093 | 148 |
| * | Tata Consumer Products Ltd. | 19,709 | 143 |
| | Zee Entertainment Enterprises Ltd. | 51,222 | 142 |
| | Marico Ltd. | 27,848 | 140 |
| | Bharti Infratel Ltd. | 50,773 | 137 |
| | Jubilant Foodworks Ltd. | 4,385 | 125 |
| | Piramal Enterprises Ltd. | 6,184 | 115 |
| | Pidilite Industries Ltd. | 5,899 | 113 |
| | Shree Cement Ltd. | 399 | 110 |
| 2 | ICICI Prudential Life Insurance Co. Ltd. | 18,626 | 107 |
| | Apollo Hospitals Enterprise Ltd. | 4,776 | 106 |
| | Shriram Transport Finance Co. Ltd. | 10,899 | 104 |
| | Havells India Ltd. | 12,295 | 103 |
| 2 | InterGlobe Aviation Ltd. | 6,097 | 99 |
| | Muthoot Finance Ltd. | 6,109 | 95 |
| | Ambuja Cements Ltd. | 32,852 | 94 |
| | Berger Paints India Ltd. | 12,670 | 93 |
| | Balkrishna Industries Ltd. | 4,899 | 88 |
| | Biocon Ltd. | 17,147 | 88 |
| | Petronet LNG Ltd. | 27,040 | 88 |
| 2 | HDFC Asset Management Co. Ltd. | 2,678 | 88 |
| | Motherson Sumi Systems Ltd. | 57,809 | 86 |
| 2 | AU Small Finance Bank Ltd. | 9,013 | 82 |
| | Container Corp. of India Ltd. | 15,422 | 82 |
| | Torrent Pharmaceuticals Ltd. | 2,245 | 81 |
| | Page Industries Ltd. | 312 | 81 |
| | Cadila Healthcare Ltd. | 15,404 | 78 |
| | Persistent Systems Ltd. | 5,774 | 75 |
| | PI Industries Ltd. | 2,925 | 73 |
| | LIC Housing Finance Ltd. | 17,480 | 72 |
| | Colgate-Palmolive India Ltd. | 3,897 | 72 |
| | Ipca Laboratories Ltd. | 2,778 | 71 |
| * | Vodafone Idea Ltd. | 513,757 | 71 |
| | Crompton Greaves Consumer Electricals Ltd. | 19,175 | 71 |
| | Alkem Laboratories Ltd. | 1,926 | 71 |
| | Mphasis Ltd. | 4,579 | 69 |
| | Federal Bank Ltd. | 91,967 | 69 |
| | Mahindra & Mahindra Financial Services Ltd. | 36,396 | 67 |
ESG International Stock ETF
| | | | | | Shares | Market
Value•
($000) |
| * | Max Financial Services Ltd. | 8,293 | 66 |
| * | Aavas Financiers Ltd. | 3,433 | 66 |
| | Indiabulls Housing Finance Ltd. | 22,740 | 65 |
| | Bosch Ltd. | 366 | 64 |
| 2 | Laurus Labs Ltd. | 4,179 | 64 |
| | Karnataka Bank Ltd. | 101,832 | 63 |
| 2 | RBL Bank Ltd. | 23,376 | 62 |
| | Oracle Financial Services Software Ltd. | 1,472 | 61 |
| | Torrent Power Ltd. | 13,570 | 61 |
| | WABCO India Ltd. | 621 | 59 |
| * | IDFC First Bank Ltd. | 136,423 | 59 |
| | Escorts Ltd. | 3,926 | 58 |
| 2 | Dr Lal PathLabs Ltd. | 2,401 | 58 |
| | AIA Engineering Ltd. | 2,308 | 57 |
| | Supreme Industries Ltd. | 3,056 | 56 |
| | DLF Ltd. | 25,804 | 56 |
| | V-Mart Retail Ltd. | 2,166 | 56 |
| | Natco Pharma Ltd. | 5,497 | 56 |
| | Karur Vysya Bank Ltd. | 102,986 | 54 |
| | South Indian Bank Ltd. | 522,267 | 52 |
| | Gillette India Ltd. | 686 | 51 |
| | Bajaj Holdings & Investment Ltd. | 1,376 | 50 |
| | PTC India Ltd. | 62,288 | 50 |
| | Rajesh Exports Ltd. | 8,176 | 50 |
| | Whirlpool of India Ltd. | 1,705 | 49 |
| | Gujarat Gas Ltd. | 10,971 | 49 |
| | Tata Communications Ltd. | 4,060 | 48 |
| | City Union Bank Ltd. | 26,203 | 48 |
| * | Fortis Healthcare Ltd. | 26,836 | 48 |
| | Jubilant Life Sciences Ltd. | 4,321 | 46 |
| | Coromandel International Ltd. | 4,318 | 45 |
| | NMDC Ltd. | 33,248 | 44 |
| | NHPC Ltd. | 150,683 | 44 |
| * | Godrej Properties Ltd. | 3,572 | 44 |
| | JK Cement Ltd. | 2,115 | 43 |
| | Bayer CropScience Ltd. | 532 | 42 |
| | Sundaram Finance Ltd. | 1,937 | 42 |
| | Birlasoft Ltd. | 19,387 | 42 |
| | Indraprastha Gas Ltd. | 7,808 | 42 |
| | Welspun Corp. Ltd. | 28,252 | 41 |
| | REC Ltd. | 27,604 | 40 |
| * | TeamLease Services Ltd. | 1,237 | 40 |
| | Minda Industries Ltd. | 8,623 | 40 |
| | Sterlite Technologies Ltd. | 18,935 | 39 |
| * | Union Bank of India | 93,939 | 39 |
| | SRF Ltd. | 689 | 38 |
| | Glenmark Pharmaceuticals Ltd. | 5,969 | 38 |
| | Kajaria Ceramics Ltd. | 6,483 | 38 |
| | Kansai Nerolac Paints Ltd. | 5,851 | 38 |
| | | | | | Shares | Market
Value•
($000) |
| 2 | Endurance Technologies Ltd. | 2,546 | 38 |
| | India Cements Ltd. | 23,758 | 37 |
| | Coforge Ltd. | 1,425 | 37 |
| | Voltas Ltd. | 4,174 | 36 |
| | Indian Hotels Co. Ltd. | 25,727 | 36 |
| | Motilal Oswal Financial Services Ltd. | 3,836 | 36 |
| | eClerx Services Ltd. | 3,730 | 36 |
| | Bombay Burmah Trading Co. | 1,987 | 36 |
| | Castrol India Ltd. | 22,166 | 36 |
| | Pfizer Ltd. | 569 | 35 |
| | Gujarat Pipavav Port Ltd. | 32,578 | 35 |
| | Kaveri Seed Co. Ltd. | 4,448 | 35 |
| * | Bank of India | 46,426 | 34 |
| | Mahanagar Gas Ltd. | 2,637 | 34 |
| 2 | Nippon Life India Asset Management Ltd. | 9,184 | 34 |
| | Thermax Ltd. | 3,199 | 33 |
| | Exide Industries Ltd. | 14,831 | 33 |
| * | Indian Bank | 37,677 | 33 |
| * | Bajaj Consumer Care Ltd. | 14,146 | 33 |
| * | Bank of Baroda | 49,418 | 33 |
| | Hexaware Technologies Ltd. | 5,940 | 32 |
| | Alembic Pharmaceuticals Ltd. | 2,469 | 32 |
| | Manappuram Finance Ltd. | 15,361 | 31 |
| * | Canara Bank | 21,499 | 31 |
| | EIH Ltd. | 25,799 | 31 |
| * | Central Bank of India | 127,759 | 31 |
| * | Just Dial Ltd. | 6,216 | 31 |
| | Varun Beverages Ltd. | 3,144 | 31 |
| | Cholamandalam Financial Holdings Ltd. | 5,210 | 31 |
| | Dalmia Bharat Ltd. | 3,043 | 31 |
| | Chambal Fertilizers & Chemicals Ltd. | 14,713 | 30 |
| | ACC Ltd. | 1,658 | 30 |
| | Apollo Tyres Ltd. | 18,078 | 30 |
| | Phoenix Mills Ltd. | 3,378 | 30 |
| *,2 | Quess Corp. Ltd. | 6,083 | 30 |
| * | Future Retail Ltd. | 13,573 | 30 |
| | Hindustan Zinc Ltd. | 9,396 | 29 |
| | Power Finance Corp. Ltd. | 22,602 | 29 |
| | Prestige Estates Projects Ltd. | 8,675 | 29 |
| | Emami Ltd. | 5,851 | 28 |
| | Tube Investments of India Ltd. | 3,219 | 28 |
| | Gateway Distriparks Ltd. | 21,953 | 27 |
| | Cholamandalam Investment & Finance Co. Ltd. | 8,637 | 27 |
| | Aarti Industries Ltd. | 1,860 | 26 |
ESG International Stock ETF
| | | | | | Shares | Market
Value•
($000) |
| | Oberoi Realty Ltd. | 4,948 | 26 |
| 2 | PNB Housing Finance Ltd. | 6,699 | 26 |
| * | Punjab National Bank | 55,410 | 26 |
| | Welspun India Ltd. | 34,874 | 26 |
| | Ceat Ltd. | 2,090 | 25 |
| | TVS Motor Co. Ltd. | 4,169 | 25 |
| * | DCB Bank Ltd. | 20,738 | 25 |
| 2 | Godrej Agrovet Ltd. | 3,739 | 25 |
| | Vinati Organics Ltd. | 1,827 | 25 |
| | Strides Pharma Science Ltd. | 2,916 | 24 |
| | Godrej Industries Ltd. | 4,019 | 24 |
| | Multi Commodity Exchange of India Ltd. | 1,119 | 24 |
| | Redington India Ltd. | 15,136 | 22 |
| | Astral Poly Technik Ltd. | 1,461 | 22 |
| | Bata India Ltd. | 1,235 | 22 |
| * | Jammu & Kashmir Bank Ltd. | 87,272 | 21 |
| * | Dish TV India Ltd. | 131,892 | 20 |
| | Vakrangee Ltd. | 53,438 | 20 |
| * | Aditya Birla Capital Ltd. | 24,373 | 20 |
| | Polycab India Ltd. | 1,680 | 20 |
| | Indiabulls Ventures Ltd. | 7,104 | 19 |
| | Repco Home Finance Ltd. | 7,818 | 19 |
| | Ajanta Pharma Ltd. | 957 | 19 |
| * | Raymond Ltd. | 4,638 | 18 |
| | KRBL Ltd. | 4,936 | 18 |
| | Balrampur Chini Mills Ltd. | 8,941 | 18 |
| | Jindal Saw Ltd. | 20,589 | 17 |
| | PVR Ltd. | 953 | 17 |
| | Finolex Cables Ltd. | 4,410 | 17 |
| * | Indiabulls Real Estate Ltd. | 20,012 | 17 |
| | JM Financial Ltd. | 13,905 | 16 |
| | Avanti Feeds Ltd. | 2,284 | 16 |
| 2 | Dilip Buildcon Ltd. | 3,182 | 16 |
| * | IFCI Ltd. | 159,540 | 15 |
| | National Aluminium Co. Ltd. | 30,294 | 15 |
| | Rain Industries Ltd. | 10,064 | 15 |
| | Sundram Fasteners Ltd. | 2,451 | 15 |
| | TTK Prestige Ltd. | 189 | 15 |
| * | Mahindra CIE Automotive Ltd. | 8,314 | 15 |
| | IDFC Ltd. | 37,895 | 14 |
| * | TV18 Broadcast Ltd. | 31,831 | 14 |
| | Edelweiss Financial Services Ltd. | 12,887 | 14 |
| | Amara Raja Batteries Ltd. | 1,430 | 14 |
| | V-Guard Industries Ltd. | 6,229 | 14 |
| | Thomas Cook India Ltd. | 27,523 | 13 |
| | Symphony Ltd. | 1,144 | 13 |
| * | Aditya Birla Fashion & Retail Ltd. | 7,007 | 13 |
| | Care Ratings Ltd. | 2,063 | 11 |
| | Yes Bank Ltd. | 54,048 | 11 |
| | | | | | Shares | Market
Value•
($000) |
| * | Sun Pharma Advanced Research Co. Ltd. | 4,241 | 10 |
| * | Equitas Holdings Ltd. | 12,964 | 10 |
| | DCM Shriram Ltd. | 2,097 | 10 |
| | Century Textiles & Industries Ltd. | 1,877 | 9 |
| | Sobha Ltd. | 2,611 | 9 |
| * | Future Consumer Ltd. | 52,332 | 9 |
| * | Suzlon Energy Ltd. | 157,392 | 8 |
| * | IRB Infrastructure Developers Ltd. | 5,170 | 8 |
| * | VA Tech Wabag Ltd. | 2,896 | 8 |
| 2 | Syngene International Ltd. | 1,188 | 8 |
| | Ramco Cements Ltd. | 759 | 7 |
| | NCC Ltd. | 16,130 | 7 |
| | NBCC India Ltd. | 19,798 | 7 |
| | HEG Ltd. | 462 | 5 |
| | Graphite India Ltd. | 1,899 | 5 |
| | Arvind Ltd. | 9,750 | 4 |
| *,1 | Hemisphere Properties India Ltd. | 1,129 | 3 |
| * | Aarti Surfactants Ltd. | 26 | — |
| * | Minda Industries Ltd. Rights Exp. 09/08/2020 | 319 | — |
| | | | | | | 26,542 |
| Indonesia (0.4%) |
| | Bank Central Asia Tbk. PT | 578,800 | 1,247 |
| | Bank Rakyat Indonesia Persero Tbk. PT | 3,585,500 | 864 |
| | Telekomunikasi Indonesia Persero Tbk. PT | 3,746,700 | 737 |
| | Bank Mandiri Persero Tbk. PT | 1,408,900 | 576 |
| | Bank Negara Indonesia Persero Tbk. PT | 796,200 | 279 |
| | Charoen Pokphand Indonesia Tbk. PT | 498,500 | 216 |
| | Unilever Indonesia Tbk. PT | 327,000 | 185 |
| | Indofood Sukses Makmur Tbk. PT | 232,300 | 122 |
| | Kalbe Farma Tbk. PT | 980,600 | 106 |
| | Indah Kiat Pulp & Paper Corp. Tbk. PT | 126,000 | 80 |
| * | Barito Pacific Tbk. PT | 1,119,200 | 64 |
| | Indofood CBP Sukses Makmur Tbk. PT | 83,300 | 59 |
| * | Indocement Tunggal Prakarsa Tbk. PT | 60,600 | 49 |
| * | Tower Bersama Infrastructure Tbk. PT | 522,900 | 47 |
| | Bank BTPN Syariah Tbk. PT | 145,900 | 39 |
| * | XL Axiata Tbk. PT | 228,900 | 38 |
| | Ciputra Development Tbk. PT | 675,800 | 36 |
| * | Ace Hardware Indonesia Tbk. PT | 262,800 | 28 |
ESG International Stock ETF
| | | | | | Shares | Market
Value•
($000) |
| | Summarecon Agung Tbk. PT | 522,800 | 23 |
| * | Jasa Marga Persero Tbk. PT | 85,400 | 23 |
| * | Japfa Comfeed Indonesia Tbk. PT | 253,300 | 21 |
| | Bank Pembangunan Daerah Jawa Barat Dan Banten Tbk. PT | 269,900 | 20 |
| | Pakuwon Jati Tbk. PT | 699,000 | 20 |
| | Surya Citra Media Tbk. PT | 221,900 | 19 |
| * | Mitra Adiperkasa Tbk. PT | 369,500 | 17 |
| * | Smartfren Telecom Tbk. PT | 2,394,600 | 15 |
| | Bank Tabungan Negara Persero Tbk. PT | 94,700 | 10 |
| * | Kresna Graha Investama Tbk. PT | 1,209,300 | 10 |
| | Media Nusantara Citra Tbk. PT | 131,500 | 8 |
| | Surya Semesta Internusa Tbk. PT | 209,500 | 5 |
| * | Matahari Department Store Tbk. PT | 46,000 | 4 |
| * | Agung Podomoro Land Tbk. PT | 456,400 | 4 |
| * | Panin Financial Tbk. PT | 210,700 | 3 |
| * | Wijaya Karya Persero Tbk. PT | 39,500 | 3 |
| * | Bumi Serpong Damai Tbk. PT | 57,300 | 3 |
| * | Bekasi Fajar Industrial Estate Tbk. PT | 319,100 | 3 |
| * | Siloam International Hospitals Tbk. PT | 11,600 | 3 |
| | Ramayana Lestari Sentosa Tbk. PT | 41,400 | 2 |
| * | Global Mediacom Tbk. PT | 94,100 | 2 |
| *,1 | Trada Alam Minera Tbk. PT | 477,100 | 2 |
| * | PP Persero Tbk. PT | 36,200 | 2 |
| * | Waskita Karya Persero Tbk. PT | 38,300 | 2 |
| * | Sentul City Tbk. PT | 96,500 | — |
| | | | | | | 4,996 |
| Ireland (0.2%) |
| | Kerry Group plc Class A | 9,514 | 1,249 |
| | Kingspan Group plc | 12,794 | 1,097 |
| | CRH plc (XDUB) | 8,121 | 303 |
| * | Bank of Ireland Group plc | 61,083 | 137 |
| | Glanbia plc | 9,689 | 112 |
| * | AIB Group plc | 42,550 | 52 |
| | Cairn Homes plc | 15,088 | 14 |
| | Dalata Hotel Group plc | 4,099 | 13 |
| | Irish Continental Group plc | 1,849 | 7 |
| | | | | | | 2,984 |
| | | | | | Shares | Market
Value•
($000) |
| Israel (0.4%) |
| * | Nice Ltd. | 4,581 | 1,052 |
| * | Teva Pharmaceutical Industries Ltd. | 61,670 | 610 |
| | Bank Hapoalim BM | 77,436 | 468 |
| | Bank Leumi Le-Israel BM | 90,272 | 462 |
| | Israel Discount Bank Ltd. Class A | 124,100 | 397 |
| | ICL Group Ltd. | 56,957 | 212 |
| | Mizrahi Tefahot Bank Ltd. | 7,813 | 159 |
| * | Tower Semiconductor Ltd. | 6,390 | 126 |
| * | Bezeq The Israeli Telecommunication Corp. Ltd. | 109,927 | 125 |
| | Azrieli Group Ltd. | 1,452 | 78 |
| * | Nova Measuring Instruments Ltd. | 1,388 | 76 |
| | Strauss Group Ltd. | 1,873 | 55 |
| | Electra Ltd. | 99 | 45 |
| | Shikun & Binui Ltd. | 9,876 | 44 |
| * | Shapir Engineering & Industry Ltd. | 6,114 | 43 |
| | Harel Insurance Investments & Financial Services Ltd. | 5,789 | 42 |
| | Sapiens International Corp. NV | 983 | 33 |
| | Matrix IT Ltd. | 1,220 | 31 |
| * | Hilan Ltd. | 642 | 30 |
| | Shufersal Ltd. | 3,816 | 30 |
| | FIBI Holdings Ltd. | 1,143 | 30 |
| | AudioCodes Ltd. | 947 | 29 |
| | Reit 1 Ltd. | 7,284 | 29 |
| | Isracard Ltd. | 10,165 | 28 |
| | Formula Systems 1985 Ltd. | 272 | 25 |
| * | Clal Insurance Enterprises Holdings Ltd. | 1,957 | 19 |
| * | Partner Communications Co. Ltd. | 4,340 | 19 |
| * | Cellcom Israel Ltd. | 4,655 | 17 |
| | Rami Levy Chain Stores Hashikma Marketing 2006 Ltd. | 260 | 16 |
| * | Kamada Ltd. | 1,526 | 15 |
| | Menora Mivtachim Holdings Ltd. | 965 | 13 |
| | IDI Insurance Co. Ltd. | 493 | 13 |
| | Kenon Holdings Ltd. | 574 | 13 |
| | Sella Capital Real Estate Ltd. | �� 5,366 | 10 |
| * | Allot Ltd. | 857 | 9 |
| * | AFI Properties Ltd. | 304 | 8 |
| | Gazit-Globe Ltd. | 1,384 | 7 |
| | | | | | | 4,418 |
| Italy (1.3%) |
| * | Intesa Sanpaolo SpA | 969,152 | 2,086 |
ESG International Stock ETF
| | | | | | Shares | Market
Value•
($000) |
| | Ferrari NV | 8,559 | 1,671 |
| * | UniCredit SpA | 141,785 | 1,395 |
| | Assicurazioni Generali SpA | 72,207 | 1,122 |
| | Terna Rete Elettrica Nazionale SpA | 118,529 | 858 |
| * | Fiat Chrysler Automobiles NV | 70,559 | 782 |
| * | FinecoBank Banca Fineco SpA | 48,118 | 728 |
| | Mediobanca Banca di Credito Finanziario SpA | 69,333 | 603 |
| * | Moncler SpA | 15,483 | 600 |
| | Telecom Italia SpA (Bearer) | 1,150,124 | 544 |
| *,2 | Nexi SpA | 28,373 | 505 |
| | Tenaris SA | 47,525 | 278 |
| | Recordati Industria Chimica e Farmaceutica SpA | 5,104 | 278 |
| * | DiaSorin SpA | 1,337 | 242 |
| * | Amplifon SpA | 6,521 | 217 |
| 2 | Poste Italiane SpA | 23,237 | 213 |
| | ERG SpA | 6,125 | 162 |
| 2 | Infrastrutture Wireless Italiane SpA | 15,834 | 154 |
| *,2 | doValue SpA | 12,819 | 145 |
| | Interpump Group SpA | 4,119 | 144 |
| * | Banco BPM SpA | 81,211 | 137 |
| * | ASTM SpA | 6,526 | 133 |
| * | Biesse SpA | 7,479 | 125 |
| | Azimut Holding SpA | 6,210 | 121 |
| | Italgas SpA | 18,847 | 121 |
| | Hera SpA | 28,212 | 108 |
| | Buzzi Unicem SpA (MTAA) | 4,213 | 103 |
| | Reply SpA | 905 | 101 |
| * | De' Longhi SpA | 2,882 | 96 |
| * | Unipol Gruppo SpA | 19,546 | 94 |
| * | IMA Industria Macchine Automatiche SpA | 1,074 | 86 |
| | Banca Mediolanum SpA | 11,580 | 86 |
| *,2 | Pirelli & C SpA | 18,044 | 78 |
| * | Banca Generali SpA | 2,385 | 73 |
| * | Freni Brembo SpA | 6,867 | 66 |
| * | Cerved Group SpA | 7,639 | 65 |
| * | BPER Banca | 22,380 | 61 |
| 2 | Anima Holding SpA | 13,911 | 61 |
| | Webuild SpA | 39,750 | 52 |
| * | Banca Popolare di Sondrio SCPA | 19,984 | 48 |
| * | Societa Cattolica di Assicurazioni SC | 7,874 | 47 |
| * | Brunello Cucinelli SpA | 1,493 | 47 |
| | A2A SpA | 29,717 | 43 |
| | Tamburi Investment Partners SpA | 6,237 | 42 |
| *,2 | Technogym SpA | 4,712 | 42 |
| | | | | | Shares | Market
Value•
($000) |
| | UnipolSai Assicurazioni SpA | 14,275 | 41 |
| 2 | Carel Industries SpA | 1,607 | 39 |
| | Iren SpA | 14,352 | 38 |
| 2 | Enav SpA | 8,501 | 36 |
| * | Salvatore Ferragamo SpA | 2,384 | 34 |
| * | Telecom Italia SpA (Registered) | 67,343 | 32 |
| | Italmobiliare SpA | 736 | 27 |
| | Falck Renewables SpA | 3,939 | 26 |
| * | DeA Capital SpA | 16,523 | 23 |
| * | MARR SpA | 1,358 | 21 |
| *,2 | RAI Way SpA | 3,084 | 20 |
| * | Immobiliare Grande Distribuzione SIIQ SpA | 5,375 | 20 |
| | Autogrill SpA | 3,798 | 19 |
| * | Banca Monte dei Paschi di Siena SpA | 11,008 | 19 |
| | Piaggio & C SpA | 6,297 | 18 |
| | Danieli & C Officine Meccaniche SpA | 1,043 | 16 |
| | Zignago Vetro SpA | 1,065 | 16 |
| * | Credito Emiliano SpA | 2,712 | 14 |
| * | Cairo Communication SpA | 8,334 | 13 |
| * | Arnoldo Mondadori Editore SpA | 9,116 | 12 |
| * | Juventus Football Club SpA | 8,956 | 10 |
| *,2 | Banca Farmafactoring SpA | 1,799 | 10 |
| * | Tod's SpA | 291 | 8 |
| * | Datalogic SpA | 523 | 7 |
| * | Rizzoli Corriere Della Sera Mediagroup SpA | 8,503 | 6 |
| | Buzzi Unicem SpA (SGMX) | 265 | 4 |
| *,2 | OVS SpA | 2,886 | 3 |
| * | Banca IFIS SpA | 199 | 2 |
| | | | | | | 15,297 |
| Japan (17.8%) |
| | Toyota Motor Corp. | 152,800 | 10,092 |
| | SoftBank Group Corp. | 102,100 | 6,316 |
| | Sony Corp. | 75,500 | 5,912 |
| | Keyence Corp. | 11,100 | 4,572 |
| | Takeda Pharmaceutical Co. Ltd. | 98,457 | 3,671 |
| | Daiichi Sankyo Co. Ltd. | 40,700 | 3,631 |
| | Nintendo Co. Ltd. | 6,600 | 3,553 |
| | Mitsubishi UFJ Financial Group Inc. | 747,600 | 3,119 |
| | Recruit Holdings Co. Ltd. | 81,600 | 3,093 |
| | KDDI Corp. | 106,200 | 3,087 |
| | Shin-Etsu Chemical Co. Ltd. | 24,100 | 2,929 |
| | Nidec Corp. | 32,500 | 2,728 |
| | Honda Motor Co. Ltd. | 106,600 | 2,714 |
| | Kao Corp. | 31,200 | 2,377 |
ESG International Stock ETF
| | | | | | Shares | Market
Value•
($000) |
| | Tokyo Electron Ltd. | 9,100 | 2,334 |
| | Murata Manufacturing Co. Ltd. | 38,400 | 2,271 |
| | Sumitomo Mitsui Financial Group Inc. | 77,100 | 2,267 |
| | Hoya Corp. | 22,200 | 2,184 |
| | FANUC Corp. | 12,400 | 2,175 |
| | Mizuho Financial Group Inc. | 1,467,200 | 1,986 |
| | NTT DOCOMO Inc. | 69,500 | 1,938 |
| | Tokio Marine Holdings Inc. | 41,900 | 1,934 |
| | Astellas Pharma Inc. | 122,900 | 1,928 |
| | Chugai Pharmaceutical Co. Ltd. | 42,100 | 1,876 |
| | SMC Corp. | 3,400 | 1,868 |
| | Fast Retailing Co. Ltd. | 3,100 | 1,848 |
| | Fujitsu Ltd. | 14,100 | 1,841 |
| | Oriental Land Co. Ltd. | 13,500 | 1,832 |
| | Terumo Corp. | 42,300 | 1,721 |
| | Nippon Telegraph & Telephone Corp. | 74,400 | 1,693 |
| | Seven & i Holdings Co. Ltd. | 51,100 | 1,649 |
| | M3 Inc. | 28,100 | 1,628 |
| | Central Japan Railway Co. | 10,700 | 1,604 |
| | Eisai Co. Ltd. | 18,000 | 1,572 |
| | SoftBank Corp. | 114,306 | 1,502 |
| | Kubota Corp. | 80,800 | 1,459 |
| | Olympus Corp. | 72,800 | 1,441 |
| | Panasonic Corp. | 154,100 | 1,420 |
| | East Japan Railway Co. | 21,600 | 1,406 |
| | Secom Co. Ltd. | 14,800 | 1,401 |
| | Shiseido Co. Ltd. | 23,800 | 1,384 |
| | Aeon Co. Ltd. | 52,800 | 1,311 |
| | Sysmex Corp. | 15,000 | 1,310 |
| | Mitsubishi Estate Co. Ltd. | 81,800 | 1,280 |
| | Dai-ichi Life Holdings Inc. | 81,100 | 1,229 |
| | Kyocera Corp. | 20,700 | 1,188 |
| | Suzuki Motor Corp. | 28,900 | 1,183 |
| | Nomura Holdings Inc. | 224,300 | 1,152 |
| | Mitsui Fudosan Co. Ltd. | 63,000 | 1,140 |
| | Daiwa House Industry Co. Ltd. | 42,300 | 1,131 |
| | Z Holdings Corp. | 168,400 | 1,121 |
| | Denso Corp. | 26,300 | 1,106 |
| | Omron Corp. | 15,100 | 1,106 |
| | Shionogi & Co. Ltd. | 19,800 | 1,099 |
| | Canon Inc. | 62,000 | 1,063 |
| | Unicharm Corp. | 24,400 | 1,063 |
| | Japan Exchange Group Inc. | 40,400 | 1,048 |
| | ORIX Corp. | 84,200 | 1,047 |
| | Nippon Paint Holdings Co. Ltd. | 12,100 | 1,039 |
| | Ono Pharmaceutical Co. Ltd. | 34,100 | 1,030 |
| | | | | | Shares | Market
Value•
($000) |
| | Bridgestone Corp. | 32,300 | 1,023 |
| | FUJIFILM Holdings Corp. | 21,500 | 1,023 |
| | Bandai Namco Holdings Inc. | 16,000 | 993 |
| | Shimano Inc. | 4,600 | 974 |
| | Pan Pacific International Holdings Corp. | 39,400 | 928 |
| | Nitori Holdings Co. Ltd. | 4,400 | 921 |
| | Nitto Denko Corp. | 13,800 | 838 |
| | Sompo Holdings Inc. | 22,300 | 838 |
| | Toyota Industries Corp. | 14,400 | 836 |
| | Sekisui House Ltd. | 41,400 | 818 |
| | Yamato Holdings Co. Ltd. | 31,100 | 813 |
| | West Japan Railway Co. | 15,100 | 794 |
| | Advantest Corp. | 16,500 | 791 |
| | NEC Corp. | 14,900 | 787 |
| | MS&AD Insurance Group Holdings Inc. | 27,700 | 768 |
| | Sumitomo Electric Industries Ltd. | 64,900 | 762 |
| | Ajinomoto Co. Inc. | 40,000 | 746 |
| | Yaskawa Electric Corp. | 20,200 | 725 |
| | TDK Corp. | 6,900 | 715 |
| | Nexon Co. Ltd. | 30,500 | 714 |
| | Yamaha Corp. | 14,400 | 702 |
| | Asahi Kasei Corp. | 83,000 | 695 |
| | Kintetsu Group Holdings Co. Ltd. | 15,800 | 695 |
| | Sumitomo Realty & Development Co. Ltd. | 22,900 | 675 |
| | Resona Holdings Inc. | 179,700 | 661 |
| | Sumitomo Mitsui Trust Holdings Inc. | 22,700 | 655 |
| | NTT Data Corp. | 57,100 | 652 |
| | Santen Pharmaceutical Co. Ltd. | 33,900 | 647 |
| | TOTO Ltd. | 14,700 | 645 |
| | Daiwa Securities Group Inc. | 142,400 | 642 |
| | Yakult Honsha Co. Ltd. | 11,200 | 639 |
| | MINEBEA MITSUMI Inc. | 36,800 | 637 |
| | Makita Corp. | 13,700 | 633 |
| | Sekisui Chemical Co. Ltd. | 38,700 | 619 |
| | Shimadzu Corp. | 20,600 | 615 |
| | Aisin Seiki Co. Ltd. | 17,700 | 607 |
| | Hamamatsu Photonics KK | 13,300 | 606 |
| | MEIJI Holdings Co. Ltd. | 7,400 | 598 |
| | Kyowa Kirin Co. Ltd. | 23,100 | 597 |
| | Toyo Suisan Kaisha Ltd. | 10,500 | 597 |
| | T&D Holdings Inc. | 55,600 | 582 |
| | Mitsubishi Chemical Holdings Corp. | 99,600 | 582 |
| | Pigeon Corp. | 12,700 | 580 |
| | Tobu Railway Co. Ltd. | 18,500 | 578 |
| | LIXIL Group Corp. | 31,200 | 573 |
| | Azbil Corp. | 18,200 | 572 |
ESG International Stock ETF
| | | | | | Shares | Market
Value•
($000) |
| | SG Holdings Co. Ltd. | 12,400 | 571 |
| | NH Foods Ltd. | 12,400 | 562 |
| | Odakyu Electric Railway Co. Ltd. | 21,800 | 540 |
| | Nagoya Railroad Co. Ltd. | 19,100 | 533 |
| | Tokyu Corp. | 39,600 | 530 |
| | Japan Post Holdings Co. Ltd. | 68,900 | 510 |
| | Stanley Electric Co. Ltd. | 17,700 | 505 |
| | Toho Co. Ltd. (Tokyo) | 13,300 | 505 |
| | Yamaha Motor Co. Ltd. | 32,000 | 502 |
| | Nisshin Seifun Group Inc. | 30,300 | 500 |
| | Keihan Holdings Co. Ltd. | 11,500 | 496 |
| | Sumitomo Chemical Co. Ltd. | 151,800 | 492 |
| | Toray Industries Inc. | 103,300 | 490 |
| | Dentsu Group Inc. | 18,400 | 483 |
| | Bank of Kyoto Ltd. | 11,200 | 477 |
| | Daifuku Co. Ltd. | 5,400 | 475 |
| | Dai Nippon Printing Co. Ltd. | 22,300 | 473 |
| | Haseko Corp. | 34,400 | 469 |
| | Concordia Financial Group Ltd. | 139,400 | 462 |
| | Mitsui Chemicals Inc. | 19,600 | 460 |
| | Konami Holdings Corp. | 11,900 | 458 |
| | NSK Ltd. | 59,700 | 458 |
| | Chiba Bank Ltd. | 87,500 | 453 |
| | Sohgo Security Services Co. Ltd. | 9,700 | 453 |
| | Brother Industries Ltd. | 27,200 | 450 |
| | SBI Holdings Inc. | 19,800 | 450 |
| | Shizuoka Bank Ltd. | 64,200 | 446 |
| | Hisamitsu Pharmaceutical Co. Inc. | 9,600 | 443 |
| | Oji Holdings Corp. | 98,100 | 443 |
| | Ricoh Co. Ltd. | 59,400 | 443 |
| | Nissan Motor Co. Ltd. | 109,400 | 441 |
| | Keikyu Corp. | 29,400 | 439 |
| | Lion Corp. | 20,400 | 433 |
| | COMSYS Holdings Corp. | 15,100 | 422 |
| | Nomura Research Institute Ltd. | 15,600 | 415 |
| | Hulic Co. Ltd. | 45,600 | 415 |
| | Nissan Chemical Corp. | 7,800 | 413 |
| | Taiheiyo Cement Corp. | 16,200 | 411 |
| | Seiko Epson Corp. | 34,400 | 410 |
| | Taiyo Yuden Co. Ltd. | 15,200 | 409 |
| | Teijin Ltd. | 25,900 | 406 |
| | Isuzu Motors Ltd. | 40,400 | 399 |
| | SUMCO Corp. | 29,100 | 395 |
| | Kuraray Co. Ltd. | 38,600 | 394 |
| | Mazda Motor Corp. | 61,100 | 389 |
| | Kurita Water Industries Ltd. | 12,400 | 388 |
| | Yamada Denki Co. Ltd. | 70,900 | 381 |
| | | | | | Shares | Market
Value•
($000) |
| | Air Water Inc. | 27,000 | 379 |
| | Anritsu Corp. | 16,900 | 370 |
| | Keio Corp. | 6,000 | 363 |
| | Marui Group Co. Ltd. | 19,900 | 363 |
| | Nissin Foods Holdings Co. Ltd. | 3,600 | 360 |
| | Kaken Pharmaceutical Co. Ltd. | 7,600 | 352 |
| | Disco Corp. | 1,500 | 350 |
| | Lasertec Corp. | 4,600 | 348 |
| | Nihon M&A Center Inc. | 6,900 | 343 |
| | Hankyu Hanshin Holdings Inc. | 10,500 | 341 |
| | MISUMI Group Inc. | 13,000 | 341 |
| | NGK Spark Plug Co. Ltd. | 19,600 | 335 |
| | Showa Denko KK | 17,200 | 335 |
| | Daito Trust Construction Co. Ltd. | 3,700 | 328 |
| | Aozora Bank Ltd. | 18,100 | 324 |
| | Kobayashi Pharmaceutical Co. Ltd. | 3,500 | 312 |
| | Alfresa Holdings Corp. | 15,400 | 309 |
| | Fukuoka Financial Group Inc. | 18,600 | 307 |
| | Coca-Cola Bottlers Japan Holdings Inc. | 18,200 | 303 |
| | Japan Airlines Co. Ltd. | 14,900 | 295 |
| | Alps Alpine Co. Ltd. | 18,500 | 294 |
| | CyberAgent Inc. | 5,500 | 293 |
| | Nikon Corp. | 37,400 | 293 |
| | Hikari Tsushin Inc. | 1,200 | 290 |
| | Rohm Co. Ltd. | 4,400 | 283 |
| *,3 | ANA Holdings Inc. | 11,200 | 279 |
| | Otsuka Corp. | 5,500 | 270 |
| | Koito Manufacturing Co. Ltd. | 5,500 | 266 |
| | MonotaRO Co. Ltd. | 6,400 | 253 |
| | TIS Inc. | 12,600 | 251 |
| * | Renesas Electronics Corp. | 39,600 | 249 |
| | Welcia Holdings Co. Ltd. | 5,800 | 248 |
| | Sumitomo Dainippon Pharma Co. Ltd. | 18,600 | 235 |
| | Sinanen Holdings Co. Ltd. | 8,200 | 229 |
| | Sac's Bar Holdings Inc. | 44,000 | 225 |
| | Nippon Shinyaku Co. Ltd. | 2,700 | 223 |
| | GMO Payment Gateway Inc. | 2,100 | 222 |
| | Seibu Holdings Inc. | 20,200 | 222 |
| | Capcom Co. Ltd. | 4,500 | 218 |
| | Miura Co. Ltd. | 5,100 | 209 |
| | Hoshizaki Corp. | 2,600 | 199 |
| * | PeptiDream Inc. | 4,900 | 199 |
| | Ryohin Keikaku Co. Ltd. | 12,600 | 197 |
| | Skylark Holdings Co. Ltd. | 12,200 | 194 |
| | Kansai Paint Co. Ltd. | 8,100 | 193 |
ESG International Stock ETF
| | | | | | Shares | Market
Value•
($000) |
| | Keisei Electric Railway Co. Ltd. | 6,500 | 191 |
| | Oracle Corp. Japan | 1,600 | 188 |
| | Kakaku.com Inc. | 6,900 | 184 |
| | Nabtesco Corp. | 5,800 | 183 |
| | Casio Computer Co. Ltd. | 11,300 | 182 |
| | Itochu Techno-Solutions Corp. | 5,000 | 181 |
| | NET One Systems Co. Ltd. | 4,700 | 181 |
| | Kyushu Railway Co. | 8,000 | 176 |
| | PC Depot Corp. | 26,000 | 175 |
| | Konica Minolta Inc. | 54,000 | 174 |
| | Nippon Express Co. Ltd. | 2,900 | 171 |
| | Ibiden Co. Ltd. | 5,400 | 169 |
| * | Tokyo Rope Manufacturing Co. Ltd. | 34,200 | 167 |
| | Tokyo Century Corp. | 3,100 | 159 |
| | Kose Corp. | 1,300 | 153 |
| | Japan Post Bank Co. Ltd. | 18,700 | 150 |
| | Cybozu Inc. | 5,100 | 150 |
| | Hirose Electric Co. Ltd. | 1,300 | 147 |
| | Rohto Pharmaceutical Co. Ltd. | 4,500 | 143 |
| | JSR Corp. | 6,600 | 141 |
| | Nichirei Corp. | 5,200 | 136 |
| | USS Co. Ltd. | 7,900 | 133 |
| | Ito En Ltd. | 2,200 | 133 |
| * | LINE Corp. | 2,600 | 133 |
| | Denka Co. Ltd. | 4,700 | 132 |
| | THK Co. Ltd. | 5,600 | 131 |
| | Taiyo Nippon Sanso Corp. | 7,400 | 130 |
| | Rinnai Corp. | 1,400 | 130 |
| | Matsumotokiyoshi Holdings Co. Ltd. | 3,700 | 130 |
| | Sushiro Global Holdings Ltd. | 5,500 | 128 |
| | K's Holdings Corp. | 8,700 | 123 |
| | Goldwin Inc. | 1,700 | 123 |
| | Shinsei Bank Ltd. | 10,395 | 121 |
| | Tokyu Fudosan Holdings Corp. | 28,000 | 120 |
| | Suzuken Co. Ltd. | 3,200 | 119 |
| | Hakuhodo DY Holdings Inc. | 9,400 | 117 |
| | Mebuki Financial Group Inc. | 47,800 | 116 |
| | Maezawa Kasei Industries Co. Ltd. | 12,300 | 116 |
| | Persol Holdings Co. Ltd. | 7,400 | 115 |
| | Nihon Kohden Corp. | 3,300 | 113 |
| | Asics Corp. | 8,100 | 112 |
| | House Foods Group Inc. | 3,300 | 112 |
| | Calbee Inc. | 3,600 | 112 |
| | Yamazaki Baking Co. Ltd. | 6,600 | 108 |
| | Kagome Co. Ltd. | 3,400 | 106 |
| | | | | | Shares | Market
Value•
($000) |
| | Koei Tecmo Holdings Co. Ltd. | 2,600 | 103 |
| | Open House Co. Ltd. | 2,900 | 103 |
| | Lawson Inc. | 2,000 | 99 |
| | Ezaki Glico Co. Ltd. | 2,300 | 98 |
| | TechnoPro Holdings Inc. | 1,800 | 96 |
| | Sugi Holdings Co. Ltd. | 1,300 | 94 |
| | Medipal Holdings Corp. | 4,900 | 94 |
| | Tokyo Ohka Kogyo Co. Ltd. | 1,900 | 93 |
| | Amada Co. Ltd. | 10,300 | 92 |
| | Zensho Holdings Co. Ltd. | 4,100 | 92 |
| | Fancl Corp. | 2,800 | 92 |
| | FamilyMart Co. Ltd. | 4,100 | 91 |
| | Fujita Kanko Inc. | 6,400 | 91 |
| * | Right On Co. Ltd. | 17,000 | 91 |
| | Nihon Unisys Ltd. | 3,100 | 89 |
| | Kyowa Exeo Corp. | 3,500 | 88 |
| | SCSK Corp. | 1,600 | 87 |
| | Nankai Electric Railway Co. Ltd. | 3,900 | 86 |
| | BayCurrent Consulting Inc. | 800 | 86 |
| | Kyushu Financial Group Inc. | 18,500 | 85 |
| | Nishi-Nippon Railroad Co. Ltd. | 2,900 | 84 |
| | SCREEN Holdings Co. Ltd. | 1,700 | 83 |
| | Hino Motors Ltd. | 12,400 | 83 |
| | Morinaga Milk Industry Co. Ltd. | 1,700 | 83 |
| | Japan Post Insurance Co. Ltd. | 5,039 | 81 |
| | Isetan Mitsukoshi Holdings Ltd. | 14,300 | 79 |
| | Ain Holdings Inc. | 1,200 | 78 |
| | J Front Retailing Co. Ltd. | 11,300 | 78 |
| | Sumitomo Forestry Co. Ltd. | 4,800 | 77 |
| | Tokyo Tatemono Co. Ltd. | 6,300 | 77 |
| | Toyo Seikan Group Holdings Ltd. | 6,700 | 75 |
| | Aica Kogyo Co. Ltd. | 2,200 | 75 |
| | Acom Co. Ltd. | 19,000 | 74 |
| | Iyo Bank Ltd. | 11,600 | 74 |
| | Tokai Carbon Co. Ltd. | 7,900 | 74 |
| | Nomura Real Estate Holdings Inc. | 3,900 | 74 |
| | Chugoku Bank Ltd. | 7,900 | 73 |
| | Seino Holdings Co. Ltd. | 4,800 | 73 |
| | Izumi Co. Ltd. | 1,800 | 70 |
| | JTEKT Corp. | 9,100 | 70 |
| | FP Corp. | 900 | 69 |
| | Taisho Pharmaceutical Holdings Co. Ltd. | 1,100 | 68 |
| | Furukawa Electric Co. Ltd. | 2,800 | 67 |
ESG International Stock ETF
| | | | | | Shares | Market
Value•
($000) |
| | Sawai Pharmaceutical Co. Ltd. | 1,300 | 67 |
| | Toyo Tire Corp. | 4,000 | 67 |
| | GMO internet Inc. | 2,500 | 67 |
| | Maruichi Steel Tube Ltd. | 2,500 | 67 |
| | Kewpie Corp. | 3,400 | 64 |
| | Zenkoku Hosho Co. Ltd. | 1,800 | 64 |
| | Showa Corp. | 3,000 | 64 |
| | Sotetsu Holdings Inc. | 2,300 | 63 |
| | Hiroshima Bank Ltd. | 12,100 | 61 |
| | Benesse Holdings Inc. | 2,400 | 61 |
| | Hachijuni Bank Ltd. | 15,900 | 61 |
| | Keihin Corp. | 2,500 | 61 |
| | NOK Corp. | 5,500 | 60 |
| * | Intage Holdings Inc. | 6,900 | 60 |
| | Nitto Boseki Co. Ltd. | 1,500 | 60 |
| | Morinaga & Co. Ltd. | 1,600 | 59 |
| | Nifco Inc. | 2,300 | 59 |
| | DeNA Co. Ltd. | 3,700 | 59 |
| | Seven Bank Ltd. | 23,500 | 59 |
| | Shimamura Co. Ltd. | 700 | 58 |
| | Ulvac Inc. | 1,600 | 57 |
| | Takara Bio Inc. | 2,100 | 57 |
| | Ushio Inc. | 4,500 | 56 |
| | Fukuyama Transporting Co. Ltd. | 1,100 | 54 |
| | NEC Networks & System Integration Corp. | 2,800 | 52 |
| | Nippon Kanzai Co. Ltd. | 2,700 | 51 |
| | Shiga Bank Ltd. | 2,200 | 51 |
| | DIC Corp. | 2,100 | 50 |
| | Dowa Holdings Co. Ltd. | 1,600 | 50 |
| | ADEKA Corp. | 3,400 | 50 |
| | Iwatani Corp. | 1,400 | 50 |
| | Daicel Corp. | 6,800 | 49 |
| | Hitachi Transport System Ltd. | 1,400 | 49 |
| | Nippon Kayaku Co. Ltd. | 5,000 | 49 |
| | Yoshinoya Holdings Co. Ltd. | 2,500 | 49 |
| | Rengo Co. Ltd. | 6,700 | 49 |
| | AEON Financial Service Co. Ltd. | 5,400 | 48 |
| | Ariake Japan Co. Ltd. | 700 | 48 |
| | Nagase & Co. Ltd. | 3,700 | 48 |
| | Yamaguchi Financial Group Inc. | 7,300 | 48 |
| | Daido Steel Co. Ltd. | 1,400 | 47 |
| | Daiichikosho Co. Ltd. | 1,500 | 47 |
| | Gunma Bank Ltd. | 14,300 | 47 |
| | Nippo Corp. | 1,800 | 47 |
| | Yaoko Co. Ltd. | 600 | 47 |
| | Anicom Holdings Inc. | 1,100 | 47 |
| | Sankyu Inc. | 1,100 | 46 |
| | Toyobo Co. Ltd. | 3,200 | 46 |
| | Sharp Corp. | 3,600 | 45 |
| | | | | | Shares | Market
Value•
($000) |
| | Aeon Mall Co. Ltd. | 3,300 | 44 |
| | OSG Corp. | 3,000 | 44 |
| | Sanwa Holdings Corp. | 4,400 | 44 |
| | Kenedix Inc. | 9,000 | 44 |
| | Tokuyama Corp. | 1,900 | 44 |
| | DMG Mori Co. Ltd. | 3,400 | 43 |
| | JCR Pharmaceuticals Co. Ltd. | 400 | 43 |
| | Takuma Co. Ltd. | 2,700 | 43 |
| | H.U. Group Holdings Inc. | 1,700 | 42 |
| | Nippon Shokubai Co. Ltd. | 800 | 42 |
| | Mitsubishi Logistics Corp. | 1,400 | 42 |
| | OKUMA Corp. | 900 | 41 |
| | Jeol Ltd. | 1,400 | 41 |
| | Zeon Corp. | 3,800 | 40 |
| | GS Yuasa Corp. | 2,400 | 40 |
| | CKD Corp. | 2,900 | 40 |
| | Jafco Co. Ltd. | 1,000 | 40 |
| | Kiyo Bank Ltd. | 2,700 | 40 |
| | Mitsubishi UFJ Lease & Finance Co. Ltd. | 8,300 | 39 |
| | Hitachi Capital Corp. | 1,600 | 39 |
| | Yokohama Rubber Co. Ltd. | 2,500 | 39 |
| | Kurimoto Ltd. | 2,200 | 39 |
| | Lintec Corp. | 1,600 | 38 |
| | TS Tech Co. Ltd. | 1,300 | 38 |
| | Pola Orbis Holdings Inc. | 2,100 | 38 |
| | Awa Bank Ltd. | 1,700 | 38 |
| | Nissin Kogyo Co. Ltd. | 1,800 | 38 |
| | As One Corp. | �� 300 | 38 |
| | Milbon Co. Ltd. | 700 | 38 |
| | MOS Food Services Inc. | 1,400 | 38 |
| | Fujitsu General Ltd. | 1,400 | 37 |
| | Sumitomo Rubber Industries Ltd. | 3,900 | 37 |
| | Wacoal Holdings Corp. | 2,100 | 37 |
| | Ryoyo Electro Corp. | 1,300 | 37 |
| | Shinko Electric Industries Co. Ltd. | 2,500 | 37 |
| | Kisoji Co. Ltd. | 1,600 | 36 |
| | Toyoda Gosei Co. Ltd. | 1,600 | 35 |
| | Systena Corp. | 2,200 | 35 |
| | Toagosei Co. Ltd. | 3,500 | 34 |
| | Megmilk Snow Brand Co. Ltd. | 1,500 | 34 |
| | Fujimori Kogyo Co. Ltd. | 900 | 34 |
| | Nishimatsu Construction Co. Ltd. | 1,800 | 34 |
| | Shimachu Co. Ltd. | 1,200 | 34 |
| | Shoei Co. Ltd. | 1,100 | 34 |
| | Asahi Holdings Inc. | 1,000 | 34 |
| | Toyo Ink SC Holdings Co. Ltd. | 1,900 | 33 |
| | Nipro Corp. | 2,800 | 32 |
| | Hokuhoku Financial Group Inc. | 3,400 | 32 |
ESG International Stock ETF
| | | | | | Shares | Market
Value•
($000) |
| | Fujikura Kasei Co. Ltd. | 6,600 | 32 |
| | Kokuyo Co. Ltd. | 2,900 | 32 |
| | Paramount Bed Holdings Co. Ltd. | 800 | 32 |
| | Glory Ltd. | 1,500 | 31 |
| | Kyudenko Corp. | 1,100 | 31 |
| | Hokkoku Bank Ltd. | 1,100 | 31 |
| | Tokyo Seimitsu Co. Ltd. | 1,000 | 31 |
| | Japan Material Co. Ltd. | 2,300 | 31 |
| * | Aiful Corp. | 12,400 | 30 |
| | Nippon Electric Glass Co. Ltd. | 1,600 | 30 |
| | Shinwa Co. Ltd. | 1,600 | 30 |
| | OBIC Business Consultants Co. Ltd. | 500 | 30 |
| | Fuso Pharmaceutical Industries Ltd. | 1,200 | 30 |
| | Kyokuyo Co. Ltd. | 1,200 | 30 |
| | Ringer Hut Co. Ltd. | 1,300 | 30 |
| | TOKAI Holdings Corp. | 3,100 | 30 |
| | 77 Bank Ltd. | 2,000 | 29 |
| | Ichibanya Co. Ltd. | 600 | 29 |
| | Heiwa Real Estate Co. Ltd. | 1,100 | 29 |
| | Key Coffee Inc. | 1,400 | 29 |
| | Hazama Ando Corp. | 4,300 | 29 |
| | Sumitomo Osaka Cement Co. Ltd. | 900 | 29 |
| | Kaneka Corp. | 1,100 | 28 |
| | Hiday Hidaka Corp. | 1,700 | 28 |
| | Zuiko Corp. | 2,800 | 28 |
| | cocokara fine Inc. | 500 | 28 |
| | Nippon Light Metal Holdings Co. Ltd. | 15,900 | 28 |
| | NHK Spring Co. Ltd. | 4,300 | 27 |
| | Colowide Co. Ltd. | 1,700 | 27 |
| | Hokkan Holdings Ltd. | 2,000 | 27 |
| | Infocom Corp. | 800 | 27 |
| | Shochiku Co. Ltd. | 200 | 27 |
| | Showa Sangyo Co. Ltd. | 800 | 27 |
| | Toho Holdings Co. Ltd. | 1,400 | 27 |
| | Yushiro Chemical Industry Co. Ltd. | 2,300 | 27 |
| | Citizen Watch Co. Ltd. | 8,300 | 26 |
| | Fuji Oil Holdings Inc. | 900 | 26 |
| | Chuetsu Pulp & Paper Co. Ltd. | 1,900 | 26 |
| | Shizuoka Gas Co. Ltd. | 3,200 | 26 |
| | Organo Corp. | 500 | 26 |
| | Morita Holdings Corp. | 1,400 | 26 |
| | Nippon Densetsu Kogyo Co. Ltd. | 1,300 | 26 |
| | Artnature Inc. | 4,400 | 26 |
| | Toyota Boshoku Corp. | 1,800 | 25 |
| | Fuji Seal International Inc. | 1,400 | 25 |
| | KFC Holdings Japan Ltd. | 900 | 25 |
| | | | | | Shares | Market
Value•
($000) |
| | Achilles Corp. | 1,500 | 25 |
| | Ogaki Kyoritsu Bank Ltd. | 1,200 | 25 |
| | Sanrio Co. Ltd. | 1,500 | 25 |
| | KYORIN Holdings Inc. | 1,300 | 25 |
| | Takashimaya Co. Ltd. | 3,000 | 24 |
| | Nippon Paper Industries Co. Ltd. | 1,900 | 24 |
| | Daiseki Co. Ltd. | 1,000 | 24 |
| | Nojima Corp. | 800 | 24 |
| | Nippon Seiki Co. Ltd. | 2,300 | 24 |
| | Okura Industrial Co. Ltd. | 1,600 | 24 |
| | Sumitomo Bakelite Co. Ltd. | 900 | 24 |
| | Itoham Yonekyu Holdings Inc. | 3,400 | 23 |
| | Fujiya Co. Ltd. | 1,100 | 23 |
| | Eizo Corp. | 600 | 23 |
| | Meiko Network Japan Co. Ltd. | 3,200 | 23 |
| | Nagaileben Co. Ltd. | 900 | 23 |
| * | Sagami Holdings Corp. | 1,800 | 23 |
| | Toho Co. Ltd. (Kobe) | 1,300 | 23 |
| | Daito Pharmaceutical Co. Ltd. | 700 | 23 |
| | North Pacific Bank Ltd. | 10,800 | 23 |
| | Maruwa Unyu Kikan Co. Ltd. | 600 | 23 |
| | Joyful Honda Co. Ltd. | 1,600 | 23 |
| | Nisshinbo Holdings Inc. | 3,200 | 22 |
| | NTN Corp. | 11,400 | 22 |
| | Aiphone Co. Ltd. | 1,700 | 22 |
| | Chuo Spring Co. Ltd. | 900 | 22 |
| | Iriso Electronics Co. Ltd. | 600 | 22 |
| | Riken Keiki Co. Ltd. | 900 | 22 |
| | Taikisha Ltd. | 800 | 22 |
| | Toyo Corp. | 2,400 | 22 |
| | Transcosmos Inc. | 800 | 22 |
| | Earth Corp. | 300 | 22 |
| | Mirait Holdings Corp. | 1,600 | 22 |
| | Kintetsu World Express Inc. | 1,000 | 21 |
| | Digital Garage Inc. | 700 | 21 |
| | Kato Sangyo Co. Ltd. | 600 | 21 |
| | Toshiba TEC Corp. | 500 | 21 |
| | Tsubakimoto Chain Co. | 900 | 21 |
| | Outsourcing Inc. | 2,600 | 21 |
| | Daishi Hokuetsu Financial Group Inc. | 1,100 | 21 |
| | Maeda Road Construction Co. Ltd. | 1,100 | 20 |
| | Argo Graphics Inc. | 600 | 20 |
| | en-japan Inc. | 700 | 20 |
| | Furuno Electric Co. Ltd. | 2,200 | 20 |
| | Kumiai Chemical Industry Co. Ltd. | 2,100 | 20 |
| | Kyodo Printing Co. Ltd. | 800 | 20 |
ESG International Stock ETF
| | | | | | Shares | Market
Value•
($000) |
| | NichiiGakkan Co. Ltd. | 1,300 | 20 |
| | Nissin Corp. | 1,300 | 20 |
| | Rock Field Co. Ltd. | 1,600 | 20 |
| | Shinko Shoji Co. Ltd. | 2,400 | 20 |
| | Torishima Pump Manufacturing Co. Ltd. | 2,600 | 20 |
| | Totetsu Kogyo Co. Ltd. | 800 | 20 |
| | Takamiya Co. Ltd. | 4,200 | 20 |
| | ValueCommerce Co. Ltd. | 600 | 20 |
| | Restar Holdings Corp. | 1,100 | 20 |
| | Tokai Tokyo Financial Holdings Inc. | ��� 8,000 | 19 |
| | ASKUL Corp. | 600 | 19 |
| * | Kappa Create Co. Ltd. | 1,400 | 19 |
| | Nichi-iko Pharmaceutical Co. Ltd. | 1,700 | 19 |
| | Nihon Parkerizing Co. Ltd. | 2,000 | 19 |
| | Nissan Shatai Co. Ltd. | 2,100 | 19 |
| | Tocalo Co. Ltd. | 1,900 | 19 |
| | Riken Technos Corp. | 5,300 | 19 |
| | Ryoden Corp. | 1,400 | 19 |
| | Senko Group Holdings Co. Ltd. | 2,100 | 19 |
| | Kansai Mirai Financial Group Inc. | 4,500 | 19 |
| | Fujikura Ltd. | 6,200 | 18 |
| | Mabuchi Motor Co. Ltd. | 500 | 18 |
| | Keihanshin Building Co. Ltd. | 1,300 | 18 |
| | Mitsubishi Paper Mills Ltd. | 5,800 | 18 |
| | Mitsuuroko Group Holdings Co. Ltd. | 1,700 | 18 |
| | Mochida Pharmaceutical Co. Ltd. | 500 | 18 |
| | Nanto Bank Ltd. | 1,000 | 18 |
| | Sanyo Denki Co. Ltd. | 400 | 18 |
| | Tachibana Eletech Co. Ltd. | 1,000 | 18 |
| | Strike Co. Ltd. | 400 | 18 |
| | Alpha Systems Inc. | 500 | 17 |
| | Ehime Bank Ltd. | 1,600 | 17 |
| | Japan Securities Finance Co. Ltd. | 3,400 | 17 |
| | Marudai Food Co. Ltd. | 1,000 | 17 |
| | Tokyo Electron Device Ltd. | 600 | 17 |
| | Bank of Okinawa Ltd. | 600 | 17 |
| | ST Corp. | 900 | 17 |
| | San-In Godo Bank Ltd. | 3,500 | 17 |
| | TKC Corp. | 300 | 17 |
| | Create Restaurants Holdings Inc. | 2,800 | 17 |
| | Tokushu Tokai Paper Co. Ltd. | 400 | 17 |
| | Broadleaf Co. Ltd. | 3,600 | 17 |
| | Yamashin-Filter Corp. | 1,500 | 17 |
| | Fujio Food Group Inc. | 1,400 | 17 |
| | | | | | Shares | Market
Value•
($000) |
| | Exedy Corp. | 1,200 | 16 |
| * | Kawasaki Kisen Kaisha Ltd. | 1,400 | 16 |
| | Fukui Bank Ltd. | 1,000 | 16 |
| | Hokuto Corp. | 800 | 16 |
| | Maruzen Showa Unyu Co. Ltd. | 500 | 16 |
| | Nippon Suisan Kaisha Ltd. | 3,600 | 16 |
| | Noritake Co. Ltd. | 500 | 16 |
| | Oita Bank Ltd. | 700 | 16 |
| | Daihen Corp. | 400 | 16 |
| | Tsugami Corp. | 1,500 | 16 |
| | Tokyo Kiraboshi Financial Group Inc. | 1,500 | 16 |
| | Japan Lifeline Co. Ltd. | 1,100 | 15 |
| | Aichi Bank Ltd. | 500 | 15 |
| | Hodogaya Chemical Co. Ltd. | 300 | 15 |
| | Ines Corp. | 1,200 | 15 |
| | Mitsui-Soko Holdings Co. Ltd. | 900 | 15 |
| | Plenus Co. Ltd. | 900 | 15 |
| | Ryosan Co. Ltd. | 800 | 15 |
| | Tadano Ltd. | 1,800 | 15 |
| | Topcon Corp. | 1,900 | 15 |
| | WATAMI Co. Ltd. | 1,500 | 15 |
| | Japan Transcity Corp. | 3,200 | 15 |
| | G-7 Holdings Inc. | 500 | 15 |
| | Belc Co. Ltd. | 200 | 14 |
| | Keiyo Bank Ltd. | 3,100 | 14 |
| | Fuso Chemical Co. Ltd. | 400 | 14 |
| | Axial Retailing Inc. | 300 | 14 |
| | Mandom Corp. | 900 | 14 |
| | Mizuno Corp. | 800 | 14 |
| | Optex Group Co. Ltd. | 1,100 | 14 |
| | Saibu Gas Co. Ltd. | 600 | 14 |
| | Yokogawa Bridge Holdings Corp. | 800 | 14 |
| | JCU Corp. | 400 | 14 |
| | TOMONY Holdings Inc. | 4,400 | 14 |
| * | RENOVA Inc. | 1,300 | 14 |
| | Feed One Co. Ltd. | 7,900 | 14 |
| | Autobacs Seven Co. Ltd. | 1,000 | 13 |
| | Bank of the Ryukyus Ltd. | 1,500 | 13 |
| | Toppan Forms Co. Ltd. | 1,400 | 13 |
| | Hioki EE Corp. | 400 | 13 |
| | Kenko Mayonnaise Co. Ltd. | 800 | 13 |
| | Kita-Nippon Bank Ltd. | 800 | 13 |
| | Kyosan Electric Manufacturing Co. Ltd. | 2,800 | 13 |
| | Studio Alice Co. Ltd. | 900 | 13 |
| * | Leopalace21 Corp. | 7,300 | 13 |
| | Nitta Corp. | 600 | 13 |
| | Hyakugo Bank Ltd. | 4,200 | 13 |
| | Rokko Butter Co. Ltd. | 800 | 13 |
ESG International Stock ETF
| | | | | | Shares | Market
Value•
($000) |
| | San-Ai Oil Co. Ltd. | 1,500 | 13 |
| | Monex Group Inc. | 5,000 | 13 |
| | Mizuho Leasing Co. Ltd. | 500 | 13 |
| | Duskin Co. Ltd. | 500 | 13 |
| | ARTERIA Networks Corp. | 800 | 13 |
| | Fixstars Corp. | 1,200 | 13 |
| | Matsui Securities Co. Ltd. | 1,300 | 12 |
| | Happinet Corp. | 1,000 | 12 |
| | Ichiyoshi Securities Co. Ltd. | 2,700 | 12 |
| | Tsukuba Bank Ltd. | 7,900 | 12 |
| | Kitagawa Corp. | 900 | 12 |
| | Hyakujushi Bank Ltd. | 700 | 12 |
| | Prima Meat Packers Ltd. | 400 | 12 |
| | T-Gaia Corp. | 600 | 12 |
| | Sanshin Electronics Co. Ltd. | 700 | 12 |
| | Shikoku Bank Ltd. | 1,600 | 12 |
| | Shimizu Bank Ltd. | 800 | 12 |
| | Shin Nippon Air Technologies Co. Ltd. | 600 | 12 |
| | Tochigi Bank Ltd. | 8,000 | 12 |
| | Toho Bank Ltd. | 5,700 | 12 |
| | Uchida Yoko Co. Ltd. | 200 | 12 |
| | Unipres Corp. | 1,400 | 12 |
| | Zojirushi Corp. | 800 | 12 |
| | Yonex Co. Ltd. | 2,000 | 12 |
| | Asahi Co. Ltd. | 700 | 12 |
| | Fuyo General Lease Co. Ltd. | 200 | 12 |
| | Japan Best Rescue System Co. Ltd. | 1,300 | 12 |
| | SB Technology Corp. | 400 | 12 |
| * | Raksul Inc. | 400 | 12 |
| | Tomy Co. Ltd. | 1,400 | 11 |
| | Central Sports Co. Ltd. | 500 | 11 |
| | Information Services International-Dentsu Ltd. | 200 | 11 |
| | Hosokawa Micron Corp. | 200 | 11 |
| | JP-Holdings Inc. | 4,500 | 11 |
| * | Mitsubishi Steel Manufacturing Co. Ltd. | 2,100 | 11 |
| | Sumitomo Warehouse Co. Ltd. | 900 | 11 |
| | Tonami Holdings Co. Ltd. | 200 | 11 |
| | Towa Bank Ltd. | 1,700 | 11 |
| | Toli Corp. | 4,500 | 11 |
| | Yushin Precision Equipment Co. Ltd. | 1,700 | 11 |
| | Starzen Co. Ltd. | 300 | 11 |
| | Kyokuto Securities Co. Ltd. | 2,000 | 11 |
| | Ohara Inc. | 1,100 | 11 |
| | Hirata Corp. | 200 | 11 |
| | Maruha Nichiro Corp. | 500 | 11 |
| | Aomori Bank Ltd. | 500 | 10 |
| | | | | | Shares | Market
Value•
($000) |
| | Advan Co. Ltd. | 800 | 10 |
| | Megachips Corp. | 500 | 10 |
| | Teikoku Electric Manufacturing Co. Ltd. | 900 | 10 |
| | BML Inc. | 400 | 10 |
| | MTI Ltd. | 1,400 | 10 |
| | Daiichi Jitsugyo Co. Ltd. | 300 | 10 |
| * | Descente Ltd. | 600 | 10 |
| | Daisyo Corp. | 800 | 10 |
| | Fujibo Holdings Inc. | 300 | 10 |
| | Elematec Corp. | 1,200 | 10 |
| | Kanaden Corp. | 800 | 10 |
| | Kyokuto Kaihatsu Kogyo Co. Ltd. | 800 | 10 |
| | Maeda Corp. | 1,400 | 10 |
| | Micronics Japan Co. Ltd. | 1,000 | 10 |
| | Matsuyafoods Holdings Co. Ltd. | 300 | 10 |
| | Michinoku Bank Ltd. | 1,000 | 10 |
| | Miroku Jyoho Service Co. Ltd. | 500 | 10 |
| | Nissin Electric Co. Ltd. | 900 | 10 |
| | Nippon Koei Co. Ltd. | 400 | 10 |
| | Nippon Signal Co. Ltd. | 1,000 | 10 |
| | Okasan Securities Group Inc. | 3,200 | 10 |
| | Okuwa Co. Ltd. | 700 | 10 |
| | Okinawa Electric Power Co. Inc. | 630 | 10 |
| | Riken Vitamin Co. Ltd. | 500 | 10 |
| | Royal Holdings Co. Ltd. | 600 | 10 |
| | Takasago Thermal Engineering Co. Ltd. | 700 | 10 |
| | Pack Corp. | 400 | 10 |
| | Tsurumi Manufacturing Co. Ltd. | 600 | 10 |
| | Yokowo Co. Ltd. | 400 | 10 |
| | Gurunavi Inc. | 1,600 | 10 |
| | S-Pool Inc. | 1,500 | 10 |
| | Mie Kotsu Group Holdings Inc. | 2,300 | 10 |
| | World Co. Ltd. | 700 | 10 |
| | San ju San Financial Group Inc. | 800 | 10 |
| * | Japan Display Inc. | 19,700 | 10 |
| | Insource Co. Ltd. | 400 | 10 |
| | Bank of Saga Ltd. | 800 | 9 |
| | Fukushima Galilei Co. Ltd. | 300 | 9 |
| | Fuji Soft Inc. | 200 | 9 |
| | Godo Steel Ltd. | 500 | 9 |
| | Kureha Corp. | 200 | 9 |
| | Mitsui High-Tec Inc. | 600 | 9 |
| | Nichiden Corp. | 500 | 9 |
| | Nichiha Corp. | 400 | 9 |
| | Nisshin Oillio Group Ltd. | 300 | 9 |
ESG International Stock ETF
| | | | | | Shares | Market
Value•
($000) |
| | Mitsubishi Logisnext Co. Ltd. | 1,000 | 9 |
| | SMK Corp. | 400 | 9 |
| | Shima Seiki Manufacturing Ltd. | 600 | 9 |
| | Doutor Nichires Holdings Co. Ltd. | 600 | 9 |
| | Monogatari Corp. | 100 | 9 |
| | Noevir Holdings Co. Ltd. | 200 | 9 |
| | CHIMNEY Co. Ltd. | 700 | 9 |
| | KH Neochem Co. Ltd. | 400 | 9 |
| | United Arrows Ltd. | 500 | 8 |
| | Central Glass Co. Ltd. | 400 | 8 |
| | Enplas Corp. | 400 | 8 |
| | Adastria Co. Ltd. | 500 | 8 |
| | Idec Corp. | 500 | 8 |
| | Noritsu Koki Co. Ltd. | 500 | 8 |
| | Dai-Dan Co. Ltd. | 300 | 8 |
| | SWCC Showa Holdings Co. Ltd. | 800 | 8 |
| | Tokai Corp. | 400 | 8 |
| | Shibaura Machine Co. Ltd. | 400 | 8 |
| | Toridoll Holdings Corp. | 600 | 8 |
| | Resorttrust Inc. | 500 | 7 |
| | Cosel Co. Ltd. | 900 | 7 |
| | Kohnan Shoji Co. Ltd. | 200 | 7 |
| | Neturen Co. Ltd. | 1,500 | 7 |
| | Oki Electric Industry Co. Ltd. | 700 | 7 |
| | Seiren Co. Ltd. | 500 | 7 |
| | UACJ Corp. | 400 | 7 |
| | Gree Inc. | 1,600 | 7 |
| | Orient Corp. | 5,000 | 6 |
| | Belluna Co. Ltd. | 600 | 6 |
| | Computer Engineering & Consulting Ltd. | 400 | 6 |
| | Gakken Holdings Co. Ltd. | 400 | 6 |
| * | KNT-CT Holdings Co. Ltd. | 600 | 6 |
| | Nippon Soda Co. Ltd. | 200 | 6 |
| | Ohsho Food Service Corp. | 100 | 6 |
| | Raito Kogyo Co. Ltd. | 400 | 6 |
| | Sanken Electric Co. Ltd. | 300 | 6 |
| | Shibuya Corp. | 200 | 6 |
| | Shinmaywa Industries Ltd. | 700 | 6 |
| | Taki Chemical Co. Ltd. | 100 | 6 |
| | Toa Corp. | 400 | 6 |
| | Towa Pharmaceutical Co. Ltd. | 300 | 6 |
| | Toyo Kanetsu KK | 300 | 6 |
| | Nextage Co. Ltd. | 600 | 6 |
| | Solasto Corp. | 500 | 6 |
| | Canon Marketing Japan Inc. | 300 | 5 |
| | H2O Retailing Corp. | 700 | 5 |
| | J Trust Co. Ltd. | 2,100 | 5 |
| | Chiyoda Integre Co. Ltd. | 300 | 5 |
| | | | | | Shares | Market
Value•
($000) |
| | Eiken Chemical Co. Ltd. | 300 | 5 |
| | Kameda Seika Co. Ltd. | 100 | 5 |
| | Kanematsu Corp. | 400 | 5 |
| | Sumitomo Mitsui Construction Co. Ltd. | 1,300 | 5 |
| | Nissha Co. Ltd. | 500 | 5 |
| | Nitto Kogyo Corp. | 300 | 5 |
| | Pacific Industrial Co. Ltd. | 500 | 5 |
| | Sangetsu Corp. | 300 | 5 |
| | NS United Kaiun Kaisha Ltd. | 400 | 5 |
| | Sinko Industries Ltd. | 400 | 5 |
| | Daio Paper Corp. | 400 | 5 |
| | KAWADA TECHNOLOGIES Inc. | 100 | 5 |
| * | Vision Inc. | 600 | 5 |
| * | Akebono Brake Industry Co. Ltd. | 2,700 | 4 |
| | Musashi Seimitsu Industry Co. Ltd. | 400 | 4 |
| | IDOM Inc. | 700 | 4 |
| | Future Corp. | 200 | 4 |
| * | FDK Corp. | 400 | 4 |
| | Gunze Ltd. | 100 | 4 |
| | PAL GROUP Holdings Co. Ltd. | 400 | 4 |
| | Joshin Denki Co. Ltd. | 200 | 4 |
| | Kanamoto Co. Ltd. | 200 | 4 |
| | Nichicon Corp. | 600 | 4 |
| | Okamoto Industries Inc. | 100 | 4 |
| | Okamura Corp. | 600 | 4 |
| | Sanoh Industrial Co. Ltd. | 600 | 4 |
| * | Toho Zinc Co. Ltd. | 200 | 4 |
| | Yahagi Construction Co. Ltd. | 500 | 4 |
| | Sankyo Tateyama Inc. | 500 | 4 |
| | Obara Group Inc. | 100 | 3 |
| | Futaba Industrial Co. Ltd. | 500 | 3 |
| | Seiko Holdings Corp. | 200 | 3 |
| | Press Kogyo Co. Ltd. | 1,000 | 3 |
| | Macromill Inc. | 400 | 3 |
| | Ichikoh Industries Ltd. | 400 | 2 |
| * | Nippon Sheet Glass Co. Ltd. | 600 | 2 |
| | Nippon Thompson Co. Ltd. | 500 | 2 |
| | Riken Corp. | 100 | 2 |
| | Sumida Corp. | 400 | 2 |
| | Tamron Co. Ltd. | 100 | 2 |
| | Qol Holdings Co. Ltd. | 200 | 2 |
| | Koshidaka Holdings Co. Ltd. | 500 | 2 |
| * | Sanden Holdings Corp. | 500 | 1 |
| | | | | | | 214,813 |
ESG International Stock ETF
| | | | | | Shares | Market
Value•
($000) |
| Kuwait (0.2%) |
| | National Bank of Kuwait SAKP | 381,799 | 1,075 |
| | Kuwait Finance House KSCP | 227,591 | 466 |
| | Mobile Telecommunications Co. KSC | 126,905 | 245 |
| * | Agility Public Warehousing Co. KSC | 83,061 | 170 |
| | Gulf Bank KSCP | 114,846 | 80 |
| * | Warba Bank KSCP | 73,617 | 48 |
| | National Industries Group Holding SAK | 83,406 | 42 |
| | Kuwait International Bank KSCP | 54,381 | 31 |
| | Burgan Bank SAK | 44,224 | 29 |
| * | Alimtiaz Investment Group KSC | 101,143 | 28 |
| | Integrated Holding Co. KCSC | 21,901 | 25 |
| | | | | | | 2,239 |
| Luxembourg (0.0%) |
| | Millicom International Cellular SA SDR | 1 | — |
| Malaysia (0.7%) |
| | Public Bank Bhd. | 191,300 | 754 |
| | Top Glove Corp. Bhd. | 104,800 | 662 |
| | Malayan Banking Bhd. | 347,900 | 612 |
| | Hartalega Holdings Bhd. | 89,900 | 357 |
| | CIMB Group Holdings Bhd. | 433,600 | 343 |
| * | Supermax Corp. Bhd. | 55,892 | 298 |
| | Sime Darby Plantation Bhd. | 199,300 | 244 |
| | Press Metal Aluminium Holdings Bhd. | 194,300 | 243 |
| | MISC Bhd. | 118,900 | 217 |
| | Petronas Chemicals Group Bhd. | 162,300 | 212 |
| | Maxis Bhd. | 174,900 | 210 |
| | DiGi.Com Bhd. | 218,400 | 207 |
| | IHH Healthcare Bhd. | 155,000 | 199 |
| | Axiata Group Bhd. | 266,300 | 192 |
| | Sime Darby Bhd. | 364,000 | 191 |
| | IOI Corp. Bhd. | 154,900 | 166 |
| | Nestle Malaysia Bhd. | 4,900 | 164 |
| | PPB Group Bhd. | 33,800 | 146 |
| | AMMB Holdings Bhd. | 202,700 | 142 |
| | Kossan Rubber Industries | 35,300 | 136 |
| | Hong Leong Bank Bhd. | 35,600 | 120 |
| | HAP Seng Consolidated Bhd. | 67,400 | 116 |
| | Petronas Gas Bhd. | 29,000 | 115 |
| | Kuala Lumpur Kepong Bhd. | 20,000 | 108 |
| | | | | | Shares | Market
Value•
($000) |
| | RHB Bank Bhd. | 89,600 | 98 |
| | Gamuda Bhd. | 113,400 | 92 |
| | Frontken Corp. Bhd. | 96,400 | 88 |
| | QL Resources Bhd. | 37,000 | 85 |
| | Petronas Dagangan Bhd. | 16,000 | 79 |
| | TIME dotCom Bhd. | 27,300 | 76 |
| | Bursa Malaysia Bhd. | 31,700 | 74 |
| | VS Industry Bhd. | 138,400 | 62 |
| | Yinson Holdings Bhd. | 40,300 | 61 |
| | IJM Corp. Bhd. | 203,900 | 59 |
| | Inari Amertron Bhd. | 109,500 | 59 |
| | Telekom Malaysia Bhd. | 58,382 | 58 |
| | Malaysia Airports Holdings Bhd. | 46,900 | 57 |
| | Malakoff Corp. Bhd. | 234,200 | 56 |
| | Pavilion REIT | 139,100 | 52 |
| | Hong Leong Financial Group Bhd. | 15,600 | 46 |
| | Sunway Construction Group Bhd. | 88,900 | 42 |
| | Genting Plantations Bhd. | 17,300 | 41 |
| | Alliance Bank Malaysia Bhd. | 76,900 | 40 |
| * | Pentamaster Corp. Bhd. | 34,350 | 39 |
| | Westports Holdings Bhd. | 40,900 | 36 |
| | My EG Services Bhd. | 96,900 | 35 |
| | YTL Corp. Bhd. | 208,900 | 34 |
| * | FGV Holdings Bhd. | 111,200 | 33 |
| | Fraser & Neave Holdings Bhd. | 4,400 | 32 |
| | IGB REIT | 58,200 | 26 |
| | Bermaz Auto Bhd. | 78,400 | 26 |
| | Muhibbah Engineering M Bhd. | 115,300 | 23 |
| | Malaysia Building Society Bhd. | 145,400 | 20 |
| | Malaysian Resources Corp. Bhd. | 157,800 | 19 |
| | Sime Darby Property Bhd. | 120,400 | 19 |
| | Padini Holdings Bhd. | 32,200 | 18 |
| | KPJ Healthcare Bhd. | 91,000 | 18 |
| | IOI Properties Group Bhd. | 76,300 | 17 |
| | Scientex Bhd. | 7,300 | 16 |
| | AEON Credit Service M Bhd. | 7,400 | 16 |
| | Sunway Bhd. | 45,500 | 15 |
| | AirAsia Group Bhd. | 90,800 | 14 |
| | Leong Hup International Bhd. | 68,700 | 14 |
| * | Cahya Mata Sarawak Bhd. | 36,800 | 13 |
| * | UEM Sunrise Bhd. | 131,300 | 13 |
| | Pos Malaysia Bhd. | 56,800 | 12 |
| | SP Setia Bhd. Group | 54,100 | 10 |
| * | AirAsia X Bhd. | 604,900 | 10 |
ESG International Stock ETF
| | | | | | Shares | Market
Value•
($000) |
| | Astro Malaysia Holdings Bhd. | 44,400 | 8 |
| | | | | | | 7,915 |
| Mexico (0.5%) |
| | America Movil SAB de CV | 1,924,841 | 1,169 |
| | Fomento Economico Mexicano SAB de CV | 144,823 | 843 |
| | Wal-Mart de Mexico SAB de CV | 297,900 | 715 |
| | Grupo Financiero Banorte SAB de CV | 206,500 | 714 |
| | Grupo Bimbo SAB de CV Class A | 258,534 | 478 |
| | Cemex SAB de CV | 1,366,000 | 438 |
| 2 | Macquarie Mexico Real Estate Management SA de CV | 247,163 | 287 |
| | Grupo Elektra SAB de CV | 3,455 | 189 |
| | Grupo Aeroportuario del Pacifico SAB de CV Class B | 22,600 | 176 |
| | Gruma SAB de CV Class B | 10,545 | 125 |
| | Fibra Uno Administracion SA de CV | 148,700 | 116 |
| | Industrias Penoles SAB de CV | 6,550 | 109 |
| | Grupo Aeroportuario del Sureste SAB de CV Class B | 7,955 | 90 |
| * | Grupo Financiero Inbursa SAB de CV | 112,500 | 82 |
| * | Grupo Aeroportuario del Centro Norte SAB de CV Class B | 17,600 | 80 |
| | Infraestructura Energetica Nova SAB de CV | 25,200 | 74 |
| | Orbia Advance Corp. SAB de CV | 45,900 | 74 |
| | Coca-Cola Femsa SAB de CV | 16,100 | 68 |
| | Bolsa Mexicana de Valores SAB de CV | 29,300 | 62 |
| | PLA Administradora Industrial S de RL de CV | 46,800 | 60 |
| | Prologis Property Mexico SA de CV | 27,574 | �� 55 |
| | Kimberly-Clark de Mexico SAB de CV Class A | 30,500 | 49 |
| * | Telesites SAB de CV | 61,300 | 46 |
| * | Controladora Vuela Cia de Aviacion SAB de CV Class A | 49,600 | 40 |
| | Corp. Inmobiliaria Vesta SAB de CV | 26,400 | 39 |
| | Qualitas Controladora SAB de CV | 9,100 | 36 |
| * | Regional SAB de CV | 14,000 | 35 |
| | | | | | Shares | Market
Value•
($000) |
| | Arca Continental SAB de CV | 7,400 | 34 |
| *,2 | Banco del Bajio SA | 41,500 | 33 |
| | La Comer SAB de CV | 21,500 | 33 |
| * | Axtel SAB de CV | 100,863 | 32 |
| * | Alsea SAB de CV | 29,400 | 30 |
| * | Genomma Lab Internacional SAB de CV Class B | 29,100 | 30 |
| | Grupo Carso SAB de CV | 12,700 | 25 |
| | Gentera SAB de CV | 76,600 | 25 |
| * | Credito Real SAB de CV SOFOM ER | 32,300 | 18 |
| | Concentradora Fibra Danhos SA de CV | 17,600 | 17 |
| | El Puerto de Liverpool SAB de CV | 5,800 | 15 |
| | Grupo Cementos de Chihuahua SAB de CV | 3,000 | 14 |
| | Grupo Herdez SAB de CV | 5,700 | 10 |
| | Grupo Comercial Chedraui SA de CV | 7,600 | 9 |
| * | Hoteles City Express SAB de CV | 35,200 | 9 |
| | Banco Santander Mexico SA Institucion de Banca Multiple Grupo Financiero Santand | 14,300 | 9 |
| * | Unifin Financiera SAB de CV | 10,874 | 9 |
| * | Grupo Rotoplas SAB de CV | 8,023 | 6 |
| | Grupo Lala SAB de CV Class B | 4,300 | 3 |
| | | | | | | 6,610 |
| Netherlands (3.1%) |
| | ASML Holding NV | 25,003 | 9,344 |
| | Unilever NV | 90,099 | 5,235 |
| *,2 | Adyen NV | 1,655 | 2,790 |
| * | Koninklijke Philips NV | 57,471 | 2,720 |
| * | Prosus NV | 26,752 | 2,681 |
| | Koninklijke Ahold Delhaize NV | 68,088 | 2,048 |
| | ING Groep NV | 240,955 | 1,967 |
| | Koninklijke DSM NV | 11,589 | 1,856 |
| | Wolters Kluwer NV | 18,148 | 1,489 |
| | Akzo Nobel NV | 13,561 | 1,339 |
| 3 | NN Group NV | 18,799 | 707 |
| | Koninklijke KPN NV | 263,537 | 692 |
| | Randstad NV | 11,334 | 590 |
| * | IMCD NV | 5,295 | 562 |
| | ASR Nederland NV | 14,579 | 504 |
| | ASM International NV | 2,851 | 428 |
| * | Galapagos NV | 2,692 | 361 |
| 3 | Aegon NV | 122,180 | 338 |
| | TKH Group NV | 7,467 | 293 |
| 2 | ABN AMRO Bank NV | 25,782 | 245 |
ESG International Stock ETF
| | | | | | Shares | Market
Value•
($000) |
| *,2 | Signify NV | 6,239 | 208 |
| | Koninklijke Vopak NV | 3,642 | 200 |
| | BE Semiconductor Industries NV | 3,585 | 171 |
| * | Corbion NV | 3,018 | 139 |
| * | Altice Europe NV Class B | 31,062 | 137 |
| *,2 | Just Eat Takeaway.com NV (XAMS) | 980 | 109 |
| * | Boskalis Westminster | 3,421 | 72 |
| *,2 | GrandVision NV | 2,361 | 68 |
| | PostNL NV | 20,494 | 61 |
| *,2 | Basic-Fit NV | 2,013 | 56 |
| | APERAM SA | 1,818 | 54 |
| * | OCI NV | 4,004 | 54 |
| 2 | Flow Traders | 1,304 | 51 |
| 2 | Intertrust NV | 2,233 | 40 |
| * | Galapagos NV (OOTC) | 165 | 22 |
| | Eurocommercial Properties NV | 1,732 | 21 |
| | NSI NV | 593 | 21 |
| | Sligro Food Group NV | 1,092 | 19 |
| 2 | NIBC Holding NV | 1,845 | 16 |
| * | Altice Europe NV | 3,147 | 14 |
| * | Accell Group NV | 378 | 11 |
| * | TomTom NV | 1,235 | 10 |
| 3 | Wereldhave NV | 895 | 7 |
| | Vastned Retail NV | 142 | 4 |
| | | | | | | 37,754 |
| New Zealand (0.4%) |
| | Fisher & Paykel Healthcare Corp. Ltd. | 39,270 | 973 |
| * | a2 Milk Co. Ltd. | 58,273 | 727 |
| | Spark New Zealand Ltd. | 190,428 | 618 |
| | Auckland International Airport Ltd. | 112,352 | 500 |
| | Contact Energy Ltd. | 100,272 | 421 |
| | Meridian Energy Ltd. | 58,591 | 200 |
| | Ryman Healthcare Ltd. | 20,610 | 186 |
| | Chorus Ltd. | 17,258 | 98 |
| | Infratil Ltd. | 25,410 | 85 |
| | EBOS Group Ltd. | 5,104 | 79 |
| | Mercury NZ Ltd. | 20,861 | 73 |
| * | Pushpay Holdings Ltd. | 12,516 | 73 |
| | Fletcher Building Ltd. | 28,968 | 70 |
| | Goodman Property Trust | 41,081 | 64 |
| | Summerset Group Holdings Ltd. | 7,897 | 46 |
| | Freightways Ltd. | 4,706 | 24 |
| | Precinct Properties New Zealand Ltd. | 19,911 | 22 |
| | Kiwi Property Group Ltd. | 31,736 | 22 |
| | Metlifecare Ltd. | 4,706 | 19 |
| | Heartland Group Holdings Ltd. | 21,745 | 18 |
| | Kathmandu Holdings Ltd. | 19,078 | 16 |
| | Argosy Property Ltd. | 16,147 | 15 |
| | | | | | Shares | Market
Value•
($000) |
| | Air New Zealand Ltd. | 15,173 | 14 |
| | Vista Group International Ltd. | 9,184 | 11 |
| | Scales Corp. Ltd. | 3,089 | 10 |
| * | Synlait Milk Ltd. | 1,759 | 8 |
| | Tourism Holdings Ltd. | 1,445 | 2 |
| | | | | | | 4,394 |
| Norway (0.5%) |
| * | DNB ASA | 67,315 | 1,078 |
| | Telenor ASA | 44,900 | 731 |
| | Mowi ASA | 34,256 | 670 |
| | Yara International ASA | 14,951 | 626 |
| * | Norsk Hydro ASA | 141,127 | 450 |
| * | Storebrand ASA | 69,687 | 428 |
| * | TOMRA Systems ASA | 7,923 | 384 |
| * | Schibsted ASA Class B | 8,701 | 344 |
| * | Adevinta ASA Class B | 12,846 | 239 |
| * | Bakkafrost P/F | 2,692 | 168 |
| * | NEL ASA | 68,306 | 166 |
| * | Nordic Semiconductor ASA | 15,825 | 163 |
| | Salmar ASA | 2,436 | 132 |
| * | Gjensidige Forsikring ASA | 5,807 | 124 |
| *,2 | Scatec Solar ASA | 3,873 | 84 |
| 2 | Entra ASA | 5,109 | 70 |
| * | Norwegian Finans Holding ASA | 8,395 | 64 |
| * | Schibsted ASA Class A | 1,314 | 57 |
| | SpareBank 1 SMN | 5,532 | 55 |
| * | Borregaard ASA | 3,331 | 49 |
| * | Veidekke ASA | 3,082 | 41 |
| * | SpareBank 1 SR-Bank ASA | 4,383 | 39 |
| 2 | BW LPG Ltd. | 8,413 | 39 |
| | Leroy Seafood Group ASA | 5,955 | 38 |
| | Frontline Ltd. | 4,078 | 32 |
| *,3 | Aker ASA Class A | 648 | 30 |
| *,2 | Sbanken ASA | 3,743 | 29 |
| * | Atea ASA | 1,925 | 23 |
| | Austevoll Seafood ASA | 1,525 | 14 |
| | Grieg Seafood ASA | 1,064 | 11 |
| 2 | Elkem ASA | 4,052 | 8 |
| *,3 | Norwegian Air Shuttle ASA | 3,601 | — |
| | | | | | | 6,386 |
| Pakistan (0.0%) |
| * | SUI Southern Gas Co. Ltd. | 865,102 | 90 |
| | Lucky Cement Ltd. | 16,400 | 61 |
| | Millat Tractors Ltd. | 9,500 | 51 |
| | Bank Alfalah Ltd. | 219,000 | 46 |
| | MCB Bank Ltd. | 43,000 | 44 |
| | Fauji Cement Co. Ltd. | 244,500 | 32 |
| * | National Bank of Pakistan | 134,500 | 30 |
| | Habib Bank Ltd. | 35,200 | 29 |
| * | Hub Power Co. Ltd. | 40,512 | 21 |
| | Fauji Fertilizer Co. Ltd. | 28,500 | 19 |
ESG International Stock ETF
| | | | | | Shares | Market
Value•
($000) |
| | DG Khan Cement Co. Ltd. | 23,500 | 16 |
| * | SUI Northern Gas Pipeline | 41,500 | 16 |
| | Searle Co. Ltd. | 10,300 | 16 |
| | Kot Addu Power Co. Ltd. | 77,500 | 14 |
| | Engro Corp. Ltd. | 2,420 | 4 |
| | | | | | | 489 |
| Peru (0.0%) |
| | Cia de Minas Buenaventura SAA ADR | 9,196 | 129 |
| Philippines (0.2%) |
| | Ayala Land Inc. | 490,300 | 291 |
| | Ayala Corp. | 19,230 | 291 |
| | BDO Unibank Inc. | 154,760 | 274 |
| | Bank of the Philippine Islands | 191,350 | 265 |
| | PLDT Inc. | 5,565 | 168 |
| | Universal Robina Corp. | 48,230 | 137 |
| | International Container Terminal Services Inc. | 54,740 | 118 |
| | Globe Telecom Inc. | 1,805 | 78 |
| | Metropolitan Bank & Trust Co. | 107,057 | 74 |
| | Manila Electric Co. | 10,810 | 60 |
| | Security Bank Corp. | 29,720 | 59 |
| | Jollibee Foods Corp. | 19,800 | 55 |
| * | GT Capital Holdings Inc. | 5,680 | 47 |
| | Puregold Price Club Inc. | 41,100 | 46 |
| | Robinsons Retail Holdings Inc. | 31,990 | 46 |
| | Wilcon Depot Inc. | 130,900 | 44 |
| | Metro Pacific Investments Corp. | 618,000 | 43 |
| | Aboitiz Power Corp. | 79,100 | 43 |
| | Century Pacific Food Inc. | 115,400 | 39 |
| | Cebu Air Inc. | 33,720 | 25 |
| | Vista Land & Lifescapes Inc. | 258,100 | 16 |
| * | First Gen Corp. | 25,500 | 13 |
| | Nickel Asia Corp. | 144,000 | 10 |
| | Manila Water Co. Inc. | 31,600 | 9 |
| * | Filinvest Land Inc. | 339,000 | 6 |
| *,2 | CEMEX Holdings Philippines Inc. | 186,933 | 6 |
| | | | | | | 2,263 |
| Poland (0.2%) |
| | Powszechna Kasa Oszczednosci Bank Polski SA | 77,913 | 455 |
| * | CD Projekt SA | 3,741 | 445 |
| | Powszechny Zaklad Ubezpieczen SA | 43,653 | 322 |
| | Bank Polska Kasa Opieki SA | 18,959 | 269 |
| * | KGHM Polska Miedz SA | 6,523 | 242 |
| *,2 | Dino Polska SA | 2,300 | 139 |
| | | | | | Shares | Market
Value•
($000) |
| | Cyfrowy Polsat SA | 9,908 | 77 |
| | LPP SA | 33 | 64 |
| 2 | PLAY Communications SA | 7,041 | 58 |
| * | Orange Polska SA | 26,078 | 51 |
| * | Santander Bank Polska SA | 1,183 | 49 |
| * | Asseco Poland SA | 2,077 | 40 |
| * | Bank Millennium SA | 36,166 | 30 |
| | KRUK SA | 676 | 27 |
| | CCC SA | 1,414 | 22 |
| * | mBank SA | 411 | 21 |
| * | Alior Bank SA | 5,709 | 21 |
| | Warsaw Stock Exchange | 1,564 | 19 |
| * | AmRest Holdings SE | 2,391 | 14 |
| | Bank Handlowy w Warszawie SA | 1,155 | 12 |
| | | | | | | 2,377 |
| Portugal (0.0%) |
| * | Jeronimo Martins SGPS SA | 12,340 | 203 |
| | REN - Redes Energeticas Nacionais SGPS SA | 46,945 | 137 |
| | EDP Renovaveis SA | 7,131 | 122 |
| | Banco Comercial Portugues SA | 359,549 | 42 |
| * | CTT-Correios de Portugal SA | 11,496 | 36 |
| * | NOS SGPS SA | 4,992 | 20 |
| | Mota-Engil SGPS SA | 10,000 | 19 |
| | Sonae SGPS SA | 24,793 | 18 |
| * | Navigator Co. SA | 4,298 | 11 |
| | Altri SGPS SA | 1,635 | 8 |
| | | | | | | 616 |
| Qatar (0.2%) |
| | Qatar National Bank QPSC | 276,671 | 1,367 |
| | Industries Qatar QSC | 106,871 | 289 |
| | Masraf Al Rayan QSC | 233,345 | 267 |
| | Commercial Bank PSQC | 125,897 | 144 |
| | Mesaieed Petrochemical Holding Co. | 245,875 | 143 |
| | Qatar Fuel QSC | 25,548 | 129 |
| | Qatar International Islamic Bank QSC | 48,781 | 115 |
| | Qatar Gas Transport Co. Ltd. | 151,402 | 113 |
| | Ooredoo QPSC | 46,405 | 84 |
| | Barwa Real Estate Co. | 87,894 | 82 |
| * | Doha Bank QPSC | 92,139 | 60 |
| | Vodafone Qatar QSC | 109,533 | 39 |
| | United Development Co. QSC | 80,662 | 28 |
| | Medicare Group | 10,926 | 23 |
| | | | | | | 2,883 |
| Russia (0.3%) |
| | Sberbank of Russia PJSC | 631,830 | 1,930 |
| | Polyus PJSC | 1,364 | 332 |
ESG International Stock ETF
| | | | | | Shares | Market
Value•
($000) |
| | Magnit PJSC | 4,166 | 249 |
| | Mobile TeleSystems PJSC | 41,220 | 188 |
| | Moscow Exchange MICEX-RTS PJSC | 77,780 | 144 |
| | Inter RAO UES PJSC | 1,910,000 | 135 |
| | Novolipetsk Steel PJSC | 50,210 | 105 |
| | Sistema PJSFC | 270,300 | 78 |
| | VTB Bank PJSC GDR | 84,419 | 77 |
| | PhosAgro PJSC | 2,035 | 76 |
| | Detsky Mir PJSC | 46,470 | 73 |
| | Polyus PJSC GDR | 557 | 68 |
| | Rostelecom PJSC | 48,710 | 64 |
| | Mobile TeleSystems PJSC ADR | 5,794 | 54 |
| | RusHydro PJSC | 5,089,000 | 50 |
| | VTB Bank PJSC | 92,410,000 | 44 |
| | Aeroflot PJSC | 33,650 | 37 |
| | OGK-2 PJSC | 3,581,000 | 36 |
| | M.Video PJSC | 4,770 | 36 |
| | ENEL RUSSIA PJSC | 2,829,000 | 35 |
| | TGC-1 PJSC | 209,400,000 | 33 |
| | Unipro PJSC | 864,000 | 31 |
| | ROSSETI PJSC | 1,524,000 | 30 |
| | Rosseti Lenenergo PJSC Preference Shares | 14,320 | 29 |
| | Federal Grid Co. Unified Energy System PJSC | 3,960,000 | 10 |
| | Mosenergo PJSC | 327,000 | 9 |
| | | | | | | 3,953 |
| Saudi Arabia (0.4%) |
| | Saudi Basic Industries Corp. | 53,958 | 1,266 |
| | Al Rajhi Bank | 72,355 | 1,251 |
| | National Commercial Bank | 82,166 | 815 |
| * | Saudi Arabian Mining Co. | 21,904 | 230 |
| | Almarai Co. JSC | 14,509 | 208 |
| | Savola Group | 15,276 | 198 |
| * | Etihad Etisalat Co. | 24,115 | 172 |
| | Arriyadh Development Co. | 29,645 | 130 |
| | Saudi Airlines Catering Co. | 5,600 | 120 |
| | Abdullah Al Othaim Markets Co. | 3,091 | 103 |
| | Saudia Dairy & Foodstuff Co. | 1,634 | 80 |
| | Yanbu Cement Co. | 8,984 | 79 |
| | Sahara International Petrochemical Co. | 18,413 | 78 |
| | Saudi Ground Services Co. | 9,489 | 77 |
| | Arabian Centres Co. Ltd. | 10,712 | 73 |
| * | Fawaz Abdulaziz Al Hokair & Co. | 10,026 | 60 |
| * | National Industrialization Co. | 17,469 | 55 |
| | | | | | | 4,995 |
| | | | | | Shares | Market
Value•
($000) |
| Singapore (0.8%) |
| | DBS Group Holdings Ltd. | 118,800 | 1,821 |
| | Oversea-Chinese Banking Corp. Ltd. | 209,900 | 1,336 |
| | United Overseas Bank Ltd. | 83,500 | 1,197 |
| | Singapore Telecommunications Ltd. (XSES) | 434,800 | 734 |
| | Singapore Exchange Ltd. | 84,300 | 533 |
| * | CapitaLand Ltd. | 213,100 | 433 |
| | Wilmar International Ltd. | 132,687 | 424 |
| | City Developments Ltd. | 69,200 | 408 |
| * | UOL Group Ltd. | 80,500 | 388 |
| | ComfortDelGro Corp. Ltd. | 305,900 | 332 |
| | Singapore Press Holdings Ltd. | 248,000 | 198 |
| | Mapletree Logistics Trust | 118,300 | 180 |
| | Singapore Airlines Ltd. | 64,700 | 173 |
| | Keppel DC REIT | 59,128 | 126 |
| | Venture Corp. Ltd. | 8,000 | 117 |
| | Frasers Logistics & Commercial Trust | 109,789 | 108 |
| | NetLink NBN Trust | 102,000 | 73 |
| | SATS Ltd. | 23,700 | 52 |
| | Ascendas India Trust | 51,300 | 50 |
| | Sembcorp Industries Ltd. | 35,600 | 49 |
| | Frasers Centrepoint Trust | 25,400 | 47 |
| * | Sembcorp Marine Ltd. | 299,500 | 45 |
| | Manulife US REIT | 57,294 | 43 |
| | Keppel Infrastructure Trust | 76,700 | 31 |
| | Parkway Life REIT | 11,300 | 31 |
| | ESR-REIT | 98,161 | 29 |
| | CapitaLand Retail China Trust | 31,800 | 27 |
| | Singapore Post Ltd. | 36,200 | 19 |
| | StarHub Ltd. | 21,100 | 19 |
| | Golden Agri-Resources Ltd. | 168,800 | 18 |
| | Sabana Shari'ah Compliant Industrial REIT | 61,100 | 17 |
| | CDL Hospitality Trusts | 20,800 | 16 |
| | First REIT | 44,200 | 16 |
| | First Resources Ltd. | 15,300 | 15 |
| | Soilbuild Business Space REIT | 47,100 | 15 |
| | Hutchison Port Holdings Trust | 129,400 | 14 |
| | Olam International Ltd. | 14,300 | 14 |
| | Raffles Medical Group Ltd. | 23,700 | 14 |
| | Lippo Malls Indonesia Retail Trust | 145,300 | 12 |
| | Far East Hospitality Trust | 30,500 | 12 |
| | Accordia Golf Trust | 20,100 | 11 |
| | Singapore Telecommunications Ltd. | 6,300 | 11 |
ESG International Stock ETF
| | | | | | Shares | Market
Value•
($000) |
| | AIMS APAC REIT | 11,300 | 10 |
| | ARA LOGOS Logistics Trust | 19,000 | 9 |
| *,1 | Eagle Hospitality Trust | 38,000 | 5 |
| * | Yoma Strategic Holdings Ltd. | 20,000 | 4 |
| 1 | Best World International Ltd. | 3,000 | 3 |
| * | Sembcorp Marine Ltd. Rights Exp. 09/02/2020 | 561,000 | — |
| | | | | | | 9,239 |
| South Africa (1.1%) |
| | Naspers Ltd. | 26,400 | 4,814 |
| | FirstRand Ltd. | 322,470 | 717 |
| | Gold Fields Ltd. | 53,794 | 704 |
| | Standard Bank Group Ltd. | 84,505 | 525 |
| | Impala Platinum Holdings Ltd. | 52,089 | 480 |
| | Bid Corp. Ltd. | 28,281 | 466 |
| | Sanlam Ltd. | 112,466 | 362 |
| | Capitec Bank Holdings Ltd. | 6,428 | 316 |
| | Clicks Group Ltd. | 23,289 | 315 |
| | Vodacom Group Ltd. | 38,625 | 291 |
| | Bidvest Group Ltd. | 34,219 | 273 |
| | Anglo American Platinum Ltd. | 3,494 | 260 |
| | Shoprite Holdings Ltd. | 39,604 | 258 |
| | Absa Group Ltd. | 55,177 | 250 |
| | SPAR Group Ltd. | 25,680 | 245 |
| | Remgro Ltd. | 46,423 | 239 |
| | AVI Ltd. | 57,647 | 234 |
| | Foschini Group Ltd. | 49,020 | 221 |
| * | Harmony Gold Mining Co. Ltd. | 28,364 | 184 |
| | Old Mutual Ltd. | 277,970 | 183 |
| | Mr Price Group Ltd. | 26,027 | 177 |
| | Growthpoint Properties Ltd. | 242,761 | 175 |
| | Nedbank Group Ltd. | 29,574 | 167 |
| | Tiger Brands Ltd. | 16,213 | 165 |
| * | Northam Platinum Ltd. | 17,120 | 162 |
| * | Aspen Pharmacare Holdings Ltd. | 18,628 | 149 |
| * | MultiChoice Group | 22,797 | 130 |
| | Discovery Ltd. | 15,265 | 109 |
| | NEPI Rockcastle plc | 21,355 | 100 |
| | Kumba Iron Ore Ltd. | 2,524 | 79 |
| | Redefine Properties Ltd. | 431,631 | 63 |
| | PSG Group Ltd. | 18,993 | 50 |
| | African Rainbow Minerals Ltd. | 3,638 | 46 |
| | Imperial Logistics Ltd. | 21,373 | 43 |
| | DRDGOLD Ltd. | 24,680 | 37 |
| * | Sappi Ltd. | 27,516 | 36 |
| | | | | | Shares | Market
Value•
($000) |
| | Life Healthcare Group Holdings Ltd. | 36,479 | 35 |
| | Pick n Pay Stores Ltd. | 12,743 | 31 |
| | Woolworths Holdings Ltd. | 16,628 | 31 |
| | Netcare Ltd. | 40,786 | 30 |
| | Rand Merchant Investment Holdings Ltd. | 16,193 | 29 |
| | Transaction Capital Ltd. | 22,385 | 24 |
| | JSE Ltd. | 2,651 | 19 |
| | Resilient REIT Ltd. | 8,399 | 19 |
| * | Super Group Ltd. | 16,852 | 18 |
| | Fortress REIT Ltd. Class A | 23,070 | 17 |
| | AECI Ltd. | 3,214 | 16 |
| | Telkom SA SOC Ltd. | 11,863 | 16 |
| | KAP Industrial Holdings Ltd. | 97,643 | 16 |
| | Barloworld Ltd. | 3,920 | 14 |
| | Truworths International Ltd. | 7,419 | 13 |
| | DataTec Ltd. | 9,473 | 12 |
| | Coronation Fund Managers Ltd. | 4,546 | 11 |
| | Liberty Holdings Ltd. | 2,847 | 10 |
| | Santam Ltd. | 637 | 9 |
| | Momentum Metropolitan Holdings | 10,419 | 9 |
| 2 | Dis-Chem Pharmacies Ltd. | 8,756 | 9 |
| | RMB Holdings Ltd. | 102,058 | 7 |
| | EPP NV | 15,500 | 7 |
| | Motus Holdings Ltd. | 3,936 | 6 |
| | Hyprop Investments Ltd. | 5,458 | 6 |
| | Astral Foods Ltd. | 453 | 4 |
| * | Massmart Holdings Ltd. | 2,664 | 4 |
| | SA Corporate Real Estate Ltd. | 52,269 | 3 |
| | Lewis Group Ltd. | 2,090 | 2 |
| * | Nampak Ltd. | 14,448 | 1 |
| * | PPC Ltd. | 14,109 | 1 |
| | | | | | | 13,454 |
| South Korea (3.6%) |
| | Samsung Electronics Co. Ltd. | 268,067 | 12,172 |
| | Samsung Electronics Co. Ltd. Preference Shares | 83,134 | 3,321 |
| | NAVER Corp. | 8,130 | 2,201 |
| | SK Hynix Inc. | 32,068 | 2,027 |
| | LG Chem Ltd. | 3,019 | 1,878 |
| * | Celltrion Inc. | 6,468 | 1,614 |
| | Samsung SDI Co. Ltd. | 3,231 | 1,227 |
| | Kakao Corp. | 3,201 | 1,094 |
| | KB Financial Group Inc. | 23,892 | 741 |
| | Hyundai Mobis Co. Ltd. | 3,924 | 734 |
| | Shinhan Financial Group Co. Ltd. | 28,389 | 707 |
ESG International Stock ETF
| | | | | | Shares | Market
Value•
($000) |
| | LG Household & Health Care Ltd. | 552 | 684 |
| *,2 | Samsung Biologics Co. Ltd. | 801 | 523 |
| | Hana Financial Group Inc. | 17,850 | 422 |
| | LG Electronics Inc. | 5,524 | 391 |
| * | Celltrion Healthcare Co. Ltd. | 4,232 | 356 |
| | LG Corp. | 4,903 | 341 |
| | Samsung Electro-Mechanics Co. Ltd. | 3,089 | 323 |
| | Samsung Fire & Marine Insurance Co. Ltd. | 1,891 | 297 |
| | Mirae Asset Daewoo Co. Ltd. | 36,079 | 282 |
| | Samsung SDS Co. Ltd. | 1,875 | 248 |
| | Woori Financial Group Inc. | 33,358 | 237 |
| | CJ CheilJedang Corp. | 659 | 225 |
| | Coway Co. Ltd. | 3,064 | 206 |
| | Amorepacific Corp. | 1,392 | 196 |
| | Seegene Inc. | 867 | 193 |
| | Samsung Securities Co. Ltd. | 7,101 | 180 |
| | Samsung Life Insurance Co. Ltd. | 3,503 | 180 |
| | SK Telecom Co. Ltd. | 729 | 152 |
| | BNK Financial Group Inc. | 34,786 | 148 |
| | Green Cross Corp. | 636 | 142 |
| * | Genexine Co. Ltd. | 917 | 138 |
| | Hanwha Solutions Corp. | 4,071 | 137 |
| | SK Telecom Co. Ltd. ADR | 5,766 | 132 |
| | Industrial Bank of Korea | 18,629 | 127 |
| * | LG Display Co. Ltd. | 10,337 | 127 |
| | Hanjin Kal Corp. | 1,977 | 126 |
| | Lotte Chemical Corp. | 775 | 123 |
| *,2 | Netmarble Corp. | 870 | 122 |
| | Hyundai Glovis Co. Ltd. | 952 | 116 |
| * | Samsung Heavy Industries Co. Ltd. | 26,059 | 113 |
| | Amorepacific Corp. Preference Shares | 2,230 | 112 |
| | Hankook Tire & Technology Co. Ltd. | 4,501 | 112 |
| * | KMW Co. Ltd. | 1,667 | 107 |
| | SK Securities Co. Ltd. | 168,085 | 106 |
| | LG Innotek Co. Ltd. | 851 | 104 |
| | LG Uplus Corp. | 10,240 | 103 |
| | Hanmi Pharm Co. Ltd. | 392 | 101 |
| | DB Insurance Co. Ltd. | 2,730 | 100 |
| | Hyundai Steel Co. | 4,196 | 88 |
| * | Samsung Engineering Co. Ltd. | 9,307 | 88 |
| | Douzone Bizon Co. Ltd. | 1,024 | 87 |
| | Sam Young Electronics Co. Ltd. | 11,789 | 83 |
| | Hanon Systems | 7,495 | 81 |
| | | | | | Shares | Market
Value•
($000) |
| | DB HiTek Co. Ltd. | 2,669 | 80 |
| | Chong Kun Dang Pharmaceutical Corp. | 485 | 79 |
| | LEENO Industrial Inc. | 690 | 74 |
| | Bukwang Pharmaceutical Co. Ltd. | 2,284 | 73 |
| | POSCO Chemical Co. Ltd. | 941 | 70 |
| * | HMM Co. Ltd. | 13,811 | 67 |
| | Kumho Petrochemical Co. Ltd. | 798 | 67 |
| * | Pharmicell Co. Ltd. | 3,430 | 65 |
| | Lotte Corp. | 2,544 | 64 |
| * | Hanall Biopharma Co. Ltd. | 2,211 | 64 |
| | Hyundai Marine & Fire Insurance Co. Ltd. | 3,399 | 63 |
| * | Hansol Holdings Co. Ltd. | 21,213 | 62 |
| * | Eusu Holdings Co. Ltd. | 13,318 | 62 |
| | AMOREPACIFIC Group | 1,428 | 61 |
| | Com2uSCorp | 643 | 60 |
| * | CJ Logistics Corp. | 466 | 59 |
| | Korea Asset In Trust Co. Ltd. | 19,799 | 59 |
| | Youlchon Chemical Co. Ltd. | 4,389 | 57 |
| | Ilyang Pharmaceutical Co. Ltd. | 837 | 57 |
| | DGB Financial Group Inc. | 12,506 | 56 |
| | S-1 Corp. | 754 | 55 |
| | KISCO Corp. | 14,830 | 55 |
| | Ecopro BM Co. Ltd. | 422 | 55 |
| | Hansol Chemical Co. Ltd. | 395 | 54 |
| | JB Financial Group Co. Ltd. | 15,012 | 54 |
| | DB Financial Investment Co. Ltd. | 17,248 | 53 |
| | Koh Young Technology Inc. | 700 | 53 |
| | DoubleUGames Co. Ltd. | 858 | 53 |
| | LG Electronics Inc. Preference Shares | 1,903 | 52 |
| | Hyundai Elevator Co. Ltd. | 1,469 | 51 |
| | Eugene Investment & Securities Co. Ltd. | 16,946 | 51 |
| | Samchully Co. Ltd. | 817 | 50 |
| | SK Materials Co. Ltd. | 235 | 49 |
| | KIWOOM Securities Co. Ltd. | 540 | 49 |
| | Daewoong Co. Ltd. | 1,595 | 48 |
| | Kolmar Korea Holdings Co. Ltd. | 2,068 | 48 |
| | Samyang Corp. | 836 | 47 |
| * | Hugel Inc. | 344 | 47 |
| | Eo Technics Co. Ltd. | 486 | 46 |
| * | OCI Co. Ltd. | 852 | 46 |
| *,1 | Lotte Tour Development Co. Ltd. | 2,873 | 46 |
| | Hyundai Department Store Co. Ltd. | 1,007 | 45 |
ESG International Stock ETF
| | | | | | Shares | Market
Value•
($000) |
| | JYP Entertainment Corp. | 1,555 | 45 |
| | Cheil Worldwide Inc. | 2,880 | 44 |
| * | Binex Co. Ltd. | 1,451 | 44 |
| | LG Household & Health Care Ltd. Preference Shares | 73 | 43 |
| | Mando Corp. | 1,639 | 43 |
| | KC Co. Ltd. | 2,474 | 42 |
| | NH Investment & Securities Co. Ltd. | 5,595 | 42 |
| | Meritz Fire & Marine Insurance Co. Ltd. | 3,925 | 42 |
| | Lotte Shopping Co. Ltd. | 626 | 40 |
| * | Enzychem Lifesciences Corp. | 344 | 40 |
| | Hanil Cement Co. Ltd. | 597 | 40 |
| | E1 Corp. | 958 | 39 |
| | Hanssem Co. Ltd. | ��� 478 | 39 |
| | BGF retail Co. Ltd. | 359 | 39 |
| | Daishin Securities Co. Ltd. | 4,420 | 38 |
| | Modetour Network Inc. | 3,999 | 38 |
| 1 | Taeyoung Engineering & Construction Co. Ltd. | 2,105 | 38 |
| | Ecopro Co. Ltd. | 957 | 38 |
| * | Mezzion Pharma Co. Ltd. | 269 | 38 |
| * | Inscobee Inc. | 20,202 | 37 |
| | Samyang Holdings Corp. | 688 | 37 |
| | Cosmax Inc. | 428 | 37 |
| * | SFA Semicon Co. Ltd. | 8,334 | 35 |
| | Korean Reinsurance Co. | 5,607 | 35 |
| | Samsung Card Co. Ltd. | 1,450 | 35 |
| | Dae Han Flour Mills Co. Ltd. | 236 | 34 |
| * | SBS Media Holdings Co. Ltd. | 21,095 | 34 |
| | NS Shopping Co. Ltd. | 3,459 | 34 |
| * | WONIK IPS Co. Ltd. | 1,267 | 34 |
| | Interpark Corp. | 19,256 | 33 |
| | Dongwon Industries Co. Ltd. | 174 | 33 |
| | L&F Co. Ltd. | 926 | 33 |
| * | LegoChem Biosciences Inc. | 734 | 33 |
| * | ST Pharm Co. Ltd. | 603 | 33 |
| * | GemVax & Kael Co. Ltd. | 1,713 | 32 |
| * | HLB Life Science Co. Ltd. | 2,140 | 32 |
| | Youngone Corp. | 1,194 | 32 |
| | Hansol Paper Co. Ltd. | 2,818 | 32 |
| | Samsung Fire & Marine Insurance Co. Ltd. Preference Shares | 286 | 31 |
| * | Aprogen pharmaceuticals Inc. | 23,400 | 31 |
| | Ahnlab Inc. | 576 | 31 |
| * | Korea Line Corp. | 2,290 | 31 |
| | NICE Holdings Co. Ltd. | 1,978 | 31 |
| | Posco ICT Co. Ltd. | 8,529 | 31 |
| | | | | | Shares | Market
Value•
($000) |
| | KC Tech Co. Ltd. | 1,832 | 31 |
| * | ABLBio Inc. | 1,033 | 31 |
| * | Duk San Neolux Co. Ltd. | 1,094 | 31 |
| | Jusung Engineering Co. Ltd. | 5,447 | 30 |
| | Huchems Fine Chemical Corp. | 1,974 | 30 |
| * | CUROCOM Co. Ltd. | 15,418 | 30 |
| * | Gamevil Inc. | 1,069 | 30 |
| | Kolmar Korea Co. Ltd. | 787 | 30 |
| | F&F Co. Ltd. | 362 | 29 |
| | Hanjin Transportation Co. Ltd. | 786 | 29 |
| 1 | DongKook Pharmaceutical Co. Ltd. | 225 | 29 |
| | Hyundai Home Shopping Network Corp. | 528 | 29 |
| | Maeil Dairies Co. Ltd. | 514 | 29 |
| | Zinus Inc. | 413 | 29 |
| | Binggrae Co. Ltd. | 566 | 28 |
| | TK Corp. | 5,057 | 28 |
| | Sebang Global Battery Co. Ltd. | 1,217 | 28 |
| | NICE Information Service Co. Ltd. | 1,830 | 28 |
| | Dong-A Socio Holdings Co. Ltd. | 303 | 28 |
| | IS Dongseo Co. Ltd. | 743 | 28 |
| | Korea Real Estate Investment & Trust Co. Ltd. | 19,485 | 28 |
| * | Yuanta Securities Korea Co. Ltd. | 11,217 | 28 |
| * | Innox Advanced Materials Co. Ltd. | 658 | 28 |
| * | NHN Corp. | 442 | 27 |
| | Doosan Bobcat Inc. | 1,158 | 26 |
| | LOTTE Fine Chemical Co. Ltd. | 694 | 26 |
| * | Webzen Inc. | 892 | 26 |
| | Toptec Co. Ltd. | 1,853 | 26 |
| * | Amicogen Inc. | 757 | 26 |
| | It's Hanbul Co. Ltd. | 1,102 | 26 |
| | GS Home Shopping Inc. | 251 | 25 |
| * | Dongkuk Steel Mill Co. Ltd. | 4,757 | 25 |
| * | Komipharm International Co. Ltd. | 1,947 | 25 |
| * | Hansol Technics Co. Ltd. | 3,342 | 25 |
| * | Samsung Pharmaceutical Co. Ltd. | 7,549 | 25 |
| * | CrystalGenomics Inc. | 1,451 | 25 |
| | Cuckoo Homesys Co. Ltd. | 696 | 25 |
| * | Ananti Inc. | 3,082 | 24 |
| | Sangsangin Co. Ltd. | 4,852 | 24 |
| | LS Electric Co. Ltd. | 520 | 24 |
ESG International Stock ETF
| | | | | | Shares | Market
Value•
($000) |
| | Sam Chun Dang Pharm Co. Ltd. | 490 | 24 |
| * | Able C&C Co. Ltd. | 3,778 | 24 |
| * | Oscotec Inc. | 862 | 24 |
| | Iljin Materials Co. Ltd. | 565 | 24 |
| * | YG Entertainment Inc. | 616 | 24 |
| | Korea Electric Terminal Co. Ltd. | 619 | 23 |
| * | Wonik Holdings Co. Ltd. | 6,264 | 23 |
| | Dongjin Semichem Co. Ltd. | 839 | 23 |
| * | DIO Corp. | 1,074 | 23 |
| * | BH Co. Ltd. | 1,372 | 23 |
| * | G-treeBNT Co. Ltd. | 926 | 23 |
| | GOLFZON Co. Ltd. | 418 | 23 |
| | Daou Technology Inc. | 1,323 | 22 |
| | Kyobo Securities Co. Ltd. | 3,886 | 22 |
| | NEPES Corp. | 891 | 22 |
| | Hana Tour Service Inc. | 693 | 22 |
| | Daea TI Co. Ltd. | 4,255 | 22 |
| | KTB Investment & Securities Co. Ltd. | 10,035 | 22 |
| | Namyang Dairy Products Co. Ltd. | 97 | 22 |
| * | COSON Co. Ltd. | 8,045 | 22 |
| | Sindoh Co. Ltd. | 1,212 | 22 |
| * | CJ CGV Co. Ltd. | 1,181 | 22 |
| * | Seobu T&D | 4,039 | 22 |
| * | Hancom Inc. | 1,349 | 22 |
| * | Cafe24 Corp. | 363 | 22 |
| | Hanil Holdings Co. Ltd. | 540 | 21 |
| | SPC Samlip Co. Ltd. | 409 | 21 |
| * | Humax Co. Ltd. | 5,470 | 21 |
| | Silicon Works Co. Ltd. | 558 | 21 |
| | Innocean Worldwide Inc. | 461 | 21 |
| * | Soulbrain Co. Ltd. | 115 | 21 |
| | SK Gas Ltd. | 252 | 20 |
| | Seoul Semiconductor Co. Ltd. | 1,472 | 20 |
| | Ssangyong Cement Industrial Co. Ltd. | 4,172 | 20 |
| * | Neowiz | 774 | 20 |
| | Mirae Asset Life Insurance Co. Ltd. | 6,228 | 20 |
| * | SM Entertainment Co. Ltd. | 641 | 19 |
| * | Hanwha Investment & Securities Co. Ltd. | 12,582 | 19 |
| | Green Cross Holdings Corp. | 840 | 19 |
| | Daewoong Pharmaceutical Co. Ltd. | 200 | 19 |
| * | Kumho Tire Co. Inc. | 6,067 | 19 |
| | Partron Co. Ltd. | 2,262 | 19 |
| | Shinsegae International Inc. | 167 | 19 |
| | Huons Co. Ltd. | 315 | 19 |
| | | | | | Shares | Market
Value•
($000) |
| | Hyundai Mipo Dockyard Co. Ltd. | 694 | 18 |
| * | Insun ENT Co. Ltd. | 2,089 | 18 |
| * | Medipost Co. Ltd. | 756 | 18 |
| | KT Skylife Co. Ltd. | 2,452 | 18 |
| * | Coreana Cosmetics Co. Ltd. | 4,004 | 17 |
| * | Asiana Airlines Inc. | 4,657 | 17 |
| | Samwha Capacitor Co. Ltd. | 380 | 17 |
| | Daesang Corp. | 684 | 17 |
| | INTOPS Co. Ltd. | 1,295 | 17 |
| | Hyundai Greenfood Co. Ltd. | 2,759 | 17 |
| * | Yungjin Pharmaceutical Co. Ltd. | 2,960 | 17 |
| | Taekwang Industrial Co. Ltd. | 31 | 17 |
| * | Lumens Co. Ltd. | 12,770 | 17 |
| * | Osstem Implant Co. Ltd. | 544 | 17 |
| | iMarketKorea Inc. | 2,649 | 17 |
| | Dong-A ST Co. Ltd. | 211 | 17 |
| * | Hyosung Heavy Industries Corp. | 457 | 17 |
| | Hankook Technology Group Co. Ltd. | 1,208 | 16 |
| | Kwang Dong Pharmaceutical Co. Ltd. | 1,993 | 16 |
| | Korea Petrochemical Ind Co. Ltd. | 162 | 16 |
| | LG Chem Ltd. Preference Shares | 52 | 16 |
| | CJ Freshway Corp. | 1,235 | 16 |
| | HS Industries Co. Ltd. | 2,693 | 16 |
| | Nexen Tire Corp. | 3,685 | 16 |
| | Halla Holdings Corp. | 703 | 16 |
| | Wemade Co. Ltd. | 534 | 16 |
| | Hanwha Life Insurance Co. Ltd. | 12,288 | 16 |
| | Advanced Process Systems Corp. | 837 | 16 |
| * | Peptron Inc. | 949 | 16 |
| * | Naturecell Co. Ltd. | 1,694 | 15 |
| | InBody Co. Ltd. | 1,128 | 15 |
| | KISWIRE Ltd. | 1,290 | 15 |
| *,1 | KONA I Co. Ltd. | 1,364 | 15 |
| * | CMG Pharmaceutical Co. Ltd. | 3,943 | 15 |
| | Huons Global Co. Ltd. | 507 | 15 |
| | Woongjin Thinkbig Co. Ltd. | 6,611 | 15 |
| | LG Hausys Ltd. | 309 | 15 |
| * | Telcon RF Pharmaceutical Inc. | 3,343 | 15 |
| * | Anterogen Co. Ltd. | 291 | 15 |
| | Handsome Co. Ltd. | 539 | 14 |
| * | KH Vatec Co. Ltd. | 759 | 14 |
ESG International Stock ETF
| | | | | | Shares | Market
Value•
($000) |
| * | Hanwha General Insurance Co. Ltd. | 6,091 | 14 |
| | Kolon Industries Inc. | 506 | 14 |
| | i-SENS Inc. | 589 | 14 |
| | Harim Holdings Co. Ltd. | 2,625 | 14 |
| | Sungwoo Hitech Co. Ltd. | 5,271 | 13 |
| | KCC Corp. | 110 | 13 |
| | SL Corp. | 1,287 | 13 |
| | Cell Biotech Co. Ltd. | 977 | 13 |
| | Dae Hwa Pharmaceutical Co. Ltd. | 783 | 13 |
| * | Homecast Co. Ltd. | 4,311 | 13 |
| | Young Poong Corp. | 31 | 13 |
| * | Dentium Co. Ltd. | 406 | 13 |
| * | STCUBE | 1,613 | 12 |
| | Daekyo Co. Ltd. | 3,519 | 12 |
| | TES Co. Ltd. | 687 | 12 |
| | Vieworks Co. Ltd. | 424 | 12 |
| | ICD Co. Ltd. | 931 | 12 |
| | Hyosung Chemical Corp. | 146 | 12 |
| | Hyosung TNC Co. Ltd. | 147 | 12 |
| | PI Advanced Materials Co. Ltd. | 497 | 12 |
| | Jeil Pharmaceutical Co. Ltd. | 254 | 12 |
| * | Kuk-il Paper Manufacturing Co. Ltd. | 2,899 | 12 |
| | Mcnex Co. Ltd. | 419 | 12 |
| * | Byucksan Corp. | 5,036 | 11 |
| | JW Pharmaceutical Corp. | 333 | 11 |
| | Green Cross Cell Corp. | 286 | 11 |
| | Dongwon F&B Co. Ltd. | 75 | 11 |
| * | Interflex Co. Ltd. | 1,048 | 11 |
| | Youngone Holdings Co. Ltd. | 323 | 10 |
| | Chongkundang Holdings Corp. | 97 | 10 |
| * | Hyundai Construction Equipment Co. Ltd. | 572 | 10 |
| | Tongyang Inc. | 9,624 | 9 |
| | Foosung Co. Ltd. | 1,294 | 9 |
| * | Eutilex Co. Ltd. | 280 | 9 |
| * | Hyosung Advanced Materials Corp. | 74 | 8 |
| | Daeduck Co. Ltd. | 1,291 | 7 |
| | Songwon Industrial Co. Ltd. | 652 | 7 |
| | Meritz Financial Group Inc. | 927 | 7 |
| * | GNCO Co. Ltd. | 5,594 | 6 |
| | Soulbrain Holdings Co. Ltd. | 142 | 6 |
| * | Lutronic Corp. | 1,359 | 6 |
| * | Vidente Co. Ltd. | 1,044 | 6 |
| * | Feelux Co. Ltd. | 1,807 | 5 |
| * | Lock&Lock Co. Ltd. | 549 | 5 |
| | | | | | Shares | Market
Value•
($000) |
| * | NKMax Co. Ltd. | 397 | 5 |
| * | iNtRON Biotechnology Inc. | 283 | 4 |
| * | Ssangyong Motor Co. | 912 | 3 |
| *,1 | Cellumed Co. Ltd. | 685 | 3 |
| | Hansae Co. Ltd. | 229 | 3 |
| *,1 | Yuyang DNU Co. Ltd. | 2,639 | 3 |
| | AK Holdings Inc. | 111 | 2 |
| | LF Corp. | 230 | 2 |
| | Humedix Co. Ltd. | 87 | 2 |
| | Namhae Chemical Corp. | 198 | 1 |
| * | Agabang&Company | 560 | 1 |
| *,1 | Esmo Corp. | 3,938 | 1 |
| | Hyundai Livart Furniture Co. Ltd. | 55 | 1 |
| | | | | | | 43,189 |
| Spain (1.1%) |
| | Banco Santander SA (XMAD) | 1,009,748 | 2,248 |
| | Industria de Diseno Textil SA | 65,783 | 1,850 |
| 2 | Cellnex Telecom SA | 24,012 | 1,543 |
| | Amadeus IT Group SA | 26,356 | 1,481 |
| | Banco Bilbao Vizcaya Argentaria SA | 415,427 | 1,217 |
| | Telefonica SA | 290,162 | 1,143 |
| *,2 | Aena SME SA | 4,145 | 619 |
| | CaixaBank SA | 245,205 | 539 |
| | Bankinter SA | 70,750 | 381 |
| | Grifols SA | 13,445 | 364 |
| | Grifols SA Preference Shares Class B | 18,264 | 294 |
| | Merlin Properties Socimi SA | 29,841 | 268 |
| | Banco de Sabadell SA | 417,212 | 168 |
| | Viscofan SA | 2,103 | 156 |
| | Inmobiliaria Colonial Socimi SA | 16,129 | 142 |
| | Bankia SA | 108,660 | 137 |
| * | Masmovil Ibercom SA | 4,875 | 131 |
| * | Pharma Mar SA | 845 | 86 |
| | Mapfre SA | 43,646 | 83 |
| | Acerinox SA | 6,746 | 55 |
| | Cia de Distribucion Integral Logista Holdings SA | 2,721 | 48 |
| * | Fluidra SA | 2,327 | 39 |
| | Zardoya Otis SA | 5,547 | 38 |
| | Faes Farma SA | 8,300 | 33 |
| | Bolsas y Mercados Espanoles SHMSF SA | 820 | 32 |
| *,2 | Neinor Homes SA | 1,895 | 25 |
| 2 | Euskaltel SA | 2,670 | 25 |
| | Banco Santander SA (XMEX) | 9,806 | 22 |
ESG International Stock ETF
| | | | | | Shares | Market
Value•
($000) |
| *,2 | Global Dominion Access SA | 4,542 | 19 |
| | Construcciones y Auxiliar de Ferrocarriles SA | 536 | 19 |
| *,3 | Distribuidora Internacional de Alimentacion SA | 116,250 | 16 |
| | Prosegur Cia de Seguridad SA | 6,488 | 16 |
| * | Almirall SA | 1,397 | 15 |
| * | Unicaja Banco SA | 20,814 | 15 |
| *,2 | Aedas Homes SA | 592 | 13 |
| 2 | Prosegur Cash SA | 12,332 | 10 |
| | Lar Espana Real Estate Socimi SA | 2,012 | 10 |
| | Sacyr SA | 3,614 | 8 |
| *,2 | Metrovacesa SA | 937 | 7 |
| | Ence Energia y Celulosa SA | 1,476 | 5 |
| 2 | Gestamp Automocion SA | 1,513 | 4 |
| * | Promotora de Informaciones SA Class A | 3,532 | 2 |
| | | | | | | 13,326 |
| Sweden (2.4%) |
| | Atlas Copco AB Class B | 64,588 | 2,595 |
| | Telefonaktiebolaget LM Ericsson Class B | 195,982 | 2,285 |
| * | Volvo AB Class B | 90,308 | 1,730 |
| | Assa Abloy AB Class B | 60,630 | 1,405 |
| * | Essity AB Class B | 39,789 | 1,370 |
| | Investor AB Class A | 20,562 | 1,305 |
| | Hennes & Mauritz AB Class B | 63,198 | 1,012 |
| * | Skandinaviska Enskilda Banken AB Class A | 97,351 | 965 |
| | Investor AB Class B | 14,353 | 918 |
| | Kinnevik AB Class B | 23,576 | 914 |
| * | Svenska Handelsbanken AB Class A | 88,276 | 888 |
| * | Industrivarden AB Class A | 32,675 | 871 |
| | Boliden AB | 26,635 | 796 |
| * | Svenska Cellulosa AB SCA Class B | 55,402 | 715 |
| | Epiroc AB Class A | 47,800 | 713 |
| | SKF AB Class B | 35,520 | 710 |
| * | Skanska AB Class B | 32,902 | 669 |
| | Tele2 AB Class B | 44,938 | 638 |
| | Telia Co. AB | 161,556 | 623 |
| | Castellum AB | 26,596 | 545 |
| * | Trelleborg AB Class B | 31,094 | 543 |
| | Electrolux AB Class B | 23,592 | 512 |
| * | Securitas AB Class B | 35,441 | 505 |
| 3 | Elekta AB Class B | 34,851 | 438 |
| * | Nibe Industrier AB Class B | 15,099 | 425 |
| * | Swedish Orphan Biovitrum AB | 17,002 | 382 |
| | | | | | Shares | Market
Value•
($000) |
| * | Getinge AB Class B | 15,405 | 343 |
| * | EQT AB | 12,016 | 223 |
| * | Fastighets AB Balder Class B | 4,906 | 196 |
| *,2 | Dometic Group AB | 15,584 | 192 |
| | Husqvarna AB Class B | 17,150 | 187 |
| | ICA Gruppen AB | 3,531 | 173 |
| * | AAK AB | 8,187 | 162 |
| | Nordic Entertainment Group AB Class B | 3,459 | 144 |
| * | Samhallsbyggnadsbolaget i Norden AB | 51,281 | 143 |
| | Fabege AB | 11,575 | 141 |
| | Avanza Bank Holding AB | 6,906 | 136 |
| | Beijer Ref AB | 3,362 | 134 |
| * | Holmen AB Class B | 3,637 | 130 |
| | Epiroc AB Class B | 8,743 | 126 |
| | BillerudKorsnas AB | 6,748 | 114 |
| * | L E Lundbergforetagen AB Class B | 2,455 | 112 |
| 2 | Thule Group AB | 3,284 | 104 |
| * | SSAB AB Class B | 33,058 | 102 |
| | Atlas Copco AB Class A | 2,008 | 93 |
| *,2 | Bravida Holding AB | 7,800 | 93 |
| 3 | Intrum AB | 3,593 | 91 |
| * | Loomis AB Class B | 3,625 | 91 |
| | Wihlborgs Fastigheter AB | 5,179 | 83 |
| | AddTech AB Class B | 1,574 | 82 |
| * | Hexpol AB | 9,702 | 80 |
| | JM AB | 2,472 | 76 |
| | Axfood AB | 3,365 | 74 |
| * | Sectra AB Class B | 994 | 74 |
| * | Electrolux Professional AB Class B | 16,566 | 74 |
| | Investment AB Latour Class B | 3,155 | 71 |
| * | Nolato AB Class B | 666 | 65 |
| | NCC AB Class B | 3,556 | 64 |
| * | Mycronic AB | 2,775 | 63 |
| * | Arjo AB Class B | 9,998 | 59 |
| * | Bure Equity AB | 1,799 | 56 |
| | Wallenstam AB Class B | 3,913 | 51 |
| * | Pandox AB Class B | 4,474 | 51 |
| * | Vitrolife AB | 1,844 | 50 |
| * | Hansa Biopharma AB | 1,721 | 48 |
| * | Nyfosa AB | 6,516 | 47 |
| | Kungsleden AB | 5,167 | 41 |
| | Catena AB | 856 | 35 |
| | Hufvudstaden AB Class A | 2,748 | 34 |
| * | Concentric AB | 1,692 | 33 |
| 2 | Resurs Holding AB | 6,067 | 32 |
| | Klovern AB Class B | 21,056 | 32 |
| * | Modern Times Group MTG AB Class B | 2,266 | 31 |
| | Klovern AB Preference Shares | 713 | 27 |
ESG International Stock ETF
| | | | | | Shares | Market
Value•
($000) |
| | Lindab International AB | 1,607 | 26 |
| *,2 | Munters Group AB | 3,422 | 26 |
| * | Nobia AB | 3,638 | 24 |
| * | Peab AB Class B | 2,389 | 23 |
| | Investment AB Oresund | 1,595 | 23 |
| * | Adapteo OYJ | 2,262 | 21 |
| * | Bilia AB Class A | 1,704 | 20 |
| * | Mekonomen AB | 1,764 | 19 |
| * | Kinnevik AB | 23,576 | 19 |
| | SkiStar AB | 1,521 | 18 |
| * | Ratos AB Class B | 4,064 | 16 |
| * | Svenska Handelsbanken AB Class B | 1,415 | 16 |
| | Bonava AB Class B | 2,184 | 16 |
| | Samhallsbyggnadsbolaget i Norden AB (XSTO) | 4,466 | 15 |
| * | Cloetta AB Class B | 4,552 | 13 |
| 2 | Scandic Hotels Group AB | 3,695 | 13 |
| | Clas Ohlson AB Class B | 967 | 11 |
| | Dios Fastigheter AB | 1,570 | 10 |
| * | Collector AB | 4,677 | 8 |
| *,2 | Attendo AB | 1,249 | 7 |
| *,3 | SAS AB | 6,747 | 5 |
| | | | | | | 29,484 |
| Switzerland (6.2%) |
| | Nestle SA (Registered) | 180,702 | 21,765 |
| | Roche Holding AG (XVTX) | 44,209 | 15,465 |
| | Zurich Insurance Group AG | 8,996 | 3,326 |
| | Lonza Group AG (Registered) | 4,702 | 2,922 |
| | Givaudan SA (Registered) | 598 | 2,513 |
| | UBS Group AG (Registered) | 202,713 | 2,466 |
| | Credit Suisse Group AG (Registered) | 145,258 | 1,598 |
| * | Alcon Inc. | 27,117 | 1,543 |
| | Geberit AG (Registered) | 2,453 | 1,412 |
| | Swiss Re AG | 17,301 | 1,393 |
| | Partners Group Holding AG | 1,187 | 1,209 |
| | Swiss Life Holding AG (Registered) | 2,501 | 1,011 |
| | Sonova Holding AG (Registered) | 4,280 | 1,001 |
| | Logitech International SA (Registered) | 12,194 | 903 |
| | Schindler Holding AG | 3,375 | 902 |
| | Swisscom AG (Registered) | 1,559 | 863 |
| | Straumann Holding AG (Registered) | 833 | 822 |
| | Julius Baer Group Ltd. | 16,754 | 803 |
| | Chocoladefabriken Lindt & Spruengli AG | 90 | 767 |
| | | | | | Shares | Market
Value•
($000) |
| * | Kuehne + Nagel International AG (Registered) | 3,888 | 754 |
| | Adecco Group AG (Registered) | 14,061 | 736 |
| | Temenos AG (Registered) | 4,538 | 733 |
| | Baloise Holding AG (Registered) | 4,257 | 663 |
| | Swiss Prime Site AG (Registered) | 6,901 | 622 |
| | Vifor Pharma AG | 4,201 | 621 |
| *,2 | Sunrise Communications Group AG | 4,710 | 561 |
| | Georg Fischer AG (Registered) | 495 | 492 |
| | Cembra Money Bank AG | 4,106 | 490 |
| * | Clariant AG (Registered) | 22,047 | 460 |
| 2 | Galenica AG | 6,126 | 440 |
| * | Flughafen Zurich AG (Registered) | 2,738 | 413 |
| | Roche Holding AG (XSWX) | 1,040 | 365 |
| * | Mobimo Holding AG (Registered) | 1,222 | 359 |
| | Helvetia Holding AG (Registered) | 3,668 | 346 |
| * | SIG Combibloc Group AG Class C | 17,354 | 341 |
| * | ams AG | 18,449 | 327 |
| | Tecan Group AG (Registered) | 611 | 276 |
| | Chocoladefabriken Lindt & Spruengli AG (Registered) | 3 | 265 |
| 2 | VAT Group AG | 1,320 | 258 |
| | Barry Callebaut AG (Registered) | 104 | 231 |
| | PSP Swiss Property AG (Registered) | 1,695 | 202 |
| | Belimo Holding AG (Registered) | 23 | 201 |
| | EMS-Chemie Holding AG (Registered) | 217 | 196 |
| | Banque Cantonale Vaudoise (Registered) | 1,127 | 120 |
| * | Idorsia Ltd. | 4,003 | 119 |
| | Vontobel Holding AG (Registered) | 1,262 | 93 |
| | Allreal Holding AG (Registered) | 433 | 90 |
| * | Dufry AG (Registered) | 2,631 | 80 |
| | DKSH Holding AG | 1,191 | 80 |
| | Schindler Holding AG (Registered) | 272 | 72 |
| * | Siegfried Holding AG (Registered) | 123 | 70 |
| | Interroll Holding AG (Registered) | 25 | 67 |
| | Emmi AG (Registered) | 55 | 57 |
ESG International Stock ETF
| | | | | | Shares | Market
Value•
($000) |
| | Daetwyler Holding AG | 242 | 57 |
| * | Landis+Gyr Group AG | 926 | 56 |
| | Bucher Industries AG (Registered) | 144 | 54 |
| | Inficon Holding AG (Registered) | 63 | 54 |
| | Stadler Rail AG | 1,208 | 54 |
| | Valiant Holding AG (Registered) | 546 | 52 |
| | Bachem Holding AG (Registered) Class B | 118 | 50 |
| | Berner Kantonalbank AG (Registered) | 176 | 44 |
| | Forbo Holding AG (Registered) | 24 | 40 |
| * | Aryzta AG | 54,601 | 39 |
| | OC Oerlikon Corp. AG (Registered) | 4,180 | 38 |
| | Swissquote Group Holding SA (Registered) | 421 | 37 |
| * | dormakaba Holding AG | 56 | 36 |
| | SFS Group AG | 377 | 36 |
| | VZ Holding AG | 405 | 36 |
| | St. Galler Kantonalbank AG (Registered) | 77 | 35 |
| | Schweiter Technologies AG | 21 | 29 |
| | Implenia AG (Registered) | 828 | 29 |
| | Conzzeta AG (Registered) | 28 | 29 |
| | Vetropack Holding AG (Registered) | 416 | 26 |
| * | Ascom Holding AG (Registered) | 1,893 | 25 |
| | Comet Holding AG (Registered) | 158 | 25 |
| | Leonteq AG | 595 | 24 |
| | Kardex Holding AG (Registered) | 107 | 22 |
| | LEM Holding SA (Registered) | 11 | 20 |
| | Burckhardt Compression Holding AG | 79 | 20 |
| * | Ypsomed Holding AG (Registered) | 120 | ��19 |
| | Intershop Holding AG | 28 | 18 |
| | Zehnder Group AG | 334 | 17 |
| * | Valora Holding AG (Registered) | 88 | 16 |
| * | Komax Holding AG (Registered) | 96 | 16 |
| | Liechtensteinische Landesbank AG | 240 | 16 |
| * | ALSO Holding AG (Registered) | 55 | 15 |
| * | GAM Holding AG | 5,627 | 14 |
| | | | | | Shares | Market
Value•
($000) |
| * | COSMO Pharmaceuticals NV | 59 | 6 |
| * | u-blox Holding AG | 59 | 3 |
| | | | | | | 74,991 |
| Taiwan (5.0%) |
| | Taiwan Semiconductor Manufacturing Co. Ltd. | 1,518,174 | 22,128 |
| | Hon Hai Precision Industry Co. Ltd. | 723,400 | 1,897 |
| | MediaTek Inc. | 93,104 | 1,761 |
| | Chunghwa Telecom Co. Ltd. | 224,000 | 828 |
| | Delta Electronics Inc. | 124,000 | 797 |
| | Largan Precision Co. Ltd. | 6,000 | 693 |
| | Formosa Plastics Corp. | 259,000 | 692 |
| | Nan Ya Plastics Corp. | 321,000 | 673 |
| | E.Sun Financial Holding Co. Ltd. | 719,862 | 667 |
| | Mega Financial Holding Co. Ltd. | 662,000 | 661 |
| | Uni-President Enterprises Corp. | 284,000 | 645 |
| | Cathay Financial Holding Co. Ltd. | 471,052 | 640 |
| | China Steel Corp. | 814,000 | 552 |
| | United Microelectronics Corp. | 643,000 | 463 |
| | Quanta Computer Inc. | 163,000 | 427 |
| | Taiwan Cement Corp. | 291,376 | 426 |
| | First Financial Holding Co. Ltd. | 582,616 | 422 |
| | ASE Technology Holding Co. Ltd. | 197,000 | 409 |
| | Hotai Motor Co. Ltd. | 20,000 | 408 |
| | Formosa Chemicals & Fibre Corp. | 175,000 | 405 |
| | Yuanta Financial Holding Co. Ltd. | 606,320 | 380 |
| | Taiwan Cooperative Financial Holding Co. Ltd. | 553,851 | 379 |
| | Hua Nan Financial Holdings Co. Ltd. | 592,026 | 364 |
| | Taiwan Mobile Co. Ltd. | 100,000 | 346 |
| * | Ruentex Development Co. Ltd. | 234,000 | 345 |
| | Realtek Semiconductor Corp. | 26,000 | 337 |
| | Asustek Computer Inc. | 36,000 | 298 |
| | Catcher Technology Co. Ltd. | 43,000 | 294 |
| | Shanghai Commercial & Savings Bank Ltd. | 202,000 | 288 |
| | Yageo Corp. | 25,000 | 284 |
| | WPG Holdings Ltd. | 201,680 | 283 |
| | Chailease Holding Co. Ltd. | 63,040 | 278 |
ESG International Stock ETF
| | | | | | Shares | Market
Value•
($000) |
| | President Chain Store Corp. | 30,000 | 276 |
| | Novatek Microelectronics Corp. | 33,000 | 270 |
| | Taishin Financial Holding Co. Ltd. | 591,354 | 267 |
| | Accton Technology Corp. | 33,000 | 263 |
| | Lite-On Technology Corp. | 161,000 | 255 |
| | Silergy Corp. | 4,000 | 254 |
| | Chang Hwa Commercial Bank Ltd. | 380,182 | 237 |
| | SinoPac Financial Holdings Co. Ltd. | 644,000 | 237 |
| | Foxconn Technology Co. Ltd. | 130,000 | 231 |
| | China Development Financial Holding Corp. | 786,000 | 229 |
| | Win Semiconductors Corp. | 23,000 | 225 |
| | Bank of Kaohsiung Co. Ltd. | 633,291 | 218 |
| | Pegatron Corp. | 101,000 | 215 |
| | Synnex Technology International Corp. | 139,000 | 207 |
| | Pou Chen Corp. | 216,000 | 204 |
| * | AGV Products Corp. | 758,000 | 202 |
| | Far EasTone Telecommunications Co. Ltd. | 96,000 | 201 |
| | Airtac International Group | 9,000 | 199 |
| * | Shin Kong Financial Holding Co. Ltd. | 625,411 | 177 |
| | Wistron Corp. | 160,000 | 174 |
| | Unimicron Technology Corp. | 67,000 | 168 |
| | Giant Manufacturing Co. Ltd. | 16,000 | 166 |
| | AU Optronics Corp. | 464,000 | 165 |
| | Asia Cement Corp. | 109,000 | 158 |
| | Innolux Corp. | 503,000 | 157 |
| | Micro-Star International Co. Ltd. | 33,000 | 152 |
| | Globalwafers Co. Ltd. | 11,000 | 148 |
| | Vanguard International Semiconductor Corp. | 45,000 | 143 |
| | Walsin Technology Corp. | 26,000 | 142 |
| | Parade Technologies Ltd. | 4,000 | 142 |
| | Hiwin Technologies Corp. | 12,484 | 137 |
| | Feng TAY Enterprise Co. Ltd. | 23,400 | 136 |
| | Cheng Shin Rubber Industry Co. Ltd. | 108,000 | 133 |
| | Eclat Textile Co. Ltd. | 10,000 | 132 |
| * | China Life Insurance Co. Ltd. | 180,278 | 126 |
| | Zhen Ding Technology Holding Ltd. | 30,000 | 126 |
| | | | | | Shares | Market
Value•
($000) |
| | Rich Development Co. Ltd. | 384,000 | 122 |
| | Chroma ATE Inc. | 22,000 | 121 |
| | ASMedia Technology Inc. | 2,000 | 121 |
| | Powertech Technology Inc. | 40,000 | 118 |
| | Merida Industry Co. Ltd. | 14,000 | 117 |
| | Taiwan Business Bank | 335,160 | 114 |
| | Acer Inc. | 136,000 | 108 |
| | Compal Electronics Inc. | 168,000 | 106 |
| | Senao International Co. Ltd. | 105,000 | 104 |
| | Infortrend Technology Inc. | 244,000 | 104 |
| | Inventec Corp. | 133,000 | 103 |
| | Taichung Commercial Bank Co. Ltd. | 267,633 | 102 |
| | Taiwan High Speed Rail Corp. | 89,000 | 98 |
| | Tripod Technology Corp. | 23,000 | 91 |
| | Simplo Technology Co. Ltd. | 8,000 | 91 |
| | Teco Electric & Machinery Co. Ltd. | 91,000 | 91 |
| | International Games System Co. Ltd. | 3,000 | 90 |
| | Macronix International | 87,000 | 89 |
| | Far Eastern International Bank | 227,000 | 87 |
| | Sino-American Silicon Products Inc. | 26,000 | 85 |
| | Chicony Electronics Co. Ltd. | 28,000 | 84 |
| | Tyntek Corp. | 151,000 | 83 |
| | Formosan Rubber Group Inc. | 116,000 | 82 |
| | ASPEED Technology Inc. | 2,000 | 82 |
| | Genius Electronic Optical Co. Ltd. | 4,158 | 81 |
| | Compeq Manufacturing Co. Ltd. | 54,000 | 80 |
| | Flytech Technology Co. Ltd. | 38,000 | 80 |
| | Poya International Co. Ltd. | 4,000 | 79 |
| | Taiyen Biotech Co. Ltd. | 76,000 | 79 |
| | King's Town Bank Co. Ltd. | 62,000 | 77 |
| * | Tatung Co. Ltd. | 131,000 | 77 |
| | Nanya Technology Corp. | 43,000 | 76 |
| * | Epistar Corp. | 56,000 | 76 |
| | Advanced International Multitech Co. Ltd. | 66,000 | 76 |
| * | Sunplus Technology Co. Ltd. | 178,000 | 75 |
| | Sonix Technology Co. Ltd. | 41,000 | 75 |
| | momo.com Inc. | 3,000 | 74 |
| | FSP Technology Inc. | 65,000 | 73 |
| | ITEQ Corp. | 17,950 | 73 |
| | Syncmold Enterprise Corp. | 26,000 | 73 |
ESG International Stock ETF
| | | | | | Shares | Market
Value•
($000) |
| | Gigabyte Technology Co. Ltd. | 25,000 | 72 |
| * | Evergreen Marine Corp. Taiwan Ltd. | 121,000 | 72 |
| | Kinik Co. | 33,000 | 72 |
| | Voltronic Power Technology Corp. | 2,050 | 72 |
| | eMemory Technology Inc. | 4,000 | 71 |
| | Wah Lee Industrial Corp. | 36,000 | 69 |
| | TCI Co. Ltd. | 6,297 | 69 |
| | Capital Securities Corp. | 182,000 | 68 |
| | YC INOX Co. Ltd. | 81,000 | 66 |
| | TXC Corp. | 25,000 | 66 |
| | Phison Electronics Corp. | 7,000 | 66 |
| | E Ink Holdings Inc. | 47,000 | 66 |
| | Sercomm Corp. | 24,000 | 64 |
| | Elan Microelectronics Corp. | 13,000 | 63 |
| | Eva Airways Corp. | 157,932 | 62 |
| | Test Research Inc. | 31,000 | 62 |
| * | Federal Corp. | 78,000 | 62 |
| | King Yuan Electronics Co. Ltd. | 57,000 | 61 |
| | Taiwan Surface Mounting Technology Corp. | 15,000 | 61 |
| | IBF Financial Holdings Co. Ltd. | 152,864 | 60 |
| * | Silicon Integrated Systems Corp. | 141,000 | 59 |
| | Lien Hwa Industrial Holdings Corp. | 40,890 | 59 |
| | Radiant Opto-Electronics Corp. | 16,000 | 59 |
| | Vivotek Inc. | 23,000 | 59 |
| | Elite Material Co. Ltd. | 10,000 | 58 |
| | Far Eastern Department Stores Ltd. | 66,000 | 58 |
| | Goldsun Building Materials Co. Ltd. | 78,000 | 58 |
| | Sampo Corp. | 73,000 | 58 |
| | Tung Ho Steel Enterprise Corp. | 64,000 | 58 |
| | Lotes Co. Ltd. | 4,000 | 58 |
| | Nien Made Enterprise Co. Ltd. | 5,000 | 58 |
| | Taiwan Union Technology Corp. | 14,000 | 57 |
| | Walsin Lihwa Corp. | 99,000 | 57 |
| | United Integrated Services Co. Ltd. | 8,000 | 56 |
| | Taiwan Fertilizer Co. Ltd. | 30,000 | 55 |
| | Eternal Materials Co. Ltd. | 47,000 | 55 |
| | Sinbon Electronics Co. Ltd. | 9,000 | 55 |
| | Sanyang Motor Co. Ltd. | 68,000 | 55 |
| | Jih Sun Financial Holdings Co. Ltd. | 152,450 | 54 |
| | | | | | Shares | Market
Value•
($000) |
| | Makalot Industrial Co. Ltd. | 8,100 | 54 |
| | Winbond Electronics Corp. | 130,000 | 54 |
| | Wowprime Corp. | 22,000 | 54 |
| | Topco Scientific Co. Ltd. | 13,000 | 53 |
| | Formosa Taffeta Co. Ltd. | 49,000 | 53 |
| | President Securities Corp. | 92,820 | 52 |
| | China Airlines Ltd. | 179,000 | 52 |
| | Jentech Precision Industrial Co. Ltd. | 5,000 | 52 |
| * | Lingsen Precision Industries Ltd. | 129,000 | 51 |
| * | Via Technologies Inc. | 36,000 | 51 |
| | Lite-On Semiconductor Corp. | 38,000 | 51 |
| | Great Wall Enterprise Co. Ltd. | 33,250 | 51 |
| | CyberTAN Technology Inc. | 98,000 | 51 |
| | Taiwan PCB Techvest Co. Ltd. | 35,000 | 51 |
| * | D-Link Corp. | 78,000 | 50 |
| | KEE TAI Properties Co. Ltd. | 145,000 | 50 |
| | Nan Kang Rubber Tire Co. Ltd. | 31,000 | 50 |
| * | Yang Ming Marine Transport Corp. | 145,000 | 50 |
| | Lextar Electronics Corp. | 68,000 | 50 |
| | Gloria Material Technology Corp. | 89,000 | 49 |
| | Yulon Finance Corp. | 14,300 | 49 |
| | Ichia Technologies Inc. | 84,000 | 49 |
| | Sheng Yu Steel Co. Ltd. | 79,000 | 49 |
| | Wistron NeWeb Corp. | 17,000 | 48 |
| | Posiflex Technology Inc. | 17,000 | 48 |
| * | Gold Circuit Electronics Ltd. | 27,000 | 47 |
| | Hong Pu Real Estate Development Co. Ltd. | 57,000 | 47 |
| * | Mercuries & Associates Holding Ltd. | 56,100 | 47 |
| | Pan-International Industrial Corp. | 78,000 | 47 |
| | TA Chen Stainless Pipe | 64,780 | 47 |
| | U-Ming Marine Transport Corp. | 46,000 | 47 |
| | YFY Inc. | 75,000 | 47 |
| | Chung-Hsin Electric & Machinery Manufacturing Corp. | 36,000 | 46 |
| | Standard Foods Corp. | 21,000 | 46 |
| | Formosa International Hotels Corp. | 10,000 | 45 |
| | Evergreen International Storage & Transport Corp. | 91,000 | 45 |
| | Systex Corp. | 15,000 | 45 |
ESG International Stock ETF
| | | | | | Shares | Market
Value•
($000) |
| | Global Unichip Corp. | 5,000 | 45 |
| * | Nan Ya Printed Circuit Board Corp. | 11,000 | 45 |
| | Asia Polymer Corp. | 70,350 | 44 |
| | Coretronic Corp. | 36,000 | 43 |
| | Taiwan Cogeneration Corp. | 34,000 | 43 |
| | Grape King Bio Ltd. | 7,000 | 43 |
| | Elite Semiconductor Microelectronics Technology Inc. | 35,000 | 43 |
| | ITE Technology Inc. | 17,000 | 43 |
| | Jess-Link Products Co. Ltd. | 33,000 | 43 |
| | FLEXium Interconnect Inc. | 10,000 | 43 |
| | Aten International Co. Ltd. | 15,000 | 43 |
| | Wan Hai Lines Ltd. | 60,000 | 43 |
| * | Dynamic Electronics Co. Ltd. | 71,635 | 43 |
| | Cleanaway Co. Ltd. | 8,000 | 43 |
| | Zinwell Corp. | 66,000 | 42 |
| | Hsin Kuang Steel Co. Ltd. | 41,000 | 42 |
| | Chipbond Technology Corp. | 22,000 | 42 |
| * | Motech Industries Inc. | 56,000 | 42 |
| | Test Rite International Co. Ltd. | 55,000 | 42 |
| * | Alpha Networks Inc. | 43,772 | 42 |
| | Greatek Electronics Inc. | 24,000 | 41 |
| | Global Brands Manufacture Ltd. | 61,000 | 41 |
| | Tong Hsing Electronic Industries Ltd. | 9,000 | 41 |
| * | FocalTech Systems Co. Ltd. | 36,000 | 41 |
| * | PharmaEssentia Corp. | 10,437 | 41 |
| * | Gemtek Technology Corp. | 42,000 | 40 |
| | Chong Hong Construction Co. Ltd. | 14,000 | 40 |
| | Yieh Phui Enterprise Co. Ltd. | 122,300 | 40 |
| | Hota Industrial Manufacturing Co. Ltd. | 11,000 | 39 |
| | HannStar Display Corp. | 143,000 | 39 |
| | Kindom Development Co. Ltd. | 29,000 | 39 |
| | Sincere Navigation Corp. | 71,900 | 39 |
| * | Mercuries Life Insurance Co. Ltd. | 121,000 | 39 |
| * | Yeong Guan Energy Technology Group Co. Ltd. | 11,000 | 39 |
| * | Etron Technology Inc. | 111,000 | 38 |
| * | Shining Building Business Co. Ltd. | 112,000 | 38 |
| * | Ruentex Industries Ltd. | 16,200 | 38 |
| | Taiwan Secom Co. Ltd. | 13,000 | 38 |
| | | | | | Shares | Market
Value•
($000) |
| | Advanced Ceramic X Corp. | 3,000 | 38 |
| | China Metal Products | 41,000 | 37 |
| | BES Engineering Corp. | 134,000 | 37 |
| | Merry Electronics Co. Ltd. | 7,000 | 37 |
| | Globe Union Industrial Corp. | 78,000 | 37 |
| | Huang Hsiang Construction Corp. | 28,000 | 37 |
| | Charoen Pokphand Enterprise | 16,000 | 37 |
| | Huaku Development Co. Ltd. | 12,000 | 37 |
| | Shin Zu Shing Co. Ltd. | 7,165 | 37 |
| | Lung Yen Life Service Corp. | 19,000 | 36 |
| | Run Long Construction Co. Ltd. | 15,000 | 36 |
| | Prince Housing & Development Corp. | 102,000 | 36 |
| | Weltrend Semiconductor | 36,000 | 36 |
| | Cheng Loong Corp. | 34,000 | 35 |
| | L&K Engineering Co. Ltd. | 36,000 | 35 |
| | Pixart Imaging Inc. | 6,000 | 35 |
| | Taiwan TEA Corp. | 63,000 | 35 |
| * | United Renewable Energy Co. Ltd. | 88,287 | 35 |
| | General Interface Solution Holding Ltd. | 8,000 | 35 |
| | Radium Life Tech Co. Ltd. | 96,200 | 34 |
| | Taiwan Hon Chuan Enterprise Co. Ltd. | 17,000 | 34 |
| | Soft-World International Corp. | 11,000 | 34 |
| | Lealea Enterprise Co. Ltd. | 109,000 | 34 |
| | WT Microelectronics Co. Ltd. | 25,000 | 33 |
| | OptoTech Corp. | 45,000 | 33 |
| | Shinkong Synthetic Fibers Corp. | 80,000 | 33 |
| | Foxsemicon Integrated Technology Inc. | 5,000 | 33 |
| | Clevo Co. | 32,000 | 32 |
| | Taiflex Scientific Co. Ltd. | 18,000 | 32 |
| | Taiwan Sakura Corp. | 20,000 | 32 |
| | Tong-Tai Machine & Tool Co. Ltd. | 70,000 | 31 |
| | TTY Biopharm Co. Ltd. | 13,000 | 31 |
| * | Hung Sheng Construction Ltd. | 52,000 | 31 |
| | Namchow Holdings Co. Ltd. | 21,000 | 31 |
| | Supreme Electronics Co. Ltd. | 31,000 | 31 |
| | Global Mixed Mode Technology Inc. | 6,000 | 31 |
ESG International Stock ETF
| | | | | | Shares | Market
Value•
($000) |
| | ChipMOS Technologies Inc. | 31,000 | 31 |
| | Mitac Holdings Corp. | 31,248 | 31 |
| | Cheng Uei Precision Industry Co. Ltd. | 21,000 | 30 |
| | Holtek Semiconductor Inc. | 14,000 | 30 |
| | Firich Enterprises Co. Ltd. | 32,239 | 30 |
| | Dynapack International Technology Corp. | 11,000 | 30 |
| | Ton Yi Industrial Corp. | 92,000 | 30 |
| | CHC Healthcare Group | 21,000 | 30 |
| * | Taiwan Land Development Corp. | 109,000 | 29 |
| | Li Peng Enterprise Co. Ltd. | 128,000 | 29 |
| | Center Laboratories Inc. | 10,788 | 29 |
| | Hu Lane Associate Inc. | 11,275 | 29 |
| | Yulon Motor Co. Ltd. | 34,000 | 29 |
| | Swancor Holding Co. Ltd. | 6,000 | 29 |
| | Fusheng Precision Co. Ltd. | 5,000 | 29 |
| * | Unizyx Holding Corp. | 36,000 | 28 |
| | China Electric Manufacturing Corp. | 70,600 | 28 |
| | Ho Tung Chemical Corp. | 85,000 | 28 |
| | Sporton International Inc. | 3,000 | 28 |
| | Chaun-Choung Technology Corp. | 3,000 | 28 |
| * | OBI Pharma Inc. | 7,000 | 28 |
| | Chung Hwa Pulp Corp. | 78,000 | 27 |
| | Taiwan Paiho Ltd. | 10,000 | 27 |
| * | Grand Pacific Petrochemical | 41,000 | 27 |
| | Chilisin Electronics Corp. | 8,000 | 27 |
| | Nantex Industry Co. Ltd. | 17,000 | 27 |
| | Sigurd Microelectronics Corp. | 21,000 | 27 |
| * | PChome Online Inc. | 7,000 | 27 |
| * | ALI Corp. | 32,000 | 26 |
| | Sinyi Realty Inc. | 26,000 | 26 |
| | China Petrochemical Development Corp. | 88,200 | 26 |
| | Nien Hsing Textile Co. Ltd. | 47,000 | 26 |
| | Kinsus Interconnect Technology Corp. | 12,000 | 26 |
| | Everlight Electronics Co. Ltd. | 21,000 | 25 |
| | Faraday Technology Corp. | 17,000 | 25 |
| | HTC Corp. | 24,000 | 25 |
| * | HannsTouch Solution Inc. | 73,000 | �� 25 |
| | Ardentec Corp. | 22,000 | 25 |
| * | XinTec Inc. | 6,000 | 25 |
| | LandMark Optoelectronics Corp. | 3,000 | 25 |
| | TYC Brother Industrial Co. Ltd. | 31,000 | 24 |
| | Cyberlink Corp. | 6,000 | 24 |
| | | | | | Shares | Market
Value•
($000) |
| * | Elitegroup Computer Systems Co. Ltd. | 50,000 | 24 |
| | Visual Photonics Epitaxy Co. Ltd. | 9,000 | 24 |
| | Depo Auto Parts Ind Co. Ltd. | 14,000 | 24 |
| | SDI Corp. | 15,000 | 24 |
| | Ta Ya Electric Wire & Cable | 48,000 | 24 |
| | Taiwan Styrene Monomer | 44,000 | 24 |
| | Wei Chuan Foods Corp. | 34,000 | 24 |
| | Cub Elecparts Inc. | 4,132 | 24 |
| | Chunghwa Precision Test Tech Co. Ltd. | 1,000 | 24 |
| | Brighton-Best International Taiwan Inc. | 27,000 | 24 |
| | Unitech Printed Circuit Board Corp. | 32,000 | 23 |
| | Chin-Poon Industrial Co. Ltd. | 26,000 | 23 |
| * | Phihong Technology Co. Ltd. | 68,000 | 23 |
| | Adlink Technology Inc. | 10,000 | 23 |
| | AcBel Polytech Inc. | 26,000 | 23 |
| | A-DATA Technology Co. Ltd. | 13,000 | 23 |
| | Zeng Hsing Industrial Co. Ltd. | 5,000 | 23 |
| | Qisda Corp. | 35,000 | 22 |
| | China Motor Corp. | 15,200 | 22 |
| | Asia Optical Co. Inc. | 10,000 | 22 |
| | Longchen Paper & Packaging Co. Ltd. | 36,308 | 22 |
| | Advanced Wireless Semiconductor Co. | 7,370 | 22 |
| * | Roo Hsing Co. Ltd. | 49,000 | 21 |
| * | Gigastorage Corp. | 58,986 | 21 |
| * | Orient Semiconductor Electronics Ltd. | 56,000 | 21 |
| | King Slide Works Co. Ltd. | 2,000 | 21 |
| | Chlitina Holding Ltd. | 3,000 | 21 |
| | Transcend Information Inc. | 9,000 | 20 |
| | Wafer Works Corp. | 17,000 | 20 |
| | Oriental Union Chemical Corp. | 34,000 | 20 |
| | Sitronix Technology Corp. | 4,000 | 20 |
| | Tong Yang Industry Co. Ltd. | 15,000 | 20 |
| | Gourmet Master Co. Ltd. | 6,000 | 20 |
| * | TPK Holding Co. Ltd. | 12,000 | 20 |
| | Ennoconn Corp. | 2,000 | 20 |
| | TA-I Technology Co. Ltd. | 8,000 | 19 |
| | Cathay Real Estate Development Co. Ltd. | 29,000 | 19 |
| | Rechi Precision Co. Ltd. | 28,000 | 19 |
| | Kung Long Batteries Industrial Co. Ltd. | 4,000 | 19 |
ESG International Stock ETF
| | | | | | Shares | Market
Value•
($000) |
| | Xxentria Technology Materials Corp. | 11,000 | 19 |
| * | Wisdom Marine Lines Co. Ltd. | 23,543 | 19 |
| | Topkey Corp. | 3,000 | 19 |
| | Sunonwealth Electric Machine Industry Co. Ltd. | 9,000 | 19 |
| | International CSRC Investment Holdings Co. | 25,990 | 18 |
| | Career Technology MFG. Co. Ltd. | 18,513 | 18 |
| | Taiwan FamilyMart Co. Ltd. | 2,000 | 18 |
| | USI Corp. | 40,000 | 18 |
| | WUS Printed Circuit Co. Ltd. | 16,600 | 18 |
| | Elite Advanced Laser Corp. | 8,000 | 17 |
| | Bizlink Holding Inc. | 2,000 | 17 |
| | Sunny Friend Environmental Technology Co. Ltd. | 2,000 | 17 |
| | Egis Technology Inc. | 3,000 | 17 |
| | Ability Enterprise Co. Ltd. | 36,000 | 16 |
| | IEI Integration Corp. | 10,000 | 16 |
| * | Ritek Corp. | 80,000 | 16 |
| | Taiwan Glass Industry Corp. | 42,000 | 16 |
| | Arcadyan Technology Corp. | 5,123 | 16 |
| | China General Plastics Corp. | 23,100 | 15 |
| | China Man-Made Fiber Corp. | 56,000 | 15 |
| | Pan Jit International Inc. | 12,400 | 15 |
| | Taiwan Semiconductor Co. Ltd. | 12,000 | 15 |
| | Getac Technology Corp. | 9,000 | 15 |
| | ScinoPharm Taiwan Ltd. | 13,000 | 15 |
| | Chicony Power Technology Co. Ltd. | 6,000 | 15 |
| | Kinpo Electronics | 35,000 | 14 |
| | Holy Stone Enterprise Co. Ltd. | 4,000 | 14 |
| | Tainan Spinning Co. Ltd. | 36,000 | 14 |
| | TaiDoc Technology Corp. | 2,000 | 14 |
| * | Asia Pacific Telecom Co. Ltd. | 56,779 | 14 |
| | China Steel Chemical Corp. | 4,000 | 13 |
| *,1 | Unity Opto Technology Co. Ltd. | 90,000 | 13 |
| | Kuo Toong International Co. Ltd. | 24,330 | 13 |
| | Johnson Health Tech Co. Ltd. | 5,000 | 13 |
| | | | | | Shares | Market
Value•
($000) |
| | Asia Vital Components Co. Ltd. | 5,000 | 12 |
| | Darwin Precisions Corp. | 29,000 | 11 |
| | Darfon Electronics Corp. | 8,000 | 11 |
| | Iron Force Industrial Co. Ltd. | 4,000 | 11 |
| * | Gigasolar Materials Corp. | 3,000 | 11 |
| | Concraft Holding Co. Ltd. | 3,450 | 11 |
| | St. Shine Optical Co. Ltd. | 1,000 | 10 |
| | Machvision Inc. | 1,039 | 10 |
| | YungShin Global Holding Corp. | 7,000 | 10 |
| * | Taigen Biopharmaceuticals Holdings Ltd. | 13,000 | 10 |
| | Basso Industry Corp. | 7,000 | 9 |
| | Quanta Storage Inc. | 6,000 | 9 |
| | Li Cheng Enterprise Co. Ltd. | 8,846 | 9 |
| * | CMC Magnetics Corp. | 30,114 | 8 |
| | Brogent Technologies Inc. | 2,100 | 8 |
| | UPC Technology Corp. | 17,000 | 7 |
| | Toung Loong Textile Manufacturing | 7,000 | 6 |
| * | Medigen Biotechnology Corp. | 2,000 | 5 |
| | Primax Electronics Ltd. | 3,000 | 5 |
| | Ginko International Co. Ltd. | 1,050 | 5 |
| * | Lotus Pharmaceutical Co. Ltd. | 1,000 | 3 |
| * | Tung Thih Electronic Co. Ltd. | 1,000 | 3 |
| | Casetek Holdings Ltd. | 1,000 | 3 |
| 1 | Pharmally International Holding Co. Ltd. | 1,282 | 3 |
| | Everlight Chemical Industrial Corp. | 4,000 | 2 |
| * | WT Microelectronics Co. Ltd. Rights Exp. 10/05/2020 | 3,427 | — |
| | | | | | | 59,745 |
| Thailand (0.7%) |
| | CP ALL PCL (Foreign) | 412,600 | 843 |
| | Siam Cement PCL (Foreign) | 69,500 | 791 |
| | Airports of Thailand PCL (Foreign) | 369,500 | 668 |
| | Siam Commercial Bank PCL (Foreign) | 203,800 | 477 |
| | Home Product Center PCL (Foreign) | 848,400 | 409 |
| | Kasikornbank PCL (Foreign) | 148,200 | 403 |
| | Advanced Info Service PCL (Foreign) | 66,200 | 389 |
| | Energy Absolute PCL (Foreign) | 267,600 | 362 |
ESG International Stock ETF
| | | | | | Shares | Market
Value•
($000) |
| | Carabao Group PCL (Foreign) | 93,200 | 362 |
| | Bangkok Dusit Medical Services PCL (Foreign) | 391,100 | 262 |
| | Intouch Holdings PCL (Foreign) | 113,078 | 198 |
| | Charoen Pokphand Foods PCL (Foreign) | 184,700 | 192 |
| | Thaicom PCL (Foreign) | 941,400 | 190 |
| | Central Pattana PCL (Foreign) | 122,900 | 186 |
| | Gulf Energy Development PCL (Foreign) | 179,400 | 182 |
| | Sino-Thai Engineering & Construction PCL (Foreign) | 400,200 | 169 |
| | PTT Global Chemical PCL (Foreign) | 110,700 | 165 |
| | Global Power Synergy PCL (Foreign) | 66,592 | 137 |
| * | BEC World PCL (Foreign) | 892,500 | 133 |
| | BTS Group Holdings PCL (Foreign) | 340,600 | 114 |
| | Krung Thai Bank PCL (Foreign) | 327,800 | 101 |
| | Bangkok Bank PCL (Foreign) | 21,400 | 73 |
| | Delta Electronics Thailand PCL (Foreign) | 19,700 | 73 |
| | Kiatnakin Phatra Bank PCL (Foreign) | 54,900 | 70 |
| | Electricity Generating PCL (Foreign) | 9,500 | 68 |
| | Krungthai Card PCL (Foreign) | 68,500 | 68 |
| | TMB Bank PCL (Foreign) | 2,207,124 | 67 |
| | CPN Retail Growth Leasehold REIT | 80,500 | 62 |
| | Tisco Financial Group PCL (Foreign) | 25,100 | 54 |
| | Thai Union Group PCL (Foreign) | 119,700 | 54 |
| | WHA Premium Growth Freehold & Leasehold REIT | 110,800 | 53 |
| | Indorama Ventures PCL (Foreign) | 68,000 | 52 |
| | Jasmine Broadband Internet Infrastructure Fund | 161,472 | 52 |
| * | Central Plaza Hotel PCL (Foreign) | 57,900 | 51 |
| | Bangkok Expressway & Metro PCL (Foreign) | 159,600 | 47 |
| | Com7 PCL (Foreign) | 33,200 | 44 |
| | Bumrungrad Hospital PCL (Foreign) | 12,200 | 43 |
| | | | | | Shares | Market
Value•
($000) |
| | Muangthai Capital PCL (Foreign) | 26,800 | 43 |
| | True Corp. PCL (Foreign) | 375,600 | 40 |
| | Berli Jucker PCL (Foreign) | 33,100 | 39 |
| | Siam Global House PCL (Foreign) | 58,529 | 39 |
| | Thanachart Capital PCL (Foreign) | 37,100 | 38 |
| | B Grimm Power PCL (Foreign) | 25,300 | 38 |
| | Asset World Corp. PCL (Foreign) | 282,400 | 36 |
| | Osotspa PCL (Foreign) | 26,800 | 33 |
| | Thai Vegetable Oil PCL (Foreign) | 35,700 | 31 |
| | Total Access Communication PCL (Foreign) | 26,900 | 31 |
| | KCE Electronics PCL (Foreign) | 33,400 | 31 |
| | TQM Corp. PCL (Foreign) | 7,600 | 31 |
| | Sri Trang Agro-Industry PCL (Foreign) | 35,400 | 29 |
| | Hana Microelectronics PCL (Foreign) | 22,000 | 28 |
| | WHA Corp. PCL (Foreign) | 271,500 | 28 |
| | Supalai PCL (Foreign) | 42,200 | 23 |
| | Bangkok Land PCL (Foreign) | 675,700 | 22 |
| | Samart Corp. PCL (Foreign) | 115,000 | 18 |
| | AP Thailand PCL (Foreign) | 88,200 | 18 |
| | Bangkok Airways PCL (Foreign) | 88,100 | 16 |
| | GFPT PCL (Foreign) | 36,300 | 15 |
| | SPCG PCL (Foreign) | 26,500 | 15 |
| | TPI Polene PCL (Foreign) | 295,300 | 12 |
| | VGI PCL (Foreign) | 51,200 | 12 |
| | TTW PCL (Foreign) | 28,000 | 12 |
| | Thoresen Thai Agencies PCL (Foreign) | 113,700 | 11 |
| | Tipco Asphalt PCL (Foreign) | 13,700 | 11 |
| | Jasmine International PCL (Foreign) | 114,300 | 11 |
| | Major Cineplex Group PCL (Foreign) | 18,300 | 10 |
| | AEON Thana Sinsap Thailand PCL (Foreign) | 2,800 | 10 |
| | Super Energy Corp. PCL (Foreign) | 387,600 | 10 |
| | Chularat Hospital PCL (Foreign) | 122,800 | 10 |
| | Univentures PCL (Foreign) | 96,000 | 9 |
| | TOA Paint Thailand PCL (Foreign) | 6,800 | 9 |
| | Gunkul Engineering PCL (Foreign) | 111,400 | 9 |
ESG International Stock ETF
| | | | | | Shares | Market
Value•
($000) |
| * | Group Lease PCL | 70,900 | 8 |
| | Plan B Media PCL (Foreign) | 39,700 | 7 |
| | Advanced Info Service PCL | 1,200 | 7 |
| | Thaifoods Group PCL (Foreign) | 41,800 | 6 |
| | Taokaenoi Food & Marketing PCL (Foreign) | 15,700 | 5 |
| * | Precious Shipping PCL (Foreign) | 24,700 | 4 |
| * | Thai Airways International PCL (Foreign) | 33,800 | 4 |
| | Beauty Community PCL (Foreign) | 85,000 | 4 |
| | Unique Engineering & Construction PCL (Foreign) | 17,300 | 3 |
| * | U City PCL (Foreign) | 64,000 | 3 |
| | BCPG PCL (Foreign) | 6,000 | 2 |
| | Workpoint Entertainment PCL (Foreign) | 3,100 | 1 |
| * | Gulf Energy Development PCL Rights Exp. 09/18/2020 | 16,450 | 1 |
| * | Minor International PCL Warrants Exp. 09/30/2021 | 3,645 | — |
| * | BTS Group Holdings PCL Warrants Exp. 02/16/2021 | 15,060 | — |
| | | | | | | 8,497 |
| Turkey (0.1%) |
| | Tat Gida Sanayi A/S | 139,957 | 195 |
| * | Logo Yazilim Sanayi ve Ticaret A/S | 13,959 | 177 |
| * | Yatas Yatak ve Yorgan Sanayi ve Ticaret A/S | 142,603 | 156 |
| * | Turkiye Garanti Bankasi A/S | 90,015 | 83 |
| * | Eregli Demir ve Celik Fabrikalari TAS | 54,616 | 65 |
| * | Akbank T.A.S. | 97,114 | 65 |
| * | Gubre Fabrikalari TAS | 12,258 | 50 |
| * | Zorlu Enerji Elektrik Uretim A/S | 109,551 | 40 |
| * | Aksa Enerji Uretim A/S Class B | 55,252 | 39 |
| * | Konya Cimento Sanayii A/S | 675 | 35 |
| | Turk Traktor ve Ziraat Makineleri A/S | 2,379 | 30 |
| * | Turk Hava Yollari AO | 19,932 | 29 |
| | Ford Otomotiv Sanayi A/S | 2,206 | 25 |
| * | Koza Anadolu Metal Madencilik Isletmeleri A/S | 14,046 | 25 |
| | | | | | Shares | Market
Value•
($000) |
| * | Emlak Konut Gayrimenkul Yatirim Ortakligi A/S | 101,754 | 24 |
| * | Sok Marketler Ticaret A/S | 13,618 | 24 |
| | Kardemir Karabuk Demir Celik Sanayi ve Ticaret A/S Class A | 36,287 | 22 |
| * | Bera Holding A/S | 17,692 | 21 |
| * | Turkiye Is Bankasi A/S Class C | 30,596 | 20 |
| 2 | Enerjisa Enerji A/S | 18,394 | 20 |
| * | Alarko Holding A/S | 27,754 | 19 |
| | Haci Omer Sabanci Holding A/S | 17,735 | 19 |
| | Coca-Cola Icecek A/S | 3,293 | 19 |
| * | Koza Altin Isletmeleri A/S | 1,798 | 19 |
| | AG Anadolu Grubu Holding A/S | 8,007 | 18 |
| | Aksigorta A/S | 17,334 | 17 |
| | EGE Endustri ve Ticaret A/S | 181 | 17 |
| * | Petkim Petrokimya Holding A/S | 32,626 | 17 |
| * | Turkiye Vakiflar Bankasi TAO | 30,765 | 17 |
| *,2 | Mavi Giyim Sanayi ve Ticaret A/S Class B | 2,923 | 15 |
| * | Ulker Biskuvi Sanayi A/S | 4,462 | 14 |
| | Aygaz A/S | 8,618 | 13 |
| * | Is Gayrimenkul Yatirim Ortakligi A/S | 58,322 | 13 |
| * | Yapi ve Kredi Bankasi A/S | 48,161 | 13 |
| | Brisa Bridgestone Sabanci Sanayi ve Ticaret A/S | 7,642 | 12 |
| * | Cimsa Cimento Sanayi ve Ticaret A/S | 7,525 | 12 |
| * | Pegasus Hava Tasimaciligi A/S | 1,931 | 12 |
| | Akcansa Cimento A/S | 6,754 | 11 |
| * | Torunlar Gayrimenkul Yatirim Ortakligi A/S | 22,142 | 11 |
| | Aksa Akrilik Kimya Sanayii A/S | 11,264 | 10 |
| | Anadolu Cam Sanayii A/S | 13,365 | 9 |
| | Dogan Sirketler Grubu Holding A/S | 31,140 | 9 |
| * | Sekerbank Turk A/S | 50,455 | 9 |
| *,2 | MLP Saglik Hizmetleri A/S Class B | 3,921 | 8 |
| | Tekfen Holding A/S | 3,446 | 7 |
| | Turkiye Sise ve Cam Fabrikalari A/S | 5,701 | 5 |
| | Tofas Turk Otomobil Fabrikasi A/S | 1,547 | 5 |
| * | Arcelik A/S | 1,329 | 4 |
| | TAV Havalimanlari Holding A/S | 1,847 | 4 |
ESG International Stock ETF
| | | | | | Shares | Market
Value•
($000) |
| | Soda Sanayii A/S | 3,606 | 3 |
| | | | | | | 1,506 |
| United Arab Emirates (0.2%) |
| | First Abu Dhabi Bank PJSC | 268,363 | 836 |
| | Emirates Telecommunications Group Co. PJSC | 102,311 | 461 |
| | Abu Dhabi Commercial Bank PJSC | 160,981 | 242 |
| | Aldar Properties PJSC | 179,931 | 99 |
| | Abu Dhabi Islamic Bank PJSC | 61,723 | 67 |
| | Dubai Financial Market PJSC | 269,740 | 64 |
| | Air Arabia PJSC | 150,314 | 47 |
| * | Eshraq Investments PJSC | 398,693 | 42 |
| | RAK Properties PJSC | 381,113 | 41 |
| * | DXB Entertainments PJSC | 622,903 | 20 |
| * | DAMAC Properties Dubai Co. PJSC | 79,395 | 19 |
| * | Arabtec Holding PJSC | 101,139 | 18 |
| | | | | | | 1,956 |
| United Kingdom (7.9%) |
| | AstraZeneca plc | 82,447 | 9,152 |
| | GlaxoSmithKline plc | 301,058 | 5,881 |
| | Unilever plc | 67,391 | 3,984 |
| | Reckitt Benckiser Group plc | 38,838 | 3,899 |
| | Prudential plc | 161,492 | 2,603 |
| | RELX plc | 111,633 | 2,533 |
| | Vodafone Group plc | 1,672,815 | 2,453 |
| | National Grid plc | 209,475 | 2,346 |
| | London Stock Exchange Group plc | 18,859 | 2,228 |
| | Experian plc | 56,498 | 2,111 |
| | Tesco plc | 620,432 | 1,812 |
| | Compass Group plc | 109,588 | 1,773 |
| | CRH plc (XLON) | 43,506 | 1,624 |
| | Lloyds Banking Group plc | 4,304,629 | 1,623 |
| | Barclays plc | 1,061,225 | 1,554 |
| | Ferguson plc | 14,781 | 1,449 |
| | Smith & Nephew plc | 59,733 | 1,205 |
| | Legal & General Group plc | 362,174 | 1,041 |
| | SSE plc | 61,474 | 1,036 |
| | Ashtead Group plc | 29,549 | 1,025 |
| | Segro plc | 80,177 | 1,019 |
| * | Ocado Group plc | 29,402 | 979 |
| | Rentokil Initial plc | 132,587 | 944 |
| | Halma plc | 30,177 | 895 |
| | Standard Chartered plc | 163,504 | 852 |
| | Sage Group plc | 85,673 | 846 |
| | Aviva plc | 224,215 | 845 |
| | 3i Group plc | 65,230 | 802 |
| | Bunzl plc | 24,740 | 798 |
| | | | | | Shares | Market
Value•
($000) |
| | Croda International plc | 10,122 | 797 |
| | Spirax-Sarco Engineering plc | 5,830 | 794 |
| | Persimmon plc | 22,703 | 789 |
| | Next plc | 9,503 | 761 |
| | WPP plc | 85,509 | 724 |
| | BT Group plc | 518,762 | 722 |
| | Smurfit Kappa Group plc | 20,228 | 716 |
| *,2 | Just Eat Takeaway.com NV (XLON) | 6,197 | 692 |
| | DCC plc | 7,595 | 675 |
| | Smiths Group plc | 35,113 | 652 |
| | Mondi plc | 32,661 | 643 |
| | Rightmove plc | 71,433 | 599 |
| | Kingfisher plc | 159,116 | 579 |
| | Polymetal International plc | 21,298 | 578 |
| | Admiral Group plc | 16,343 | 570 |
| 2 | Auto Trader Group plc | 74,659 | 558 |
| | Severn Trent plc | 17,915 | 556 |
| | Informa plc | 100,673 | 555 |
| | Berkeley Group Holdings plc | 9,125 | 551 |
| | St. James's Place plc | 42,103 | 546 |
| | Standard Life Aberdeen plc | 174,470 | 546 |
| | Burberry Group plc | 28,130 | 537 |
| | United Utilities Group plc | 48,597 | 534 |
| | Wm Morrison Supermarkets plc | 200,450 | 513 |
| | Johnson Matthey plc | 15,886 | 501 |
| | RSA Insurance Group plc | 83,013 | 495 |
| | Barratt Developments plc | 70,306 | 491 |
| | Tate & Lyle plc | 53,691 | 487 |
| | Pennon Group plc | 35,769 | 478 |
| | HomeServe plc | 27,551 | 476 |
| | Hargreaves Lansdown plc | 21,713 | 467 |
| | Direct Line Insurance Group plc | 116,256 | 459 |
| | Howden Joinery Group plc | 60,639 | 453 |
| | Phoenix Group Holdings plc | 47,132 | 436 |
| | Spectris plc | 12,762 | 434 |
| | Derwent London plc | 11,307 | 427 |
| * | Coca-Cola HBC AG | 16,056 | 426 |
| | Britvic plc | 37,472 | 425 |
| | Natwest Group plc | 283,171 | 422 |
| | Taylor Wimpey plc | 255,667 | 413 |
| | DS Smith plc | 119,573 | 411 |
| | Pearson plc | 55,505 | 409 |
| | Intermediate Capital Group plc | 21,664 | 392 |
| | British Land Co. plc | 76,779 | 375 |
| | M&G plc | 156,848 | 362 |
| | J Sainsbury plc | 146,400 | 360 |
| | Bellway plc | 10,118 | 321 |
ESG International Stock ETF
| | | | | | Shares | Market
Value•
($000) |
| | Hikma Pharmaceuticals plc | 10,095 | 319 |
| | Beazley plc | 50,900 | 292 |
| | B&M European Value Retail SA | 43,740 | 278 |
| | ITV plc | 324,742 | 260 |
| | Schroders plc | 6,110 | 237 |
| | JD Sports Fashion plc | 24,124 | 232 |
| | UNITE Group plc | 17,790 | 229 |
| 2 | Avast plc | 31,177 | 223 |
| | Antofagasta plc | 15,290 | 219 |
| | Hiscox Ltd. | 20,532 | 216 |
| | Games Workshop Group plc | 1,732 | 213 |
| | Marks & Spencer Group plc | 139,854 | 207 |
| | IG Group Holdings plc | 19,046 | 198 |
| | Dechra Pharmaceuticals plc | 4,686 | 196 |
| 2 | ConvaTec Group plc | 75,541 | 193 |
| | Fresnillo plc | 10,262 | 174 |
| | Electrocomponents plc | 18,534 | 168 |
| | Centamin plc | 58,939 | 166 |
| | IWG plc | 40,486 | 152 |
| | Investec plc | 76,441 | 151 |
| | SSP Group plc | 42,939 | 141 |
| *,2 | Trainline plc | 26,811 | 141 |
| | Assura plc | 127,917 | 139 |
| | Lancashire Holdings Ltd. | 13,268 | 135 |
| 2 | Countryside Properties plc | 30,670 | 131 |
| | Inchcape plc | 19,313 | 130 |
| | TP ICAP plc | 32,419 | 129 |
| | Signature Aviation plc | 36,912 | 128 |
| | Grafton Group plc | 12,100 | 125 |
| 2 | Quilter plc | 66,108 | 125 |
| | Spirent Communications plc | 31,551 | 124 |
| | Genus plc | 2,654 | 118 |
| | Cranswick plc | 2,211 | 110 |
| | Hays plc | 68,061 | 109 |
| | Future plc | 5,572 | 109 |
| | Plus500 Ltd. | 5,487 | 107 |
| | Man Group plc | 64,943 | 107 |
| | Safestore Holdings plc | 10,084 | 106 |
| | WH Smith plc | 6,721 | 106 |
| | LondonMetric Property plc | 33,628 | 106 |
| | UDG Healthcare plc | 10,847 | 105 |
| | Ashmore Group plc | 18,274 | 103 |
| | Close Brothers Group plc | 6,754 | 101 |
| | Royal Mail plc | 41,942 | 100 |
| | Big Yellow Group plc | 6,965 | 99 |
| | Computacenter plc | 3,590 | 98 |
| | Pets at Home Group plc | 24,794 | 97 |
| | Domino's Pizza Group plc | 21,302 | 95 |
| | Greggs plc | 4,934 | 93 |
| | | | | | Shares | Market
Value•
($000) |
| | AJ Bell plc | 15,429 | 92 |
| | Moneysupermarket.com Group plc | 22,143 | 90 |
| * | Virgin Money UK plc | 70,656 | 88 |
| 2 | Ascential plc | 21,267 | 88 |
| | OneSavings Bank plc | 21,225 | 86 |
| | Vistry Group plc | 9,958 | 85 |
| 2 | John Laing Group plc | 21,314 | 82 |
| | Victrex plc | 3,159 | 81 |
| | Micro Focus International plc | 19,841 | 79 |
| | Grainger plc | 18,111 | 76 |
| | easyJet plc | 8,859 | 75 |
| *,2 | Wizz Air Holdings plc | 1,454 | 75 |
| | Softcat plc | 4,036 | 75 |
| | KAZ Minerals plc | 9,592 | 74 |
| | Dunelm Group plc | 3,736 | 71 |
| | Pagegroup plc | 13,511 | 69 |
| | Drax Group plc | 17,874 | 67 |
| | Shaftesbury plc | 8,948 | 63 |
| | IntegraFin Holdings plc | 8,875 | 63 |
| | Mediclinic International plc | 17,129 | 60 |
| | Dixons Carphone plc | 47,302 | 59 |
| | Marshalls plc | 6,634 | 56 |
| | International Consolidated Airlines Group SA | 19,686 | 55 |
| | Redrow plc | 8,986 | 54 |
| | Capital & Counties Properties plc | 28,938 | 50 |
| 2 | Hastings Group Holdings plc | 14,188 | 48 |
| | Mitie Group plc | 103,434 | 46 |
| | Cineworld Group plc | 55,138 | 46 |
| | Paragon Banking Group plc | 9,708 | 46 |
| | Aggreko plc | 7,342 | 46 |
| | Essentra plc | 11,008 | 45 |
| | Jupiter Fund Management plc | 14,994 | 42 |
| | Vesuvius plc | 7,576 | 41 |
| | Sanne Group plc | 4,440 | 41 |
| * | Just Group plc | 58,484 | 40 |
| | Brewin Dolphin Holdings plc | 11,896 | 39 |
| * | AO World plc | 14,398 | 39 |
| | Hochschild Mining plc | 11,811 | 38 |
| * | Firstgroup plc | 62,898 | 37 |
| | Provident Financial plc | 11,026 | 37 |
| | Coats Group plc | 50,224 | 37 |
| 2 | Airtel Africa plc | 48,844 | 37 |
| | Daily Mail & General Trust plc Class A | 4,154 | 36 |
| | Savills plc | 3,179 | 35 |
| | Great Portland Estates plc | 4,278 | 35 |
ESG International Stock ETF
| | | | | | Shares | Market
Value•
($000) |
| | National Express Group plc | 20,227 | 34 |
| * | Frasers Group plc | 7,230 | 34 |
| | Workspace Group plc | 4,511 | 34 |
| | Sirius Real Estate Ltd. | 34,318 | 34 |
| | Elementis plc | 34,082 | 33 |
| * | Hammerson plc | 47,547 | 31 |
| | Synthomer plc | 7,267 | 30 |
| *,2 | Aston Martin Lagonda Global Holdings plc | 37,371 | 28 |
| | Greencore Group plc | 16,093 | 27 |
| | Polypipe Group plc | 4,577 | 27 |
| | Crest Nicholson Holdings plc | 9,424 | 25 |
| *,2 | McCarthy & Stone plc | 26,543 | 25 |
| | Kainos Group plc | 1,650 | 25 |
| | Rathbone Brothers plc | 1,068 | 24 |
| | St. Modwen Properties plc | 5,519 | 24 |
| | Redde Northgate plc | 9,423 | 24 |
| | Vectura Group plc | 16,278 | 24 |
| | Telecom Plus plc | 1,118 | 21 |
| | Rhi Magnesita NV | 546 | 20 |
| *,2 | Watches of Switzerland Group plc | 4,424 | 20 |
| | Halfords Group plc | 8,829 | 19 |
| | Keller Group plc | 2,139 | 17 |
| | Restaurant Group plc | 22,839 | 17 |
| | AG Barr plc | 2,978 | 17 |
| 2 | Ibstock plc | 8,512 | 17 |
| | Go-Ahead Group plc | 1,814 | 16 |
| | Picton Property Income Ltd. | 17,007 | 16 |
| 2 | Equiniti Group plc | 10,203 | 15 |
| 2 | TI Fluid Systems plc | 6,919 | 15 |
| | TBC Bank Group plc | 1,188 | 14 |
| | Ferrexpo plc | 4,560 | 11 |
| * | Bank of Georgia Group plc | 771 | 10 |
| | SIG plc | 14,852 | 6 |
| | RDI REIT plc | 5,397 | 6 |
| | Stagecoach Group plc | 9,115 | 5 |
| | NewRiver REIT plc | 5,722 | 5 |
| | TalkTalk Telecom Group plc | 4,266 | 4 |
| 2 | Spire Healthcare Group plc | 2,910 | 4 |
| * | Dignity plc | 520 | 4 |
| * | Metro Bank plc | 2,707 | 4 |
| | AA plc | 6,577 | 3 |
| | Galliford Try Holdings plc | 2,290 | 3 |
| | Stobart Group Ltd. | 6,994 | 2 |
| | International Personal Finance plc | 2,012 | 2 |
| *,2 | Funding Circle Holdings plc | 2,197 | 2 |
| | Superdry plc | 736 | 1 |
| | Card Factory plc | 2,673 | 1 |
| | | | | | Shares | Market
Value•
($000) |
| 1 | NMC Health plc | 4,208 | — |
| | | | | | | 95,463 |
Total Common Stocks
(Cost $1,100,560) | 1,198,676 |
| Temporary Cash Investments (0.3%) |
| Money Market Fund (0.3%) |
| 4,5 | Vanguard Market Liquidity Fund, 0.147%
| 34,854 | 3,486 |
| | | | | | Face
Amount
($000) | |
| U.S. Government and Agency Obligations (0.0%) |
| 6 | United States Treasury Bill, 0.116%, 9/29/2020
| 186 | 186 |
| 6 | United States Treasury Bill, 0.139%, 10/13/2020
| 150 | 150 |
| | | | | | | 336 |
Total Temporary Cash Investments
(Cost $3,821) | 3,822 |
Total Investments (99.8%)
(Cost $1,104,381) | | 1,202,498 |
| Other Assets and Liabilities—Net (0.2%) | | 2,334 |
| Net Assets (100%) | | 1,204,832 |
| Cost is in $000. |
| • | See Note A in Notes to Financial Statements. |
| * | Non-income-producing security. |
| 1 | Security value determined using significant unobservable inputs. |
| 2 | Securities exempt from registration under Rule 144A of the Securities Act of 1933. Such securities may be sold in transactions exempt from registration, normally to qualified institutional buyers. At August 31, 2020, the aggregate value of these securities was $29,752,000, representing 2.5% of net assets. |
| 3 | Includes partial security positions on loan to broker-dealers. The total value of securities on loan is $1,352,000. |
| 4 | Affiliated money market fund available only to Vanguard funds and certain trusts and accounts managed by Vanguard. Rate shown is the 7-day yield. |
| 5 | Collateral of $1,514,000 was received for securities on loan. |
| 6 | Securities with a value of $336,000 have been segregated as initial margin for open futures contracts. |
| | ADR—American Depositary Receipt. |
| | FDR—Fiduciary Depositary Receipt. |
| | GDR—Global Depositary Receipt. |
| | REIT—Real Estate Investment Trust. |
| | SDR—Special Drawing Rights. |
ESG International Stock ETF
Derivative Financial Instruments Outstanding as of Period End
| Futures Contracts |
| | | | ($000) |
| | Expiration | Number of
Long (Short)
Contracts | Notional
Amount | Value and
Unrealized
Appreciation
(Depreciation) |
| Long Futures Contracts | | | | |
| MSCI EAFE Index | September 2020 | 33 | 3,135 | 13 |
| MSCI Emerging Market Index | September 2020 | 39 | 2,146 | 23 |
| | | | | 36 |
| Forward Currency Contracts |
| | Contract
Settlement
Date | Contract Amount (000) | Unrealized
Appreciation
($000) | Unrealized
(Depreciation)
($000) |
| Counterparty | | Receive | | Deliver |
| Toronto Dominion Bank | 10/6/20 | USD | 731 | JPY | 77,957 | — | (6) |
| JPY—Japanese yen. |
| USD—U.S. dollar. |
See accompanying Notes, which are an integral part of the Financial Statements.
ESG International Stock ETF
Statement of Assets and Liabilities
|
| ($000s, except shares and per-share amounts) | Amount |
| Assets | |
| Investments in Securities, at Value | |
| Unaffiliated Issuers (Cost $1,100,896) | 1,199,012 |
| Affiliated Issuers (Cost $3,485) | 3,486 |
| Total Investments in Securities | 1,202,498 |
| Investment in Vanguard | 47 |
| Foreign Currency, at Value (Cost $1,530) | 1,540 |
| Cash Collateral Pledged—Futures Contracts | 169 |
| Receivables for Investment Securities Sold | 153 |
| Receivables for Accrued Income | 2,470 |
| Total Assets | 1,206,877 |
| Liabilities | |
| Due to Custodian | 48 |
| Payables for Investment Securities Purchased | 147 |
| Collateral for Securities on Loan | 1,514 |
| Payables to Vanguard | 87 |
| Variation Margin Payable—Futures Contracts | 72 |
| Unrealized Depreciation—Forward Currency Contracts | 6 |
| Other Liabilities | 171 |
| Total Liabilities | 2,045 |
| Net Assets | 1,204,832 |
| At August 31, 2020, net assets consisted of: | |
| | |
| Paid-in Capital | 1,115,276 |
| Total Distributable Earnings (Loss) | 89,556 |
| Net Assets | 1,204,832 |
| | |
| Net Assets | |
| Applicable to 23,000,000 outstanding $.001 par value shares of beneficial interest (unlimited authorization) | 1,204,832 |
| Net Asset Value Per Share | $52.38 |
See accompanying Notes, which are an integral part of the Financial Statements.
ESG International Stock ETF
|
| | Year Ended
August 31, 2020 |
| | ($000) |
| Investment Income | |
| Income | |
| Dividends1 | 19,016 |
| Interest2 | 28 |
| Securities Lending—Net | 90 |
| Total Income | 19,134 |
| Expenses | |
| The Vanguard Group—Note B | |
| Investment Advisory Services | 110 |
| Management and Administrative | 711 |
| Marketing and Distribution | 45 |
| Custodian Fees | 205 |
| Auditing Fees | 49 |
| Shareholders’ Reports | 13 |
| Trustees’ Fees and Expenses | — |
| Total Expenses | 1,133 |
| Expenses Paid Indirectly | (27) |
| Net Expenses | 1,106 |
| Net Investment Income | 18,028 |
| Realized Net Gain (Loss) | |
| Investment Securities Sold2 | (13,333) |
| Futures Contracts | 619 |
| Forward Currency Contracts | 37 |
| Foreign Currencies | 195 |
| Realized Net Gain (Loss) | (12,482) |
| Change in Unrealized Appreciation (Depreciation) | |
| Investment Securities2,3 | 101,233 |
| Futures Contracts | 24 |
| Forward Currency Contracts | (6) |
| Foreign Currencies | 64 |
| Change in Unrealized Appreciation (Depreciation) | 101,315 |
| Net Increase (Decrease) in Net Assets Resulting from Operations | 106,861 |
| 1 | Dividend income are net of foreign withholding taxes of $2,005,000. |
| 2 | Interest income, realized net gain (loss), and change in unrealized appreciation (depreciation) from an affiliated company of the fund were $25,000, $1,000, and $1,000, respectively. Purchases and sales are for temporary cash investment purposes. |
| 3 | The change in unrealized appreciation (depreciation) is net of deferred foreign capital gains taxes of $171,000. |
See accompanying Notes, which are an integral part of the Financial Statements.
ESG International Stock ETF
Statement of Changes in Net Assets
|
| | Year Ended August 31, 2020 | September 18, 20181 to August 31, 2019 |
| | ($000) | ($000) |
| Increase (Decrease) in Net Assets | | |
| Operations | | |
| Net Investment Income | 18,028 | 5,847 |
| Realized Net Gain (Loss) | (12,482) | (1,830) |
| Change in Unrealized Appreciation (Depreciation) | 101,315 | (3,271) |
| Net Increase (Decrease) in Net Assets Resulting from Operations | 106,861 | 746 |
| Distributions2 | | |
| Total Distributions | (14,331) | (3,720) |
| Capital Share Transactions | | |
| Issued | 693,888 | 421,388 |
| Issued in Lieu of Cash Distributions | — | — |
| Redeemed | — | — |
| Net Increase (Decrease) from Capital Share Transactions | 693,888 | 421,388 |
| Total Increase (Decrease) | 786,418 | 418,414 |
| Net Assets | | |
| Beginning of Period | 418,414 | — |
| End of Period | 1,204,832 | 418,414 |
| 1 | Inception. |
| 2 | Certain prior period numbers have been reclassed to conform with current period presentation. |
See accompanying Notes, which are an integral part of the Financial Statements.
ESG International Stock ETF
| | Year
Ended
August 31,
2020 | September 18,
20181 to
August 31,
2019 |
For a Share Outstanding
Throughout Each Period | | |
| Net Asset Value, Beginning of Period | $48.09 | $50.00 |
| Investment Operations | | |
| Net Investment Income2 | 1.192 | 1.529 |
| Net Realized and Unrealized Gain (Loss) on Investments | 4.138 | (2.714) |
| Total from Investment Operations | 5.330 | (1.185) |
| Distributions | | |
| Dividends from Net Investment Income | (1.040) | (.725) |
| Distributions from Realized Capital Gains | — | — |
| Total Distributions | (1.040) | (.725) |
| Net Asset Value, End of Period | $52.38 | $48.09 |
| Total Return | 11.23% | -2.36% |
| Ratios/Supplemental Data | | |
| Net Assets, End of Period (Millions) | $1,205 | $418 |
| Ratio of Total Expenses to Average Net Assets | 0.15% | 0.17%3, 4 |
| Ratio of Net Investment Income to Average Net Assets | 2.45% | 3.30%3 |
| Portfolio Turnover Rate | 12% | 22% |
| 1 | Inception. |
| 2 | Calculated based on average shares outstanding. |
| 3 | Annualized. |
| 4 | The ratio of expenses to average net assets for the period net of reduction from custody fee offset arrangements was 0.15%. |
See accompanying Notes, which are an integral part of the Financial Statements.
ESG International Stock ETF
Notes to Financial Statements
Vanguard ESG International Stock ETF is registered under the Investment Company Act of 1940 as an open-end investment company, or mutual fund. ETF Shares are listed for trading on Cboe BZX Exchange; they can be purchased and sold through a broker. The fund invests in securities of foreign issuers, which may subject it to investment risks not normally associated with investing in securities of U.S. corporations. Market disruptions associated with the COVID-19 pandemic have had a global impact, and uncertainty exists as to the long-term implications. Such disruptions can adversely affect assets of the fund and thus fund performance.
A. The following significant accounting policies conform to generally accepted accounting principles for U.S. investment companies. The fund consistently follows such policies in preparing its financial statements.
1. Security Valuation: Securities are valued as of the close of trading on the New York Stock Exchange (generally 4 p.m., Eastern time) on the valuation date. Equity securities are valued at the latest quoted sales prices or official closing prices taken from the primary market in which each security trades; such securities not traded on the valuation date are valued at the mean of the latest quoted bid and asked prices. Securities for which market quotations are not readily available, or whose values have been affected by events occurring before the fund's pricing time but after the close of the securities’ primary markets, are valued at their fair values calculated according to procedures adopted by the board of trustees. These procedures include obtaining quotations from an independent pricing service, monitoring news to identify significant market- or security-specific events, and evaluating changes in the values of foreign market proxies (for example, ADRs, futures contracts, or exchange-traded funds), between the time the foreign markets close and the fund’s pricing time. When fair-value pricing is employed, the prices of securities used by a fund to calculate its net asset value may differ from quoted or published prices for the same securities.
Investments in Vanguard Market Liquidity Fund are valued at that fund's net asset value.
Temporary cash investments are valued using the latest bid prices or using valuations based on a matrix system (which considers such factors as security prices, yields, maturities, and ratings), both as furnished by independent pricing services.
2. Foreign Currency: Securities and other assets and liabilities denominated in foreign currencies are translated into U.S. dollars using exchange rates obtained from an independent third party as of the fund’s pricing time on the valuation date. Realized gains (losses) and unrealized appreciation (depreciation) on investment securities include the effects of changes in exchange rates since the securities were purchased, combined with the effects of changes in security prices. Fluctuations in the value of other assets and liabilities resulting from changes in exchange rates are recorded as unrealized foreign currency gains (losses) until the assets or liabilities are settled in cash, at which time they are recorded as realized foreign currency gains (losses).
3. Futures Contracts: The fund uses index futures contracts to a limited extent, with the objectives of maintaining full exposure to the stock market, maintaining liquidity, and minimizing transaction costs. The fund may purchase futures contracts to immediately invest incoming cash in the market, or sell futures in response to cash outflows, thereby simulating a fully invested position in the underlying index while maintaining a cash balance for liquidity. The primary risks associated with the use of futures contracts are imperfect correlation between changes in market values of stocks held by the fund and the prices of futures contracts, and the possibility of an illiquid market. Counterparty risk involving futures is mitigated because a regulated clearinghouse is the counterparty instead of the clearing broker. To further mitigate counterparty risk, the fund trades futures contracts on an exchange, monitors the financial strength of its clearing brokers and clearinghouse, and has entered into clearing agreements with its clearing brokers. The
ESG International Stock ETF
clearinghouse imposes initial margin requirements to secure the fund’s performance and requires daily settlement of variation margin representing changes in the market value of each contract. Any securities pledged as initial margin for open contracts are noted in the Schedule of Investments.
Futures contracts are valued at their quoted daily settlement prices. The notional amounts of the contracts are not recorded in the Statement of Assets and Liabilities. Fluctuations in the value of the contracts are recorded in the Statement of Assets and Liabilities as an asset (liability) and in the Statement of Operations as unrealized appreciation (depreciation) until the contracts are closed, when they are recorded as realized gains (losses) on futures contracts.
During the year ended August 31, 2020, the fund’s average investments in long and short futures contracts represented less than 1% and 0% of net assets, respectively, based on the average of the notional amounts at each quarter-end during the period.
4. Forward Currency Contracts: The fund enters into forward currency contracts to provide the appropriate currency exposure related to any open futures contracts. The fund’s risks in using these contracts include movement in the values of the foreign currencies relative to the U.S. dollar and the ability of the counterparties to fulfill their obligations under the contracts. The fund mitigates its counterparty risk by entering into forward currency contracts only with a diverse group of prequalified counterparties, monitoring their financial strength, entering into master netting arrangements with its counterparties, and requiring its counterparties to transfer collateral as security for their performance. In the absence of a default, the collateral pledged or received by the fund cannot be repledged, resold, or rehypothecated. The master netting arrangements provide that, in the event of a counterparty’s default (including bankruptcy), the fund may terminate the forward currency contracts, determine the net amount owed by either party in accordance with its master netting arrangements, and sell or retain any collateral held up to the net amount owed to the fund under the master netting arrangements. The forward currency contracts contain provisions whereby a counterparty may terminate open contracts if the fund’s net assets decline below a certain level, triggering a payment by the fund if the fund is in a net liability position at the time of the termination. The payment amount would be reduced by any collateral the fund has pledged. Any securities pledged as collateral for open contracts are noted in the Schedule of Investments. The value of collateral received or pledged is compared daily to the value of the forward currency contracts exposure with each counterparty, and any difference, if in excess of a specified minimum transfer amount, is adjusted and settled within two business days.
Forward currency contracts are valued at their quoted daily prices obtained from an independent third party, adjusted for currency risk based on the expiration date of each contract. The notional amounts of the contracts are not recorded in the Statement of Assets and Liabilities. Fluctuations in the value of the contracts are recorded in the Statement of Assets and Liabilities as an asset (liability) and in the Statement of Operations as unrealized appreciation (depreciation) until the contracts are closed, when they are recorded as realized gains (losses) on forward currency contracts.
During the year ended August 31, 2020, the fund’s average investments in forward currency contracts represented less than 1% of net assets, based on the average of the notional amounts at each quarter-end during the period.
5. Federal Income Taxes: The fund intends to continue to qualify as a regulated investment company and distribute all of its taxable income. The fund’s tax returns are open to examination by the relevant tax authorities until expiration of the applicable statute of limitations, which is
ESG International Stock ETF
generally three years after the filing of the tax return. Management has analyzed the fund’s tax positions taken for all open federal and state income tax years, and has concluded that no provision for income tax is required in the fund’s financial statements.
6. Distributions: Distributions to shareholders are recorded on the ex-dividend date. Distributions are determined on a tax basis at the fiscal year-end and may differ from net investment income and realized capital gains for financial reporting purposes.
7. Securities Lending: To earn additional income, the fund lends its securities to qualified institutional borrowers. Security loans are subject to termination by the fund at any time, and are required to be secured at all times by collateral in an amount at least equal to the market value of securities loaned. Daily market fluctuations could cause the value of loaned securities to be more or less than the value of the collateral received. When this occurs, the collateral is adjusted and settled before the opening of the market on the next business day. The fund further mitigates its counterparty risk by entering into securities lending transactions only with a diverse group of prequalified counterparties, monitoring their financial strength, and entering into master securities lending agreements with its counterparties. The master securities lending agreements provide that, in the event of a counterparty’s default (including bankruptcy), the fund may terminate any loans with that borrower, determine the net amount owed, and sell or retain the collateral up to the net amount owed to the fund; however, such actions may be subject to legal proceedings. While collateral mitigates counterparty risk, in the event of a default, the fund may experience delays and costs in recovering the securities loaned. The fund invests cash collateral received in Vanguard Market Liquidity Fund, and records a liability in the Statement of Assets and Liabilities for the return of the collateral, during the period the securities are on loan. Collateral investments in Vanguard Market Liquidity Fund are subject to market appreciation or depreciation. Securities lending income represents fees charged to borrowers plus income earned on invested cash collateral, less expenses associated with the loan. During the term of the loan, the fund is entitled to all distributions made on or in respect of the loaned securities.
8. Credit Facilities and Interfund Lending Program: The fund and certain other funds managed by The Vanguard Group ("Vanguard") participate in a $4.3 billion committed credit facility provided by a syndicate of lenders pursuant to a credit agreement and an uncommitted credit facility provided by Vanguard. Both facilities may be renewed annually. Each fund is individually liable for its borrowings, if any, under the credit facilities. Borrowings may be utilized for temporary or emergency purposes, subject to the fund’s regulatory and contractual borrowing restrictions. With respect to the committed credit facility, the participating funds are charged administrative fees and an annual commitment fee of 0.10% of the undrawn committed amount of the facility; these fees are allocated to the funds based on a method approved by the fund’s board of trustees and included in Management and Administrative expenses on the fund’s Statement of Operations. Any borrowings under either facility bear interest at a rate based upon the higher of the one-month London Interbank Offered Rate (or an acceptable alternate rate, if necessary), federal funds effective rate, or overnight bank funding rate plus an agreed-upon spread, except that borrowings under the uncommitted credit facility may bear interest based upon an alternative rate agreed to by the fund and Vanguard.
In accordance with an exemptive order (the “Order”) from the SEC, the fund may participate in a joint lending and borrowing program that allows registered open-end Vanguard funds to borrow money from and lend money to each other for temporary or emergency purposes (the “Interfund Lending Program”), subject to compliance with the terms and conditions of the Order, and to the extent permitted by the fund’s investment objective and investment policies. Interfund loans and
ESG International Stock ETF
borrowings normally extend overnight, but can have a maximum duration of seven days. Loans may be called on one business day’s notice. The interest rate to be charged is governed by the conditions of the Order and internal procedures adopted by the board of trustees. The board of trustees is responsible for overseeing the Interfund Lending Program.
For the year ended August 31, 2020, the fund did not utilize the credit facilities or the Interfund Lending Program.
9. Other: Dividend income is recorded on the ex-dividend date. Interest income includes income distributions received from Vanguard Market Liquidity Fund and is accrued daily. Premiums and discounts on debt securities are amortized and accreted, respectively, to interest income over the lives of the respective securities, except for premiums on certain callable debt securities that are amortized to the earliest call date. Taxes on foreign dividends and capital gains have been provided for in accordance with the fund's understanding of the applicable countries’ tax rules and rates. Foreign capital gains tax is accrued daily based upon net unrealized gains. Security transactions are accounted for on the date securities are bought or sold. Costs used to determine realized gains (losses) on the sale of investment securities are those of the specific securities sold.
B. In accordance with the terms of a Funds’ Service Agreement (the “FSA”) between Vanguard and the fund, Vanguard furnishes to the fund investment advisory, corporate management, administrative, marketing, and distribution services at Vanguard’s cost of operations (as defined by the FSA). These costs of operations are allocated to the fund based on methods and guidelines approved by the board of trustees and are generally settled twice a month.
Upon the request of Vanguard, the fund may invest up to 0.40% of its net assets as capital in Vanguard. At August 31, 2020, the fund had contributed to Vanguard capital in the amount of $47,000, representing less than 0.01% of the fund’s net assets and 0.02% of Vanguard’s capital received pursuant to the FSA. The fund’s trustees and officers are also directors and employees, respectively, of Vanguard.
C. The fund’s custodian bank has agreed to reduce its fees when the fund maintains cash on deposit in the non-interest-bearing custody account. For the year ended August 31, 2020, custodian fee offset arrangements reduced the fund’s expenses by $27,000 (an annual rate of less than 0.01% of average net assets).
D. Various inputs may be used to determine the value of the fund’s investments and derivatives. These inputs are summarized in three broad levels for financial statement purposes. The inputs or methodologies used to value securities are not necessarily an indication of the risk associated with investing in those securities.
Level 1—Quoted prices in active markets for identical securities.
Level 2—Other significant observable inputs (including quoted prices for similar securities, interest rates, prepayment speeds, credit risk, etc.).
Level 3—Significant unobservable inputs (including the fund’s own assumptions used to determine the fair value of investments). Any investments and derivatives valued with significant unobservable inputs are noted on the Schedule of Investments.
ESG International Stock ETF
The following table summarizes the market value of the fund's investments and derivatives as of August 31, 2020, based on the inputs used to value them:
| | Level 1
($000) | Level 2
($000) | Level 3
($000) | Total
($000) |
| Investments | | | | |
| Assets | | | | |
| Common Stocks—North and South America | 103,274 | 2 | — | 103,276 |
| Common Stocks—Other | 50,857 | 1,044,305 | 238 | 1,095,400 |
| Temporary Cash Investments | 3,486 | 336 | — | 3,822 |
| Total | 157,617 | 1,044,643 | 238 | 1,202,498 |
| | | | |
| Derivative Financial Instruments | | | | |
| Liabilities | | | | |
| Futures Contracts1 | 72 | — | — | 72 |
| Forward Currency Contracts | — | 6 | — | 6 |
| Total | 72 | 6 | — | 78 |
| 1 | Represents variation margin on the last day of the reporting period. |
E. At August 31, 2020, the fair values of derivatives were reflected in the Statement of Assets and Liabilities as follows:
| Statement of Assets and Liabilities Caption | Equity
Contracts
($000) | Foreign
Exchange
Contracts
($000) | Total
($000) |
| Variation Margin Payable—Futures Contracts | 72 | — | 72 |
| Unrealized Depreciation—Forward Currency Contracts | — | 6 | 6 |
| Total Liabilities | 72 | 6 | 78 |
Realized net gain (loss) and the change in unrealized appreciation (depreciation) on derivatives for the year ended August 31, 2020, were:
| Realized Net Gain (Loss) on Derivatives | Equity
Contracts
($000) | Foreign
Exchange
Contracts
($000) | Total
($000) |
| Futures Contracts | 619 | — | 619 |
| Forward Currency Contracts | — | 37 | 37 |
| Realized Net Gain (Loss) on Derivatives | 619 | 37 | 656 |
| |
| Change in Unrealized Appreciation (Depreciation) on Derivatives | | | |
| Futures Contracts | 24 | — | 24 |
| Forward Currency Contracts | — | (6) | (6) |
| Change in Unrealized Appreciation | 24 | (6) | 18 |
ESG International Stock ETF
F. Permanent differences between book-basis and tax-basis components of net assets are reclassified among capital accounts in the financial statements to reflect their tax character. These reclassifications have no effect on net assets or net asset value per share. As of period end, permanent differences primarily attributable to the accounting for foreign currency transactions and passive foreign investment companies were reclassified between the individual components of total distributable earnings (loss).
Temporary differences between book-basis and tax-basis components of total distributable earnings (losses) arise when certain items of income, gain, or loss are recognized in different periods for financial statement and tax purposes; these differences will reverse at some time in the future. The differences are primarily related to the deferral of losses from wash sales; the recognition of unrealized gains or losses from certain derivative contracts; the recognition of unrealized gains from passive foreign investment companies; and the classification of securities for tax purposes. As of period end, the tax-basis components of total distributable earnings (losses) are detailed in the table as follows:
| | Amount
($000) |
| Undistributed Ordinary Income | 8,487 |
| Undistributed Long-Term Gains | — |
| Capital Loss Carryforwards | (14,143) |
| Qualified Late-Year Losses | — |
| Net Unrealized Gains (Losses) | 95,212 |
The tax character of distributions paid was as follows:
| | Year Ended
August 31, 2020 | | Period Ended
August 31, 2019 |
| | Amount
($000) | | Amount
($000) |
| Ordinary Income* | 14,331 | | 3,720 |
| Long-Term Capital Gains | — | | — |
| Total | 14,331 | | 3,720 |
| * | Includes short-term capital gains, if any. |
As of August 31, 2020, gross unrealized appreciation and depreciation for investments and derivatives based on cost for U.S. federal income tax purposes were as follows:
| | Amount
($000) |
| Tax Cost | 1,107,182 |
| Gross Unrealized Appreciation | 177,761 |
| Gross Unrealized Depreciation | (82,445) |
| Net Unrealized Appreciation (Depreciation) | 95,316 |
ESG International Stock ETF
G. During the year ended August 31, 2020, the fund purchased $737,896,000 of investment securities and sold $91,119,000 of investment securities, other than temporary cash investments. Purchases and sales include $466,976,000 and $0, respectively, in connection with in-kind purchases and redemptions of the fund’s capital shares.
H. Capital shares issued and redeemed were:
| | Year Ended
August 31, 2020 | | September 18, 20181 to
August 31, 2019 |
| | Shares
(000) | | Shares
(000) |
| Issued | 14,300 | | 8,700 |
| Issued in Lieu of Cash Distributions | — | | — |
| Redeemed | — | | — |
| Net Increase (Decrease) in Shares Outstanding | 14,300 | | 8,700 |
I. Management has determined that no events or transactions occurred subsequent to August 31, 2020, that would require recognition or disclosure in these financial statements.
Report of Independent Registered
Public Accounting Firm
To the Board of Trustees of Vanguard World Fund and Shareholders of Vanguard ESG International Stock ETF
Opinion on the Financial Statements
We have audited the accompanying statement of assets and liabilities, including the schedule of investments, of Vanguard ESG International Stock ETF (one of the funds constituting Vanguard World Fund, referred to hereafter as the "Fund”) as of August 31, 2020, the related statement of operations for the year ended August 31, 2020 and the statement of changes in net assets and the financial highlights for the year ended August 31, 2020 and for the period September 18, 2018 (inception) through August 31, 2019, including the related notes (collectively referred to as the “financial statements”). In our opinion, the financial statements present fairly, in all material respects, the financial position of the Fund as of August 31, 2020, the results of its operations for the year ended August 31, 2020, and the changes in its net assets and the financial highlights for the year ended August 31, 2020 and for the period September 18, 2018 (inception) through August 31, 2019 in conformity with accounting principles generally accepted in the United States of America.
Basis for Opinion
These financial statements are the responsibility of the Fund’s management. Our responsibility is to express an opinion on the Fund’s financial statements based on our audits. We are a public accounting firm registered with the Public Company Accounting Oversight Board (United States) (“PCAOB”) and are required to be independent with respect to the Fund in accordance with the U.S. federal securities laws and the applicable rules and regulations of the Securities and Exchange Commission and the PCAOB.
We conducted our audits of these financial statements in accordance with the standards of the PCAOB. Those standards require that we plan and perform the audit to obtain reasonable assurance about whether the financial statements are free of material misstatement, whether due to error or fraud.
Our audits included performing procedures to assess the risks of material misstatement of the financial statements, whether due to error or fraud, and performing procedures that respond to those risks. Such procedures included examining, on a test basis, evidence regarding the amounts and disclosures in the financial statements. Our audits also included evaluating the accounting principles used and significant estimates made by management, as well as evaluating the overall presentation of the financial statements. Our procedures included confirmation of securities owned as of August 31, 2020 by correspondence with the custodian and brokers and by agreement to the underlying ownership records of the transfer agent; when replies were not received from brokers, we performed other auditing procedures. We believe that our audits provide a reasonable basis for our opinion.
/s/PricewaterhouseCoopers LLP
Philadelphia, Pennsylvania
October 19, 2020
We have served as the auditor of one or more investment companies in The Vanguard Group of Funds since 1975.
Special 2020 tax information (unaudited) for Vanguard ESG International Stock ETF
This information for the fiscal year ended August 31, 2020, is included pursuant to provisions of the Internal Revenue Code.
The fund distributed $9,801,000 of qualified dividend income to shareholders during the fiscal year.
The fund designates to shareholders foreign source income of $21,027,000 and foreign taxes paid of $1,667,000. Shareholders will receive more detailed information with their Form 1099-DIV in January 2021 to determine the calendar-year amounts to be included on their 2020 tax returns.
Trustees Approve Advisory Arrangements
The board of trustees of Vanguard ESG International Stock ETF has renewed the fund’s investment advisory arrangement with The Vanguard Group, Inc. (Vanguard), through its Equity Index Group. The board determined that continuing the fund’s internalized management structure was in the best interests of the fund and its shareholders.
The board based its decision upon an evaluation of the advisor’s investment staff, portfolio management process, and performance. This evaluation included information provided to the board by Vanguard’s Portfolio Review Department, which is responsible for fund and advisor oversight and product management. The Portfolio Review Department met regularly with the advisor and made monthly presentations to the board during the fiscal year that directed the board’s focus to relevant information and topics.
The board, or an investment committee made up of board members, also received information throughout the year during advisor presentations. For each advisor presentation, the board was provided with letters and reports that included information about, among other things, the advisory firm and the advisor’s assessment of the investment environment, portfolio performance, and portfolio characteristics.
In addition, the board received monthly reports, which included a Market and Economic Report, a Fund Dashboard Monthly Summary, and a Fund Performance Report.
Prior to their meeting, the trustees were provided with a memo and materials that summarized the information they received over the course of the year. They also considered the factors discussed below, among others. However, no single factor determined whether the board approved the arrangements. Rather, it was the totality of the circumstances that drove the board’s decision.
Nature, extent, and quality of services
The board reviewed the quality of the investment management services provided to the fund since its inception in 2018 and took into account the organizational depth and stability of the advisor. The board considered that Vanguard has been managing investments for more than four decades. The Equity Index Group adheres to a sound, disciplined investment management process; the team has considerable experience, stability, and depth.
The board concluded that Vanguard’s experience, stability, depth, and performance, among other factors, warranted continuation of the advisory arrangement.
Investment performance
The board considered the fund’s performance since its inception, including any periods of outperformance or underperformance compared with its target index and peer group. The board concluded that the performance was such that the advisory arrangement should continue.
Cost
The board concluded that the fund’s estimated expense ratio for the current fiscal year was well below the average expense ratio charged by funds in its peer group and that the fund’s estimated advisory expenses for the current fiscal year were also well below the peer-group average.
The board does not conduct a profitability analysis of Vanguard because of Vanguard’s unique structure. Unlike most other mutual fund management companies, Vanguard is owned by the funds it oversees.
The benefit of economies of scale
The board concluded that the fund’s arrangement with Vanguard ensures that the fund will realize economies of scale as it grows, with the cost to shareholders declining as fund assets increase.
The board will consider whether to renew the advisory arrangement again after a one-year period.
Liquidity Risk Management
Vanguard funds (except for the money market funds) have adopted and implemented a written liquidity risk management program (the “Program”) as required by Rule 22e-4 under the Investment Company Act of 1940. Rule 22e-4 requires that each fund adopt a program that is reasonably designed to assess and manage the fund’s liquidity risk, which is the risk that the fund could not meet redemption requests without significant dilution of remaining investors’ interests in the fund.
Assessment and management of a fund’s liquidity risk under the Program take into consideration certain factors, such as the fund’s investment strategy and the liquidity of its portfolio investments during normal and reasonably foreseeable stressed conditions, its short- and long-term cash-flow projections during both normal and reasonably foreseeable stressed conditions, and its cash and cash-equivalent holdings and access to other funding sources. As required by the rule, the Program includes policies and procedures for classification of fund portfolio holdings in four liquidity categories, maintaining certain levels of highly liquid investments, and limiting holdings of illiquid investments.
The board of trustees of Vanguard World Fund approved the appointment of liquidity risk management program administrators responsible for administering Vanguard ESG International Stock ETF’s Program and for carrying out the specific responsibilities set forth in the Program, including reporting to the board on at least an annual basis regarding the Program’s operation, its adequacy, and the effectiveness of its implementation for the past year (the “Program Administrator Report”). The board has reviewed the Program Administrator Report covering the period from December 1, 2018, through December 31, 2019 (the “Review Period”). The Program Administrator Report stated that during the Review Period the Program operated and was implemented effectively to manage the fund’s liquidity risk.
London Stock Exchange Group companies include FTSE International Limited (“FTSE”), Frank Russell Company (“Russell”), MTS Next Limited (“MTS”), and FTSE TMX Global Debt Capital Markets Inc. (“FTSE TMX”). All rights reserved. “FTSE®”, “Russell®”, “MTS®”, “FTSE TMX®” and “FTSE Russell” and other service marks and trademarks related to the FTSE or Russell indexes are trademarks of the London Stock Exchange Group companies and are used by FTSE, MTS, FTSE TMX and Russell under license. All information is provided for information purposes only. Every effort is made to ensure that all information given in this publication is accurate, but no responsibility or liability can be accepted by the London Stock Exchange Group companies nor its licensors for any errors or for any loss from use of this publication. Neither the London Stock Exchange Group companies nor any of their licensors make any claim, prediction, warranty or representation whatsoever, expressly or impliedly, either as to the results to be obtained from the use of the Indices or the fitness or suitability of the Indices for any particular purpose to which they might be put. The London Stock Exchange Group companies do not provide investment advice and nothing in this document should be taken as constituting financial or investment advice. The London Stock Exchange Group companies make no representation regarding the advisability of investing in any asset. A decision to invest in any such asset should not be made in reliance on any information herein. Indexes cannot be invested in directly. Inclusion of an asset in an index is not a recommendation to buy, sell or hold that asset. The general information contained in this publication should not be acted upon without obtaining specific legal, tax, and investment advice from a licensed professional. No part of this information may be reproduced, stored in a retrieval system or transmitted in any form or by any means, electronic, mechanical, photocopying, recording or otherwise, without prior written permission of the London Stock Exchange Group companies. Distribution of the London Stock Exchange Group companies’ index values and the use of their indexes to create financial products require a license with FTSE, FTSE TMX, MTS and/or Russell and/or its licensors.
This page intentionally left blank.
The People Who Govern Your Fund
The trustees of your mutual fund are there to see that the fund is operated and managed in your best interests since, as a shareholder, you are a part owner of the fund. Your fund’s trustees also serve on the board of directors of The Vanguard Group, Inc., which is owned by the Vanguard funds and provides services to them.
A majority of Vanguard’s board members are independent, meaning that they have no affiliation with Vanguard or the funds they oversee, apart from the sizable personal investments they have made as private individuals. The independent board members have distinguished backgrounds in business, academia, and public service. Each of the trustees and executive officers oversees 212 Vanguard funds.
Information for each trustee and executive officer of the fund appears below. That information, as well as the Vanguard fund count, is as of the date on the cover of this fund report. The mailing address of the trustees and officers is P.O. Box 876, Valley Forge, PA 19482. More information about the trustees is in the Statement of Additional Information, which can be obtained, without charge, by contacting Vanguard at 800-662-7447, or online at vanguard.com.
Interested Trustee1
Mortimer J. Buckley
Born in 1969. Trustee since January 2018. Principal occupation(s) during the past five years and other experience: chairman of the board (2019–present) of Vanguard and of each of the investment companies served by Vanguard; chief executive officer (2018–present) of Vanguard; chief executive officer, president, and trustee (2018–present) of each of the investment companies served by Vanguard; president and director (2017–present) of Vanguard; and president (2018–present) of Vanguard Marketing Corporation. Chief investment officer (2013–2017), managing director (2002–2017), head of the Retail Investor Group (2006–2012), and chief information officer (2001–2006) of Vanguard. Chairman of the board (2011–2017) and trustee (2009–2017) of the Children’s Hospital of Philadelphia; and trustee (2018–present) and vice chair (2019–present) of The Shipley School.
Independent Trustees
Emerson U. Fullwood
Born in 1948. Trustee since January 2008. Principal occupation(s) during the past five years and other experience: executive chief staff and marketing officer for North America and corporate vice president (retired 2008) of Xerox Corporation (document management products and services). Former president of the Worldwide Channels Group, Latin America, andWorldwide Customer Service and executive chief staff officer of Developing Markets of Xerox. Executive in residence and 2009–2010 Distinguished Minett Professor at the Rochester Institute of Technology. Director of SPX FLOW, Inc. (multi-industry manufacturing). Director of the University of Rochester Medical Center, the Monroe Community College Foundation, the United Way of Rochester, North Carolina A&T University, and Roberts Wesleyan College. Trustee of the University of Rochester.
Amy Gutmann
Born in 1949. Trustee since June 2006. Principal occupation(s) during the past five years and other experience: president (2004–present) of the University of Pennsylvania. Christopher H. Browne Distinguished Professor of Political Science, School of Arts and Sciences, and professor of communication, Annenberg School for Communication, with secondary faculty appointments in the Department of Philosophy, School of Arts and Sciences, and at the Graduate School of Education, University of Pennsylvania.
1 Mr. Buckley is considered “interested person,” as defined in the Investment Company Act of 1940, because he is an officer of the Vanguard funds.
F. Joseph Loughrey
Born in 1949. Trustee since October 2009. Principal occupation(s) during the past five years and other experience: president and chief operating officer (retired 2009) and vice chairman of the board (2008–2009) of Cummins Inc. (industrial machinery). Chairman of the board of Hillenbrand, Inc. (specialized consumer services) and the Lumina Foundation. Director of the V Foundation. Member of the advisory council for the College of Arts and Letters and chair of the advisory board to the Kellogg Institute for International Studies, both at the University of Notre Dame.
Mark Loughridge
Born in 1953. Trustee since March 2012. Principal occupation(s) during the past five years and other experience: senior vice president and chief financial officer (retired 2013) of IBM (information technology services). Fiduciary member of IBM’s Retirement Plan Committee (2004–2013), senior vice president and general manager (2002–2004) of IBM Global Financing, vice president and controller (1998–2002) of IBM, and a variety of other prior management roles at IBM. Member of the Council on Chicago Booth.
Scott C. Malpass
Born in 1962. Trustee since March 2012. Principal occupation(s) during the past five years and other experience: chief investment officer (retired June 2020) and vice president (retired June 2020) of the University of Notre Dame. Assistant professor of finance at the Mendoza College of Business, University of Notre Dame, and member of the Notre Dame 403(b) Investment Committee (retired June 2020). Member of the board of Catholic Investment Services, Inc. (investment advisors) and the board of superintendence of the Institute for the Works of Religion.
Deanna Mulligan
Born in 1963. Trustee since January 2018. Principal occupation(s) during the past five years and other experience: chief executive officer (2011–present) of The Guardian Life Insurance Company of America. President (2010–2019), chief operating officer (2010–2011), and executive vice president (2008–2010) of Individual Life and Disability of The Guardian Life Insurance Company of America. Member of the board of The Guardian Life Insurance Company of America, the American Council of Life Insurers, and the Economic Club of New York. Trustee of the Partnership for New York City (business leadership), Chief Executives for Corporate Purpose, NewYork-Presbyterian Hospital, Catalyst, and the Bruce Museum (arts and science). Member of the Advisory Council for the Stanford Graduate School of Business.
André F. Perold
Born in 1952. Trustee since December 2004. Principal occupation(s) during the past five years and other experience: George Gund Professor of Finance and Banking, Emeritus at the Harvard Business School (retired 2011). Chief investment officer and co-managing partner of HighVista Strategies (private investment firm). Member of the board of advisors and member of the investment committee of the Museum of Fine Arts Boston. Member of the board (2018–present) of RIT Capital Partners (investment firm). Member of the investment committee of Partners Health Care System.
Sarah Bloom Raskin
Born in 1961. Trustee since January 2018. Principal occupation(s) during the past five years and other experience: deputy secretary (2014–2017) of the United States Department of the Treasury. Governor (2010–2014) of the Federal Reserve Board. Commissioner (2007–2010) of financial regulation for the State of Maryland. Member of the board of directors (2012–2014) of Neighborhood Reinvestment Corporation. Director (2017–present) of i(x) Investments, LLC; director (2017–present) of Reserve Trust. Rubenstein Fellow (2017–present) of Duke University; trustee (2017–present) of Amherst College, and trustee (2019–present) of the Folger Shakespeare Library.
Peter F. Volanakis
Born in 1955. Trustee since July 2009. Principal occupation(s) during the past five years and other experience: president and chief operating officer (retired 2010) of Corning Incorporated (communications equipment) and director of Corning Incorporated (2000–2010) and Dow Corning (2001–2010). Director (2012) of SPX Corporation (multi-industry manufacturing). Overseer of the Amos Tuck School of Business Administration, Dartmouth College (2001–2013). Chairman of the board of trustees of Colby-Sawyer College. Member of the board of Hypertherm Inc. (industrial cutting systems, software, and consumables).
Executive Officers
John Bendl
Born in 1970. Principal occupation(s) during the past five years and other experience: principal of Vanguard. Chief financial officer (2019–present) of each of the investment companies served by Vanguard. Chief accounting officer, treasurer, and controller of Vanguard (2017–present). Partner (2003–2016) at KPMG (audit, tax, and advisory services).
Glenn Booraem
Born in 1967. Principal occupation(s) during the past five years and other experience: principal of Vanguard. Investment stewardship officer (2017–present), treasurer (2015–2017), controller (2010–2015), and assistant controller (2001–2010) of each of the investment companies served by Vanguard.
Christine M. Buchanan
Born in 1970. Principal occupation(s) during the past five years and other experience: principal of Vanguard. Treasurer (2017–present) of each of the investment companies served by Vanguard. Partner (2005–2017) at KPMG (audit, tax, and advisory services).
David Cermak
Born in 1960. Principal occupation(s) during the past five years and other experience: principal of Vanguard. Finance director (2019–present) of each of the investment companies served by Vanguard. Managing director and head (2017–present) of Vanguard Investments Singapore. Managing director and head (2017–2019) of Vanguard Investments Hong Kong. Representative director and head (2014–2017) of Vanguard Investments Japan.
Thomas J. Higgins
Born in 1957. Principal occupation(s) during the past five years and other experience: principal of Vanguard. Finance director (2019–present), chief financial officer (2008–2019), and treasurer (1998–2008) of each of the investment companies served by Vanguard.
Peter Mahoney
Born in 1974. Principal occupation(s) during the past five years and other experience: principal of Vanguard. Controller (2015–present) of each of the investment companies served by Vanguard. Head of International Fund Services (2008–2014) at Vanguard.
Anne E. Robinson
Born in 1970. Principal occupation(s) during the past five years and other experience: general counsel (2016–present) of Vanguard. Secretary (2016–present) of Vanguard and of each of the investment companies served by Vanguard. Managing director (2016–present) of Vanguard. Managing director and general counsel of Global Cards and Consumer Services (2014–2016) at Citigroup. Counsel (2003–2014) at American Express.
Michael Rollings
Born in 1963. Principal occupation(s) during the past five years and other experience: finance director (2017–present) and treasurer (2017) of each of the investment companies served by Vanguard. Managing director (2016–present) of Vanguard. Chief financial officer (2016–present) of Vanguard. Director (2016–present) of Vanguard Marketing Corporation. Executive vice president and chief financial officer (2006–2016) of MassMutual Financial Group.
John E. Schadl
Born in 1972. Principal occupation(s) during the past five years and other experience: principal of Vanguard. Chief compliance officer (2019–present) of Vanguard and of each of the investment companies served by Vanguard. Assistant vice president (2019–present) of Vanguard Marketing Corporation.
Vanguard Senior Management Team
| Joseph Brennan | Chris D. McIsaac |
| Mortimer J. Buckley | James M. Norris |
| Gregory Davis | Thomas M. Rampulla |
| John James | Karin A. Risi |
| Martha G. King | Anne E. Robinson |
| John T. Marcante | Michael Rollings |
Connect with Vanguard®>vanguard.com
Fund Information > 800-662-7447
Direct Investor Account Services > 800-662-2739
Institutional Investor Services > 800-523-1036
Text Telephone for People
Who Are Deaf or Hard of Hearing > 800-749-7273
This material may be used in conjunction with the offering of shares of any Vanguard fund only if preceded or accompanied by the fund’s current prospectus.
All comparative mutual fund data are from Lipper, a Thomson Reuters Company, or Morningstar, Inc., unless otherwise noted.
You can obtain a free copy of Vanguard’s proxy voting guidelines by visiting vanguard.com/proxyreporting or by calling Vanguard at 800-662-2739. The guidelines are also available from the SEC’s website, sec.gov. In addition, you may obtain a free report on how your fund voted the proxies for securities it owned during the 12 months ended June 30. To get the report, visit either vanguard.com/proxyreporting or sec.gov.
You can review information about your fund on the SEC’s website, and you can receive copies of this information, for a fee, by sending a request via email addressed to publicinfo@sec.gov.
© 2020 The Vanguard Group, Inc.
All rights reserved.
Vanguard Marketing Corporation, Distributor.
Q43940 102020
Item 2: Code of Ethics. The Registrant has adopted a code of ethics that applies to the Registrant’s principal executive officer, principal financial officer, principal accounting officer or controller or persons performing similar functions. The Code of Ethics was amended during the reporting period covered by this report to make certain technical, non-material changes.
Item 3: Audit Committee Financial Expert. All members of the Audit Committee have been determined by the Registrant’s Board of Trustees to be Audit Committee Financial Experts and to be independent: F. Joseph Loughrey, Mark Loughridge, Sarah Bloom Raskin, and Peter F. Volanakis.
Item 4: Principal Accountant Fees and Services.
(a) Audit Fees.
Audit Fees of the Registrant.
Fiscal Year Ended August 31, 2020: $720,000
Fiscal Year Ended August 31, 2019: $685,000
Aggregate Audit Fees of Registered Investment Companies in the Vanguard Group.
Fiscal Year Ended August 31, 2020: $10,761,407
Fiscal Year Ended August 31, 2019: $9,568,215
Includes fees billed in connection with audits of the Registrant, other registered investment companies in the Vanguard complex, The Vanguard Group, Inc., and Vanguard Marketing Corporation.
(b) Audit-Related Fees.
Fiscal Year Ended August 31, 2020: $2,915,863
Fiscal Year Ended August 31, 2019: $3,012,031
Includes fees billed in connection with assurance and related services provided to the Registrant, other registered investment companies in the Vanguard complex, The Vanguard Group, Inc., and Vanguard Marketing Corporation.
(c) Tax Fees.
Fiscal Year Ended August 31, 2020: $247,168
Fiscal Year Ended August 31, 2019: $357,238
Includes fees billed in connection with tax compliance, planning, and advice services provided to the Registrant, other registered investment companies in the Vanguard complex, The Vanguard Group, Inc., and Vanguard Marketing Corporation.
(d) All Other Fees.
Fiscal Year Ended August 31, 2020: $115,000
Fiscal Year Ended August 31, 2019: $0
Includes fees billed for services related to tax reported information provided to the Registrant, other registered investment companies in the Vanguard complex, The Vanguard Group, Inc., and Vanguard Marketing Corporation.
(e) (1) Pre-Approval Policies. The policy of the Registrant’s Audit Committee is to consider, and, if appropriate, approve before the principal accountant is engaged for such services, all specific audit and non-audit services provided to: the Registrant, other registered investment companies in the Vanguard complex, The Vanguard Group, Inc., and entities controlled by The Vanguard Group, Inc. that provide ongoing services to the Registrant. In making a determination, the Audit Committee considers whether the services are consistent with maintaining the principal accountant’s independence.
In the event of a contingency situation in which the principal accountant is needed to provide services in between scheduled Audit Committee meetings, the Chairman of the Audit Committee would be called on to consider and, if appropriate, pre-approve audit or permitted non-audit services in an amount sufficient to complete services through the next Audit Committee meeting, and to determine if such services would be consistent with maintaining the accountant’s independence. At the next scheduled Audit Committee meeting, services and fees would be presented to the Audit Committee for formal consideration, and, if appropriate, approval by the entire Audit Committee. The Audit Committee would again consider whether such services and fees are consistent with maintaining the principal accountant’s independence.
The Registrant’s Audit Committee is informed at least annually of all audit and non-audit services provided by the principal accountant to the Vanguard complex, whether such services are provided to: the Registrant, other registered investment companies in the Vanguard complex, The Vanguard Group, Inc., or other entities controlled by The Vanguard Group, Inc. that provide ongoing services to the Registrant.
(2) No percentage of the principal accountant’s fees or services were approved pursuant to the waiver provision of paragraph (c)(7)(i)(C) of Rule 2-01 of Regulation S-X.
(f) For the most recent fiscal year, over 50% of the hours worked under the principal accountant’s engagement were not performed by persons other than full-time, permanent employees of the principal accountant.
(g) Aggregate Non-Audit Fees.
Fiscal Year Ended August 31, 2020: $362,168
Fiscal Year Ended August 31, 2019: $357,238
Includes fees billed for non-audit services provided to the Registrant, other registered investment companies in the Vanguard complex, The Vanguard Group, Inc., and Vanguard Marketing Corporation.
(h) For the most recent fiscal year, the Audit Committee has determined that the provision of all non-audit services was consistent with maintaining the principal accountant’s independence.
Item 5: Audit Committee of Listed Registrants.
The Registrant is a listed issuer as defined in rule 10A-3 under the Securities Exchange Act of 1934 (“Exchange Act”). The Registrant has a separately-designated standing audit committee established in accordance with Section 3(a)(58)(A) of the Exchange Act. The Registrant’s audit committee members are: F. Joseph Loughrey, Mark Loughridge, Sarah Bloom Raskin, and Peter F. Volanakis.
Item 6: Investments.
Not applicable.
Item 7: Disclosure of Proxy Voting Policies and Procedures for Closed-End Management Investment Companies.
Not applicable.
Item 8: Portfolio Managers of Closed-End Management Investment Companies.
Not applicable.
Item 9: Purchase of Equity Securities by Closed-End Management Investment Company and Affiliated Purchasers.
Not applicable.
Item 10: Submission of Matters to a Vote of Security Holders.
Not applicable.
Item 11: Controls and Procedures.
(a) Disclosure Controls and Procedures. The Principal Executive and Financial Officers concluded that the Registrant’s Disclosure Controls and Procedures are effective based on their evaluation of the Disclosure Controls and Procedures as of a date within 90 days of the filing date of this report.
(b) Internal Control Over Financial Reporting. In March 2020, a third-party service provider began performing certain administrative and accounting services for Vanguard ESG U.S. Stock ETF. In May 2020, a third-party service provider began performing certain administrative and accounting services for Vanguard ESG International Stock ETF. There were no other significant changes in the Registrant’s Internal Control Over Financial Reporting or in other factors that could significantly affect this control subsequent to the date of the evaluation, including any corrective actions with regard to significant deficiencies and material weaknesses.
Item 12: Disclosure of Securities Lending Activities for Closed-End Management Investment Companies.
Not applicable.
Item 13: Exhibits.
Pursuant to the requirements of the Securities Exchange Act of 1934 and the Investment Company Act of 1940, the registrant has duly caused this report to be signed on its behalf by the undersigned, thereunto duly authorized.
| BY: | /s/ MORTIMER J. BUCKLEY* | |
| | | |
| | MORTIMER J. BUCKLEY | |
| | CHIEF EXECUTIVE OFFICER | |
Date: October 20, 2020
Pursuant to the requirements of the Securities Exchange Act of 1934 and the Investment Company Act of 1940, this report has been signed below by the following persons on behalf of the registrant and in the capacities and on the dates indicated.
| | VANGUARD WORLD FUND | |
| | |
| BY: | /s/ MORTIMER J. BUCKLEY* | |
| | | |
| | MORTIMER J. BUCKLEY | |
| | CHIEF EXECUTIVE OFFICER | |
Date: October 20, 2020
| | VANGUARD WORLD FUND | |
| | |
| BY: | /s/ JOHN BENDL* | |
| | | |
| | JOHN BENDL | |
| | CHIEF FINANCIAL OFFICER | |
Date: October 20, 2020
* By: /s/ Anne E. Robinson
Anne E. Robinson, pursuant to a Power of Attorney filed on October 23, 2020 (see File Number 2-52698), Incorporated by Reference.