EXHIBIT D
Government of Jamaica
This description of the Government of Jamaica is dated as of December 19, 2012, and appears as Exhibit (d) to the Government of Jamaica’s Annual Report on Form 18-K to the US Securities and Exchange Commission for the fiscal year ended March 31, 2012.
D-1
EXCHANGE RATES
The following table shows exchange rate information for the selling of US dollars for the periods indicated. The Federal Reserve Bank of New York does not report a noon buying rate for the JA dollar. The official exchange rate published by the Bank of Jamaica for US dollars on December 18, 2012, was J$92.93 per US$1.00.
Foreign Exchange Rates
| | | | | | | | | | | | | | |
Year | | Month | | Average for
Period(1) | | | End of Period | | | Percentage Change(2)
(End of Period) | |
| | | (spot weighted average ask in J$ for US$) | |
2005 | | | | | 62.60 | | | | 64.58 | | | | 4.79 | |
2006 | | | | | 65.98 | | | | 67.15 | | | | 3.98 | |
2007 | | | | | 69.16 | | | | 70.62 | | | | 5.17 | |
2008 | | | | | 73.36 | | | | 80.47 | | | | 13.95 | |
2009 | | | | | 88.82 | | | | 89.60 | | | | 11.35 | |
2010 | | | | | 87.34 | | | | 85.86 | | | | (4.17 | ) |
2011 | | | | | 86.08 | | | | 86.60 | | | | 0.86 | |
2012 | | January | | | 86.78 | | | | 86.83 | | | | 0.27 | |
| | February | | | 86.91 | | | | 87.02 | | | | 0.27 | |
| | March | | | 87.25 | | | | 87.30 | | | | 0.28 | |
| | April | | | 87.33 | | | | 87.35 | | | | 0.06 | |
| | May | | | 87.75 | | | | 88.12 | | | | 0.88 | |
| | June | | | 88.48 | | | | 88.70 | | | | 0.66 | |
| | July | | | 89.24 | | | | 89.69 | | | | 1.12 | |
| | August | | | 89.73 | | | | 89.82 | | | | 0.15 | |
| | September | | | 89.90 | | | | 89.93 | | | | 0.12 | |
| | October | | | 90.64 | | | | 91.09 | | | | 1.29 | |
| | November | | | 91.46 | | | | 91.89 | | | | 0.88 | |
| (1) | The weighted average of the exchange rates for annual periods is calculated as the simple average of end of month rates. |
| (2) | As compared to the prior month. |
Source: Bank of Jamaica.
PRESENTATION OF CERTAIN INFORMATION
All references in this annual report on Form 18-K to “Jamaica” and the “Government” are to the Government of Jamaica, unless otherwise indicated. All references to “JA dollars” and “J$” are to Jamaica dollars, all references to “US dollars” and “US$” are to the lawful currency of the United States of America, or US, and all references to “€” are to Euro. Historical amounts translated into JA dollars or US dollars have been converted at historical rates of exchange. References to annual periods (e.g., “2010”) refer to the calendar year ended December 31, and references to fiscal year or FY (e.g., “FY 2009/10” or “FY 2010/11”) refer to Jamaica’s fiscal year ended March 31. All references to “tonnes” are to metric tonnes. Jamaica publishes external economy information, such as external debt and goods and services exported, in US dollars. All international currencies, such as external debt denominated in Euro, are translated into US dollars. Domestic economy information is published by Jamaica in Jamaica dollars. The base year for gross domestic product data contained in this Form 18-K was changed in 2003 from 1986 to 1996. Components contained in tabular information in this annual report on Form 18-K may not add to totals due to rounding. The term “N/A” is used to identify economic or financial data that is not presented for a particular period because it is not applicable to such period and “n.a.” for economic or financial data that is not available.
Statistical information included in this report is the latest official data publicly available. Financial data provided may be subsequently revised in accordance with Jamaica’s ongoing maintenance of its economic data.
D-2
D-3
JAMAICA
History
Originally settled by the Arawak Indians, Jamaica was first visited by Christopher Columbus in 1494 on his second voyage to the New World. Jamaica’s name derives from the Arawak word “Xaymaca,” which means “Land of Wood and Water.” In 1655 Admiral William Penn and General Robert Venables led a British force that conquered the island, ousting the Spaniards. Over the next 40 years, Jamaica became the stronghold of the Caribbean buccaneers who transformed Port Royal, then the island’s commercial center, into the richest city in the New World. The sugar industry, supported to a great extent by slaves transported from Africa until the abolition of slavery in 1834, formed the basis of the island’s economy. During its three centuries as a British colony, Jamaica was variously administered by a governor and a planter-controlled legislature, by British Crown Colony rule from London, England, and by limited representative government in the late 19th and early 20th centuries. The Government granted universal adult suffrage in 1944. From 1958 to 1961, Jamaica was a member of the now-defunct West Indies Federation, which encompassed all of Britain’s Caribbean colonies. Although plans for independence first appeared in the 1940s, internal self-government did not begin until 1959. On August 6, 1962, Jamaica became an independent country within the British Commonwealth.
The historical development of the island has influenced Jamaican national symbols. Jamaica’s flag, a diagonal cross of gold on a green and black background, represents the statement, “The sun shineth, the land is green and the people are strong and creative.” The national crest incorporates the original Arawak inhabitants with the legend “Out of Many, One People,” which reflects the country’s multiracial heritage. Jamaica’s reggae music enjoys international renown.
Territory and Population
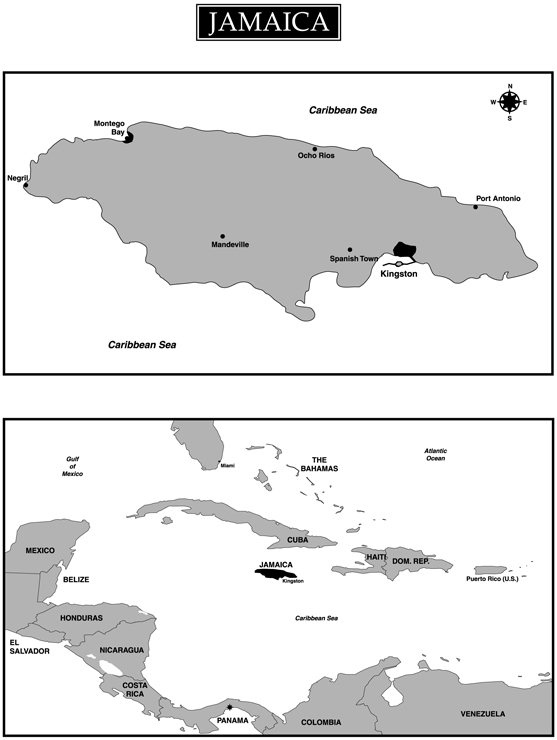
Jamaica, the third largest island in the Caribbean Sea, is located 558 miles (898 kilometers) southeast of Miami, Florida, 90 miles (144.8 kilometers) south of Cuba and 100 miles (160.9 kilometers) southwest of Haiti. The island has an area of 4,411 square miles (11,420 square kilometers), and its highest point is the Blue Mountain Peak, which rises 7,402 feet (2,256 meters) above sea level. The capital city, Kingston, located on the island’s southeast coast, also serves as Jamaica’s major commercial center. The natural harbor in Kingston is the seventh largest in the world. The country’s second-largest city, Montego Bay, located on the island’s northwest coast, is Jamaica’s main center for tourism. See “The Jamaican Economy—Principal Sectors of the Economy—Tourism.”
From 2007 to 2011, Jamaica’s population grew at an average rate of approximately 0.4% per year. At December 31, 2011, Jamaica’s population was estimated at 2,709,300, a 0.2% increase over the December 31, 2010 population of 2,703,600. The last official census completed in 2011 indicated that 46% of Jamaica’s population lives in rural areas while 54% lives in urban areas. Jamaica’s official language is English, and a majority of the population speaks a dialect.
Society
Diverse religious beliefs are represented in Jamaica, although Christian denominations predominate. Other major religious groups include adherents to the Rastafari, Bahai, Islamic and Jewish faiths.
Jamaica’s educational system is based on the British system. The school system consists of a pre-primary cycle of two years, followed by a primary cycle of six years and a secondary cycle of five years. In some instances students pursue two years of additional secondary education. The Government of Jamaica has a policy designed to support the mandatory engagement of all children between the ages of three to 18 years in a meaningful learning process and in a structured and regulated setting. It addresses regular attendance at learning institutions for all children as well as exposure to both academic and vocational program at the secondary level. The HEART Trust/NTA is the facilitating and coordinating body for technical and vocational workforce development in Jamaica. The Trust provides access to training, development of competence, assessment and certification to working age Jamaicans. It also facilitates career development and employment services island-wide. Training is provided both in the workplace (Enterprise-based), as well as through 28 formal Technical, Vocational and Educational Training (TVET) institutions and over 120 TVET special programs.
D-4
The educational system accommodates a variety of public and private schools. Post-secondary education is available to qualified candidates at community colleges, the University of Technology, University College of the Caribbean, Northern Caribbean University, International University of the Caribbean, the Jamaican campus of the University of the West Indies and several private off-shore universities.
In addition to the formal school system, Jamaica has an adult literacy program, which contributed to reducing the illiteracy rate from 32.2% in 1987 to 19.1% in 1999, according to a 1999 survey. No comparable survey has been undertaken since 1999. Data provided by UNESCO using the 1999 data estimates the 2009 literacy rate at 86.8%.
In 2011, the average number of unemployed persons was 158,300, an increase of 2.3% from 154,700 in 2010. The average unemployment rate was 12.7% in 2011, an increase from 12.4% in 2010. See “The Jamaican Economy—Employment and Labor.” The unemployment rate in Jamaica during the past six years has been relatively stable, ranging from a high of 12.7% in 2011 to a low of 9.7% in 2007. Recent macro- and micro-economic developments have caused the unemployment rate to increase in 2012. Unemployment as of June 30, 2012, was 12.8%.
The following table shows selected social indicators applicable to Jamaica for the five years ended December 31, 2011:
Social Indicators
| | | | | | | | | | | | | | | | | | | | |
| | | 2007 | | | 2008 | | | 2009 | | | 2010 | | | 2011 | |
Real GDP per capita(1) | | J$ | 286,633 | | | J$ | 283,094 | | | J$ | 272,394 | | | J$ | 267,726 | | | J$ | 270,603 | |
Perinatal Mortality Rate (per thousand)(2) | | | 27.1 | | | | 29.7 | | | | 29.7 | | | | 27.4 | | | | 30.3 | |
| (1) | In constant 2007 prices. |
| (2) | Defined as deaths in government hospitals occurring anytime from 28 weeks of pregnancy until seven days after birth. |
Source: Statistical Institute of Jamaica, Planning Institute of Jamaica and Ministry of Health—Information Unit.
Governmental Structure and Political Parties
The Jamaica (Constitution) Order in Council 1962, or the Constitution, is the supreme law of Jamaica and sets forth the basic framework and legal underpinnings for governmental activity in Jamaica. The Constitution came into effect when Jamaica became an independent country on August 6, 1962, and includes provisions that safeguard the fundamental freedoms of the individual. While a simple majority of Parliament can enact amendments to the Constitution, certain amendments require ratification by a two-thirds majority in both houses of Parliament, and amendments altering fundamental rights and freedoms require the additional approval of a national referendum.
Jamaica is a parliamentary democracy based upon the British Westminster model and is a member of the British Commonwealth. The Head of State is the British Monarch, who is represented locally by the Governor-General of Jamaica. Traditionally, the British Monarch appoints the Governor-General upon the recommendation of Jamaica’s Prime Minister. The actions of the Governor-General are, in most cases, of a purely formal and ceremonial nature. General elections are constitutionally due every five years, at which time all seats in the House of Representatives will be up for election. The Constitution permits the Prime Minister to call elections at any time within or shortly beyond the five-year period, consistent with the Westminster model.
National legislative power is vested in a bicameral Parliament composed of a House of Representatives and a Senate. The House of Representatives comprises 63 members elected by the people in the general elections. The Senate comprises 21 members appointed by the Governor-General, 13 of whom are appointed on the advice of the Prime Minister and eight of whom are appointed on the advice of the Leader of the Opposition. The President of the
D-5
Senate is elected by its members. The members of the House of Representatives select their own chairman, known as the Speaker. The Prime Minister, usually the member most likely to command the support of the majority of the members of the House of Representatives, is appointed by the Governor-General.
In addition to the national governing bodies, local government is administered through 12 parish councils and a statutory corporation that administers the Kingston and St. Andrew (KSAC) areas and the Municipality of Portmore. The results of the last local government election, which took place in March 2012, accorded the ruling People’s National Party, or PNP, 12 of the 13 parish councils and the KSAC. The PNP and Jamaica Labour Party, or JLP, shared the Trelawny Council, with one elected independent candidate. The PNP won the Municipality of Portmore.
The principal policy-making body of the Government is the Cabinet, which is responsible for the general direction and control of Jamaica and whose members are collectively accountable to Parliament. The Cabinet consists of the Prime Minister and no fewer than 11 other members of the two Houses of Parliament. No fewer than two, and no more than four members must be selected from the Senate. The Governor-General appoints members of the Cabinet upon the recommendation of the Prime Minister.
The Jamaican judicial system is based on English common law and practice and consists of a Supreme Court, a Court of Appeal and local courts. Final appeals are made to the Judicial Committee of the Privy Council in the United Kingdom, or UK. A number of Caribbean nations, including Jamaica, are currently discussing the establishment of a Caribbean Court of Justice to replace the Judicial Committee of the Privy Council for those nations. Jamaica has signed an agreement to establish the Caribbean Court of Justice. In April 2005, Jamaica passed the Caribbean Court of Justice (Original Jurisdiction) Act 2005. The Act provides for the implementation of the provisions of the Agreement establishing the Caribbean Court of Justice in its original jurisdiction. The Caribbean Court of Justice, in its original jurisdiction, will hear and determine matters relating to the interpretation and application of the Revised Treaty of Chaguaramas establishing the Caribbean Community and Common Market.
Two major political parties dominate Jamaica’s political system. From Jamaica’s independence on August 6, 1962, until 1972, the JLP formed the government; then the PNP assumed power in 1972. In late 1980, the JLP returned to power until February 1989, when Michael Manley led the PNP to victory and became Prime Minister. In 1992, Prime Minister Manley resigned as Prime Minister and leader of the PNP and was succeeded by Percival James (“P. J.”) Patterson. The PNP won the 1993 general election and Mr. Patterson was returned as Prime Minister. In 1995, a former Chairman of the JLP formed a third political party, the National Democratic Movement. In the 1997 general election, the PNP won 51.7% of the votes cast, and P. J. Patterson returned to the office of Prime Minister. In March 2006, Prime Minister Patterson resigned as Prime Minister and leader of the PNP and was succeeded by Portia Simpson-Miller.
In the September 3, 2007 general elections, the JLP won 49.98% of the votes cast, and Bruce Golding became Prime Minister. The changes in the leadership of the country had no material effect on the economy of Jamaica. On September 25, 2011, Mr. Golding announced that he would not be seeking re-election, and Andrew Holness succeeded Mr. Golding as Prime Minister and leader of the JLP on October 23, 2011.
Jamaica held its most recent general election on December 29, 2011. As a result of that election, the PNP won 53.0% of the votes cast, and Portia Simpson-Miller became Prime Minister. The Jamaican Constitution requires that a general election be held every five years, at which time all seats in the House of Representatives will be up for election. Given that the last general election was December 29, 2011, an election is to be constitutionally held by December 2016. However, the Prime Minister is constitutionally permitted to call an election at any time before this date.
D-6
The following table shows the parliamentary electoral results for the past six general elections:
Parliamentary Electoral Results
| | | | | | | | | | | | | | | | | | | | | | | | |
| | | 1989 | | | 1993 | | | 1997 | | | 2002 | | | 2007 | | | 2011(1) | |
| | | (number of representatives) | |
| | | | | | |
People’s National Party | | | 45 | | | | 52 | | | | 51 | | | | 34 | | | | 28 | | | | 42 | |
Jamaica Labour Party | | | 15 | | | | 8 | | | | 9 | | | | 26 | | | | 32 | | | | 21 | |
| (1) | Following a Boundaries Revision exercise conducted between April 2008 and March 2010, the number of constituencies (parliamentary seats) was increased from sixty to sixty-three. |
Source: Office of the Prime Minister.
In recognition of the jubilee year of Jamaican independence, the Administration of Prime Minister Simpson Miller has proposed to begin the process of detaching Jamaica from the British Monarchy and to have Jamaica become a republic with an indigenous president as its Head of State. An important agenda item for the Administration in this respect is to establish the Caribbean Court of Justice as its final appellate jurisdiction, replacing the Judicial Committee of the Privy Council. The Administration also intends to broaden and deepen Jamaican input into the regional integration movement. See “—International Relationships—Caribbean Community and Common Market (CARICOM).”
International Relationships
Jamaica maintains diplomatic relations with almost every nation in the world. Jamaica is a member of the United Nations and its affiliated institutions, including the Food and Agriculture Organization, the International Monetary Fund, the World Bank Group, the World Health Organization, the World Tourism Organization, the World Intellectual Property Organization (WIPO), the International Seabed Authority and the United Nations Environment Program. It is also a member of several other regional and international bodies, including the World Trade Organization (WTO); the African, Caribbean and Pacific Group of States (ACP); the Association of Caribbean States (ACS); the Caribbean Community (CARICOM); the Commonwealth; the Latin American and Caribbean Economic System (SELA); the Organization of American States (OAS); and the Community of Latin American and Caribbean States (CELAC).
Jamaica is a signatory to the Cotonou Partnership Agreement and party to the CARIFORUM-EU Economic Partnership Agreement. It is also a beneficiary of the Caribbean Basin Economic Recovery Act and the Caribbean-Canada Trade Agreement (CARIBCAN). In addition, as a member of the United Nations bloc of developing countries known as the Group of 77, Jamaica is eligible for the Generalized System of Preferences. Jamaica is also a member of the Group of 15, a group of 17 states focused on cooperation among developing countries in the areas of trade, investment and technology.
Jamaica receives preferential tariff treatment on most of its products pursuant to, among others, the trade agreements described below.
WTO—Doha Development Round
Jamaica has been participating in the WTO’s Doha Development Round, aimed at further liberalizing trade at the global level, since it was launched in Doha, Qatar in 2001. These negotiations were scheduled to be concluded in 2005 but are currently at an impasse due to various unresolved issues. The Eighth WTO Ministerial Conference (MC8) was held in Geneva, Switzerland from December 15-17, 2011. The Conference addressed issues under its existing mandate relating to: (1) the Importance of the Multilateral Trading System (MTS); (2) Trade and Development; and (3) the Doha Development Agenda (DDA). Among the decisions adopted that were of particular interest to Jamaica were those on the Work Programme on Small Economies and the Trade Policy Review Mechanism. The WTO is to continue with its regular work program and also continue efforts to advance the Doha Development Agenda negotiations to the extent possible. Work is now underway in preparation for the Ninth Ministerial Meeting which is to be held in Bali, Indonesia, in December 2013.
D-7
Caribbean Community (CARICOM)
The Treaty of Chaguaramas (the Treaty) establishing CARICOM was signed in 1973 by four English-speaking Caribbean countries. These countries are: Barbados, Guyana, Jamaica, and Trinidad and Tobago. Other countries subsequently signed on to the Treaty as Member States, including Antigua, The Bahamas, Dominica, Grenada, Montserrat, St. Kitts Nevis Anguilla, St. Lucia and St. Vincent. The main focus of the Treaty has been to deepen economic integration and increase trade among CARICOM Member States. In pursuing these objectives, the Treaty made provisions for, inter alia:
| | • | | the promotion of economic integration among CARICOM Member States, including the establishment of a common market regime and the integration of economic activities; |
| | • | | the coordination of CARICOM Member States’ foreign policies; and |
| | • | | the engagement of CARICOM Member States in functional cooperation activities aimed at improving the effectiveness and efficiency of certain common services, as well as the advancement of social, cultural and technological development. |
The Treaty also created “Community Organs” to monitor the activities and initiatives mandated. Additionally, in fulfilling the provisions of the Treaty, CARICOM Member States established common institutions for the purposes of policy formulation and cooperation aimed at improving the provision of services such as education and health care. As well, CARICOM Member States have cooperated in other important areas such as labor, agriculture, transportation, communication, tourism and disaster preparedness.
Between 1997 and 2001, Member States negotiated a revision of the Treaty, based on recommendations made by the West Indian Commission in 1992, to expand the scope of the Common Market by establishing a single market and economy. Consequently, the Revised Treaty of Chaguaramas establishing the Caribbean Community including the CARICOM Single Market and Economy (CSME) was signed by the following Caribbean countries in July 2001: Antigua and Barbuda, The Bahamas, Barbados, Belize, Dominica, Grenada, Guyana, Jamaica, Montserrat, St. Kitts and Nevis, St. Lucia, St. Vincent and the Grenadines, Suriname and Trinidad and Tobago. Haiti later signed the Revised Treaty of Chaguaramas (the Revised Treaty) on July 2, 2002.
The Revised Treaty seeks to establish a common economic region among CARICOM Member States which would provide for the free movement of goods, services, people and capital, and would give CSME nationals the right to establish businesses and acquire property in any CARICOM Member State participating in the CSME. Additionally, the Revised Treaty provides for the establishment of the Single Economy, which would include the harmonization of fiscal and monetary policies and the establishment of a common currency. In January 2006, the implementation of the provisions of the CARICOM Single Market (CSM) was initiated by Jamaica, Barbados, Belize, Guyana, Suriname and Trinidad and Tobago, that is, the provisions enabling the free movement of goods, services, people and capital. Other Member States started the CSM implementation process in July 2006. The Bahamas, and Montserrat are members of the Caribbean Community but are not yet participating in the CSME. A 2009 audit conducted by the CARICOM Secretariat indicates that Jamaica is far advanced in implementing its obligations under the Revised Treaty.
It was agreed by CARICOM heads of government in May 2011 that CARICOM should consolidate the gains of the Single Market before moving to the Single Economy. In the meantime, negotiations are underway for a CARICOM Financial Services Agreement to remove all regulations, the existence of which negatively affects intra-CARICOM trade in financial services. Negotiations are also underway to complete a CARICOM Investment Code, which will help to facilitate the establishment of a Community Investment Policy and create a framework for the designation of CARICOM as a single investment location. In this context, the CARICOM Investment Code is to establish common standards of treatment for extra-CARICOM investors.
Jamaica remains committed to the mandate of the Revised Treaty of Chaguaramas.
D-8
Caribbean-Canada Trade Agreement (CARIBCAN)
The CARIBCAN is an agreement entered into by Canada and the CARICOM countries in 1986. This agreement establishes a program for trade, investment and industrial cooperation, and features the unilateral extension by Canada of preferential duty-free access to the Canadian market for many imports from CARICOM countries. CARIBCAN’s basic objectives are to enhance the Caribbean region’s existing trade and export earnings, improve its trade and economic development prospects, promote new investment opportunities, and encourage enhanced economic integration and cooperation within the region. This program, after running its course for more than twenty years, has been slated to be replaced by the CARICOM-Canada Trade and Development Agreement, with reciprocal equal access for Canadian companies to the Caribbean market. The negotiations, which commenced in 2009, are still underway. A fourth round of negotiations was convened in July 2012, and CARICOM and Canada are currently engaged in preparations for future rounds of negotiations in order to finalize the agreement.
The Caribbean Basin Initiative
The Caribbean Basin Initiative, or CBI, which was initially launched in 1983 with the enactment of the Caribbean Basin Economic Recovery Act, was amended in 1990 to increase market access to the United States. The benefits under the CBERA are of indefinite duration. In 2000, the United States further expanded the CBI with the enactment of the Caribbean Basin Trade Partnership Act (CBTPA). The CBTPA provides preferential access for a number of products previously excluded from the CBI. The CBTPA will expire on September 30, 2020.
Generalized System of Preferences
Under the aegis of the United Nations Conference on Trade and Development (UNCTAD), the Generalized System of Preferences was designed to afford developing countries preferential access for a wide range of their exports to the markets of developed countries. The Generalized System of Preferences is an export-promotion tool with the objectives of increasing the export earnings of developing countries, promoting industrialization in developing countries and accelerating the rate of economic growth in developing countries.
Cotonou Partnership Agreement
In February 2000, the European Union and the African Caribbean Pacific group of countries, or ACP, concluded negotiations for a new 20-year trade, industrial, financial and technical cooperation agreement. Jamaica ratified the new agreement, known as the Cotonou Partnership Agreement, in February 2001 and, following ratification by 75% of ACP Member States and all EU members, the agreement formally entered into force on April 1, 2003. The agreement was reviewed in 2005 and 2010. The trade provisions of the Cotonou Partnership Agreement have been replaced by the CARIFORUM-EU Economic Partnership Agreement, as described below.
The revision in 2005 was the first one as provided for under the Cotonou Partnership Agreement (CPA). The revised Agreement was signed in Luxembourg on 25 June 2005 and entered into force on 1 July 2008. The first revision prepared the ground for the 2007-2013 financial framework of development assistance or 10th European Development Fund (EDF).
Negotiation of the second revision of the CPA was launched on 29 May 2009 and was concluded in Brussels on 19 March 2010. The revised Agreement was signed in Burkina Faso on 22 June 2010 and is being provisionally applied from 31 October 2010. The second revision has been adapted to include current global challenges such as climate change, food security, regional integration, State fragility and aid effectiveness.
A third revision of the CPA should take place in 2015. This would be the final review prior to the expiration of the Agreement in 2020.
The CARIFORUM-EU Economic Partnership Agreement
The CARIFORUM-EU Economic Partnership Agreement (EPA) was signed by Jamaica and other CARIFORUM Countries, that is, other CARICOM countries and the Dominican Republic, in October of 2008. The
D-9
duration of the EPA is indefinite, and provides exporters of most CARIFORUM-originated goods with duty-free and quota-free access to the EU market. The coverage of the agreement extends to include traditional exports, such as sugar, bananas, rum and rice, which will ultimately enter the EU duty-free and quota-free.
The EU’s preferential system for bananas ended on January 1, 2006, and the sugar regime which existed under the Cotonou Partnership Agreement ended on September 30, 2009. However, under the EPA, bananas from CARIFORUM countries enter the EU quota-free and duty-free, and since October 1, 2009, CARIFORUM sugar exporters have duty-free and quota-free access to the EU market under a managed system which will last until 2015, when the conditions will be removed. The agreement also requires the EU to remove restrictions on CARIFORUM’s services exports, beginning with the liberalization of 29 sectors and sub-sectors.
At the same time, the EPA requires Jamaica and other CARIFORUM countries to remove all tariffs/duties on 86.9% of the value of imports from the EU (90.2% of tariff lines) on a phased basis over a 25-year period.
The EPA establishes provisions to administer trade related issues between the parties. These trade-related issues are primarily in relation to agriculture and fisheries, sanitary and phyto-sanitary standards, customs and trade facilitation, investment facilitation, intellectual property rights, competition, electronic commerce and personal data protection. The agreement goes further to provide for parties to undertake development cooperation in a number of areas, ranging from the development of supply-side capacity, including the development of trade-related infrastructure, to the enhancement of the tourism sector and culture cooperation. The agreement is being provisionally applied by Jamaica. Jamaica has commenced the first phase of its tariff reductions, performing its obligations under the EPA. The tariff reductions are being applied administratively, pending the amendment to the Customs Act. These reductions took effect in September 2012.
D-10
THE JAMAICAN ECONOMY
General
Jamaica operates as a mixed, free market economy with state enterprises as well as private sector businesses. Major sectors of the Jamaican economy include agriculture, mining, manufacturing, tourism and financial and insurance services. As an open economy, Jamaica is well integrated into the global economy with intraregional trade contributing prominently to overall economic activity.
Since the early 1980s, successive governments have implemented structural reforms aimed at fostering private sector activity and increasing the role of market forces in resource allocation. During this period, a large share of the economy has been returned to private sector ownership through divestment and privatization programs in areas such as agriculture, tourism, transportation, banking, manufacturing and communications. See “—Privatization.” Deregulation of markets, the elimination of price subsidies and price controls and the reduction and removal of trade barriers have reduced or eliminated production disincentives and anti-export biases.
In the early 1990s, the reform process in Jamaica gained momentum with, among other developments, the liberalization of the foreign exchange market and the overhaul and simplification of the tax system. In addition to changes in personal income tax and corporate tax regimes, a number of indirect taxes were removed and replaced with a value-added tax. The Tax Administration Reform Project implemented in 1994 was aimed at broadening the tax base, facilitating voluntary compliance with the tax laws, improving the effectiveness of tax administration and tax collection and controlling tax evasion. To enhance compliance, Jamaica implemented a Tax Registration Number system aimed at broadening the tax base through the assignment of identification numbers to individuals and businesses. See “Public Finance—Tax Reform.”
In 2009, Jamaica introduced a new strategic plan for the country’s growth and development—Vision 2030 Jamaica. This strategic plan aims at enabling Jamaica to achieve developed country status by 2030, and is based on the following seven guiding principles: transformational leadership, partnership, transparency and accountability, social cohesion, equity, sustainability, and urban and rural development. Vision 2030 Jamaica seeks to redefine the strategic direction of Jamaica by moving from dependence on lower forms of capital, such as tourism and basic agricultural commodities, to higher forms of capital, such as cultural, human, knowledge and institutional capital stocks. Despite the abovementioned prior initiatives, challenges for Jamaican business owners remain. These challenges primarily stem from global factors that include the price of oil, high energy prices, and, in some sectors, high commodity prices. See “—Principal Sectors of the Economy.”
The Administration of Prime Minister Simpson Miller remains committed to the framework of the Vision 2030 Jamaica national development plan, stating its support to the Growth Inducement Strategy, which is the short-medium term strategies consistent with the Vision 2030 framework, and it has also articulated the need for specific short-term emergency employment measures. The Administration plans using state resources to stimulate employment through the Jamaica Emergency Employment Programme (JEEP) in the short and medium term. While the Administration’s policies are based on the principle that the private sector is a major participant in shaping the Jamaican economy, the Administration also believes that the Government must act to stimulate growth and to restore confidence in Jamaica during times of crisis. The Administration intends to use JEEP in a transparent and non-partisan manner to improve critical areas, such as infrastructure and environment, confident that it will enhance economic growth. The Administration has also announced its intention to pursue a tight fiscal policy, reduce Jamaica’s debt-to-GDP ratio, maintain the key macro-economic fundamentals and act prudently with respect to Jamaica’s debt.
Impact of Global Economic Crisis
Beginning in the second half of 2007, the short-term funding markets in the United States encountered several issues, leading to liquidity disruptions in various markets. In particular, subprime mortgage loans in the United States began to face increased rates of delinquency, foreclosure and loss. These and other related events have had a significant adverse impact on the international economic environment, including the global credit, commodities and financial markets as a whole. Although Jamaica has limited exposure to subprime assets and financially distressed
D-11
international financial institutions, the country was affected by the contraction of liquidity in the international financial markets, the volatility in commodity prices, and the contraction in growth in some of Jamaica’s most important tourism clientele and export markets. Gross domestic product, or GDP, grew slightly in 2011 but contracted in 2010 and 2009. In addition, continuing deteriorated market conditions have also had adverse effects on the Jamaican economy. GDP contracted slightly in the first quarter of 2012 compared to the same period of 2011. See “—Gross Domestic Product.”
IMF Arrangements
Standby Arrangement (SBA)
In February 2010, Jamaica entered into a 27-month Standby Arrangement (SBA), with the International Monetary Fund (IMF) in the amount of SDR 820.5 million (approximately US$1.27 billion). Prior to the execution of the SBA, the Government had to take several actions, including adopting a tax policy package yielding approximately 2% of GDP; completing the Jamaica Debt Exchange (JDX); and reaching an agreement regarding the divestment of Air Jamaica, all of which the Government completed. See “—Public Sector Indebtedness—The Jamaica Debt Exchange,” “—Public Finance—Tax Reform” and “—The Jamaican Economy—Privatization.” The SBA supported Jamaica’s economic program aimed at restoring macroeconomic stability and creating conditions for improved growth. This program included critical steps and policy reforms to tackle fiscal and debt imbalances and other underlying vulnerabilities. The program was designed to assist the country in the establishment of fiscal and debt sustainability over the medium term. As such, the program focused on facilitating tax reform, rationalization of the public sector and reform of public financial systems.
To achieve these goals, the program focused on a three-pronged strategy:
| | • | | comprehensive debt management; and |
| | • | | reforms to further strengthen the financial system. |
As part of the SBA, Jamaica undertook a structural reform agenda, which included reforms to fiscal institutions, public entities, debt management, and the financial sector. As part of these reforms Jamaica passed the Fiscal Responsibility Framework, launched its strategic and comprehensive domestic liability management program, and implemented a variety of reforms impacting the financial system. See “—IMF Standby Agreement—Fiscal Consolidation,” “—IMF Standby Agreement—Comprehensive Debt Management,” and “—IMF Standby Agreement—Legal Reforms to Financial System.”
Repayment of funds disbursed under the SBA is slated to commence in May 2013, with the final payment occurring in February 2017. The SBA provided for eight reviews by the IMF Executive Board before its expiration in May 2012. The executive board of the IMF concluded reviews of Jamaica’s economic performance under the SBA for the quarters ending March 2010, June 2010 and September 2010. Completion of such reviews enabled the immediate disbursement of additional amounts under the SBA, bringing total disbursements under the arrangement to SDR 541.8 million (about US$849.97 million) as of May 2011. The third review was completed in January 2011 and it was agreed that the fourth and fifth reviews would be combined and completed by June 2011. However, such reviews were not completed due mainly to concerns by the management and staff of the IMF regarding Jamaica’s failure to meet fiscal consolidation and structural policies necessary to comply with the medium-term benchmarks. Key fiscal indicators in FY2010/11 fell short of the milestones that would have signaled satisfactory progress towards the objectives of the fiscal program.
In the absence of the scheduled reviews, no further performance targets were established to form the basis of further drawdowns. This also resulted in Jamaica not receiving SDRs 285.7 million (US$420 million) from the IMF neither multilateral funding of approximately US$550 million and grants of approximately €$59.19 million.
D-12
Negotiations Towards an Extended Fund Facility (EFF)
In March 2012, the Government began negotiations with the IMF regarding the successor agreement to the SBA, an Extended Fund Facility (EFF). EFFs are typically three years in duration with the possibility of an extension into a fourth year. The repayment period for an EFF is also longer than the SBA, typically between 4 1/2 to 10 years. Each disbursement under an EFF is generally repaid in twelve equal semiannual installments. As with the SBA, the funds disbursed under the EFF will support Jamaica’s economic program aimed at restoring macroeconomic stability and creating conditions for improved growth and poverty reduction. The EFF will also have the same three-pronged strategy of the SBA. The Government is of the view that an effective program with the IMF, as well as robust partnerships with other international financial institutions, is an essential element to maintain local and international confidence in Jamaica, while undertaking the necessary economic reforms.
Fiscal Consolidation
Jamaica is committed to strengthening its fiscal discipline by adopting a number of programs, the first of which is the Fiscal Responsibility Framework, or FRF. The FRF requires the Government to adopt a number of initiatives including the following:
| | • | | preparing medium-term goals and explaining deviations, should there be any; |
| | • | | more comprehensive reporting in several areas and empowering the Financial Secretary to obtain fiscal information of all public sector entities; |
| | • | | strengthening accountability to Parliament in areas such as corporate plans and budgets of public bodies and increasing oversight of overall fiscal policy; |
| | • | | establishing quantitative ceilings on debt stock, fiscal balance and wages within a specific time frame; and |
| | • | | requiring the Ministry of Finance and Planning to present to Parliament, at the time of the annual budget, a medium-term fiscal policy framework paper with plans and policies for developing the country. |
The FRF is the centerpiece to a number of other initiatives aimed at achieving fiscal consolidation. These other initiatives include a medium-term expenditure framework, the establishment of a centralized treasury management system and the enhancement and consolidation of legislation governing debt management generally.
Comprehensive Debt Management
On January 14, 2010, the Government of Jamaica launched its strategic and comprehensive domestic liability management program, marketed as the Jamaica Debt Exchange, or JDX, for domestic securities only. The results of the JDX revealed a participation rate of approximately 99.2% with a 100% participation rate from financial institutions. This level of success represented an exchange of approximately J$695.6 billion in eligible bonds.
The immediate benefits of the JDX were the realignment of the domestic debt portfolio, which saw a significant reduction in maturities over the next three years; substantial cost savings through the reduction in the projected interest cost for FY 2010/11 of J$17.1 billon (i.e., US$190.7 million or 15.2% of interest cost); extension of amortization equal to J$148.6 billion (or US$1.66 billion) in FY 2010/11; the creation of 25 new benchmark bonds in exchange for over 350 smaller and illiquid bonds; the removal of US Dollar Indexed Bonds and the introduction of new CPI-Indexed Bonds into the domestic portfolio; and an increase in the fixed rate component of the domestic debt portfolio. See “Public Sector Indebtedness—The Jamaica Debt Exchange.”
In addition to implementing the JDX, the Government has an on-going debt management strategy that includes the following:
| | • | | increasing the fixed-rate proportion of the domestic debt stock; |
D-13
| | • | | reducing foreign currency domestic debt; |
| | • | | focusing on benchmark bonds to enhance liquidity; |
| | • | | continuing to develop the secondary capital market; |
| | • | | increasing the transparency and predictability of debt issuance and operations; |
| | • | | continuing to engage multilateral institutions and bilateral creditors; and |
| | • | | enhancing and consolidating legislation governing debt management generally. |
In November 2012, the House of Parliament approved the Public Debt Management Act, 2012, to make provision for the better management of the public debt. See “Public Sector Indebtedness—General”.
Legal Reforms to Financial System
The Government plans to implement a variety of reforms impacting the financial system. These include the following:
| | • | | introducing an omnibus banking law that will allow for more effective supervision of financial conglomerates, including harmonization of the prudential standards that apply to commercial banks, merchant banks and building societies; |
| | • | | amending the Bank of Jamaica Act to provide the Bank of Jamaica with the responsibility for overall financial stability; |
| | • | | reforming of deposit taking institutions to enhance capital rules seeking to address market risks; |
| | • | | reforming of the securities dealers rules to strengthen their ability to withstand shocks going forward; and |
| | • | | continuing to strengthen the regulatory and supervisory framework of securities dealers to enhance capitalization and margin requirements. |
Gross Domestic Product
The Jamaican economy grew by 1.3% in 2011 when compared with 2010. GDP declined by 1.5% in 2010 compared to 2009. The growth in 2011 was mainly the result of a 5.0% increase in the goods producing sectors, which was partially offset by a 0.1% decline in the services industries. The increase in the goods producing sectors was largely the result of increases in mining and quarrying, agriculture and forestry and fishing. The mining and quarrying sector increased by 19.4% in 2011 as compared to 2010, primarily due to increases in the bauxite and alumina production. The agriculture, forestry and fishing industry grew by 9.8 % in 2011 compared to 2010. This growth reflected a return to production levels prior to the adverse weather conditions experienced in 2010.
The slight decline in the services industry in 2011 was mainly due to a decrease of 1.9% in transport, storage and communication, which was partially offset by an increase of 2,0% of hotels and restaurants and 1,6% increase in electricity and water, each as compared to 2010.
GDP declined by 0.1% during the first quarter of 2012 as compared to the first quarter of 2011, mainly as a result of decreases in the production of goods and services of 0.2% and 0.1%, respectively. During the first quarter of 2012, sectors recording growth as compared to the same period in 2011 included the following: agriculture, forestry and fishing, which reported a 6.5% growth; manufacturing which reported a 0.5% growth; hotels and restaurants which reported a 0.8% growth; wholesale and retail trade which reported a 0.9% growth; and finance and insurance services which reported a 0.6% growth. Such growth was offset by decreases of 3.1% in the transport, storage and communication sector, 5.0% in the mining and quarrying sector and 5.6% in the construction sector.
D-14
The pace of Jamaica’s economic growth has been impacted by the amount of government spending for interest payments. There has been, however, a declining trend in interest costs. In FY 2011/2012, interest payments accounted for 37.4% of total revenues and 9.5% of GDP. This compares favorably to FY 2010/2011 when interest payments accounted for 40.6% of total revenue and 11.0% of GDP. Interest cost as a percentage of total revenues has averaged 47% over the last three years. This favorable outturn of declining interest costs to revenue is expected to continue through the medium-term, thus creating fiscal space to allow for improvements to infrastructure, increased economic efficiencies, and poverty reduction. See “—Public Sector Indebtedness.”
Sectoral Origin of Gross Domestic Product(1)
| | | | | | | | | | | | | | | | | | | | | | | | | | | | | | | | | | | | | | | | |
| | | 2007 | | | 2008 | | | 2009 | | | 2010 | | | 2011 | |
| | | Amount | | | % of
Total | | | Amount | | | % of
Total | | | Amount | | | % of
Total | | | Amount | | | % of
Total | | | Amount | | | % of
Total | |
| | | (in millions of J$ at constant 2007 prices, except percentages) | |
| | | | | | | | | | |
Agriculture, Forestry and Fishing: | | | 40,895 | | | | 5.3 | | | | 38,369 | | | | 5.0 | | | | 43,929 | | | | 6.0 | | | | 43,818 | | | | 6.1 | | | | 48,113 | | | | 6.6 | |
Traditional Export Agriculture | | | 7,365 | | | | 1.0 | | | | 6,366 | | | | 0.8 | | | | 7,078 | | | | 1.0 | | | | 7,640 | | | | 1.1 | | | | 7,122 | | | | 1.0 | |
Other Agricultural Crops and Post-Harvest Crop Activities | | | 23,836 | | | | 3.1 | | | | 22,464 | | | | 3.0 | | | | 27,033 | | | | 3.7 | | | | 26,834 | | | | 3.7 | | | | 31,368 | | | | 4.3 | |
Animal Farming, Forestry and Fishing | | | 9,694 | | | | 1.3 | | | | 9,538 | | | | 1.3 | | | | 9,819 | | | | 1.3 | | | | 9,344 | | | | 1.3 | | | | 9,623 | | | | 1.3 | |
Construction | | | 63,829 | | | | 8.3 | | | | 58,992 | | | | 7.8 | | | | 53,870 | | | | 7.3 | | | | 53,167 | | | | 7.4 | | | | 53,609 | | | | 7.3 | |
Manufacture | | | 67,821 | | | | 8.8 | | | | 67,454 | | | | 8.9 | | | | 64,241 | | | | 8.7 | | | | 61,776 | | | | 8.5 | | | | 62,893 | | | | 8.6 | |
Mining and Quarrying: | | | 32,353 | | | | 4.2 | | | | 31,493 | | | | 4.1 | | | | 15,627 | | | | 2.1 | | | | 14,969 | | | | 2.1 | | | | 17,872 | | | | 2.4 | |
Bauxite and Alumina | | | 30,957 | | | | 4.0 | | | | 30,286 | | | | 4.0 | | | | 14,485 | | | | 2.0 | | | | 13,655 | | | | 1.9 | | | | 16,686 | | | | 2.3 | |
Quarrying incl. Gypsum | | | 1,396 | | | | 0.2 | | | | 1,207 | | | | 0.2 | | | | 1,142 | | | | 0.2 | | | | 1,314 | | | | 0.2 | | | | 1,186 | | | | 0.2 | |
| | | | | | | | | | | | | | | | | | | | | | | | | | | | | | | | | | | | | | | | |
Total Goods | | | 204,898 | | | | 26.7 | | | | 196,308 | | | | 25.8 | | | | 177,667 | | | | 24.2 | | | | 173,730 | | | | 24.0 | | | | 182,487 | | | | 24.9 | |
| | | | | | | | | | | | | | | | | | | | | | | | | | | | | | | | | | | | | | | | |
Wholesale & Retail Trade; Repairs; Installation of Machinery and Equipment | | | 142,126 | | | | 18.5 | | | | 141,473 | | | | 18.6 | | | | 136,287 | | | | 18.6 | | | | 131,075 | | | | 18.1 | | | | 131,774 | | | | 18.0 | |
Electricity and Water Supply | | | 24,494 | | | | 3.2 | | | | 24,715 | | | | 3.2 | | | | 25,247 | | | | 3.4 | | | | 24,165 | | | | 3.3 | | | | 24,556 | | | | 3.4 | |
Finance & Insurance Services | | | 79,243 | | | | 10.3 | | | | 80,855 | | | | 10.6 | | | | 82,734 | | | | 11.3 | | | | 79,131 | | | | 10.9 | | | | 78,755 | | | | 10.8 | |
Producers of Government Services | | | 96,150 | | | | 12.5 | | | | 96,288 | | | | 12.7 | | | | 96,015 | | | | 13.1 | | | | 96,310 | | | | 13.3 | | | | 96,423 | | | | 13.2 | |
Hotels & Restaurants | | | 36,066 | | | | 4.7 | | | | 36,842 | | | | 4.8 | | | | 37,578 | | | | 5.1 | | | | 38,841 | | | | 5.4 | | | | 39,619 | | | | 5.4 | |
Real Estate, Renting & Business Activities | | | 79,827 | | | | 10.4 | | | | 80,980 | | | | 10.6 | | | | 79,991 | | | | 10.9 | | | | 79,200 | | | | 11.0 | | | | 78,853 | | | | 10.8 | |
Transport, Storage & Communication | | | 90,075 | | | | 11.7 | | | | 87,321 | | | | 11.5 | | | | 84,244 | | | | 11.5 | | | | 81,997 | | | | 11.3 | | | | 80,461 | | | | 11.0 | |
Other Services | | | 49,967 | | | | 6.5 | | | | 50,462 | | | | 6.6 | | | | 50,724 | | | | 6.9 | | | | 50,283 | | | | 7.0 | | | | 50,031 | | | | 6.8 | |
| | | | | | | | | | | | | | | | | | | | | | | | | | | | | | | | | | | | | | | | |
Total Services | | | 597,948 | | | | 78.0 | | | | 598,934 | | | | 78.7 | | | | 592,819 | | | | 80.7 | | | | 581,002 | | | | 80.3 | | | | 580,471 | | | | 79.3 | |
| | | | | | | | | | | | | | | | | | | | | | | | | | | | | | | | | | | | | | | | |
Less: Financial Intermediation Services Indirectly Measured (FISIM) | | | 35,874 | | | | 4.7 | | | | 34,511 | | | | 4.5 | | | | 36,221 | | | | 4.9 | | | | 31,550 | | | | 4.4 | | | | 30,570 | | | | 4.2 | |
| | | | | | | | | | | | | | | | | | | | | | | | | | | | | | | | | | | | | | | | |
Gross Domestic Product | | | 766,972 | | | | 100.0 | | | | 760,731 | | | | 100.0 | | | | 734,266 | | | | 100.0 | | | | 723,182 | | | | 100.0 | | | | 732,388 | | | | 100.0 | |
| | | | | | | | | | | | | | | | | | | | | | | | | | | | | | | | | | | | | | | | |
| (1) | The Jamaican System of National Accounts has undergone a comprehensive revision. The revision included: (1) the compilation of the national accounts in line with the United Nations System of National Accounts 1993 (1993 SNA); (2) incorporation of new and revised data into the estimates; (3) revision of the national accounts classification of industries; and (4) rebasing of the constant price estimates from 2003 to 2007. |
Source: Statistical Institute of Jamaica.
D-15
The following table shows the rate of growth of real GDP by economic sectors at constant 2007 prices for the five years ended December 31, 2011:
Rate of Growth of Real GDP by Sector(1)
| | | | | | | | | | | | | | | | | | | | |
| | | 2007 | | | 2008 | | | 2009 | | | 2010 | | | 2011 | |
| | | (%) | |
| | | | | |
Agriculture, Forestry and Fishing: | | | (8.1 | ) | | | (6.2 | ) | | | 14.5 | | | | (0.3 | ) | | | 9.8 | |
Traditional Export Agriculture | | | (7.0 | ) | | | (13.6 | ) | | | 11.2 | | | | 7.9 | | | | (6.8 | ) |
Other Agricultural Crops and Post-Harvest Crop Activities | | | (9.1 | ) | | | (5.8 | ) | | | 20.3 | | | | (0.7 | ) | | | 16.9 | |
Animal Farming, Forestry and Fishing | | | (6.4 | ) | | | (1.6 | ) | | | 2.9 | | | | (4.8 | ) | | | 3.0 | |
Construction | | | 4.5 | | | | (7.6 | ) | | | (8.7 | ) | | | (1.3 | ) | | | 0.8 | |
Manufacture | | | 1.2 | | | | (0.5 | ) | | | (4.8 | ) | | | (3.8 | ) | | | 1.8 | |
Mining and Quarrying: | | | (2.9 | ) | | | (2.7 | ) | | | (50.4 | ) | | | (4.2 | ) | | | 19.4 | |
Bauxite and Alumina | | | (3.5 | ) | | | (2.2 | ) | | | (52.2 | ) | | | (5.7 | ) | | | 22.2 | |
Quarrying incl. Gypsum | | | 13.1 | | | | (13.5 | ) | | | (5.4 | ) | | | 15.0 | | | | (9.8 | ) |
Total Goods | | | (0.5 | ) | | | (4.2 | ) | | | (9.5 | ) | | | (2.2 | ) | | | 5.0 | |
Wholesale & Retail Trade; Repairs and Installation of Machinery | | | 1.4 | | | | (0.5 | ) | | | (3.7 | ) | | | (3.8 | ) | | | 0.5 | |
Electricity and Water Supply | | | 0.6 | | | | 0.9 | | | | 2.2 | | | | (4.3 | ) | | | 1.6 | |
Finance & Insurance Services | | | 4.9 | | | | 2.0 | | | | 2.3 | | | | (4.4 | ) | | | (0.5 | ) |
Producers of Government Services | | | 1.3 | | | | 0.1 | | | | (0.3 | ) | | | 0.3 | | | | 0.1 | |
Hotels & Restaurants | | | 0.4 | | | | 2.1 | | | | 2.0 | | | | 3.4 | | | | 2.0 | |
Real Estate, Renting & Business Activities | | | 3.4 | | | | 1.4 | | | | (1.2 | ) | | | (1.0 | ) | | | (0.4 | ) |
Transport, Storage & Communication | | | 2.1 | | | | (3.1 | ) | | | (3.5 | ) | | | (2.7 | ) | | | (1.9 | ) |
Other Services | | | 1.9 | | | | 1.0 | | | | 0.5 | | | | (0.9 | ) | | | (0.5 | ) |
Total Services | | | 2.1 | | | | 0.2 | | | | (1.0 | ) | | | (2.0 | ) | | | (0.1 | ) |
Less: Financial Intermediation Services Indirectly Measured (FISIM) | | | 2.0 | | | | (3.8 | ) | | | 5.0 | | | | (12.9 | ) | | | (3.1 | ) |
Gross Domestic Product | | | 1.4 | | | | (0.8 | ) | | | (3.5 | ) | | | (1.5 | ) | | | 1.3 | |
| (1) | The Jamaican System of National Accounts has undergone a comprehensive revision. The revision included: (1) the compilation of the national accounts in line with the United Nations System of National Accounts 1993 (1993 SNA); (2) incorporation of new and revised data into the estimates; (3) revision of the national accounts classification of industries; and (4) rebasing of the constant price estimates from 2003 to 2007. |
Source: Statistical Institute of Jamaica.
The Petrocaribe Agreement
On August 23, 2005, Jamaica entered into the Petrocaribe Energy Cooperation Agreement (the Petrocaribe Agreement), with the government of the Bolivarian Republic of Venezuela, effective as of June 29, 2005, for an automatically renewable one-year term. The Petrocaribe Agreement has been renewed annually since 2005. Under the arrangement, Venezuela has agreed to make available to Jamaica a portion of the value of Jamaica’s purchases of oil as a concessionary loan facility, the terms of which are determined by the prevailing price per barrel of oil internationally. Currently, with the price of oil averaging more than $100 per barrel, the amount of concessionary financing available is sixty percent 60% of the value of purchases, which is to be repaid over 25 years, including a two-year grace period, at an interest rate of 1.0%. The terms of the Petrocaribe Agreement limit the concessionary flows to the purchase of a maximum of 23,500 barrels per day (23,500 Bbl/day) of crude oil, refined products and liquefied petroleum gas (LPG) or its energy equivalents, supplied directly to Jamaica for its internal consumption. Prices for products are based on prevailing rates in the international oil market and deliveries to Jamaica are subject to the commercial policies and practices of Petroleos de Venezuela S.A., or PDVSA. Jamaica has the option of providing alternative forms of payments through goods and services. The Petrocaribe Agreement may be modified or terminated by Venezuela upon 30 days’ written notice to Jamaica.
D-16
In 2006, Parliament authorized the establishment of the Petrocaribe Development Fund to undertake the following activities in relation to the Petrocaribe Agreement:
| | • | | manage loan proceeds that flow to Jamaica; |
| | • | | provide financing for approved projects and receive loan repayments from borrowers; and |
| | • | | meet debt service obligations to Venezuela arising from the Agreement. |
At November 30, 2012, the loan proceeds to the Petrocaribe Development Fund totaled US$2,167 million.
Revitalization of downtown Kingston
The Urban Development Corporation of Jamaica, or UDC, is in the process of preparing a redevelopment plan for downtown Kingston and Port Royal. This envisages various projects being implemented on a phased basis in keeping with Vision 2030 Jamaica, which seeks to position Jamaica as a place of choice to live, work, raise families and do business. As part of this plan, the UDC has been actively engaging public and private sector entities to invest in downtown Kingston.
Arising out of these efforts, telecommunications company Digicel has completed the construction of its group headquarters in Kingston. Digicel is incorporated in Bermuda but has its head offices in Jamaica. It is expected that the staff on Digicel will move into their new headquarters early in the New Year (2013). One of the direct consequences will be the addition of approximately 1,000 working professionals and expatriates to the downtown Kingston area each day. This will result in an increased demand for support services such as banking, restaurants and other retail services. Digicel has continued to invest in the market district of downtown Kingston and the UDC has been working collaboratively with them.
In fact, the UDC through collaboration with the Kingston and St. Andrew Corporation, or KSAC, has carried out additional improvements works to the market district geared at providing a greater sense of order and space to the vendors and shoppers alike.
The UDC has been spearheading a multi-stakeholder approach to the redevelopment of the capital city and adjoining Port Royal, which is yielding opportunities in the areas of residential, and commercial development. The UDC has realized that one of the main obstacles to be overcome is the issue of addressing the myriad problems of providing suitable housing accommodation for the inner city community dwellers without causing major dislocation and with some level of affordability. To date, two pilot housing units have been constructed from which lessons will be learnt leading to its adaption elsewhere.
Several infrastructure investment projects continue through the plan area. The National Work Agency (NWA) has initiated its Traffic Management Plan. The National Water Commission is currently undertaking the construction of the new Darling Street Sewerage Pumping station which will improve the discharge of sewerage to the Soapberry Treatment Plant. The major benefit of this project to the plan area is the gradual improvement that will return to the water quality of the Kingston Harbour, which will encourage more recreational use of this resource.
Private interests are also playing their part by carrying out façade improvement to their properties in the business district. Several of the previously abandoned or derelict buildings are being renovated and returned to use.
The UDC is leading the charge in making the downtown particularly the Kingston waterfront a lively entertainment space with its support for several activities. One of the many projects proposed seek to reposition the waterfront as a leisure and event space with the festival market place proposal being one the important anchors. This development will combine the elements of entertainment, cuisine and other commercial activities. The Jamaica Conference Centre continues to offer premier conferencing facilities.
D-17
The Ministry of Foreign Affairs and Foreign Trade will be relocating to the Kingston Waterfront. When the project is implemented, it will serve as an anchor for development on the eastern side of the plan area, similar to the impact Digicel had on the western side.
Principal Sectors of the Economy
Tourism
The tourism industry is the leading gross earner of foreign exchange for Jamaica and makes a significant contribution to employment. Tourism accounted for 40.9% of gross foreign exchange earnings from the productive sector in 2011. In 2011, the accommodation sub-sector alone employed approximately 34,921 persons. Visitor arrivals in Jamaica have increased by 44.4% in the last decade, from 2,131,785 million visitors in 2002 to 3,077,233 million visitors in 2011. Total visitors’ accommodation has also grown during the last decade to 28,451 rooms in 2011 from 24,239 rooms in 2002.
During 2011 visitor arrivals increased 8.7% to 3,077,233, from 2,831,297 in 2010 mainly due to the opening of the new Falmouth pier in Trelawny and an inactive hurricane season. In 2011, stopover arrivals to Jamaica increased by 1.6% to 1,951,752 from 1,921,678 in 2010. The number of cruise passengers increased significantly by 23.7% to 1,125,481 from 909,619 in 2010. Jamaica’s stopover arrivals during 2011 increased slightly despite the decrease in flight frequencies and routes during the latter part of 2011 along with increased surcharges and energy fees and the continued impact of the global recession in the visitor-generating countries, which effects were partially offset by the inactive hurricane season.
During 2010, visitor arrivals increased 2.8% to 2,831,297 in 2010, from 2,753,446 in 2009 mainly due to increases in the frequency of flights and number of routes provided by airlines during the year, Governmental support of increased marketing, the private tourism industry offering attractive rates, continued advertising and an increase in hotel occupancy in an environment with increased hotel capacity. In 2010, stopover arrivals to Jamaica increased by 4.9% to 1,921,678 from 1,831,097 in 2009. This increase was partially offset by a 1.4% decline in the number of cruise passengers to 909,619 from 922,349 in 2009. The main factors that can be identified as having had a positive impact on Jamaica’s stopover arrivals during 2010 were the aggressive thrust to maintain the current airlift capacity and initiate new gateways to the island, Governmental support of increased marketing, as well as the private industry offering attractive pricing for air travel, hotels and vacation packages.
For the first eight months of 2012, total visitor arrivals were 2,377,262, an increase of 13.0% compared to the same period of 2011; stopover arrivals totaled 1,439,919, a 2.6% increase over the same period in 2011; and cruise passengers totaled 937,343, an increase of 33.9% compared to the same period in 2011. The number of cruise passengers increased mainly due to the opening of the new cruise ship pier in Falmouth Trelawny. The increases in stopover arrivals in the eight-month period ended August, 2012 reflect the results of the continuing wide-ranging marketing and sales activities Jamaica has embarked upon to encourage travel from Jamaica’s major tourist markets—the United States and Canada—as well as attractive pricing offered by the private tourism industry. In addition, Jamaica continued to secure adequate airlift out of major airport hubs allowing more visitors easy access to the destination. Currently 31 airlines fly into Jamaica including Airtran Airlines, American Airlines, British Airways, Delta Airlines, Jet Blue, Sunwing Airlines, United Airlines, Virgin Atlantic Airlines, and Westjet Airlines.
The United States, Jamaica’s major tourist market, accounted for 62.8% of total stopover visitors in 2011, compared to 64.7% in 2010. Jamaica’s share of visitors from Canada has grown to 19.4% a share in 2011 from 16.9% in 2010. Jamaica’s share of visitors from Europe decreased to 13.0% in 2011 from 14.1% in 2010. Average hotel room occupancy was 60.5% in 2011 and 2010, 59.0% in 2009, 60.4% in 2008 and 63.2% in 2007. Approximately 74.3% of hotel rooms in Jamaica are in the all-inclusive hotel category. In 2011, the average room occupancy rate of all-inclusive hotels was 67.3%. Three hotel chains—Sandals Resorts International Limited, SuperClubs and RIU Resorts—operate the majority of the all-inclusive rooms.
Investment in visitor accommodation is growing as a number of major hotel projects reached completion, mainly along the North Coast of Jamaica from Negril to Ocho Rios. In 2008, the following properties were opened: Grand Palladium—Fiesta Resort with 1,056 rooms in Lucea, the second Iberostar property—Iberostar Suites Rosehall—with 273 rooms, and the fourth Riu property—Riu Mahoe Bay—with 681 rooms in Montego Bay. The
D-18
Palmyra Resort & Spa at Rose Hall, which began construction in 2005, opened the first phase with 299 rooms in December 2009. During 2010, the Secrets Wild Orchid and Secrets St. James properties were opened in Montego Bay, each with 350 rooms. Excellence Resorts plans to construct four hotel properties with a total of 1,650 rooms in Trelawny.
In September 2006, the Government and the Tavistock Group entered into a joint venture agreement for the development of the US$2.5 billion Harmony Cove Resort in Trelawny. Construction on the first phase of the project is scheduled to begin in 2013 with a budget of approximately US$900 million and will take approximately three years to complete. The entire project is expected to be completed within the next 10 years. At completion, the resort is expected to include several luxury hotels and residences, with a total of 5,000 rooms.
Total new investment in the sector is expected to be in the range of US$900 million to US$1.0 billion, excluding the cost of land acquisition. Some 8,000 rooms are expected to be constructed. However, in light of the current economic environment, the timeframe is under review.
The following table shows the number of visitor arrivals for the first eight month period ended August 30, 2011 and 2012:
| | | | | | | | | | | | |
| | | 2011 | | | 2012 | | | % Change | |
Foreign Nationals | | | 1,302,293 | | | | 1,335,515 | | | | 2.6 | |
Non-resident Jamaicans | | | 101,209 | | | | 104,404 | | | | 3.2 | |
| | | | | | | | | | | | |
Total Stopover Visitors | | | 1,403,502 | | | | 1,439,919 | | | | 2.6 | |
Cruise Passengers | | | 700,137 | | | | 937,343 | | | | 33.9 | |
| | | | | | | | | | | | |
Total Visitors | | | 2,103,639 | | | | 2,377,262 | | | | 13.0 | |
| | | | | | | | | | | | |
Average Length of Stay (nights) | | | 8.7 | | | | 8.6 | | | | (1.1 | ) |
Source: Jamaica Tourist Board.
The following table shows the number of visitor arrivals for the five years ended December 31, 2011:
Visitor Arrivals
| | | | | | | | | | | | | | | | | | | | | | | | |
| | | 2007 | | | 2008 | | | 2009 | | | 2010 | | | 2011 | | | %
Change 2011
vs. 2010 | |
Foreign Nationals | | | 1,573,267 | | | | 1,623,675 | | | | 1,683,846 | | | | 1,768,810 | | | | 1,800,280 | | | | 1.8 | |
Non-resident Jamaicans | | | 127,518 | | | | 143,596 | | | | 147,251 | | | | 152,868 | | | | 151,472 | | | | (0.9 | ) |
| | | | | | | | | | | | | | | | | | | | | | | | |
Total Stopover Visitors | | | 1,700,785 | | | | 1,767,271 | | | | 1,831,097 | | | | 1,921,678 | | | | 1,951,752 | | | | 1.6 | |
Cruise Passengers | | | 1,179,504 | | | | 1,092,263 | | | | 922,349 | | | | 909,619 | | | | 1,125,481 | | | | 23.7 | |
| | | | | | | | | | | | | | | | | | | | | | | | |
Total Visitors | | | 2,880,289 | | | | 2,859,534 | | | | 2,753,446 | | | | 2,831,297 | | | | 3,077,233 | | | | 8.7 | |
| | | | | | | | | | | | | | | | | | | | | | | | |
Average Length of Stay (nights) | | | 9.6 | | | | 9.3 | | | | 9.2 | | | | 9.0 | | | | 8.9 | | | | (1.1 | ) |
Source: Jamaica Tourist Board.
D-19
The following table shows the number of stopover visitors by country of origin for the five years ended December 31, 2011:
Stopover Visitors by Country of Origin
| | | | | | | | | | | | | | | | | | | | | | | | |
| | | 2007 | | | 2008 | | | 2009 | | | 2010 | | | 2011 | | | % Change
2011 vs. 2010 | |
United States | | | 1,132,532 | | | | 1,150,942 | | | | 1,172,844 | | | | 1,242,943 | | | | 1,225,565 | | | | (1.4 | ) |
United Kingdom and Ireland | | | 189,597 | | | | 191,867 | | | | 187,350 | | | | 187,092 | | | | 175,966 | | | | (5.9 | ) |
Other European | | | 99,297 | | | | 92,833 | | | | 89,449 | | | | 84,223 | | | | 77,439 | | | | (8.1 | ) |
Canada | | | 190,650 | | | | 236,193 | | | | 290,307 | | | | 325,191 | | | | 378,938 | | | | 16.5 | |
Caribbean | | | 62,967 | | | | 67,231 | | | | 65,333 | | | | 58,299 | | | | 66,216 | | | | 13.6 | |
Latin America | | | 12,169 | | | | 16,122 | | | | 14,492 | | | | 13,442 | | | | 16,589 | | | | 23.4 | |
Japan | | | 3,049 | | | | 2,846 | | | | 2,511 | | | | 1,950 | | | | 2,027 | | | | 3.9 | |
Other | | | 10,524 | | | | 9,237 | | | | 8,811 | | | | 8,538 | | | | 9,372 | | | | 9.8 | |
| | | | | | | | | | | | | | | | | | | | | | | | |
Total | | | 1,700,785 | | | | 1,767,271 | | | | 1,831,097 | | | | 1,921,678 | | | | 1,951,752 | | | | 1.6 | |
| | | | | | | | | | | | | | | | | | | | | | | | |
Source: Jamaica Tourist Board.
The following table shows the percentage hotel room occupancy for the five years ended December 31, 2011:
Hotel Room Occupancy
| | | | | | | | | | | | | | | | | | | | |
| | | 2007 | | | 2008 | | | 2009 | | | 2010 | | | 2011 | |
| | | (%) | |
| | | | | |
Kingston and St. Andrew | | | 61.2 | | | | 56.9 | | | | 46.2 | | | | 41.8 | | | | 45.2 | |
Montego Bay | | | 59.1 | | | | 59.7 | | | | 60.2 | | | | 61.2 | | | | 63.2 | |
Ocho Rios | | | 67.4 | | | | 68.0 | | | | 64.9 | | | | 66.0 | | | | 63.9 | |
Port Antonio | | | 16.3 | | | | 12.5 | | | | 21.1 | | | | 10.0 | | | | 14.1 | |
Mandeville | | | 52.0 | | | | 58.2 | | | | 45.4 | | | | 49.8 | | | | 58.7 | |
Negril | | | 65.7 | | | | 54.9 | | | | 57.3 | | | | 61.7 | | | | 58.5 | |
| | | | | | | | | | | | | | | | | | | | |
Total | | | 63.2 | | | | 60.4 | | | | 59.0 | | | | 60.5 | | | | 60.5 | |
| | | | | | | | | | | | | | | | | | | | |
Source: Jamaica Tourist Board.
The following table shows estimated visitor expenditure for the five years ended December 31, 2011:
Estimated Visitor Expenditure
| | | | | | | | | | | | | | | | |
| | | Stopover
US$ per
person
per day | | | Cruise
US$ per
passenger
per day | | | Total Visitor
Expenditure
US$ Million | | | Visitor
Expenditure
% Change From
Prior Year | |
2007 | | | 114.5 | | | | 97.2 | | | | 1,910.1 | | | | 2.1 | |
2008 | | | 119.5 | | | | 94.2 | | | | 1,975.5 | | | | 3.4 | |
2009 | | | 114.0 | | | | 83.4 | | | | 1,925.4 | | | | (2.5 | ) |
2010 | | | 115.7 | | | | 87.4 | | | | 2,001.2 | | | | 3.9 | |
2011 | | | 115.7 | | | | 87.4 | | | | 2,008.3 | | | | 0.4 | |
Source: Jamaica Tourist Board.
In 2011, the total visitor expenditure increased by 0.4% to US$2,008.3 from US$2,001.2 million in 2010. This increase is small primarily because of the declining average length of stay of visitors. The average expenditure per person per night remained steady from US$115.7 in 2010. During the first eight months of 2012, provisional estimates of total visitor expenditure increased by 3.4% when compared to the same period in 2011.
D-20
Infrastructure
Since 2002, Jamaica has made progress on the Highway 2000 project, a joint public-private sector project. Once completed, this multi-lane motorway will connect the capital of Kingston in the southeast of Jamaica with the tourism centers of Montego Bay in the northwest and Ocho Rios in the center of northern Jamaica and will cover approximately 230 kilometers (or 144 miles). The developers, through National Road Operating and Constructing Company Limited (NROCC), are authorized by the Minister of Transport and Works through a 35-year concession agreement for the project to levy, collect and retain tolls in connection with the project.
The project will be completed in two phases. TransJamaican Highway Limited (TJH), a project company jointly owned by Bouygues Travaux Publics S.A. and Autoroutes du Sud de la France, was hired to design, construct, finance, operate and maintain the first phase of the project (Phase 1). Phase 1 was commenced in 2002.
Phase 1 is made up of three separate sub-projects:
| | • | | Phase 1A was completed in July 2006 at a cost of approximately US$240 million and includes the construction of a four lane tolled motorway from Mandela Highway to Sandy Bay as well as a six lane highway connecting Kingston to Portmore. This phase also includes the construction of three new toll plazas. |
| | • | | Phase 1B was completed in February 2011 at a cost of approximately US$104 million and involved the construction of an additional 10.5 kilometers of roadway from Sandy Bay to May Pen. The project is funded by Inter-American Development Bank the International Finance Corporation, the European Investment Bank (EIB) and Société de Promotion et de Participation pour la Coopération Economique S.A. |
| | • | | Phase 1C—TJH has an option to construct Phase 1C, which would have extended the Highway from May Pen to Williamsfield. This option has not been exercised to date. |
The second phase of the project (Phase 2) includes two sub-projects:
| | • | | Phase 2A involves the construction of a tolled highway commencing in Caymanas and extending to Ocho Rios. A concession agreement was signed in 2012 with Jamaica North South Highway Company Limited for the implementation of this project, which includes the completion of the Mt. Rosser Bypass section of the roadway, which begun in 2007. The concession includes the design, construction, financing, operation and maintenance of the toll road for a period of 50 years. The developer will provide the full financing for the project, which is estimated on US$600 million. |
| | • | | Phase 2B— TJH also had an option to extend the Highway from Williamsfield to Montego Bay. This option has not been exercised to date. |
Jamaica and the Export-Import Bank of China signed a Preferential Buyer Credit Loan Agreement for the sum of US$58.1 million on February 3, 2010. The purpose of the loan is to repair and secure the degraded shoreline of the Palisadoes Peninsula in Kingston and to protect the Kingston Harbour from potential storm surges. The project commenced in September 2010 and was scheduled for completion in September 2012. The project is currently 97% complete with an extension granted to December 2012 in order to complete two major outstanding activities—the replanting of the mangroves and the construction of the boardwalk on the harbor side.
Additionally, Jamaica divested the Sangster International Airport in 2003 and upgrading work was completed in April 2009. In 2011, the Norman Manley International Airport improvement was completed, and included a new departures terminal, a new two-level pier fitted with jet loading bridges, upgrades to the arrivals terminal, car park and roadway upgrades, IT systems, operations, safety and security equipment upgrades, and electrical distribution systems upgrades. See “—Privatization.” Funding for these projects came from European Investment Bank (EIB) and the Caribbean Development Bank (CDB), as well as government funding from the Petrocaribe Development Fund, the Airport Improvement Fund (AIF) and equity and subordinated debt via the Airports Authority of Jamaica (AAJ).
D-21
In 2011, the construction of the Falmouth Cruise Ship Terminal was completed. This Terminal was constructed through a collaborative arrangement between the Port Authority of Jamaica (PAJ) and Royal Caribbean Cruises Limited (RCCL). The commercial area was developed by RCCL on lands leased on a long term basis from the PAJ and is operated by Falmouth Jamaica Land Company Limited (FJLCL), a subsidiary of RCCL. FJLCL on the other hand, manages a number of shops and other commercial buildings on the leased area, integrating part of the FCST.
The FCST welcomed its first cruise vessel with over 3,000 passengers and more than 1,000 crew members in February 2011 and by the end of the year accommodated the highest number of cruise ship visitors of any of the four cruise ship piers in Jamaica with a total of 460,415 passengers arriving on 111 vessels. As of October 2012, a total of 109 vessels carrying 477,998 passengers have been accommodated at this facility along 2012. Financing for the project was secured through a government guaranteed loan of US$121.65 million, made available by HSBC plc, London and supported by the Eksport Kredit Fonden. See “Public Sector Indebtedness—External Debt.”
Other
Potential future negative economic and other conditions in the United States and other countries may have an adverse effect on Jamaican tourism. Other factors that may affect the tourist industry include the availability of direct flights to and from the country, potential visitors’ perceptions of Jamaica’s crime rate, travel advisories issued by foreign authorities and development in other competing tourist destinations, including Mexico, the Dominican Republic, Florida, Cuba and other Caribbean destinations.
Jamaica has a Master Plan for Sustainable Tourism, which it adopted in 1998. The plan includes:
| | • | | facilitating growth in selected areas; |
| | • | | enhancing the visitor experience through development of products from Jamaica’s culture; |
| | • | | creating heritage and diversified natural habitats; and |
| | • | | developing a model to foster more community involvement in the tourism sector. |
Jamaica and the relevant members of the tourism sector have agreed upon the details of the Master Plan and its implementation. Jamaica believes that the implementation of the Master Plan will ensure Jamaica’s competitive position through product diversification and improvement, lead to the adoption of sound environmental practices and create opportunities to allow more Jamaicans to participate directly in the tourism sector. The implementation of the Master Plan will continue on an ongoing basis.
In December 2004, the Tourism Enhancement Act, 2004 was passed. This act, as amended on August 2011, provides for a Tourism Enhancement Fee (TEF) of US$20.00 and US$2.00 to be paid by incoming airlines and cruise ship passengers, respectively. Funds from the TEF are to be placed in a dedicated fund to be used solely for implementing the recommendations emanating from the Master Plan.
The tourism industry’s commitment to sound environmental practices was evidenced in 1998 by the selection of Jamaica as the pilot destination for the launch of the Green Globe Hotel Certification Program. The project was executed by the Environmental Audits for Sustainable Tourism initiative funded through the United States Agency for International Development, in collaboration with the Jamaica Hotels and Tourist Association. Through this program, environmental audits were conducted for twenty hotels and one tourism attraction. Four Jamaican hotels became the first in the world to attain Green Globe Certification.
Several tourism entities have implemented environment management systems (EMS), and there are approximately six Green Global certified entities in Jamaica. Many of the Green Globe certified companies in Jamaica are part of the Sandals Resorts and SuperClubs chains. Having an effective environmental management system is a mechanism for improving operation efficiency and cutting waste. It is a good way to not only improve the organization’s environmental performance, but also to save money. Participating entities often reduce operating costs, which can lead to increased profitability. Programs such as the Green Globe certification scheme are a useful way for companies to effectively demonstrate their corporate social responsibilities.
D-22
Jamaica is located within the Atlantic hurricane zone and, as a result, the island is subject to the effects of major hurricanes, particularly in key sectors of the economy such as agriculture, tourism and mining. The Government through its Office of Disaster Preparedness and Emergency Management (ODPEM) has initiated measures aimed at mitigating the effects of such major hurricanes on the island.
A vulnerability and capacity assessment of the tourism and agriculture sector is being undertaken by the ODPEM along with the key sector stakeholders. The ODPEM, with the support of its parent ministry, completed the National Hazard Mitigation Policy, which was approved by Cabinet on November 4, 2005, and is currently initiating the process of developing the strategies and action plan for the implementation of the Policy. The disaster management legislation, called the Disaster Preparedness and Emergency Management Act, has been reviewed with a view to strengthening it. The ODPEM will also be undertaking a review of the national Disaster Management Programme and the National Disaster Organization given the changing demands of disaster management locally and globally.
Mining and Quarrying
The mining and quarrying sector of the Jamaican economy, dominated by the bauxite and alumina industries, is the country’s largest export sector. Based on 2011 production data, Jamaica is the seventh largest producer of bauxite in the world. Mining and quarrying accounted for approximately 2% of Jamaica’s GDP in 2011 and recorded an estimated increase in real growth of 4.3% in 2011 compared to 2010. The sector accounted for approximately 45.1% of Jamaica’s exports of goods and services in 2011.
The mining and quarrying industry increased by 19.4% in 2011 as compared to 2010, primarily due to increases in bauxite and alumina production. Alumina production moved from 1,590.7 thousand tonnes in 2010 to 1,959.9 thousand tonnes in 2011, representing a 23.2% increase.
The improved global environment and the absence of major weather-related disruptions to production in 2011 led to an increase in bauxite production of 19.3% to 10,188,882 tonnes, while the export of crude bauxite increased by 19.5% to 5,143,463 tonnes, each as compared to 2010. In 2011, the world aluminum industry continued to experience a recovery in demand and prices when compared to 2010. However, due to unfavorable market conditions, only one of the three shuttered Jamaican alumina plants remained open. Nevertheless, alumina production rose by 23.2% to 1,959,925 tonnes and exports of alumina rose 24.4% to 1,959,238 tonnes in 2011, as compared to 2010, due to the full-year operation at UC Rusal’s 650,000 tonne Ewarton Works alumina plant.
Results of operations of the bauxite and alumina industries are sensitive to fluctuations in global commodity prices. Foreign exchange earnings in the sector rose 40.6% to US$739.5 million in 2011, compared to US$525.8 million in 2010. The increase in foreign exchange earnings was mainly due to higher bauxite production and higher alumina prices in 2011, as compared to 2010. Earnings from bauxite exports increased 23.2% to US$149.2 million in 2011 from US$121.1 million in 2010, primarily due to the significantly increased export level of bauxite, as well as a marginal increase in prices as a result of new contract arrangements.
The increase of aluminum demand and the raise of its price during 2011 resulted in higher alumina Jamaican exports in 2011 relative to 2010. The increase of global alumina prices during 2011 resulted, in part, from a new system of indexation to the alumina spot market rather than to the 3-month aluminum London Metals Exchange (LME) price on which the alumina price was based during 2010. The price of alumina exported from Jamaica was US$301.3 per tonne in 2011, compared to US$256.9 per tonne in 2010, representing an increase of 17.3%.
In the first nine months of 2012, alumina production in Jamaica fell by 9.9%, to 1,324,077 tonnes, as compared to 1,469,570 tonnes in the first nine months of 2011. Crude bauxite production totaled 3,589,954 tonnes in the first nine months of 2012, representing a decrease of 7.6% compared to 3,883,549 tonnes in the same period of 2011. In the first nine months of 2012, alumina exports fell by 9.1%, to 1,342,405 tonnes, as compared to 1,476,816 tonnes in the first nine months of 2011. Also, in the first nine months of 2012, crude bauxite exports totaled 3,574,533 tonnes, representing a decrease of 7.7% compared to 3,872,193 tonnes in the same period of 2011. The decreases in the first nine-month period in 2012 was largely due to a reduction in production as a result of the technical disruptions at the plant.
D-23
The global price of aluminium decreased during the nine-month period ending September 30, 2012, to an average of US$2,025 per tonne, which was 19% lower than the comparable period of 2011. The decline was primarily due to the impact of the deepening financial and debt crisis in the Euro-zone, a slowdown in Chinese economic activity, and investors moving out of high-risk financial assets, including commodities.
Average Caribbean-sourced alumina spot prices for year-to-date September, 2012 have decreased 20.3% to US$310.94 per tonne compared to US$390.11 for the same period in 2011. Alumina prices in 2011 had strengthened as a result of new pricing mechanisms introduced by the major producers such as Alcoa Inc. and UC Rusal. The traditional indexing of alumina to aluminium prices was replaced in favour of linking them to the main driving factors affecting alumina production costs such as the cost of bauxite and energy.
The Government continued work on a National Minerals Policy, which, among other things, is intended to effectively manage mineral resources and mineral-bearing lands from the pre-mining to the post-mining stage. The policy is also directed towards expansion, diversification (especially in the area of energy) and modernization of the minerals industry.
Jamaica believes that it has mineable bauxite reserves sufficient to last approximately fifty years under current expectations about mining practices and market demand. This estimate of reserves is based on a range of technological and economic factors, and is subject to revision from time to time. In addition, the cost of exploiting mineable reserves can vary significantly depending on such factors as the location and mineralogical character of the reserves and technological progress in the industry.
In September 2011, UC Rusal acquired the remaining 35% stake in Alumina Partners of Jamaica (“Alpart”) from Norsk Hydro ASA for US$46 million and the refinery is now wholly owned by UC Rusal. This has extended the company’s reserve base as it seeks to be self-sufficient in raw materials. As such, UC Rusal is actively developing plans to resume production at the complex, which has been closed since 2009.
The following table shows the production, exports, prices and earnings of the bauxite and alumina sector for the five years ended December 31, 2011:
Bauxite and Alumina Sector
| | | | | | | | | | | | | | | | | | | | |
| | | 2007 | | | 2008 | | | 2009 | | | 2010 (1) | | | 2011 (1) | |
Bauxite | | | | | | | | | | | | | | | | | | | | |
Production (tonnes) | | | 14,567,739 | | | | 14,636,097 | | | | 7,815,119 | | | | 8,539,853 | | | | 10,188,882 | |
Exports (tonnes) | | | 4,451,640 | | | | 4,429,313 | | | | 3,196,331 | | | | 4,486,263 | | | | 5,143,463 | |
Prices (US$ per tonne)(2) | | | 25.4 | | | | 26.1 | | | | 29.0 | | | | 28.1 | | | | 28.4 | |
Earnings (US$ million)(3) | | | 115.4 | | | | 115.5 | | | | 92.8 | | | | 121.1 | | | | 149.2 | |
Alumina | | | | | | | | | | | | | | | | | | | | |
Production (tonnes) | | | 3,940,589 | | | | 3,995,358 | | | | 1,773,567 | | | | 1,590,659 | | | | 1,959,925 | |
Exports (tonnes) | | | 3,896,058 | | | | 4,034,558 | | | | 1,883,934 | | | | 1,575,312 | | | | 1,959,238 | |
Prices (US$ per tonne)(2) | | | 308.6 | | | | 310.8 | | | | 202.8 | | | | 256.9 | | | | 301.3 | |
Earnings (US$ million)(3) | | | 1,202.2 | | | | 1,253.8 | | | | 382.1 | | | | 404.7 | | | | 590.3 | |
| | | | | | | | | | | | | | | | | | | | |
Total Earnings (US$ million) | | | 1,317.6 | | | | 1,369.2 | | | | 474.9 | | | | 525.8 | | | | 739.5 | |
| | | | | | | | | | | | | | | | | | | | |
| (2) | Average price received. |
| (3) | Includes exports of hydrate |
Source: Jamaica Bauxite Institute.
Manufacturing
Real GDP for the manufacturing sector grew by 1.8% in 2011 following a decline of 3.8% in 2010. The higher real GDP in 2011 was primarily due to higher value added recorded in the food, beverages and tobacco component of manufacturing, which increased 2.9% when compared to the value added recorded in 2010 and the other manufacturing component, which increased 0.5% when compared to the value added recorded in 2010. The sector’s performance accounted for 8.6% of Jamaica’s GDP in 2011.
D-24
During 2011, the manufacturing sector was positively impacted by both demand-side and supply-side conditions. The overall growth in the local economy, particularly in the mining and agriculture industries, positively impacted domestic demand for manufactured goods. On the supply side, favorable weather conditions positively impacted production, particularly in the food, beverage and tobacco industries. In addition, increased access to financing due to lower interest rates supported greater investment in manufacturing.
Vision 2030 Jamaica, the country’s strategic plan, includes a policy framework for the manufacturing sector. This framework focuses on transitioning to higher levels of productivity and value-added production using efficient and clean technologies and environmentally sustainable processes, as part of an enabling regulatory environment. The fundamental goal for the manufacturing industry is to achieve levels of productivity that will enable the manufacturing sector to compete successfully in domestic and export markets.
Agriculture, Forestry and Fishing
During 2011, real value added for the Agriculture, Forestry & Fishing sector is estimated to have increased by 9.8% compared to 2010. This improved performance was primarily attributed to favorable weather conditions as well as the implementation of better farming practices as a result of the Production and Productivity Program implemented by the Ministry of Agriculture. The program is aimed at improving best practice methodologies among selected groups of farmers engaged in the production of a selected group of domestic crops. The program encourages the production of selected crops in areas that are best suited and by farmers who are willing to be trained to implement improved production practices.
The implementation of the second phase of the Agricultural Development Strategy, which began in 2006, continued in 2011. The strategy is aimed at transforming the agricultural sector by the year 2020 with the main focus being an increase in productivity. In addition, the Agriculture Sector Plan under Vision 2030 Jamaica was finalized in 2009 with a strategic framework that builds on Jamaica’s Agricultural Development Strategy. The Agriculture Sector Plan for Jamaica is one of the strategic priority areas of the Vision 2030 Jamaica—National Development Plan.
Since 1997, Jamaica has undertaken several initiatives to improve productivity and product quality while lowering production costs in the sugar and banana industries. In November 1997, Jamaica commenced a program to provide support to the local sugar industry following decades of financial losses in the industry. The critical points of the strategy are:
| | • | | promotion of a sustainable private-sector led sugar cane industry; |
| | • | | promotion of a diversified industry having as its major outputs raw sugar, molasses, ethanol and bagasse, a by-product used in the production of electricity; |
| | • | | strengthening of the economy and social infrastructure of sugar-dependent areas; and |
| | • | | divestment of the publicly owned sugar estates, which annually generate over 70% of sugar production. |
With respect to the banana industry, Jamaica participates in two externally supported projects that began in 1996: the United Kingdom/Northern Ireland/Jamaica Government project, aimed at reducing rejection due to peel scarring, and a European Union project, aimed at improving the competitiveness of the banana industry. Effective January 1, 2006, the European Union adopted a new “tariff-only” regime for bananas from countries that enjoy most favored nation status. The new regime also retains a duty-free annual quota for bananas originating in ACP countries so there has been no effect yet on Jamaica’s exports of bananas to the European Union. See “Jamaica—International Relationships—Cotonou Partnership Agreement.” Companies in the banana industry in Jamaica are also making efforts to increase competitiveness by diversifying and improving productivity. New products developed include banana-based drinks, banana flour and cereal products. Efforts to improve productivity include eliminating redundant labor and reducing labor costs through lower wage settlements. See “—Employment and Labor.”
D-25
The quantity of bananas produced in Jamaica was estimated at 46.6 tonnes in 2011 compared with 53.6 tonnes in 2010. This decline was due to the impact of Tropical Storm Nicole in September 2010. Export of bananas was insignificant in 2011 with earnings of J$0.05 million. The effects of Hurricane Dean which occurred in August 2007 are still affecting banana exports, since it destroyed approximately 85.0% of the existing crop at the moment, leading to a cessation of banana exports. Banana exports resumed in August 2008 but were again halted with the passage of Tropical Storm Gustav, which destroyed approximately 80.0% of the existing crop at the moment. These weather-related shocks led Jamaica’s largest exporter (Jamaica Producers), which accounts for 80.0% of banana exports, to make the decision to cease exports from Jamaica. In the absence of any significant export, the production of bananas continued to be influenced by local demand as well as demand for the value-added processed products.
Having divested the remaining three publicly owned sugar factories in 2010, the Government during 2011 continued the implementation of the Jamaica Country Strategy for the Adaptation of the Sugar Industry: 2006-2015. The key objective of this policy is the development of a sustainable private-sector led sugar cane industry by 2015. In support of the implementation of the Sugar Adaptation Strategy, the European Union agreed to provide financial assistance to the Government over the period 2006 - 2013, under the Accompanying Measures for Sugar Protocol Countries. In 2009, the European Union disbursed €6.1 million to the Government and the amounts disbursed in 2010 and 2011 were €11.6 million and €8.1 million, respectively.
The following table shows the production of selected agricultural products for the five years ended December 31, 2011:
Production of Selected Agriculture Products
| | | | | | | | | | | | | | | | | | | | |
| | | 2007 | | | 2008 | | | 2009 | | | 2010 | | | 2011 | |
| | | (in tonnes) | |
| | | | | |
Sugar cane | | | 1,968,009 | | | | 1,652,047 | | | | 1,334,579 | | | | 1,390,084 | | | | 1,518,339 | |
Yams | | | 113,124 | | | | 102,284 | | | | 124,516 | | | | 136,785 | | | | 134,619 | |
Bananas(1) | | | 17,473 | | | | 39 | | | | 45.3 | | | | 53.6 | | | | 46,660 | |
Potatoes | | | 33,531 | | | | 30,725 | | | | 42,937 | | | | 45,734 | | | | 57,424 | |
Citrus | | | 124,553 | | | | 122,291 | | | | 128,241 | | | | 117,440 | | | | n/a | |
Coffee | | | 15,117 | | | | 9,035 | | | | 12,456 | | | | 9 121 | | | | 8,099 | |
Cocoa | | | 1,915 | | | | 1,015 | | | | 1,108 | | | | 1,368 | | | | 498 | |
| (1) | Includes only export production data. |
Source: Planning Institute of Jamaica.
Construction
Real GDP for the construction industry grew by 0.8% during 2011 when compared to 2010. This was influenced by the improved performance in civil engineering activities, which benefited from continued spending on the widening of the Washington Boulevard Corridor, the Palisadoes Protection and Rehabilitation project and work under the Jamaica Development Infrastructure Programme (JDIP). Activities within building construction were impacted by a reduction in residential projects.
Privatization
Jamaica’s privatization program commenced in the early 1980s with the divestment of public services and small entities such as garbage collection and sanitation services. Larger sales have included interests in the hotel sector, the National Commercial Bank, Telecommunications of Jamaica Limited, Air Jamaica Limited, Petrojam-Belize and the Caribbean Cement Company Limited. Jamaica has continued its program of privatization by divesting 80% of its interest in the power and energy company, Jamaica Public Service Company Limited, in 2001. The Government granted a concession for the management of the transhipment terminal of the Kingston seaport to APM Terminals and Amalgamated Stevedoring Co. Ltd., a consortium of foreign and local entities, in October 2001. The consortium assumed management of the terminal in February 2002. The contract expired in February 2009 and the terminal is now being managed by the Port Authority of Jamaica.
D-26
In connection with the privatization of Air Jamaica Limited in 1994, the Government retained ownership for its own account of 25.0% of the airline’s ordinary shares and ownership of an additional 5.0% of its ordinary shares, which the Government was contractually obligated to contribute to an employee share ownership plan. During the period of privatization, the Government provided US$169.0 million in loans and assistance to the airline. In December 2004, Jamaica purchased the remaining 75% of the ordinary shares for US$1.00 and converted approximately US$395 million, the total liabilities of Air Jamaica owed to the Government, into ordinary shares.
In the fiscal year 2007/2008, the decision was made to re-privatize the national carrier Air Jamaica Limited. To this end, the Government sought a divestment that achieved certain strategic objectives. On May 1, 2010, the Government entered into an agreement with Caribbean Airlines pursuant to which Caribbean Airlines obtained the routes of Air Jamaica and agreed to provide sustainable airlift to Jamaica. In return the Government acquired a 16% equity interest in Caribbean Airlines valued at US$28.5 million. The Government remains the owner of the remaining assets and liabilities of Air Jamaica. Under an agreement, Caribbean Airlines will lease some of these assets from Air Jamaica. The Government is liquidating the remaining assets of Air Jamaica as appropriate and will continue to service the liabilities.
Jamaica re-privatized the government-owned assets of the sugar cane industry in August 2011. A Sugar Cane Negotiating Team was appointed to oversee the divestment process by the Ministry of Agriculture and Cabinet. In July 2009, the team concluded the divestment of three of the six sugar estates—St. Thomas/Duckenfield, Long Pond and Hampden—for an aggregate sale price (for the factories) of US$2 million. The associated sugar cane lands were divested through 50 year leases. In July 2010, the Government signed an agreement with Complant International Sugar Industry Co. Limited, a Chinese firm, for the sale of the Monymusk, Frome and Bernard Lodge sugar factories and associated farmlands of the Sugar Company of Jamaica (SCJ) Holdings for US$9 million. Under the agreement, the firm is committed to invest US$127 million, approximately, during 2011-2013, on modernizing the factories. The firm is also investigating the feasibility of constructing a sugar refinery and ethanol plant. At present there are post-divestment matters outstanding as it relates to contractual obligations between the purchasers and the Sugar Company of Jamaica Holding, on the sale of the six sugar estates. Post-closing issues remaining outstanding to be addressed by the Government at September 2012 included remedy of environmental breaches, land transfer, and the facilitation of the approval of all regulatory licences. These matters are being pursued by the respective parties (the Government and Complant International Sugar Industry Co. Limited).
During FY 2010/201, Jamaica privatizated lands at Montpelier, St. James, and land and buildings at Ariguanabo. In January 2010, the sale of 525 acres of the Montpelier Citrus Company Limited lands was approved by the Cabinet. The land was sold for J$52 million to Ramble Enterprises Limited, a local company engaged in dairy farming.
In March 2010, the Cabinet approved the sale of 14 acres of land (with buildings) of the Ariguanabo property to the existing lessee, New Era Homes Limited for an aggregate sale price of J$163.9 million.
In December 2010, the Government finalized the sale of the National Hotel and Properties interest in the Jamaica Pegasus Hotel Limited. The shares were sold for US$11 million.
D-27
The following table shows a summary of certain major entities privatized and the proceeds received by Jamaica since 2000 in relinquishing its majority or residual:
Summary of Certain Major Jamaican Entities Privatized (By Sale)(1) (2)
| | | | | | | | | | | | | | | | |
Entity | | Year(s) of
Privatization | | | Type of Sale | | Payment
Received
in
J$Million | | | Payment
Received in
US$ Million | | | Sector |
Ashtrom Jamaica Limited | | | 2000 | | | Shares | | | 22.00 | | | | N/A | | | Housing |
Jamaica Public Service Co. Ltd. | | | 2001 | | | Shares | | | N/A | | | | 201.00 | | | Energy |
Aqualapia Limited | | | 2002 | | | Shares | | | 32.35 | | | | N/A | | | Agri-Business |
Sangster International Airport | | | 2003 | | | Lease | | | 7.00 | | | | N/A | | | Transportation |
Land – Ariguanabo (13.76 hectares) | | | 2003 | | | Sale | | | 23.48 | | | | N/A | | | Housing |
Building (Lot 5A) – 60,000 square feet | | | 2003 | | | Lease | | | 7.68 | | | | N/A | | | Warehousing |
Building (Lot 5B) – 60,000 square feet | | | 2003 | | | Lease | | | 7.68 | | | | N/A | | | Manufacturing |
Cotton Polyester Textile Company Ltd. | | | 2004 | | | Lease | | | 7.55 | | | | N/A | | | Manufacturing |
Land – Salt River (51 hectares) | | | 2005 | | | Sale | | | 6.93 | | | | N/A | | | Tourism |
Farm Machinery Center | | | 2006 | | | Lease | | | N/A | | | | 0.18 | | | Manufacturing |
Hampden & Long Pond Estate | | | 2009 | | | Sale/Lease | | | N/A | | | | 1.5 | | | Agriculture |
Duckenfield Estate | | | 2009 | | | Sale/Lease | | | N/A | | | | 0.5 | | | Agriculture |
Land – Montpelier Citrus Company Limited – 525 acres | | | 2010 | | | Sale | | | 52.00 | | | | N/A | | | Agriculture |
Land and Buildings – Ariguanabo | | | 2010 | | | Lease/Sale | | | 163.90 | | | | N/A | | | Manufacturing |
Jamaica Pegasus Hotel of Jamaica Limited(2) | | | 2010 | | | Sale | | | N/A | | | | 11.00 | | | Tourism |
Bernard Lodge, Frome & Monymusk | | | 2010 | | | Sale/Lease | | | N/A | | | | 9.00 | | | Agriculture |
| (1) | Where payment is received in both JA dollars and US dollars for certain sales, the amounts listed are not equivalencies, but represent the portion of the payment received in each currency. This table does not include entities divested by FINSAC. |
| (2) | This table does not reflect the privatization of Air Jamaica. For information about such privatization please refer to Section“—Privatization”. |
| (3) | The sale of the Government’s 59.81% holding in the hotel was completed in December 2010. |
Source: National Investment Bank of Jamaica Limited/Development Bank of Jamaica Limited, Ministry of Finance and Planning.
Inflation
The macroeconomic stabilization program introduced in 1991, which focused on lowering inflation through tight fiscal and monetary policies and stability in the foreign exchange market, has contributed to a consistent reduction in the rate of inflation. Macroeconomic stability continues to be a primary focus of Jamaica under the National Industrial Policy, as Jamaica regards consistent low levels of inflation as the cornerstone of sustained long-term economic growth.
The Consumer Price Index number series, which measures the rate of inflation, was revised in 2007. The series now has a base year of December 2006. It also has 12 divisions that are based on the United Nations Statistical Division—Classification of Individual Consumption According to Purpose (COICOP). The “basket” of consumer goods and services now has approximately 482 commodities, an increase from 231 in the previous series.
The increase in the Consumer Price Index from January through October 2012 was 6.3% compared to 7.7% for the same period in 2011. The main factor contributing to the decrease in the inflation rate in 2012 as compared to 2011, was the reduction of the cost of agricultural production, as a result of increased domestic supply, moderating the effect of increases in the international prices of oil and grain. This in turn impacted the cost of bread and cereals, electricity, water and fuels used for transport. Reduced prices in the telecommunications sector also contributed to the decrease in the rate of inflation in the first 10 months period of 2012.
Inflation for 2011 was 6.0% based on the Consumer Price Index. The 2011 inflation rate represented a decline of 5.7% over the 11.7% rate recorded in 2010, which in turn represented an increase of 1.5 percentage points over the 10.2% rate recorded in 2009. This represented a decline from the 16.8% rate recorded in both 2008 and 2007, and an increase from the 5.7% rate recorded in 2006. In 2011, there was relatively low incidence of extreme weather and an uneventful hurricane season. Consequently, the local agricultural sector was not affected by severe droughts, flooding and hurricanes that occurred in previous years. Inflation out-turn for 2011 was also influenced by other domestic and international factors such as fluctuations in oil prices in the world market. Weather conditions in the world economy continued to affect the price of imported commodities such as rice, wheat and soybeans. The impact of these factors on inflation was moderated by continued low demand conditions and the appreciation of the domestic currency against the US dollar.
D-28
The following table shows the changes in the Consumer Price Index for the five years ended December 31, 2011, and the ten-month period from January through October 2012:
| | | | |
Year/Period | | Consumer Price Index Increase
Over Previous Year | |
| | | (%) | |
| |
2007 | | | 16.8 | |
2008 | | | 16.8 | |
2009 | | | 10.2 | |
2010 | | | 11.7 | |
2011 | | | 6.0 | |
October 2012 | | | 6.3 | |
Source: Statistical Institute of Jamaica.
Employment and Labor
In 2011, the total labor force in Jamaica was 1,251,900 persons, a 0.2% increase compared to 1,249,600 persons in 2010. The service sector employed 67.1% of the employed labor force in 2011, while the goods-producing sector accounted for 32.9% of the employed labor force in the same period. The agriculture and manufacturing sub-sectors accounted for 17.6% and 6.8% of the employed labor force, respectively.
Average employment in 2011 was 1,093,500 compared to 1,094,900 in 2010. The average unemployment rate was 12.7% in 2011, an increase from 12.4% in 2010.
There were 247 industrial disputes and 10 work stoppages in 2011, compared to 203 industrial disputes and 12 work stoppages in 2010 and 150 industrial disputes and 4 work stoppages in 2009, as difficulties were experienced in the negotiation of new wage and fringe benefit packages. A total of 2,704 man-days were lost to work stoppages in 2011 in comparison to 7,942 man-days lost to work stoppages in 2010. This has resulted in an average of 1.9 lost man-days per worker in 2011 that were related to work stoppages as compared to 2.5 lost man-days per worker in 2010.
Due to the economic conditions prevalent at the moment, the scheduled 7% pay increase for public sector workers due April 2009 was not implemented. The Government implemented such increase on September 2011 recognizing April’s 2009 increase. The balance of the increased payment not recognized in 2009 (from May 2009 to August 2009) was paid in December 2011. The arrears for two years (FY 2009/10 and FY 2010/11) are scheduled to be discharged over the medium term, with two payments in FY 2012/13, and FY 2013/14 and one payment in FY 2014/15.
The following table shows certain labor force and employment data for the five years ended December 31, 2011:
Labor Force and Employment(1)
| | | | | | | | | | | | | | | | | | | | |
| | | 2007 | | | 2008 | | | 2009 | | | 2010 | | | 2011 | |
| | | (in thousands of persons, except percentages) | |
| | | | | |
Total Population | | | 2,682.1 | | | | 2,692.4 | | | | 2,698.8 | | | | 2,705.8 | | | | 2,711.1 | |
Labor Force | | | 1,276.9 | | | | 1,299.6 | | | | 1,269.8 | | | | 1,249.6 | | | | 1,251.9 | |
Employed Labor Force | | | 1,152.6 | | | | 1,162.2 | | | | 1,125.5 | | | | 1,094.9 | | | | 1,093.5 | |
Unemployed Labor Force | | | 124.1 | | | | 137.3 | | | | 144.3 | | | | 154.7 | | | | 158.4 | |
Unemployment Rate (%) | | | 9.7 | | | | 10.6 | | | | 11.4 | | | | 12.4 | | | | 12.7 | |
Job-Seeking Rate (%) | | | 5.8 | | | | 6.6 | | | | 7.2 | | | | 7.6 | | | | 8.0 | |
Labor Force Participation Rate (%) | | | 64.9 | | | | 65.5 | | | | 63.6 | | | | 62.4 | | | | 62.3 | |
| (1) | The data above represents the derived annual average. |
Source: Statistical Institute of Jamaica, Labour Force Survey.
D-29
Legal Proceedings and Processes
NTCS Matter
The Ministry of Transport and Works granted franchises to the National Transport Cooperative Society (NTCS) in March 1995 to operate buses in the Kingston Metropolitan area. The Ministry of Transport and Works terminated the franchises with NTCS in September 1998. NTCS, in arbitration proceedings with the Ministry of Transport and Works, claimed damages of approximately J$50 billion, plus interest, alleging breach of contract resulting from the termination of the franchises. On October 2, 2003 an arbitration tribunal awarded to NTCS the sum of J$4.5 billion, plus interest, to be paid by the Government. The Government commenced legal proceedings in the Supreme Court of Jamaica on October 27, 2003, challenging this award. Judgment was delivered on November 29, 2004, in favor of the Government and the arbitral award was set aside. The NTCS appealed the decision of the Supreme Court, which appeal was heard by the Jamaican Court of Appeal in January 2006. The Court of Appeal handed down judgment in favor of the Government on May 9, 2008, confirming the decision of the Supreme Court. The NTCS appealed the decision of the Jamaican Court of Appeal to the Judicial Committee of the Privy Council in England. The appeal was heard on June 29 and 30, 2009, and on November 26, 2009, and the Judicial Committee of the Privy Council upheld the appeal in favor of the NTCS and remitted the matter to the Jamaican Court of Appeal for damages to be assessed. On various dates in September 2011 and on December 20, 2010, the Court of Appeal heard a preliminary application by NTCS challenging the admission of expert evidence tendered by the Government. On December 20, 2010, the Court of Appeal ruled in favor of NTCS on the preliminary application. The Court of Appeal heard the referral submitted to it by the Privy Council for damages to be assessed in March, April and September, 2011. On December 20, 2010, the Court of Appeal delivered its judgment in the matter, assessing damages to be paid by the Government at approximately J$1.8 billion plus interest. The Court of Appeal reserved its judgment in relation to costs in the matter, pending receipt of further submissions from the parties. On March 9, 2012, the Court of Appeal apportioned costs in the matter. On June 1 and 11, 2012 the Court of Appeal granted the Government conditional leave to appeal to the Privy Council its decisions of December 20, 2010, September 30, 2011 and March 9, 2012, which includes an appeal in relation to the award of damages and costs. On December 3 and 7, 2012, the Court of Appeal heard the application of the Government for final leave to appeal to the Privy Council in relation to its decisions of December 20, 2010, September 30, 2011 and March 9, 2012 and also in relation to a stay of execution of said decisions. On December 7, 2012 the Court of Appeal ordered the stay of execution on condition that the Government pay the sum of $370,434,402.41 to the NTCS’s attorneys-at-law by the 7th February 2013. The Court of Appeal also granted final leave to the Government to appeal to the Privy Council as aforesaid on condition that it file the Record of Appeal within 7 days of the 7th December 2012. The Court of Appeal further ordered that NTCS’s attorneys, give by the 10th of December 2012 a written undertaking to not dispose of the funds until the appeal is heard and determined. In relation to the stay of execution the Government may consider making an application to the Privy Council for a full stay of execution.
Sandals Whitehouse
A claim has been made in the Supreme Court of Jamaica on November 9, 2005, by Gorstew Limited and Sandals Whitehouse Management Limited (Sandals) against Ackendown Newtown Development Company Limited (Andco), the Development Bank of Jamaica (DBJ) and the Urban Development Corporation (UDC) as it relates to the apportionment of cost overruns incurred in the construction of the Sandals Whitehouse Hotel. The approved budget for the building and equipping of the Sandals Whitehouse Hotel was US$70 million but there were cost overruns of US$29 million. Gorstew Limited also filed claims for damages of US$28.8 million, unspecified brand damages, interest and costs. The parties had agreed to have the matter settled by arbitration. Arbitration commenced, but has been suspended, pending settlement negotiations. The parties have executed a deed of settlement dated February 7, 2011, wholly discontinuing the matter before the Supreme Court as well as the arbitration.
Cigarette Company of Jamaica
The matter concerned whether certain transfers, reflected on the books of both the Cigarette Company of Jamaica Limited and Carreras Group Ltd. (CCJ), were distributions or loans. If they were distributions, transfers would be subject to income tax deducted at source. The Commissioner of Taxpayer Audit and Assessment (the Commissioner) assessed the CCJ to pay income tax for the years 1997–2002. The total amount assessed was J$5.7
D-30
billion, comprised of J$2.17 billion in tax and penalties of J$3.54 billion. The CCJ appealed against the assessments to the Commissioner of Taxpayer Appeals, who dismissed the appeal on November 23, 2004. The CCJ then appealed to the Revenue Court and the appeal was dismissed on October 30, 2007. In November 2007, the CCJ paid approximately J$1.7 billion to the Inland Revenue Department for income tax for the years 1997 - 2002 and penalties based on the judgment in favor of the Commissioner. The CCJ appealed the decision of the Revenue Court and on February 12, 2010, the Court of Appeal held that the transfers were loans and not subject to income tax. This judgment was subject to appeal by the Commissioner. The Government obtained the order for final leave to appeal to the Judicial Committee of the Privy Council and the matter was heard on February 15, 2012. On March 13, 2012, the Privy Council handed down its judgment dismissing the appeal of the Commissioner with costs before the Board. Full and final settlement of costs have been was agreed between the parties in favor of CCJ in the sum of £142,000.00. The £142,000.00 in respect of the costs of the Privy Council appeal has been paid by the Government. The amount received by the Inland Revenue Department has not been refunded to CCJ.
Legal Processes
During 2010, the Government continued its program to modernize the country’s law enforcement infrastructure, transforming the culture of the Jamaican Constabulary Forces (JCF) into a modern policing service and restore public confidence by:
| | • | | actively targeting corruption within the JCF; |
| | • | | improving the professionalism of police officers through intense leadership and management training and development; |
| | • | | implementation of a performance management system with targets and verifiable indicators for the executive leadership of the JCF; |
| | • | | revising the JCF Use of Force policy with emphasis on ethical policing and protecting the rights of citizens; |
| | • | | enhancing the use of technology for management and intelligence gathering; |
| | • | | enacting a major program of legislative reform including restructuring the accountability framework of the JCF; and |
| | • | | implementing community policing in all policing divisions. |
The current policing strategy is working in tandem with the Ministry of National Security’s emphasis on crime and violence prevention strategies and improved community safety through the development of a Crime Prevention and Community Safety Strategy. The strategy is based on the following:
| | • | | creating community-based partnerships to enhance local governance structures; |
| | • | | diversion and reintegration of ex-offenders and deported persons in order to reduce re-offending; and |
| | • | | establishment of prevention programs that focus on young people at risk of involvement in crime and violence. |
The Ministry’s crime prevention efforts are duly supported by the following international partners:
| | • | | the United Nations Development Program, Jamaica Violence Prevention, Peace & Sustainable Development Program (JSPD); |
| | • | | the United States Agency of International Development; |
D-31
| | • | | the European Union’s Poverty Reduction Program II—Capacity Building and Training for Communities Component; |
| | • | | the Canadian Improved Governance and Citizen Security and Participation Program/Community Empowerment and Transformation; |
| | • | | the United Kingdom Department for International Development (DFID) Rehabilitation and Reintegration of Local Offenders and Deported Persons Programme; |
| | • | | DFID, which is also supporting policy development and social intervention through the Community Security Initiative; and |
| | • | | the Citizen Security and Justice Program funded by the IADB which is set to continue for an additional four years in vulnerable communities. |
Measures taken by the Government in 1993 to enhance security, particularly in the major resort areas of the north coast where special tourist security personnel were assigned, have been successful in reducing crimes against tourists. The economy and foreign direct investment can be negatively affected by a material increase in violent crimes and drug trafficking. If the recent decreases in crime were not to continue and there were a material increase in violent crimes and drug trafficking, this could have a material negative impact on the Jamaican economy by reducing tourism and the sectors of the economy that benefit from tourism as well as foreign direct investment.
As reported by the JCF Statistics Unit, the number of reported cases of murder during the month of June 2012 decreased by 2% from the corresponding period in 2011. When compared to the corresponding period of 2011, crime statistics for January 1, 2012 - December 08, 2012 period revealed a 3% decreased in the total number of reported cases of murder. The crime figures for the same period showed a 7% decreased in the total number of reported major crimes for 2012, as compared with the same period of 2011. Serious violent crimes, which include murders and shootings, showed a 6% decreased during January 1, 2012 - December 08, 2012 as compared with the corresponding period of 2011.
In the period of May 2010 to July 2010, the Government, in an effort to address an outbreak of violence connected with the extradition of an individual to the United States, declared a state of emergency in Kingston and St. Andrew during the period of May 23, 2010 to July 23, 2010 and in St. Catherine during the period of June 23, 2010 to July 23, 2010, and took measures to increase security and restore safety to communities. Although 101 murders occurred in these cities during the period of May 23, 2010 to June 22, 2010, the measures taken by the Government resulted in a 63% drop in murders during the period of June 23, 2010 to July 23, 2010 as compared to the period of May 23, 2010 to June 22, 2010. This strategic policing plan will remain in effect to enhance the overall security of the island and curb the operations of criminal gangs. The JCF has implemented a Street Crimes Unit that targets such activities in major towns and minimize the threats that gangs pose to the safety and security of communities. The Peace Management Initiative has also continued to have significant results at the community level.
In addition, the Government is proceeding assiduously with work to strengthen the legislative tools available to the criminal justice system. The law enforcement apparatus has been enhanced with the promulgation of critical amendments to six pieces of legislation that will assist the police and prosecutors in their crime-fighting efforts. Additionally, the Ministry of National Security has proposed and gained approval for the development of Anti-Gang Legislation, targeting criminal organizations which have been at the heart of the criminal threat facing the country. There are a number of other anti-crime legislative initiatives pending.
D-32
THE EXTERNAL ECONOMY
Balance of Payments
Jamaica’s balance of payments is dependent on international economic developments as well as domestic economic policies and programs. In 2011, the balance of payments recorded an overall deficit of US$205.2 million as compared to a surplus of US$442.0 million in 2010. For the period January to June 2012, there was a balance of payments deficit of US$425.7 million relative to a surplus of US$95.8 million for the period January to June 2011. For 2011, the current account deficit increased by 126.7% to US$2,109.8 million from US$930.8 million in 2010. The deterioration in the current account deficit in 2011 resulted from deteriorations in all sub-accounts. For the period January to June 2012, there was a current account deficit of US$642.7 million, which represented an improvement of US$148.1 million relative to the corresponding period in 2011. The improved performance in the current account for January – June 2012 was a result of improvements in the goods, income and current transfers sub-accounts. The current account measures the trade balance plus the balance on services, income and current transfers.
The merchandise trade deficit increased by 30.8% to US$4,257.6 million in 2011 from US$3,256.2 million in 2010, reflecting the net effect of increases in both imports and exports. For the purpose of this paragraph, exports include free-zone exports and goods procured in ports, while imports include free-zone imports and goods procured in ports. Further, imports are recorded at their market value at the customs frontier of the economy from which they are exported. The value of exports increased by US$293.6 million to US$1,664.8 million in 2011 from US$1,371.2 million in 2010, primarily due to an increase in crude materials largely reflecting alumina exports. The value of imports increased by US$1,295.0 million to US$5,922.4 million in 2011 relative to 2010 primarily due to an increase in the value of mineral fuels.
During the period January to June 2012, the merchandise trade deficit declined by 0.8% to US$1,937.3 million relative to the corresponding period in 2011. The improvement in the merchandise trade deficit primarily reflected a greater decrease in imports than the corresponding reduction in exports. The reduction in imports of US$31.9 million was mainly due to declines in chemicals and mineral fuel imports. The value of exports decreased by US$17.2 million and was mainly attributable to a reduction in crude materials.
The surplus on the services account decreased by 17.3% to US$669.8 million in 2011 from US$810.0 million in 2010, primarily due to an increase in payment for freight. Similarly, for January to June 2012, the surplus on the services sub-account declined by 0.7% to US$447.5 million relative to the corresponding period of 2011, which resulted primarily from an increase in net transportation outflows.
The deficit on the income account of US$518.4 million for 2011 represented an increase of 4.8%, from US$494.6 million in 2010. This resulted from a reduction in income earnings. During the period from January to June 2012, net income outflows decreased by 41.9% to US$156.4 million, from US$269.1 million in the corresponding period of 2011. This resulted primarily from a reduction in income outflows from foreign direct investment companies.
For 2011, net current transfers decreased by 0.7% to US$1,996.4 million, from US$2,010.0 million in 2010. The deterioration in net current transfers was primarily attributable to a 27.3% reduction in official transfers. From January to June 2012, net current transfers increased by 2.4% to US$1,003.6 million from US$979.9 million in the corresponding period in 2011. The improvement in net current transfers during January to June 2012 was primarily attributable to a 3.5% increase in net remittance inflows to US$890.9 million, from US$860.9 million in the corresponding period of 2011.
The balance of payments results in 2011 were influenced by net capital inflows from official and private sources, which were insufficient to finance the current account deficit. Consequently, the net international reserves decreased by US$205.2 million to US$1,966.1 as of December 31, 2011, from US$2,171.4 million as of December 31, 2010. During the period January to June 2012, the net international reserves decreased by US$425.7 million to US$1,540.4 million, as official and private flows were also insufficient to finance the current account deficit.
D-33
The following table shows Jamaica’s balance of payments for the five years ended December 31, 2011 and other periods in 2011 and 2012 as indicated:
Balance of Payments
| | | | | | | | | | | | | | | | | | | | | | | | | | | | |
| | | 2007 | | | 2008 | | | 2009 | | | 2010 | | | 2011 | | | Jan-Jun
2011 | | | Jan-June
2012(1) | |
| | | (in millions of US$) | |
Current Account | | | (2,038.2 | ) | | | (2,793.3 | ) | | | (1,127.5 | ) | | | (930.8 | ) | | | (2,109.8 | ) | | | (790.7 | ) | | | (642.7 | ) |
Goods Balance | | | (3,841.3 | ) | | | (4,802.9 | ) | | | (3,087.9 | ) | | | (3,256.2 | ) | | | (4,257.6 | ) | | | (1,952.1 | ) | | | (1,937.3 | ) |
Exports(2) | | | 2,362.6 | | | | 2,743.9 | | | | 1,387.7 | | | | 1371.2 | | | | 1,664.8 | | | | 879.8 | | | | 862.6 | |
Imports(3) | | | 6,203.9 | | | | 7,546.8 | | | | 4,475.6 | | | | 4,627.4 | | | | 5,922.4 | | | | 2,831.9 | | | | 2,800.0 | |
Services Balance | | | 424.8 | | | | 428.1 | | | | 769.9 | | | | 810.0 | | | | 669.8 | | | | 450.4 | | | | 447.5 | |
Transportation | | | 112.9 | | | | (644.7 | ) | | | (441.2 | ) | | | (429.7 | ) | | | (576.1 | ) | | | (250.5 | ) | | | (273.1 | ) |
Travel | | | 1,611.9 | | | | 1,707.7 | | | | 1,709.0 | | | | 1,808.8 | | | | 1,853.6 | | | | 1,016.7 | | | | 1,042.4 | |
Other Services | | | (646.7 | ) | | | (634.9 | ) | | | (497.9 | ) | | | (569.1 | ) | | | (607.7 | ) | | | (315.8 | ) | | | (321.9 | ) |
Goods and Services Balance | | | (3,416.5 | ) | | | (4,374.8 | ) | | | (2,318.0 | ) | | | (2,446.2 | ) | | | (3,587.8 | ) | | | (1,501.6 | ) | | | (1,489.8 | ) |
Income | | | (661.6 | ) | | | (568.3 | ) | | | (667.9 | ) | | | (494.6 | ) | | | (518.4 | ) | | | (269.1 | ) | | | (156.4 | ) |
Compensation of Employees | | | 64.8 | | | | 83.7 | | | | 67.6 | | | | 89.1 | | | | 36.5 | | | | 1.7 | | | | 11.4 | |
Investment Income | | | (726.4 | ) | | | (651.9 | ) | | | (735.5 | ) | | | (583.7 | ) | | | (554.9 | ) | | | (270.8 | ) | | | (167.8 | ) |
Current Transfers | | | 2,039.9 | | | | 2,149.8 | | | | 1,858.4 | | | | 2,010.0 | | | | 1,996.4 | | | | 979.9 | | | | 1,003.6 | |
General Government | | | 133.0 | | | | 100.7 | | | | 143.9 | | | | 194.3 | | | | 141.3 | | | | 73.3 | | | | 66.9 | |
Other Sectors | | | 1,906.9 | | | | 2,049.1 | | | | 1,714.5 | | | | 1,815.7 | | | | 1,855.1 | | | | 906.6 | | | | 936.7 | |
Capital and Financial Account | | | 2,038.2 | | | | 2,793.3 | | | | 1,127.5 | | | | 930.8 | | | | 2,109.8 | | | | 790.7 | | | | 642.7 | |
Capital Account | | | (35.5 | ) | | | 18.1 | | | | 20.7 | | | | (22.1 | ) | | | (9.1 | ) | | | (10.0 | ) | | | (17.1 | ) |
Official | | | 0.7 | | | | 48.6 | | | | 45.3 | | | | 4.2 | | | | 29.0 | | | | 10.0 | | | | 3.0 | |
Private | | | (36.2 | ) | | | (30.5 | ) | | | (24.5 | ) | | | (26.3 | ) | | | (38.2 | ) | | | (20.1 | ) | | | (20.1 | ) |
Financial Account | | | 2,073.7 | | | | 2,775.2 | | | | 1,106.7 | | | | 952.9 | | | | 2,119.0 | | | | 800.8 | | | | 659.7 | |
Other Official Investment | | | 653.0 | | | | 518.6 | | | | 254.7 | | | | 967.7 | | | | 497.9 | | | | 177.5 | | | | 353.4 | |
Other Private Investments (including errors and omissions) | | | 980.9 | | | | 2,151.8 | | | | 808.4 | | | | 427.2 | | | | 1,415.8 | | | | 719.0 | | | | (119.4 | ) |
(Increase)/Decrease in reserves(4) | | | 439.8 | | | | 104.8 | | | | 43.6 | | | | (442.0 | ) | | | 205.2 | | | | (95.8 | ) | | | 425.7 | |
| (2) | Based on recommendations contained in the IMF’s Balance of Payments Manual, exported goods include free-zone exports and goods procured in ports. |
| (3) | Based on recommendations contained in the IMF’s Balance of Payments Manual, imported goods are recorded at their market value at the customs frontier of the economy from which they are exported and include free-zone imports and goods procured in ports. |
| (4) | Official International Reserves held by Jamaica and the Bank of Jamaica. |
Source: Bank of Jamaica.
Foreign Trade
Total merchandise trade (exports plus imports) between Jamaica and its foreign trade partners in 2011 increased by 23.7% to US$8,239.1 million, as compared to US$6,662.1 million in 2010. The merchandise trade deficit grew by 25.1% in 2011 to US$4,990.5 million, as compared to US$3,990.8 million in 2010.
The deficit in 2011 resulted from a 24.2% increase in the value of imports, principally due to the sharp increase in the price of fuels, higher imports of mineral fuels, machinery and transport equipment, food, chemicals and manufactured goods. The value of exports increased by 21.6% due, primarily, to significantly higher earnings from alumina, bauxite and mineral fuels.
D-34
The following table shows the performance of merchandise trade for the five years ended December 31, 2011, and other periods in 2011 and 2012 as indicated:
Merchandise Trade
| | | | | | | | | | | | | | | | | | | | | | | | |
| | | Imports(1) | | | % Change | | | Exports | | | % Change | | | Balance | | | % Change | |
| | | (in millions of US$, except percentages) | |
| | | | | | |
2007(3) | | | 6,893.0 | | | | 20.0 | | | | 2,305.2 | | | | 15.1 | | | | (4,587.8 | ) | | | 22.5 | |
2008(3) | | | 8,361.0 | | | | 21.3 | | | | 2,682.8 | | | | 16.4 | | | | (5,678.2 | ) | | | 23.8 | |
2009(2) | | | 5,057.6 | | | | (39.5 | ) | | | 1,319.4 | | | | (50.8 | ) | | | (3,738.2 | ) | | | 34.2 | |
2010(3) | | | 5,326.4 | | | | 5.3 | | | | 1,335.7 | | | | 1.2 | | | | (3,990.8 | ) | | | 6.8 | |
2011(3) | | | 6,614.8 | | | | 24.2 | | | | 1,624.3 | | | | 21.6 | | | | (4,990.5 | ) | | | 25.1 | |
Jan – June 2011(2) | | | 3,160.8 | | | | 28.0 | | | | 848.5 | | | | 26.5 | | | | (2,312.3 | ) | | | 28.6 | |
Jan – June 2012(2) | | | 3,120.8 | | | | (1.3 | ) | | | 847.1 | | | | (0.2 | ) | | | (2,273.7 | ) | | | 26.4 | |
| (1) | Merchandise imports are cost, insurance and freight values, which differ in presentation from the import values presented in the balance of payments. |
| NB: | Effective 2010 data on the Jamaica Free Zone (Kingston, Montego Bay along with the Single Entity Free Zone) is being included. Prior to 2010 only data on the Single Entity Free Zone was included. The Single Entity Free Zone fell within the Customs territory. |
Source: Statistical Institute of Jamaica.
Exports
Total exports (including the Jamaica Free Zone) during 2011 increased by 21.6% to US$1,624.3 million, compared to US$1,335.7 million in 2010, primarily due to increased earnings from alumina, bauxite and mineral fuels.
Traditional exports (including the Jamaica Free Zone) increased by 31.9% to US$862.7 million, from US$654.3 million in 2010. Earnings from the mining and quarrying sector in 2011 increased by 36.3% to US$725.1 million from US$532.0 million in 2010 due to increased activity in bauxite operations. Alumina exports in 2011 were valued at US$583.1 million, increasing from US$402.8 million in 2010, an increase of US$180.3 million. In 2011, bauxite exports, which are primarily exported to the United States, increased by 10.2%, or US$13.2 million, to US$141.9 million. The value of sugar exported in 2011 amounted to US$62.2 million, which was 40.5% higher than the US$44.2 million earned in 2010.
Non-traditional exports (including the Jamaica Free Zone) increased by 12.8% to US$675.5 million in 2011 from US$599.1 million in 2010, primarily due to the significant increase in earnings from mineral fuels, crude material (primarily waste and scrap), beverages and food. Receipts from mineral fuels increased to US$371.8 million in 2011 from US$291.2 million in 2010 primarily due to higher prices for fuel on the world market. Ethanol exports fell by US$39.3 million to US$8.7 million in 2011 from US$48.1 million in 2010. The implementation of the United States Trade and Development Act of 2000, which provides Caribbean countries, including Jamaica, with NAFTA-like privileges, may remove some of the structural barriers in the United States to non-traditional exports from these countries. See “Jamaica—International Relationships—The Trade and Development Act of 2000.” For the purposes of this discussion, exports exclude free-zone exports and goods procured in ports.
D-35
The following table shows Jamaica’s exports by sector for the five years ended December 31, 2011, and other periods in 2011 and 2012 as indicated:
Exports
| | | | | | | | | | | | | | | | | | | | | | | | | | | | |
| | | 2007 (2) | | | 2008 (2) | | | 2009(1) | | | 2010(2) | | | 2011(2) | | | Jan – June
2011(2) | | | Jan – June
2012(2) | |
| | | (in millions of US$) | |
| | | | | | | |
Traditional Exports | | | | | | | | | | | | | | | | | | | | | | | | | | | | |
Agriculture | | | | | | | | | | | | | | | | | | | | | | | | | | | | |
Banana | | | 9.2 | | | | 0.0 | | | | 0.0 | | | | 0.0 | | | | 0.1 | | | | 0.0 | | | | 0.1 | |
Citrus | | | 1.8 | | | | 1.8 | | | | 1.7 | | | | 1.8 | | | | 2.1 | | | | 1.8 | | | | 1.5 | |
Coffee | | | 27.2 | | | | 26.8 | | | | 33.8 | | | | 19.2 | | | | 18.3 | | | | 10.1 | | | | 8.2 | |
Cocoa | | | 2.0 | | | | 1.0 | | | | 1.8 | | | | 1.0 | | | | 1.1 | | | | 0.5 | | | | 1.0 | |
Pimento | | | 2.1 | | | | 2.1 | | | | 1.7 | | | | 2.9 | | | | 1.8 | | | | 0.4 | | | | 0.4 | |
| | | | | | | | | | | | | | | | | | | | | | | | | | | | |
Total | | | 42.3 | | | | 31.7 | | | | 39.1 | | | | 24.9 | | | | 23.4 | | | | 12.8 | | | | 11.2 | |
Mining and Quarrying | | | | | | | | | | | | | | | | | | | | | | | | | | | | |
Bauxite | | | 113.0 | | | | 114.5 | | | | 85.4 | | | | 128.7 | | | | 141.9 | | | | 68.5 | | | | 66.9 | |
Alumina | | | 1,193.1 | | | | 1,230.5 | | | | 368.0 | | | | 402.8 | | | | 583.1 | | | | 285.4 | | | | 251.7 | |
Gypsum | | | 0.4 | | | | 3.1 | | | | 0.2 | | | | 0.5 | | | | 0.1 | | | | 0.1 | | | | 0.0 | |
| | | | | | | | | | | | | | | | | | | | | | | | | | | | |
Total | | | 1,306.5 | | | | 1,348.1 | | | | 453.6 | | | | 532.0 | | | | 725.1 | | | | 354.0 | | | | 318.6 | |
Manufacturing | | | | | | | | | | | | | | | | | | | | | | | | | | | | |
Sugar | | | 100.3 | | | | 104.3 | | | | 72.3 | | | | 44.2 | | | | 62.2 | | | | 55.8 | | | | 93.7 | |
Rum | | | 45.7 | | | | 43.7 | | | | 48.4 | | | | 47.2 | | | | 48.7 | | | | 26.3 | | | | 18.6 | |
Citrus Products | | | 0.3 | | | | 0.3 | | | | 0.5 | | | | 2.1 | | | | 0.3 | | | | 0.0 | | | | 0.0 | |
Coffee Products | | | 4.6 | | | | 1.3 | | | | 1.5 | | | | 3.1 | | | | 2.3 | | | | 1.3 | | | | 2.5 | |
Cocoa Products | | | 0.7 | | | | 0.5 | | | | 0.7 | | | | 0.8 | | | | 0.7 | | | | 0.5 | | | | 0.4 | |
| | | | | | | | | | | | | | | | | | | | | | | | | | | | |
Total | | | 151.6 | | | | 150.1 | | | | 123.4 | | | | 97.4 | | | | 114.2 | | | | 83.8 | | | | 115.3 | |
| | | | | | | | | | | | | | | | | | | | | | | | | | | | |
Total Traditional Exports | | | 1,500.4 | | | | 1,529.9 | | | | 616.1 | | | | 654.3 | | | | 862.7 | | | | 450.6 | | | | 445.1 | |
| | | | | | | | | | | | | | | | | | | | | | | | | | | | |
Non-Traditional Exports | | | | | | | | | | | | | | | | | | | | | | | | | | | | |
Food and Beverage | | | | | | | | | | | | | | | | | | | | | | | | | | | | |
Pumpkins | | | 0.4 | | | | 0.4 | | | | 0.4 | | | | 0.4 | | | | 0.6 | | | | 0.3 | | | | 0.3 | |
Dasheens | | | 1.5 | | | | 1.6 | | | | 1.4 | | | | 1.6 | | | | 1.7 | | | | 0.9 | | | | 0.7 | |
Sweet Potatoes | | | 2.0 | | | | 2.5 | | | | 2.5 | | | | 3.1 | | | | 2.6 | | | | 1.2 | | | | 1.4 | |
Yams | | | 15.5 | | | | 20.4 | | | | 18.7 | | | | 18.8 | | | | 19.7 | | | | 10.1 | | | | 8.9 | |
Papayas | | | 2.7 | | | | 2.2 | | | | 2.9 | | | | 2.8 | | | | 2.5 | | | | 1.1 | | | | 2.8 | |
Ackee | | | 7.2 | | | | 8.9 | | | | 13.6 | | | | 12.8 | | | | 12.4 | | | | 4.6 | | | | 6.3 | |
Other Fruits & Fruit Preparations | | | 4.2 | | | | 5.2 | | | | 6.2 | | | | 6.1 | | | | 5.3 | | | | 2.7 | | | | 4.0 | |
Meat & Meat Preparations | | | 2.0 | | | | 3.1 | | | | 2.8 | | | | 2.6 | | | | 3.6 | | | | 1.7 | | | | 2.0 | |
Dairy Products & Birds’ Eggs | | | 4.8 | | | | 7.4 | | | | 6.5 | | | | 6.0 | | | | 7.4 | | | | 5.2 | | | | 4.8 | |
Fish, Crustaceans & Mollusks | | | 8.4 | | | | 8.2 | | | | 4.7 | | | | 8.0 | | | | 8.0 | | | | 2.5 | | | | 2.2 | |
Other Food Exports | | | 43.4 | | | | 58.8 | | | | 59.9 | | | | 62.9 | | | | 71.5 | | | | 37.7 | | | | 37.8 | |
Beverages and Tobacco (excluding rum) | | | 52.6 | | | | 49.6 | | | | 53.0 | | | | 56.3 | | | | 64.6 | | | | 36.3 | | | | 38.3 | |
| | | | | | | | | | | | | | | | | | | | | | | | | | | | |
Total | | | 144.7 | | | | 168.3 | | | | 172.1 | | | | 181.3 | | | | 199.7 | | | | 104.3 | | | | 110.0 | |
| | | | | | | |
Inedible Materials | | | | | | | | | | | | | | | | | | | | | | | | | | | | |
Limestone | | | 0.6 | | | | 1.2 | | | | 1.1 | | | | 0.9 | | | | 2.1 | | | | 2.1 | | | | 1.5 | |
Waste & Scrap | | | 78.3 | | | | 21.1 | | | | 12.6 | | | | 17.6 | | | | 38.9 | | | | 22.5 | | | | 13.0 | |
Other | | | 2.4 | | | | 2.9 | | | | 3.0 | | | | 4.4 | | | | 3.0 | | | | 1.5 | | | | 1.3 | |
| | | | | | | | | | | | | | | | | | | | | | | | | | | | |
Total | | | 81.3 | | | | 25.2 | | | | 16.7 | | | | 22.9 | | | | 44.0 | | | | 26.1 | | | | 15.8 | |
Mineral Fuels etc. | | | 326.0 | | | | 434.4 | | | | 213.6 | | | | 291.2 | | | | 371.8 | | | | 206.0 | | | | 202.6 | |
Ethanol | | | 154.8 | | | | 395.4 | | | | 170.4 | | | | 48.1 | | | | 8.7 | | | | 3.7 | | | | 17.4 | |
Apparel | | | 1.5 | | | | 1.5 | | | | 1.5 | | | | 1.6 | | | | 1.5 | | | | 0.8 | | | | 0.8 | |
Furniture | | | 0.6 | | | | 0.9 | | | | 0.8 | | | | 1.4 | | | | 1.1 | | | | 0.5 | | | | 0.3 | |
Other Exports | | | 44.9 | | | | 65.0 | | | | 51.3 | | | | 52.6 | | | | 48.7 | | | | 21.0 | | | | 20.6 | |
| | | | | | | | | | | | | | | | | | | | | | | | | | | | |
Total | | | 527.8 | | | | 897.2 | | | | 437.5 | | | | 394.9 | | | | 431.8 | | | | 232.0 | | | | 241.7 | |
| | | | | | | | | | | | | | | | | | | | | | | | | | | | |
| | | | | | | |
Total Non-Traditional Exports | | | 753.8 | | | | 1,090.7 | | | | 626.3 | | | | 599.1 | | | | 675.5 | | | | 362.4 | | | | 367.6 | |
| | | | | | | |
Re-Exports | | | 51.0 | | | | 62.2 | | | | 77.0 | | | | 82.3 | | | | 86.1 | | | | 35.5 | | | | 34.4 | |
| | | | | | | | | | | | | | | | | | | | | | | | | | | | |
| | | | | | | |
Total Exports | | | 2,305.2 | | | | 2,682.8 | | | | 1,319.4 | | | | 1,335.7 | | | | 1,624.3 | | | | 848.5 | | | | 847.1 | |
| | | | | | | | | | | | | | | | | | | | | | | | | | | | |
Source: Statistical Institute of Jamaica.
D-36
In the past, the Jamaican sugar and banana industries and, less significantly, traditional rum and rice suppliers, enjoyed preferential trade arrangements with respect to exports to the European Union pursuant to the Cotonou Partnership Agreement. The CARIFORUM-EU Economic Partnership Agreement, which replaces the trade provisions of the Cotonou Partnership Agreement, was signed in October 2008. This free trade agreement provides for duty-free, quota-free access to the EU market for most goods, as of January 1, 2009. The CARIFORUM-EU Ecomonic Partnership Agreement is currently being applied provisionally, and Jamaica is in the process of implementing this agreement. This agreement has a strong development component.
The CARIFORUM-EU Economic Partnership Agreement is reciprocal and asymmetrical in nature, and covers trade in traditional export products, such as sugar, bananas, rum and rice, which will ultimately enter the EU duty-free and quota-free. The EU’s preferential system for bananas ended on January 1, 2006, and the sugar regime that existed under the Cotonou Partnership Agreement ended on September 30, 2009. As of October 1, 2009, ACP sugar exporters have duty-free, quota-free access to the EU market under a managed system lasting until 2015. Thereafter, sugar will enter the EU market duty-free and quota-free under the CARIFORUM-EU Economic Partnership Agreement. See “Jamaica-International Relationships—The CARIFORUM-EU Economic Partnership Agreement.”
The Jamaican banana industry contributed minimally to the export earnings for the years 2008, 2009, 2010 and 2011. This was due to the exit of the major exporter from the market, as a result of devastating hurricanes in recent years. Jamaica has already commenced initiatives designed to improve the competitiveness of Jamaican bananas. See “The Jamaican Economy—Principal Sectors of the Economy—Agriculture, Forestry and Fishing.”
Imports
Merchandise imports increased by 24.2% to US$6,614.8 million in 2011, moving from US$5,326.5 million in 2010 which in turn shows an increase as compared to US$5,057.6 million in 2009. The increase in the value of imports in 2011 was dominated by higher spending on the importation of fuel, which was influenced by the increase in oil prices in the international markets. The increase in the imports of food, manufactured goods, machinery and transport equipment and chemicals were other contributory factors. For the purposes of this discussion, imports include cost, insurance and freight values, as well as free-zone imports, and excludes goods procured in ports.
The following table shows Jamaica’s imports for the five years ended December 31, 2011, and other periods in 2011 and 2012 as indicated:
Imports (c.i.f.)(1)
| | | | | | | | | | | | | | | | | | | | | | | | | | | | |
| | | 2007(3) | | | 2008(3) | | | 2009(2) | | | 2010(2) | | | 2011(3) | | | Jan –
June
2011(3) | | | Jan –
June
2012(3) | |
| | | (in millions of US$) | |
| | | | | | | |
Mineral Fuels, Lubricants, etc. | | | 2,428.9 | | | | 3,354.8 | | | | 1,419.4 | | | | 1,688.7 | | | | 2,441.8 | | | | 1,250.9 | | | | 1,207.6 | |
Machinery | | | 1,252.4 | | | | 1,264.3 | | | | 819.7 | | | | 793.4 | | | | 939.7 | | | | 429.7 | | | | 445.6 | |
Food | | | 730.7 | | | | 886.3 | | | | 801.9 | | | | 812.9 | | | | 938.4 | | | | 446.6 | | | | 464.8 | |
Beverages & Tobacco | | | 93.2 | | | | 93.5 | | | | 79.9 | | | | 76.0 | | | | 77.5 | | | | 39.4 | | | | 40.6 | |
Crude Materials (excl. Fuels) | | | 67.5 | | | | 73.4 | | | | 54.9 | | | | 60.8 | | | | 63.2 | | | | 36.0 | | | | 22.4 | |
Animal & Vegetable Oils & Fats | | | 31.6 | | | | 53.9 | | | | 33.9 | | | | 32.6 | | | | 58.6 | | | | 33.9 | | | | 32.1 | |
Chemicals | | | 849.0 | | | | 951.0 | | | | 738.7 | | | | 696.9 | | | | 909.6 | | | | 377.2 | | | | 329.3 | |
Manufactured Goods | | | 753.4 | | | | 883.6 | | | | 555.4 | | | | 587.1 | | | | 647.1 | | | | 318.3 | | | | 311.8 | |
Miscellaneous Manufactured Articles | | | 591.2 | | | | 682.0 | | | | 461.0 | | | | 483.0 | | | | 470.5 | | | | 207.9 | | | | 215.4 | |
Other | | | 95.1 | | | | 118.2 | | | | 92.8 | | | | 94.9 | | | | 68.4 | | | | 21.0 | | | | 51.4 | |
| | | | | | | | | | | | | | | | | | | | | | | | | | | | |
| | | | | | | |
Total Imports | | | 6,893.0 | | | | 8,361.0 | | | | 5,057.6 | | | | 5,326.4 | | | | 6,614.8 | | | | 3,160.8 | | | | 3,120.8 | |
| | | | | | | | | | | | | | | | | | | | | | | | | | | | |
| (1) | Merchandise imports are c.i.f. values which differ in presentation from import values presented in the balance of payments. |
Source: Statistical Institute of Jamaica.
D-37
Trading Partners
The United States of America, Canada and the United Kingdom were Jamaica’s main trading partners for exports in 2011. The main trading partners for imports were the United States of America, Venezuela and Trinidad and Tobago.
The following tables show the direction of trade for the five years ended December 31, 2011, and other periods in 2011 and 2012 as indicated:
Exports (f.o.b.) by Destination
| | | | | | | | | | | | | | | | | | | | | | | | | | | | |
| | | 2007(2) | | | 2008(2) | | | 2009(1) | | | 2010(1) | | | 2011(2) | | | Jan –
June
2011(2) | | | Jan –
June
2012(2) | |
| | | (in millions of US$) | |
| | | | | | | |
NAFTA | | | 1,162.9 | | | | 1,246.1 | | | | 784.6 | | | | 826.6 | | | | 1,103.9 | | | | 571.2 | | | | 421.9 | |
| | | | | | | |
of which USA | | | 824.3 | | | | 981.8 | | | | 648.1 | | | | 659.7 | | | | 836.2 | | | | 458.9 | | | | 346.4 | |
of which Canada | | | 333.3 | | | | 259.0 | | | | 131.6 | | | | 164.9 | | | | 263.4 | | | | 110.1 | | | | 74.5 | |
European Union | | | 592.7 | | | | 721.3 | | | | 233.1 | | | | 173.0 | | | | 266.0 | | | | 144.7 | | | | 199.1 | |
of which UK | | | 216.0 | | | | 225.3 | | | | 129.6 | | | | 83.9 | | | | 111.7 | | | | 73.1 | | | | 25.8 | |
CARICOM | | | 56.4 | | | | 65.9 | | | | 66.4 | | | | 65.5 | | | | 68.0 | | | | 33.8 | | | | 35.0 | |
Japan | | | 28.1 | | | | 23.9 | | | | 37.3 | | | | 15.8 | | | | 13.7 | | | | 7.0 | | | | 7.4 | |
Other countries | | | 465.1 | | | | 625.6 | | | | 198.0 | | | | 254.8 | | | | 172.7 | | | | 91.8 | | | | 183.7 | |
| | | | | | | | | | | | | | | | | | | | | | | | | | | | |
| | | | | | | |
Total | | | 2,305.2 | | | | 2,682.8 | | | | 1,319.4 | | | | 1,335.7 | | | | 1,624.3 | | | | 848.5 | | | | 847.1 | |
| | | | | | | | | | | | | | | | | | | | | | | | | | | | |
Source: Statistical Institute of Jamaica.
Imports (c.i.f.) by Origin(1)
| | | | | | | | | | | | | | | | | | | | | | | | | | | | |
| | | 2007(3) | | | 2008(3) | | | 2009(2) | | | 2010(2) | | | 2011(3) | | | Jan –
June
2011(3) | | | Jan –
June
2012(3) | |
| | | (in millions of US$) | |
| | | | | | | |
NAFTA | | | 2,937.8 | | | | 3,630.3 | | | | 2,072.4 | | | | 2,002.9 | | | | 2,578.7 | | | | 1,258.3 | | | | 1,273.1 | |
of which USA | | | 2,699.5 | | | �� | 3,294.4 | | | | 1,850.3 | | | | 1,831.0 | | | | 2,180.2 | | | | 1,080.0 | | | | 1,107.3 | |
of which Canada | | | 137.4 | | | | 131.6 | | | | 106.6 | | | | 91.7 | | | | 117.3 | | | | 57.8 | | | | 51.2 | |
European Union | | | 453.1 | | | | 510.2 | | | | 369.5 | | | | 354.8 | | | | 441.6 | | | | 142.1 | | | | 172.1 | |
of which UK | | | 129.2 | | | | 105.5 | | | | 79.7 | | | | 82.4 | | | | 96.3 | | | | 46.1 | | | | 36.9 | |
CARICOM | | | 1,191.2 | | | | 1,635.3 | | | | 737.7 | | | | 868.4 | | | | 1,025.2 | | | | 605.4 | | | | 504.0 | |
Japan | | | 227.9 | | | | 194.3 | | | | 118.5 | | | | 121.0 | | | | 149.7 | | | | 56.3 | | | | 109.4 | |
Other countries | | | 2,083.0 | | | | 2,390.9 | | | | 1,759.5 | | | | 1,979.3 | | | | 2,419.6 | | | | 1,098.7 | | | | 1,062.2 | |
| | | | | | | | | | | | | | | | | | | | | | | | | | | | |
| | | | | | | |
Total | | | 6,893.0 | | | | 8,361.0 | | | | 5,057.6 | | | | 5,326.4 | | | | 6,614.8 | | | | 3,160.8 | | | | 3,120.8 | |
| | | | | | | | | | | | | | | | | | | | | | | | | | | | |
| (1) | Merchandise imports are c.i.f. values which differ in presentation from import values presented in the balance of payments. |
Source: Statistical Institute of Jamaica.
D-38
INTERNATIONAL RESERVES
The net international reserves of the Bank of Jamaica declined to US$1,966 million at December 31, 2011, from US$2,171.4 million at December 31, 2010. Gross international reserves at December 31, 2011 were US$2,820.4 million or approximately 19.2 weeks of goods and services imports. The decline in the international reserves over the period was mainly due to a decline in official capital inflows.
With the intensification of the global credit crisis in the December 2008 quarter, international financial institutions took actions to reduce risk exposure, particularly to emerging market debt. These actions included the withdrawal of overseas margin funding arrangements with domestic financial institutions. In response, the Bank of Jamaica made a special loan facility available to facilitate repayment of margin arrangements that were collateralized with Government of Jamaica global bonds. In October 2008, US$168.8 million was provided to financial institutions under this facility. No further disbursements were made and as at September 30, 2010 the balance on the special loan facility was zero as all loans were repaid.
At November 30, 2012, net international reserves of the Bank of Jamaica were US$1,078.2 million, with gross international reserves at US$1,932.2 million or approximately 12.9 weeks of goods and services imports.
The following table shows the Bank of Jamaica’s international reserves for the period December 31, 2007 to November 30,2012:
International Reserves
| | | | | | | | | | | | | | | | | | | | | | | | |
| | | 2007 | | | 2008 | | | 2009 | | | 2010 | | | 2011 | | | Nov 2012 | |
| | | (in millions of US$) | |
| | | | | | |
Supplementary Fund | | | 125.5 | | | | 155.5 | | | | 259.2 | | | | 154.1 | | | | 155.3 | | | | 157.1 | |
Special Drawing Rights | | | 0.3 | | | | 0.1 | | | | 329.0 | | | | 335.8 | | | | 330.4 | | | | 294.8 | |
Other Reserves | | | 1,779.9 | | | | 1,639.8 | | | | 1,170.6 | | | | 2,489.3 | | | | 2,334.7 | | | | 1,480.3 | |
Gross International Reserves | | | 1,905.8 | | | | 1,795.4 | | | | 1,751.9 | | | | 2,979.2 | | | | 2,820.4 | | | | 1,932.2 | |
Total Foreign Liabilities | | | 28.1 | | | | 22.5 | | | | 22.5 | | | | 807.8 | | | | 854.3 | | | | 854.1 | |
Net International Reserves | | | 1,877.7 | | | | 1,772.9 | | | | 1,729.4 | | | | 2,171.4 | | | | 1,966.1 | | | | 1,078.2 | |
Gross Reserves in Weeks of Merchandise Imports | | | 16.4 | | | | 14.8 | | | | 18.9 | | | | 32.3 | | | | 25.5 | | | | 17.2 | |
Gross Reserves in Weeks of Goods & Services Imports | | | 12.1 | | | | 10.9 | | | | 13.2 | | | | 23.5 | | | | 19.2 | | | | 12.9 | |
Source: Bank of Jamaica.
Exchange Rates
As part of its economic liberalization program, Jamaica began gradually dismantling exchange controls in 1990 and formally abolished all remaining exchange controls with the repeal in 1992 of the Exchange Control Act. The movement of foreign exchange into and out of Jamaica is unrestricted. All Jamaican residents are permitted to hold, invest and borrow foreign currency. Non-residents are also permitted to invest and borrow both local and foreign currency in Jamaica. However, only an authorized dealer may carry on the business of trading in foreign currency or foreign currency instruments. In addition, an authorized dealer must be party to any transaction involving the buying or selling of foreign currency or foreign currency instruments in return for Jamaica dollars and the lending or borrowing of foreign currency. Cambios and bureaux de change are authorized specifically to buy and sell foreign currency.
Since the repeal of the Exchange Control Act in 1992, the exchange rate has been determined by market conditions and Jamaica has not set any trading band or target. Jamaica intends to conduct its macroeconomic policies in such a way as to maintain relative stability in the foreign exchange market.
During 2011, the Jamaica Dollar gradually decreased in value against the US dollar, with the J/US dollar exchange rate falling from J$85.86 to US$1.00 at December 31, 2010, to J$86.60 to US$1.00 at December 31, 2011,
D-39
a depreciation of 0.9%. This depreciation compares with an appreciation of 4.2% in 2010. The appreciation in 2010 reflected increased investor preference for Jamaica dollar instruments as evidenced by an expansion in net private capital inflows and the absence of severe demand pressures in the foreign exchange market. Improved investor confidence occurred against the background of the success of the Jamaica Debt Exchange (JDX) and the country’s achievement of the quantitative performance targets under the IMF Stand-By Arrangement. Since the exchange rate is market-determined, there can be no assurance that the exchange rate will be maintained at current levels. The official exchange rate as at November 30, 2012 was J$91.89 per US$1.00, representing a depreciation of 5.8 per cent for the calendar year to date. The accelerated pace of depreciation largely reflected uncertainty about the timing and status of an agreement with the IMF on a medium term economic program.
The Federal Reserve Bank of New York does not report a noon buying rate for the Jamaica Dollar. The official exchange rate published by the Bank of Jamaica for US dollars on December 18, 2012, was J$92.93 per US$1.00.
Foreign Exchange Rates
| | | | | | | | | | | | | | |
Year | | Month | | Average for
Period(1) | | | End of Period | | | Percentage Change(2)
(End of Period) | |
| (spot weighted average ask in J$ for US$) | |
| | | | |
2005 | | | | | 62.60 | | | | 64.58 | | | | 4.79 | |
2006 | | | | | 65.98 | | | | 67.15 | | | | 3.98 | |
2007 | | | | | 69.16 | | | | 70.62 | | | | 5.17 | |
2008 | | | | | 73.36 | | | | 80.47 | | | | 13.95 | |
2009 | | | | | 88.82 | | | | 89.60 | | | | 11.35 | |
2010 | | | | | 87.34 | | | | 85.86 | | | | (4.17 | ) |
2011 | | | | | 86.08 | | | | 86.60 | | | | 0.86 | |
2012 | | January | | | 86.78 | | | | 86.83 | | | | 0.27 | |
| | February | | | 86.91 | | | | 87.06 | | | | 0.27 | |
| | March | | | 87.25 | | | | 87.30 | | | | 0.28 | |
| | April | | | 87.33 | | | | 87.35 | | | | 0.06 | |
| | May | | | 87.75 | | | | 88.12 | | | | 0.88 | |
| | June | | | 88.48 | | | | 88.70 | | | | 0.66 | |
| | July | | | 89.24 | | | | 89.69 | | | | 1.12 | |
| | August | | | 89.73 | | | | 89.82 | | | | 0.15 | |
| | September | | | 89.90 | | | | 89.93 | | | | 0.12 | |
| | October | | | 90.64 | | | | 91.09 | | | | 1.29 | |
| | November | | | 91.46 | | | | 91.86 | | | | 0.88 | |
| (1) | The weighted average of the exchange rates for annual periods is calculated as the simple average of end of month rates. |
| (2) | As compared to the prior month. |
Source: Bank of Jamaica.
D-40
PUBLIC FINANCE
The Public Sector Budget
The Government of Jamaica includes all ministries, departments and agencies whose activities form part of the budgetary operation of the central administration. The operations of Central Government and state-owned enterprises are now referred to as the Overall public sector.
Jamaica’s fiscal year runs from April 1 of each year to March 31 of the following year. Pursuant to the Constitution and the Fiscal Responsibility Framework, the Minister of Finance and Planning is responsible for preparing estimates of revenue and expenditure and submitting those estimates to Parliament as early as possible but within four months after the beginning of the fiscal year to which they relate. In addition, the Minister of Finance and Planning must present a Fiscal Policy Paper, detailing multi-year budgets and targets and the fiscal strategy being pursued to achieve these targets. The Ministry of Finance and Planning, in conjunction with other ministries, departments, and agencies, prepares multi-year draft budgets, which must be approved by the Cabinet prior to its submission to Parliament. Final approval by Parliament is usually granted by May of the relevant fiscal year.
The budget distinguishes between recurrent and capital expenditure. Recurrent expenditure refers to operating expenditure of the central government, while capital expenditure refers to the central government’s planned investment for the fiscal year. The major criteria used in determining allocation levels for recurrent expenditure are expenditure ceilings based on Jamaica’s economic policy, Jamaica’s priorities for the fiscal year, and commitments arising from the continuation of programs, projects and policies previously authorized by the Cabinet. Such commitments include interest on public debt, a statutory obligation that is paid first, as well as salaries, rent and public utilities. The major criteria used in deciding allocation levels for capital expenditure are current year projections for public investment, multilateral/bilateral programs and the implementation status of projects.
Jamaica’s significant indebtedness has impacted the ability of the Government to use revenue to increase its spending in education, healthcare, and infrastructure and the Government has supplemented that spending and utilized bilateral (project) funding flows to meet the demands of these sectors. Fiscal space has been limited as debt payments must be made before funds are available to Jamaica for other policies and programs. The allocations from revenues to education, healthcare, and national security have been mainly to cover the operating costs of these ministries/sectors. The capital budgets of these ministries, however, have been supplemented by bilateral (project) funding. These funds are used to build and maintain schools, maintain hospital equipment and buildings in the health sector, and make infrastructural improvements. For example, the Jamaica Development Infrastructure Program (JDIP) was implemented to improve the road network throughout the island.
D-41
The following table shows Jamaica’s fiscal results for FY 2007/08 through FY 2011/12 and the FY 2012/13 fiscal budget:
Government Revenue and Expenditure
| | | | | | | | | | | | | | | | | | | | | | | | |
| | | 2007/08 | | | 2008/09 | | | 2009/10 | | | 2010/11 | | | 2011/12 | | | Budget
2012/13(7) | |
| | | (in millions of J$) | |
| | | | | | |
Revenue and Grants | | | 252,640.7 | | | | 276,199.8 | | | | 300,200.1 | | | | 316,041.4 | | | | 322,149.8 | | | | 361,282.5 | |
Tax Revenue | | | 219,517.6 | | | | 246,216.6 | | | | 265,860.2 | | | | 279,874.2 | | | | 289,882.2 | | | | 335,625.1 | |
Income and Profits | | | 92,625.7 | | | | 107,394.9 | | | | 118,295.6 | | | | 105,118.7 | | | | 106,422.8 | | | | 123,249.3 | |
Production and Consumption | | | 64,268.9 | | | | 69,253.2 | | | | 70,996.7 | | | | 78,571.4 | | | | 84,628.9 | | | | 96,554.7 | |
Of which GCT (local) | | | 37,446.9 | | | | 40,415.7 | | | | 41,452.1 | | | | 46,389.9 | | | | 47,973.2 | | | | 53,042.1 | |
International Trade | | | 60,925.0 | | | | 67,275.3 | | | | 74,485.7 | | | | 94,144.0 | | | | 96,511.6 | | | | 113,433.4 | |
Non-Tax Revenue(1) | | | 18,235.0 | | | | 16,081.3 | | | | 21,245.5 | | | | 20,473.9 | | | | 16,709.2 | | | | 18,555.2 | |
Bauxite Levy | | | 4,998.3 | | | | 4,446.7 | | | | 1,588.9 | | | | 421.1 | | | | 1,524.5 | | | | 1,681.3 | |
Capital Revenue(2) | | | 9,350.4 | | | | 1,878.5 | | | | 5,208.8 | | | | 5,147.4 | | | | 10,585.1 | | | | 1,008.9 | |
Grants | | | 4,539.4 | | | | 7,576.7 | | | | 6,296.7 | | | | 10,124.8 | | | | 3,448.8 | | | | 4,412.0 | |
Expenditure | | | 294,279.6 | | | | 351,521.4 | | | | 421,458.5 | | | | 388,768.0 | | | | 403,122.2 | | | | 414,258.0 | |
Recurrent Expenditure(3) | | | 252,877.9 | | | | 310,149.5 | | | | 387,044.2 | | | | 333,173.8 | | | | 349,891.3 | | | | 374,765.0 | |
Programs | | | 64,918.7 | | | | 73,310.4 | | | | 72,042.2 | | | | 76,917.9 | | | | 89,699.4 | | | | 92,160.7 | |
Wages and Salaries | | | 86,235.8 | | | | 111,533.9 | | | | 126,286.4 | | | | 127,901.3 | | | | 139,556.9 | | | | 146,070.4 | |
of which back pay(4) | | | 521.2 | | | | 0.0 | | | | 4,656.8 | | | | 3,339.3 | | | | 3,524.3 | | | | 9,510.6 | |
Interest | | | 101,723.4 | | | | 125,305.2 | | | | 188,715.6 | | | | 128,354.7 | | | | 120,635.0 | | | | 136,533.8 | |
Domestic | | | 70,022.8 | | | | 89,522.8 | | | | 144,869.1 | | | | 88,049.5 | | | | 81,547.9 | | | | 90,080.9 | |
Foreign | | | 31,700.7 | | | | 35,782.4 | | | | 43,846.5 | | | | 40,305.2 | | | | 39,087.1 | | | | 46,453.0 | |
Capital Expenditure(5) | | | 41,401.7 | | | | 41,371.9 | | | | 34,414.3 | | | | 55,594.1 | | | | 53,230.9 | | | | 39,493.0 | |
IMF | | | 0.0 | | | | 0.0 | | | | 0.0 | | | | 0.0 | | | | 0.0 | | | | 0.0 | |
Unallocated | | | 0.0 | | | | 0.0 | | | | 0.0 | | | | 0.0 | | | | 0.0 | | | | 0.0 | |
Fiscal Surplus (Deficit) | | | (37,638.8 | ) | | | (75,321.6 | ) | | | (121,258.4 | ) | | | (72,726.6 | ) | | | (80,972.4 | ) | | | (52,975.5 | ) |
Loan Receipts | | | 135,240.3 | | | | 212,148.6 | | | | 299,599.6 | | | | 212,968.9 | | | | 163,520.5 | | | | 269,765.9 | |
External | | | 16,835.5 | | | | 56,362.5 | | | | 50,818.1 | | | | 90,490.2 | | | | 20,768.1 | | | | 127,958.9 | |
Domestic | | | 118,404.8 | | | | 155,786.1 | | | | 248,781.5 | | | | 122,478.7 | | | | 142,752.5 | | | | 141,807.0 | |
Amortization | | | 106,115.4 | | | | 148,733.2 | | | | 169,514.0 | | | | 102,157.5 | | | | 128,373.2 | | | | 198,170.2 | |
External | | | 37,293.4 | | | | 49,826.1 | | | | 25,533.1 | | | | 22,764.0 | | | | 60,553.0 | | | | 73,557.4 | |
Domestic | | | 68,822.1 | | | | 98,907.2 | | | | 143,980.9 | | | | 79,393.5 | | | | 67,820.2 | | | | 124,612.9 | |
Primary Surplus (Deficit) | | | 64,084.6 | | | | 49,983.6 | | | | 67,457.2 | | | | 55,628.1 | | | | 39,662.6 | | | | 83,558.3 | |
Overall Surplus (Deficit) | | | (8,514.0 | ) | | | (11,906.2 | ) | | | 8,827.2 | | | | 38,084.9 | | | | (45,825.0 | ) | | | 18,620.1 | |
GDP(6) | | | 912,346.6 | | | | 1,014,392.1 | | | | 1,092,405.6 | | | | 1,171,853.0 | | | | 1,263,310.0 | | | | 1,392,640.0 | |
| (1) | Non-tax revenue includes user fees and interest revenue. |
| (2) | Capital revenue includes royalties, loan repayments and divestment receipts. |
| (3) | Recurrent expenditure refers to the Government’s day-to-day operational expenses. |
| (4) | Back pay represents payments, in any given year, of wages/salaries and allowances due for previous fiscal years. |
| (5) | Capital expenditure refers to Jamaica’s investment for the fiscal year. |
| (6) | GDP is calculated on a calendar year basis. Therefore, the number presented represents an estimate of GDP for the fiscal year. The gross domestic product series was revised in 2003 and subsequently revised again in 2008. This revision was made in order to capture the changing structure of industries in the manufacturing, financial and insurance services, business services and the miscellaneous services sectors. In addition the base year has been changed from 1986 to 1996. |
| (7) | The figures provided in this column represent the 2012/13 Budget. |
Source: Ministry of Finance and Planning and the Planning Institute of Jamaica.
Revenue and Expenditure
Jamaica posted a fiscal deficit in FY 2011/12 of J$81.0 billion or 6.4% of GDP. This followed fiscal deficits in FY 2010/11 of J$72.7 billion or 6.3% of GDP; in FY 2009/2010 of J$121.3 billion or 11.1% of GDP; in FY 2008/09 of J$75.3 billion or 7.4% of GDP; and in FY 2007/08 of J$37.6 billion or 4.1% of GDP. These deficits were due mainly to lower revenue yields due to the contraction in the economy, influenced by the global economic recession, as well as higher wages and salaries and interest costs incurred partly as a result of government intervention in the financial sector in the mid-1990s, which subsequently inflated central government debt stock. The 6.4% of GDP deficit recorded in FY 2011/12 was worse than the 4.6% originally targeted. The increase in the deficit in FY 2011/12 was mainly due to lower than expected revenue and grants inflows, which outweighed the lower than
D-42
budgeted expenditure. Jamaica has maintained relatively high primary surpluses over the last five years, despite the reductions in FY 2010/11 and FY 2011/12. The fiscal operations recorded primary surpluses of 7.0% in FY 2007/08, 4.9% in FY 2008/09, 6.2% in FY 2009/10, 4.6% in FY 2010/11 and 3.1% in 2011/2012.
The operations of the overall public sector recorded deficits of 6.9% in FY 2007/08, 9.5% in FY 2008/09, 11.4% in 2009/10, 6.7% in FY 2010/11, 6.4% in FY 2011/2012 and a budgeted deficit of 4.3% in FY 2012/13.
Total revenue and grants for the central government for FY 2011/12 were J$322.2 billion, or 25.5% of GDP. This represented an increase of 2.4% over total revenue and grants collected in FY 2010/11. Collections in FY 2011/12, however, were below expected levels. This worse than targeted performance of revenue and grants was impacted mainly by shortfalls in tax revenue, grants and non-tax revenue. Tax revenue for FY 2011/12 increased by 3.6%, whereas non-tax revenue decreased by 18.4% when compared to FY 2010/11. The grants received in FY 2011/12 totaled J$3.4 billion, 74.2% below budget, due mainly to the delay in programmed proceeds from the EU.
Total expenditure (excluding amortization) for FY 2011/12 was J$403.1 billion, or 31.9% of GDP. This represented a 3.7% increase over FY 2010/11 and a decrease of J$9.4 billion, or 2.3% below budget. Recurrent expenditure totaled J$349.9 billion in FY 2011/12, representing 86.8% of total expenditure, with capital expenditure representing 13.2% of total expenditure. Recurrent expenditure was J$2.2 billion or 0.6% lower than budgeted, mainly as a result of lower interest payments. Interest costs of J$120.6 billion were J$10.4 billion below budget, and included domestic interest costs of J$81.5 billion and foreign interest payments of J$39.1 billion, which were J$7.1 billion and J$3.4 billion, or each 8.0%, below budget.
The largest component of recurrent expenditure was wages and salaries, which represented 34.6% of total expenditure (less amortization) in FY 2011/12. Interest costs represented 29.9% of total expenditure in FY 2011/12, 33.0% of total expenditure in FY2010/11, 44.8% of total expenditure in FY 2009/10, 35.6% in FY 2008/09, and 34.6% in FY 2007/08. Interest expenditure consumed 37.4% of total revenue and grants in FY 2011/12, compared to 40.6% consumed in FY 2010/11, 62.9% consumed in FY 2009/10, 45.4% consumed in FY 2008/09, and 39.6% in FY 2007/08.
Expenditure on wages and salaries in FY 2011/12 increased to J$139.6 billion, or 9.1%, compared to J$127.9 billion in FY 2010/11 due principally to the outstanding 7% increase to public sector workers effective April 2011, as well as the payment of back pay to certain groups of public sector workers relating to contractual obligations that predated the wage freeze which commenced in April 2009. Wages and salaries represented 34.6% of total expenditure in FY 2011/12 compared to 32.9% of total expenditure in FY 2010/11.
FY 2012/13 Budget
The FY 2012/13 budget remains consistent with Jamaica’s overall macroeconomic program, which has as its primary goals low single-digit inflation rates, stability in the foreign exchange market, further reduction in domestic interest rates, the maintenance of adequate foreign reserves and the acceleration of economic growth.
For FY 2012/13, Jamaica has targeted a budget deficit of J$53.0 billion and a primary surplus of J$83.6 billion. Budgeted revenue and grants inflows for FY 2012/13 is projected at J$361.3 billion, with 92.9% projected to be received from tax revenue. Tax revenue is budgeted to increase by 15.8% over FY 2011/12, primarily as a result of the normal increase in the base revenue associated with movements in macroeconomic indicators (inflation, economic growth, imports and exchange rates), as well as a revenue-positive reform package expected to yield J$16.6 billion, or 1.2% of GDP.
Expenditure (less amortization) is budgeted to increase by 2.8% over FY 2011/12 due mainly to higher spending on interest costs and wages. The FY 2012/13 expenditure budget is projected to be J$414.3 billion, comprising J$374.8 billion for recurrent expenditure and J$39.5 billion for spending on capital projects. Of the recurrent budget, J$92.2 billion is allocated to recurrent programs, J$141.6 billion is allocated to wages and salaries and J$136.5 billion is allocated to interest payments.
D-43
The expenditure on wages and salaries is budgeted to increase by 4.7% in FY 2012/13. This increase is due primarily to the scheduled installment of the one-off payment equivalent to two years (2009 – 2011) of the 7% wage adjustment, as well as the provision of J$2.5 billion earmarked for partial payment of outstanding amounts due to teachers and for recruitment of new members of the security forces. See “—Employment and Labor.”
FY 2012/13 April-September
The primary surplus for the April to September period of FY 2012/13 amounted to J$30.8 billion, compared to the target of J$29.3 billion. The over-performance relative to the target was largely influenced by lower than expected spending on capital and recurrent programs. Overall, revenue and grants were J$6.7 billion, or 4.1% lower than targeted for the April to September period of FY 2012/13. Compared to the similar period last year, revenue and grants decreased by J$2.3 billion or 1.4%. Tax revenue fell short of its target by J$5.3 billion.
Expenditure for the April to September period of FY 2012/13 totalled J$188.0 billion, a reduction of J$11.6 billion or 5.8% relative to budget, with all the main categories, namely programs, wages and salaries, interest and capital expenditure, being lower than expected. This level of overall spending represented a reduction of J$13.0 billion or 6.5% below the corresponding period last year. Contributing to this reduction was a decline of J$20.6 billion or 6.8% in capital expenditure and J$0.9 billion or 4.4% in external interest costs, which outweighed increases in the other categories of expenditure. The higher outlay of capital in 2011 was occasioned by one-off payments in relation to the winding-up of the operations of Air Jamaica and Sugar Company of Jamaica Limited.
The combination of lower than expected revenue and grants, and lower than expected spending, resulted in the fiscal deficit for the April – September period of 2012 being J$30.5 billion, which was J$4.9 billion or 13.9% better than targeted. This represents a 25.9% reduction in the deficit relative to the same period in FY 2011/12.
Tax Reform
Prior to 1986, the individual income tax base in Jamaica included all sources of income with a graduated marginal rate structure ranging from 30.0% to 57.5%. There were no standard deductions, but taxpayers could qualify for up to 16 separate tax credits that had been gradually added to the tax system over the years. Because these credits came into existence on different dates and were not indexed to inflation, their value had been substantially eroded over the years. Jamaica further narrowed its income tax base by permitting employers to grant non-taxable perquisites to employees that were not required to be reported as income.
In 1986, Jamaica introduced tax reforms that included a flat tax rate for individuals and a uniform standard deduction, or income exemption level, which replaced the former system of tax credits. A flat tax rate and an income threshold replaced the progressive rate structure. Since 1993, the personal income tax rate has been 25.0%. As part of the Stand-By Arrangement (SBA), tax rates for income were adjusted to 27.5% (up from 25%) for income ranging from J$5 million to J$10 million and 35% for income over J$10 million. This temporary three-tier rate structure lasted until December 31, 2010. The general income tax threshold after which taxes are paid has increased over time. Effective July 1, 2008, the general income tax threshold was raised to J$200,304 and then to J$320,736 effective July 1, 2009. The general income tax threshold was last increased to J$441,168, effective January 1, 2010. In the case of corporations, the statutory corporate income tax rate is currently 33 1/3%. The income tax rate for building societies is 30.0%.
D-44
The following table shows the changes in personal income tax rate and threshold since 2004:
Personal Income Tax Rates and Thresholds
| | | | | | | | | | | | |
Effective Date | | Rate (%) | | | Threshold (J$) | | | Increase (%) | |
January 2004 | | | 25 | | | | 120,432 | | | | — | |
January 2005 | | | 25 | | | | 120,432 | | | | — | |
July 2005 | | | 25 | | | | 169,104 | | | | 40.4 | |
January 2006 | | | 25 | | | | 193,440 | | | | 14.4 | |
January 2007 | | | 25 | | | | 193,440 | | | | — | |
January 2008 | | | 25 | | | | 193,440 | | | | — | |
January 2009 | | | 25 | | | | 220,272 | | | | 13.9 | |
July 2009 | | | 25 | | | | 320,736 | | | | 45.6 | |
January 2010 | | | 25 | | | | 441,168 | | | | 37.5 | |
January 2011 | | | 25 | | | | 441,168 | | | | — | |
January 2012 | | | 25 | | | | 441,168 | | | | — | |
Source: Ministry of Finance and Planning.
In 1996, Jamaica implemented a tax compliance program aimed at improving the efficiency and effectiveness of tax administration and compliance through the implementation of the taxpayer registration number system, which assigned individuals and businesses identification numbers. The registration of taxpayers, which began in April 1996, is ongoing. The system became operational on November 18, 1996. At September 30,, 2012, confirmed registration was as follows: 2,082,030 individuals; 148,045 sole proprietors and 87,281 organizations – resulting in approximately 2,317,356 confirmed taxpayer registration numbers assigned to date.
During 2009, the Government introduced additional tax measures aimed at increasing revenue by over 3% of GDP. These measures included the following:
| | • | | raising the excise tax effective on gasoline by J$8.75 per liter (see below) and broadening the GCT base by eliminating certain exemptions; |
| | • | | increasing the GCT rate on telephone services effective from 20% to 25% and increasing the departure tax to J$1.800, which is intended to generate annualized revenue equal to 0.3% of GDP; |
| | • | | making changes effective January 1, 2010 to increase revenue equal to 1.75% of GDP through the following: |
| | • | | raising the standard GCT rate to 17.5% from 16.5% as well as applying GCT, at lower rates, to electricity consumption, tourism and commercial importers; |
| | • | | tax rates for income were temporarily adjusted to 27.5% from 25% for income from J$5 million to J$10 million and to 35% for income over J$10 million until December 31, 2010; |
| | • | | applying an ad valorem tax of 15% to fuel; |
| | • | | freezing the ability to grant or renew discretionary waivers of duties and taxes as well as raising excise taxes on cigarettes and license fees for large motorcars; and |
| | • | | introduction of an advance GCT of 5% on commercial imports. The measure resulted in commercial importers being required to pay GCT at the rate of 22.5%, except in specified cases. |
D-45
During 2010 and 2011, the Government introduced additional tax measures. These measures included the following:
| | • | | adopting a 10% GCT on electricity for residential (for those consuming more than 200 kwh per month), commercial and industrial customers (i.e., expansion of the GCT base) (effective February 1, 2010); |
| | • | | restructuring the manner in which taxes on alcohol are applied by taxing content rather than by beverage class; |
| | • | | reducing Property Transfer Tax and Stamp Duty rates; |
| | • | | increasing property tax rates, effective April 1, 2010. This rise resulted in the flat rate moving from J$600 to J$1,000. The flat rate is applicable to property with unimproved value up to J$300,000. However, for rates in respect of property with un-improved values exceeding J$300,000, those now attract 0.75 per cent for every additional dollar, up from the previous 0.5 per cent; |
| | • | | increasing the GCT rate payable by the tourism sector from 8.25% to 10%; and |
| | • | | introducing SCT on high caffeine/high “energy drinks,” effective December 2010. |
| | • | | reducing the 15% ad valorem SCT on fuel to 10% effective April 14, 2010; |
| | • | | changing the Stamp duty on refinancing and transfer of existing mortgages. Under the new policy, where there is refinancing of a mortgage for equal amounts or less, the applicable Stamp Duty has been reduced to a nominal rate of J$100.00; |
| | • | | removing Transfer Tax and Stamp Duty on securities (corporate bonds); |
| | • | | increasing annual motor vehicle license fees by J$1,000 and raised the GCT on the second hand sale of motor vehicles by an average of 26% as determined by cc rating; |
| | • | | changing the Import Duty Structure for Motor Vehicles, with the Common External Tariff (CET) for motorcars reduced from 40% to 20%; a reduction in CET for bikes below 300 cc and 600 cc to 10% and 20%, respectively and an increase in CET rates for pickups from 10% to 20%; |
Following a Green Paper on Tax Reform issued by the Ministry of Finance in May 2011, a White Paper on Tax Reform 2012 was issued on November 15, 2012. The tax measures outlined in the Fiscal Budget for 2012/13 were broadly consistent with the Green Paper. Some of the key measures adopted include:
| | • | | from June 1st 2012, the tax on ordinary dividends payable to Jamaican residents has been increased to 5%; |
| | • | | reduction in the Standard Rate of GCT from 17.5% to 16.5% and widen the GCT base effective June 1, 2012; |
| | • | | increase in electricity rate to 16.5% and the total exemption of domestic use by residential customers effective July 1, 2012; |
| | • | | increase tax rate on winnings – Betting, Gaming, Horse Racing and Lottery Rate- from 15% to 20%, effective June 1, 2012; |
| | • | | changes to termination cost for telephone calls J$0.30 per minute on all domestic calls for termination to the mobile network and fixed lines and J$0.075 per minute on all international calls for termination to the mobile network, effective July 15, 2012; |
| | • | | imposition of SCT on denatured ethanol for use in blending of petroleum products - SCT rate of J$16.32 per litre, effective June 1, 2012; |
| | • | | introduction of the guest accommodation room tax of (i) US$1 for accommodations with less than 51 rooms, (ii) US$2 for accommodations with 51 to 100 rooms and (iii) US$4 for accommodations with at least 101 rooms, effective September 1, 2012. |
D-46
Intervention and Divestment
Jamaica’s intervention in the financial sector, through FINSAC, was undertaken to rehabilitate financial institutions with liquidity and solvency problems and to protect depositors. This intervention resulted in the protection of 1.5 million deposit accounts with a value of J$68.7 billion and 569,000 individual insurance policies with a total face value of J$174.4 billion. FINSAC’s intervention also provided protection to 55,000 beneficiaries of private pension funds, which had a total value of J$19.0 billion.
The types of assistance FINSAC has provided include the assumption of deposit and other liabilities, the provision of liquidity support, the purchase of ordinary and preference shares, the acquisition of under-performing assets and the provision of subordinated loans. In exchange for such assistance, FINSAC has acquired a combination of equity, board seats and the assets in numerous financial institutions and their related companies. FINSAC’s activities in the banking sector also involved the merger of several financial institutions under its control to create Union Bank of Jamaica Limited, which was subsequently sold in March 2001 for J$1.6 billion.
FINSAC financed its operations through the issuance of government-guaranteed securities. A portion of these securities was repaid with the first installment of the proceeds of loans from the IADB, the CDB and World Bank and an additional portion was repaid with the proceeds of the divestment of approximately J$11.7 billion in assets and property, including many major Jamaican banks, insurance companies, hotels and other businesses. As of April 1, 2001, the remaining J$79.3 billion in government-guaranteed securities issued by FINSAC were assumed by Jamaica as direct obligations. Jamaica’s efforts at restructuring the financial sector were aided in 2000 by the provision of loan packages from the IADB, the World Bank and the CDB. See “Public Sector Indebtedness.”
As a result of the FINSAC intervention, FINSAC assumed investments in various financial institutions, non-performing loan portfolios and other financial assets, the great majority of which it has divested to the private sector. FINSAC aggressively marketed its non-performing loan portfolio, which resulted in its sale by the end of 2002. In addition, in 2002 FINSAC sold its shareholdings in two of the largest financial institutions that had been in need of intervention and rehabilitation—the National Commercial Bank (the largest commercial bank in Jamaica at that time) and Life of Jamaica (a major insurance company in Jamaica).
Proceeds from these sales have been used to reduce FINSAC liabilities and, consequently, the public sector debt associated with the rehabilitation of the financial sector.
With the fulfillment of FINSAC’s responsibilities of intervening and rehabilitating institutions and subsequently disposing of its majority equity stakes in intervened institutions, the Jamaican Government scaled down the operations of FINSAC as of July 2003. The management of Jamaica’s minority stakes in institutions in which FINSAC intervened as well as the responsibility of completing the legal procedures required to formally close down institutions that have already ceased operations have been assumed by FIS.
Improvements in the Legislative and Regulatory Framework
Along with the efforts at restructuring the financial sector through FINSAC, Jamaica has also focused its attention on regulatory and supervisory reform. A number of key amendments to Jamaica’s financial legislation came into effect in October 1997, and provided for:
| | • | | more efficient and effective powers for remedial action taken by the supervisory authorities in respect of distressed institutions; |
| | • | | reduced capacity for institutions to lend to, or invest in, related entities; |
D-47
| | • | | a more stringent computation of capital adequacy; |
| | • | | a more precise definition of non-performing loans and power for the supervisory authorities to prescribe accounting rules; and |
| | • | | greater control by supervisory authorities over changes of ownership and a stricter definition of a “fit and proper person” for management, directors and owners of financial institutions. See “The Monetary System—Legislation and Regulation.” |
The Deposit Insurance Act was also passed in March 1998, to establish a scheme for the protection of depositors. See “The Monetary System—The Financial System—Legislation and Regulation—Deposit Insurance.”
After its initial response to the crisis, Jamaica has maintained its efforts to foster the effective supervision and regulation of the financial sector. This involved regulatory reform focused mainly on streamlining the supervision of the sector. The Financial Services Commission, or FSC, which became operational on August 2, 2001, is the sole regulatory and supervisory agency for non-deposit taking financial institutions, unit trusts, mutual funds, insurance, and pension funds. The Bank of Jamaica has retained its supervisory functions in the new regime, and its powers have been bolstered with the passage of legislation giving the Supervisor of Banks greater autonomy to intervene in troubled institutions through temporary management. The supervisory structure is complemented by the creation of the Regulatory Policy Council, or RPC, an umbrella entity comprised of the head of the FSC, the Supervisor of Banks, the head of the Jamaica Deposit Insurance Corporation, and the Financial Secretary or a nominee. The RPC utilizes a proactive and coordinated approach to developing policy for the financial sector, thus helping in the detection of problems and sharing of information among the supervisors.
A new Insurance Act was enacted in December 2001 to repeal and replace the Insurance Act of 1972; to provide measures to strengthen corporate governance and the rulemaking process; and to establish prompt corrective action. Reform of the pensions system has also been progressing with a new National Pensions Act, which became effective in March 2005. This new Insurance Act includes new requirements for pension funds such as registration, licensing, investment limits, minimum solvency standards and information disclosure. In 2007, the second phase of the Pension Reform initiative was advanced with the submission of additional drafting instructions for the preparation of amendments to the Pensions (Superannuation Funds and Retirement Schemes) Act and associated regulations. This was preceded by extensive consultations with major stakeholders in the industry. The legislation will address issues such as mandatory vesting, portability of pension rights, funding and solvency of approved superannuation funds and retirement schemes and registration of self-administered funds.
D-48
PUBLIC SECTOR INDEBTEDNESS
General
Under Section 116 of the Jamaica Constitution, all loans charged on Jamaica’s Consolidated Fund, including all external debt payments such as those under the debt securities, represent a statutory charge on the revenue and assets of Jamaica. See “Public Finance—The Public Sector Budget.” These statutory charges are paid without any requirement of Parliamentary approval, directly from revenue and assets, before funds are available to Jamaica for other policies and programs.
The Constitution and the Financial Administration and Audit Act give the Ministry of Finance and Planning overall responsibility for the management of Jamaica’s public debt. The Loan Act limits the amount of funds which may be borrowed. In 2009, the Jamaican Parliament passed legislation increasing the amount of funds which Jamaica may borrow. In November 2012, the House of Parliament approved the Public Debt Management Act, 2012, to make provision for the better management of the public debt. The legislation repealed the Loan Act of 1964 and several enactments related to the incurrence of debt by the Government and other connected matters. The Public Debt Management Act provides for the circumstances under which the Minister of Finance may borrow money, including to finance fiscal deficits, refinance any maturing or outstanding public debt and finance prepayments. The borrowing limits under the Public Debt Management Act are subject to the Financial Administration and Audit Act, as amended, which provides that the Minister of Finance may take any measure to, among others, reduce the fiscal balance to nil and reduce the total debt of Jamaica to 100% or less of GDP, either, by the end of the financial year ending on March 31, 2016. The above-mentioned targets may be exceeded on the grounds of national security, national emergency or any other exception ground.
Jamaica has never defaulted on any of its external or domestic debt obligations.
Domestic Debt
At September 30, 2012, Jamaica’s domestic debt was approximately J$976.126 billion, which excludes government-guaranteed securities. At December 31, 2011, Jamaica’s domestic debt, which excludes government-guaranteed securities, was J$883.39 billion, an increase of 10.43% when compared to the domestic debt level at December 31, 2010. Jamaica has incurred domestic debt primarily to provide budgetary financing and to cover the capitalization of accrued interest on the Bank of Jamaica’s holding of former FINSAC securities.
In addition to this level of domestic debt, Jamaica has guaranteed certain financial obligations of public sector entities, which carry out major infrastructure projects from time to time. At June 30, 2012, the extent of these internal guarantees was approximately J$28.643 billion.
Currently, Jamaica’s domestic debt consists mainly of Benchmark Investment Notes, following the Jamaica Debt Exchange Initiative (see below), which saw an exchange of some of the previously issued debt instruments (Local Registered Stocks and Debentures). At December 31, 2011, 5.7% of the outstanding domestic debt was scheduled to mature within one year, 48.1% between one and five years and the remaining 46.2% after five years. The interest rate composition of the domestic debt at December 31, 2011, was 56.5% contracted on a fixed rate basis, while 43.4% was contracted on a floating interest rate basis and 0.1% was non-interest bearing.
At September 30, 2012, 16.12% of Jamaica’s domestic debt was scheduled to mature in one year, 33.68% in five years and the remaining 50.20% after five years. At September 30, 2012, approximately 43.64% of the domestic debt was on a floating rate basis and 56.28% on a fixed rate basis. Of the total debt at September 30, 2012, 18.54% was denominated in or indexed to foreign currency (US$ and Euro) and 81.46% was J$-denominated.
At December 31, 2011, Jamaica had J$846.49 billion of domestic bonds outstanding, representing 95.82% of total domestic debt. This represented a J$85.87 billion, or 11.29% increase over the level outstanding at December 31, 2010. The remaining J$36.90 billion, or 4.18%, is comprised of loans and treasury bills.
D-49
Issuance of treasury bills is limited by statute to a maximum of J$12.0 billion in total outstanding treasury bills. The outstanding stock of treasury bills at December 31, 2011, was J$4.0 billion, representing 0.5% of total domestic debt. The stock of treasury bills decreased in 2008, 2009, 2010 and 2011 in keeping with Jamaica’s planned reduction of the stock of treasury bills in an effort to extend the average maturity of the domestic debt. Treasury bills are auctioned on a multiple-price basis.
Jamaica issues both local and foreign currency-denominated bonds in the domestic market. Foreign currency denominated bonds that are issued in Jamaica are classified as domestic debt. Of the total domestic debt at December 31, 2011, 12.26% was denominated in or indexed to foreign currency (US$ and Euro). A total of J$108.12 billion, or 12.24%, of the domestic debt was US dollar-denominated, J$215.1 million, or 0.02%, was Euro-denominated, J$0.00 billion was US dollar-indexed instruments, while the remaining J$775.06 billion, or 87.74%, was J$-denominated.
The following table shows domestic debt by instrument type for the five years ended December 31, 2011, and the six months ended September 30, 2012:
Domestic Debt by Instrument Type
| | | | | | | | | | | | | | | | | | | | | | | | |
| | | 2007 | | | 2008 | | | 2009 | | | 2010 | | | 2011 | | | Sept 30, 2012 | |
| | | (in millions of J$) | |
| | | | | | |
Securities | | | | | | | | | | | | | | | | | | | | | | | | |
Treasury Bills | | | 4,700.0 | | | | 4,194.5 | | | | 3,813.4 | | | | 4,000.0 | | | | 4,000.0 | | | | 4,000.0 | |
Local Registered Stocks | | | 224,228.4 | | | | 205,120.1 | | | | 180,573.5 | | | | 0.0 | | | | 0.0 | | | | 0.0 | |
J$ Benchmark Notes(1) | | | — | | | | — | | | | — | | | | 659,066.8 | | | | 741,015.6 | | | | 760,651.5 | |
| | | | | | | | | | | | | | | | | | | | | | | | |
Total | | | 228,928.4 | | | | 209,314.6 | | | | 184,387.0 | | | | 663,066.8 | | | | 745,015.6 | | | | 764,651.5 | |
| | | | | | | | | | | | | | | | | | | | | | | | |
Bonds | | | | | | | | | | | | | | | | | | | | | | | | |
Investment Debenture | | | 256,340.3 | | | | 300,665.6 | | | | 449,364.9 | | | | 0.0 | | | | 0.0 | | | | 0.0 | |
Land | | | 377.6 | | | | 352.6 | | | | 352.6 | | | | 331.1 | | | | 200.1 | | | | 200.1 | |
US$ Denominated | | | 50,038.0 | | | | 64,224.9 | | | | 83,733.2 | | | | 108,813.2 | | | | 108,116.4 | | | | 180,907.6 | |
US$ Indexed | | | 17,773.2 | | | | 26,542.1 | | | | 30,134.8 | | | | 0.0 | | | | 0.0 | | | | 0.0 | |
CPI Indexed Bonds (1) | | | — | | | | — | | | | — | | | | 23,191.2 | | | | 24,921.7 | | | | 25,844.9 | |
| | | | | | | | | | | | | | | | | | | | | | | | |
Total | | | 324,529.1 | | | | 391,785.3 | | | | 563,585.5 | | | | 132,335.5 | | | | 133,238.2 | | | | 206,952.6 | |
| | | | | | | | | | | | | | | | | | | | | | | | |
| | | | | | |
Loans | | | | | | | | | | | | | | | | | | | | | | | | |
Commercial Banks | | | 4,432.5 | | | | 7,255.6 | | | | 5,448.9 | | | | 4,456.2 | | | | 3,870.6 | | | | 3,472.0 | |
Other (including Public Sector) | | | 536.2 | | | | 560.1 | | | | 593.7 | | | | 105.7 | | | | 1,048.2 | | | | 938.7 | |
| | | | | | | | | | | | | | | | | | | | | | | | |
Total | | | 4,968.7 | | | | 7,815.7 | | | | 6,042.6 | | | | 4,561.9 | | | | 5,134.8 | | | | 4,410.7 | |
| | | | | | | | | | | | | | | | | | | | | | | | |
Total | | $ | 558,426.3 | | | $ | 608,915.5 | | | $ | 754,015.1 | | | | 799,964.2 | | | | 883,388.6 | | | | 976,126.3 | |
| | | | | | | | | | | | | | | | | | | | | | | | |
| (1) | These instruments were issued as part of JDX. See “– The Jamaica Debt Exchange.” |
Source: Ministry of Finance and Planning.
The following table shows the amortization schedule for domestic debt outstanding as of September 30, 2012:
Domestic Debt Amortization Schedule
as of September 30, 2012
| | | | | | | | | | | | | | | | | | | | |
| | | 2012(1) | | | 2013 | | | 2014 | | | 2015 | | | 2016 | |
| | | (in millions of J$) | |
| | | | | |
Bonds(2) | | | 114.7 | | | | 139,192.5 | | | | 123,156.9 | | | | 53,148.2 | | | | 82,295.1 | |
Loans | | | 613.8 | | | | 8,472.4 | | | | 8,304.8 | | | | 3,582.8 | | | | 3,583.3 | |
| | | | | | | | | | | | | | | | | | | | |
Total | | | 14,465.18 | | | | 147,664.8 | | | | 131,461.7 | | | | 56,730.9 | | | | 85,878.4 | |
| | | | | | | | | | | | | | | | | | | | |
| (1) | Projections from December 1, 2012 to December 31, 2012. |
Source: Ministry of Finance and Planning.
D-50
The following table shows the interest schedule for domestic debt outstanding as of September 30, 2012:
Central Government Domestic Debt Interest Schedule
as of September 30, 2012
| | | | | | | | | | | | | | | | | | | | |
| | | 2012(1) | | | 2013 | | | 2014 | | | 2015 | | | 2016 | |
| | | (in millions of J$) | |
| | | | | |
Bonds(1) | | | 807.5 | | | | 75,635.3 | | | | 61,511.8 | | | | 51,993.4 | | | | 46,595.4 | |
Loans | | | 640.9 | | | | 2,364.8 | | | | 1,890.0 | | | | 1,679.9 | | | | 1,567.7 | |
| | | | | | | | | | | | | | | | | | | | |
Total | | | 1448.4 | | | | 78,000.13 | | | | 63,401.8 | | | | 53,673.3 | | | | 48,163.1 | |
| | | | | | | | | | | | | | | | | | | | |
Contingent Liabilities | | | | | | | | | | | | | | | | | | | | |
Source: Ministry of Finance and Planning.
The following table shows the maturity structure of domestic debt outstanding as of June 30, 2012:
Domestic Debt Maturity Structure
as of September 30, 2012
| | | | | | | | | | | | | | | | | | | | |
| | | Less than
1 year | | | 1-5 years(1) | | | 5-10 years(1) | | | 10 years
& over (2) | | | Total | |
| | | (in millions of J$) | |
J$ Benchmark Notes | | | 122,923.6 | | | | 252,384.8 | | | | 219,856.8 | | | | 191,331.3 | | | | 786,496.4 | |
US$ Denominated Notes & Loans | | | 30,398.1 | | | | 75,572.4 | | | | 17,343.8 | | | | 57,593.7 | | | | 180,907.6 | |
Treasury Bills | | | 4,000.0 | | | | 0.0 | | | | 0.0 | | | | 0.0 | | | | 4,000.0 | |
Commercial Bank & Public Sector Entity Loans | | | 0.1 | | | | 672.0 | | | | 3,738.6 | | | | 100.0 | | | | 4,410.7 | |
Land Bonds | | | 0.0 | | | | 0.0 | | | | 0.0 | | | | 200.1 | | | | 200.1 | |
Euro Denominated Bonds | | | 0.0 | | | | 111.3 | | | | 0.0 | | | | 0.0 | | | | 111.3 | |
Other | | | 0.0 | | | | 0.0 | | | | 0.0 | | | | 0.2 | | | | 0.2 | |
| | | | | | | | | | | | | | | | | | | | |
Total | | | 157,321.8 | | | | 328,740.5 | | | | 240,939.1 | | | | 249,125.2 | | | | 976,126.3 | |
| | | | | | | | | | | | | | | | | | | | |
Source: Ministry of Finance and Planning.
The following table shows the interest rate composition of domestic debt outstanding as at June 30, 2012:
Domestic Debt Interest Rate Composition
as of September 30, 2012
| | | | | | | | |
| | | Principal Amount
Outstanding | | | Share of Outstanding
Debt | |
| | | (in millions of J$) | | | (%) | |
| | |
Variable Rate Debt | | | 425,945.9 | | | | 43.6 | |
Fixed Rate Debt | | | 549,326.8 | | | | 56.3 | |
Non Interest-Bearing Debt | | | 853.5 | | | | 0.1 | |
| | | | | | | | |
Total Debt | | | 976,126.3 | | | | 100.00 | |
| | | | | | | | |
Source: Ministry of Finance and Planning.
D-51
The Jamaica Debt Exchange
On January 14, 2010, the Government of Jamaica launched its strategic and comprehensive domestic liability management program, marketed as the Jamaica Debt Exchange, or JDX. The main characteristics were a par-for-par exchange offer with “no haircuts,” voluntary exchange of approximately J$701.5 billion in market issued domestic debt, voluntary exchange of short-dated, high-yielding interest bearing securities for longer-dated securities with significantly lower yields, the introduction of new benchmark securities, an extension of the maturity profile of the domestic debt portfolio in order to lower refinancing risks, achievement of substantial cost savings, the issue of an appropriate mix of fixed, variable and US$ securities and the introduction of new CPI-Indexed Investment Bonds.
The results of the JDX revealed an overall participation rate of approximately 99.16% with a 100% participation rate from financial institutions. This level of success represented an exchange of approximately J$695.6 billion in eligible bonds.
The immediate benefits of the JDX were the realignment of the domestic debt portfolio, which saw a significant reduction in maturities over the next three years; substantial cost savings through the reduction in the projected interest cost for FY 2010/11 of J$17.1 billon (i.e., US$190.7 million or 15.2% of interest cost); extension of amortization equal to J$148.6 billion (or US$1.66 billion) in FY 2010/11, the creation of twenty-five (25) new benchmark bonds in exchange for over three hundred and fifty (350) smaller and illiquid bonds; the removal of US Dollar Indexed Bonds and the introduction of new CPI-Indexed Bonds into the domestic portfolio; and an increase in the fixed rate component of the domestic debt portfolio. Occurring simultaneously with the JDX was the passing into law of the Government Securities Dematerialization Act, which allows domestic securities to be issued in a dematerialized format in the Central Securities Depository operated by the Bank of Jamaica.
External Debt
At September 30, 2012, the total of external debt was US$8,186.8 million, of which 89.31% was denominated in US dollars, 5.66% was denominated in Euro, 1.93% was denominated in Yen, and 1.47% was denominated in Chinese Yuan.
At December 31, 2011, public sector external debt was US$8,626.1 million, an increase of 2.82% from December 31, 2010. At December 31, 2011, the stock of external debt was US$8,626.1 million, of which 91.30% was denominated in US dollars, 5.15% was denominated in Euro, 1.58% denominated in Yen and 1.53% was denominated in Chinese Yuan. Bond issues of US$4,028.31 million represented the largest creditor category of Jamaica’s public sector external debt, and accounted for 46.7% of total public sector external debt at December 31, 2011 while bilateral and multilateral obligations of US$4,096.05 million accounted for 47.5%. Multilateral indebtedness was US$3,306.65 million, an increase of 7.65% over December 31, 2010.
Bond issues of US$3,728.8 million represented the largest creditor category of Jamaica’s public sector external debt, and accounted for 45.5% of total external indebtedness at September 30, 2012. Bilateral and multilateral obligations accounted for 48.8% of external debt at September 30, 2012. Multilateral indebtedness was US$3,262.98 million, a decrease of 1.32% over December 31, 2011.
The IADB, for the period 2006–2009, approved a new country strategy for Jamaica in which the bank links its loans to budget support rather than investment loans. Traditional investment loans may also be used if joint agreement is reached between the bank and the Government. The IADB now provides funding for budgetary support, which is accessed through its policy-based loans.
In September 2008, IDB provided a US$300 million credit facility to help eligible Jamaican financial institutions maintain credit flows. All seven commercial banks currently operating in Jamaica are eligible to participate in the facility. As of June 2010, US$96.3 million of the IDB credit facility had been disbursed. The remaining amount under the credit facility was cancelled because it was not disbursed.
D-52
In December 2001, Jamaica issued US$250 million 11.625% fixed rate notes due 2022. In June 2002, Jamaica registered a US$700 million shelf registration statement with the US Securities and Exchange Commission and subsequently in June 2002, issued US$300 million 10.625% notes due 2017 off that shelf. In April 2004, US$125 million was raised through the re-opening of the existing US$300 million 10.625% bonds due 2017. In October 2004, Jamaica issued €150 million 10.5% bonds due 2014, with both issuances placed primarily with investors in Europe. In June 2005, Jamaica raised US$300 million through an offering of 9.0% fixed rate notes due 2015. In October 2005, Jamaica made further issuances of 9.25% US$250 million notes due 2025 and in February 2006, 8.50% US$250 million notes due 2036. In March 2007, Jamaica issued US$350 million 8.0% fixed rate amortizing notes due 2039. In October 2007, Jamaica issued an additional US$150 million 8.0% fixed rate amortizing notes due 2039. In June 2008, Jamaica issued US$350 million 8.0% fixed rate amortizing notes due 2019. In February 2011, Jamaica reopened the US$350 million 8.0% fixed rate bond due 2019, raising an additional US$400 million 8.0% due 2019.
In July 2005, Jamaica issued US$325 million in guarantees with respect to bonds to facilitate the financial restructuring of Air Jamaica Limited, the national airline. In December 2006, Jamaica issued US$200 million in guarantees with respect to bonds to facilitate the restructuring of certain indebtedness of CAP. In June 2007, Jamaica issued US$125 million in guarantees with respect to bonds issued by Air Jamaica. In 2009, Jamaica issued a US$60 million guarantee with respect to the expansion of the Norman Manley International Airport in Kingston. In September 2009, Jamaica issued a guarantee for US$121.65 million to HSBC Bank plc for the financing of the Falmouth Cruise Ship Terminal. Additionally, in December 2009 the Government of Jamaica issued a guarantee to NWC for three loans in respect of The Jamaica Water Supply Improvement Project. The loans were in the amounts of J$1,513.6 million, US$19.3 million and €43.3 million. In October 2010, the Government guaranteed a bond issued by the NWC in the amount of US$275 million.
In February 2010 the Government guaranteed a loan of US$340 million to the Road Maintenance Fund from China through the Eximbank of China under its global Preferential Buyer’s Credit (PBC). The purpose of the loan is to finance the rehabilitation of roads damaged by hurricane and infrastructural upgrade to certain roads and drainage. A loan of US$20 million between the Caribbean Development Bank and the Student Loan Bureau was also guaranteed in November 2010. This loan is to facilitate the provision of affordable and adequate financing to students from poor and vulnerable households to complete tertiary level programs in approved institutions in Jamaica and the Caribbean. In November 2011, the Government guaranteed a bond issued by NROCC in the amount of US$294,180,000.
In September 2011, the World Bank provided the Government with a US$100 million Programmatic Fiscal Sustainability Development Policy Loan. The objective of the loan is to enhance fiscal and debt sustainability, increase the efficiency of financial management and budget processes, and reduce distortions and enhance efficiency in the tax system.
D-53
The following table shows medium and long-term public sector external debt by creditor category for the five years ended December 31, 2011 and other periods of 2012 as indicated:
External Debt by Creditor
| | | | | | | | | | | | | | | | | | | | | | | | |
| | | 2007 | | | 2008 | | | 2009 | | | 2010 | | | 2011 | | | Sept. 30, 2012 | |
| | | (in millions of US$) | |
| | | | | | |
Bilateral | | | | | | | | | | | | | | | | | | | | | | | | |
OECD | | $ | 591.5 | | | $ | 513.6 | | | $ | 494.5 | | | | 464.8 | | | | 404.0 | | | | 347.5 | |
Non-OECD | | | 114.9 | | | | 172.9 | | | | 488.1 | | | | 540.1 | | | | 385.4 | | | | 382.0 | |
| | | | | | | | | | | | | | | | | | | | | | | | |
Total | | | 706.4 | | | | 686.5 | | | | 982.6 | | | | 1,004.9 | | | | 789.4 | | | | 729.5 | |
| | | | | | |
Multilateral | | | | | | | | | | | | | | | | | | | | | | | | |
IADB(1) | | | 515.0 | | | | 570.2 | | | | 661.3 | | | | 1,235.8 | | | | 1,291.5 | | | | 1249.3 | |
IMF(2) | | | 0.0 | | | | 0.0 | | | | 0.0 | | | | 800.0 | | | | 850.0 | | | | 850.0 | |
IBRD(3) | | | 348.8 | | | | 309.2 | | | | 378.9 | | | | 571.5 | | | | 660.1 | | | | 658.3 | |
Other(4) | | | 293.5 | | | | 319.7 | | | | 380.0 | | | | 464.3 | | | | 505.2 | | | | 505.4 | |
| | | | | | | | | | | | | | | | | | | | | | | | |
Total | | | 1,157.3 | | | | 1,199.1 | | | | 1,420.2 | | | | 3,071.6 | | | | 3,306.7 | | | | 3,263.0 | |
| | | | | | |
Commercial Banks | | | 277.9 | | | | 278.1 | | | | 300.6 | | | | 484.0 | | | | 465.8 | | | | 434.6 | |
Other Commercial(5) | | | 52.1 | | | | 40.5 | | | | 42.3 | | | | 41.6 | | | | 36.0 | | | | 30.8 | |
| | | | | | | | | | | | | | | | | | | | | | | | |
Total | | | 330.0 | | | | 318.6 | | | | 342.9 | | | | 525.6 | | | | 501.7 | | | | 465.4 | |
Bonds | | | 3,929.1 | | | | 4,139.5 | | | | 3,848.6 | | | | 3,787.4 | | | | 4,028.3 | | | | 3,728.8 | |
| | | | | | | | | | | | | | | | | | | | | | | | |
Total | | $ | 6,122.8 | | | $ | 6,343.7 | | | $ | 6,594.3 | | | $ | 8,389.5 | | | $ | 8,626.1 | | | $ | 8,186.8 | |
| | | | | | | | | | | | | | | | | | | | | | | | |
| (1) | Inter-American Development Bank. |
| (2) | International Monetary Fund. |
| (3) | International Bank for Reconstruction and Development. |
| (4) | Caribbean Development Bank, OPEC Fund for International Development, European Development Bank, European Economic Commission Community and Nordic Development Fund. |
Source: Ministry of Finance and Planning.
The following table shows Jamaica’s external debt by debtor for the five years ended December 31, 2011 and other periods of 2012, as indicated:
External Debt by Debtor
| | | | | | | | | | | | | | | | | | | | | | | | |
| | | 2007 | | | 2008 | | | 2009 | | | 2010 | | | 2011 | | | Sept. 30, 2012 | |
| | | (in millions of US$) | |
| | | | | | |
Government Direct | | $ | 5,173.7 | | | $ | 5,441.6 | | | $ | 5,463.9 | | | $ | 6,287.1 | | | $ | 6,376.6 | | | $ | 5,991.3 | |
Government-Guaranteed | | | 948.1 | | | | 901.7 | | | | 1,130.4 | | | | 1,302.5 | | | | 1,399.5 | | | | 1,345.5 | |
Bank of Jamaica | | | 1.0 | | | | 0.4 | | | | 0.0 | | | | 800.0 | | | | 850.0 | | | | 850.0 | |
| | | | | | | | | | | | | | | | | | | | | | | | |
Total | | $ | 6,122.8 | | | $ | 6,343.7 | | | $ | 6,594.3 | | | $ | 8,389.5 | | | $ | 8,626.1 | | | $ | 8,186.8 | |
| | | | | | | | | | | | | | | | | | | | | | | | |
Source: Ministry of Finance and Planning.
D-54
The following table shows the amortization schedule for external debt outstanding as of September 30, 2012:
External Debt Principal Amortization Schedule
as of September 30, 2012
| | | | | | | | | | | | | | | | | | | | | | | | |
| | | 2012 | | | 2013 | | | 2014 | | | 2015 | | | 2016 | | | 2017 | |
| | | (in millions of US$) | |
| | | | | | |
Multilateral | | | | | | | | | | | | | | | | | | | | | | | | |
IADB | | $ | 98.0 | | | $ | 98.4 | | | $ | 58.5 | | | $ | 64.2 | | | | 95.7 | | | | 103.0 | |
IBRD | | | 35.5 | | | | 37.2 | | | | 36.4 | | | | 40.8 | | | | 46.2 | | | | 46.5 | |
Other | | | 30.8 | | | | 305.1 | | | | 558.5 | | | | 396.4 | | | | 163.8 | | | | 50.5 | |
| | | | | | | | | | | | | | | | | | | | | | | | |
Total | | | 164.3 | | | | 440.7 | | | | 653.4 | | | | 501.4 | | | | 305.7 | | | | 200.0 | |
| | | | | | | | | | | | | | | | | | | | | | | | |
Commercial Banks | | | 76.2 | | | | 68.2 | | | | 65.4 | | | | 72.3 | | | | 80.9 | | | | 77.1 | |
Other Commercial | | | 7.7 | | | | 5.9 | | | | 5.9 | | | | 3.0 | | | | 1.1 | | | | 1.1 | |
Bonds | | | 355.1 | | | | 47.6 | | | | 240.6 | | | | 472.6 | | | | 19.0 | | | | 706.0 | |
Bilateral | | | 75.4 | | | | 66.1 | | | | 56.0 | | | | 89.9 | | | | 84.9 | | | | 78.7 | |
| | | | | | | | | | | | | | | | | | | | | | | | |
Total | | $ | 658.7 | | | $ | 668.5 | | | $ | 1,021.3 | | | $ | 1,139.2 | | | $ | 491.6 | | | $ | 1,062.9 | |
| | | | | | | | | | | | | | | | | | | | | | | | |
Source: Ministry of Finance and Planning.
The following table shows the interest schedule for external debt outstanding as of September 30, 2012:
External Debt Interest Schedule
as of September 30, 2012
| | | | | | | | | | | | | | | | | | | | | | | | |
| | | 2012 | | | 2013 | | | 2014 | | | 2015 | | | 2016 | | | 2017 | |
| | | (in millions of US$) | |
| | | | | | |
Multilateral | | | | | | | | | | | | | | | | | | | | | | | | |
IADB | | $ | 38.0 | | | $ | 29.3 | | | $ | 27.2 | | | $ | 25.8 | | | $ | 24.1 | | | $ | 21.6 | |
IBRD | | | 6.5 | | | | 10.9 | | | | 10.0 | | | | 9.0 | | | | 7.8 | | | | 6.7 | |
Other | | | 39.2 | | | | 35.2 | | | | 30.3 | | | | 23.0 | | | | 18.4 | | | | 15.7 | |
| | | | | | | | | | | | | | | | | | | | | | | | |
Total | | | 83.7 | | | | 75.4 | | | | 67.5 | | | | 57.8 | | | | 50.3 | | | | 44.0 | |
| | | | | | | | | | | | | | | | | | | | | | | | |
Commercial Banks | | | 18.0 | | | | 14.9 | | | | 14.0 | | | | 13.1 | | | | 10.9 | | | | 7.8 | |
Other Commercial | | | 1.5 | | | | 1.4 | | | | 1.2 | | | | 1.0 | | | | 0.9 | | | | 0.9 | |
Bonds | | | 344.0 | | | | 332.6 | | | | 328.3 | | | | 288.3 | | | | 265.6 | | | | 231.6 | |
Bilateral | | | 42.0 | | | | 24.0 | | | | 24.2 | | | | 24.6 | | | | 24.0 | | | | 14.9 | |
| | | | | | | | | | | | | | | | | | | | | | | | |
Total | | $ | 489.3 | | | $ | 448.5 | | | $ | 435.2 | | | $ | 384.8 | | | $ | 351.7 | | | $ | 299.2 | |
| | | | | | | | | | | | | | | | | | | | | | | | |
Source: Ministry of Finance and Planning.
The following table shows the maturity structure for external debt outstanding as of September 30, 2012
Total External Debt Maturity Structure
as of September 30, 2012
| | | | | | | | | | | | | | | | | | | | |
| | | Less than
1 year | | | 1-5
years | | | 5-10
years | | | 10 years
& over | | | Total | |
| | | (in millions of US$) | |
| | | | | |
Bilateral | | | 65.2 | | | | 52.5 | | | | 194.8 | | | | 417.0 | | | | 729.5 | |
Multilateral | | | 115.1 | | | | 971.3 | | | | 387.0 | | | | 1,789.6 | | | | 3,262.9 | |
IADB | | | 62.4 | | | | 97.3 | | | | 163.6 | | | | 926.0 | | | | 1,249.3 | |
IBRD | | | 30.6 | | | | 5.8 | | | | 157.8 | | | | 464.3 | | | | 658.3 | |
IMF | | | 0 | | | | 849.9 | | | | 0 | | | | 0 | | | | 849.9 | |
Other | | | 22.1 | | | | 18.2 | | | | 65.5 | | | | 399.6 | | | | 505.4 | |
D-55
| | | | | | | | | | | | | | | | | | | | |
| | | Less than
1 year | | | 1-5
years | | | 5-10
years | | | 10 years
& over | | | Total | |
| | | (in millions of US$) | |
| | | | | |
Commercial Bank | | | 52.7 | | | | 38.5 | | | | 299.9 | | | | 43.7 | | | | 434.6 | |
Other Commercial | | | 9.2 | | | | 11.3 | | | | 0 | | | | 10.3 | | | | 30.8 | |
Bonds | | | 0 | | | | 1,126.1 | | | | 1,182.3 | | | | 1,420.5 | | | | 3,728.8 | |
| | | | | | | | | | | | | | | | | | | | |
Total | | | 242.2 | | | | 2,199.7 | | | | 2,063.9 | | | | 3,681.0 | | | | 8,186.7 | |
| | | | | | | | | | | | | | | | | | | | |
Percentage | | | 3.0 | | | | 26.9 | | | | 25.2 | | | | 45.0 | | | | 100.0 | |
| | | | | | | | | | | | | | | | | | | | |
Source: Ministry of Finance and Planning.
The following table shows interest rate composition for external debt as of September 30, 2012:
External Debt Interest Rate Composition as at September 30, 2012
| | | | | | | | |
| | | Principal Amount
Outstanding | | | Share of
Outstanding Debt | |
| | | (in millions of US$) | | | (%) | |
| | |
Variable Rate Debt | | | 67.5 | | | | 5,525.25 | |
Fixed Rate Debt | | | 32.5 | | | | 2,661.52 | |
| | | | | | | | |
Total Debt | | | 100.0 | | | | 8,186.77 | |
| | | | | | | | |
Source: Ministry of Finance and Planning.
D-56
External Public and Publicly Guaranteed Debt (including Bank of Jamaica debt)(1)
| | | | | | | | | | | | | | | | | | |
| | | Interest | | | Issue Date | | Final Maturity | | Currencies | | Principal Amount
Outstanding at
March 31, 2012 | | | Principal Amount
Outstanding at
September 30,
2012 | |
| | | % | | | | | | | | | (in US$) | | | (in US$) | |
| | | | | | |
Multilateral Organizations | | | | | | | | | | | | | | | | | | |
World Bank | | | Various | | | Various | | Various | | USD, JPK, GBP, CAD, EUR | | | 651,046,824.0 | | | | 658,284,551.0 | |
Inter-American Dev. Bank | | | Various | | | Various | | Various | | USD, JPK, GBP, CAD, EUR | | | 1,271,643,263.0 | | | | 1,249,329,630.0 | |
Others | | | Various | | | Various | | Various | | USD, JPK, GBP, CAD, EUR, SDR | | | 528,246,405.0 | | | | 505,394,126.0 | |
IMF(2) | | | | | | | | | | | | | 849,975,176.0 | | | | 849,975,176.0 | |
| | | | | | | | | | | | | | | | | | |
Total Multilateral Organizations | | | | | | | | | | | | | 3,300,911,668.0 | | | | 3,262,983,483.0 | |
| | | | | | | | | | | | | | | | | | |
Foreign Governments (including Original Loans and Paris Club) | | | Various | | | Various | | Various | | USD, JPK, GBP, CAD, EUR | | | | | | | | |
Bonds (Global) USD | | | | | | | | | | | | | | | | | | |
USD250 mn 2022 | | | 11.625 | % | | Dec. 19, 2001 | | Jan. 15, 2022 | | USD | | | 250,000,000.0 | | | | 250,000,000.0 | |
USD300 mn 2017 | | | 10.625 | % | | June 20, 2002 | | June 20, 2017 | | USD | | | 300,000,000.0 | | | | 300,000,000.0 | |
USD125 mn 2017 | | | 10.625 | % | | April 27, 2004 | | June 20, 2017 | | USD | | | 125,000,000.0 | | | | 125,000,000.0 | |
USD300 mn 2015 | | | 9.0 | % | | June 2, 2005 | | June 2, 2015 | | USD | | | 300,000,000.0 | | | | 300,000,000.0 | |
USD250 mn 2025 | | | 9.25 | % | | October 18, 2005 | | October 18, 2025 | | USD | | | 250,000,000.0 | | | | 250,000,000.0 | |
USD250 mn 2036 | | | 8.50 | % | | February 28, 2006 | | February 28, 2036 | | USD | | | 250,000,000.0 | | | | 250,000,000.0 | |
USD125 mn 2015 | | | Variable | | | July 2005 | | July 2015 | | USD | | | 125,000,000.0 | | | | 125,000,000.0 | |
USD200 mn 2015 | | | 9.375 | % | | July 2005 | | July 2015 | | USD | | | 100,000,000.0 | | | | 85,714,286.0 | |
USD200 mn 2021 | | | 8.5 | % | | Nov. 16, 2006 | | Nov. 16, 2021 | | USD | | | 190,476,191.0 | | | | 180,952,381.0 | |
USD125 mn 2027 | | | 8.125 | % | | June 2007 | | July 2027 | | USD | | | 125,000,000.0 | | | | 125,000,000.0 | |
USD150 mn 2039 | | | 8.0 | % | | October 11, 2007 | | March 15, 2039 | | USD | | | 150,000,000.0 | | | | 150,000,000.0 | |
USD350 mn 2039 | | | 8.0 | % | | March 15, 2007 | | March 15, 2039 | | USD | | | 250,000,000.0 | | | | 250,000,000.0 | |
USD350 mn 2019 | | | 8.0 | % | | June 24, 2008 | | June 24, 2019 | | USD | | | 350,000,000.0 | | | | 350,000,000.0 | |
USD400 mn 2019 | | | 8.0 | % | | February 14, 2011 | | June 24, 2019 | | USD | | | 400,000,000.0 | | | | 400,000,000.0 | |
USD294.18mn 2024 | | | 9.375 | | | Nov 3, 2011 | | Nov 10, 2024 | | USD | | | 294,180,000.0 | | | | 294,180,000.0 | |
| | | | | | | | | | | | | | | | | | |
Total (Global) USD | | | | | | | | | | | | | 3,459,656,191.0 | | | | 3,435,846,667.0 | |
| | | | | | | | | | | | | | | | | | |
Bonds (EUR) | | | | | | | | | | | | | | | | | | |
EUR150 mn 2014 | | | 10.50 | % | | Oct. 27, 2004 | | Oct. 27, 2014 | | EUR | | | 150,000,000.0 | | | | 150,000,000.0 | |
| | | | | | | | | | | | | | | | | | |
Total (EUR) | | | | | | | | | | | | | 350,000,000.0 | | | | 150,000,000.0 | |
| | | | | | | | | | | | | | | | | | |
Commercial Banks | | | Various | | | Various | | Various | | USD | | | 467,434,536.0 | | | | 434,618,856.0 | |
Other Commercial (Export Credit) | | | Various | | | Various | | Various | | USD, JPK, GBP, CAD, EUR | | | 32,538,925.0 | | | | 30,829,350.0 | |
| | | | | | | | | | | | | | | | | | |
Total | | | | | | | | | | | | | 499,973,461.0 | | | | 465,448,206.0 | |
| | | | | | | | | | | | | | | | | | |
| (1) | LEGEND: USD = United States Dollar; CAD = Canadian Dollar; JPK = Japanese Yen; EUR = Euro; SDR = Special Drawing Rights. |
| (2) | These are amounts disbursed under the SBA. |
D-57
External Public Direct Debt(1)
| | | | | | | | | | | | | | | | | | |
| | | Interest | | | Issue Date | | Final Maturity | | Currencies | | Principal Amount
Outstanding at
March 31, 2012 | | | Principal Amount
Outstanding at
September 30,
2012 | |
| | | % | | | | | | | | | (in US$) | | | (in US$) | |
| | | | | | |
Multilateral Organizations | | | | | | | | | | | | | | | | | | |
World Bank | | | Various | | | Various | | Various | | USD, JPK, GBP, CAD, EUR | | | 651,046,824.0 | | | | 658,284,551.0 | |
Inter-American Dev. Bank | | | Various | | | Various | | Various | | USD, JPK, GBP, CAD, EUR, UOA | | | 1,262,695,646.0 | | | | 1,240,757,013.0 | |
Others | | | Various | | | Various | | Various | | USD, JPK, GBP, CAD, EUR, SDR | | | 365,116,685.0 | | | | 360,165,540.0 | |
| | | | | | | | | | | | | | | | | | |
Total Multilateral Organizations | | | | | | | | | | | | | 2,278,859,155.0 | | | | 2,259,207,104.0 | |
| | | | | | | | | | | | | | | | | | |
| | | | | | |
Foreign Governments (including Original Loans and Paris Club) | | | Various | | | Various | | Various | | USD, JPK, GBP, CAD, EUR | | | 617,593,780.9 | | | | 590,313,083.4 | |
Bonds (Global) USD | | | | | | | | | | | | | | | | | | |
USD300 mn 2017 | | | 10.63 | % | | June 20, 2002 | | June 20, 2017 | | USD | | | 300,000,000.0 | | | | 300,000,000.0 | |
US$125 mn 2017 | | | 10.63 | % | | April 30, 2004 | | June 20, 2017 | | USD | | | 125,000,000.0 | | | | 125,000,000.0 | |
USD250 mn 2022 | | | 11.63 | % | | Dec. 19, 2001 | | Jan. 15, 2022 | | USD | | | 250,000,000.0 | | | | 250,000,000.0 | |
USD300 mn 2015 | | | 9.0 | % | | June 2, 2005 | | June 2, 2015 | | USD | | | 300,000,000.0 | | | | 300,000,000.0 | |
USD250 mn 2025 | | | 9.25 | % | | October 18, 2005 | | October 17, 2025 | | USD | | | 250,000,000.0 | | | | 250,000,000.0 | |
USD250 mn 2036 | | | 8.50 | % | | February 28, 2006 | | February 28, 2036 | | USD | | | 250,000,000.0 | | | | 250,000,000.0 | |
USD150 mn 2039 | | | 8.0 | % | | October 11, 2007 | | March 15, 2039 | | USD | | | 150,000,000.0 | | | | 150,000,000.0 | |
USD350 mn 2039 | | | 8.0 | % | | March 15, 2007 | | March 15, 2039 | | USD | | | 350,000,000.0 | | | | 350,000,000.0 | |
USD350 mn 2019 | | | 8.0 | % | | June 24, 2008 | | June 24, 2019 | | USD | | | 350,000,000.0 | | | | 350,000,000.0 | |
USD400 mn 2019 | | | 8.0 | % | | February 14, 2011 | | June 24, 2019 | | USD | | | 400,000,000.0 | | | | 400,000,000.0 | |
Total (Global) USD | | | | | | | | | | | | | 2,725,000,000.0 | | | | 2,725,000,000.0 | |
| | | | | | | | | | | | | | | | | | |
Bond (EUR) | | | | | | | | | | | | | | | | | | |
EUR 150 mn 2014 | | | 10.50 | % | | Feb. 11, 2004 | | Feb. 11, 2014 | | EUR | | | 150,000,000.0 | | | | 150,000,000.0 | |
| | | | | | | | | | | | | | | | | | |
Total | | | | | | | | | | | | | 350,000,000.0 | | | | 150,000,000.0 | |
| | | | | | | | | | | | | | | | | | |
Commercial Banks | | | Various | | | Various | | Various | | USD | | | | | | | | |
Other Commercial (Export Credit) | | | Various | | | Various | | Various | | USD | | | 231,350,026.0 | | | | 207,176,654.0 | |
| | | | | | | | | | | | | | | | | | |
| | | | | | |
Total | | | | | | | | | | | | | 6,334,913,443.9 | | | | 6,288,659,483.9 | |
| | | | | | | | | | | | | | | | | | |
| (1) | LEGEND: USD = United States Dollar; CAD = Canadian Dollar; JPK = Japanese Yen; EUR = Euro; SDR = Special Drawing Rights, which are units of measure derived from a group of currencies which constitute the International Monetary Fund loan portfolio; UOA = Units of Accounts, which are units of measure derived from a group of currencies which constitute the Inter-American Development Bank loan portfolio; GBP = British Pound Sterling. |
D-58
External Guaranteed Debt(1)
| | | | | | | | | | | | | | |
| | | Interest | | | Issue Date | | Final Maturity | | Currencies | | Principal Amount
Outstanding at
September 30,
2012 | |
| | | % | | | | | | | | | (in US$) | |
| | | | | |
Multilateral Organizations | | | | | | | | | | | | | | |
Inter-American Dev. Bank | | | Various | | | Various | | Various | | USD | | | 0 | |
Others | | | Various | | | Various | | Various | | USD, EUR | | | 153,801,203.0 | |
| | | | | | | | | | | | | | |
Total Multilateral Organizations | | | | | | | | | | | | | 153,801,203.0 | |
| | | | | | | | | | | | | | |
Foreign Governments (including Original Loans) | | | Various | | | Various | | Various | | USD | | | 139,195,557.3 | |
Commercial Banks | | | Various | | | Various | | Various | | USD | | | 227,442,202.0 | |
Other Commercial (Export Credit) | | | Various | | | Various | | Various | | USD,
CAD | | | 14,260,023.0 | |
Bonds | | | | | | | | | | | | | | |
| | | | | |
US$ 125 million due 2015 | | | Variable | | | July 2005 | | July 2015 | | USD | | | 125,000,000.0 | |
| | | | | | | | | | | | | | |
| | | | | |
US$ 200 million due 2015 | | | 9.375 | % | | July 2005 | | July 2015 | | USD | | | 85,714,286.0 | |
| | | | | | | | | | | | | | |
| | | | | |
US$125 million due 2017 | | | 8.125 | % | | June 2007 | | June 2027 | | USD | | | 125,000,000.0 | |
| | | | | | | | | | | | | | |
| | | | | |
US$ 200 million due 2021 | | | 8.5 | % | | November 2006 | | November 2006 | | USD | | | 180,952,381.0 | |
| | | | | | | | | | | | | | |
| | | | | |
US$ 294.18 million due 2024 | | | 9.375 | % | | November 2011 | | November 2024 | | USD | | | 294,180,000.0 | |
| | | | | | | | | | | | | | |
Total | | | | | | | | | | | | | 1,345,545,652.3 | |
| | | | | | | | | | | | | | |
| (1) | LEGEND: USD = United States Dollar; CAD = Canadian Dollar; EUR = Euro. |
Bank of Jamaica Debt(1)
| | | | | | | | | | | | |
| | | Interest | | Issue
Date | | Final
Maturity | | Currencies | | Principal Amount
Outstanding at
September 30,
2012 | |
| | | % | | | | | | | | (in US$) | |
| | | | | |
Foreign Governments (including Original Loans) | | n.a. | | n.a. | | n.a. | | USD | | | 0 | |
IMF(2) | | | | | | | | | | | 849,975,176.0 | |
Total | | Various | | Various | | Various | | Various | | | 849,975,176.0 | |
| | | | | | | | | | | | |
| (1) | LEGEND: USD = United States Dollar; SDR = Special Drawing Rights. |
| (2) | These are amounts disbursed under the SBA. |
Debt Service Indicators
Public sector external debt as a percentage of nominal GDP decreased to 60.2% at December 31, 2011, from 62.4% at December 31, 2010. External debt as a percentage of exports of goods and services decreased to 113.7% at December 31, 2010, from 131.8% at December 31, 2010. External debt service payments as a percentage of exports of goods and services decreased to 7.1% during 2011 from 7.6% during 2010.
D-59
The following table shows public sector external debt indicators for the five years ended December 31, 2011.
Debt Indicators
| | | | | | | | | | | | | | | | | | | | |
| | | 2007 | | | 2008 | | | 2009 | | | 2010 | | | 2011 | |
| | | (in millions of US$, except percentages) | |
| | | | | |
External Debt Service Principal | | $ | 483.4 | | | $ | 486.1 | | | $ | 203.3 | | | $ | 265.9 | | | $ | 677.9 | |
Interest | | | 428.0 | | | | 394.5 | | | | 387.7 | | | | 476.7 | | | $ | 484.4 | |
| | | | | | | | | | | | | | | | | | | | |
Total | | | 911.4 | | | | 880.6 | | | | 591.0 | | | | 742.6 | | | | 1,162.3 | |
| | | | | | | | | | | | | | | | | | | | |
| | | | | |
Exports of Goods and Services(1) | | | 7,454.8 | | | | 8,027.2 | | | | 6,160.3 | | | | 6,294.9 | | | | 6,826.9 | |
External Debt Service Ratio (%) | | | 12.2 | | | | 11.0 | | | | 9.6 | | | | 11.7 | | | | 17.0 | |
Interest on External Debt/Exports of Goods and Services (%)(1) | | | 5.7 | | | | 4.9 | | | | 6.3 | | | | 7.6 | | | | 7.1 | |
External Debt Outstanding/Exports of Goods and Services (%)(1) | | | 82.1 | | | | 79.0 | | | | 107.0 | | | | 133.3 | | | | 126.4 | |
| | | | | |
External Debt/Nominal GDP (%)(2) | | | 48.8 | | | | 50.8 | | | | 54.7 | | | | 61.4 | | | | 60.2 | |
Domestic Debt/Nominal GDP (%)(3) | | | 63.1 | | | | 60.6 | | | | 69.8 | | | | 68.2 | | | | 71.1 | |
| | | | | | | | | | | | | | | | | | | | |
Total Debt/Nominal GDP (%)(2) | | | 111.9 | | | | 111.4 | | | | 124.5 | | | | 119.6 | | | | 131.3 | |
| | | | | | | | | | | | | | | | | | | | |
| (1) | Exports of goods, services and current transfers. |
| (2) | Calculated by converting external debt to Jamaica dollars using the average annual nominal exchange rate. |
| (3) | Calculated using Jamaican dollars. |
Source: Ministry of Finance and Planning and Bank of Jamaica.
Debt Records
Jamaica has never defaulted on any of its external or domestic debt obligations, which under the Jamaican Constitution are paid without any requirement of Parliamentary approval, directly from revenue and assets of Jamaica, before funds are available to Jamaica for other policies and programs. Since 1993, Jamaica has been involved in only one debt restructuring, which occurred in January 2010. See “—The Jamaica Debt Exchange.”
On January 25, 1993, Jamaica entered into a multi-year debt service rescheduling arrangement with the Paris Club comprised of OECD creditor governments and their agencies. This accord spanned the 36-month consolidation period from October 1, 1992 through September 30, 1995. Pursuant to the Paris Club Accord, the parties finalized the single outstanding bilateral implementing agreement in January 1996.
In March 1996, Jamaica formally completed a three-year extended fund facility with the International Monetary Fund.
D-60
Summary of Economic Information
| | | | | | | | | | | | | | | | | | | | |
| | | 2007 | | | 2008 | | | 2009 | | | 2010 | | | 2011 | |
| | | (in millions of US$, except where noted) | |
DOMESTIC SECTOR(1) | | | | | | | | | | | | | | | | | | | | |
Nominal GDP (J$ millions) | | | 885,352.5 | | | | 997,625.9 | | | | 1,067,955.1 | | | | 1,153,666.0 | | | | 1,241,782.5 | |
Nominal GDP(2) | | | 12,812.6 | | | | 13,591.6 | | | | 12,026.5 | | | | 13,215.0 | | | | 14,422.6 | |
Real Gross Domestic Product (J$ millions)(3) | | | 766,972.0 | | | | 760,730.8 | | | | 734,265.7 | | | | 723,181.6 | | | | 732,388.2 | |
Real GDP(2) | | | 11,099.5 | | | | 10,364.2 | | | | 8,268.8 | | | | 8,283.9 | | | | 8,506.3 | |
Percent Change in Real GDP | | | 1.4 | | | | (0.8 | ) | | | (3.5 | ) | | | (1.5 | ) | | | 1.3 | |
Real GDP per capita (J$/person) | | | 286,633 | | | | 283,094 | | | | 272,394 | | | | 267,726 | | | | 270,603 | |
Inflation | | | | | | | | | | | | | | | | | | | | |
Consumer Price Index (Percent Change) | | | 16.8 | | | | 16.8 | | | | 10.2 | | | | 11.7 | | | | 6.0 | |
Interest Rates (Percent)(4) | | | | | | | | | | | | | | | | | | | | |
Weighted Average Loan Rate | | | 21.6 | | | | 21.4 | | | | 21.5 | | | | 20.4 | | | | 19.5 | |
Weighted Average Deposit Rate | | | 7.0 | | | | 6.6 | | | | 6.7 | | | | 3.8 | | | | 2.6 | |
Treasury Bill Yield(5) | | | 13.3 | | | | 24.4 | | | | 16.8 | | | | 7.5 | | | | 6.5 | |
Unemployment Rate (Percent)(6) | | | 9.7 | | | | 10.6 | | | | 11.4 | | | | 12.4 | | | | 12.7 | |
EXTERNAL SECTOR | | | | | | | | | | | | | | | | | | | | |
Average Annual Nominal Exchange Rate (J$/US$) | | | 69.1 | | | | 73.4 | | | | 88.8 | | | | 87.3 | | | | 86.1 | |
Export of Goods | | | 2,305.2 | | | | 2,682.8 | | | | 1,319.4 | | | | 1,335.7 | | | | 1,624.3 | |
Alumina | | | 1,193.1 | | | | 1,230.5 | | | | 368.0 | | | | 402.8 | | | | 583.1 | |
Sugar | | | 100.3 | | | | 104.3 | | | | 72.3 | | | | 44.2 | | | | 62.2 | |
Imports of Goods | | | 6,893.0 | | | | 8,361.0 | | | | 5,057.6 | | | | 5,326.4 | | | | 6,614.8 | |
Goods Balance | | | (4,587.8 | ) | | | (5,678.2 | ) | | | (3,738.2 | ) | | | (3,990.8 | ) | | | (4,990.5 | ) |
Current Account Balance | | | (2,038.2 | ) | | | (2,793.3 | ) | | | (1,127.5 | ) | | | (930.8 | ) | | | (2,109.8 | ) |
Gross Foreign Direct Investments | | | 866.5 | | | | 1436.6 | | | | 540.9 | | | | 227.7 | | | | 219.8 | |
Net Foreign Direct Investments | | | 751.5 | | | | 1,360.7 | | | | 479.8 | | | | 169.5 | | | | 145.3 | |
Increase/(Decrease) in Reserves | | | (439.9 | ) | | | (104.8 | ) | | | (43.5 | ) | | | 442.0 | | | | (205.3 | ) |
Net International Reserves of the Bank of Jamaica | | | 1,877.7 | | | | 1,772.9 | | | | 1,729.4 | | | | 2,171.4 | | | | 1,966.1 | |
Weeks of Coverage of Goods Imports(7) | | | 16.4 | | | | 14.8 | | | | 18.9 | | | | 32.3 | | | | 25.5 | |
PUBLIC FINANCE (J$ millions)(8) | | | | | | | | | | | | | | | | | | | | |
Revenue and Grants | | | 256,640.7 | | | | 276,199.8 | | | | 300,200.1 | | | | 316,041.4 | | | | 322,149.8 | |
Expenditure | | | 294,279.6 | | | | 351,521.4 | | | | 421,458.5 | | | | 388,768.0 | | | | 403,122.2 | |
Fiscal Surplus (Deficit) | | | (37,638.8 | ) | | | (75,321.6 | ) | | | (121,258.4 | ) | | | (72,726.6 | | | | (80,972.4 | ) |
Fiscal Surplus (Deficit) as a percent of Nominal GDP | | | (4.1 | ) | | | (7.4 | ) | | | (11.1 | ) | | | (6.2 | ) | | | (6.4 | ) |
Primary Surplus | | | 64,084.6 | | | | 49,983.6 | | | | 67,457.2 | | | | 55,628.1 | | | | 39,662.6 | |
Primary Surplus as a percent of Nominal GDP | | | 7.0 | | | | 5.0 | | | | 6.2 | | | | 4.6 | | | | 3.1 | |
Loan Receipts | | | 135,240.3 | | | | 212,148.6 | | | | 299,599.6 | | | | 212,968.9 | | | | 163,520.5 | |
Amortization | | | 106,115.4 | | | | 148,733.2 | | | | 169,514.0 | | | | 102,157.5 | | | | 128,373.2 | |
Overall Surplus (Deficit) | | | (8,514.0 | ) | | | (11,906.2 | ) | | | 8,827.2 | | | | 38,084.5 | | | | (45,825.0 | ) |
Overall Public Sector Surplus (Deficit)(9) | | | (63,000.0 | ) | | | (96,367.2 | ) | | | (124,534.2 | ) | | | (78,514.2 | ) | | | (80,851.8 | ) |
Overall Public Sector Surplus (Deficit) as a percent of Nominal GDP | | | (6.9 | ) | | | (9.5 | ) | | | (11.4 | ) | | | (6.7 | ) | | | (6.4 | ) |
PUBLIC DEBT | | | | | | | | | | | | | | | | | | | | |
Domestic Debt (J$ millions)(10) | | | 558,426.3 | | | | 608,915.5 | | | | 754,015.1 | | | | 799,964.2 | | | | 883,388.6 | |
Percent of Nominal GDP | | | 63.1 | | | | 60.6 | | | | 69.8 | | | | 68.2 | | | | 71.1 | |
Public Sector External Debt | | | 6,122.8 | | | | 6,343.7 | | | | 6,594.3 | | | | 8,389.5 | | | | 8626.1 | |
Percent of Nominal GDP | | | 48.8 | | | | 50.8 | | | | 54.7 | | | | 61.4 | | | | 60.2 | |
Total Public Sector Debt (J$ millions) | | | 990,800.9 | | | | 1,119,401.9 | | | | 1,344,864.8 | | | | 1,520,301.0 | | | | 1,630,414.9 | |
Percent of Nominal GDP | | | 111.9 | | | | 111.3 | | | | 124.5 | | | | 129.6 | | | | 131.3 | |
External Debt Service Ratio | | | 12.2 | | | | 11.0 | | | | 9.6 | | | | 11.7 | | | | 17.0 | |
TOURISM | | | | | | | | | | | | | | | | | | | | |
Total Visitor Arrivals | | | 2,880,289 | | | | 2,859,534 | | | | 2,753,446 | | | | 2,831,297 | | | | 3,077,233 | |
Occupancy Rate (% Hotel Rooms) | | | 63.2 | | | | 60.4 | | | | 59.0 | | | | 60.5 | | | | 60.5 | |
Visitor Expenditures(11) | | | 1,943.0 | | | | 1,975.5 | | | | 1,925.4 | | | | 2,001.2 | | | | 2,012.5 | |
| (1) | The gross domestic product series has been revised. This revision was made in order to capture the changing structure of industries in the manufacturing, financial and insurance services, business services and the miscellaneous services sectors. In addition, the base year has been changed from 1996 to 2003. |
| (2) | Calculated using the average annual nominal exchange rate. |
| (3) | At constant 2007 prices |
| (4) | Loans are in domestic currency. |
| (5) | Tenors of Treasury Bills are approximately 182 days. |
| (6) | Includes all persons without jobs, whether actively seeking employment or not. In 2003, three labor force surveys were conducted (in April, July and October). Four labor force surveys were conducted in each of 2005, 2006, 2007 and 2008 (in January, April, July and October). |
| (7) | Calculated on the basis of gross international reserves. |
| (8) | Fiscal year data from April 1 to March 31. For example, 2010 refers to the period April 1, 2010 to March 31, 2011. |
| (9) | Overall Public Sector comprises the central government, the Bank of Jamaica, governmental statutory bodies and authorities and government-owned companies. |
| (10) | Does not include contingent liabilities in the form of guarantees of certain obligations of public entities. |
Source: Bank of Jamaica, Statistical Institute of Jamaica, Ministry of Finance and Planning and Jamaica Tourist Board.
D-61
THE MONETARY SYSTEM
Bank of Jamaica
The Bank of Jamaica (BOJ) was established in 1960 pursuant to the Bank of Jamaica Act 1960 and commenced operations in 1961. The Bank of Jamaica Act, together with the Banking Act 1992, the Financial Institutions Act, the Building Societies Act and the Bank of Jamaica (Building Societies) Regulations provides the Bank of Jamaica with the statutory authority for regulating the activities of the banking system.
Amendments to the Banking Act and the Bank of Jamaica Act designed to strengthen the Bank of Jamaica’s oversight in banking activities became law in October 1997 and March 2002, respectively. Amendments to the Financial Institutions Act, which regulates merchant banks, and the Building Societies Act, which regulates building societies, also became law in October 1997 and March 2002, respectively. See “— the Financial System” and “—Legislation and Regulation.” Amendments to the Bank of Jamaica Act, subjecting money transmitters and remittance agencies to licensing regimes and regulations comparable to those applicable to other institutions that deal with approved foreign currency became law in February 2004. These amendments will bring Jamaica in line with the Financial Action Task Force’s (FATF) 40 revised recommendations.
In addition to its operations relating to the issue and redemption of currency and as banker to the Government of Jamaica, the Bank of Jamaica’s primary role remains the development and implementation of monetary policies aimed at achieving Jamaica’s inflation objectives and maintaining long-term stability in the foreign exchange market. As the banking supervisory authority, the Bank of Jamaica is also required to ensure the soundness and development of the financial system pursuant to the Banking Act, the Financial Institutions Act and the Building Societies Act and BOJ (Building Societies) Regulations.
Money Supply and Interest Rates
The monetary base expanded by 7.8% in 2011, following an increase of 4.9% in 2010. The monetary base comprises currency issue in the hands of the public, plus vault cash held in the banking system, statutory cash reserves and demand deposits of commercial banks held at the Bank of Jamaica. The acceleration in growth in 2011 primarily reflected an expansion of 10.5% in currency issue relative to an increase of 9.4% in 2010. There was also an increase of 4.0% in the cash reserves of the commercial banks. Money supply (M2) grew by 4.1% in 2011, an acceleration relative to the increase of 1.7% in 2010 but was lower than the expansion of 6.0% in 2009. The faster growth in M2 in 2011 largely reflected an acceleration in the growth of narrow money, which is comprised of currency in circulation and demand deposits. Currency in circulation and demand deposits increased by 9.0% and 6.2%, respectively, in 2011. During 2010, currency in circulation and demand deposits expanded by 8.7% and 0.9%, respectively.
For the first ten months of 2012, the monetary base declined by 5.7%, relative to a contraction of 1.3% for the comparable period of 2011. The contraction in the monetary base during the first ten months of 2012 reflected net currency redemption of 12.1%, a sharper pace of decline in respect with the 10.2% obtained in the corresponding period of 2011. For the first 10 months of 2012, the stock of money supply (M2) grew by 1.1% as compared to 6.9% for the corresponding period of 2011.
During 2011, the Bank of Jamaica continued to ease its monetary policy stance, in a context of a favorable outlook for inflation and inflation expectations, a strengthening of the Jamaica Dollar, strong net international reserves and improved investor confidence. In this regard, the rate on the Bank’s 30-day Certificate of Deposit was reduced on four occasions by a total of 125 basis points to 6.25% at end of September 2011. During 2011 the average domestic currency loan rate of commercial banks declined to 18.0% at December 31, 2011, compared to a 20.4% at December 31, 2010.
The Bank of Jamaica has maintained its signal rate at 6.25% since September 2011. This is in a context of concerns regarding the volatility of prices in the international commodities market, uncertainties surrounding the timing and content of a new agreement with the International Monetary Fund, the debt crisis in the Eurozone as well as concerns about the pass-through of the recent depreciation in the exchange rate to inflation. These concerns and
D-62
their effects on inflation were, however, tempered by a persistent weak domestic demand. This weak demand also contributed to further declines in commercial bank loan rates. The average domestic currency loan rate of commercial banks declined to 17.40% by September 2012 from 18.0% in December 2011.
The following tables show determinants of money supply and interest rates for the five years ended December 31, 2011:
Money Supply
| | | | | | | | | | | | | | | | | | | | |
| | | 2007 | | | 2008 | | | 2009(3) | | | 2010 | | | 2011 | |
| | | (in millions of J$) | |
| | | | | |
Narrow Money (M1) | | | 105,554.7 | | | | 100,197.1 | | | | 107,818.0 | | | | 112,234.4 | | | | 120,569.9 | |
Currency | | | 40,674.9 | | | | 41,995.8 | | | | 44,614.8 | | | | 48,476.7 | | | | 52,853.8 | |
Quasi-Money(1) | | | 194,645.6 | | | | 213,042.3 | | | | 224,186.0 | | | | 225,430.1 | | | | 230,848.7 | |
Monetary Base(2) | | | 65,257.0 | | | | 71,498.5 | | | | 81,116.2 | | | | 85,093.0 | | | | 91,710.1 | |
Broad Money (M2) | | | 300,200.3 | | | | 313,139.4 | | | | 332,004.0 | | | | 337,664.4 | | | | 351,418.5 | |
| (1) | Quasi-money comprises time deposits and savings deposits. |
| (2) | The monetary base comprises currency issue in the hands of the public, plus vault cash held in the banking system, statutory cash reserves and demand deposits of commercial banks held at the Bank of Jamaica. |
Source: Bank of Jamaica.
Interest Rates
| | | | | | | | | | | | | | | | | | | | |
| | | 2007 | | | 2008 | | | 2009 | | | 2010 | | | 2011 | |
| | | (%) | |
| | | | | |
Domestic Currency Loan Rate | | | 21.9 | | | | 21.7 | | | | 21.1 | | | | 20.4 | | | | 18.0 | |
Domestic Currency Time Deposit Rate | | | 9.0 | | | | 9.8 | | | | 9.0 | | | | 4.9 | | | | 4.2 | |
Treasury Bill Yield(1) | | | 13.3 | | | | 24.5 | | | | 16.8 | | | | 7.5 | | | | 6.5 | |
| (1) | Tenors of treasury bills are approximately 182 days. |
Source: Bank of Jamaica.
During the five years ended December 31, 2011, the average yield on Government of Jamaica 182-day Treasury bills fluctuated but recorded an overall decline. The average yield increased from 13.3% in 2007 to 24.5% in 2008 before declining to 16.8% and 7.5% in 2009 and 2010, respectively. The average yield on the 182-day Treasury bill recorded a further reduction to 6.5% in 2011. The increase in yields in 2008 was influenced by the rise in the rate of inflation and inflation expectations as well as instability in the foreign exchange market resulting from the impact of the global financial crisis. The subsequent reductions in the yield were consistent with the continued increase of investor confidence and reductions in the Bank of Jamaica’s open market rates during this period. These developments occurred in the context of a moderation in inflation and inflation expectations, stability in the foreign exchange market as well as the success of the Jamaica Debt Exchange (JDX) program implemented in 2010. At December 31, 2011, the 92-day and 180-day Treasury bill yields declined to 6.2% and 6.5%, respectively, from 7.4% and 7.5%, respectively, at December 31, 2010. However, uncertainties surrounding the timing and terms of an agreement with the IMF have influenced increases in the yields on both tenors during 2012. For the calendar year to 22 November 2012, the yields on the 92-day and 180-day Treasury bills increased by 69 basis points and 35 basis points, respectively, to 6.90% and 6.81%.
In the summer of 1998, the Bank of Jamaica announced its medium-term goal to reduce the cash reserve requirement for commercial banks. As a first step towards meeting this goal, the Bank of Jamaica reduced in increments the reserve requirement for commercial banks from 25% prior to August 1998 to 17% in May 1999, thereby equalizing the cash reserve requirement for commercial banks and other deposit-taking institutions. Having equalized the cash reserve requirement, further reductions were gradually effected, resulting in an overall reduction to 9.0% at March 2002. In response to challenges which emerged from the global financial crisis in 2008, the Bank of Jamaica instituted a number of initiatives, including increasing the cash reserve requirement. During 2008, the
D-63
cash reserve requirement was increased from 9.0% as of December 2007 to 11.0% as of December 2008. In January and February 2009 the cash reserve requirement was increased by a further 3.0 percentage points to 14.0%. However, consistent with the general loosening of monetary policy since the first quarter of 2009, the requirement was reduced by 2.0 percentage points to 12.0% effective July 1, 2010. Since then, the cash reserve requirement has been maintained at 12.0%.
The Bank of Jamaica monitors the level of liquid assets to ensure that at all times supervised financial institutions meet their statutory liquidity obligations. Due to the reduction in the cash reserve requirement to 12.0%, the liquid asset requirement for deposit-taking institutions was reduced to 26.0% at July 2010. The liquid assets requirement for deposit-taking institutions has been maintained at 26.0% and commercial banks since then. However, commercial banks continue to hold excess liquid assets which were 4.5 percentage points above the statutory minimum requirement at end of September 2012.
The Financial System
Regulatory and Supervisory Structure
Regulation and supervision of the financial system is primarily undertaken by two institutions, the Bank of Jamaica and the Financial Services Commission. The Bank of Jamaica regulates and supervises the commercial banks and other licensed deposit-taking financial institutions under powers contained in several statutes and regulations. The Financial Services Commission, which became operational on August 2, 2001, is the sole regulatory and supervisory agency for certain non-deposit taking financial institutions, including securities dealers, unit trusts, mutual funds, insurance companies, and pension funds. It similarly derives its supervisory authority from various statutes. The supervisory structure is complemented by the Financial Regulatory Council, or FRC, an umbrella entity comprised of the Governor of the Bank of Jamaica (chair) in his capacity as Supervisor of Banks, the Executive Director of the Financial Services Commission, the head of the Jamaica Deposit Insurance Corporation, and the Financial Secretary or his/her nominee. The Solicitor General is also invited to these meetings to assist with legal issues affecting the financial sector. The FRC utilizes a proactive and coordinated approach to sharing regulatory information and developing policy for the financial sector, thus helping in the early detection of cross-sector problems and enhancing the implementation of consolidated supervision rules and principles.
The deposit-taking system in Jamaica continues to be impacted by the weakened global economy, as well as significant macro-economic shifts in the local economy including, among other things, the Government’s Debt Exchange Program in January of 2010 and policy adjustments related to the program entered into with the International Monetary Fund in February 2010. Notwithstanding these developments, the deposit-taking system remained adequately capitalized due mainly to the reforms of earlier years that ensured that institutions remain subject to strict regulatory requirements and oversight. A 100% risk weighting for foreign currency denominated instruments was implemented. Capital ratios have remained above the minimum risk weighted capital ratio of 10.0% and the capital to total assets (leverage ratio) requirement of 6.0%. At December 31, 2011, the risk weighted capital adequacy ratio for the deposit-taking financial institutions was 15.9% and the capital to total assets ratio was 10.8%. This compares with the Basel minimum requirement for risk weighted capital adequacy ratio of 8.0%. While the Basel Committee does not currently impose a leverage ratio, in December 2009, it proposed the introduction of a similar leverage ratio—to be initially tested under a parallel run at 3%. The Federal Reserve Bank sets its minimum leverage ratio at 3% to 4%.
An indirect impact on Jamaica resulting from the global financial crisis was the loss in credit facilities, including cuts in and withdrawal of margin funding arrangements. In response, the Bank of Jamaica made a special loan facility available to domestic financial institutions to facilitate repayment of margin arrangements held with overseas brokers. These margin arrangements had been collateralized with Government of Jamaica global bonds. By September 30, 2010, loans extended under this special loan facility had been repaid. There is also evidence of a deterioration in the asset quality of deposit-taking institutions, which is attributable to the decline in real growth consequential on the decline in the demand for Jamaica’s exports given the economic recession in Jamaica’s major export markets. At December 31, 2011, non-performing loans as a percentage of total loan portfolio were 8.9% compared to 6.5% at December 2010. Data as of September 30, 2012 shows a 7.1% of non-performing loans.
D-64
There was also limited exposure to the regional CL Financial Group (CLICO), into which the Trinidad and Tobago authorities intervened in January 2009. This exposure was limited to credit facilities extended to a CLICO affiliated institution which acquired shares in a Jamaican Corporation. No losses are anticipated on those exposures because they are fully collateralized.
Jamaica’s financial system is integrated with regional and international financial markets. Since the beginning of the liberalization process in 1991 until 1994, the banking and insurance services sector expanded significantly. Since 1995, however, the financial system has undergone consolidation as a result of a combination of closures and mergers. At December 31, 2011, there were seven commercial banks, two merchant banks and finance houses and four building societies in operation in Jamaica.
On December 31, 2011, the assets and liabilities of commercial banks amounted to J$613.7 billion, representing a 4.0% increase over December 31, 2010. On the asset side, total loans and advances were J$266.0 billion at December 31, 2011, representing an increase of 5.8% compared to 2010. On the liabilities side, total deposits were J$400.1 billion in 2011, representing an increase of 5.5% compared to 2010.
Data at September 30, 2012 reflected total assets and liabilities of commercial banks amounting to J$629.2billon and comprised primarily of loans and advances of J$290.9 billion. The main liability item deposits, totaled J$410.0 billion.
The total assets and liabilities of deposit-taking financial intermediaries other than commercial banks (i.e., building societies and merchant banks) were J$206.7 billion at December 31, 2011, representing an expansion of 7.3% over 2010. Outstanding loans and advances in these entities at December 31, 2011 was J$96.2 billion, representing an increase of 1.8% over 2010, while deposits were J$128.3 billion, representing an increase of 3.3% from 2010.
At September 30, 2012 total assets and liabilities of deposit-taking financial intermediaries (other than commercial banks) was J$215.2 billion. Loans and advances amounted to J$99.3 billion while total deposits totaled J$136.1 billion.
Legislation and Regulation
Laws and regulations governing the financial sector include:
| | • | | The Bank of Jamaica Act 1960; |
| | • | | The Unit Trust Act 1971; |
| | • | | The Financial Institutions Act 1992; |
| | • | | The Securities Act 1993; |
| | • | | The Building Societies Act and the related Bank of Jamaica (Building Societies) Regulations 1995; |
| | • | | The Industrial and Provident Societies Act and the related Bank of Jamaica (Industrial and Provident Societies) Regulations 1995; |
| | • | | The Deposit Insurance Act 1998; |
| | • | | The Insurance Act 2001; |
| | • | | The Financial Services Commission Act 2001; |
| | • | | The Pensions (Superannuation Funds and Retirement Schemes) Act 2004; |
D-65
| | • | | The Terrorism Prevention Act 2005; |
| | • | | The Terrorism Prevention (Reporting Entities) Regulations, 2010; |
| | • | | The Proceeds of Crime Act 2007; and |
| | • | | The Proceeds of Crime (Money Laundering Prevention) Regulations, 2007 |
Jamaica implemented upgraded deposit-taking financial legislation in the form of the Financial Institutions Act and the Banking Act in 1992 to provide for, among other things, a standardized legal framework for the operations of commercial banks and other licensed deposit-taking intermediaries, including enhanced minimum capital adequacy standards. In addition, these acts provided the Bank of Jamaica, in certain instances, and the Minister of Finance and Planning in others, with the means to take actions such as issuing “cease and desist” orders and assuming temporary management of such institutions when there is evidence of unsound banking practices or where the institution’s financial viability is in jeopardy.
In order to strengthen the existing regulatory framework, in light of the difficulties in the financial sector, Parliament passed amendments to the Banking Act, the Financial Institutions Act, the Building Societies Act and the Industrial and Provident Societies Act in October 1997. Some features of these amendments included:
| | • | | empowering the Minister of Finance and Planning to take control of the shares of any licensee that is no longer viable, to effect a sale of the licensee’s shares or assets or to restructure the entity in the interest of its depositors; |
| | • | | empowering the Supervisor of Banks to issue “cease and desist” orders in respect of financial institutions experiencing problems and to require special audits of these institutions; |
| | • | | enhancing the existing “fit and proper” criteria that relate to directors, significant shareholders and senior management of licensees; |
| | • | | tightening credit limits for unsecured lending, and prohibiting the issuance of unsecured credit to any affiliated parties; |
| | • | | imposing a lower ceiling on total lending to or investment in all affiliated parties; |
| | • | | tightening investment limits; |
| | • | | reducing the non-accrual period for interest on non-performing loans from six months to three months; |
| | • | | imposing minimum solvency standards and risk-based criteria; |
| | • | | specifying the obligations of bank auditors in the presentation of findings and imposing obligations on auditors to report irregularities to the Bank of Jamaica; |
| | • | | allowing for the examination of the accounts of holding companies of supervised financial institutions; and |
| | • | | prohibiting industrial and provident societies from taking deposits without written authorization from the Minister of Finance and Planning. |
These revisions provided the Bank of Jamaica, in certain instances, and the Minister, in others, with a wider range of sanctions and greater powers of intervention to use with respect to troubled financial institutions. See also “Public Finance—Improvements in the Legislative and Regulatory Framework.”
In March 2002, further amendments were made to Jamaican banking laws to grant the Bank of Jamaica expanded powers to supervise financial institutions with deposit-taking capability. These amendments included:
| | • | | the transfer to the Bank of Jamaica of powers of the Minister to assume temporary management of deposit-taking institutions in the event that the Bank of Jamaica believes that such an intermediary is, or appears, unlikely to meet its obligations; |
D-66
| | • | | the granting to the Bank of Jamaica of powers to assess fines for specific offences under the Banking Act and Financial Institutions Act; |
| | • | | the granting to the Bank of Jamaica of power to require a deposit-taking institution to legally separate its banking operations from its securities-trading activities and investment activities undertaken on behalf of investor clients; |
| | • | | the granting to the Bank of Jamaica of power to effectively carry out consolidated supervision of banks and other companies that are members of a group of which the bank is a member; and |
| | • | | the broadening of the types of cases in which a bank may disclose information concerning specific customer accounts. |
These revisions have significantly increased the scope of the Bank of Jamaica’s regulatory authority, including its powers of intervention, by expanding the Bank of Jamaica’s ability to temporarily manage troubled financial institutions. See also “Public Finance—Improvements in the Legislative and Regulatory Framework.”
Additionally, in February 2004, amendments were passed to the Bank of Jamaica Act, which effectively brought all operators of remittance companies or agencies under the supervisory ambit of the Bank of Jamaica. The regulatory regime for remittance entities came into effect in July 2005 and involves a licensing requirement that entails fit and proper due diligence checks and assessments of their systems and procedures prior to licensing, as well as both on- and off-site reviews and assessments.
Supervisory powers were further expanded in March 2005 by amendments to the Bank of Jamaica Act to clarify the Bank of Jamaica’s ability to share information with other Supervisors in keeping with the FATF’s revised 40 Recommendations on Anti-Money Laundering and the Combating of the Financing of Terrorism. Similarly, supervisory powers of sanction were also expanded to expressly deal with breaches by financial institutions of their obligations under non-financial statutes under which specific obligations were imposed (e.g., the Money Laundering Act which was replaced by the Proceeds of Crime Act and the Terrorism Prevention Act. See “—Proceeds of Crime Act” below). This was achieved by amendments to the Banking Act and Financial Institutions Act, which were passed into law in December 2004. In regards to the Bank of Jamaica (Building Societies) Regulations, the amendments were passed in Parliament in November 2004.
As part of the SBA in 2010, reforms have also been proposed and begun to strengthen the financial system. See “The Jamaican Economy—Recent Economic Crisis—IMF Standby Arrangement.”
There are also a number of regulations and best practice standards that govern the operations of financial institutions in Jamaica.
Omnibus Bill
Jamaica has identified a need to consolidate the Banking Act, the Financial Institutions Act and the Bank of Jamaica (Building Societies) Regulations, in tandem with related subsidiary regulations. The new Omnibus Bill will also seek to include all legislative amendments necessary to achieve the fullest possible compliance with the Basel Core Principles for Effective Banking Supervision. The Bill will also provide a broader framework for regulation and consolidated supervision with respect to the activities of licensed deposit-taking entities and their financial holding companies. Revisions to the financial legislation will also focus on current issues such as financial consumer protection, mobile financial services and agency banking, provisions for electronic reporting and enhancing powers as regards the investigation and prosecution of illegal deposit-taking activities. Cabinet approved the recommendations proposing the implementation of the Omnibus legislation in August 2010. See “Jamaica Economy—Recent Economic Crisis—IMF Standby Arrangement.”
D-67
Bank of Jamaica Act
In December 2010, the Cabinet approved the recommendation for the responsibility for the stability of the overall financial system in Jamaica to be statutorily assigned to the Bank of Jamaica. This will require amendments to the Bank of Jamaica Act, which have been sent to the office of the Chief Parliamentary Council for drafting. The proposed amendments to the Bank of Jamaica Act will expand the regulatory oversight of the Bank of Jamaica to financial institutions whose operations are deemed to be of systemic importance and give the Bank of Jamaica the necessary powers to direct and impose measures to mitigate and control identified risks.
Deposit Insurance
In March 1998, Parliament passed the Deposit Insurance Act, designed to protect depositors through the establishment of an explicit Deposit Insurance Scheme, or the Scheme. The Deposit Insurance Act established the Jamaica Deposit Insurance Corporation, which administers the Scheme and ultimately the Deposit Insurance Fund, or the Fund. The financial institutions covered under the Scheme (policyholders) are all commercial banks, merchant banks and building societies. All deposits (excluding government deposits and deposits from policyholders) held at these institutions are insurable under the Scheme. The insured institutions) must contribute to the Fund (by paying an initial and annual premium), which will be used to pay depositors in circumstances where an insured institution is unable to meet its deposit liabilities. Additionally, the Jamaica Deposit Insurance Corporation is authorized to make loans or advances available with security interests; guarantee, indemnify or become liable for the payment of monies or the performance of any obligation thereto, with respect to a covered institution facing financial distress.
When the Scheme was established, the coverage limit was set at J$200,000 per depositor, per institution. In order to maintain or enhance the level of protection to depositors, the limit is constantly under review, and has been adjusted twice since establishment; up to J$300,000 on July 11, 2001, then up to J$600,000 effective July 1, 2007. As at December 2011, 97.2% of insurable deposit accounts were fully covered at the J$600,000 coverage limit. This represented 32.4% of the dollar value of total insurable deposits. Total estimated insured deposits accounted for 46.0% of insurable deposits.
In addition, the Deposit Insurance Act also provides for the sharing of information between the Bank of Jamaica and the Jamaica Deposit Insurance Corporation, to enable the Corporation to be fully apprised of the financial condition of the institutions it insures.
Credit and Provisioning Regulations
The Bank of Jamaica is undertaking a comprehensive re-drafting of the captioned regulations to provide specific legal guidelines for loan accounting, credit classification and provisioning requirements for bad and doubtful debts. The regulations are being reviewed in order to take account of developments in international standards such as the International Financial Reporting Standards (IFRS) issued by the International Accounting Standards Board (IASB) and banking supervision principles issued by the Basel Committee of Banking Supervisors, such as Basel Core Principles and the Basel Standard for Sound Credit Risk and Valuation of Loans. These standards are themselves subject to comprehensive review by these international standard setting bodies. The Bank of Jamaica is currently therefore awaiting the outcome of these exercises to ascertain the implications for local regulations.
Capital Adequacy Regulations
In 2004, regulations were promulgated establishing minimum risk-based capital standards for commercial banks and licensed financial institutions. These regulations introduced the concept of Tier I and Tier II capital utilized by regulators internationally, which define eligible components and provide the framework for assigning risk weights to on and off balance sheet items. Under the regulations, the overall minimum capital required to be maintained in relation to risk weighted assets is 10%. At December 31, 2011, all supervised institutions were in compliance with this requirement.
D-68
Qualifications of Auditors Regulations
The Bank of Jamaica has drafted regulations that specify the standards for auditors in undertaking an external audit of supervised financial institutions. Among other things, the criteria specified in these regulations relate to the independence, experience and qualification of the external auditors. These proposed regulations would also require prior notification to the Bank of Jamaica of proposed appointments. The Bank of Jamaica would also be empowered to object to the appointment of an auditor if there is evidence that such auditor is not in compliance with the provisions of the regulations.
Bank of Jamaica (Credit Unions) Regulations
The Bank of Jamaica has drafted regulations to establish the supervisory regime applicable to credit unions. These regulations will, among other things, prescribe prudential criteria and minimum solvency standards covering, inter alia, essential areas such as licensing, capital adequacy, liquid assets, credit and provisioning, submission of financial statements and remedial action that can be taken by supervisory authorities with respect to problem credit unions. The draft regulations have benefited from extensive dialogue with the credit union sector and are pending presentation to Parliament by the Minister of Finance and Planning.
The Payment, Settlement and Clearing Act
The Payment, Settlement and Clearing Act was passed in Parliament in November 2010. The legislation formally establishes the legal framework for the oversight of the payment and settlement system and addresses matters such as: finality of payments, effect of insolvency on payments already in the system, and upgrading of the settlement infrastructure by, inter alia, allowing for real-time gross settlement. In this regard, Jamaica implemented a real-time gross settlement system in February 2009 and introduced a Central Securities Depository (CSD) in May 2009. The CSD is intended to house Government of Jamaica and Bank of Jamaica (domestic) securities.
Passage of this legislation is the first step in ensuring that Jamaica’s payment and settlement system operates in accordance with the Bank for International Settlements (BIS) Core Principles for Systemically Important Payment Systems.
The Cooperative Societies (Amendment) Bill
The Cooperative Societies (Amendment) Bill, which is currently at drafting stage, will seek to restrict the deposit-taking activities of cooperative societies to those cooperative societies that operate as credit unions. Secondly, it will seek to bring credit unions under the regulatory ambit of the Minister of Finance and Planning and the Bank of Jamaica.
Proceeds of Crime Act
The Proceeds of Crime Act (POCA) was passed by Parliament in early 2007 and came into effect on May 30, 2007. This statute is supported by the Proceeds of Crimes (Money Laundering Prevention) Regulations and the Proceeds of Crimes (Confiscation) Regulations which were also promulgated in 2007. With the passage of the POCA, the former Money Laundering Act, related Regulations and the Drug Offences (Forfeiture of Proceeds) Act were repealed and replaced. The wide-ranging POCA legislation provides for the investigation, identification and recovery of the proceeds of crime. Responsibilities previously delegated to the Bank of Jamaica, as the “competent authority” for deposit-taking institutions under the Money Laundering Act, are now subsumed by the POCA. Among other matters, the Act now provides for revised Threshold Reporting Transaction Limits for banking entities of US$15,000.00 (US$50,000.00 previously) and gives the Minister of National Security (as the responsible minister under POCA) the power to designate professions and businesses as financial institutions for the purposes of reporting and complying with Anti-Money Laundering requirements. POCA also seeks to address all the loopholes that hampered investigative and prosecutorial efforts to combat money laundering that existed under the previous Drug Offences Forfeiture of Proceeds Act and the Money Laundering Act.
D-69
Bank of Jamaica AML/CFT Guidance Notes
The Bank of Jamaica Anti-Money Laundering Guidance Notes, which were originally issued during the 1990s, provide specific guidance to all institutions supervised by the Bank of Jamaica on the detection and prevention of Money Laundering and the Financing of Terrorism. Revisions to the Guidance Notes were issued in 2004, 2005 and 2007 to incorporate, among other things, provisions consistent with the revised FATF 40 Recommendations of 2003 and the Eight Special Recommendations for Terrorist Financing; the Ninth Recommendation of the FATF on combating of terrorism financing and enhanced guidance on customer due diligence verification. During 2009, the Bank undertook another round of revisions with a view to incorporating relevant provisions of the Proceeds of Crime Act (POCA) and the POCA (Money Laundering Prevention) Regulations. The revisions took into account comments from the industry and the completed Guidance Notes were approved by the Minister on April 22, 2010 and gazetted.
Insurance Act
A new Insurance Act was enacted in December 2001 to repeal and replace the Insurance Act of 1972; to provide measures to strengthen corporate governance and the rulemaking process; and to establish prompt corrective action. The Insurance Act is currently being amended to harmonize certain provisions with other financial sector legislation and strengthen the legislative framework for the insurance industry.
Pensions (Superannuation Funds & Retirement Schemes) Act
Reform of the pensions system started with the enactment of the Pensions (Superannuation Funds and Retirement Schemes) Act in 2004, which became effective in March 2005. This Act included new requirements for pension funds such as registration, licensing, investment limits, minimum solvency standards and information disclosure. In 2007, the second phase of the Pension Reform initiative was advanced with the submission of additional drafting instructions for the preparation of amendments to the Act and associated regulations. This was preceded by extensive consultations with major stakeholders in the industry. The legislation will address issues such as mandatory vesting, portability of pension rights, funding and solvency of approved superannuation funds and retirement schemes.
Terrorism Prevention Act
The Terrorism Prevention Act gives effect to the UN Convention on the Suppression of the Financing of Terrorism as well as to various other UN Security Council resolutions. This Act imposes counter-terrorist financing and reporting obligations on financial institutions, which will assist the authorities in identifying, tracing and ultimately forfeiting assets owned or controlled by terrorists, and provides law enforcement with the widest range of investigative tools to achieve these objectives. The Terrorism Prevention Act was passed by the Parliament in March 2005 and came into effect in June 2005. In March 2010 an amendment to the Terrorism Prevention Act was passed to allow for the level penalties reflected in the proposed Terrorism Prevention (Reporting Entities) Regulations, 2010 to be imposed. (Under Jamaica’s laws penalties set out within Regulations are restricted to the maximum permitted under the Interpretation Act unless the Principal Act to the Regulations expressly provides otherwise).
Terrorism Prevention (Reporting Entities) Regulations
In March 2010, the Terrorism Prevention (Reporting Entities) Regulations, were promulgated under the Terrorism Prevention Act. These Regulations largely mirror the Know Your Customer (KYC) obligations contained in the Regulations under the Proceeds of Crime Act. Accordingly, the Regulations outline the operational controls that must be maintained by financial institutions particularly when contemplating the commencement of a business relationship or one-off transaction. The Regulations also require financial institutions to establish and maintain appropriate procedures in relation to identification, record-keeping, internal controls, communication, and training of employees. These Regulations also prescribe the requisite Declaration Forms for transactions that the reporting entity knows or suspects are transactions that constitute a terrorism offense; and for the quarterly reports as to whether or not the reporting entity is holding property in respect of a person who is on the United Nations list of designated terrorists or in respect of a person who has links with terrorists or terrorist groups or organizations.
D-70
The Financial Investigations Division Act
The Financial Investigations Division Act was passed in March 2010 and brought into effect by Appointed Day Notice in April 2010. The Act gives the existing Financial Investigations Division (FID) of the Ministry of Finance and Planning the necessary statutory powers and protections to carry out that Division’s mandate of investigating and prosecuting financial crime, including money laundering and the financing of terrorism. The FID operates as Jamaica’s Financial Intelligence Unit (FIU) and the passage of the statute will assist the FID in attaining membership with the Egmont Group of FIU.
The Credit Reporting Act
The Credit Reporting Act was passed in August 2010 and became effective October 1, 2010. This statute establishes a credit reporting system in Jamaica and is designed to improve credit assessment processes and to facilitate enhanced risk management and loan pricing strategies throughout the financial sector. A licensing system is imposed on persons who intend to offer credit reporting services and prescribed reporting processes are outlined to ensure objective and standardized reporting of credit information. Persons offering credit reporting services are subject to regulation by the Bank of Jamaica. Credit Reporting Regulations were issued under the Credit Reporting Act on January 14, 2011. These Regulations, among other things, outline the licensing process including the form of application, licensing fees and information and documentation to be provided in support of an application for a license. Two credit bureau were licensed between March and April 2012 and have been given a twelve month period to start operations.
Standards of Best Practices
To date, the Bank of Jamaica has issued 13 Standards of Best Practices and Guidance for the management of deposit-taking entities. These are:
| | • | | Standards of Best Practices for Capital Management; |
| | • | | Standards of Best Practices for Credit Risk Management; |
| | • | | Standards of Best Practices for Securities Portfolio Risk Management; |
| | • | | Standards of Best Practices for Liquidity Risk Management; |
| | • | | Standards of Best Practices for Interest Rate Risk Management; |
| | • | | Standards of Best Practices for Foreign Exchange Risk Management; |
| | • | | Standards of Best Practices for Internal Controls; |
| | • | | Standards of Best Practices for Real Estate Appraisal Management; |
| | • | | Standards of Best Practices for the Management or Investment of Customers’ Funds; |
| | • | | Guidance Notes for the Detection and Prevention of Money Laundering and Terrorist Financing Activities; |
| | • | | Guidelines for Fit and Proper Assessments; |
| | • | | Standards of Best Practices for Country and Transfer Risk; and |
| | • | | Standards of Best Practices for Effective Corporate Governance. |
D-71
Since the 2005 FSAP exercise, the Bank of Jamaica has engaged in a continuous process of systematically revising these standards in order to further promote the establishment of comprehensive risk management processes in deposit-taking institutions in accordance with the revised Basel Core Principles and as a necessary precursor to full implementation of the Basel Capital Adequacy framework (Basel II). In this regard, the standards relating to credit risk and market risk management have been updated considerably for issue and discussion with the industry.
Basel II/III
Bank of Jamaica is adopting a four phased approach towards the adoption of Basel II, with emphasis on the full implementation of consolidated supervision, full compliance with the Basel Core Principles and the promotion of enhanced risk management frameworks in deposit-taking entities, which are all considered to be necessary prerequisites to effective Basel II/III implementation. The second phase will focus on implementation of Pillar II, which deals with supervisory review principles. The third phase will focus on implementation of Pillar III, which addresses market discipline requirements, and in the final phase the Bank of Jamaica will fully adopt Pillar I, which focuses on quantitative assessment. With regard to Basel III, based on preliminary assessments, the Bank of Jamaica does not foresee significant challenges in complying with the more conservative capital definitions proposed under Basel III given that existing Jamaican regulatory requirements are more stringent than those of Basel II capital definition, including, for example, the capital to total assets leverage ratio which has been legally required to banks since 2004.
Consolidated and Conglomerate Supervision of Financial Groups
Legislation governing the activities of deposit-taking entities was amended in 2002 to extend the regulatory and supervisory reach of the Bank of Jamaica beyond the licensee itself, to include the wider financial group of which the licensee is a part. Pursuant to these amendments, the Bank of Jamaica has been working towards the full implementation of a comprehensive consolidated/conglomerate supervision regime. This has included the promotion of the reconfiguring of financial groups containing deposit-taking entities, into supervisable financial structures and the extension of “fit and proper” assessments to principals of financial holding companies and other entities within relevant financial groups. Further enhancements to the legislative framework will be incorporated in the Omnibus Statute.
Unregulated Financial Organizations
In 2007, the authorities were faced with the challenge of dealing with over 20 Unregulated Financial Organizations, or UFOs. The FSC, with the support of other regulatory agencies, embarked on an extensive public education campaign to increase awareness of factors that should be taken into consideration before investing. This was accompanied by investigations into the business operations of these UFOs. Following investigations by the FSC, the entities were deemed to be in contravention of the relevant laws governing the sector. The investigations have also revealed that the smaller UFOs acted as feeders for the three largest UFOs.
Consequently, the entities were served with Cease and Desist Orders. A Cease and Desist Order is an instruction to an entity requiring it to discontinue any business transaction or any actions that are in contravention of any of the Acts that have provisions for the regulation of the financial sector. To prevent the execution of these Orders, some of these entities have brought legal action against the FSC. However, in all court rulings to date, the FSC has been successful in its bid to issue and enforce the Cease and Desist Orders. A court-appointed liquidator is in the process of winding up one of the major UFOs, while others are involved in litigation. Under the SBA, there will also be additional legislation regarding the regulation of UFOs.
A bill is being drafted to amend the Securities Act of 1993 with the purpose to fight UFOs and strengthen the investigative and supervisory powers of the FSC as well as its authority to share information with other entities.
Financial Sector Assessment Program
During 2005, Jamaica participated in an IMF/World Bank Financial Sector Assessment Program, or FSAP, which is a joint initiative of the IMF and World Bank to provide member countries with a comprehensive evaluation
D-72
of their financial systems. FSAPs are designed to assess the stability of the financial system as a whole and not that of individual institutions. They have been developed to help countries identify and remedy weaknesses in their financial structure, thereby enhancing their resilience to macroeconomic shocks and cross-border contagion. In May 2005, the IMF/World Bank issued a report on the financial assessment that was undertaken in 2005 that indicated that, while Jamaica’s financial systems appeared well-capitalized and supervision had been strengthened in recent years, there was a need to further strengthen the prudential framework for security dealers, enhance the oversight of conglomerates, and develop and test crisis management systems. The report also recommended that priority be given to overhauling the payments system and introducing a central depository for fixed income securities. In this regard, in May 2009, Jamaica introduced a Central Securities Depository for fixed income securities and in November 2010, the Payment, Settlement and Clearing Act was passed.
Jamaica believes that its supervisory, regulatory and legislative framework is sufficient for maintaining the quality of the institutions in its financial sector. There can be no assurance, however, that substantial additional financial assistance or other government action may not be required in the future as developments in the financial sector continue to evolve.
The Stock Market
Jamaican Stock Exchange (JSE)
The Jamaica Stock Exchange, or JSE, is the oldest and largest stock exchange in the English-speaking Caribbean. It was established as a private limited company in August 1968, and floor trading commenced in February 1969. The JSE is a self-regulatory organization, although the Financial Services Commission has regulatory oversight. The JSE has in place a comprehensive code of rules governing members’ conduct and market operations, and has not experienced any market scandal during its 43-year history. The Financial Services Commission also regulates the Jamaican securities industry. Transactions done on the floor of the JSE are settled using a T+3 cycle.
The JSE has undertaken several modernization initiatives in recent years. In 1997, the JSE established a formal relationship with the CUSIP Service Bureau for the assignment of international securities identification numbers (ISIN) for Jamaican securities. In 1998, the Jamaica Central Securities Depository Limited, designed in conformity with G 30 standards, was incorporated as a legal entity and began operations on June 1, 1998. In February 2000, the JSE introduced automated trading, and as of May 2000, all securities listed on the JSE are traded remotely from brokers’ offices.
In May 2000, The JSE All Jamaican Composite index was introduced. This index tracks the performance of local companies. In June of the same year, the JSE Select Index was introduced to track the performance of the 15 most liquid stocks on the JSE.
In 2007, the JSE started the process of demutualization and on June 30, 2008, the JSE became a listed company after listing its Preference Shares.
The JSE launched the Junior Stock Market on April 2, 2009. This market provides an opportunity for local and Caricom small- and medium-size enterprises to raise capital. The JSE Junior Market has been endorsed by the Jamaican government through a ten year tax break. As such, a company that lists on the JSE Junior Market is not liable to pay taxes on profits for the first five years and during the following five years the company will pay half the going tax rate.
At the end of 2009, there was one listing on the Junior Market. But by the end of 2011 the market had grown significantly with eleven additional listings throughout 2010 and 2011 bringing the total listed companies to twelve. Other companies have expressed an interest in listing their shares on the JSE Junior Market through the submission of a prospectus for review.
The Junior Market has also grown significantly in terms of index movement. After starting at 100 points in 2009, the index has grown to 748.86 points as at December 30, 2011.
D-73
Trading Activity: Regular Market
For the period January to October 2012, market volume including block trades amounted to 2,187,713,858 up 20.25% relative to 1,819,286,047 units recorded in 2011. On the other hand, market value, including blocks, has decreased marginally by 1.35% for the stated period to just over J$20.7 billion. A decline was also experienced by the number of transactions (including blocks) of 28.38% to 16,702. For the stated period there were 209 trading days.
Market Capitalization amounted to J$576.45 as at the end of October 2012 compared to J$619.44 billion at the end of 2011.
Market volume (excluding blocks) for the period January to October 2012 amounted to 1,238,903,486 units compared to 1,550,142,176 units in 2011. This represents a decline of 311,238,690 units, or 20.08%. Likewise, market value decreased to J$15.75 billion from J$18.10 billion in 2011. This reflects a decrease of 13.00% or J$2.35 billion.
Year to date, October 2012, the number of transactions have decreased by 6,605 to 16,688 when compared to the total transactions in 2011. Fourteen block trades have been processed for the stated period compared to the 17 blocks trades in 2011. Market volume in the block market for the stated period amounted to 948,810,372 units and in 2011 the market volume amounted to 269,143,871 units. The total value of block trades year to date 2012 stood at $4.96 billion relative to $2.89 billion in 2011.
Since the start of the year, the month that recorded the largest number of transactions was March with 1,854 transactions. Meanwhile, the month that experienced the least transactions was October with 1,258 transactions. In April, the smallest monthly volume traded and value traded were recorded which amounted to 35,166,724 units and $366.52 million respectively. The month of July registered the highest market volume and value of 383,652,712 units and $3.48 billion respectively.
For the period January to October 2012, the main advancers were Ciboney Group Limited up 80.00% to close at J$0.09 and Guardian Holdings Limited up 54.55% to close at J$255.00. On the other hand, the main decliners were Caribbean Cement Company Limited down 66.67% to close at J$1.00 and Pulse Investments Limited down 59.18% to close at J$1.00. Trading occurred in 33 ordinary shares, of which ten shares advanced and eighteen shares declined.
The following table shows yearly trading data for the Jamaica Stock Exchange for the years 2001 to October 2012:
Jamaica Stock Exchange Trading Data
| | | | | | | | | | | | | | | | | | | | | | |
Period | | | Period-End
Market
Capitalization | | | Value Traded | | | Period-End
Market Index | | | No. of
Listed
Companies | | | No. of
Brokers | |
| | | | (in millions of J$) | | | (in millions of J$) | | | | | | | | | | |
| | | | | |
| | 2001 | | | | 197,717.5 | | | | 5,948.4 | | | | 35,723.6 | | | | 43 | | | | 10 | |
| | 2002 | | | | 292,297.9 | | | | 7,636.9 | | | | 45,396.2 | | | | 41 | | | | 10 | |
| | 2003 | | | | 512,884.4 | | | | 24,237.3 | | | | 67,586.7 | | | | 42 | | | | 10 | |
| | 2004 | | | | 879,297.2 | | | | 35,994.8 | | | | 112,655.5 | | | | 41 | | | | 11 | |
| | 2005 | | | | 839,852.8 | | | | 40,746.7 | | | | 104,510.4 | | | | 41 | | | | 11 | |
| | 2006 | | | | 822,862.4 | | | | 37,041.0 | | | | 100,678.0 | | | | 44 | | | | 11 | |
| | 2007 | | | | 876,690.6 | | | | 29,047.4 | | | | 107,968.0 | | | | 44 | | | | 11 | |
| | 2008 | | | | 597,277.0 | | | | 67,026.9 | | | | 80,152.0 | | | | 45 | | | | 11 | |
| | 2009 | | | | 544,882.5 | | | | 12,190.1 | | | | 83,321.9 | | | | 43 | | | | 11 | |
| | 2010 | | | | 564,720.7 | | | | 20,828.6 | | | | 85,220.8 | | | | 43 | | | | 11 | |
| | 2011 | | | | 619,444.8 | | | | 20,994.0 | | | | 95,297.2 | | | | 40 | | | | 11 | |
| | 2012 | * | | | 576,452.9 | | | | 20,711.1 | | | | 89,921.8 | | | | 37 | | | | 11 | |
Source: Jamaica Stock Exchange.
D-74
Main Market Index
From the start of the year, all the indices in the regular market recorded decreases with the exception of the JSE Cross Listed Index. The JSE Market Index decreased by 5,475.40 points or 5.75%, to close at 89,821.80 points. The All Jamaican Composite and the JSE Select indices declined by 13,500.23 points or 13.21%, and 462.09 points, or 16.08%, respectively, to close at 88,678.56 points and 2,411.92 points, respectively. The JSE Cross Listed index increased by 60.90 points, or 7.66%, to close at 855.45 points.
The following table shows the market indices for January to October 2012*:
| | | | | | | | | | | | |
Index | | Value 2012* points | | | Point change(1) | | | Percent change(1) | |
Main JSE Index | | | 89,821.80 | | | | (5,475.40 | ) | | | (5.75 | %) |
All Jamaican Composite Index | | | 88,678.56 | | | | (13,500.23 | ) | | | (13.21 | %) |
JSE Select Index | | | 2,411.92 | | | | (462.09 | ) | | | (16.08 | %) |
JSE Cross Listed Index | | | 855.45 | | | | 60.90 | | | | 7.66 | % |
| (1) | Measured against 2011. |
Source: Jamaica Stock Exchange.
For the period January to October 2012, on averages the stock prices declined by 13.04% and the advance decline ratio was 6:25.
Trading Activity Junior Market
Two companies listed on the Junior Market during the period January to October 2012. Despite the additional listings, market capitalization as at October 31, 2012 declined to J$21.97 billion. This represents a decrease of J$1.62 billion, or 6.86%, from the previous year.
Market volume declined to 108,103,695 units, compared to 306,220,533 units in 2011. Likewise market value decreased to J$563.5 million from J$1.25 million in 2011. Similarly, the number of transactions declined to 4,336 from 7,883 in 2011.
There were 209 days of trading for the stated period.
The following table shows yearly trading data for the Jamaica Stock Exchange Junior Market for the years 2009 to October 2012:
Jamaica Stock Exchange Junior Market Trading Data
| | | | | | | | | | | | | | | | | | | | | | |
Period | | | Period-End
Market
Capitalization | | | Value Traded | | | Period-End
Market Index | | | No. of
Listed
Companies | | | No. of
Brokers | |
| | | | (in millions of J$) | | | (in millions of J$) | | | | | | | | | | |
| | | | | |
| | 2009 | | | | | | | | 0.0 | | | | 150.0 | | | | 1 | | | | 11 | |
| | 2010 | | | | 8,466.8 | | | | 192.2 | | | | 379.9 | | | | 8 | | | | 11 | |
| | 2011 | | | | 23,595.0 | | | | 1,248.0 | | | | 748.9 | | | | 12 | | | | 11 | |
| | 2012 | * | | | 21,975.4 | | | | 563.5 | | | | 668.5 | | | | 14 | | | | 11 | |
Source: Jamaica Stock Exchange.
JSE Junior Market Index
The JSE Junior Market Index started the year 2012 at 748.86 points and at October 31, 2012 the Index closed at 668.51 points. This represents a decline of 10.73%. Two companies were listed during the period January to October 2012 bringing the total listing on the Junior Market to fourteen companies. The newly listed companies are C2W Music Limited (May 29, 2012) and K.L.E. Group Limited (October 23, 2012).
D-75
Market Developments
The JSE Combined index started on April 1, 2011 at 86,897.43 points. This index tracks the performance of all the companies that issue ordinary shares listed on both the Main Market and Junior Market of the Jamaica Stock Exchange.
The JSE USD Index started in July 5, 2011 at 100 Points. The USD index tracks the performance of companies whose shares trade in United States Dollars.
As at October 31, 2012, the total number of companies listed on the regular market stood at 37 while the total number of companies listed on the Junior Market stood at 14. There were 33 ordinary shares listed and 15 preference shares as at October 31, 2012 on the regular market.
D-76
SIGNATURE
Pursuant to the requirements of the United States Securities Exchange Act of 1934, the registrant, the Government of Jamaica has duly caused this annual report to be signed on its behalf by the undersigned, thereunto duly authorized, in the City of Kingston, Jamaica on December 19, 2012.
| | |
| GOVERNMENT OF JAMAICA |
|
|
| |
| By: | | /s/ Peter D. Phillips, PhD, MP |
| Name: | | Peter D. Phillips, PhD, MP |
| Title: | | Minister of Finance and Planning |
D-77