EXHIBIT D
Government of Jamaica
This description of the Government of Jamaica is dated as of June 2, 2017 and appears as Exhibit (D) to the Government of Jamaica’s Annual Report on Form 18-K to the US Securities and Exchange Commission for the fiscal year ended March 31, 2017.
D-1
EXCHANGE RATES
The following table shows exchange rate information for the selling of US dollars for the periods indicated. The Federal Reserve Bank of New York does not report a noon buying rate for the JA dollar. The official exchange rate published by the Bank of Jamaica for US dollars on April 12, 2017 was J$128.75 per US$1.00.
Foreign Exchange Rates(1)
| | | | | | | | | | | | |
Foreign Exchange Rates(1) Year | | Average for
Period(1) | | | End of Period | | | Percentage
Change(2)
(End of Period) | |
| | | (spot weighted average ask in J$ for US$) | |
2007 | | | 69.17 | | | | 70.62 | | | | 5.17 | |
2008 | | | 73.36 | | | | 80.47 | | | | 13.95 | |
2009 | | | 88.82 | | | | 89.60 | | | | 11.35 | |
2010 | | | 87.34 | | | | 85.86 | | | | (4.17 | ) |
2011 | | | 86.09 | | | | 86.60 | | | | 0.86 | |
2012 | | | 88.23 | | | | 92.98 | | | | 7.37 | |
2013 | | | 101.26 | | | | 106.38 | | | | 14.41 | |
2014 | | | 111.54 | | | | 114.66 | | | | 7.78 | |
2015 | | | 117.48 | | | | 120.42 | | | | 5.01 | |
2016 | | | 125.77 | | | | 128.44 | | | | 6.66 | |
| | | | | | | | | | | | |
Foreign Exchange Rates(1) Month/
Year | | Average for
Period(1) | | | End of Period | | | Percentage
Change
(End of Period)(3) | |
| | | (spot weighted average ask in J$ for US$) | |
January 2017 | | | 128.55 | | | | 128.35 | | | | (0.07 | ) |
February 2017 | | | 128.07 | | | | 128.11 | | | | (0.19 | ) |
March 2017 | | | 128.41 | | | | 128.67 | | | | 0.44 | |
April 2017 | | | 128.74 | | | | 128.75 | | | | 0.06 | |
| (1) | The weighted average of the exchange rates for annual periods is calculated as the simple average of end of month rates. |
| (2) | As compared to the prior year. |
| (3) | As compared to the prior month. |
Source: Bank of Jamaica
PRESENTATION OF CERTAIN INFORMATION
All references in the annual report on Form 18-K to “Jamaica” and the “Government” are to the Government of Jamaica, unless otherwise indicated. All references to “JA dollars” and “J$” are to Jamaica dollars, all references to “US dollars” and “US$” are to the lawful currency of the United States of America, or US, all references to “€” are to Euro all references to £ are to Great Britain Pounds. Historical amounts translated into JA dollars or US dollars have been converted at historical rates of exchange. References to annual periods (e.g., “2016”) refer to the calendar year ended December 31, and references to fiscal year or FY (e.g., “FY 2015/16” or “FY 2016/17”) refer to Jamaica’s fiscal year ended March 31. All references to “tonnes” are to metric tonnes. Jamaica publishes external economy information, such as external debt and goods and services exported, in US dollars. All international currencies, such as external debt denominated in Euro, are translated into US dollars. Domestic economy information is published by Jamaica in JA dollars. Components contained in tabular information in this annual report on Form 18-K may not add to totals due to rounding. The term “N/A” is used to identify economic or financial data that is not presented for a particular period because it is not applicable to such period and “n.a.” for economic or financial data that is not available.
Statistical information included in this report is the latest official data publicly available. Financial data provided may be subsequently revised in accordance with Jamaica’s ongoing maintenance of its economic data.
D-2
D-3
SUMMARY
The following is a summary of Jamaica’s economic information for the five years ended and as at December 31, 2016. This summary does not purport to be complete and is qualified by the more detailed information appearing elsewhere in this document.
Summary of Economic Information
| | | | | | | | | | | | | | | | | | | | |
| | | 2012 | | | 2013 | | | 2014 | | | 2015 | | | 2016 | |
DOMESTIC SECTOR(1) | | | | | | | | | | | | | | | | | | | | |
Nominal GDP (J$ millions) | | | 1,313,792.2 | | | | 1,431,097.7 | | | | 1,541,718.8 | | | | 1,667,193.4 | | | | 1,754,727.3 | |
Nominal GDP (US$ millions)(2) | | | 14,805.5 | | | | 14,268.7 | | | | 13,851.9 | | | | 14,211.9 | | | | 14,022.1 | |
Total Value Added (J$ millions) at basic price(1)(2) | | | 1,124,004.7 | | | | 1,213,715.5 | | | | 1,305,562.6 | | | | 1,401,692.9 | | | | 1,458,851.5 | |
Real GDP(J$ millions) at basic price(3) | | | 731,038.3 | | | | 732,543.7 | | | | 736,405.3 | | | | 743,289.2 | | | | 753,345.6 | |
Real GDP at basic price (US$ millions)(2)(3) | | | 10,631.5 | | | | 10,653.4 | | | | 10,709.6 | | | | 10,809.7 | | | | 10,956.0 | |
Percent Change in Real GDP(3) | | | (0.5 | ) | | | 0.2 | | | | 0.5 | | | | 0.9 | | | | 1.4 | |
Real GDP at basic price per capita (J$/person)(3) | | | 269,974.5 | | | | 269,846.4 | | | | 270,682.1 | | | | 272,737.8 | | | | 276,040.6 | |
Real GDP (J$ millions) at market price | | | 837,105.9 | | | | 841,322.3 | | | | 847,166.2 | | | | 855,607.7 | | | | 878,449.2 | |
Real GDP at market price (US$ millions)(2) | | | 12,174.1 | | | | 12,235.3 | | | | 12,320.4 | | | | 12,443.2 | | | | 6,984.6 | |
Percent change in Real GDP at market price | | | (0.6 | ) | | | 0.5 | | | | 0.7 | | | | 1.0 | | | | 2.7 | |
Real GDP at market price per capita (J$/person) | | | 309,145.6 | | | | 309,917.1 | | | | 311,394.7 | | | | 313,951.3 | | | | 321,411.3 | |
Inflation Consumer Price Index (Percent Change) | | | 8.0 | | | | 9.5 | | | | 6.4 | | | | 3.7 | | | | 1.7 | |
Interest Rates (%)(4) Weighted Average Loan Rate | | | 18.4 | | | | 17.5 | | | | 17.2 | | | | 17.1 | | | | 16.2 | |
Weighted Average Deposit Rate | | | 2.1 | | | | 2 | | | | 2 | | | | 1.5 | | | | 1.4 | |
Treasury Bill Yield(5) | | | 7.2 | | | | 8.3 | | | | 7.1 | | | | 7.0 | | | | 6.6 | |
Unemployment Rate (%)(6) | | | 13.9 | | | | 15.2 | | | | 13.7 | | | | 13.5 | | | | 13.2 | |
EXTERNAL SECTOR (US$ millions) | | | | | | | | | | | | | | | | | | | | |
Average Annual Nominal Exchange Rate (J$/US$) | | | 88.2 | | | | 101.2 | | | | 111.5 | | | | 117.5 | | | | 125.8 | |
Export of Goods (f.o.b) | | | 1,728.5 | | | | 1,580.5 | | | | 1,448.6 | | | | 1,254.9 | | | | 1,194.9 | |
Alumina | | | 508.3 | | | | 523.7 | | | | 529.4 | | | | 518.6 | | | | 444.0 | |
Sugar | | | 94.1 | | | | 53.2 | | | | 55.8 | | | | 53.9 | | | | 14.8 | |
Imports of Goods (c.i.f) | | | 6,298.3 | | | | 6,129.9 | | | | 5,847.3 | | | | 5,033.5 | | | | 4,751.3 | |
Goods Balance | | | (3,905.7 | ) | | | (3,877.7 | ) | | | (3,759.0 | ) | | | (3,194.5 | ) | | | (2,973.7 | ) |
Current Account Balance | | | (1,440.2 | ) | | | (1,356.8 | ) | | | (1,114.4 | ) | | | (430.1 | ) | | | (103.0 | ) |
Gross Foreign Direct Investments | | | 413.3 | | | | 544.7 | | | | 582.1 | | | | 925.0 | | | | 790.4 | |
Net Foreign Direct Investments | | | 389.2 | | | | 471.9 | | | | 502.4 | | | | 920.7 | | | | 564.1 | |
Increase/(Decrease) in Reserves | | | (840.5 | ) | | | (77.8 | ) | | | 953.3 | | | | 435.9 | | | | 282.4 | |
Net International Reserves of the Bank of Jamaica | | | 1,125.6 | | | | 1,047.8 | | | | 2,001.1 | | | | 2,437.0 | | | | 2,719.4 | |
Weeks of Coverage of Goods Imports(7) | | | 18.1 | | | | 17.9 | | | | 25.5 | | | | 35.5 | | | | 40.1 | |
PUBLIC FINANCE (J$ millions)(8) | | | 344,677.7 | | | | 396,979.4 | | | | 411,715.9 | | | | 455,835.8 | | | | 499,879.9 | |
Revenue and Grants | | | | | | | | | | | | | | | | | | | | |
Expenditure | | | 399,278.9 | | | | 395,241.8 | | | | 418,986.8 | | | | 460,719.4 | | | | 503,356.0 | |
Fiscal Surplus (Deficit) | | | (54,601.1 | ) | | | 1,737.6 | | | | (7,270.9 | ) | | | (4,883.7 | ) | | | (3,476.1 | ) |
Fiscal Surplus (Deficit) as a % of Nominal GDP | | | (4.1 | ) | | | 0.1 | | | | (0.5 | ) | | | (0.4 | ) | | | (0.2 | ) |
Primary Surplus | | | 72,336.5 | | | | 111,657.1 | | | | 117,241.8 | | | | 120,795.9 | | | | 135,880.1 | |
Primary Surplus as a % of Nominal GDP | | | 5.4 | | | | 7.6 | | | | 7.5 | | | | 7.1 | | | | 7.7 | (13) |
Loan Receipts | | | 144,347.1 | | | | 93,527.5 | | | | 168,705.9 | | | | 298,600.5 | | | | 89,826.8 | |
D-4
| | | | | | | | | | | | | | | | | | | | |
| | | 2012 | | | 2013 | | | 2014 | | | 2015 | | | 2016 | |
Amortization | | | 88,329.8 | | | | 106,640.2 | | | | 87,794.4 | | | | 342,725.9 | | | | 75,389.7 | |
Overall Surplus (Deficit) | | | 1,161.2 | | | | (11,375.0 | ) | | | 73,640.6 | | | | (42,937.9 | ) | | | 25,565.7 | |
Overall Public Sector Surplus (Deficit)(9) | | | (62,142.7 | ) | | | (1,888.7 | ) | | | 7,374.1 | | | | 28,695.1 | | | | 13,515.1 | |
Overall Public Sector Surplus (Deficit) as a % of Nominal GDP | | | (4.6 | ) | | | (0.1 | ) | | | 0.5 | | | | 1.7 | | | | 0.8 | |
PUBLIC DEBT | | | 995,230.9 | | | | 1,054,174.0 | | | | 1,046,850.3 | | | | 860,262.6 | | | | 834,319.9 | |
Domestic Debt (J$ millions)(10) | | | | | | | | | | | | | | | | | | | | |
Percent of Nominal GDP | | | 75.8 | | | | 74.2 | | | | 68.5 | | | | 52.4 | | | | 48.3 | |
Public Sector External Debt (US$ millions) | | | 8,255.5 | | | | 8,310.0 | | | | 8,658.6 | | | | 10,314.0 | | | | 10,244.2 | |
Percent of Nominal GDP | | | 56.0 | | | | 59.0 | | | | 64.9 | | | | 75.6 | | | | 74.5 | |
Total Public Sector Debt (J$ millions) | | | 1,762,811.2 | | | | 1,938,176.2 | | | | 2,039,650.3 | | | | 2,102,220.0 | | | | 2,150,062.67 | |
Percent of Nominal GDP | | | 134.3 | | | | 136.4 | | | | 133.4 | | | | 128.0 | | | | 122.8 | |
External Debt Service Ratio | | | 15.6 | | | | 15.1 | | | | 19.4 | | | | 18.4 | | | | 14.1 | |
TOURISM | | | | | | | | | | | | | | | | | | | | |
Total Visitor Arrivals | | | 3,306,168 | | | | 3,273,677 | | | | 3,503,978 | | | | 3,691,744 | | | | 3,837,243 | |
Occupancy Rate (% Hotel Rooms) | | | 60.5 | | | | 62.3 | | | | 67.9 | | | | 68.0 | | | | 69.0 | |
Visitor Expenditures(11) (US$ millions) | | | 2,069.6 | | | | 2,112.7 | | | | 2,244.4 | | | | 2,402.3 | | | | 2,538.9 | (13) |
| (1) | The gross domestic product series has been revised. This revision was made in order to capture the changing structure of industries in the manufacturing, financial and insurance services, business services and the miscellaneous services sectors. In addition, the base year has been changed from 1996 to 2003. |
| (2) | Calculated using the average annual nominal exchange rate. |
| (3) | At constant 2007 prices. |
| (4) | Loans are in domestic currency. |
| (5) | Tenors of Treasury Bills are approximately 182 days. |
| (6) | Includes all persons without jobs, whether actively seeking employment or not. |
| (7) | Calculated on the basis of gross international reserves. |
| (8) | Fiscal year data from April 1 to March 31. For example, 2016 refers to the period April 1, 2016 to March 31, 2017. |
| (9) | Overall Public Sector comprises the central government, the Bank of Jamaica, governmental statutory bodies and authorities and government-owned companies. |
| (10) | Does not include contingent liabilities in the form of guarantees of certain obligations of public entities. |
| (11) | Estimate. 2015 Revised. Updated data is as at March 2016. |
| (13) | Provisional estimate. |
Source: Bank of Jamaica, Statistical Institute of Jamaica, Ministry of Finance and the Public Service and Jamaica Tourist Board
D-5
JAMAICA
History
Originally settled by the Arawak Indians, Jamaica was first visited by Christopher Columbus in 1494 on his second voyage to the New World. Jamaica’s name derives from the Arawak word “Xaymaca,” which means “Land of Wood and Water.” In 1655 Admiral William Penn and General Robert Venables led a British force that conquered the island, ousting the Spaniards. Over the next 40 years, Jamaica became the stronghold of the Caribbean buccaneers who transformed Port Royal, then the island’s commercial center, into the richest city in the New World. The sugar industry, supported to a great extent by slaves transported from Africa until the abolition of slavery in 1834, formed the basis of the island’s economy. During its three centuries as a British colony, Jamaica was variously administered by a governor and a planter-controlled legislature, by British Crown Colony rule from London, England, and by limited representative government in the late 19th and early 20th centuries. The Government granted universal adult suffrage in 1944. From 1958 to 1961, Jamaica was a member of the now-defunct West Indies Federation, which encompassed all of Britain’s Caribbean colonies. Although plans for independence first appeared in the 1940s, internal self-government did not begin until 1959. On August 6, 1962, Jamaica became an independent country within the British Commonwealth.
The historical development of the island has influenced Jamaican national symbols. Jamaica’s flag, a diagonal cross of gold on a green and black background, represents the statement, “The sun shineth, the land is green and the people are strong and creative.” The national crest incorporates the original Arawak inhabitants with the legend “Out of Many, One People,” which reflects the country’s multiracial heritage. Jamaica’s reggae music enjoys international renown.
Territory and Population
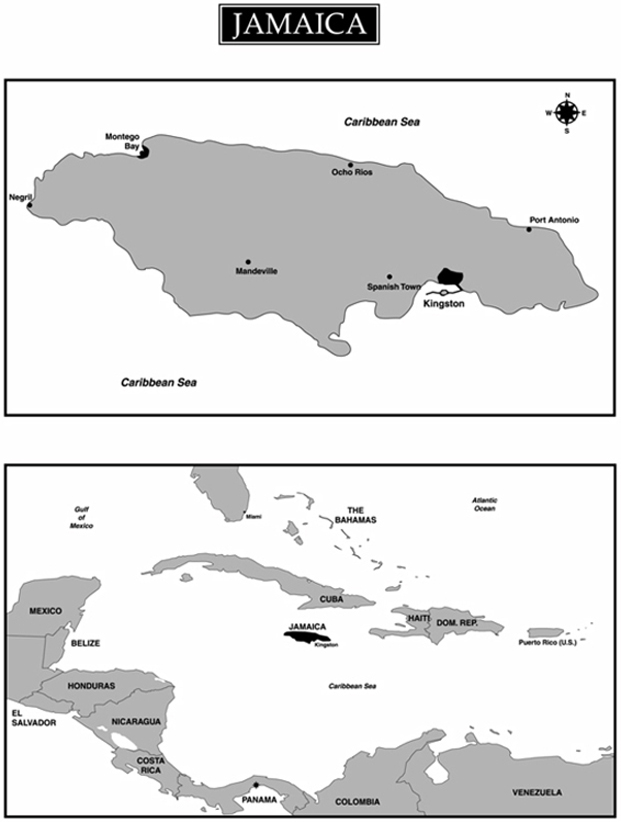
Jamaica, the third largest island in the Caribbean Sea, is located 558 miles (898 kilometers) southeast of Miami, Florida, 90 miles (144.8 kilometers) south of Cuba and 100 miles (160.9 kilometers) southwest of Haiti. The island has an area of 4,411 square miles (11,420 square kilometers), and its highest point is the Blue Mountain Peak, which rises 7,402 feet (2,256 meters) above sea level. The capital city, Kingston, located on the island’s southeast coast, also serves as Jamaica’s major commercial center. The natural harbor in Kingston is the seventh largest in the world. The country’s second-largest city, Montego Bay, located on the island’s northwest coast, is Jamaica’s main center for tourism. See “The Jamaican Economy—Principal Sectors of the Economy—Tourism.”
From 2010 to 2016, Jamaica’s population grew at an annual growth rate of approximately 0.22% per year. At December 31, 2016, Jamaica’s population was estimated at 2,730,894, a 0.20% increase over the December 31, 2015 population of 2,727,328. This low rate of population growth is primarily due to declining birth rates, a trend which the Government believes will continue. The most recent 2011 population and housing census reported that 46% of Jamaica’s population lives in rural areas while 54% lives in urban areas. Jamaica’s official language is English, and the majority of the population speaks a dialect.
Society
Jamaica’s educational system is based on the British system. The school system consists of a pre-primary cycle of two years, followed by a primary cycle of six years, a secondary cycle of seven years, post-secondary and tertiary education. The education and training sector focuses on the development of the population, from early childhood through to the tertiary level and beyond. One focus is being placed on increasing the Government’s involvement at the early childhood education level for an increased access to better quality education.
The Government has embarked on a new learner-center curriculum (National Standards Curriculum) geared at fostering the development of critical thinking and higher order skills at the primary level. Students will access their secondary education based on their aptitude, interests and ability.
The HEART Trust/NTA is the facilitating and coordinating body for technical and vocational workforce development in Jamaica. The HEART Trust/NTA provides access to training, development of competence,
D-6
assessment and certification to working age Jamaicans. It also facilitates career development and employment services island-wide. Training is provided both in the workplace (enterprise-based), as well as through formal Technical, Vocational and Educational Training (“TVET”) institutions and TVET special programs. Programs have also been implemented to increase access to all, especially unattached youths. As at March 2016, the HEART Trust/NTA directly administered training in over 29 institutions island-wide and over 356 secondary schools and special church-based and community-based training institutions.
The educational system accommodates a variety of public and private schools. Post-secondary education is available to qualified candidates at community colleges, the University of Technology, University of the Commonwealth Caribbean, Northern Caribbean University, International University of the Caribbean, the Jamaica campus of the University of the West Indies and several private off shore universities.
In addition to the formal school system, Jamaica has an adult literacy program – the Jamaican Foundation of Lifelong Learning. According to the 2008 Jamaica Survey of Living Condition Survey Literacy Module 91.7% of the population was “Literate,” with 78.3% being “Functionally Literate” and 13.4% having only “Basic Literacy,” while 8.3% were “Illiterate.” Data provided by UNESCO Institute for Statistics estimates the 2017 adult literacy rate at 90.0% (85.5% male and 94.2% female).
Recent macro- and micro-economic developments have generally caused the unemployment rate to decrease. In 2016, the average number of unemployed persons was 178,500, an increase of 0.4% from 177,900 in 2015. The average unemployment rate was 13.2% in 2016, a decrease from 13.5% in 2015. See “The Jamaican Economy—Employment and Labor.” The unemployment rate in Jamaica during the past six years has decreased from a high of 15.2% in 2013 to a low of 13.2% in 2016. Unemployment was 12.7% as at January 31, 2017, as compared to 13.3% as at January 31, 2016 and 12.9% as at March 31, 2017.
The Government remains committed to prioritizing the social protection program in an effort to minimize any potentially adverse impact on the most vulnerable within the population. To this end, the Government is providing a budgetary increase of 47% to the Programme of Advancement Through Health and Education (“PATH”) in a move to strengthen the country’s social safety net. This addition of J$3.68 billion in the FY 2017/18 budget, brings the total budget for PATH to J$11.47 billion.
The following table shows selected social indicators applicable to Jamaica for the five years ended December 31, 2016:
Social Indicators
| | | | | | | | | | | | | | | | | | | | |
| | | 2012 | | | 2013 | | | 2014 | | | 2015 | | | 2016* | |
Real GDP at market price per capita(1) | | J$ | 309,145.6 | | | J$ | 309,917.1 | | | J$ | 311,394.7 | | | J$ | 313,951.3 | | | J$ | 321,411.3 | |
Real GDP at basic price per capita | | J$ | 269,974.5 | | | J$ | 269,846.4 | | | J$ | 270,682.1 | | | J$ | 272,737.8 | | | J$ | 276,040.6 | |
Perinatal Mortality Rate (per thousand)(2) | | | 30.2 | | | | 29.2 | | | | 29.4 | | | | 30.8 | | | | 29.0 | |
| (1) | In constant 2007 prices. |
| (2) | Defined as deaths in government hospitals occurring anytime from 28 weeks of pregnancy until seven days after birth |
Please note that the statistics for Perinatal Mortality Rate are only reflective of the public secondary and tertiary health care facilities; no inference should be made of the primary health care facilities or Jamaica as a whole. Data marked by an * should be used provisionally.
Source: Statistical Institute of Jamaica, Planning Institute of Jamaica and Ministry of Health—Planning and Evaluation Branch.
Governmental Structure and Political Parties
The Jamaica Order in Council 1962 (the “Constitution”) is the supreme law of Jamaica and sets forth the basic framework and legal underpinnings for governmental activity in Jamaica. The Constitution came into effect when Jamaica became an independent country on August 6, 1962, and includes provisions that safeguard the fundamental freedoms of the individual. While a simple majority of Parliament can enact amendments to the Constitution, certain amendments require ratification by a two-thirds majority in both houses of Parliament, and amendments altering fundamental rights and freedoms require the additional approval of a national referendum.
D-7
Jamaica is a parliamentary democracy based upon the British Westminster model and is a member of the British Commonwealth. The Head of State is the British Monarch, who is represented locally by the Governor-General of Jamaica. Traditionally, the British Monarch appoints the Governor-General upon the recommendation of Jamaica’s Prime Minister. The actions of the Governor-General are, in most cases, of a purely formal and ceremonial nature. General elections are constitutionally due every five years, at which time all seats in the House of Representatives will be up for election. The Constitution permits the Prime Minister to call elections at any time within or shortly beyond the five-year period, consistent with the Westminster model.
National legislative power is vested in a bicameral Parliament composed of a House of Representatives and a Senate. The House of Representatives comprises 63 members elected by the people in the general elections. The Senate comprises 21 members appointed by the Governor-General, 13 of whom are appointed on the advice of the Prime Minister and eight of whom are appointed on the advice of the Leader of the Opposition. The President of the Senate is elected by its members. The members of the House of Representatives select their own chairman, known as the Speaker. The Prime Minister, usually the member most likely to command the support of the majority of the members of the House of Representatives, is appointed by the Governor-General.
In addition to the national governing bodies, local government is administered through 13 municipal corporations (12 parish councils and the Kingston and St Andrew Corporation) and the Municipality of Portmore. The results of the last local government election, which took place on November 28, 2016, accorded the Jamaica Labour Party (“JLP”), 8 of the 12 municipal corporations (that is including the KSAC). The People’s National Party (“PNP”) and JLP shared the St Thomas Municipal Corporation. The PNP won the Municipality of Portmore.
The principal policy-making body of the Government is the Cabinet, which is responsible for the general direction and control of Jamaica and whose members are collectively accountable to Parliament. The Cabinet consists of the Prime Minister and no fewer than 11 other members of the two Houses of Parliament. No fewer than two, and no more than four members must be selected from the Senate. The Governor-General appoints members of the Cabinet upon the recommendation of the Prime Minister.
The Jamaican judicial system is based on English common law and practice and consists of a Supreme Court, a Court of Appeal and local courts. Final appeals are made to the Judicial Committee of the Privy Council in the United Kingdom (“UK”). A number of Caribbean nations, including Jamaica, are currently discussing the establishment of a Caribbean Court of Justice to replace the Judicial Committee of the Privy Council for those nations. Jamaica has signed an agreement to establish the Caribbean Court of Justice. In April 2005, Jamaica passed the Caribbean Court of Justice (Original Jurisdiction) Act 2005. The Act provides for the implementation of the provisions of the agreement establishing the Caribbean Court of Justice in its original jurisdiction. The Caribbean Court of Justice, in its original jurisdiction, will hear and determine matters relating to the interpretation and application of the Revised Treaty of Chaguaramas (“Revised Treaty”) establishing the Caribbean Community and Common Market.
Two major political parties dominate Jamaica’s political system, the JLP and the PNP. From Jamaica’s independence on August 6, 1962, until 1972, the JLP formed the government; then the PNP assumed power in 1972. In late 1980, the JLP returned to power until February 1989, when Michael Manley led the PNP to victory and became Prime Minister. In 1992, Prime Minister Manley resigned as Prime Minister and leader of the PNP and was succeeded by Percival James (“P.J.”) Patterson. The PNP won the 1993 general election and P.J. Patterson returned as Prime Minister. In 1995, a former Chairman of the JLP formed a third political party, the National Democratic Movement. In the 1997 general election, the PNP won 51.7% of the votes cast, and P. J. Patterson returned to the office of Prime Minister. In March 2006, Prime Minister P.J. Patterson resigned as Prime Minister and leader of the PNP and was succeeded by Portia Simpson-Miller.
Jamaica held its most recent general election on February 25, 2016. As a result of that election, the JLP won 50.1% of the valid votes cast, and Andrew Holness became Prime Minister. The Constitution requires that a general election be held every five years, at which time all seats in the House of Representatives are up for election. Given that the last general election was February 25, 2016, an election is to be constitutionally held by February 2021. However, the Prime Minister, as constitutionally permitted, can decide to call an election before this date. Parliament may consider legislation to create fixed election dates and term limits for the Prime Minister.
D-8
The following table shows the parliamentary electoral results for the past six general elections:
Parliamentary Electoral Results
| | | | | | | | | | | | | | | | | | | | | | | | |
| | | 1993 | | | 1997 | | | 2002 | | | 2007 | | | 2011(1) | | | 2016 | |
People’s National Party | | | 52 | | | | 51 | | | | 34 | | | | 28 | | | | 42 | | | | 31 | |
Jamaica Labour Party | | | 8 | | | | 9 | | | | 26 | | | | 32 | | | | 21 | | | | 32 | |
| (1) | Following a Boundaries Revision exercise conducted between April 2008 and March 2010, the number of constituencies (parliamentary seats) was increased from sixty to sixty-three. |
Source: Office of the Prime Minister.
As part of the legislative agenda for FY 2016/17, the Government announced its intention to table a Constitutional (Amendment) Bill to replace Her Majesty The Queen with a non-executive President as Head of State. The Administration also intends to broaden and deepen Jamaican input into the regional integration movement. See “—International Relationships—Caribbean Community (CARICOM).”
International Relationships
Jamaica maintains diplomatic relations with almost every nation in the world. Jamaica is a member of the United Nations and its affiliated institutions, including the Food and Agriculture Organization, the International Monetary Fund (“IMF”), the World Bank Group, the World Health Organization, the World Tourism Organization, the World Intellectual Property Organization, the International Seabed Authority, the United Nations Environment Program and the United Nations Conference on Trade and Development (“UNCTAD”). It is also a member of several other regional and international bodies, including the World Trade Organization (“WTO”), the African, Caribbean and Pacific Group of States (“ACP”), the Association of Caribbean States, the Caribbean Community (“CARICOM”), the Commonwealth; the Latin American and Caribbean Economic System, the Organization of American States, and the Community of Latin American and Caribbean States.
Jamaica is a signatory to the Cotonou Partnership Agreement (“CPA”); party to the CARIFORUM-EU Economic Partnership Agreement (“EPA”) and CARICOM Bilateral Trade Agreements with Colombia, Costa Rica, Cuba, Dominican Republic and Venezuela. It is also a beneficiary of the Caribbean Basin Economic Recovery Act and the Caribbean-Canada Trade Agreement (“CARIBCAN”). In addition, as a member of the United Nations bloc of developing countries known as the Group of 77, Jamaica is eligible for the Generalized System of Preferences.
Jamaica receives preferential tariff treatment on most of its products pursuant to, among others, the trade agreements described below.
The WTO Agreements
Jamaica currently trades with the 164 members of the WTO on the basis of the Most Favoured Nation (“MFN”) and National Treatment principles, except in specific cases where it trades with members under regional trade agreements provided for in Article 24 of the General Agreement on Tariffs and Trade/WTO or where it benefits from preferences under the Enabling Clause, some of which are non-reciprocal and unilateral, such as the Generalised System of Preferences. Jamaica also benefits from other non-reciprocal preferential market access schemes provided by WTO members under the legal cover of waivers obtained within the context of Article 9 of the Marrakesh Agreement.
The WTO provides a forum for exchanging liberalization commitments through successive rounds of multilateral trade negotiations. The current round, called the Doha Development Agenda (“DDA”), was launched in 2001 and should have ended in 2005. Limited progress has been made in the DDA to further reform multilateral trade rules. Deep divisions among WTO members, including on the draft modalities for liberalizing trade in agriculture, non-agricultural market access and services and modalities for strengthening WTO rules, have contributed to the delayed progress.
D-9
A breakthrough in the round was reached at the ninth WTO Ministerial Conference held in Bali, Indonesia, in December 2013, with the adoption of the WTO Agreement on Trade Facilitation (“TF”). The TF Agreement entered into force on February 22, 2017, when two-thirds of the current WTO membership (108 Members out of 162) ratified the agreement. Jamaica ratified the agreement on January 19, 2016.
A further breakthrough in the round was reached at the tenth WTO Ministerial Conference held in Nairobi, Kenya, from December 15 – 19, 2015. Ministers adopted the historic decision to establish disciplines on export competition. This decision establishes disciplines on export subsidies and other types of export support instruments that can distort competition i.e. export credits, export credit guarantees and other types of export financing; exporting state trading enterprises; and food aid. This will see the elimination of export subsidies in the area of agriculture, a practice that was prohibited for non-agricultural products decades ago.
Work is ongoing on other outstanding issues of the DDA. WTO members are preparing for the eleventh WTO Ministerial Conference to be held from December 11 – 14, 2017, in Buenos Aires, Argentina.
Caribbean Community (CARICOM)
The Treaty of Chaguaramas (the “Treaty”) establishing CARICOM was signed in 1973 by four English-speaking Caribbean countries.
Between 1997 and 2001, Member States negotiated a revision of the Treaty to expand the scope of the Common Market by establishing a single market and economy. Consequently, the Revised Treaty of Chaguaramas (the “Revised Treaty”) establishing the Caribbean Community, including the CARICOM Single Market and Economy (“CSME”), was signed by the following Caribbean countries in July 2001: Antigua and Barbuda, The Bahamas, Barbados, Belize, Dominica, Grenada, Guyana, Jamaica, Montserrat, St. Kitts and Nevis, St. Lucia, St. Vincent and the Grenadines, Suriname, and Trinidad and Tobago. Haiti later signed the Revised Treaty on July 2, 2002.
The Revised Treaty seeks to establish a common economic space among CARICOM Member States that would provide for the free movement of goods, services, people and capital, and would give CSME nationals the right to establish businesses and to provide a service in any CARICOM Member State participating in the CSME. In January 2006, the implementation of the provisions of the CARICOM Single Market (“CSM”) was initiated by Jamaica, Barbados, Belize, Guyana, Suriname and Trinidad and Tobago, that is, the provisions enabling the free movement of goods, services, people and capital. Other Member States started the CSM implementation process in July 2006. The Bahamas and Montserrat are members of the Caribbean Community, but are not yet participating in the CSME. A 2009 audit conducted by the CARICOM Secretariat indicates that Jamaica is far advanced in implementing its obligations under the Revised Treaty.
Additionally, the Revised Treaty provides for the establishment of the single economy, which would include the harmonization of fiscal and monetary policies and the establishment of a common currency. The single economy requires a great degree of legislative and economic policy harmonization among Member States, and covers areas in which the region has not yet been able to find policy convergence. At a CARICOM Heads of Government retreat held in May 2011, Heads of the Government agreed to consolidate the gains of the CSM and to put on hold the single economy.
At the regional level, a number of instruments – draft protocols, model legislation and draft sectoral and regional policies – relating to the CSM are being negotiated. Jamaica is participating actively in these negotiations. They relate to, inter alia, the Draft Protocol on Contingent Rights, the CARICOM Financial Services Agreement, the Draft Protocol on Public Procurement, the Model Bill on Consumer Protection, the Draft Framework Policy on the Single Jurisdiction and the Draft Policy Framework on Mergers and Acquisitions.
D-10
Efforts are also underway to put in place the CARICOM Administrative Processing System (“CAPS”) at the regional level. The CAPS is a fully automated system being implemented to enable CARICOM nationals to secure online their Skilled Certificates and Service Providers Certificates.
Trade with Latin America
Jamaica, as part of CARICOM, has concluded bilateral trade agreements with Venezuela, Colombia, Cuba, the Dominican Republic and Costa Rica. These agreements were negotiated pursuant to Article 80 – Coordination of External Trade Policy of the Revised Treaty. Jamaica has only recently formally ratified the Agreements with the Dominican Republic, Costa Rica and Cuba.
Caribbean-Canada Trade Agreement (CARIBCAN)
The 1986 CARIBCAN is an agreement between Canada and all CARICOM countries, except Haiti and Suriname. This agreement establishes a program for trade, investment and industrial cooperation, and features the unilateral extension by Canada of duty-free access to the Canadian market for a range of eligible imports from beneficiary CARICOM countries. CARIBCAN’s basic objectives are to enhance the Caribbean region’s existing trade and export earnings, improve its trade and economic development prospects, promote new investment opportunities, and encourage enhanced economic integration and cooperation within the region. After more than twenty years of CARIBCAN’s existence, the Parties commenced negotiations in 2009 for a CARICOM-Canada Trade and Development Agreement that would allow reciprocal access for Canadian companies to the Caribbean market in a range of areas, including goods as well as services and investment. The negotiations on the new reciprocal trade agreement were suspended in May 2015. However, the CARIBCAN arrangement remains in force, and Canada applied for and received a new WTO MFN waiver in July 2015 which extends to 2023.
The Caribbean Basin Initiative
The Caribbean Basin Initiative (“CBI”), which was initially launched in 1983 with the enactment of the Caribbean Basin Economic Recovery Act (“CBERA”), was amended in 1990 to increase market access to the United States. In 2000, the United States further expanded the CBI with the enactment of the Caribbean Basin Trade Partnership Act (“CBTPA”). The CBTPA provides preferential access for a number of products previously excluded from the CBI. The CBTPA will expire on September 30, 2020. The United States applied for and received a new WTO waiver for CBERA/CBTPA in May 2015. The waiver will expire on December 31, 2019.
Generalized System of Preferences
Under the aegis of the UNCTAD, the Generalized System of Preferences (“GSP”) was designed to afford developing countries preferential access for a wide range of their exports to the markets of developed countries. The GSP is an export-promotion tool with the objectives of increasing the export earnings of developing countries, promoting industrialization in developing countries and accelerating the rate of economic growth in developing countries. Jamaica continues to benefit from preferences extended unilaterally under the GSP schemes of Australia, Japan, New Zealand, Norway and Switzerland.
ACP/European Union Cotonou Partnership Agreement
In February 2000, the European Union and the ACP, concluded negotiations for a new 20-year trade, industrial, financial and technical cooperation agreement. Jamaica ratified the new agreement, known as the CPA, in February 2001 and, following ratification by 75% of ACP Member States and all European Union members, the agreement formally entered into force on April 1, 2003. The agreement was reviewed in 2005 and 2010. The trade provisions of the CPA have been replaced by the EPA, as described below.
The CPA will expire in 2020. Article 95 (4) stipulates that eighteen (18) months before the expiry of the agreement, the parties shall enter into negotiations in order to examine what provisions shall subsequently govern their relationship. As such, consultations are now underway within both groupings (the ACP and the European Union) to prepare for the negotiations, which will formally commence in August 2018 on the successor arrangement to the CPA.
D-11
The CARIFORUM-EU Economic Partnership Agreement
The EPA between the Caribbean Forum of ACP States (CARIFORUM, i.e., CARICOM and the Dominican Republic) and the European Union is a reciprocal trade agreement, which was signed in October 2008 by the European Union and fourteen (14) CARIFORUM States, with the exception of Haiti, which signed the agreement in December 2009.
The EPA is a comprehensive and development-orientated trading arrangement which replaced the previous non-reciprocal trading arrangement between the European Union and the ACP countries.
Under the EPA, the European Union committed to remove immediately all tariffs and quotas on exports from CARIFORUM, with the exception of rice and sugar. In the case of rice, full liberalization took place in 2010; for sugar it took place in 2015. Under the EPA, exporters of CARIFORUM-originated goods are accorded duty-free and quota-free access to the European Union market.
Unlike the European Union, CARIFORUM States will reduce tariffs on a phased basis. The European Union’s exports into CARIFORUM are to be liberalized over a period of 25 years with exclusions and long phase—in periods for sensitive products. Seventy-five percent (75%) of all CARIFORUM’s imports of agricultural and fisheries products have been excluded from liberalization under the EPA. These sensitive products will continue to be protected by tariffs applied by CARIFORUM States. The tariff liberalization process under the EPA must be completed by January 1, 2033. The first reduction in tariffs began in January 2011. Jamaica implemented the first and second phases of tariff reductions under the EPA in January 2011 and January 2013 respectively. Jamaica commenced the third phase of tariff reductions on goods imported from the European Union in January 2015. The tariff reductions are now being made automatically.
The EPA goes beyond trade in goods to include trade in services. The agreement requires the European Union to remove restrictions on CARIFORUM’s services exports, beginning with the liberalization of 29 sectors and sub-sectors.
The EPA establishes provisions to administer trade-related issues between the parties. These trade-related issues are primarily in relation to agriculture and fisheries, sanitary and phyto-sanitary standards, customs and trade facilitation, investment facilitation, intellectual property rights, competition, electronic commerce and personal data protection. The agreement goes further to provide for parties to undertake development cooperation in a number of areas, ranging from the development of supply-side capacity, including the development of trade-related infrastructure, to the enhancement of the tourism sector and cultural cooperation.
There are several institutions established under the EPA to oversee its implementation, monitoring and review. These bodies are (i) the Joint CARIFORUM-EU Council convened at the ministerial level; (ii) the CARIFORUM-EU Trade and Development Committee convened at the level of senior officials; (iii) the CARIFORUM-EU Parliamentary Committee involving the parliamentarians; and (iv) the CARIFORUM-EU Consultative Committee to promote dialogue among civil society. Jamaica is currently applying the EPA provisionally, pending ratification.
D-12
THE JAMAICAN ECONOMY
General
Jamaica operates as a mixed, free market economy with state enterprises as well as private sector businesses. Major sectors of the Jamaican economy include agriculture, mining, manufacturing, tourism, and financial and insurance services. As an open economy, Jamaica is well integrated into the global economy with intraregional trade contributing prominently to overall economic activity.
Since the early 1980s, successive governments have implemented structural reforms aimed at fostering private sector activity and increasing the role of market forces in resource allocation. During this period, a large share of the economy has been returned to private sector ownership through divestment and privatization programs in areas such as agriculture, tourism, transportation, banking, manufacturing and communications. See “—The Jamaican Economy—Privatization.” Deregulation of markets, the elimination of price subsidies and price controls and the reduction and removal of trade barriers have reduced or eliminated production disincentives and anti-export biases.
In the early 1990s, the reform process in Jamaica gained momentum with, among other developments, the liberalization of the foreign exchange market and the overhaul and simplification of the tax system. In addition to changes in personal income tax and corporate tax regimes, taxes have been streamlined and simplified to facilitate compliance and greater efficiency in tax collection, and a number of tax exemptions have also been eliminated. The Government is continuously assessing its current tax legislation and has been implementing a series of tax reforms. See “Public Finance—Taxes and Tax Reform.”
In 2009, Jamaica introduced a new strategic plan to achieve developed country status by 2030 called Vision 2030 Jamaica. The plan is based on the following seven guiding principles: transformational leadership, partnership, transparency and accountability, social cohesion, equity, sustainability, and urban and rural development. Vision 2030 Jamaica seeks to redefine the strategic direction of Jamaica by moving from dependence on lower forms of capital, such as tourism and basic agricultural commodities, to higher forms of capital, such as cultural, human, knowledge, institutional and services capital stocks. Jamaican business owners face challenges that primarily stem from global factors that include high energy prices, including the price of oil, and, in some sectors, high commodity prices. See “—The Jamaican Economy—Principal Sectors of the Economy.”
D-13
During FY 2016/17, the Government continued on its comprehensive Economic Reform Program (“ERP”) which it began in FY 2012/13, while continuing to tighten fiscal policy. The main pillars of the ERP were:
| | • | | structural reforms to boost economic growth and employment; |
| | • | | actions to improve price and non-price competitiveness; |
| | • | | upfront fiscal adjustment, supported by extensive fiscal reforms; |
| | • | | debt reduction, including active debt management, to place public debt on a sustainable path, while protecting financial system stability; and |
| | • | | improved social protection programs. |
The ERP included a heavy and front-loaded reform agenda to support a prompt economic recovery, maintain social cohesion, build labor capacity and improve productivity. Accordingly, measures were implemented to improve access to credit, reduce bureaucracy and other limiting factors in the business environment, and to improve labor market flexibility. This reform agenda was focused on actions to strengthen public financial management, introduce a fiscal rule, reform the tax system, improve the business climate, move towards inflation targeting and reform of the securities dealers sector. See “The Monetary System—Legislation and Regulation” and “Public Finance—Taxes and Tax Reform.” These fiscal reforms were essential to a sustained fiscal consolidation effort to promote debt reduction. Structural reforms to achieve higher and sustained growth were pivotal to long-term economic stability and increased welfare of the population.
To alleviate the possible adverse impact of fiscal adjustment on the most vulnerable, the program included a floor on social spending for the most vulnerable in the population. The Government also recognized that safeguarding the financial sector was critical, and consequently had established a Financial Sector Support Fund to offer assistance, if needed, to financial institutions that participated in the debt exchange of 2013. See “The Monetary System—Legislation and Regulation.”
A key part of the ERP was a growth strategy that would focus on investment in:
| | • | | the consolidation of Jamaica as a logistics hub for shipment; |
| | • | | information technology; |
| | • | | infrastructure development; |
| | • | | diversification of the tourism product; |
| | • | | sustainable energy; and |
| | • | | the promotion of a more business-friendly environment with respect to government agency administration, workforce and access to credit for smaller to medium-sized businesses. |
Some of the impact of the ERP was reflected in the improvement in Jamaica’s ranking in the ‘Ease of Doing Business’ report, published by the World Bank. Specifically, based on the Ease of Doing Business 2017 report, Jamaica ranked 67th for the year 2016 relative to 85th in 2014. This progress was mainly based on improvements in access to financing, and ease of access to electricity as well as reductions in impediments to starting a business. This improvement also reflected the efforts towards implementing key structural reforms which augur well for a sustainable medium-term growth path for Jamaica.
D-14
IMF Arrangements
Stand-By-Arrangement
In February 2010, the Government entered into a 27-month Stand-by-Arrangement (“SBA”), with the IMF in the amount of 820.5 million (approximately US$1.27 billion) special drawing rights (“SDR”). Prior to the execution of the SBA, the Government had to take several actions, including adopting a tax policy package yielding approximately 2% of GDP; completing the Jamaica Debt Exchange (“JDX”); and reaching an agreement regarding the divestment of Air Jamaica, all of which the Government completed. The SBA supported the Government’s economic program aimed at restoring macroeconomic stability and creating conditions for improved growth. This program included critical steps and policy reforms to tackle fiscal and debt imbalances and other underlying vulnerabilities. The program was designed to assist the country in the establishment of fiscal and debt sustainability over the medium term. As such, the program focused on facilitating tax reform, rationalization of the public sector and reform of public financial systems. See “—Public Sector Indebtedness—The Jamaica Debt Exchange,” “—Public Finance—Taxes and Tax Reform” and “—The Jamaican Economy—Privatization.”
To achieve these goals, the program focused on a three-pronged strategy of:
| | • | | comprehensive debt management; and |
| | • | | reforms to further strengthen the financial system. |
As part of the SBA, the Government undertook a structural reform agenda, which included reforms to fiscal institutions, public entities, debt management, and the financial sector. As part of these reforms the Government passed the Fiscal Responsibility Framework (“FRF”), launched its strategic and comprehensive domestic liability management program, and implemented a variety of reforms impacting the financial system. The SBA approved by the IMF Board in February 2010 went off-track within a year, as the program’s targets for improving the government’s budget position were missed, which in turn eroded confidence, lowered economic growth, and resulted in acute balance of payments pressures. In the absence of the scheduled reviews under the SBA, no further performance targets were established to form the basis for further drawdowns. This also resulted in the Government not receiving SDR 285.7 million (US$420 million) from the IMF as well as multilateral funding of approximately US$550 million and grants of approximately $59.19 million. See “Public Sector Indebtedness—External Debt.”
Extended Fund Facility
On May 1, 2013, the Executive Board of the IMF approved a request by the Government for a four-year extended arrangement extended fund facility (“EFF”) in an amount of SDR 615.38 million (approximately US$932.3 million) based on exchange rates published by the IMF on January 31, 2013, the equivalent of 225% of the Government’s quota in the IMF. This EFF is the successor to and supersedes the SBA. The purpose of the EFF is to support the Government’s comprehensive ERP described above. See below for a description of the disbursements made to date under the EFF.
Pursuant to the terms of the EFF, its implementation and progress is monitored through the quarterly review quantitative performance criteria, indicative targets and structural benchmarks. See “—General.” The quantitative performance criteria establishes targets relating to, among other things: the primary balance of the Central Government; tax revenues; the overall balance of the public sector, the aggregate amount of Government direct debt, the aggregate amount of Government guaranteed debt; the aggregate amount of Government accumulation of domestic arrears, the aggregate amount of Government accumulation of tax refund arrears, the consolidated Government accumulation of external debt payment arrears, the amount of Government social spending, the cumulative change in the Government’s net international reserves and the cumulative change in the Government’s net domestic assets.
D-15
Progress under the Extended Fund Facility
The first review of performance criteria was completed by the end of September 2013, the Government met all required criteria, targets and benchmarks and the IMF made a second disbursement in the amount of approximately SDR 19.97 million on October 2, 2013. On each of the following dates, the IMF Board completed its review, found the Government to have met all criteria, and disbursed the corresponding funds:
| | • | | On December 18, 2013, with a disbursement of SDR 19.97 million (approximately US$30.8 million). |
| | • | | On March 19, 2014 with a disbursement of SDR 46.0 million (approximately US$71.4 million). |
| | • | | On September 24, 2014, with a disbursement of SDR 45.95 million (approximately US$68.6 million). |
| | • | | On December 19, 2014, with a disbursement of SDR 45.95 million (approximately US$67.0 million). |
| | • | | On March 30, 2015, the completion of that review resulted in disbursement of SDR 28.32 million (approximately US$40.0 million). |
| | • | | On June 16, 2015, permitting the disbursement of SDR 28.32 million (approximately US$39.7 million). |
| | • | | On September 23, 2015, with a disbursement of SDR 28.32 million (approximately US$39.7 million). |
| | • | | On December 17, 2015, with a disbursement of SDR 28.32 million (approximately US$39.3 million). |
| | • | | On June 21, 2016, with a disbursement of SDR 56.64 million (approximately US$80.34 million). |
| | • | | On September 20, 2016, with a disbursement of SDR 28.32 million (approximately US$38.87 million). |
D-16
The following table reflects Jamaica’s quantitative performance criteria and indicative targets, for the periods presented, under the PSBA, as applicable:
IMF Performance Criteria
| | | | | | | | | | | | | | | | | | | | | | | | | | | | | | | | | | | | |
| | | 2016 | | | 2017 | | | 2018 | |
| | | Performance
Criteria | | | Adjusted
PC | | | Actual | | | Indicative
Target | | | Performance
Criteria | | | Proposed
Revised
Performance
Criteria | | | Indicative
Target | | | Proposed
Performance
Criteria | | | Indicative
Target | |
| | | End-Dec | | | End-Mar | | | End-June | | | End-June | | | End-Sep | | | End-Dec | | | End-Mar | |
| | | (in billions of Jamaican dollars unless otherwise stated) | |
Fiscal targets | | | | | | | | | | | | | | | | | | | | | | | | | | | | | | | | | | | | |
Performance Criteria | | | | | | | | | | | | | | | | | | | | | | | | | | | | | | | | | | | | |
Primary balance of the central government (floor)(3) | | | 54.0 | | | | | | | | 76.6 | | | | 123.0 | | | | 13.4 | | | | 15.0 | | | | 37.0 | | | | 59.0 | | | | 130.5 | |
Overall balance of the public sector (floor)(3) | | | (51.5 | ) | | | (47.7 | ) | | | 10.7 | | | | (17.2 | ) | | | (41.4 | ) | | | (39.2 | ) | | | (46.9 | ) | | | (59.3 | ) | | | (14.8 | ) |
Net increase in the central government guaranteed debt (ceiling)(3) | | | 0.0 | | | | | | | | (4.1 | ) | | | 0.0 | | | | 0.0 | | | | 0.0 | | | | 0.0 | | | | 0.0 | | | | 0.0 | |
Central government accumulation of domestic arrears (ceiling)(4)(10) | | | 0.0 | | | | | | | | 0.0 | | | | 0.0 | | | | 0.0 | | | | 0.0 | | | | 0.0 | | | | 0.0 | | | | 0.0 | |
Central government accumulation of tax refund arrears (ceiling)(5)(10) | | | 0.0 | | | | | | | | (4.4 | ) | | | 0.0 | | | | 0.0 | | | | 0.0 | | | | 0.0 | | | | 0.0 | | | | 0.0 | |
Accumulation of external debt payment arrears (ceiling)(4)(9) | | | 0.0 | | | | | | | | 0.3 | | | | 0.0 | | | | 0.0 | | | | 0.0 | | | | 0.0 | | | | 0.0 | | | | 0.0 | |
Indicative targets | | | | | | | | | | | | | | | | | | | | | | | | | | | | | | | | | | | | |
Tax revenues of the central government (floor)(3) | | | 300.0 | | | | | | | | 322.1 | | | | 440.0 | | | | 100.0 | | | | 100.0 | | | | 215.0 | | | | 328.0 | | | | 473.0 | |
Change in the stock of public bodies non-guaranteed debt (ceiling)(11) | | | (1.0 | ) | | | 2.8 | | | | (1.3 | ) | | | 3.3 | | | | 7.6 | | | | 2.5 | | | | 2.0 | | | | 3.5 | | | | 11.5 | |
Central government spending on social programs (floor)(3)(7) | | | 16.4 | | | | | | | | 23.2 | | | | 24.3 | | | | 5.0 | | | | 6.1 | | | | 11.2 | | | | 18.3 | | | | 26.6 | |
Total loan value of all user funded PPPs (ceiling, percent of GDP) | | | 3.0 | | | | | | | | 0.4 | | | | 3.0 | | | | 3.0 | | | | 3.0 | | | | 3.0 | | | | 3.0 | | | | 3.0 | |
Monetary targets | | | | | | | | | | | | | | | | | | | | | | | | | | | | | | | | | | | | |
Stock of non-borrowed net international reserves (floor)(6)(8) | | | 1,428 | | | | 1,419 | | | | 1,671 | | | | 1,475 | | | | 1,521 | | | | 1,521 | | | | 1,637 | | | | 1,777 | | | | 1,917 | |
Monetary policy consultation clause (in percent | | | | | | | | | | | | | | | | | | | | | | | | | | | | | | | | | | | | |
Upper band | | | 9.0 | | | | | | | | | | | | 9.0 | | | | 9.0 | | | | 9.0 | | | | 9.0 | | | | 9.0 | | | | 8.0 | |
Center inflation target | | | 5.5 | | | | | | | | 1.7 | | | | 5.5 | | | | 5.5 | | | | 5.5 | | | | 5.5 | | | | 5.5 | | | | 5.5 | |
Lower band | | | 1.0 | | | | | | | | | | | | 2.0 | | | | 2.0 | | | | 2.0 | | | | 2.0 | | | | 2.0 | | | | 3.0 | |
| (1) | Targets as defined in the Technical Memorandum of Understanding (“TMU”). |
| (2) | Based on program exchange rates defined in the TMU. |
| (3) | Cumulative flows from April 1 through March 31. |
| (4) | Includes debt payments, supplies and other committed spending as per contractual obligations; full definition in TMU. |
| (5) | Includes tax refund arrears as stipulated by law. |
| (6) | In millions of US dollars. |
| (7) | Defined as a minimum annual expenditure on specified social protection initiatives and programs (defined in TMU). |
| (8) | Stock of BOJ NIR minus all foreign currency CDs to domestic residents; full definition in TMU. |
| (9) | Continuous performance criterion. |
| (10) | The accumulation is measured against the stock at end-March 2016, which is J$21.0 billion for domestic arrears and J$17.3 billion for tax arrears. |
| (11) | For end-Dec 2016 and end-Mar 2017, these are cumulative flows from October 1, 2016. For subsequent dates, these are cumulative flows from April 1, 2017. |
Source: Bank of Jamaica.
Precautionary Stand-By-Arrangement
A Memorandum of Understanding (“MOU”), which was submitted to the IMF on October 21, 2016, embodied the tenets of the Government’s economic reform agenda. Coupled with other measures and prior actions, the board of the IMF approved a three-year precautionary Stand-By-Arrangement (“PSBA”) on November 11, 2016 for FY 2016/17 through to FY 2019/20 in an amount of SDR 1,195.3 million (approximately US$1,640.76 million), the equivalent of 312% of Jamaica’s quota in the IMF. Following this approval, SDR 300.1 million (approximately US$411.94 million) was made available for the country to access immediately and the remaining funds will become accessible to Jamaica in six tranches upon successful completion of the semi-annual program reviews.
The new SBA replaced the EFF in the penultimate quarter of FY2016/17 and it is treated as a precautionary arrangement. The Government does not intend to draw on the new SBA unless exogenous shocks generate a balance
D-17
of payments need. In addition to the commitment to maintaining macroeconomic stability, reducing public debt and addressing a wide range of structural issues, initially raised under the EFF, the SBA incorporates a renewed focus on unlocking Jamaica’s growth potential through structural reforms and combating crime and national security challenges.
The aims of the PSBA include:
| | • | | Boosting employment and GDP growth; |
| | • | | Raising the living standards of the Jamaican people; |
| | • | | Progressively reducing a poverty level that remains too high; |
| | • | | Strengthening the social safety net for the poor; |
| | • | | Improving public sector efficiency; |
| | • | | Reallocating public resources to growth-enhancing capital spending; |
| | • | | Rebalancing taxes from direct to indirect taxes; |
| | • | | Bolstering the resilience of the financial system; and |
| | • | | Modernizing the monetary policy framework and building the foundation for an eventual move to inflation targeting, while maintaining exchange rate flexibility and continuing to build precautionary foreign reserves. |
The first IMF-Staff Review mission under the SBA was conducted between February 20 and March 3, 2017 and was followed by a successful review by the Executive Board of the IMF on April 18, 2017. All structural benchmarks for the first review were met. The approval of the first review provides Jamaica with access to an additional SDR 126 million (approximately US$170 million).
Fiscal Responsibility Framework
As part of its economic reform agenda, Jamaica is committed to strengthening its fiscal discipline by adopting a number of programs, the main one being the FRF. The FRF requires the Government to adopt a number of initiatives including the following:
| | • | | preparing medium-term goals and explaining deviations, should there be any; |
| | • | | more comprehensive reporting in several areas and empowering the Financial Secretary to obtain fiscal information from all public sector entities; |
| | • | | strengthening accountability to Parliament in areas such as corporate plans and budgets of public bodies and increasing oversight of overall fiscal policy; |
| | • | | establishing quantitative ceilings on debt stock, fiscal balance and wages within a specific time frame; |
| | • | | requiring the Ministry of Finance and the Public Service to present to Parliament, at the time of the annual budget, a medium-term fiscal policy paper with plans and policies for developing the country; and |
| | • | | establishing a revised budget calendar, which includes the simultaneous tabling of the Estimates of Revenue and Expenditure in a timely manner to effect approval no later than March 31, commencing with the FY 2015/16 Budget. |
D-18
The FRF is the centerpiece of a number of other initiatives aimed at achieving fiscal consolidation. These other initiatives include a medium-term expenditure framework, the establishment of a centralized treasury management system and the enhancement and consolidation of legislation governing debt management generally. See “Public Finance—Central Government Budget.”
Comprehensive Debt Management
On January 14, 2010, the Government of Jamaica launched its strategic and comprehensive domestic liability management program, marketed as the JDX for domestic securities only. The results of the JDX revealed a participation rate of approximately 99.2% with a 100% participation rate from financial institutions. This level of success represented an exchange of approximately J$695.6 billion in eligible bonds.
In addition to implementing the JDX, the Government has an on-going debt management strategy that includes the following:
| | • | | promoting the development of the domestic securities market; |
| | • | | improving the maturity profile of the debt; |
| | • | | increasing the fixed-rate proportion of the domestic debt stock; |
| | • | | mitigating foreign currency and interest rate risks; |
| | • | | continuing to engage multilateral institutions and bilateral creditors; and |
| | • | | continuing to execute market friendly liability management operations including buy backs and debt swaps. |
In November 2012, the House of Parliament approved the Public Debt Management Act, 2012, to make provision for the better management of the public debt. See “Public Sector Indebtedness—General.”
In February 2013, the Government of Jamaica executed a second liability management program marketed as the National Debt Exchange (“NDX”). The NDX had a participation rate of approximately 99%, which translated to a nominal amount of J$845.5 billion tendered for exchange. See “Public Sector Indebtedness—Comprehensive Debt Management.”
During 2015 and thereafter, the Government has successfully and strategically used debt management tools to rebalance the debt portfolio through the execution of buybacks, switches and other liability management tools. For example, on July 28, 2015, Jamaica, through the Central Government, purchased US$3.25 billion of Jamaica’s Petrocaribe Energy Cooperation debt from the Government of Venezuela, acting through PDVSA Petroleo, S.A. The outstanding debt as at December 31, 2015 was purchased for US$1.5 billion. Additionally, on August 30, 2016, the Government settled a tender of US$317.8 million of its 10.625% Notes due 2017 and US$467.4 million of its 8.000% Amortizing Notes due 2019 in exchange for US$743.2 million of its 8.000% Amortizing Notes due 2039. The transaction resulted in the extension of maturities, debt stock reduction and mitigation of refinancing risk in the external debt portfolio.
D-19
Legal Reforms to Financial System
As part of the MOU with the ERP and EFF, the Government passed the Banking Services Act (omnibus banking law), which includes provisions for the qualification of auditors. Additionally, the Bank of Jamaica Act was amended, giving the Bank of Jamaica responsibility for overall financial stability. In keeping with the policy direction of the Government, the Jamaican Securities Act was also amended to enhance the legislative framework for the regulation of the securities industry in order to (i) combat the establishment and proliferation of unlawful financial operations; (2) correct other deficiencies in the regulatory framework of the securities industry; and (3) strengthen the FSC’s investigative powers. The Government has also implemented a variety of reforms impacting the financial system, in particular the securities sector. These reforms include the following:
| | • | | Continuing to strengthen the regulatory and supervisory framework of securities dealers to enhance capitalization and strengthen their ability to withstand shocks. The Securities (Licensing & Registration) Regulations were amended to increase the minimum capital requirements for securities industry dealers and investment advisors. In addition, the Securities (Prudential) Regulations were enacted with a view to improving the soundness of the industry. The Securities (Prudential) Regulations stipulates standards for (i) minimum risk based capital adequacy ratios covering exposures to market, credit, foreign exchange and operational risks; (ii) stress testing; (iii) large exposures limits; (iv) restrictions on the withdrawal of capital and (v) liquidity management. |
| | • | | Reforming the securities dealers’ primary business model, which was retail repo, aimed at reducing the risks associated with the business model. The Securities (Retail Repurchase Agreement) Regulations were enacted to enhance the legal and regulatory framework for the retail repo market, by establishing a distinct treatment for investors in order to protect their interest in the event of insolvency of any securities dealer. In addition, the Collective Investment Scheme (“CIS”) regulations were promulgated to replace the Unit Trust Act and Mutual Fund regulations. These regulations were aimed at expanding the legal form in which the fund could be established as well as enhance the FSC’s authority to regulate all facets of the CIS industry. CIS product was recognized as a viable alternative to the retail repo product as it would reduce the balance sheet risks associated with the retail repo, thus, strengthening their ability to withstand interest rate and liquidity shocks. |
For further details on certain laws and regulations governing the financial sector, see “—Monetary System— Legislation and Regulation.”
Energy Policy
The Government has made the energy policy an essential component of its conscious growth agenda demonstrated through several initiatives and programs being pursued. To this end, Jamaica continues to implement the National Energy Policy 2009-2030 to reduce energy costs, develop additional generating capacity and to facilitate investments in renewable and alternative resources, as a strategy to diversify its source of energy and decrease its reliance on crude oil. Renewable sources of energy and natural gas are more financially viable and environmentally sustainable when compared to crude oil. Natural gas as an alternative source of energy acts as a transitional fuel to help the country increase its electricity generation from renewable sources. The increase in electricity generation will be informed by the Integrated Resource Plan (“IRP”) currently being undertaken by the Government of Jamaica. This IRP will provide a comprehensive assessment and projection of existing and new generation capacities within the country and outline the mechanisms that will help to determine the exact scale of investment in infrastructure to improve quality, stability and efficiency of the grid, and the transmission and distribution systems. Jamaica aims to increase renewable generation to 20% of the grid by 2030, as outlined in the National Energy Policy 2009-2030. Furthermore, in promoting energy efficiency and conservation, a new Electricity Act was passed, which takes into consideration the use and implementation of renewable energy technologies, replacing the 1890 Electric Lighting Act.
D-20
Business Process Outsourcing
Business Process Outsourcing (“BPO”) is presently making a noticeable contribution to employment generation and is augmenting economic growth in Jamaica. Jamaica provides for a number of advantages for BPO, including:
| | • | | ideal time-zone and proximity to the US, the world’s biggest originator of outsourcing; |
| | • | | sophisticated telecommunications infrastructure; |
| | • | | a large and educated English speaking workforce with low attrition rates; and |
| | • | | competitive business costs. |
The following are some recent developments in the BPO sector:
| | • | | Currently, in excess of 40 BPO firms operate in Jamaica, employing approximately 22,000 full-time workers. |
| | • | | Sutherland Global Services has expanded, increasing the headcount in that location from 2,000 to 3,000 individuals. Other BPO facilities are currently underway, including a US$6 million, 75,000 square-foot facility in Montego Freeport. |
| | • | | The PetroCaribe Development Fund has lent a total of US$46 million to BPO ventures, which are engaged in developing a total of 670,000 square feet of operating space. Employment from these ventures, is expected to be 12,000. |
| | • | | A 5-year national strategy to support further development and expansion of the industry and to create an additional 18,000 jobs has been significantly enhanced to drive the workforce in this industry to 50,000 by 2020. |
Moving forward, the objective is to move Jamaica up the value chain in the BPO industry from simple call centers to knowledge processing centers. The aim is for outsourcing more professional services such as legal, medical and accounting support, software development and technical support services.
Gross Domestic Product
The Jamaican economy expanded by 1.4% in 2016 compared to 2015, expanded by 0.9% in 2015 compared to 2014 and expanded by 0.5% in 2014 when compared to 2013. The increase in 2016 was mainly the result of improvement in all industries with the exception of Mining & Quarrying and Producers of Government Services. Industries reflecting growth in 2016 over 2015 included Agriculture, Forestry & Fishing (13.5%), Construction (0.4%), Manufacturing (0.2%), Hotels & Restaurants (2.1%), Transport, Storage & Communication (0.5%), Finance & Insurance Services (1.2%), Real Estate, Renting & Business Activities (0.4%) and Other Services (0.5%).
Real Gross Domestic Product (“GDP”) is expected to expand and strengthen over the medium term against the background of lower consumer prices, improving consumer confidence and continued improvements in Jamaica’s external competitiveness.
D-21
Sectoral Origin of Gross Domestic Product
| | | | | | | | | | | | | | | | | | | | | | | | | | | | | | | | | | | | | | | | |
| | | 2012 | | | 2013 | | | 2014 | | | 2015 | | | 2016(1) | |
| | | Amount | | | % of
Total | | | Amount | | | % of
Total | | | Amount | | | % of
Total | | | Amount | | | % of
Total | | | Amount | | | % of
Total | |
| | | (in millions of J$ at constant 2007 prices, except percentages) | |
Agriculture, Forestry and Fishing: | | | 49,371 | | | | 6.8 | | | | 49,018 | | | | 6.7 | | | | 48,782 | | | | 6.6 | | | | 48,757 | | | | 6.6 | | | | 55,333 | | | | 7.3 | |
Traditional Export Agriculture | | | 7,302 | | | | 1.0 | | | | 6,129 | | | | 0.8 | | | | 7,987 | | | | 1.1 | | | | 8,132 | | | | 1.1 | | | | n.a. | | | | n.a. | |
Other Agricultural Crops and Post-Harvest Crop Activities | | | 33,019 | | | | 4.5 | | | | 33,842 | | | | 4.6 | | | | 31,331 | | | | 4.3 | | | | 30,848 | | | | 4.2 | | | | n.a. | | | | n.a. | |
Animal Farming, Forestry and Fishing | | | 9,051 | | | | 1.2 | | | | 9,047 | | | | 1.2 | | | | 9,464 | | | | 1.3 | | | | 9,777 | | | | 1.3 | | | | n.a. | | | | n.a. | |
Construction | | | 51,252 | | | | 7.0 | | | | 52,208 | | | | 7.1 | | | | 53,084 | | | | 7.2 | | | | 53,686 | | | | 7.2 | | | | 53,917 | | | | 7.2 | |
Manufacture | | | 62,522 | | | | 8.6 | | | | 62,226 | | | | 8.5 | | | | 61,706 | | | | 8.4 | | | | 63,901 | | | | 8.6 | | | | 64,049 | | | | 8.5 | |
Mining and Quarrying: | | | 16,273 | | | | 2.2 | | | | 16,716 | | | | 2.3 | | | | 16,861 | | | | 2.3 | | | | 17,022 | | | | 2.3 | | | | 16,476 | | | | 2.2 | |
Bauxite and Alumina | | | 15,087 | | | | 2.1 | | | | 15,698 | | | | 2.1 | | | | 15,772 | | | | 2.1 | | | | 15,843 | | | | 2.1 | | | | n.a. | | | | n.a. | |
Quarrying incl. Gypsum | | | 1,186 | | | | 0.2 | | | | 1,018 | | | | 0.1 | | | | 1,089 | | | | 0.1 | | | | 1,179 | | | | 0.2 | | | | n.a. | | | | n.a. | |
Total Goods | | | 179,418 | | | | 24.5 | | | | 180,167 | | | | 24.6 | | | | 180,434 | | | | 24.5 | | | | 183,366 | | | | 24.7 | | | | 189,776 | | | | 25.2 | |
Wholesale & Retail Trade; Repairs; Installation of Machinery and Equipment | | | 129,559 | | | | 17.7 | | | | 129,400 | | | | 17.7 | | | | 129,838 | | | | 17.6 | | | | 130,586 | | | | 17.6 | | | | 131,144 | | | | 17.4 | |
Electricity and Water Supply | | | 23,705 | | | | 3.2 | | | | 23,242 | | | | 3.2 | | | | 22,973 | | | | 3.1 | | | | 23,293 | | | | 3.1 | | | | 24,152 | | | | 3.2 | |
Finance & Insurance Services | | | 81,130 | | | | 11.1 | | | | 81,216 | | | | 11.1 | | | | 81,606 | | | | 11.1 | | | | 82,000 | | | | 11.0 | | | | 83,020 | | | | 11.0 | |
Producers of Government Services | | | 96,891 | | | | 13.3 | | | | 96,739 | | | | 13.2 | | | | 96,561 | | | | 13.1 | | | | 96,460 | | | | 13.0 | | | | 96,406 | | | | 12.8 | |
Hotels & Restaurants | | | 40,322 | | | | 5.5 | | | | 40,787 | | | | 5.6 | | | | 42,005 | | | | 5.7 | | | | 42,821 | | | | 5.8 | | | | 43,713 | | | | 5.8 | |
Real Estate, Renting & Business Activities | | | 78,950 | | | | 10.8 | | | | 79,291 | | | | 10.8 | | | | 79,680 | | | | 10.8 | | | | 80,097 | | | | 10.8 | | | | 80,426 | | | | 10.7 | |
Transport, Storage & Communication | | | 80,393 | | | | 11.0 | | | | 80,743 | | | | 11.0 | | | | 81,379 | | | | 11.1 | | | | 82,187 | | | | 11.1 | | | | 82,621 | | | | 11.0 | |
Other Services | | | 50,482 | | | | 6.9 | | | | 50,603 | | | | 6.9 | | | | 51,301 | | | | 7.0 | | | | 51,948 | | | | 7.0 | | | | 52,228 | | | | 6.9 | |
Total Services | | | 581,432 | | | | 79.5 | | | | 582,023 | | | | 79.5 | | | | 585,345 | | | | 79.5 | | | | 589,392 | | | | 79.3 | | | | 593,710 | | | | 78.8 | |
Less: Financial Intermediation Services Indirectly Measured (FISIM) | | | 29,812 | | | | 4.1 | | | | 29,647 | | | | 4.0 | | | | 29,373 | | | | 4.0 | | | | 29,469 | | | | 4.0 | | | | 30,140 | | | | 4.0 | |
Real GDP at Basic Prices | | | 731,038 | | | | 100.0 | | | | 732,544 | | | | 100.0 | | | | 736,405 | | | | 100.0 | | | | 743,289 | | | | 100.0 | | | | 753,346 | | | | 100.0 | |
| (1) | Data for 2016 are preliminary. |
Source: Statistical Institute of Jamaica.
D-22
The following table shows the rate of growth of real GDP by economic sectors at constant 2007 prices for the five years ended December 31, 2016:
Rate of Growth of Real GDP by Sector
| | | | | | | | | | | | | | | | | | | | |
| | | 2012 | | | 2013 | | | 2014 | | | 2015 | | | 2016(1) | |
| | | (%) | |
Agriculture, Forestry and Fishing: | | | 2.3 | | | | (0.7 | ) | | | (0.5 | ) | | | (0.1 | ) | | | 13.5 | |
Traditional Export Agriculture | | | 2.0 | | | | (16.1 | ) | | | 30.3 | | | | 1.8 | | | | n.a. | |
Other Agricultural Crops and Post-Harvest Crop Activities | | | 4.9 | | | | 2.5 | | | | (7.4 | ) | | | (1.5 | ) | | | n.a. | |
Animal Farming, Forestry and Fishing | | | (5.8 | ) | | | 0.0 | | | | 4.6 | | | | 3.3 | | | | n.a. | |
Construction | | | (4.4 | ) | | | 1.9 | | | | 1.7 | | | | 1.1 | | | | 0.4 | |
Manufacture | | | (0.3 | ) | | | (0.5 | ) | | | (0.8 | ) | | | 3.6 | | | | 0.2 | |
Mining and Quarrying: | | | (8.7 | ) | | | 2.7 | | | | 0.9 | | | | 1.0 | | | | (3.2 | ) |
Bauxite and Alumina | | | (9.6 | ) | | | 4.0 | | | | 0.5 | | | | 0.5 | | | | n.a. | |
Quarrying incl. Gypsum | | | 4.3 | | | | (14.2 | ) | | | 7.5 | | | | 8.2 | | | | n.a. | |
| | | | | | | | | | | | | | | | | | | | |
Total Goods | | | (1.6 | ) | | | 0.4 | | | | 0.1 | | | | 1.6 | | | | 3.5 | |
| | | | | | | | | | | | | | | | | | | | |
Wholesale & Retail Trade; Repairs and Installation of Machinery | | | (1.4 | ) | | | (0.1 | ) | | | 0.3 | | | | 0.6 | | | | 0.4 | |
Electricity and Water Supply | | | (2.2 | ) | | | (2.0 | ) | | | (1.2 | ) | | | 1.4 | | | | 3.7 | |
Finance & Insurance Services | | | (0.1 | ) | | | 0.1 | | | | 0.5 | | | | 0.5 | | | | 1.2 | |
Producers of Government Services | | | (0.2 | ) | | | (0.2 | ) | | | (0.2 | ) | | | (0.1 | ) | | | (0.1 | ) |
Hotels & Restaurants | | | 1.8 | | | | 1.2 | | | | 3.0 | | | | 1.9 | | | | 2.1 | |
Real Estate, Renting & Business Activities | | | (0.2 | ) | | | 0.4 | | | | 0.5 | | | | 0.5 | | | | 0.4 | |
Transport, Storage & Communication | | | (0.1 | ) | | | 0.4 | | | | 0.8 | | | | 1.0 | | | | 0.5 | |
Other Services | | | 1.2 | | | | 0.2 | | | | 1.4 | | | | 1.3 | | | | 0.5 | |
| | | | | | | | | | | | | | | | | | | | |
Total Services | | | (0.3 | ) | | | 0.1 | | | | 0.6 | | | | 0.7 | | | | 0.7 | |
| | | | | | | | | | | | | | | | | | | | |
Less: Financial Intermediation Services Indirectly Measured (FISIM) | | | (2.6 | ) | | | (0.6 | ) | | | (0.9 | ) | | | 0.3 | | | | 2.3 | |
| | | | | | | | | | | | | | | | | | | | |
Real GDP at Basic Prices | | | (0.5 | ) | | | 0.2 | | | | 0.5 | | | | 0.9 | | | | 1.4 | |
| | | | | | | | | | | | | | | | | | | | |
| (1) | Data for 2016 are preliminary. |
Source: Statistical Institute of Jamaica.
The Petrocaribe Agreement
On August 23, 2005, Jamaica entered into the Petrocaribe Energy Cooperation Agreement (the “Petrocaribe Agreement”), with the government of the Bolivarian Republic of Venezuela, effective as at June 29, 2005. Under the agreement, Venezuela agreed to make available to Jamaica a portion of the value of Jamaica’s purchases of oil as a concessionary loan facility. The terms of the Petrocaribe Agreement limit the concessionary flows to the purchase of a maximum of 23,500 barrels per day (23,500 Bbl/day) of crude oil, refined products and liquefied petroleum gas (LPG) or its energy equivalents, supplied directly to Jamaica for its internal consumption. Prices for products are based on prevailing rates in the international oil market and deliveries to Jamaica are subject to the commercial policies and practices of Petroleos de Venezuela S.A. (“PDVSA”). Jamaica has the option of providing alternative forms of payments through goods and services. The Petrocaribe Agreement may be modified or terminated by Venezuela upon 30 days’ written notice to Jamaica.
D-23
In 2006, the Jamaican Parliament authorized the establishment of the Petrocaribe Development Fund to undertake the following activities in relation to the Petrocaribe Agreement:
| | • | | manage loan proceeds that flow to Jamaica; |
| | • | | provide financing for approved projects, social developments and receive loan repayments from borrowers; and |
| | • | | meet debt service obligations to Venezuela arising from the Petrocaribe Agreement. |
As of December 31, 2016, the loan proceeds to the Petrocaribe Development Fund totaled US$3,270 million and on March 31, 2017, the loan proceeds totaled US$3,274 million.
Revitalization of Downtown Kingston
The Urban Development Corporation of Jamaica (“UDC”) has prepared the Downtown Kingston and Port Royal Redevelopment Plan 2012 (“Redevelopment Plan”). Recommendations emanating from the Redevelopment Plan have been incorporated in the National Environment and Planning Agency’s (“NEPA”) Development Order for Kingston and St. Andrew. The Development Order is the primary instrument used by the Kingston and St. Andrew Municipal Corporation (“KSAMC”) to control development.
The UDC is spearheading a multi-agency approach towards the development and rejuvenation of areas in Downtown Kingston and Port Royal by arresting physical and social blight within the development area, with the purpose of improving economic and social conditions within the plan area and beyond.
Some projects outlined in the redevelopment plan have been implemented, or will be implemented within the 2017/18 financial year. These include the Food Bazaar, which is phase 1 of the larger Festival Market Place project; Jubilee Market; Red Rose Fish Market and the Old Naval Hospital. These projects are described below.
UDC Projects
Festival Market Place
The construction of the food bazaar, which was the first phase of the Festival Market Place project, is now complete. The bazaar combines the elements of entertainment, cuisine and other commercial activities along the waterfront. The development includes five structures along the waterfront with soft and hard landscaping, making available ten commercial spaces for rental.
Complementing the food bazaar, will be the Waterfront Landscaping Project, which is aimed at: 1) improving the landscape along Ocean Boulevard; 2) improving on the existing open green space; and 3) introducing new elements of recreational activities. These improvements will aid in the reshaping of the image of the waterfront and further enhance the experience for new and existing patrons to the area.
Concept development for the remainder of the Festival Market Place is being revisited to ensure that the UDC creates a major economic center with some of its last remaining land holdings along the waterfront. As such, the development concepts are being reviewed to ensure that the optimal potential is being created from these land assets.
Jubilee Market
Jubilee Market (Solas Market) was gutted by fire in 2009. The UDC, with funds from the Petro Caribe Development Fund, embarked on the reconstruction of this historic market. Two of the three phases of reconstruction have been completed, which included (1) the demolition of the ‘gutted’ structure and (2) the construction of the brick perimeter wall. The third phase, which began in April 2017, will include the full reconstruction of a metal framed structure, under which market activities will resume, with supporting public sanitary conveniences and administrative space. This phase will be completed in the third quarter of FY 2017/18.
D-24
Red Rose Fish Market
Work commenced on the construction of a new facility for fish vendors in the market district during February 2017. The work will include the construction of a new roof, new vending stall areas, fish storage compartments and repairs to fencing with supporting public sanitary conveniences. This work should be completed in the third quarter of the FY 2017/18.
Multi-story Developments
This project, which is currently in the proposal stage, contemplates the construction of a multi-story office building, apartments and a parking garage. These developments would cover three sites owned by UDC along Harbour, West and Port Royal Streets. Despite the early stage of this potential project, the UDC has obtained favorable responses to planning enquiries from the main government regulatory agencies. Currently, a market research study is being undertaken to inform the developments. The research work commenced in April 2017.
Major Agency Projects
While the UDC leads development within its plan area, as stated above, it also facilitates public and private sector developments through divestment of land or property and/or the provision of professional services. Major agency projects falling within this category are as follows:
Parliament Square
In support of the Government’s efforts to construct a new Parliament building, as well as relocate government offices to downtown Kingston and to areas surrounding the National Heroes Circle, the UDC will provide project management and technical advisory services. Collaboration with China Construction of America and local technical professionals has begun.
Ministry of Foreign Affairs and Foreign Trade Building
Construction of The Ministry of Foreign Affairs and Foreign Trade Head Office, on lands divested to the Ministry by the UDC, has commenced. The foundation work for the main building is scheduled for completion during April 2017. UDC is providing project management services for the project.
Old Naval Hospital
The UDC, through partnership with its stakeholders (the Jamaica National Heritage Trust and the Tourism Enhancement Fund), restored the roof of the Old Naval Hospital, which is the focal point of the Port Royal Museum and Historic Walkway project. Other phases to commence include the refurbishing of rooms on the upper floor of the Old Naval Hospital building, as well as general renovation to the Old Naval Hospital Yard and annexed buildings. This project is aimed at developing an experiential museum and documenting Port Royal’s extraordinary history. Timelines for this project will be determined once funding agreements are in place.
United Nations House and Security Upgrade
The United Nations (“UN”) expressed intentions to occupy the International Seabed Authority (building B), lot 12 Port Royal Street, shared by the Jamaica Conference Centre (“JCC”), in the short-term. The security profile of the immediate surroundings (Kingston Waterfront), as well as the wider downtown Kingston business community is a shared concern and a critical matter for attention.
The UDC, in conjunction with the Ministry of Foreign Affairs and Foreign Trade and the Planning Institute of Jamaica (“PIOJ”), through the Downtown Kingston and Port Royal Implementation Security Committee, is collaborating with the UN and other key stakeholders to facilitate the requirements necessary for relocation, as well as addressing the identified shared-security concerns.
D-25
Currently, activities are focused on Stakeholder engagement and coordination. A draft MOU has been circulated for review and updates, and will be influenced heavily by the GOJ Technology Framework Policy document. The MNS is being engaged for the realization of this project.
Private Sector Led Developments
The following developments, which are enabled by certain tax incentives to encourage investment, are being implemented:
| | • | | Grace Kennedy Limited: Construction of a new office complex and multi-story car park on lands divested to the entity by the UDC is currently underway. |
| | • | | Oceana Hotel: This hotel is being renovated and will provide commercial, hotel and residential services when completed. Completion is estimated for May 2017. |
| | • | | Victoria Pier: Work on the restoration of this building as a restaurant is currently in-progress and is being carried out by the lessee of the building. |
Energy Development Projects
Jamaica Public Service
Jamaica Public Service has opened its new 190MW power plant at a cost of US$330 million (J$42.57 billion), most of which was raised domestically. The construction of the plant will create jobs for over 700 people within the skilled, semi-skilled, and laborer job levels. Furthermore, an additional new plant is to be constructed over a period of 27 months, The new plant will operate on natural gas, which will make it only the second natural gas power plant in Jamaica. The new plant will reduce Jamaica’s overall dependence on oil and provide cleaner energy for the nation.
Other Energy Projects
In addition to the projects by Jamaica Public Service, other energy development projects include:
| | • | | Wigton Windfarm Limited in Manchester - facility being expanded by 24MWs at a cost of about US$50 million. |
| | • | | Blue Mountain Renewables LLC in St. Elizabeth - establishing 34MWs of wind capacity valued at US$90 million. |
| | • | | Content in Clarendon installing the single largest solar farm in the English-speaking Caribbean - 20MWs, valued at US$60 million. |
Principal Sectors of the Economy
Tourism
The tourism industry is the leading gross earner of foreign exchange for Jamaica and makes a significant contribution to employment. Tourism accounted for 80.3% of gross foreign exchange earnings from the productive sector in 2016, excluding remittance inflows. In 2016, the accommodation sub-sector alone employed approximately 42,444 persons. Visitor arrivals in Jamaica have increased by 27.2% in the last decade, from 3,016,898 visitors in 2006 to 3,837,243 visitors in 2016. Total visitor accommodation has also grown during the last decade from 24,890 rooms in 2006 to 29,866 rooms in 2016.
During 2016, total visitor arrivals were 3,837,243, an increase of 3.9% from 3,691,744 in 2015. Stopover arrivals totaled 2,181,684 in 2016, an increase of 2.8% from 2,123,042 in 2015, mainly due to new and expanded
D-26
airlifts out of the United States, UK and Scandinavia, as well as visa relaxation for nationals in Latin America and China. Cruise passengers totaled 1,655,559 in 2016, an increase of 5.5% from 1,568,702 in 2015, mainly due to an increase in calls to the ports of Montego Bay and Ocho Rios.
For the first two months of 2017, total visitor arrivals were 771,019, an increase of 2.9% compared to the same period of 2016; stopover arrivals totaled 372,543, a 2.1% increase over the same period in 2016; and cruise passengers totaled 398,476, an increase of 3.7% compared to the same period in 2016.
In addition, Jamaica continued to secure adequate airlift out of major airport hubs allowing more visitors easy access to their destinations in Jamaica. Currently 34 airlines fly into Jamaica either through the airports in Kingston at Norman Manley International Airport or Sangster International Airport in Montego Bay.
The United States, Jamaica’s largest tourist market, accounted for 64.4% of total stopover visitors in 2016 and 63.3% in 2015. The percentage share of Jamaica’s stopover visitors from Europe increased to 9.5% in 2016 from 9.4% in 2015. Canada accounted for 17.1% of total stopover visitors in 2016, compared to 18.4% in 2015. Average hotel room occupancy was estimated at the same level as in 2015 of 69.0% as compared to 68.0% in 2014. Approximately 77.8% of hotel rooms in Jamaica were in the all-inclusive hotel category in 2016. In 2016, the average room occupancy rate of all-inclusive hotels was estimated at 76.0%.
For FY 2016/17 JAMPRO facilitated eight hotel projects, with five being completed and operational during this period. Currently, there are three other projects still undergoing construction and are expected to be completed in within the current fiscal year. The five hotels that were completed added approximately 1,507 new rooms, and those under-going construction represent an additional US$281.7 million in capital investment. These investments included newly constructed hotels and hotels that underwent major restructuring, rebranding and expansion. Hotels that opened in FY 2016/17 include:
| | • | | RIU Reggae, Montego Bay with capital investment of US$50.0 million; |
| | • | | Royalton White Blue Waters, Trelawny - new hotel with capital investment of US$45.5 million; |
| | • | | Breathless Resort, Montego Bay - new hotel with capital investment of US$38.0 million; |
| | • | | Zoetry Resort (formerly, Coyaba Resort) - new construction and re-branding at a cost of US$6.3 million; and |
| | • | | Royalton Negril Resort & Hideway at Royalton Negril - new hotels with capital investment of US$150 million. |
The period of 2017-2018 is estimated to have a total of eight hotels coming on-stream amounting to approximately US$512.7 million in projected capital investment and represent a total of 2,800 new rooms. These investments include newly constructed hotels and hotels that are undergoing major restructuring, rebranding and expansion. Hotels for this period include:
| | • | | Azul Seven Mile Beach, Negril - new hotel with a capital investment of US$20.7 million, estimated to open July 2017; |
| | • | | Grupo Excellence, Trelawny - new hotel with a capital investment of US$110 million; |
| | • | | Karisma Group, St. Ann - new hotels; this investment will be phased over 10 years with a capital investment of US$900 million; Phase1 will consist of 450 rooms with a capital investment of US$100 million; |
| | • | | Jewel Grande (formerly, Palmyra), Montego Bay - construction and re-branding (no US$ available); |
D-27
| | • | | Spanish Court Montego Bay (formerly, Breezes) - construction and re-branding at a cost of US$12.5 million; |
| | • | | R Hotel, Kingston - new hotel with a capital investment of US$7.5 million; |
| | • | | H10 Hotel Group, Montego Bay - new hotel development will consist of 3 phases; Phase 1 will consist of 470 rooms and capital investment of US$200 million; and |
| | • | | Wyndham Kingston, Kingston - construction and re-branding at a cost of US$62 million. |
Over the next five years, approximately nine hotels are projected to come on-stream, representing approximately 4,250 new rooms. Hotels over the next five years include:
| | • | | Karisma Group - 10 year hotel investment with 2,000 rooms to come on-stream in the next five years and an additional 2,000 rooms to come on-stream in the following five years; |
| | • | | H10 Group -investment of 1,250 rooms; |
| | • | | Moon Palace Resorts, Ocho Rios (acquired the former Rooms Hotel) - this expansion will consist of 700 new rooms with a capital investment of US$160 million; |
| | • | | Bahia Principe Resort, Oyster Bay St. Ann - expansion of 300 rooms; |
| | • | | Celebration Group, Montego Bay; and |
The following table shows the new or refurbished hotels that are scheduled to open by 2017.
Hotels Scheduled to Open By 2017
| | | | | | | | |
Hotel | | Type | | New Rooms | | Projected Capital Investment(1) | | Status |
Azul 7 Mile Beach | | New hotel | | 149 | | US$20.7 million | | Scheduled to open July 2017 |
Jewel Grande | | Construction & re-branding | | 300 | | Not available | | Scheduled to open Oct. 2017 |
Spanish Court Montego Bay | | Construction & re-branding | | 120 | | US$12.7 million | | Scheduled to open Dec. 2017 |
R Hotel | | New hotel | | 40 | | US$7.5 million | | Scheduled to open July 2017 |
| | | | | | | | |
TOTAL | | | | 609 | | US$40.9 million | | |
| (1) | Projections are based on the entire lifespan of the project, as opposed to year-to-date calculations. |
D-28
The following table shows the number of visitor arrivals for the first two month period ended February, 2016 and 2017:
| | | | | | | | | | | | |
| | | 2016 | | | 2017 | | | % Change
2017 vs. 2016 | |
Total Stopover Visitors | | | 364,831 | | | | 372,543 | | | | 2.1 | |
Cruise Passengers | | | 384,211 | | | | 398,476 | | | | 3.7 | |
| | | | | | | | | | | | |
Total Visitors | | | 749,042 | | | | 771,019 | | | | 2.9 | |
| | | | | | | | | | | | |
Average Length of Stay (nights) | | | 8.6 | | | | 8.6 | | | | 0.0 | |
Source: Jamaica Tourist Board.
The following table shows the number of visitor arrivals for the five years ended December 31, 2016:
Visitor Arrivals
| | | | | | | | | | | | | | | | | | | | | | | | |
| | | 2012 | | | 2013 | | | 2014 | | | 2015 | | | 2016 | | | % Change
2016 vs. 2015 | |
Foreign Nationals | | | 1,832,329 | | | | 1,860,935 | | | | 1,929,454 | | | | 1,973,217 | | | | 2,020,381 | | | | 2.4 | |
Non-resident Jamaicans | | | 153,756 | | | | 147,474 | | | | 150,727 | | | | 149,823 | | | | 161,303 | | | | 7.7 | |
| | | | | | | | | | | | | | | | | | | | | | | | |
Total Stopover Visitors | | | 1,986,085 | | | | 2,008,409 | | | | 2,080,181 | | | | 2,123,042 | | | | 2,181,684 | | | | 2.8 | |
Cruise Passengers | | | 1,320,083 | | | | 1,265,264 | | | | 1,423,797 | | | | 1,568,702 | | | | 1,655,559 | | | | 5.5 | |
| | | | | | | | | | | | | | | | | | | | | | | | |
Total Visitors | | | 3,306,168 | | | | 3,273,677 | | | | 3,503,978 | | | | 3,691,744 | | | | 3,837,243 | | | | 3.9 | |
| | | | | | | | | | | | | | | | | | | | | | | | |
Average Length of Stay (nights) | | | 8.8 | | | | 8.7 | | | | 8.7 | | | | 8.8 | | | | 8.8 | | | | 0.0 | |
Source: Jamaica Tourist Board.
The following table shows the number of stopover visitors by country of origin for the five years ended December 31, 2016:
Stopover Visitors by Country of Origin
| | | | | | | | | | | | | | | | | | | | | | | | |
| | | 2012 | | | 2013 | | | 2014 | | | 2015 | | | 2016 | | | % Change
2016 vs. 2015 | |
United States | | | 1,257,669 | | | | 1,271,262 | | | | 1,296,457 | | | | 1,344,149 | | | | 1,406,058 | | | | 4.6 | |
United Kingdom and Ireland | | | 147,302 | | | | 153,228 | | | | 17,433 | | | | 201,364 | | | | 210,103 | | | | 4.3 | |
Other European | | | 75,126 | | | | 82,583 | | | | 81,648 | | | | 77,968 | | | | 84,606 | | | | 8.5 | |
Canada | | | 403,200 | | | | 399,331 | | | | 419,898 | | | | 391,409 | | | | 372,137 | | | | (4.9 | ) |
Caribbean | | | 64,984 | | | | 58,249 | | | | 59,057 | | | | 62,612 | | | | 65,592 | | | | 4.8 | |
Latin America | | | 25,037 | | | | 30,538 | | | | 29,263 | | | | 29,387 | | | | 27,726 | | | | (5.7 | ) |
Japan | | | 2,092 | | | | 2,177 | | | | 2,022 | | | | 2,163 | | | | 1,841 | | | | (14.9 | ) |
Other | | | 10,675 | | | | 11,041 | | | | 12,403 | | | | 13,990 | | | | 13,621 | | | | (2.6 | ) |
| | | | | | | | | | | | | | | | | | | | | | | | |
Total | | | 1,986,085 | | | | 2,008,409 | | | | 2,080,181 | | | | 2,123,042 | | | | 2,181,684 | | | | 2.8 | |
| | | | | | | | | | | | | | | | | | | | | | | | |
Source: Jamaica Tourist Board.
D-29
The following table shows the percentage hotel room occupancy for the five years ended December 31, 2015:
Hotel Room Occupancy
| | | | | | | | | | | | | | | | | | | | |
| | | 2011 | | | 2012 | | | 2013 | | | 2014 | | | 2015 | |
| | | (%) | |
Kingston and St. Andrew | | | 45.2 | | | | 49.8 | | | | 57.5 | | | | 57.1 | | | | 62.3 | |
Montego Bay | | | 63.2 | | | | 63.7 | | | | 70.9 | | | | 72.3 | | | | 73.0 | |
Ocho Rios | | | 63.9 | | | | 66.2 | | | | 70.9 | | | | 71.5 | | | | 69.0 | |
Port Antonio | | | 14.1 | | | | 10.1 | | | | 9.7 | | | | 15.4 | | | | 18.0 | |
Mandeville | | | 58.7 | | | | 55.2 | | | | 65.3 | | | | 60.0 | | | | 58.8 | |
Negril | | | 58.5 | | | | 61.3 | | | | 64.5 | | | | 63.5 | | | | 66.8 | |
| | | | | | | | | | | | | | | | | | | | |
Total | | | 60.5 | | | | 62.3 | | | | 67.9 | | | | 68.0 | | | | 69.0 | |
| | | | | | | | | | | | | | | | | | | | |
Source: Jamaica Tourist Board.
The following table shows estimated visitor expenditure for the five years ended December 31, 2016:
Estimated Visitor Expenditure
| | | | | | | | | | | | | | | | |
| | | Stopover
US$ per
person
per day | | | Cruise
US$ per
passenger
per day | | | Total Visitor
Expenditure
US$ Million | | | Visitor
Expenditure
% Change From
Prior Year | |
2012 | | | 117.2 | | | | 75.7 | | | | 2,069.6 | | | | 3.0 | |
2013 | | | 120.1 | | | | 79.3 | | | | 2,112.7 | | | | 2.1 | |
2014 | | | 121.3 | | | | 82.1 | | | | 2,244.4 | | | | 5.8 | |
2015 | | | 126.5 | | | | 87.4 | | | | 2,402.3 | | | | 7.0 | |
2016(1) | | | 130.1 | | | | 88.7 | | | | 2,538.9 | | | | 5.7 | |
Source: Jamaica Tourist Board.
In 2016, the total visitor expenditure (provisional estimate) increased by 5.7% to US$2,538.9 million from US$2,402.3 million in 2015. This increase was primarily attributable to the continued improvement in the average daily rate charged by hotels and the increased expenditures by cruise ship passengers on attractions. The average expenditure per person per night increased to US$130.1 in 2016 from US$126.5 in 2015.
Other Tourism Initiatives
Potential future negative economic and other conditions in the United States and other countries may have an adverse effect on Jamaican tourism. Other factors that may affect the tourist industry include the availability of direct flights to and from the country, potential visitors’ perceptions of Jamaica’s crime rate, travel advisories issued by foreign authorities and developments in other competing touristic destinations, including Mexico, the Dominican Republic, Florida, Cuba and other Caribbean destinations.
On December 2004, the Tourism Enhancement Act, 2004 was passed. This act, as amended on August 2011, provides for a Tourism Enhancement Fee (“TEF”) of US$20.00 and US$2.00 to be paid by incoming airlines and cruise ship passengers, respectively. Funds from the TEF are to be placed in a dedicated fund to be used for implementing the recommendations emanating from the master plan.
The Tourism Enhancement Fund has partnered with the EXIM Bank to enable Small and Micro Tourism Enterprises to access up to $25 million dollars at 5% interest over 5 years.
D-30
The tourism industry’s commitment to sound environmental practices was evidenced in 1998 by the selection of Jamaica as the pilot destination for the launch of the Green Globe Hotel Certification Program. The project was executed by the Environmental Audits for Sustainable Tourism initiative funded through the United States Agency for International Development, in collaboration with the Jamaica Hotels and Tourist Association. Through this program, environmental audits were conducted for twenty hotels and one tourism attraction. Four Jamaican hotels became the first four in the world to attain Green Globe Certification.
Several tourism entities have implemented environment management systems (EMS) and approximately six entities have been certified as Green Global in Jamaica. Many of such Green Globe certified companies are part of the Sandals Resorts and SuperClubs chains. An effective environmental management system improves operational efficiency and cuts waste. It not only improves the organization’s environmental performance, but also saves money. Participating entities often reduce operating costs, which has led to increased profitability. Programs such as the Green Globe certification are a useful way for companies to effectively demonstrate their corporate social responsibilities.
Infrastructure
Highway 2000
Since 2002, Jamaica has made significant progress on the Highway 2000 project, a joint public-private partnership project. This multi-lane motorway has connected the capital of Kingston in the southeast of Jamaica with the tourism centers of Montego Bay in the northwest and Ocho Rios in the center of northern Jamaica and covers approximately 144 miles (230 kilometers). The developers, through National Road Operating and Constructing Company Limited (“NROCC”), are authorized by the Minister of Transport and Mining via concession agreements of 35 and 50 years to levy, collect and retain tolls in connection with the project.
The project will be completed in two phases. Phase 1 and Phase 2A have been completed and Phase 2B, which is designed to extend the highway from Williamsfield to Montego Bay, has not yet been awarded to any developer.
Works on the North-South Link of Highway 2000 Project have been completed. Section 2, the Linstead to Moneague leg, was opened in August 2014, and Sections 1, the Caymanas to Linstead leg, and 3, the Moneague to Ocho Rios leg, were completed in March 2016.
Other Infrastructure
Other infrastructure work pursued during 2016 was related to the construction and rehabilitation of road infrastructure. Activities during the year were linked to bilateral funded projects, such as the following:
| | • | | Major Infrastructure Development Programme (Marcus Garvey Drive and Mandela Highway Improvement Project); |
| | • | | Organization of Petroleum Exporting Countries Fund for International Development II (“OFID II”) (May Pen to Chapelton project); |
| | • | | the Northern Jamaica Development Project; and |
| | • | | the Kuwait Fund Rehabilitation Project (Ferris to Mackfield in Westmoreland). |
Jamaica and the Export-Import Bank of China signed a Preferential Buyer Credit Loan Agreement for the sum of US$58.1 million on February 3, 2010. The loan’s purpose was to repair and secure the degraded shoreline of the Palisadoes Peninsula in Kingston and to protect the Kingston Harbor from potential storm surges.
The project commenced in September 2010 and was completed in December 2012. During the execution of the project, the implementation of an additional 4 kilometers of pipeline was requested and the Government decided to
D-31
implement the extra amount during the defects liability period; the pipeline installation was completed in November, 2013. Two major activities that were not part of the major works contract but are stipulated by the NEPA’s regulation are; the replanting of the mangroves and sand dune restoration and the construction of the boardwalk on the harbor side.
The project received cabinet approval and the contract was reviewed by the Ministry of Transport Works. The construction of the boardwalk on the harbor side was completed during FY 2013/14 and the remaining works were expected to commence during May 2014 and to have been completed in a period of approximately three months. As at March 31, 2015, the replanting of the mangroves and sand dune restoration did not commence. Delays in the project have been chiefly related to unconcluded procurement activities regarding the supply of materials and the dredging works.
Mangrove Rehabilitation
A contract was signed with the University of West Indies (“UWI”), in June 2014, to commence the replanting of mangroves; however, issues arose with respect to mobilization. The Ministry of Transport Works requested that UWI provide a mobilization bond.
In January 2015, an addendum to the contract with UWI providing for (1) a mobilization bond and (2) commencement of replanting prior to the end of FY 2014/15, and requiring that NEPA be notified of any activity outside the previously approved plan, was executed.
As at March 31, 2015, the addendum to the contract for the replanting of the mangroves was agreed upon between the UWI/ Ministry of Transport Works. The contract was subsequently mobilized and physical works commenced during April 2015 which included; cleaning up of the site locations and the replenishment of sand to these sites for the planting of the mangroves.
Nourishment sites were being developed to aid in the growing of an increased volume of mangroves needed for the replanting exercise.
The planting of mangroves commenced and was completed within three months during the first half of the 2015/16 fiscal year. Approximately six thousand mangrove seedlings were planted at two major sites along the harbor side of the peninsula, which have been secured and are under constant monitoring, which has a four year contract to ensure the sustainability of these mangroves and their sites.
Sand Dunes Restoration
The sand dunes restoration and planting of vegetation were slated to commence during May 2014. As of the date hereof, the sand dune restoration had not commenced due to implementation delays, as this activity is linked to the planned dredging of the harbor programmed by the Port Authority of Jamaica (“PAJ”), which is the proposed source of the sand to undertake the dune restoration works. The PAJ’s proposed timeframe to carry out this activity was August 2015. The progress of the project is at a standstill due to unconcluded negotiations with the PAJ. The PAJ has divested the Kingston Container Terminal (“KCT”) and alternative arrangements are being considered. Proposed discussions are to commence with the new owner’s (Terminal Link/CMA CGM Group) shortlisted contractor, who is to undertake the dredging, with a proposal to acquire sands for free/reduced costs and or pay for transportation only. Additionally, there are discussions with the Ministry of Economic Growth and Job Creation about the possibility of implementing this activity on a phased basis. However, as of the date hereof, no confirmation has yet been made on the way forward.
Other Transportation Infrastructure
Jamaica divested the Sangster International Airport in 2003 and upgrading work was completed in April 2009. In March 2012, Phase 1A of the Norman Manley International Airport improvement was completed, which included a new departure terminal; a new two-level pier, fitted with jet-loading bridges; upgrades to the arrivals terminal, car park and roadway; IT systems, operations, safety and security equipment upgrades and electrical distribution systems upgrades. Funding for these projects came from: the European Investment Bank and the Caribbean
D-32
Development Bank; governmental funding from the Petrocaribe Development Fund and the Airport Improvement Fund; and equity and subordinated debt through the Airports Authority of Jamaica (“AAJ”). Work under Phase 1B of the project was far advanced as of December 31, 2015, with the following works completed: chilled water system; expansion of cargo logistics center; and runway/taxiway edge repairs and drainage system.
The Government is seeking to identify a private operator for the Norman Manley International Airport to complete the modernization and expansion of the airport facilities. The private operator will be selected through an open, transparent and competitive international bidding process and no restriction has been placed on the ability of the current operator of the Sangster International Airport or its shareholders to participate in the process. The Request for Qualifications closed on May 1, 2017 and it is anticipated that the announcement of the prequalified bidders will be made by mid-June 2017.
In 2011, the construction of the Falmouth Cruise Ship Terminal (“FCST”) was completed. The FCST was constructed through a collaborative arrangement between the PAJ and Royal Caribbean Cruises Limited (“RCCL”). The commercial area was developed by RCCL on lands leased on a long term basis from the PAJ, and is operated by Falmouth Jamaica Land Company Limited (“FJLCL”), a subsidiary of RCCL. FJLCL, on the other hand, manages a number of shops and other commercial buildings on the leased area, integrating part of the FCST.
The FCST welcomed its first cruise vessel with over 3,000 passengers and more than 1,000 crew members in February 2011 and by the end of 2011 FCST had accommodated the highest number of cruise ship visitors of any of the four cruise ship piers in Jamaica. The FCST welcomed 707,883 passengers and 160 calls in calendar year 2016, bringing the total number of passengers arriving at FCST, since its first vessel call in March 2011, to 3,925,945 from a total of 937 calls, as of December 31, 2016. Financing for the project was secured through a government guaranteed loan of US$121.65 million, made available by HSBC plc, London and supported by the Eksport Kredit Fonden. See “Public Sector Indebtedness—External Debt.”
ODPEM National Disaster Work Program
For Jamaica, extreme weather conditions can have significant impacts on the social and economic conditions of the country. As a result, the Government of Jamaica has prioritized Hazard Risk Reduction and Adaptation to Climate Change as a key strategic priority to achieving economic growth and job creation, which is one of its strategic pillars to achieving Vision 2030. The Office of Disaster Preparedness and Emergency Management (“ODPEM”), a statutory body, is the local organization with responsibility for coordinating disaster and emergency activities towards protecting the Jamaican populace. With legislative support from the Disaster Risk Management Act of 2015 (the “NDRM Act”) and formerly the Disaster Preparedness and Emergency Management Act of June 1993, the ODPEM utilizes a collaborative multi-agency approach to create a culture of disaster preparedness. To operationalize the NDRM ACT, the National Disaster Risk Management Council has identified seven committees, up from the previous six sub-committees, of the previous National Disaster Committee. Over the next three years ODPEM will seek to operationalize the NDRM Act by rebranding the former sub-committees of the Disaster Preparedness and Emergency Management Act of 1993 through a series of public awareness campaigns to educate the Jamaican populace of the organization’s new mandate.
Based on its mandate, ODPEM has crafted its strategic plan around two main polices, the first being the Disaster Risk Management and Regulatory Framework, and the second being an institutional strengthening policy to enhance capacity. Around these two policies are nine program areas namely, National Readiness, Public Awareness and Education, Hazard Risk and Vulnerability, Project Development and Technical Cooperation, Response and Recovery Coordination, Building Disaster Resilient Community, Human Resource and Capability, Information, Communication and Technology and Internal Administrative Processes Programmes. These nine program areas will encompass all of the projects and initiatives within ODPEM.
A key feature of ODPEM will be to strengthen the current national emergency telecommunication network, in partnership with the government of Japan, through the Japan International Cooperation Agency. Through another strategic partnership with the Caribbean Disaster Emergency Management Agency, ODPEM will be rolling out a National Volunteer Project initially with one hundred and fifty trained volunteers across the island. Another strategic priority will be the rationalization of shelters across the island through a Shelter Management Project, which will include the annual or biannual inspection of shelters, the effective manning and operation of official shelters across
D-33
the island and a public awareness program of shelter operations, expectations and expected behavior. In addition, the program will include seeing to the welfare and rehabilitation of shelter occupants and the training and development of shelter managers.
Another strategic pillar is Jamaica’s response and recovery capability which ODPEM will seek to strengthen through the Building Disaster Resilient Community program. Natural disasters affect the country at both the level of the community and the infrastructure that connects communities and sectors, including road networks, and communications, among others. While communities cannot be responsible for national infrastructure and emergency response, as this is the purview of government, they can play either a proactive or passive role in reducing hazard related risks and emergency response. The public education programs/workshops will also seek to impart the importance of the public’s role in disaster reduction and preparedness. Through an inter-agency approach, ODPEM will seek to establish mechanisms that will enable the continuity of governance in the event of a catastrophic disaster to maintain the rule of law in the country. In order to accomplish these strategic priorities, ODPEM will be undertaking an organizational review to align its resources in an effort to carry out the mandate of the organization.
The Government is also committed to taking strategic measures for mitigation of the harmful impacts of drought. These measures include the installation, through a Climate Change Adaptation Programme, of twelve water harvesting systems throughout the island.
Mining and Quarrying
The mining and quarrying sector of the Jamaican economy, dominated by the bauxite and alumina industries, is the country’s largest merchandise export sector.
Total bauxite production decreased by 11.3% in 2016 to roughly 8.54 million tonnes when compared to 2015, when 9.63 million tonnes were produced. Meanwhile, there was a 24.1% decrease in crude bauxite exports from approximately 4.56 million tonnes in 2015 to approximately 3.46 million tonnes in 2016 due to a curtailment of shipments to Sherwin Alumina refinery in the United States after it closed operations in October 2016. Bauxite prices are negotiated based on demand and are referenced to price levels in other bauxite exporting countries.
In 2016, the world aluminum industry continued to experience a downturn in prices, with the annual average London Metal Exchange 3-month aluminium price falling 4.2% to US$1,610.52 per tonne and the annual average CRU Atlantic Basis Price falling 12.8% to US$250.16 per tonne. However, local alumina production in 2016 remained relatively flat at 1.87 million tonnes, and exports decreased by 5.3% to 1.83 million tonnes when compared with 2015.
Total gross earnings in the sector declined by 16.0% to US$546.1 million in 2016 from US$650.4 million in 2015. Earnings in 2016 from crude bauxite exports decreased by 26.8% to US$90.2 million compared with US$123.2 million in 2015, primarily due to the marginally weaker bauxite prices and reduction in exports to the US. Earnings in 2016 from alumina exports decreased by 13.5% to US$455.9 million in comparison to US$527.2 million in 2015.
In the first three months of 2017, alumina production in Jamaica was approximately 447,560 tonnes, which represents a decline of 6.1% from approximately 476,790 tonnes produced in the same period of 2016. Crude bauxite production totaled 662,300 tonnes in the first three months of 2017, representing a decrease of 39.8% compared to the 1.1 million tonnes produced in the same period of 2016. In the first three months of 2017, alumina exports declined by 4.3% to approximately 443,340 tonnes relative to the 463,250 tonnes exported in the first three months of 2016. Meanwhile, in the first three months of 2017, crude bauxite exports totaled approximately 678,660 tonnes, which translated to a decrease of 31.1% relative to the 985,420 million tonnes exported over the same period of 2016. Crude bauxite operations, particularly exports, have been challenged by the principal bauxite customer, Sherwin Alumina refinery, closing operations in October of 2016.
The global price of aluminum increased during the three-month period ended March 31, 2017, to an average of US$1,855.75 per tonne, which was 22.4% higher than the comparable period of 2016, when the price averaged US$1,515.63 per tonne. The increase in prices largely reflected tightening of market conditions in China, due to logistics bottlenecks and increases in the cost of production.
D-34
In the first three months of 2017, the CRU Atlantic Basis Price for alumina averaged US$334.99 per tonne, denoting a 56.6% increase from the US$213.87 per tonne registered over the same quarter of 2016. A general increase in aluminum consumption underpinned the upward trajectory of alumina prices.
Jamaica believes that it has mineable bauxite reserves sufficient to last approximately fifty years under current mining practices and market demand expectations. This estimate of reserves is based on a range of technological and economic factors, and is subject to revision from time to time. The cost of exploiting mineable reserves can vary significantly depending on such factors as the location and mineralogical character of the reserves and technological progress in the industry.
The mining and quarrying sector will require a significant amount of capital investment in the near future as it carries out plans to transform its energy base away from oil and into natural gas and coal in an effort to reduce overall costs and strengthen global competitiveness. Under Jamalco’s energy solution a preferred bidder was selected to develop and implement a coal fired solution at an estimated cost of US$500.0 million by the fourth quarter of 2018. Under the recent development in the United States, which permits the sale of natural gas to non NAFTA (North American Free Trade Agreement) countries, an opportunity arose to consider a natural gas solution. In this context, Jamalco and New Fortress have developed a proposal for a natural gas solution encompassing:
| | • | | financing, development, construction, ownership and operation of a natural gas-fired steam and electric generating facility utilizing turbines and heat recovery steam generators to be located adjacent to the Jamalco refinery facility in Clarendon, Jamaica, on a site provided by Jamalco. The objective is to supply to the Jamaica Public Service Grid approximately 94MW of power and to the power plant owned and operated by Jamalco, consisting of four heavy fuel oil fired boilers and three steam turbine generators (the “Jamalco Power Station”) approximately 300Kpph of Steam (900 psig/900 Deg F); and |
| | • | | jointly with Jamalco, installing in the Jamalco Power Station new dual fuel fired boilers with a capacity of approximately 400Kpph and re-engineering existing boilers and Jamalco’s calciners to become dual fuel. The targeted completion period is the fourth quarter of 2018. |
The Government of Jamaica, since December 1, 2014, wholly owns Clarendon Alumina Production (“CAP”), which holds a 45% undivided interest as a co-tenant in common in the assets of Jamalco, a joint venture with Noble Resources Ltd. (the “Noble Group”). Alcoa Inc. previously owned 55% of the Noble Group. The business of the joint venture consists of an integrated alumina production and export network comprised of bauxite mining operations, an alumina refinery, a power plant, a rail transport system and a port with docking and loading facilities.
On June 17, 2013, CAP and the Noble Group entered into an alumina sales agreement (“Alumina Sales Agreement”), pursuant to which CAP agreed to supply, sell and deliver not less than 3.38 and up to 6.08 million tonnes, of alumina to the Noble Group over a twelve-year period. In consideration for the alumina delivered pursuant to the Alumina Sales Agreement, the Noble Group and CAP entered into a prepayment facility agreement on June 17, 2013, pursuant to which the Noble Group made available a US$120,000,000 secured prepayment facility (“Prepayment Facility”) to CAP. A condition subsequent to this facility was the successful completion of a consent solicitation and an exchange offer of notes issued by CAP and guaranteed by Jamaica for notes issued by Jamaica. This exchange offer was completed successfully in September 2013. See “Public Sector Indebtedness—External Debt.” Additionally, the Noble Group has a security interest over CAP’s 45% interest in the Jamalco joint venture. All funds disbursed under the facility must be repaid in full by June 30, 2025. Until all funds disbursed under the Prepayment Facility are repaid, CAP grants the Noble Group an option to purchase at market value all or part of CAP’s interest in Jamalco, as well as the right to appoint a Noble Group representative to the executive committee of Jamalco. In October 2014, the Noble Group acquired a 55% undivided interest of Alcoa Inc. in Jamalco.
In 2016, the ownership structure of the industry had undergone two changes. First, in July 2016, UC Rusal sold its 100% stake in Alumina Partners of Jamaica (“Alpart”) to the Chinese state industrial group, Jiuquan Iron & Steel (Group) Co. Ltd. (“JISCO”) for US$299 million. Rehabilitation exercises are being undertaken at the refinery for it to be reopened by June 20. Alpart is Jamaica’s largest refinery and has the capacity to produce 1.65 million tonnes
D-35
of alumina per annum. Second, in October 2016, Noranda Aluminum Holding Corporation sold its 45% stake in Noranda Bauxite Limited to New Day Aluminum LLC, an affiliate of DADA Holdings LLC. The sale comes after Noranda Inc. had filed for Chapter 11 bankruptcy in February 2016.
Currently, the Government has significant ownership interest in Jamalco and Noranda Jamaica Bauxite Partners, alumina and bauxite producers respectively. See “—The Jamaican Economy— Legal Proceedings and Process.” The other significant alumina producers (Windalco-Ewarton, Windalco-Kirkvine and Alpart) are privately owned.
The following table shows the production, exports, prices and earnings of the bauxite and alumina sector for the five years ended December 31, 2016:
Bauxite and Alumina Sector
| | | | | | | | | | | | | | | | | | | | |
| | | 2012(1) | | | 2013 | | | 2014 | | | 2015 | | | 2016 | |
Bauxite | | | | | | | | | | | | | | | | | | | | |
Production (tonnes) | | | 9,289,040 | | | | 9,435,214 | | | | 9,676,697 | | | | 9,626,603 | | | | 8,540,131 | |
Exports (tonnes) | | | 4,759,647 | | | | 4,707,375 | | | | 4,812,541 | | | | 4,558,048 | | | | 3,455,402 | |
Prices (US$ per tonne)(2) | | | 27.62 | | | | 27.2 | | | | 28.88 | | | | 27.03 | | | | 26.08 | |
Gross Earnings (US$ in thousands)(3) | | | 131,440 | | | | 128,037 | | | | 124,548 | | | | 123,213 | | | | 90,117 | |
Alumina | | | | | | | | | | | | | | | | | | | | |
Production (tonnes) | | | 1,720,453 | | | | 1,854,910 | | | | 1,850,960 | | | | 1,864,543 | | | | 1,865,278 | |
Exports (tonnes) (1) | | | 1,753,505 | | | | 1,901,753 | | | | 1,823,485 | | | | 1,936,228 | | | | 1,833,890 | |
Prices (US$ per tonne)(2) | | | 292.88 | | | | 278.3 | | | | 300.39 | | | | 272.28 | | | | 248.60 | |
Gross Earnings (US$ in thousands)(3) | | | 513,565 | | | | 529,254 | | | | 547,756 | | | | 527,206 | | | | 455,909 | |
Total Gross Earnings (US$ in thousands) | | | 645,005 | | | | 657,291 | | | | 672,305 | | | | 650,419 | | | | 546,073 | |
Source: Economics Division, JBI
| (1) | The term exports is equivalent to sales (Included in sales is hydrate). |
| (2) | Average price received. |
| (3) | For the calculation of the Gross Earnings line items in the table above, the unit price is multiplied by the volume of exports, be it bauxite or alumina. The resulting gross bauxite earnings and gross alumina earnings figures are then summed to give total gross earnings. |
Manufacturing
Real value added for the Manufacture sector grew by 0.2% in 2016 compared with 2015 and accounted for 8.5% of GDP. This performance was driven by the output from the Food, Beverages & Tobacco component as real value added for the Other Manufacturing sub-industry was estimated to have declined. Growth was supported by record levels of employment, continued low crude oil prices in the global market place and greater overall demand in 2016. Export earnings for the Manufacture industry were lower than the total in 2015. The reduced earnings were driven by the decline in Traditional Exports as Non-Traditional Exports increased.
The Ministry of Industry, Commerce, Agriculture and Fisheries, under the framework of the Vision 2030 Jamaica – National Development Plan and the Medium Term Socio-Economic Policy Framework (“MTF”) (2012–2015) & (2015–2018), implemented policies and programs for the Manufacture sector. Policies regarding the manufacturing sector were focused on the Micro, Small and Medium-sized Enterprise (“MSME”) as they represent a critical segment of the sector. These policies and programs were geared towards enhancing the business environment; providing institutional support and capacity building; and increasing competitiveness to facilitate higher production and exports. Through the affiliated agencies of the Ministry of Industry, Investment, & Commerce, work focused on training and development, particularly with respect to international standards; attracting investments; and the continued implementation of initiatives to expand and create new linkages between the Manufacture and the Tourism sectors.
Real GDP for the manufacturing sector grew by 0.2% in 2016, following an increase of 3.6% in 2015. The growth in real GDP in 2016 was due to higher output levels in the Food, Beverages & Tobacco, which grew by
D-36
1.1%. The increase in the Food, Beverages & Tobacco sub-industry was attributed mainly to higher production levels for Poultry Meat; Animal Feeds; Bakery Products; Beer & Stout and Carbonated Beverages. There was also higher output from fruits and vegetable processing. Other Manufacturing declined by 0.9% and this was primarily the result of lower output of the Petroleum Products sub-category.
Vision 2030 Jamaica, the country’s first long-term national development plan, covering the period 2009-2030 includes a policy framework for the manufacturing sector geared towards improving its performance and competitiveness. This framework focuses on transitioning to higher levels of productivity and value-added production using efficient and clean technologies and environmentally sustainable processes, with motivated productive employees. As part of an enabling business and regulatory environment, this framework will advance a manufacturing sector that embodies high levels of productivity and competes successfully in domestic and export markets.
The manufacturing sector has benefitted from various initiatives accomplished through the implementation of a series of MTFs, including Vision 2030 Jamaica. Some key achievements include:
| | • | | The passage of legislation to provide a more competitive regime for all sectors that allowed for duty free treatment of raw materials, intermediate, consumables and capital goods; allowances for capital investment; and introduction of employment tax credits; and |
| | • | | Delivery of training and development courses to the sector including: Good Manufacturing Practices; Hazard Analysis & Critical Control Points in general awareness and audit; Elements of Food Safety; and International Standards in several areas. |
Agriculture, Forestry and Fishing
Real GDP for the agriculture, forestry and fishing sector grew by 13.5% and this sector accounted for 7.3% of GDP in 2016. The overall improvement in the industry in 2016 was primarily due to more favorable weather conditions experienced across the country. During 2016, the Government employed a number of strategies to foster growth in the industry. These included Government programs that offered farmers support in the areas of marketing, irrigation and extension services, aimed at improving efficiency in the industry. This involved the expansion of the Agro Parks concept, which seeks to combine public and private partnership to develop productive and marketing infrastructure to improve productivity, quality and competitiveness.
The Agricultural Development Strategy, which began in 2006 and was aimed at transforming the agricultural sector by the year 2020 with the main focus being an increase in productivity, was subsumed under the Agriculture Sector Plan under Vision 2030 Jamaica. The Agriculture Sector Plan for Jamaica is one of the strategic priority areas of the Vision 2030 Jamaica—National Development Plan.
Since 1997, Jamaica has undertaken several initiatives to improve productivity and product quality while lowering production costs in the sugar and banana industries. In November 1997, Jamaica commenced a program to provide support to the local sugar industry following decades of financial losses in the industry. The critical points of the strategy are:
| | • | | promotion of a sustainable private-sector led sugar cane industry; |
| | • | | promotion of a diversified industry having as its major outputs raw sugar, molasses, ethanol and bagasse, a by-product used in the production of electricity; |
| | • | | strengthening of the economy and social infrastructure of sugar-dependent areas; and |
| | • | | divestment of the publicly owned sugar estates, which annually generate over 70% of sugar production. |
With respect to the banana industry, Jamaica participates in two externally supported projects that began in 1996: the United Kingdom/Northern Ireland/Jamaica Government project, aimed at reducing rejection due to peel
D-37
scarring, and an European Union project, aimed at improving the competitiveness of the banana industry. Effective January 1, 2006, the European Union adopted a new “tariff-only” regime for bananas from countries that enjoy most favored nation status. The new regime also retains a duty-free annual quota for bananas originating in the ACP so there has been no effect yet on Jamaica’s exports of bananas to the European Union. See “Jamaica—International Relationships—ACP/European Union Cotonou Partnership Agreement.” Companies in the banana industry in Jamaica are also making efforts to increase competitiveness by diversifying and improving productivity. New products developed include banana-based drinks, banana flour and cereal products. Efforts to improve productivity include eliminating redundant labor and reducing real labor costs through lower wage settlements. See “—The Jamaican Economy—Employment and Labor.”
The effects of Hurricane Dean which occurred in August 2007 are still affecting banana exports, since it destroyed approximately 85.0% of the then-existing crop, leading to a cessation of banana exports. Banana exports resumed in August 2008 but were again halted by Tropical Storm Gustav, which destroyed approximately 80.0% of the then-existing crop. Banana exports were further affected by damage caused by Hurricane Sandy in 2012. These weather-related shocks led Jamaica’s largest exporter (“Jamaica Producers”), which accounted for 80% of banana exports, to make the decision to cease exports from Jamaica. However, the demand for Jamaican banana in the UK and Diaspora remains strong. A production expansion program was therefore developed by the Ministry of Agriculture to satisfy the demand for both local and export markets.
The quantity of bananas produced in Jamaica was estimated at 58,702 tonnes in 2016 compared to 54,810 tonnes in 2015. In 2016, a total of approximately 371.6 tonnes of the fruit valued at US$358,000 was exported compared with approximately 288.1 tonnes valued at US$259,000 in 2015. The increase in exports may be attributed to the Ministry of Agriculture Banana Export Expansion Programme developed in 2014. This program seeks to facilitate greater production to meet the demands of the export markets. The program also seeks to create proper market linkages by engaging all stakeholders.
The Government divested the remaining three publicly owned sugar factories in 2010 and has continued the implementation of the Jamaica Country Strategy for the “Adaptation of the Sugar Industry: 2006-2020 (the Jamaica Country Strategy for the Adaptation of the Sugar Industry was adopted in 2006 and revised in 2009 (“Sugar Adaptation Strategy”). The key objective of this policy is the development of a sustainable private-sector led sugar cane industry and to strengthen economic diversification, social resilience and environmental sustainability within the sugar-dependent areas. In support of the implementation of the Sugar Adaptation Strategy, the European Union agreed to provide financial assistance in the amount of €146.6 million to the Government over the 2006 to 2013 period, under the Accompanying Measures for Sugar Protocol Countries. In 2009, the European Union disbursed €6.1 million to the Government and the amounts disbursed in 2010 and 2011 were €2.7 million and €6.9 million respectively. While there was no disbursement in 2012, disbursements in 2013 to 2015 totaled €58.3 million. In 2016, the European Union disbursed €6.5 million.
The Government is committed to partnering with the private sector for the establishment of nine Agro Parks to stabilize the agricultural supply chain, deepen inter-industry links, increase competitive import substitution and activate unutilized rural land and labor. The primary objective of this project, which began in 2012, is to facilitate the expansion of the productive capacity of the agricultural sector. This is to be achieved through the building of infrastructure to support investments in the production of selected crops directed towards import substitution and replacement as well as the provision of raw materials for agro-processing and non-traditional exports. The parks, funded in the amount of J$285 million, are to be complemented by improved inputs, including irrigation, transport infrastructure and technical services. A total of nine Agro Parks had been established at the end of 2014, with agricultural production of a wide range of domestic crops, including vegetables, condiments, fruits and tubers. They are located at Plantain Garden River, St. Thomas; Yallahs, St. Thomas; Amity Hall, St. Catherine; Hill Run, St. Catherine; Ebony Park, Clarendon, New Forest/Duff House; St. Elizabeth/Manchester; Meylersfield, Westmoreland; and Sweet River Multispecies Abattoir, Westmoreland.
Jamaica has implemented a rigid regulatory framework for the start of an industrial hemp and medical marijuana industry. To date, 27 conditional and 2 full licenses have been issued for growing, processing and retailing medical marijuana products, and the Cannabis Licensing Authority is processing numerous other applications.
D-38
The Government has provided 286 acres of land to Red Stripe to effect a 5% substitution of cassava in their local brew. The Government will be providing another 250 acres to increase substitution to 10%
The following table shows the production of selected agricultural products for the five years ended December 31, 2016:
Production of Selected Agriculture Products
| | | | | | | | | | | | | | | | | | | | |
| | | 2012 | | | 2013 | | | 2014 | | | 2015 | | | 2016 | |
| | | (in tonnes) | |
Sugar cane | | | 1,475,225 | | | | 1,402,564 | | | | 1,779,258 | | | | 1,572,400 | | | | 1,127,100 | |
Yams | | | 145,059 | | | | 138,834 | | | | 135,303 | | | | 136,732 | | | | 156,103 | |
Bananas | | | 47,473 | | | | 37,211 | | | | 51,581 | | | | 54,810 | | | | 58,702 | |
Potatoes | | | 57,561 | | | | 61,645 | | | | 58,988 | | | | 58,749 | | | | 65,013 | |
Citrus | | | 97,072 | | | | 83,758 | | | | 71,194 | | | | 74,336 | | | | 74,217 | |
Coffee | | | 6,687 | | | | 6,984 | | | | 5,298 | | | | 5,847 | | | | 7,580 | |
Cocoa | | | 1,393 | | | | 997 | | | | 1,154 | | | | 637 | | | | 726 | |
Source: Planning Institute of Jamaica.
Construction
Real GDP for the construction industry increased by 0.4% in 2016 as compared to 2015 and contributed 7.2% to GDP. This performance resulted from increased activities in the building construction sub-industry. The performance in building construction was influenced by the construction and renovation of hotels as well as residential housing starts. The Other Construction sub-industry, however, declined due mainly to contraction in civil engineering activities. Civil engineering reduced due to reduction in road work infrastructure associated with the North-South leg of Highway 2000.
Transportation, storage and communication
Real GDP for the Transport, Storage and Communication industry increased by 0.5% in 2016, primarily due to improved performances in transport, and post and telecommunications. The post and telecommunications sub-industry was positively impacted by growth in telephone and subscriber television services, and telecommunications continued to benefit from increased competition in the provision of data plans, broadband services, telephone and subscriber television services. There was a 4.1% increase in the number of passengers who travelled through both international airports, moving from 5,298,400 in 2015 to 5,516,510 in 2016. Producers of Government Services fell by 0.1%, primarily as a result of the continued effort by the Government to reduce expenditure under the Public Sector Reform (Transformation) program.
Privatization
Jamaica’s privatization program commenced in the early 1980s with the divestment of public services. Larger sales have included interests in the hotel sector, the National Commercial Bank, Telecommunications of Jamaica Limited, Air Jamaica Limited, Petrojam-Belize and the Caribbean Cement Company Limited. Jamaica has continued its program of privatization by divesting 80% of its interest in the power and energy company, Jamaica Public Service Company Limited, in 2001.
In connection with the privatization of Air Jamaica Limited in 1994, the Government retained ownership for its own account of 25.0% of the airline’s ordinary shares and ownership of an additional 5.0% of its ordinary shares, which the Government was contractually obligated to contribute to an employee share ownership plan. During the period of privatization, the Government provided US$169 million in loans and assistance to the airline. In December 2004, Jamaica purchased the remaining 75% of the ordinary shares for US$1.00 and converted approximately US$395 million, the total liabilities of Air Jamaica owed to the Government, into ordinary shares.
D-39
The Government entered into a contract for the management of the transshipment terminal of the Kingston seaport to APM Terminals and Amalgamated Stevedoring Co. Ltd., a consortium of foreign and local entities, in October 2001. The consortium assumed management of the terminal in February 2002. The contract expired in February 2009. The PAJ in April 2015, executed a concession agreement with Kingston Freeport Terminal Limited (“KFTL”), a special purpose vehicle formed to manage the Kingston Container Terminal (“KCT”). KFTL is jointly owned by members of the consortium, Terminal Link and CMA CGM Group with equity interests of 40% and 60%, respectively. The Agreement will give KFTL a 30-year concession term with the right to finance, expand, operate, maintain and transfer the facility at the end of the agreement. Financial closure for the transaction was achieved on June 30, 2016 and KFTL assumed operations of the port on July 1, 2016.
In FY 2007/08, the decision was made to re-privatize the national carrier Air Jamaica Limited. To this end, the Government sought a divestment that achieved certain strategic objectives. On May 1, 2010, the Government entered into an agreement with Caribbean Airlines pursuant to which Caribbean Airlines obtained the routes of Air Jamaica and agreed to provide sustainable airlift to Jamaica. In return the Government acquired a 16% equity interest in Caribbean Airlines valued at US$28.5 million. The Government remains the owner of the remaining assets and liabilities of Air Jamaica Limited. Under an agreement, Caribbean Airlines has leased some of these assets from Air Jamaica Limited. The Government continues to service the long term loans.
Jamaica re-privatized the government-owned assets of the sugar cane industry in August 2011. A “Sugar Cane Negotiating Team” was appointed to oversee the divestment process by the Ministry of Agriculture and Cabinet. In July 2009, the team concluded the divestment of three of the six sugar estates—St. Thomas/Duckenfield, Long Pond and Hampden—for an aggregate sale price (for the factories) of US$2.0 million. The associated sugar cane lands were divested through 50-year leases. In July 2010, the Government signed an agreement with Complant International Sugar Industry Co. Limited, a Chinese firm, for the sale of the Monymusk, Frome and Bernard Lodge sugar factories for US$9.0 million and the lease of associated farmlands of the Sugar Company of Jamaica Holdings. The lease rate for Complant International Sugar Industry Co. Limited is US$35/hectare/annum. Under the agreement, the firm is committed to invest approximately US$127.0 million, from 2011 to 2013, on modernizing the factories.
During FY 2010/11, Jamaica privatized lands at Montpelier, St. James, and land and buildings at Ariguanabo. In January 2010, the sale of 525 acres of the Montpelier Citrus Company Limited lands was approved by the Cabinet. The land was sold for J$52.0 million to Ramble Enterprises Limited, a local company engaged in dairy farming. In February and December 2010, a total of 24.2 acres of the Cotton Polyester Factory Complex were sold to the Urban Development Corporation for J$150.0 million.
In March 2010, the Cabinet approved the sale of 14 acres of land (with buildings) of the Ariguanabo property to the existing lessee, New Era Homes Limited for an aggregate sale price of J$163.9 million.
In December 2010, the Government finalized the sale of the National Hotel and Properties interest in the Jamaica Pegasus Hotel Limited. The shares were sold for US$11.0 million.
In October 2011, the Government finalized the sale of the assets of the Mavis Bank Coffee Factory to Jamaica Producers Group Limited and Pan Jamaican Investment Trust Limited for US$4.0 million.
The UDC completed the sale of its 50% stake in Bloody Bay Hotel Development Limited (“BBHDL”) to Village Resorts Limited (“VRL”) in 2013. The Cabinet approved the sale of the shares to VRL in January 2013, and UDC and VRL signed the agreement finalizing the sale on March 27, 2013. Aggregate proceeds from the sale were US$11.2 million, which included US$9.5 million for the real estate and related fixed assets and US$1.7 million representing UDC’s share of cash and other liquid assets of BBHDL at the time of the sale.
Following the decision to divest the Wallenford Coffee Company (“WCC”), the Cabinet decided on March 18, 2013, to approve the WCC Memorandum of Understanding (“WCC MOU”). The WCC MOU was executed by all parties as at August 29, 2013. The sale price was US$16.0 million and the purchaser assumed possession of WCC on September 11, 2013.
D-40
In May 2014, the Government, through the Jamaica Bauxite Mining Limited (“JBM”), executed a Debt Settlement & Asset Purchase Agreement with UC Rusal Alumina Jamaica Limited, owner of 93% interest in the West Indies Alumina Company (“Windalco”), for the sale of JBM’s 7% interest in Windalco for US$11.0 million.
In 2014, Oceana Hotel and Forum Hotel were sold for J$385.0 million and J$350.0 million, respectively.
In January 2015, the Government executed an agreement for the sale of the former Farm Machinery Centre property to RYCO Jamaica Ltd. for J$40.0 million.
In April 2016, the Government, through the Petroleum Corporation of Jamaica, executed an agreement for the sale of the Petroleum Company of Jamaica for US$19.0 million. The sale was completed in June 2016.
In July 2016, the Cabinet approved a 49 year lease, with an option to purchase at any time for market value, of approximately 1,610 acres of agricultural lands in Montpelier, St. James and Shettlewood, Hanover to Jamaica Green Botanical Producers Co. Limited. The lease provides for payment of J$6,500 per acre per annum, which is equivalent to J$10,465,000 per annum. The land is owned by the Montpelier Citrus Company Limited (“MCCL”). The MCCL and lessee executed the lease on October 7, 2016.
In October 2016, the Cabinet considered and approved the terms and conditions for the privatization of Caymans Track Limited’s operations to Supreme Ventures Limited, the preferred bidder. The definitive agreements were signed on February 10, 2017. Delivery of the property occurred on March 7, 2017 for payment of US$2.38 million. The contract has a provision for a minimum lease payment of US$305,000 per annum.
In March 2017, a Share Sale and Purchase Agreement was signed between Jamaican Teas Limited and the Accountant General for the Government’s shares in KIW International Limited. The Government’s shares in KIW comprised 6,800,000 (42%) of the 15,965,608 ordinary shares and all 14,000,000 Cumulative Preference Shares of the company. The purchase price was J$57.00 million.
A memorandum of understanding has been signed between the Government and Herzog on December 9, 2016 for the privatization of Jamaica Railway Corporation. Herzog is now engaged in due diligence activities. The memorandum of understanding is due to expire on June 9, 2017 with the enterprise team to evaluate Herzog’s updated business plan.
D-41
The following table shows a summary of certain major entities privatized and the proceeds received by Jamaica since 2000 in relinquishing its majority or residual interest:
Summary of Certain Major Jamaican Entities Privatized (By Sale) (1)(2)
| | | | | | | | | | | | | | | | |
Entity | | Year(s) of
Privatization | | | Type of Sale or
Transaction | | Payment
Received in
J$ Million | | | Payment
Received in
US$ Million | | | Sector |
Ashtrom Jamaica Limited | | | 2000 | | | Shares | | | 22.00 | | | | n.a. | | | Housing |
Jamaica Public Service Co. Ltd | | | 2001 | | | Shares | | | n.a. | | | | 201.00 | | | Energy |
Aqualapia Limited | | | 2002 | | | Shares | | | 32.35 | | | | n.a. | | | Agri-Business |
Sangster International Airport (2) | | | 2003 | | | Lease | | | n.a. | | | | 126.37 | | | Transportation |
Land – Ariguanabo (13.76 hectares) | | | 2003 | | | Sale | | | 23.48 | | | | n.a. | | | Housing |
Building (Lot 5A) – 60,000 square feet | | | 2003 | | | Lease | | | 7.68 | | | | n.a. | | | Warehousing |
Building (Lot 5B) – 60,000 square feet | | | 2003 | | | Lease | | | 7.68 | | | | n.a. | | | Manufacturing |
Cotton Polyester Textile Company Ltd. | | | 2004 | | | Lease | | | 7.55 | | | | n.a. | | | Manufacturing |
Land – Salt River (51 hectares) | | | 2005 | | | Sale | | | 6.93 | | | | n.a. | | | Tourism |
Farm Machinery Center | | | 2006 | | | Lease | | | n.a. | | | | 0.18 | | | Manufacturing |
Hampden & Long Pond Estate | | | 2009 | | | Sale/Lease | | | n.a. | | | | 2.69 | | | Agriculture |
Duckenfield Estate | | | 2009 | | | Sale/Lease | | | n.a. | | | | 1.27 | | | Agriculture |
Land – Montpelier Citrus Company Limited – 525 acres | | | 2010 | | | Sale | | | 52.00 | | | | n.a. | | | Agriculture |
Cotton Polyester Factory Complex | | | 2010 | | | Sale | | | 150.00 | | | | n.a. | | | Manufacturing |
Land and Buildings - Ariguanabo | | | 2010 | | | Lease/Sale | | | 163.90 | | | | n.a. | | | Manufacturing |
Jamaica Pegasus Hotel of Jamaica Limited(3) | | | 2010 | | | Sale | | | n.a. | | | | 11.0 | | | Tourism |
Bernard Lodge, Frome & Monymusk | | | 2010 | | | Sale/Lease | | | n.a. | | | | 14.07 | | | Agriculture |
Mavisbank Coffee Factory | | | 2011 | | | Sale of Assets | | | n.a. | | | | 4.0 | | | Agro-Processing |
Bloody Bay Hotel Development Limited (BBHDL) | | | 2013 | | | Sale | | | n.a. | | | | 11.2 | | | Tourism |
Wallenford Coffee Company Limited(4) | | | 2013 | | | Sale of Assets | | | n.a. | | | | 4.0 | | | Agriculture |
West Indies Alumina Company (Windalco) | | | 2014 | | | Shares | | | n.a. | | | | 11.0 | | | Mining |
Oceana Hotel | | | 2014 | | | Sale of Asset | | | 385.0 | | | | n.a. | | | Tourism |
Forum Hotel | | | 2014 | | | Sale of Asset | | | 350.0 | | | | n.a. | | | Residential |
Farm Machinery Centre Property | | | 2015 | | | Sale | | | 40 | | | | n.a. | | | Agri-business |
Kingston Container Terminal | | | 2016 | | | Long-term concession | | | n.a. | | | | 90 | | | PPP |
PETCOM | | | 2016 | | | Sale of Asset/Shares | | | n.a. | | | | 19 | | | Energy |
Caymanas Track Limited | | | 2017 | | | Long Term Lease | | | n.a. | | | | 2.38 | | | Entertainment |
KIW | | | 2017 | | | Sale of Shares | | | 57 | | | | n.a. | | | Manufacturing |
| (1) | Where payment is received in both JA dollars and US dollars for certain sales, the amounts listed are not equivalencies, but represent the portion of the payment received in each currency. This table does not include entities divested by FINSAC. In addition, the table does not reflect the privatization of Air Jamaica. For information about such privatization please refer to Section “—Privatization”. |
| (2) | Amounts shown in the table exclude initial payment (US$16.0 million; reimbursement for expenditure on capital works and US$1.0 million fixed assets transferred) and only captures concession fees. Effective April 2016, the fees became 1 Weight Load Unit = US$2.745. The concessionaire also makes payments on supernormal surpluses. |
| (3) | The sale of the Government’s 59.81% holding in the hotel was completed in December 2010. |
| (4) | Sale price for Wallenford Coffee Company is US$16.0 million, however remaining sale price of US$5.0 million provided via vendor’s mortgage and US$7.0 million via earn out arrangement. |
| (5) | The remaining J$20.0 million of the J$40.0 million sale price was granted as a vendor’s mortgage for seven years. |
| (6) | Payments for KCT to be received on financial close. |
Sources: Development Bank of Jamaica Limited, Urban Development Corporation, Sugar Company Jamaica Holding Limited and Airports Authority of Jamaica.
Significant Government-Owned Companies
The Government of Jamaica owns and controls certain companies and enterprises, some of the most significant of which include the National Housing Trust (“NHT”), the Trust, the AAJ, the PAJ, and the National Insurance Fund (“NIF”).
The Government of Jamaica established the NHT to lend money at low interest rates to contributors who intend to purchase, build, repair, or improve their homes. Furthermore, the NHT develops housing solutions for the sale of homes to contributors. The NHT also offers low-cost financing to private developers.
D-42
The Trust is an organization mandated to strengthen the workforce in Jamaica via the development, support, and maintenance of technical and vocational, education and training institutions within the country. The Trust is active in the development of vocational and technical skills training programs, career guidance, job placement, assessment and certifications, policy analysis, and technical assistance to institutions, among other functions and activities.
The Government of Jamaica established the AAJ in 1974 through the Airports Authority Act. The AAJ is an independent statutory body with the principal responsibility, through ownership and management, of Jamaica’s two international airports, the Norman Manley International Airport and the Sangster International Airport. As of 1990, the AAJ assumed additional responsibility for Jamaica’s four domestic aerodromes. The AAJ is involved in the long-term planning and development of the airport system within Jamaica.
The PAJ is a statutory corporation within Jamaica that the Government of Jamaica established through the Port Authority Act of 1972. The PAJ constitutes the principal maritime agency that has broad responsibility for both the development and the regulation of Jamaica’s port and shipping industries. Furthermore, the PAJ has the general mandate of, and responsibility for, ensuring the safety of all vessels that navigate through Jamaica’s ports of entry. The Port Authority also exercises general responsibility for regulating tariffs on goods that enter into and exit from Jamaica’s public ports.
The NIF was established under Section 39 of the National Insurance Act. It is responsible for managing the investment portfolio created from contributions to the National Insurance Scheme (“NIS”). NIF seeks to optimise returns and provide for the disbursement of pensions and other benefits pursuant to the NIS.
The following table provides the respective assets, revenue and expenses for the significant government-owned companies listed below as at March 31, 2017:
| | | | | | | | | | | | |
| | | Assets(1) | | | Revenue(1) | | | Expenses(1) | |
| | | (in millions of J$) | |
National Housing Trust | | | 254,345.00 | | | | 33,420.41 | | | | 8,680.41 | |
Heart Trust | | | 11,129.60 | | | | 11,409.13 | | | | 10,084.95 | |
Airports Authority of Jamaica | | | 28,218.19 | | | | 9,801.40 | | | | 6,459.70 | |
Port Authority of Jamaica | | | 56,857.78 | | | | 16,877.15 | | | | 11,828.16 | |
National Insurance Fund | | | 98,064.24 | | | | 30,974.67 | | | | 20,417.96 | |
Inflation
The macroeconomic stabilization program introduced in 1991, which has focused on lowering inflation through tight fiscal and monetary policies and stability in the foreign exchange market, has contributed to a consistent reduction in the rate of inflation. Macroeconomic stability continues to be a primary focus of Jamaica under its economic reform agenda, as Jamaica regards consistent low levels of inflation as the cornerstone of sustained long-term economic growth.
The Consumer Price Index (“CPI”) number series, which measures the rate of inflation, has 12 divisions that are based on the United Nations Statistical Division—Classification of Individual Consumption According to Purpose. The “basket” of consumer goods and services has approximately 500 items.
For year ended December 31, 2016, the All Jamaica ‘All Divisions’ CPI recorded an inflation rate of 1.7%, a 2 percentage points decrease from the 3.7% in 2015 and 4.7 percentage points decrease from 6.4% in 2014. The decrease in inflation in 2016, as compared to 2015 primarily resulted from the lower oil prices on the international market, which led to lower petrol and energy costs. Also contributing to the lower inflation rate, was lower prices for market produce during the first half of the year due to favorable weather conditions, which primarily impacted the movement for the ‘Food and Non-Alcoholic Beverages’ division.
D-43
The All Jamaica ‘All Divisions’ CPI for March 2017 was 238.7, indicating inflation of 0.4% compared to the February 2017 index of 237.8. The movement in the March 2017 index resulted in the calendar year-to-date inflation rate of 1.0 % and the FY 2016/17 inflation of 4.1%.
The following table shows the changes in the CPI for the five years ended December 31, 2016, and for the interim period of 2017:
| | | | |
Year/Period | | CPI Increase
Over Previous Year | |
| | | (%) | |
2012 | | | 8.0 | |
2013 | | | 9.5 | |
2014 | | | 6.4 | |
2015 | | | 3.7 | |
2016 | | | 1.7 | |
Jan – Mar 2017 | | | 1.0 | |
Source: Statistical Institute of Jamaica.
Employment and Labor
In 2016, the total labor force in Jamaica was 1,353,700 persons, a 2.8% increase compared to 1,316,600 persons in 2015. The service sector employed 76.3% of the employed labor force in 2016, while the goods-producing sector accounted for 23.7% of the employed labor force in the same period. The agriculture and manufacturing sub-sectors accounted for 16.7% and 6.6% of the employed labor force, respectively.
Average employment in 2016 was 1,175,200 compared to 1,138,700 in 2015. The average unemployment rate was 13.2% in 2016, a decrease from 13.5% in 2015.
The calendar year ending 2016 recorded 360 industrial disputes and one work stoppage compared to 518 industrial disputes and two work stoppages in 2015. This was as a result of difficulties experienced in the negotiation of new wage and fringe benefit packages in all sectors. There were 105 man hours lost for 2016 while 1,620 man hours were lost for 2015. This showed a significant decrease of 93.5% when compared to the 2015 period.
D-44
The following table shows certain labor force and employment data for the five years ended December 31, 2016:
Labor Force and Employment(1)
| | | | | | | | | | | | | | | | | | | | |
| | | 2012 | | | 2013 | | | 2014 | | | 2015 | | | 2016 | |
| | | (in thousands of persons, except percentages) | |
Total Population | | | 2,706.9 | | | | 2,713.9 | | | | 2,720.0 | | | | 2,725.2 | | | | 2,731.0 | |
Labor Force | | | 1,281.9 | | | | 1,308.5 | | | | 1,307.5 | | | | 1,316.6 | | | | 1,353.7 | |
Employed Labor Force | | | 1,103.4 | | | | 1,108.9 | | | | 1,127.8 | | | | 1,138.7 | | | | 1,175.2 | |
Unemployed Labor Force | | | 178.6 | | | | 199.6 | | | | 179.7 | | | | 177.9 | | | | 178.5 | |
Unemployment Rate (%) | | | 13.9 | | | | 15.2 | | | | 13.7 | | | | 13.5 | | | | 13.2 | |
Job-Seeking Rate (%) | | | 8.9 | | | | 9.8 | | | | 9.0 | | | | 9.1 | | | | 8.6 | |
Labor Force Participation Rate (%) | | | 61.9 | | | | 63.0 | | | | 62.8 | | | | 63.1 | | | | 64.8 | |
Male (%) | | | 69.2 | | | | 70.0 | | | | 70.0 | | | | 70.3 | | | | 71.2 | |
Female (%) | | | 54.7 | | | | 56.3 | | | | 55.9 | | | | 56.3 | | | | 58.6 | |
Age Breakdown | | | | | | | | | | | | | | | | | | | | |
14 – 19 Years | | | 10.7 | | | | 11.4 | | | | 10.4 | | | | 10.6 | | | | 12.3 | |
20 – 24 Years | | | 63.8 | | | | 65.2 | | | | 63.4 | | | | 64.7 | | | | 68.5 | |
25 – 34 Years | | | 81.4 | | | | 82.6 | | | | 83.2 | | | | 82.2 | | | | 84.4 | |
35 – 44 Years | | | 85.4 | | | | 87.1 | | | | 86.8 | | | | 86.7 | | | | 87.7 | |
45 – 54 Years | | | 84.1 | | | | 84.4 | | | | 84.0 | | | | 84.5 | | | | 86.3 | |
55 – 64 Years | | | 68.2 | | | | 68.9 | | | | 70.1 | | | | 71.9 | | | | 72.0 | |
65 Years and Over | | | 26.3 | | | | 27.5 | | | | 28.5 | | | | 29.3 | | | | 29.3 | |
| (1) | The data above represent the derived annual average, updated to reflect 2011 based population estimates. |
Source: Statistical Institute of Jamaica, Labour Force Survey.
Legal Proceedings and Processes
Legal Proceedings
There are no governmental, legal or arbitration proceedings (including any such proceedings which are pending or threatened of which the Government is aware) during the 12 months preceding the date of this document which may have or has had in the recent past significant effects on the financial position or profitability of the Government.
Legal Processes
In 2016, the Government is continuing its program to modernize the country’s law enforcement infrastructure, transforming the culture of the Jamaican Constabulary Force (“JCF”) into a modern policing service and restore public confidence. The road map, as articulated in “The Organizational Review of the Jamaica Constabulary Force: The transition to a modern police service in 2015,” details measures that have been implemented and/or are scheduled for roll out. These measures include:
| | • | | Actively targeting corruption within the JCF; |
| | • | | Improving the professionalism of police officers through intense leadership and management training and development; |
| | • | | Implementing a performance management system with targets and verifiable indicators for the executive leadership of the JCF; |
| | • | | Revising the JCF Use of Force policy with emphasis on ethical policing and protecting the rights of citizens; |
| | • | | Enhancing the use of technology for management and intelligence gathering; |
D-45
| | • | | Enacting a major program of legislative reform including restructuring the accountability framework of the JCF; and |
| | • | | Implementing community policing in all policing divisions. |
The Ministry of National Security’s crime prevention efforts are duly supported by the following international partners:
| | • | | The United States Agency of International Development – Community Empowerment and Transformation Project II strengthening local governance structures; |
| | • | | The European Union’s Poverty Reduction Program III/IV—supports community development through provision of basic physical infrastructure and social services in vulnerable and volatile communities; |
| | • | | The Justice Security Accountability and Transparency Project (“JSAT Project”) supporting capacity building of the law enforcement agencies and justice sector; |
| | • | | The United Kingdom Department for International Development (“DFID”) Rehabilitation and Reintegration of Local Offenders and Deported Persons Programme; and |
| | • | | The third phase of the Citizen Security and Justice Program funded by the Inter-American Development Bank (“IDB”), DFID and Global Affairs Canada, which is set to continue until 2019 in 50 vulnerable communities. |
Legislation
The law enforcement apparatus has been enhanced with the promulgation of critical pieces of legislation that will assist the police and prosecutors in their crime-fighting efforts. These include:
| | • | | The Law Reform (Fraudulent Transactions) (Special Provisions) Act enacted in 2013 to address the scourge of ‘lottery scamming.’ This legislation criminalizes such activities that facilitate lottery scamming, including: inviting a person to visit Jamaica under false pretenses; using an access device to transfer or transport money or monetary instrument; use of premises for acts which constitute an offense under this Act; offense of making, repairing or buying things for copying data from an access device, or forging or falsifying an access device. In accordance with Article 20 of this Act, the legislation will be reviewed in 2018. |
| | • | | The Criminal Justice (Suppression of Criminal Organizations) Act enacted in 2014 to target criminal gang leaders, members and facilitators. To date, 340 persons have been charged under this Act. In accordance with Article 20, this Act is to be reviewed in 2017. |
| | • | | The Finger Prints (Amendment) Bill. Amendments are being considered to allow for the taking of fingerprints from persons who are suspected of engaging in criminal activities. |
| | • | | The Noise Abatement (Amendment) Act, which will allow for the revision of mechanisms to give effect to coordinated granting of licenses for entertainment activities, as well as the establishment of entertainment zones. |
| | • | | The DNA (Evidence) Act, enacted for the keeping, maintenance and operation of a consolidated forensic DNA databank for the purposes of, inter alia, forensic investigation and human identification; providing for the regulation of the taking of bodily samples (other than finger prints) from persons and crime scenes; and the retention or destruction of samples and DNA profiles. Regulations for the DNA (Evidence) Act were gazetted on March 31, 2017. |
D-46
Crime Statistics
In reviewing the 2016 Jamaica National Crime Victimization Survey (“JNCVS”) respondents’ perceptions about crime and their feelings of fear and safety indicate that a large proportion of persons do not alter their behavior as a result of their fear of crime. This is consistent with their feelings that the danger of criminal victimization has declined in Jamaica. The level of fear has declined in Jamaica from the initial conduct of the 2006 JNCVS to the present. The declines were the strongest for using public transportation alone after dark, shopping alone after dark, going to a restaurant alone after dark, going to work or school at night and going out at night to a bar, night club, concert or stage show.
However, as reported by the JCF Statistics Unit, crime statistics for 2016 recorded an increase in incidences compared to the previous year. Serious crimes, which include murders and shootings, showed a 12.35% increase during the period from January 1 to December 31, 2016, with 2,566 cases in 2016 as compared to 2,284 cases in the same period in 2015. When compared to the corresponding period of 2015, crime statistics for the period from January 1 to December 31, 2016 revealed that the total number of murders increased by 11.75%, to 1,350 cases in comparison to 1,208 cases. Moreover, the number of reported cases of murder during the period January 1 to April 15, 2017 increased by 21.27% with 382 cases when compared to the corresponding period in 2016 with 315 cases.
D-47
THE EXTERNAL ECONOMY
Balance of Payments
Jamaica’s balance of payments is dependent on international economic developments as well as domestic economic policies and programs. For 2016, the current account deficit improved significantly by US$327.1 million to US$103.0 million or 0.7% of GDP as compared to a deficit of US$430.1 million, or 3.0% of GDP in 2015. This continues the trend of improvement in the current account since 2011. The improvement in the current account balance for 2016 resulted from improvements in all sub-accounts, with the exception of the income sub-account. In particular, the improvement in the current account reflected lower imports, largely due to the significant decline in international fuel prices, along with improvements in travel and remittances flows. The current account reflects the trade balance (balance on the goods), plus the balance on services, income and current transfers.
For the purpose of this section, exports include free-zone exports and goods procured in ports, while imports include free-zone imports and goods procured in ports. Imports are recorded at their market value at the customs frontier of the economy from which they are exported.
In 2016, the goods balance improved by 6.9% or US$220.8 million to US$2,973.7 million as compared to US$3,194.5 million in 2015, primarily due to a reduction in the value of imports, which was partly offset by a reduction in earnings from exports. The value of imports (f.o.b. or free on board) declined by 6.3% or US$280.9 million to US$4,168.5 million reflecting decreases in all major categories of imports especially, mineral fuel, miscellaneous commodities and manufactured goods imports of US$242.1 million, US$100.3 million and US$76.1 million, respectively. A partially offsetting impact to the overall reduction in imports was an increase of US$215.5 million in the importation of machinery and transport equipment. The value of merchandise exports declined by 4.8%, or US$60.0 million, to US$1,194.9 million, mainly due to the reduction in earnings of crude materials of US$106.0 million. This is related to decreased exports of Bauxite/Alumina for the year. This was partially offset by increased earnings from the exports of beverage and tobacco, machinery and transport goods as well as exports of miscellaneous manufactured goods of US$21.5 million, US$20.6 million and US$16.3 million, respectively.
For 2016, the surplus on the services sub-account increased by 17.1% to US$1,051.2 million from US$898.0 million in 2015. The increase in the surplus on services was primarily the result of an improvement in the balance on travel/tourism which was assisted by an improvement in other services. The improvement in the other services balance was mainly influenced by larger inflows from other business services, as well as reduced outflows of insurance and pension services.
The deficit on the income sub-account for 2016 was US$570.0 million, relative to the deficit of US$440.0 million for 2015. The greater deficit mainly reflected the impact of higher outflows by 17.6% or US$132.0 million. The outturn for 2016 was mainly a result of an increase in interest income outflows and profit repatriation by foreign direct investment (“FDI”) related companies.
In 2016, net current transfers increased by 3.6% to US$2,389.5 million from US$2,306.4 million in 2015, primarily due to increases in personal (private) transfers due to higher remittances, as well as greater transfers from official sources. Remittances for 2016 were US$2,291.5 million as compared to US$2,226.0 million in 2015.
The balance of payments results for 2016 were influenced by net capital inflows from official and private sources, which were sufficient to finance the current account deficit. FDI inflows, even though marginally lower than the flows for 2015, continued to be an important source of long term financing for the current account for Jamaica. See “—Foreign Direct Investment.” As a result, there was a build-up in the net international reserves for 2016 by US$282.4 million to US$2,719.4 million as at December 31, 2016.
D-48
The following table shows Jamaica’s balance of payments for the five years ended December 31, 2016:
Balance of Payments (f.o.b.)
| | | | | | | | | | | | | | | | | | | | |
| | | 2012 | | | 2013 | | | 2014 | | | 2015 | | | 2016(1) | |
| | | (in millions of US$) | |
Current Account | | | (1,440.2 | ) | | | (1,356.8 | ) | | | (1,114.4 | ) | | | (430.1 | ) | | | (103.0 | ) |
Goods Balance | | | (3,905.7 | ) | | | (3,877.7 | ) | | | (3,759.0 | ) | | | (3,194.5 | ) | | | (2973.7 | ) |
Exports(2) | | | 1,728.5 | | | | 1,580.5 | | | | 1,448.6 | | | | 1,254.9 | | | | 1194.9 | |
Imports(3) | | | 5,632.4 | | | | 5,458.2 | | | | 5,207.6 | | | | 4,449.4 | | | | 4168.4 | |
Services Balance | | | 578.3 | | | | 696.6 | | | | 707.5 | | | | 898.0 | | | | 1051.2 | |
Transportation | | | (726.2 | ) | | | (688.8 | ) | | | (696.0 | ) | | | (573.2 | ) | | | (571.5 | ) |
Travel | | | 1,885.3 | | | | 1,895.8 | | | | 2,057.3 | | | | 2,166.1 | | | | 2285.0 | |
Other Services | | | (580.9 | ) | | | (510.4 | ) | | | (653.8 | ) | | | (694.9 | ) | | | (662.4 | ) |
Goods and Services Balance | | | (3,327.4 | ) | | | (3,181.1 | ) | | | (3,051.5 | ) | | | (2,296.5 | ) | | | (1922.5 | ) |
Income | | | (199.6 | ) | | | (333.6 | ) | | | (298.4 | ) | | | (440.0 | ) | | | (570.0 | ) |
Compensation of Employees | | | 59.6 | | | | 50.0 | | | | 63.9 | | | | 80.9 | | | | 79.2 | |
Investment Income | | | (259.2 | ) | | | (383.6 | ) | | | (362.3 | ) | | | (520.8 | ) | | | (649.2 | ) |
Current Transfers | | | 2,086.8 | | | | 2,157.9 | | | | 2,235.6 | | | | 2,306.4 | | | | 2389.5 | |
General Government | | | 168.3 | | | | 196.6 | | | | 165.3 | | | | 165.5 | | | | 185.4 | |
Other Sectors | | | 1,918.5 | | | | 1,961.2 | | | | 2,070.2 | | | | 2,140.9 | | | | 2204.1 | |
Capital and Financial Account | | | 2066.0 | | | | 1,408.9 | | | | 727.9 | | | | 1157.4 | | | | 1128.2 | |
Capital Account | | | (26.2 | ) | | | (12.8 | ) | | | (27.6 | ) | | | 1,430.0 | | | | (10.8 | ) |
Official | | | 5.9 | | | | 18.9 | | | | 4.1 | | | | 13.1 | | | | 20.9 | |
Private | | | (32.1 | ) | | | (31.7 | ) | | | (31.7 | ) | | | 1416.9 | | | | (31.7 | ) |
Financial Account | | | 2092.3 | | | | 1,421.7 | | | | 755.5 | | | | (272.6 | ) | | | 1138.9 | |
Other Official Investment | | | 781.8 | | | | 516.6 | | | | 821.8 | | | | (1,202.2 | ) | | | (32.6 | ) |
Other Private Investments (including errors and omissions) | | | (192.0 | ) | | | 559.4 | | | | 946.3 | | | | 91.8 | | | | 71.4 | |
(Increase)/Decrease in reserves(4) | | | 840.5 | | | | 77.8 | | | | (953.3 | ) | | | (435.9 | ) | | | (282.4 | ) |
| (2) | Based on recommendations contained in the IMF’s Balance of Payments Manual, exported goods include free-zone exports and goods procured in ports. |
| (3) | Based on recommendations contained in the IMF’s Balance of Payments Manual, imported goods are recorded at their market value at the customs frontier of the economy from which they are exported and include free-zone imports and goods procured in ports. |
| (4) | Official International Reserves held by the Bank of Jamaica. |
Source: Bank of Jamaica.
Foreign Trade
Total merchandise trade (exports plus imports) between Jamaica and its foreign trade partners in 2016, decreased by 5.4% to US$5,946.1 million as compared to US$6,288.3 million in 2015. The merchandise trade deficit decreased by 5.9% in 2016, to approximately US$3,556.6 million, compared to US$3,778.7 million in 2015. The decrease in the trade deficit in 2016 was primarily a result of lower imports of minerals, fuels and food. The value of exports in 2016 decreased by 4.8% to US$1,194.8 million due primarily to lower earnings from mineral fuels, manufactured goods, beverages and tobacco, chemicals and food. Notably, the contraction in imports of fuels of U$242.1 million or 20.6% occurred in the context of a decline in the annual average price of crude oil during this period. Please note that these import values are values presented under “c.i.f.” standards, which include cost, insurance and freight costs and exports are presented at “f.o.b.” standards.
D-49
The following table shows the performance of merchandise trade for the five years ended December 31, 2016:
Merchandise Trade (c.i.f)
| | | | | | | | | | | | | | | | | | | | | | | | |
| | | Imports(1) | | | % Change | | | Exports(2) | | | % Change | | | Balance | | | % Change | |
| | | (in millions of US$, except percentages) | |
2012 | | | 6,298.3 | | | | 1.0 | | | | 1,742.8 | | | | 0.6 | | | | (4,555.5 | ) | | | 1.7 | |
2013 | | | 6,129.9 | | | | (2.7 | ) | | | 1,580.4 | | | | (9.3 | ) | | | (4,549.5 | ) | | | 0.1 | |
2014 | | | 5,847.3 | | | | (4.6 | ) | | | 1,448.5 | | | | (8.3 | ) | | | (4,398.8 | ) | | | 3.3 | |
2015(3) | | | 5,033.5 | | | | (13.9 | ) | | | 1,254.8 | | | | (13.4 | ) | | | (3,778.7 | ) | | | 14.1 | |
2016 | | | 4,751.3 | | | | (5.6 | ) | | | 1,194.8 | | | | (4.8 | ) | | | (3,556.6 | ) | | | 5.9 | |
| (1) | Merchandise imports are cost, insurance and freight values, which differ in presentation from the import values presented in the balance of payments. |
| (2) | Exports as listed in this table include free-zone exports and exclude goods procured in ports. |
Source: Statistical Institute of Jamaica.
Exports
Total exports, including the Jamaica Free Zone, in 2016, decreased by 4.8% to US$1,194.8 million, compared to US$1,254.8 million earned in 2015, primarily due to decreases in domestic exports of crude materials (excluding fuels), mineral fuels, food and manufactured goods.
Traditional exports, including the Jamaica Free Zone, decreased by 18.1% in 2016 to US$626.7 million from US$765.0 million in 2015, primarily due to decreased earnings from alumina, bauxite and sugar. Alumina exports totaled approximately US$444.0 million in 2016 compared to US$518.6 million in 2015, a decrease of 14.4%. Bauxite exports, which are primarily exported to the United States, fell to US$91.9 million in 2016, compared to US$123.2 million in 2015. Manufacturing decreased in 2016 by 39.6% to US$57.8 million compared to US$95.7 million in 2015, primarily due to significantly lower earnings from sugar. The value of sugar exported in 2016 decreased by 72.6% to US$14.8 million from US$53.9 million in 2015, which was mainly due to lower export volumes, as a result of decreased production and reduced prices in the international market. Rum exports, however, increased by 3.9% to US$39.6 million from US$38.1 million in 2015. Agriculture increased by 20.2% to US$33.2 million, from US$27.6 million in 2015, due mainly to higher receipts from Coffee, which was valued at US$27.6 million, a 19.8% increase when compared to 2015.
Non-traditional exports, including the Jamaica Free Zone, increased by 6.3% to US$463.9 million in 2016 from US$436.3 million in 2015, primarily due to increased earnings from, Food and Beverages & Tobacco (excluding rum). Receipts from mineral fuels and related products decreased to US$172.7 million in 2016, as compared to US$194.3 million in 2015, primarily due to lower prices in the international market. Exports of non-traditional food in 2016 increased by 23.0% to approximately US$169.0 million, as compared to US$137.4 million in 2015.
D-50
The following table shows Jamaica’s exports by sector for the five years ended December 31, 2016:
Exports
| | | | | | | | | | | | | | | | | | | | |
| | | 2012 | | | 2013 | | | 2014 | | | 2015(1) | | | 2016 | |
| | | (in millions of US$) | |
Traditional Exports | | | | | | | | | | | | | | | | | | | | |
Agriculture | | | | | | | | | | | | | | | | | | | | |
Banana | | | 0.1 | | | | 0.1 | | | | 0.2 | | | | 0.3 | | | | 0.3 | |
Citrus | | | 1.9 | | | | 3.3 | | | | 1.7 | | | | 1.4 | | | | 1.8 | |
Coffee | | | 13.8 | | | | 16.3 | | | | 13.5 | | | | 23.0 | | | | 27.6 | |
Cocoa | | | 1.9 | | | | 0.5 | | | | 1.0 | | | | 0.5 | | | | 0.9 | |
Pimento | | | 2.3 | | | | 1.9 | | | | 2.3 | | | | 2.4 | | | | 2.5 | |
| | | | | | | | | | | | | | | | | | | | |
Total | | | 20.0 | | | | 22.1 | | | | 18.7 | | | | 27.6 | | | | 33.1 | |
Mining and Quarrying | | | | | | | | | | | | | | | | | | | | |
Bauxite | | | 130.1 | | | | 128.0 | | | | 131.2 | | | | 123.2 | | | | 91.8 | |
Alumina | | | 508.3 | | | | 523.7 | | | | 529.4 | | | | 518.6 | | | | 444.0 | |
Gypsum | | | 0.4 | | | | 0.0 | | | | 0.0 | | | | 0.0 | | | | 0.0 | |
| | | | | | | | | | | | | | | | | | | | |
Total | | | 638.8 | | | | 651.7 | | | | 660.7 | | | | 641.8 | | | | 535.8 | |
Manufacturing | | | | | | | | | | | | | | | | | | | | |
Sugar | | | 94.1 | | | | 53.2 | | | | 55.8 | | | | 53.9 | | | | 14.8 | |
Rum | | | 55.7 | | | | 48.2 | | | | 44.9 | | | | 38.1 | | | | 39.6 | |
Citrus Products | | | 0.6 | | | | 0.4 | | | | 0.2 | | | | 0.2 | | | | 0.3 | |
Coffee Products | | | 4.1 | | | | 3.2 | | | | 2.8 | | | | 2.8 | | | | 2.6 | |
Cocoa Products | | | 1.0 | | | | 0.9 | | | | 1.0 | | | | 0.6 | | | | 0.5 | |
| | | | | | | | | | | | | | | | | | | | |
Total | | | 155.5 | | | | 105.7 | | | | 104.7 | | | | 95.7 | | | | 57.8 | |
| | | | | | | | | | | | | | | | | | | | |
Total Traditional Exports | | | 814.3 | | | | 779.5 | | | | 784.1 | | | | 765.0 | | | | 626.7 | |
| | | | | | | | | | | | | | | | | | | | |
Non-Traditional Exports | | | | | | | | | | | | | | | | | | | | |
Food and Beverage | | | | | | | | | | | | | | | | | | | | |
Pumpkins | | | 0.5 | | | | 0.7 | | | | 0.5 | | | | 0.4 | | | | 0.2 | |
Dasheens | | | 1.7 | | | | 1.6 | | | | 1.4 | | | | 1.0 | | | | 1.4 | |
Sweet Potatoes | | | 2.8 | | | | 3.6 | | | | 2.6 | | | | 2.7 | | | | 3.1 | |
Yams | | | 19.6 | | | | 22.2 | | | | 22.1 | | | | 21.7 | | | | 25.8 | |
Papayas | | | 4.5 | | | | 3.4 | | | | 3.8 | | | | 4.2 | | | | 4.4 | |
Ackee | | | 13.9 | | | | 15.5 | | | | 11.9 | | | | 14.9 | | | | 21.1 | |
Other Fruits & Fruit Preparations | | | 7.0 | | | | 5.7 | | | | 5.6 | | | | 4.3 | | | | 5.9 | |
Meat & Meat Preparations | | | 3.9 | | | | 5.0 | | | | 4.7 | | | | 5.1 | | | | 6.8 | |
Dairy Products & Birds’ Eggs | | | 6.9 | | | | 6.2 | | | | 5.9 | | | | 6.5 | | | | 7.8 | |
Fish, Crustaceans & Mollusks | | | 8.9 | | | | 11.0 | | | | 12.4 | | | | 11.2 | | | | 11.7 | |
Other Food Exports | | | 74.4 | | | | 77.9 | | | | 75.6 | | | | 65.4 | | | | 80.8 | |
Beverages and Tobacco (excluding rum) | | | 48.2 | | | | 35.0 | | | | 35.3 | | | | 29.3 | | | | 49.2 | |
| | | | | | | | | | | | | | | | | | | | |
Total | | | 192.2 | | | | 187.7 | | | | 181.8 | | | | 166.7 | | | | 218.1 | |
Inedible Materials | | | | | | | | | | | | | | | | | | | | |
Limestone | | | 1.5 | | | | 2.5 | | | | 2.9 | | | | 3.3 | | | | 3.5 | |
Waste & Scrap | | | 22.0 | | | | 26.7 | | | | 33.8 | | | | 12.3 | | | | 11.4 | |
Other | | | 3.0 | | | | 4.5 | | | | 2.7 | | | | 4.6 | | | | 5.2 | |
| | | | | | | | | | | | | | | | | | | | |
Total | | | 26.5 | | | | 33.7 | | | | 39.4 | | | | 20.1 | | | | 20.1 | |
Mineral Fuels and related products | | | 387.7 | | | | 351.2 | | | | 301.4 | | | | 194.3 | | | | 172.7 | |
Ethanol | | | 194.8 | | | | 88.8 | | | | 0.1 | | | | 0.0 | | | | 0.0 | |
Apparel | | | 1.4 | | | | 1.4 | | | | 1.4 | | | | 0.9 | | | | 1.7 | |
Furniture | | | 1.0 | | | | 0.5 | | | | 0.5 | | | | 1.1 | | | | 0.8 | |
Other Exports | | | 56.9 | | | | 36.2 | | | | 71.4 | | | | 53.2 | | | | 50.4 | |
| | | | | | | | | | | | | | | | | | | | |
Total | | | 641.9 | | | | 498.2 | | | | 374.8 | | | | 249.5 | | | | 225.6 | |
| | | | | | | | | | | | | | | | | | | | |
Total Non-Traditional Exports | | | 860.5 | | | | 719.6 | | | | 596.0 | | | | 436.3 | | | | 463.9 | |
Re-Exports | | | 67.8 | | | | 81.2 | | | | 68.4 | | | | 53.5 | | | | 104.2 | |
| | | | | | | | | | | | | | | | | | | | |
Total Exports | | | 1,742.8 | | | | 1,580.4 | | | | 1,448.5 | | | | 1,254.8 | | | | 1,194.8 | |
| | | | | | | | | | | | | | | | | | | | |
Source: Statistical Institute of Jamaica.
D-51
In the past, the Jamaican sugar and banana industries and, less significantly, traditional rum and rice suppliers, enjoyed preferential trade arrangements with respect to exports to the European Union pursuant to the CPA. The EPA, which replaces the trade provisions of the CPA, was signed in October 2008. This free trade agreement provides for duty-free, quota-free access to the European Union market for most goods, as at January 1, 2009. The EPA is currently being applied provisionally, and Jamaica is in the process of implementing this agreement. This agreement has a strong development component. Under the 10th European Development Fund’s Caribbean Regional Indicative Programme, approximately €72.0 million were allocated to CARIFORUM States for the EPA Implementation. At the national level, Jamaica is in the process of implementing two projects in respect of the EPA.
The EPA Capacity Building Project (“EPA I”), which was signed on May 4, 2012 in the amount of €2.25 million, is designed to enhance Jamaica’s competitiveness goals as outlined in the National Export Strategy and Vision 2030 Jamaica – National Development Plan. The accreditation of official testing laboratories, which is one aspect of the project, will mostly address ISO 17025 standards since this is the internationally recognized standard under the provisions of the WTO Agreement on Technical Barriers to Trade. Capacity building interventions are being undertaken in food-related laboratories which provide support to the export industry. The project aims to promote export competitiveness and food security.
The EPA Capacity Building Project (“EPA II”) was formulated through sector wide needs assessment/consultation with business support organizations and public sector food laboratories from November 2012 to February 2013. It is designed to enhance the supply-side micro and medium to small-sized enterprises and to continue capacity building within public sector laboratories and support accreditation agencies, aligning them with the strategic priorities of the Government of Jamaica. The expectation is that through these interventions, Jamaica’s agricultural health and food quality systems will attain a level of compliance which enhances food security and international competitiveness. Approximately €5.0 million was allocated for the EPA II to build on the initiatives undertaken under the EPA I. EPA II will expand its main focus to include addressing upstream problems from the supply side, broadening the European Union action in creating a sustainable and enabling environment for increased market presence of Jamaican exports.
The EPA is reciprocal and asymmetrical in nature, and covers trade in traditional export products, such as sugar, bananas, rum and rice, which will ultimately enter the European Union duty-free and quota-free. The European Union’s preferential system for bananas ended on January 1, 2006, and the sugar regime that existed under the CPA ended on September 30, 2009. As at October 1, 2009, ACP sugar exporters have duty-free, quota-free access to the European Union market under a managed system lasting until 2015. Thereafter, sugar will enter the European Union market duty-free and quota-free under the EPA. See “Jamaica—International Relationships—The CARIFORUM-EU Economic Partnership Agreement.”
The Jamaican banana industry contributed minimally to the export earnings for the years 2012, 2013, 2014, 2015 and 2016. This was due to the exit of the major exporter from the market, as a result of devastating hurricanes in recent years. Jamaica has already commenced initiatives designed to improve the competitiveness of Jamaican bananas. See “The Jamaican Economy—Principal Sectors of the Economy—Agriculture, Forestry and Fishing.”
Imports
Merchandise imports decreased by 5.6% in 2016 to US$4,751.3 million from US$5,033.5 million in 2015. This decrease in the value of imports was due in part to lower spending on mineral fuels and related products, manufactured goods, chemicals and food. Mineral fuels and related products imports decreased in 2016 by 20.6% to US$934.9 million compared to US$1,177.0 million in 2015 due to significantly lower prices in the international market. In 2016, expenditure on food fell by 0.3% to US$840.9 million primarily due to lower prices for grains, as well as, decreased importation of meat, meat preparations and dairy products. Chemicals fell by 3.6% to US$556.7 million due primarily to lower imports of ethanol fuel and other related products. For the purposes of this discussion, imports include cost, insurance and freight values and include free-zone imports and exclude goods procured in ports.
D-52
The following table shows Jamaica’s imports for the five years ended December 31, 2016:
Imports (c.i.f.)(1)
| | | | | | | | | | | | | | | | | | | | |
| | | 2012 | | | 2013 | | | 2014 | | | 2015(2) | | | 2016 | |
| | | (in millions of US$) | |
Mineral Fuels and related products | | | 2,178.3 | | | | 2,176.7 | | | | 1,971.9 | | | | 1,177.0 | | | | 934.9 | |
Machinery | | | 901.4 | | | | 905.7 | | | | 964.2 | | | | 1,026.7 | | | | 1,242.3 | |
Food | | | 952.4 | | | | 963.6 | | | | 919.3 | | | | 843.6 | | | | 840.9 | |
Beverages & Tobacco | | | 79.8 | | | | 77.1 | | | | 73.4 | | | | 71.1 | | | | 71.9 | |
Crude Materials (excl. Fuels) | | | 46.7 | | | | 56.0 | | | | 63.9 | | | | 56.5 | | | | 59.4 | |
Animal & Vegetable Oils & Fats | | | 51.4 | | | | 42.8 | | | | 35.4 | | | | 32.4 | | | | 15.1 | |
Chemicals | | | 896.4 | | | | 749.1 | | | | 601.7 | | | | 577.8 | | | | 556.7 | |
Manufactured Goods | | | 617.9 | | | | 600.6 | | | | 611.5 | | | | 647.1 | | | | 571.0 | |
Miscellaneous Manufactured Articles | | | 455.5 | | | | 444.0 | | | | 490.7 | | | | 478.6 | | | | 436.7 | |
Other | | | 118.1 | | | | 114.3 | | | | 115.2 | | | | 122.7 | | | | 22.4 | |
| | | | | | | | | | | | | | | | | | | | |
Total Imports | | | 6,298.3 | | | | 6,129.9 | | | | 5,847.3 | | | | 5,033.5 | | | | 4,751.3 | |
| | | | | | | | | | | | | | | | | | | | |
| (1) | Merchandise imports are c.i.f. values which differ in presentation from import values presented in the balance of payments. |
Source: Statistical Institute of Jamaica.
Trading Partners
The United States of America, Canada, the Netherlands, the Russian Federation and the United Kingdom were Jamaica’s main trading partners for exports in 2016. The main trading partners for imports in 2016 were the United States of America, Trinidad and Tobago, China, Japan and Mexico.
The following tables show the direction of trade for the five years ended December 31, 2016:
Exports (f.o.b.) by Destination
| | | | | | | | | | | | | | | | | | | | |
| | | 2012 | | | 2013 | | | 2014 | | | 2015(1) | | | 2016 | |
| | | (in millions of US$) | |
NAFTA | | | 963.0 | | | | 991.9 | | | | 791.0 | | | | 623.9 | | | | 642.2 | |
of which USA | | | 837.5 | | | | 767.1 | | | | 568.7 | | | | 446.5 | | | | 493.7 | |
of which Canada | | | 122.6 | | | | 221.8 | | | | 221.6 | | | | 174.8 | | | | 144.8 | |
European Union | | | 347.4 | | | | 290.7 | | | | 274.8 | | | | 204.4 | | | | 206.1 | |
of which UK | | | 45.0 | | | | 81.8 | | | | 74.2 | | | | 80.2 | | | | 49.9 | |
CARICOM | | | 83.2 | | | | 79.7 | | | | 90.1 | | | | 63.1 | | | | 89.6 | |
Japan | | | 10.7 | | | | 12.4 | | | | 9.2 | | | | 15.0 | | | | 19.8 | |
Other countries | | | 338.3 | | | | 205.7 | | | | 283.4 | | | | 348.4 | | | | 237.1 | |
| | | | | | | | | | | | | | | | | | | | |
Total | | | 1,742.8 | | | | 1,580.4 | | | | 1,448.5 | | | | 1,254.8 | | | | 1,194.8 | |
| | | | | | | | | | | | | | | | | | | | |
Source: Statistical Institute of Jamaica.
Imports (c.i.f.) by Origin(1)
| | | | | | | | | | | | | | | | | | | | |
| | | 2012 | | | 2013 | | | 2014 | | | 2015(2) | | | 2016 | |
| | | | | | (in millions of US$) | |
NAFTA | | | 2,522.6 | | | | 2,426.5 | | | | 2,548.7 | | | | 2,231.7 | | | | 2,125.4 | |
of which USA | | | 2,153.6 | | | | 2,051.1 | | | | 2,245.0 | | | | 2,006.9 | | | | 1,844.0 | |
of which Canada | | | 100.7 | | | | 101.0 | | | | 106.1 | | | | 94.4 | | | | 86.2 | |
European Union | | | 377.5 | | | | 366.9 | | | | 427.3 | | | | 430.9 | | | | 466.9 | |
of which UK | | | 85.0 | | | | 68.9 | | | | 62.7 | | | | 68.2 | | | | 73.1 | |
CARICOM | | | 893.7 | | | | 926.9 | | | | 762.9 | | | | 597.9 | | | | 465.7 | |
Japan | | | 205.8 | | | | 184.0 | | | | 156.4 | | | | 177.8 | | | | 299.5 | |
Other countries | | | 2,298.7 | | | | 2,225.6 | | | | 1,952.0 | | | | 1,595.2 | | | | 1,393.8 | |
| | | | | | | | | | | | | | | | | | | | |
Total | | | 6,298.3 | | | | 6,129.9 | | | | 5,847.3 | | | | 5,033.5 | | | | 4,751.3 | |
| | | | | | | | | | | | | | | | | | | | |
| (1) | Merchandise imports are c.i.f. values which differ in presentation from import values presented in the balance of payments. |
Source: Statistical Institute of Jamaica.
D-53
Foreign Direct Investment
FDI inflows peaked in 2008 at US$1,436.6 million, or 10.5% of GDP, before decreasing by 62.3% in 2009 as a result of the global economic recession. In 2011, FDI reached a low of US$218.2 million. FDI inflows have since increased steadily between since 2012 to US$925 million (or 6.5% of GDP) in 2015. For 2016, however, FDI inflows fell by US$134.6 million or 14.6% to US$790.4 million, relative to 2015. This decline was primarily due to lower investment flows for infrastructure development and the tourism industry by over US$276.1 million, partially offset by an increase of US$223.8 million in inflows from divestments and to the Agricultural/Manufacturing industries.
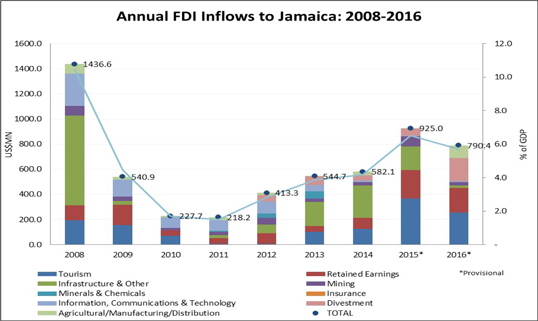
D-54
Quarterly FDI Flows to Jamaica by Region: FY 2014/15, FY 2015/16 & FY-DEC 2016/17
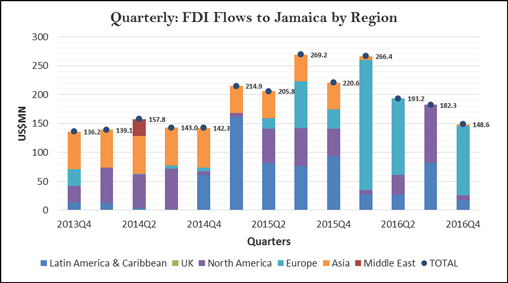
Source: Bank of Jamaica
Portfolio Investments
For 2016, there were net portfolio investment outflows of US$652.2 million relative to net portfolio investment inflows of US$1,288.9 million for 2015. The fall in net inflows for 2016 largely emanated from the acquisition by Jamaican residents of portfolio investment assets (outflows) of US$561.1 million (of which US$547.9 million were bonds) coupled with a decrease in portfolio investment liabilities (outflows) of US$91.2 million. The reduced portfolio liabilities (inflows) for 2016 was mainly attributable to foreign investors’ reducing their holdings of Government of Jamaica securities as residents marginally increased their holdings of these securities on the secondary market.
For 2015, there were net portfolio investment inflows of US$1,288.9 million relative to portfolio investment inflows of US$465.9 million for 2014. The results for 2015 largely emanated from portfolio liabilities (inflows) of US$1,797.6 million (US$1,705.2 million of which were bonds and US$92.5 million of which were equity) which was partially offset by an increase in portfolio assets (outflows) of US$508.7 million in this period. The net incurrence of portfolio liabilities (inflows) was largely a result of the Government of Jamaica issuing two bonds on the international capital market totaling US$1,350.0 million to non-residents.
Portfolio Investments
| | | | | | | | |
| | | 2015(1) | | | 2016 | |
A. Net Acquisition of Portfolio Assets (outflows)/inflows | | | 508.7 | | | | 561.1 | |
Equity | | | 29.8 | | | | 13.2 | |
Bonds | | | 478.9 | | | | 547.9 | |
B. Net Incurrence of Portfolio Liabilities inflows/(outflows) | | | 1,797.6 | | | | (91.2 | ) |
Equity | | | 92.5 | | | | 79.3 | |
Bonds | | | 1,705.2 | | | | (170.4 | ) |
C. Net Portfolio Investments Balance [A minus B] (inflows)/outflows | | | (1,288.9 | ) | | | 652.2 | |
D-55
International Reserves
Net international reserves of the Bank of Jamaica increased to US$2,719.4 million as at December 31, 2016, from US$2,437.0 million as at December 31, 2015. Gross international reserves as at December 31, 2016 were US$3,291.5 million, or approximately 24.5 weeks of goods and services imports.
As of March 31, 2017, net international reserves of the Bank of Jamaica were US$2,769.2 million, with gross international reserves at US$3,323.9 million or approximately 24.4 weeks of goods and services imports.
The following table shows the Bank of Jamaica’s international reserves for the period December 31, 2012 to December 31, 2016 and also to March 31, 2017.
International Reserves
| | | | | | | | | | | | | | | | | | | | | | | | |
| | | December 31,
2012 | | | December 31,
2013 | | | December 31,
2014 | | | December 31,
2015 | | | December 31,
2016 | | | March 31,
2017 | |
| | | (in millions of US$) | |
Supplementary Fund | | | 157.5 | | | | 137.7 | | | | 463.2 | | | | 479.4 | | | | 346.5 | | | | 347.5 | |
Special Drawing Rights | | | 290.9 | | | | 295.3 | | | | 269.2 | | | | 250.4 | | | | 270.6 | | | | 270.7 | |
Other Reserves | | | 1,532.4 | | | | 1,384.6 | | | | 1,740.6 | | | | 2,184.0 | | | | 2,674.3 | | | | 2,705.7 | |
Gross International Reserves | | | 1,980.8 | | | | 1,817.6 | | | | 2,473.0 | | | | 2,913.8 | | | | 3,291.5 | | | | 3,323.9 | |
Total Foreign Liabilities | | | 855.2 | | | | 769.7 | | | | 471.9 | | | | 476.8 | | | | 572.1 | | | | 554.7 | |
Net International Reserves | | | 1,125.6 | | | | 1,047.8 | | | | 2,001.1 | | | | 2,437.0 | | | | 2,719.4 | | | | 2,769.2 | |
Gross Reserves in Weeks of Merchandise Imports | | | 18.1 | | | | 17.9 | | | | 25.5 | | | | 35.5 | | | | 40.1 | | | | 39.9 | |
Gross Reserves in Weeks of Goods & Services Imports | | | 13.1 | | | | 12.8 | | | | 17.7 | | | | 22.5 | | | | 24.5 | | | | 24.4 | |
Source: Bank of Jamaica.
Exchange Rates
As part of its economic liberalization program, Jamaica began gradually dismantling exchange controls in 1990 and formally abolished all remaining exchange controls with the repeal in 1992 of the Exchange Control Act. The movement of foreign exchange into and out of Jamaica is unrestricted. All Jamaican residents are permitted to hold, invest and borrow in foreign currency. Non-residents are also permitted to invest and borrow both local and foreign currency in Jamaica. However, only an authorized dealer may carry on the business of trading in foreign currency or foreign currency instruments. In addition, an authorized dealer must be party to any transaction involving the buying or selling of foreign currency or foreign currency instruments in return for Jamaica dollars and the lending or borrowing of foreign currency. Cambios and bureaux de change are authorized specifically to buy and sell foreign currency.
Since the repeal of the Exchange Control Act in 1992, the exchange rate has been determined by market conditions and Jamaica has not set any trading band or target.
During 2016, the Jamaica dollar gradually depreciated against the US dollar, with the JA/US dollar exchange rate falling from J$120.4 per US$1.00 at December 31, 2015 to J$128.4 per US$1.00 at December 31, 2016, a depreciation of 6.6%. Total purchases and sales reported by authorized foreign currency traders decreased to US$9,643.1 million and US$9,911.7 million, respectively in 2016 from US$10,002.3 million and US$10,250.2 million, respectively, in 2015. During 2016, the Bank of Jamaica’s intervention in the market resulted in net foreign currency–sale of US$848.0 million via the trading room in contrast to net foreign currency sale of US$451.4 million via the trading room in 2015.
D-56
The official exchange rate as at March 31, 2017 was J$128.7 per US$1.00, representing an annual depreciation of 5.4% relative to the annual depreciation of 6.6% as at December 31, 2016. The slower pace of depreciation against the US dollar for the fiscal quarter ended March 31, 2017 occurred in the context of a tempering of demand as institutions maintained their Jamaica Dollar liquidity positions to meet end of year tax obligations for FY 2016/17. In addition, the slower pace of depreciation was underpinned by increased reports of adequate USD supply within the foreign exchange market.
The Federal Reserve Bank of New York does not report a noon buying rate for the JA dollar. The official exchange rate published by the Bank of Jamaica for US dollars on March 31, 2017 was J$127.8 per US$1.00.
D-57
PUBLIC FINANCE
The Central Government Budget
The Government of Jamaica includes all ministries, departments and agencies whose activities form part of the budgetary operation of the central administration. The operations of Central Government and state-owned enterprises are now referred to as the overall public sector.
Jamaica’s fiscal year runs from April 1 of each year to March 31 of the following year. Pursuant to the Constitution and the FRF, the Minister of Finance and the Public Service has the responsibility of preparing estimates of revenue and expenditure and submitting those estimates to Parliament for approval before the beginning of the fiscal year to which they relate. In addition, the Minister of Finance must present a Fiscal Policy Paper, detailing multi-year budgets and targets and the fiscal strategy being pursued to achieve these targets. The Ministry of Finance and the Public Service, in conjunction with other ministries, departments, and agencies, prepares multi-year draft budgets, which must be approved by the Cabinet prior to its submission to Parliament. Under the aegis of the enhanced fiscal rules which were legislated in March 2014, Parliament is required to approve the budget prior to the start of the fiscal year to which the budget relates, that is, no later than March 31, beginning with the FY 2015/16 Budget. For FY 2016/17, there was a delay in the tabling of the budget, due to the General Elections on February 25, 2016.
The budget distinguishes between recurrent and capital expenditure. Recurrent expenditure refers to operating expenditure of the Central Government, while capital expenditure refers to the Central Government’s planned investment for the fiscal year. The major criteria used in determining allocation levels for recurrent expenditure are expenditure ceilings based on Jamaica’s economic policy, Jamaica’s priorities for the fiscal year, and commitments arising from the continuation of programs, projects and policies previously authorized by the Cabinet. Such commitments include interest on public debt, a statutory obligation that is paid first, as well as salaries, rent and public utilities. The major criteria used in deciding allocation levels for capital expenditure are current year projections for public investment, multilateral/bilateral programs and the implementation status of projects.
Jamaica’s significant indebtedness has impacted the ability of the Government to increase its spending in education, healthcare, and infrastructure and the Government has supplemented that spending and utilized bilateral/multilateral (project) funding flows to meet the demands of these sectors. Fiscal space has been limited as debt payments must be made before funds are available to Jamaica for other policies and programs. Nevertheless, the Government remains committed to prioritizing the social protection program, in an effort to minimize any potentially adverse impact on the most vulnerable within the population. The allocations from revenues to education, healthcare, and national security have been mainly to cover the operating costs of these ministries/sectors. The capital budgets of these ministries, however, have been supplemented by bilateral and multilateral (project) funding. These funds are used to build and maintain schools, maintain hospital equipment and buildings in the health sector, and make infrastructural improvements.
D-58
The following table shows Jamaica’s fiscal results for FY 2012/13 through FY 2016/17:
Government Revenue and Expenditure
In millions of J$
| | | | | | | | | | | | | | | | | | | | |
| | | 2013/14(9) | | | 2014/15(9) | | | 2015/16(9) | | | 2016/17 | | | 2017/18(8) | |
Revenue and Grants | | | 396,979.4 | | | | 411,715.9 | | | | 455,835.8 | | | | 499,879.9 | | | | 537,069.4 | |
Tax Revenue | | | 343,836.1 | | | | 370,877.5 | | | | 411,854.0 | | | | 458,323.4 | | | | 478,254.7 | |
Income and Profits | | | 112,647.7 | | | | 120,854.2 | | | | 130,759.6 | | | | 136,024.6 | | | | 122,564.4 | |
Production and Consumption | | | 115,212.3 | | | | 120,421.2 | | | | 133,792.2 | | | | 148,313.9 | | | | 161,741.6 | |
Of which GCT (local) | | | 61,265.1 | | | | 63,994.6 | | | | 72,745.0 | | | | 78,174.7 | | | | 84,825.4 | |
International Trade | | | 113,891.8 | | | | 127,237.7 | | | | 147,302.1 | | | | 173,984.9 | | | | 193,948.7 | |
Non-Tax Revenue(1) | | | 41,047.1 | | | | 34,311.5 | | | | 35,748.6 | | | | 33,754.1 | | | | 52,103.6 | |
Bauxite Levy | | | 1,009.5 | | | | 0.0 | | | | 2,116.9 | | | | 1,940.9 | | | | 131.0 | |
Capital Revenue(2) | | | 658.1 | | | | 1,509.2 | | | | 652.7 | | | | 568.6 | | | | 2,228.1 | |
Grants | | | 10,428.5 | | | | 5,017.8 | | | | 5,463.6 | | | | 5,292.8 | | | | 4,352.1 | |
Expenditure | | | 395,241.8 | | | | 418,986.8 | | | | 460,719.4 | | | | 503,356.0 | | | | 543,056.3 | |
Recurrent Expenditure(3) | | | 358,252.9 | | | | 395,967.8 | | | | 427,972.1 | | | | 461,400.8 | | | | 493,773.8 | |
Programs | | | 91,971.7 | | | | 112,696.6 | | | | 133,505.2 | | | | 142,976.4 | | | | 162,736.2 | |
Compensation(4) | | | | | | | | | | | | | | | 179,068.1 | | | | 193,184.7 | |
Of which Wages and Salaries | | | 156,361.7 | | | | 158,758.6 | | | | 168,787.4 | | | | 166,484.7 | | | | 179,525.8 | |
of which Back pay(5) | | | 12,516.2 | | | | 7,434.4 | | | | 5,272.3 | | | | 3,587.6 | | | | 5,200.7 | |
Of which Employer’s Contribution | | | | | | | | | | | | | | | 12,583.4 | | | | 13,658.9 | |
Interest | | | 109,919.5 | | | | 124,512.7 | | | | 125,679.5 | | | | 139,356.2 | | | | 137,852.9 | |
Domestic | | | 68,728.9 | | | | 76,052.1 | | | | 71,391.3 | | | | 63,544.0 | | | | 62,903.4 | |
Foreign | | | 41,190.6 | | | | 48,460.5 | | | | 54,288.3 | | | | 75,812.2 | | | | 74,949.5 | |
Capital Expenditure(6) | | | 36,988.8 | | | | 23,019.0 | | | | 32,747.3 | | | | 41,955.3 | | | | 49,282.5 | |
Fiscal Surplus (Deficit) | | | 1,737.6 | | | | (7,270.9 | ) | | | (4,883.7 | ) | | | (3,476.1 | ) | | | (5,986.9 | ) |
Loan Receipts | | | 93,527.5 | | | | 168,705.9 | | | | 298,600.5 | | | | 89,826.8 | | | | 159,612.0 | |
External | | | 53,407.6 | | | | 129,458.0 | | | | 269,596.2 | | | | 34,282.8 | | | | 70,612.0 | |
Domestic | | | 40,119.9 | | | | 39,247.9 | | | | 29,004.3 | | | | 55,544.1 | | | | 89,000.0 | |
Amortization | | | 106,640.2 | | | | 87,794.4 | | | | 342,725.9 | | | | 75,389.7 | | | | 172,548.1 | |
External | | | 30,035.8 | | | | 58,041.9 | | | | 265,007.1 | | | | 45,679.9 | | | | 70,099.9 | |
Domestic | | | 76,604.4 | | | | 29,752.5 | | | | 77,718.9 | | | | 29,709.8 | | | | 102,448.2 | |
Primary Surplus (Deficit) | | | 111,657.1 | | | | 117,241.8 | | | | 120,795.9 | | | | 135,880.1 | | | | 131,866.0 | |
Overall Surplus (Deficit) | | | (11,375.0 | ) | | | 73,640.6 | | | | (42,937.9 | ) | | | 25,565.7 | | | | (7,221.7 | ) |
GDP(7) | | | 1,462,200.0 | | | | 1,571,800.0 | | | | 1,691,000.0 | | | | 1,757,500.0 | | | | 1,883,800.0 | |
| (1) | Non-tax revenue includes user fees, dividends from government owned entities and interest revenue. |
| (2) | Capital revenue includes royalties and loan repayments. |
| (3) | Recurrent expenditure refers to the Government’s day-to-day operational expenses. |
| (4) | Based on adoption of a Revised Chart of Accounts beginning with the FY 2016/17 Budget, consistent with the IMF’s Government Finance Statistics, the fiscal accounts now show a category called Compensation broken out into (a) wages and salaries paid to employees and (b) contributions made by the Government toward statutory deductions and health insurance. |
| (5) | Back pay represents payments, in any given year, of wages/salaries and allowances due for previous fiscal years. |
| (6) | Capital expenditure refers to Jamaica’s investment for the fiscal year. |
| (7) | GDP is calculated on a calendar year basis. Therefore, the number presented represents an estimate of GDP for the fiscal year. The gross domestic product series was revised in 2003 and subsequently revised again in 2008. This revision was made in order to capture the changing structure of industries in the manufacturing, financial and insurance services, business services and the miscellaneous services sectors. In addition the base year has been changed from 1986 to 1996. |
| (8) | The figures provided in this column represent the 2017/18 Budget. |
Source: Ministry of Finance and the Public Service and the Planning Institute of Jamaica.
Revenue and Expenditure for FY 2016/17
Jamaica posted a fiscal deficit in FY 2016/17 of J$3.5 billion or an estimated 0.2% of GDP. This followed a fiscal deficit in FY 2015/16 of J$4.9billion or 0.4% of GDP, a fiscal deficit in FY 2014/15 of J$7.3 billion or 0.5% of GDP, and a fiscal surplus in FY 2013/14 of J$1.7 billion or 0.1% of GDP. Deficits in previous years were due mainly to higher capital spending, as well as wages and salaries and interest costs. The improved fiscal position
D-59
since FY 2013/14 is influenced largely by reductions in expenditure, including lower interest payments arising from the NDX, the wage restraint agreements signed with the unions representing public sector workers and lower spending on capital programs. Recent revenue enhancement measures also contributed to the reduction in the fiscal deficit. The 0.2% of GDP fiscal deficit recorded in FY 2016/17 was 0.5 percentage points better than the originally targeted 0.7%. This performance was mainly due to higher than budgeted total revenue and grants and lower than projected total expenditure. Revenues and grants exceeded target by J$8.6 billion or 1.8%, while expenditure was almost J$5 billion or 1.0% below budget. Jamaica has maintained relatively high primary surpluses over the last five years. The fiscal operations recorded primary surpluses of an estimated 7.7% of GDP in FY 2016/17, 7.1% of GDP in FY 2015/16, 7.5% of GDP in FY 2014/15, and 7.6% of GDP in FY 2013/14. The primary surplus for FY 2016/17 amounted to J$135.9 billion, compared to the target of J$123.1 billion.
Overall, revenue and grants were J$499.9 billion, or 1.8% above target for FY 2016/17. This compares to J$455.9 billion, or 0.5% above target for FY 2015/16. The operations of the overall public sector recorded a surplus of 0.8% of GDP in FY 2016/17, 1.7% of GDP in FY 2015/16, 0.5% of GDP in FY 2014/15 following a deficit of 0.1% of GDP in FY 2013/14. The budgeted overall public sector deficit for FY 2017/18 is 0.2% of GDP.
Revenue and Grants
Total revenue and grants for the Central Government for FY 2016/17 were J$499.9 billion, or an estimated 28.4% of GDP. This represents an increase of J$44.0 billion or 9.7% over total revenue and grants collected in FY 2015/16. Collections in FY 2016/17 were J$8.6 billion or 1.8% above budgeted levels. Tax revenues accounted primarily for the buoyancy of revenue and grants, exceeding budget by J$13.2 billion or 3.0%. On the other hand, non-tax revenues, bauxite levy and grants all underperformed relative to budget. Tax revenue for FY 2016/17 increased by 11.3% while non-tax revenue decreased by 5.6% when compared to FY 2015/16. The grants received in FY 2016/17 totaled J$5.3 billion, 18.7% below budget, due mainly to delays in the rate of implementation of capital projects.
Expenditure
Total expenditure (excluding amortization) for FY 2016/17 was J$503.4 billion, or an estimated 28.6% of GDP. This represented a 9.3% increase over FY 2015/16 and was J$4.97 billion, or 1.0% below budget. Recurrent expenditure totaled J$461.4 billion in FY 2016/17, representing 91.7% of total expenditure, with capital expenditure representing 8.3% of total expenditure. Recurrent expenditure was J$2.1 billion, or 0.5%, lower than budgeted, mainly as a result of lower than anticipated wages and salaries, lower interest payments (particularly on the external debt stock) and below targeted spending on programs.
The largest component of recurrent expenditure was wages and salaries, which represented 33.1% of total expenditure (less amortization) in FY 2016/17 compared to 36.6% of total expenditure in FY 2015/16. Interest costs represented 27.7% of total expenditure in FY 2016/17, 27.3% of total expenditure in FY 2015/16 and 29.7% of total expenditure in FY2014/15. Interest expenditure consumed 27.9% of total revenue and grants in FY 2016/17, compared to 27.6% in FY 2015/16 and 30.2% in FY 2014/15. Interest costs as a percentage of total revenues have averaged 28.5% over the last three years.
Expenditure on compensation of employees in FY 2016/17 increased to J$179.1 billion, or by 6.1%, compared to J$168.8 billion in FY 2015/16, due primarily to payment of new salary rates to public sector workers who reached a late settlement on their 2015/17 negotiations, in addition to the payment of arrears for previous outstanding settlements to certain government employees.
Interest costs of J$139.4 billion were J$770.1 million below budget, and included domestic interest costs of J$63.5 billion and foreign interest costs of J$75.8 billion. Domestic interest costs were J$1.05 billion or 1.7% above budget, while foreign interest costs were J$1.8 billion or 2.3% below budget.
The decline in interest costs has contributed to a reduction in the fiscal deficit and the containment of the rate of growth of the public debt stock. In FY 2016/17, interest payments amounted to an estimated 7.9% of GDP, which represents an increase relative to FY 2015/16, when interest payments accounted for 7.4% of GDP.
D-60
FY 2017/18 Budget
The Government’s target for FY 2017/18 is a primary surplus of 7.0% of GDP, equivalent to J$131.9 billion, and a fiscal deficit of 0.3% of GDP, equivalent to J$6.0 billion. Revenue and grant inflows are projected at J$537.1 billion with expenditure at J$543.1 billion.
The FY 2017/18 budget remains consistent with Jamaica’s overall economic program, which seeks to promote sustainable economic growth and fiscal and debt sustainability while protecting the most vulnerable social groups.
Revenue and Grants
The revenue and grants projection for FY 2017/18 represents 28.5% of the projected GDP, an increase of 0.1 percentage points above the 28.4% in FY 2016/17. Tax revenue of J$478.3 billion is estimated to account for 89.0% of total revenue and grants, 1.7 percentage points lower than in FY 2016/17.
Tax revenue is budgeted to increase by 4.3%, or J$19.9 billion, over collections in FY 2016/17, due mainly to the programmed increase in nominal income and increased efforts to improve tax payer compliance.
Grant receipts are budgeted to decrease by J$0.9 billion, or 17.8% below FY 2016/17 collections, due largely to expectations of no budget support flows from the European Union.
Expenditure
Expenditure (less amortization) is budgeted to increase by 7.9% over FY 2016/17 due to higher recurrent and capital expenditure. The FY 2017/18 expenditure budget is projected to be J$543.1 billion, comprised of J$493.8 billion for recurrent expenditure and J$49.3 billion for spending on capital projects. Of the recurrent budget, J$162.7 billion is allocated to recurrent programs, J$193.2 billion is allocated to compensation (inclusive of J$179.5 billion and J$13.7 billion for wages and salaries and employers contribution, respectively) and J$137.9 billion is allocated to interest payments.
In the medium-term, the Government is targeting a primary surplus of 7.0% of GDP. The contribution of expenditure towards the achievement of these targets is embodied in the FY 2017/18 expenditure profile, with total expenditure, net of appropriations-in-aid, of J$715.6 billion. This is comprised of expenditure of J$543.1 billion and debt amortization payments of J$172.5 billion. Debt-servicing is projected to be J$310.4 billion and accounts for the largest portion of the overall budget at 43.4%, followed by education services at J$100.4 billion or 14.0%, health services at J$63.8 billion or 8.9%, and national security services at J$60.7 billion or 8.5%. The projected debt service for FY 2017/18 shows an increase of J$95.7 billion, or 13.4% of the overall expenditure, net of appropriations-in-aid, when compared to the FY 2016/17 outturn of J$214.7 billion, or 37.1% of overall expenditure.
The Government’s borrowing requirement for FY 2017/18 amounts to J$159.6 billion. This amount is required to finance the deficit of J$6.0 billion and cover amortization payments of J$172.5 billion, leaving an overall deficit of J$7.2 billion, after netting out or offsetting inflows of J$11.7 billion. The expenditure on wages and salaries is budgeted to increase by 7.8% in FY 2017/18. This increase is due primarily to projected increase in wages and salaries (including allowances) to public sector employees.
Wage Developments
With the wage agreements covering the period of 2015-2017 having expired, the Government will be negotiating new wage agreements to cover the period of 2017-2019 with unions representing public sector workers. Provisions have been made in the FY 2017/18 Budget to meet the projected increase in wages and salaries. The timeline for achieving the programmed 9% of GDP wage target was revised from March 31, 2016 to March 31, 2019. For FY 2017/18, the wage bill, as a percentage of GDP, is projected to be 9.5%.
D-61
Taxes and Tax Reform
History
Since independence, the Jamaican tax system has been dependent on a multiplicity of indirect taxes including on international trade and an income tax system with different marginal tax rates and several deductible allowances. Jamaica has engaged in major tax reform in the mid 1980’s as well as the 1990’s. In 2004, a comprehensive study of Jamaica’s tax system by a university found that the system, while it had a sound basic structure, had major problems. Since 2004, the Government has sought to address some of the issues identified in the study, including improving receipts from indirect taxes through increasing the general consumption tax (“GCT”) and enhancing the effectiveness of tax administration.
During 2009, 2010 and 2011, the Government introduced additional tax measures aimed at increasing revenue as a percentage of GDP. Following a Green Paper on Tax Reform issued by the Ministry of Finance and the Public Service in May 2011, a White Paper on Tax Reform 2012 was issued on November 15, 2012. The Green Paper and White Paper on Tax Reform focused on several areas to be reformed over a three-year period. These reforms included, among others, the following: removing basic food from the tax system; reducing the statutory corporate income tax rate to be competitive with regional and international competitors; imposing withholding tax on dividends; overhauling capital allowances regime; preventing tax delinquents from benefiting from tax incentives and tax credits for research and development; limiting capital gains tax in lieu of a reduced transfer tax; and enhancing tax administration to increase compliance.
As part of the ERP, the Government committed itself to tax reforms that strengthen tax administration and significantly cut back the granting of tax incentives, exemptions and zero rates. The tax reform is meant to be targeted to significantly broaden the tax base, simplify the tax system, reduce economic distortions in the system and pave the way for a phased reduction in tax rates to a competitive level.
A number of tax measures consistent with the reform process were implemented between FY 2012/13 and FY 2013/14, including:
| | • | | Reducing the standard rate of GCT from 17.5% to 16.5%; |
| | • | | Partially widening the GCT base; and |
| | • | | Amending the GCT regime as it relates to electricity. |
The reduction in the GCT standard rate was consistent with the Government’s commitment to tax reform and reducing the rate applicable to taxable goods and services. The GCT base was partially widened in an effort to broaden the tax base and reduce administrative issues. This was accomplished by reducing the list of items for exempt and 0% GCT. A small number of basic foods and other critical items were retained because of their social sensitivity or significance to consumption by the most vulnerable. For electricity, GCT payable by residential customers was removed and the standard rate of 16.5% was levied on commercial entities and businesses.
Additionally, the Government reduced the statutory Corporate Income Tax (“CIT”) rate to be consistent with the standard Personal Income Tax (“PIT”) rate, so as to match international benchmarks. The CIT was modified as follows:
| | • | | The 33.33% rate was retained for the regulated companies, including those regulated by the Financial Services Commission (“FSC”), Office of Utilities Regulation (“OUR”), Bank of Jamaica and the Ministry of Finance and the Public Service; and |
| | • | | The rate was reduced to 25% from 33.33% for unregulated companies. |
There was no adjustment to rates applicable to building societies or life assurance companies. The reduction of the statutory CIT rate occurred in the context of the partial widening of the GCT base and an anticipation of enhanced compliance in the payment of CIT and other business taxes.
D-62
The asset tax for financial institutions and security dealers regulated by the FSC and Bank of Jamaica was modified to tax 0.14% of total assets of these financial institutions. The tax regime for non-financial institutions was also modified. An annual asset tax was implemented based on the asset value of these companies.
In keeping with equity and to ensure compliance with Jamaica’s trading partners, an adjustment was made to the termination fee structure that relates to mobile-to-mobile and mobile-to-land termination. OUR implemented the following fee structure:
| | • | | J$0.05 per minute on all calls originating and terminating on a fixed network in Jamaica; |
| | • | | J$0.40 per minute on all other calls (domestic and international) originating in Jamaica; and |
| | • | | US$0.075 per minute on all international calls for termination to the mobile network. |
Calls to emergency and special services are among a number of limited exceptions.
The tax free expenses of transportation and commissions were removed from the computation of output tax, which prevents operators in the tourism industry from claiming transportation and commission as a tax free expense when computing the output tax. The 10% GCT rate for the sector was retained. A Hotel Occupancy Room Rate Tax was also implemented, which ranges from US$2.00 to US$12.00 per night based on the number of rooms and size of the hotel.
On November 15, 2013, the Government adopted the Fiscal Incentives (Miscellaneous Provisions) Act 2013 and the Income Tax Relief (Large Scale Projects and Pioneer Industries Act) Act 2013:
| | • | | The Fiscal Incentives (Miscellaneous Provisions) Bill (“FIB”), and the tax law amendments arising out of it, eliminate existing sector-based incentive programs, provide generalized incentives for employment and capital investments, introduce a rule-based and non-discretionary tax system and encourage tax compliance. This included the repeal of a number of incentive legislations. The FIB also includes the simplification of the capital allowance regime under the Income Tax Act and the introduction of an employment tax credit for unregulated companies based on the statutory contributions paid onetime of up to 30% of the income tax payable from trading income. Furthermore, net loss carry forwards have been restricted to 50% of chargeable income for any year of assessment, except for the first 5 years of new businesses and entities with gross income of J$3.0 million or less. |
| | • | | The Income Tax Relief (Large-Scale Projects & Pioneer Industries) Bill provides a mechanism through which additional income tax incentives can be offered if the Minister of Finance designates a project as a large-scale project or an economic activity in a pioneer industry. |
On December 6, 2013, the Government enacted the Customs Tariff (Revision) (Amendment) Resolution and the Stamp Duty (Amendment of Schedule) Order, amending the Customs and Stamp Duty Act, respectively. The new regime reduces customs duty for many higher rate categories, such as jewelry and auto parts and provides a non-discretionary “productive inputs reliefs” for customs duty on items that are part of local production. There is a similar arrangement for some relief from additional stamp duty. These reforms are aimed at reducing the cost of doing business in Jamaica.
FY 2014/15 to 2016/17
Revenue measures implemented for FY 2014/15 to 2016/17 included, among others, the following:
| | • | | A withholding tax of 15% on insurance premiums paid by Jamaican residents to non-residents. First introduced in April 2014, modified in FY 2015/16 to exclude payments made by brokers and insurance agents to unconnected parties, and to be further amended in FY 2017/18 to reflect the original wording; |
D-63
| | • | | The Asset Tax rate applicable to regulated companies, excluding life insurance companies, was increased from 0.14% to 0.25% of the value of the assets in FY 2014/15; |
| | • | | The age for which the imposition of GCT would be applicable on the second sale of motor vehicles, was increased from 8 to 10 years in FY 2014/15; |
| | • | | The modified Asset Tax rate for life insurance companies was increased from 0.14% to 1.0% in FY 2014/15 for a period not exceeding one year. The rate was subsequently synchronized with other financial institutions in FY 2015/16 by reducing it to 0.25%, with a commitment for further reduction subject to the availability of fiscal space; |
| | • | | Standardization of Special Consumption Tax (“SCT”) rate on alcohol of J$1,120 per liter of pure alcohol for all categories, including the tourism sector introduced in FY 2014/15, now increased to J$1,230 per liter of pure alcohol; |
| | • | | Introduction of a Minimum Business Tax of J$60,000.0 annually, payable in equal amounts in June and September of each year; |
| | • | | Elimination of zero-rating under the GCT for government purchases, with the exception of public schools and the Jamaica Defense Force; |
| | • | | Replacement of the 1% petroleum levy with a specific SCT of J$2 per liter; |
| | • | | Rationalization of the Environmental Levy with the introduction of the 0.5% on domestic sales (excluding the services sector), as well as on imports from CARICOM; |
| | • | | Increase in the SCT on cigarettes introduced in March 2015 to $12 per stick, further increased to $14 per stick in May 2016, and now increased to $17 per stick in March 2017; |
| | • | | Increase in the Personal Income Tax (the “PIT”) annual threshold in two phases to J$1,500,096. As at July 1, 2016, the annual threshold will move from $592,800 to $1,000,272, with the second phase increase to $1,500,096 in April 2017. Statutory income of individuals earning in excess of $6 million now attracts a rate of 30%. For FY 2016/17, taxes garnered from the increased PIT threshold were J$3.1 billion higher than predicted; |
| | • | | Effective March 2015, outdated fees for trade and business licenses last amended in 1987 were rationalized to reflect the current economic cost of administering the Licences on Trade and Business Act; |
| | • | | Effective May 1, 2015, withholding tax on specified services at a rate of 3%, designed to improve compliance in the service industry by mandating certain service providers, including the major professions, to file an income tax return in order to obtain a credit for the tax withheld at source; and |
| | • | | Transfer pricing rules were introduced in December 2015 as a mechanism to protect Jamaica’s tax revenue from base erosion and profit shifting strategies carried out by Multi-National Enterprises. The rules reflects a clarification and enhancement of anti-avoidance provisions first introduced in 1970. The transfer pricing rules, which are based on the arm’s length principle and in accordance with OECD standards, took full effect in year of assessment 2016. |
FY 2017/18
Revenue measures consistent with the reform process to provide for revenue adequacy, base broadening and increased compliance efforts in order to ensure equitable distribution of the tax burden, which are being implemented in FY 2017/18 include the following:
| | • | | Increase the specific SCT rates on petrol by J$7 per liter; |
D-64
| | • | | GCT on group health insurance premiums were introduced at the standard rate of 16.5% as a means of broadening the GCT tax base within the context of a shift in tax strategy from direct to indirect taxes. The measure became effective in April 2017; and |
| | • | | GCT on consumption of electricity for residential purposes, reimposed in 2015 on monthly consumption in excess of 350 KWH is further revised in 2017 to impose GCT on monthly residential consumption in excess of 150 KWH. |
D-65
PUBLIC SECTOR INDEBTEDNESS
General
Under Section 116 of the Constitution, all loans charged on Jamaica’s Consolidated Fund, including all external debt payments such as those under the debt securities, represent a statutory charge on the revenue and assets of Jamaica. See “Public Finance—The Central Government Budget.” These statutory charges are paid without any requirement of Parliamentary approval, directly from revenue and assets, before funds are available to Jamaica for other policies and programs.
The Constitution and the Financial Administration and Audit Act give the Ministry of Finance and the Public Service overall responsibility for the management of Jamaica’s public debt. In November 2012, the House of Parliament approved the Public Debt Management Act, 2012, to make provision for the better management of the public debt. The legislation repealed the Loan Act of 1964 and several enactments related to the incurrence of debt by the Government and other connected matters. The Public Debt Management Act provides for the circumstances under which the Minister of Finance may borrow money, including to finance fiscal deficits, refinance any maturing or outstanding public debt and finance prepayments. The borrowing limits under the Public Debt Management Act are subject to the Financial Administration and Audit Act, as amended, which provides that the Minister of Finance may take any measure to, among others, reduce the fiscal balance to nil and reduce the total public debt of Jamaica to 96% of GDP by the end of 2020 and 60% of GDP by the end of the financial year ended March 31, 2026. As guided by the Public Debt Management Act, contingent liabilities as a percentage of GDP was 9.9% at December 31, 2016, declining from 10.4% at end FY 2015/16 and is targeted to fall to 3.0% by FY 2026/27. The above-mentioned targets may be exceeded under limited circumstances including parliamentary approval allowing suspension of the fiscal rules for a specified period during the occurrence of major adverse shocks such as natural disasters or a severe economic contraction. If the above were to occur, there would be an automatic correction mechanism that would allow for deviations to be addressed in a systematic manner with specified adjustment levels relative to whether the deviations exceeded either the lower threshold of 1.5% of GDP or the upper threshold of 3.5% of GDP.
Jamaica has never defaulted on any of its external or domestic debt obligations.
Domestic Debt
At March 31, 2017, Jamaica’s domestic debt was approximately J$848.5 billion, which excludes government-guaranteed securities. At December 31, 2016, Jamaica’s domestic debt, which excludes government-guaranteed securities, was J$834.3 billion, a decrease of 3.0% when compared to the domestic debt level at December 31, 2015. Jamaica has incurred domestic debt primarily to provide budgetary financing.
In addition to this level of domestic debt, Jamaica has guaranteed certain financial obligations of public sector entities, which carry out major infrastructure projects from time to time. At March 31, 2017, the extent of these internal guarantees was approximately J$37.6 billion.
Currently, Jamaica’s domestic debt consists mainly of Benchmark Investment Notes, following the JDX and NDX Initiatives (see below), which saw an exchange of some of the previously issued debt instruments (Local Registered Stocks and Debentures). At December 31, 2016, 8.8% of the outstanding domestic debt was scheduled to mature within one year, 33.8% between one and five years and the remaining 57.4% after five years. The interest rate composition of the domestic debt at December 31, 2016, was 59.5% contracted on a fixed rate basis, while 40.4% was contracted on a floating interest rate basis and 0.1% was non-interest bearing.
At March 31, 2017, 9.6% of Jamaica’s domestic debt was scheduled to mature in one year, 37.4% in five years and the remaining 53.0% after five years. At March 31, 2017, approximately 39.7% of the domestic debt was on a floating rate basis, 60.2% on a fixed rate basis and 0.1% represented non-interest bearing debt. Of the total debt at March 31, 2017, 8.1% was denominated in foreign currency (US$) and 91.9% was J$-denominated.
D-66
At December 31, 2016, Jamaica had J$831.7 billion of domestic bonds and securities outstanding, representing 99.7% of total domestic debt. This represented a J$25.7 billion, or 3.0%, decrease over the level outstanding at December 31, 2015. The remaining J$2.6 billion, or 0.3%, is comprised of loans.
The outstanding stock of Treasury bills at December 31, 2016, was J$4.9 billion, representing 0.6% of total domestic debt. Treasury bills are auctioned on a multiple-price basis. Jamaica issues both local and foreign currency-denominated bonds in the domestic market. Foreign currency denominated bonds that are issued in Jamaica are classified as domestic debt. Of the total domestic debt at December 31, 2016, 8.1% or J$67.6 billion was denominated in foreign currency (US$) and the remaining J$766.7 billion, or 91.9%, was J$-denominated.
The following table shows domestic debt by instrument type for the last five years as at December 31, 2016, and as at March 31, 2017:
Domestic Debt by Instrument Type
| | | | | | | | | | | | | | | | | | | | | | | | |
| | | December 31, | | | March 31 | |
| | | 2012 | | | 2013 | | | 2014 | | | 2015 | | | 2016 | | | 2017 | |
| | | (in millions of J$) | |
Securities | | | | | | | | | | | | | | | | | | | | | | | | |
Treasury Bills | | | 4,000.0 | | | | 4,000.0 | | | | 4,000.0 | | | | 4,000.0 | | | | 4,888.0 | | | | 5,120.1 | |
Local Registered Stocks | | | — | | | | — | | | | — | | | | — | | | | — | | | | — | |
J$ Benchmark Notes(1) | | | 773,786.3 | | | | 761,731.2 | | | | 753,374.8 | | | | 739,416.6 | | | | 714,457.8 | | | | 727,984.5 | |
| | | | | | | | | | | | | | | | | | | | | | | | |
Total | | | 777,786.3 | | | | 765,731.2 | | | | 757,374.8 | | | | 743,416.6 | | | | 719,345.8 | | | | 733,104.6 | |
| | | | | | | | | | | | | | | | | | | | | | | | |
Bonds | | | | | | | | | | | | | | | | | | | | | | | | |
Land | | | — | | | | — | | | | — | | | | — | | | | | | | | | |
US$ Denominated | | | 186,469.3 | | | | 244,943.4 | | | | 243,361.7 | | | | 69,945.9 | | | | 67,607.1 | | | | 67,726.5 | |
US$ Indexed | | | — | | | | — | | | | — | | | | — | | | | | | | | | |
CPI Indexed Bonds (1) | | | 26,734.7 | | | | 39,884. 6 | | | | 42,954.9 | | | | 44,028.7 | | | | 44,783.8 | | | | 45,234.1 | |
| | | | | | | | | | | | | | | | | | | | | | | | |
Total | | | 213,203.9 | | | | 284,827.9 | | | | 286,316.5 | | | | 113,974.6 | | | | 112,390.9 | | | | 112,960.6 | |
| | | | | | | | | | | | | | | | | | | | | | | | |
Loans | | | | | | | | | | | | | | | | | | | | | | | | |
Commercial Banks | | | 3,304.0 | | | | 2,793.0 | | | | 2,450.0 | | | | 2,275.0 | | | | 2,100.0 | | | | 2,012.5 | |
Other (including Public Sector) | | | 936.6 | | | | 821.9 | | | | 709.0 | | | | 596.4 | | | | 483.2 | | | | 428.2 | |
| | | | | | | | | | | | | | | | | | | | | | | | |
Total | | | 4,240.6 | | | | 3,614.9 | | | | 3,159.0 | | | | 2,871.4 | | | | 2,583.2 | | | | 2,440.7 | |
| | | | | | | | | | | | | | | | | | | | | | | | |
Total | | | 995,230.9 | | | | 1,054,174.0 | | | | 1,046,850.3 | | | | 860,262.6 | | | | 834,319.9 | | | | 848,505.9 | |
| | | | | | | | | | | | | | | | | | | | | | | | |
| (1) | These instruments were issued as part of JDX. See “—The Jamaica Debt Exchange.” |
Source: Ministry of Finance and the Public Service.
D-67
The following table shows the amortization schedule over the next five years for domestic debt outstanding as at March 31, 2017:
Domestic Debt Amortization Schedule
as at March 31, 2017
| | | | | | | | | | | | | | | | | | | | |
| | | 2017 | | | 2018 | | | 2019 | | | 2020 | | | 2021 | |
| | | (in millions of J$) | |
Bonds(1) | | | 74,857.3 | | | | 61,929.2 | | | | 49,062.2 | | | | 153,554.7 | | | | 2,995.0 | |
Loans | | | 289.5 | | | | 2,038.3 | | | | 103.7 | | | | 100.4 | | | | 50.2 | |
| | | | | | | | | | | | | | | | | | | | |
Total | | | 75,146.8 | | | | 63,967.5 | | | | 49,165.9 | | | | 153,655.1 | | | | 3,045.2 | |
| | | | | | | | | | | | | | | | | | | | |
Source: Ministry of Finance and the Public Service.
The following table shows the interest schedule over the next five years for domestic debt outstanding as at March 31, 2017:
Central Government Domestic Debt Interest Schedule
as at March 31, 2017
| | | | | | | | | | | | | | | | | | | | |
| | | 2017 | | | 2018 | | | 2019 | | | 2020 | | | 2021 | |
| | | (in millions of J$) | |
Bonds(1) | | | 59,349.7 | | | | 58,913.0 | | | | 53,319.9 | | | | 44,890.3 | | | | 41,930.5 | |
Loans | | | 645.0 | | | | 599.1 | | | | 497.3 | | | | 498.5 | | | | 497.1 | |
| | | | | | | | | | | | | | | | | | | | |
Total | | | 59,994.7 | | | | 59,512.1 | | | | 53,817.2 | | | | 45,388.8 | | | | 42,427.6 | |
| | | | | | | | | | | | | | | | | | | | |
Source: Ministry of Finance and the Public Service.
The following table shows the maturity structure of domestic debt outstanding as at March 31, 2017:
Domestic Debt Maturity Structure
as at March 31, 2017
| | | | | | | | | | | | | | | | | | | | |
| | | Less than
1 year | | | 1-5 years(1) | | | 5-10 years(1) | | | 10 years
& over (2) | | | Total | |
| | | (in millions of J$) | |
J$ Benchmark Notes | | | 75,978.8 | | | | 246,890.6 | | | | 162,676.4 | | | | 287,672.7 | | | | 773,218.5 | |
US$-Denominated Notes & Loans | | | — | | | | 67,726.5 | | | | — | | | | — | | | | 67,726.5 | |
Treasury Bills | | | 5,120.1 | | | | — | | | | — | | | | — | | | | 5,120.1 | |
Commercial Bank & Public Sector Entity Loans | | | — | | | | 2,440.7 | | | | — | | | | — | | | | 2,440.7 | |
Other | | | — | | | | — | | | | — | | | | 0.1 | | | | 0.1 | |
| | | | | | | | | | | | | | | | | | | | |
Total | | | 81,098.8 | | | | 317,057.8 | | | | 162,676.4 | | | | 287,672.89 | | | | 848,505.9 | |
| | | | | | | | | | | | | | | | | | | | |
Source: Ministry of Finance and the Public Service.
D-68
The following table shows the interest rate composition of domestic debt outstanding as at March 31, 2017:
Domestic Debt Interest Rate Composition
as at March 31, 2017
| | | | | | | | |
| | | Principal Amount
Outstanding | | | Share of Outstanding
Debt | |
| | | (in millions of J$) | | | (%) | |
Variable Rate Debt | | | 336,875.5 | | | | 39.7 | |
Fixed Rate Debt | | | 511,228.8 | | | | 60.2 | |
Non-Interest-Bearing Debt | | | 401.6 | | | | 0.1 | |
| | | | | | | | |
Total Debt | | | 848,505.9 | | | | 100.00 | |
| | | | | | | | |
Source: Ministry of Finance and the Public Service.
External Debt
At March 31, 2017, total external debt was US$10,183.9 million, of which 96.7% was denominated in US dollars, 1.5% was denominated in Euro, 0.3% was denominated in Yen, 1.2% was denominated in Chinese Yuan and 0.3% in other currencies.
At December 31, 2016, public sector external debt was US$10,244.0 million, a decrease of 0.7% from December 31, 2015, of which 96.6% was denominated in US dollars, 1.5% was denominated in Euro, 0.3% denominated in Yen and 1.3% was denominated in Chinese Yuan. Official creditors, comprising bilateral and multilateral obligations, accounted for US$4,407.1 million, or 43.0%, of total public sector external debt, representing the second largest creditor category of Jamaica’s public sector external debt. Bond issuances of US$5,610.3 million represented 54.8% of total public sector external debt at December 31, 2016. Multilateral indebtedness was US$3,703.8 million, an increase of 4.9% over December 31, 2015.
Bilateral and multilateral obligations accounted for 42.7% of total public sector external debt at March 31, 2017 and represented the second largest creditor category of Jamaica’s public sector external debt. Bond issues of US$5,610.3 million accounted for 55.1% of total public sector external debt at March 31, 2017. Multilateral indebtedness was US$3,671.9 million, a decrease of 0.9% over December 31, 2016.
The IDB, for the period 2006—2009, approved a new country strategy for Jamaica in which the bank links its loans to budget support rather than investment loans. Traditional investment loans may also be used if joint agreement is reached between the bank and the Government. The IDB now provides funding for budgetary support, which is accessed through its policy-based loan facility.
In December 2001, Jamaica issued US$250.0 million 11.625% fixed rate notes due 2022. In June 2002, Jamaica registered a US$700.0 million shelf registration statement with the US Securities and Exchange Commission and subsequently in June 2002, issued US$300.0 million 10.625% notes due 2017 off that shelf. In April 2004, US$125.0 million was raised through the re-opening of the existing US$300.0 million 10.625% bonds due 2017. In October 2005, Jamaica made further issuances of 9.25% US$250.0 million notes due 2025 and in February 2006, 8.50% US$250.0 million notes due 2036. In March 2007, Jamaica issued US$350.0 million 8.0% fixed rate Amortizing Notes due 2039. In October 2007, Jamaica reopened its 8.0% fixed rate Amortizing Notes due 2039 for an additional US$150.0 million. In June 2008, Jamaica issued US$350.0 million 8.0% fixed rate Amortizing Notes due 2019. In February 2011, Jamaica reopened the US$350.0 million 8.0% fixed rate bond due 2019, raising an additional US$400.0 million 8.0% due 2019. In July 2014, Jamaica issued an additional US$800.0 million 7.625% fixed rate notes due 2025. In July 2015, Jamaica issued US$1.35 billion 6.75% notes due April 2028 and US$650.0 million 7.875% notes due July 28, 2045. On August 30, 2016, the Government settled a tender of US$317.8 million of its 10.625% Notes due 2017 and US$467.4 million of its 8.000% Amortizing Notes due 2019 in exchange for US$743.2 million of its 8.000% Amortizing Notes due 2039.
In September 2006, Jamaica issued US$200.0 million in guarantees with respect to bonds to facilitate the restructuring of certain indebtedness of CAP. These bonds were exchanged for bonds of the Government in September 2013. In June 2007, Jamaica issued US$125.0 million in guarantees with respect to bonds issued by Air Jamaica. In 2009, Jamaica issued a US$60.0 million guarantee with respect to the expansion of the Norman Manley International Airport in Kingston. In July 2009, Jamaica issued a guarantee for US$121.65 million to HSBC Bank plc for the financing of the Falmouth Cruise Ship Terminal. Additionally, in December 2009 the Government of Jamaica issued a guarantee to NWC for three loans in respect of The Jamaica Water Supply Improvement Project. The loans were in the amounts of J$1,513.6 million, US$19.3 million and €43.3 million. In October 2010, the Government guaranteed a bond issued by the NWC in the amount of US$275.0 million.
D-69
In February 2010 the Government guaranteed a loan of US$340.0 million to the Road Maintenance Fund from China through the Export-Import Bank of China under its global Preferential Buyer’s Credit (“PBC”). The purposes of the loan are to finance (a) the rehabilitation of roads damaged by hurricanes and (b) an upgrade in infrastructure to certain roads and drainage. A loan of US$20.0 million between the Caribbean Development Bank and the Student Loan Bureau was also guaranteed in November 2010. This loan is to facilitate the provision of affordable and adequate financing to students from poor and vulnerable households to complete tertiary level programs in approved institutions in Jamaica and the Caribbean. In November 2011, the Government guaranteed a bond issued by the NROCC in the amount of US$294.2 million. The bond carries a coupon of 9.375% and is due to mature in 2024. On December 9, 2011, the Government guaranteed a loan, issued by IDB, to the National Water Commission, the purpose of which was to improve the water supply in the Kingston metropolitan area.
In September 2011, the World Bank provided the Government with a US$100.0 million Programmatic Fiscal Sustainability Development Policy Loan. The objective of the loan is to enhance fiscal and debt sustainability, increase the efficiency of financial management and budget processes, and reduce distortions and enhance efficiency in the tax system. On the same day, the IDB also issued a US$65.0 million loan intended to support a sustainable fiscal position by strengthening the Ministry of Finance and the Public Service’s institutional capacity. On December 13, 2012, the IDB issued a U$30.0 million loan that intended to support the Government’s efforts to improve human capital and labor market outcomes of the poor by enhancing the efficiency and effectiveness of key social protection programs. In October 2013, the IDB provided the Government with a US$60.0 million Public Financial and Performance Management Loan. In December 2013, the World Bank issued a US$130.0 million Economic and Stabilization and Foundation for Growth Development Policy Loan. In February 2014, the IDB provided a US$80.0 million Fiscal Structural Programme for Economic Growth Loan and a US$60.0 million Competitive Enhancement Programme Loan.
In September 2013, the Government completed an exchange offer, in which Jamaica exchanged all of the 8.50% Amortizing Notes due 2021 issued by CAP (and guaranteed by the Government) for 8.50% Amortizing Notes due 2021 issued by the Government. There was no increase in the Government’s debt as a result of the exchange offer.
The Government, as a part of its debt management strategy, executed a liability management exercise through the buyback of high cost near term maturities. On September 2, 2014, the Government repurchased US$37.88 million nominal amount of the US$300.0 million 9% notes due to mature in 2015. Similarly, on December 2014 the Government repurchased US$14.0 million nominal amount of the US$425.0 million 10.625% notes due 2017 and US$9.0 million nominal amount of US$161.9 million 8.5% Amortizing Note due 2021. In January 2016, the Government also repurchased US$14.0 million of the US$350.0 million 7.875% notes due 2045. In August 2016, the Government repurchased US$4.6 million nominal amount of the 6.75% Amortizing Note due 2028 and US$450,000 nominal amount of the 8.5% Amortizing Note due 2021.
Upon the IMF approval of the EFF, certain funds from multilateral and development agencies, such as the World Bank, IDB and the European Union, were made available to the Government. See “The Jamaican Economy—IMF Arrangements—Standby Arrangement and Extended Fund Facility.”
D-70
The following table shows medium and long-term public and publicly guaranteed external debt by creditor category for the four years ended December 31, 2016 and other periods as indicated:
External Debt by Creditor
| | | | | | | | | | | | | | | | | | | | |
| | | December 31,
2013 | | | December 31,
2014 | | | December 31,
2015 | | | December 31,
2016 | | | March 31,
2017 | |
| | | (in millions of US$) | |
Bilateral | | | | | | | | | | | | | | | | | | | | |
OECD | | | 235.2 | | | | 163.6 | | | | 130.8 | | | | 99.8 | | | | 97.9 | |
Non-OECD | | | 620.3 | | | | 663.0 | | | | 652.1 | | | | 603.6 | | | | 583.5 | |
| | | | | | | | | | | | | | | | | | | | |
Total | | | 855.5 | | | | 826.6 | | | | 782.9 | | | | 703.4 | | | | 681.4 | |
Multilateral | | | | | | | | | | | | | | | | | | | | |
IDB(1) | | | 1,281.1 | | | | 1,413.9 | | | | 1,563.6 | | | | 1,692.8 | | | | 1,669.4 | |
IMF(2) | | | 836.7 | | | | 665.2 | | | | 655.6 | | | | 751.3 | | | | 758.9 | |
IBRD(3) | | | 779.1 | | | | 753.8 | | | | 825.5 | | | | 809.1 | | | | 799.2 | |
Other(4) | | | 513.1 | | | | 511.9 | | | | 484.8 | | | | 450.7 | | | | 444.3 | |
| | | | | | | | | | | | | | | | | | | | |
Total | | | 3,410.0 | | | | 3,344.8 | | | | 3,529.5 | | | | 3,703.9 | | | | 3,671.8 | |
Commercial Banks | | | 386.8 | | | | 351.1 | | | | 290.3 | | | | 216.7 | | | | 210.5 | |
Other Commercial(5) | | | 21.0 | | | | 14.3 | | | | 11.5 | | | | 9.9 | | | | 9.9 | |
| | | | | | | | | | | | | | | | | | | | |
Total | | | 407.8 | | | | 365.4 | | | | 301.8 | | | | 226.6 | | | | 220.4 | |
Bonds | | | 3,636.8 | | | | 4,121.8 | | | | 5,699.8 | | | | 5,610.3 | | | | 5,610.3 | |
| | | | | | | | | | | | | | | | | | | | |
Total | | | 8,310.0 | | | | 8,658.6 | | | | 10,314.0 | | | | 10,244.2 | | | | 10,183.9 | |
| | | | | | | | | | | | | | | | | | | | |
| (1) | Inter-American Development Bank. |
| (2) | International Monetary Fund. |
| (3) | International Bank for Reconstruction and Development. |
| (4) | Caribbean Development Bank, OPEC Fund for International Development, European Development Bank, European Economic Commission Community and Nordic Development Fund. |
Source: Ministry of Finance and the Public Service.
The following table shows Jamaica’s external debt by debtor for the four years ended December 31, 2016 and other periods as indicated:
External Debt by Debtor
| | | | | | | | | | | | | | | | | | | | |
| | | December 31,
2013 | | | December 31,
2014 | | | December 31,
2015 | | | December 31,
2016 | | | March 31,
2017 | |
| | | (in millions of US$) | |
Government Direct | | | 6,291.7 | | | | 6,952.8 | | | | 8,778.3 | | | | 8,640.5 | | | | 8,891.4 | |
Government-Guaranteed | | | 1,269.5 | | | | 1,257.3 | | | | 1,087.5 | | | | 1,053.8 | | | | 737.2 | |
Bank of Jamaica | | | 478.8 | | | | 448.5 | | | | 448.1 | | | | 549.7 | | | | 555.3 | |
| | | | | | | | | | | | | | | | | | | | |
Total | | | 8,310.0 | | | | 8,658.6 | | | | 10,313.9 | | | | 10,244.0 | | | | 10,183.9 | |
| | | | | | | | | | | | | | | | | | | | |
Source: Ministry of Finance and the Public Service.
D-71
The following table shows the amortization schedule for external debt outstanding as at March 31, 2017:
External Debt Principal Amortization Schedule
as at March 31, 2017
| | | | | | | | | | | | | | | | | | | | |
| | | 2017 | | | 2018 | | | 2019 | | | 2020 | | | 2021 | |
| | | (in millions of US$) | |
Multilateral | | | | | | | | | | | | | | | | | | | | |
IDB | | | 103.4 | | | | 100.9 | | | | 108.0 | | | | 114.0 | | | | 106.0 | |
IBRD | | | 46.5 | | | | 40.2 | | | | 24.4 | | | | 33.9 | | | | 56.9 | |
Other | | | 56.0 | | | | 93.0 | | | | 127.8 | | | | 142.5 | | | | 63.0 | |
| | | | | | | | | | | | | | | | | | | | |
Total | | | 205.6 | | | | 233.9 | | | | 259.9 | | | | 290.2 | | | | 225.9 | |
| | | | | | | | | | | | | | | | | | | | |
Commercial Banks | | | 71.2 | | | | 52.3 | | | | 42.1 | | | | 28.2 | | | | 0.0 | |
Other Commercial | | | 1.0 | | | | 1.0 | | | | 1.0 | | | | 1.0 | | | | 0.0 | |
Bonds | | | 688.7 | | | | 277.7 | | | | 277.7 | | | | 27.7 | | | | 27.7 | |
Bilateral | | | 78.1 | | | | 104.3 | | | | 96.4 | | | | 93.2 | | | | 88.2 | |
| | | | | | | | | | | | | | | | | | | | |
Total | | | 1,045.3 | | | | 669.7 | | | | 677.3 | | | | 440.3 | | | | 341.8 | |
| | | | | | | | | | | | | | | | | | | | |
Source: Ministry of Finance and the Public Service.
The following table shows the interest schedule for external debt outstanding as at March 31, 2016:
External Debt Interest Schedule
as of March 31, 2017
| | | | | | | | | | | | | | | | | | | | |
| | | 2017 | | | 2018 | | | 2019 | | | 2020 | | | 2021 | |
| | | (in millions of US$) | |
Multilateral | | | | | | | | | | | | | | | | | | | | |
IDB | | | 28.1 | | | | 26.4 | | | | 24.5 | | | | 22.5 | | | | 28.2 | |
IBRD | | | 11.3 | | | | 10.7 | | | | 10.2 | | | | 10.0 | | | | 15.3 | |
Other | | | 21.6 | | | | 20.4 | | | | 14.3 | | | | 11.0 | | | | 6.6 | |
| | | | | | | | | | | | | | | | | | | | |
Total | | | 60.0 | | | | 56.4 | | | | 48.0 | | | | 42.5 | | | | 50.1 | |
| | | | | | | | | | | | | | | | | | | | |
Commercial Banks | | | 9.2 | | | | 6.6 | | | | 4.6 | | | | 2.9 | | | | 0.0 | |
Other Commercial | | | 0.7 | | | | 0.6 | | | | 0.5 | | | | 0.5 | | | | 0.0 | |
Bonds | | | 431.7 | | | | 387.2 | | | | 364.9 | | | | 352.6 | | | | 409.4 | |
Bilateral | | | 21.6 | | | | 21.9 | | | | 19.9 | | | | 17.4 | | | | 14.4 | |
| | | | | | | | | | | | | | | | | | | | |
Total | | | 523.2 | | | | 472.6 | | | | 437.8 | | | | 415.9 | | | | 473.9 | |
| | | | | | | | | | | | | | | | | | | | |
Source: Ministry of Finance and the Public Service.
D-72
The following table shows the maturity structure for external debt outstanding as at March 31, 2017:
Total External Debt Maturity Structure
as of March 31, 2017
| | | | | | | | | | | | | | | | | | | | |
| | | Less than
1 year | | | 1-5
years | | | 5-10
years | | | 10 years
& over | | | Total | |
| | | (in millions of US$) | |
Bilateral | | | 26.1 | | | | 79.8 | | | | 371.8 | | | | 203.6 | | | | 681.3 | |
Multilateral | | | 4.3 | | | | 130.1 | | | | 869.8 | | | | 2667.7 | | | | 3671.9 | |
IDB | | | 1.2 | | | | 71.9 | | | | 50.3 | | | | 1,546.1 | | | | 1,669.4 | |
IBRD | | | 3.1 | | | | 34.6 | | | | 21.3 | | | | 740.2 | | | | 799.2 | |
IMF | | | 0.0 | | | | 0.0 | | | | 758.9 | | | | 0.0 | | | | 758.9 | |
Other | | | 0.0 | | | | 23.6 | | | | 39.3 | | | | 381.4 | | | | 444.3 | |
Commercial Bank | | | 16.0 | | | | 143.9 | | | | 50.5 | | | | 0.0 | | | | 210.5 | |
Other Commercial | | | 0.0 | | | | 0.00 | | | | 9.9 | | | | 0.0 | | | | 9.9 | |
Bonds | | | 79.1 | | | | 358.5 | | | | 1,594.2 | | | | 3,578.6 | | | | 5,610.3 | |
| | | | | | | | | | | | | | | | | | | | |
Total | | | 125.5 | | | | 712.3 | | | | 2,896.2 | | | | 6,444.9 | | | | 10,183.9 | |
| | | | | | | | | | | | | | | | | | | | |
Percentage | | | 1.2 | | | | 7.0 | | | | 28.5 | | | | 63.3 | | | | 100.0 | |
| | | | | | | | | | | | | | | | | | | | |
Source: Ministry of Finance and the Public Service.
The following table shows interest rate composition for external debt as at March 31, 2017:
External Debt Interest Rate Composition as at March 31, 2017
| | | | | | | | |
| | | Principal Amount
Outstanding | | | Share of
Outstanding Debt | |
| | | (in millions of US$) | | | (%) | |
Variable Rate Debt | | | 3,128.3 | | | | 30.7 | |
Fixed Rate Debt | | | 7,055.6 | | | | 69.3 | |
| | | | | | | | |
Total Debt | | | 10,183.9 | | | | 100.0 | |
| | | | | | | | |
Source: Ministry of Finance and the Public Service.
D-73
The following table shows external public and publicly guaranteed debt (including Bank of Jamaica debt) as at December 31, 2016 and at March 31, 2017.
External Public and Publicly Guaranteed Debt (including Bank of Jamaica debt) (1)
| | | | | | | | | | | | | | | | | | | | | | |
| | | Interest | | | Issue Date | | Final Maturity | | | Currencies | | | Principal
Amount
Outstanding at
December 31, 2016 | | | Principal Amount
Outstanding at
March 31, 2017 | |
| | | % | | | | | | | | | | | (in US$) | | | (in US$) | |
Multilateral Organizations World Bank | | | Various | | | Various | | | Various | | |
| USD, JPK, GBP,
CAD, EUR |
| | | 809,073,262.0 | | | | 799,206,711.0 | |
Inter-American Dev. Bank | | | Various | | | Various | | | Various | | |
| USD, JPK, GBP,
CAD, EUR |
| | | 1,692,764,602.0 | | | | 1,669,419,025.0 | |
Others | | | Various | | | Various | | | Various | | |
| USD, JPK, GBP,
CAD, EUR, SDR |
| | | 450,.654,416 | | | | 444.295,974 | |
IMF(2) | | | | | | | | | | | | | | | | | 751,284,184.0 | | | | 758,937,907.0 | |
| | | | | | | | | | | | | | | | | | | | | | |
Total Multilateral Organizations | | | | | | | | | | | | | | | | | 3,703,776,646.0 | | | | 3,671,859,617.0 | |
| | | | | | | | | | | | | | | | | | | | | | |
Foreign Governments (including Original Loans and Paris Club) | | | Various | | | Various | | | Various | | |
| USD, JPK, GBP,
CAD, EUR |
| | | 703,366,047.0 | | | | 681,404,457.0 | |
| | | | | | | | | | | | | | | | | | | | | | |
Bonds (Global) USD | | | | | | | | | | | | | | | | | | | | | | |
USD250 mn 2022 | | | 11.625 | % | | Dec. 19,
2001 | | | Jan. 15, 2022 | | | | USD | | | | 250,000,000.0 | | | | 250,000,000. 0 | |
USD300 mn 2017 | | | 10.625 | % | | June 20,
2002 | | | June 20, 2017 | | | | USD | | | | 79,049,758.0 | | | | 79,049758.0 | |
USD125 mn 2017 | | | 10.625 | % | | April 27,
2004 | | | June 20, 2017 | | | | USD | | | | 0.0 | | | | 0.0 | |
USD250 mn 2025 | | | 9.25 | % | | October 18,
2005 | | | October 18, 2025 | | | | USD | | | | 250,000,000.0 | | | | 250,000,000. 0 | |
USD250 mn 2036 | | | 8.50 | % | | February 28,
2006 | | | February 28, 2036 | | | | USD | | | | 250,000,000.0 | | | | 250,000,000.0 | |
USD200 mn 2021 | | | 8.5 | % | | Nov. 16,
2006 | | | Nov. 16, 2021 | | | | USD | | | | 78,306,309.0 | | | | 78,306,309.0 | |
USD125 mn 2027 | | | 8.125 | % | | June 2007 | | | July 2027 | | | | USD | | | | 103,887,000.0 | | | | 103,887,000.0 | |
USD150 mn 2039 | | | 8.0 | % | | October 11,
2007 | | | March 15, 2039 | | | | USD | | | | 1,243,238,000.0 | | | | 1,243,238,000.0 | |
USD350 mn 2039 | | | 8.0 | % | | March 15,
2007 | | | March 15, 2039 | | | | USD | | | | 0.0 | | | | 0.0 | |
USD350 mn 2019 | | | 8.0 | % | | June 24,
2008 | | | June 24, 2019 | | | | USD | | | | 280,169,400.0 | | | | 280,169,400.0 | |
USD400 mn 2019 | | | 8.0 | % | | February 14,
2011 | | | June 24, 2019 | | | | USD | | | | 0.0 | | | | 0.0 | |
USD294.18mn 2024 | | | 9.375 | % | | Nov 3,
2011 | | | Nov 10, 2024 | | | | USD | | | | 294,180,000.0 | | | | 294,180,000.0 | |
USD$800mn 2025 | | | 7.625 | % | | July 9,
2014 | | | July 9, 2025 | | | | USD | | | | 800,000,000.0 | | | | 800,000,000.0 | |
USD$1,350mn 2028 | | | 6.75 | % | | July 28,
2015 | | | April 28, 2028 | | | | USD | | | | 1,345,450,000.0 | | | | 1,345,450,000.0 | |
USD$650mn 2045 | | | 7.875 | % | | July 28,
2015 | | | July 28, 2045 | | | | USD | | | | 636,000,000.0 | | | | 636,000,000.0 | |
| | | | | | | | | | | | | | | | | | | | | | |
Total (Global) USD | | | | | | | | | | | | | | | | | 5,610,280,467.0 | | | | 5,610,280,467.0 | |
| | | | | | | | | | | | | | | | | | | | | | |
Commercial Banks | | | Various | | | Various | | | Various | | | | USD | | | | 216,645,633.0 | | | | 210,477,351.0 | |
| | | | | | | | | | | | | | | | | | | | | | |
Other Commercial (Export Credit) | | | Various | | | Various | | | Various | | |
| USD, JPK, GBP,
CAD, EUR |
| | | 9,925,582.0 | | | | 9,925,582.0 | |
Total | | | | | | | | | | | | | | | | | 10,243,994,193.0 | | | | 10,183,947,474.0 | |
| | | | | | | | | | | | | | | | | | | | | | |
| (1) | LEGEND: USD = United States Dollar; CAD = Canadian Dollar; JPK = Japanese Yen; EUR = Euro; SDR = Special Drawing Rights. |
| (2) | These are amounts disbursed under the SBA. |
D-74
The following table shows external public direct debt as at December 31, 2016 and at March 31, 2017.
External Public Direct Debt (1)
| | | | | | | | | | | | | | | | | | | | | | | | |
| | | Interest | | | Issue Date | | | Final Maturity | | | Currencies | | | Principal
Amount
Outstanding at
December 31, 2016 | | | Principal
Amount
Outstanding at
March 31, 2017 | |
| | | % | | | | | | | | | | | | (in US$) | | | (in US$) | |
Multilateral Organizations World Bank | | | Various | | | | Various | | | | Various | | |
| USD, JPK, GBP,
CAD, EUR |
| | | 809,073,262 | | | | 799,206,711.0 | |
Inter-American Dev. Bank | | | Various | | | | Various | | | | Various | | |
| USD, JPK, GBP,
CAD, EUR, UOA |
| | | 1,577.,444,039.0 | | | | 1,554,769,221.0 | |
Others | | | Various | | | | Various | | | | Various | | |
| USD, JPK, GBP,
CAD, EUR, SDR |
| | | 538,774,407.0 | | | | 537,068,773.0 | |
| | | | | | | | | | | | | | | | | | | | | | | | |
Total Multilateral Organizations | | | | | | | | | | | | | | | | | | | 2,925,291,708.0 | | | | 2,891,044,705.0 | |
| | | | | | | | | | | | | | | | | | | | | | | | |
Foreign Governments (including Original Loans and Paris Club) | | | Various | | | | Various | | | | Various | | |
| USD, JPK, GBP,
CAD, EUR |
| | | 391,144,137.0 | | | | 675,274,037.0 | |
| | | | | | | | | | | | | | | | | | | | | | | | |
Bonds (Global) USD | | | | | | | | | | | | | | | | | | | | | | | | |
USD300 mn 2017 | | | 10.625 | % | |
| June 20,
2002 |
| | | June 20, 2017 | | | | USD | | | | 79,049,758.0 | | | | 79,049,758.0 | |
US$125 mn 2017 | | | 10.625 | % | |
| April 30,
2004 |
| | | June 20, 2017 | | | | USD | | | | 0.0 | | | | 0.0 | |
USD250 mn 2022 | | | 11.625 | % | |
| Dec. 19,
2001 |
| | | Jan. 15, 2022 | | | | USD | | | | 250,000,000.0 | | | | 250,000,000.0 | |
USD250 mn 2025 | | | 9.25 | % | |
| October 18,
2005 |
| | | October 17, 2025 | | | | USD | | | | 250,000,000.0 | | | | 250,000,000.0 | |
USD250 mn 2036 | | | 8.50 | % | |
| February 28,
2006 |
| | | February 28, 2036 | | | | USD | | | | 250,000,000.0 | | | | 250,000,000.0 | |
USD150 mn 2039 | | | 8.0 | % | |
| October 11,
2007 |
| | | March 15, 2039 | | | | USD | | | | 1,243,238,000.0 | | | | 1,243,238,000.0 | |
USD350 mn 2039 | | | 8.0 | % | |
| March 15,
2007 |
| | | March 15, 2039 | | | | USD | | | | 0.0 | | | | 0.0 | |
USD350 mn 2019 | �� | | 8.0 | % | |
| June 24,
2008 |
| | | June 24, 2019 | | | | USD | | | | 0.0 | | | | 0.0 | |
USD400 mn 2019 | | | 8.0 | % | |
| February 14,
2011 |
| | | June 24, 2019 | | | | USD | | | | 280,169,400.0 | | | | 280,169,400.0 | |
USD200 mn 2021 | | | 8.50 | % | |
| September 5,
2013 |
| | | November 16, 2021 | | | | USD | | | | 78,306,309.0 | | | | 78,306,309.0 | |
USD 800 mn 2025 | | | 7.625 | % | | | July 9, 2014 | | | | July 9, 2025 | | | | USD | | | | 800,000,000.0 | | | | 800,000,000.0 | |
USD 1,350 mn 2028 | | | 6.75 | % | |
| July 28,
2015 |
| | | April 28, 2028 | | | | USD | | | | 1,345,450,000.0 | | | | 1,345,450,000.0 | |
USD 650 mn 2045 | | | 7.875 | % | |
| July 28,
2015 |
| | | July 28, 2045 | | | | USD | | | | 636,000,000.0 | | | | 636,000,000.0 | |
| | | | | | | | | | | | | | | | | | | | | | | | |
Total (Global) USD | | | | | | | | | | | | | | | | | | | 5,212,213,467.0 | | | | 5,212,213,467.0 | |
| | | | | | | | | | | | | | | | | | | | | | | | |
Commercial Banks | | | Various | | | | Various | | | | Various | | | | USD | | | | 111,853,872.0 | | | | 112,855,187.0 | |
Other Commercial (Export Credit) | | | Various | | | | Various | | | | Various | | | | USD | | | | 0.0 | | | | 0.0 | |
| | | | | | | | | | | | | | | | | | | | | | | | |
Total | | | | | | | | | | | | | | | | | | | 8,640,503,184.0 | | | | 8,891,387,396.0 | |
| | | | | | | | | | | | | | | | | | | | | | | | |
D-75
| (1) | LEGEND: USD = United States Dollar; CAD = Canadian Dollar; JPK = Japanese Yen; EUR = Euro; SDR = Special Drawing Rights, which are units of measure derived from a group of currencies which constitute the International Monetary Fund loan portfolio; UOA = Units of Accounts, which are units of measure derived from a group of currencies which constitute the Inter-American Development Bank loan portfolio; GBP = British Pound Sterling. |
The following table shows external guaranteed debt as at December 31, 2016 and at March 31, 2017.
External Guaranteed Debt(1)
| | | | | | | | | | | | | | | | | | | | |
| | | Interest | | | Issue Date | | Final
Maturity | | Currencies | | | Principal
Amount
Outstanding at
December 31, 2016 | | | Principal
Amount
Outstanding at
March 31, 2017 | |
| | | % | | | | | | | | | | (in US$) | |
Multilateral Organizations | | | | | | | | | | | | | | | | | | | | |
Inter-American Dev. Bank | | | Various | | | Various | | Various | | | USD | | | | 115,320,563.0 | | | | 114,649,804.0 | |
Others | | | Various | | | Various | | Various | |
| USD,
EUR |
| | | 113.439,795.0 | | | | 110,840,382.0 | |
| | | | | | | | | | | | | | | | | | | | |
Total Multilateral Organizations | | | | | | | | | | | | | | | 228,760,358.0 | | | | 225,490,186.0 | |
| | | | | | | | | | | | | | | | | | | | |
Foreign Governments (including Original Loans) | | | Various | | | Various | | Various | | | USD | | | | 312,221,910.0 | | | | 6,130,420.0 | |
Commercial Banks | | | Various | | | Various | | Various | | | USD | | | | 104,791,761.0 | | | | 97,622,164.0 | |
Other Commercial (Export Credit) | | | Various | | | Various | | Various | |
| USD,
CAD |
| | | 9,925,582.0 | | | | 9,925,582.0 | |
US$125 million due 2027 | | | 8.125 | % | | June 2007 | | June 2027 | | | USD | | | | 103,887,000.0 | | | | 103,.887,000.0 | |
| | | | | | | | | | | | | | | | | | | | |
US$294.18 million due 2024 | | | 9.375 | % | | November
2011 | | November
2024 | | | USD | | | | 294,180,000.0 | | | | 294,180,000.0 | |
| | | | | | | | | | | | | | | | | | | | |
Total Bonds | | | | | | | | | | | | | | | 398,067,000.0 | | | | 389,067,000.0 | |
| | | | | | | | | | | | | | | | | | | | |
| (1) | LEGEND: USD = United States Dollar; CAD = Canadian Dollar; EUR = Euro. |
The following table shows Bank of Jamaica debt as at December 31, 2016 and at March 31, 2017.
Bank of Jamaica Debt(1)
| | | | | | | | | | | | | | | | | | | | | | | | |
| | | Interest | | | Issue
Date | | | Final
Maturity | | | Currencies | | | Principal
Amount
Outstanding at
December 31, 2016 | | | Principal
Amount
Outstanding at
March 31, 2017 | |
| | | % | | | | | | | | | | | | (in US$) | |
IMF | | | | | | | | | | | | | | | | | | | 549,724,398.0 | | | | 555,324,726.0 | |
Total | | | Various | | | | Various | | | | Various | | | | Various | | | | 549,724,398.0 | | | | 555,324,726.0 | |
| | | | | | | | | | | | | | | | | | | | | | | | |
| (1) | LEGEND: USD = United States Dollar; SDR = Special Drawing Rights. |
D-76
Debt Service Indicators
Public sector external debt as a percentage of nominal GDP decreased to 74.5% as at December 31, 2016 from 75.6% on December 31, 2015. External debt as a percentage of exports of goods and services decreased to 150.6% on December 31, 2016 from 157.8% on December 31, 2015. External debt service payments as a percentage of exports of goods and services decreased to 14.1% during 2016 from 18.4% during 2015.
The following table shows public sector external debt indicators as at and for the five years ended December 31, 2016.
Debt Indicators
| | | | | | | | | | | | | | | | | | | | |
| | | 2012 | | | 2013 | | | 2014 | | | 2015 | | | 2016 | |
| | | (in millions of US$, except percentages) | |
External Debt Service Principal | | | 565.5 | | | | 584.9 | | | | 927.8 | | | | 822.8 | | | | 360.0 | |
Interest | | | 446.4 | | | | 406.5 | | | | 349.5 | | | | 377.9 | | | | 597.6 | |
| | | | | | | | | | | | | | | | | | | | |
Total | | | 1,011.9 | | | | 991.3 | | | | 1,277.3 | | | | 1,200.7 | | | | 957.6 | |
| | | | | | | | | | | | | | | | | | | | |
Exports of Goods and Services(1) | | | 6,491.6 | | | | 6,418.0 | | | | 6,570.5 | | | | 6,537.6 | | | | 6,802.4 | |
External Debt Service Ratio (%) | | | 15.6 | | | | 15.1 | | | | 19.4 | | | | 18.4 | | | | 14.1 | |
Interest on External Debt/Exports of Goods and Services (%)(1) | | | 6.9 | | | | 6.4 | | | | 5.3 | | | | 5.8 | | | | 8.8 | |
External Debt Outstanding/Exports of Goods and Services (%)(1) | | | 113.7 | | | | 129.5 | | | | 131.8 | | | | 157.8 | | | | 150.6 | |
External Debt/Nominal GDP (%)(2) | | | 56.0 | | | | 59.0 | | | | 64.9 | | | | 75.6 | | | | 74.5 | |
Domestic Debt/Nominal GDP (%)(3) | | | 75.8 | | | | 74.2 | | | | 68.5 | | | | 52.4 | | | | 48.3 | |
| | | | | | | | | | | | | | | | | | | | |
Total Debt/Nominal GDP (%)(2) | | | 134.3 | | | | 136.4 | | | | 133.4 | | | | 128.0 | | | | 122.8 | |
| | | | | | | | | | | | | | | | | | | | |
| (1) | Exports of goods, services and current transfers. |
| (2) | Calculated by converting external debt to JA dollars using the average annual nominal exchange rate. |
| (3) | Calculated using Jamaica Dollars. |
Source: Ministry of Finance and the Public Service and Bank of Jamaica.
For purposes of Jamaica’s EFF arrangement with the IMF, total debt is defined as debt of the Bank of Jamaica, debt of the Central Government, debt of Petrocaribe Development Fund (net of any amounts owed by the Central Government to PDF), domestic guaranteed debt and external guaranteed debt (“EFF Debt”). Jamaica’s EFF Debt to nominal GDP was 121.3% at the end of the 2016/17 fiscal year, 120.2% at the end of the 2015/16 fiscal year, and 136.6% at the end of the 2014/15 fiscal year.
On April 1, 2017, the Government implemented a new definition of public debt (“Public Debt”) consistent with the definition being utilized by the IMF under the PSBA. This definition is also in line with international standards and consistent with the Public Sector Debt Statistics Guide developed by the IMF. If this new definition had been in place for FY2016/17, Public Debt to GDP would have been 115%.
D-77
Comprehensive Debt Management
The Jamaica Debt Exchange
On January 14, 2010, the Government of Jamaica launched its strategic and comprehensive domestic liability management program, marketed as the JDX. The main characteristics were a par-for-par exchange offer with “no haircuts,” voluntary exchange of approximately J$701.5 billion in market-issued domestic debt, voluntary exchange of short-dated, high-yielding interest bearing securities for longer-dated securities with significantly lower yields, the introduction of new benchmark securities, an extension of the maturity profile of the domestic debt portfolio in order to lower refinancing risks, achievement of substantial cost savings, the issue of an appropriate mix of fixed, variable and US$ securities and the introduction of new CPI-Indexed Investment Bonds.
The results of the JDX revealed an overall participation rate of approximately 99.2% with a 100% participation rate from financial institutions. This level of success represented an exchange of approximately J$695.6 billion in eligible bonds.
The immediate benefits of the JDX were the realignment of the domestic debt portfolio, which saw a significant reduction in maturities over the next three years; substantial cost savings through the reduction in the projected interest cost for FY 2010/11 of J$17.1 billion (i.e., US$190.7 million or 15.2% of interest cost); extension of amortization equal to J$148.6 billion (or US$1.7 billion) in FY 2010/11; the creation of 25 new benchmark bonds in exchange for over 350 smaller and illiquid bonds; the removal of US Dollar Indexed Bonds and the introduction of new CPI-Indexed Bonds into the domestic portfolio; and an increase in the fixed rate component of the domestic debt portfolio. Occurring simultaneously with the JDX was the passing into law of the Government Securities Dematerialization Act, which allows domestic securities to be issued in a dematerialized format in the Central Securities Depository operated by the Bank of Jamaica.
The National Debt Exchange
Three years after the historic JDX in February 2010, the Government of Jamaica executed a second domestic debt exchange to further realign the portfolio through the extension of maturities and reduction of interest rates. The debt exchange became necessary to address the growing refinancing risk in the one- to three-year period that had again become inherent in the domestic portfolio. It was also one of the actions needed in order for Jamaica to secure an EFF with the IMF.
The Exchange, which was marketed as the NDX, was launched on February 12, 2013, and settled on February 22, 2013. The main features were a voluntary par-for-par exchange for all bonds except the new fixed rate accreting note (“FRAN”) offer, which had an exchange ratio of 0.8:1. The new FRAN offer is one where investors are issued principal value of J$80.00 in new notes for every J$100.00 of principal value of Old Notes exchanged. The principal accretes from J$80.00, beginning August 15, 2015, to J$100.00 by the maturity date on August 15, 2028. The introduction of the FRAN was specifically targeted at public bodies and long term investors, such as pension funds.
In addition, the NDX replaced 25 eligible JA and US dollar-denominated benchmark bonds with a nominal value of J$852.5 billion with 22 new benchmark bonds with extended maturities and significantly reduced yields. The NDX had a participation rate of just under 99.0%, translating to a nominal amount of J$841.5 billion tendered for exchange.
D-78
The main benefits of the NDX were (1) a reduction in weighted average costs through reduced margins on CPI and variable rate bonds on average by 0.975%, a reduced coupon on locally-issued US$-denominated notes by, on average, 1.792%; reduced coupon on J$-denominated notes by, on average, 3.206%; (2) a reduction in risk associated with variable rate reset rates (tied to treasury rates plus a margin) for variable rate debt reduced by over J$113.0 billion; (3) substantial cost savings averaging J$17 billion per annum through an annualized reduction by an average rate of 2.0%; and (4) a reduction in refinancing risk through an extension of the maturity profile of the domestic debt portfolio by an average of 5 years, and a reduction in redemptions by approximately J$375.0 billion for the period up to 2016.
To increase the aggregate savings of the NDX ahead of the board meeting of the IMF, on March 22, 2013, Jamaica performed, on a private basis, an additional exchange offer with eight leading local holders of various bonds involving approximately J$20 billion and US$51 million, which created four further new local instruments in addition to those created in the NDX transaction.
Liability Management
On July 28, 2015, Jamaica, through the Central Government, purchased US$3.25 billion of Jamaica’s Petrocaribe Energy Cooperation debt from the Government of Venezuela, acting through PDVSA Petroleo, S.A. The outstanding debt as at December 31, 2015 was purchased for US$1.5 billion.
On August 30, 2016, the Government settled a tender of US$317.8 million of its 10.625% Notes due 2017 and US$467.4 million of its 8.000% Amortizing Notes due 2019 in exchange for US$743.2 million of its 8.000% Amortizing Notes due 2039. The transaction resulted in the extension of maturities, debt stock reduction and mitigation of refinancing risk in the external debt portfolio.
Debt Records
Jamaica has never defaulted on any of its external or domestic debt obligations, which under the Jamaican Constitution are paid without any requirement of Parliamentary approval, directly from revenue and assets of Jamaica, before funds are available to Jamaica for other policies and programs. Since 1993, Jamaica has been involved in only two debt restructurings, which occurred in January 2010 and February 2013. See “—Public Finance—The Jamaica Debt Exchange—The National Debt Exchange.”
On January 25, 1993, Jamaica entered into a multi-year debt service rescheduling arrangement with the Paris Club comprised of Organisation for Economic Co-Operation Development (“OECD”) creditor governments and their agencies. This accord spanned the 36-month consolidation period from October 1, 1992 through September 30, 1995. Pursuant to the Paris Club Accord, the parties finalized the single outstanding bilateral implementing agreement in January 1996.
In March 1996, Jamaica formally completed a three-year extended fund facility with the International Monetary Fund. For a description of our extended fund facility and our current stand-by-arrangement see “The Jamaican Economy—IMF Arrangements.”
D-79
THE MONETARY SYSTEM
Bank of Jamaica
The Bank of Jamaica was established in 1960 pursuant to the Bank of Jamaica Act 1960 and commenced operations in 1961. The Bank of Jamaica Act, together with the Banking Services Act (the “BSA”) which took effect September 30, 2015, provides the Bank of Jamaica with the statutory authority for regulating the activities of the banking system. The BSA repealed the former Banking Act, The Financial Institutions Act and The Bank of Jamaica (Building Societies) Regulations. Under the BSA, financial holding companies of DTIs are also required to be licensed, which will allow for the conduct of consolidated supervision.
Amendments to the Bank of Jamaica Act accorded the institutional responsibility for the stability of Jamaica’s financial system to the Bank of Jamaica in October 2015. Furthermore, several enhancements to the regulatory framework were effected through the Bank of Jamaica Act and the BSA. See “—the Financial System” and “—Legislation and Regulation.” Amendments to the Bank of Jamaica Act, subjecting money transmitters and remittance agencies to licensing regimes and regulations comparable to those applicable to other institutions that deal with approved foreign currency became law in February 2004. These amendments will bring Jamaica in line with the Financial Action Task Force’s (the “FATF”) 40 revised recommendations.
In addition to its operations relating to the issue and redemption of currency and as banker to the Government of Jamaica, the Bank of Jamaica’s primary role remains the development and implementation of monetary policies aimed at achieving Jamaica’s inflation objectives and maintaining long-term stability in the foreign exchange market. As the banking supervisory authority, the Bank of Jamaica is also required to ensure the soundness and development of the financial system pursuant to the Banking Services Act.
Money Supply and Interest Rates
The monetary base expanded by 15.1% in 2016, following increases of 12.2% and 5.1% for 2015 and 2014, respectively. The monetary base comprises currency issue in the hands of the public, vault cash held in the banking system, statutory cash reserves and demand deposits of commercial banks held at the Bank of Jamaica. The acceleration in the rate of growth in 2016 was reflected in an increase of 16.6% in currency issue, relative to 12.5% for 2015 and a small acceleration in the growth of commercial banks’ local currency cash reserves to 11.9% from 11.6%. A build-up in the Net International Reserves was the main source of expansion in the monetary base. Growth in broad money supply (“M2”) that includes foreign currency decelerated to 13.3% in 2016 from 16.0% for 2015. The tempered expansion in M2 in 2016 largely reflected a moderated expansion of 0.6% in demand deposits from 21.8% in 2015. However, this was offset by stronger growth in savings and time deposits. In 2015, currency with the non-bank public, time and savings deposits increased by 15.3%, 10.7% and 15.0%, respectively.
For the first three months of 2017, the monetary base declined by 6.3% relative to a contraction of 1.8% for the comparable period of 2016. The contraction in the monetary base during the first three months of 2017 largely reflected net currency redemption of 10.4%. For the first two months of 2017, the stock of M2 grew by 11.0% as compared to an expansion of 0.8% for the corresponding period of 2016, reflecting the impact of a new entrant to the commercial banking sector in February 2017.
On May 31, 2016, the Bank of Jamaica reduced the interest rate payable on its 30-day Certificate of Deposit (“CD”) by 25 basis points to 5.00%. This adjustment was in the context of a generally favorable outlook for inflation, which was projected to end FY 2016/17 below the target band. In addition, the risks to the inflation forecast were skewed to the downside in the context of overall improvements in the domestic macroeconomic environment and a trend decline in inflation expectations. Furthermore, the policy adjustments were assessed to pose no risks to the continued attainment of the monetary targets under the EFF-supported program, which were comfortably met in 2016.
On September 1, 2016, the Bank of Jamaica began a process of adjustments to its interest rate corridor to enhance the monetary policy transmission process. In this regard, the Bank increased the rate on the overnight deposit from 0.25% to 3.0%, a level consistent with rates in the overnight market. These adjustments are aimed at
D-80
clearly defining the floor of the interest rate corridor. The Bank will ultimately transition to the overnight rate as the policy signal rate from the current 30-day policy signal. Transitioning to an overnight signal rate is consistent with the best practice of leading central banks, in particular, those institutions that operate a full-fledged inflation targeting monetary policy regime. This adjustment narrowed the width of the corridor to 425 basis points from 700 basis points.
On October 3, 2016, the Bank began the process of removing the bias in the cash reserve requirement structure that favors foreign currency deposits. In addition, the Bank stopped its remuneration of reserve holdings for foreign currency prescribed liabilities. The policy was geared towards the level of dollarization in the economy. In this regard, the foreign currency cash reserve requirement for deposit-taking institutions was increased by 1 percentage point to 10%. In addition, the liquid assets ratio applicable to foreign currency prescribed liabilities increased by one percentage point to 24%. The foreign currency cash reserve requirement was further increased by 1 percentage point on November 1, 2016 and December 1, 2016, thereby ending the year at 12%. Notably, the local currency cash reserve and liquid assets requirement were maintained at 12.0% and 26.0%, respectively. During 2016, the Bank of Jamaica continued to manage Jamaica Dollar liquidity through issues of regular and special open market operations instruments.
The foreign currency cash reserve requirement for deposit-taking institutions was further increased on March 1, 2017, by 2 percentage points to 14.0% and by 1 percentage point to 15.0% on April 3, 2017.
On March 6, 2017, the Bank of Jamaica increased the interest rate on its overnight instrument to 4.00% from 3.00%. Subsequently, on April 5, 2017, the Bank lowered the interest rate on its 30-day CD by 25 basis points to 4.75% and reduced the interest rate on the overnight instrument by 25 basis points to 3.75%. On April 5, 2017, the Bank’s interest rate corridor was reduced to 300 basis points. The adjustment to the policy rate reflects the Bank’s assessment that inflation for FY 2017/18 will be within the BOJ’s inflation target range of 4.0% to 6.0% for the fiscal year. Further, the continued tight fiscal policy posture supports an easing in monetary conditions.
The weighted average domestic currency loan rate of commercial banks decreased to 14.98% as at February 28, 2017 from 16.21% as at December 31, 2016. Notably, lending rates in the banking system have declined successively since 2013.
The following tables show determinants of money supply and interest rates for the five years ended March 31, 2017:
Money Supply
| | | | | | | | | | | | | | | | | | | | | | | | |
| | | 2012(3) | | | 2013 | | | 2014 | | | 2015(3) | | | 2016 | | | 2017(4) | |
| | | (in millions of J$) | |
Narrow Money (M1) | | | 133,264.5 | | | | 148,734.0 | | | | 165,010.4 | | | | 196,069.1 | | | | 244,616.0 | | | | 286,846.7 | |
Currency | | | 54,734.7 | | | | 58,641.4 | | | | 63,583.5 | | | | 73,326.6 | | | | 86,411.1 | | | | 87,712.7 | |
Quasi-Money(1) | | | 241,202.8 | | | | 267,219.8 | | | | 281,530.1 | | | | 320,927.5 | | | | 375,983.4 | | | | 459,925.6 | |
Monetary Base(2) | | | 97,648.5 | | | | 103,633.4 | | | | 108,882.5 | | | | 122,211.7 | | | | 140,698.1 | | | | 133,738.9 | |
Broad Money (M2) | | | 374,467.3 | | | | 415,953.8 | | | | 446,540.5 | | | | 517,788.5 | | | | 586,686.9 | | | | 669,984.2 | |
| (1) | Quasi-money comprises time deposits and savings deposits. |
| (2) | The monetary base comprises currency issue in the hands of the public, plus vault cash held in the banking system, statutory cash reserves and demand deposits of commercial banks held at the Bank of Jamaica. |
| (4) | As at February 28, 2017 (provisional). |
Source: Bank of Jamaica.
D-81
Interest Rates
| | | | | | | | | | | | | | | | | | | | | | | | |
| | | 2012 | | | 2013 | | | 2014 | | | 2015 | | | 2016 | | | 2017(3) | |
| | | (%) | |
Domestic Currency Loan Rate | | | 18.4 | | | | 17.5 | | | | 17.2 | | | | 17.1 | | | | 16.2 | | | | 15.0 | |
Domestic Currency Time Deposit Rate | | | 3.9 | | | | 4.3 | | | | 4.0 | | | | 3.8 | | | | 3.4 | | | | 3.3 | |
Treasury Bill Yield(1) | | | 7.7 | | | | 7.5 | | | | 7.0 | | | | 6.7 | | | | 5.7 | | | | 5.9 | |
Treasury Bill Yield(2) | | | 7.2 | | | | 8.3 | | | | 7.1 | | | | 7.0 | | | | 6.6 | | | | 6.1 | |
| (1) | Tenors of Treasury bills are approximately 90 days. |
| (2) | Tenors of Treasury bills are approximately 182 days. |
| (3) | As at February 28, 2017. |
Source: Bank of Jamaica.
At the end of 2012, the weighted average yields on Government of Jamaica Treasury Bills (“WATBY”) on 6-month Treasury Bills was 7.2%. In the last five years, the WATBY for 6-month and 3-month Treasury Bills has generally trended downwards. The initial uptick in 2013 for the 6-month Treasury bills was addressed by a moderation in inflation and the achievement of the targets under the IMF Standby Arrangement, resulting in downward trends in 2014, 2015, 2016 and to February 28, 2017. As at February 28, 2017, the yield on the 3-month Treasury bills was 6.1%.
Cash Reserves
In the summer of 1998, the Bank of Jamaica announced its medium-term goal to reduce the cash reserve requirement for commercial banks. As a first step towards meeting this goal, the Bank of Jamaica reduced in increments the cash reserve requirement for commercial banks to 17% in May 1999 from 25% prior to August 1998, thereby equalizing the cash reserve requirement for commercial banks and other deposit-taking institutions. Having equalized the cash reserve requirement, further reductions were gradually effected, resulting in an overall reduction to 9.0% at March 2002. In response to challenges which emerged from the global financial crisis in 2008, the Bank of Jamaica instituted a number of initiatives, including an increase in the cash reserve requirement. The cash reserve requirement was increased to 11.0% as at December 2008 from 9.0% as at December 2007. Between January and February 2009 the cash reserve requirement was increased by a further 3.0 percentage points to 14.0%. However, effective July 1, 2010, consistent with the general loosening of monetary policy since the first quarter of 2009, the requirement was reduced by 2.0 percentage points to 12.0%. Since 2010, the cash reserve requirement has been maintained at 12.0%.
The Bank of Jamaica monitors the level of liquid assets outstanding to ensure that at all times supervised financial institutions meet their statutory liquidity obligations. The liquid assets requirement for deposit-taking institutions was 26.0% at December 31, 2014, with commercial banks holding excess liquid assets of J$27.2 billion above the statutory minimum requirements. At December 31, 2015, the liquid assets requirement for deposit-taking institutions remained at 26.0% with commercial banks holdings of liquid asset decreasing to J$14.4 billion above the statutory minimum requirements. The liquid assets requirement for deposit-taking institutions at December 31, 2016, remained unchanged at 26.0% with commercial banks holdings of liquid asset decreasing marginally to J$14.1 billion above the statutory minimum.
D-82
The Financial System
Regulatory and Supervisory Structure
Regulation and supervision of the financial system is primarily undertaken by two institutions, the Bank of Jamaica and the Financial Services Commission. The Bank of Jamaica regulates and supervises the commercial banks and other licensed deposit-taking financial institutions under powers contained in the recently implemented Banking Services Act, which repealed and replaced three statutes. The Financial Services Commission, which became operational on August 2, 2001, is the sole regulatory and supervisory agency for certain non-deposit taking financial institutions, including securities dealers, unit trusts, mutual funds, insurance companies and pension funds. It similarly derives its supervisory authority from various statutes. Recent amendments to the Bank of Jamaica Act enable the establishment of a Financial Regulatory Committee (the “FRC”) with the objective of facilitating information sharing, coordination and cooperation among regulatory authorities. The FRC consists of the Governor of the Bank of Jamaica (Chair); the Financial Secretary; the Executive Director of the Financial Services Commission and the CEO of the Jamaica Deposit Insurance Corporation. This committee replaces the Financial Regulatory Council which was established in 2000 with the mandate to develop policies and strategies to facilitate coordination and information sharing between the various supervisory and related agencies operating in the Jamaican financial sector. The conduct of the Financial Regulatory Council, which comprised the members now mandated under the law, was guided by a Memorandum of Understanding. As with the Financial Regulatory Council, the FRC will utilize a proactive and coordinated approach to sharing regulatory information and developing policy for the financial sector, thus helping in the early detection of cross-sector problems and enhancing the implementation of consolidated supervision rules and principles.
The deposit-taking system has remained adequately capitalized due mainly to the reforms of earlier years that ensured that institutions remain subject to strict regulatory requirements and oversight. A 100% risk weighting for Government foreign currency denominated instruments was implemented. Capital ratios have remained above the minimum risk weighted capital ratio of 10.0% and the capital to total assets (leverage ratio) requirement of 6.0%. At December 31, 2016, the risk weighted capital adequacy ratio for the deposit-taking financial institutions was 14.8% and the capital to total assets ratio was 10.6%. This compares with the Basel minimum requirement for risk weighted capital adequacy ratio of 8%. While the Basel Committee does not currently impose a leverage ratio, in December 2009, it proposed the introduction of a similar leverage ratio—to be initially tested under a parallel run at 3%. The Federal Reserve Bank sets its minimum leverage ratio at 3% to 4%.
An indirect impact on Jamaica arising from the global financial crisis was the loss in credit facilities, including cuts in and withdrawal of margin funding arrangements. In response, the Bank of Jamaica made a special loan facility available to domestic financial institutions to facilitate repayment of margin arrangements held with overseas brokers. These margin arrangements were collateralized with Government of Jamaica global bonds. By September 30, 2010, loans extended under this special loan facility were repaid. There is also evidence that there was deterioration in the asset quality of deposit-taking institutions over the period from December 2009 to December 2011, when non-performing loans moved to 8.2% at the end of 2011, from 4.5% at the end of 2009. The deterioration was attributable to the fall in real growth consequent on the decline in the demand for Jamaica’s exports given the economic recession in Jamaica’s major export markets. The deteriorating trend has since reversed and at December 31, 2016, non-performing loans as a percentage of total loan portfolio fell to 2.9%.
Jamaica’s financial system is integrated with regional and international financial markets. Since the beginning of the liberalization process in 1991 until 1994, the banking and insurance services sector expanded significantly. Since 1995, however, the financial system has undergone consolidation as a result of a combination of closures and mergers. As at March 31, 2017, the number of deposit taking institutions in operation consisted of seven commercial banks, two merchant banks and finance houses and two building societies.
On December 31, 2016, assets net of International Financial Reporting Standards (“IFRS”) provision for losses, including contingent accounts (i.e. customer accounts for acceptances, guarantees and letters of credit), and liabilities of commercial banks, amounted to J$1,061.3 billion and J$893.6 billion, respectively; representing increases of 15.6% and 16.3%, respectively, over December 31, 2015. On the asset side, total loans and advances (gross) amounted to J$495.4 billion at December 31, 2016, representing an increase of 19.7% relative to 2015. On the liabilities side, total deposits were J$667.5 billion in 2016, representing an increase of 13.6% when compared to 2015.
D-83
The total assets and liabilities of deposit-taking financial intermediaries other than commercial banks (i.e., building societies and merchant banks) was J$316.6 billion and J$265.2 billion, respectively, as at December 31, 2016, representing respective expansions of 14.2% and 15.3% over 2015. Outstanding loans and advances (gross) in these entities at December 31, 2016 was J$147.8 billion, representing an increase of 13.8% over 2015, while deposits were J$210.4 billion, representing an increase of 14.3% from 2015.
Legislation and Regulation
Laws and regulations governing the financial sector include:
| | • | | The Bank of Jamaica Act 1960; |
| | • | | The Securities (Collective Investment Scheme) Regulations, 2013; |
| | • | | The Securities Act 1993; |
| | • | | The Industrial and Provident Societies Act and the related Bank of Jamaica (Industrial and Provident Societies) Regulations 1995; |
| | • | | The Deposit Insurance Act 1998; |
| | • | | The Insurance Act 2001; |
| | • | | The Financial Services Commission Act 2001; |
| | • | | The Pensions (Superannuation Funds and Retirement Schemes) Act 2004; |
| | • | | The Terrorism Prevention Act 2005; |
| | • | | The Terrorism Prevention (Reporting Entities) Regulations, 2010; |
| | • | | The Proceeds of Crime Act 2007; |
| | • | | The Proceeds of Crime (Money Laundering Prevention) Regulations, 2007; |
| | • | | The Credit Reporting Act; |
| | • | | The Banking Services Act 2015; |
| | • | | Payment, Clearing and Settlement Act, 2010; |
| | • | | Financial Investigations Division Act, 2010; and |
| | • | | Moneylending Act, 1938. |
Jamaica implemented upgraded deposit-taking financial legislation in the form of the Financial Institutions Act and the Banking Act in 1992 to provide for, among other things, a standardized legal framework for the operations of commercial banks and other licensed deposit-taking intermediaries, including enhanced minimum capital adequacy standards. In addition, these acts provided the Bank of Jamaica, in certain instances, and the Minister of Finance and Planning in others, with the means to take actions such as issuing “cease and desist” orders and assuming temporary management of such institutions when there is evidence of unsound banking practices or where the institution’s financial viability is in jeopardy.
D-84
In order to strengthen the existing regulatory framework, in light of the difficulties in the financial sector, Parliament passed amendments to the Banking Act, the Financial Institutions Act, the Building Societies Act and the Industrial and Provident Societies Act in October 1997. Some features of these amendments included:
| | • | | empowering the Minister of Finance and Planning to take control of the shares of any licensee that is no longer viable, to effect a sale of the licensee’s shares or assets or to restructure the entity in the interest of its depositors; |
| | • | | empowering the Supervisor of Banks to issue “cease and desist” orders in respect of financial institutions experiencing problems and to require special audits of these institutions; |
| | • | | enhancing the existing “fit and proper” criteria that relate to directors, significant shareholders and the senior management of licensees; |
| | • | | tightening credit limits for unsecured lending, and prohibiting the issuance of unsecured credit to any affiliated parties; |
| | • | | imposing a lower ceiling on total lending to or investment in all affiliated parties; |
| | • | | tightening investment limits; |
| | • | | reducing the non-accrual period for interest on non-performing loans from six months to three months; |
| | • | | imposing minimum solvency standards and risk-based criteria; |
| | • | | specifying the obligations of bank auditors in the presentation of findings and imposing obligations on auditors to report irregularities to the Bank of Jamaica; |
| | • | | allowing for the examination of the accounts of holding companies of supervised financial institutions; and |
| | • | | prohibiting industrial and provident societies from taking deposits without written authorization from the Minister of Finance and Planning. |
These revisions provided the Bank of Jamaica, in certain instances, and the Minister, in others, with a wider range of sanctions and greater powers of intervention to use with respect to troubled financial institutions.
In March 2002, further amendments were made to Jamaican banking laws to grant the Bank of Jamaica expanded powers to supervise financial institutions with deposit-taking capability. These amendments included:
| | • | | the transfer to the Bank of Jamaica of powers of the Minister to assume temporary management of deposit-taking institutions in the event that the Bank of Jamaica believes that such an intermediary is, or appears, unlikely to meet its obligations; |
| | • | | the granting to the Bank of Jamaica of powers to assess fines for specific offenses under the Banking Act and Financial Institutions Act; |
| | • | | the granting to the Bank of Jamaica of power to require a deposit-taking institution to legally separate its banking operations from its securities-trading activities and investment activities undertaken on behalf of investor clients; |
| | • | | the granting to the Bank of Jamaica of power to effectively carry out consolidated supervision of banks and other companies that are members of a group of which the bank is a member; and |
| | • | | the broadening of the types of cases in which a bank may disclose information concerning specific customer accounts. |
D-85
These revisions have significantly increased the scope of the Bank of Jamaica’s regulatory authority, including its powers of intervention, by expanding the Bank of Jamaica’s ability to temporarily manage troubled financial institutions.
Additionally, in February 2004, amendments were passed to the Bank of Jamaica Act, which effectively brought all operators of remittance companies or agencies under the supervisory ambit of the Bank of Jamaica. The regulatory regime for remittance entities came into effect in July 2005 and involves a licensing requirement that entails fit and proper due diligence checks and assessments of their systems and procedures prior to licensing, as well as both on- and off-site reviews and assessments.
Supervisory powers were further expanded in March 2005 by amendments to the Bank of Jamaica Act to clarify the Bank of Jamaica’s ability to share information with its overseas regulatory counterparts. Supervisory powers of sanction were also expanded to expressly deal with breaches by financial institutions of their obligations under non-financial statutes under which specific obligations were imposed (e.g., the Money Laundering Act which was replaced by the Proceeds of Crime Act and the Terrorism Prevention Act. See “—Proceeds of Crime Act” below). This was achieved by amendments to the Banking Act and Financial Institutions Act, which were passed into law in December 2004. In regards to the Bank of Jamaica (Building Societies) Regulations, the amendments were passed in Parliament in November 2004.
As part of the SBA in 2010, reforms have also been proposed and begun to strengthen the financial system. See “The Jamaican Economy—IMF Arrangements.”
There are also a number of regulations and best practice standards that govern the operations of financial institutions in Jamaica.
Bank of Jamaica Act
In December 2010, the Cabinet approved the recommendation for the responsibility for the stability of the overall financial system in Jamaica to be statutorily assigned to the Bank of Jamaica. In October 2015, these amendments to the Bank of Jamaica Act were passed. These amendments address the following:
| | • | | Outlining the Bank of Jamaica’s role of maintaining financial system stability; |
| | • | | Mandating the establishment of a Financial System Stability Committee (“FSSC”) to coordinate the activities pursuant to the objective of financial system stability; incorporating the development of holding company legislation to allow for more effective consolidated supervision of financial groups that include one or more deposit taking institutions; |
| | • | | Establishing the financial stability oversight powers of the Bank of Jamaica in relation to financial institutions supervised by the Bank of Jamaica and those regulated by the Financial Services Commission as well as other persons who engage in the offer of financial services whose operations are deemed to be of systemic importance; |
| | • | | Granting the necessary powers to the Bank of Jamaica to obtain information from these persons referenced above that will allow for the assessment of risks to the financial system (including the powers of inspection and powers to demand information); |
| | • | | Giving the necessary powers to the Bank of Jamaica to direct and impose measures to mitigate and control the risks from these systemically important financial institutions and services to the financial system. Powers include the ability to extend liquidity where this is deemed necessary in the circumstances and powers to issue prescriptive rules, standards and codes pertinent to the oversight of the stability of the financial system; |
| | • | | Mandating the establishment of a Central Financial System database; and |
D-86
| | • | | Mandating the publication of a financial stability report within three months after the end of each financial year. |
Omnibus Legislation (Banking Services Act)
The Banking Services Act was passed in June 2014 and was brought into effect on September 30, 2015 by Appointed Day Notice. It repealed the Banking Act, the Financial Institutions Act, the deposit-taking and related provisions in the Building Societies Act and the Bank of Jamaica (Building Societies Regulations). The Building Societies Act and the Bank of Jamaica Act were also consequently amended. At the core of the Banking Services Act is a framework that allows for increased compliance with international supervisory principles. Significant enhanced provisions incorporated in the Banking Services Act include:
| | • | | Supervisory Autonomy—Under the Banking Services Act, certain critical supervisory functions have been transferred from the Minister of Finance to the Supervisor and the Supervisory Committee. The Supervisory Committee, as prescribed by the Banking Services Act, consists of five persons: three ex-officio members and two independent persons appointed by the Governor-General, on the advice of the Minister of Finance. The ex-officio members of the Supervisory Committee are the Supervisor (Chairman), a member of the senior executive staff of the Bank with responsibility over the financial stability oversight (currently the Senior Deputy Governor) and the Deputy Supervisor. The Supervisory Committee became operational during 2015; |
| | • | | Consolidated Supervision Framework—The Banking Services Act requires a Financial Holding Company (“FHC”) to be established for each financial group to which a Deposit-taking Institution (“DTI”) belongs, the FHC, which is required to be licensed and supervised by the Bank of Jamaica, will be responsible for, among other things, ensuring that the financial group is adequately capitalized on a consolidated basis and subject to effective governance and risk management. In addition, the FHC’s responsibilities involve ensuring that the DTI group members comply with regulatory requirements applicable under the Banking Services Act or any other legislation governing their operations; |
| | • | | Enforceable Code of Conduct— The Banking Services Act provides for the issuance of an enforceable Code of Conduct on deposit-taking licensees’ dealings with their customers. This Code is expected to complement consumer protection for users of banking services, available under substantive consumer protection mechanisms and agencies outside of the Bank of Jamaica. The Banking Services (Deposit Taking Institutions) (Customer Related Matters) Code of Conduct was issued by the Bank of Jamaica in August 2016; |
| | • | | Counterparty Exposure Limits—The Banking Services Act provides a framework for the containment of risks within the context of licensee’s capital resources through enhanced requirements at the FHC and DTI level, on incurring counterparty exposures; |
| | • | | Agent Banking—The Banking Services Act provides for the extension of permissible banking services through agents who meet the requirements for authorization and are approved by the Supervisory Committee. This provision will allow customers of deposit-taking licensees to conduct certain banking services through a non-deposit-taking third party. Permissible activities in which agents may be used, include deposits and withdrawals, loan repayments, bill payments, account balance inquiries and collection of know-your-customer and customer due diligence information. The Banking Services (Deposit Taking Institutions) (Agent Banking) Regulations were passed in November 2016; and |
| | • | | Amendments to the Bank of Jamaica Act coinciding with the Banking Services Act also provide for the establishment of a Financial Regulatory Committee with the objective of facilitating information sharing, coordination and cooperation among regulatory authorities. |
D-87
Micro Credit Legislation
Cabinet approved the policy proposal to enhance the legislative framework for privately owned money lending institutions in 2013. The new regulatory framework being proposed aims to address the deficiencies inherent in the operations of the industry, provide for improvement in the monitoring of the industry, transparency, protection of consumers and reduction in risks of the industry being used as a vehicle to facilitate money laundering.
Deposit Insurance
In May 1998, Parliament passed the Deposit Insurance Act, designed to protect depositors through the establishment of an explicit Deposit Insurance Scheme (the “Scheme”). The Deposit Insurance Act established the Jamaica Deposit Insurance Corporation (the “JDIC”), which administers the Scheme and a Deposit Insurance Fund (the “Fund”). The financial institutions covered under the Scheme (the “Policyholders”) are all commercial banks, merchant banks and building societies. All deposits (excluding government deposits and deposits from Policyholders) held at these institutions are insurable under the Scheme. The insured institutions must contribute to the Fund, on an ex-ante basis by paying an annual premium of 0.15% of the total value of insurable deposits held by each institution, which will be used to reimburse depositors (up to the prescribed coverage limit) in circumstances where an insured non-viable institution is being resolved by way of a payout. The JDIC also has the option to levy premiums on an ex-post basis. In addition to premiums, the Fund comprises an accretion of investment and other sources of income. As at December 2016, the value of the Fund stood at J$16 billion.
Additionally, the JDIC is authorized to make loans or advances with security, and to guarantee, indemnify or become liable for the payment of monies, with respect to a covered institution facing financial distress. Further, the Deposit Insurance Act also provides for the sharing of information between the Bank of Jamaica and the JDIC, to enable the JDIC to be fully apprised of the financial conditions of the insured institutions.
When the Scheme was established, the coverage limit was set at J$200,000 per depositor, per institution. In order to maintain or enhance the level of protection to depositors, the coverage limit is constantly under review and has been adjusted twice to J$300,000 and J$600,000 on July 11, 2001 and July 1, 2007 respectively. At December 31, 2016 the total number of accounts in the banking system that were covered up to the $600,000 coverage limit (which covers accounts with balances up to J$600,000) was 96.0%. At this level of coverage, the JDIC continues to provide protection to the majority of retail depositors. This is consistent with the JDIC’s public policy objective and international standard of best practice as recommend by the International Association of Deposit Insurers to cover 90-95% of deposit accounts in the system.
Agent Banking Framework
Pursuant to provisions in the Banking Services Act providing for certain banking services to be offered through agents, the Bank of Jamaica issued a consultation paper to the industry during 2015 identifying related regulations. The Agent Banking Regulations were passed in November 2016. The provision of banking services through this delivery channel is expected to widen access to financial services and promote financial inclusion.
D-88
Code of Conduct on Customer Related Matters
Pursuant to provisions in the Banking Services Act providing for the Supervisor to issue a Code of Conduct on customer related matters, the Bank of Jamaica issued a consultation paper to the industry during 2015. The Code was issued in August 2016 and addresses such matters as DTI’s obligations to provide notice of fees and charges, express interest rates as an effective annual rate, ensure language in contracts is simple and clear and key terms identified to customers, and maintaining effective customer complaints mechanisms and procedures, among other matters.
Credit and Provisioning Regulations
The Bank of Jamaica is undertaking a comprehensive re-drafting of the captioned regulations to provide specific legal guidelines for loan accounting, credit classification and provisioning requirements for bad and doubtful debts. The regulations are being reviewed in order to take account of developments in international standards such as the IFRS issued by the International Accounting Standards Board and banking supervision principles issued by the Basel Committee of Banking Supervisors, such as Basel Core Principles and the Basel Standard for Sound Credit Risk and Valuation of Loans. These standards are themselves subject to comprehensive review by these international standard setting bodies. The Bank of Jamaica is therefore currently awaiting the outcome of these exercises to ascertain the implications for local regulations.
Capital Adequacy Regulations
In 2004, regulations were promulgated establishing minimum risk-based capital standards for commercial banks and licensed financial institutions. These regulations introduced the concept of Tier I and Tier II capital utilized by regulators internationally, which define eligible components and provide the framework for assigning risk weights to on and off balance sheet items. Under the regulations, the overall minimum capital required to be maintained in relation to risk weighted assets is 10%. The original regulations were repealed and reissued under the new Banking Services Act during 2015. Capital Adequacy Regulations addressing Financial Holding Companies are also being drafted to be issued under the Banking Services Act.
Qualifications of Auditors Regulations
The Bank of Jamaica has drafted regulations that specify the standards for auditors in undertaking an external audit of supervised financial institutions. Among other things, the criteria specified in these regulations relate to the independence, experience and qualification of the external auditors. These proposed regulations would also require prior notification to the Bank of Jamaica of proposed appointments. The Bank of Jamaica would also be empowered to object to the appointment of an auditor if there is evidence that such auditor is not in compliance with the provisions of the regulations. The intention is for these proposed regulations to be promulgated under the new Banking Services Act.
Bank of Jamaica (Credit Unions) Regulations
Regulations have been drafted to establish the supervisory regime applicable to credit unions. These regulations will, among other things, prescribe prudential criteria and minimum solvency standards covering, inter alia, essential areas such as licensing, capital adequacy, liquid assets, credit limits and provisioning, submission of financial statements and remedial action that can be taken by supervisory authorities with respect to problem credit unions. The draft proposed regulations have benefited from extensive dialogue with the credit union sector and are pending presentation to Parliament by the Minister of Finance and the Public Service once drafting is complete. Pending finalization and promulgation of the Regulations by the Parliament, oversight responsibility for the sector remains vested in the Department of Co-operatives and Friendly Societies as the statutory agency, while the Jamaica Co-operatives Credit Union League continues to undertake a self-regulatory role.
D-89
The Payment, Clearing and Settlement Act
The Payment, Clearing and Settlement Act was passed in Parliament in November 2010. The legislation formally establishes the legal framework for the oversight of the payment and settlement system and addresses matters such as: finality of payments, effect of insolvency on payments already in the system, and upgrading of the settlement infrastructure by, inter alia, allowing for real-time gross settlement. In this regard, Jamaica implemented a real-time gross settlement system in February 2009 and introduced a Central Securities Depository (“CSD”) in May 2009. The CSD is intended to house Government of Jamaica and Bank of Jamaica (domestic) securities.
Passage of this legislation is the first step in ensuring that Jamaica’s payment and settlement system operates in accordance with the Bank for International Settlements Core Principles for Systemically Important Payment Systems.
The Cooperative Societies (Amendment) Bill
The Cooperative Societies (Amendment) Bill, which has been drafted, will seek to restrict the deposit-taking activities of cooperative societies to those cooperative societies that operate as credit unions. Secondly, it will seek to bring credit unions under the regulatory ambit of the Minister of Finance and the Public Service and the Bank of Jamaica.
Proceeds of Crime Act
The Proceeds of Crime Act (“POCA”) was passed by Parliament in early 2007 and came into effect on May 30, 2007. This statute is supported by the Proceeds of Crimes (Money Laundering Prevention) Regulations and the Proceeds of Crimes (Confiscation) Regulations which were also promulgated in 2007. With the passage of the POCA, the former Money Laundering Act, related Regulations and the Drug Offences (Forfeiture of Proceeds) Act were repealed and replaced. The wide-ranging POCA legislation provides for the investigation, identification and recovery of the proceeds of crime. Responsibilities previously delegated to the Bank of Jamaica, as the “competent authority” for deposit-taking institutions under the Money Laundering Act, are now subsumed by the POCA. Among other matters, the Act now provides for revised Threshold Reporting Transaction Limits for financial institutions of US$15,000.00 (US$50,000.00 previously) and gives the Minister of National Security (as the responsible minister under POCA) the power to designate professions and businesses as financial institutions for the purposes of reporting and complying with Anti-Money Laundering requirements. POCA also seeks to address all the loopholes that hampered investigative and prosecutorial efforts to combat money laundering that existed under the previous Drug Offences (Forfeiture of Proceeds) Act and the Money Laundering Act.
Since its passage in 2007, the POCA has been amended to extend the list of predicate offenses and offenses in respect of which an assumption of criminal lifestyle can be made, to include offenses under the Child Pornography (Prevention) Act, specified offenses under the Sexual Offences Act, and related inchoate offenses such as aiding and abetting and incitement, as well as offenses under the Law Reform (Fraudulent Transactions) (Special Provisions) Act, which targets offenses such as lotto scam activities.
In October 2013, further amendments to the POCA were passed to:
| | • | | clarify the suspicious transactions reporting requirements; |
| | • | | outline the powers that competent authorities designated under the POCA will have in relation to their role of monitoring compliance with the Anti-Money Laundering requirements; |
| | • | | ensure that obligations placed on financial institutions are similarly placed on the entities that are responsible for the implementation of Anti-Money Laundering prevention, policies and procedures in the financial institution’s group of companies; and |
| | • | | effect other amendments to the Money Laundering Prevention Regulations under the POCA to strengthen the requirements for Customer Due Diligence (“CDD”), the application of CDD measures for politically exposed persons (PEP), and the use of risk-based processes to identify and address Anti-Money Laundering/Counter Financing of Terrorism (“CFT”) risks. |
D-90
The United Nations Security Council Resolution (Implementation) Act, 2013
The Act reflects Jamaica’s compliance with FATF Recommendation 7 (Targeted financial sanctions related to proliferation) of the revised FATF Forty (40) Recommendations issued in 2012.
Bank of Jamaica AML/CFT Guidance Notes
The Bank of Jamaica Anti-Money Laundering Guidance Notes, which were originally issued during the 1990s, provide specific guidance to all institutions supervised by the Bank of Jamaica on the detection and prevention of money laundering and the financing of terrorism. Revisions to the Guidance Notes were issued in 2004, 2005 and 2007 to incorporate, among other things, provisions consistent with the revised FATF 40 Recommendations of 2003 and the Eight Special Recommendations for Terrorist Financing; and the Ninth Special Recommendation of the FATF on cash couriers and enhanced guidance on customer due diligence verification. During 2009, the Bank of Jamaica undertook another round of revisions with a view to incorporating relevant provisions of the POCA and the POCA (Money Laundering Prevention) Regulations. The revisions took into account comments from the industry and the completed Guidance Notes were approved by the Minister on April 22, 2010. Further, revisions to the Guidance Notes have been undertaken in keeping with 2013 amendments to the POCA and Terrorism Prevention (Reporting Entities) Regulations, the passage of the United Nations Security Council Resolutions Implementation Act, as well as developments in international best practices in the areas of Anti-Money Laundering and CFT techniques, promulgated by the FATF and the Basel Committee of Banking Supervisors. In this regard, a consultation paper was issued for comment in April 2016.
Insurance Act
A new Insurance Act was enacted in December 2001 to repeal and replace the Insurance Act of 1972, to provide measures to strengthen corporate governance and the rulemaking process, and to establish prompt corrective action. The Insurance Act was amended in February 2016, to among other things, harmonize certain provisions with other financial sector legislation and strengthen the legislative framework for the insurance industry.
Pensions (Superannuation Funds & Retirement Schemes) Act
Reform of the pensions system started with the enactment of the Pensions (Superannuation Funds and Retirement Schemes) Act in 2004, which became effective in March 2005. This Act included new requirements for pension funds such as registration, licensing, investment limits, minimum solvency standards and information disclosure. In 2015, Cabinet approved the second phase of the Pension Reform initiative and the necessary drafting instructions were issued to the Office of the Chief Parliamentary Counsel to prepare the necessary amending legislation. This was preceded by extensive consultations with major stakeholders in the industry. The legislation will address issues such as mandatory vesting, portability of pension rights, funding and solvency of approved superannuation funds and retirement schemes.
Terrorism Prevention Act
The Terrorism Prevention Act gives effect to the UN Convention on the Suppression of the Financing of Terrorism as well as to various other UN Security Council resolutions. This Act imposes counter-terrorist financing and reporting obligations on financial institutions, which will assist the authorities in identifying, tracing and ultimately forfeiting assets owned or controlled by terrorists, and provides law enforcement with the widest range of investigative tools to achieve these objectives. The Terrorism Prevention Act was passed by the Parliament in March 2005 and came into effect in June 2005. In March 2010 an amendment to the Terrorism Prevention Act was passed to allow for greater penalties to be imposed under the proposed Terrorism Prevention (Reporting Entities) Regulations, 2010. (Under Jamaica’s laws penalties set out within Regulations are restricted to the maximum permitted under the Interpretation Act unless the Principal Act to the Regulations expressly provides otherwise).
D-91
The Terrorism Prevention Act was amended in April 2011 to clarify and expand on the obligation of financial institutions to report unusual or suspicious transactions and to allow for the implementation of the listed entity provisions in the act. Jamaica has since issued its first list of designated terrorists in accordance with the UN Resolution 1267, following the publication of the requisite court order in June 2012. A subsequent court order was published in July 2013.
Further amendments to the Terrorism Prevention Act were passed in October 2013 to, among other things, ensure that property of corresponding value can be confiscated, and to allow for Jamaica’s full implementation of the International Convention for the Suppression of Acts of Nuclear Terrorism of September 4, 2005, the 2005 amendment to the Convention on the Physical Protection of Nuclear Material, the October 14, 2005 amendment to the Protocol to the Convention for the Suppression of Unlawful Acts Against the Safety of Maritime Navigation, and the October 14, 2005 Protocol to the Convention for the Suppression of Unlawful Acts Against the Safety of Fixed Platforms.
Terrorism Prevention (Reporting Entities) Regulations
In March 2010, the Terrorism Prevention (Reporting Entities) Regulations, were promulgated under the Terrorism Prevention Act. These Regulations largely mirror the Know Your Customer (KYC) obligations contained in the Regulations under POCA. Accordingly, the Regulations outline the operational controls that must be maintained by financial institutions particularly when contemplating the commencement of a business relationship or a one-off transaction. The Regulations also require financial institutions to establish and maintain appropriate procedures in relation to identification, record-keeping, internal controls, communication and training of employees. These Regulations also prescribe the requisite Declaration Forms for transactions that the reporting entity knows or suspects are transactions that constitute a terrorism offense, and for the quarterly reports as to whether or not the reporting entity is holding property in respect of a person who is on the United Nations list of designated terrorists or in respect of a person who has links with terrorists or terrorist groups or organizations.
In October 2013, the Terrorism Prevention (Reporting Entities) Regulations were amended to consolidate and intensify the requirements for CDD, the application of CDD measures for PEP, and the use of risk-based processes to identify and address Anti-Money Laundering/CFT risks.
The Financial Investigations Division Act
The Financial Investigations Division Act (“FIDA”) was passed in March 2010 and brought into effect by Appointed Day Notice in April 2010. The Act gives the existing Financial Investigations Division (the “FID”) of the Ministry of Finance and the Public Service the necessary statutory powers and protections to carry out that Division’s mandate of investigating and prosecuting financial crime, including money laundering and the financing of terrorism. The FIDA was amended in 2013 to, among other things, clarify the FID’s role where Jamaica contemplates entering into information sharing agreements with international counterparts. As a result of the 2013 amendments to FIDA, the FID achieved full membership in the Egmont Group of Financial Intelligence Units in June 2014.
The Credit Reporting Act
The Credit Reporting Act (“CRA”) was passed in August 2010 and became effective October 1, 2010. This statute establishes a credit reporting system in Jamaica and is designed to improve credit assessment processes and to facilitate enhanced risk management and loan pricing strategies throughout the financial sector. A licensing system is imposed on persons who intend to offer credit reporting services and prescribed reporting processes are outlined to ensure objective and standardized reporting of credit information. Persons offering credit reporting services are subject to regulation by the Bank of Jamaica. Credit Reporting Regulations were issued under the CRA on January 14, 2011. These Regulations, among other things, outline the licensing process including the form of application, licensing fees and information and documentation to be provided in support of an application for a license. Two credit bureaus were licensed between March and April 2012 and were given a twelve-month period to start operations. Both entities commenced operations during 2013. In August 2014, the Minister of Finance and Planning, based on recommendations from the Bank of Jamaica, issued an additional license bringing to three the number of credit reporting agencies under the CRA. There was an increased level of credit reporting activity
D-92
reported by the two licensed credit bureaus that had commenced the issue of credit reports during 2013. Specifically, in 2015 there were 129,698 credit reports issued and 69 signed credit information providers, reflecting an increase from the 69,939 reports and 53 credit providers in 2014.
Standards of Best Practices
To date, the Bank of Jamaica has issued 13 Standards of Best Practices and Guidance for the management of deposit-taking entities. These are:
| | • | | Standards of Best Practices for Capital Management; |
| | • | | Standards of Best Practices for Credit Risk Management; |
| | • | | Standards of Best Practices for Securities Portfolio Risk Management; |
| | • | | Standards of Best Practices for Liquidity Risk Management; |
| | • | | Standards of Best Practices for Interest Rate Risk Management; |
| | • | | Standards of Best Practices for Foreign Exchange Risk Management; |
| | • | | Standards of Best Practices for Internal Controls; |
| | • | | Standards of Best Practices for Real Estate Appraisal Management; |
| | • | | Standards of Best Practices for the Management or Investment of Customers’ Funds; |
| | • | | Guidance Notes for the Detection and Prevention of Money Laundering and Terrorist Financing Activities; |
| | • | | Guidelines for Fit and Proper Assessments; |
| | • | | Standards of Best Practices for Country and Transfer Risk; and |
| | • | | Standards of Best Practices for Effective Corporate Governance. |
Since the 2005 FSAP exercise, the Bank of Jamaica has engaged in a continuous process of systematically revising these standards in order to further promote the establishment of comprehensive risk management processes in deposit-taking institutions in accordance with the revised Basel Core Principles and as a necessary precursor to full implementation of the Basel Capital Adequacy framework (Basel II). In this regard, the standards relating to credit risk and market risk management have been updated considerably for issue and discussion with the industry.
Basel II/III
Bank of Jamaica is adopting a four phased approach towards the adoption of Basel II, with emphasis on the full implementation of consolidated supervision, full compliance with the Basel Core Principles and the promotion of enhanced risk management frameworks in deposit-taking entities, which are all considered to be necessary prerequisites to effective Basel II/III implementation. The second phase will focus on implementation of Pillar II, which deals with supervisory review principles. The third phase will focus on implementation of Pillar III, which addresses market discipline requirements, and in the final phase the Bank of Jamaica will fully adopt Pillar I, which focuses on quantitative assessment. With regard to Basel III, based on preliminary assessments, the Bank of Jamaica does not foresee significant challenges in complying with the more conservative capital definitions proposed under Basel III given that existing Jamaican regulatory requirements are more stringent than those of Basel II capital definitions, including, for example, definitions of regulatory capital and the capital to total assets leverage ratio which has been a legal requirement for banks since 2004.
D-93
Consolidated and Conglomerate Supervision of Financial Groups
Legislation governing the activities of deposit-taking entities was amended in 2002 to extend the regulatory and supervisory reach of the Bank of Jamaica beyond the licensee itself, to include the wider financial group of which the licensee is a part. Pursuant to these amendments, the Bank of Jamaica has been working towards the full implementation of a comprehensive consolidated/conglomerate supervision regime. This has included the promotion of the reconfiguring of financial groups containing deposit-taking entities, into supervisable financial structures and the extension of “fit and proper” assessments to principals of financial holding companies and other entities within relevant financial groups. Further enhancements to the legislative framework were incorporated in the new Banking Services Act, which now requires that FHCs be licensed and, therefore, be subject to supervisory oversight.
Unregulated Financial Organizations
In 2007, the authorities were faced with the challenge of dealing with over 20 Unregulated Financial Organizations (“UFOs”). The FSC, with the support of other regulatory agencies, embarked on an extensive public education campaign to increase awareness of factors that should be taken into consideration before investing. This was accompanied by investigations into the business operations of these UFOs. Following investigations by the FSC, the entities were deemed to be in contravention of the relevant laws governing the sector. The investigations also revealed that the smaller UFOs acted as feeders for the three largest UFOs.
Consequently, the entities were served with Cease and Desist Orders. A Cease and Desist Order is an instruction to an entity requiring it to discontinue any business transaction or any actions that are in contravention of any of the Acts that have provisions for the regulation of the financial sector. To prevent the execution of these Orders, some of these entities brought legal action against the FSC. However, in all court rulings to date, the FSC has been successful in its bid to issue and enforce the Cease and Desist Orders. A court-appointed liquidator is in the process of winding up one of the major UFOs, while others are involved in litigation. Under the SBA, there will also be additional legislation regarding the regulation of UFOs.
In 2013, the Securities Act was amended to, among other things, enhance the framework for the regulation of the securities industry in order to combat the establishment and proliferation of unregulated financial organizations, strengthen the investigative and supervisory powers of the FSC, modernize the framework for the regulation of CISs and correct other deficiencies in the regulatory framework of the securities industry.
Securities Industry Legal Reform
In 2014, the Securities Act was amended to enhance the legal and regulatory framework for retail repurchase agreements (retail repos) in Jamaica including providing additional protection for the interests of repurchase clients prior to and in the event of a dealer’s insolvency or bankruptcy. In addition, the Securities (Retail Repurchase Agreements) Regulations and the Securities (Prudential) Regulations were approved in 2014 in keeping with the reform of the securities dealer industry, the latter regulations seeking to tighten the prudential standards for securities dealers in line with international best practices.
As part of the ongoing review of the securities industry legal and regulatory framework a number of legislative achievements have been made in 2015:
| | • | | The Securities (Retail Repurchase Agreements)(Amendment) Regulations, 2015; |
| | • | | The Securities (Collective Investment Schemes)(Amendment) Regulations, 2015; |
| | • | | Guidelines: For Jamaica Depositary Receipts; |
| | • | | Consultative Paper: Proposed Amendments of the Securities (Takeovers and Mergers) Regulations, 1999; |
| | • | | Securities (Disclosure of Interest) Regulations, 1999; and |
D-94
| | • | | New Retail Repurchase Agreement Regulatory and Operational Framework. |
Securities Dealers Rules and Regulatory and Supervisory Framework
In keeping with the requirements of the Memorandum of Economic and Financial Policies pursuant to the EFF with the IMF, the FSC was required to introduce and gradually tighten the prudential standards for the securities sector. Accordingly, on March 31, 2016, the FSC implemented a Strategy for Prudential Tightening which satisfies this requirement. The primary objective of the strategy is to ensure that in the near- to medium-term, the retail repo portfolios of individual firms and the securities industry as a whole will reach a level that is deemed by the Bank of Jamaica and the FSC to be systemically safe and prudentially manageable. Strategy implementation will be achieved by the following broad steps:
| | • | | Developing Prudential Guidelines for the securities industry which complement the Securities (Prudential) Regulations, 2014; |
| | • | | Implementing the Prudential Guidelines in tranches; |
| | • | | Utilizing a new ratio, the Retail Repo Leverage Ratio as a supervisory tool by monitoring the trend in values of this ratio for securities dealers without establishing a prudential benchmark at the outset of the strategy implementation; and |
| | • | | On a continuous basis, assessing the market impact of the prudential strategy and determining whether or not the systemic risk posed by the retail repo market warrants further prudential strengthening. |
Financial Sector Assessment Program
During 2005, Jamaica participated in an IMF/World Bank Financial Sector Assessment Program (“FSAP”), which is a joint initiative of the IMF and World Bank to provide member countries with a comprehensive evaluation of their financial systems. FSAPs are designed to assess the stability of the financial system as a whole and not that of individual institutions. They have been developed to help countries identify and remedy weaknesses in their financial structure, thereby enhancing their resilience to macroeconomic shocks and cross-border contagion. In May 2005, the IMF/World Bank issued a report on the financial assessment that was undertaken in 2005 that indicated that, while Jamaica’s financial systems appeared well-capitalized and supervision had been strengthened in recent years, there was a need to further strengthen the prudential framework for security dealers, enhance the oversight of conglomerates, and develop and test crisis management systems. The report also recommended that priority be given to overhauling the payments system and introducing a central depository for fixed income securities. In this regard, in May 2009, Jamaica introduced a Central Securities Depository for fixed income securities and in November 2010, the Payment, Clearing and Settlement Act was passed. Many of the recommendations in the 2005 FSAP were implemented as part of the EFF.
More recently, a FSAP Development Module for Jamaica was undertaken in April 28 to May 9, 2014. The focus of the mission was to identify constraints to enhancing financial inclusion and covered areas including financing of MSMEs, housing finance, rural/agriculture finance, payment systems and remittances, and consumer protection and financial literacy.
The report noted that the authorities recently passed the Banking Services Act which contained provisions for enhanced supervision of conglomerates; drafted Credit Unions’ regulations; are working to reform the securities dealers sectors, making less risky business models (collective investments schemes) available to securities dealers, as well as have undertaken significant financial infrastructure reforms to improve the credit reporting system, secured transactions, and insolvency framework. The report noted however, that failure of Jamaica to complete its reform effort, could have adverse regional repercussions including through financial linkages throughout the Caribbean. It also noted that Jamaica’s authorities should review the implementation of its oversight function ensuring the best balance between competition and cooperation in the credit reporting market. In addition, the report recommended that a comprehensive review of its regulatory framework for the remittances sector be conducted to enable the sector to provide innovative retail remittance products to the beneficiaries at competitive prices over the medium term.
D-95
The Stock Market
Jamaica Stock Exchange (JSE)
The Jamaica Stock Exchange (“JSE”) is the oldest and largest stock exchange in the English-speaking Caribbean. It was established as a private limited company in August 1968, and floor trading commenced in February 1969 and is now a public company. The JSE is a self-regulatory organization, although the Financial Services Commission has regulatory oversight. The JSE has in place a comprehensive code of rules governing members’ conduct and market operations, and has not experienced any market scandal during its 48-year history. The Financial Services Commission also regulates the Jamaican securities industry. Transactions done on the floor of the JSE are settled using a T+3 cycle.
The JSE has undertaken several modernization initiatives in recent years. In 1997, the JSE established a formal relationship with the CUSIP Service Bureau for the assignment of international securities identification numbers (“ISIN”) for Jamaican securities. In 2012, the JSE was granted approval for Partnership with the Association of National Numbering Agencies and the JSE now assigns ISINs for Jamaican securities.
In 1998, the Jamaica Central Securities Depository Limited, designed in conformity with G30 standards, was incorporated as a legal entity and began operations on June 1, 1998. In February 2000, the JSE introduced automated trading, and as at May 2000, all securities listed on the JSE are traded remotely from brokers’ offices.
In May 2000, the JSE All Jamaican Composite index was introduced. This index tracks the performance of local companies. In June of the same year, the JSE Select Index was introduced to track the performance of the 15 most liquid stocks on the JSE.
In 2007, the JSE started the process of demutualization and on June 30, 2008, the JSE became a listed company after listing its Preference Shares. The Preference Shares have been redeemed and consequently delisted on May 31, 2013. In July 2013, the Jamaica Stock Exchange offered 20% of its ordinary shares to the public by way of an IPO and the offer was oversubscribed by 41%. More than 150 applications were received for the offer. The JSE listed the ordinary shares on July 23, 2013.
The JSE launched the Junior Stock Market on April 2, 2009. This market provides an opportunity for local and Caricom small- and medium-size enterprises to raise capital. The JSE Junior Market has been endorsed by the Jamaican government through a ten-year tax break. As such, a company that lists on the JSE Junior Market is not liable to pay taxes on profits for the first five years and is liable for just 50% of the corporate tax rate for the second five year period.
The JSE Combined Index started on April 1, 2011, at 86,897.43 points. This index tracks the performance of all the companies that issue ordinary shares listed on both the Main Market and Junior Market of the Jamaica Stock Exchange.
In July 2011, the JSE launched the US$ Equities Market which facilitates the trading and settlement of US$ denominated shares. The JSE US$ Equities Market Index, which tracks the performance of companies whose shares trade in US dollars, started at 100 Points and has grown to 216.59 points as at March 31, 2017.
In June 2013, the JSE launched the Bond Market which facilitates the trading and settlement of fixed income securities, whether they are corporate bonds, Government of Jamaica securities, the securities of any other sovereign CARICOM country.
D-96
Trading Activity: Regular Market
In 2016, market volume including block trades totaled 3.36 billion shares, a decrease of 18.4% from the 4.12 billion shares traded in 2015. The value of shares traded in 2016 amounted to J$48.45 billion, a decrease of 25.06% from 2015.
Likewise, for the period from January to March 2017, market value, including block trades, amounted to over J$9.60 billion, down 65.81% relative to the same period in 2016. Market volume, including blocks, has decreased by 67.27% for the stated period to 639.02 million units, compared to the 1.95 billion units recorded in the same period in 2016. An increase was experienced in the number of transactions (including blocks) of 32.17% to 11,577 transactions for the period. For the stated period there were 63 trading days.
At December 31, 2016, market capitalization totaled J$697.45 billion, up 13.3% from 2015. The top ten listed companies (based on market capitalization) account for approximately 80.23% of market capitalization, with the top five listed companies accounting for 52.49% of market capitalization at December 31, 2016. At March 31, 2017, there were thirty-four domestic companies listed on the JSE, and market capitalization totaled J$800.13 billion.
Market volume (excluding blocks) for the period January to March 2017 amounted to 633.99 million units compared to 403.07 million units for the same period in 2016. This represents an increase of 230.92 million units, or 57.29%. Likewise, market value for the stated period increased to J$9.17 billion from J$5.80 billion for the same period in 2015. This reflects an increase of 57.96% or J$3.36 billion.
Between January and March 2017, the number of transactions increased by 32.26% to 11,575 when compared to the non-block transactions for the same period in 2016. Two block trades have been processed for the stated period compared to the seven block trades in the same period in 2016. Market volume in the block market for the stated period amounted to 5.02 million units compared to 1.55 billion units in the comparative period in 2016. The total value of block trades as at March 31, 2017 stands at J$430.04 million relative to J$22.28 billion in 2016.
For the year ended December 31, 2016, the month that recorded the largest number of transactions was January with 3,355 transactions. Meanwhile, the month that experienced the least transactions was October with 2,099 transactions. In the month of July, the smallest monthly volume traded and value traded were recorded which amounted to 61.15 million units and J$912.50 million, respectively. The month of April registered the highest market volume of 337.06 million units and September recorded the largest market value of J$3.52 billion.
For the year ended December 31, 2016, the main advancers were Trinidad Cement Limited, up 320% to close at J$63.00, and The Palace Amusement (1921) Company Limited, up 124.68% to close at J$195.00. On the other hand, the main decliners were Cable & Wireless Jamaica Limited, down 47.83% to close at J$0.72, and Ciboney Group Limited, down 14.29% to close at J$0.18. Trading occurred in forty-four stocks, of which thirty-five shares advanced and four shares declined.
D-97
The following table shows yearly trading data for the Jamaica Stock Exchange for the period beginning January 2001 to March 31, 2017:
Jamaica Stock Exchange Trading Data – Main Market
| | | | | | | | | | | | | | | | | | | | |
| Period | | Period-End
Market
Capitalization | | | Value
Traded | | | Period-End
Market
Index | | | No. of
Listed
Companies | | | No. of
Brokers | |
| | | (in millions of J$) | |
2001 | | | 197,717.5 | | | | 5,948.4 | | | | 35,723.6 | | | | 43 | | | | 10 | |
2002 | | | 292,297.9 | | | | 7,636.9 | | | | 45,396.2 | | | | 41 | | | | 10 | |
2003 | | | 512,884.4 | | | | 24,237.3 | | | | 67,586.7 | | | | 42 | | | | 10 | |
2004 | | | 879,297.2 | | | | 35,994.8 | | | | 112,655.5 | | | | 41 | | | | 11 | |
2005 | | | 839,852.8 | | | | 40,746.7 | | | | 104,510.4 | | | | 41 | | | | 11 | |
2006 | | | 822,862.4 | | | | 37,041.0 | | | | 100,678.0 | | | | 44 | | | | 11 | |
2007 | | | 876,690.6 | | | | 29,047.4 | | | | 107,968.0 | | | | 44 | | | | 11 | |
2008 | | | 597,277.0 | | | | 67,026.9 | | | | 80,152.0 | | | | 45 | | | | 11 | |
2009 | | | 544,882.5 | | | | 12,190.1 | | | | 83,321.9 | | | | 43 | | | | 11 | |
2010 | | | 564,720.7 | | | | 20,828.6 | | | | 85,220.8 | | | | 43 | | | | 11 | |
2011 | | | 619,444.8 | | | | 20,994.0 | | | | 95,297.2 | | | | 40 | | | | 11 | |
2012 | | | 590,637.4 | | | | 61,109.5 | | | | 92,101.2 | | | | 36 | | | | 11 | |
2013 | | | 492,179.9 | | | | 15,978.2 | | | | 80,633.5 | | | | 36 | | | | 11 | |
2014 | | | 296,836.9 | | | | 12,807.5 | | | | 76,353.4 | | | | 36 | | | | 12 | |
2015 | | | 615,559.6 | | | | 64,647.8 | | | | 150,692.1 | | | | 36 | | | | 12 | |
2016 | | | 697,446.8 | | | | 48,449.6 | | | | 192,276.6 | | | | 35 | | | | 12 | |
January to March 2017 | | | 800,126.8 | | | | 9,601.0 | | | | 223,833.6 | | | | 34 | | | | 13 | |
Source: Jamaica Stock Exchange.
Main Market Index
As at the end of March, 2017, relative to the same period last year, all of the indices in the main market recorded increases. The Main JSE Index increased by 45.43% and the All Jamaican Composite index increased 43.70%. At the same time the JSE Select, which tracks the fifteen most liquid stocks, recorded an increase of 37.67%. The JSE combined index, which tracks the main market and the junior market companies, advanced by 46.67% at the end of the period.
The following table shows the market indices as at March 31, 2017:
| | | | | | | | | | | | |
Index | | Value 2017 points | | | Point
change(1) | | | Percent
change(1) | |
Main JSE Index | | | 223,833.6 | | | | 31,556.9 | | | | 16.41 | % |
All Jamaican Composite Index | | | 245,670.4 | | | | 35,530.9 | | | | 16.91 | % |
JSE Select Index | | | 7,325.3 | | | | 922.3 | | | | 14.40 | % |
JSE Cross Listed Index | | | 238,359.8 | | | | 33,399.7 | | | | 16.30 | % |
JSE Combine Index | | | 2,997.0 | | | | 403.3 | | | | 15.55 | % |
JSE Jnr Market Index | | | 223,833.6 | | | | 31,556.9 | | | | 16.41 | % |
| (1) | Measured against December 2016. |
Source: Jamaica Stock Exchange.
For the year ended December 31, 2016, on average the ordinary stock prices appreciated by 40.71% and the advance decline ratio was 27:04.
Trading Activity Junior Market
On April 2, 2009, the JSE launched its Junior Market. The total volume traded amounted to 675.10 million units valued at J$5.07 billion in 2016. For the period January 1, 2017 to March 31, 2017, volume amounted to 251.77 million units with a value of J$1.44 billion.
For the year ended December 31, 2016, the JSE Junior Market Index increased by 44.82% to close at 2,593.71 points. For the period January 1, 2017 to March 31, 2017, the JSE Junior Market Index increased by 15.55% to close at 2,997.00 points.
D-98
As at March 31, 2017, the market capitalization of the Junior Market amounted to J$120.09 billion and there were 29 domestic companies listed on the Junior Market.
Market volume for the period January 1, 2017 to March 31, 2017 increased to 251.77 million units, compared to 233.20 million units in the comparative period of 2016. Similarly, the number of transactions increased to 5,946 from 5,273 for the same period in 2016. On the other hand, market value decreased to J$1.44 billion from J$2.07 billion for the same period in 2016.
There were 63 days of trading for the period from January 1, 2017 to March 31, 2017.
The following table shows yearly trading data for the Jamaica Stock Exchange Junior Market for the period from January 2011 to March 31, 2017:
Jamaica Stock Exchange Junior Market Trading Data – Junior Market
| | | | | | | | | | | | | | | | |
Period | | Period-End
Market
Capitalization | | | Value Traded | | | Period-End
Market Index | | | No. of
Listed
Companies | |
| | | (in millions of J$) | | | (in millions of J$) | | | | | | | |
2011 | | | 23,595.0 | | | | 1,247.9 | | | | 748.9 | | | | 12 | |
2012 | | | 22,101.6 | | | | 5,185.3 | | | | 647.8 | | | | 16 | |
2013 | | | 27,391.1 | | | | 1,386.0 | | | | 757.9 | | | | 21 | |
2014 | | | 26,097.1 | | | | 2,002.9 | | | | 687.9 | | | | 23 | |
2015 | | | 67,946.7 | | | | 7,429.7 | | | | 1,791.0 | | | | 23 | |
2016 | | | 103,417.6 | | | | 5,067.3 | | | | 2,593.7 | | | | 29 | |
January to March 2017 | | | 120,091.3 | | | | 1,442.9 | | | | 2,997.0 | | | | 30 | |
Source: Jamaica Stock Exchange.
JSE Junior Market Index
The JSE Junior Market Index started the year 2016 at 1,791.05 points and at December 31, 2016 the Index closed at 2,593.71 points. This represented an increase of 44.82%. The index closed at 2,997.00 points as at March 31, 2017. During 2016, there were six ordinary share listings and one preference share listing bringing the total listings on the JSE Junior Market to thirty-three and the total listed companies to twenty-nine as at December 31, 2016. During the period from January 1, 2017 to March 31, 2017, one company was listed on the JSE Junior Market increasing the number of companies listed to 30. The newly listed companies are set forth in the table below.
| | |
Company | | Date Listed |
CAC 2000 Limited | | January 7, 2016 |
tTech Limited | | January 7, 2016 |
IronRock Insurance Company Limited | | March 15, 2016 |
Jetcon Corporation Limited | | March 24, 2106 |
ISP Finance Services Limited | | March 30, 2016 |
Key Insurance Company Limited | | March 31, 2016 |
Eppley Limited 8.25% Preference Share | | December 22, 2016 |
Main Event Entertainment Limited | | February 8, 2017 |
Market Developments
As at March 31, 2017, the total number of companies listed on the Main Market stood at 34 while the total number of companies listed on the Junior Market stood at 30. There were 31 ordinary share and 12 preference share listings as at March 31, 2017 on the Main Market. As at March 31, 2017, the number of companies listed on the USD market stood at four companies: three ordinary share and two preference share listings. As at March 31, 2017, there are four securities listed on the JSE Bond Market.
D-99
The JSE implemented and launched its Online Trading Platform in May 2015. The JSE is also in the process of developing a Corporate Governance Index which will be launched in 2017.
D-100