UNITED STATES
SECURITIES AND EXCHANGE COMMISSION
Washington, D.C. 20549
_________________
FORM 6-K
Report of Foreign Private Issuer
Pursuant to Rule 13a-16 or 15d-16
of the Securities Exchange Act of 1934
For the Month of March 2011
_________________
HADERA PAPER LTD.
(Translation of Registrant’s Name into English)
P.O. Box 142, Hadera, Israel
(Address of Principal Corporate Offices)
Indicate by check mark whether the registrant files or will file annual reports under cover of Form 20-F or Form 40-F:
x Form 20-F oForm 40-F
Indicate by check mark if the registrant is submitting the Form 6-K in paper as permitted by Regulation S-T Rule 101(b)(1): o
Note: Regulation S-T Rule 101(b)(1) only permits the submission in paper of a Form 6-K if submitted solely to provide an attached annual report to security holders.
Indicate by check mark if the registrant is submitting the Form 6-K in paper as permitted by Regulation S-T Rule 101(b)(7): o
Note: Regulation S-T Rule 101(b)(7) only permits the submission in paper of a Form 6-K submitted to furnish a report or other document that the registrant foreign private issuer must furnish and make public under the laws of the jurisdiction in which the registrant is incorporated, domiciled or legally organized (the registrant’s “home country”), or under the rules of the home country exchange on which the registrant’s securities are traded, as long as the report or other document is not a press release, is not required to be and has not been distributed to the registrant’s security holders, and, if discussing a material event, has already been the subject of a Form 6-K submission or other Commission filing on EDGAR.
Indicate by check mark whether the registrant by furnishing the information contained in this form is also thereby furnishing the information to the Commission pursuant to Rule 12g3-2(b) under the Securities Exchange Act of 1934:
o Yes x No
If “Yes” is marked, indicate below the file number assigned to the registrant in connection with Rule 12g3-2(b): 82-______________
Attached hereto as Exhibit 1 and incorporated herein by reference is the Registrant’s press release dated March 7, 2011 with respect to the Registrant’s results of operations for the year ended December 31, 2010.
Attached hereto as Exhibit 2 and incorporated herein by reference is the Registrant’s Management Discussion with respect to the Registrant’s results of operations for the year ended December 31, 2010.
Attached hereto as Exhibit 3 and incorporated herein by reference is the Registrant’s periodical report for the year ended December 31, 2010.
Attached hereto as Exhibit 4 and incorporated herein by reference are the Registrant’s consolidated financial statements for the year ended December 31, 2010.
Attached hereto as Exhibit 5 and incorporated herein by reference are the consolidated financial statements of Hadera Paper- Printing and Writing Paper Ltd. and subsidiaries with respect to the year ended December 31, 2010.
Attached hereto as Exhibit 6 and incorporated herein by reference are the consolidated financial statements of Hogla-Kimberly Ltd. and subsidiaries with respect to the year ended December 31, 2010.
SIGNATURE
Pursuant to the requirements of the Securities Exchange Act of 1934, the Registrant has duly caused this report to be signed on its behalf by the undersigned, thereunto duly authorized.
HADERA PAPER LTD. (Registrant) By: /s/ Yael Nevo Name: Yael Nevo Title: Corporate Secretary |
Dated: March 8, 2011
EXHIBIT INDEX
Exhibit No. 1. 2. 3. 4. 5. 6. | Description Press release dated March 7, 2011. Registrant's management discussion. Registrant's periodical report. Registrant's consolidated financial statements. Consolidated financial statements of Hadera Paper- Printing and Writing Paper Ltd. and subsidiaries. Consolidated financial statements of Hogla- Kimberly Ltd. and subsidiaries. |
Exhibit 1
| NEWS | |
| For Release: IMMEDIATE |
Hadera Paper Ltd.
Reports Financial Results for Fiscal Year Ended December 31, 2010
Hadera, Israel, March 7, 2011 - Hadera Paper Ltd. (AMEX:AIP) (the “Company”) today reported financial results for the year ended December 31, 2010 ("the Reported Period") and for the fourth quarter of the year ("Fourth Quarter"). The Company, its subsidiaries and associated companies – are referred to hereinafter as the "Group".
The Consolidated Data set forth below excludes the results of operation of the associated companies: Hadera Paper- Printing and Writing Paper Ltd. ("Hadera Paper Printing") and Hogla-Kimberly Ltd. ("H-K").
It should be noted, that following an acquisition transaction, as at December 31, 2010, the Company holds approximately 75% of the shares of Hadera Paper Printing that was consolidated within the financial statements of the Company.
Consolidated sales in 2010 amounted to NIS 1,121.0 million, as compared with NIS 892.0 million last year, representing an increase of 25.7% originating primarily from growth in the packaging paper and recycling sector in relation to last year.
Consolidated sales in the Fourth Quarter of the year totaled NIS 336.4 million, as compared with NIS 237.6 million in the corresponding quarter last year, representing growth of approximately 41.6%, originating primarily as a result of an increase in the sales of the packaging paper and recycling sector in relation to the corresponding quarter last year and as compared with Fourth Quarter sales of NIS 295.4 million this year, representing growth of approximately 13.9%.
The operating profit totaled NIS 61.3 million in 2010, 5.5% of sales, as compared with NIS 15.6 million, 1.7% of sales, last year. The increase in operating profit in 2010 as compared with the corresponding year is primarily attributed to the increase in gross profit as a result of the increase in sales. In 2010 and in 2009 the operating profit included non-recurring revenues.
The operating profit in the Fourth Quarter of the year amounted to NIS 28.6 million in relation to operating profit of NIS 0.4 million in the corresponding quarter last year and as compared with operating profit of NIS 20.2 million in the third quarter of the year. The increase in operating profit this quarter is primarily attributed to the sharp rise in gross profit of paper and recycling sector, as a result of the increase in sales and the manufacturing efficiency of the sector as a result of the operation of Machine 8.
The net profit attributed to the Company's shareholders in 2010 amounted to NIS 100.7 million, as compared with net profit of NIS 91.2 million in 2009, representing an increase of 10.4%. The net profit, net of non-recurring revenues and expenditures during the Reported Period, amounted to approximately NIS 76.7 million, as compared with net profit, net of non-recurring revenues and expenditures in 2009 that amounted to NIS 59.2 million, representing an increase of 29.6%.
The net profit attributed to the Company's shareholders during the Reported Period was affected by the improvement in the operating margin of most Group companies in Israel as a result of the growth in operations that brought about an improvement in the operating profit.
Basic earnings per share amounted to NIS 19.84 per share ($5.59 per share) in 2010, as compared with basic earnings per share of NIS 18.03 per share ($4.78 per share) in 2009.
The exchange rate of the NIS in relation to the dollar was revaluated during 2010 by approximately 6.0%, as compared with a revaluation of approximately 0.7% last year (the average exchange rate of the NIS vis-à-vis the dollar was revaluated in 2010 by a rate of approximately 5.1% in relation to last year). The changes in exchange rates, affected the results of the various sectors, although the Group's business portfolio, including the investee companies, is practically at equilibrium in terms of foreign currency and consequently, the exposure of the group to sharp fluctuations in currency exchange rates is low.
The inflation rate in 2010 amounted to 2.7%, as compared with an inflation rate of 3.9% in 2009.
In the global packaging paper market, the Company estimates that as a result of the continuing rise in global pulp prices during the Reported Period, the demand for recycled packaging paper has increased, as an alternative to virgin packaging paper. The trend of rising prices of recycled products in the global packaging paper market continued consistently throughout the Reported Period, at an average rate of approximately 28% (according to publications by PPI Germany), and grew more moderate only toward the end of 2010 until its stabilization.
The Group manages a wide and diverse portfolio of companies and businesses focused on consumer goods and basic commodities. As part of the trend of consumption in the Israeli economy during the Reported Period, this trend led to an increase in demand at most Group companies for a wide range of products, while continuing to place an emphasis on the implementation of efficiency and cost-cutting measures across all sectors of operation.
The aforementioned revaluation of the NIS in relation to the average dollar and the euro, in relation to last year, by approximately 5.1% and 9.4%, respectively, led to savings in terms of inputs and imported products denominated in dollars or euro, in the principal sectors of operation of the Company, whose prices track import prices in the said currencies. As a result of the said revaluation, the relative price of natural gas denominated in dollars, decreased by approximately 6% in relation to last year and also contributed to savings. Moreover, the price of electricity also decreased by approximately 10% in 2010, in relation to last year. These savings were partially offset by the rising prices of water during the year, by an average rate of 42%, along with the sharp rise in the price of fibers by approximately 43%, in relation to last year.
Net financial expenses amounted to NIS 44.8 million in 2010, as compared with NIS 18.3 million in 2009. The growth in financial expenses originated primarily as a result of the growth in financial expenses on account of long-term liabilities, that increased by approximately NIS 30.6 million relation to last year, mostly due to the cost of financing Series 3 and 4, whose discounting of financing costs for Machine 8 ended at the end of May, coupled with the issuing of bond series 5 (new series) in May. Moreover, an increase was recorded in financial expenses as a result of long-term loans assumed by a subsidiary for financing an investment in a corrugator.
2
The Company’s share in the earnings of associated companies totaled NIS 81.1 million in 2010, as compared with NIS 87.4 million last year.
The following principal changes were recorded in the Company’s share in the earnings of associated companies, in relation to the corresponding period last year:
| - | The Company's share in the net profit of Hadera Paper Printing (49.9%) in 2010 amounted to NIS 11.1 million as compared with NIS 14.1 million in 2009, a decrease of NIS 3.0 million. The decrease in the profit originated primarily from the decrease in the operating profit of Hadera Paper Printing, that decreased from NIS 40.5 million last year, to NIS 31.1 million this year. The decrease in operating profit in 2010 originated primarily from the sharp rise in the prices of raw materials in relation to last year, despite measures to raise prices in the course of the year and the improved gross margin of part of the product range. The decrease in net income was also affected by the growth in tax expenditures in the amount of NIS 6.7 million in 2010, as compared with last year, primarily as a result of recording tax revenues of approximately NIS 6 million last year as a result of the change in the tax rate, that were offset as a result of the reduction in financial expenses in the amount of NIS 9.7 million. |
| - | The Company's share in the net profit of H-K in Israel (49.9%) in 2010 amount to NIS 75.0 million as compared with NIS 83.0 million in 2009. The decrease in the sum of NIS 8.0 million, originated primarily from the decrease in operating profit that fell from NIS 210.0 million to NIS 193.8 million this year. The decrease in the operating profit is primarily attributed to the erosion of the selling prices in some sectors of operation, coupled with the rise in the prices of some principal inputs at the company, that were offset by far-reaching efficiency measures that were implemented across the company, continuing savings in purchasing and the strengthening of the company brands, led to a reduction in the erosion of earnings in 2010. |
| - | The Company's share in the losses of KCTR Turkey (49.9%) in 2010, amounted to NIS 2.7 million, as compared with NIS 7.6 million in 2009, representing a decrease of NIS 4.9 million. This reduction in loss, despite the slight decrease in the volumes of operation, is primarily attributed to the sale of the PEDO brand to a local chain, that generated non-recurring revenues of NIS 3.1 million in 2010, that brought about the continuing reduction in the net loss from NIS 15.1 million last year, to NIS 5.4 million in 2010. In addition, the loss was reduced as a result of recording of financial revenues from the valuation of operational balances. |
The Company also announced that the Board of Directors has approved the convening of an annual general shareholders meeting to discuss the financial reports and management discussion for 2010, and to approve, the election of directors (other than external directors), the nomination of the auditing CPA's for 2011 and the approval of a lease agreement between the Company and Clal PV Projects Ltd. (a private company held and indirectly controlled by Clal Industries and Investments Ltd., the Company's controlling shareholder) for the Company’s leasing roof area to Clal P.V. for construction of installations for the production of electricity using photovoltaic technology. At such time as the Company fixes the record date and meeting date for the shareholders meeting, it will distribute a proxy statement describing the proposals to be considered at the meeting.
3
This report contains various forward-looking statements based upon the Board of Directors’ present expectations and estimates regarding the operations and plans of the Group and its business environment. The Company does not guarantee that the future results of operations will coincide with the forward-looking statements and these may in fact differ considerably from the present forecasts as a result of factors that may change in the future, such as changes in costs and market conditions, failure to achieve projected goals, failure to achieve anticipated efficiencies and other factors which lie outside the control of the Company as well as certain other risks detailed from time to time in the Company's filings with the Securities and Exchange Commission. The Company undertakes no obligation for publicly updating the said forward-looking statements, regardless of whether these updates originate from new information, future events or any other reason.
Hadera PAPER LTD.
SUMMARY OF RESULTS
(AUDITED)
except per share amounts
NIS IN THOUSANDS (1)
| 2010 | 2009 | |||||||
| Net sales | 1,121,008 | 891,995 | ||||||
| Net earnings attributed to the Company's shareholders | 100,728 | 91,230 | ||||||
| Basic net earnings per share attributed to the Company's shareholders | 19.84 | 18.03 | ||||||
| Fully diluted earnings per share attributed to the Company's shareholders | 19.68 | 18.03 | ||||||
(1) The representative exchange rate at December 31, 2011 was NIS 3.549=$1.00.
Contact:
Yael Nevo, Adv.
Corporate Secretary and Chief of Legal Department
Hadera Paper Ltd. Group
Yaeln@hadera-paper.co.il
4
Exhibit 2

-Translation from Hebrew-
March 6, 2011
MANAGEMENT DISCUSSION
The Board of Directors of Hadera Paper Ltd. ("The Company" or "Hadera Paper"", the Company, its consolidated subsidiaries and its associated companies – hereinafter: “The Group”)) is hereby honored to present the Management Discussion as at December 31, 2010, reviewing the principal changes in the operations of the company for the months January to December 2010 ("The Period of the Report" or "The Reported Period"). The report was formulated in accordance with the Securities Regulations (Periodic and Immediate Reports), 1970. The results of the company that are presented in the management discussion relate to the share of the shareholders of the company in the results, unless stated otherwise.
A. | Description of the Corporation’s Business |
| 1. | Company Description |
Hadera Paper Group deals in the manufacture and sale of packaging paper, corrugated board packaging, consumer product packaging and unique packaging for industry, recycling of paper and plastic waste, manufacture and marketing of fine paper and in the marketing of office supplies – through subsidiaries. The Company also holds associated companies that deal in the manufacture and marketing of household paper products, hygiene products, disposable diapers and complementary kitchen products.
The company’s securities are traded on the Tel Aviv Stock Exchange and on the New York Stock Exchange (NYSE).
| 2. | General |
Principal Current Operations
| 1. | Business Environment |
The economic recovery in most world financial and real markets continued during 2010, especially in awakening markets, including Israel. At the same time, the effects of the financial crisis which began in 2008 are still evident, including in the fluctuation of rates of securities and currencies, in light of the uncertainty regarding the capacities of some of the European countries to service their debts, the United States’ ability to bring down unemployment rates, the slow recovery of the US real estate market and the handling of increasing inflation in developing countries (China, in particular), following the sharp rise in commodity prices throughout the world.
In Israel, 2010 was a year of recovery from the global crisis. Starting in the second half of 2009, a gradual recovery was noted in GDP. This trend continued in 2010 as well, as 4.5% growth was recorded,1 as compared with 0.8% growth in 2009. Exports of goods and services grew by 12.6%2 in 2010, as compared with a decrease of 12.5% in 2009. In parallel to the recovery in exports in 2010, local demand bounced back, the industry’s sales in the local market grew at a cumulative rate of approximately 5% from the last quarter of 2009 until the second quarter of 2010. In 2010, a rise in private consumption per capita was noted, of some 2.9%3. The growth in local demand stemmed from households, in light of the drop in unemployment rates, as well as from the real increase in average wages in the market, as well as in light of the rise in economic activity in general.
The local capital market showed a positive trend in 2010, and at the same time, capital raising in the corporate debt market gradually increased. The obvious recovery of the Israeli market, on the one hand, and concerns regarding development of a bubble in the local residential real estate market, on the other hand, caused the Bank of Israel to slowly and gradually increase the monetary interest rate, and at the same time to continue be involved in the foreign currency market, and lately, in cooperation with the Ministry of Finance, also to pressure the short term movements of foreign capital. 2011 opened with a continued growth trend for the Israeli market and recovery in the financial markets, together with the development of a trend of geo-political instability in a number of countries in the Middle East.
The continued trend of geopolitical instability in the Middle East could, under certain scenarios, negatively impact the status of the Israeli market and also on the Company’s option of engaging under an agreement with gas provider EMG, one of the gas providers the Company has been negotiating with, in connection with gas supply. As of the date of this report, the Company cannot assess the impact the situation in the region will have on the option of said engagement with EMG, or said impact on possible conditions of engagement with other gas suppliers.
In September 2010 Israel formally joined the OECD (Organization for Economic Cooperation and Development) as a full member. The OECD is a forum of countries committed to democracy and free-market economics, serving as a platform formulate policy and actual practice in economics, society and the environment. Membership in the OECD serves as an indication that Israel is considered to be a "developed nation" and meets the economic and regulatory standards set by the organization. Moreover, Israel's membership in the OECD may hold a positive influence on foreign investors who are considering an investment in Israel and may also serve to influence the credit rating of the State of Israel.
1 Growth data from the Central Bureau of Statistics, December 29, 2010, "Preliminary Assessments for National Accounts for 2010".
2 The data regarding the export of goods and services originating from Central Bureau of Statistics publication, December 29, 2010, "Preliminary Assessments for National Accounts for 2010".
3 Data regarding consumption per capita from the Central Bureau of Statistics, December 29, 2010, "Preliminary Assessments for National Accounts for 2010".
2
In the global packaging paper market, the company estimates that as a result of the continuing rise in global pulp prices during the reported period, the demand for recycled packaging paper has increased, as an alternative to virgin packaging paper. The trend of rising prices of recycled products in the global packaging paper market continued consistently throughout the reported period, at an average rate of approximately 28% (according to publications by PPI Germany), and grew more moderate only toward the end of 2010 until its stabilization. At the beginning of 2011, the rising trend in global recycled paper prices is expected to continue according to indications in the publications of several recycled paper manufacturers in Europe. An additional increase in prices is expected starting in February 2011, a rate of approximately 10%. The said increase in prices and demand, in addition to the prevailing high level of prices, may support the continued growth and expansion in the volumes of operation of the packaging paper sector, in Israel and worldwide.
The above information regarding the impact of Israel having joined the OECD and pertaining to future trends in the paper market and input prices constitutes forward-looking information as defined in the Securities Law, based on the company's estimates at the date of this report. These estimates may not materialize - in whole or in part - or may materialize in a different manner, inter alia on account of factors that lie outside the control of the company, such as business opportunities the company may have, dependence on external factors and changes in regulation, changes in global raw material prices and changes in the supply and demand of global paper products as well as changes in the geopolitical situation in the Middle East.
| 2. | Impact of the Business Environment on Company Operations |
General
The Hadera Paper Group manages a wide and diverse portfolio of companies and businesses focused on consumer goods and basic commodities. As part of the trend of consumption in the Israeli economy during the reported period, this trend led to an increase in demand at most Group companies for a wide range of products, while continuing to place an emphasis on the implementation of efficiency and cost-cutting measures across all sectors of operation.
Sector Operations
In the packaging paper and recycling sector, Machine 8(the new packaging paper manufacturing array) entered into operation during the reported period. This manufacturing array is expected to lead to the doubling of operations in the sector. The running-in of the machine was completed in May and the results of operations have been included as part of the profits of the packaging paper and recycling sector since June. In parallel, the gradual improvement in the learning curve of the machine is continuing. Following the operation of the new manufacturing array, the sales turnover of the packaging paper and recycling sector has increased, both to the domestic market and in export sales. Selling prices in the packaging paper sector are currently on an upward trend globally and locally. This trend is apparently expected to continue in the near future. These factors and others are expected to assist in the continuing improvement in the profitability and results of the sector. Regarding the capitalization of the net costs of the running-in period, see Note 6g to the financial statements.
3
Paper waste, which constitutes the main raw material for the manufacture of packaging paper is collected by Amnir from various sources throughout Israel. On January 19, 2001, the Formalization of Treatment of Packaging Law – 2011 (hereinafter: the Packaging Law), with the goal of regulating arrangements in the matter of treatment of packaging waste. Inter alia, the Packaging Law establishes responsibility for recycling packaging waste and goals for recycling types of packaging waste. The Packaging Law will enter into effect on March 1, 2011, and certain provisions regarding the start of collection by the recognized body will enter into effect on July 1, 2011. In light of the provisions of the Packaging Law, an adjustment will be required in the set-up of the Company’s collection of paper. However, the Company cannot at this stage estimate the impact the law will have on operations, and this is dependent, inter alia, on regulations that will be enacted by power of the law in the matter of separation at source, removal and collection of waste, and on the method of operation to be used by the recognized body to be established by power of the law. The company is examining its preparations in anticipation of the potential setup of collection. For additional details regarding the packaging law, seen a detailed explanation in the periodical report in Section 24.1.24.5.
The impact of the packaging law on the company constitutes forward-looking information as defined in the Securities Law, based on the company's estimates at the date of this report. These estimates may not materialize - in whole or in part - or may materialize in a different manner, inter alia on account of factors that lie outside the control of the company, such as arrangements that will be determined by virtue of the law, changes in global raw material prices and changes in the supply and demand of global paper products.
In the fine paper sector, pulp prices continued to soar during the reported period in relation to the corresponding period last year, inter alia as a result of the damage of the earthquake in Chile, that harmed three production plants of large pulp suppliers, thereby leading to delays in the provision of pulp to the global market. In order to compensate for this cost increase, prices were raised in this sector starting in the second quarter. This rise in prices served to compensate for the decrease in the sold quantities, among others. Additionally, Hadera Paper Printing successfully expanded its exports to the United States in 2010, thereby contributing to its improved profitability. The relocation to the logistics center in Modi'in is expected to improve the Company’s logistic capacities and to support the Company’s continued growth and development.
On December 31, 2010, the company acquired from a subsidiary of Mondi Business Paper Group, 25.1% of the issued and outstanding share capital of Hadera Paper Printing, (hereinafter in this section: "The Acquisition Transaction"). The total consideration of the acquisition transaction amounted to €10.364 million, that were paid from the company's own resources. Following the closing of the transaction, true to the date of the report, the company holds approximately 75% of the shares of Hadera Paper Printing, that was consolidated within the financial statements of the company, with a subsidiary of Mondi Group holding the remaining shares of Hadera Paper Printing. As to the accounting implications, see Note 17 to the Company's financial statements dated December 31, 2010, attached to this report.
4
On October 4, 2010, the Company completed a full tender offer for the acquisition of all of the holdings of the public in Carmel, at a price of $22.5 per share in cash, at a total consideration of approximately $4.4 million. As of October 4, 2010, the Company holds 100% of the issued and outstanding share capital and voting rights of Carmel, that has become a privately held company.
In the household paper and absorbent market (through the Hogla Kimberly sector - an associated company), the level of profitability has decreased somewhat in relation to the corresponding period, due to the fierce competition in certain areas of activity. Moreover, the collapse of a significant supplier overseas has created shortages and has led to a temporary increase in costs, that was partially offset by significant efficiency measures. Operations in this sector during the reported period were characterized by price competition and by a preference of consumers for attractively-priced products. The company is therefore continuing to promote special sales campaigns in order to preserve customers and market share. Additionally, the revaluation of the NIS in relation to the average dollar exchange rate during the reported period, as compared with the corresponding period last year, has reduced the damage associated with the higher purchasing costs in some of the sectors. Efforts were also made to distribute purchasing among a wider selection of suppliers, in order to reduce costs. These measures provided the company with the necessary flexibility in order to protect market share and preserve optimized profitability in a competitive business environment.
Raw Materials
In the course of 2010, the NIS was revaluated in relation to the average dollar and the euro, in relation to last year, by a rate of approximately 5.1% and 9.4%, respectively. This revaluation led to savings in terms of inputs and imported products denominated in dollars or euro, in the principal sectors of operation of the company, whose prices track import prices in the said currencies. As a result of the said revaluation, the relative price of natural gas denominated in dollars, decreased by approximately 6% in relation to last year and also contributed to savings. Moreover, the price of electricity also decreased by approximately 10% in 2010, in relation to last year. These savings were partially offset by the rising prices of water during the year, by an average rate of 42%, along with the sharp rise in the price of fibers by approximately 43%, in relation to last year.
Impact of Developments in Financial Markets
The developments in global markets, and especially in the euro bloc and in the United States, that also include volatility in global exchange rates, have and may continue to affect the business results of the Company and its investees, their liquidity, shareholders' equity and assets and the ability to realize these assets, the state of their business (including the demand for the products of the Company's investees), their financial benchmarks and covenants, credit ratings, ability to distribute dividends and even their ability to raise financing for operating activities and long-term activities as well as the financing terms.
5
All of the above, in relation to trends in the global market, in the paper market, in selling prices and in the prices of inputs and their impact on the company, the influence of the completion of the running-in period of the new manufacturing array - all constitute forward-looking information as defined in the securities law, based on the company's estimates at the date of this report. These estimates may not materialize - in whole or in part - or may materialize in a different manner, inter alia on account of factors that lie outside the control of the company, such as the crisis in global credit and banking markets, changes in global raw material prices and changes in the supply and demand of global paper products.
As at the date of publication of these financial statements, no material changes have occurred to the Company's risk management policy.
The exchange rate of the NIS in relation to the dollar was revaluated during 2010 by approximately 6.0%, as compared with a revaluation of approximately 0.7% last year (the average exchange rate of the NIS vis-à-vis the dollar was revaluated in 2010 by a rate of approximately 5.1% in relation to last year).
The changes in exchange rates as mentioned above, affected the results of the various sectors, although the group's business portfolio, including the investee companies, is practically at equilibrium in terms of foreign currency and consequently, the exposure of the group to sharp fluctuations in currency exchange rates is low.
The inflation rate in 2010 amounted to 2.7%, as compared with an inflation rate of 3.9% in 2009. As regards hedging transactions conducted by the company in 2010 on account of its index-linked liabilities, see Section E2, below.
B. | Explanation of the Results of Operation |
| 1. | Analysis of Operations and Profitability |
Commencing January 1, 2009, the company applies International Financial Reporting Standard (IFRS) No. 8, “Operating Segments”, and has accordingly recognized the packaging products and board segment, which includes the operations of Carmel Container Systems and Frenkel C.D., as a separate segment. The associated companies Hogla Kimberly and Hadera Paper - Printing and Writing Paper Ltd. ("Hadera Paper Printing") - formerly Mondi Hadera Paper (a consolidated company as of December 31, 2010) were also recognized as independent segments (for further details, see Note 21 to the financial statements dated December 31, 2010). Please note that the following analysis of financial results relates to the companies that are consolidated in the results of Hadera Paper and is affected by the adoption of the Standard mentioned above.
6
| a. | Sales |
Consolidated sales in 2010 amounted to NIS 1,121.0 million, as compared with NIS 892.0 million last year, representing an increase of 25.7% originating primarily from growth in the packaging paper and recycling sector in relation to last year.
The sales of the packaging paper and recycling sector amounted to NIS 511.4 million in 2010, or NIS 442.7 million net of inter-company sales, as compared with NIS 339.3 million, or NIS 264.2 million net of inter-company sales last year, representing an increase of 67.6%.
The growth in the sales turnover of the packaging paper and recycling sector originates from quantitative growth in the sales of packaging and recycling as a result of the operation of Machine 8, as mentioned above. The growth in the output of Machine 8 served to increase exports to Europe and offered a response for the growth in demand from the local market. The growth in sales is also attributed to the rise in selling prices in relation to last year.
The sales of the packaging products and cardboard sector in 2010 amounted to NIS 509.7 million, and NIS 500.8 million net of inter-company sales, as compared with NIS 484.3 million, and NIS 477.8 million net of inter-company sales, last year, representing an increase of approximately 4.8%, originating primarily as a result of the increase in the volume of operations of the companies in this sector.
The sales of the office supplies marketing sector in 2010 amounted to NIS 178.8 million, or NIS 177.5 million net of inter-company sales, as compared with NIS 151.0 million last year, or NIS 150.0 million net of inter-company sales, representing an increase of 18.3% that originated from the quantitative growth in sales, primarily due to having secured institutional tenders that have expanded the volume of customers and activity in this sector.
The consolidated sales in the fourth quarter of the year totaled NIS 336.4 million, as compared with NIS 237.6 million in the corresponding quarter last year, representing growth of approximately 41.6%, originating primarily as a result of an increase in the sales of the packaging paper and recycling sector in relation to the corresponding quarter last year and as compared with fourth quarter sales of NIS 295.4 million this year, representing growth of approximately 13.9%.
| b. | Cost of Sales |
The cost of sales amounted to NIS 945.4 million in 2010 – or 84.3% of sales – as compared with NIS 765.7 million – or 85.8% of sales – last year. The improvement in the ratio of cost of sales to sales is primarily attributed to the manufacturing efficiency of Machine 8 and a reduction in the rate of consumption of raw materials, despite the sharp rise in output. The increase in the cost of sales originated primarily from an increase in manufacturing costs, (especially energy costs and the use of raw materials, as a result of the operation of Machine 8).
The gross profit totaled NIS 175.6 million in 2010 (15.7% of sales), as compared with NIS 126.3 million, 14.2% of sales, last year, representing growth of approximately 39.0% in relation to last year.
The higher gross profit in relation to last year originated primarily as a result of a quantitative growth in sales in light of the initial recognition of revenues from the sales of Machine 8 in June, coupled with the expansion of operations at the entire range of companies as a result of the market recovery, as stated above. The growth in gross profit is also attributed to the lower prices of some of the raw materials, see Section A2, above.
7
Labor Wages
The labor wages within the cost of sales amounted to NIS 215.1 million in 2010,19.2% of sales, as compared with NIS 206.9 million last year,23.2% of sales. The growth in the labor wages in relation to last year is primarily attributed to the rise in the number of employees as a result of the growth in the volume of operations, both in the office supplies sector and in the packaging paper and recycling sector, that were offset as a result of the discounting of labor expenses in the sum of NIS 8.5 million in the running-in period of Machine 8. (See Note 6f to the financial statements dated December 31, 2010).
The labor wages within the general and administrative expenses amounted to NIS 95.7 million in 2010, 8.5% of sales, as compared with the sum of NIS 87.5 million last year, 9.8% of sales.
The growth in the cost of labor wages in relation to 2009 originated primarily from the recording of labor wages on account of a special bonus to the retiring CEO, according to the decision of the Board of Directors dated March 23, 2010.
The relatively sharp drop in the cost of labor wages as a proportion of sales is primarily attributed to the growth in the volume of operations and sales.
| c. | Selling, General and Administrative and other Expenses |
The growth in selling, general and administrative and other expenses is primarily attributed to the wage bonus granted to the retiring CEO, as mentioned above, that was offset by the recording of proceeds from the sale of real estate in the amount of NIS 18.5 million, a refund of approximately NIS 8.5 million from Hadadit fund for employers and earnings from the devaluation of an investment in a subsidiary that was consolidated on December 31, 2010, in the amount of NIS 5.8 million. The general and administrative expenses also included an amortization of excess cost in the sum of NIS 2.7 million, on account of excess cost recorded during the acquisition of Carmel and Frenkel CD in 2008. Net of the non-recurring labor expenses and net of non-recurring revenues, the Selling General, Administrative and Other expenses increased by approximately NIS 20.0 million, in relation to last year. The increase in expenses originates primarily from an increase in the selling and transportation expenses as a result of the growth in the volumes of operation on the local market in various sectors as well as opposite export markets of the packaging and recycling sector, coupled with the recording of an expenditure related to the valuation of a Hadera Paper Printing Put option in the amount of NIS 0.9 million in 2010, as compared with a revenue of NIS 1.9 million last year.
8
The selling, general and administrative expenses (including wages) and other expenses amounted to NIS 114.3 million in 2010 or 10. 2% of sales – as compared with NIS 110.7 million, 12.4% of sales, last year. Net of non-recurring revenues during the reported period, as a result of the sale of assets in the amount of approximately NIS 18.5 million, a refund from Hadadit fund for employers, valuation of an investment in an investee company and a non-recurring labor expenditure, as mentioned above, the selling, general and administrative expenses amounted to NIS 147.1 million, or approximately 13.1% of sales, as compared with last year, when the selling, general and administrative and other expenses, net of non-recurring revenues as a result of the distribution of a unilateral dividend on account of a preferred share that was allocated by a consolidated subsidiary in the amount of NIS 16.4 million, amounted to NIS 127.1 million, or approximately 14.2% of sales.
| d. | Operating Profit |
The operating profit totaled NIS 61.3 million in 2010, 5.5% of sales, as compared with NIS 15.6 million, 1.7% of sales, last year. The increase in operating profit in 2010 as compared with the corresponding year, is primarily attributed to the increase in gross profit as a result of the increase in sales, as mentioned above. In 2010 and in 2009 the operating profit included non-recurring revenues, as mentioned in Section 1.3, above.
The operating profit of the paper and recycling sector amounted to NIS 50.1 million in 2010, as compared with an operating loss of NIS 2.8 million last year, that included non-recurring profits, as mentioned above. It should be noted that the expenses allocated in 2010 to the packaging sector included non-recurring labor expenses of NIS 5.0 million, as detailed in Section 1.2, above.
The operating profit of the packaging products and board segment amounted to NIS 7.1 million in 2010, as compared with an operating profit of NIS 14.7 million last year. The decrease in operating profit in this sector is primarily attributed to the rise in raw material prices and the increase in other manufacturing expenses, as compared with last year.
The operating profit of the office supplies sector amounted to NIS 5.1 million in 2010, as compared with NIS 4.0 million last year.
The operating profit in the fourth quarter of the year amounted to NIS 28.6 million in relation to operating profit of NIS 0.4 million in the corresponding quarter last year and as compared with operating profit of NIS 20.2 million in the third quarter of the year. The increase in operating profit this quarter is primarily attributed to the sharp rise in gross profit of paper and recycling sector, as a result of the increase in sales and the manufacturing efficiency of the sector as a result of the operation of Machine 8, as mentioned above.
| e. | Financial Expenses |
Net financial expenses amounted to NIS 44.8 million in 2010, as compared with NIS 18.3 million in 2009.
The growth in financial expenses originated primarily as a result of the growth in financial expenses on account of long-term liabilities, that increased by approximately NIS 30.6 million relation to last year, mostly due to the cost of financing Series 3 and 4, whose discounting of financing costs for Machine 8 ended at the end of May, coupled with the issuing of bond series 5 (new series) in May. Moreover, an increase was recorded in financial expenses as a result of long-term loans assumed by a subsidiary for financing an investment in a corrugator.
9
| f. | Taxes on Income |
Tax revenues of NIS 3.0 million were recorded in 2010, as compared with tax revenues totaling NIS 7.1 million in 2009. The decrease in tax revenues this year, originating from a loss for tax purposes in the current operations, by comparison with the tax revenues last year, is primarily attributed to non-recurring tax revenues in the amount of NIS 8.6 million that were included in 2009, as a result of the decrease in the tax rate over the next several years.
| g. | Company’s Share in Earnings of Associated Companies |
The companies whose earnings are reported under this item (according to Hadera Paper’s holdings therein), include primarily: Hadera Paper Printing, Hogla Kimberly.
The company’s share in the earnings of associated companies totaled NIS 81.1 million in 2010, as compared with NIS 87.4 million last year.
The following principal changes were recorded in the Company’s share in the earnings of associated companies, in relation to the corresponding period last year:
| - | The Company's share in the net profit of Hadera Paper Printing (49.9%) in 2010 amounted to NIS 11.1 million as compared with NIS 14.1 million in 2009, a decrease of NIS 3.0 million. The decrease in the profit originated primarily from the decrease in the operating profit of Hadera Paper Printing, that decreased from NIS 40.5 million last year, to NIS 31.1 million this year. The decrease in operating profit in 2010 originated primarily from the sharp rise in the prices of raw materials in relation to last year, despite measures to raise prices in the course of the year and the improved gross margin of part of the product range. The decrease in net income was also affected by the growth in tax expenditures in the amount of NIS 6.7 million in 2010, as compared with last year, primarily as a result of recording tax revenues of approximately NIS 6 million last year as a result of the change in the tax rate, that were offset as a result of the reduction in financial expenses in the amount of NIS 9.7 million. |
| - | The Company's share in the net profit of Hogla Kimberly in Israel (49.9%) in 2010 amount to NIS 75.0 million as compared with NIS 83.0 million in 2009. The decrease in the sum of NIS 8.0 million, originated primarily from the decrease in operating profit from NIS 210.0 million to NIS 193.8 million this year. The decrease in the operating income is primarily attributed to the erosion of the selling prices in some sectors of operation, coupled with the rise in the prices of some principal inputs at the company, that were offset by far-reaching efficiency measures that were implemented across the company, continuing savings in purchasing and the strengthening of the company brands, led to a reduction in the erosion of earnings in 2010. |
10
| - | The Company's share in the losses of KCTR Turkey (49.9%) in 2010, amounted to NIS 2.7 million, as compared with NIS 7.6 million in 2009, representing a decrease of NIS 4.9 million. This reduction in loss, despite the slight decrease in the volumes of operation, is primarily attributed to the sale of the PEDO brand to a local chain, that generated non-recurring revenues of NIS 3.1 million in 2010, that brought about the continuing reduction in the net loss from NIS 15.1 million last year, to NIS 5.4 million in 2010. In addition, the loss was reduced as a result of recording of financial revenues from the valuation of operational balances. |
| h. | The Net Profit and the Earnings Per Share Attributed to the Company's Shareholders |
The net profit attributed to the Company's shareholders in 2010 amounted to NIS 100.7 million, as compared with net profit of NIS 91.2 million in 2009, representing an increase of 10.4%. The net profit, net of non-recurring revenues and expenditures during the reported period, amounted to approximately NIS 76.7 million, as compared with net profit, net of non-recurring revenues and expenditures in 2009, that amounted to NIS 59.2 million, representing an increase of 29.6%.
The net profit attributed to the Company's shareholders during the reported period was affected by the improvement in the operating margin of most Group companies in Israel as a result of the growth in operations that brought about an improvement in the operating profit, as mentioned above.
Basic earnings per share amounted to NIS 19.84 per share ($5.59 per share) in 2010, as compared with basic earnings per share of NIS 18.03 per share ($4.78 per share) in 2009.
Diluted earnings per share amounted to NIS 19.68 per share ($5.55 per share) in 2010, as compared with diluted earnings per share of NIS 18.03 per share ($4.78 per share) in 2009.
| 2. | Analysis of the Company's Financial Situation |
| · | The cash and cash equivalents item rose from NIS 26.3 million on December 31, 2009 to NIS 121.0 million on December 31, 2010. The increase in cash and cash equivalents originates primarily from the issuing of bond series 5 in the second quarter, that was invested in NIS deposits and is serving to finance the company's current operations. |
| · | The designated deposits in the sum of NIS 127.6 million on December 31, 2009 were utilized entirely in the course of 2010. The decrease in deposits originates as a result of the use of the designated deposit funds for the construction of Machine 8, between the reported years. |
| · | The increase in the accounts receivable item originates from the consolidation of the Hadera Paper Printing customers on December 31, 2010, in the amount of approximately NIS 175.6 million. In the packaging paper and recycling sector, an increase was recorded from NIS 81.2 million on December 31, 2009, to NIS 124.7 million on December 31, 2010. This increase is attributed to quantitative growth in activity in both local and export markets. In the packaging products and cardboard sector, a decrease was recorded in trade receivables, from NIS 199.4 million on December 31, 2009, to NIS 190.2 million on December 31, 2010, as a result of an increase in sales in this sector, coupled with an increase in the days of credit in some of the segments of operation in the sector. Trade receivables for the office supplies marketing sector rose from NIS 53.1 million as at December 31, 2009, to NIS 65.2 million, as at December 31, 2010, as a result of growth in the volume of operations. |
11
| · | Other receivables relating to the packaging paper and recycling segment decreased from NIS 92.1 million as at December 31, 2009, to NIS 43 million as at December 31, 2010. The decrease originates primarily from a reduction in credit/debit of inter-company balances as a result of the consolidation of Hadera Paper Printing on December 31, 2010 and the accounts payable balance that was consolidated and amounted to NIS 6.0 million. Other receivables relating to the packaging products and board sector decreased from NIS 5.1 million as at December 31, 2009, to NIS 4.5 million as at December 31, 2010. In the office supplies marketing segment, the other accounts receivable item increased from NIS 1.7 million on December 31, 2009, to NIS 3.6 million on December 31, 2010, primarily as a result of the increase in supplier advances. |
| · | The increase in the inventories item originates from the consolidation of the Hadera Paper Printing inventories on December 31, 2010, in the amount of approximately NIS 161.6 million. Inventories in the packaging paper and recycling sector decreased from NIS 91.1 million as at December 31, 2009, to NIS 76.2 million as at December 31, 2010. This increase is primarily attributed to utilizing the paper waste inventory as a result of the full operation of the new packaging paper manufacturing machine, following the completion of its running-in period. Inventories of the packaging products and board sector increased from NIS 68.5 million as at December 31, 2009, to NIS 79.1 million as at December 31, 2010. The increase is primarily attributed to the 7% rise in prices of raw materials in relation to last year. Inventories in the office supplies marketing sector rose from NIS 20.6 million as at December 31, 2009, to NIS 26.6 million, as at December 31, 2010, primarily as a result of growth in the inventories imported from the Far East. |
| · | The investment in associated companies decreased from NIS 340.1 million on December 31, 2009, to a sum of NIS 237.5 million on December 31, 2010. The principal components of the said decrease, include the consolidation of Hadera Paper Printing for the first time on December 31, 2010, which led to a decrease in investments of NIS 117.7 million, coupled with the company share in the dividend in distributed in the amount of NIS 47.4 million from associated companies and the company share in the declared dividend in the sum of NIS 2.5 million by an associated company, that were offset by the company share in the earnings of associated companies in the sum of NIS 70.1 million, between the reported years, that led to a decrease in investment between the reported years. |
| · | Short-term credit increased from NIS 131.6 million on December 31, 2009 to NIS 144.6 million on December 31, 2010. The growth in this item originates primarily as a result of the consolidation of the credit balances of Hadera Paper Printing on December 31, 2010, in the amount of NIS 92.9 million, that were offset as a result of the repayment of credit. |
12
| · | The growth in the other payables item originates primarily from the consolidation of the Hadera Paper Printing balances in the amount of NIS 23.7 million. In the packaging paper and recycling sector, growth was recorded from NIS 88.5 million as at December 31, 2009, to NIS 129 million as at December 31, 2010. The growth originated primarily as a result of a payable debt in the sum of NIS 49.4 million, on account of the purchase of Hadera Paper Printing. Other accounts payable of the packaging products and board sector increased from NIS 13.8 million as at December 31, 2009, to NIS 14.6 million as at December 31, 2010, primarily as a result of growth in debts to institutions on account of employees. Other accounts payable for the office supplies marketing sector decreased from NIS 5.8 million on December 31, 2009 to NIS 5.0 million on December 31, 2010. |
| · | The company’s shareholders' equity increased from NIS 858.4 million as at December 31, 2009 to NIS 953.6 million as at December 31, 2010. This change originated primarily from the net profit attributed to the company's shareholders between the periods, in the sum of NIS 100.7 million. |
| 3. | Investments in Fixed Assets |
| Investments in fixed assets amounted to NIS 219.1 million in 2010, as compared with NIS 352.5 million in 2009. The investments this year consisted primarily of payments on account of purchasing from equipment vendors for the new packaging paper manufacturing network (Machine 8), in the sum of NIS 96.3 million (including a decrease of NIS 43.8 million in supplier credit). The outstanding investment in Machine 8, true to December 31, 2010, amounts to NIS 702.3 million. Additional investments included were related to environmental protection (wastewater treatment) and current investments in equipment renewal, means of transportation and building maintenance at the Hadera site. |
| Regarding the examination of the need for impairment during the reported period, see Note 4c4 of the financial statements dated December 31, 2010, as well as the highly significant devaluation attached to the financial statements dated December 31, 2010. |
| 4. | Financial Liabilities The long-term liabilities (including current maturities) amounted to NIS 989.6 million as at December 31, 2010, as compared with NIS 847.6 million as at December 31, 2009. The long-term liabilities have increased in relation to last year primarily as a result of the issuing of a NIS-denominated bond series (Series 5) in the amount of NIS 181.5 million in the second quarter (see Note 10a(4) to the financial statements dated December 31, 2010), coupled with the assumption of long-term loans intended to finance the payments for Machine 8, as well as the consolidation of the long-term loans of Hadera Paper Printing in the amount of NIS 13.0 million. This increase was offset as a result of the repayment of the older debenture series, coupled with the cash flows from operating activities. The long-term liabilities include primarily four series of debentures and the following long-term bank loans: Series 2 – NIS 101.0 million, for repayment until 2013. Series 3 – NIS 179.8 million, for repayment until 2018. Series 4 – NIS 196.3 million, for repayment until 2015. Series 5 – NIS 181.5 million, for repayment until 2017. Long-term loans – NIS 331.8 million. |
13
| · | The balance of short-term credit, as at December 31, 2010, amounted to NIS 144.6 million, as compared with NIS 131.6 million as at December 31, 2009. |
| · | The net debt, as at December 31, 2010, net of the deposits and cash balance, amounted to NIS 1,013.2 million, as compared with net debt of NIS 825.3 million as at December 31, 2009. |
In July 2010 the Supervisor of the Capital Market, Insurance and Savings at the Ministry of Finance ("the Supervisor") published a circular which sets forth the Committee's recommendations for establishing parameters for institutional bodies' investments in non-government bonds. The circular, inter alia, includes provisions regarding the formulation of internal policies by institutional bodies prior to investing in bonds, the information required by such bodies to review and monitor investment in bonds, the mechanisms for cooperation between institutional bodies on certain matters relating to investment in bonds, the provisions that should be included in the bond documents as a condition for institutional bodies' investment therein and the requirement of institutional bodies to establish an investment policy (including with respect to rights to call in loans which would be included in the bonds), which addresses contractual criteria for the bonds and their various issuers. Most of the directives entered into force in October 2010. The memorandum of the Supervisor and the manner by which the recommendations are adopted as they appear in the report of the Committee, may hold implications on the ability to raise capital from institutional entities by way of bonds, including the terms and the price of raising such capital. As at the date of the reports the company is yet unable to identify these influences. |
| 5. | Financial liabilities at fair value through the statement of income Put Option to a Shareholder at an Associated Company For information pertaining to the Put option, see Note 17a to the annual financial statements dated December 31, 2010. Liability on account of the Put option to a shareholder at an associated company (investee until December 31, 2010), as at December 31, 2010 and as at December 31, 2009, is presented in the sum of NIS 31.5 million, and NIS 12.0 million, respectively. On account of the Put option, the associated company - until its consolidation on December 31, 2010 - other expenses of NIS 0.9 million were recorded in 2010, as compared with other expenses of NIS 1.9 million in 2009. The principal factors responsible for the change originated as a result of an agreement signed by the company for the acquisition of 25.1% of the shares of the associated companies ("Transaction Agreement") determining economic calculation of the value of the option and its blocking for three years. Regarding additional agreements arising from the transaction agreement and their potential impact on the terms of the option, see Note 17 to the financial statements dated December 31, 2010. |
14
C. | Liquidity |
| Cash Flows |
| The cash flows from operating activities in 2010 amounted to NIS 193.1 million, as compared with NIS 179.2 million in 2009. The growth in the cash flows from operating activities in 2010 in relation to last year, originated primarily from the growth in the earnings from operating activities, coupled with the company share in the dividends of associated companies, that was offset as a result of an increase in working capital this year in relation to last year, amounting to NIS 9.4 million, as compared with a decrease of approximately NIS 39.6 million last year. The increase in working capital this year originated primarily from an increase in the accounts receivable balances, an increase that was partially offset by the growth in the payable balances on account of a payable debt in the sum of NIS 49.4 million on account of the acquisition of control over Hadera Paper Printing. |
| The company possesses positive cash flows from operating activities, according to its interim consolidated financial statements dated December 31, 2010. However, the company's ongoing cash flows from operating activities in its separate financial statements, according to Regulation 38D of the Reporting Regulations ("Separate Financial Statements"), are negative. In light of the above, the company's Board of Directors conducted a discussion during its meeting on November 7, 2010, of Regulation 10(b)(14) to the Securities Regulations (Periodical and Immediate Reports) - 1970 ("Reporting Regulations") and determined that the ongoing negative cash flows from operating activities in the separate financial statements as at December 31, 2010, does not indicate a liquidity problem on the part of the company. This determination is based on an examination of the expected cash flows of the company and on the company's ability to raise additional credit, on the basis of an economic calculation performed by the company, and after having been presented to the Board of Directors and having the report of cash flows that is included in the company's separate financial statements discussed by the Board. |
| The data that served the Board of Directors as a basis for its estimation included the expected cash flows of the company for the next two years, based on the balance of cash and deposits as at the date of the report, totaling NIS 43.8 million held by the company, cash flows from operating activities in the sum of NIS 105 million in the coming year (approximately NIS 89.5 million in the following year), originating from company estimates regarding cash flows from revenues from operating activities, cash flows from dividends and the repayment of loans from investee companies. Cash flows created from investment activities totaling approximately NIS 9.9 million (net) in the coming year (approximately NIS 5 million that will serve for investment activities the following year), originating from the realization of real estate assets and an increase in holdings in investee and associated companies. The cash flows that will serve for financing activities, totaling approximately NIS 155 million in the coming year (approximately NIS 83.5 million in the following year), originating from the utilization of short-term credit, to serve for the repayment of loans plus interest, net. In addition to the above, the company is able to raise additional credit in the total sum of approximately NIS 280 million, also by way of recycling existing bank credit, for its continued operating activities and for making investments. |
15
| The information appearing above, including the expected cash flows, is based on the estimates, forecasts and plans of the company, according to the best of its knowledge and understanding regarding its operations and according to the data at its disposal as at the date of this report and which constitutes forward-looking information as defined in the Securities Law - 1968, whose materialization is not certain and whose realization is not exclusively under the control of the company. Consequently, there is no certainty that the data and/or estimates and/or forecasts and/or plans will materialize, in whole or in part, and they may materialize in a manner that is materially different than anticipated, inter alia, on account of the dependence upon external and macro-economic factors that are not subject to the control of the company, including changes in the business and defense environment, coupled with the materialization of any of the risk factors affecting the company. |
| D. | Details of Operations in the Various Sectors |
| 1. | Hogla-Kimberly (Household Products) |
The sales turnover of Hogla-Kimberly Israel amounted to approximately NIS 1,229.1 million in 2010, as compared with approximately NIS 1,237.6 million in 2009, representing a decrease of 0.7%.
The decrease in sales in relation to the corresponding period last year is primarily attributed to the erosion of prices as a result of escalating competition in the market.
The operating profit of Hogla-Kimberly Israel amounted to approximately NIS 193.8 million in 2010, as compared with approximately NIS 210.0 million in 2009.
The decrease in the operating profit in relation to the preceding year is attributed to the erosion of prices as a result of the escalating competition in the market, coupled with the rise in the prices of the principal raw materials, that was partially offset by efficiency measures that were implemented by the company, as well as of the decrease in the average US dollar exchange rate vis-à-vis the NIS, by a rate of approximately 5.1%, in relation to 2009.
The sales turnover of KCTR, Hogla-Kimberly’s subsidiary operating in Turkey, amounted to approximately NIS 498.2 million (approximately $132.6 million) in 2010, as compared with approximately NIS 493.6 million (approximately $127.7 million) last year, representing an increase of 0.9%.
KCTR’s strategic cooperation agreement with Unilever, under which Unilever carries out the selling, distribution and collection activities nationwide, with the exception of retail chains to which KCTR continues to sell independently, continues to expand the customer base in the reported period and to bring about the enhancement of the Huggies and Kotex brands.
In addition, it should be noted that toward the end of 2009, the Turkish tax authorities addressed KCTR as part of the examination of its financial statements for the years 2004-2008, conducted at KCTR on account of the taxation of the influx of capital from Hogla Kimberly Ltd. to KCTR. KCTR estimates, on the basis of the opinion of its legal and tax consultants, that the probability that it will be liable for an additional tax payment is low (See also Note 14.11 to the financial statements dated December 31, 2010).
The necessary funds for financing the strategic program in Turkey and for financing the current operations and investments, originate primarily from internal resources of Hogla Kimberly. (No investment was made in KCTR in 2010). The financial expenses this year were reduced as a result of an increase in financial incom as a result of the devaluation of operational balances, which contributed to an additional reduction in the net loss.
16
| 2. | Hadera Paper - Printing and Writing Paper (Formerly Mondi Hadera Paper) |
The sales turnover of Hadera Paper Printing amounted to NIS 728.7 million in 2010, as compared with NIS 669.2 million in 2009, representing an increase of 8.9%. The sales turnover of Hadera Paper Printing amounted to NIS 175.2 million in the fourth quarter of the year, as compared with NIS 157.3 million in the corresponding quarter last year, representing an increase of 11.4%.
The growth in the sales turnover, despite the quantitative decrease in sales, is primarily attributed to the raising of prices that was made in 2010. Prices in the local market grew by 11% in NIS terms in relation to last year. The course of the fourth quarter of 2010, the selling prices were eroded. Selling prices decreased by 5.5% in the fourth quarter, in relation to the third quarter of 2010, following escalating competition due to the widespread importing of paper into Israel.
The operating profit of Hadera Paper Printing amounted to NIS 31.1 million in 2010, as compared with NIS 40.5 million in 2009, representing a decrease of 23.2%. In the fourth quarter of 2010, the operating profit amounted to NIS 0.5 million, as compared with an operating profit of NIS 11.6 million in the fourth quarter of 2009 and as compared with operating profit of NIS 7.2 million in the third quarter of 2010.
The decrease in operating profit this year in relation to 2009, despite the rise in prices mentioned above, originated primarily as a result of the increase in the average pulp prices in 2010 in relation to 2009, in NIS terms, by a rate of approximately 43%. The decrease in the operating profit in the fourth quarter of 2010, in relation to the fourth quarter of 2009, originated from the increase in the average pulp prices as mentioned above, coupled with low operational efficiency in the fourth quarter of 2010, the relocation to the new logistics center in Modi'in and the decrease in the gross margin of the sale of purchase paper by Hadera Paper Printing.
A moderate decrease in pulp prices was recorded in the fourth quarter of 2010. Average pulp prices decreased by approximately 8.5% in NIS terms in the fourth quarter of the year, in relation to the third quarter of the year. This decrease did not result in an improved operating profit in the fourth quarter of 2010 in relation to the third quarter of the year, due to a greater erosion of selling prices as mentioned above, low operational efficiency, the relocation to the new logistics center in Modi'in and the decrease in the gross margin of the sale of purchase paper by Hadera Paper Printing.
| 3. | Carmel Container Systems - Packaging and Board Products |
The aggregate sales turnover of Carmel (including Frenkel CD) amounted to NIS 509.7 million in 2010, as compared with NIS 484.3 million last year, an increase of 5.2%.
In 2010, the consolidated sales turnover of Carmel Container Systems Ltd. amounted to NIS 397.3 million, as compared with NIS 383.0 million last year, an increase of 3.7%.
17
The consolidated sales turnover of Carmel Container Systems Ltd. amounted to NIS 113.9 million in the fourth quarter this year, as compared with NIS 99.7 million in the corresponding quarter last year, representing an increase of 14.2% and as compared with NIS 94.4 million in the third quarter this year.
The growth in sales turnover in 2010 as compared with 2009 originated primarily from a quantitative increase in sales of the corrugated board market, while maintaining a stable level of selling prices by comparison with 2009.
The consolidated operating profit of Carmel amounted to NIS 3.6 million in 2010, as compared with an operating profit of NIS 12.8 million last year. The decrease in the operating profit of Carmel is primarily attributed to the sharp rise of 7% in input prices, coupled with the eroded profitability of the Tri-Wall subsidiary. These influences were partially offset by the operational efficiency that was gained as a result of the reduction in stoppages and the greater output capacity. Moreover, in 2010, Carmel acquired a new processing machine that will serve to improve its output capacity and printing capability. These moves are expected to bring about an improvement in the profitability of Carmel over the next several quarters.
The consolidated operating profit of Carmel in the fourth quarter of 2010 amounted to NIS 2.4 million, as compared with an operating profit of NIS 5.9 million in the corresponding quarter in 2009 and as compared with an operating loss of NIS 0.4 million in the third quarter this year.
The aggregate operating profit of Carmel (including Frenkel CD) amounted to NIS 7.1 million in 2010, as compared with an operating profit of NIS 14.7 million last year.
Regarding the need to examine the impairment of the Carmel cash generating unit, see Note 8 to the financial statements dated September 30, 2010.
The above information pertaining to the output capacity and improved profitability of Carmel constitutes forward-looking information as defined in the Securities Law, based on the company's estimates at the date of this report. These estimates may not materialize - in whole or in part - or may materialize in a different manner, inter alia on account of factors that lie outside the control of the company, such as changes in local and global raw material prices and changes in the supply and demand of local and global cardboard packaging products.
| 4. | Packaging Paper and Recycling |
The sales turnover of the Packaging Paper and Recycling Division amounted to NIS 511.4 million in the reported period (NIS 581.4 million, net of the sales of Machine 8 totaling NIS 70 million that were discounted during its running in, until May 31, 2010), as compared with NIS 339.3 million last year, representing an increase of approximately 50.7%. The division’s sales turnover in the fourth quarter totaled NIS 170.0 million, as compared with NIS 88.3 million in the corresponding quarter last year, representing an increase of 92.5%, and as compared with NIS 152.0 million in the third quarter of the year.
The quantitative sales of packaging paper amounted to 214.3 thousand tons in 2010 (264.3 thousand tons net of sales totaling 50,000 tons that were discounted during the running-in of Machine 8), as compared with 141.9 thousand tons last year.
The sales of paper and cardboard waste by Amnir amounted to 355.5 thousand tons in 2010, as compared with 194.9 thousand tons last year.
18
The growth in the sales turnover originated primarily from the activation of Machine 8, starting in June this year. Moreover, as a result of the emergence from the economic crisis, an increase was recorded in the quantitative demand and in the selling prices, both of packaging paper and of paper waste at Amnir. The company also increased its export sales, as well as the sales of its new products, recycled paper that serves as a substitute for virgin paper.
The division ended 2010 with an operating profit of NIS 43.8 million, as compared with an operating loss of NIS 20.9 million last year. The cost of operating Machine 8, through to May 31, 2010, were discounted as part of the running-in expenses. The division’s operating profit in the fourth quarter of the year amounted to NIS 12.4 million, as compared with an operating loss of NIS 6.4 million in the corresponding quarter last year and an operating profits of NIS 21.1 million in the third quarter of the year, that included a non-recurring revenue of NIS 17.2 million. Net of the non-recurring revenue, the operating profits from current activities in the third quarter amounted to NIS 3.9 million.
The considerable improvement in operating profit in 2010, in relation to last year, is primarily attributed to the quantitative increase in sales as a result of the entry of Machine 8 into current operation, starting in June of this year, coupled with the raising of selling prices. The operating profit also included non-recurring earnings of approximately NIS 17.2 million from the sale of real estate in Bnei-Brak, in light of preparations being made by Amnir for the relocation into the logistic center at Modi'in.
| 5. | Graffiti - Office Supplies Marketing |
Graffiti's sales turnover during the reported period amounted to NIS 178.9 million, as compared with NIS 151.0 million in the corresponding period last year, representing an increase of 18.5%.
In 2010, Graffiti recorded an operating profit of NIS 5.1 million, as compared with an operating profit of NIS 4.0 million last year. The growth in the operating profit in 2010 is primarily attributed to the growth in sales that was offset as a result of the sharp rise in the cost of fine paper, at a rate of 14.1%.
Graffiti continues to implement its plan for growth in the marketing of office supplies to businesses and institutional clients and is taking several principal courses of action in order to establish its position as a leader in this market:
Graffiti is constantly working to improve the procurement network, with an emphasis on imports from the Far-East that will serve to significantly reduce purchasing costs, aiming to improve the gross and operating profitability.
Graffiti plans to relocate to a modern and efficient distribution center in Modi'in, that has already been occupied by Hadera Paper Printing and by Amnir in 2010, which will allow for realizing considerable savings in operational costs, while continuing to record growth in both sales and profitability. The relocation is planned for April 2011 and should last approximately 3 months. Graffiti will continue to operate its existing logistic centers during the transitional period, until the complete stabilization of the new logistic center at Modi'in.
Graffiti has completed the detailed specification of the computerized management systems of the logistic center and is currently working on constructing a detailed transition plan covering the various aspects, including: Planning the transfer of merchandise, recruiting supplier assistance for the move and communicating the relocation to the company customers.
Graffiti has successfully assimilated and implemented the Hadera Paper information systems during the reported period. This will allow the company to record accelerated growth and earnings while improving customer service, as modern systems and infrastructure are implemented at the new distribution center.
19
E. | Exposure and Management of Market Risks |
| 1. | General |
The Company conducts periodical discussions regarding market risks and exposure to exchange rate and interest rate fluctuations, with the participation of the relevant elements, so as to reach decisions in this matter. The individual responsible for the implementation of market risk management policy at the Company is Shaul Glicksberg, the Group's VP of Finance and Business Development.
| 2. | Market Risks to which the Company is Exposed |
Description of Market Risks
The market risks reflect the risk of changes in the value of financial instruments affected by changes in the interest rate, in the Consumer Price Index and in foreign currency exchange rates.
Exchange Rate Risks
Approximately half of the Company’s sales are denominated in US dollars, whereas a significant share of its expenses and liabilities are in NIS. The Company is therefore exposed to fluctuations in the exchange rate of the NIS vis-à-vis the US dollar. This exposure includes economic exposure (on account of surplus proceeds on payments in foreign currency or linked thereto) and accounting exposure (on account of a surplus of dollar-linked assets over foreign-currency-denominated liabilities).
The Company periodically reexamines the need for hedging on account of these exposures. True to December 31, 2010, the Company entered into hedging transactions in the sum of €4.0 million and $2.1 million, primarily in order to hedge the cash flows related to payments for the acquisition of fixed assets from equipment vendors for Machine 8 and for inventory purchases.
It should be noted that on the aggregate level that includes associated companies, the currency exposure is limited.
Consumer Price Index Risks
The Company is exposed to changes in the Consumer Price Index, pertaining to the debentures issued by the Company and to net long-term loans, in the total sum of NIS 296.1 million.
20
In early 2010, the Company entered into hedging transactions for a period of one year, to protect itself against a rise in the CPI, in the amount of NIS 30 million, pursuant to previous transactions that were made in early 2009 and terminated at the end of 2009.
The company continues to regularly monitor quoted prices for hedging its exposure and in the event that these will be reasonable, the company will enter into the relevant hedging transactions.
The company also enjoys partial natural hedging due to the current debt of an associated company that is linked to the consumer price index.
Credit Risks
Most of the Group’s sales are made in Israel to a large number of customers and the exposure to customer-related credit risks is consequently generally limited. The Group regularly analyzes – through credit committees that operate within the various companies – the quality of the customers, their credit limits and the relevant collateral required, as the case may be. The Group also makes use of credit insurance services at some of the Group companies, as needed.
The financial statements include provisions for doubtful debts, based on the existing risks on the date of the statements.
Sensitivity Analysis Tables for Sensitive Instruments, According to Changes in Market Elements as at December 31, 2010:
| Sensitivity to Interest Rates | ||||||||||||||||||||
| Sensitive Instruments | Profit (loss) from changes | Fair value as at Dec-31-10 | Profit (loss) from changes | |||||||||||||||||
Interest rise 10% | Interest rise 5% | Interest decrease 5% | Interest decrease 10% | |||||||||||||||||
| In NIS thousands | ||||||||||||||||||||
| Debentures - Series 2 | 772 | 387 | (104,144 | ) | (390 | ) | (782 | ) | ||||||||||||
| Debentures - Series 3 | 2,547 | 1,281 | (184,231 | ) | (1,296 | ) | (2,607 | ) | ||||||||||||
| Debentures - Series 4 | 1,865 | 936 | (212,453 | ) | (944 | ) | (1,896 | ) | ||||||||||||
| Debentures - Series 5 | 3,256 | 1,638 | (197,494 | ) | (1,657 | ) | (3,333 | ) | ||||||||||||
| Loan A - fixed interest | 74 | 37 | (16,052 | ) | (37 | ) | (75 | ) | ||||||||||||
| Loan B - fixed interest | 1,165 | 585 | (99,647 | ) | (591 | ) | (1,189 | ) | ||||||||||||
| Loan C - fixed interest | 110 | 55 | (18,112 | ) | (55 | ) | (111 | ) | ||||||||||||
The fair value of the loans is based on a calculation of the present value of the cash flows, according to the generally-accepted interest rate on loans with similar characteristics (4% in 2010).
Regarding the terms of the debentures and other liabilities – See Note 10 to the annual financial statements dated December 31, 2010.
Regarding long-term loans and capital notes granted - See Note 5 to the annual financial statements dated December 31, 2010.
21
Sensitivity Analysis Tables for Sensitive Instruments, According to Changes in Market Elements as at December 31, 2010:
| Sensitivity of euro-linked instruments to changes in the euro exchange rate | ||||||||||||||||||||
| Sensitive Instruments | Profit (loss) from changes | Fair value as at Dec-31-10 | Profit (loss) from changes | |||||||||||||||||
Rise in € 10% | Rise in € 5% | Decrease in € 5% | Decrease in € 10% | |||||||||||||||||
| In NIS thousands | ||||||||||||||||||||
| Cash and cash equivalents | 4,892 | 2,446 | 48,920 | (2,446 | ) | (4,892 | ) | |||||||||||||
| Other accounts receivable | 1,014 | 507 | 10,140 | (507 | ) | (1,014 | ) | |||||||||||||
| Accounts payable and credit balances | (10,686 | ) | (5,344 | ) | (106,883 | ) | 5,344 | 10,688 | ||||||||||||
| Forward | 1,548 | 625 | (311 | ) | (1,220 | ) | (2,143 | ) | ||||||||||||
| Sensitivity to the US Dollar Exchange Rate | ||||||||||||||||||||
| Sensitive Instruments | Profit (loss) from changes | Fair value as at Dec-31-10 | Profit (loss) from changes | |||||||||||||||||
Revaluation of $ 10% | Revaluation of $ 5% | Devaluation of $ 5% | Devaluation of $ 10% | |||||||||||||||||
| In NIS thousands | ||||||||||||||||||||
| Cash and cash equivalents | 2,776 | 1,388 | 27,756 | (1,388 | ) | (2,776 | ) | |||||||||||||
| Other accounts receivable | 3,628 | 1,814 | 36,277 | (1,814 | ) | (3,628 | ) | |||||||||||||
| Accounts payable and credit balances | (10,665 | ) | (5,333 | ) | (106,654 | ) | 5,333 | 10,665 | ||||||||||||
| NIS/US$ forward transaction | 547 | 175 | (29 | ) | (571 | ) | (943 | ) | ||||||||||||
| Other accounts receivable reflect primarily short-term customer debts |
22
| Sensitivity to the Consumer Price Index | ||||||||||||||||||||
| Sensitive Instruments | Profit (loss) from changes | Fair value as at Dec-31-10 | Profit (loss) from changes | |||||||||||||||||
Rise in CPI 2% | Rise in CPI 1% | Decrease in CPI 1% | Decrease in CPI 2% | |||||||||||||||||
| In NIS thousands | ||||||||||||||||||||
| NIS-CPI forward transactions | 600 | 300 | (240 | ) | (300 | ) | (600 | ) | ||||||||||||
| Bonds 2 | (2,083 | ) | (1,041 | ) | (104,144 | ) | 1,041 | 2,083 | ||||||||||||
| Bonds 3 | (3,685 | ) | (1,842 | ) | (184,231 | ) | 1,842 | 3,685 | ||||||||||||
| Other accounts receivable | 39 | 20 | 1,950 | (20 | ) | (39 | ) | |||||||||||||
See Note 19c to the financial statements dated December 31, 2010.
| Sensitivity to the exchange rate of the yen | ||||||||||||||||||||
| Sensitive Instruments | Profit (loss) from changes | Fair value as at Dec-31-10 | Profit (loss) from changes | |||||||||||||||||
Rise in the yen 10% | Rise in the yen 5% | Decrease in the yen 5% | Decrease in the yen 10% | |||||||||||||||||
| In NIS thousands | ||||||||||||||||||||
| Accounts Payable | (367 | ) | (184 | ) | (3,672 | ) | 184 | 367 | ||||||||||||
| Sensitivity to other currencies (GBP) | ||||||||||||||||||||
| Sensitive Instruments | Profit (loss) from changes | Fair value as at Dec-31-10 | Profit (loss) from changes | |||||||||||||||||
Rise of 10% | Rise of 5% | Decrease of 5% | Decrease of 10% | |||||||||||||||||
| In NIS thousands | ||||||||||||||||||||
| Other accounts receivable | 86 | 43 | 864 | (43 | ) | (86 | ) | |||||||||||||
23
Sensitivity Analysis Tables for Sensitive Instruments, According to Changes in Market Elements as at December 31, 2009:
| Sensitivity to Interest Rates | ||||||||||||||||||||
| Sensitive Instruments | Profit (loss) from changes | Fair value as at Dec-31-09 | Profit (loss) from changes | |||||||||||||||||
Interest rise 10% | Interest rise 5% | Interest decrease 5% | Interest decrease 10% | |||||||||||||||||
| In NIS thousands | ||||||||||||||||||||
| Debentures - Series 2 | 1,247 | 626 | (136,715 | ) | (631 | ) | (1,266 | ) | ||||||||||||
| Debentures - Series 3 | 3,160 | 1,590 | (207,266 | ) | (1,611 | ) | (3,442 | ) | ||||||||||||
| Debentures - Series 4 | 2,729 | 1,371 | (266,721 | ) | (1,383 | ) | (2,779 | ) | ||||||||||||
| Loan A - fixed interest | 148 | 74 | (23,350 | ) | (75 | ) | (150 | ) | ||||||||||||
| Loan B - fixed interest | 1,500 | 754 | (111,745 | ) | (763 | ) | (1,534 | ) | ||||||||||||
| Loan C | 135 | 68 | (24,119 | ) | (68 | ) | (136 | ) | ||||||||||||
| Long-term loans and capital notes - granted | (195 | ) | (98 | ) | 50,980 | 98 | 197 | |||||||||||||
The fair value of the loans is based on a calculation of the present value of the cash flows, according to the generally-accepted interest rate on loans with similar characteristics (4% in 2009).
Regarding the terms of the debentures and other liabilities – See Note 9 to the annual financial statements dated December 31, 2009.
Regarding long-term loans and capital notes granted - See Note 5 to the annual financial statements dated December 31, 2009.
| Sensitivity of euro-linked instruments to changes in the euro exchange rate | ||||||||||||||||||||
| Sensitive Instruments | Profit (loss) from changes | Fair value as at Dec-31-09 | Profit (loss) from changes | |||||||||||||||||
Rise in € 10% | Rise in € 5% | Decrease in € 5% | Decrease in € 10% | |||||||||||||||||
| In NIS thousands | ||||||||||||||||||||
| Cash and cash equivalents | 203 | 101 | 2,027 | (101 | ) | (203 | ) | |||||||||||||
| Designated deposits | 2,395 | 1,197 | 23,949 | (1,197 | ) | (2,395 | ) | |||||||||||||
| Other accounts receivable | 508 | 254 | 5,075 | (254 | ) | (508 | ) | |||||||||||||
| Accounts payable and credit balances | (7,258 | ) | (3,629 | ) | (72,583 | ) | 3,629 | 7,258 | ||||||||||||
| NIS-€ forward transaction | 5,123 | 1,994 | (1,114 | ) | (4,264 | ) | (7,393 | ) | ||||||||||||
24
| Sensitivity to the US Dollar Exchange Rate | ||||||||||||||||||||
| Sensitive Instruments | Profit (loss) from changes | Fair value as at Dec-31-09 | Profit (loss) from changes | |||||||||||||||||
Revaluation of $ 10% | Revaluation of $ 5% | Devaluation of $ 5% | Devaluation of $ 10% | |||||||||||||||||
| In NIS thousands | ||||||||||||||||||||
| Cash and cash equivalents | 495 | 247 | 4,945 | (247 | ) | (495 | ) | |||||||||||||
| Other accounts receivable | 1,271 | 635 | 12,707 | (635 | ) | (1,271 | ) | |||||||||||||
| Accounts payable and credit balances | (4,082 | ) | (2,041 | ) | (40,820 | ) | 2,041 | 4,082 | ||||||||||||
| Liabilities at fair value through the statement of income | (1,198 | ) | (599 | ) | (11,982 | ) | 599 | 1,198 | ||||||||||||
| Other accounts receivable reflect primarily short-term customer debts |
| Capital note – See Note 5 to the financial statements |
Sensitivity Analysis Tables for Sensitive Instruments, According to Changes in Market Elements as at December 31, 2009:
| Sensitivity to the Consumer Price Index | ||||||||||||||||||||
| Sensitive Instruments | Profit (loss) from changes | Fair value as at Dec-31-09 | Profit (loss) from changes | |||||||||||||||||
Revaluation of $ 10% | Revaluation of $ 5% | Devaluation of $ 5% | Devaluation of $ 10% | |||||||||||||||||
| In NIS thousands | ||||||||||||||||||||
| NIS-CPI forward transactions | 2,000 | 1,000 | 3,052 | (1,000 | ) | (2,000 | ) | |||||||||||||
| Bonds 2 | (4,145 | ) | (2,073 | ) | (207,266 | ) | 2,073 | 4,145 | ||||||||||||
| Bonds 3 | (2,734 | ) | (1,367 | ) | (136,715 | ) | 1,367 | 2,734 | ||||||||||||
See Note 17c to the financial statements | ||||||||||||||||||||
| Sensitivity to the exchange rate of the yen | ||||||||||||||||||||
| Sensitive Instruments | Profit (loss) from changes | Fair value as at Dec-31-09 | Profit (loss) from changes | |||||||||||||||||
Rise in the yen 10% | Rise in the yen 5% | Decrease in the yen 5% | Decrease in the yen 10% | |||||||||||||||||
| In NIS thousands | ||||||||||||||||||||
| Accounts Payable | 260 | 130 | 2,605 | (130 | ) | (260 | ) | |||||||||||||
25
Linkage Base Report
Below are the balance sheet items, according to linkage bases, as at Dec-31-10:
| In NIS millions | Unlinked | CPI-linked | In foreign currency, or linked thereto (primarily US$) | €-linked | Non-Monetary Items | Total | ||||||||||||||||||
| Assets | ||||||||||||||||||||||||
| Cash and cash equivalents | 44.3 | 27.8 | 48.9 | 121.0 | ||||||||||||||||||||
| Other accounts receivable | 564.1 | 2.0 | 37.1 | 9.8 | 9.0 | 622.0 | ||||||||||||||||||
| Inventories | 343.5 | 343.5 | ||||||||||||||||||||||
| Investments in Associated Companies | 19.2 | 218.3 | 237.5 | |||||||||||||||||||||
| Deferred taxes on income | 2.2 | 2.2 | ||||||||||||||||||||||
| Fixed assets, net | 1,358.6 | 1,358.6 | ||||||||||||||||||||||
| Investment property (real estate) | 24.5 | 24.5 | ||||||||||||||||||||||
| Intangible Assets | 35.7 | 35.7 | ||||||||||||||||||||||
| Land under lease | 24.8 | 24.8 | ||||||||||||||||||||||
| Financial assets available for sale | 1.6 | 1.6 | ||||||||||||||||||||||
| Other assets | 1.4 | 1.4 | ||||||||||||||||||||||
| Assets on account of employee benefits | 0.8 | 0.8 | ||||||||||||||||||||||
| Total Assets | 628.4 | 2.0 | 64.9 | 58.7 | 2,019.6 | 2,773.6 | ||||||||||||||||||
| Liabilities | ||||||||||||||||||||||||
| Short-term credit from banks | 144.6 | 144.6 | ||||||||||||||||||||||
| Accounts payable and credit balances | 318.4 | 110.3 | 106.9 | 6.6 | 542.2 | |||||||||||||||||||
| Current tax liabilities | 20.0 | 20.0 | ||||||||||||||||||||||
| Deferred taxes on income | 45.3 | 45.3 | ||||||||||||||||||||||
| Long-Term Loans | 313.6 | 18.3 | 331.9 | |||||||||||||||||||||
| Notes (debentures) – including current maturities | 378.0 | 279.8 | 657.7 | |||||||||||||||||||||
| Liabilities on account of employee benefits | 46.7 | 46.7 | ||||||||||||||||||||||
| Put option to holders of non-controlling interests | 31.5 | - | 31.5 | |||||||||||||||||||||
| Shareholders’ equity, reserves and retained earnings | 953.6 | 953.6 | ||||||||||||||||||||||
| Total liabilities and equity | 1,252.8 | 298.1 | 110.3 | 106.9 | 1,005.5 | 2,773.6 | ||||||||||||||||||
| Surplus financial assets (liabilities) as at Dec-31-10 | (624.4 | ) | (296.1 | ) | (45.4 | ) | (48.2 | ) | 1,014.1 | 0.0 | ||||||||||||||
* As to hedging transactions associated with surplus CPI-linked liabilities, see Section E(2), above.
26
Linkage Base Report
Below are the balance sheet items, according to linkage bases, as at Dec-31-09:
| In NIS millions | Unlinked | CPI-linked | In foreign currency, or linked thereto (primarily US$) | €-linked | Non-Monetary Items | Total | ||||||||||||||||||
| Assets | ||||||||||||||||||||||||
| Cash and cash equivalents | 19.3 | 5.0 | 2.0 | 26.3 | ||||||||||||||||||||
| Short-term deposits and investments | 103.7 | 23.9 | 127.6 | |||||||||||||||||||||
| Other accounts receivable | 396.5 | 1.1 | 13.3 | 5.1 | 6.8 | 422.8 | ||||||||||||||||||
| Inventories | 175.9 | 175.9 | ||||||||||||||||||||||
| Investments in Associated Companies | 17.8 | 36.7 | 286.5 | 341.0 | ||||||||||||||||||||
| Deferred taxes on income | 2.1 | 2.1 | ||||||||||||||||||||||
| Fixed assets, net | 1,126.4 | 1,126.4 | ||||||||||||||||||||||
| Intangible Assets | 27.1 | 27.1 | ||||||||||||||||||||||
| Land under lease | 37.6 | 37.6 | ||||||||||||||||||||||
| Other assets | 1.3 | 1.3 | ||||||||||||||||||||||
| Assets on account of employee benefits | 0.6 | |||||||||||||||||||||||
| Total Assets | 537.9 | 37.8 | 18.3 | 31.0 | 1,663.7 | 2,288.7 | ||||||||||||||||||
| Liabilities | ||||||||||||||||||||||||
| Short-term credit from banks | 131.6 | 131.6 | ||||||||||||||||||||||
| Accounts payable and credit balances | 252.7 | 43.4 | 72.6 | 368.7 | ||||||||||||||||||||
| Current tax liabilities | 2.7 | 2.7 | ||||||||||||||||||||||
| Deferred taxes on income | 30.4 | 30.4 | ||||||||||||||||||||||
| Long-Term Loans | 253.5 | 28.1 | 281.6 | |||||||||||||||||||||
| Notes (debentures) – including current maturities | 237.9 | 328.1 | 566.0 | |||||||||||||||||||||
| Liabilities on account of employee benefits | 37.3 | 37.3 | ||||||||||||||||||||||
| Liabilities at fair value through the statement of income | 12.0 | 12.0 | ||||||||||||||||||||||
| Shareholders’ equity, reserves and retained earnings | 858.4 | 858.4 | ||||||||||||||||||||||
| Total liabilities and equity | 915.7 | 356.2 | 55.4 | 72.6 | 888.8 | 2,288.7 | ||||||||||||||||||
| Surplus financial assets (liabilities) as at Dec-31-09 | (377.8 | ) | (318.4 | ) | (37.1 | ) | (41.6 | ) | 774.9 | 0.0 | ||||||||||||||
27
Associated Companies
Hadera Paper is exposed to various risks associated with operations in Turkey, where Hogla-Kimberly is active through its subsidiary, KCTR. These risks originate from concerns regarding economic and political instability, high devaluation and elevated inflation rates that have characterized the Turkish economy in the past and inspite of relative stability may recur and harm the KCTR operations.
Hadera Paper is also exposed to tax related issues at KCTR, as detailed in Note 14.11 to the financial statements dated December 31, 2010.
F. | Forward-Looking Statements |
This report contains various forecasts that constitute forward-looking statements, as defined in the Securities Law, based upon the Board of Directors’ present expectations and estimates regarding the operations of the Group and its business environment. The Company does not guarantee that the future results of operations will coincide with the forward-looking statements and these may in fact differ considerably from the present forecasts as a result of factors that may change in the future, such as changes in costs and market conditions, failure to achieve projected goals, failure to achieve anticipated efficiencies and other factors which lie outside the control of the Company. The Company undertakes no obligation to publicly update such forward-looking statements, regardless of whether these updates originate from new information, future events or any other reason.
G. | Corporate Governance Issues |
| 1. | Donations and Contributions |
Hadera Paper Group has continued to implement its policy for corporate and social responsibility and has continued to invest both efforts and resources in matters related to community involvement and contribution. The company's employees and managers at the various sites are all taking an active part in community involvement, in supporting teenagers and primarily in working toward reducing social inequalities and in providing equal opportunity for education and for personal accomplishments within the framework of the company and the community.
As part of this policy, the company makes contributions to various institutions active in the said areas. The Group's contributions and donations amounted to NIS 584 thousand in 2010.
| In parallel, through its employees, the Company also participates in volunteer activity in the community, for promoting these same objectives. |
This year the company focused on donations to youth clubs, community centers operating in the afternoons - with the intention of fortifying and enriching teenagers while granting them a proper opportunity.
Moreover the company is active in the granting of student scholarships, through the Shenkar Foundation, that was established by the company together with its Austrian strategic partner in Hadera Paper Printing. Two scholarships were granted this year, as well as assistance provided to two projects: A women's club in Um-el-Fahem and a children's club in the Eastern Worker neighborhood of Hadera, as well as for the purchase of computers for the youth center in Hadera. The total contributions of the company through the Shenkar Foundation amounted to NIS 70 thousand.
28
| 2. | Members of the Board of Directors Possessing Financial Skills and Qualifications |
The minimum number of company directors possessing accounting and financial qualifications and skills was determined to be two for the company, in consideration of the nature of the accounting and financial issues that are raised in the preparation of the company’s financial statements, in view of the company’s areas of operation and in consideration of the composition of the board of directors as a whole, that includes individuals possessing business, management and professional experience that enables them to deal effectively with the tasks of managing the company, including reporting duties.
The members of the company’s board of directors who possess accounting and financial qualifications and skills are:
| Itzhak Manor - | Holds an MBA from Hebrew University. Serves as director at various publicly-traded and privately-held companies within the IDB Group; Chairman of companies in the David Lubinsky Group Ltd. |
| Amos Mar-Haim - | Holds a BA in economics and an MBA from Hebrew University. Formerly served and currently serves as Chairman or Deputy Chairman at publicly-traded or privately-held companies. Member of the Israeli Accounting Standards Board. |
Regarding a decision by the Audit Committee and the Board Of Directors of the company, dated March 6, 2011, regarding directors' compensation, see Appendix E to the periodical report.
| 3. | The Company’s Internal Auditor |
| 1. | Auditor's name: Eli Greenbaum Holding the position since 16.07.06 Credentials: CPA |
| 2. | The Auditor is employed by the Company. |
| 3. | The Company’s Audit Committee has approved the appointment of the Auditor on March 7, 2006. The Auditor is a CPA by training and has dealt in Treasury positions at the Company for 20 years and consequently possesses the necessary skills for the job. |
| 4. | The Internal Auditor is supervised by the General Manager. |
| 5. | The work plan for internal auditing is annual. The work plan is determined on the basis of: A five-year plan, covering numerous issues that were approved by the Audit Committee according to the auditing needs of the Company and covers issues that the Internal Auditor believes warrant his examination and consideration in the course of the current year. The work plan is determined by the Internal Auditor and the Audit Committee. The work plan is approved by the Audit Committee. The judgment of the Internal Auditor in terms of deviations from the audit program, subject to the approval of the Company’s Audit Committee. |
29
| 6. | The Internal Auditing program includes auditing topics in corporations that constitute significant holdings of the Company. |
| 7. | Scope of employment in 2010: Full-time position for the auditor. The auditing hours number a total of 170 monthly hours, totaling 2,140 hours annually, divided equally between the corporation and its investee companies: |
| Audited body | Estimated hours of audit annually |
| Internal auditing at the Company | 240 hours |
| Auditing at investee companies | 1,800 hours |
| Total hours | 2,140 hours |
In addition to the Internal Auditor, there exists a team dealing in the execution and implementation of internal auditing processes as part of the SOX procedures, to which the company is committed since it is traded on AMEX. The company believes that these procedures are complementary to the internal auditing work. The internal auditor conducts his audit in accordance with acceptable professional standards for internal audit in Israel and overseas, and according to the Company's Board of Directors, based on the assessment of the Company's Audit Committee, the internal auditor complies with the requirements set forth in those standards.
In addition to the above, some of the subsidiaries outsource their internal auditing operations. The scope of auditing amounted to approximately 350 hours in 2010.
| 8. | The Company declares that it has granted the Internal Auditor free, constant and direct access to all the information at the disposal of the Company and the investee companies. |
| 9. | Audit reports were submitted in writing and discussed on the following dates: |
| Submitted | Discussed | |
| 3.3.10 | 23.3.10 | |
| 5.5.10 | 9.5.10 | |
| 4.8.10 | 8.8.10 | |
| 3.11.10 | 7.11.10 |
| 10. | The scope of employment of the Internal Auditor is determined according to a cycle that renders it possible to audit all the significant topics at the Company, once every few years. This scope of activity, the nature, the continuity of operation and the work plan of the Internal Auditor – are reasonable – according to the estimation of the Company’s Audit Committee, while rendering it possible to realize the Internal Audit objectives of the organization. |
| 11. | The Auditor is employed by the Company. The Board of Directors believes that the compensation received by the Internal Auditor does not influence his professional judgment. |
30
| 4. | Senior Employee Compensation |
In determining the compensation and bonuses of senior employees, the directors and Compensation Committee took into consideration the position and standing of each executive and his contribution to the operations and business of the Company. The labor wage expenses and benefits granted to senior executives and position holders are reasonable, are not an exceptional transaction and reflect the company's accomplishments and are comparable with market standards.
| 1. | Ofer Bloch, Group CEO: |
| 1.1 | Description of Compensation: During the reported period, Ofer Bloch was eligible for wages totaling NIS 1,879 thousand (this included wages, social benefits and acceptable perks, bonus salary and company car). Moreover, on March 6, 2011, the Board of Directors of the company approved the payment of a bonus to Ofer Bloch in the sum of NIS 750,000. For details regarding the employment agreement of Ofer Bloch, see Section 13.4 of Part A of the periodical report (Description of the Company’s Business). For additional details regarding the compensation of Ofer Bloch during the reported period, see Appendix D to part D of the periodical report (Additional Details regarding the Corporation). |
| 1.2 | Examining the relationship between the compensation and contribution of Ofer Bloch, the fairness and reasonability of the compensation: |
| 1.2.1 | In order to examine and evaluate the terms of the compensation of Ofer Bloch, the Board of Directors of the company has examined, inter alia, Ofer Bloch's compliance with the requirements of his position and his performance as CEO of the group during the reported period, his contribution to the company, the results of operations of the company in 2010 and whether the company has met objectives that were defined in the work plan. |
| 1.2.2 | The Board of Directors of the company was presented - to its satisfaction - with the principal terms of employment of Ofer Bloch in the reported period, including the value of the benefits he was granted, as well as the terms of employment of the other position holders at the company. Data was also presented regarding generally accepted compensation in the market during the reported period and true to the date of the examination, for similar position holders at companies possessing the same size and area of operations as that of the company. |
| 1.2.3 | Ofer Bloch has been serving as CEO of the group since January 1, 2010. During the reported period, Ofer Bloch has managed to lead the company to considerable accomplishments, while contributing to the improvement and development of the company, including the intensive handling of the subject of the packaging law, issuing bonds, the initial operation of Machine 8, the relocation to the logistics center and a contribution to strategic thinking regarding the continued operation of the group. |
31
| 1.2.4 | The terms of employment of Ofer Bloch are fair, generally acceptable and reasonable, inter alia, while taking into consideration the financial situation of the company, its objectives and the challenges it faces. As regards the bonus that was granted to Ofer Bloch, the Board of Directors of the company believes that it appropriately reflects his significant contribution to improving the operations and development of the company, as detailed above. |
| 1.2.5 | In the opinion of the Board of Directors of the company, given the overall considerations detailed above, as well as in consideration of his complex role, skills, experience and his contribution to the company during the reported period, Ofer Bloch's compensation during the reported period is in line with the best interests of the company and is fair and reasonable in relation to his contribution to the company, within the framework of his position during the aforesaid period of time. |
| 2. | Shaul Glicksberg - VP Finance and Business Development: |
| 2.1 | Description of Compensation: During the reported period, Shaul Glicksberg was eligible for wages totaling NIS 1,389 thousand (this included wages, social benefits and acceptable perks, bonus salary and company car). Moreover, on March 6, 2011, the Board of Directors of the company approved the payment of a bonus to Shaul Glicksberg in the sum of NIS 350,000. True to the report date, Shaul Glicksberg holds 5,500 non-marketable stock options of the company, that were allocated to him as part of the employee stock option plan. For additional details regarding the compensation of Shaul Glicksberg during the reported period, see Appendix D to part D of the periodical report (Additional Details regarding the Corporation). |
| 2.2 | Examining the relationship between the compensation and contribution of Shaul Glicksberg, the fairness and reasonability of the compensation: |
| 2.2.1 | In order to examine and evaluate the terms of the compensation of Shaul Glicksberg, the Board of Directors of the company has examined, inter alia, his compliance with the requirements of his position and his performance as VP Finance and Business Development of the Group during the reported period, his contribution to the company, the results of operations of the company in 2010 and whether the company has met objectives that were defined in the work plan. |
| 2.2.2 | The Board of Directors of the company was presented - to its satisfaction - with the principal terms of employment of Shaul Glicksberg in the reported period, including the value of the benefits he was granted, as well as the terms of employment of the other position holders at the company. Data was also presented regarding generally accepted compensation in the market during the reported period and true to the date of the examination, for similar position holders at companies possessing the same size and area of operations as that of the company. |
32
| 2.2.3 | Shaul Glicksberg has been serving in his position since January 1, 2008. During the reported period, Shaul Glicksberg successfully contributed to the improvement and development of the company in such matters as the investment in Bondex, including the successful completion of the issuing of bonds, improving the credit rating of the company and the highly professional and outstanding management of the company's financial systems. |
| 2.2.4 | The terms of employment of Shaul Glicksberg are fair, generally acceptable and reasonable, inter alia, while taking into consideration the financial situation of the company, its objectives and the challenges it faces. As regards the bonus that was granted to Shaul Glicksberg, the Board of Directors of the company believes that it appropriately reflects his significant contribution to improving the operations and development of the company, as detailed above. |
| 2.2.5 | The Board of Directors of the company believes, that given the terms of the options granted to Shaul Glicksberg, the scope of compensation in securities, as mentioned above, is fair and reasonable. The volume of options he was granted reflects the company's objective in encouraging him to continue and devote his energy to the company. The exercise price that was determined serves to ensure that the compensation is contingent upon the rise in the price of the share and is consequently dependent upon the market situation and the financial position of the company. The mechanism that was determined allows for compensation over a long period of time, while correlating the compensation with a continuing contribution to the company over the same length of time. |
| 2.2.6 | In the opinion of the Board of Directors of the company, given the overall considerations detailed above, as well as in consideration of the complex role of Shaul Glicksberg, his skills, experience and his contribution to the company during the reported period, his compensation during the reported period is in line with the best interests of the company and is fair and reasonable in relation to his contribution to the company, within the framework of his position during the aforesaid period of time. |
| 3. | Gideon Lieberman, Chief Operating Officer: |
| 3.1 | Description of Compensation: During the reported period, Gideon Lieberman was eligible for wages totaling NIS 1,134 thousand (this included wages, social benefits and acceptable perks, bonus salary and company car). Moreover, on March 6, 2011, the Board of Directors of the company approved the payment of a bonus to Gideon Lieberman in the sum of NIS 300,000. True to the report date, Gideon Lieberman holds 5,500 non-marketable stock options of the company that were allocated to him as part of the employee stock option plan. For additional details regarding the compensation of Gideon Lieberman during the reported period, see Appendix D to part D of the periodical report (Additional Details regarding the Corporation). |
33
| 3.2 | Examining the relationship between the compensation and contribution of Gideon Lieberman, the fairness and reasonability of the compensation: |
| 3.2.1 | In order to examine and evaluate the terms of the compensation of Gideon Lieberman, the Board of Directors of the company has examined, inter alia, his compliance with the requirements of his position and his performance as Chief Operating Officer (COO) of the Company during the reported period, his contribution to the company, the results of operations of the company in 2010 and whether the company has met objectives that were defined in the work plan. |
| 3.2.2 | The Board of Directors of the company was presented - to its satisfaction - with the principal terms of employment of Gideon Lieberman in the reported period, including the value of the benefits he was granted, as well as the terms of employment of the other position holders at the company. Data was also presented regarding generally accepted compensation in the market during the reported period and true to the date of the examination, for similar position holders at companies possessing the same size and area of operations as that of the company. |
| 3.2.3 | Gideon Lieberman is serving as Chief Operating Officer of the company, where he has been employed since August 25, 1975. During the reported period, Gideon Lieberman successfully contributed to the improvement and development of the company, including handling the engineering planning of the construction of Machine 8, provision of infrastructure services to all companies in the group, successfully leading the operational and maintenance processes and handling the matter of environmental issues. |
| 3.2.4 | The terms of employment of Gideon Lieberman are fair, generally acceptable and reasonable, inter alia, while taking into consideration the financial situation of the company, its objectives and the challenges it faces. As regards the bonus that was granted to Gideon Lieberman, the Board of Directors of the company believes that it appropriately reflects his significant contribution to improving the operations and development of the company, as detailed above. |
| 3.2.5 | The Board of Directors of the company believes, that given the terms of the options granted to Gideon Lieberman, the scope of compensation in securities, as mentioned above, is fair and reasonable. The volume of options he was granted reflects the company's objective in encouraging him to continue and devote his energy to the company. The exercise price that was determined serves to ensure that the compensation is contingent upon the rise in the price of the share and is consequently dependent upon the market situation and the financial position of the company. The mechanism that was determined allows for compensation over a long period of time, while correlating the compensation with a continuing contribution to the company over the same length of time. |
| 3.2.6 | In the opinion of the Board of Directors of the company, given the overall considerations detailed above, as well as in consideration of the complex role of Gideon Lieberman, his skills, experience and his contribution to the company during the reported period, his compensation during the reported period is in line with the best interests of the company and is fair and reasonable in relation to his contribution to the company, within the framework of his position during the aforesaid period of time. |
34
| 4. | Shimon Biton, CEO of Combined Advanced Energy Ltd.: |
| 4.1 | Description of Compensation: During the reported period, Shimon Biton was eligible for wages totaling NIS 1,152 thousand (this included wages, social benefits and acceptable perks, bonus salary and company car). Moreover, on March 6, 2011, the Board of Directors of the company approved the payment of a bonus to Shimon Biton in the sum of NIS 200,000. True to the report date, Shimon Biton holds 2,750 non-marketable stock options of the company that were allocated to him as part of the employee stock option plan. For additional details regarding the compensation of Shimon Biton during the reported period, see Appendix D to part D of the periodical report (Additional Details regarding the Corporation). |
| 4.2 | Examining the relationship between the compensation and contribution of Shimon Biton, the fairness and reasonability of the compensation: |
| 4.2.1 | In order to examine and evaluate the terms of the compensation of Shimon Biton, the Board of Directors of the company has examined, inter alia, his compliance with the requirements of his position and his performance as CEO of the energy company of the group during the reported period, his contribution to the company, the results of operations of the company in 2010 and whether the company has met objectives that were defined in the work plan. |
| 4.2.2 | The Board of Directors of the company was presented - to its satisfaction - with the principal terms of employment of Shimon Biton in the reported period, including the value of the benefits he was granted, as well as the terms of employment of the other position holders at the company. Data was also presented regarding generally accepted compensation in the market during the reported period and true to the date of the examination, for similar position holders at companies possessing the same size and area of operations as that of the company. |
| 4.2.3 | Shimon Biton serves as CEO of the energy company within the company and has been employed by the company since July 1977. During the reported period, Shimon Biton successfully contributed to improving and developing the company, including leading the project for the construction of Machine 8 and its successful hand over to current operations, handling the company's real estate and advancing an examination of the potential opportunities of the company, related to energy and to promoting an investment in the power station. |
| 4.2.4 | The terms of employment of Shimon Biton are fair, generally acceptable and reasonable, inter alia, while taking into consideration the financial situation of the company, its objectives and the challenges it faces. As regards the bonus that was granted to Shimon Biton, the Board of Directors of the company believes that it appropriately reflects his significant contribution to improving the operations and development of the company, as detailed above. |
35
| 4.2.5 | The Board of Directors of the company believes, that given the terms of the options granted to Shimon Biton, the scope of compensation in securities, as mentioned above, is fair and reasonable. The volume of options he was granted reflects the company's objective in encouraging him to continue and devote his energy to the company. The exercise price that was determined serves to ensure that the compensation is contingent upon the rise in the price of the share and is consequently dependent upon the market situation and the financial position of the company. The mechanism that was determined allows for compensation over a long period of time, while correlating the compensation with a continuing contribution to the company over the same length of time. |
| 4.2.6 | In the opinion of the Board of Directors of the company, given the overall considerations detailed above, as well as in consideration of the complex role of Shimon Biton, his skills, experience and his contribution to the company during the reported period, his compensation during the reported period is in line with the best interests of the company and is fair and reasonable in relation to his contribution to the company, within the framework of his position during the aforesaid period of time. |
| 5. | Gur Ben David, CEO of packaging paper and recycling: |
| 5.1 | Description of Compensation: During the reported period, Gur Ben David was eligible for wages totaling NIS 1,032 thousand (this included wages, social benefits and acceptable perks, bonus salary and company car). Moreover, on March 6, 2011, the Board of Directors of the company approved the payment of a bonus in the sum of NIS 300,000. True to the report date, Gur Ben David holds 6,750 non-marketable stock options of the company that were allocated to him as part of the employee stock option plan. For additional details regarding the compensation of Gur Ben David during the reported period, see Appendix D to part D of the periodical report (Additional Details regarding the Corporation). |
| 5.2 | Examining the relationship between the compensation and contribution of Gur Ben David, the fairness and reasonability of the compensation: |
| 5.2.1 | In order to examine and evaluate the terms of the compensation of Gur Ben David, the Board of Directors of the company has examined, inter alia, his compliance with the requirements of his position and his performance as CEO of the packaging paper and recycling division of the company during the reported period, his contribution to the company, the results of operations of the company in 2010 and whether the company has met objectives that were defined in the work plan. |
36
| 5.2.2 | The Board of Directors of the company was presented - to its satisfaction - with the principal terms of employment of Gur Ben David in the reported period, including the value of the benefits he was granted, as well as the terms of employment of the other position holders at the company. Data was also presented regarding generally accepted compensation in the market during the reported period and true to the date of the examination, for similar position holders at companies possessing the same size and area of operations as that of the company. |
| 5.2.3 | Gur Ben David serves as the CEO of the packaging paper and recycling division of the company and has been in the employment of the company since August 1, 2006. During the reported period, Gur Ben David successfully contributed to the improvement and development of the company, including work related to the packaging law, the successful completion of the running-in of Machine 8, significant growth in output capacity, growth in the sales of the division while recording improved profitability, development of export markets and development of unique products. |
| 5.2.4 | The terms of employment of Gur Ben David are fair, generally acceptable and reasonable, inter alia, while taking into consideration the financial situation of the company, its objectives and the challenges it faces. As regards the bonus that was granted to Gur Ben David, the Board of Directors of the company believes that it appropriately reflects his significant contribution to improving the operations and development of the company, as detailed above. |
| 5.2.5 | The Board of Directors of the company believes, that given the terms of the options granted to Gur Ben David, the scope of compensation in securities, as mentioned above, is fair and reasonable. The volume of options he was granted reflects the company's objective in encouraging him to continue and devote his energy to the company. The exercise price that was determined serves to ensure that the compensation is contingent upon the rise in the price of the share and is consequently dependent upon the market situation and the financial position of the company. The mechanism that was determined allows for compensation over a long period of time, while correlating the compensation with a continuing contribution to the company over the same length of time. |
| 5.2.6 | In the opinion of the Board of Directors of the company, given the overall considerations detailed above, as well as in consideration of the complex role of Gur Ben David, his skills, experience and his contribution to the company during the reported period, his compensation during the reported period is in line with the best interests of the company and is fair and reasonable in relation to his contribution to the company, within the framework of his position during the aforesaid period of time. |
In January 2008, the board of directors decided to adopt a senior employee stock option plan. In the first quarter of 2008, a sum of 250,500 stock options were allocated to senior employees at associated and consolidated companies, and on January 8, 2009 - a sum of 34,000 options were granted, out of the 35,250 allocated to the trustee, for future granting. Total general expenses for this program are estimated at NIS 15.5 million, as at the date they were granted. The plan's impact on the consolidated financial statements is estimated at NIS 13.8 million.
37
| 5. | Auditing CPA Fees |
Current Fees
The fee of the CPA on account of the auditing services is determined by the Board of Directors. The fee for the auditing services, including the auditing of the internal control over financial reporting, is determined after negotiations with the auditing CPAs, within whose framework the volume of auditing and its complexity is examined, while relating to the generally accepted fees of the auditing CPA. The fee for services that are not related to auditing is determined in accordance with the type of work, the volume of hours and the topic being audited. The fee for the company's auditing CPAs, was equal to $280,000 in 2010, as compared with a sum of approximately $220,000 in 2009. The hours invested by the auditing CPAs on account of these services amounted to 6,563 hours and 6,267 hours in the years 2010 and 2009, respectively.
Below are details of the total fee payable to the auditing CPA of the Company and its subsidiaries in the reported year and in the preceding year:
| 2010 | 2009 | |||||||||||||||
| $K | Hours | $K | Hours | |||||||||||||
| Auditing and tax report auditing services to the company (including special auditing works) | 205,600 | 5,343 | 135,000 | 4,506 | ||||||||||||
| Auditing of internal auditors | 67,000 | 1,080 | 65,700 | 1,100 | ||||||||||||
| Miscellaneous | 7,300 | 140 | 19,700 | 421 | ||||||||||||
| Total | 279,900 | 6,563 | 220,400 | 6,027 | ||||||||||||
| 6. | External Directors The Company chose not to include in its articles of association the provision with regard to the percentage of external board members. |
| 7. | Internal Auditing - SOX |
By virtue of being a company whose shares are publicly traded in the United States, the company is subject to "Sarbanes Oxley" (SOX) in its entirety, including Section 302 (proper disclosure and evaluation of controls in the organization), Section 404 (Management Assessment of Internal Controls) and Section 906 (Criminal responsibility for breach of this section). The main points of the law have to do with increasing reporting and disclosure, the authorities and duties of the Audit Committee, manager responsibilities, enforcement, sanctions and penalties and increasing the independence from external accountants. The controls instigated by the company for the implementation of the law are regularly inspected by the company's auditing team and by the external accountant. Since 2007, with the introduction of the directives of the said law in the United States, the company is complying with the demands of the law.
38
We note that on February 16, 2010, the Securities and Exchange Commission (SEC) authorized the company's requests that its reports regarding the effectiveness of internal control be made in the format prescribed by law, by virtue of its being listed for trade on AMEX, i.e.- the SOX regulations in the United States that apply to the company as mentioned above, subject to the company having undertaken to examine, once every quarter, its compliance with the terms described in its application to the SEC, including any change in the directives of the law in Israel and in the United States, in the status of the company as it relates to these laws, changes in the implementation of the SOX regulations and any other change that may affect the disclosure provided by the company.
| 8. | Detailed processes undertaken by the company's supreme supervisors, prior to the approval of the financial statements |
| 1. | On February 8, 2011, the Board of Directors of the company authorized the Audit Committee to also serve as a committee for the examination of the financial statements. It was resolved that it would be called the balance sheet and audit committee and would be charged - on behalf of the Board of Directors - to oversee the completeness of the financial statements and the work of the auditing CPAs and to make recommendations regarding the ratification of the financial statements and a discussion thereof prior to such ratification. |
| 2. | The members of the committee are as follows: |
Name | External / independent director | Possessing accounting and financial expertise / able to read financial statements | Skills, education and experience | Provided an affidavit | |
| Atalia Arad | External Director | Capable of reading and understanding financial statements | Her education and professional experience (see chapter D, Appendix G of the 2010 periodical report). | P | |
| Amir Makov | External Director | Possesses accounting and financial qualifications | His education and professional experience (see chapter D, Appendix G of the 2010 periodical report). | P | |
| Amos Mar-Haim | Possesses accounting and financial qualifications | His education and professional experience (see chapter D, Appendix G of the 2010 periodical report). | P |
39
Ms. Atalia Arad serves as chairperson of the committee |
| 3. | On February 28, 2011, the Balance Sheet and Audit Committee met to discuss the financial statements of the company for 2010 ("The Financial Statements"), for the purpose of formulating recommendations for the Board of Directors of the company. |
| 4. | The position holders, interested parties, family members and/or anyone on their behalf present in the meeting of the committee, include: Ofer Bloch - CEO, Shaul Glicksberg - VP Finance and Business Development, Yael Nevo - legal counsel, Shmuel Molad - Treasurer, Boaz Simons - VP of Clal Industries and Investments Ltd. (CII), controlling shareholder of the company, Yehuda Ben-Ezra, VP Finance & Treasurer of CII, Dror Dotan - Assistant to the CII CEO. |
| 5. | It should be noted that the auditing CPA also attended this meeting. He reviewed the auditing and review process that was conducted by himself, as regards the financial statements. |
| 6. | In the course of the meeting, the committee examined the material issues related to the financial statements, the crucial estimates and critical valuations implemented in the financial statements, the plausibility of the data, the accounting policy that was implemented and changes therein, and the implementation of the proper disclosure principal in the financial statements and regarding any accompanying information. The Committee also examined various aspects of control and risk assessment reflected in the financial statements (such as reporting of financial risks), as well as those affecting the reliability of the financial statements. Upon completion of the discussion of data presented, the committee handed down its recommendations to the Board of Directors of the company, regarding the ratification of the financial statements. |
| 7. | The said recommendations were forwarded to the members of the Board of Directors approximately 5 days before the date that was set for the discussion and ratification of the financial statements. |
| 8. | The Board of Directors of the company believes that the recommendations of the committee were transferred to it within a reasonable time, and perhaps even more so, prior to the discussion by the Board of Directors, taking into consideration the scope and complexity of the issues to be discussed in the recommendations. The Board of Directors of the company has accepted the recommendations of the balance sheet and object committee regarding the approval of the financial statements. |
40
| 9. | Procedure for classifying transactions as marginal |
On March 8, 2009, the Company's Board of Directors resolved to adopt rules and guidelines for categorizing a transaction of the Company or of one of its consolidated subsidiaries - with a controlling shareholder ("controlling shareholder transaction") - as a negligible transaction as set forth in Regulation 41(a)(6) of the Securities Regulations (Preparation of Annual Financial Statements), 2010 ("Financial Statements Regulations"). These rules and guidelines shall also serve to examine the extent of disclosure in the periodical report and the prospectus ( including shelf prospectus reports) regarding a transaction of the company, Corporation under its control and any related company, with a controlling shareholder, or in whose approval a controlling shareholder possesses a personal interest, as set forth in Regulation 22 of the Securities Regulations (Periodic and Immediate Reports) -1970 ("Periodic Report Regulations") and in Regulation 54 of the Securities Regulations (Prospectus Details and Prospectus Draft - Form and Shape) - 1969, as well as for the purpose of submitting an immediate report regarding a said transaction of the company, as stipulated in Regulation 37(a)(6) of the Periodic Report Regulations (the types of transactions determined in the Financial Statements Regulations, Periodical Statements Regulations and in the Prospectus Details Regulations mentioned above, hereinafter: "Related Party Transactions"). On August 8, 2010, the Company's Board of Directors decided to update the rules and guidelines for the classification of an interested party transaction as a negligible transaction for the purposes described above, as follows:
The Company and its associated and related companies, are conducting or may conduct interested-party transactions in the course of their normal state of affairs, and they possess or may possess undertakings to conduct such transactions, including transactions of the type and possessing the characteristics outlined below: Obtaining banking, financial and/or economic services (such as: portfolio management, investment consulting, managing funds provided for the employees, deposits) from a banking corporation and financial institutions; purchasing insurance policies (such as: Managers liability insurance, property insurance and managers insurance); sale and purchase of products and services (such as: Communication products and services, Call Center services, food products, office supplies, paper and cardboard products, clothing, textile, hygiene products, complementary products for cleaning and kitchen use and pesticides); sale and purchase of gifts and gift certificates; purchase and/or rental and/or operational leasing of vehicles; purchase of commercial vehicles, trucks and generators; purchase of travel, flights and tourism services in Israel and overseas and conference and event planning services; legal services; purchasing; rental of real estate property; property management services; vehicle repair services; transportation and courier services, packaging and export services; archive services, warehouse management services and logistic services; administrative services; underwriting engagements; irrigation and pest control services, shredding and waste treatment; rental of advertising space; supply of newspapers, magazines and periodicals.
In the absence of any special qualitative considerations arising from the circumstances, a transaction with an interested party shall be deemed negligible if it is not an exceptional transaction (as defined in the Companies Law) for the purposes outlined above, if the applicable benchmark calculated for the transaction is less than 0.5% and the volume of the transaction does not exceed NIS 8 million (with this sum being adjusted according to the rise, from time to time, in the consumer price index, in relation to the Known Index starting at the beginning of 2010).
In any interested party transaction classified as a negligible transaction, one or more of the criterions relevant to the specific transaction will be calculated based on the consolidated audited or reviewed financial statements of the Company: (a) The sales ratio – total sales in the interested party's transaction divided by total annual sales; (b) Sales cost ratio – the cost of the interested party's transaction divided by the total cost of annual sales; (c) Profit ratio – the actual or forecasted profit or loss attributed to the interested party's transaction divided by the average annual profit or loss in the last three years, based on the last 12 quarters for which reviewed or audited financial statements were published; (d) Assets ratio – the total volume of assets in the interested party's transaction divided by total assets; (e) Liabilities ratio – the liabilities in the interested party's transaction divided by total liabilities; (f) Operating costs ratio - the volume of the expenditure that is the subject of the interested party transaction divided by the total annual operating expenditures. For example, in an insurance transaction of several years, the annual paid insurance fees shall be considered as the volume of the transaction. In cases where, at the Company's discretion, all the aforementioned quantitative benchmarks are not applicable for evaluation of the negligibility of the transaction with an interested party, the transaction shall be deemed negligible, in accordance with another applicable benchmark to be determined by the Company, provided that the applicable benchmark calculated for said transaction is less than 0.5% and that the volume of the transaction shall not exceed NIS 8 million (with this sum being adjusted according to the rise, from time to time, of the consumer price index in relation to the Known Index since the beginning of 2010).
41
The consideration of the quantitative benchmarks of an interested-party transaction may lead to the classification of the transaction as a transaction that is not negligible despite the aforesaid. Thus - and only as an example - a transaction with an interested party shall not usually be deemed negligible if it is conceived as a significant event by the Company's management, and if it serves as a basis for making managerial decisions, or if in the course of the transaction with an interested party, the latter is expected to receive benefits which are important to disclose publicly.
Separate interested-party transactions that are in fact interconnected and that are in fact part of the same engagement (for example: conducting negotiations regarding the entirety of the transactions), shall be examined as a single transaction.
An interested-party transaction that was classified as negligible by an investee company of the Company, shall also be considered negligible at the parent company level. A transaction that was classified by the investee company is a transaction that is not negligible, shall be examined against the relevant benchmarks at the parent company level.
The Audit Committee of the Company shall annually review the manner of implementation of the instructions in this procedure by the Company, and will conduct sample examinations of interested-party transactions to which the company is a party directly, that were classified is negligible transactions according to the procedural instructions. As part of the sample examinations of the said transactions, the Audit Committee shall examine, inter alia, the manner by which the prices and other terms of the transaction were determined, as the circumstances may be, and will analyze the impact of the transaction on the business situation of the company and the results of its operations. The operations of the Audit Committee as stated in this section, including the sample examination mentioned above, the manner of its implementation and the summarized results and conclusions, shall be disclosed in the periodical report of the company.
The Company's Board of Directors shall examine the need to update the instructions of this procedure from time to time, while taking into consideration the interest-party transactions undertaken by the company and the relevant changes in the legislation.
42
H. | Disclosure Directives Related to the Financial Reporting of the Corporation |
| 1. | Events Subsequent to the Balance Sheet Date |
For details regarding events that occurred subsequent to the balance sheet date, see Note 22 to the financial statements dated December 31, 2010.
| 2. | Critical Accounting Estimates |
Regarding critical accounting estimates, see Note 4 of the financial statements dated December 31, 2010.
| I. | Dedicated Disclosure to Debenture Holders For details regarding the rating of debentures, see Note 15 to the periodical report for the year 2010. On January 02, 2011, Standard & Poor's Maalot ratified the Company's ilA+ rating. The rating forecast is stable. The said rating report is attached as an appendix to the management discussion date December 31, 2010. |
| 1. | Sources of Finance See Section B4 - Financial Liabilities and further details in the table below. |
43
| J. | Dedicated Disclosure to Debenture Holders - Continued |
| 2. | Debentures for institutional investors and the public |
| Series | Issue Date | Name of rating Company | Rating at time of issue and at report date | Total stated value at issue date | Interest type | Stated Interest | Registered for trade on stock exchange (Yes/No) | Interest payment dates | Nominal par value as at Dec-31-10 | Book value of debenture balances as at Dec-31-10 | Book value of interest to be paid as at Dec-31-10 | Fair value as at Dec-31-10 |
| In NIS millions | ||||||||||||
| Series 2 | 12.2003 | Maalot | A+ | 200,000,000 | Fixed | 5.65% | No | Annual interest December 21 In the years 2004-2013 | 85.7 | 101.0 | 0.2 | 104.1 |
| Series 3 | 7.2008 | Maalot | A+ | 187,500,000 | Fixed | 4.65% | Yes | Annual interest On July 10 In the years 2009-2018 | 166.7 | 179.8 | 4.0 | 184.2 |
| Series 4 | 7-8.2008 | Maalot | A+ | 235,557,000 | Fixed | 7.45% | Yes | Semi-annual interest On January 10 and July 10 In the years 2009-2015 | 196.3 | 196.3 | 7.0 | 212.5 |
| Series 5 | 5.2010 | Maalot | A+ | 181,519,000 | Fixed | 5.85% | Yes | Semi-annual interest On November 30 and May 31 of the years 2010-2017 | 181.5 | 181.5 | 0.9 | 197.4 |
Comments:
| 1. | Series 2 - Linked to the Consumer Price Index (CPI). Principal repaid in 7 annual installments, between Dec-21-2007 and Dec-21-2013. |
| 2. | Series 3 - Linked to the Consumer Price Index (CPI). Principal repaid in 9 annual installments, between July 2010 and July 2018. |
| 3. | Series 4 - Principal repaid in 6 annual installments, between July 2010 and July 2015. |
| 4. | Series 5 - Principal repaid in 5 annual installments, between November 2013 and November 2017. |
| 5. | The trustee of the debentures (Series 2) is Bank Leumi Le-Israel Trust Corporation Ltd. The responsible contact person on behalf of Bank Leumi Le-Israel Trust Corporation Ltd. is Ms. Idit Teuzer (telephone: 03-5170777). |
| 6. | The trustee of the public debentures (Series 3, 4) is Hermetic Trust Corporation (1975) Ltd. The responsible contact people on behalf of Hermetic Trust Corporation (1975) Ltd. are Mr. Dan Avnon and/or Ms. Merav Ofer-Oren (telephone: 03-5272272). |
| 7. | The trustee of the public debentures (Series 5) is Strauss Lazar Trust Corporation (1992) Ltd. The responsible contact person at Strauss Lazar Trust Corporation (1992) Ltd. in the matter of the public debentures is Mr. Uri Lazar (telephone: 03-6237777). |
| 8. | As at the date of the report, the Company has met all of the terms and undertakings of the trust notes and there exist no terms that constitute just cause for demanding the immediate repayment of the debentures. |
| Zvika Livnat, Chairman of the Board of Directors | Ofer Bloch, CEO |
44
Exhibit 3

A Free Translation From Hebrew

Table of Contents
| Part | Topic |
| A. | Corporate Description |
| B. | Management Discussion |
| C. | Financial Statements as at December 31, 2010 |
| D. | Additional Details Regarding the Corporation |
| E. | Report Regarding Effectiveness of Internal Auditing Over Financial Reporting and Disclosure |
Part A
Description of the Corporation's Business
Table of Contents
| Table of Contents | 1 |
| Part A | 1 |
| Table of Contents | 1 |
| Chapter A - Description of the General Development of the Corporation's Business | 1 |
| 1. Introduction | 1 |
| 2. Corporate operations and description of development of its business | 3 |
| 3. Sectors of operation | 7 |
| 4. Equity investments in the Company and transactions in its shares | 8 |
| 5. Dividend distribution | 9 |
| Chapter B - Other Information | 10 |
| 6. Financial Information Regarding the Corporation's Sectors of Operation | 10 |
| 7. The General Environment and Impact of External Factors on the Company | 15 |
| Chapter C – Business Description of the Corporation by Sector | 17 |
| 8. The Paper and Recycling Sector | 17 |
| 8.1. Structure of the packaging paper and recycling operating sector and changes thereto | 17 |
| 8.2. Limitations, Legislation, Regulations and Special Constraints applicable to the packaging paper and recycling operating sector | 18 |
| 8.3. Changes to volume of operations in the packaging paper and recycling sector and its profitability | 18 |
| 8.4. Developments in the packaging paper and recycling sector and changes to its customer profile | 19 |
| 8.5. Critical success factors in the packaging paper and recycling sector of operations and changes therein | 21 |
| 8.6. Changes to suppliers and raw materials for the packaging paper and recycling operating sector | 22 |
| 8.7. Major barriers to entry and exit in the packaging paper and recycling sector and changes therein | 23 |
| 8.8. Structure of competition in the packaging paper and recycling operating sector and changes thereto | 24 |
| 8.9. Products and services in the packaging paper and recycling operating sector | 24 |
| 8.10 Distribution of revenues and profitability of products and services in the packaging paper and recycling operating sector | 25 |
| 8.11. New Products | 25 |
| 8.12. Customers of the packaging paper and recycling operating sector | 26 |
| 8.13. Marketing and distribution in the packaging paper and recycling sector | 28 |
| 8.14. Order backlog in the packaging paper and recycling sector | 28 |
| 8.15. Competition in the packaging paper and recycling sector | 28 |
| 8.16. Seasonality | 29 |
| 8.17. Output capacity in the packaging paper and recycling sector | 30 |
| 8.18. Fixed assets, real estate and facilities in the packaging paper and recycling operating sector | 31 |
| 8.19. Research and development | 32 |
| 8.20. Raw materials and suppliers in the packaging paper and recycling sector | 32 |
| 8.21. Working Capital | 34 |
| 8.22. Environmental considerations in the packaging paper and recycling sector | 35 |
| 8.23. Restrictions on and Supervision of Corporate Operations in the Packaging Paper and Recycling Sector | 35 |
| 8.24. Material agreements in the packaging paper and recycling sector | 40 |
| 8.25. Anticipated development over the next year for the operating sector | 41 |
| 8.26. Risk factors in the packaging paper and recycling operating sector | 42 |
| 9. Office Supplies Marketing sector | 45 |
| 9.1. Structure of the Office Supplies Marketing sector | 45 |
| 9.2. Changes to volume of operations in the sector and its profitability | 46 |
| 9.3. Technological changes that can potentially impact the sector of operations | 46 |
| 9.4. Critical success factors in the sector of operations | 46 |
| 9.5. Structure of competition in the office supplies marketing sector | 47 |
| 9.6. Marketing and distribution in marketing of office supplies sector of operations | 47 |
| 9.7. Customers in the marketing of office supplies sector | 47 |
| 9.8. Marketing and distribution in the marketing of office supplies sector | 48 |
| 9.9. Order backlog in the marketing of office supplies | 48 |
| 9.10. Competition in the marketing of office supplies sector | 48 |
| 9.11. Seasonality | 49 |
| 9.12. Fixed assets, real estate and facilities in the marketing of office supplies sector | 49 |
| 9.13. Suppliers in the marketing of office supplies sector | 50 |
| 9.14. Working Capital | 50 |
| 9.15. Restrictions on and Supervision of Corporate Operations in the Office Supplies Marketing Sector | 51 |
| 9.16. Forecast for developments in the sector of operations for the coming year | 51 |
| 9.17. Risk factors in the marketing of office supplies sector | 52 |
| 10. Packaging products and cardboard sector | 53 |
| 10.1. The packaging products and cardboard operating sector and changes therein | 53 |
| 10.2. Changes in the volume of operations in the packaging products and cardboard operating sector | 53 |
| 10.3. Developments in the packaging products and cardboard sector and changes to its customer profile | 54 |
10.4. Critical success factors in the packaging products and cardboard sector of operations and changes therein | 54 |
| 10.5. Changes to suppliers and raw materials for the packaging products and cardboard sector | 54 |
| 10.6. Major barriers to entry and exit in the packaging products and cardboard sector and changes therein | 55 |
10.7. The structure of the packaging products and cardboard operating sector and changes therein | 55 |
| 10.8. Products and services in the packaging products and cardboard operating sector | 56 |
| 10.9. Distribution of revenues and profitability of products and services in the packaging products and cardboard operating sector | 57 |
| 10.10. Customers in the packaging products and cardboard operating sector | 57 |
| 10.11. Marketing and distribution in the packaging products and cardboard operating sector | 58 |
| 10.12. Order backlog in the packaging products and cardboard operating sector | 59 |
| 10.13. Competition in the packaging products and cardboard operating sector | 59 |
| 10.14. Seasonality | 59 |
| 10.15. Output capacity in the packaging products and cardboard operating sector | 59 |
| 10.16. Research and development in the packaging products and cardboard operating sector | 60 |
| 10.17. Fixed assets, real estate and facilities in the packaging products and cardboard operating sector | 60 |
| 10.18. Raw materials and suppliers in the packaging products and cardboard operating sector | 61 |
| 10.19. Working Capital | 62 |
| 10.20. Environmental protection in the packaging products and cardboard operating sector | 63 |
| 10.21. Restrictions and regulation on corporate operations in the packaging products and cardboard operating sector | 63 |
| 10.22. Anticipated development over the next year for the operating sector | 64 |
| 10.23. Risk factors in the packaging products and cardboard operating sector | 64 |
| 11. Fine paper sector | 66 |
| 11.1. Structure of the fine paper sector | 66 |
| 11.2. Developments in the fine paper sector and changes to its customer profile | 67 |
| 11.3. Critical success factors in the Fine Paper sector of operations and changes therein | 67 |
| 11.4. Changes to suppliers and raw materials in the sector | 67 |
| 11.5. Major barriers to entry and exit in the sector of operations and changes therein | 67 |
| 11.6. Dividend distribution | 67 |
| 11.7 Economic environment and the impact of external factors on operations in the fine paper sector | 68 |
| 11.8. Products and services in the fine paper sector | 68 |
| 11.9. Sales of imported paper | 69 |
| 11.10. Distribution of revenues and profitability of products and services in the fine paper sector | 70 |
| 11.11. Customers of the fine paper sector | 70 |
| 11.12. Marketing and distribution in the fine paper sector | 71 |
| 11.13. Order backlog in the fine paper sector | 72 |
| 11.14. Competition in the fine paper sector | 72 |
| 11.15. Seasonality | 73 |
| 11.16. Output capacity in the fine paper sector | 73 |
| 11.17. Fixed assets, real estate and facilities in the fine paper sector | 73 |
| 11.18. Raw materials and suppliers in the fine paper sector | 74 |
| 11.19. Working Capital | 76 |
| 11.20. Financing | 77 |
| 11.21. Taxation | 77 |
| 11.22. Environmental issues in the fine paper sector | 78 |
| 11.23. Restrictions on and Supervision of Corporate Operations in the Fine Paper Sector | 78 |
| 11.24. Material agreements in the fine paper sector | 78 |
| 11.25. Anticipated development over the next year for the operating sector | 82 |
| 11.26. Risk factors in the fine paper sector | 82 |
| Chapter D – Additional Information Regarding the Company | 85 |
| 12. Fixed assets, real estate and facilities | 85 |
| 13. Human Resources | 88 |
| 13.1. Company’s organizational structure | 88 |
| 13.2. Staff employed according to areas of activity | 89 |
| 13.3 Employment agreements | 89 |
| 13.4. Agreements with senior officers | 90 |
| 13.5. Pay Cuts | 95 |
| 13.6. Hadadit Fund | 95 |
| 14. Restrictions and Supervision of the Company's Operations | 96 |
| 15. Financing | 97 |
16. Taxation | 101 |
| 17. Environmental Protection | 101 |
| 18. Insurance | 104 |
| 19. Material Agreements | 105 |
| 20. Legal Proceedings | 108 |
| 21. Business Objectives and Strategy | 108 |
| 22. Anticipated Development over the Next Year | 113 |
| 23. Risk Factors | 113 |
23.1 General | 113 |
23.2 Macro-Economic Risk Factors | 113 |
23.3 Sector-Specific Risk Factors | 115 |
23.4 Special Factors | 115 |
23.5 General factors | 116 |
23.6. The extent of impact of risk factors | 116 |
| 24. Investments in Associated Companies | 116 |
24.1. Hogla-Kimberly Ltd. | 116 |
Chapter A -
Description of the General Development of the Corporation's Business
| 1. | Introduction |
The Board of Directors of Hadera Paper Ltd. is honored to hereby present the description of the corporation's business as at December 31, 2010 - a review of the corporate description and development of its business in 2010 ("the reported period"). The report was formulated in accordance with the Securities Regulations (Periodic and Immediate Reports), 1970.
| 1.1. | Legend |
For the sake of convenience, in this periodic report the following abbreviations shall have the meaning noted adjacent to them:
| "Amnir" - | Amnir Recycling Industries Ltd.; | |
| "Amnir Environment" - | Amnir Industries and Environmental Services Ltd.; | |
| "Integraed Energy" | Advanced Integrated Energy Ltd. | |
| "Graffiti" - | Graffiti Office Supplies & Paper Marketing Ltd.; | |
| "DIC" - | Discount Investment Corporation Ltd.; | |
| "TASE" - | The Tel Aviv Stock Exchange Ltd.; | |
| "The Company" or "Hadera Paper" - | Hadera Paper Ltd. (formerly: "American Israeli Paper Mills Ltd."); | |
| "The Group" | The Company, its subsidiaries and associated companies, as defined below; | |
| "Subsidiaries" - | Companies directly and/or indirectly controlled by the Company1: Graffiti Office Supplies & Paper Marketing Ltd., Hadera Paper - Packaging Paper and Recycling Ltd., Hadera Paper - Development and Infrastructure Ltd., Amnir Recycling Industries Ltd., Attar Office Supplies Marketing Ltd., Carmel Container Systems Ltd., Frenkel CD Ltd., Hadera Paper - Printing and Writing Paper Ltd. and its subsidiaries and other inactive companies as set forth in section 2.5 below; | |
| "Associated Companies" - | Hogla Kimberly Ltd., KCTR (Turkey), Cycle-Tec Ltd. and their subsidiaries; | |
| "Hogla Kimberly" - | Hogla Kimberly Ltd.; | |
| "The Companies Law" - | The Companies Law, 1999; | |
| "The Securities Act" - | The Securities Act, 1968; | |
| "Tri-Wall" - | Tri-Wall Containers (Israel) Ltd. | |
| "Carmel" - | Carmel Container Systems Ltd.; | |
| "CII" - | Clal Industries and Investments Ltd.; |
1In respect of this report, "Control" - as defined in Section 1 of the Securities Act.
1
| "Report date" - | December 31, 2010; | |
| "Hadera Paper Packaging" - | Hadera Paper - Packaging Paper and Recycling Ltd. (formerly: Hadera Paper Industries Ltd. and prior to that "AIPM Paper Industries (1995) Ltd."); | |
| "Hadera Paper Printing" - | Hadera Paper - Printing and Writing Paper Ltd. (formerly: "Mondi Hadera Paper Ltd."); | |
| "Hadera Paper Infrastructure" - | Hadera Paper Development and Infrastructure Ltd.; | |
| "Cycle-Tec" - | Cycle-Tec Recycling Technology Ltd.; | |
| "Attar" - | Attar Office Supplies Marketing Ltd.; | |
| "Frenkel-CD" - | Frenkel-CD Ltd.; | |
| "Kimberly-Clark" - | Kimberly-Clark Corp. | |
| "NYSE"- | New York Stock Exchange Euronext (formerly: American Stock Exchange - AMEX); | |
| "KCTR"- | Kimberly-Clark Tuketim Mallari Sanayi Ve Ticare A.S. |
| 1.2. | The degree to which information included in this report is material, including description of the subsidiaries and associated companies and description of their business, is provided from the Company's viewpoint, and in some cases the description has been elaborated to provide a comprehensive view of the topic described. |
| 1.3. | Holding stakes in shares of investee companies are rounded to the nearest percentage point, and are current in proximity to the date of this report, unless otherwise indicated. Holding stakes in shares of an investee company are calculated out of total actual issued share capital of said investee, not accounting for potential dilution due to exercise of options and other convertible securities issued by the company, unless otherwise indicated. In calculating the holding rate in company shares, fully diluted, the exercise of all the options and other convertible securities issued at that date were taken into account, unless stated otherwise. Consequently, holding percentage is may change according to the exercise of options granted to the remaining shareholders in the same investee company. |
| 1.4. | In the description of the investee companies, data that is based on various surveys and studies is occasionally included. The company is not responsible for the content of such surveys and studies. |
| 1.5. | This report refers to both men and women - the occasional use of the masculine form is for purposes of convenience only. |
| 1.6. | Part A of this annual report should be read along with its other parts, including the notes to the financial statements. |
2
| 2. | Corporate operations and description of development of its business |
| 2.1. | The Company was incorporated in Israel as a private company in 1951. In 1959 the Company held an initial public offering of its securities, pursuant to a prospectus published on that date (hereinafter: "The IPO") and Company shares have been listed since then for trading on the TASE and on the NYSE. On July 1, 2008, pursuant to approval by the Registrar of Companies, the Company changed its name from American Israeli Paper Mills Ltd. to Hadera Paper Ltd. |
| 2.2. | The controlling shareholder of the company is CII, that holds, as of a date adjacent to the publication date of this report, approximately 59.09% of the Company's issued capital and voting rights, respectively. |
| 2.3. | Prior to September 30, 2009, DIC held 21.45% of the issued capital and voting rights to the company and was a controlling shareholder of the company. On September 30, 2009, following the finalization of the transaction for the sale of all the DIC holdings in the company to CII, DIC ceased being a controlling shareholder of the company. CII accordingly increased its holdings in the company. |
| 2.4. | To the best of the Company's knowledge, the following are details of holders of 5% or more of the Company's issued share capital or voting rights, in immediate proximity to the publication date of this report: |
| Name of Interested Party | Ordinary Shares of NIS 0.01 par value | Holding rate of capital and voting, non-diluted | Holding rate of capital and voting, fully diluted | |||||||||
Clal Industries and Investments Ltd.2 | 3,007,621 | 59.09 | % | 57.60 | % | |||||||
Clal Insurance Holdings Ltd.3 | 224,736 | 4.42 | % | 4.30 | % | |||||||
Clal Finance4 | 35,759 | 0.70 | % | 0.68 | % | |||||||
Psagot Investment House Ltd.5 | 276,361 | 5.43 | % | 5.29 | % | |||||||
| Public | 1,545,334 | 30.36 | % | 32.11 | % | |||||||
| Total | 5,089,811 | 100 | % | 100 | % | |||||||
| 2 | CII is a public company. As of the date of this report, IDB Development Co., Ltd. (hereinafter: "IDB Development"), a public company whose shares are listed for trade on the TASE , holds 60.54% of CII's issued capital. To the best of the Company's knowledge, Clal Insurance Business Holding Ltd. (hereinafter: "Clal Holdings"), a public company whose shares are listed for trading on the TASE, which is controlled, as of the report date, by IDB Development, holds 4.21% of CII's issued capital. To the best of the Company's knowledge, Clal Holdings is an interested party in Clal Industries, since it is controlled by IDB Development, the controlling shareholder of CII. |
To the best of the Company's knowledge, IDB Development Ltd. ("IDB Development") is a privately-held company whose shares are listed for trade on the Tel Aviv Stock Exchange Ltd. ("TASE") and whose controlling shareholder is IDB Holdings Ltd. ("IDB Holdings"), which holds all of the issued share capital and voting rights therein. To the best of the company's knowledge, IDB Holdings is a public company whose shares and securities are registered for trade on the TASE. To the best of the company's knowledge, the following is a description of the control in IDB Holdings: Ganden Holdings Ltd. (Ganden Holdings"), a private company incorporated in Israel, which holds directly and via Ganden Investments IDB Ltd. ("Ganden"), a private company incorporated in Israel wholly owned by it (indirectly), 54.72% of the issued share capital and voting rights of IDB Holdings (approximately 54.36% fully diluted), as follows: Ganden holds approximately 37.22% of the issued share capital and voting rights of IDB Holdings (approximately 36.98% fully diluted), while Ganden Holdings directly holds approximately 17.50% of the issued share capital and voting rights of IDB Holdings (approximately 17.38% fully diluted). Moreover, Shelly Bergman (one of the controlling shareholders in Ganden Holdings, as described below), holds - through YZD Ltd. - a privately held company incorporated in Israel which it wholly owns, approximately 4.17% of the issued share capital and voting rights of IDB Holdings (approximately 4.14% fully diluted).
Ganden Holdings is a private company whose controlling shareholders are Nochi Dankner, who holds, directly and via a company controlled by him, 56.30% of the issued share capital and voting rights in Ganden Holdings, and Shelly Bergman (Nochi Dankner's sister), who holds 12.41% of the issued share capital and voting rights in Ganden Holdings; these controlling shareholders are deemed to jointly hold 68.71% of the issued share capital and voting rights in Ganden Holdings, inter alia, by virtue of a cooperation and pre-coordination agreement between them. Nochi Dankner's control of Ganden Holdings is also based on an agreement signed or joined by all shareholders of Ganden Holdings, whereby Nochi Dankner was granted, inter alia, veto rights on Board of Directors and General Meetings of Ganden Holdings and its subsidiaries. Moreover, it should be noted that Nochi Dankner serves as Chairman of the Board of Directors of IDB Holdings and IDB Development.
Hashkaa Mutzlachat Ltd. ("Hashkaa Mutzlachat"), a company wholly owned by Mr. Tzur Dabush, holds 1.67% of the issued share capital and voting rights of Ganden Holdings; for the sake of caution and in view of Tzur Dabush's commitment toward Nochi Dankner to vote using all of his shares of Ganden Holdings together with Nochi Dankner, in accordance with the voting and instructions of Nochi Dankner, Hashkaa Mutzlachat and Tzur Dabush may, for as long as said commitment remains in force, be deemed to hold together with Nochi Dankner, means of control over Ganden Holdings, and may therefore also be deemed to be controlling shareholders of Ganden Holdings.
3
Other material corporate shareholders of Ganden Holdings are as follows:
| A. | Nolai BV (a private company indirectly owned by The L.S. Settlement, which is held in trust by a law firm based in Gibraltar, whose beneficiaries are descendants of Ms. Anna Schimmel, including Mr. Yaakov Schimmel, who serves as a director of IDB Holdings and IDB Development) holds approximately 9.9% of the issued share capital and voting rights in Ganden Holdings. |
| b. | Avi Fisher, who serves, inter alia, as Deputy CEO of IDB Holdings and as Deputy Chairman of IDB Development, holds in person and via a company controlled by him and by his wife, holds, directly and indirectly, approximately 9.1% of the issued share capital and voting rights in Ganden Holdings. |
Manor Holdings B.A., Ltd. ("Manor Holdings"), a private company incorporated in Israel, which holds directly and via Manor Investments - IDB Ltd. ("Manor"), its subsidiary which is a private company incorporated in Israel, approximately 13.30% of the issued share capital and voting rights of IDB Holdings (approximately 13.22% fully diluted), as follows: Manor holds approximately 10.25% of the issued share capital and voting rights of IDB Holdings (approximately 10.18% fully diluted), while Manor Holdings directly holds approximately 3.05% of the issued share capital and voting rights of IDB Holdings (approximately 3.03% fully diluted).
Manor is a company controlled by Itzhak Manor and his wife, Ruth Manor. Itzhak Manor and Ruth Manor, along with their four children - Dori Manor, Tamar Morel, Michal Topaz and Sharon Vishnia - hold all Manor shares via two private companies registered in Israel- Manor Holdings and Euro Man Automotive Ltd. ("Euro Man"), as follows: Ruth and Itzhak Manor hold all shares of Manor Holdings, which holds 60% of Manor shares; in addition, Ruth and Itzhak Manor and their aforementioned children hold all shares of Euro Man, which holds 40% of Manor shares, as follows: Ruth Manor and Itzhak Manor each hold 10% of Euro Man shares; Dori Manor, Tamar Morel, Michal Topaz and Sharon Vishnia each hold 20% of Euro Man shares. Note also that Itzhak Manor serves as Vice Chairman of the IDB Holdings Board of Directors and as member of the IDB Development Board of Directors; Dori Manor serves as member of the Boards of Directors of IDB Holdings and of IDB Development.
Avraham Livnat Ltd., a private company incorporated in Israel, holds directly and via Avraham Livnat Investments (2002) Ltd. ("Livnat"), a wholly-owned private company incorporated in Israel, approximately 13.31% of the issued share capital and voting rights of IDB Holdings (approximately 13.23% fully diluted), as follows: Livnat holds approximately 10.20% of the issued share capital and voting rights of IDB Holdings (approximately 10.13% fully diluted), while Avraham Livnat Ltd. directly holds approximately 3.11% of the issued share capital and voting rights of IDB Holdings (approximately 3.09% fully diluted).
Avraham Livnat Ltd. is a company controlled by Avraham Livnat, which is wholly owned by Avraham Livnat and his three sons - Ze'ev Livnat, Zvi Livnat and Shai Livnat - as follows: Avraham Livnat holds 75% of the voting rights in Avraham Livnat Ltd. and Zvi Livnat holds 25% of the voting rights in Avraham Livnat Ltd., and each of Messrs. Ze'ev Livnat, Zvi Livnat and Shai Livnat, each hold 33.3% of the capital of Avraham Livnat Ltd. Furthermore, Zvi Livnat serves as board member and Deputy CEO of IDB Holdings, and as Deputy Chairman of the Board of IDB Development, and Shai Livnat serves as board member of IDB Development.
A shareholders agreement (as updated) exists between Ganden, Manor and Livnat, relating to their holdings and joint control over IDB Holdings ("IDB Shareholders Agreement"), relating to approximately 51.7% of the issued share capital of IDB Holdings, held as follows: [a] Ganden - 31.02%; [b] Manor - 10.34%; and [c] Livnat - 10.34% (on their own and through their parent companies).
The IDB shareholders' agreement includes, inter alia, a pre-coordination agreement on uniform voting at shareholder meetings of IDB Holdings; exercise of voting power to achieve maximum representation of candidates supported by Ganden, Manor and Livnat on IDB Holdings' and IDB Development's Boards of Directors as well as representation on boards of major subsidiaries; determination of persons holding office of Chairman of the Board and Vice Chairmen on IDB Holdings and its major subsidiaries; non-disclosure of all matters concerning the business of IDB Holdings and its investees; restrictions on transactions in shares of IDB Holdings which form part of the controlling interest; setting up a mechanism for right of first refusal, tag-along right for sale or transfer of IDB Holdings shares and Ganden's right to require Manor and Livnat to sell, concurrently with the former, shares in the controlling stake to a third party, should certain circumstances occur; agreement by Ganden, Manor and Livnat, among themselves, to make their best efforts, subject to all legal provisions, to cause IDB Holdings to distribute to its shareholders, annually, at least one half of the distributable annual income; and for all investees of IDB Holdings (including IDB Development) to adopt a policy aimed at distributing to its shareholders, annually, as dividend, one half or more of distributable annual income, provided that no significant impact is caused to the cash flows or to plans approved and adopted from time to time by their boards of directors; the right of each of Ganden, Manor and Livnat to purchase surplus shares of IDB Holdings which are not part of the controlling interest, subject to the requirement to offer the other parties to the IDB shareholders' agreement to purchase a part thereof based on their holdings stake in IDB Holdings; commitment by Ganden, Manor and Livnat to avoid any action or investment which may terminate or materially deteriorate terms of regulatory approvals or permits granted to Ganden, Manor and Livnat, to IDB Holdings or to its investee companies. The shareholders agreement in IDB is valid for 20 years starting in May 2003.
The shares in IDB Holdings, held by Ganden Holdings (17.50%), by Ganden (6.2%), by Manor Holdings (2.96%), by Avraham Livnat Ltd. (2.97%) and by Shelly Bergman, via her wholly-owned company (4.17%) of the issued share capital of IDB Holdings - are excluded from the "controlling interest" as defined in the IDB shareholders' agreement.
| 3 | Clal Insurance Holdings Ltd. (hereinafter: Clal Holdings"), a public company whose shares are listed for trading on the stock exchange, which is controlled, as of the report date, by IDB Development Co. Ltd. (hereinafter: "IDB Development"). To the best of the Company's knowledge, Clal Holdings is an interested party in Clal Industries, since it is controlled by IDB Development, the controlling shareholder of CII. |
| 4 | Clal Finance Ltd. (hereinafter: "Clal Finance"), a public company whose shares are listed for trade on the TASE, which is controlled, as of the report date, by Clal Holdings. To the best of the Company's knowledge, Clal Finance is an interested party in the Company, since it is controlled by IDB Development, the controlling shareholder of CII. |
| 5 | Psagot Investment House Ltd. (hereinafter: "Psagot"), is a company - that to the best of the company's knowledge, true to the date of the report - is controlled by AP.PS ACQUISITION LTD., a dedicated Israeli company wholly owned by Partners Apax an international investment fund ("Apax"). |
4
| 2.5. | The Company deals - directly or through its subsidiaries - in the manufacture and sale of packaging paper, corrugated board containers and packaging for consumer goods, in the collection and recycling of paper waste, in the manufacturing and marketing of fine paper and in the marketing of office supplies. Moreover, the company possesses holdings in an associated company that deals - directly and through the subsidiaries of the associated company - in the manufacture and marketing of household paper products, hygiene products, disposable diapers and complementary kitchen products. |
| 2.6. | The company has five sectors of operation, that are reported as accounting sectors in the company's consolidated financial statements: (a) Packaging paper and recycling sector; (b) Office supplies marketing sector; (c) Packaging products and cardboard sector; (d) Fine paper sector; and (e) through the company's associated company - the Hogla Kimberly sector (non-food disposable consumer goods). The companies in the group that are active in the packaging paper and recycling sector include Hadera Paper Packaging, Hadera Paper Infrastructure and Amnir. To companies in the group that are active in the marketing of office supplies include Graffiti and Attar. The companies in the group that are active in the packaging products and cardboard sector include Carmel, Tri-Wall and Frenkel-CD. The companies in the group that are active in the fine paper sector include Hadera Paper Printing and its subsidiaries. For details regarding the five operating sectors, see Section 3, below. The Company provides various services, including headquarter services, to some of its subsidiaries and to an associated company. For details, see Section 3.1, below. |
5
| 2.7. | The following diagram illustrates the Company's holdings in major Group companies: |
Hogla-Kimberly
Ltd.
Ltd.
Hadera Paper -
Packaging
Paper and
Recycling Ltd.
Packaging
Paper and
Recycling Ltd.
Amnir
Recycling
Industries Ltd.
Recycling
Industries Ltd.
Frenkel-CD
Ltd.(2)
Ltd.(2)
Attar Marketing Office
Supplies Ltd.
Supplies Ltd.
49.9%
75%
100%
100 %
Hadera Paper Ltd. (1)
100%
100%
Hadera Paper
- Printing and
Writing Paper
Ltd.
- Printing and
Writing Paper
Ltd.
100%
28.92%
28.92%
KCTR
(Turkey)
100%
Hadera Paper
Development and
Infrastructure Ltd.
Development and
Infrastructure Ltd.
100%
Tri-Wall
Containers
(Israel) Ltd.
Containers
(Israel) Ltd.
100%
Carmel
Container
Systems Ltd.
Container
Systems Ltd.
Graffiti Office
Supplies & Paper
Marketing Ltd.
Supplies & Paper
Marketing Ltd.
| (1) | The company also has holdings in the following companies: Advanced Integrated Energy Ltd. (100%), Bondex Technologies Ltd. (18.37%) and Cycle-Tec Ltd. (30.18%) (company with no business activity), whose operations are not material to the company. |
| (2) | There are two types of shares in Frenkel-CD. The holding percentage of the company in the voting rights, directly and indirectly, is equal to 57.72%. |
6
| 2.8. | Changes in the Business of the Corporation during the Reported Period |
| 2.8.1. | On October 4, 2010, the company completed a full tender offer for the acquisition of all of the holdings of the public in Carmel, at a price of $22.5 per share in cash, at a total consideration of approximately $4.4 million. As of October 4, 2010, the company holds 100% of the issued and outstanding share capital and voting rights of Carmel, that has become a privately held company. |
| 2.8.2. | Effective December 31, 2010, the company acquired from a subsidiary of Mondi Business Paper Group (hereinafter: "Mondi Group"), 25.1% of the issued and outstanding share capital of Hadera Paper Printing (hereinafter in this section: "The Acquisition Transaction"). The total consideration of the acquisition transaction amounted to €10.364 million, that were paid from the company's own resources. Following the closing of the transaction, true to the date of the report, the company holds approximately 75% of the shares of Hadera Paper Printing, that was consolidated within the financial statements of the company, with a subsidiary of Mondi Group holding the remaining shares of Hadera Paper Printing. For details regarding the operations of Hadera Paper Printing and the acquisition transaction, see section 11, below. |
| 3. | Sectors of operation |
As mentioned above, the Company, via its subsidiaries and associated companies, operates in five sectors of operation:
| 3.1. | Packaging Paper and Recycling - Company operations in this sector include the manufacture and sale of packaging paper, used mainly as raw materials in the packaging industry (hereinafter: "corrugators"). This sector of operations also includes the collection and recycling of paper waste, as well as a network of complementary services for the packaging industry. Most of the manufacturing performed by the company consists of fluting paper (paper that serves as a raw material for the manufacture of corrugated board packages, serving as a separation between the external layer of the box and its internal side). This paper is produced by Hadera Paper Packaging out of recycled paper waste, collected by Amnir from various sources throughout Israel. Within this sector of operations, the company also produces types of paper based entirely (100%) on recycled fibers that constitute a replacement for pulp-based packaging paper. Additionally, Hadera Paper Infrastructures provides various services to some of the group companies, at the company site in Hadera. Such services include: Engineering services, regular maintenance to ensure manufacturing consistency, supply of gas, electricity, steam, fuel, water, spare parts warehouse, transportation services, cleaning, security and catering services. For further details regarding this operating sector, see Section 8, below. |
| 3.2. | Office supplies marketing - Company operations in this sector are carried out via Graffiti and Attar, including marketing of office and paper supplies, primarily to the institutional and business markets, which include inter-alia: government offices, banks, HMOs and other businesses. The rate of technological development of Israel’s business sector leads to increasing demand for technology-based products, including office automation, printers, hardware, software and consumables such as toners, inkjet cartridges, etc. Office supplies are often delivered along with management of the customers' relevant purchasing budget, thus allowing Graffiti to assist in cost reduction and improved efficiency for large enterprises. For further details regarding this operating sector, see Section 9, below. |
7
| 3.3. | Packaging and cardboard products - Company operations in this operating segment include production and sale of cardboard products, intended primarily for customers in the industry and agriculture sectors and of cardboard shelf packaging for consumer goods, mostly used in industry, agriculture, food, beverages and cosmetics. Packaging and board production is partially based on recycled paper waste used as raw material. The packaging and cardboard produced by Carmel and by Frenkel-CD are also made of recycled paper produced by Hadera Paper Packaging. For further details regarding this operating sector, see Section 10, below. |
| 3.4. | Manufacture of Fine Paper - The company's operations in this sector are conducted through the subsidiary company Hadera Paper Printing and its subsidiaries and consists of the manufacture and marketing of fine paper, the marketing of imported paper, such as coated paper and special paper, complementary to its product range. For further details regarding this operating sector, see Section 11, below. |
| 3.5. | Hogla Kimberly (disposable, non-food consumer goods) - The company operations in this sector are performed through the Hogla associated company and its subsidiaries and consist of the manufacture and marketing of a wide variety of household paper products, disposable diapers for babies, incontinence products (adult absorbent products), feminine hygiene products and complimentary products for the kitchen and for cleaning. For further details regarding this operating sector, see Section 24.1, below. |
| 4. | Equity investments in the Company and transactions in its shares |
| 4.1. | On January 14, 2008, the Company adopted a compensation plan for senior employees of the Group, whereby up to 285,750 stock options, each of which is exercisable into one ordinary share of the Company, of NIS 0.01 par value, would be allocated (hereinafter: "Compensation Plan"). The number of shares derived from the exercise of the stock options represented - on the date of approval of the allotment - approximately 5.65% of the issued share capital of the company. Pursuant to the conditions of the said option warrants, the offerees who will exercise the option warrants will not be allocated all of the shares derived therefrom, but only a quantity of shares that reflects the sum of the financial benefit that is inherent to the option warrants at the exercise date only. In the course of the first quarter of 2008, a sum of 250,500 stock options were granted as aforesaid, and on January 8, 2009, a sum of 34,000 stock options were granted, out of 35,250 stock options that were allocated to the trustee, as a reservoir for future granting. On August 9, 2009, the remaining options held by the Trustee, totaling 1,250 options, were cancelled. During 2009, senior employees and position holders at the company exercised 1064 option warrants into 98 ordinary shares of the company. Moreover, a total of 17,686 stock options expired in 2009. In the course of 2010, a total of 103,462 option warrants were exercised into 24,009 shares and true to December 31, 2010, a total of 158,038 option warrants of the company have either expired or have yet to be exercised. For details regarding the aforementioned stock option plan and allocation, see section 13.4.5, below. |
8
| 5. | Dividend distribution |
| 5.1. | The company did not distribute any dividends to its shareholders during the past two years. As of December 31, 2010, the company possesses retained earnings that are eligible for distribution, in the sum of NIS 506,445 thousand. |
| 5.2. | We note that, as of the report date, the Company has yet to adopt a dividend distribution policy. Furthermore, as of the report date, the Company has yet to assume any restrictions on dividend distribution. It is noted that dividends from distributable profits from approved enterprises (alternative enterprises) are subject to extra taxes, as specified in the Law for the Encouragement of Capital Investments. |
9
Chapter B - Other Information
| 6. | Financial Information Regarding the Corporation's Sectors of Operation |
| 6.1. | Below are data regarding financial information about the Company's sectors of operation in the years 2010, 2009 and 2008: |
| Year ended December 31, 2010 | |||||||||||||||||||||||||||||||||||
| NIS thousands | Packaging paper & recycling sector | Office Supplies Marketing sector | Packaging products and cardboard sector | Hogla Kimberly Sector | Fine paper sector | Adjustments to consolidated* | Consolidated | ||||||||||||||||||||||||||||
| 1. | Revenues | ||||||||||||||||||||||||||||||||||
| a. | External sector revenues | 393,439 | 176,580 | 489,543 | 1,691,918 | 691,069 | (2,382,986 | ) | 1,059,563 | ||||||||||||||||||||||||||
| b. | Revenues from other operating sectors | 117,927 | 2,267 | 20,102 | 5,591 | 37,633 | (122,075 | ) | 61,445 | ||||||||||||||||||||||||||
| c. | Total | 511,366 | 178,847 | 509,645 | 1,697,509 | 728,702 | (2,505,061 | ) | 1,121,008 | ||||||||||||||||||||||||||
| 2. | Costs* | ||||||||||||||||||||||||||||||||||
| a. | Costs that constitute revenues of another sector of the corporation | 12,531 | 35,483 | 73,757 | 55,578 | 6,152 | (121,771 | ) | 61,730 | ||||||||||||||||||||||||||
| b. | Other Costs | 448,676 | 138,237 | 428,783 | 1,455,328 | 691,478 | (2,164,519 | ) | 997,983 | ||||||||||||||||||||||||||
| c. | Total | 461,207 | 173,720 | 502,540 | 1,510,906 | 697,630 | (2,286,290 | ) | 1,059,713 | ||||||||||||||||||||||||||
| d. | Fixed costs | 206,445 | 19,940 | 164,333 | 448,479 | 160,293 | (612,481 | ) | 387,009 | ||||||||||||||||||||||||||
| e. | Variable costs | 254,762 | 153,781 | 338,207 | 1,062,427 | 537,337 | (1,673,810 | ) | 672,704 | ||||||||||||||||||||||||||
| 3. | Operating Profit | 50,159 | 5,127 | 7,105 | 186,603 | 31,072 | (218,771 | ) | 61,295 | ||||||||||||||||||||||||||
| a. | Operating profit attributed to the owners of the parent company | 50,159 | 5,127 | 5,399 | 93,115 | 15,505 | (109,716 | ) | 59,589 | ||||||||||||||||||||||||||
| b. | Operating profit attributed to rights that do not offer control | - | - | 1,706 | 93,488 | 15,567 | (109,055 | ) | 1,706 | ||||||||||||||||||||||||||
| 4. | Total assets as at December 31, 2010** | 1,689,167 | 53,425 | 376,061 | 979,817 | 425,379 | (750,215 | ) | 2,773,634 | ||||||||||||||||||||||||||
| 5. | Total liabilities as at December 31, 2010 | 138,405 | 35,920 | 75,931 | 501,159 | 119,809 | 948,154 | 1,820,032 | |||||||||||||||||||||||||||
| * | Adjustments are primarily for general assets not assigned to a specific operating sector (such as investment in associated companies, cash, etc.). |
| ** | For a valuation of total company assets provided to the company and attached to the financial statements, see the Company's financial statements as at December 31, 2010. . |
10
| Year ended December 31, 2009 | |||||||||||||||||||||||||||||||||||
| NIS thousands | Paper & recycling sector | Office Supplies Marketing sector | Packaging products and cardboard sector | Hogla Kimberly Sector | Fine Paper Sector | Adjustments to consolidated* | Consolidated | ||||||||||||||||||||||||||||
| 1. | Revenues | ||||||||||||||||||||||||||||||||||
| a. | External sector revenues | 219,866 | 149,107 | 468,339 | 1,722,613 | 645,972 | (2,368,582 | ) | 837,315 | ||||||||||||||||||||||||||
| b. | Revenues from other operating sectors | 119,433 | 1,904 | 15,965 | 4,014 | 23,250 | (109,886 | ) | 54,680 | ||||||||||||||||||||||||||
| c. | Total | 339,299 | 151,011 | 484,304 | 1,726,627 | 669,222 | (2,478,468 | ) | 891,995 | ||||||||||||||||||||||||||
| 2. | Costs* | �� | |||||||||||||||||||||||||||||||||
| a. | Costs that constitute revenues of another sector of the corporation | 59,601 | 30,777 | 94,561 | 54,596 | 5,209 | (184,939 | ) | 59,805 | ||||||||||||||||||||||||||
| b. | Other Costs | 282,435 | 116,251 | 375,031 | 1,478,226 | 623,472 | (2,058,812 | ) | 816,603 | ||||||||||||||||||||||||||
| c. | Total | 342,036 | 147,028 | 469,592 | 1,532,822 | 628,681 | (2,243,751 | ) | 876,408 | ||||||||||||||||||||||||||
| d. | Fixed costs | 146,691 | 15,636 | 145,797 | 541,218 | 143,825 | (684,838 | ) | 308,329 | ||||||||||||||||||||||||||
| e. | Variable costs | 195,345 | 131,392 | 323,795 | 991,604 | 484,856 | (1,558,913 | ) | 568,079 | ||||||||||||||||||||||||||
| 3. | Operating profit from ordinary operations | (2,737 | ) | 3,983 | 14,712 | 193,805 | 40,541 | (234,717 | ) | 15,587 | |||||||||||||||||||||||||
| a. | Operating profit attributed to the owners of the parent company | (2,737 | ) | 3,983 | 12,192 | 96,709 | 20,230 | 117,310 | 13,067 | ||||||||||||||||||||||||||
| b. | Operating profit attributed to rights that do not offer control | 2,520 | 97,096 | 20,311 | 117,407 | 2,520 | |||||||||||||||||||||||||||||
| 4. | Total assets as at December 31, 2009 | 1,638,895 | 43,542 | 356,742 | 990,670 | 461,786 | (1,202,959 | ) | 2,288,676 | ||||||||||||||||||||||||||
| 5. | Total liabilities as at December 31, 2009 | 141,911 | 31,327 | 82,657 | 534,577 | 306,478 | 360,946 | 1,430,247 | |||||||||||||||||||||||||||
| * | Adjustments are primarily for general assets not assigned to a specific operating sector (such as investment in associated companies, cash etc.) |
11
| Year ended December 31, 2008 | |||||||||||||||||||||||||||||||||||
| NIS '000 | Paper & recycling sector | Office Supplies Marketing sector | Packaging products and cardboard sector | Hogla Kimberly Sector | Fine Paper Sector | Adjustments to consolidated* | Consolidated | ||||||||||||||||||||||||||||
| 1. | Revenues | ||||||||||||||||||||||||||||||||||
| a. | External sector revenues | 273,436 | 129,068 | 500,069 | 1,605,376 | 717,424 | (2,660,433 | ) | 564,940 | ||||||||||||||||||||||||||
| b. | Revenues from other operating sectors | 133,331 | 2,046 | 12,508 | 3,200 | 14,923 | (57,464 | ) | 108,544 | ||||||||||||||||||||||||||
| c. | Total | 406,767 | 131,114 | 512,577 | 1,608,576 | 732,347 | (2,717,897 | ) | 673,484 | ||||||||||||||||||||||||||
| 2. | Costs* | ||||||||||||||||||||||||||||||||||
| a. | Costs that constitute revenues of another sector of the corporation | 66,185 | 19,250 | 97,344 | 68,756 | 7,913 | (182,779 | ) | 76,669 | ||||||||||||||||||||||||||
| b. | Other Costs | 302,809 | 108,631 | 421,459 | 1,404,067 | 690,344 | (2,365,846 | ) | 561,464 | ||||||||||||||||||||||||||
| c. | Total | 368,994 | 127,881 | 518,803 | 1,472,823 | 698,257 | (2,548,625 | ) | 638,133 | ||||||||||||||||||||||||||
| d. | Fixed costs | 145,699 | 17,930 | 150,377 | 520,034 | 147,168 | (773,581 | ) | 207,627 | ||||||||||||||||||||||||||
| e. | Variable costs | 223,295 | 109,951 | 368,426 | 952,789 | 551,089 | (1,775,044 | ) | 430,506 | ||||||||||||||||||||||||||
| 3. | Operating profit | 37,773 | 3,233 | (6,226 | ) | 135,753 | 34,090 | (169,272 | ) | 35,351 | |||||||||||||||||||||||||
| a. | Operating profit attributed to the owners of the parent company | 37,773 | 3,233 | (4,250 | ) | 67,741 | 17,011 | 84,181 | 37,327 | ||||||||||||||||||||||||||
| b. | Operating profit attributed to rights that do not offer control | (1,476 | ) | 68,012 | 17,079 | 85,091 | 1,976 | ||||||||||||||||||||||||||||
| 4. | Total assets as of December 31, 2008 | 803,279 | 72,624 | 415,666 | 946,156 | 483,962 | (677,593 | ) | 2,044,094 | ||||||||||||||||||||||||||
| 5. | Total liabilities as at December 31, 2008 | 82,925 | 35,258 | 76,837 | 505,167 | 361,404 | 224,875 | 1,286,466 | |||||||||||||||||||||||||||
| * | Adjustments are primarily for general assets not assigned to a specific operating sector (such as investment in associated companies, cash etc.) |
12
| 6.2. | Developments over the past three years |
| 6.2.1. | Below are explanations of developments in data pertaining to financial information set forth in section 6, above: |
| 6.2.2. | In the course of 2008, the Israeli economy slowed down (3.9% growth in relation to 2007), while in the second half of 2008, private-consumption demand dropped as well. Furthermore, 2008 was a volatile year for the Israeli shekel versus the dollar, as an average revaluation at a rate of approximately 13% occurred, as compared to 2007, totaling approximately 1.1% during the latter part of 2008, in addition to the 9% revaluation during 2007. At the beginning of 2009, the business sector had to deal with a freeze in demand resulting from the worldwide financial crisis which developed in 2008. The main decrease in demand was observed by a reduction in the demand for exports, leading to adjustments in the scope of employment and investment. Some recovery was noted starting from the second quarter of 2009, increasing in strength in most of the sectors of the Israeli market, in the Israeli capital market and significant increases were even noted in real estate property investments. |
| 6.2.3. | The imbalance between supply and demand in the global paper industry (beginning in 2008 as a result of the financial crisis and the deceleration of operations during the first half of 2009) caused an influx of low-priced paper into Israel, forcing the companies in Israel in both the fine paper sector as well as in the packaging paper sector to maintain a low price level, and even to lower prices throughout most of 2009. The erosion of sales prices was compensated by the continued decrease in inputs in 2009 (mainly fibers and chemicals). During 2009, electricity prices also decreased, offsetting the rise in the price of water during 2009, as compared with 2008. |
| 6.2.4. | There was a consistent rise in prices in the world packaging paper market throughout all of 2010. The trend of price rises in recycled products became more moderate towards the end of 2010. |
| 6.2.5. | At the beginning of 2011, the trend, continuing from 2010, of rising prices of recycled paper in the world was reflected in the publications of a number of recycled paper manufacturers in Europe regarding additional price rises are expected starting in February 2011, at a rate of approximately 10%. |
| 6.2.6. | Amnir collects paper waste, which constitutes the main raw material for the manufacture of packaging paper, from various sources throughout Israel. On January 19, 2001, the Formalization of Treatment of Packaging Law 5771 – 2011 (hereinafter: "the Packaging Law), with the goal of regulating arrangements in the matter of treatment of packaging waste. Inter alia, the Packaging Law establishes responsibility for recycling packaging waste and goals for recycling types of packaging waste. The Packaging Law goes into effect on March 1, 2011, and certain regulations relating to the start of collection by a recognized body go into effect as of July 1, 2011. In light of the provisions of the Packaging Law, an adjustment will be required in the set-up of the Company’s collection of paper and board, however the Company cannot at this stage estimate the impact the law will have on operations, and this is dependent, inter alia, on regulations that will be enacted by power of the law in the matter of separation at source and removal and collection of waste, and on the method of operation to be used by the recognized body to be established by power of the law. For details regarding the Packaging Law, see section 8.23.2, below. |
13
| 6.2.7. | Regarding printing and copying paper (fine paper), in 2010 there were rises in prices in the local market in light of the fact that a number of plants throughout the world stopped manufacture, causing a reduction in the supply of paper in the local market. At the same time, there was a rise in the price of pulp during 2010, as compared with 2009. During 2010, Hadera Paper Printing took steps toward increasing exports to the US, which contributed to the improvement of its profitability. The relocation to the logistics center in Modi'in is expected to improve the Company’s logistic capacities and to support the Company’s continued growth and development. |
| 6.2.8. | During 2009, a decreasing trend was felt in input prices, mainly in the areas of fibers and chemicals. This trend turned during the last quarter of 2009, in light of awakening activities in the markets. As of the end of 2009, pulp prices began to rise steeply. These rises leveled out only towards the end of 2010. During 2010 starch prices decreased, as well as the price of electricity as compared with 2009. This diminishment of costs was offset by the rise in water prices. |
| 6.2.9. | The average revaluation of the shekel versus the dollar of approximately 5.1% in 2010, as compared with 2009, and the revaluation of the shekel versus the euro at the rate of approximately 9% during 2010 as compared with 2009 had a positive effect on the Company in terms of imported inputs, while - on the other hand - serving to erode selling prices in the Company’s areas of operations where prices are quoted in dollars and euro. |
| 6.2.10. | Changes in currency rates could impact the Company’s various areas of operations in different ways, so that the overall negative and positive effects are offset against each other, and therefore the Company’s exposure to changes in currency rates is low. The above information with regard to Company estimates of trends in the global market, in the paper industry and in selling prices, input and paper prices, demand growth trends and the impact of all these factors on Company results constitutes forward-looking information as defined in the Securities Act, and merely consists of forecasts and estimates by the Company which are not certain to materialize and are based on information available to the Company as of the report date. These estimates may not materialize - in whole or in part - or may materialize in a different manner than anticipated, inter alia on account of factors that lie outside the control of the company, such as the impact of the crisis in the global credit and banking sectors, changes in global raw material prices and changes in the demand and supply of paper products worldwide, as well as changes and developments in regulation in the sectors of operation and/or the realization of any of the risk factors outlined in sections 8.26, 9.17, 10.23, 11.26 and 23, below. |
| 6.2.11. | For additional details regarding change in the sector of operations, see Sections 8, 9, 10, 11, 24, below. |
14
| 7. | The General Environment and Impact of External Factors on the Company |
| 7.1. | The economic recovery in most world financial and real markets continued during 2010, especially in awakening markets, and in Israel. At the same time, the effects of the financial crisis which began in 2008 are still evident, including in the fluctuation of rates of securities and currencies, in light of the uncertainty regarding the capacities of some of the European countries to service their debts, the United States’ ability to bring down unemployment rates, the slow recovery of the US real estate market and the handling of increasing inflation in developing countries (China, in particular), following the sharp rise in commodity prices throughout the world. |
| 7.2. | In Israel, 2010 was a year of recovery from the global crisis. Starting in the second half of 2009, a gradual recovery was noted in GDP. This trend continued in 2010, when a 4.5% growth rate6 was recorded as compared with 0.8% growth in 2009, thanks to the renewed rise in global demand. Growth was felt in the Israeli economy in the development of output in the paper and paper product industry beginning in the third quarter of 2009 through to the second quarter of 2010, reaching some 7%7. There was also a rapid expansion of export starting in the second half of 2009, resulting from an average devaluation in the exchange rate of the shekel vs. the dollar, at the rate of approximately 9%, as compared with 2008, and improvement in Israel’s conditions of trade in light of a fall in prices of commodities throughout the world. This expansion continued on into 2010. Export of goods and services grew in 2010 at the rate of some 12.6%8 as compared with a decrease of some 12.5% in 2009. Together with the recovery in exports, a certain recovery in local demand was also recorded: The industry’s sales in the local market grew at a cumulative rate of approximately 5% from the last quarter of 2009 until the second quarter of 2010. In 2010, a rise in private consumption per capita was noted, of some 2.9%9. The growth in local demand stemmed from households, in light of the drop in unemployment rates, as well as from the real increase in average wages in the market, as well as in light of the rise in economic activity in general. |
| 7.3. | The local capital market showed a positive trend in 2010, and at the same time, capital raising in the corporate debt market gradually increased. The obvious recovery of the Israeli market, on the one hand, and concerns regarding development of a bubble in the local residential real estate market, alongside the concern from inflation increase ,on the other hand, caused the Bank of Israel to slowly and gradually increase the monetary interest rate, and at the same time to continue be involved in the foreign currency market, and lately, in cooperation with the Ministry of Finance, to also impose limitations on the short term movement of capital. 2011 opened with a continued growth trend for the Israeli market and recovery in the financial markets, together with the development of a trend of geo-political instability in a number of countries in the Middle East. The continued trend of instability in the Middle East could, under certain scenarios, negatively impact the status of the Israeli market. |
| 6 | Growth data from the Central Bureau of Statistics, Dec-29-2010, "Preliminary Assessments for National Accounts for 2010". |
| 7 | Growth data for paper and paper products industry from publication by the Israel Manufacturers Association, "Status of the Israeli Industry, Trends and Forecasts 2010-2011". |
15
| 7.4. | In September 2010 Israel formally joined the OECD (Organization for Economic Cooperation and Development) as a full member. The OECD is a forum of countries committed to democracy and free-market economics, serving as a platform to formulate policy and actual practice in economics, society and the environment. Membership in the OECD serves as an indication that Israel is considered to be a "developed nation" and meets the economic and regulatory standards set by the organization. Moreover, Israel's membership in the OECD may hold a positive influence on foreign investors who are while investing in Israel and may also serve to influence the credit rating of the State of Israel. |
| 7.5. | In the paper industry, the worldwide economic slowdown in 2009 forced companies in Israel to maintain a low price level. This trend changed during the last quarter of 2009 and in the beginning of 2010, and measures for raising sale prices for printing and copy paper and for packaging paper in the local market as well as in export markets were taken in 2010, following the improved economic situation and end of the recession. It looks as if this trend of high demand for packaging paper will continue into the beginning of 2011 as well. |
| 7.6. | Gas prices, denominated in US dollars, which represent a material input in the manufacturing chain of paper, decreased in 2010 by approximately 6% in relation to 2009 as a result of the revaluation of the NIS in relation to the average US dollar exchange rate during the period, by a rate of approximately 5.1% in relation to 2009. For additional details regarding the gas agreement, see section 19.8, below. However, recent geo-political developments in Egypt and uncertainty with regards to stability of governments could - under certain scenarios - negatively impact the Company’s option of engaging under an agreement with gas provider EMG, one of the gas providers the Company has been negotiating with, in connection with gas supply. As of the date of this report, the Company cannot assess the impact the situation in the region will have on the option of said engagement with EMG, or said impact on possible conditions of engagement with other gas suppliers. |
| 7.7. | The developments in global markets, and especially in the euro bloc and in the United States, that also include volatility in global exchange rates, have and may continue to affect the business results of the Company and its investees, their liquidity, shareholders' equity and assets and the ability to realize these assets, the state of their business (including the demand for the products of the Company's investees), their financial benchmarks and covenants, credit ratings, ability to distribute dividends and even their ability to raise financing for operating activities and long-term activities as well as the financing terms. |
| 7.8. | Said information regarding the impact of Israel having joined the OECD and regarding trends in demand for packaging paper is considered forward looking information as defined in the Securities Law, and constitutes forecasts and assessments on the part of the company, the realization of which is not certain and based on information existing in the company as of the date of the report. These forecasts and estimates by the Company may not materialize, in whole or in part, or may materialize in a manner significantly different than that expected. The major factors that could impact this are business opportunities the company may have, dependence on external factors, changes in demand and supply, developments and changes in regulation and/or realization of any of the risk factors outlined in sections 8.26 and 23, below. |
16
Chapter C – Business Description of the Corporation by Sector
| 8. | The Paper and Recycling Sector |
| 8.1. | Structure of the packaging paper and recycling operating sector and changes thereto |
| 8.1.1. | The paper and recycling operations focus primarily on the manufacture and sale of packaging paper, used as raw materials in the corrugated board industry (hereinafter: "corrugators") as well as paper waste collection and recycling. Production and sales of packaging paper is conducted by the Company via its subsidiary, Hadera Paper Packaging. Paper waste collection and recycling is primarily conducted via the subsidiary, Amnir. |
| 8.1.2. | Packaging paper is intended, as mentioned, primarily for the corrugated board industry, for the manufacture of board containers used as product packaging. The corrugated board industry serves the following sectors: Industry, agriculture and the food and beverage industry. Consequently, the macro-economic variable that possesses the greatest impact on the demand for packaging paper and the derived volume of paper waste collection by the company is the level of economic activity in the market and the export volumes. |
| 8.1.3. | The majority of production conducted by the company in this sector consists of fluting paper (incorporated in corrugated board boxes as a wavy layer between the outer and inner box walls). All of the packaging paper produced by Hadera Paper Packaging, is made of recycled paper waste, collected from various sources throughout Israel. Globally, packaging paper is also produced from virgin fibers (pulp). In this sector of operations, the company also produces paper types made of 100% recycled fibers, that constitute a replacement for pulp-based packaging paper. For details regarding the development of paper from recycled fibers, as a replacement for paper from virgin fibers, see section 8.11, below. |
| 8.1.4. | The range of complementary services: For the purpose of the paper manufacturing operations, the company maintains a network of complementary services for the operations of group companies at the company site in Hadera. These services are provided through Hadera Paper Infrastructures. For details, see section 3.1, above. |
| 8.1.5. | Paper and board waste collection network - The collection activity of raw materials for paper production (paper and board waste) is carried out by Amnir. Amnir's operations primarily include: paper and board collection, information security (shredding services at customer premises or at Amnir premises), plastic recycling and production of paper products, that is not material for the sector. Since the supply of such raw materials is vital for the production continuity of paper, Amnir’s operations in collecting such waste constitute a crucial step in the packaging paper production process. |
| 8.1.6. | Amnir collects paper waste from various sources around Israel, and as of the report date it processes (sorting and compressing of paper waste) at its plants approximately 270,000 tons of paper waste annually (wood-free paper, wood-based paper and board). Approximately 78% of the paper waste handled by Amnir is used for in-house production of packaging paper by Hadera Paper Packaging, and 22% of it is sold as raw material to producers of tissue paper (Hogla-Kimberly, Shaniv Paper Industry Ltd., Panda Paper Mills (1997) Ltd. and White Paper Jerusalem (2000) Ltd.). The paper waste handled by Amnir also includes paper waste that Amnir purchases from various elements. |
17
| 8.2. | Limitations, Legislation, Regulations and Special Constraints applicable to the packaging paper and recycling operating sector |
| 8.2.1. | Due to the nature of the sector of operations, it is subject to a range of regulatory restrictions concerning environmental protection. For further details see section 8.22, below. |
| 8.2.2. | This sector of operations is subject to the directives of the Packaging Law. For details regarding the Packaging Law, see section 8.23.2, below. |
| 8.2.3. | In December 1988, the Company was declared a monopoly in the production and marketing of paper in rolls and sheets - by the Israel Antitrust Authority, by its authority pursuant to the Antitrust Act, 1988 (hereinafter: "the Antitrust Act"). In July 1998 this declaration was partially rescinded with regard to fine paper in rolls and sheets. However, in the area of packaging paper in rolls and sheets, the company still declared a monopoly. For restrictions applicable to the Company pursuant to the Antitrust Act, see section 8.23.8, below. In February 2010, the company submitted a request to the Antitrust Authority, to rescind its monopoly status in the area of packaging paper in rolls and sheets, as mentioned above, since the company estimates that it is not actually a monopoly in this area. The response of the Antitrust Authority is yet to be received. |
| 8.3. | Changes to volume of operations in the packaging paper and recycling sector and its profitability |
| 8.3.1. | The global paper industry is a cyclical one, reflected in more highly profitable years which lead to investments in the paper industry and expanded production capacity. Therefore, in subsequent years there is excess supply, which causes a significant decline in profitability for several years, until supply and demand are once again balanced. As a result, and since this is a capital-intensive industry, the global paper industry typically exports its surplus production at relatively low prices at “cost plus” (i.e. covering the variable cost and a certain contribution toward fixed costs). |
| 8.3.2. | Based on internal Company estimates, consumption of packaging paper in Israel (excluding tissue) averaged approximately 950 million tons per year in recent years. |
| 8.3.3. | The company estimates, that the packaging paper market in Israel, recorded growth of approximately 3% in 2010, after it decreased by approximately 10% in 2008 and by an additional 6% in 2009. |
| 8.3.4. | The volume of paper recycling in 2010 amounted to 390,000 tons (including waste by corrugators). This constitutes an increase of approximately 14% in recycling in Israel since 2007. |
18
| 8.3.5. | The paper recycling rate, out of total paper consumption in Israel in 2010, was approximately 40% (as compared with a paper recycling rate of approximately 37% in 2009). Based on the above data, there currently exists - following the operation of Machine 8 - potential for growth in the volume of production of paper in Israel, at the expense of paper imports. Moreover, given the low rate of recycling in Israel (by comparison with the existing rates in Europe), there exists potential for continued growth in the volume of paper recycling. Note that based on data from the Confederation of European Paper Industries (CEPI), the average annual rate of paper recycling in recent years out of total paper consumption in Western Europe was 57% (as compared with 40% in Israel). |
| 8.4. | Developments in the packaging paper and recycling sector and changes to its customer profile |
| 8.4.1. | In recent years, the trend among customers has been toward the use of paper made from recycled fiber and away from using paper made of virgin fiber (originating from imports) - in order to reduce their production costs. The move to recycled paper was made possible by the technology change which allowed recycled paper to be used in the production of paper with strength qualities similar to pulp-based paper. Furthermore, in recent years awareness of environmental protection issues has grown, which may assist in the growth in the paper recycling rate. For further details with regard to developments in the field of paper from recycled fibers, see section 8.11, below. |
| 8.4.2. | There was a rise in prices in global paper markets in 2010, after a fall in prices during 2008 and during the first half of 2009. This fall in prices was the result of global surplus supply of packaging and packaging paper because of the effects of the economic crisis on the packaging and packaging paper industry, as a result of the reduction of global commerce. Following changes in global prices, recycled paper prices in Israel rose during 2010. In light of the improvement in the global situation which occurred during 2010, and the emergence out of the deep recession world markets had been in, world commerce took a turn and there was a rise in demand for merchandise, and as a result, a growth in demand for packaging and packaging paper. In the Company’s estimate, this trend of high demand for packaging paper will continue into 2011 as well. Information regarding the continuing trend of elevated demand for packaging paper constitutes forward-looking information, as defined by the Securities Act and merely consists of forecasts and estimates by the Company which are not certain to materialize and are based on information available to the Company as of the report date. The aforementioned Company forecasts and estimates may not materialize, in whole or in part, or may differ from current forecasts and estimates, due to multiple factors, including changes in demand in markets in which the Company operates, global supply and cost of paper products, developments and changes to regulation of the operating sector and/or materialization of any of the risk factors set forth in sections 8.26 and 23, below. |
| 8.4.3. | In recent years, the trend of market transition to thinner packaging paper that is reinforced with starch of higher quality and purity levels continues. This paper was developed overseas and is produced by modern machines, that were built in recent years. The imported paper competes with the company’s products. This trend necessitated a change in the range of paper produced by the Company, in order to allow it to face competition in this operating sector. |
19
| 8.4.4. | As part of the solutions for this challenge, the Company's Board of Directors approved, on November 19, 2006 and on October 15, 2007, the installation of a new packaging paper production system, known as "Machine 8" (hereinafter: "the new machine" or "Machine 8"). Machine 8 would enable the Company to meet growing demand in the local market, at a more competitive cost to the Company and with a higher paper quality vs. competing imports. |
| 8.4.5. | The setup cost for the entire system, which was approved by the Board of Directors, including additional investment in paper waste collection (to be used as raw material) amounts to NIS 700 million. The new machine was activated in January 2010. The running in process of the machine was successfully completed on May 31, 2010. |
| 8.4.6. | Even during 2010 and even thereafter, the improvement in the learning curve operating the machine is expected to continue, to the effect that an additional movement is expected in the output of the new machine and in the manufacturing costs (including items such as: lost fibers, energy costs, water, sewage etc.). The company estimates that the new machine will ultimately have an output capacity of approximately 230,000 tons per annum. |
| 8.4.7. | Moreover, upon completion of the learning process of the new machine, that is expected to take place in 2011, the active output capacity of the company in packaging paper is expected to grow from approximately 160,000 tons per annum before the construction of the machine, to approximately 320,000 tons per annum (as compared with 270,000 tons during 2010, with the partial operation of Machine 8). Information concerning the expected operation rate of the new machine, advantages of the new machine and increase in expected production capacity of the Company constitutes forward-looking information as defined in the Securities Act and merely consists of forecasts and estimates by the Company which are not certain to materialize and are based on information available to the Company as of the report date. The aforementioned Company forecasts and estimates may not materialize, in whole or in part, or may differ from current forecasts and estimates, due to multiple factors, including business opportunities available to the Company, changes in demand in markets in which the Company operates, global supply and cost of paper products, developments and changes to regulation of the operating sector, technical malfunctions and/or materialization of any of the risk factors set forth in sections 8.26 and 23, below. |
20
| 8.5. | Critical success factors in the packaging paper and recycling sector of operations and changes therein Several critical success factors may be indicated for Company operations in the packaging paper and recycling sector, which impact its operations: |
| 8.5.1. | Condition of Israel's Economy - Packaging paper is intended, as mentioned, primarily for the corrugated board industry, for the manufacture of board containers used as product packaging. The corrugated board industry serves the following sectors: Industry, agriculture and the food and beverage industry. As a result, extensive current economic activity has a positive material impact on the demand for packaging paper and on the volume of associated paper and board waste collection (that serves as raw material for the manufacture of packaging paper). On the other hand, an economic crisis or a slowdown in economic activity will possess an adverse impact on the aforesaid. |
| 8.5.2. | Financing and capital raising capabilities - Machines used in paper production are very costly, in terms of both acquisition and maintenance cost. Consequently, financing capabilities and the ability to raise funds, constitute an advantage in the sector of operations. |
| 8.5.3. | Local producer - In this operating sector, a local producer enjoys an advantage over imports, as the former is able to ensure constant supply of the product, at a relatively short lead time and at the size and quality required by customers, thereby saving them the need to maintain large inventories. The Company is the only packaging paper producer in Israel, and therefore enjoys an advantage in this operating sector. |
| 8.5.4. | Product quality and customer service - High product quality, availability and quality customer service are important success factors in this operating sector. A high level of quality and service are contributing to preserving the existing customers. |
| 8.5.5. | Packaging Law - In January 2011 the Packaging Law was passed by the Knesset, regulating, among other things, separation and collection of packaging waste. The Company is studying the impact of the law and the regulations enacted by power of the law in the matter of separation at source, removal and collection of waste on the Company’s operations. For details regarding the Packaging Law, see section 8.23.2, below. |
| 8.5.6. | Landfill levy - Starting in July 2007, pursuant to the Cleanliness Law as set forth in section 8.23.3, below, a landfill levy is charged to waste sent for landfilling, ranging from NIS 10 per ton in 2007, up to NIS 50 per ton in 2011 and thereafter. In January 2011, regulations were enacted prescribing that the landfilling fee will continue to rise for a period. The company estimates that the enforcement of the said landfill levy may cause various entities to prefer transferring their waste for recycling over landfilling, in order to avoid the said landfilling levy. This may result in growth in the volume of waste collected for recycling, thereby lowering the company's collection costs. The information regarding the implications of the landfilling levy is considered forward looking information as defined in the Securities Law, and constitutes forecasts and assessments on the part of the company, the realization of which is not certain and based on information existing in the company as of the date of the report. Company forecasts and estimates may not materialize, in whole or in part. Moreover, the actual results may differ from the current estimates and forecasts due to various factors, including regulatory developments and changes in the sector of operations and/or the realization of any the risk factors outlined in Sections 8.26 and 23, below. |
21
| 8.6. | Changes to suppliers and raw materials for the packaging paper and recycling operating sector |
| 8.6.1. | The increase in paper production capacity due to operation of Machine 8, as set forth in section 8.4, below, requires doubling, over the next few years, of the paper waste collection volume to be used as raw material in production of packaging paper. Amnir started as early as 2007 to increase the paper waste collection volume, in preparation for the construction of Machine 8. Amnir continued this activity in 2010 as well, and plans to continue and gradually expand the quantity of paper waste, according to well-detailed plans. The information regarding the increase in the quantity of paper waste collected is considered forward looking information as defined in the Securities Law, and constitutes only forecasts and assessments on the part of the company, the realization of which is not certain and based on information existing in the company as of the date of the report. Company forecasts and estimates may not materialize, in whole or in part. Furthermore, actual results may differ from current forecasts and estimates, due to multiple factors, including business opportunities available to the Company, changes in demand in markets in which the Company operates, supply and cost of paper products globally, developments and changes to regulation of the operating sector and/or materialization of any of the risk factors set forth in sections 8.26 and 23, below. |
| 8.6.2. | For the aforementioned preparations, Amnir took, inter alia, the following steps: Intensifying collection operations with existing customers, establishment of a greater number of municipal paper collection points and development of new collection sources; adapting Amnir's organizational structure and re-organization in all operating areas, including marketing, logistics, facilities, maintenance, purchasing etc.; establishment of an alternative site for Amnir's facility to receive and process the necessary additional volume; accumulation of paper waste inventory pending operation of the new machine; cooperation with local authorities on paper waste collection (including cooperation on paper waste collection from apartment buildings); dedicated collection from private customers, inter alia, by means of installation of collection containers; removal of cardboard from streets; and marketing projects to increase awareness of waste recycling. |
| 8.6.3. | The prices of paper waste throughout the world, which fell significantly at the end of 2008 and during the beginning of 2009 in light of a reduction in demand and the economic crisis, began to increase in Israel and throughout the world during 2009, as a result of high demand for newsprint and board waste throughout the world (especially in Asia). This trend remained constant throughout 2010. |
22
| 8.6.4. | Under the Cleanliness Law, starting in July 2007 there is a fee for landfilling waste. In the matter of the impact of the Cleanliness Law on the raw materials set-up in the sector of operations, see section 8.23.3 below. |
| 8.6.5. | Furthermore, in January 2011, the Packaging Law was passed by the Knesset, regulating, among other things, separation and collection of packaging waste. The Company is studying the impact of the law and the regulations enacted by power of the law in the matter of separation at source, removal and collection of waste on the Company’s operations. For details regarding the Packaging Law, see section 8.23.2, below. Information concerning the increase in the output capacity of the company and the impact of the Packaging Law and Cleanliness Law on the ability of the company to obtain the required raw materials for its operations, constitute forward-looking information as defined in the Securities Act and merely consist of forecasts and estimates by the Company which are not certain to materialize and are based on information available to the Company as of the report date. Company forecasts and estimates may not materialize, in whole or in part. Furthermore, actual results may differ from current forecasts and estimates, due to multiple factors, including business opportunities available to the Company, changes in markets in which the Company operates, global demand, supply and cost of paper products, developments and changes to regulation of the operating sector and/or materialization of any of the risk factors set forth in sections 8.26 and 23, below. |
| 8.7. | Major barriers to entry and exit in the packaging paper and recycling sector and changes therein There are several barriers to entry of any company to the field of paper production: |
| 8.7.1. | Initial capital - The paper industry is, by nature, capital intensive with heavy investment required in infrastructure and equipment (paper machinery, paper waste processing systems and associated infrastructure); entry into this operating sector requires a significant initial capital. Moreover, even after conducting the initial investments for establishing the necessary infrastructure for entering the sector, this area of operations is characterized by significant investments in ongoing equipment maintenance and in the energy systems. |
| 8.7.2. | Skilled staff - Manufacturing of products in this sector requires professional, skilled staff. A company starting operations in this operating segment would be required to recruit appropriate staff, which may prove to be a challenge to any company intending to operate in this segment. |
| 8.7.3. | Long penetration time - Penetrating into this operating sector requires a long time, mainly due to significant investments in installation of required equipment, staff training and the importance of reputation in this sector. |
| 8.7.4. | Local producer - In this operating sector, a local producer enjoys a significant advantage over imports, as the former is able to ensure constant supply of the product, at a relatively short lead time and at the size and quality required by customers, thereby saving them the need to maintain large inventories. |
23
| 8.7.5. | Few customers - This operating sector typically has a limited number of customers. This fact, along with the competitive environment of this operating sector, makes it difficult for new companies to penetrate the sector, because customers are hard to recruit as they often have long-term relationships with paper producers and/or paper importers. |
| 8.7.6. | The Company believes that there are no material exit barriers from this segment, except for the following: Immediate discontinuation of operations would require arrangements to be made with customers concerning conclusion of product inventory delivery as well as arrangement of payments to suppliers. Furthermore, with regard to the payment of fixed expenses, the Company would be required to make appropriate arrangements, since some of these fixed expenses relating to infrastructure services at the Company's site in Hadera cannot be immediately terminated. |
| 8.7.7. | Note that the paper waste collection area has no material barriers to entry, since no material capital investment or special licenses are required, and the time to penetrate the market is short. Furthermore, small players can operate in this sector. |
| 8.8. | Structure of competition in the packaging paper and recycling operating sector and changes thereto |
| 8.8.1. | The Company, via its subsidiary Hadera Paper Packaging, is the sole producer of packaging paper in Israel, and competes with self-imports by its customers. In the field of paper waste collection, competition is primarily from two companies - KMM Recycling Facilities Ltd. and Tal-El Collection and Recycling Ltd.. In addition, there are small collectors of paper waste. |
| 8.8.2. | For additional details regarding the competition in the sector, see Section 8.15, below. |
| 8.9. | Products and services in the packaging paper and recycling operating sector The principal products and services in the area of operations are: |
| 8.9.1. | Packaging paper - The Company's operations in this operating segment involve the production and sale of packaging paper from recycled fiber (i.e. from paper waste collected for recycling). This paper is used as raw material for production of cardboard packaging by the corrugated board industry. As regards new products, see Section 8.11, below. For details regarding the manufacture of packaging paper by the company, see Section 3.1, above. |
| 8.9.2. | Paper waste collection and recycling - Through its Amnir subsidiary, the Company deals in the provision of paper waste collection and recycling services, to serve as raw materials and the manufacture of packaging paper. As of the date of the report, approximately 78% of the quantity of waste sold by Amnir serves for the internal manufacture of packaging paper by Hadera Paper Packaging, while the remaining waste sold by Amnir, accounting for approximately 22% of the quantity of the waste, as at the date of the report, is sold as raw material for manufacturers of tissue paper (Hogla Kimberly, Shaniv, Panda and Jerusalem Paper). In addition to paper waste collection, Amnir also purchases paper waste from various entities as needed. Amnir sorts and compresses the paper waste it collects at its facilities, as described in section 8.1.6, above. Amnir also provides information security services (shredding services), with the shredded waste also being used as raw material for its operations. Note that, to the best of the Company's knowledge and based on its internal estimates, Amnir has a 61% share of the paper waste collection market in Israel (excluding waste purchased from other entities, as set forth in section 8.15.6, below). |
24
| 8.9.3. | Material changes expected in the corporation's share and product mix: |
| 8.9.3.1. | In January 2010, Machine 8 entered into operation, having completed its running-in period on May 31, 2010, which service to increase the manufacturing capacity of the company and will consequently allow the company to increase its share in the market for packaging paper from recycled fibers in Israel, while also expanding its export operations. For additional details regarding the new machine, see Section 8.4, above. |
| 8.9.3.2. | In January 2011, the Israeli Knesset passed the Packaging Law, whose impact on the company operations, including the demand for the services provided by the company in the paper waste collection sector, is currently being examined by the company. For further details see Section 8.23.2, below. |
| 8.10. | Distribution of revenues and profitability of products and services in the packaging paper and recycling operating sector Most of the revenues in this sector of operations originate from the sale of packaging paper. Moreover, the sector also has revenues from the sale of paper waste to others. In 2008, the revenues of the sector from the sale of paper waste to others represent approximately 10% of total company revenues, whereas during the years 2009 and 2010, this percentage decreased and fell below 10%. |
| 8.11. | New Products |
| 8.11.1. | In the course of the last two years, the Company has started to quickly develop paper types, based on 100% recycled fibers, whose high quality will render it possible to replace packaging paper based on pulp, in the corrugated board industry in Israel and overseas (hereinafter: "The New Products"). The objective of the technological and operational development process of the new products is to continue and expand the volume of the potential market for recycled packaging paper. The development of the new paper types is based on fiber characterization, the development and implementation of various chemical additives and the use of advanced manufacturing technologies, both in the existing manufacturing lines and in the new production line. In 2010, the company recorded initial significant sales of the new products. The company estimates that the sales of the new products will grow even further in 2011. The cost of the new products is competitive in relation to the cost of pulp-based paper that is imported to Israel, while allowing an improvement in the profitability of the sector. The development of the products is continuing in an ongoing manner, while focusing on an additional improvement of the strength and resistance to humidity and refrigeration of the paper produced from recycled materials, to the extent that they will be able to replace a more significant share of the imported virgin packaging paper market, while meeting the required quality and expanding the market share of the company, alongside the sales of the company's other products. The development costs are immaterial to the company. |
25
Information regarding the expected sales and the improved profitability as a result of the launch of the new products constitutes forward-looking information, as defined by the Securities Act and merely consists of forecasts and estimates by the Company which are not certain to materialize and are based on information available to the Company as of the report date. The aforementioned Company forecasts and estimates may not materialize, in whole or in part, or may differ from current forecasts and estimates, due to multiple factors, including problems in the continued development, business opportunities available to the Company, changes in demand in markets wherein the Company operates, global supply and cost of paper products and/or materialization of any of the risk factors set forth in Sections 8.26 and 23, below.
| 8.12. | Customers of the packaging paper and recycling operating sector |
| 8.12.1. | Packaging paper |
| 8.12.1.1. | As of the report date, the Company is dependent on four material customers, who produce corrugated board and cardboard packaging (corrugators), including Carmel, a subsidiary of the Company (hereinafter jointly in this section: "The Customers"). Company sales to Carmel in 2010 and 2009 accounted for 7% and 8% of total Company sales, respectively. Company sales to each of the other three material customers in 2010 and 2009 accounted for: (a) 4% and 3% of total company sales, respectively; (b) 3% and 3% of total company sales, respectively; (c) 4% and 1% of total company sales, respectively. The Company has no long-term agreements with the aforementioned customers. To the best of the Company's knowledge, the same applies to agreements between these customers and the Company's competitors. Contracting with each customer refers to an annual volume of packaging paper to be delivered to the customer, with the price usually being set in advance every quarter. |
| 8.12.1.2. | Due to the industry structure (one local producer and a limited number of customers), the sector is dependent on each of the aforementioned customers, and termination of the contract with any one of them may have a material adverse effect on the Company results. The aforementioned customers are long-standing customers of the Group, and have been in business with the Company for many years; in actual fact, the Group successfully maintains contracts with the customers over years by ensuring current delivery and service with a short lead time, which allows it to enjoy the benefit of a local supplier. During the years 2008 and 2009 a decrease was recorded in sales to local customers on account of importing at dumping prices, due to the global economic crisis and due to the increased exports operations of the company and the establishment of overseas markets, at the expense of the domestic market, as part of preparations for greater production as a result of the operation of Machine 8. With the operation of Machine 8 and the initial emergence from the global crisis, the sales to the domestic market already started to increase in 2010 and amounted to 129,000 tons in 2010, as compared with 93,000 tons in 2009. The company estimates that the sales of the operating sector to the domestic market are expected to rise even further in 2011. |
26
| 8.12.1.3. | In addition, Hadera Paper Packaging exports packaging paper to various customers overseas (mostly in Turkey, Italy, Greece and Egypt). In the years 2010 and 2009, the volume of revenues from the sale of packaging paper to overseas customers amounted to NIS 160 million (NIS 197 million including sales during the running-in period) and approximately NIS 57 million and represented a percentage of approximately 15% and 6% of the sales revenues during those years, respectively. Hadera Paper Packaging intends to increase its sales to export markets in 2011 as well. For further details see section 8.25.4, below. |
| Said information concerning the sales to the domestic market and the intentions of Hadera Paper Packaging to increase its domestic and export sales is considered forward looking information as defined in the Securities Law, and constitutes forecasts and assessments on the part of the Company, the realization of which is not certain and based on information existing in the company as of the date of the report. These forecasts and estimates by the Company may not materialize, in whole or in part, or may materialize in a manner significantly different than that expected. The principal factors that may affect this include changes in demand in the markets wherein the company operates, changes in demand and supply of paper products worldwide, prices of paper products globally and/or the materialization of any of the risk factors outlined in sections 8.26 and 23, below. |
| 8.12.2. | Paper waste |
| 8.12.2.1. | Approximately 78% of the paper waste sold by Amnir is used for in-house production of packaging paper by Hadera Paper Packaging, while 22% of the paper waste sold by Amnir is sold as raw material to external factors (primarily the four producers of tissue paper in Israel - Hogla-Kimberly, Shaniv Paper Industry Ltd., Panda Paper Mills (1997) Ltd. and White Paper Jerusalem (2000) Ltd.). Amnir has no dependence on any individual customer, nor has it any long-term agreements with said customers. Supply contracts are usually made for one year, while defining the quantity and prices according to which the engagement is made. Most of the customers are long-standing customers of the Group. |
27
| 8.12.3. | Customer attributes |
| Below is a distribution of major packaging paper sales by customer attributes (excluding sales that were capitalized): |
| Revenues In NIS Millions | 2010 | 2009 | ||||||
| Domestic clients | 192 | 145 | ||||||
| Export customers | 160 | 57 | ||||||
| 8.13. | Marketing and distribution in the packaging paper and recycling sector |
| 8.13.1. | Marketing and distribution of products in the local market are conducted directly by company employees opposite the customers. Marketing and distribution to export markets are conducted through local agents or through international marketing and sales companies that purchase the paper from Hadera Paper Packaging and sell it to their own customers overseas. Despite the fact that in certain regions to which the merchandise is exported there exists a single agent for the region, the company estimates that in the event that such an agent were to discontinue its operations vis-à-vis the company, the impact to the company would be purely temporary, while incurring no additional significant cost as a result of the need to replace such an agent. The company therefore estimates that it has no dependence upon any of the agents. |
| 8.13.2. | Shipping to customers is made mostly via external shipping companies. Marine shipping companies are engaged for exports. The Company has no exclusive agreements with any of the aforementioned shipping companies. The Company also has no dependency on any of these shipping companies. |
| 8.14. | Order backlog in the packaging paper and recycling sector |
| 8.14.1. | Product delivery volumes are based on an overall annual forecast, determined and coordinated between the Company and its customers. Current supply is converted into orders, based on a few days in advance or even less, so the Company has no order backlog in this sector of operations. In export sales, a monthly quota is determined for the customer and is usually determined up to two months in advance. The packaging paper manufacturing plant operates according to a flexible production plan which allows delivery of a customer order within 24-48 hours, at the quality specified in the specifications. |
| 8.15. | Competition in the packaging paper and recycling sector |
| 8.15.1. | As mentioned above, Hadera Paper Packaging is the sole producer in Israel of packaging paper, hence the competition in the packaging paper business is against imports, made directly by customers. True to the date of the report, there exist no import limitations. Imports into Israel include all paper types produced in Israel at different paper qualities, depending on the supplier’s production machinery. |
| 8.15.2. | To the best of the Company's knowledge, its major competitors in Israel are the following foreign vendors: Varel - German and Modern Carton - Turkey. |
28
| 8.15.3. | The Company estimates - based on its internal estimates - that its market share in sales of packaging paper used as raw material for the corrugating industry in Israel, is equal to 37% in 2010 (data representing annual average). |
| 8.15.4. | As mentioned above, the Group competes in this operating sector by providing high-quality products, as well as by ensuring a high level of on-going delivery and service with a short lead time in relation to the other vendors, which affords it the benefit of local supplier. |
| 8.15.5. | On January 15, 2009, the Company filed the complaint with the Supervisor of Anti-Dumping Charges at the Ministry of Industry, Trade and Employment (hereinafter in this section: "The Supervisor"), regarding dumping imports of packaging paper from several European nations to Israel. The Company claimed that in recent years it has faced importing of packaging paper at extremely low prices, suspected of being dumping prices, and after collecting the required information and identification of the sources of dumping, the Company filed the aforementioned complaint. On September 1, 2009, the Supervisor announced its findings that importing at dumping prices of recycled packaging paper products was allegedly taking place, while causing damage to the local production sector. The supervisor therefore decided to impose a temporary levy, for a period of six months, at a level equal to 52-67 euro per ton on the import of recycled packaging paper products from manufacturers in the European Union. In December 2009, the company announced that in hearing held in court regarding the petitions of five importers/producers that were appealing the decision of the Supervisor, it was agreed between the parties that the decision of the Supervisor would remain in place for the four months following December 3, 2009, while the guarantees that were deposited by the petitioners in October and November would be returned to them. This agreement received the validity of a court ruling and the temporary guarantee was in place until March 31, 2010. On January 21, 2010, the Supervisor informed the Dumping Committee of his recommendation to impose a dumping levy of €31-44 per ton, on most different producers from the European Union. On August 4, 2010, the Supervisor announced that the Advisory Committee regarding the levy and dumping had recommended that a levy be imposed for a limited period and the minister of trade employment and industry accepted its recommendation. However, following the objection of the Minister of Finance to approve the levy, no dumping levy was imposed on the import of recycled packaging products. |
| 8.15.6. | There are two major competitors in paper waste collection, which operate throughout Israel - KMM Recycling Plants Ltd. and Tal-El Collection and Recycling Ltd. In addition, there are many competitors with small market share who mainly operate in a limited geography. The Company estimates, based on its internal estimates, that Amnir's market share as of the report date in the collection of paper waste (excluding purchasing of waste from other collectors) out of total paper waste collected in Israel, is equal to 61%. |
| 8.16. | Seasonality |
In general, the demand in the marketing of board packaging products rises in the winter months, primarily between November and March of each year, due to demand arising from agricultural crops. The said seasonality in the demand for board packaging products does not possess a material impact on the area of operations that supplies this sector with packaging paper, due to the fact that the area of operations has thus far sold all of its output capacity. As for the other products of the packaging paper and recycling segment, there is no seasonal impact on demand. |
29
| 8.17. | Output capacity in the packaging paper and recycling sector |
| 8.17.1. | Packaging paper |
| 8.17.1.1. | The company's packaging paper manufacturing plant in Hadera houses three paper machines. Two machines operate at full capacity and possess an annual output capacity of approximately 320,000 tons together. It should be noted that on May 31, 2010, the running-in process of Machine 8 was completed, as mentioned in Section 8.4 above (although the machine continues to be in its output improvement stage and the overall output capacity stated above is based on the maximum output assumption, subsequent to the completion of the said process). One of the three machines (hereinafter: "The Additional Machine"), operates intermittently, according to market conditions and profitability, as examined by the sector from time to time, and possesses an output capacity of approximately 60,000 tons per annum. The machines (except for the additional machine as mentioned above) operate at nearly full capacity and their output capacity is therefore nearly entirely utilized. The paper machines operate 24 hours a day, in 3 shifts (except for planned maintenance stoppage). |
| Said information regarding the growth in the Company's anticipated output capacity is considered forward-looking information as defined in the Securities Law, and constitutes merely forecasts and assessments on the part of the Company, the realization of which is not certain and is based on information existing in the company as of the report date . The aforementioned Company forecasts and estimates may not materialize, in whole or in part, or may differ from current forecasts and estimates, due to multiple factors, including business opportunities available to the Company, changes in demand in markets in which the Company operates, global supply and cost of paper products, developments and changes to regulation of the operating sector and/or materialization of any of the risk factors set forth in sections 9.19 and 23, below. |
| 8.17.1.2. | Below are machine production data (in thousands of tons) for 2010 and 2009: |
Potential output capacity (As of report date) | 2010 | 2009 | ||||||||||
| Machine 1 | 60 | 10 | 52 | |||||||||
| Machine 2 | 90 | 91 | 90 | |||||||||
| Machine 8 | 230 | 170** | - | |||||||||
| Total | 380* | 271 | 142 | |||||||||
| * | As mentioned above, Machine 1 operates intermittently and the anticipated actual output without Machine 1 amounts to 320,000 tons. |
| ** | The running-in of the machine ended on May 31, 2010. |
30
| 8.17.2. | Paper waste collection and recycling |
| Below are data with regard to sorting and compressing output (in thousands of tons) of collected raw material, primarily paper and board waste, compared to potential output capacity in 2010 and 2009: |
| Actual output | ||||||||||||
Potential output capacity (As of report date) | 2010 | 2009 | ||||||||||
| Modi'in* | 290 | 149 | 140 | |||||||||
| Hadera | 130 | 107 | 95 | |||||||||
| Total | 420 | 256 | 235 | |||||||||
* In November 2010, the Amnir plant in Bney Brak was relocated to the logistics center in Modi'in.
| 8.18. | Fixed assets, real estate and facilities in the packaging paper and recycling operating sector |
| 8.18.1. | Packaging paper machines - The Hadera site has three packaging paper manufacturing machines - as mentioned above - two of which are in operation at close to full capacity, of approximately 320,000 tons annually, while one operates intermittently according to market conditions. For additional details regarding Machine 8, that has completed its running-in process in 2010, see Section 8.4, above. |
| 8.18.2. | Energy systems - The company site in Hadera includes an energy center operated by Hadera Paper Infrastructures. The energy network provides steam that serves for the paper manufacturing process and provides approximately one half of the electrical consumption of the paper machines operated on-site. The energy center includes boilers for steam production, a steam turbine for electricity generation (providing on average of 13 megawatt-hour, with maximum generation capacity of 18 megawatt-hour), as well as cooling water systems, compressed air systems, water distilling systems, a cold water system and a control room for control of the energy production process. |
| 8.18.3. | For details of the Company facility in Hadera, see section 12.1, below. |
| 8.18.4. | Paper waste collection network - As of the report date, for collection and processing of raw material collected (paper and board waste), Amnir operates a fleet of 61 trucks of different types; 37 additional trucks are operated by sub-contractors. |
| 8.18.5. | Paper waste recycling - The company operates two plants where paper waste recycling takes place: |
| 8.18.5.1. | Amnir facility at Hadera, including: Plant for sorting, cleaning and compacting paper and board waste, where the principal fixed assets are: Two presses, paper sorting system and paper and magnetic media shredding system, as well as a paper salvage plant including guillotines and printing, rolling and cutting machines. The facility includes a storage area for paper and board waste. The area of the facility covers 40,000 square meters. For further details regarding the Company facility in Hadera, see section 13.1, below. |
31
| 8.18.5.2. | Amnir plant at the new logistic center (hereinafter: "Logistic Center") in Modi'in, that has replaced the plant in Bney Brak since November and where is located: Plant for sorting, cleaning and compacting paper and board waste, where the principal fixed assets include three presses and a sorting system. Moreover, a large and innovative shredding center is planned to be constructed at the logistic center. the area within the logistic center that is designated for the Amnir operations covers some 40,000 m² and includes both open areas and buildings. The area of the plant in Bney Brak was sold to an unrelated third party and will be vacated by at Amnir in March 2011. For details regarding the Logistic Center, see section 12.6, below. |
| 8.19. | Research and development |
| 8.19.1. | During 2010 the Company purchased some 18.37% of the shares of Bondex (16.84% fully diluted), in consideration of $450 thousand. Bondex deals in research and development of bonder, a biological material (to be grown in tobacco leaves) designated for providing improved features in strength and water resistance of paper, still in the process of development. Development is in the initial stages, and it would seem that significant development expenses are not anticipated over the coming year. Note that Bondex’s operations are not material to the overall group’s operations at this stage. |
| 8.19.2. | During February 2011, a foreign investor purchased shares in Bondex. Following this investment, the Company’s holdings in Bondex total 16.33%, and fully diluted (assuming realization of the options granted to the investor) 13.70%. |
| 8.20. | Raw materials and suppliers in the packaging paper and recycling sector |
8.20.1. | Paper waste constitutes the main raw material for the packaging paper and recycling operating sector. The paper waste collection operation is deployed nationwide, with the paper waste being collected by Amnir or purchased from thousands of suppliers throughout the country by Amnir and transferred on a regular basis to processing plants at the logistics center in Modi'in and in Hadera. An additional part of the waste that is consumed by the paper machines is the waste that is purchased from corrugated board packaging producers (waste created in the process of creating the packages by the corrugators' customers and sold to the company). |
| 8.20.2. | In 2010 and 2009, Amnir collected paper waste (wood-free paper, wood-based paper and board) amounting to 212,000 tons and 185,000 tons, respectively. In recent years, waste purchased by Amnir from other waste suppliers amounted to 20%-25% of total waste processed by Amnir. Amnir is not dependent upon any specific supplier. |
| 8.20.3. | During January 2011 the Packaging Law was passed by the Knesset, formalizing, among other things, separation and collection of packaging waste. The Company is still studying the impacts of the law and of the arrangements that are to be regulated by power thereof on the Company in the matter of separation at source and removal and collection of waste, and, among other things, the impact on the set-up of the Company’s collection of paper and board, availability of raw materials needed for operations and on the costs of raw materials. For more details regarding the Packaging Law, see section 8.23.2, below. |
32
| 8.20.4. | In the paper and recycling sector there are purchasing contracts with suppliers for the purchase of auxiliary materials such as chemicals, adhesives, felt, screens, etc. |
| 8.20.5. | Starch – The Company purchases starch from Galam Ltd. (hereinafter: Galam"), used by the company in paper production. The sums purchased from Galam have increased significantly in 2010, following the expansion of operations due to the introduction of Machine 8. Galam is the only producer of starch in Israel, although there exist competing starch exports, at competitive prices. |
| 8.20.6. | Since July 2005, the company has been acquiring natural gas from Yam Tethys Partnership (the energy generation network described above is operated using natural gas). True to the report date, there exist several suppliers of natural gas in Israel: Yam Tethys, EMG and an additional potential supplier. Total Company purchases from Yam Tethys Partnership for the purpose of this sector of operations in 2010 and 2009, amounted to NIS 30 million and NIS 25 million, respectively, that represented 15.5% and 13.8% of total purchases in the packaging paper and recycling sector from suppliers, respectively. For more details on the aforementioned agreement, see section 19.8, below. The company estimates that it is dependent upon Yam Tethys in the provision of natural gas, since the replacement of the supplier may incur significant additional costs. For details regarding negotiations with gas suppliers, as well as regarding the termination of the Yam Tethys agreement on June 30, 2011, see Section 19.8, below. For information on this matter, see also section 8.26.3.1, below. |
| 8.20.7. | The company has an agreement dated July 2007 with Gas Routes for a period of six years, for the transportation of natural gas to the company site in Hadera. The agreement also includes an extension option for an additional period of two years. The transportation agreement is worded as approved by the Natural Gas Authority for transportation consumers, and is published on the website of the Ministry of National Infrastructure, with commercial terms agreed individually by the parties. The proceeds, pursuant to the agreement, include payment of a non-recurring connection fee upon connection, based on actual cost of connection to the Company's facility, as well as monthly payments based on two components: (a) A fixed amount for the gas volume ordered by the Company; (b) based on the actual gas volume delivered to the facility. True to the date of this report, the company is dependent upon Gas Routes. For further details regarding the agreement, see section 19.9, below. |
| Company estimates concerning the cost of replacing the natural gas provider, regarding the company's dependence upon Gas Routes and regarding the potential impact of the Packaging Law on the company's raw materials system, constitute forward-looking information as defined in the Securities Act and merely consist of forecasts and estimates by the Company which are not certain to materialize and are based on information available to the Company as of the report date. Company forecasts and estimates may not materialize, in whole or in part. Furthermore, actual results may differ from current forecasts and estimates, due to multiple factors, including business opportunities available to the Company, changes in markets in which the Company operates, global demand, supply and cost of paper products, developments and changes to regulation of the operating sector and/or materialization of any of the risk factors set forth in sections 8.26 and 23, below. |
33
| 8.20.8. | It should be noted that in light of the transition to the use of natural gas, the company promoted the process opposite United Nations, within the framework of the Kyoto accord, whereby within the countries that have signed the accord, a company that has contributed to lowering greenhouse gases while making a global contribution could be rewarded economically for its efforts to prevent global warming, by way of exploiting greenhouse gas offsetting rights. These rights, when approved by a certified organ of the United Nations, are marketable in international markets between eligible companies and other companies that must improve due to their having deviated from the permitted quantities of greenhouse gas emissions. With this said transition to the use of natural gas, the company has received permission of the United Nations for rights as a result of the lowering of carbon emissions originating from the transition to natural gas. In this manner, the company recorded in 2010, revenues in the amount of NIS 1.8 million on account of the sale of greenhouse gas emissions for 2009, in accordance with an agreement signed by the company in February 2009 with TEP (Trading Emissions PLC), an investment company registered in the UK, specializing in the trade of carbon rights. The agreement enables TP to trade in company rights to carbon emissions from 2008 through to 2012. |
| 8.21. | Working Capital |
| 8.21.1. | Raw Material and Finished Goods Inventory Policy: The Company maintains operating inventory of raw materials and finished goods equivalent to consumption and delivery over 2-3 weeks. True to the report date , the company holds inventories of 7.5 weeks of wood-free paper waste. Over the last two years, in preparation for the initial operation of Machine 8, Amnir worked to accumulate raw material inventories (paper waste) beyond its current needs as set forth above. Close to the report date, Amnir has accumulated approximately 15,000 tons intended to be used by Machine 8 (as compared with approximately 100,000 tons at the end of 2009). These inventories are expected to serve for the manufacture of paper during 2011. In parallel, for the purpose of increasing inventories of paper waste as part of the regular activities, the company is also examining the possibility of importing paper waste. For further details on said estimates, see section 8.1.6, above. |
| 8.21.2. | Furthermore, the company maintains an inventory of maintenance materials to be used by production facilities, based on anticipated consumption levels and the need to maintain ongoing machine operations. |
| 8.21.3. | Goods return or replacement policy: Goods in this operating sector are sold as final sale to customers, and are returned in case of faulty product or due to mismatch between order and delivery. When a customer complains of a faulty or mismatching product, the complaint is reviewed and if correct, the goods are returned and the customer is credited. Based on past experience, the volume of returns is not material to total operation volume. |
34
| 8.21.4. | Average credit duration |
| 8.21.4.1. | Below are data regarding average volume of credit and duration for suppliers and customers in 2010 and 2009: |
| Average 2010 | Average 2009 | |||||||||||||||
Average volume of credit (NIS M) | Average credit days | Average volume of credit (NIS M) | Average credit days | |||||||||||||
| Accounts receivable (customers) | 154 | 99 | 103 | 98 | ||||||||||||
| Accounts Payable (Suppliers) | 138 | 102 | 72 | 105 | ||||||||||||
| 8.21.4.2. | The average days of inventory in this sector of operations in 2010, totaled 26 days. |
| 8.22. | Environmental considerations in the packaging paper and recycling sector |
| For details regarding environmental issues, see Section 17, below. |
| 8.23. | Restrictions on and Supervision of Corporate Operations in the Packaging Paper and Recycling Sector |
| 8.23.1. | The Recycling Act: |
| 8.23.1.1. | The Collection and Removal of Waste for Recycling Law, 5753 – 1993 and the Regulations for Collection of Waste for Recycling (Duty to Remove Waste for Recycling) 5758 – 1998 (hereinafter in this section: :"the Recycling Laws") require local authorities and businesses to recycle waste at increasing rates, and allow the company to offer services and win tenders involving recycling operations. The absence of supporting enforcement of the Recycling Act is limiting the Company's ability to expand the collection of paper waste. Further to the passing of the Packaging Law in January 2011 as noted above, collection of packaging has been excluded from the Recycling Law. |
| 8.23.2. | Packaging Law |
| 8.23.2.1. | On January 19, 2011 the Formalization of Treatment of Packaging Law 5771 – 2011 was passed (hereinafter: "the Packaging Law), with the goal of regulating arrangements in the matter of treatment of packaging waste. The Packaging Law is based on the principle of manufacturer responsibility, under which the manufacturer or importer is responsible recycling the packaging for products manufactured or imported by it for sale in Israel, and to bear the cost involved in the collection and recycling of packaging waste. In order to perform said manufacturers’ and importers’ duties, manufacturers and importers must engage under a contract with a recognized body, which is a company whose sole objective is the performance of the duties of the manufacturers and importers it engages with, a body which has been recognized under the Packaging Law. |
35
| 8.23.2.2. | The Packaging Law establishes, inter alia, responsibility for recycling packaging waste, targets for recycling types of packaging waste, financial sanctions for failure to reach targets and instructions for the formalization of establishment of the recognized body and its operations. The Packaging Law also states that for the purpose of calculating attainment of targets for recycling types of packaging wastes, recovery of packaging( waste will be recognized up to the rate of 10% of the total weight of the disposable packages of all products the manufacturer or importer has sold during that year, and export of packaging waste up to the rate of 20% of the target for recycling according to type of material, for each type of material. |
| 8.23.2.3. | According to the Packaging Law, a local authority, and anyone required by law to collect and remove waste from properties owned or possessed by such, save a duty by power of a bylaw (hereinafter: “responsible for the removal of waste”) must prescribe an arrangement in the matter of separation of packaging waste from other waste within their areas, and an arrangement in the matter of collection and removal of packaging waste so separated. The Packaging Law also stipulates that notwithstanding the aforesaid, any business owner may engage (under direct engagement) with a recognized body in the matter of collection and removal of all or any packaging waste created at the place of business, respective to the terms of recognition of such recognized body. |
| 8.23.2.4. | The Packaging Law entered into effect on March 1, 2011, and certain provisions regarding the start of collection by a recognized body will enter into effect on July 1, 2011. |
| 8.23.2.5. | In light of the provisions of the Packaging Law, an adjustment in the set-up of the Company’s paper collection activities will be necessary. The Company cannot at this point assess the impact of the law on its activities, and this depends, among other things, on arrangements to be set by power of the law regarding separation at source, and in the matter of collection and removal of waste, and on the method by which the recognized body established by power of the law operates. The Company is exploring its preparations for possible collection solutions. |
| 8.23.3. | The Cleanliness Law |
| 8.23.3.1. | Under the Maintaining Cleanliness Law 5744 - 1984 (hereinafter: "the Cleanliness Law") there is a fee for landfilling waste in the amount of NIS 50 per ton, from 2011 onwards. In January 2011, regulations were enacted prescribing that the landfilling fee will continue to rise for a period. Remainders left after waste is sorted (in other words, waste that has been sorted at a transfer station for treatment and sorting of waste for purposes of recycling) will be charged by a lower fee for landfilling, in the amount of 4 NIS per ton from 2011 onwards. The company estimates that the enforcement of the said landfill levy may cause various entities to prefer transferring their waste for recycling over landfilling, in order to avoid the said landfilling levy. This may result in growth in the volume of waste collected for recycling, thereby lowering the collection costs. |
36
| The company estimates regarding the impact of the cleanliness law on the growth in the collection of paper waste for recycling and lowering of waste collection costs is considered forward looking information as defined in the Securities Law, and constitutes forecasts and assessments on the part of the company, the realization of which is not certain and based on information existing in the company as of the report date . Company forecasts and estimates may not materialize, in whole or in part. Moreover, the actual results may differ from the current estimates and forecasts due to various factors, including regulatory developments and changes in the sector of operations and/or the realization of any the risk factors outlined in Sections 8.26 and 23, below. |
| 8.23.4. | Work Hours Act |
| 8.23.4.1. | The Company is subject to provisions of protective labor legislation, including the Work and Rest Hours Act, -1951 (hereinafter in this section: "the Work Hours Act"). The Work Hours Act regulates, inter alia, the number of permitted working hours and the weekly rest to which all employees in Israel are entitled. As of the report date, the Company is in full compliance with all provisions of the Work Hours Act and regulations based there upon, and has obtained the permits required for its operations. |
| 8.23.5. | Business Licenses |
| 8.23.5.1. | Hadera Paper's business license, dated November 14, 2001, is contingent, inter alia, on existence of systems for the collection and transportation of waste water and ground water, transfer of all industrial waste water to a waste water pre-treatment facility, installation and operation of backup pumps, maintenance of bio-mass inventory and maintenance of a malfunction log. The license is also contingent on filing reports with the Ministry of Environmental Protection. To the best of the company's knowledge, the company is complying with all the requirements and demands of the said license, except for meeting the conditions of wastewater discharge, as discussed in the hearing held for the company at the ministry of the environment. For additional details regarding this matter, see Section 17, below. |
37
| 8.23.6. | Legislation on Issues of Environmental Protection |
| 8.23.6.1. | The Company is required to act in accordance with the provisions of a permit order given by the Director of the Government Authority for Water and Sewerage, under section 20-11 to the Water Law 5719 – 1959. For further details see section 17 below. |
| 8.23.6.2. | The Company is required to act in accordance with a permit for poisons given by the Ministry for Protection of the Environment, under the Hazardous Materials Law 5753 -1993. For further details see section 17 below. |
| 8.23.7. | Natural Gas Sector Law |
Pursuant to provisions of the Natural Gas Sector Law (2002) (hereinafter: "the Gas Law"), the Natural Gas Authority was established in the Ministry of National Infrastructure, with the objective to supervise license terms and tariffs associated with the natural gas transportation, delivery and storage system. The Gas Law also stipulates certain preferences for buying "Made in Israel". Furthermore, in 2003 a Government Corporation - "Israel Natural Gas Routes Ltd." - (hereinafter: "Gas Routes") was established and charged with creation of natural gas transportation infrastructure in Israel. The Company is one of the first industrial facilities in Israel to connect to the natural gas system, and to convert to the use of natural gas. The Company is connected to the maritime route of the natural gas transportation system. For details regarding the Company's agreement with Gas Routes, see section 19.9, below. |
| 8.23.8. | Antitrust |
| 8.23.8.1. | In December 1988, Hadera Paper was declared a monopoly in the production and marketing of paper in rolls and sheets - by the Israel Antitrust Authority, by virtue of its authority pursuant to the Antitrust Act. In July 1998 this declaration was partially rescinded with regard to fine paper in rolls and sheets. The declaration has not been rescinded for packaging paper in rolls and sheets. Regarding the petition filed by the company in February 2010 for rescinding this declaration, see Section 8.2.3, above. Other than directives related to the Anti-Trust Law, the company received no special instructions from the Anti-Trust Commissioner, regarding its declaration as a monopoly. |
| 8.23.8.2. | The Antitrust Act stipulates, inter alia, that a monopoly holder shall not abuse his market position in such manner as might restrict business competition or impact the public, including by means of setting unfair prices; decrease or increase of scope of assets or services offered other than via fair competition; setting different contract terms for similar transactions which may give an unfair advantage to certain customers or suppliers over their competitors; setting terms for contracting with regard to the monopoly asset or service, which by their nature or pursuant to common trading terms do not apply to the subject of the contract. Furthermore, the Antitrust Act stipulates that should the Antitrust Supervisor deem that, due to existence of a monopoly or to behavior of the monopoly holder, business competition or the public are impacted - the Supervisor may issue instructions to the monopoly holder with regard to steps the latter must take to avoid such impact. Statutory means set forth in the Antitrust Act confer on the Supervisor, inter alia, the right to appeal to the court for an order to divide the monopoly into two or more business corporations. |
38
| 8.23.8.3. | True to the report date, the declaration of the Company to be a monopoly had no material impact on its operations, profitability or financial standing. The Company is unable to estimate the future impact of said declaration, including such case where the Company may be issued special instructions by the Supervisor with regard to its operations declared to be a monopoly, on Company operations, profitability or financial standing. |
| 8.23.9. | Work Safety |
| 8.23.9.1. | The Company is subject to legislation concerning work safety and health. The Work Safety Ordinance (New Version), 1970 and regulations based thereupon, regulate issues of employee health, safety and welfare. Furthermore, the Labor Supervision Organization Act, 1954 and regulations based there upon regulate issues of supervision of work safety, safety committees, appointment of safety supervisors, safety programs, providing information regarding risk and employee training. |
| 8.23.9.2. | The Company places an emphasis on the matter of safety at work in general, and of the employees in particular, by implementation of a proactive safety policy (intended to prevent the causes of accidents by full and current reporting, investigating cases of near-accidents, drawing conclusions therefrom, while implementing the necessary procedural and physical changes, in order to prevent the accidents themselves from happening, to the extent possible). As of the report date, the Company is compliant with all safety regulations set forth in this section. |
| 8.23.10. | Quality Control and Regulation |
| 8.23.10.1. | The company operates its major production facility at Hadera subject to the following standards: ISO 9001/2000 – Quality Management; ISO 14001 – Environmental Protection and Israeli Standard 18001 - Safety. Moreover, paper and board waste collected and processed by Amnir is produced subject to international standards and to the paper waste standard, which is updated every few years. In addition, Amnir is recognized as an authorized service provider to the Ministry of Defense. Furthermore, Company operations at its facility are subject to provisions of product-related standards, municipal laws (primarily business license) and globally accepted standards. |
| 8.23.11. | SOX |
| 8.23.11.1. | By virtue of being a company whose shares are publicly traded in the United States, the company is subject to "Sarbanes Oxley" (SOX) in its entirety, including Section 302 (proper disclosure and evaluation of controls in the organization), Section 404 (Management Assessment of Internal Controls) and Section 906 (Criminal responsibility for breach of this section). The main points of the law have to do with increasing reporting and disclosure, the authorities and duties of the Audit Committee, manager responsibilities, enforcement, sanctions and penalties and increasing the independence from external accountants. The controls instigated by the company for the implementation of the law are regularly inspected by the company's auditing team and by the external accountant. Since 2007, with the introduction of the directives of the said law in the United States, the company is complying with the demands of the law. |
39
| 8.23.11.2. | Note that on February 16, 2010 the Securities Authority responded positively to the Company’s request that its reporting in Israel regarding the effectiveness of internal control be performed using the SOX format, applicable to the Company by power of its registration for trading on the NYSE. The Authority granted permission conditional upon the Company’s undertaking to examine its compliance with the conditions described in the application to the Authority quarterly, including any changes in the laws in Israel and in the US, changes in the Company’s status and in the context of these laws, changes in the applicability of SOX and any change likely to impact disclosure provided by the Company. |
| 8.24. | Material agreements in the packaging paper and recycling sector |
| 8.24.1. | Agreement with Yam Tethys Group - An agreement was signed by the Company and partners of the Yam Tethys Group (Noble Energy Mediterranean Ltd., Delek Drilling Limited Partnership, Avner Oil Exploration Limited Partnership and Delek Investment and Assets Ltd.) For details regarding the engagement, see section 19.8, below. |
The company is dependent upon Yam Tethys, as detailed in Section 8.20.6, above. The company is conducting discussions with EMG and with the potential additional suppliers, regarding the purchase of natural gas, for its continuing operations, subsequent to the termination of the agreement with Yam Tethys, as well as for the power station whose establishment is being analyzed by the company. For complete details regarding the power generation station, see Section 21.8, below. Moreover, for additional details regarding the potential impact of the latest developments in Egypt, see Section 8.26.4.1, below. |
| 8.24.2. | Agreement with Israel Natural Gas Routes Ltd. - The company entered into an agreement with Gas Routes for the transportation of natural gas to the company site in Hadera. For complete details, see Section 19.9, below. |
| 8.24.3. | Agreements for purchase of major equipment for "Machine 8" - In conjunction with the set-up of a new packaging paper production system known as "Machine 8", as set forth in section 8.4, above, the Company has entered into agreements for the purchase of major equipment for the aforementioned production system and for building construction to serve for the said equipment. The said equipment was acquired from the leading companies in the world in the manufacture and sale of paper machines, with the central equipment for the manufacturing array being ordered from Italian company Voith, while additional complementary items were ordered from Finnish company METSO and Italian company SEEI. Most of the machine construction process ended on January 15, 2010, while the running in process of the machine ended on May 31, 2010. The machine is now operational and is on a learning curve, to improve output and manufacturing costs. |
40
| 8.25. | Anticipated development over the next year for the operating sector |
| 8.25.1. | As set forth in section 8.4, above, a new packaging paper production system, known as "Machine 8", was constructed over the past several years and will allow the Company to meet the demand on the domestic market, at a more competitive cost to the Company and with higher paper quality compared to competing imports. As mentioned above, true to the date of the report, Machine 8 is currently in the last stages of its learning curve for improving the output and reducing manufacturing costs. The operation of Machine 8 requires a significant increase, over the coming years, of collection volume of paper waste to serve as raw material for packaging paper production. Amnir is working to increase the volume of waste collection, inter alia, by intensifying collection activity from existing customers and the development of new collection sources, adaptation of its organizational structure, examining the possibility of importing waste from overseas, relocation to the new logistics center and inventory accumulation. |
| 8.25.2. | The Packaging Law entered into effect on March 1, 2011. The Company cannot at this point assess the impact of the law on its activities, and this depends, among other things, on arrangements to be set by power of the law regarding separation at source, and in the matter of collection and removal of waste, and on the method by which the recognized body established by power of the law operates. |
| 8.25.3. | In the course of the last two years, the sector has started to quickly develop paper types, based on 100% recycled fibers, whose high quality will render it possible to replace packaging paper based on pulp, in the corrugated board industry in Israel and overseas. The development process is gradual and is currently in advanced stages and is intended to expand the volume of the potential market for packaging paper and the gradual launch of products that started at the end of 2009. For additional details, refer to Section 8.11, above. |
| 8.25.4. | Upon the operation of the new manufacturing system, the significant expansion in the output capacity of recycled packaging paper will allow for the expansion of the sector's operations both in Israel and overseas. Together with the process of developing pulp-replacement packaging paper products on the basis of 100% recycled fibers, as mentioned above, this will enable the sector to expand the sale of such products, as a substitute for pulp-based packaging paper in international markets. The new products create an improved profit potential and have started to be sold at a significant price supplement per ton of exported paper, as compared with the selling prices of basic paper types. The company worked in 2009 and 2010 to develop export markets that would absorb surplus manufacturing that cannot be absorbed by the domestic market and has started marketing to several agents dealing in various types of packaging paper, in Europe and elsewhere. Pursuant to the operation of Machine 8, this activity is expected to bring about a gradual increase in exports by the company, alongside the diversification of the company's product and markets portfolio within the sector of operations. |
41
| Information concerning the new developments of the company, the continuing development of export markets by the company, the improved profitability potential and the preparations for increasing the quantity of raw materials, all constitute forward-looking information as defined in the Securities Act and merely consists of forecasts and estimates by the Company which are not certain to materialize and are based on information available to the Company as of the report date. The aforementioned Company forecasts and estimates may not materialize, in whole or in part, or may differ from current forecasts and estimates, due to multiple factors, including business opportunities available to the Company, changes in demand in markets in which the Company operates, global supply and cost of paper products, factors related to the completion of development and/or the materialization of any of the risk factors set forth in sections 8.26 and 23, below. |
| 8.26. | Risk factors in the packaging paper and recycling operating sector |
| 8.26.1. | For details of macro-economic risk factors, see section 23, below. |
| 8.26.2. | Sector-Specific Risk Factors |
| 8.26.2.1. | Regulation - Operations in the packaging paper and recycling sector are subject to regulation of various issues (for further information see section 8.23, above). Changes in regulation may impact companies operating in this operating sector, e.g. stricter environmental protection regulations and government decisions concerning the raising of minimum wages. |
8.26.2.2. | Competition - This operating sector is competitive, with competition against imported products (see Section 8.15, above). There is also competition in raw material collection. There are many collectors operating in Israel, of which two have significant market share, to the best of the Company's knowledge. |
| 8.26.2.3. | Raw materials - The anticipated increase in the capacity of the paper machines of the company, based on paper waste for recycled fiber, require an increase in the paper collection volumes to be used as raw material for production in the paper production sector, and location of more extensive collection sources. Consequently, the company needs to significantly increase the quantities of paper waste, and is even examining the possibility of importing paper waste. A failure to locate a sufficient quantity of paper waste for manufacturing will impair the company's ability to realize its output capacity potential in packaging paper. Absence of enforcement of the Recycling Act, which mandates waste recycling, would make it more difficult to obtain alternative sources for raw materials at a competitive cost. Nevertheless, approval of the Cleanliness Law in January 2007, which imposes a landfill levy on waste, may bring about, if effectively enforced, some improvement in the paper waste collection capacity, according to Company estimate. The Packaging Law may also serve to significantly affect the collection operations of raw materials, although this impact is the pendant upon the regulations that will be set by virtue of the law and the actions of the recognized body that will be established by virtue of the law. For additional information, see Sections 8.23.2 and 8.23.3, above. |
42
| 8.26.2.4. | Increase in input prices - Such as gas, electricity, transportation and starch - may serve to impair the company's profitability. Regarding gas, in July 2011, the gas supply agreement with Yam Tethys is scheduled to terminate and the company is examining alternatives for the said agreement. According to company estimates, and based on the prevailing market prices, upon the signing of a new agreement with any of the potential suppliers, the price of gas is expected to rise in relation to the gas prices pursuant to the current agreement. For details see Section 19.8, below. |
| 8.26.2.5. | Environment - Requirements of the Ministry of Environmental Protection with regard to this sector and its facilities require the Company to allocate financial resources to this issue. These requirements may expand and proliferate due to increasing awareness toward environmental protection and developing regulation in this area, which may force the Company to allocate further financial resources associated with this operating sector. |
In the matter of quality of sewage, on January 30, 2011 the Ministry for the Protection of the Environment (hereinafter: "the Ministry") held a hearing for the Company regarding suspicion of pollution of water by discharging low quality waste water into the Hadera Stream. The Ministry found that the Company had a duty to improve the quality of the waste water, and a duty of reporting weekly to the Ministry regarding the quality of the treated waste water. It was further found that if the Company did not fulfill the values prescribed in the permit order for discharging into the Hadera Stream, granted on August 11, 2010, the Ministry’s Director of the Haifa District would issue, under his authority, an order to cease operations of Machine 8 which the Company operates, without requiring any advance warnings or additional hearings. The Company is acting to improve the treated waste water by taking various actions, and as a result of these actions there is already an improvement in the quality of the treated waste water flowing into the stream. At the same time, the company at this stage cannot estimate the rate or timetable for improvement of the treated waste water, and cannot estimate said effects in the event of failure to comply with required values. For additional details regarding this matter, see Section 17, below. |
| Furthermore, as the Company deals, inter alia, in dangerous and toxic materials, it is exposed to damages likely to be caused because of these products, including health damages, environmental damages, damages resulting from flammable materials catching fire and the like. Hence the Company is exposed to claims which may negatively impact the business results of the operating sector as well as Company reputation. |
43
| 8.26.2.6. | Customers – Because of the small number of customers in Israel for packaging paper finished products, there is a dependency on customers in Israel, and a decrease in the number of customers could impair the results of operation. However, due to the advantages of being a local producer, this risk is estimated as mediocre by the company. Regarding export customers, sales are conducted through foreign sales agents. Since these agents are not the final customer, they may be replaced within relatively short periods of time and the dependence on them is therefore low. |
| 8.26.2.7. | Closure of ports – The Company imports raw materials and spare parts used for the manufacture of its products, and exports finished products though the Israeli ports. Closure of ports in Israel could harm import of raw materials and spare parts, and directly impact the Company’s operations, and could also harm export of finished products and impact the Company’s profitability. However, since the Company maintains an inventory of raw materials, only a prolonged closing of the ports will have a medium impact on its activity. |
| 8.26.3. | Special Factors |
| 8.26.3.1. | Dependence on gas supplier - As stated in Section 8.20.6, above, the company is dependent upon the natural gas supplier, Yam Tethys, that to the best knowledge of the company, true to the report date , is one of two natural gas suppliers in Israel. Termination of the contract with said supplier would require the Company to contract with an alternative supplier or to convert to use of diesel, which is significantly more expensive than natural gas as of the report date. For information regarding the contract with Yam Tethys, see Section 19.8, below. See also 8.26.4.1, below. |
| 8.26.3.2. | Dependence on gas transporter - For delivery of gas to the Company's Hadera facility, the company is dependent on Gas Routes, which transports natural gas to the Hadera site via the maritime pipeline to Hadera and a land pipeline to the Hadera facility. Termination of the contract with the gas transporter may materially impact the operating sector. For information regarding the contract with Gas Routes, see section 19.9, below. |
| 8.26.3.3. | Monopoly - The Company has been declared a monopoly in the packaging paper sector in rolls and sheets, as defined in the Antitrust Act (for information on declaration of the Company as a monopoly and the petition submitted by the company for rescinding this declaration, see Sections 8.2.3 and 8.23.8, above), and is subject to laws applicable to a monopoly in Israel. Statutory means set forth in the Antitrust Act confer on the Supervisor, inter alia, the right to intervene on matters which may impact the public, including setting business restrictions on the corporation, including price supervision. Such restrictions, should they be enforced, may negatively impact results of the operating sector. |
44
| 8.26.3.4. | The Company's manufacturing and distribution sites - The production operations of this operating sector are concentrated in a limited number of sites. Impact to one or more of the production and/or distribution sites may materially impact the financial results of this operating sector. |
| 8.26.4. | General factors |
| 8.26.4.1. | Geo-political developments in Egypt - Recent geo-political developments in Egypt and uncertainty with regards to stability of governments could negatively impact the Company’s option of engaging under an agreement with gas provider EMG, one of the gas providers the Company has been negotiating with in connection with gas supply. As of the report date, the Company cannot assess the impact the situation in the region will have on the option of said engagement with EMG, or said impact on possible conditions of engagement with other gas suppliers. |
| 8.26.5. | The extent of impact of risk factors |
| Following below is a list of the risk factors and their degree of impact on the sector of operations: For details of macro-economic risk factors, see section 23, below. |
| Risk Factors | Degree of Impact | ||
| Considerable Influence | Medium Influence | Small Influence | |
| Sector-related factors | -Competition -Raw Materials | -Closing of ports -Accounts receivable (customers) -Environmental protection | -Regulation |
| Special Factors | -Dependence on gas transporter -Dependence on gas supplier | -Monopoly -Geopolitical developments in Egypt | |
| 9. | Office Supplies Marketing sector |
| 9.1. | Structure of the Office Supplies Marketing sector |
| The office supplies marketing sector focuses on the marketing of office supplies, disposable paper products, office technology, office furnishings, complimentary equipment (dry food, cleaning products), art products, sales promotion products and more. At the company, the office supplies marketing sector is conducted by its subsidiaries Graffiti and Attar. The company, through the said subsidiaries, deals in the marketing of office supplies to business customers, institutional customers, chains and stores, using sales methods that includes sales agents, telephone sale and service centers and a B2B e-commerce website. This sector is characterized by numerous local and international brands. |
45
| 9.2. | Changes of volume of operations in the sector and its profitability |
| The office supplies sector in Israel is a relatively stable market, yet it is affected by the prices of paper, plastics and steel. Moreover, the overall level of economic activity possesses an impact on this market, as expressed by a change in the consumption habits during periods of recession. Most of the products marketed in this sector are imported, including: Various pens, office supplies, shredders, binding machines, disposable paper products etc. Moreover, the Israeli market also deals in the marketing of products acquired from local producers and suppliers, including: Office furniture, printers, fax machines, computers and peripherals, cameras, food products, toiletry products, etc. |
| 9.3. | Technological changes that can potentially impact the sector of operations |
| The rate of technological development of Israel’s business sector leads to increasing demand for technology-based products marketed by Graffiti, including office automation, printers, hardware, software and consumables such as toners, inkjet cartridges, etc. |
| 9.4. | Critical success factors in the sector of operations |
| 9.4.1. | Several critical success factors may be indicated for Company operations in the office supplies marketing sector, which impact its operations: |
| 9.4.2. | Elevated quality of service supported by complex logistics - Availability and strong customer service are critical success factors in this sector. A high level of quality and service are contributing to preserving the existing customers. Graffiti intends to relocate to an advanced logistics center during 2011, operated using the most advanced automatic and semiautomatic systems in the world of modern logistics. The company estimates that the improvement in the logistics capabilities will contribute to a significant rise in the quality of service. Information regarding the improvement in the logistics capabilities and the rise in the quality of service constitutes forward-looking information, as defined by the Securities Act and merely consists of forecasts and estimates by the Company which are not certain to materialize and are based on information available to the Company as of the report date. These forecasts and estimates by the Company may not materialize, in whole or in part, may differ from the existing estimates and forecasts or may materialize in a manner significantly different than that expected. The major factors that could impact this include the dependence on external factors, the efficiency and assimilation of systems upon relocation to logistics center, changes in demand and supply, developments and changes in regulation and/or realization of any of the risk factors outlined in sections 9.17 and 23, below. |
| 9.4.3. | Lowering of costs by improving the sources of acquisition with an emphasis on the transition to acquisitions from the Far East - Graffiti invests considerable efforts in cutting brokerage fees in the supply chain by arriving at direct agreements with manufacturers throughout the Far East, at the expense of local purchasing. |
46
| 9.5. | Structure of competition in the office supplies marketing sector |
| 9.5.1. | Graffiti has many competitors in the marketing of office supplies sector. For details on competition in this sector of operations, see section 9.10, below. |
| 9.6. | Products and Services in office supplies sector of operations |
| 9.6.1. | Graffiti specializes in providing comprehensive solutions for office supplies by directly supplying institutions and businesses. Graffiti offers approximately 12,000 different items to its customers nationwide. Moreover, Graffiti provides outsourcing services by delivering a wide range of office supply products, often in conjunction with managing the customer’s applicable purchasing budget, thereby assisting large organizations in reducing costs and increasing efficiency. Graffiti has a B2B (Business-to-Business) website for online ordering, allowing Graffiti customers to enter their orders and to control and manage their purchasing budgets. This tool allows Graffiti to serve a wider variety of customers with no significant increase in marketing costs. |
| 9.6.2. | Through Attar - a wholly-owned subsidiary - Graffiti also serves as the exclusive distributor for international brand name products in the office supplies sector, such as Artline (Sachihata Inc.) (hereinafter: "Artline), Mitsubishi (Uni-Mitsubishi Pencil Co.) (Hereinafter: "Mitsubishi), Max (Max Co. Ltd.) (hereinafter: "Max), Schneider (Schneider Schreibgerate GmbH) (hereinafter: "Schneider) and Fellowes (Fellowes Distribution Services B.V.) (hereinafter: "Fellows"). |
| 9.6.3. | Graffiti’s products include office supplies and office automation products, as well as office equipment and inter alia, toner and inkjet cartridges, software, peripheral equipment, computers, training and visual aids, filing systems, paper products, office furniture as well as other office supplies such as food and cleaning products. Graffiti’s subsidiary, Attar, deals in the sale and distribution of brands in the office supplies sector. |
| 9.6.4. | The demand for products marketed in this sector of operations is relatively rigid, since it consists mostly of basic consumer goods. Despite the aforesaid, during times of recession it is evident that consumption habits tend to change, due to the desire to save and cut-backs across organizations, that also include their office supplies. The mix of products is rather similar across different organizations that constitute the customer base in this area. The office supplies market is a traditional market where no significant changes tend to take place. Most of the changes in terms of products concern office technology (printers, fax machines etc.), yet these are not changes that are material to the operations in the sector. All products marketed by Graffiti have competing products sold by many suppliers and distributors. |
| 9.6.5. | In this operating segment, there is no single product category for which Company revenues account for over 10% of total revenues. |
| 9.7. | Customers in the marketing of office supplies sector |
| 9.7.1. | Graffiti sells its products to thousands of diverse customers in the business and institutional sectors, in Israel only. Large local and national organizations number among Graffiti’s customers (such as government ministries, banks, health funds and the like), with thousands of employees, as well as small organizations with only a small number of employees. |
47
| 9.7.2. | During 2010 and 2009, approximately 34% and 32% of Graffiti’s sales - respectively - came from securing a variety of tenders, awarding Graffiti supply contracts for periods of one to four years. Engagements made through tenders are by nature for a limited time, according to the terms of the tender, and upon termination of the agreement period, such engagements end. |
| 9.7.3. | During 2010 and 2009 there was no single customer that accounted for 10% or more of the company’s total revenues during those periods. Furthermore, as of the date of this report, Graffiti is not dependent upon any single customer. |
| 9.8. | Marketing and distribution in the marketing of office supplies sector |
| 9.8.1. | Graffiti’s orders for products in this sector of operations come from a number of sources (field sales personnel, telephone sales center, e-mail, fax and an e-commerce website). All orders are routed to the order processing system, that generates picking tasks for the coming days. Once the orders have been picked, they are organized by delivery destination, and ordered products are delivered the following day. |
| 9.8.2. | Graffiti maintains three storage and distribution centers, located at Rosh Ha'Ayin, Tiberias and Be'er Sheva. Graffiti’s distribution system is based on a fleet of trucks, under operational lease, backed up by external distribution contractors in cases of peak demand. Graffiti is not dependent upon any of its external contractors. Graffiti maintains service and sales offices in Be'er Sheva, Jerusalem, Tiberias and Rosh Ha'Ayin. (It should be noted that during the second half of 2011, Graffiti is expected to vacate the site in Rosh Ha'Ayin and relocate it to the new logistics center in Modi'in, as detailed in Section 9.12 below). |
| 9.8.3. | On the matter of Attar’s being an exclusive agent for a number of suppliers in Israel, see section 9.6.2, below. |
| 9.9. | Order backlog in the marketing of office supplies |
| There is no order backlog in this sector of operations. Orders are handled within a short time, usually by the day following the order. |
| 9.10. | Competition in the marketing of office supplies sector |
| 9.10.1. | The names of Graffiti’s major competitors in this sector of operations are: Kravitz (1974) Ltd., Office Depot (Israel) Ltd.(that was purchased during 2010 by the New Hamashbir Lazarchan( Ofek Hadash Ltd., Pythagoras (1986) Ltd., Arta Supplies for Art Graphics and Office Ltd., Lautman Rimon Ltd., and Pan Office Supply Manufacture and Import Ltd. |
| 9.10.2. | There are three dominant players in the sector of office supplies by direct supply to institutions and businesses: Graffiti, Office Depot (Israel) Ltd. and Kravitz (1974) Ltd., who dominate primarily: (a) Customers dealt with primarily by tenders; and (b) strategic customers (such as banks and local municipalities). In addition to these players, there are also a large number of competitors in the business customer market holding small market shares, mainly active in smaller geographic areas. |
48
| 9.10.3. | Graffiti cannot estimate its share of the market, as Graffiti markets a very large variety of products in the area of office supplies, with the aim of providing comprehensive solutions for supply of the various products in the office supplies sector. It is consequently difficult to define the size of the relevant market, and Graffiti's share therein. |
| 9.10.4. | During January 2010, Graffiti received notice from the Ministry of Industry Trade and Employment regarding the investigation of a complaint lodged by DC Paper and Plastic Industries Ltd. to the Supervisor of Commerce Fees at the Ministry of Industry Trade and Employment (hereinafter in this section: "the Supervisor"), regarding imported dumping of paper cups from China to Israel, by Graffiti, among others. On November 22, 2010, the Supervisor imposed a temporary guarantee on the import of paper cups from China to Israel. The Supervisor in his decision name a few importers with regards to whom no levy, or a levy at a lower rate, would be imposed. Following this decision Graffiti has been purchasing cups only from importers on whom no levies have been imposed, and the above has no substantial impact on Graffiti. |
| 9.10.5. | Graffiti deals with its competitors by maintaining high standards of quality and service. The size and variety of Graffiti’s products also give it an advantage over its competitors. Graffiti has an advanced sales and service center, providing fast turnaround times for its customers. |
| 9.11. | Seasonality |
| Graffiti’s sales during the second half of the calendar year are usually higher than the first half of that same year, in light of the start of the school year and the realization of annual purchase budgets for institutions and businesses. During the second half of 2010, Graffiti’s sales were approximately 14% higher than the first half of that same year, and the sales during the second half of 2009 were approximately 18% higher than the first half of that same year. |
| 9.12. | Fixed assets, real estate and facilities in the marketing of office supplies sector |
| At the present time, Graffiti leases the buildings at various sites: |
| 9.12.1. | Main logistics center in Rosh Ha'Ayin - Graffiti rents a building at Afek Park in Rosh Ha'Ayin, covering an area of 5350 m², serving as a central logistics center and as the Graffiti headquarters, of which 120 m² are sublet. The rental agreement is expected to terminate in October 2011. At this date, the logistics center is scheduled to be relocated to the new logistics center in Modi'in. For details regarding the Logistic Center, see section 12.6, below. |
| 9.12.2. | Graffiti also leases stores, warehouses and sales centers throughout the country. |
| 9.12.3. | Moreover, Graffiti operates a distribution network consisting of 38 distribution vehicles, of which 29 are under operating leases, while 9 distribution vehicles are owned by the company. |
49
| 9.13. | Suppliers in the marketing of office supplies sector |
| 9.13.1. | Graffiti does not itself manufacture office supplies, it purchases supplies from a large number of suppliers (Hewlett Packard Ltd., Brother – Reshef Engineering Solutions Ltd., Xerox Israel Ltd., Hadera Paper Printing, Hogla-Kimberly, Strauss-Elite Ltd., Afik Printing Products Ltd., Canon-Karat Israel Ltd. and more), and markets these to its customers. |
| 9.13.2. | Graffiti is working to expand the volume and range of imports, in order to increase the diversity and create a relative advantage vis-à-vis its competitors. Graffiti is not dependent upon any single supplier of those mentioned above. |
| 9.13.3. | Graffiti has contracts with major suppliers, covering issues such as: Quality of service, returns, repairs and the like. Agreements, as mentioned, are usually annual framework agreements, and the quantity of the product actually ordered is determined according to demand during that year. Regarding other suppliers, the purchase price is determined from time to time in negotiations between the parties, with most of the categories of products having at least two suppliers, allowing for an improvement of Graffiti's purchasing capability. |
| 9.13.4. | Hadera Paper Printing, a subsidiary of the company as of December 31, 2010 (as detailed in section 11.1, above), is a main supplier of fine paper to Graffiti. Graffiti engages with Hadera Paper Printing under an annual framework agreement which sets out the commercial principles, among other things, with regard to cost and linkage mechanism, with the quantity being determined according to demand over the course of the year. Graffiti’s rate of purchase of Hadera Paper Printing’s fine paper during 2010 and 2009 was 26.4% and 22.3% of total office supply purchases, respectively. |
| 9.13.5. | Graffiti is not dependent upon any single supplier of those mentioned above. |
| 9.14. | Working Capital |
| 9.14.1. | The levels of inventories of finished products in the area of office supplies are operational levels that are adjusted to the period of supply and the need to maintain variety. On average, inventory levels are about 2 months’ worth of expected delivery. |
| 9.14.2. | Product return and replacement policy and product warranty - Goods in this operating sector are sold as final sale to customers, and are returned in case of faulty product or due to mismatch between order and delivery. When a customer complains of a faulty or mismatching product, the complaint is reviewed and if correct, the goods are returned and the customer is credited. The volume of returns is insignificant in relation to the total volume of operations of Graffiti. Graffiti provides warranty on the products it markets and sells according to the warranties provided by the manufacturers of such product (if any). |
50
| 9.14.3. | Average credit duration |
| Data with regard to the average period and the volume of credit from suppliers and customers during reporting periods over the years 2010 and 2009 are provided below: |
| Average 2010 | Average 2009 | |||||||||||||||
Average volume of credit in NIS millions | Average credit days | Average credit volume In NIS millions | Average credit days | |||||||||||||
| Accounts receivable (customers) | 59 | 104 | 49.15 | 102 | ||||||||||||
| Accounts Payable (Suppliers) | 45.2 | 93 | 41.77 | 110 | ||||||||||||
| · | The average days of inventory in this sector in 2010 is 67 days. |
| 9.15. | Restrictions on and Supervision of Corporate Operations in the Office Supplies Marketing Sector |
| 9.15.1. | Work Hours Law – This area of operations is subject to the provisions of the protection laws in the area of labor law, including Work and Rest Hours Law 5741 – 1981. For further details see section 8.23.4, above. |
| 9.15.2. | Consumer Provisions - The companies in this area of operations are subject to various consumer provisions, including by power of the Consumer Protection Law 5741 – 1981 and the Liability for Faulty Products Law 5740 – 1980. For further details see section 24.1.24.2, below. |
| 9.15.3. | Work Safety - The companies in the sector are subject to legislation concerning work safety and health. For details see section 9.16, above. |
| 9.15.4. | Packaging Law - The sector of operations is subject to legislation related to the packaging law, by virtue of the company being an importer of propackaged ducts. For details regarding the Packaging Law, see section 8.23.2, above. |
| 9.15.5. | Business licenses - Graffiti holds a perpetual business license, for storage and marketing of office equipment and paper. |
| 9.15.6. | Quality Control and Regulation - Graffiti is committed to the highest standards and conforms with Israeli standards and with ISO 9001:2000 standards for distribution of office supplies to businesses and organizations. Graffiti is an authorized supplier to the Ministry of Defense. Moreover, some of the products marketed by this segment of operations possesses standards issued by the Israeli Institute of Standards. Beyond the above, there are no special restrictions on this sector of operations. |
| 9.16. | Forecast for developments in the sector of operations for the coming year |
| 9.16.1. | The company is studying the expansion of this sector of operations through acquisitions or ventures with small suppliers of office supplies. The company is also studying and focusing on creating strategic ventures in order to improve Graffiti’s operations base through purchase, sales methods and computerized support for Graffiti’s information systems. |
| 9.16.2. | Moreover, the company intends to relocate the Graffiti site from Rosh Ha'Ayin to the new logistics center in Modi'in in the second half of 2011. Accordingly, investments will be necessary in storage and distribution equipment. For details regarding the Logistic Center, see section 12.6, below. |
51
| 9.17. | Risk factors in the marketing of office supplies sector |
| For details regarding macro-economic risk factors, see section 23, below. |
| 9.17.1. | Sector-Specific Risk Factors |
| 9.17.1.1. | Accounts Receivable Risks - Most sales in this sector of operations are performed in Israel, and some of the sales are performed without full collateral. The sector of operations routinely studies the quality of its customers so that it may determine if provisions must be made for doubtful debts, and the amount thereof. The company estimates that the financial statements reflect appropriate provisions for doubtful debts. |
| 9.17.1.2. | Competition - The sector operates in a competitive market with a considerable degree of competition, in this matter see Section 9.10, above. The entry of new competitors and/or expansion of existing competitors’ operations could detrimentally impact the company’s scope of operations in this sector, as well as the financial outcome of the sector of operations. |
| 9.17.2. | Special Factors |
| 9.17.2.1. | Exclusivity - As stated in section 9.6.2, above, Graffiti (via Attar) is the exclusive distributor in Israel of a number of international brand name products in Israel, in the area of office equipment. Should such aforesaid exclusivity be terminated in a comprehensive manner, this could impact this sector of operations. At the same time, in light of the fact that Graffiti is an exclusive agent of a large number of suppliers, it is Graffiti’s estimate that the aforesaid termination of exclusivity will not be substantial in terms of its impact. |
| 9.17.3. | The extent of impact of risk factors |
| The company’s estimates regarding the types and measure of the influence of the aforesaid risk factors on the sector of operations appears below. For details regarding macro-economic risk factors, see section 23, below. |
| Risk Factors | Degree of Impact | ||
| Considerable Influence | Medium Influence | Small Influence | |
Sector-related factors | -Competition | -Accounts Receivable Risks | |
| Special Factors | -Exclusivity | ||
52
| 10. | Packaging products and cardboard sector |
| 10.1. | The packaging products and cardboard operating sector and changes therein |
| 10.1.1. | The packaging products and cardboard operating sector focuses primarily on the manufacture and sale of cardboard packaging, that serve primarily for customers in industry and agriculture, while also focusing on the manufacture and sale of cardboard shelf packaging for consumer goods, that serve primarily for industry, agriculture, pharmaceuticals, food and cosmetics. |
| 10.1.2. | The cardboard shelf-packaging production and sales operations are carried out via the subsidiaries Carmel and Frenkel-CD. |
| 10.1.2.1. | Carmel is engaged in the design, manufacture and marketing of cardboard packaging products. Moreover, Carmel possesses unique capabilities in digital printing on various materials, with a wide format. On October 4, 2010, the company completed a full tender offer according to Section 336 of the Companies Law, for the purchase of all of the holdings of the public in Carmel, so that as of that date, Carmel became a privately held company, owned by the Company. For additional details, refer to Section 2.8, above. |
| 10.1.2.2. | Tri-Wall Containers (Israel) Ltd. (hereinafter: "Tri-Wall") – is a subsidiary wholly-owned by Carmel. Tri-Wall engages in the design, manufacture and marketing of special triple-walled board containers (produced by Carmel), integrated with other materials such as wood, layering materials and the like, for the packaging and shipping of goods mostly for the hi-tech market, bulk shipments and other uses. In addition, Tri-Wall manufactures wooden shipping pallets for the local market and for export. |
| 10.1.2.3. | Frenkel- CD, a subsidiary in joint ownership between the company, Carmel and Frenkel & Sons Ltd., is among the leading companies in designing, producing and marketing packaging for consumer goods from compacted board. Frenkel-CD offers its numerous customers from industry, agriculture, food and beverage industries, cosmetics, pharmaceuticals and high-technology industries, unique packaging solutions that are tailored to their needs. |
| 10.2. | Changes in the volume of operations in the packaging products and cardboard operating sector |
| 10.2.1. | The global paper industry is a cyclical one, reflected in more highly profitable years which lead to investments in the paper industry and expanded production capacity. Therefore, in subsequent years there is excess supply, which causes a significant decline in profitability for several years, until supply and demand are once again balanced. As a result, and since this is a capital-intensive industry, the global paper industry typically exports its extra production at relatively low prices at “cost plus” (i.e. covering the variable cost plus a certain contribution toward fixed costs). |
53
| 10.2.2. | The company estimates that the entire packaging products and board sector in Israel grew by approximately 3% in 2010, as compared with its level in 2009. |
| 10.2.3. | The Cardboard industry serves the following sectors: Industry, agriculture and the food and beverage industry. Consequently, the macro-economic variable that possesses the greatest impact on the demand for packaging products and cardboard and the derived volume of waste collection is the level of economic activity in the market and the export volumes of its customers. |
| 10.3. | Developments in the packaging products and cardboard sector and changes to its customer profile |
| 10.3.1. | Paper is a central component in the manufacture of cardboard packaging. Following a decrease in prices in the years 2008-2009 (as a result of surplus supply coupled with the impact of the global economic crisis on the packaging industry), the prices of paper increased dramatically in 2010, such that a significant increase was recorded in raw material costs in this sector of operations, accompanied by a decrease in operating income. |
| 10.4. | Critical success factors in the packaging products and cardboard sector of operations and changes therein |
| Several critical success factors may be indicated for Company operations in the packaging products and cardboard sector, which impact its operations: |
| 10.4.1. | The economic situation in the Israeli economy - The cardboard industry caters to the local industry, agriculture and food and beverage industries. As a result, extensive current economic activity has a positive material impact on the demand for packaging products and cardboard. An economic crisis would obviously have an adverse effect. |
| 10.4.2. | Investment in necessary production equipment - Machines used in the production of packaging products and cardboard are very costly, in terms of both acquisition and maintenance cost. Consequently, financing capabilities and the ability to raise funds, constitute an advantage in the sector of operations. |
| 10.4.3. | Product quality and customer service - High product quality, availability and quality customer service are important success factors in this operating sector. High level quality and service contribute to preservation of existing customers and to increasing the number of customers. |
| 10.4.4. | Reputation - Due to the nature of this operating sector, reputation is a key success factor in this sector. |
| 10.5. | Changes to suppliers and raw materials for the packaging products and cardboard sector |
| 10.5.1. | The principal raw material that serves in the manufacture of corrugated board is paper. The supply of this raw material is crucial to the process. |
| 10.5.2. | The paper that serves in the manufacture of the packaging and board products of this sector of operations is partially acquired from imports (all natural paper products that serve in manufacture - approximately 45% of total raw materials) and partially from a local producer (all the recycled paper products that serve in manufacture - approximately 55% of the total raw materials). The local producer from which the raw material is purchased is Hadera Paper Packaging, a subsidiary of the company that forms part of the packaging paper and recycling sector. |
54
| 10.5.3. | In this context it should be noted that in Europe between 85% 90% of the raw material serving for the manufacture of packaging products and board, consists of recycled materials. Likewise, in Israel there also exists a trend of the rising use of recycled materials in the packaging products and cardboard sector. |
| 10.5.4. | The price of paper rose sharply in 2010, to the effect that a significant increase was recorded in raw material costs in this sector of operations, accompanied by a decrease in operating income. |
| 10.6. | Major barriers to entry and exit in the packaging products and cardboard sector and changes therein |
| 10.6.1. | There are several barriers to entry of any company to the field of packaging products and cardboard production: |
| 10.6.1.1. | Initial capital - The packaging products and cardboard industry is, by nature, capital intensive with heavy investments required in infrastructure and equipment (paper machinery, paper waste processing systems and associated infrastructure); entry into this operating sector requires a significant initial capital. Furthermore, even following the initial capital outlay, this operating sector requires significant investment in equipment maintenance. |
| 10.6.1.2. | Skilled staff - Manufacturing of products in the packaging and cardboard sector requires professional, skilled staff. A company starting operations in this operating segment would be required to recruit appropriate staff, which may prove to be a challenge to any company intending to operate in this segment. |
| 10.6.1.3. | Reputation - A penetration of this sector would require an extended period of time, due to the importance of reputation in the sector. |
| 10.6.1.4. | The Company believes that there are no material exit barriers from this segment, except for the following: Immediate discontinuation of operations would require arrangements to be made with customers concerning conclusion of product inventory delivery as well as arrangement of payments to suppliers. |
| 10.7. | The structure of the packaging products and cardboard operating sector and changes therein |
| 10.7.1. | The corrugated cardboard industry is capital-intensive, which constitutes a natural entry and exit barrier of competitors. The main substitute for corrugated board products is primarily flexible wrapping for beverages and plastic crates for slaughter houses. |
55
| 10.7.2. | For additional details regarding the competition in the sector, see Section 10.13, below. |
| 10.8. | Products and services in the packaging products and cardboard operating sector |
| Major products and services: |
| 10.8.1. | Cardboard - The Company is engaged, via its subsidiary Carmel, in the production of cardboard products in three categories: |
| 10.8.1.1. | Corrugated board products – The corrugated board products, that constitute an essential part of this sector of operations, are manufactured and processed in line with the customers' specific requirements, which are determined according to the type of stored goods, the type of packaging, the expected weights on the packaging during transportation, temperature and humidity conditions during the storage and transportation, the graphic design of the packaging, etc. The manufactured and processed corrugated cardboard products include: (1) "standard" corrugated board containers - boxes manufactured in different sizes, which are closed by sealing the upper flaps and bottom of the box; (2) containers and boxes in different geometric shapes that can be "positioned" by manually folding the cardboard plate without sealing or mechanically folding the flaps using warm glue. These products are primarily sold to machinery-intensive industries that operate at high rates, such as the soft beverage industry; (3) Cardboard crates for agriculture: trays that are formed only using tray forming machines with matching molds, in geographic proximity to the final customers. |
| 10.8.1.2. | Corrugated board sheets – These are used as raw materials and marketed to corrugated board processors, who use them as raw materials for the manufacture of packaging. Cardboard processors are small processing plants, which sell their produce to small and medium-sized customers. Carmel, as well as an additional local competitor, specialize in the unique manufacture of triple-wall sheets that are used for specialized packaging, among others by the subsidiary Tri-Wall, mainly for the high-tech industry. Alongside local manufacture, there exist imports of triple-wall boards, against which Carmel possesses an advantage, being a local manufacture. |
| 10.8.1.3. | Digital printing (advertising) products - Planning, design and production of digital prints for diverse applications in sales promotion, display stands, decoration of pavilions in trade exhibitions and on billboards. High printing quality using a technology of ink injection on the work surface, while the cutting is shape-based, with no need for embossing. |
| 10.8.2. | Cardboard shelf packaging - The subsidiary, Frenkel-CD, designs, produces and markets shelf packaging and display stands. |
56
| 10.8.3. | Containers and pallets - The Company is engaged, via the Tri-Wall subsidiary, in the production of the following products: |
| 10.8.3.1. | Triple-wall cardboard packaging which are mainly used for the export of heavy bulky products such as chemicals, electronic equipment, high-tech equipment, medical equipment, security equipment, etc. |
| 10.8.3.2. | Complex packaging primarily for the export of high-tech products, which are made of wood, plywood, triple-wall cardboard, padding materials, metals and other materials. In the course of 2010, Tri-Wall began to provide outsourcing services, following the establishment of operations for the manufacture of packaging using a manufacturing line that would operate on-site at the customer's premises. |
| 10.8.3.3. | Regular and unique wooden surfaces and pallets which are used as a basis for the above packaging and wooden pallets for transportation. |
| 10.9. | Distribution of revenues and profitability of products and services in the packaging products and cardboard operating sector |
| The following data presents the distribution of revenues from products and services in the years 2010, 2009 and 2008: |
| NIS millions | 2010 | 2009* | 2008 | |||||||||||||||||||||
| Revenues | Percentage of Company Revenues | Revenues | Percentage of Company Revenues | Revenues | Percentage of Company Revenues | |||||||||||||||||||
| Sales of packaging and cardboard products | 343 | 31 | % | 334 | 37.40 | % | 360 | 84 | % | |||||||||||||||
| Shelf packaging | 130 | 12 | % | 117 | 13.10 | % | 117 | 100 | % | |||||||||||||||
* The packaging and cardboard products sector was consolidated within the company's financial statements starting September 1, 2008.
| 10.10. | Customers in the packaging products and cardboard operating sector |
| 10.10.1. | Cardboard |
| 10.10.1.1. | The bulk of the Carmel subsidiary's production is directed to the domestic market to customers from industry and agriculture, as specified below, while 1%-2% of the production is channeled to direct exports. A large percentage of the industrial and agricultural customers export their products in corrugated cardboard containers, so that a considerable portion of sales is also directed to indirect exports. The products are supplied in line with orders that customers submit through salespersons or directly to the customer service department. The orders are made in line with the price proposals to the customers and in accordance with the commercial arrangements between the parties. A small portion of the products is manufactured for inventory, at the customers' request. |
| 10.10.1.2. | Carmel has a wide range of customers that include leading companies, which operate in different sectors, among which are: (a) the industrial sector, which includes food and soft beverages companies, dairies, textile companies and others; (b) the agricultural sector, which comprises customers that are farmers, packaging houses and marketing organization, and where the produce is directed both to the domestic market and to exports; (c) Cardboard processors – small plants for processing corrugated cardboards in small production series; (d) digital printing customers – which primarily include advertising agencies; (e) others – cellular operators, government offices and banks. |
57
| 10.10.1.3. | Carmel has a material customer, the revenues from which to Carmel in 2010 and 2009 amounted to NIS 43.5 million and NIS 55.5 million, respectively, which accounted for 11% and approximately 14.4%, respectively, of its total revenues. The nature of Carmel's agreement with this customer is identical to its agreements with other customers, as detailed below. |
| 10.10.1.4. | Carmel is not dependent on any customer whatsoever. |
| 10.10.1.5. | As of December 31, 2010, Carmel had 250 active customers. As of December 31, 2010 and 2009, Carmel's 20 largest customers accounted for 51% and 55% of Carmel's total revenues over the same period, respectively. |
| 10.10.2. | Cardboard shelf packaging |
| 10.10.2.1. | Most of the sales of Frenkel-CD are made to the domestic market, while 6% are directed toward direct exports. Nevertheless, some of the company's local customers channel the packaging that is purchased toward indirect exports. |
| 10.10.2.2. | The manufacture provision of products with customers is usually performed according to customer orders made with the company, that are unique to the ordering party. For each order, the delivery dates are determined, and sometimes framework orders are made for extended periods, for which packaging is produced for inventories. |
| 10.10.2.3. | The company has a wide range of customers, including leading Israeli companies in various sectors. The principal sectors in which the company operates include food, pharmaceuticals, cosmetics, agriculture, plastics and sales promotion. |
| 10.10.2.4. | Frenkel-CD is not dependent upon any single customer. |
| 10.11. | Marketing and distribution in the packaging products and cardboard operating sector |
| 10.11.1. | The marketing and distribution in this sector of operations are conducted in various ways, including direct sales to final customers and sales through distributors. |
| 10.11.2. | Transportation to the customer is conducted primarily using external shippers, while the company does not have any exclusive agreements with any of the said shippers. The Company also has no dependency on any of these shipping companies. |
58
| 10.12. | Order backlog in the packaging products and cardboard operating sector Product delivery volumes are based on an overall annual forecast, determined and coordinated between the sector and its customers. Current supply is converted into orders, based on a few days in advance or even less, so the Company has no order backlog. |
| 10.13. | Competition in the packaging products and cardboard operating sector |
| 10.13.1. | The corrugated cardboard industry is capital-intensive, which constitutes a natural entry and exit barrier of competitors. The main substitute for corrugated board products is primarily flexible wrapping for beverages. |
| 10.13.2. | To the best of the company's knowledge and based on its internal information and assessment, the cardboard packaging market in Israel is dominated by four principal companies: Carmel Container Systems Ltd., Cargal Ltd., YMA 1990 Packaging Product Manufacturing (a partnership between Kibbutz En HaMifratz and Kibbutz Ge'aton) and Best Cardboard Ltd. According to Carmel estimates, total sales for Carmel in 2010 and 2009 amounted to 27% in each one of the years of the total market. |
| 10.13.3. | In addition, there are 30 cardboard packaging manufacturers with small market shares, which perform the processing activity, but not the manufacturing of corrugated cardboard. These manufacturers produce small series of packaging with less advanced machinery compared to that used by Carmel. Carmel estimates that as of December 31 of the years 2010 and 2009, the total annual volume of the corrugated board industry amounted to 315 thousand tons and 300 thousand tons, respectively, and the estimated sales in 2010 and 2009 amounted to NIS 1,400 million and NIS 1,200 million. |
| 10.13.4. | The methods employed by companies in this sector for dealing with competition within the sector, include the following parameters: The advantage of a major market player in terms of size and seniority, efficiency in production and supply, the level and quality of service to the customer and competitive prices. |
| 10.14. | Seasonality |
| 10.14.1. | Generally speaking, most of the demand for cardboard packaging products is in winter months, primarily November and March (Q1 and Q4), due to the dynamic seasonal export of citrus and bell pepper crops. Sales of cardboard packaging products during the first and fourth quarters of the year are higher by an average of approximately 10% in relation to the sales during the second and third quarters. As for the other products of the packaging products and cardboard segment, there is no seasonal impact on demand. |
| 10.15. | Output capacity in the packaging products and cardboard operating sector |
| 10.15.1. | Carmel's corrugated cardboards are manufactured in two sites. The first is located in Caesarea (working in two shifts, with some of the production lines operating 24 hours a day, except for weekends). The second plant is located in Carmiel (working only one shift, except for weekends). Most of the activity takes place at Caesarea, using 12 processing machines and including all of the corrugation operations and most of the processing work. |
59
| 10.15.2. | In 2010, two new processing machines were acquired and installed at the company site in Caesarea: a) An advanced printing machine; b) an innovative processing machine. The new machines replaced two previous machines. |
| 10.15.3. | The manufacturing operations in the packaging products sector by Frenkel-CD are conducted at the Frenkel-CD plant in Caesarea, that operates 24 hours a day, in three shifts, except for the weekends. |
| 10.15.4. | The Tri-Wall container manufacturing activities are conducted at a plant in Netanya, that is usually active in one shift and is supplemented as required, except for the weekend. Pallets are manufactured at a plant in Netivot, operating in one shift, except for the weekend. |
10.15.5. | As of December 31, 2010, Carmel's production capacity for corrugated board in its Caesarea plant is estimated at 100,000 tons, and at the Carmel plant in Carmiel - at 15,000 tons. Actual production currently utilizes 80% of production capacity at the Caesarea plant and 85% of production capacity at the Carmiel plant. |
| 10.16. | Research and development in the packaging products and cardboard operating sector |
| 10.16.1. | Carmel, together with Galbital RFID Solutions (hereinafter: "Galbital"), in equal parts, conducts research and development activity regarding new implementations in packaging and transportation. The company and Galbital are currently in the process of registering a patent for the implementation of RFID technology in the area of inventory management. |
| 10.17. | Fixed assets, real estate and facilities in the packaging products and cardboard operating sector |
| 10.17.1. | Real Estate |
| 10.17.1.1. | Carmel owns some 15,000 square meters in Netivot. Carmel leases land and buildings from a company owned by the controlling member of the Company in the industrial area in Caesarea, and the Company leases buildings in Carmiel, at Kibbutz Mishmarot and in Netanya, all for the following periods and under the following conditions: |
| 10.17.1.2. | Caesarea, lease agreement for Carmel’s central site, located on an area of some 90,000 m², where corrugated board manufacturing operations are concentrated. The lease agreement was signed with Gev-Yam Properties Ltd., a company controlled by the Company's controlling shareholder, in April 1994, for a period of 20 years from the date of population of the building, in 1996. |
| 10.17.1.3. | Netanya, Tri-Wall’s manufacturing site, spread over an area of 22,000 m². The lease agreement is for a period of two years ending in December 2012. |
60
| 10.17.1.4. | Caesarea, Frenkel CD site in Caesarea, spread over an area of some 21,000 m², used for manufacture, storage and supply of merchandise. The lease agreement was signed in 2005 for a period ending in 2020 (including an extension option). The landlord is a company owned by the minority shareholders in Frenkel CD. |
| 10.17.1.5. | Furthermore, the sector of operations also has additional warehouses at Kibbutz Mishmarot and another manufacturing site in Caesarea. |
| 10.17.2. | Fixed Assets |
| 10.17.2.1. | Carmel's fixed assets primarily include machinery and manufacturing equipment for paper corrugation and processing machines, which perform cutting, printing, gluing and folding, to complete the final product. Carmel owns two corrugators and approximately 12 processing machines. Carmel also owns two digital printing machines capable of printing on corrugated board and other rigid materials, with a high printing quality, a range of sales promotion applications, display stands and billboards. |
| 10.17.2.2. | Carmel has a vehicle fleet, which includes cars, under an operating lease, and fork-lifts, some of which are owned by the Company and some under an operating lease. Carmel operates a truck fleet through sub-contractors. |
| 10.17.2.3. | Frenkel CD owns four printing machines and 21 additional machines. |
| 10.17.2.4. | Tri-Wall owns two processing lines for the manufacture of pallets and two lines for the manufacture of special packaging. |
| 10.17.2.5. | Carmel has established current liens on its assets in benefit of the banks and the State of Israel. Moreover, Frenkel CD has established current and permanent liens on its assets in favor of the banks and the State of Israel. |
| 10.18. | Raw materials and suppliers in the packaging products and cardboard operating sector |
| 10.18.1. | In the packaging products and board sector there are purchasing contracts with suppliers for the purchase of auxiliary materials such as chemicals, adhesives and various packaging materials. |
| 10.18.2. | Prices are determined by negotiation with suppliers, every month, accounting for market conditions and prices of competing imports. |
| 10.18.3. | The main raw material in the production of corrugated board is paper. This raw material forms the central component of the cost of sales, representing approximately 50% of the final product’s cost. Carmel has two central suppliers in the paper sector: (1) Hadera Paper, the shareholder in Carmel, that supplies recycled paper, from whom the purchasing in the years 2010 and 2009 amounted to NIS 70.1 million and NIS 69.8 million, respectively, representing 37% and 47%, respectively, of the total annual paper consumption of Carmel during those same years; and (2) International Forest Products, a member of the Kraft group, provider of virgin paper, from whom the purchasing in the years 2010 and 2009 amounted to NIS 36.7 million and NIS 39.7 million, respectively, that represented 19% and 23%, respectively, of the total annual paper consumption of Carmel during those same years. |
61
| 10.18.4. | The principal auxiliary materials that are used by Carmel in the manufacture of corrugated board include starch and fuel oil. Starch constitutes the main component in the adhesive that glues the paper sheets. The starch provider is Galam Ltd. Carmel also utilizes auxiliary materials such as embossing devices and printing plates, purchased from several local suppliers, as well as wooden pallets produced by Tri-Wall. |
| 10.18.5. | The main raw materials used by Tri-Wall for the manufacture of containers (in its Netanya plant) are triple-wall boards manufactured by Carmel as well as varied packaging materials such as plywood, padding materials and metal parts which are acquired from several local suppliers. |
| 10.18.6. | The principal raw materials used by Frenkel CD in the manufacture of cardboard shelf packaging include duplex board and some corrugated board. Duplex cardboard is mostly imported directly from Europe and the US and is purchased in part from local agents (indirect imports). Corrugated board supply from Carmel accounts for 20% of Frenkel-CD's raw materials. |
| 10.18.7. | Carmel, Frenkel-CD and Tri-Wall are not dependent on any supplier. |
| 10.19. | Working Capital |
| 10.19.1. | Raw Material and Finished Goods Inventory Policy |
| 10.19.1.1. | Raw material and finished goods inventory - The Company maintains operating inventory of raw materials - primarily paper - and finished goods, equivalent to consumption and delivery over 3 to 4 months. |
| 10.19.1.2. | Maintenance material inventory - The Company has an inventory of maintenance materials for use with means of production, based on expected consumption volume and the need to maintain continuous operation of the machines, at a quantity that is variable in line with the orders. |
| 10.19.2. | Goods return or replacement policy |
| 10.19.2.1. | Goods in this operating sector are sold as final sale to customers, and are returned in case of faulty product or due to mismatch between order and delivery. When a customer complains of a faulty or mismatching product, the complaint is reviewed and if correct, the goods are returned and the customer is credited. Based on past experience, the volume of returns is not material to total operation volume. |
62
| 10.19.3. | Average credit duration |
| Below are data regarding average credit duration and amount for suppliers and customers in 2010 and 2009: |
| Average 2010 | Average 2009 | |||||||||
| Average credit volume | Average credit days | Average credit volume | Average credit days | |||||||
| Accounts receivable - trade | NIS 182 million | 144 | NIS 164 million | 134 | ||||||
| Accounts Payable | NIS 108 million | 111 | NIS 104 million | 117 | ||||||
| 10.19.4. | Customer credit days have increased, following their agreed extension opposite the clients, one obtaining appropriate collateral. Supplier credit days have decreased in 2010 following a change in the payment terms and in the mix of suppliers. |
| 10.19.5. | The average days of inventory in this sector of operations in 2010, totals 57 days. |
| 10.20. | Environmental protection in the packaging products and cardboard operating sector |
| This part was discussed as part of the environmental discussion at the corporate level. See Section 17, below. |
| 10.21. | Restrictions and regulation on corporate operations in the packaging products and cardboard operating sector |
| 10.21.1. | Work Hours Law – This area of operations is subject to the provisions of the protection laws in the area of labor law, including Work and Rest Hours Law 5741 – 1981. For further details see section 8.23.4, above. |
10.21.2. | Consumer Provisions - The companies in this area of operations are subject to various consumer provisions, including by power of the Consumer Protection Law 5741 – 1981 and the Liability for Faulty Products Law 5740 – 1980. For further details see section 24.1.24.2, below. |
| 10.21.3. | Business Licenses - |
| 10.21.3.1. | Carmel has a business license in effect from April 9, 1998. Furthermore, the Ministry for the Protection of the Environment has set out additional conditions for the business license in a document from October 2006. To the best of the Company’s knowledge, the Company complies with all the requirements and conditions required under the license as mentioned, and all other conditions. |
63
| 10.21.3.2. | Frenkel CD holds a business license since 1995. To the best of the company's knowledge, the company is in compliance with all the terms and conditions related to the validity of the license. |
| 10.21.4. | Work Safety |
| The companies in the sector are subject to legislation concerning work safety and health. For additional details, refer to Section 8.23.9, above. |
| 10.21.5. | Quality Control and Regulation |
| 10.21.5.1. | Carmel and Frenkel CD operate in accordance with quality and control standards as customary for international companies, and are compliant with the requirements of international standard 2000: ISO-9001 and the HACCP and BRC/IOP international standards for food-safety management. In addition, Carmel was certified for the Environmental Quality Standard 14001 and Safety 18001. Carmel was awarded a Platinum Award from the Israeli Institute of Standards, as one of 20 companies in Israel possessing five quality standards. |
| 10.21.5.2. | Tri-Wall operates in accordance with quality and control standards as customary for international companies, and is compliant with the requirements of international standard: 15 ISPM 9001, ISO, standard for disinfection in agriculture. |
| 10.21.5.3. | Furthermore, Company operations at its facility are subject to provisions of product-related quality standards, municipal laws (primarily business license) and globally accepted standards. |
| 10.22. | Anticipated development over the next year for the operating sector |
| 10.22.1. | Moreover, Carmel is interested in gradually expanding the proportion of recycled paper out of the raw materials that are used for the production of its products, at the expense of virgin paper. It should be noted in this respect that in Europe, between 85% and 90% of the raw materials that serve in the manufacture of packaging products and cardboard are recycled materials and that there exists a trend of a rise in the use of recycled materials in this sector in Israel as well. |
| 10.23. | Risk factors in the packaging products and cardboard operating sector |
| For details of macro-economic risk factors, see section 23, below. |
| 10.23.1. | Sector-Specific Risk Factors |
| 10.23.1.1. | Regulation- Operations in the packaging products and cardboard sector are subject to regulation of various issues (for further information see section 10.21, above). Changes in regulation may impact companies operating in this operating sector, e.g. stricter environmental protection regulations, including the Packaging Law and government decisions concerning the raising of minimum wages. |
64
| 10.23.1.2. | Competition - This operating sector is competitive, with competition against three principal competitors in Israel, as well as against imported products (in this respect, see Section 10.13, above). |
| 10.23.1.3. | Raw materials - A rise in the prices of raw materials, primarily paper - which is a material component in the production cost of cardboard, as well as an increase in the prices of other inputs, such as gas, electricity, transportation and starch - may impact the profitability of companies in this sector of operations. |
| 10.23.1.4. | Environment - Requirements of the Ministry of Environmental Protection with regard to this sector and its facilities require the Company to allocate financial resources to this issue. These demands could expand and increase because of the growing awareness toward protection of the environment, which could force the companies in this sector to allocate additional resources. |
| 10.23.1.5. | Furthermore, as the Company deals, inter alia, in dangerous and toxic materials, it is exposed to damages likely to be caused because of these products, including health damages, environmental damages, damages resulting from flammable materials catching fire and the like. Hence the Company is exposed to claims which may negatively impact the business results of the operating sector as well as Company reputation. |
| 10.23.1.6. | Exposure to foreign currency - The operations in the packaging products and board sector are exposed to risks on account of the changes in currency exchange rates, since a large part of the raw materials are imported. Changes in exchange rates of various currencies vis-à-vis the NIS may erode profit margins and cash flows. |
| 10.23.1.7. | Closure of ports- The companies in this sector of operations import many raw materials used for the manufacture of their products. Shutting down the ports in Israel will harm the imports of raw materials and will directly impact the operations of companies in the sector. However, since the companies in the sector maintain an inventory of raw materials, only a prolonged closing of the ports will have a medium impact on operations. |
| 10.23.2. | The extent of impact of risk factors |
| The company’s estimates regarding the types and measure of the influence of the aforesaid risk factors on the sector of operations appears below. For details of macro-economic risk factors, see section 23, below. |
| Risk Factors | Degree of Impact | ||
| Considerable Influence | Medium Influence | Small Influence | |
| Sector-related factors | -Prices of raw materials | -Closing of ports | -Regulation |
| -Competition | -Raw Materials | ||
| -Environmental protection | |||
| -Exposure to foreign currency | |||
65
| 11. | Fine paper sector |
| Hadera Paper Printing manufactures fine paper (printing and writing paper), and sells imported paper, such as coated paper and special paper, complementary to its product range. Following below are additional details regarding the fine paper sector and its operations. |
| 11.1. | Structure of the fine paper sector |
| 11.1.1. | The fine paper sector deals in the manufacture and marketing of writing and printing paper, including special paper types and coated paper. Operations in this sector are conducted by the company through the subsidiary Hadera Paper Printing (formerly "Mondi Hadera paper Ltd."). Hadera Paper Printing and its competitors in the sector market fine paper to active customers including printers, publishing houses, marketers of office supplies, producers of paper products such as notebooks, envelopes and so on, as well as to wholesalers that operate opposite smaller customers. |
| 11.1.2. | Hadera Paper Printing is a privately held company that was established in 1999. As part of a transaction conducted between the company and an Austrian company that is a member of Mondi Business Paper Ltd. Group. (hereinafter: MBP"" or "Mondi Group") in February 2000, Mondi Group acquired 50.1% of the shares of Hadera Paper Printing (the company operations in the fine paper sector was separated prior to the transaction and transferred to Hadera Paper Printing, that was established for this purpose). |
| 11.1.3. | On September 7, 2010, the company signed an agreement with a subsidiary of Mondi Group that held - prior to the transaction - 50.1% of the issued and outstanding share capital of Hadera Paper Printing, pursuant to which Mondi Group will sell to the company 25.1% of the issued and outstanding share capital of Hadera Paper Printing in consideration of €10.364 million (hereinafter: "The Acquisition Transaction"). |
| 11.1.4. | The Acquisition Transaction includes, inter alia, the amendment of the existing shareholder agreement between the parties, pertaining to their holdings in Hadera Paper Printing, including also the changes necessary as a result of the modification of the holding percentages, as well as the amendment of the existing agreements between the shareholders and Hadera Paper Printing, all as detailed below. |
| 11.1.5. | The approval of the Antitrust Supervisor regarding the merger of the companies was received on November 4, 2010 and as of December 31, 2010, the acquisition transaction was finalized. Pursuant to the transaction, the company holds 75% of the shares of Hadera Paper Printing, whose results have been consolidated with those of the company. True to the date of the report, the shareholders of Hadera Paper Printing include Hadera Paper (that holds, together with the subsidiary AIPM Marketing (1992) Ltd., 75% of the issued and outstanding share capital of Hadera Paper Printing) and Mondi Group (that holds 25% of the issued and outstanding share capital of Hadera Paper Printing). Regarding the accounting implications, see Note 17 to the financial statements of the company, dated December 31, 2010, that are attached to this report. |
| 11.1.6. | For additional details regarding the acquisition transaction, see section 11.24.2, below. |
66
| 11.2. | Developments in the fine paper sector and changes to its customer profile |
| 11.2.1. | The fine paper sector in Israel is a stable market characterized by slow growth. The variables that affect this market include primarily the ratio between global supply and demand for paper products and the overall level of economic activity, that affect the amount of printing and advertising products. In the course of this period, the operations of several global plants were discontinued and the global supply of paper has decreased. |
| 11.3. | Critical success factors in the Fine Paper sector of operations and changes therein |
| Several critical success factors may be indicated for Company operations in the Fine Paper sector, which impact its operations: |
| 11.3.1. | Investment in necessary production equipment - Machines used in paper production are very costly, in terms of both acquisition and maintenance cost. Consequently, financing capabilities and the ability to raise funds, constitute an advantage in the sector of operations. |
| 11.3.2. | Local producer - In this operating sector, a local producer enjoys a significant advantage over imports, as the former is able to ensure a constant supply of the product, at a relatively short lead time and at the size and quality required by customers, thereby saving them the need to maintain large inventories. |
| 11.3.3. | Product quality - The high quality of products is a critical success factor in the sector. |
| 11.4. | Changes to suppliers and raw materials in the sector |
| The price of pulp, one of the central raw materials in this sector, has increased significantly globally in 2010. |
| 11.5. | Major barriers to entry and exit in the sector of operations and changes therein |
| Most of the products marketed in this area in Israel, are manufactured products in which the company possesses an advantage as the local producer, capable of supplying small quantities at short lead times, although there also exist imported products. Due to entrance barriers into the sector, as detailed below, the structure of competition in the area is relatively stable. |
| 11.6. | Dividend distribution |
| 11.6.1. | Hadera Paper Printing did not distribute dividends to shareholders in 2009. |
| 11.6.2. | On July 26, 2010, the board of directors of Hadera Paper Printing approved the distribution of NIS 5,920 thousands as dividend to the shareholders. The dividend was distributed on August 11, 2010. |
| 11.6.3. | On December 31, 2010, the board of directors of Hadera Paper Printing approved the distribution of NIS 8,528 thousands as dividend to the shareholders. The dividend was distributed on January 31, 2011. |
67
| 11.6.4. | As of December 31, 2010, Hadera Paper Printing has distributable profits in the amount of NIS 118.7 million. |
| 11.6.5. | Dividend Distribution Policy: The shareholders agreement between Hadera Paper and MBP, that was signed as part of the acquisition transaction on September 7, 2010, defines a profit distribution policy, pursuant to which starting in 2011, subject to restrictions stipulated by law and as defined in the shareholders agreement, Hadera Paper Printing will distribute to its shareholders at least 50% of its earnings every year ("Minimum Distribution Sum"), all as described in the shareholders agreement. Notwithstanding the aforesaid, the board of directors of Hadera Paper Printing will be permitted to lower the minimum distribution sum in the event that distribution of the full aforesaid amount, together with capital expenses fixed in the annual budget, will cause a breach of Hadera Paper Printing’s financial undertakings versus financial institutions. If Hadera Paper Printing’s board of directors resolves to distribute an amount lower than the minimum distribution sum, the undertaking to distribute the balance of the amount not distributed out of the minimum distribution sum will be carried over to the following year (for a period not exceeding two years). |
| 11.6.6. | Pursuant to financial covenants which Hadera Paper Printing has undertaken to the banks, for the purpose of receiving credit facilities, the ratio of shareholders' equity to total assets will not be less than 22% and therefore, no dividend will be distributed as a result of which the ratio of shareholders' equity to total assets will fall below 22%, after taking into account an approved investment budget. True to the date of the report, Hadera Paper Printing is in compliance with the financial covenants outlined above. |
| 11.7. | Economic environment and the impact of external factors on operations in the fine paper sector |
| 11.7.1. | Due to the global economic crisis in 2009, a deterioration was recorded in the ratio between the demand and supply for the paper products sold by Hadera Paper Printing. This deterioration brought about an erosion of the selling prices in the sector in 2009, yet in light of the discontinuation of operations in several plants worldwide, the supply of paper on the local market decreased throughout most of 2010 and Hadera Paper Printing has raised selling prices on the local market in 2010. The price of pulp, the principal raw material in paper production, rose sharply in relation to the 2009 prices. Light of the raising of selling prices, despite this rise in the cost of pulp, Hadera Paper Printing managed to avoid any damage to its profit margins in relation to the profitability in the years 2008 and 2009. |
| 11.8. | Products and services in the fine paper sector |
| Manufacture of Fine Paper |
| 11.8.1. | Hadera Paper Printing is the only manufacturer in Israel of fine paper. However, there are many importers operating in the Israeli market who import fine paper. |
| 11.8.2. | The annual production volume produced by Hadera Paper Printing amounted to 141,000 tons in 2010, as compared with 139,000 tons in 2009. The growth in manufacturing output in 2010 originates from the improved efficiency of the manufacturing processes in relation to 2009 (when the efficiency of the paper machine of Hadera Paper Printing deteriorated due to mechanical failures in the course of the year). The manufactured paper is intended for marketing on the domestic market, for direct exports and for inventories. |
68
| 11.8.3. | During 2010, approximately 101 thousand tons of paper produced by Hadera Paper Printing were marketed in the local market. The remainder, consisting of some 34 thousand tons, was designated for direct export to the United States, Italy, Egypt, Jordan and Turkey. In 2010, Hadera Paper Printing expanded its direct exports to the United States, where profit margins are higher than in the Middle East. The company intends to continue to work toward expanding exports, while placing special emphasis on increasing exports to the United States. |
| The above information concerning the expansion of Hadera Paper Printing’s direct export to the United States constitutes forward-looking information as defined in the Securities Act, and comprises forecasts and estimations whose realization is not absolute and is based upon Hadera Paper Printing’s existing information as of the date of this report. The sector's forecasts and estimates may not materialize, all or in part, or may materialize in a way which is materially different than anticipated. The principal factors that could influence this are dependent upon external factors, developments and changes in regulation in the sector of operations, changes in supply and demand in the sector and/or the realization of any of the risk factors listed in Sections 11.26 and 23, below. |
| 11.8.4. | In 2010, a quantitative decrease was recorded in sales to the domestic market of 4,400 tons (approximately 4.3%), while in 2009 the Company recorded a quantitative increase in sales to the local market of 4,000 tons (approximately 3.6%). Despite the quantitative decrease, growth was recorded in the sales turnover of Hadera Paper Printing to the local market in 2010, in the sum of approximately NIS 31 million, as compared with 2009, primarily as a result of the 12% rise in selling prices. |
| 11.8.5. | Growth was recorded in 2010 in the sales of Hadera Paper Printing to direct exports, as compared with 2009, in the sum of approximately NIS 8 million. |
| 11.9. | Sales of imported paper |
| 11.9.1. | As aforesaid, Hadera Paper Printing compliments its basket of products by the importing of paper from Europe (such as coated and special papers that it does not manufacture) and the Far East. The annual volume of imports by Hadera Paper Printing in 2010 amounted to approximately 40,000 tons of paper, which are marketed by the company exclusively to the domestic market, as compared with 37,000 tons of paper in 2009. |
| 11.9.2. | Amongst Hadera Paper Printing’s suppliers of paper are Stora Enso and the APP Group, who are its main suppliers of different types of coated papers. The Company began working with an additional supplier in 2009 - Moorim Group - that is also one of the largest global producers of coated paper. For additional details regarding suppliers, see Section 11.8, above. |
69
| 11.10. | Distribution of revenues and profitability of products and services in the fine paper sector |
| 11.10.1. | The sales turnover of the fine paper sector in 2010 amounted to NIS 728.7 million, up from NIS 669.2 million in 2009. The selling prices of fine paper on the global market are affected by the ratio of supply to demand and the ability of the companies to raise prices as a result of changes in input prices. The trend that began in mid-2008 consisting of a sharp decrease in pulp prices (a principal component in the manufacture of paper), came to an end by the end of 2009, followed by a sharp rise in pulp prices in 2010. Due to lacking demand in relation to the global supply of paper, the worldwide prices of paper did not rise significantly as warranted by the rise in pulp prices. As opposed to this trend of a moderate increase in paper prices worldwide, on the local market, due to the discontinuation of manufacturing by several global plants, the supply of paper decreased until the fourth quarter of 2010, as Hadera Paper Printing raised prices on the domestic market, as warranted by the rise in pulp prices. This accounts for the increase in the sales turnover of the company in 2010, as compared with the decrease in the sales turnover in 2009. |
| 11.10.2. | For further financial information regarding Hadera Paper Printing, see its financial statements as at December 31, 2010, attached to this report. |
| 11.11. | Customers of the fine paper sector |
| 11.11.1. | Hadera Paper Printing markets its products to a large variety of customers in Israel and abroad. During 2010, approximately 101 thousand tons of paper produced by this sector were marketed in the local market. The remainder, consisting of some 34 thousand tons, was designated for exports. |
| 11.11.2. | In Israel, Hadera Paper Printing possesses approximately 450 customers, with the central customers being printing houses (approximately 21%), paper wholesalers (approximately 19%), office supplies wholesalers (approximately 32%), manufacturers of paper products (approximately 28%) and end users. |
11.11.3. | Overseas, Hadera Paper Printing markets to big wholesalers in the paper sector, as well as to large printing houses and manufacturers in Jordan. |
| 11.11.4. | As part of the export operations, in 2010, Hadera Paper Printing expanded its exports to the United States, where profit margins are higher than in the Middle East. The company intends to continue to work toward expanding exports, while placing special emphasis on increasing exports to the United States. |
| The above information concerning the expansion of Hadera Paper Printing’s direct export to the United States constitutes forward-looking information as defined in the Securities Act, and comprises forecasts and estimations whose realization is not absolute and is based upon Hadera Paper Printing’s existing information as of the date of this report. The sector's forecasts and estimates may not materialize, all or in part, or may materialize in a way which is materially different than anticipated. The principal factors that could influence this are dependent upon external factors, developments and changes in regulation in the sector of operations, changes in supply and demand in the sector and/or the realization of any of the risk factors listed in Sections 11.26 and 23, below. |
70
| 11.11.5. | Hadera Paper Printing is not dependent upon any single customer or group of customers that might significantly influence its operations. Furthermore, Hadera Paper Printing does not have any revenues from any single customer that constitute more than 10% of its total revenues. |
| 11.12. | Marketing and distribution in the fine paper sector |
| 11.12.1. | Hadera Paper Printing possesses a local distribution system that provides it with the ability to market its products to a variety of customers operating within the Israeli market. During the years 2006-2010, Hadera Paper Printing worked to expand its distribution network, and even secured institutional tenders, including the provision of distribution services to customers down to the end user level. |
| 11.12.2. | Distribution to Middle-East customers is carried out to border points (to Egypt via the Nitzanim Terminal and to Jordan via the Sheikh Hussein Bridge), with the transportation from these border points to the actual customer being done at the customers' expense. The distribution to additional export customers, including the United States, is made to the closest marine port in proximity to the customer's place of business. |
| 11.12.3. | Hadera Paper Printing distributes its products from two logistic sites - the logistics center in Modi'in and from Hadera. |
| 11.12.4. | The large principal site is the company site in Hadera, that is in close proximity to the manufacturing and finishing facilities of Hadera Paper Printing. Paper is distributed from this site to the company's customers in Israel and overseas. Paper that is designated for export, is transferred to containers that are sent to the seaports by truck. Paper intended for marketing on the domestic market is partially sent directly from the Hadera site to the larger customers of the sector nationwide, while another part is distributed from the new logistics center in Modi'in, as detailed below in this section. True to the date of the reports, approximately 103,000 tons per annum are distributed from the Hadera site. |
| 11.12.5. | In November 2010, Hadera Paper Printing moved its logistics center to the new Logistics Center in Modi'in, replacing the sites in Holon and in Haifa, as detailed below. The Logistics Center worked, advancing on the learning curve with constant progress during December 2010, until reaching full capacity. An advanced storage system was installed at the Logistics Center, based on radio shuttle technology, allowing for the optimal storage of large quantities of paper. The warehouse is managed using software for warehouse management according to location, allowing optimal management of paper inventories. Paper is distributed from the Logistics Center to customers of the sector throughout the country, in order to provide an immediate level of service and maintain low levels of paper inventories in their respective warehouses. Furthermore, all the imports of writing and printing paper is directly taken in at the Logistics Center (some of the imported paper is transferred directly to the customers from the sea ports). Distribution from the Logistics Center is performed using trucks belonging to Hadera Paper Printing, through sub-contractors, and using trucks belonging to customers of the sector. As of the date of this report, the Logistics Center site is planned to distribute some 42,000 tons per year. For details regarding the Logistics Center, see Section 12.3 above and Note 14e to the company's financial statements as at December 31, 2010. |
71
| 11.12.6. | The above information with regard to the planned volume of distribution from the logistics center, constitutes forward-looking information as defined in the Securities Act, and merely consists of forecasts and estimates by Mondi which are not certain to materialize and are based on information available to in the sector as of the report date. The sector's forecasts and estimates may not materialize, all or in part, or may materialize in a way which is materially different than anticipated. The principal factors that could influence this are dependent upon external factors, the efficiency and assimilation of the systems at the logistics center, developments and changes in regulation in the sector of operations, changes in supply and demand in the sector and/or the realization of any of the risk factors listed in Sections 11.26 and 23, below. |
| 11.12.7. | Upon the transition to the logistics center, the leasing contracts of the company in the sector, at the Holon and Nesher sites have terminated. From the site located in Holon, products were distributed to customers of the sector in the greater Tel Aviv area and in Jerusalem, while the Nesher site located in proximity to Haifa, catered to customers in the northern region of the country. |
| 11.12.8. | As of the date of the report, the sector is not dependent upon any single marketing site listed above in this section. |
| 11.13. | Order backlog in the fine paper sector |
| There is no order backlog in the sector. The orders are made with short lead times and on the basis of customer forecasts. |
| 11.14. | Competition in the fine paper sector |
| 11.14.1. | The entry barriers to manufacturing fine paper are high due to the heavy investments in paper machinery required for its production. On the other hand, Hadera Paper Printing is exposed to competition from paper importers who do not come up against entrance barriers to the Israeli market. As there are no restrictions, obstacles or customs imposed on paper imported into Israel, Hadera Paper Printing must constantly maintain its advantages as a local manufacturer, such as availability, flexibility, service and quality, in order to deal with its competitors. |
| 11.14.2. | Hadera Paper Printing’s main competitors are the following paper importers: Niris Ltd., Ronaimer Ltd., Allenper Trade Ltd., Mei Hanahal Ltd. and BVR Ahvat Havered Ltd. The company estimates that the market share of Hadera Paper Printing in this sector in the domestic market is approximately 50%. We emphasize that the aforementioned market share is based on the company's internal assessment as of the report date. |
| 11.14.3. | Due to the global economic crisis, competition on the part of paper importers has increased and consequently, surplus supply has been created in the fine paper market at dumping prices. On February 26, 2009, the Company announced that Hadera Paper Printing filed a complaint with the Supervisor of Anti-Dumping Charges at the Ministry of Industry, Trade and Employment (hereinafter in this section: "The Supervisor"), regarding dumping imports of fine paper from several European nations to Israel. Upon review of the complaint, the Supervisor decided to launch an investigation of this issue. On may 27, 2010, the Supervisor announced that in light of developments in the paper market in the recent past and in view of information that he had received, a decision was made to close the investigation. Despite the damages incurred by the company in the past as a result of imports at dumping prices, the company announced that it does not object to the Supervisor's decision, given the changes in the market. |
72
| 11.15. | Seasonality |
| In the fine paper sector, the seasonality does not affect demand. |
| 11.16. | Output capacity in the fine paper sector |
| Under Hadera Paper Printing’s proprietorship is a paper production machine for fine paper. As of the date of this report, it is operating at full capacity all year round, 24 hours a day, in 3 work shifts (except for planned maintenance stoppages). Furthermore, under Hadera Paper Printing’s ownership is equipment for processing the aforesaid finished products, at a high production rate (approximately 55%) in 2-3 shifts as needed. |
| 11.17. | Fixed assets, real estate and facilities in the fine paper sector |
| 11.17.1. | Hadera Paper Printing leases most of its areas and the buildings used for production and storage in Hadera, from the Company. The lease term is 24 years and 11 months, starting in November 1999. Pursuant to the agreement, each party is entitled to cancel the agreement by providing an advance notice of 10 years, in addition to which each party is entitled to cancel the lease of parts of the leased property by providing a one-year advance notice. |
| 11.17.2. | Hadera Paper Printing leases the areas and building used at the Modi'in Logistics Center from the Company, also serving Amnir and Graffitti, its subsidiary companies. The lease agreement is for a period of 15 years starting November 2010, and is a back to back lease agreement to the lease agreement the Company signed with Gev Yam Ltd., the lessor of the property. Pursuant to the agreement, each party is entitled to cancel the agreement once ten years have passed, by providing an advanced notice of 180 days, in addition to which each party is entitled to cancel the lease of parts of the leased property by providing a one-year advance notice. |
| 11.17.3. | The distribution sites of Hadera Paper Printing in Holon and Nesher have been relocated to the new logistics center in Modi'in at the end of 2010. For details regarding the Logistics Center, see Sections 8.18.6.2 and 12.6, below and Note 14e to the company's financial statements as at December 31, 2010. |
| 11.17.4. | Fixed assets: Following construction work and investments made by Hadera Paper Printing in the past on the paper machine, the output capacity of the paper machine reached 144,000 tons in 2008. Investments were made by Hadera Paper Printing in the machine during the years 2010 and 2009 at sums that were immaterial and whose purpose was only to preserve the existing situation. For details regarding the sector in Hadera, see Section 12, below. |
73
| 11.18. | Raw materials and suppliers in the fine paper sector |
| The operations in this sector require the following raw materials: |
| 11.18.1. | Pulp – |
| 11.18.1.1. | The principal raw material used in the production of paper is pulp. |
| 11.18.1.2. | Engagement for purchase of pulp is performed by the holder of the minority interests in the company - MBP - in a centralized manner for the sector and for its other plants in Europe, allowing for a constant supply of pulp as well as economies of scale. For details regarding assistance from MBP in the purchasing of raw materials, see Section 11.24.2.4, below. Under the annual negotiations that are conducted between MBP (in coordination and in cooperation with the responsible officer in the sector) and pulp suppliers, framework agreements are made between them and MBP which obligate them to supply a certain amount of pulp to the MBP Group (with the sector included therein). These agreements do not set pulp prices, which are set in a routine manner according to pulp’s global market prices every month. Hadera Paper Printing pays the pulp price directly to the supplier and pays a commission to MBP only in order to cover its costs. Hadera Paper Printing purchases approximately 116,500 tons of pulp annually, of three principal types. All the pulp is purchased overseas within the framework of long-term contracts, which include mechanisms for price adjustment and suppliers’ undertakings to ensure the supply of pulp from alternative sources in the event that the supplier cannot provide the agreed quantity. There is a relative flexibility in the demand for types of pulp, with shifting from one type of pulp to another, and as the world pulp market is quite a large one relative to the use by the sector, the company is in effect not dependent on any particular supplier or on any particular type of pulp. If need be, it would be possible to purchase any type of pulp in any quantity immediately on the free market. |
| 11.18.1.3. | The principal pulp supplier for Hadera Paper Printing is International Forest Products Corporation. The supplier is located in the United States and the volume of purchasing from the supplier the years 2000 and 2009 amounted to 41% and 39% respectively, out of total pulp purchases, and represented 24% and 14%, respectively, out of the total purchases made by Hadera Paper Printing from all suppliers of raw materials during these years. |
| 11.18.1.4. | The sector is not dependent upon any particular pulp supplier. |
| 11.18.1.5. | The sector is exposed to fluctuations in the price of pulp, used as the main raw material in the production of paper. Unusual rises in the prices of pulp could harm profits, unless the company can realize such rises in the sale price of its products. In the course of 2010, pulp prices rose sharply and then proceeded to grow more moderate only towards the end of the year, as pulp prices started to decrease moderately in the fourth quarter. |
74
| 11.18.1.6. | Coated paper - Hadera Paper Printing imports coated paper mainly from APP Group and from STORA ENSO. Hadera Paper Printing has no dependency whatsoever on APP and Stora Enso as the aforesaid paper suppliers. However, in the event that Hadera Paper Printing were to cease collaborating with the suppliers, it would incur a certain short-term damage, since it would need to purchase coated paper from other suppliers, a process that could potentially increase the purchasing cost in the short-term. |
| 11.18.1.7. | PCC - Another important raw material in the production of fine paper is PCC (Precipitated Calcium Carbonate). In May 2005, an agreement was signed between Hadera Paper Printing and Swiss company Omya International AG (hereinafter: “The Supplier”) for supplying PCC. In accordance with the aforesaid agreement, the supplier set up a factory in Israel for manufacturing PCC and began supplying it to Hadera Paper Printing in April 2006. The original agreement was for a 10-year term. This amendment to the original agreement stipulates that the original agreement would be extended by a further four years through December 31, 2020 and a different price mechanism was put in place, compared to the original agreement, starting from the signing date of the amendment. In September 2005, the agreement was transferred to UniCrystal Shefaya, Ltd. (which changed its name to Oumya Shefaya, Ltd., an Israeli company wholly owned by the supplier. The agreement with the supplier reduced the cost of PCC for Hadera Paper Printing both by the price reduction as well as the high technological efficiency of the purchased product. Hadera Paper Printing does have a dependency on the aforesaid PCC supplier. The proportion of purchases from the said supplier represented 3.5% and 4.2% respectively, in the years 2010 and 2009, out of total purchases of raw materials made by Hadera Paper Printing. |
| 11.18.1.8. | Starch – Hadera Paper Printing purchases starch from Galam Ltd. (hereinafter: “Galam”) for its paper production. Until 2009, Hadera Paper Printing was dependent on Galam as a single producer of starch in Israel, however, following the appearance of competing imports of starch, at prices competitive to those of Galam, this dependence has now decreased significantly. With respect to the other products, the dependence remains. |
| 11.18.1.9. | The engagement with Galam is for 11 years, terminating in 2011. Should Hadera Paper Printing's contract with Galam be terminated and not be renewed, Mondi would be required to import starch, which may increase its expenses for purchasing starch from alternative sources, such as the sector's overseas suppliers. Nevertheless, in light of competing imports, it would appear that no significant increase in the starch purchasing costs is to be expected. The proportion of purchases from the said supplier represented 2.3% and 3.6% respectively, in the years 2010 and 2009, out of total purchases made by Hadera Paper Printing. |
| 11.18.1.10. | The above information with regard to manufacturing costs, constitutes forward-looking information as defined in the Securities Act, and merely consists of forecasts and estimates by the sector which are not certain to materialize and are based on information available to the sector as of the report date. The sector's forecasts and estimates may not materialize, all or in part, or may materialize in a way which is materially different than anticipated. The main factors that could affect the aforesaid are dependence on external factors, changes in demand and supply in the market, and/or realization of any of the risk factors detailed in Section 12.1.22, below. |
75
| 11.18.2. | Hadera Paper Printing imports pulp and supplementary papers in foreign currency. As a result, there is a risk arising from fluctuations in the exchange rate (for further details regarding the aforesaid risk, see Section 12.1.22, below). |
| 11.18.3. | Hadera Paper Printing consumes natural gas as part of its energy supply system. For details regarding the agreement for the provision of gas, see Section 8.20.6, below. As to the impact of risk factors on energy prices, see Section 11.24.2, below. |
| 11.19. | Working Capital |
| 11.19.1. | As of the date of this report, Hadera Paper Printing’s working capital, as a percentage of its sales, stands at 22.4%. Hadera Paper Printing makes a policy of closely controlling its working capital, to ensure it is equal to the level required operationally. |
| 11.19.2. | Hadera Paper Printing’s inventory is managed by its logistics department. Stocking up on the purchased inventory of raw materials, auxiliary materials and finished products is carried out with a look toward keeping minimal inventory levels, Hadera Paper Printing’s operational requirements as well as business opportunities. |
| 11.19.3. | In Hadera Paper Printing’s routine operations, there are no returns of merchandise above the amount that is reasonable for its activities. All returned merchandise (following customer complaints concerning quality or incompatibility with its requirements) is approved by Hadera Paper Printing's competent authorities. The products are sold as a final sale to the customers and are returned as a result of a flaw or lack of compliance between the order and the delivery. When a customer complains of a faulty or mismatching product, the complaint is reviewed and if correct, the goods are returned and the customer is credited. |
Below are data regarding average credit duration and amounts for suppliers and customers in 2010 and 2009: |
| Average 2010 | Average 2009 | |||||||||||||||
Average credit volume NIS M | Average credit days | Average volume of credit (NIS M) | Average credit days | |||||||||||||
| Accounts receivable – trade | 180 | 94 | 176.5 | 92 | ||||||||||||
| Accounts Payable | 169 | 114 | 165 | 111 | ||||||||||||
76
| 11.19.4. | The gap between customer and supplier credit days originates from different market characteristics - customer credit days are influenced by short term credit granted to export markets while suppliers offer longer credits terms. |
| 11.19.5. | The average days of inventory at Hadera Paper Printing in 2010, total 80 days. |
| 11.19.6. | Hadera Paper Printing has customer credit procedures. It continuously monitors the credit extended to its customers through its financial department, concerning the making of timely payments. As of December 31, 2010, the Company’s average number of credit days (in local and foreign markets) stood at 94. Hadera Paper Printing maintains a credit insurance policy |
| 11.19.7. | A large part of the credit terms extended by suppliers is set by their agreements within MBP Group’s collective agreements. As of December 31, 2010, the average number of credit days extended to Hadera Paper Printing by its suppliers stood at 114. |
| 11.20. | Financing |
| 11.20.1. | Hadera Paper Printing only utilizes bank credit facilities. It does not have any non-bank credit sources (besides supplier credit). |
| 11.20.2. | As of December 31, 2010, Hadera Paper Printing has long-term loans of NIS 13 million, of which NIS 3.6 million are repayable in 2011. As of December 31, 2010, the average interest on these loans was 5.72% linked to the CPI, while the effective interest rate was almost identical to the average interest rate. As of the date of this report, all the loans are being serviced as required. |
| 11.20.3. | As of the date of this report, Hadera Paper Printing has bank-approved credit facilities totaling NIS 306 million (these include the aforesaid long-term loans). It is Hadera Paper Printing’s estimation that these credit facilities will meet its expected requirements for the coming years. Hadera Paper Printing has committed not to pledge any asset without prior consent of the banks. |
| 11.20.4. | As a financial covenant for the said loans and facilities, Hadera Paper Printing undertook vis-à-vis the banks that the ratio of equity to balance sheet total would be no less than 22%. As of the date of this report, the Company meets this covenant. |
| The aforesaid information concerning the fact that the credit facilities of the company are suitable for its needs for the next three years, constitutes forward-looking information as defined in the Securities Act, based upon the Company's estimations as of the date of this report as well as the existing information at the disposal of the company as of the date of this report. These estimations may not materialize, in whole or in part, or even materialize in a manner essentially different than expected. The major factors that could influence this are changes in supply and demand, macro-economic factors, not meeting objectives and/or the realization of any of the risk factors listed in Section 12.1.22, below. |
| 11.21. | Taxation |
| For details see Note 23 to the financial statements of Hadera Paper Printing as at December 31, 2010, attached to this report. |
77
| 11.22. | Environmental issues in the fine paper sector |
| For a discussion regarding environmental issues, see Section 17, below. |
| 11.23. | Restrictions on and Supervision of Corporate Operations in the Fine Paper Sector |
| 11.23.1. | Work Hours Law – This area of operations is subject to the provisions of the protection laws in the area of labor law, including Work and Rest Hours Law 5741 – 1981. For further details see section 8.23.4, above. |
| 11.23.2. | Work Safety- The sector is subject to legislation concerning work safety and health. For additional details, refer to Section 8.23.9, above. |
| 11.23.3. | Business Licenses - - Hadera Printing Paper has a business license for its operations at the Hadera site as part of the Company’s business license. The Company also has an independent business license for the Modi'in site. |
| 11.23.4. | Consumer Provisions - The companies in this area of operations are subject to various consumer provisions, including by power of the Consumer Protection Law 5741 – 1981 and the Liability for Faulty Products Law 5740 – 1980. For further details see section 24.1.24.2, below. |
| 11.23.5. | Quality Control and Regulation - The sector operates its major production facility at Hadera subject to the following standards: ISO 9901/2000 – Quality Management; ISO 14001 – Environmental Protection and Israeli Standard 18001 - Safety. |
| 11.23.6. | Furthermore, Hadera Paper Printing operations at its facility are subject to municipal laws and standards and globally accepted standards. |
| 11.24. | Material agreements in the fine paper sector |
| 11.24.1. | Oumya Shefaya Ltd. agreement - see Section 11.18.1.7 above. |
| 11.24.2. | Shareholders agreement at Hadera Printing Paper: Details below of the principles of the issues agreed upon between Hadera Paper and MBP under the shareholders’ agreement signed between the parties as part of the purchase transaction of September 7, 2010 , finalized on December 31, 2010, under which the Mondi Group, which held 50.1% of Hadera Printing Paper, sold the Company 25.1% of Hadera Printing Paper’s issued and outstanding share capital, in return for the sum of 10.364 million euro, from the Company's own resources. For further details see section 11.1 above . For legal opinion regarding the allocation f o the cost of purchasing Hadera Paper Printing see the Company's financial statements as at December 31, 2010 (hereinafter: "The Shareholder Agreement"). |
| 11.24.2.1. | Structure of the board of directors: Hadera Printing Paper’s board will include up to six directors. |
| So long as MBP holds at least 25% of the issued and outstanding capital of Hadera Printing Paper, MBP will be entitled to appoint two directors. In the event that MBP’s rate of holdings in Hadera Printing Paper falls lower than 25%, but remains higher than 12.5% of the issued and outstanding share capital of Hadera Printing Paper, MBP will be entitled to appoint one director. If MBP’s rate of holdings in Hadera Printing Paper falls lower than 12.5%, MBP will not be entitled to appoint any director at Hadera Printing Paper. |
78
| So long as the Company holds at least 75% of the issued and outstanding share capital of Hadera Printing Paper, the Company shall be entitled to appoint up to four directors. |
| Subject to the veto rights in the shareholders’ agreement (to be set out below), resolutions will be passed by the board of directors by a majority vote. |
| 11.24.2.2. | Veto Rights: So long as MBP holds at least 12.5% of the issued and outstanding share capital of Hadera Printing Paper, Hadera Printing Paper will not take certain actions set out in the shareholders’ agreement without the approval of (1) MBP and the Company, in the event the action requires shareholders’ approval; or (2) approval of one director appointed by MBP together with one director appointed by the Company, if the action has been passed by the board of directors. The actions named in the shareholders’ agreement include, inter alia, amendment of articles of association, transactions between interested parties, appointment of a CEO and CFO, appointment of an accountant, liquidation, merger, sale of substantial assets, change in the capital structure, allocation of securities of any type, changes in the rights assigned to shares, changes in the corporate structure, purchase of a substantial asset, entry into a new area of activities, agreements for the distribution of profits, granting exclusive rights in Hadera Printing Paper’s assets and the like. |
| 11.24.2.3. | Policy regarding distribution of profits: Starting in 2011, subject to the restrictions provided by law and in the shareholders’ agreement, Hadera Printing Paper will distribute at least 50% of its profits every year to its shareholders (the “Minimum distributed amount”). Notwithstanding the aforesaid, the board of directors of Hadera Paper Printing will be permitted to lower the minimum distribution sum in the event that distribution of the full aforesaid amount, together with capital expenses fixed in the annual budget, will cause a breach of Hadera Paper Printing’s financial undertakings versus financial institutions. |
| If Hadera Paper Printing’s board of directors resolves to distribute an amount lower than the minimum distribution sum, the undertaking to distribute the balance of the amount not distributed out of the minimum distribution sum will be carried over to the following year (for a period not exceeding two years). |
| 11.24.2.4. | Non-competition: MBP undertook, in its name and in that of its affiliated companies (as this term was defined in the shareholders’ agreement) , for a period of three years after the event of the earlier of the following: (A) The rate of MBP’s holdings or those of affiliated companies is not less than 25% of the issued and outstanding share capital of Hadera Printing Paper, (B) the rate of the Company’s and/or its subsidiary companies and/or affiliated companies is not less than 25% of the issued and outstanding share capital of Hadera Printing Paper; or – (C) MBP’s rights to appoint a director for Hadera Printing Paper expires (hereinafter: "“non-competition period”). |
79
| According to the shareholders’ agreement, and subject to legal restrictions, MBP has undertaken to assist Hadera Printing Paper in the purchase of raw materials (including pulp) from its sources, for preferred prices, provided such purchase is targeted for Hadera Printing Paper’s needs only. |
| The shareholders agreement further prescribes arrangements regarding cooperation in the transfer of information, the right to participate in allocation of securities of Hadera Printing Paper, future funding of the Company and the like. |
| 11.24.2.5. | Restriction agreement on transfer of shares: As part of the purchase transaction described in section 11.24.2 above, the restriction agreement on transfer of shares between the Company, MBP, American Israeli Paper Mills Marketing Ltd. and Hadera Printing Paper (hereinafter: "Restriction agreement on transfer of shares"). The principles of the Restriction agreement on transfer of shares are as follows: |
| 11.24.2.6. | Blockage Period: MBP undertook not to transfer the shares in Hadera Printing Paper, save in the cases named in the Restriction agreement on transfer of shares, for a period of three years from the date of completion of the purchase transaction (hereinafter: "the “blockage period”). |
| 11.24.2.7. | Right of First Refusal: Transfer of shares is subject to right of first refusal in cases set out in the agreement, such as transfer to an affiliated company (as the term was defined in the Restriction agreement on transfer of shares). |
| 11.24.2.8. | Call Option: To be realized after the party in breach has received notice to correct the breach and has not done so within 30 days, unless the breach is fundamental, repeating and intentional, where no option for correction will be given if over a period of two years three fundamental breaches have occurred. Upon occurrence of a breach (as the term was defined in the share transfer restriction agreement), including, inter alia, intentional violation of certain provisions of the agreements between the parties, bankruptcy, imposition of a lien for the purpose of enforcing a judgment against one of the parties for a substantial sum, the other party shall have the option to purchase all the violating party’s holdings in Hadera Printing Paper, at a price based on the an average multiplier of Hadera Printing Paper’s profits before tax, all as set forth in the share transfer restriction agreement, and in any event shall not be less than the minimal sum named in the agreement. |
80
| 11.24.2.9. | Put Option: In addition to the above, in the event of a breach event by the Company or by an affiliated company, MBP shall have the right to sell all its holdings in Hadera Printing Paper to the Company at the price described in section 11.24.2.8 above. |
| 11.24.2.10. | Additional Put Option: Any time after the conclusion of the blockage period, MBP has the option to sell the Company its holdings in Hadera Printing Paper at a price 20% lower than the value of Hadera Printing Paper (as defined in the share transfer restriction agreement) and this value shall not be less than the sum named in the agreement, as stated. Notwithstanding the aforesaid, MBP shall have the right to realize this option before the end of the blockage period in one of the following cases: (A) additional raising of capital for Hadera Printing Paper (by way of allocation of shares and/or owners’ loans) in which MBP has decided not to participate (B) transfer of shares in Hadera Printing Paper by the Company to a third party, where after such transfer, the Company ceases to held by Hadera Printing Paper by a majority of shares, or (C) changes in control of Hadera Printing Paper. |
| 11.24.3. | In addition to the agreements set out above, attached below are details of arrangements existing between Hadera Printing Paper’s shareholders and Hadera Printing Paper: |
| 11.24.3.1. | The Company leases the properties and buildings necessary for its operations in Hadera and at the Modi'in Logistics Center to Hadera Printing Paper. |
| 11.24.3.2. | The Company provides Hadera Printing Paper maintenance services and infrastructure. |
| 11.24.3.3. | MBP, via an affiliated company, granted Hadera Printing Paper the exclusive rights to use the Mondi brand name for products in Israel, as defined in the license agreement for the trademark in effect from December 31, 2010 (hereinafter: "the “license agreement”) for a period of one year from the date of signing the license agreement, free of charge. MBP may cancel said awarded rights of use in the event its affiliated companies transfer all holdings in Hadera Printing Paper shares. |
| 11.24.3.4. | Hadera Printing Paper was appointed distributor of MBP products in Israel. Distribution rights granted are exclusive for a period of non-competition as set forth in section 11.24.2.4 above. MBP was appointed by Hadera Printing Paper on a non-exclusive basis, as distributor of Hadera Printing Paper products in territories named in the marketing agreement in effect from December 31 2010, including in Europe. |
81
| 11.25. | Anticipated development over the next year for the operating sector |
Business Objectives and Strategy: As of the date of this report, the sector’s main objectives are: |
| 11.25.1. | Expanding the fine paper marketing, with an increased focus on branded paper for office use (A4). |
| 11.25.2. | Focus on local market activity and direct export markets to the Middle East and the United States – markets wherein the company possesses logistic and commercial advantages. |
| 11.25.3. | Expansion of the paper machine’s production capacity, in accordance with the demands for the sector's products, with the aim of expanding sales to the local market and export markets, and reducing manufacturing costs per ton of paper, in order to create an advantage in a competitive market. |
| 11.25.4. | Complementing this sector’s variety of papers marketed through the import of those that are not worthwhile to produce on its paper machine. Expanding the aforesaid variety will serve to complement the Company's basket of customer products and will provide the sector with synergy in terms of its clients. |
| 11.25.5. | Building and implementation of a marketing concept that positions the customer as the major asset for Hadera Paper Printing, while building a system of activities and communication to support this concept. |
| 11.25.6. | The sector's strategic goals as laid out above are based on the company's objectives and ambitions as of the reporting date and could change in accordance with the relevant decisions made by the company. |
| The aforesaid information constitutes forward-looking information as defined in the Securities Act, based upon the Company's estimations as of the date of this report as well as the existing information that it has as of the date of this report. These estimations may not materialize, in whole or in part, or even materialize in a manner essentially different than expected. The major factors that could influence this are changes in supply and demand, macro-economic factors, not meeting objectives and/or the actualization of one of the risk factors listed in Sections 11.26 and 23, below. |
| 11.26. | Risk factors in the fine paper sector |
| 11.26.1. | Macro-economic risk factors |
| 11.26.1.1. | Economic slowdown - An economic slowdown in the global market or an economic slowdown in the Israeli market, may potentially harm the demand for the type of products that the sector produces or imports, while increasing the competition from imports, thereby causing a decline in sector sales and harming its profitability. |
| 11.26.1.2. | Inflation - A high inflation rate may impact the sector’s payroll expenses, which are adjusted over time to changes in the consumer price index. |
82
| 11.26.1.3. | Exchange Rate - The selling prices of approximately 50% of the customers in this sector are denominated in US dollars or linked thereto, while the remainder is denominated in NIS. A devaluation of the USD (lower exchange rate) may lead to a decline in NIS-denominated sale prices, due to competing imports. Furthermore, the price of pulp and of some additional raw materials, which comprise a material share of the sector's production costs, are denominated in USD. Accordingly, significant changes in the exchange rate may impact the sector's results and profitability. |
| 11.26.2. | Sector-Specific Risk Factors |
| 11.26.2.1. | Competition - The sector operates in a competitive market where there exists competition against imported paper. For additional details, refer to Section 11.14, above. |
| 11.26.2.2. | Raw materials - Pulp is the main raw material used in paper manufacture. Material price hikes in pulp prices could harm the sector's profitability. Moreover, the company is also exposed to rises in the price of chemical inputs, such as starch. |
| 11.26.2.3. | Dependence on energy prices – The sector operations are dependent on energy consumption. A rise in energy prices or material delays in their supply could harm the sector's operations. However, due to the transition to natural gas, the impact of energy prices on this sector has decreased significantly. Regarding the influence of risk factors on energy prices, see Sections 8.20.6, 19.8 and 8.26.4.1. |
| 11.26.2.4. | Accounts Receivable Risks - Most of the sector sales are made in Israel, with some sales made without full collateral. Accordingly, Hadera Paper Printing is exposed to the risk of receiving the full credit owed it by it customers. At the same time, Hadera Paper Printing is continuously examining the quality of its customers and has a trade credit insurance policy, which provides insurance for some of the credit extended to customers of the Company. |
| 11.26.3. | Special Factors |
Dependence upon a single supplier - This sector is dependent upon Oumya Shefaya Ltd., the supplier of PCC (precipitated calcium carbonate). For additional details, refer to Section 12.1.13, above. |
83
| 11.26.4. | The extent of impact of risk factors |
| Following below is a list of the risk factor types and their influence upon the sector: |
| Risk Factors | Degree of Impact | ||
| Considerable Influence | Medium Influence | Small Influence | |
| Macro-economic factors | -Economic slowdown -Exchange Rates | -Inflation -Energy prices | |
| Sector-related factors | -Competition -Raw material prices | -Accounts Receivable Risks | |
| Special Factors | -Dependence upon a single supplier | ||
Hogla Kimberly Sector
For details regarding the sector of operations, see Section 24.1, below.
84
Chapter D – Additional Information Regarding the Company10
| 12. | Fixed assets, real estate and facilities |
Following below are details on the fixed assets and facilities in use by the Company:
| 12.1. | The main management's offices and the central production and storage facilities of the company are located in Hadera (hereinafter: "The Company Site"), on a site covering 350,000 m² (hereinafter: "The Plot"), part of which is owned by the Company (approximately 274,000 m²) and part (68,000 m²) is leased from the Israel Land Administration (hereinafter: "ILA"). Pursuant to the leasing agreements, the leases end between the years 2012 and 2056. Some of the leasing agreements involve discounting terms. |
Some of the plot is rented to associated companies that operate in the site.
| 12.2. | Moreover, the company leases from the ILA an area of 25,000 m² in Nahariya, that is under lease until 2018, that is rented out to an associated company (Hogla Kimberly), where a plant for the manufacture and processing of paper is located. The Company also faces the contractual rights by virtue of a development agreement, to an additional plot of 3500 m² in Nahariya, that is also rented out the Hogla Kimberly. |
| 12.3. | Amnir, a subsidiary of the Company, previously leased a plot in Bney Brak of 9,000 square meters from the Israel Land Administration, which housed a plant for the collection and recycling of paper and cardboard waste. This plot was sold - pursuant to an agreement dated July 25, 2010 - to an unrelated third party, in consideration of NIS 20 million, that are paid in installments until delivery of possession over the property. As to the capital gains from the sale of the property, see Note 15 (L) to the Company's financial statements dated December 31, 2010, attached to this report. Possession over the property is expected to be handed over at the end of March 2011. |
| 12.4. | On June 1, 2010 the Company entered into an agreement for the sale of its rights in a property covering 7,600 square meters in Tel Aviv (hereinafter: "The Plot"), that was leased from the Tel Aviv Municipality and served in the past as one of the Company’s paper manufacturing plants, in return for the overall sum of NIS 64 million, (hereinafter: "The sale agreement"). The purchasing parties are Gav Yam Property and Building Group Ltd., ("Gav Yam"), company indirectly controlled by IDB Development Company Ltd., the controlling shareholder of the company and by Amot Investments Ltd. ("Amot"), with shares of 71% and 29%, respectively. The agreement stipulates two contingent preconditions, regarding the extension of the eligibility period for construction rights and regarding the land inspection costs. As at December 31, 2010, no confirmation has been received that the preconditions have not been met. The sale agreement was approved by the Audit Committee and the Board of Directors of the company on May 31, 2010, and by the general meeting of the company on July 27, 2010. For additional details, see the company reports dated June 2, 2010, June 13, 2010 and July 11, 2010; reference numbers 2010-01-507615, 2010-01-518157 and 2010-01-550647, respectively. As to the accounting treatment of the sale of the property, see Note 7(d) to the Company's financial statements dated December 31, 2010, attached to this report. |
10 The information included in this Chapter D - "Additional Information About the Company" does not include associated companies (the business operations of Hogla Kimberly and its subsidiaries).
85
| 12.5. | In addition to the above, the Company’s subsidiaries and/or associated companies hold and/or rent plants, offices and warehouses at different sites all over the country including Rosh Ha’ayin, Afulah, Migdal Haemek, Caesarea, Carmiel, Holon, Haifa, Zrifin and more. In this matter, see Sections 8.18, 9.12, 10.17, 11.17 and 24.1.15, above. |
| 12.6. | Agreement for leasing of a Logistics Center: On November 3, 2008, the Company's General Meeting approved the lease agreement signed on September 18, 2008 between the Company and Gev-Yam Land Ltd. ("the lessor"), a public company controlled by the Company's indirect controlling shareholders, whereby the Company would lease a plot in Modi'in with an area of 74,500 square meters, as well as buildings to be constructed by the lessor for the Company, with a total constructed area of 21,300 square meters, to serve as a logistics center, industrial and office space ("Logistics Center") for the Company's subsidiaries, which would - in part - replace existing lease agreements. The Leasing Period shall be 15 years from the date of receiving possession of the Leased Property. The Company will also hold an option to extend the lease by an additional 9 years and 11 months. Each party is entitled to cancel the agreement once ten years have passed, by providing an advanced notice of 180 days, in addition to which each party is entitled to cancel the lease of parts of the leased property by providing a one-year advance notice. During the fourth quarter of 2010, the logistics center was populated by Amnir and by Hadera Paper Printing, while during the second half of 2011, Graffiti is also expected to relocate its distribution site to the logistics center. For further details, see the Company's report dated September 25, 2008. |
| 12.7. | On November 1, 2009, the Company announced that it examined the need for a provision for the impairment of the packaging paper sector as a cash generating unit and has arrived at the conclusion that no recognition is necessary of a loss on account of the impairment of fixed assets. Due to said indications occurred on 2009 the Company examined in 2010 the need for a provision for the impairment of the packaging paper sector for Decembe4r 31, 2010 and has arrived at the conclusion that no recognition is necessary on the account of the impairment. The company also examined the need for a provision for impairment on account of the consolidated subsidiary Carmel Container Systems Ltd. as a cash generating unit and has arrived at the conclusion that no recognition is necessary of a loss on account of the impairment. For additional details, see the company's report dated November 1, 2009 and also see Note 4(c)4 and 5(a)1 to the attached financial statements dated December 31, 2010. |
86
| 12.8 | An agreement was approved by the Audit Committee on February 28 and by the board of directors on March 6, 2011, for the Company’s leasing roof area at the Company’s Hadera plant to Clal P.V. Projects Ltd. ("Clal PV"), a private company held and controlled indirectly by Clal Industries and Investments, in an overall area of up to 19,200 m2 (out of which the company was granted an option not to lease a portion of this area, in the scope of up to approx. 14,300 m2), for construction of installations for the production of electricity using photovoltaic technology and transfer of this electricity to the electricity grid during the lease period, under a production license to be granted to Clal PV. Rental fees come to between NIS 90 thousand and NIS 802 thousand per year, according to the area actually leased, and will be determined on the basis of the fee for production of Kw/h electricity approved for Clal PV in the production license granted. The agreement also states that the Company will be paid additional rental fees up to the sum of NIS 70 thousand per year for surplus electricity output capacity (if any) according to the provisions of the agreement. The lease period will begin at the time of delivery of possession of the leased property, and will terminate at the end of 20 years from the time of commercial operation of the leased property (as defined in the agreement), and Clal PV has the option to extend for an additional period, subject to the overall lease period not exceeding 24 years and 11 months. Customary conditions for cancellation of the agreement were provided in the agreement, and the Company was given an option to cancel the agreement in the event it notifies of its desire to make use of the leased property for its own activities, which do not allow for the operation of the installations at the property, and in such case, Clal PV agrees to vacate the leased property within a time period stipulated as against payment of the economic value of the production installations according to an external economic valuation. The agreement is subject to the fulfillment of various prerequisites within 15 months from the date of signing, including, inter alia, obtaining permits, authorization and licenses to construct the installations, obtaining the consent of the general meeting of the Company shareholders to be convened for the purpose of approving this engagement (in light of its being a transaction in which CII possesses a personal interest) and other conditions. |
87
| 13. | Human Resources |
| 13.1. | Company’s organizational structure |
| The following is the organization structure diagram of the Company and its subsidiaries as at the report date: |
Marketing
Purchasing and logistics
Office Supplies Marketing
(211)
Marketing
Purchasing and logistics
Finance
Manufacturing
Headquarters
Fine Paper
(305)
Headquarters
Manufacturing
Finance
Purchasing and logistics
Marketing
Packaging and cardboard products
(755)
Finance
Manufacturing
Supply Chain
Marketing
Headquarters
Information Systems
Packaging paper & recycling sector
(774)
Packaging Paper and Recycling Sector
Packaging and cardboard
Fine Paper
Office Supplies Marketing
Company CEO and headquarters
(28)
(28)
Headquarters &
miscellaneous
Finance
88
The Company’s most important and main resource is its human capital. The development of human capital is a top priority for The Company, and it invests in training and seminars for its employees, including designated training for specific positions. |
The Company is implementing a talent management process, within whose framework it conducts performance analysis, while mapping in identifying the management potential at the group and creates personal development programs. In addition, a group-wide mentoring process was conducted, with the participation of management members that provided personal mentoring to managers who possess the highest development potential at the group. A management development program has been in place across the entire group for two years now, to promote change and improvement in perception, processes and B2B sales management practices. |
| 13.2. | Staff employed according to areas of activity |
| As of the reporting date, the Company, through its subsidiaries, employed staff in the four segments of operation as follows: In the packaging paper and recycling segment - 774 employees, in the office supplies segment - 211 employees, in the packaging products and cardboard segment - 755 employees and in fine paper - 305 employees. The total number of employees employed by the company and its subsidiaries together is 2,073 and 1,680 as of December 31, 2010 and 2009, respectively. Most of the growth in the number of employees between 2010 and 2009 is attributed to Hadera Paper Printing having become a subsidiary of the Company, as stated in Sections 2.8.2 and 11.24.2, above. |
| 13.3. | Employment agreements |
| As of the reporting date, employees of the Company and its subsidiaries are employed under two types of agreements. 711 employees are employed under collective agreements and general extension orders in the field of industry that apply thereto, and 1,362 employees are employed under personal contracts. |
| 13.3.1. | Collective Labor Agreements |
As aforesaid, as of the reporting date, 711 of the employees of the Company and its subsidiaries operating in Hadera and at the logistics center are employed under a special collective agreement - "integrated edition" (hereinafter in this section: "The Agreement"), which consists of the collective agreement signed in 1972 between Hadera Workers' Council, the company's workers committee and the company, as well as agreement renewals that were signed between the parties from time to time. The agreement is renewed with the parties' consent every two-three years. |
| The agreement applies to all the employees that are employed in Hadera by the company and its subsidiaries as at the signing of the agreement and employees that will be employed by the company in the future, except for administrative workers, experts, teenagers, handicapped workers and day workers. |
| Once a position becomes available or a new position is created, the Company may issue an in-house tender amongst its employees, thereby granting first priority to its own workers. Every worker accepted for employment is considered a provisional worker for a period of 36 months after which, according to management's decision, a permanent employee status is granted to him/her. In addition, the company may hire "temporary" employees for a period of up to 12 months. |
89
| The employees' wages are determined based on a table of wages and seniority at the company, that is updated in accordance with the agreements that apply to the company. In addition, the employees are entitled to various benefits such as: A continuing study fund and provident/pension fund, incremental pay for work in shifts and for special calls, and other benefits. |
| 13.3.2. | Personal employment agreements |
As aforesaid, as of the reporting date, 1,362 employees of the Company and its subsidiaries are employed under personal employment contracts. Personal employment contracts, under which some of the company's workers are employed, include the terms of employment, information on employees' related rights (such as: annual vacation and advanced notice), provisions for pension funds and severance pay funds, as well as provisions for vocational study funds. Pursuant to said employment contracts, the employees are paid a monthly salary which increases from time to time by the amount of the cost-of-living increment, in accordance with the agreement between the Histadrut (Israel's Labor Union) and the Manufacturers Association of Israel. Additional pay increments are added to the salary on a personal basis and are subject to the company's discretion. In addition, in accordance with the personal contracts, the employee is entitled to one bonus monthly salary per year (13th month salary), as well as to the reimbursement of travel fare or a portion of his/her car expenses or alternatively, a company car provided to the employee. |
| The personal employment contracts also include a non-competition clause, for certain terms as defined in those specific employment contracts. Moreover, according to the employment contracts, each party may terminate the agreement by providing advanced written notice of between one and three months. |
| 13.4. | Agreements with senior officers |
| 13.4.1. | Senior management employees of the Company are employed under personal contracts. For details regarding personal employment contracts, see section 13.3.2, above. |
| On May 13, 2007, the Board of Directors of the Company approved the employment agreement of the company's CEO, Mr. Avi Brener, who retired as the company's CEO on December 31, 2009 and who ended his employment at the company on January 31, 2010. Regarding the terms of retirement of the CEO, according to his employment terms, in addition to the release of funds accumulated in a directors' insurance/provident fund etc., at the date of retirement, the CEO shall be paid a retirement bonus in the sum of his last monthly salary prior to the retirement multiplied by the number of years he worked at the group (as of August 1988). On March 23, 2010, the audit committee and the Board of Directors approved the payment of a special non-recurring bonus in the sum of NIS 5 million, to the retiring CEO. For additional details regarding the terms of retirement of the CEO and the special bonus, see the immediate reports published by the company on March 8, 2010 and on March 23, 2010. |
90
On November 24, 2009, the company's Board of Directors approved the employment agreement of the Company's new CEO, Mr. Ofer Bloch, who assumed his position January 1, 2010. The principal terms of the CEO's employment agreement include: In the event of dismissal or resignation, advanced notice of 3 months will be provided. The CEO's monthly salary will total NIS 100,000 and will be linked to the Consumer Price Index. Moreover, a tax rebate will be provided to cover the value of the company car and telephone. The annual bonus of the CEO will be equal to a sum of 6-9 paychecks, according to the discretion of the company's Board of Directors and provided that the company has recorded a net profit during the relevant year. In the event that the company did not record net profit during the relevant year, the CEO will not be eligible for a bonus, unless otherwise decided by the Board of Directors, according to its discretion. The CEO is also entitled to related benefits as customary for senior employees in the company, including: Company car (including tax rebate), bonus 13th month salary, directors' insurance, continuing education fund, annual vacation, convalescence pay, sick pay, social benefits, clothing, reimbursement of telephone expenses, reimbursement of per diem and entertainment expenses. In addition, after 180 days from the date of commencement of employment of the CEO, the board of directors of the Company will establish a stock option plan for the CEO, which will be subject to the principles of the existing compensation plan in the Company, in the amount acceptable for a CEO of the Company. Regarding the Company's existing stock options plan, see section 13.4.5, below. As of of the report, the said options have yet to be allocated to the CEO, and the company is working to formulate a stock option plan as aforesaid. In addition, as of the date of assuming office, in respect of his position as CEO, Mr. Bloch will be covered by the Company's existing executives insurance liability policy (as it shall be from time to time) and will also receive a letter of indemnification from the Company, which is identical to the letters of indemnification granted to officers of the Company (see sections 13.4.3 and 13.4.4, below). For additional details regarding the employment agreement with the company CEO, see the company's report dated November 24, 2009. |
| On March 6, 2011, the Board of Directors of the company approved the payment of the bonus to Ofer Bloch in the sum of NIS 750 thousands, on account of his contribution to the company operations in 2010. For additional details regarding the bonus that was approved, see the immediate report published by the Company on March 7, 2011. |
| 13.4.2. | Remuneration of Directors |
In accordance with the resolution of the Audit Committee and the Board of Directors of the Company, the annual remuneration and participation rewards of all directors of the Company has been approved on May 31, 2010, including directors that are controlling shareholders or their relatives and external directors of the Company for 2010. The annual remuneration for directors, including external directors and including directors that are controlling shareholders or related thereto, is NIS 59,100, while the meeting participation remuneration is NIS 2,200, with no change from the updated director remuneration that was approved on June 8, 2009. |
91
| On March 7, 2011, the company announced a resolution of the audit committee and the Board of Directors of the company regarding the approval of annual remuneration and participation remuneration for directors at the company (who are not external directors) for 2011, at the level of the "regular amount" stipulated in the company regulations ( directives regarding remuneration and expenses for external directors), 2000 (hereinafter: "remuneration directives"), subject upon meeting regulation 1a(2) to the company ordinance (relief in transactions with interested parties), 2000 (hereinafter: "relief directives") regarding directors who are not controlling shareholders or related thereto, and directive 1b(3) to the relief directives regarding directors who are not controlling shareholders or related thereto, as stated in the company announcement. |
| 13.4.3. | Letters of indemnification |
| Pursuant to the resolutions of the general meetings of the company dated June 21, 2006 and July 14, 2004, the company issued letters of indemnification to all the directors and officers of the company, including directors that may be considered controlling shareholders in the company (Mr. Zvika Livnat and Mr. Itzhak Manor), by virtue of being controlling shareholders in IDB Holdings, which is an indirect controlling shareholders of the company. For additional details see footnote 2, above. For details on the letter of indemnification see section 19.1, below. |
| 13.4.4. | officers and directors insurance at the group |
| On July 27, 2010, following the approval of the Company's Audit Committee and Board of Directors, the Company's shareholders' meeting approved the Company's engagement with Clal Insurance Company Ltd. for the acquisition of an officers' liability insurance policy for the period commencing June 1, 2010 until November 30, 2011. The volume of coverage of the policies $6 million, while the annual premium is $37,000 ($55,500 for 18 months), after conducting a tender for insurance services by addressing the different insurers to receive a proposal for renewing insurance. The audit committee and Board of Directors of the Company have stated that the policy was issued under market conditions, in accordance with the standards in such transactions. The amount of the policy's coverage is identical to the amount of coverage of previous policies for 2009 and 2008. The annual premium as part of the policy ($37,000) is lower than the premium paid in 2009 ($51,800) and is lower than the premium paid in 2008, that included an expansion of liability on account of a shelf prospectus. As of 2009, insurance coverage was expanded to also include position holders and the directors of Carmel and its subsidiaries. |
92
| 13.4.5. | Employee stock option plans |
| 13.4.5.1. | Bonus plan for employees in the group 2008 |
| (a) | On January 14, 2008, following the approval of the Audit Committee, the board of directors of the Company approved a bonus plan for senior employees at the company and/or in subsidiaries and/or in associated companies of the Company, (hereinafter in this section: "The Plan"), pursuant to which up to 285,750 option warrants (hereinafter in this section: "option warrants"), each exercisable into one ordinary share of the Company, will be allotted to senior employees and officers in the group, including the CEO of the company which, on the date of approval of the allotment, accounted for 5.65% of the issued share capital of the company. The offerees in the said plan are not interested parties in the Company, except for the retiring CEO, who was an interested party by virtue of his position. Pursuant to the conditions of the said option warrants, the offerees who will exercise the option warrants will not be allocated all of the shares derived therefrom, but only a quantity of shares that reflects the sum of the financial benefit that is inherent to the option warrants at the exercise date only. In the course of the first quarter of 2008, a sum of 250,500 stock options were granted as aforesaid, and on January 8, 2009, a sum of 34,000 stock options were granted, out of 35,250 stock options that were allocated to the trustee, as a reservoir for future granting. On August 9, 2009, the remaining options held by the Trustee, totaling 1,250 options, were cancelled. |
| in the course of 2010, a total of 103,462 option warrants were exercised into 24,009 shares. As of December 31, 2010, a total of 158,038 options had not yet been exercised. |
The plan's impact on the consolidated financial statements during the years of the plan is estimated at NIS 13.8 million. |
The option warrants are not registered for trading. The company has obtained approval from the TASE and NYSE to list for trading the ordinary shares allotted to the offerees upon the exercise of the option warrants. |
| (b) | Vesting period for the option warrants |
a. | The option warrants may be exercised at the following dates, provided the offeree is employed by the company and/or a subsidiary and/or an associated company, on that date: |
| a. | Each offeree shall be entitled to exercise one quarter of the amount of the option warrants offered to him pursuant to the plan (hereinafter: "the first tranche") at the end of one year from the determining date of January 14, 2008 (hereinafter: "the end of the vesting period of the first tranche") and up to four years from the determining date. Subsequent to the said four years, all the option warrants included in the First Tranche and not yet exercised will expire and shall offer no rights whatsoever. |
93
| b. | Each offeree shall be entitled to exercise another (second) quarter of the amount of the option warrants offered to him pursuant to the plan (hereinafter: the second tranche") at the end of two years from the determining date (hereinafter: "the end of the vesting period of the second tranche") and up to four years from the determining date. Subsequent to the said four years, all the option warrants included in the Second Tranche and not yet exercised will expire and shall offer no rights whatsoever. |
| c. | Each offeree shall be entitled to exercise another (third) quarter of the amount of the option warrants offered to him pursuant to the plan (hereinafter: the third tranche") at the end of three years from the determining date (hereinafter: the end of the vesting period of the third tranche") and up to five years from the determining date. Subsequent to the said four years, all the option warrants included in the Third Tranche and not yet exercised will expire and shall offer no rights whatsoever. |
| d. | Each offeree shall be entitled to exercise another (fourth) quarter of the amount of the option warrants offered to him pursuant to the plan (hereinafter: the fourth tranche") at the end of four years from the determining date (hereinafter: the end of the vesting period of the fourth tranche") and up to six years from the determining date. Subsequent to the said six years, all the option warrants included in the Fourth Tranche and not yet exercised will expire and shall offer no rights whatsoever. |
| (c) | Economic value of the options |
As of the approval date of the aforementioned allocation (January 14, 2008), the economic value of each option warrant was NIS 96.43. This economic value was computed using the "Black and Scholes" formula taking into consideration the closing price of the company's shares on the stock exchange on January 13, 2008 (the last trading day before the board of directors' resolution), which was NIS 237.40 per share, while the weekly standard deviation was 4.3%. The following assumptions were taken into consideration in the calculation of the economic value: a. All the option warrant shall be exercised on the last day of their exercise period; b. assuming the exercise of all the option warrants and theoretically assuming the allotment of the maximum amount of exercise shares. It is hereby clarified that pursuant to the plan, the maximum allowable allotment, is only in the amount of the bonus; c. The computation of the economic value does not take into account the fact that the option warrants will not be registered for trading on the stock exchange, and does not take into account the restriction on the options during the restriction periods set forth in the plan; d. the standard deviation was computed in accordance with the weekly returns of an ordinary share of the company for the six months ended on December 31, 2007; e. the annual discount rate for the option warrants was set at 4.5%.
94
(d) | The exercise price |
The option warrants were allocated to the Offerees free of charge.
The exercise price of each of the option warrants shall be NIS 223.965 per share. The exercise price is determined according to the average closing price of an ordinary share of the company on the stock exchange in the thirty (30) trading days preceding the date of the Board of Directors' decision on the approval of the plan (January 14, 2008), after deducting 10% (hereinafter: "The Exercise Price").
On the exercise date the offerees will not be required to pay the exercise price and the exercise price will only be used to determine the amount of the bonus and the amount of exercise shares that will actually be allotted to the offerees will be calculated according to the terms of the compensation plan. The payment that the Offerees will actually make to the Company upon exercise of the options will only be equal to the level of the par value of the shares actually allocated (or transferred) to them upon the exercise.
(e) | Additional Provisions |
The plan also includes additional provisions with regard to the manner of calculation of the exercise price, adjustments in case of changes to capital and dividend payment, and eligibility to exercise the options in case of termination of employment.
| 13.5. | Pay Cuts |
| In 2009, as part of the alignment with the global economic crisis, the Company's management adopted a policy of mutually-agreed pay cuts for executives. In this capacity, executives in various levels gave their consent to a pay cut ranging between 8% and 10% for this year. |
95
| 13.6. | Hadadit Fund |
On Dec. 22, 2010 the Hadera Paper Group received a refund of participation fees in an overall amount of NIS 10 million (hereinafter: "the Refund") from the employers’ mutual fund (Hadadit), as a refund for participation fees it paid into the fund. The Refund was performed subject to the Group’s undertaking to return this sum, or part thereof, in certain cases, which the Company estimates are unlikely to occur. For details regarding net income recorded for the Company for this refund, see Note 15(L)(3) in the financial statements of Dec. 31, 2010, part C below. |
| 14. | Restrictions and Supervision of the Company's Operations |
| 14.1. | Enforcement Policy |
| Pursuant to the Securities Law and the Companies Law, the company is bound by reporting duties and is forbidden from using inside information. |
| In this capacity, on August 8, 2007, the board of directors of the company adopted a plan that includes an enforcement procedure concerning the duties of reporting in accordance with securities laws and an enforcement procedure concerning the prohibition to use inside information. The plan was approved in the framework the company's policy to enhance transparency and ensure maximum control over the management of its business. Under the plan, the company’s legal counsel was placed in charge of the enforcement and execution of the plan. The plan includes two main procedures: One, an enforcement procedure concerning the company's duties of reporting under securities laws. This procedure is designed to ensure that the company complies with all the reporting duties applicable thereto (inter alia, the annual reports, quarterly reports and immediate reports) and that it adequately reports the approval of transactions with officers and controlling shareholders. Under this framework, the company approved the establishment of a remuneration committee and to authorize it to approve the terms of employment of officers, except for the CEO, which do not constitute unexceptional transactions. The second procedure is an enforcement procedure concerning the prohibition to use inside information. This procedure was designed to assist in ensuring the existence of regulations that prohibit the use of inside information for the purpose of trading in securities of the company. The procedure will help the company to reduce the risks that arise from the use of inside information. Under this procedure, a person was made responsible of inside information affairs, and is in charge of handling the issue. Among others, the procedure establishes different guidelines and limitations that apply to "insiders" in the company in connection with trades in securities of the company and regarding the provision of information on the company. |
| 14.2. | Efficiency for Enforcement Procedures Law |
| On January 17, 2011, the third reading for the memorandum for the Efficiency for Enforcement Procedures at the Securities Authority (Legislation Amendments) 5777 - 2011 bill was approved by the Knesset. The law will go into effect 30 days from the date of its publication in the Official Gazette. |
| The aim of this law is to streamline enforcement of the provisions of laws which the Securities Authority is responsible for, laws formalizing the field of securities, including the Securities Law, the Arrangement for Dealing in Investment Consultancy, Investment Markets and Management of Portfolios Law, 5755 – 1995, and the Joint Investment in Trust Law, 5754 – 1994. |
96
| The law prescribes an administrative enforcement mechanism mainly dealing with certain types of violations of the said laws as part of an administrative process in which various means of enforcement are imposed on the party in violation, including: Financial sanctions, payment to the party injured by the violation, prohibition on serving as a senior officer in a supervised body for a certain period of time, and cancellation of or imposition of conditions on a license, authorization or permit. In certain cases where the violating party is a corporation, the law states that responsibility for such falls also on the CEO, except under certain conditions, including where the corporation has procedures for prevention of violations. The proposed bill also includes a mechanism of agreed arrangements as an alternative to holding a criminal or administrative procedure, also allowing for imposing said means of enforcement. |
| As part of the Company’s preparation towards this law coming into effect, the Company is studying the option of adopting procedures for strengthening strict measures in the Company for performing the provisions of the Securities Law and other relevant laws and reliability of financial statements and disclosure, among other things. |
| 15. | Financing |
| The Company finances its activity from independent sources and bank loans. It should be noted that the company has issued five series of bonds. |
On April 8, 1992, the Company issued NIS 48 million of registered debentures (Series 1) to institutional investors, each of NIS 0.01 par value (hereinafter: "Series 1 Debentures"). The debentures bear an interest rate of 3.8% per annum while the principal and interest are linked to the CPI. The debentures were repaid in full in June 2009. |
On December 17, 2003 and on December 23, 2003, the Company issued, by way of a private placement by tender, to institutional investors, NIS 200 million of registered debentures of NIS 1 par value each (hereinafter – "Series 2 Debentures"). The outstanding portion of the debentures bear an interest rate of 5.65% per annum while the principal and interest are linked to the CPI. The principal is repayable in seven equal installments starting December 2007. The balance of debentures as of December 31, 2010, in the amount of NIS 101.0 million, is repayable in three equal annual installments in December of each of the years 2011-2013. The debentures are not convertible into shares of the company. As part of the issuance of the debentures (Series 2) on December 21, 2003, the Company entered into a deed of trust with the Trust Company of Bank Leumi Le'Israel Ltd. Under the deed of trust, the Company has undertaken to indemnify the trustee in certain cases, such as: Expenses incurred by the trustee in the course of managing the trust, expenses related to authority and permission vested in the trustee by the deeds of trust as well as with regard to legal proceedings and claims related to the trust. |
| The debentures (Series 2) may be redeemed immediately under the following cases: Dissolution of the Company, imposition of attachment on its assets, placing of the Company in receivership and any event which materially impacts the rights of bond holders. |
97
| On July 14, 2008, the Company issued two bond series pursuant to the shelf prospectus published by the Company on May 26, 2008. The company allocated a sum of NIS 187,500 thousands par value of registered debentures (hereinafter: "Series 3 Debentures", CPI-linked) , each with a par value of NIS 0.01, in return for financial remuneration of NIS 187,500 thousands. The unpaid balance of the debentures bears an interest of 4.65% per annum, while the principal and interest of the debentures are linked to the known CPI (base: May 2008 CPI). The balance of outstanding debentures (Series 3) as of December 31, 2010, in the amount of NIS 179.8 million, is repayable in 8 equal annual installments on July 10 of the years 2011 through 2018. As of the reporting date, the debentures are not convertible into shares of the Company. |
| In July-August 2008, the Company issued debentures (Series 4) and expanded this series pursuant to a shelf prospectus published on May 26, 2008. The Company allocated NIS 235,557,000 par value of shekel debentures (Series 4) for a financial consideration of NIS 240,360,000. The unpaid balance of debentures bears an interest rate of 7.45% per annum. The balance of outstanding debentures as of December 31, 2011 in the amount of NIS 196.3 million is repayable in 5 equal annual installments on July 10 of the years 2010 through 2015. As of the reporting date, the debentures are not convertible into shares of the Company. |
| AS part of the issuance of bonds (Series 3 and 4), the Company signed on May 26, 2008 a deed of trust with Hermetic Trust Corporation (1975) Ltd. As part of this deed of trust, the Company committed to indemnify the trustee in certain cases, such as: Expenses incurred by the trustee in the course of managing the trust, expenses related to authority and permission vested in the trustee by the deeds of trust as well as with regard to legal proceedings and claims related to the trust. |
| The bonds (Series 3) and the bonds (Series 4) may be redeemed immediately in cases such as: Dissolution of the Company, imposition of attachment on its assets, placing of the Company in receivership and any event which materially impacts the rights of bond holders. |
| On May 23, 2010, the Company issued a bond series (Series 5) pursuant to the shelf prospectus published by the Company on May 26, 2008. The Company has allotted NIS 181,519 thousand par value in NIS-denominated bonds (Series 5), for total consideration of NIS 181,519 thousand. Net of issuance expenses, the Company received net proceeds amounting to NIS 179,886 thousand. The unpaid balance of debentures bears an interest rate of 5.85% per annum. The balance of debentures as at December 31, 2010, in the amount of NIS 181.5 million, is repayable in 5 equal annual installments on July 10 of each of the years 2013 through 2017. As of the reporting date, the debentures are not convertible into shares of the Company. |
| As part of the issuance of the debentures (Series 5), the Company entered into a deed of trust with the Trust Company Strauss Lazar Trust Corporation (1992) Ltd. As part of this deed of trust, the Company committed to indemnify the trustee in certain cases, such as: Expenses incurred by the trustee in the course of managing the trust, expenses related to authority and permission vested in the trustee by the deeds of trust as well as with regard to legal proceedings and claims related to the trust. |
| The debentures (Series 5) may be redeemed immediately under the following cases: Dissolution of the Company, imposition of attachment on its assets, placing of the Company in receivership and any event which materially impacts the rights of bond holders. |
| For further information regarding these bonds, see Note 10 to the Company's financial statements as of December 31, 2010, attached to this report. |
98
| Below are details of the volume of loans assumed by the company and the average interest paid thereupon as at December 31, 2010, 2009 and 2008: |
| 31.12.2010 | Sources of Finance | Actual Sum (In NIS millions) | Average Interest | Effective interest | Repayment Date | |||||||||||||||
| Short-term loans | Linked to Prime | Banks | 144.6 | 3.36 | % | 3.40 | % | April 2011 | ||||||||||||
| Long-term loans | Linked to Prime | Banks | 207.8 | 4.29 | % | 4.36 | % | 2010-2014 | ||||||||||||
| Long-term loans | CPI-Linked | Banks | 18.2 | 5.00 | % | 5.10 | % | 2010-2015 | ||||||||||||
| Long-term loans | Unlinked | Banks | 15.8 | 5.50 | % | 5.61 | % | 2013 | ||||||||||||
| Long-term loans | Unlinked | Institutionals | 90.0 | 6.30 | % | 6.40 | % | 2010-2017 | ||||||||||||
| Long-term loans - Bond Series 2 | CPI-linked | Institutionals | 101.0 | 5.65 | % | 5.65 | % | Up to 2013 | ||||||||||||
| Long-term loans - Bond Series 3 | CPI-linked | Institutionals | 179.8 | 4.65 | % | 4.65 | % | Up to 2018 | ||||||||||||
| Long-term loans - Bond Series 4 | Unlinked | Institutionals | 196.3 | 7.45 | % | 7.59 | % | Up to 2015 | ||||||||||||
| Long-term loans - Bond Series 5 | Unlinked | Institutionals | 181.5 | 5.85 | % | 5.94 | % | Up to 2017 | ||||||||||||
| 31.12.2009 | Sources of Finance | Actual sum (NIS millions) | Average Interest | Effective interest | Repayment Date | |||||||||||||||
| Short-term loans | Linked to Prime | Banks | 91.3 | 2.40 | % | 2.43 | % | April 2010 | ||||||||||||
| Short-term loans | Linked to Prime | Institutionals | 40.0 | 2.68 | % | 2.72 | % | 2011 | ||||||||||||
| Long-term loans | Linked to Prime | Banks | 130.7 | 4.22 | % | 4.28 | % | 2010-2014 | ||||||||||||
| Long-term loans | CPI-Linked | Banks | 28.4 | 4.87 | % | 4.96 | % | 2010-2015 | ||||||||||||
| Long-term loans | Unlinked | Banks | 22.8 | 5.50 | % | 5.61 | % | 2013 | ||||||||||||
| Long-term loans | Unlinked | Institutionals | 100.0 | 6.30 | % | 6.40 | % | 2010-2017 | ||||||||||||
| Long-term loans - Bond Series 2 | CPI-linked | Institutionals | 131.3 | 5.65 | % | 5.65 | % | Up to 2013 | ||||||||||||
| Long-term loans - Bond Series 3 | CPI-linked | Institutionals | 196.7 | 4.65 | % | 4.65 | % | Up to 2018 | ||||||||||||
| Long-term loans - Bond Series 4 | Unlinked | Institutionals | 237.9 | 7.45 | % | 6.95 | % | Up to 2015 | ||||||||||||
| The Company has also undertaken a negative pledge to a bank in connection with an NIS loan taken in 2009, in the amount of NIS 70 million, as well as toward an institutional entity in relation to long-term credit assumed from that entity in 2009, in the amount of NIS 100 million. The balance of the loan as at December 31, 2010 totals approximately NIS 90 million. |
99
| In 2006, the Frenkel CD subsidiary entered into agreement with one of the banks for receipt of long-term loans aggregating NIS 56 million for periods up to 7 years, at interest rates ranging between 4.95% and 5.33% (linked to the Consumer Price Index) as well as a short-term facility of NIS 30.6 million. To receive this credit facility and those loans, the subsidiary has undertaken to comply with financial covenants pursuant to which the subsidiary's shareholders' equity, net of goodwill will be no less than 18.5% of total consolidated assets, net of goodwill. The subsidiary is in compliance with the financial covenants. |
| The subsidiary Hadera Paper Printing has agreed with various banks regarding the acceptance of long-term loans and short term facilities. To receive this credit facility and those loans, the subsidiary has undertaken to comply with financial covenants pursuant to which the subsidiary's shareholders' equity, will be no less than 22.0% of the balance sheet total. The subsidiary is in compliance with the financial covenants. For additional details regarding the financing terms of the Hadera Paper Printing subsidiary, see Section 11.20, above. |
| Except for the aforementioned commitments of the Company and its subsidiaries, the Company does not have additional financial covenants. |
| As of the reporting date, the company has a bank credit facility of NIS 890.3 million, of which, as of December 31, 2010, a sum of NIS 379.7 million has been used. |
| On-call loans held by the Company are with a variable interest rate. Interest update is carried out at the time of the Bank of Israel’s change in interest rates. During 2010, 2009 and 2008, the average interest rate in respect of the aforementioned loans was 2.8%-3.3%, 2.6%-3/1% and 3.8%-5.1%, respectively. |
| Interest rates on prime-linked loans in 2010 was 3.3%-4.7%. The weighted interest rate on prime-linked loans in proximity to the date of the report was 4.32%. |
| The average interest rate in proximity to the reporting date was 3.1%. |
| The Company has repaid liabilities toward Hogla-Kimberly (an associated company) in 2009, to cover a capital note in the amount of NIS 33 million. |
| The corporation has obtained a rating by Maalot (Standard and Poor’s) for the bonds (Series 2-5) issued by the Company; these are rated A+/Negative Outlook. AA- rating was granted in December 2003, and in February 2008 it was further validated by a rating of (AA-)/Stable. Pursuant to the Company's request to raise additional debt by issuing bonds amounting up to a total of NIS 435 million, the Company was issued, in July-August 2008, a rating of AA- / Negative Outlook for its bond issuance (Series 3 and Series 4), which also applies to all other Company bond series in circulation. On October 5, 2009, Maalot the rating company announced that it has downgraded the Company's debenture series in circulation to A+/Negative Outlook, due to the crisis in the global business environment and the rise in financial leverage. The rating was conditional on the Company's meeting certain financial ratios. For details see the Company Report dated October 5, 2009. Pursuant to the Company's request to raise additional debt by issuing bonds amounting up to a total of NIS 200 million, the Company was issued a rating of A+ / Negative Outlook for its bond issuance (Series 5). For further details, see the company's report dated May 10, 2010. On February 2, 2011, due to a decrease in leveraging and an improvement in the business situation, Maalot confirmed the rating of the company and has updated the rating forecasts to A+ / Stable. For details see the Company Report dated February 2, 2010. |
100
| The Company forms part of the IDB Group and is therefore influenced by the Israel Banking Supervisor’s “Correct Banking Management Regulations”, which include amongst others, limits regarding the volume of loans an Israeli bank can issue to a single borrower; to a single “borrowing group” (as this term is defined in the said regulations), and to the six largest borrowers and "borrowing groups” at a bank corporation. IDB Development, its controlling shareholders and some of the companies held thereby, are considered to be a single “borrowing group”. Under certain circumstances, this can influence the ability of member companies in Hadera Paper Group to borrow additional sums from Israeli banks as well as upon their ability to carry out certain business transactions in partnership with entities that drew on the aforesaid credit. |
| 16. | Taxation |
| For details see Note 13 to the financial statements of the company as at December 31, 2010, attached to this report. |
| 17. | Environmental Protection |
| 17.1. | Environmental Risks and Management thereof |
| The environmental risks which are likely to have substantial impact on the company are: |
| 17.1.1. | Production processes in the Company’s plant involve emission of pollutants into the air, which are mainly the product of the burning of natural gas. Uncontrolled emissions of these materials over time can cause damage to people and to the environment. By moving over to natural gas, the Company significantly reduced the rates of these emissions, and it takes all the necessary means to ensure it complies with the requirements of the emission standards and controls the risks involved in these activities. |
| 17.1.2. | At its sites, the Company uses hazardous materials (mainly flammable materials) which if not controlled could cause damages to people and to the environment. These materials are stored by the Company according to the conditions of the poison permit granted by the Ministry for the Protection of the Environment and in accordance with the required safety rules. |
| 17.1.3. | During the Company’s production processes sewage is created containing materials having the potential to harm water sources (rivers and sewerage systems) if they reach these sources without being properly treated. The Company discharges wastewater (sewage after being treated) into the Hadera River under a permit order given by the Director of the Government Authority for Water and Sewerage, under the Water Law 5719 – 1959. The wastewater is released after treatment designed to raise their quality to the values prescribed in the permit order. A hearing was held for the Company in this matter, see section 17.3 below. |
17.1.4. | The Company’s Hadera plant operations have the potential to cause noise nuisance to nearby residents. The Company takes the necessary measures to comply with the relevant standards prescribed in the Regulations for Prevention of Hazards (Unreasonable Noise) 5750 – 1990. |
101
| 17.2. | Substantial Ramifications of the Law on the Corporation |
| The provisions of law in effect on the date of this report having substantial ramifications on the Company, including on its capital investments, profits and competitive status: |
| 17.2.1. | The Company’s business license is conditional upon terms prescribed by the Ministry for the Protection of the Environment, designed to protect the environment and prevent nuisances. These conditions are customary for plants of this type. The business license does not require renewal from one period to another. |
| 17.2.2. | The Company stores hazardous materials under a permit granted by the Ministry for the Protection of the Environment. The poison permit is granted under conditions dealing mainly in the manner of storage and use of these materials for the prevention of any incidents. The conditions in the poison permit are customary for plants of this type. The Company’s poison permit is renewed every year. The current permit is in effect through July 2011. |
| 17.2.3. | The Company discharges wastewater into the Hadera river after treatment under a purification process in the Company’s installation, under a permit order given by the Director of the Government Authority for Water and Sewerage (hereinafter: "the Water Authority") for 2010, expiring on December 31, 2010, and in accordance with the conditions thereof. This permit specifies, inter alia, conditions regarding quality of treated waste water discharged into the stream. In December 2010, the Company submitted an application for renewal of the permit order for 2011, which is currently in discussion opposite the committee granting permission for discharging water into the river in this matter. |
| 17.2.4. | During 2010, the project for returning waste water was accelerated, and some half million cubic meters of softened water were returned, constituting approximately 25% of all sewage sent into the Hadera river. In addition, during 2010, while expanding production installations and the amount of sewage accordingly, the Company continued to run a pilot program for desalination, studying special desalination technology. The pilot is a necessary step towards the construction of a future desalination installation at the Hadera site, planned for operation in 2012, allowing full return of all treated water into the plant as part of the Company’s vision of becoming a “no sewage plant”. |
| 17.2.5. | The Company anticipates that in 2011 total environmental investments/ costs, both the current ones, expected over the Company’s ordinary business operation, as well as those relating to the continued promotion of the desalination installation and improvement of water treatment, will amount to NIS 25 million. |
| Information regarding the desalination project, construction of the future desalination installation, its operation and application, as well as regarding expected environmental investments and costs are forward-looking information, as defined in the Securities Law and constitute a forecast and estimates only on the part of the Company, realization of which is not certain, and is based on the Company’s assessments as of the date of this report, and on information available to the Company as of the date of the report. The aforementioned Company forecasts and estimates may not materialize, in whole or in part, or may differ from current forecasts and estimates, due to multiple factors, including changes in demand in markets in which the Company operates, global supply and cost of paper products, developments and changes to regulation of the operating sector, technical malfunctions, a need for additional investments, unexpected occurrences and/or materialization of any of the risk factors set forth in sections 8.26 and 23, below. |
102
| 17.3. | Details Regarding Events or Issues Relating to The Company’s Activities Which Caused or Could Cause Harm to the Environment |
| 17.3.1. | Suspected water pollution by discharge of waste water |
| 17.3.1.1. | On January 30, 2011 the Ministry for the Protection of the Environment (hereinafter: "the Ministry") held a hearing for the Company regarding suspicion of pollution of water by discharging low quality waste water into the Hadera river. During the hearing the positions of the Ministry and of the Company were heard. The Company presented its position that the decline in the quality of the treated waste water was the result of the use of a new raw material. Upon discovery of the source of the problem, the Company ceased the use of that raw material. The Company works in full transparency opposite the authorities, and was in fact even the one who reported to representatives of the Ministry regarding this harm to the quality of the waste water. |
| 17.3.1.2. | On February 8, 2011 the Company received the summary of the hearing in which it was found, inter alia, that the Company had a duty to improve the quality of the waste water, and a duty of reporting weekly to the Ministry regarding the quality of the treated waste water. The Ministry further noted in this summary that if the Company does not fulfill the values prescribed in the permit order for discharge into the Hadera River given on August 11, 2010 within one month from the date of the hearing, the Ministry’s Director of the Haifa District will issue, under his authority, an order to cease operations of Machine 8 which the Company operates, without requiring any advance warnings or additional hearings. Under section 20 to the Business Licensing Law 5728 – 1968, the aforesaid order remains in effect for 30 days from the date of issue. |
| 17.3.1.3. | The Company has been acting for some time for the improvement of the treated waste water by the performance of a number of measures, and as a result of these measures, an improvement may already be seen in the quality of the treated waste water discharged into the river. However, the company at this stage cannot estimate the rate or timetable for improvement of the treated waste water, and cannot at this stage estimate the impact of the above in the event of failure to fulfill the required values. For further details on this matter, see the Company’s report dated February 8, 2011. |
103
| 17.4. | Legal or Administrative Processes Related to Environmental Protection |
| Below are details regarding substantial legal or administrative processes relating to environmental protection which the Company or its senior officers are a party to, and the results of each said process which ended during the past year, as of the date of the report: |
| 17.4.1. | Suspicion of water pollution by discharge of waste water: See section 17.3.1 above. |
| 17.5. | The Corporation’s Policy on Management of Environmental Risks, Manner of Exercise and Manner of Supervision |
| 17.5.1. | The Company acts in accordance with an environmental management system managed using environmental protection procedures. The principles of environmental protection procedures are consistent with the requirements of Israeli standard ISO 14001/2004, and all of the Company’s divisions have been authorized by the Israel Standards Institute with regards to this standard. Furthermore, the Company acts in accordance with the environmental requirements of the Kimberly-Clark and Mondi partners, and representatives of these international companies inspect the Company once a year. The Company has appointed a Ph.D. in environmental engineering as the responsible party for the matter of environmental protection. |
| 17.6. | Details Regarding Amounts Ruled, Provisions Recognized in Financial Statements and Environmental Costs |
| 17.6.1. | The Company invested NIS 2.22 million in infrastructure relating to environmental protection in 2010. |
| 17.6.2. | The current investment budget (not including anticipated expenses for the desalination installation) for environmental protection for 2011 is approximately NIS 4.32 million. |
| 18. | Insurance |
| The Company and its subsidiaries are insured by Clal Insurance Ltd., a company controlled by IDB Development, under the insurance policies specified hereunder: (a) Fire damage and loss of revenue insurance; (b) Terror damage insurance; (c) Mechanical breakage insurance; (d) Employer liability insurance; (e) Third party insurance; (f) Goods-in-transit insurance; (g) Product liability insurance; (h) Installation insurance for Machine 8 and (i) Officer liability insurance (as set forth in section 13.4.4 above). The policies are at market terms and in effect until July 31, 2011 (except for the insurance of contracting work at the logistics center, that will expire upon completion of the construction on June 30, 2011, except for the insurance of Carmel and its subsidiaries that will expire May 31, 2011 and except for director and officer liability insurance that will expire November 30, 2011, as mentioned above). The Company is working to include the appropriate coverage for the operations of the logistics center in Modi'in, as part of the available property and elementary insurance policies existing at the company. Moreover, the Company has compulsory and all damage insurance for all its vehicles, including the trucks. In addition, the Company has additional insurance policies in immaterial amounts, such as a marine insurance, credit insurance and overseas travel insurance. In the Company's estimation, the Company has appropriate insurance coverage. |
104
| Despite the aforesaid, it should be noted that Hadera Paper Printing is not included in the Company's elementary insurance (as opposed to liability insurance), since it handles its elementary insurance as part of the insurance network of the Mondi group. |
| Starting October 1, 2010, Hogla Kimberly, at its own request, was removed from the elementary insurance coverage and the company's liability insurance (except the equipment and property of Hogla Kimberly at the Hadera site). Hogla Kimberly ensures the liabilities, property, equipment and buildings of its remaining additional sites through the network of insurance of Kimberly Clark. |
| 19. | Material Agreements |
| 19.1. | Letters of indemnification - Pursuant to the resolutions of the general meetings of the Company dated June 21, 2006 and July 14, 2004, the company issues letters of indemnification to all the directors and officers of the Company, including directors that are considered controlling shareholders in the Company (Mr. Tzvika Livnat and Mr. Itzhak Manor), as they may be from time to time. Under the letters of indemnification, the Company provides all the directors and officers therein, as they may be from time to time, indemnification in advance, in accordance with the Company's Articles of Association and the provisions of the Companies Law in respect of any liability or expenses imposed on the officer in consequence of actions he has taken and/or will take by virtue of being an officer of the company, which are related directly or indirectly, to one or more of the type of events outlined in the letters of indemnification, such as: (a) transactions and/or actions executed directly and/or indirectly in the course of Group business; (b) offering, issuance and buy-back of securities by the Company or by Company shareholders; (c) any event arising from the Company being a public company, or arising from the fact that its shares have been offered to the public or arising from the fact that its shares are traded on a stock exchange in Israel or overseas; (d) events related to investments made by the Company in any corporation; (e) action with regard to obtaining licenses and permits; (f) action directly or indirectly related to employer/employee relationships within the Company or to the Company's trade relationships; (g) action with regard to any statutory reports or notices filed; (h) provision of information required by statute to companies that are interested parties in the Company; (i) actions with regard to voting rights in investees; (j) all of the aforementioned transactions, actions and events shall include all decisions, agreements, notices, disclosure documents and reports related thereto, as well as any other matter related to any of the foregoing, either directly or indirectly, whether or not the aforementioned transactions and/or actions are completed for any reason whatsoever. |
| The amount of indemnification pursuant to all the letters of indemnification that have been provided and/or will be provided to the offers and employees of the Company, shall not exceed a cumulative sum equal to 25% of the Company's shareholders' equity in accordance with the last consolidated financial statements published prior to the actual provision of indemnification. It is furthermore noted that, in the event where an officer receives indemnification from the insurer of the officers' insurance policy, concerning the matter which is the subject of indemnification, the indemnification shall amount to the difference between the amount of financial liability imposed on him and legal expenses, and the amount received from the insurer in respect of the same matter, provided the amount of indemnification to which the company has committed does not exceed the maximum amount of indemnification |
105
| 19.2. | Agreement for leasing of a Logistics Center: On September 18, 2008, a lease agreement was signed between the Company and Gev-Yam Land Ltd. ("the lessor"), a public company controlled by the Company's indirect controlling shareholders, whereby the Company would lease a plot in Modi'in with an area of 74,500 square meters, as well as buildings to be constructed by the lessor for the Company, with a total constructed area of 21,300 square meters, to serve as a logistics center, industrial and office space ("Logistics Center") for the Company's subsidiaries, which would - in part - replace existing lease agreements. The Leasing Period shall be 15 years from the date of receiving possession of the Leased Property. The Company will also hold an option to extend the lease by an additional 9 years and 11 months. During the fourth quarter of 2010, the logistics center was populated by Amnir and by Hadera Paper Printing, while during the second half of 2011, Graffiti is also expected to relocate its distribution site to the logistics center. For additional details, refer to Section 12.6, above. |
| 19.3. | [removed] |
| 19.4. | Tender offer for full purchase of all public holdings in Carmel: On October 4, 2010, the company completed a full tender offer for the acquisition of all of the holdings of the public in Carmel, at a price of $22.5 per share in cash, at a total consideration of approximately $4.4 million. As of October 4, 2010, the Company holds 100% of the issued and outstanding share capital and voting rights of Carmel, that has become a privately held company. For details regarding Carmel’s activities and regarding the tender offer, see sections 2.8 and 10, above. |
| 19.5. | Mondi - Hadera Paper Printing transaction: As at December 31, 2010 the Company acquired 25.1% of the issued and outstanding share capital of Hadera Paper Printing from a subsidiary of Mondi Group. Total consideration for the purchase transaction stood at 10.364 million euro, paid from the Company’s own resources. Following the closing of the transaction, true to the date of the report, the Company holds approximately 75% of the shares of Hadera Paper Printing, that was consolidated within the financial statements of the Company, with a subsidiary of Mondi Group holding the remaining shares of Hadera Paper Printing. For details regarding Hadera Printing Paper’s activities and details regarding the acquisition transaction, see section 11.1, above. |
| 19.6. | Sale of property in Bney Brak: Amnir, one of the Company’s subsidiary companies, sold a plot of land covering 9000 m² in Bney Brak on July 25, 2010. This property served as a waste paper and cardboard collection and recycling plant. Consideration paid was in the amount of NIS 20 million. For full details, see section 12.3, above. |
| 19.7. | Sale of property in Tel Aviv: On June 1, 2010, the Company entered into an agreement for the sale of its rights to a property of 7600 m² in Tel Aviv, which in the past served as one of the Company’s paper manufacturing plants, in return for the sum of NIS 64 million, subject to certain conditions. For full details, see section 12.4 Error! Reference source not found., above. |
106
| 19.8. | Agreement with Yam Tethys Group - On July 29, 2005, a natural gas purchase agreement was signed by the Company and partners of the Yam Tethys Group (Noble Energy Mediterranean Ltd., Delek Drilling Limited Partnership, Avner Oil Exploration Limited Partnership and Delek Investment and Assets Ltd.). The gas to be purchased, pursuant to this agreement, is intended to fulfill the Company’s requirements in the coming years, for the operation of its energy generation plants using cogeneration at the Hadera plant. The gas is being supplied to the company since August 2007, pursuant to the agreement (hereinafter: "Gas Flows Start Date"). Gas delivery is scheduled to end upon the earlier of: (1) 5 years from gas flow start date, as set forth in the agreement; (2) completion of gas purchase amounting to 0.43 BCM; but no later than July 1, 2011. Based on company estimates regarding the consumption of natural gas during the period of the agreement and the volume of consumption of natural gas by the company, starting in 2007 as mentioned above, the overall estimated financial volume of the transaction totals approximately 33 million dollars over the entire period, as stated above. In July 2011, the gas supply agreement with Yam Tethys is scheduled to terminate and the Company is examining alternatives for the said agreement. According to Company estimates, and based on the prevailing market prices, upon the signing of a new agreement with any of the potential suppliers, the price of gas is expected to rise in relation to the gas prices pursuant to the current agreement. |
True to the date of the report, there exist several suppliers of natural gas in Israel: Yam Tethys, EMG and an additional potential supplier. The Company is dependent upon Yam Tethys, as detailed in Section 8.20.6, above. The Company is conducting discussions with EMG and with the potential additional suppliers, regarding the purchase of natural gas, for its continuing operations, subsequent to the termination of the agreement with Yam Tethys, as well as for the power station whose establishment is being analyzed by the Company. For details regarding the power generation station, see Section 21.8, below. Moreover, for additional details regarding the potential impact of the latest developments in Egypt, see Section 23.5, below. |
| 19.9. | Agreement with Israel Natural Gas Routes Ltd. - The Company has an agreement dated July 11, 2007 with Gas Routes for a period of six years, for the transportation of natural gas to the Company site in Hadera. The agreement also includes an extension option for an additional period of two years. The transportation agreement is worded as approved by the Natural Gas Authority for transportation consumers, and is published on the website of the Ministry of National Infrastructure, with commercial terms agreed individually by the parties. The proceeds, pursuant to the agreement, include payment of a non-recurring connection fee upon connection, based on actual cost of connection to the Company's facility, as well as monthly payments based on two components: (a) A fixed amount for the gas volume ordered by the Company; (b) based on the actual gas volume delivered to the facility. True to the date of the report, the company is dependent upon Gas Routes, as detailed in Section 8.20.7, above. In the agreement, the Company undertook to make a fixed annual payment even if it makes no actual use of the transport, amounting to NIS 2 million per year. The agreement addresses the indemnification of Natural Gas Routes as part of the payment of compensation due to harm to adjacent land. Compensation lawsuit is currently being deliberated against Natural Gas Routes by owners of land in proximity to the gas production plant, regarding impairment. The proceeding is conducted before the appeals committee and the Company is not a party to the proceedings. On February 25, 2010, the company received the decision of the committee to set the level of compensation at NIS 2,670 thousands. All of the parties to the lawsuit have appealed the decision of the committee. The appeals have been heard jointly, with the agreement of the parties, and were rejected by the court on December 10, 2010. The company has made the necessary provision according to its estimates in this respect, as stated in Note 14(j) to its financial statements dated December 31, 2010. |
107
| 19.10. | An agreement was approved by the Audit Committee on February 28, 2011 and by the board of directors on March 6, 2011, for the Company’s leasing roof area at the Company’s Hadera plant to Clal P.V. Projects Ltd. ("Clal PV"), a private company held and controlled indirectly by Clal Industries and Investments, in an overall area of up to 19,200 m2 (out of which the company was granted an option not to lease a portion of this area, in the scope of up to approx. 14,300 m2), for construction of installations for the production of electricity using photovoltaic technology and transfer of this electricity to the electricity grid during the lease period, under a production license to be granted to Clal PV. The agreement is subject to the fulfillment of various prerequisites within 15 months from the date of signing, including, inter alia, obtaining permits, authorization and licenses to construct the installations, obtaining the consent of the general meeting of the Company shareholders to be convened for the purpose of approving this engagement (in light of its being a transaction that CII has a personal interest in) and other conditions. For additional details, refer to Section 12.8, above. |
| 19.11. | Initiative for collection of paper overseas: On March 6, 2011 the Company’s board of directors approved the establishment of a foreign company (hereinafter: "the Foreign Company") to be established for the purpose of engaging with a business partner overseas (an unrelated third party) for operation in the field of removal of paper and cardboard waste and recycling operations overseas, as a joint venture (hereinafter: "JV"). The Company’s portion in the operations is expected to stand at 65%. Operations will require an initial investment, to be performed in stages, according to the JV’s needs, of some $5.2 million, by shareholder loans or shareholder guarantees, out of which the Company will invest some 80% of the amount. The agreement is expected to include restrictions regarding the partners’ transfer of shares in the JV, to grant the foreign company the right to appoint 2/3 of the members of the board of directors and the JV’s CEO, to grant the Company the right to purchase up to 75% of the paper and cardboard waste collected by the JV at market prices, and to include certain non-competition clauses. The Company is acting towards this agreement, and there is no certainty that any part or all of the above regarding the probability of the JV and final agreements on understandings, will be realized. |
| 20. | Legal Proceedings |
| There are no material legal proceedings filed against the Company, and no material demands by any government authorities. With regard to legal proceedings described in the financial statements, see Note 14 to the Company's financial statements as of December 31, 2010 attached to this report. |
| Regarding a lawsuit against Gas Routes in relation to the agreement, see details in Section 19.9, above. |
| Regarding a class-action lawsuit filed against Hogla Kimberly and the taxation lawsuit in Turkey against KCTR, a subsidiary of Hogla Kimberly in Turkey, see Section 24.1.25, below. |
108
| 21. | Business Objectives and Strategy |
| 21.1. | Hadera Paper, together with its strategic partners in various fields (associated companies) aspires to continue to develop its business both in Israel and abroad, while being rigorous about its market leadership and innovation at the same time, and while constantly improving its products and customer service. This is in addition to expanding its output capacity, broadening its basket of products and its sectors of operation, while simultaneously continuing to improve efficiency in all production cost components. |
| 21.2. | Hadera Paper examines from time to time, subject to business opportunities and the company's decisions on this subject, the inclusion of strategic partners for its activities that are currently carried out by wholly-owned subsidiaries. |
| 21.3. | The company strives to manage the various units together with its strategic partners, in a manner that would best express the synergy of the acquisition, the operation and the other systems such as steam and energy. |
| 21.4. | In the manufacture of packaging paper, as a response to the competitive environment wherein the Company operates, a new packaging paper production system, known as "Machine 8", was constructed over the past several years and will allow the Company to meet the demand on the domestic market, at a more competitive cost to the Company and with higher paper quality compared to competing imports. The Company estimates that the new machine will ultimately have an output capacity of approximately 230,000 tons per annum. The running in process of the machine was successfully completed on May 31, 2010. The gradual improvement in the learning curve of the machine is continuing. The Company estimates that upon completion of the learning process of the new machine, that is expected to take place in 2011, the active output capacity of the Company in packaging paper is expected to grow from approximately 160,000 tons per annum before the construction of the machine, to approximately 320,000 tons per annum. It should be noted that Machine 1 is still operational and its output potential is equal to 50,000 tons per annum, as it is able to supply extraordinary demand if necessary and/or to produce niche products with high added value. The operation of Machine 8 requires doubling, over the coming years, of collection volume of paper waste to serve as raw material for packaging paper production. Amnir is working to increase the volume of waste collection, inter alia, by intensifying collection activity from existing customers and the development of new collection sources, adaptation of its organizational structure, examining the possibility of importing waste from overseas, relocation to the new logistics center and inventory accumulation. The company is also examining the establishment of additional collection systems overseas. For additional details regarding the expected developments in the manufacture of packaging paper, see Section 8.25, above. For additional details regarding the Logistic Center, see section 12.3, below. |
| 21.5. | On March 1, 2011 the Formalization of Treatment of Packaging Law 5771 – 2011 will enter into effect (hereinafter: "the Packaging Law), with the goal of regulating arrangements in the matter of treatment of packaging waste. Inter alia, the Packaging Law establishes responsibility for recycling packaging waste and goals for recycling types of packaging waste. The Company cannot at this point assess the impact of the law on its activities, and this depends, among other things, on arrangements to be set by power of the law regarding separation at source, and in the matter of collection and removal of waste, and on the method by which the recognized body established by power of the law operates. The company is preparing to examine the various collection possibilities. For details regarding the Packaging Law, see section 8.23.2, above. |
109
| 21.6. | The company also continues its efforts to promote the processes of innovation in the group's companies by developing new products and through competitive differentiation. In the course of the last two years, the sector has started to quickly develop paper types, based on 100% recycled fibers, whose high quality will render it possible to replace packaging paper based on pulp, in the corrugated board industry in Israel and overseas. The development process is gradual and is currently in advanced stages and is intended to significantly expand the volume of the potential market for packaging paper. The gradual launch of products that started in 2009. For additional details, refer to Section 8.11, above. |
| 21.7. | Moreover, upon the operation of the new manufacturing system, the significant expansion in the output capacity of recycled packaging paper will allow for the expansion of the sector's operations both in Israel and overseas. Together with the process of developing pulp-replacement packaging paper products on the basis of 100% recycled fibers, as mentioned above, this will enable the sector to expand the sale of such products, as a substitute for pulp-based packaging paper in international markets. The new products create an improved profit potential and have started to be sold at a significant price supplement per ton of exported paper, as compared with the selling prices of basic paper types. The Company worked in 2009 and 2010 to develop export markets that would absorb surplus manufacturing that cannot be absorbed by the domestic market and has started marketing to several agents dealing in various types of packaging paper, in Europe and elsewhere. Pursuant to the operation of Machine 8, this activity is expected to bring about a gradual increase in exports by the Company, alongside the diversification of the Company's product portfolio and markets within the sector of operations. |
| Information concerning the increase in output capacity, growth in the quantity of waste collection, increased profit potential, new developments of the company and the continuing development of export markets by the company all constitute forward-looking information as defined in the Securities Act and merely consists of forecasts and estimates by the Company which are not certain to materialize and are based on information available to the Company as of the report date. The aforementioned Company forecasts and estimates may not materialize, in whole or in part, or may differ from current forecasts and estimates, due to multiple factors, including business opportunities available to the Company, changes in demand in markets in which the Company operates, global supply and cost of paper products, technical malfunctions, factors related to the completion of development and/or the materialization of any of the risk factors set forth in sections 8.26 and 23, below. |
| 21.8. | As of the report date, the Company is reviewing and promoting the installation of a power plant intended to provide steam and electricity for the production system in Hadera, and to sell surplus electricity to the Israel Electric Company (IEC) and/or to private customers, at a scope of up to 230 MW. The power plant, should it be installed, is planned to operate on land acquired for this project adjacent to the Company facility in Hadera, and is to be operated by natural gas. The decision regarding the approval of the power station project is being delayed, inter alia, as a result of the need to await a more stable business environment in terms of the possible gas sources, in order to complete the engagement for the purchase of the natural gas that is required. Consequently, a company named Combined Energy was established in 2010, to conduct negotiations with potential gas suppliers, as detailed in section 19.8 above, and also to conduct negotiations with future potential clients. |
110
| The above information regarding construction of the power plant constitutes forward-looking information as defined in the Securities Act, based on company estimates as of the report date. This estimate may not materialize, in whole or in part, or may materialize differently due to, inter alia, changes to the Company's work plan, obtaining regulatory approvals, market conditions, economic feasibility review, dependence on external factors or any of the risk factors set forth in sections 8.26 and 23, below. |
| 21.9. | In the area of office equipment, the Company's goals are to continue the reinforcement of Graffiti's position as a leading company in the direct supply of office equipment to institutions and businesses in Israel ("B2B"), while focusing on expanding the range of products offered to existing clients, expanding operations vis-à-vis potential clients for the purchase of a wider product range and expanding the use of the e-commerce site. The Company is studying the expansion of this sector of operations through acquisitions or ventures with small suppliers of office supplies, as well as through the creation of strategic collaborations. The company also intends to exploit the advantages of the new logistics center, upon the completion of the relocation, in order to expand and develop the Graffiti operations. |
| Information regarding the establishment and strengthening of the Graffiti position in the sector, the expansion of the sector, the creation of strategic collaborations and the exploitation of the logistics center for the expansion and development of the Graffiti operations all constitute forward-looking information as defined in the Securities Act and merely consists of forecasts and estimates by the Company which are not certain to materialize and are based on information available to the Company as of the report date. The aforementioned Company forecasts and estimates may not materialize, in whole or in part, or may differ from current forecasts and estimates, due to multiple factors, including business opportunities available to the Company, changes in demand in markets in which the Company operates, global supply and cost of paper products and/or materialization of any of the risk factors set forth in sections 9.17 and 23, below. |
| 21.10. | The company continues the implementation of cross-organizational plans: As part of the talent management program, emphasis was placed in 2010 on the mapping and professional diagnosis of the corporate top talent reserve and the creation of a development program that is in line with the challenges of the group. |
| 21.11. | In addition, the Company has adopted a plan for the implementation of work processes for the sales and marketing networks, targeted on institutional markets, for the intensification of the companies' added value in client perception and the improvement loyalty premium and price on the basis of differentiation of products and service. The Company also continues to implement the center lining program for improving the efficiency of manufacturing lines and operational performance. |
| 21.12. | In the course of the year, the Company decided upon the creation of a supply chain mechanism that will result in savings and efficiency in purchasing, logistics, international shipments and planning, while maximizing the synergy between the group companies in these areas. As part of this activity, several distribution centers are being relocated to the new and advanced logistics center in Modi'in. |
111
| 21.13. | At the same time, the company has been conducting marketing activity according to the B2B client orientation, aimed at creating a business client focus based on the understanding of the clients' needs, their value to the company and their prioritization, to create an advantage and differentiation in company solutions, which would enhance loyalty and improve premiums relative to competitors. This would also include marketing communication operations opposite the target audiences in order to strengthen and position the company brand. |
| 21.14. | The Company has also been implementing a pro-active approach with respect to safety and management culture, under which employees should identify risks and take action to prevent them, in order to minimize safety events, increase the information on risks and expand the cooperation between managers and staff on the subject of safety. Moreover, in order to increase awareness toward safety, any safety event is analyzed at a monthly level at all group companies, under the leadership of the group CEO, to serve as a discussion tool for drawing conclusions and initiating preventive measures. |
| These measures, along with focusing on efficiency cost-cutting measures, are intended to compensate for the escalating competition in the anticipated erosion of selling prices in the currently challenging business environment, while bringing about improved profitability. |
Said information regarding the improved profitability, improved efficiency and the strengthening and positioning of the brand, is considered forward looking information as defined in the Securities Law, and constitutes forecasts and assessments on the part of the company, the realization of which is not certain and based on information existing in the company as of the date of the report. These forecasts and estimates by the Company may not materialize, in whole or in part, or may materialize in a manner significantly different than that expected. The major factors that could impact this are business opportunities the company may have, dependence on external factors, changes in demand and supply, developments and changes in regulation and/or realization of any of the risk factors outlined in sections 9.17, 8.26 and 23, below. |
| 21.15. | Moreover, as stated in Section 17 above, the Company is working to encourage a reduction in the wastewater being transferred to the Hadera Stream from the company site and to transfer part of that runoff for reuse at the site, while developing new technologies for softening and desalinating wastewater. In 2010, the company managed to salvage approximately half a million cubic meters of softened waste water at its plants, instead of using freshwater, representing approximately 25% of total waste water. In addition to increasing the salvage of softened wastewater, the company is working to promote the water desalination project and is continuing with the desalination pilot project. The completion of the project would allow to reclaim approximately 2,000,000 m³ of water, representing approximately 70% of the total consumption of water on the site, while significantly reducing the allocation of water to the plant. |
Said information regarding the processes for reducing wastewater, promotion of the desalination project and the repercussions of its completion, including the reduction of water allocation, as mentioned above, are all considered forward looking information as defined in the Securities Law, and constitutes forecasts and assessments on the part of the company, the realization of which is not certain and based on information existing in the company as of the date of the report. These forecasts and estimates by the Company may not materialize, in whole or in part, or may materialize in a manner significantly different than that expected. The major factors that could impact this are dependence on external factors, changes in demand and supply, developments and changes in regulation and/or realization of any of the risk factors outlined in sections 9.17, 8.26 and 23, below. |
112
| 21.16. | Regarding the strategic Investment in Turkey, see Section 24.1.26.1, below. |
| 21.17. | The company's strategic goals as laid out above are based on the company's objectives and ambitions as of the reporting date and could change in accordance with the relevant decisions made by the company. |
| 22. | Anticipated Development over the Next Year |
| As of the report date, the Company is reviewing and promoting installation of a power plant which would provide steam and electricity to the Hadera production plant, and would sell surplus electricity to IEC and/or to private customers - for further details see section 21.8 above. |
| For details regarding the transition to the new Logistics Center, C. Section 12.3, above. |
| For details regarding Machine 8, see Section 8.4, above. |
| The company's assessments regarding the power plant project constitute forward-looking information, as defined by the Securities Law, based on information held by the Company as at the date of the report. These estimations may not materialize, in whole or in part, or even materialize in a manner essentially different than expected. Major factors which may impact this include changes to market supply and demand, changes to company plans, obtaining regulatory authorization and/or materialization of any of the risk factors set forth in sections 8.26, 9.17 and 23, below. |
| 23. | Risk Factors |
| 23.1. | General |
| The Company conducts periodical discussions regarding market risks and exposure to exchange rate and interest rate fluctuations, with the participation of the relevant factors, so as to reach decisions in this matter. The individual responsible for the implementation of market risk management policy at the Company is Shaul Glicksberg, the Group's VP of Finance and Business Development. |
| 23.2. | Macro-Economic Risk Factors |
| 23.2.1. | Macro-economic factors |
| 23.2.1.1. | Economic, political and social situation - The Group is dependent upon the economic situation in Israel and worldwide. The emergence from the global financial crisis in 2010 led to developments in global markets, and especially in the euro bloc and in the United States, that also include volatility in global exchange rates, have and may continue to affect the business results of the Company and its investees, their liquidity, shareholders' equity and assets and the ability to realize these assets, the state of their business (including the demand for the products of the Company's investees). In Israel, 2010 was a year of recovery from the global crisis, that was accompanied by growth and expanded activity. During the last several months of the year, much like in other developing countries, a certain slowdown in growth was evident, accompanied by the revaluation of principal foreign currencies against the shekel, coupled with an increase in the inflation rate in the local market, that may serve to erode the competitive abilities of the company against global competitors and against imports. |
113
| 23.2.1.2. | As at the date of the report, it is impossible to estimate whether the said crisis in the financial markets has indeed run its course, what are its direct and indirect economic implications globally and in Israel, and how long such implications will last, if at all. |
| 23.2.1.3. | An economic slowdown in Israel or globally, or a persistent recession and/or a deterioration of the political and security situation in Israel and outside Israel could have an adverse effect on the financial situation of the company and the group's companies. In addition, these circumstances could reduce the demand for the Company's products, and as a result hurt sales, financial results and profitability. |
| 23.2.2. | Inflation |
| Since the Company has significant excess liabilities linked to the Consumer Price Index, primarily in respect of bonds issued by the Company, amounting to NIS 296 million in total, a high inflation rate may cause significant financing expenses. The Company occasionally enters into hedging transactions to cover the said exposure on account of the liabilities. The Company is examining the cost of hedging as opposed to the relevant exposure and is operating accordingly to hedge the risk. |
| A high inflation rate may also impact payroll expenses, which are adjusted over time to changes in the consumer price index. |
| The Company continues to regularly monitor quoted prices for hedging its exposure and in the event that these will be reasonable, the company will enter into the relevant hedging transactions. |
| The Company also enjoys partial natural hedging on some of the said liabilities due to the current debt of an associated company that is linked to the consumer price index. |
114
| 23.2.3. | Exposure to Exchange Rate Fluctuations |
| The Company and its consolidated subsidiaries and associated companies are exposed to risks on account of changes in exchange rates, whether due to the import of raw materials and finished goods, or due to exports to foreign markets. Changes in exchange rates of various currencies vis-à-vis the NIS may erode profit margins and cash flows. |
| Approximately half of the Company’s sales are denominated in US dollars, whereas a significant share of its expenses and liabilities are in NIS. The Company is therefore exposed to exchange rate fluctuations of the NIS vis-à-vis the US dollar. |
| Economic exposure (on account of surplus proceeds on payments in foreign currency or linked thereto) and accounting exposure (on account of a surplus of dollar-linked liabilities over foreign-currency-denominated assets). |
| Pursuant to the purchase of equipment for Machine 8, whose prices are denominated in euro, true to December 31, 2010, the company has entered into forward transactions on the euro in the sum of €3.0 million, to hedge against the cash flows, regarding the completion of payments for the acquisition of the fixed assets acquired from the equipment vendors of Machine 8. |
| It should be noted that on the aggregate level that includes associated companies, the currency exposure is limited. |
| 23.2.4. | Interest Risks |
| The company is exposed to changes in interest rates, primarily in respect of bonds it has issued in the amount of NIS 658 million, as at December 31, 2010. For details see section 16, above. |
| 23.3. | Sector-Specific Risk Factors |
| For details regarding sector-specific risk factors, see Section 8.26, above for the packaging paper and recycling sector, Section 9.17 above, for the office supplies marketing sector, Section 10.23 above, for packaging products and cardboard and Section 11.26 above, for the fine paper sector. |
| 23.4. | Special Factors |
| 23.4.1. | Accounts Receivable Risks |
| Most of the sales of the Company and its associated companies are made to many customers in Israel, with some sales being made without full collateral. Exposure to accounts receivable risk is generally limited due to the relatively large number of customers. The company is regularly examine the quality of accounts receivable in order to determine the sum of provision that is required for doubtful debts, especially in view of the lessons of the global financial crisis. The company's exposure to accounts receivable risk is measured according to the quality of the client and volume of the exposure thereto in terms of the total credit. The financial statements reflect appropriate provisions for doubtful debt. |
| 23.4.2. | Group of Borrowers |
| As the Company is part of the IDB Group, the group may be affected from the directives of proper banking management of the Supervisor on Bans which, inter alia, include restrictions on the amount of loans an Israeli bank may provide to a single borrower and to a group of borrowers. IDB Holdings and some of the companies in the IDB Group are considered as one group of borrowers. This may, under certain circumstances, affect the company's ability to borrow funds from an Israeli bank. |
115
| As to the risk factors in each of the Company's sectors of operation, see section 23.3, above. |
| 23.5. | General factors |
| 23.5.1. | Geo-political developments in Egypt - Recent geo-political developments in Egypt and uncertainty with regards to stability of governments could negatively impact the Company’s option of engaging under an agreement with gas provider EMG, one of the gas providers the Company has been negotiating with in connection with gas supply. As of the date of this report, the Company cannot assess the impact the situation in the region will have on the option of said engagement with EMG, or said impact on possible conditions of engagement with other gas suppliers. |
| 23.6. | The extent of impact of risk factors |
| Following below is a list of the risk factors and their influence upon the Company: For details regarding the company's assessment of the type and degree of influence of the sector-related risk factors, see Sections 8.26, 9.17, 10.23, 11.26 above and 23, below. |
| Risk Factors | Degree of Impact | ||
| Considerable Influence | Medium Influence | Small Influence | |
Macro-economic factors | -Economic, political and social situation -Exposure to Exchange Rate Fluctuations | -Interest Risks -Inflation | |
| Special Factors | -Accounts Receivable Risks -Group of Borrowers | - Geopolitical developments in Egypt | |
| 24. | Investments in Associated Companies |
| Following below is a description of the Company's principal associated company. The results of operation of this company are not consolidated in the Company's financial statements and are presented as part of "Investments in associated companies" in the company's financial statements. |
| 24.1. | Hogla-Kimberly Ltd. |
Hogla-Kimberly is the leading company in the non-food disposable goods market in Israel. Hogla-Kimberly manufactures and markets a wide variety of home paper products (tissue paper, paper towels, napkins and wipes), disposable diapers for babies, wet wipes, incontinence products (adult absorbent products), feminine hygiene products and other products for the kitchen and for cleaning. Hogla-Kimberly also sells reels of tissue paper to manufacturers of household paper products. The operations of Hogla-Kimberly in Israel are also conducted through wholly-owned subsidiaries - Hogla-Kimberly Marketing Ltd. and Mollett Marketing Ltd. |
116
| Moreover, Hogla-Kimberly also operates in Turkey through a Turkish subsidiary - KIMBERLY-CLARK TUKETIM MALLARI SANAYI VE TICARET A.S., (hereinafter: "KCTR"), that was acquired by Hogla-Kimberly in 1999. |
| Following below is additional information regarding Hogla-Kimberly and its operations. |
| 24.1.1. | General |
| 24.1.1.1. | Hogla-Kimberly is a privately-held company that was established in 1963 as a wholly-owned subsidiary of the company, for the purpose of engaging in operations in the disposable, non-food consumer goods category. In 1996, Kimberly Clark Corporation (KC) (hereinafter: "Kimberly Clark" or "KC") acquired 49.9% of Hogla-Kimberly's issued share capital. On March 31, 2000, KC increased its holdings in Hogla-Kimberly to 50.1% of the latter's issued share capital. As a result, Hogla-Kimberly Ltd. is no longer consolidated within the Company’s financial statements since the second quarter of 2000, and the Company’s share of the Hogla-Kimberly results is included in the company’s share in the earnings of associated companies. As at the date of the report, KC holds 50.1% of the issued share capital of Hogla-Kimberly, while the Company holds 49.9% of the issued share capital of Hogla-Kimberly. |
| 24.1.1.2. | In March 2009, Hogla-Kimberly issued the Company a preferred share, which entitles the Company to repay a capital note given to Hogla-Kimberly in the amount of NIS 33 million. Later on in March 2009, the capital note was repaid in full. |
| 24.1.1.3. | In June 1996, an agreement was signed between the company and Kimberly Clark, the shareholders of Hogla-Kimberly, that was revised in the year 2000 (hereinafter in this section: "The Agreement"), whose key points are as follows: |
(a) | Pursuant to the agreement, six directors serve at Hogla-Kimberly, of which three serve on behalf of the company and three on behalf of Kimberly Clark. The chairman of the board of directors is appointed by KC, while the deputy chairman is appointed by the Company. Resolutions of the board of directors of Hogla-Kimberly must be passed unanimously by the directors present, and the quorum required is at least two directors, one from each party. |
| (b) | Pursuant to the agreement, the following resolutions will require a resolution on the part of the shareholders of Hogla-Kimberly: (1) Amendment of the articles of Hogla-Kimberly and an increase in the registered capital; (2) Selection of the auditing CPA that will be recommended by Kimberly Clark; (3) Liquidation or discontinuation of part of the operations of Hogla-Kimberly, acquisition of material new operations and a merger with a party that is not a related party; |
117
(c) | The agreement stipulates that resolutions passed by the General Meeting shall be carried unanimously. |
| (d) | The CEO of Hogla-Kimberly is appointed by Kimberly Clark, from an agreed-upon short-list that was prepared by the Company and by Kimberly Clark. The CFO is appointed with the recommendation of Kimberly Clark, subject to the approval of the board of directors. Pursuant to the agreement, it was decided that in the event of disagreement between the company and Kimberly Clark in certain issues, such as: Appointment and termination of the CEO, appointment and termination of the CFO, CEO compensation, CFO compensation and operating budget - these issues shall be brought up, by request of the Company or of Kimberly-Clark, before the CEOs of both companies, and in case of disagreement between them, the issues will be submitted for recommendation by an arbitrator - which would be brought before the General Meeting and decided by an ordinary majority of the shareholders. |
(e) | Pursuant to the agreement, the company provides Hogla-Kimberly with various services such as maintenance services and infrastructure for the Hogla-Kimberly plant at the Hadera site and also leases it real-estate for its operations in Hadera and in Nahariya. The company also provides Hogla-Kimberly with various staff or headquarter services. Kimberly Clark provides Hogla-Kimberly - pursuant to the agreement - with information, technological assistance and the permission to use its international brands. The services provided by the shareholders to Hogla-Kimberly that are not covered by the license agreement as defined above, are provided in return for payment, based on market prices. |
(f) | Each party holds a right of first refusal in the event of the sale of shares by the other party. The agreement also grants the company an option, whereby in the event that KC wishes to sell its shares to a third party, the company will be able to buy back control (0.2% of the issued share capital of Hogla-Kimberly) in return for the sum it received in 2000 for the sale of control ($5 million). |
| (g) | The shareholders agreed not to compete against each other (including their subsidiaries) in the area of operation of Hogla-Kimberly in Israel, in the Palestinian territories and in Gaza as detailed in the agreement, for as long as they hold the shares of Hogla-Kimberly and for a period of five years subsequent to the sale of their holdings in Hogla-Kimberly. |
118
| 24.1.1.4. | As part of an agreement signed between Hogla-Kimberly and Kimberly Clark in June 1996 (hereinafter in this section: "The license agreement"), Kimberly Clark grants Hogla-Kimberly a license to use certain trademarks and technical services associated with the manufacture of the products outlined in the license agreement. According to the license, Hogla-Kimberly will assume responsibility for product liability and shall indemnify Kimberly Clark for any breach and/or negligence associated with the manufacture of such products. As of the report date, the aforementioned agreement is effective through July 2011. |
| 24.1.1.5. | Hogla-Kimberly operations in the Turkish market: |
| (a) | Hogla-Kimberly operates in the Turkish market through a wholly-owned subsidiary that was acquired in 1999, named KIMBERLY-CLARK TUKETIM MALLARI SANAYI VE TICARET A.S., (hereinafter: "KCTR"). The Turkish market, due to its size and relatively low penetration rates, was earmarked by Hogla-Kimberly as possessing potential for strategic growth. |
| (b) | KCTR manufactures and sells products in the diaper and feminine hygiene sectors. For details regarding KCTR products, see Section 24.1.7.1, below. |
| (c) | KCTR operates in the Turkish market through its premium products under the Kimberly Clark Worldwide brand, in a format similar to that used by Hogla-Kimberly in Israel. For this purpose, KCTR has over the past several years, established both manufacturing as well as appropriate marketing, distribution and sales infrastructures in Turkey, for the local market and for exporting to Kimberly-Clark companies throughout the region. |
| (d) | Hogla-Kimberly is exposed to various risks related to its operations in Turkey. Over the last few years there has been greater stability in the Turkish market and Hogla-Kimberly estimates that the main risk associated with the Turkish market involves economic instability and elevated inflation rates that previously characterized the Turkish economy, and could potentially return and negatively affect KCTR’s operations. However, in light of the nature of products in the non-food disposable consumer goods market, which is a relatively stable market, that is only slightly affected by the overall level of economic activity. |
(e) | KCTR is continuing to implement a multi-annual program for expanding its operations in Turkey and reinforcing the position of the Huggies and Kotex brands in this market. Pursuant to this activity and pursuant to the distribution agreement that KCTR signed with Unilever, KCTR managed to significantly increase its turnover (5.0% in 2010 in relation to 2009), while improving its gross margins. |
119
| 24.1.2. | Dividend Distribution |
On February 26, 2009, the board of directors of Hogla-Kimberly approved the distribution of NIS 41.7 million ($10 million), as dividend to the shareholders. The dividend was distributed on July 1, 2009. |
| On February 26, 2009, the board of directors of Hogla-Kimberly approved the distribution of NIS 32.77 million to the preferred shareholders. The dividend was distributed on March 19, 2009. |
| On July 30, 2009, the board of directors of Hogla-Kimberly approved a distribution of NIS19 million to the shareholders. The dividend was distributed on October 01, 2009. |
| On October 22, 2009, the board of directors of Hogla-Kimberly approved a distribution of NIS 40 million as dividend to the shareholders. The dividend was distributed on January 20, 2010. |
| On February 18, 2010, the board of directors of Hogla-Kimberly approved a distribution of NIS 20 million as dividend to the shareholders. The dividend was distributed on May 12, 2010. |
| On April 22, 2010, the board of directors of Hogla-Kimberly approved a distribution of NIS 40 million as dividend to the shareholders. The dividend was distributed on July 15, 2010. |
| On July 27, 2010, the board of directors of Hogla-Kimberly approved a distribution of NIS 40 million as dividend to the shareholders. The distribution of NIS 35 million was performed on November 29, 2010, the distribution of the remaining NIS 5 million will be performed in the first quarter of 2011. |
On January 23, 2010, the board of directors of Hogla-Kimberly approved the distribution of NIS 30 million, as dividend to the shareholders. The dividend will be paid during the second quarter of 2011, provided that there are no significant negative developments on account of the tax occurrence in Turkey, as stated in Note 14 of the financial statements of the company. |
| Hogla-Kimberly possesses accrued earnings from several sources, including earnings originating from an "approved enterprise", that were exempt of corporate taxes at the date of their creation. In the event that dividend is distributed from the exempt revenues, Hogla-Kimberly shall be liable for the corporate taxes from which it was exempt. |
As part of the Income Tax approval of the merger, for simplification of the holding structure at Hogla-Kimberly Group, at Shikma Ltd. (a subsidiary merged into Hogla-Kimberly in 2006) (hereinafter: "Shikma"), a sum of NIS 101 million was capitalized, originating from its equity earnings, resulting from income of an Approved Enterprise at Shikma. In the event that this sum is distributed as dividend at Hogla-Kimberly, it shall be liable for corporate taxes according to the Income Tax agreement. |
120
| 24.1.2.1. | Dividend at KCTR: |
| KCTR has not distributed any dividends since its establishment. As at December 31, 2010, KCTR possesses no distributable earnings. |
| 24.1.3. | The general environment and the effect of external factors on Hogla-Kimberly's activity |
| By the very nature of most of the Hogla-Kimberly products being basic consumer goods, the demand for its products in recent years has remained relatively stable. The factors that can potentially affect the Hogla-Kimberly results in the future include: (1) Escalating competition on the part of local manufacturers and from imports, either through price competition or through the marketing of improved products; (2) Strengthening retail chains and constant pressure on their part to erode margins and expand private labels; (3) Rising prices of raw materials and finished goods purchased by Hogla-Kimberly, on account of rising global input prices; (4) Macro-economic factors that affect the market characteristics wherein Hogla-Kimberly operates, such as lower demand for consumer goods as a result of a global or domestic economic slowdown; (5) The strength of the Hogla-Kimberly brands in relation to competing brands, including adverse events related to the brands or the reputation of Hogla-Kimberly, whose occurrence may harm consumer demand. |
| The above information with regard to factors that may potentially impact the results of Hogla-Kimberly in the future, constitutes forward-looking information as defined in the Securities Act, and merely consists of forecasts and estimates by Hogla-Kimberly which are not certain to materialize and are based on information available at the company and at Hogla-Kimberly as of the report date. These estimates may not materialize - in whole or in part - or may materialize in a different manner than anticipated, inter alia on account of factors that lie outside the control of the company or of Hogla Kimberly, such as changes in market conditions, entry of competitors, technological developments, changes in the anticipated costs as well as changes and developments in regulation in the sectors of operation and/or the realization of any of the risk factors outlined in sections 24.1.28 below and 23, above. |
| 24.1.4. | Structure of the Hogla Kimberly Sector |
The Hogla-Kimberly sector belongs to the non-food disposable consumer goods market in Israel and deals in a wide variety of home paper products, disposable diapers for babies, wet wipes, incontinence products, feminine hygiene products and other products for the kitchen and for cleaning. Operations in this sector are conducted by the company through the associated company Hogla Kimberly. Hogla Kimberly and its competitors in the sector market the product intended for the private consumer through supermarket chains, drugstore chains and small private stores. The institutional sector services customers such as institutions, hospitals, hotels etc. In the non-food disposable consumer goods market, there exists a wide range of products with competition being waged both against local products and against international brands. The non-food disposable consumer goods market in Israel is a relatively stable market, that is only slightly affected by the overall level of economic activity. Most of the products marketed within Israel are those produced in Israel, although there also exist imported products. Due to entrance barriers into the sector, as detailed below, the structure of competition in the area is relatively stable. |
121
| In the course of 2010, Hogla-Kimberly managed to successfully strengthen its leading brands through enhanced marketing efforts. Moreover, in 2010, through focused sales efforts, Hogla-Kimberly managed to increase its quantitative sales. The quantitative growth in sales was assisted by the inclusion of Hogla-Kimberly's leading products as "loss leaders" (a leading product sold by the retail chain at an unprofitable price in order to attract customers) at the retail marketing chains. On the expense side, Hogla-Kimberly managed to lower the cost of manufactured products, by changing certain product specifications and by improving the output of some of its manufacturing plants, as well as by conducting an organizational change to streamline its methods of operation opposite consumers and clients, so as to lend support to the long-term strategy of Hogla Kimberly. |
On the other hand, an increase in prices was reported for most raw materials in relation to 2009, some of which were offset by the revaluation of the shekel against the dollar. This increase in the prices of raw materials has an impact on the profitability of the sector. |
| 24.1.5. | Critical success factors in the Hogla Kimberly sector of operations and changes therein |
| Several critical success factors may be indicated for Company operations in the Hogla Kimberly sector, which impact its operations: |
| 24.1.5.1. | Investment in necessary production equipment - Machines used in paper production are very costly, in terms of both acquisition and maintenance cost. Consequently, financing capabilities and the ability to raise funds, constitute an advantage in the sector of operations. |
| 24.1.5.2. | Local producer - In this operating sector, a local producer enjoys an advantage over imports, as the former is able to provide solutions that cater to the local consumer, ensure a constant supply of the product, at a relatively short lead time and as required by customers, thereby saving them the need to maintain large inventories. |
| 24.1.5.3. | Product quality and leading brands - The high quality of products and leading brands is a critical success factor in the sector. |
122
| 24.1.6. | Principal Entry Barriers |
| There are several barriers to entry of any company into the sector: |
| 24.1.6.1. | Initial capital - The sector industry is, by nature, capital intensive with heavy investment required in infrastructure and equipment, investment in distribution infrastructure and investments in technological improvements, entry into this operating sector requires a significant initial capital. Moreover, even after conducting the initial investments for establishing the necessary infrastructure for entering the sector, this area of operations is characterized by significant investments in ongoing equipment maintenance. |
| 24.1.6.2. | Building a brand - A penetration of this sector would require an extended period of time, due to the importance of reputation and leading brands in the sector. |
| 24.1.6.3. | Technological know-how and development capabilities - Since the sector is characterized by advanced technology, an entry into the sector would require technological know-how, development capabilities and frequent investments and technological improvements. |
| 24.1.7. | Products and Services |
Hogla-Kimberly manufactures and markets a wide variety of home paper products (tissue paper, paper towels, napkins and wipes), disposable diapers for babies, wet wipes, incontinence products (adult absorbent products), feminine hygiene products and other products for the kitchen and for cleaning. Hogla-Kimberly also sells reels of tissue paper to manufacturers of household paper products. |
| Hogla-Kimberly regularly upgrades a large part of its products on the basis of new technology and supporting marketing operations in an ongoing manner. |
The product whose revenues (in Israel and in Turkey) exceed 10% of the total accumulated revenues of Hadera paper in 2010, also including a relative proportion of the revenues of Hogla Kimberly (according to the Company holdings in Hogla Kimberly) (hereinafter: "Aggregate Hadera Paper Revenues") is disposable diapers. Hogla-Kimberly's consolidated revenues (Israel and Turkey) from disposable diapers in 2010 and 2009, amounted to NIS 904.8 million and NIS 946.2 million, respectively, which accounted for 53% and 55% of Hogla-Kimberly's total consolidated revenues. |
| Hogla-Kimberly upgrades its products from time to time, in order to preserve innovation and leadership. |
| 24.1.7.1. | KCTR Products and Services: |
| KCTR manufactures and markets products in the diaper and feminine hygiene sectors. Toward the end of 2005, KCTR launched the first Kotex feminine hygiene products, while in the course of 2006, KCTR also launched the Huggies brand. The launch was accompanied by an extensive marketing campaign. The penetration of products in these sectors involves - by its very nature - massive investments in advertising, sales promotion and additional expenses associated with penetrating into the large retail marketing chains and expanding shelf space. In 2009, KCTR continued in the process of developing products and launched new product lines under the brands Huggies and Kotex. KCTR also launched a profitable new category - Dry Nites - that contributed to both revenues and gross profit. In 2010, KCTR continued to develop its principal products Huggies and Kotex. Moreover, in 2010, KCTR launched a new brand in the adult care category, named Depend, with the intention of dominating the market and raising the gross profitability of the category. |
123
| 24.1.8. | Distribution of product and service revenues at the Hogla Kimberly sector of operations |
| The revenues of Hogla Kimberly from the sale of disposable diapers (in Israel and in Turkey) totaled NIS 904.8 million in 2010, NIS 946.2 million in 2009 and NIS 842.1 million in 2008. The said revenues in 2010 represented 24.4% of the total aggregate revenues of Hadera Paper in 2010, that also include the revenues of Hogla Kimberly . It should be noted that the Hogla Kimberly revenues from the sale of toilet paper represent less than 10% of the total aggregate revenues of Hadera paper. |
| For further financial information concerning Hogla-Kimberly, see its financial statements as at December 31, 2010, attached to this report. |
| 24.1.9. | Customers |
| Hogla-Kimberly's client market is usually stable. Hogla-Kimberly operates nationwide and its products are marketed and distributed extensively to clients throughout the country. |
| In the years 2008-2010, Hogla-Kimberly sales to the food retail chains grew somewhat, at the expense of sales to private and small stores. In the institutional market (serving businesses such as: institutions, hospitals, offices, hotels and the like) there has been a trend of consolidation over the past several years (merger of small competitors). In 2010, approximately 19.5% of Hogla-Kimberly sales were made to the institutional market, while 80.5% of its sales were to the consumer market (including retail chains). |
| All the retail marketing chains and pharmacy chains number among Hogla-Kimberly’s customers. Total sales to major retail chain Supersol, a company controlled by a controlling shareholder, in 2010 and 2009, amounted to NIS 224.5 million and NIS 242.2 million, respectively, which accounted for 13.2% and 14.0% of Hogla-Kimberly's revenues. Hogla-Kimberly has no agreement with Supersol and the engagement with Supersol is made from time to time in the normal course of Hogla-Kimberly's business, according to an agreement regarding the commercial terms between the parties and at market terms. |
| The sales of Hogla Kimberly to the three largest retail marketing chains in Israel represent approximately 31% of consolidated sales. The discontinuation of sales to each of the three chains could hurt the sales of Hogla-Kimberly in the short term, but given the customers' loyalty to the strong brands, no long-term negative impact is expected, and therefore Hogla-Kimberly is not dependent upon any of these chains. |
124
| Hogla-Kimberly is not dependent upon any single client. |
| Hogla-Kimberly is active in the Israeli retail market for consumer goods. |
| 24.1.9.1. | KCTR customers: |
KTCR sells its products to the private market in Turkey, consisting of local chains and small retailers, as well as to the nationwide and international food chains that operate in Turkey, which KCTR estimates account for 30% of the market potential, in which KCTR continues to operate directly. The sales and marketing to the private market are made through Unilever (for additional details, see Section 24.1.10, below). |
| Moreover, KCTR exports its products to various countries in the region. In August 2007, the KCTR plant in Turkey was declared by Kimberly Clark to be a regional manufacturing plant, which resulted in greater exports. |
KCTR is not dependent upon any single client. Moreover, KCTR has no single client whose revenues account for over 10% of the total KCTR revenues. |
| 24.1.10. | Marketing and Distribution |
| Hogla-Kimberly, through its employees, operates a sales and distribution system based on the operation of distribution warehouses, merchandise distribution trucks and a wide array of sales personnel. Hogla-Kimberly has two distribution sites, in Zrifin and in Haifa. For sales to the institutional market, extensive use is made of a separate Hogla-Kimberly marketing system and a combination of distribution with operations on the household front. Wholesalers are also used for distribution and customer service for smaller customers in the market. |
| Hogla-Kimberly is not dependent upon any single wholesaler. |
| As Hogla-Kimberly’s products are by nature “off-the-shelf products”, and of a relatively large volume (diapers, toilet paper and the like), and because of the type of customers, a constant supply to customers is required. |
| 24.1.10.1. | KCTR's marketing and distribution: |
A strategic cooperation agreement was signed on March 1, 2007, between KCTR and Unilever in Turkey. Pursuant to this agreement, Unilever will conduct the sales, distribution and collection on behalf of KCTR in the entire Turkish market, except for international supermarket chains that operate in Turkey (opposite which KCTR operates directly), in return for marketing and distribution commission that is paid by KCTR. KCTR is operating according to the agreement, which is currently being extended until 2012, and in accordance with the commercial terms that are determined annually. |
125
| Although KCTR is dependent upon Unilever as a distribution factor to the private market and in the event that the agreement is terminated, the company would expect to see certain short-term damage to its operations in Turkey. However, KCTR estimates that the cancellation of the agreement in order to significantly and adversely affect KCTR in the long-term, or causes significant additional costs as a result of the need for replacement. Consequently, the company believes that KCTR is not dependent upon Unilever. |
| 24.1.11. | Order Backlog |
| Hogla Kimberly has no backlog. The orders are made with short lead times and on the basis of customer forecasts. |
| 24.1.12. | Competition |
| Hogla-Kimberly operates in a very competitive environment with regard to the products manufactured on the local market as well as against imported products. It should be noted that over the last several years there has been an escalation of private labels, marketed by retail marketing chains. |
| Nevertheless, the operations of Hogla-Kimberly in the manufacture of paper products and diapers is characterized by few competitors, especially in view of the elevated entrance barriers that exist therein. These entrance barriers include inter alia, significant investments in production facilities, investments in distribution infrastructure and frequent investments in technological improvements. It should further be noted that although there exists no limit on the import of paper products and diapers, other than tariffs on imports from the Far East, due to the bulky nature of some of the products, local production enjoys a significant economic advantage. |
| Over the past several years, a trend has been evident whereby competition is escalating in the sector of operations of Hogla Kimberly, primarily in the paper sector, due to the operations of the competitors in increasing the market share of private labels at the retail marketing chains. |
| Hogla Kimberly faces competition against international brands as part of the overall global strategy of Kimberly-Clark when dealing with such competitors. The company adopts a similar strategy when dealing with local competition, i.e. by maintaining innovation, developing know-how and preserving leadership. |
| The fierce competition that exists between clients (primarily retail marketing chains), that is accompanied by price wars, also reflects on Hogla-Kimberly as a supplier of such products and the pressure that is being brought to bear on the company to lower prices. |
126
In the sector of feminine hygiene products and disposable diapers, Hogla-Kimberly's main competitor is Procter and Gamble (P&G). (hereinafter: "P&G"). In the sector of household paper products, Hogla-Kimberly's main competitors include Sano - Bruno's Plants Ltd. (hereinafter: "Sano"), Shaniv Paper Industries Ltd. (hereinafter: "Shaniv") and Kalir Chemicals - Production and Marketing Ltd. (hereinafter: "Kalir") and the private label brands of the marketing chains. It should be noted that as part of the competition in the household paper products market to the Ultra-Orthodox sector, one of the company's competitors shuts down its production on Saturdays (the "Sabbath"). This fact may constitute a certain advantage for this competitor in that particular market. In the sector of paper products to the institutional market, Hogla-Kimberly's main competitors include Kalir and Sano. In the home cleaning aids sector there are many competitors, and a large market share is held by private labels. |
| According to data from Nielsen Israel for the Near Food sector, the following are Hogla-Kimberly's market share numbers by value in 2010, in the specific segments wherein Hogla Kimberly operates (data are an annual average): In disposable baby diapers - 73%, in toilet paper - 66%, in wet wipes - 69%, in disposable kitchen paper towels - 53% and feminine hygiene products - 26%. |
| 24.1.12.1. | Competition at KCTR: |
| The Turkish market is characterized by fierce competition against local brands and primarily against Procter & Gamble (P&G) - both in diapers and in feminine hygiene products. In 2010, the competition in the Turkish diaper market wherein KCTR operates, actually escalated, as the selling prices of the leading competitors continued to erode, coupled with the penetration efforts of additional competitors into the market. |
KCTR estimates that as of the report date, in the diaper market, KCTR's market share in Turkey is 8%, while to the best of KCTR's knowledge, the main competitor, Procter and Gamble (P&G), enjoys a 40% market share, while an additional company (Hayat Kimya A.Ş) commands a 21% market share. |
KCTR estimates that in the feminine hygiene market, as at the date of the statements, the KCTR market share in Turkey is equal to 10%. |
| 24.1.13. | Seasonality |
| Hogla-Kimberly products are generally sold on a regular scale all year round, while during the Jewish holiday season (Rosh Hashanah, Passover), there is a marginal increase in the scope of sales beyond the ordinary monthly average. |
127
| 24.1.14. | Manufacturing Capacity, Fixed Assets, Real Estate and Facilities |
| The production of household (tissue) paper and diapers is made by Hogla-Kimberly in three production sites: |
| (a) | Manufacture of household (tissue) paper - Hogla-Kimberly has two plants for the production of household paper (tissue), in Hadera and in Nahariya, with a total output capacity of 58 thousand tons per annum, operating at full capacity, as well as two paper product rolling systems with a capacity of 44 thousand tons per year. Hogla-Kimberly regularly invests in expanding the output capacity for the purpose of supplying the demand for the said products. |
| (b) | Diaper manufacturing - Hogla-Kimberly has a diaper manufacturing plant in Afula, with an output capacity of 500 million infant diapers per annum, plus 42 million adult incontinence diapers per annum - that also operates at full capacity. Hogla Kimberly regularly invests in upgrading the diaper production lines, and continues to improve its products as much as possible, according to customers tastes and preferences. In case of production failure, the company acts according to the return and replacement policy, as detailed in section 24.1.20.5 below. |
| 24.1.14.2. | Manufacturing Capacity, Fixed Assets, Real Estate and Facilities of KCTR: |
| KCTR possesses an advanced manufacturing plant in Turkey that produces most of its products. The manufacturing site is located in Istanbul, on a plot of land of 13,000 m², owned by KCTR. The KCTR manufacturing facility possesses an output capacity of 1,200 million baby diapers per annum and operates at full capacity. In total, the production site in Turkey consists of six lines for the manufacture of diapers. |
| An investment of approximately $7.7 million was approved in 2010 for the addition of a feminine hygiene production machines, that is scheduled to begin operations in the third quarter of 2011. With the addition of this line, the production site in Turkey will have six lines for the manufacture of diapers and one line for the manufacture of feminine hygiene products. |
| 24.1.15. | Fixed assets, real estate and facilities |
| 24.1.15.1. | The real estate of the paper production site in Hadera are leased to Hogla-Kimberly by the Company, pursuant to a contract in effect until July 2011, which is extended from time to time with the consent of both parties. |
| 24.1.15.2. | The real estate of the Hogla-Kimberly paper manufacturing site at Nahariya is leased to Hogla-Kimberly by the company, through 2016. The lease agreement includes two extension options for a total of nine additional years. |
| 24.1.15.3. | The real estate of the Hogla-Kimberly diaper plant in Afula is under lease from Israel land Administration (ILA) by Hogla-Kimberly until 2023. |
128
| 24.1.15.4. | Hogla-Kimberly Distribution Sites at Zrifin and Haifa: Hogla-Kimberly's distribution center and office space in Zrifin are leased through 2022. The Haifa distribution site is under lease until 2014. The leasing contracts of these sites allow Hogla-Kimberly to shorten the leasing period at various points. |
| 24.1.15.5. | Moreover, Hogla Kimberly rents a warehouse in Hadera, under lease until 2022. |
| 24.1.16. | Research and development |
| Hogla-Kimberly (Israel and Turkey) does not invest in research and development. |
| Hogla-Kimberly relies on the Kimberly Clark development centers and enjoys participation in the outcome of the R&D efforts, marketing and sales know-how and new products, through collaboration agreements and the license agreement with Kimberly Clark, as detailed in Section 24.1.1, above. Hogla-Kimberly itself makes adjustments to adapt the products to the Israeli market, for meeting Israeli standards and other adaptations to the local manufacturing environment. |
| 24.1.17. | Intangible Assets |
Hogla Kimberly possesses registered trademarks that serve it and its operations and crucial to its activity as they are leading brands in the market. These trademarks are extended according to law from time to time. Among these: Titulim, Lily, Molett, Shmurat Teva, Nikol, Shikma and others. Hogla-Kimberly also has rights to use Kimberly Clark Worldwide’s brand-name products in the local market and in Turkey, including: HUGGIES®, KLEENEX®, KOTEX®, DEPEND® and others. In consideration of the right to use the said products and for the transfer of know-how, Hogla-Kimberly pays royalties to Kimberly Clark, amounting to a low, single-digit rate. |
| 24.1.18. | Human Resources |
| Hogla-Kimberly’s primary and most important resource is its human capital. The development of human capital is a top priority for Hogla-Kimberly, and it invests in training and seminars for its employees, including designated training for specific positions. An internal reorganization process took place in 2010, in order to streamline the work methods opposite consumers and customers and to lend support to the company's long-term strategy. |
| Hogla-Kimberly also places an emphasis on the matter of safety at work in general, and of the employees in particular, by implementation of a proactive safety policy (for prevention of the causes of accidents by investigating cases of near-accidents, in order to prevent the accidents themselves from happening, to the extent possible). |
| As at the date of the report, Hogla-Kimberly numbers a total of 1,111 employees in Israel. |
129
| The employees are employed under two types of agreements as follows: |
| As at the date of the report, 542 employees are employed under a collective labor agreement, while 569 employees are employed under a personal employment contract. |
| Those employed under the collective agreement gain the status of permanent (tenured) employees at the end of a trial period ranging between 24 and 36 months. |
Senior executives of Hogla-Kimberly, including the CEO and the CEO of the Turkish company, were granted options and/or restricted shares, pursuant to the senior employee compensation plan of Kimberly Clark. During the first quarter of 2008, approval was given for granting stock options exercisable into Hadera Paper ordinary shares, to a number of Hogla-Kimberly senior executives under Hadera Paper’s senior employee compensation program. For details see Section 13.4.5, above. |
| The accounting expenditure that was recorded in the years 2010 and 2009 on account of the granting of employee options is immaterial to Hogla Kimberly. |
| 24.1.18.1. | KCTR Human Resources: |
| The development of human capital is a top priority for The Company, and it invests in training and seminars for its employees, including designated training for specific positions. |
| As at December 31, 2010, KCTR numbers 370 employees in Turkey, most of which work at the production site under a collective labor agreement. |
| For details regarding Kimberly-Clark management remuneration program, see Section 24.1.18, above. |
| 24.1.19. | Raw Materials and Suppliers |
| Hogla-Kimberly’s main raw materials are: |
| 24.1.19.1. | For the tissue paper industry – Clean pulp and/or recycled fibers. The pulp is imported from overseas, from four principal suppliers: Fibria Trading international KFT, Ekman & COAB, Heinzel Pulpsales GMBH, and Sodra Cell (UK) Ltd. The purchase of pulp from Fibria is made under a framework agreement that this supplier possesses with Kimberly Clark, while the purchase of pulp from the other suppliers is made on the basis of an independent agreement between Hogla-Kimberly and the supplier, where in all of the said agreements, orders are made according to demand, at prices agreed upon between the parties. Regarding recycled fibers, the principal supplier is Amnir, a subsidiary of Hadera paper, along with imports from various suppliers that are irregular. |
| 24.1.19.2. | The diaper industry - Pulp for the diaper industry is imported from two suppliers overseas: WEYERHAEUSER NR COMPANY and DOMTAR Paper company LLC. Super Absorbent Polymer (SAP) is purchased from several international suppliers, chief among which is Toyota Tsusho Corporation, by way of framework agreements of Kimberly-Clark. In all of the said agreements, orders are made according to demand, at prices agreed-upon between the parties. |
130
| Other raw materials are imported in part and partially purchased from local suppliers. |
| Hogla-Kimberly has no dependence on any suppliers since with regard to the main raw materials there are alternative sources, with inconsequential added cost. |
| Hogla-Kimberly is assisted by Kimberly Clark’s central purchasing in the purchase process, mainly in the purchase of commodities. |
| 24.1.19.3. | Finished Goods Alongside the independent manufacturing of products, Hogla-Kimberly also purchases finished products for marketing and distribution under its various brands. As at the date of the report, the proportion of Hogla-Kimberly sales attributed to products it manufactures is equal to 74%, while the proportion of sales attributed to finished products that it purchases is equal to 26%. |
Most of the purchase of finished products for marketing and distribution is made from Kimberly Clark group companies and includes certain types of disposable diapers, special paper products and feminine hygiene products. In parallel, Hogla-Kimberly purchases finished products from various suppliers according to its own specifications, including wet wipes, various hygiene products and various kitchen aids that are sold under the Nikol brand, including garbage bags, aluminum foil, nylon cling-wrap and more. |
| 24.1.19.4. | Raw material and suppliers of KCTR: |
| The main KCTR raw material is pulp that is imported from several overseas suppliers, chief among which is Kimberly Clark. |
| KCTR has no special engagement or long term contracts with any of its raw material suppliers, but operates under on-call orders at market prices. The transfer prices vis-à-vis Kimberly Clark are determined in line with the transfer price policy of Kimberly Clark. |
| There also exists no dependence upon any suppliers. |
| KCTR possesses exposure associated with the volatility of the exchange rates of the euro and the US dollar vis-à-vis the Turkish lira, through the purchase of raw materials and the import of products. |
| In 2010, KCTR purchased absorbent material for diapers from Sandia - Sakai (Toyota) in conjunction with global framework agreements with Kimberly-Clark, for a total of $17.5 million, or 13% of total purchasing from suppliers in 2010. The total purchasing of absorbent material for diapers from Sandia - Sakai in 2009, in conjunction with global framework agreements with Kimberly-Clark, amounted to $19.5 million, or 14% of total purchasing from suppliers in the same year. There are alternative suppliers in the market, and KCTR is not dependent on this supplier. |
131
| 24.1.20. | Working Capital |
| 24.1.20.1. | Accounts receivable (customers) |
| Hogla-Kimberly sells its products under acceptable credit terms. In the consumer market, credit of 64 days is usually granted. In the institutional market, credit of 90 days is usually granted. |
| Customer credit is granted after examining the credit history of the client, the collateral and the business information that exists at Hogla-Kimberly regarding the client. If necessary, private customers are required to provide personal guarantees and/or bank guarantees to secure their debt - all or in part - according to an assessment of the credit risk. Starting in November 2007, Hogla-Kimberly joined a credit insurance facility which covers several of its major customers, with maximum compensation covered by the policy being $10 million, as at the date of this report. |
| 24.1.20.2. | Suppliers |
| Hogla-Kimberly makes purchases from most of its suppliers under open credit conditions. As of December 31, 2010, average days payable outstanding was 123 days. |
| 24.1.20.3. | Below are data regarding average credit duration and amounts for suppliers and customers (Israel and Turkey) for the years 2010 and 2009: |
| Average 2010 | Average 2009 | |||||||||||||||
| Average volume of credit in NIS millions | Average credit days | Average volume of credit in NIS millions | Average credit days | |||||||||||||
| Accounts receivable - trade | 307 | 65 | 307 | 64 | ||||||||||||
| Accounts Payable (Suppliers) | 333 | 103 | 293 | 91 | ||||||||||||
| 24.1.20.4. | Inventories |
| Hogla-Kimberly maintains an inventory of raw materials, goods in process (paper rolls before processing into a final product), finished goods inventories and spare parts inventories. There exists a well-defined inventory policy for each category, revolving around four weeks. The inventory setting policy takes into consideration the product's supply time, shipment time, possible problems in imports and ports, risk level of product shortages and the various demand levels. |
132
| Hogla-Kimberly maintains average inventories of 71.6 days in 2010. The Hogla-Kimberly inventories are mostly stored at the Hogla-Kimberly warehouses, plants and distribution centers and partially in leased external warehouses. |
| The percentage of Primary Working Capital, i.e.: (account receivables, inventories and supplier credit), as a percentage of sales, was equal to an average of 9% in 2010. |
| 24.1.20.5. | Return and Replacement Policy - The products in the sector are sold as the final sales to company customers and are returned on the basis of a defective product or in case of mismatch. When a customer complains of a faulty or mismatching product, the complaint is reviewed and if correct, the goods are returned and the customer is credited. The volume of returns is insignificant in relation to the total volume of operations of Hogla Kimberly. |
| 24.1.20.6. | Product warranty - Hogla Kimberly offers a warranty for the products it markets and sells, under a manufacturers warranty (to the extent applicable) of the same product and is subject to the provisions of the Liability for Defective Products Law. For more details regarding the Liability for Defective Products Law, see section 24.1.24.2, below. |
| 24.1.21. | Financing |
| Most of the Hogla-Kimberly operations are financed through the available cash flows. From time to time, Hogla-Kimberly makes use of on-call bank credit. As of December 31, 2010, the average interest on long-term loans was 3.5%, while the effective interest rate was slightly higher than the average interest rate. |
| In early January 2008, Hogla-Kimberly reached an agreement with one of the banks for the receipt of loans totaling NIS 100 million, for four years, at an interest rate linked to the prime rate on the NIS. For the purpose of securing this loan, Hogla-Kimberly undertook to meet the following financial covenants: |
(a) | Its shareholders' equity shall not fall below NIS 250 million or 25% of the consolidated balance sheet total. |
| (b) | The shareholders, Kimberly Clark and/or Hadera Paper, shall not together hold less than 51% of the issued share capital of Hogla-Kimberly and any means of control therein. |
| Hogla-Kimberly committed to other banks with which it does business to comply with the aforementioned financial covenants. |
| Hogla Kimberly is in compliance with the financial covenants. |
133
| True to the date of publication of the report, the outstanding balance of the loan was NIS 33.7 million. |
| 24.1.21.2. | KCTR Financing: |
| The Turkish operations require an injection of cash from time to time, from internal Hogla Kimberly resources as well as from external resources, in order to make investments in fixed assets and finance working capital. Since the end of 2009 true to the date of publication of the support, the operations in Turkey have been financed with no need for injections of equity from the shareholders. |
| 24.1.22. | Taxation |
| For details see Note 22 to the financial statements of Hogla as at December 31, 2010, attached to this report. |
| For details regarding the tax investigation in Turkey, see Note 14 to the financial statements of Hogla as at December 31, 2010, attached to this report. |
| 24.1.23. | Environmental Protection |
| The Hogla-Kimberly operations are subject to various directives concerning the environment. Hogla-Kimberly is implementing strict mechanisms and a high-technology quality control system in order to preserve the environment. |
| 24.1.23.1. | For environmental considerations at the Hogla-Kimberly manufacturing site in Hadera, see Section 17, above. |
| 24.1.23.2. | The environmental issues pertaining to Hogla Kimberly at the Nahariya and Afula manufacturing sites will be detailed below: |
| 24.1.23.3. | Environmental Risks and Management thereof - |
(a) | The environmental risks which are likely to have substantial impact on the company are: At the Hogla-Kimberly manufacturing site in Nahariya, a partial purification process takes place of the water that serve for the paper manufacturing process, with the remaining purification taking place at the regional sewage treatment plant, in line with an agreement approved by the environmental protection authorities. |
| 24.1.23.4. | Substantial Ramifications of the Law on the Corporation |
| The provisions of law in effect on the date of this report having substantial ramifications on the Company, including on its capital investments, profits and competitive status: |
| (a) | The Company’s business license for operations in Nahariya is conditional upon terms prescribed by the Ministry for the Protection of the Environment, designed to protect the environment and prevent nuisances. These conditions are customary for plants of this type. The business license does not require renewal from one period to another. |
134
| (b) | Hogla-Kimberly stores hazardous materials under the conditions of the poison permit granted by the Ministry for the Protection of the Environment. The poison permit is granted under conditions dealing mainly in the manner of storage and use of these materials for the prevention of any incidents. The conditions in the poison permit are customary for plants of this type. The Company’s poison permit is renewed every three years. |
| 24.1.23.5. | The Corporation’s Policy on Management of Environmental Risks, Manner of Exercise and Manner of Supervision |
| On the matter of this operational sector’s policies of managing environmental risks, see section 17 above. |
| 24.1.23.6. | In Turkey, Hogla Kimberly acts through its subsidiary company KCTR under Kimberly Clark Worldwide’s strict environmental protection standards. |
| 24.1.24. | Restrictions and corporate control |
| The following is a brief summary of the principal legislation and standards that are relevant to the Hogla-Kimberly operations: |
| 24.1.24.1. | Antitrust - In 2006, Hogla Kimberly joined the agreed-upon order between the antitrust authority and the food suppliers, that regulates, among other things, various aspects of the commercial agreements between dominant suppliers and the marketing chains, including prohibitions and restrictions on practices limiting the number of suppliers, their identity, quantity of products, types and location, involvement in management of the category, allotment of shelf space at a rate exceeding half the total shelf space, steward arrangements, exclusivity in campaigns and the granting of benefits relying on achievement of sales goals. Hogla-Kimberly estimates that the implementation of the order will not materially impact its business. |
| Hogla-Kimberly has adopted an internal enforcement plan in terms of anti-trust. In line with the enforcement plan, current and initiated inspections are conducted of the engagements of the company and its operations and a consistent mechanism is in place to provide preliminary and ongoing training to the relevant employees. Hogla-Kimberly believes that the implementation of the enforcement plan will serve to increase awareness among employees and managers to the issue of anti-trust legislation, while lowering the probability of breaching the law unknowingly and reducing the damage that may be incurred despite the implementation of the enforcement plan. |
135
24.1.24.2. | Consumer regulations – Hogla-Kimberly is subject to various consumer regulations, including those of the Consumer Protection Law -1981 (hereinafter: "Consumer Protection Law”). The Consumer Protection Law and regulations enacted there under apply to all sales or service transactions provided by businesses to private consumers. The law deals in private transactions only, and encompasses all sectors of the market (save the banking and insurance sectors, which are subject to specific regulation). In protecting the consumer, the law prescribes a number of provisions applicable to dealers (property vendors or services providers, including manufacturers) regarding the proscription of misleading consumers in material issues of a transaction, the duty of disclosure of issues named in the law, disclosure of the policy for return of goods, prohibition of misleading packaging, the duty of marking goods and their packaging and the duty of providing post-sales services. Breach of the provisions of the law will result in penal sanctions of imprisonment and/or fines (depending on the severity and duration of the act), and constitutes a civil wrong under the Torts Ordinance [New Version]. Apart from the criminal provisions applicable to dealers who breach of the provisions of the Consumer Protection Law, the law provides criminal sanctions for employers and officers in a corporation which does not prevent the breach of provisions of the law. The Consumer Protection Authority, headed by the Supervisor of Consumer Protection (hereinafter in this section: "the “Supervisor”), is responsible for implementation of the provision of the law and application of the principle of fair trade. In order to allow performance of the provisions of the law, the Supervisor was granted a large numbers of powers, including the power to deal with consumer complaints, powers of search and investigation and the power to make certain dealers are aware of their duty to cease actions that are contrary to the provisions of the law. |
In addition, Hogla-Kimberly is subject to the provisions of the Liability for Defective Products Law, -1980 (hereinafter: "the “Liability for Defective Products Law”). The Liability for Defective Products Law prescribed a mechanism for monetary compensation for injury a consumer has suffered from a defective product. The law prescribes cognitive provisions regarding manufacturer’s liability for compensating anyone who sustained personal injury from a defect in any product manufactured by such. Together with consumer’s rights, the law also provides defenses the manufacturer or importer may raise in order to defend themselves against such claims under to lawful causes (the consumer’s willful exposure to risks, defect created after having left the consumer’s control, defective product left consumer’s control against their will, and the like). |
| 24.1.24.3. | Licensing of products and standards – Some of Hogla-Kimberly’s products require licensing under Ministry of Health regulation. To the best of the company’s knowledge, Hogla-Kimberly has licenses from the Ministry of Health for all relevant products as required by law, as well as the Standards Institute’s standard stamp for its products. The cosmetics industry also has a licensing duty under the Order for Control of Goods and Services (Cosmetics),– 1973, which it renews from time to time. Hogla-Kimberly also has a valid business license. |
136
| 24.1.24.4. | Marking of goods – Hogla-Kimberly received a permit to mark some of its products with a standard stamp of the Israel Standards Institute under the Standards Law, -1953, and the regulations enacted there under. Hogla-Kimberly is also subject to the regulations of marking of goods included in its sector of operations, including with regard to attaching instructions for use to its cleaning and household products (under the Consumer Protection Order (Marking of Goods),– 1983), and additional instructions under the Hazardous Materials Law,– 1993 – and the regulations enacted there under. |
| 24.1.24.5. | Packaging Law - The Packaging Law was passed by the Israeli Knesset on January 19, 2011. Among other things, it is based on the principle of manufacturer responsibility, under which the manufacturer or importer is responsible for recycling the packaging for products manufactured or imported by it for sale in Israel, and to bear the cost involved in the collection and recycling of packaging waste. In order to perform said manufacturers’ and importers’ duties, manufacturers and importers must engage under contracts with a recognized body, which is a company whose sole objective is the performance of the duties of the manufacturers and importers it engages with, a body which has been recognized under the Packaging Law. Hogla Kimberly, as a manufacturing and marketing company, will be required - like other manufacturing firms - to prepare itself for complying with the law. For additional details regarding the Packaging Law, see section 8.23.1.1 8.23.2, above. |
| 24.1.24.6. | Quality Control- In its manufacturing sites, Hogla Kimberly operates in accordance with the following standards: ISO 9901/2000 – Quality Management; ISO 14001 – Environmental Protection and Israeli Standard 18001 - Safety. |
| 24.1.24.7. | SOX - By virtue of being a subsidiary of Kimberly Clark, a company whose shares are publicly traded in the United States, Hogla-Kimberly is subject to "Sarbanes Oxley" (SOX) in its entirety, including Section 302 (proper disclosure and evaluation of controls in the organization), Section 404 (Management Assessment of Internal Controls) and Section 906 (Criminal responsibility for breach of this section). The main points of the law have to do with increasing reporting and disclosure, the authorities and duties of the Audit Committee, manager responsibilities, enforcement, sanctions and penalties and increasing the independence from external accountants. The controls instigated by Hogla-Kimberly for the implementation of the law are regularly inspected by the Kimberly Clark auditing team and by the external accountant. Since 2004, with the introduction of the directives of the said law in the United States, Hogla is meeting the demands of the law. |
137
| 24.1.25. | Legal Proceedings |
| For a description of material legal proceedings, including demands of the authorities against Hogla Kimberly, and regarding the filing of a class action lawsuit against Hogla Kimberly and against an additional competing company, that is estimated by the plaintiff, if accepted as a class action lawsuit, at approximately NIS 111 million, as well as a description of the demands on the part of the Turkish tax authorities against KCTR, see Note 14 to the financial statements of Hogla-Kimberly as at December 31, 2010, attached to this report. |
| 24.1.26. | Business Objectives and Strategy |
| Hogla-Kimberly’s business and marketing strategy in the local market is to develop and expand consumption in the relevant categories wherein Hogla-Kimberly is active, while at the same time, to increase the market share of Hogla-Kimberly by strengthening and promoting its leading brands, through advertising activity, marketing promotion, product improvement, as well as the constant examination of penetration into new categories. |
| In addition, as part of the Hogla-Kimberly strategy as part of its objectives for the Turkish market, Hogla Kimberly has formulated a strategic plan in 2006 in respect of KCTR (Global Business Plan) for the coming decade (until 2015), that is meant to expand the operations of KCTR and to improve its profitability by building it to be a significant player in the Turkish market. The transition to profitability, that was planned to take place in 2010, has been postponed as a result of market competition. For further details see section 24.1.26.1, below. |
| In parallel, as part of its objectives, Hogla-Kimberly is acting to reduce the manufacturing and operating costs, by capitalizing on its market advantage as the leading producer, through the strategic relations with the Kimberly Clark development departments, exploiting the diverse know-how that resides with Kimberly Clark and that is at its disposal, exploiting the large sales network that is available to it and through intelligent purchasing that is well integrated into Kimberly Clark's global purchasing network. |
| Moreover, as part of its objectives, Hogla Kimberly has launched a social responsibility project, whose implementation has started. |
| The strategic goals of Hogla-Kimberly, as described above, are based on the objectives and aspirations of Hogla-Kimberly, as at the date of the report and may change according to the relevant decisions being made by Hogla-Kimberly. |
| The above information with regard to the objectives and business strategy of Hogla Kimberly, lowering of manufacturing and operational costs, and the expansion of market share, constitute forward-looking information as defined in the Securities Act, and merely consists of forecasts and estimates by Hogla-Kimberly which are not certain to materialize and are based on information available at the company and at Hogla-Kimberly as of the report date. These estimates may not materialize - in whole or in part - or may materialize in a different manner than anticipated, inter alia on account of factors that lie outside the control of the company or of Hogla Kimberly, such as changes in market conditions, entry of competitors, technological developments, changes in the anticipated costs as well as changes and developments in regulation in the sectors of operation and/or the realization of any of the risk factors outlined in sections 24.1.28 below and 23, above. |
138
| 24.1.26.1. | Business objectives and strategy of KCTR: |
| In the course of 2006, Hogla-Kimberly formulated a strategic plan pertaining to KCTR (Global Business Plan) - until 2015 - intended to expand the KCTR operations and improve its profitability, by building it to be a significant player in the Turkish market for disposable diapers and feminine hygiene products, on the basis of the international brands of Kimberly Clark, based on local manufacture. The plan allows for gradual implementation according to actual results of operation, over several years and in various areas. The plan was approved by both Kimberly Clark and the Company. In 2010, KCTR continued to implement the strategic plan. In the event that the plan is fully implemented and successful, KCTR is expected - by 2015 - to become a dominant and profitable company, with annual sales of approximately $230 million. The KCTR turnover amounted to $134 million in 2010. |
| As part of the said strategic plan, additional investments in fixed assets for the production facility in Turkey are being considered from time to time. |
| The objectives of KCTR consists of increasing sales to the local market, by strengthening and promoting its brand, through advertising and sales promotion, as well as through product improvement. |
| The above information with regard to the results of implementation of the strategic plan of KCTR, expansion of sales to the local market, strengthening and promoting the brands, constitute forward looking information as defined in the Securities Law, and constitutes forecasts and assessments on the part of the Company, the realization of which is not certain and based on information existing in the company as of the date of the report. These estimates and forecasts of the company may not materialize - in whole or in part - or may materialize in a different manner than anticipated, inter alia on account of factors that lie outside the control of the company or of KCTR, such as changes in market conditions, entry of competitors, changes in the anticipated costs, technological changes as well as changes and developments in regulation in the sectors of operation and/or the realization of any of the risk factors outlined in sections 24.1.28 below and 23, above. |
139
| 24.1.27. | Anticipated development over the next year |
| Anticipated development over the next year: |
| 24.1.27.1. | The operating losses of KCTR over the past several years, in view of the implementation of the strategic program, which derive inter alia, from launch expenses, elevated sales promotion and advertising costs in relation to the volume of sales, along with low gross margins due to the fierce competition in the Turkish market, have been reduced, and the operating loss in 2010 decreased as a result of the improvement in the gross profit, cost-cutting and increased sales. KCTR is working to arrive at operational equilibrium in 2012, a date that has been postponed in light of market developments. |
| 24.1.27.2. | The above information with regard to the results of implementation of the strategic plan of KCTR, and the arrival at operational equilibrium constitute forward looking information as defined in the Securities Law, and constitutes forecasts and assessments on the part of the Company, the realization of which is not certain and based on information existing in the company as of the date of the report. These estimates and forecasts of the company may not materialize - in whole or in part - or may materialize in a different manner than anticipated, inter alia on account of factors that lie outside the control of the company or of KCTR, such as changes in market conditions, entry of competitors, changes in the anticipated costs, technological changes as well as changes and developments in regulation in the sectors of operation and/or the realization of any of the risk factors outlined in sections 24.1.28 below and 23, above. |
| 24.1.28. | Risk Factors |
| 24.1.28.1. | Macro-economic factors |
(a) | Economic Slowdown in the Israeli Economy - Since most of the Hogla-Kimberly products are basic consumer goods, a decline in the standard of living in Israel, in private consumption and in the level of available income, could adversely affect the financial results of Hogla-Kimberly. |
(b) | Inflation - Hogla-Kimberly is exposed to a certain degree to risk of changes in the Consumer Price Index, primarily due to input prices. A high inflation rate may also impact payroll expenses, which over time are adjusted for changes in the CPI. |
(c) | Exposure to Exchange Rate Fluctuations - Hogla-Kimberly is exposed to risks on account of changes in exchange rates, whether due to the import of raw materials and finished goods, or - to a far more limited degree - due to exports to foreign markets. Changes in exchange rates of various currencies vis-à-vis the NIS may erode profit margins and cash flows. |
140
| Hogla-Kimberly implements a hedging policy against exchange rate exposure by purchasing rolling protection (forward transactions) for six months ahead, that cover - at any given moment - an average of three months of transactions, until the maximum level of protection approved by the board of directors, which is 80% of the anticipated monthly exposure. |
| 24.1.28.2. | Sector-related factors |
(a) | Competition- Intensification of competition, unexpected entry of new competitors, the strengthening and expansion of private label, could cause harm to Hogla-Kimberly’s market share in its areas of operation and real erosion in the sale prices of its products, resulting in damage to Hogla-Kimberly’s financial results and business operations. |
(b) | Damage to reputation - Hogla-Kimberly has a wide variety of well-reputed brand names, and damage to these could detrimentally impact Hogla-Kimberly’s financial results. Hogla-Kimberly acts to safeguard the reputation of its brands, while enforcing a strict and uncompromising quality control system and using modern production technologies. |
(c) | Centralization of Hogla-Kimberly operations - Hogla-Kimberly’s production operations are centralized at three sites (Hadera, Nahariya and Afula), and its distribution operations are at two additional sites (Zrifin and Haifa). Lengthy damages to one or more of the production and/or distribution sites could substantially impact Hogla-Kimberly’s financial results. |
(d) | Environmental Protection - The requirements of the Ministry for Protection of the Environment with regard to the sector and its installations require that Hogla-Kimberly budget financial resources for this issue. These demands could expand and increase because of the growing awareness of protection of the environment, which could force Hogla-Kimberly to budget additional resources. |
| (e) | Prices of raw materials – a substantial rise in the price of Hogla-Kimberly’s raw materials could damage its operations and profits. Hogla-Kimberly’s exposure derives from fluctuations in the price of raw materials, mainly pulp, fluff and absorbent materials (SAP), representing the main raw materials used for the production of tissue paper and diapers, and for the imported products. Unusual rises in the cost of raw materials and imported finished products could impair profitability. |
141
(f) | Dependence on energy prices – Hogla-Kimberly’s operations are dependent on energy consumption. A rise in energy prices or substantial delays in supply could damage Hogla-Kimberly’s operations and profits. Hogla-Kimberly is exposed in a secondary manner to fluctuations in energy prices, both in the process of paper production, and as the fuel for its fleet of distribution trucks. |
(g) | Regulation - Hogla-Kimberly is subject to legal restrictions in its commercial operations, which could impact the outcome of its operations, such as – government policies on various issues and various government resolutions, such as a rise in the minimum wage. Such changes in regulations could impact Hogla-Kimberly’s activities in its sector of operations. |
(h) | Customers - There are three large retail marketing chains in Israel. Hogla-Kimberly's sales to the three retail chains represent 40% of total sales. The discontinuation of sales to each of the three chain could hurt the sales of Hogla-Kimberly in the short term, but given the customers' loyalty to the strong brands, no long-term negative impact is expected, and therefore Hogla-Kimberly is not dependent on these chains. |
| 24.1.28.3. | Special Factors |
Factors related to Hogla-Kimberly's operations in Turkey - Hogla-Kimberly is exposed to risk factors associated with its operations in Turkey, including economic instability and high inflation rates which have been typical of Turkey's economy in the past - for further details see section 24.1.1.5, above. KCTR is also exposed to relevant risk factors in the Turkish market, in terms of exposure to changes in exchange rates, see Section 24.1.28.1(c) above, as well as the sector-specific risks in Turkey related to competition, damage to reputation and raw material prices, as stated in sections 24.1.28.2 (a)(b), respectively, above. |
| 24.1.28.4. | The extent of impact of risk factors |
| The following are the Hogla-Kimberly estimates regarding the types and impacts of said risk factors on Hogla-Kimberly: |
| Risk Factors | Degree of Impact | ||
| Considerable Influence | Medium Influence | Small Influence | |
| Macro-economic factors | -Economic slowdown | -Exchange Rates | -Inflation |
| Sector-related factors | -Damage to reputation | -Competition -Raw material prices -Customers | -Energy prices -Regulation |
| Special Factors | -Centralized operations -Environmental Protection -Operations in Turkey | ||
142
Part B
MANAGEMENT DISCUSSION
143
Part C
Financial Statements
144
Part D
Additional Details Regarding the Corporation
145
Table of Contents
| Topic | Content | Page |
| Regulation 8 B | Valuation | 1 |
| Regulation 10 A | Summary of quarterly income statements | 1 |
| Regulation 10 C | Utilization of Proceeds from Securities with Regard to Intended objectives of the Proceeds as Specified in the Prospectus | 1 |
| Regulation 11 | List of Investments in subsidiaries and in related companies as of the date of the balance sheet | 1 |
| Regulation 12 | Changes in investments in subsidiaries and in related companies during the reported year | 1 |
| Regulation 13 | Revenues of subsidiaries and related companies, and the corporation’s revenues from such as of the balance sheet date | 2 |
| Regulation 14 | List of groups of loan balances given as of the date of the balance sheet, if granting of loans was one of the corporation’s main dealings | 2 |
| Regulation 20 | Trade on the Stock Exchange – securities registered for trade/ suspended – dates and reasons | 2 |
| Regulation 21 | Compensation of interested parties and senior officers | 2 |
| Regulation 22 | Transactions with Controlling Shareholders | 2 |
| Regulation 24 | Convertible shares and securities held by interested parties in the corporation, in subsidiary companies or in a related company as close as possible to the date of the report | 2 |
| Regulation 24 A | Registered share capital, issued capital and convertible securities | 2 |
| Regulation 25 A | Residence and address | 3 |
| Regulation 26 | Directors of the Company | 3 |
| Regulation 26 A | Senior Officers of the Company | 3 |
| Topic | Content | Page |
| Regulation 26 B | Approved signatory of the company | 4 |
| Regulation 27 | The Company’s CPA | 4 |
| Regulation 28 | Changes in the memorandum or articles | 4 |
| Regulation 29 | Directors’ recommendations and resolutions | 4 |
| Regulation 29 A | Company Resolutions | 5 |
| Appendix A | Summary of quarterly statements | 7 |
| Appendix B-1 | List of investments in subsidiary companies and associated companies | 8 |
| Appendix B-2 | Loans to subsidiaries and associated companies of the company as at December 31, 2010 | 9 |
| Appendix C | List of changes in investments in subsidiary companies and associated companies | 10 |
| Appendix C 1 | List of company, subsidiary and associated company revenues | 13 |
| Appendix D | Remuneration of Senior Officers | 14 |
| Appendix E | Transactions with Controlling Shareholders | 16 |
| Appendix F | List of interested party holdings | 22 |
| Appendix G | List of Directors | 24 |
| Appendix H | List of senior officers in the Company | 25 |
| Company Name: | Hadera Paper Ltd. |
| Company No. with Registrar: | Private company 52-0018383-3 |
| Company number on stock exchange (issuer number): | 632 |
| The Company’s address: | POB 142, Hadera 38101 |
| Tel: | 04-6349405 |
Telefax: | 04-6339740 |
| Date of balance sheet: | December 31, 2010 |
| Date of Report: | March 7, 2011 |
| Reported Period: | January 1, 2010 - December 31, 2010 |
| E-mail: | Yaeln@hadera-paper.co.il |
Regulation 8 B - valuation
A very significant economic for Hadera Paper is added to the financial statements as at December 31, 2010. For details see Note 4(c)4 to the consolidated financial statements of the Company as at December 31, 2010.
In addition, an economic work dealing with purchase price allocation (P.P.A) of Hadera Paper Printing and Writing (formerly Mondi Hadera Paper), in order tp check and asses Hadera Paper Printing and Writing tangible and intangible asets and commitments and updating valuation and Put option which is held by Mondi Group.
Regulation 10 A – Summary of Quarterly Income Statements
Summary of quarterly of income statements is attached hereto as Appendix A of this report.
Regulation 10 C – Utilize of proceeds from securities, with regards to objectives of proceeds according to prospectus
Recycling of existing debt and current investments.
Regulation 11 - List of Company Investments in Subsidiaries and Related Companies, directly and indirectly, as at December 31, 2010
List of investments attached hereto as Appendix B-1 of this report.
Regulation 12 - Changes in company Investments in Subsidiaries and Related Companies, directly and indirectly, during the reported period
List of changes in investments attached hereto as Appendix C of this report.
- 1 -
Regulation 13 - Revenues of Subsidiaries and Related Companies and the Company’s Income Therefrom as at the reporting date
List of revenues attached hereto as Appendix C1 of this report.
Regulation 14 – List of groups of loan balances given as of the date of the balance sheet, if granting of loans was one of the corporation’s main dealings
None. The granting of loans was not one of the Corporation's main the things during the reported period and until the date of the report.
Regulation 20 - Stock exchange trading - securities registered for trade/ suspended
| 1. | Securities issued by the company and registered for trade on the stock exchange during the reported period: |
During the reported period, 24,009 shares were registered for trade following the exercise of 103,462 options, as part of the employee stock option plan. For details regarding the stock option plan, see Section 13.4.5 to the Periodical Report, dated December 31, 2010.
| 2. | Securities of the company whose trading was interrupted during the reported period |
During the reported period, trading in the securities of the company was interrupted on the following dates:
March 8, 2010 - publication of annual financial statements.
Regulation 21 - Compensation for Interested Parties and Senior Officers
Details attached hereto in Appendix D.
Regulation 22 - Transactions with a Controlling Shareholder
Details attached hereto in Appendix E.
Regulation 24 - Convertible shares and securities held by interested parties and by senior officers in the corporation, in subsidiaries or in related companies as at February 14, 2011
Details attached hereto in Appendix E.
Regulation 24A – Registered share capital, issued capital and convertible securities as at February 14, 2011
The number of ordinary shares included in the registered capital of the company: 20 million ordinary shares, each of NIS 0.01 par value.
- 2 -
The number of ordinary shares included in the issued capital of the company: 5,089,811 ordinary shares, each of NIS 0.01 par value.
Number of ordinary shares included in the issued capital of the company, net of dormant shares: 5,089,811
Number of dormant shares of the company: 0
Number of options of the company: 158,038 options, exercisable into up to 158,038 ordinary shares of the company.
On January 14, 2008, the Board of Directors of the Company, following the approval of the Company's Audit Committee, approved a compensation program for senior employees and officers of the Group, pursuant to which up to 285,750 stock options will be allocated each exercisable into an ordinary share of NIS 0.01 par value of the Company, which, as of the date of approval of the allocation, represented 5.65% of the issued share capital of the Company. 250,500 stock options were granted during the first quarter of 2008. On January 8, 2009, a total of 34,000 stock options were granted out of 35,250 that were allocated to the Trustee, as a reserve for future grants. On August 9, 2009, the remaining options held by the Trustee, totaling 1,250 options, were cancelled. In the course of 2010, a total of 103,462 option warrants were exercised into 24,009 shares. During 2009, a total of 1,064 stock options were exercised into 98 shares, while 17,686 stock options expired. 4,250 stock options expired in 2008. As of December 31, 2010, a total of 158,038 stock options have not yet been exercised.
Regulation 25A – Residence and Address
| The corporation’s registered address: | POB 142; Hadera Industrial Zone, 38101. |
| E-mail address: | YAELN@HADERA-PAPER.CO.IL |
| Telephone No.: | 04-6349349 or 04-6349405 |
| Fax. no.: | 04-6339740 |
Regulation 26 – Corporation’s board of directors
List of directors and their particulars attached hereto as Appendix F.
Regulation 26A – Senior Officers in the Corporation
List of senior officers and their particulars attached hereto as Appendix G.
- 3 -
Regulation 26B - Approved Signatories of the Corporation
There are no independent signatories at the company.
Regulation 27 – Corporation’s Accountant
Name of the Corporation accountant during the reported period: Brightman Almagor & Co.
Address: 5 Ma'ale Shachrur, Haifa.
To the best of the company's knowledge, the accountant or his partner are not an interested party or related to an interested party or senior officers at the company.
Regulation 28 – Changes in the memorandum or articles of association during the reported year
None.
Regulation 29 – Directors’ recommendations and resolutions
| A. | Recommendations of the Board of Directors to the general meeting |
| (1) | Payment of dividend or allocation or allotment of preferred shares - None. |
| (2) | Change in the registered capital or issued capital of Corporation - None. |
| (3) | Change in the memorandum or articles of association of the company - None. |
| (4) | Repayment of securities - None. |
| (5) | Early repayment of debentures - None. |
| (6) | Transaction not according to market conditions, between the company and an interested party therein - None. |
| B. | Director decisions regarding issues outlined in the regulation that do not require approval of the general meeting |
| (1) | Payment of dividend or allocation - as defined in the companies law, by other method or allotment of preferred shares - None. |
| (2) | Change in the registered capital or issued capital of Corporation - None. |
| (3) | Change in the memorandum or articles of association of the company - None. |
| (4) | Repayment of shares - none. |
| (5) | Early repayment of debentures - None. |
| (6) | Transaction not according to market conditions, between the company and an interested party therein - None. |
- 4 -
| C. | Decisions of the general meeting made without the recommendations of directors - |
None.
| D. | Decisions of special general meeting |
| · | On July 27, 2010, the General Meeting of Company shareholders approved, subsequent to approval by the Company's Audit Committee and Board of Directors, purchase of officer liability insurance amounting to $6 million. |
| · | On July 27, 2010, the general meeting of the Company, after receiving the approval of the Audit Committee and Board of Directors of the company, approved the engagement of the company in an agreement dated June 1, 2010, for the sale of its rights in a property covering 7,600 square meters in Tel Aviv (hereinafter: "The Plot"), that was leased from the Tel Aviv Municipality and served in the past as one of the Company’s paper manufacturing plants, in return for the overall sum of NIS 64 million, (hereinafter: "The Sale Agreement"). The purchasing parties are Gav Yam Property and Building Group Ltd., ("Gav Yam"), a company indirectly controlled by IDB Development Company Ltd., the controlling shareholder of the company and by Amot Investments Ltd. ("Amot"), with shares of 71% and 29%, respectively. For additional details, see Section 12.4 to the periodical report of the company, attached to this report. |
| · | On February 8, 2011, the company announced the convening of the special general meeting of the company on March 21, 2011, for the purpose of ratifying the appointment of Ms. Aliza Rotbard as an external director of the company. |
| · | The board of directors approved, on March 6, 2011, (subsequent to the approval of the Audit Committee), the company entering into an agreement for leasing roof top areas on the Company’s Hadera plant to Clal P.V. Projects Ltd. (hereinafter: "Clal PV"), a private company held and controlled indirectly by CII, at an overall area of up to 19,200 m2 (out of which the company was granted an option not to lease a portion of this area, in the scope of up to 14,300 m2), for construction of installations for the production of electricity using photovoltaic technology and transfer of this electricity to the electricity grid during the lease period, under a production license to be granted to Clal PV. The company will convene a general meeting to approve the said transaction, as required by law. For additional details, see Section 12.8 to the periodical report of the company, attached to this report. |
- 5 -
Regulation 29 A - Company resolutions regarding topics outlined in the regulation
| 1. | Extraordinary transactions requiring special approval according to Section 270(1) of the companies law- None. |
| 2. | Indemnification of officers- On May 10, 2004, the company’s board of directors resolved, regarding indemnification of each of the company's senior officers, for any liability or expense as set out below, imposed on such following an action taken (including actions before the date of the letter of indemnification) and/or any action to be taken in future by virtue of office in the company, directly or indirectly related to events set out in the schedule to the letter of indemnification, to any part of such or related to such, directly or indirectly, provided the sum of remuneration, under all writs of remuneration granted in this matter to such company officer, according to the resolution of the board of directors, does not exceed a cumulative sum equivalent to 25% of the company’s shareholders’ equity according to its last financial statements (consolidated), published before de facto awarding of the letter of indemnification. On June 21, 2006, the general meeting approved the amendment to section 1.1 of the letter of indemnification, in accordance with amendment No. 3 of the Companies Law and in accordance with the amendment to the company articles. |
| 3. | Senior Officers' liability insurance- On July 27, 2010, the General Meeting of Company shareholders approved, subsequent to approval by the Company's Audit Committee and Board of Directors, purchase of officer liability insurance amounting to $6 million. |
Hadera Paper Ltd.
Date of Signature: March 6, 2011
Names of signing parties:
Ofer Bloch, Company CEO.
Shaul Glicksberg - VP Finance and Business Development.
- 6 -
Appendix A
Regulation 10 A – Summary of Consolidated Quarterly Statements of Income (In NIS thousands)
| Q1 2010 | Q2 2010 | Q3 2010 | Q4 2010 | Annual | ||||||||||||||||
| Sales, net | 239,985 | 249,206 | 295,435 | 336,382 | 1,121,008 | |||||||||||||||
| Cost of Sales | 196,625 | 209,723 | 254,697 | 281,777 | 945,422 | |||||||||||||||
| Gross Profit | 43,360 | 39,483 | 40,738 | 54,605 | 175,586 | |||||||||||||||
| Selling, Marketing, General and Administrative and Other Expenses: | ||||||||||||||||||||
| Selling and Marketing | 20,719 | 19,935 | 22,878 | 23,669 | 87,201 | |||||||||||||||
| General and Administrative | 17,432 | 11,543 | 14,922 | 15,706 | 59,603 | |||||||||||||||
| Others | (2,214 | ) | 2,856 | (17,226 | ) | (15,929 | ) | (32,513 | ) | |||||||||||
| Total Expenses | 35,937 | 34,334 | 20,574 | 23,446 | 114,291 | |||||||||||||||
| Profit (loss) from ordinary operations | 7,423 | 5,149 | 20,164 | 28,559 | 61,295 | |||||||||||||||
| Financial revenues | 2,041 | 579 | 2,611 | 4,083 | 9,314 | |||||||||||||||
| Financial Expenses | 2,967 | 10,432 | 20,263 | 20,417 | 54,079 | |||||||||||||||
| Financial expenses, net | 926 | 9,853 | 17,652 | 16,334 | 44,765 | |||||||||||||||
| Profit (loss) after financing | 6,497 | (4,704 | ) | 2,512 | 12,225 | 16,530 | ||||||||||||||
| Share in earnings (losses) of associated companies, net of taxes | 19,461 | 20,595 | 18,490 | 22,586 | 81,132 | |||||||||||||||
| Profit before taxes on income | 25,958 | 15,891 | 21,002 | 34,811 | 97,662 | |||||||||||||||
| Taxes on income expenses (revenues) | 1,231 | (1,607 | ) | (2,085 | ) | (489 | ) | (2,950 | ) | |||||||||||
| Net income for the period | 24,727 | 17,498 | 23,087 | 35,300 | 100,612 | |||||||||||||||
| Net profit attributed to: | ||||||||||||||||||||
| Company Shareholders | 24,290 | 18,038 | 23,026 | 35,374 | 100,728 | |||||||||||||||
| Minority Interest | 437 | (540 | ) | 61 | (74 | ) | (116 | ) | ||||||||||||
| 24,727 | 17,498 | 23,087 | 35,300 | 100,612 | ||||||||||||||||
| Basic net earnings (loss) per share (in NIS) | 4.80 | 3.55 | 4.53 | 6.96 | 19.84 | |||||||||||||||
| Diluted net earnings (loss) per share (in NIS) | 4.75 | 3.52 | 4.50 | 6.90 | 19.68 | |||||||||||||||
| No. of shares that served for calculating basic earnings per share | 5,060,872 | 5,082,028 | 5,082,028 | 5,084,785 | 5,078,156 | |||||||||||||||
| No. of shares that served for calculating diluted earnings per share | 5,116,494 | 5,117,276 | 5,114,456 | 5,123,338 | 5,118,416 | |||||||||||||||
- 7 -
Appendix B-1
Regulation 11: List of Investments in subsidiaries and in related companies as at the balance sheet date |
| 1) | Companies held by the company |
| Holding percentage | ||||||||||||||||||||||||||||||||||
| (direct and indirect) | ||||||||||||||||||||||||||||||||||
| Company Name | No. of share On stock exchange | Type of Share and par value In NIS | No. shareholders* | Total Par Value NIS | Value in separate financial statements of the Corporation, according to Regulation 9C | In equity | In voting rights | In right to appoint Directors | Stock exchange price as at Balance Sheets In NIS per share | Notes | ||||||||||||||||||||||||
| Amnir Recycling Industries Ltd. | - | Ord. 1 | 5,367,000 | 5,367,000 | 154,146 | 100 | 100 | 100 | N.A. | - | ||||||||||||||||||||||||
| Graffiti Office Supplies & Paper Marketing Ltd. | - | Ord. 1 | 1,000 | 1,000 | (8,590 | ) | 100 | 100 | 100 | N.A. | - | |||||||||||||||||||||||
| Carmel Container Systems Ltd. | - | Ord. 1 | 1,739,937 | 1,739,937 | 160,004 | 100.0 | 100.0 | 100.0 | N.A. | - | ||||||||||||||||||||||||
| Frenkel-CD Ltd. | - | Ord. A 1 Ord. B 1 | 6,076,000 1,090 | 6,076,000 1,090 | 11,007 | 57.84 | 57.82 | 57.82 | N.A. | - | ||||||||||||||||||||||||
| Hadera Paper Development and Infrastructures Ltd. | - | Ord. 1 | 100 | 100 | 145,970 | 100** | 100** | 100** | N.A. | - | ||||||||||||||||||||||||
| Hadera Paper - Packaging Paper and Recycling Ltd. (formerly: "Hadera Paper Industries Ltd.") | - | Ord. 1 | 100 | 100 | 123,146 | 100** | 100** | 100** | N.A. | - | ||||||||||||||||||||||||
| Hadera Paper - Printing and Writing Paper Ltd. (formerly: "Mondi Hadera Paper Ltd.") | - | Ord. 1 | 750 | 750 | 157,485 | 75.0 | 75.0 | 75.0 | N.A. | - | ||||||||||||||||||||||||
| American Israeli Paper Mills Marketing (1992) Ltd. | - | Ord. 1 | 100 | 100 | (2,023 | ) | 100*** | 100*** | 100*** | N.A. | Inactive company | |||||||||||||||||||||||
| Dafnir Packaging Systems Ltd. | - | Ord. 0.0001 | 1,250,000 | 125 | (893 | ) | 100*** | 100*** | 100*** | N.A. | Inactive company | |||||||||||||||||||||||
| Niroz Investment Company Ltd. | - | Ord. 0.0001 | 6 | 0.0006 | 88,219 | 100** | 100** | 100** | N.A. | Inactive company | ||||||||||||||||||||||||
1.Associated companies | ||||||||||||||||||||||||||||||||||
| Hogla-Kimberly Ltd. | - | Ord. 1 Preferred 1 | 4,547,622 1 | 4,547,622 1 | 239,116 | 49.9 | 49.9 | 49.9 | N.A. | - | ||||||||||||||||||||||||
2.Others | ||||||||||||||||||||||||||||||||||
| Bondex Technologies Ltd. | - | Preferred 0.01 | 20,250 | 202.5 | 1,646 | 18.37 | 16.67 | 16.67 | N.A. | - | ||||||||||||||||||||||||
* Number of shares held by the company.
** Including one share held by American Israeli Paper Mills Marketing (1992) Ltd. (inactive company).
*** Including one share held by Niroz Investment Company Ltd. (inactive company)
- 8 -
Appendix B-2
Loans to subsidiaries and associated companies of the company as at December 31, 2010
| Lending party | Borrowing party | Outstanding loans and capital notes, including accrued interest, in NIS thousands | Interest rate % | Linkage Type | Repayment years |
| Hadera Paper Ltd. | Hadera Paper - Printing and Writing Paper Ltd. | 36,674 | 4% | CPI-Linked | Monthly repayment |
| Hadera Paper Ltd. | Amnir Recycling Industries Ltd. | 22,794 | 6% | US$-linked | The repayment date has yet to be set |
| Hadera Paper Ltd. | Attar Marketing Office Supplies Ltd. | 15,810 | 4% | CPI-Linked | Repayment date yet to be set |
| Nir Oz Investment Company Ltd.* | Hadera Paper Ltd. | (14,673) | 0% | Unlinked | Repayment date yet to be set |
| Hadera Paper Ltd. | American Israeli Paper Mills Marketing (1992) Ltd.* | 2,103 | 0% | Unlinked | Repayment date yet to be set |
| Hadera Paper Ltd. | Dafnir Packaging Systems Ltd.* | 1,134 | 0% | Unlinked | Repayment date yet to be set |
| Hadera Paper Ltd. | Hadera Paper - Packaging Paper and Recycling | 595,000 | 6.55% | Unlinked | Annual repayment |
* Inactive company
- 9 -
Appendix C
Regulation 12 – Changes in investments in subsidiary companies and in
associated companies during the reported period
| Changes in holdings during the reported period - |
| 1. | On October 4, 2010, the company completed the full tender offer regarding the acquisition of all of the public holdings in Carmel Container Systems Ltd. ("Carmel"), a subsidiary of the company, at a price of $22.5 per share in cash (subject to withholding tax according to law), in consideration of approximately $4.4 million, pursuant to the decision of the Board of Directors dated August 30, 2010, regarding the full tender offer, according to Section 336 of the Companies Law, 1999. The Carmel shares are not and were not registered for trading on an Israeli stock exchange, although they were previously registered for trade on the American Stock Exchange and were delisted at Carmel's initiative in 2005. |
Pursuant to the Companies Law - 1999, the company automatically acquired all of the shares offered as part of the tender offer, including all of the shares held by shareholders that did not accept the tender offer.
The company completed the process of transferring the payment to shareholders whose shares were purchased without their participation and the completion of the technical process opposite the American stock exchange. Upon completion of the said technical process, the company holds 100% of the issued and outstanding share capital and voting rights of Carmel, starting with the last acceptance date of the tender offer, October 4, 2010.
| 2. | On September 7, 2010, Hadera Paper signed an agreement with a subsidiary of Mondi Group (“Mondi Group”), that held - prior to the transaction - 50.1% of the issued and outstanding share capital of Hadera Paper - Printing and Writing Paper Ltd. (formerly Mondi Hadera Paper Ltd.) ("Hadera Paper Printing"), pursuant to which Mondi Group will sell to the Company 25.1% of the issued and outstanding share capital of Hadera Paper Printing ("The Acquisition Transaction"). |
Prior to the acquisition transaction, the company held 49.9% of the issued and outstanding share capital of Hadera Paper Printing, and holds, subsequent to the completion of the acquisition transaction, valid as at December 31, 2010, 75% of the issued and outstanding share capital of Hadera Paper Printing. Mondi Group holds the remaining 25%.
- 10 -
In consideration of the shares being sold, the Company paid Mondi Group, from its own resources, upon finalization of the Acquisition Transaction, a sum of 10.364 million euro, on January 5, 2011.
The Acquisition Transaction includes, inter alia, the amendment of the existing shareholder agreement between the parties, pertaining to their holdings in Hadera Paper Printing (that entered into force subject to the finalization of the Acquisition Transaction on December 31, 2010), including also the changes necessary as a result of the modification of the holding percentages, including the protection of minority interests, rules for the continued cooperation between the shareholders and Hadera Paper Printing, a non-competition clause, dividend distribution policy and the like, subject to the provisions of the law.
Moreover, the Acquisition Transaction includes the amendment of the existing agreements between the shareholders and Hadera Paper Printing (that entered into force with the finalization of the Acquisition Transaction on December 31, 2010), including a marketing agreement, rental agreement, agreement for the provision of services and the signing of new agreements (that entered into force subject to the finalization of the Acquisition Transaction on December 31, 2010), including a subletting agreement and an agreement governing the use of the Mondi brand.
As part of the previous agreement between Hadera Paper and Mondi group dated November 21, 1999, MBP was granted the option to sell its holdings in Mondi Hadera to the Company at a price 20% lower than its value (as defined in the agreement), or $20 million, less 20% - the higher of the two. The Acquisition Transaction, included an amendment of the Put option, stipulating that it may not be exercised during the first three years subsequent to the date of finalization of the Acquisition Transaction (except for specific circumstances outlined in the agreement). Moreover, it was determined that Mondi Group will be subject to the undertaking not to sell its shares in Hadera Paper Printing for a period of three years subsequent to the date of finalization of the Acquisition Transaction (except for specific circumstances outlined in the agreement).
Following the finalization of the transaction as at December 31, 2010, the company is consolidating in its financial statements, as at December 31, 2010, the financial statements of Hadera Paper Printing.
- 11 -
In November 2010 the Company purchased some 18.37% of the shares of Bondex (16.48% fully diluted), in consideration of $450 thousand. Bondex deals in the commercialization and development of bonder, a biological material intended to provide packaging paper with improved characteristics such as strength and water resistance. The other shareholders of Bondex, as at December 31, 2010, and to the best of the Company's knowledge, are third parties which are not interested parties in the Company, as follows: Private investors - 2.49%; founders - 31.75%; and the startup nursery and other entities 47.39%. True to the date of approval of the financial statements, the company was diluted down to 16.33% (13.70% fully diluted) as a result of a foreign investor having acquired 11.11% of the shares of Bondex.
The cost of acquiring the shares of Carmel, Bondex and Hadera Paper Printing amounted to NIS 15,703 thousands, NIS 1,646 thousands and NIS 49,368 thousands, respectively, as detailed below:
Primary Operations | Purchase Date | Percentage of ordinary shares purchased | Cost of acquisition | ||||||||||
NIS thousands | |||||||||||||
| Bondex | Packaging paper R&D | 10.11.2010 | 18.37 | % | 1,646 | ||||||||
| Carmel | Packaging and cardboard | 4.10.2010 | 10.30 | % | 15,703 | ||||||||
| Hadera Paper - Printing | Fine Paper | 31.12.2010 | 25.10 | % | 49,368 | ||||||||
| 66,717 | |||||||||||||
- 12 -
Appendix C 1
Regulation 13: Profit and loss of subsidiaries and associated companies and revenues therefrom for the year ended December 31, 2010 (NIS M)
| Revenues received | ||||||||||||||||||||||||||||
| Profit (loss) before taxes and special items | Net Income (loss) | Dividend | Dividend Subsequent to Balance Sheet Date | Management fees | Management fees subsequent to balance sheet date | Interest (received by company or eligibility) | ||||||||||||||||||||||
| Subsidiaries | ||||||||||||||||||||||||||||
| Amnir Recycling Industries Ltd. | 11,783 | 24,338 | - | - | 478 | 78 | 6,037 | |||||||||||||||||||||
| Graffiti Office Supplies & Paper Marketing Ltd. | 2,476 | 1,858 | - | - | 500 | 83 | 1,052 | |||||||||||||||||||||
| Hadera Paper - Packaging Paper and Recycling Ltd. | (25,997 | ) | (16,369 | ) | - | - | 717 | 117 | 8,420 | |||||||||||||||||||
| Hadera Paper Development and Infrastructures Ltd. | 4,402 | 3,961 | - | - | 821 | 68 | 4,817 | |||||||||||||||||||||
| Carmel Container Systems Ltd. | 3,707 | 2,938 | - | - | - | - | - | |||||||||||||||||||||
| Frenkel-CD Ltd. | 277 | 6 | - | - | - | - | - | |||||||||||||||||||||
| Hadera Paper - Printing and Writing Paper Ltd. | 29,358 | 22,072 | 7,210 | - | 1,473 | 235 | 2,044 | |||||||||||||||||||||
| Associated companies | ||||||||||||||||||||||||||||
| Hogla-Kimberly Ltd. | 190,597 | 144,693 | 49,900 | 14,970 | 1,296 | 221 | - | |||||||||||||||||||||
- 13 -
Appendix D
Regulation 21
Regulation 21(a) - Remuneration of Senior Officers
| 1. | Following below is the accounting cost of remuneration (remuneration paid during the reporting year, including the company's undertakings of remuneration on account of the reported year) for the five highest-paid senior officers of the Company: |
| Recipient Details | Remuneration for Services (in NIS thousands) | Total in NIS Thousands | ||||||
| Name | Position | Scope of employment | Holding rate in company equity, fully diluted | Salary | Bonus | Other | Share-based payment in respect of options * | Total |
Ofer Bloch1 | Group CEO | 100% | - | 21,879 | 3750 | 2,629 | ||
Shaul Gliksberg4 | VP Finance and Business Development | 100% | 0.11% | 51,389 | 6350 | 738 | 1,777 | |
Gideon Lieberman8 | COO | 100% | 0.11% | 91,134 | 10300 | 1138 | 1,472 | |
Shimon Biton12 | Combined Energy CEO | 100% | 0.05% | 131,152 | 14200 | 1538 | 1,390 | |
Gur Ben David16 | General Manager, Packaging Paper & Recycling Division | 100% | 0.13% | 171,032 | 18300 | 1938 | 1,370 | |
| ________________________ |
| The sums appear in terms of the cost to the company in 2010. |
*Sum appearing in column "share based payment" reflects the expenditure recorded by the company in its 2010 financial statements according to IFRS 2 on account of the granting of option warrants. |
The exercise periods of the option warrants are as follows:
| · | The offeree will be eligible to exercise into options one quarter of the quantity of the stock options (starting one year after January 14, 2008) (hereinafter: "The Determining Date") and up to four years from the determining date. |
| · | The offeree will be eligible to exercise into shares one additional (second) quarter of the quantity of option warrants, starting two years from the Determining Date and up to four years from the determining date. |
| · | The offeree will be eligible to exercise into shares an additional (third) quarter of the total sum of stock options, starting with the end of three years from the Determining Date and until the end of five years from the Determining Date. |
| · | The offeree would be eligible to exercise into shares an additional [fourth] quarter of the total sum of stock options allocated to him according to the plan, starting with the end of four years from The Determining Date and until the end of six years from The Determining Date. |
| 1. | Mr. Ofer Bloch began his tenure as CEO of the company on January 1, 2010. According to the employment contract, any one of the parties is eligible to terminate the engagement at any time while providing advanced notice of three months. |
| 2. | The wage component appearing in the above table includes all the following components : Labor wages, social and additional deductions as normally accepted, bonus 13th paycheck annually and company car. |
- 14 -
| 3. | The sum appearing in the column “bonus” is a provision on account of some of the annual bonus approved the Board of Directors of the company for payment to Mr. Ofer Bloch for the year 2010 and that will actually be paid in 2011. According to the employment agreement, the annual bonus of the CEO the equal to 6-9 monthly salaries, according to the discretion of the Board of Directors of the company. |
| 4. | Shaul Gliksberg has been employed as VP Finance at the company since January 1, 2008. According to the employment agreement, each one of the parties may terminate the engagement at any time while providing advanced notice of three months. |
| 5. | The wage component appearing above includes all of the following components: basic salary, social and additional deductions as normally accepted, bonus 13th paycheck annually and company car. |
| 6. | The sum appearing under the “bonus” column is the bonus that the company decided to pay to Shaul Gliksberg in the March 2011 paycheck, on account of 2010. Shaul Gliksberg does not have a guaranteed bonus and the sums of the bonuses were determined according to the discretion of the Board of Directors, in appreciation of the contribution of Shaul Gliksberg to the results of operation of the company. |
| 7. | On March 10, 2008, Shaul Gliksberg was allocated 11,000 option warrants, exercisable into up to 11,000 ordinary shares of the company, in accordance with the terms of the employee stock option plan adopted by the company. |
| 8. | Gideon Lieberman, has been employed as COO of the company since August 25, 1975. According to the employment agreement, each of the parties may terminate the engagement at any time by providing advanced notice of three months. |
| 9. | The wage component appearing in the above table includes all the following components : Labor wages, social and additional deductions as normally accepted, bonus 13th paycheck annually and company car. |
| 10. | The sum appearing under the “bonus” column is the bonus that the company decided to pay to Gideon Lieberman in the March 2011 paycheck, on account of 2010. Gideon Lieberman does not have a guaranteed bonus and the sums of the bonuses were determined according to the discretion of the Board of Directors, in appreciation of the contribution of Gideon Lieberman to the results of operation of the company. |
| 11. | On March 10, 2008, Gideon Lieberman was allocated 11,000 option warrants as part of the terms of his employment, to be exercised into up to 11,000 ordinary shares of the company, according to the terms of the employee stock option plan adopted by the company. |
| 12. | Shimon Biton, CEO of Combined Advanced Energy Ltd. has been working for the company since July 1977. According to the employment agreement, each one of the parties may terminate the engagement at any time while providing advanced notice of three months. |
| 13. | The salaries component appearing above includes all of the following components: Basic salary, social and additional deductions as normally accepted, bonus 13th paycheck annually and company car. |
| 14. | The sum appearing under the “bonus” column is the bonus that the company decided to pay to Shimon Biton in the March 2011 paycheck, on account of 2010. Shimon Biton does not have a guaranteed bonus and the sums of the bonuses were determined according to the discretion of the Board of Directors, in appreciation of the contribution of Shimon Biton to the results of operation of the company. |
| 15. | On March 10, 2008, Shimon Biton was allocated 11,000 option warrants as part of the terms of his employment, to be exercised into up to 11,000 ordinary shares of the company, according to the terms of the employee stock option plan adopted by the company. |
| 16. | Gur Ben-David, CEO of the Packaging Paper Division has been employed by the company since August 1, 2006. |
According to the employment agreement, each one of the parties may terminate the engagement at any time while providing advanced notice of three months.
| 17. | The salaries component appearing above includes all of the following components: Basic salary, social and additional deductions as normally accepted, bonus 13th paycheck annually and company car. |
| 18. | The sum appearing under the “bonus” column is the bonus that the company decided to pay to Gur Ben-David in the March 2011 paycheck, on account of 2010. Gur Ben-David does not have a guaranteed bonus and the sums of the bonuses were determined according to the discretion of the Board of Directors, in appreciation of the contribution of Gur Ben-David to the results of operation of the company. |
| 19. | On March 10, 2008, Gur Ben-David was allocated 11,000 option warrants as part of the terms of his employment, to be exercised into up to 11,000 ordinary shares of the company, according to the terms of the employee stock option plan adopted by the company. |
On May 13, 2007, the Board of Directors of the Company approved the employment agreement of the company's CEO, Mr. Avi Brener, who retired as the company's CEO on December 31, 2009 and who ended his employment at the company on January 31, 2010. Regarding the terms of retirement of the CEO, according to his employment terms, in addition to the release of funds accumulated in a directors' insurance/provident fund etc., at the date of retirement, the CEO shall be paid a retirement bonus in the sum of his last monthly salary prior to the retirement multiplied by the number of years he worked at the group (as of August 1988). On March 23, 2010, the audit committee and the Board of Directors approved the payment of a special non-recurring bonus in the sum of NIS 5 million, to the retiring CEO. For additional details regarding the terms of retirement of the CEO and the special bonus, see the immediate reports published by the company on March 8, 2010 and on March 23, 2010.
- 15 -
Director compensation
The total remuneration paid to the company directors and the accompanying expenditures, do not deviate from the norm and amounted - during the reported period - to NIS 1075.6 thousands (of which approximately NIS 215.8 thousand were paid to Clal Industries and Investments Ltd., controlling shareholder of the company, on account of the tenure of Messrs. Zvika Livnat, Avi Fischer and Dan Vardi as directors at the company.
Appendix E
Regulation 22 - Transactions with controlling shareholders parties
Negligible transactions
On March 8, 2009, the Board of Directors of the Company approved rules for the assessment of negligible transaction as the term is defined in the Securities Regulations (Preparation of Annual Financial Statements), 1993. The procedure was updated by the Board of Directors of the company on August 8, 2010.
In its normal course of business, the Group conducted transactions with controlling shareholders that are "negligible transactions" in accordance with the said tests appearing in Note 20 to the company's financial statements, dated December 31, 2010.
According to these tests, each transaction with aninteresed party will be considered to be a negligible transaction if it is not an extraordinary transaction and if the relevant parameter for the transaction (one or more) will be equal to less than 0.5%, while the volume of the transaction does not exceed NIS 8 million. In any interested party transaction classified as a negligible transaction, one or more of the criterions relevant to the specific transaction will be calculated based on the consolidated audited or reviewed financial statements of the Company: (a) The sales ratio – total sales in the interested party's transaction divided by total annual sales; (b) Sales cost ratio – the cost of the interested party's transaction divided by the total cost of annual sales; (c) Profit ratio – the actual or forecasted profit or loss attributed to the interested party's transaction divided by the average annual profit or loss in the last three years, based on the last 12 quarters for which reviewed or audited financial statements were published; (d) Assets ratio – the total volume of assets in the interested party's transaction divided by total assets; (e) Liabilities ratio – the liabilities in the interested party's transaction divided by total liabilities; (f) Operating costs ratio - the volume of the expenditure that is the subject of the interested party transaction divided by the total annual operating expenditures. For example, in an insurance transaction of several years, the annual paid insurance fees shall be considered as the volume of the transaction. In cases where, at the Company's discretion, all the aforementioned quantitative benchmarks are not applicable for evaluation of the negligibility of the transaction with an interested party, the transaction shall be deemed negligible, in accordance with another applicable benchmark to be determined by the Company, provided that the applicable benchmark calculated for said transaction is less than 0.5% and that the volume of the transaction shall not exceed NIS 8 million (with this sum being adjusted according to the rise, from time to time, of the consumer price index in relation to the Known Index since the beginning of 2010).
- 16 -
Unexceptional transactions with senior officers or controlling shareholders
The Articles of Association of the Company includes a provision under which, subject to the provisions of the Companies Law, a transaction of the Company with an officer or controlling shareholder of the Company or a transaction of the Company with another person in which the officeer or controlling shareholder of the Company has a personal interest, and which are not unexceptional transactions, shall be approved as follows:
| a. | An engagement as aforesaid, in an unexceptional transaction, shall be approved by the board of directors or by the audit committee or by another organ authorized thereto by the board of directors, whether by a specific decision or in accordance with the directives of the board of directors, whether by a general authorization, or by authorization for a certain type of transactions or by authorization for a particular transaction. |
| b. | The approval of transaction that are unexceptional as stated in sub-section a. above, may be carried out by granting general approval to a certain type of transactions or by approving a particular transaction; |
Subject to the provisions of the Companies Law, a general notice given to the board of directors by an officer or controlling shareholder in the company, concerning his personal interest in a particular entity, while specifying his personal interest, shall constitute disclosure by the officer or controlling shareholder, to the company, of said personal interest, for the purpose of any engagement with an entity as aforesaid, in an unexceptional transaction.
- 17 -
On March 7, 2006, the board of directors of the company approved that the company's management is the authorized entity to approve unexceptional transactions of the company with an officer or controlling shareholder or a transaction of the company with another person, in which the officer or controlling shareholder in the company has a personal interest, as stated in this section, above.
The company and/or its subsidiaries have several engagements with interested parties in the company and/or with companies in which the interested parties in the company are controlling shareholders therein, which are conducted in the course of ordinary business under such conditions and at such prices which are not different from those acceptable in the company with respect to its other clients and suppliers, such as the purchase and leasing of equipment, cellular communications and insurance, as detailed below.
Transactions not outlined in section 270[4] of the Companies Law and that are not negligible:
| 1. | Directors’ Liability Insurance: On July 27, 2010, following the approval of the company's Audit Committee and Board of Directors, the company's shareholders' meeting approved the company's engagement with Clal Insurance Company Ltd., a company owned by the controlling shareholder in the Company indirectly, for the acquisition of an officers' liability insurance policy for the period commencing June 1, 2010 until November 30, 2011. The volume of coverage of the policies $6 million, while the annual premium is $37,000 ($55,500 for 18 months), after conducting a tender for insurance services by addressing the different insurers to receive a proposal for renewing insurance. . The audit committee and Board of Directors of the company have stated that the policy was issued under market conditions, in accordance with the standards in such transactions. The amount of the policy's coverage is identical to the amount of coverage of previous policies for 2009 and 2008. The annual premium as part of the policy ($37,000) is lower than the premium paid in 2009 ($51,800) and is lower than the premium paid in 2008, that included an expansion of liability on account of a shelf prospectus. Starting in 2009, insurance coverage was expanded to also include position holders and directors of Carmel and its subsidiaries. |
| 2. | Insurance: For details regarding insurance policies purchased by the company for itself and for the subsidiaries, see Section 18, above, to the periodical report. |
- 18 -
| · | Letters of indemnification: Pursuant to the resolutions of the general meeting of the Company dated June 21, 2006 and July 14, 2004, the Company issues letters of indemnification to all the directors and officers of the company, including directors that are considered controlling shareholders in the company (Messrs. Zvika Livnat and Itzhak Manor), as they may be from time to time. Under the letters of indemnification, the company provides all the directors and officers therein, as they may be from time to time, indemnification in advance, in accordance with the company's Articles of Association and the provisions of the Companies Law in respect of any liability or expenses imposed on the officer in consequence of actions he has incurred and/or will incur by virtue of being an officer of the company, which are related directly or indirectly, to the type of events outlined in the letters of indemnification. The amount of indemnification pursuant to all the letters of indemnification that have been provided and/or will be provided to the offers and employees of the company, shall not exceed a cumulative sum equal to 25% of the company's shareholders' equity in accordance with the last consolidated financial statements published prior to the actual provision of indemnification. For additional details, see Section 19.1 to the periodical report of the company, attached to this report. |
| 3. | Product Sale - in the course of 2010, Hogla Kimberly Ltd., an associated company of the company's, in the normal course of its affairs, sold from time to time, toiletry, cleaning and paper products to Supersol Ltd., a company controlled by the company's controlling shareholder, for the purpose of sale in some stores and for its own use. On account of the said transactions, Hogla Kimberly Ltd. receive the overall sum of NIS 224.5 million in 2010. The format of the engagement with Supersol, is similar to Hogla engagements with retail marketing chains, as follows: The actual purchases are usually made in an ongoing manner by the various branches, as part of the normal course of affairs and from time to time, according to their needs. Additionally, the parties occasionally sign an agreement that determines different commercial terms that donot constitute an undertaking to either sell and or purchase any products. |
| 4. | Product sales: In the course of 2010, through a wholly owned subsidiary of the company in the packaging products and cardboard sector, the company recorded sales to Cargal Ltd., a company in which the Company's controlling shareholder is an interested party, in the overall sum of NIS 48.5 million. In accordance with the format of the engagement with Cargal, in a manner similar to the other company customers, a commercial agreement is signed with the customer once every quarter, which defines the commercial terms. The commercial agreement does not constitute an undertaking on the part of Cargal, for the purchase of packaging paper from the company, and the actual purchasing is made in an ongoing manner, in the normal course of affairs, from time to time, according to Cargal's needs. |
- 19 -
| 5. | Product sales: In the course of 2010, the company sold, through Carmel Container Systems Ltd., to Mehadrin Tnuport Exports Limited Partnership, an interested party in IDB Group, cardboard products in the total value of approximately NIS 7.6 million. |
| 6. | Rental of Buildings: In the course of 2010, Carmel Container Systems Ltd. paid to Gav Yam Property and Building Group Ltd, a public company controlled indirectly by the controlling shareholder, a sum of approximately NIS 11 million on account of the rental of buildings in Caesarea. |
| 7. | Cellular Services: In the course of 2010, the company paid, also through subsidiaries and associated companies, to Cellcom Israel Ltd., a company controlled by the controlling shareholder of the company, the sum of NIS 2.7 million on account of the purchasing of cellular telephone services, by virtue of the agreement signed in 2009. |
| 8. | Fuel for automobiles: In the course of 2010, Carmel Container Systems Ltd. paid Delek - Israel Fuel Company Ltd., the sum of approximately NIS 3.8 million for automobile fuel. |
| 9. | Vehicle leasing: In the course of 2010, Carmel Container Systems Ltd. paid Prime Lease Vehicle Fleet Management Ltd., an interested party from IDB Group, the sum of NIS 1.1 million for automobile leasing services. |
Transactions outlined in section 270[4] of the Companies Law:
| a. | Agreement for leasing of a Logistics Center: On September 18, 2008, a lease agreement was signed between the Company and Gav-Yam Property and Building Group Ltd ("the lessor"), a public company controlled by the Company's indirect controlling shareholders, whereby the Company leased a plot in Modi'in with an area of 74,500 square meters, as well as buildings constructed by the lessor for the Company, with a total constructed area of 21,300 square meters, to serve as a logistics center, industrial and office space ("Logistics Center") for the Company's subsidiaries, which would - in part - replace existing lease agreements. The Leasing Period is 15 years from the date of receiving possession of the Leased Property. The Company will also hold an option to extend the lease by an additional 9 years and 11 months. During the fourth quarter of 2010, the logistics center was populated by Amnir and by Hadera Paper Printing, while during the second half of 2011, Graffiti is also expected to relocate its distribution site to the logistics center. For additional details, see Section 12.6 to the periodical report of the company, attached to this report. A sum of approximately NIS 2 million was paid in 2010 on account of this agreement. |
- 20 -
| b. | Sale of an asset: On July 27, 2010, the general meeting of the Company, after receiving the approval of the Audit Committee and Board of Directors of the company, approved the engagement of the company dated June 1, 2010, for the sale of its rights in a property covering 7,600 square meters in Tel Aviv (hereinafter: "The Plot"), that was leased from the Tel Aviv Municipality and served in the past as one of the Company’s paper manufacturing plants, in return for the overall sum of NIS 64 million, (hereinafter: "The Sale Agreement"). The purchasing parties are Gav Yam Property and Building Group Ltd., ("Gav Yam"), a company indirectly controlled by IDB Development Company Ltd., the controlling shareholder of the company and by Amot Investments Ltd. ("Amot"), with shares of 71% and 29%, respectively. For additional details, see Section 12.4 to the periodical report of the company, attached to this report. |
| c. | Directors’ Compensation: On March 7, 2010, the company announced a decision on the part of the audit committee and the Board of Directors of the company regarding the approval of annual remuneration and participation remuneration for directors at the company (who are not external directors) for 2010, at the level of the "regular amount" stipulated in the company regulations ( directives regarding remuneration and expenses for external directors), 2000 (hereinafter: "remuneration directives"), subject upon meeting regulation 1a(2) to the company ordinance (relief in transactions with interested parties), 2000 (hereinafter: "relief directives") regarding directors who are not controlling shareholders or related thereto, and directive 1b(3) to the relief directives regarding directors who are not controlling shareholders or related thereto, as stated in the company announcement. On March 7, 2011, the company announced a decision on the part of the audit committee and the Board of Directors of the company regarding the approval of annual remuneration and participation remuneration for directors at the company (who are not external directors) for 2011, at the level of the "regular amount" stipulated in the company regulations ( directives regarding remuneration and expenses for external directors), 2000 (hereinafter: "remuneration directives"), subject upon meeting regulation 1a(2) to the company ordinance (relief in transactions with interested parties), 2000 (hereinafter: "relief directives") regarding directors who are not controlling shareholders or related thereto, and directive 1b(3) to the relief directives regarding directors who are not controlling shareholders or related thereto, as stated in the company announcement. |
- 21 -
Appendix F
Regulation 24
| Holding Percentage | Holding Percentage - fully diluted | ||||||||||||||||||||||||||||
Name of Interested Party11 | Company No. / ID No. | Name of Security | No. of Security on the Stock Exchange | No. of securities held as at Feb-14-2011 | In equity | In voting and authority to appoint directors | In equity | In voting and authority to appoint directors | |||||||||||||||||||||
| Clal Industries and Investments Ltd. | 52-002187-4 | Ordinary shares | 632018 | 3,007,621 | 59.09 | % | 59.09 | % | 57.60 | % | 57.60 | % | |||||||||||||||||
| Clal Insurance Holdings Ltd. | 52-003612-0 | Ordinary shares | 632018 | 224,736 | 4.42 | % | 4.42 | % | 4.30 | % | 4.30 | % | |||||||||||||||||
| Clal Finance Ltd. | 51-138234-3 | Ordinary shares | 632018 | 35,759 | 0.70 | % | 0.70 | % | 0.68 | % | 0.68 | % | |||||||||||||||||
| Psagot Investment House Ltd. | 51-376707-9 | Ordinary shares | 632018 | 276,361 | 5.43 | % | 5.43 | % | 5.29 | % | 5.29 | % | |||||||||||||||||
11 Data regarding holders at the company shares are according to the best knowledge of the company.
- 22 -
Regulation 24 - Senior position holders
| Holding Percentage | Holding Percentage - fully diluted | |||||||
| Name of senior position holder | ID No. | Name of Security | No. of Security on the Stock Exchange | Number of options held as at Feb-14-2011 | In equity | In voting and authority to appoint directors | In equity | In voting and authority to appoint directors |
| Shaul Glicksberg | 57082539 | Employee options | 6320063 | 5,500 | 0 | 0 | 0.11 | 0.11 |
| Gideon Lieberman | 54469192 | Employee options | 6320063 | 5,500 | 0 | 0 | 0.11 | 0.11 |
| Gur Ben-David | 50976281 | Employee options | 6320063 | 6,750 | 0 | 0 | 0.13 | 0.13 |
| Michal Mendelson | 55900641 | Employee options | 6320063 | 2,124 | 0 | 0 | 0.04 | 0.04 |
| Simcha Kenigsbuch | 55104913 | Employee options | 6320063 | 4,250 | 0 | 0 | 0.08 | 0.08 |
| Noga Alon | 58693789 | Employee options | 6320063 | 2,124 | 0 | 0 | 0.04 | 0.04 |
| David Basson | 55722755 | Employee options | 6320063 | 3,624 | 0 | 0 | 0.07 | 0.07 |
| Shmuel Molad | 25447905 | Employee options | 6320063 | 2,750 | 0 | 0 | 0.05 | 0.05 |
| Avraham Tenenbaum | 51325785 | Employee options | 6320063 | 2,124 | 0 | 0 | 0.04 | 0.04 |
| Avner Solel | 52224540 | Employee options | 6320063 | 2,750 | 0 | 0 | 0.05 | 0.05 |
| Doron Kempler | 50424142 | Employee options | 6320063 | 5,500 | 0 | 0 | 0.11 | 0.11 |
- 23 -
Appendix G
List of directors serving on the Board of Directors of the company as at December 31, 201012:
(In alphabetical order)
Avital Shmuel
Arad Atalia
Vardi Dan
Livnat Zvi
Milo Roni
Manor Itzhak
Makov Amir13
Mar-Haim Amos
Rosenfeld Adi
Vardi Dan
B. Directors who ceased serving on the Board of Directors of the company during the reported period
Following below are details regarding directors who ceased serving on the Board of Directors of the company during the reported period:
Yehezkel Avi
Fisher Avi
12 On February 8, 2011, the company announced the convening of the special general meeting of the company on March 21, 2011, for the purpose of ratifying the appointment of Ms. Aliza Rotbard as an external director of the company.
- 24 -
Appendix H
Senior officers at the company 14 ,15
Ofer Bloch - Company CEO
Shaul Gliksberg - VP Finance and Business Development.
Gur Ben-David - CEO, Hadera Paper Packaging
Yael Nevo - Legal counsel and company secretary
Michal Mendelson - Group marketing manager
Simcha Kenigsbuch - IT Manager
Noga Alon - Group Organizational Development Manager
David Basson - VP, Supply Chain
Shmuel Molad – Controller
Avraham Tenenbaum - Manager of Development and Innovation
Avner Solel - CEO, Hadera Paper Printing
Doron Kempler - CEO, Carmel Container Systems
14 On October 31, 2010, Adv. Lea Katz resigned from her position as legal counsel of the Corporation.
15On March 1, 2011, the company announced the appointment of Mr. Zvika Abramowitz as the company's VP of Human Resources.
- 25 -
Part E
Report Regarding Effectiveness of Internal Auditing Over Financial
Statementss and Disclosure
The company is exempt from submitting the report.
- 26 -
Exhibit 4
HADERA PAPER LTD
CONSOLIDATED FINANCIAL STATEMENTS
AS OF DECEMBER 31, 2010
HADERA PAPER LTD
CONSOLIDATED FINANCIAL STATEMENTS
AS OF DECEMBER 31, 2010
TABLE OF CONTENTS
| Page | |
| F-1 | |
| Consolidated Financial Statements | |
| F-2- F-3 | |
| F-4 | |
| F-5 | |
| F-6- F-8 | |
| F-9- F-10 | |
| F-11- F-89 |
 | Brightman Almagor Zohar Haifa office 5 Ma’aleh Hashichrur Street P.O.B. 5648, Haifa 31055 Israel Tel: +972 (4) 860 7333 Fax: +972 (4) 867 2528 info-haifa@deloitte.co.il www.deloitte.co.il |
Report of Independent Registered Public Accounting Firm To the shareholders of Hadera Paper ltd. |
We have audited the accompanying consolidated statements of financial position of Hadera Paper Ltd. (“the Company”) and subsidiaries as of December 31, 2010 and 2009, and the related, consolidated statements of income, comprehensive income, changes in equity and cash flows for each of the three years in the period ended December 31, 2010. These financial statements are the responsibility of the Company's board of directors and management. Our responsibility is to express an opinion on these financial statements based on our audit.
We did not audit the financial statements of certain subsidiaries, which statements reflect total assets constituting approximately 15% and 17% of consolidated total assets as of December 31, 2010 and 2009, respectively, and total revenues constituting approximately 45%, 54% and 25% of consolidated total revenues for the years ended December 31, 2010, 2009 and 2008, respectively.
Likewise we did not audit the financial statements of certain associated companies, in which the Company's share in their profits or losses is a net amount of 1,440 Thousands NIS, for the year ended December 31, 2008. The financial statements of those companies were audited by other Auditors whose reports have been furnished to us, and our opinion, insofar as it relates to amounts included for those companies, is based solely on the reports of the other auditors.
We conducted our audits in accordance with generally accepted auditing standards in Israel, including those prescribed under the Auditors' Regulations (Auditor's Mode of Performance), 1973. Those standards require that we plan and perform the audit to obtain reasonable assurance whether the financial statements are free of material misstatement. An audit also includes examining, on a test basis, evidence supporting the amounts and disclosures in the financial statements. An audit also includes assessing the accounting principles used and significant estimates made by the company's Board of Directors and management, as well as evaluating the overall financial statement presentation. We believe that our audits and the reports of the other independent auditors provide a reasonable basis for our opinion
In our opinion, based on our audits and the reports of other auditors, such consolidated statements present fairly, in all material respects, the financial position of the Company and subsidiaries at December 31, 2010 and 2009, and the results of their operations, changes in equity and cash flows, for each of the three years in the period ended December 31, 2010, in conformity with International Financial Reporting Standards (IFRS) as issued by the International Accounting Standards Board (IASB) and in accordance with the Israeli Securities Regulations (Annual Financial Statements), 2010.
Brightman Almagor Zohar& Co.
Certified Public Accountants
A Member Firm of Deloitte Touche Tohmatsu
Israel
March 6, 2011
F - 1
HADERA PAPER LTD
CONSOLIDATED STATEMENTS OF FINANCIAL POSITION
December 31 | ||||||||||||
Note | 2 0 10 | 2 0 0 9 | ||||||||||
NIS in thousands | ||||||||||||
| Assets | ||||||||||||
| Current Assets | ||||||||||||
| Cash and cash equivalents | 2f | 120,992 | 26,261 | |||||||||
| Designated deposits | 2f | - | 127,600 | |||||||||
| Trade receivables | 15a | 564,929 | 323,882 | |||||||||
| Other receivables | 15a | 57,059 | 98,897 | |||||||||
| Inventories | 15b | 343,519 | 175,944 | |||||||||
| Total Current Assets | 1,086,499 | 752,584 | ||||||||||
| Non-Current Assets | ||||||||||||
| Fixed assets, net | 6 | 1,358,619 | * 1,134,234 | |||||||||
| Investments in associated companies | 5 | 237,498 | 340,975 | |||||||||
| Deferred tax assets | 13 | 2,165 | ** 2,096 | |||||||||
| Prepaid expenses in respect of an operating lease | 7 | 24,836 | * 29,756 | |||||||||
| Other intangible assets | 9 | 35,714 | 27,084 | |||||||||
| Investment property | 8 | 24,500 | - | |||||||||
| Financial assets - available for sale | 15a | 1,646 | - | |||||||||
| Other assets | 1,364 | 1,298 | ||||||||||
| Employee benefit assets | 11 | 793 | 649 | |||||||||
| Total Non-Current Assets | 1,687,135 | 1,536,092 | ||||||||||
| Total Assets | 2,773,634 | 2,288,676 | ||||||||||
| Z. Livnat | O. Bloch | S. Gliksberg | ||
| Chairman of the Board of Directors | Chief Executive Officer | Chief Financial and Business Development Officer |
Approval date of the financial statements: March 6, 2011
*Retroactively adjusted in respect of implementation of amendment to IAS17, see note 3a
** Reclassified, see note 23
The accompanying notes are an integral part of the consolidated financial statements.
F - 2
HADERA PAPER LTD
CONDENSED CONSOLIDATED STATEMENTS OF FINANCIAL POSITION
December 31 | ||||||||||||
Note | 2 010 | 2 00 9 | ||||||||||
NIS in thousands | ||||||||||||
| Liabilities and Equity | ||||||||||||
| Current Liabilities | ||||||||||||
| Credit from banks and others | 10b, 15c | 144,622 | 131,572 | |||||||||
| Current maturities of long-term notes and long term loans | 10a, b | 175,936 | 149,940 | |||||||||
| Trade payables | 15d | 370,065 | 255,895 | |||||||||
| Other payables | 15d | 172,295 | 112,745 | |||||||||
| Short term employee benefit liabilities | 11 | 27,586 | 22,421 | |||||||||
| Financial liabilities at fair value through profit and loss | 2t(2) | - | 11,982 | |||||||||
| Current tax liabilities | 19,951 | 2,760 | ||||||||||
| Total Current Liabilities | 910,455 | 687,315 | ||||||||||
| Non-Current Liabilities | ||||||||||||
| Loans from banks and others | 10b | 251,283 | 225,802 | |||||||||
| Notes | 10a | 562,348 | 471,815 | |||||||||
| Deferred tax liabilities | 13 | 45,302 | *30,404 | |||||||||
| Employee benefit liabilities | 11 | 19,132 | 14,911 | |||||||||
| Financial liability with respect to Put option granted to the non-controlling interests | 2t2 | 31,512 | - | |||||||||
| Total Non-Current Liabilities | 909,577 | 742,932 | ||||||||||
| Capital and reserves | 12 | |||||||||||
| Issued capital | 125,267 | 125,267 | ||||||||||
| Reserves | 298,258 | 307,432 | ||||||||||
| Retained earnings | 506,445 | 399,346 | ||||||||||
| capital and reserves attributed to shareholders | 929,970 | 832,045 | ||||||||||
| Non-controlling Interests | 23,632 | 26,384 | ||||||||||
| Total capital and reserves | 953,602 | 858,429 | ||||||||||
| Total Liabilities and Equity | 2,773,634 | 2,288,676 | ||||||||||
* Reclassified, see note 23
The accompanying notes are an integral part of the consolidated financial statements.
CONSOLIDATED INCOME STATEMENTS
Year ended December 31 | ||||||||||||||||
Note | 2 0 1 0 | 2 0 0 9 | 2 0 0 8 | |||||||||||||
NIS in thousands | ||||||||||||||||
| Revenue | 15e | 1,121,008 | 891,995 | 673,484 | ||||||||||||
| Cost of sales | 15f | 945,422 | 765,677 | 542,387 | ||||||||||||
| Gross profit | 175,586 | 126,318 | 131,097 | |||||||||||||
| Selling, marketing, general and administrative expenses | 15g | |||||||||||||||
| Selling and marketing expenses | 87,201 | 71,998 | 45,674 | |||||||||||||
| General and administrative expenses | 59,603 | 58,967 | 54,970 | |||||||||||||
| Other income, net | 15l | (32,513 | ) | (20,234 | ) | (4,898 | ) | |||||||||
| Total expenses | 114,291 | 110,731 | 95,746 | |||||||||||||
| Profit from ordinary operations | 61,295 | 15,587 | 35,351 | |||||||||||||
| Finance income | 15j | 9,314 | 4,727 | 12,069 | ||||||||||||
| Finance expenses | 15k | 54,079 | 22,992 | 27,112 | ||||||||||||
| Finance expenses, net | 44,765 | 18,265 | 15,043 | |||||||||||||
| Profit (loss) after financial expenses | 16,530 | (2,678 | ) | 20,308 | ||||||||||||
| Share in profit of associated companies, net | 5b | 81,132 | 87,359 | 51,315 | ||||||||||||
| Profit before taxes on income | 97,662 | 84,681 | 71,623 | |||||||||||||
| Taxes on income | 13d1 | (2,950 | ) | (7,067 | ) | 3,663 | ||||||||||
| Profit for the year | 100,612 | 91,748 | 67,960 | |||||||||||||
| Attributed to: | ||||||||||||||||
| Company shareholders | 100,728 | 91,230 | 69,710 | |||||||||||||
| Non-controlling interests | (116 | ) | 518 | (1,750 | ) | |||||||||||
| 100,612 | 91,748 | 67,960 | ||||||||||||||
| Earning for regular share of NIS 0.01 par value (see note 16): | ||||||||||||||||
| Primary attributed to Company shareholders | 19.84 | 18.03 | 13.77 | |||||||||||||
| Fully diluted attributed to company shareholders | 19.68 | 18.03 | 13.77 | |||||||||||||
| Number of share used to compute the primary earnings per share | 5,078,156 | 5,060,788 | 5,060,774 | |||||||||||||
| Number of share used to compute the fully diluted earnings per share | 5,118,416 | 5,060,788 | 5,060,774 | |||||||||||||
The accompanying notes are an integral part of the consolidated financial statements.
CONSOLIDATED STATEMENT OF
COMPREHENSIVE INCOME
Year ended December 31 | ||||||||||||
2 0 1 0 | 2 0 0 9 | 2 0 0 8 | ||||||||||
NIS in thousands | ||||||||||||
| Comprehensive Income | 100,612 | 91,748 | 67,960 | |||||||||
| Other Comprehensive Income | ||||||||||||
| Profit (loss) on cash flow hedges, net | 1,044 | 5,191 | (2,306 | ) | ||||||||
| Allocation to the income statement on account of cash flow hedging transactions, net | - | (1,128 | ) | - | ||||||||
| Actuarial profit (loss) from defined benefit plans, net | 115 | 477 | (1,501 | ) | ||||||||
| Revaluation from step acquisition | - | - | 17,288 | |||||||||
| Share in Other Comprehensive Income of associated companies, net | (11,711 | ) | (507 | ) | (29,111 | ) | ||||||
| Share in other comprehensive income associated companies, which allocated to the income statements, net | 446 | 1,163 | 1,017 | |||||||||
| Total Other Comprehensive Income for the period, net | (10,106 | ) | 5,196 | (14,613 | ) | |||||||
| Total Comprehensive Income for the period | 90,506 | 96,944 | 53,347 | |||||||||
| Attributed to: | ||||||||||||
| Company shareholders | 90,605 | 96,428 | 55,115 | |||||||||
| Non-controlling interests | (99 | ) | 516 | (1,768 | ) | |||||||
| 90,506 | 96,944 | 53,347 | ||||||||||
The accompanying notes are an integral part of the consolidated financial statements
F - 5
HADERA PAPER LTD
CONSOLIDATED
FINANCIAL STATEMENTS OF CHANGES IN SHAREHOLDERS' EQUITY
Share capital | Premium of share | Share based payments reserves | Capital reserves resulting from tax benefit on exercise of employee options | Capital reserve from revaluation from step acquisition | Hedging reserves | Foreign currency translation reserves | Retained earnings | Total for Company shareholders | Non - controlling Interests | Total | ||||||||||||||||||||||||||||||||||
NIS in thousands | ||||||||||||||||||||||||||||||||||||||||||||
| Balance - December 31, 2009 (Audited) | 125,267 | 301,695 | 10,531 | 3,397 | 14,164 | 517 | (22,872 | ) | 399,346 | 832,045 | 26,384 | 858,429 | ||||||||||||||||||||||||||||||||
Adjustment of retained earnings in respect of implementation of amendment to IAS 17 (see note 3a) | - | - | - | - | - | - | - | 3,590 | 3,590 | - | 3,590 | |||||||||||||||||||||||||||||||||
| Balance - January 1, 2010 | 125,267 | 301,695 | 10,531 | 3,397 | 14,164 | 517 | (22,872 | ) | 402,936 | 835,635 | 26,384 | 862,019 | ||||||||||||||||||||||||||||||||
For the Year ended December 31, 2010: | - | |||||||||||||||||||||||||||||||||||||||||||
Exchange differences arising on translation of foreign operations | - | - | - | - | - | (10,649 | ) | - | (10,649 | ) | - | (10,649 | ) | |||||||||||||||||||||||||||||||
| Profit (loss) on cash flow hedges, net | - | - | - | - | - | 606 | - | - | 606 | 18 | 624 | |||||||||||||||||||||||||||||||||
| Actuarial profit (loss) from defined benefit plans, net | - | - | - | - | - | (80 | ) | (80 | ) | (1 | ) | (81 | ) | |||||||||||||||||||||||||||||||
| Profit for the year | - | - | - | - | - | - | 100,728 | 100,728 | (116 | ) | 100,612 | |||||||||||||||||||||||||||||||||
| Total Comprehensive Income for the Year | - | - | - | - | - | 606 | (10,649 | ) | 100,648 | 90,605 | (99 | ) | 90,506 | |||||||||||||||||||||||||||||||
| Share purchase from non-controlling interests in subsidiary | - | - | - | - | - | - | - | 1,117 | 1,117 | (17,498 | ) | (16,381 | ) | |||||||||||||||||||||||||||||||
| Entry into consolidation (See note 17) | - | - | - | - | - | - | - | - | - | 14,845 | 14,845 | |||||||||||||||||||||||||||||||||
| Depreciation of capital from revaluation from step acquisition to retained earnings | - | - | - | - | (1,744 | ) | - | - | 1,744 | - | - | - | ||||||||||||||||||||||||||||||||
| Conversion of employee options into shares | - | 5,156 | (5,156 | ) | - | - | - | - | - | - | - | - | ||||||||||||||||||||||||||||||||
| Share based payment | - | - | 2,613 | - | - | - | - | - | 2,613 | - | 2,613 | |||||||||||||||||||||||||||||||||
| Balance – December 31, 2010 | 125,267 | 306,851 | 7,988 | 3,397 | 12,420 | 1,123 | (33,521 | ) | 506,445 | 929,970 | 23,632 | 953,602 | ||||||||||||||||||||||||||||||||
The accompanying notes are an integral part of the consolidated financial statements
F - 6
HADERA PAPER LTD
CONSOLIDATED
FINANCIAL STATEMENTS OF CHANGES IN SHAREHOLDERS' EQUITY
Share capital | Capital reserves | Share based payments reserves | Capital reserves resulting from tax benefit on exercise of employee options | Capital reserve from revaluation from step acquisition | Cash Flows Hedging reserves | Foreign currency translation reserves | Retained earnings | Total for Company shareholders | Non-controlling interests | Total | ||||||||||||||||||||||||||||||||||
| Balance - January 1, 2009 | 125,267 | 301,695 | 6,227 | 3,397 | 15,908 | (5,092 | ) | (22,186 | ) | 306,097 | 731,313 | 26,316 | 757,629 | |||||||||||||||||||||||||||||||
For the Year ended December 31, 2009: | ||||||||||||||||||||||||||||||||||||||||||||
Exchange differences arising on translation of foreign operations | - | - | - | - | - | - | (686 | ) | - | (686 | ) | - | (686 | ) | ||||||||||||||||||||||||||||||
| Profit (loss) on cash flow hedges, net | - | - | - | - | 5,609 | 5,609 | (60 | ) | 5,549 | |||||||||||||||||||||||||||||||||||
| Actuarial profit (loss) from defined benefit plans, net | - | - | - | - | - | - | - | 275 | 275 | 58 | 333 | |||||||||||||||||||||||||||||||||
| Profit for the year | - | - | - | - | - | - | - | 91,230 | 91,230 | 518 | 91,748 | |||||||||||||||||||||||||||||||||
| Total Comprehensive Income for the Year | - | - | - | - | - | 5,609 | (686 | ) | 91,505 | 96,428 | 516 | 96,944 | ||||||||||||||||||||||||||||||||
| Purchasing shares of subsidiary company | - | - | - | - | - | - | - | - | - | (448 | ) | (448 | ) | |||||||||||||||||||||||||||||||
| Depreciation of capital from revaluation from step acquisition to retained earnings | - | - | - | - | (1,744 | ) | - | - | 1,744 | - | - | - | ||||||||||||||||||||||||||||||||
| Share based payment | - | - | 4,304 | - | - | - | - | - | 4,304 | - | 4,304 | |||||||||||||||||||||||||||||||||
| Balance – December 31, 2009 | 125,267 | 301,695 | 10,531 | 3,397 | 14,164 | 517 | (22,872 | ) | 399,346 | 832,045 | 26,384 | 858,429 | ||||||||||||||||||||||||||||||||
The accompanying notes are an integral part of the consolidated financial statements
F - 7
HADERA PAPER LTD
CONSOLIDATED
FINANCIAL STATEMENTS OF CHANGES IN SHAREHOLDERS' EQUITY
Share capital | Capital reserves | Share based payments reserves | Capital reserves resulting from tax benefit on exercise of employee options | Capital reserve from revaluation from step acquisition | Cash Flows Hedging reserves | Foreign currency translation reserves | Retained earnings | Total for Company shareholders | Non-controlling interests | Total | ||||||||||||||||||||||||||||||||||
| Balance - January 1, 2008 | 125,267 | 301,695 | - | 3,397 | - | (635 | ) | 3,810 | 236,437 | 669,971 | - | 669,971 | ||||||||||||||||||||||||||||||||
For the Year ended December 31, 2008: | ||||||||||||||||||||||||||||||||||||||||||||
Exchange differences arising on translation of foreign operations | - | - | - | - | - | - | (25,996 | ) | - | (25,996 | ) | - | (25,996 | ) | ||||||||||||||||||||||||||||||
| Profit (loss) on cash flow hedges, net | - | - | - | - | - | (4,457 | ) | - | - | (4,457 | ) | 360 | (4,097 | ) | ||||||||||||||||||||||||||||||
| Revaluation from step acquisition | - | - | - | - | 17,288 | - | - | - | 17,288 | - | 17,288 | |||||||||||||||||||||||||||||||||
| Actuarial profit (loss) from defined benefit plans, net | - | - | - | - | - | - | (1,430 | ) | (1,430 | ) | (378 | ) | (1,808 | ) | ||||||||||||||||||||||||||||||
| Profit for the year | - | - | - | - | 69,710 | 69,710 | (1,750 | ) | 67,960 | |||||||||||||||||||||||||||||||||||
| Total Comprehensive Income for the Year | - | - | - | - | 17,288 | (4,457 | ) | (25,996 | ) | 68,280 | 55,115 | (1,768 | ) | 53,347 | ||||||||||||||||||||||||||||||
| First transfer to consolidation – creating minority interests | - | - | - | - | - | - | - | - | - | 28,084 | 28,084 | |||||||||||||||||||||||||||||||||
| Depreciation of capital from revaluation from step acquisition to retained earnings | - | - | - | - | (1,380 | ) | - | - | 1,380 | - | - | - | ||||||||||||||||||||||||||||||||
| Share based payment | - | - | 6,227 | - | - | - | - | - | 6,227 | - | 6,227 | |||||||||||||||||||||||||||||||||
| Balance – December 31, 2008 | 125,267 | 301,695 | 6,227 | 3,397 | 15,908 | (5,092 | ) | (22,186 | ) | 306,097 | 731,313 | 26,316 | 757,629 | |||||||||||||||||||||||||||||||
The accompanying notes are an integral part of the consolidated financial statements.
F - 8
| Year ended | ||||||||||||
December 31 | ||||||||||||
2 0 1 0 | 2 0 0 9 | 2 0 0 8 | ||||||||||
NIS in thousands | ||||||||||||
| Cash flows – operating activities | ||||||||||||
| Net Profit for the year | 100,612 | 91,748 | 67,960 | |||||||||
| Taxes on income recognized in profit and loss | (2,950 | ) | (7,067 | ) | 3,663 | |||||||
| Finance expenses recognized in profit and loss, net | 44,765 | 18,265 | 15,043 | |||||||||
| Capital profit on sale of fixed assets | (19,556 | ) | (73 | ) | (284 | ) | ||||||
| Gain from revaluation of prior holding at fair value due to achieving control | (5,760 | ) | - | - | ||||||||
| Share in profit of associated companies | (81,132 | ) | (87,359 | ) | (51,315 | ) | ||||||
| Dividend received from associated company | 70,319 | 61,814 | - | |||||||||
| Income from repayment of capital note to associated company | - | (16,418 | ) | - | ||||||||
| Depreciation and amortization | 88,047 | 78,552 | 59,784 | |||||||||
Income from revaluation of investment property | (151 | ) | - | - | ||||||||
| Share based payments expenses | 2,104 | 3,762 | 4,913 | |||||||||
| Gain from negative goodwill | - | - | (14,664 | ) | ||||||||
| 196,298 | 143,224 | 85,100 | ||||||||||
| Changes in assets and liabilities: | ||||||||||||
| Decrease (Increase) in trade and other receivables | (51,546 | ) | 22,373 | 66,805 | ||||||||
| Increase in inventories | (5,926 | ) | (7,189 | ) | (19,868 | ) | ||||||
| Increase (Decrease) in trade and other payables | 47,999 | 24,407 | (16,923 | ) | ||||||||
| Increase (Decrease) in financial liabilities at fair value through profit and loss | 872 | (1,922 | ) | 10,003 | ||||||||
| Increase (Decrease) in employee benefit | 6,678 | 4,089 | (3,063 | ) | ||||||||
| (1,923 | ) | 41,758 | 36,954 | |||||||||
| Tax Payments | (1,293 | ) | (5,754 | ) | (8,182 | ) | ||||||
| Net cash generated by operating activities | 193,082 | 179,228 | 113,872 | |||||||||
The accompanying notes are an integral part of the consolidated financial statements.
F - 9
HADERA PAPER LTD
CONSOLIDATED CASH FLOWS STATEMENTS (Cont.)
| Year ended | ||||||||||||
December 31 | ||||||||||||
2 0 1 0 | 2 0 0 9 | 2 0 0 8 | ||||||||||
NIS in thousands | ||||||||||||
| Cash flows – investing activities | ||||||||||||
Acquisition of property plant and equipment and Prepaid expenses in respect of a financing lease | (219,124 | ) | (352,455 | ) | (232,675 | ) | ||||||
| Acquisition of subsidiaries | 13,111 | - | (70,567 | ) | ||||||||
| Acquisition of other assets | (2,956 | ) | (752 | ) | (2,770 | ) | ||||||
| Proceeds from sales of fixed assets | 18,277 | 1,960 | 825 | |||||||||
| Decrease (Increase) in designated deposits | 127,600 | 124,614 | (255,244 | ) | ||||||||
| Interest received | 1,829 | 1,565 | 7,764 | |||||||||
| Associated companies: | ||||||||||||
| Granting of loans to an associated company | (978 | ) | (1,068 | ) | (422 | ) | ||||||
| Repayments of loans to an associated company | - | - | 2,851 | |||||||||
| Net cash used in investing activities | (62,241 | ) | (226,136 | ) | (550,238 | ) | ||||||
| Cash flows – financing activities | ||||||||||||
| Proceeds from issuing notes (less issuance expenses) | 179,886 | - | 424,617 | |||||||||
| Short-term bank credit – net | (79,802 | ) | 53,917 | (111,444 | ) | |||||||
| Borrowings received from banks | 93,500 | 159,674 | 39,448 | |||||||||
| Repayment of borrowings from banks and from others | (56,804 | ) | (37,830 | ) | (11,801 | ) | ||||||
| Repayment of capital note | - | (32,770 | ) | - | ||||||||
| Interest Paid | (58,538 | ) | (42,012 | ) | (20,360 | ) | ||||||
| Redemption of notes | (94,994 | ) | (40,427 | ) | (38,904 | ) | ||||||
| Share purchase from non-controlling interests in subsidiary | (15,703 | ) | - | - | ||||||||
| Net cash generated by (used in) financing activities | (32,455 | ) | 60,552 | 281,556 | ||||||||
| Increase (decrease) in cash and cash equivalents | 98,386 | 13,644 | (154,810 | ) | ||||||||
| Cash and cash equivalents beginning of the year | 26,261 | 13,128 | 167,745 | |||||||||
| Net foreign exchange differences | (3,655 | ) | (511 | ) | 193 | |||||||
| Cash and cash equivalents end of the year | 120,992 | 26,261 | 13,128 | |||||||||
*Retroactively adjusted in respect of implementation of amendment to IAS17, see note 3a
The accompanying notes are an integral part of the consolidated financial statements
F - 10
HADERA PAPER LTD
NOTES TO CONSOLIDATED FINANCIAL STATEMENTS
NOTE 1 - DESCRIPTION OF BUSINESS AND GENERAL
| 1. | Description Of Business |
Hadera Paper Limited (former - American Israeli Paper Mills Limited) and its subsidiaries (hereafter – the Company) are engaged in the production and sale of packaging paper, in paper recycling activities, in the production and sale of printing and writing paper, in the production of packaging and cardboard products and in the marketing of office supplies. The Company also has holdings in associated companies that are engaged in sale of household paper products and the handling of solid waste (the Company and its investee companies – hereafter – the Group). Most of the Group's sales are made on the local (Israeli) market. For segment information, see note 21.
| 2. | Definitions: |
| The Company | - | Hadera Paper Limited. | |
| The Group | - | the Company and its Subsidiaries. | |
| Related Parties | - | as defined by IAS 24. | |
| Interested Parties | - | as defined in the Israeli Securities law and Regulations 1968. | |
| Controlling Shareholder | - | as defined in the Israeli Securities Regulations (Annual Financial Statements), 2010. | |
| NIS | - | New Israeli Shekel. | |
| CPI | - | the Israeli consumer price index. | |
| Dollar | - | the U.S. dollar. | |
| Subsidiaries | - | companies in which the Company control, (as defined by IAS 27) directly or indirectly, and whose financial statements are fully consolidated with those of the Company. | |
| Associated Companies | - | companies in which the Group has significant influence. | |
| Affiliated Companies | - | Subsidiaries and associated companies. | |
| Other companies | - | Group investees over which the Group has no control or material influence. |
NOTE 2 - SUMMARY OF SIGNIFICANT ACCOUNTING POLICIES
| A. | Applying International Accounting Standards (IFRS) |
Statement regarding the implementation of International Financial Reporting Standards (IFRS)
The consolidated financial statements have been prepared using accounting policies consistent with International Financial Reporting Standards (hereinafter – IFRS), and interpretations to them, that were published by the International Accounting Standards Board (IASB).
The principal accounting policies described in the following notes were applied in a manner consistent with previous reporting periods presented in these consolidated financial statements, except for changes in the accounting policy arising from the implementation of standards, amendments to standards and interpretation that entered into effect on the date of the financial statements, as specified in Note 3 below.
F - 11
HADERA PAPER LTD
NOTES TO CONSOLIDATED FINANCIAL STATEMENTS
NOTE 2 - SUMMARY OF SIGNIFICANT ACCOUNTING POLICIES (Cont.)
| B. | The financial statements are drawn up in accordance with the Israeli Securities Regulations (Annual Financial Statements), 2010 (hereinafter – "Financial Statements Regulations"). |
| C. | Presentation format of the statement on financial position |
The Group presents assets and liabilities on the statement of financial position separately under current and non-current items.
| D. | Basis of preparation |
Until December 31, 2003, Israel was considered a country in which hyper-inflation conditions exist. Therefore, non-monetary balances in the balance sheet were presented on the historical nominal amount and were adjusted to changes in the exchange rate of the U.S. dollar. As of December 31, 2003 when the economy ceases to be hyper-inflationary and the Company no longer adjusted its financial statements to the U.S. dollar, the adjusted amounts as of this date were used as the historical costs. The financial statements were edited on the basis of the historical cost, except for:
| · | The following assets and liabilities measured under fair value: financial assets available for sale financial instruments measured at fair value through profit or loss, investment property, financial derivatives and liabilities for share-based payment arrangements. |
| · | Inventories are stated at the lower of cost and net realizable value. |
| · | Property, plant and equipment and intangibles assets are presented at the lower of the cost less accumulated amortizations and the recoverable amount. |
| · | Liabilities to employees as described in note 2 AA below. |
| E. | Analysis format of expenses recognized on income statement |
Company expenses on the income statement are stated based on the nature of activity related to expenses by the entity.
| F. | Foreign currencies |
| (1) | Functional currency and presentation currency |
The individual financial statements of each Group entity are presented in the currency of the primary economic environment in which the entity operates (its functional currency). For the purpose of the consolidated financial statements, the results and financial position of each entity are expressed in the New Israeli Shekel ("NIS"), which is the functional currency of the Company and the presentation currency for the consolidated financial statements, see note 2CC (3) as follows with regard to the exchange rate and the changes in them during the reported period.
| (2) | Translation of transactions that are not in the functional currency |
In preparing the financial statements of the individual entities, transactions in currencies other than the entity’s functional currency (foreign currencies) are recorded at the rates of exchange prevailing at the dates of the transactions. At the end of each reporting period, monetary items denominated in foreign currencies are retranslated at the rates prevailing at that date. Non-monetary items carried at fair value that are denominated in foreign currencies are retranslated at the rates prevailing at the date when the fair value was determined. Non-monetary items that are measured in terms of historical cost are retranslated at the rates of exchange prevailing at the date of the transaction in respect of the non- monetary item.
F - 12
HADERA PAPER LTD
NOTES TO CONSOLIDATED FINANCIAL STATEMENTS
NOTE 2 - SUMMARY OF SIGNIFICANT ACCOUNTING POLICIES (Cont.)
| F. | Foreign currencies (cont.) |
| (3) | Method of recognizing exchange rate differentials |
Exchange differences are recognized in profit or loss in the period which they were created, except for exchange differences on transactions entered into in order to hedge certain foreign currency risks (Hedge accounting details are set out in Note 2u below) and for Exchange rate differences with respect to loans denominated in a currency other than NIS which are directly attributable to acquisition, construction or manufacturing of qualifying assets (see note 2q below).
| (4) | Translation of financial statements of affiliated companies whose functional currency is not the New Israeli Shekel (NIS). |
For the purpose of presenting consolidated financial statements, the assets and liabilities of the Group’s foreign operations of associated company (mainly because of it's investment in a subsidiary company that presents it's financial statements in foreign currency) are expressed in NIS using exchange rates prevailing for the end of the reporting period. Income and expense items are translated at the average exchange rates for the period, unless exchange rates fluctuated significantly during that period, in which case the exchange rates at the dates of the transactions are used and related translation differences, are recognized on other comprehensive income under "Share of comprehensive loss of associates, net of tax" and are charged to the income statement upon net realization of foreign operations with respect to which these translation differences were created.
| G. | Cash and cash equivalents |
Cash and cash equivalents include deposits that can be withdrawn anytime as well as short-term bank deposits that are not restricted in use, with a maturity of three months.
Deposits that are restricted in use or whose maturity at the time of investment is greater than three months but less than one year are classified under designated deposits, under current assets.
| H. | Consolidated Financial Statements |
| (1) | General |
The consolidated financial statements incorporate the financial statements of the Company and entities controlled by the Company (its subsidiaries). Control is achieved where the Company has the power to govern the financial and operating policies of an entity so as to obtain benefits from its activities.
The results of subsidiaries acquired or disposed of during the year are included in the consolidated income statement from the effective date of acquisition or up to the effective date of disposal, as appropriate.
Where necessary, adjustments are made to the financial statements of subsidiaries to bring their accounting policies into line with those used by other members of the Group.
All intra-group transactions, balances, income and expenses are eliminated in full on consolidation.
F - 13
HADERA PAPER LTD
NOTES TO CONSOLIDATED FINANCIAL STATEMENTS
NOTE 2 - SUMMARY OF SIGNIFICANT ACCOUNTING POLICIES (Cont.)
| H. | Consolidated Financial Statements (cont.) |
| (2) | Non –controlling interests |
Non –controlling interests in net assets excluding goodwill of consolidated subsidiaries are presented separately under the Group's shareholders' equity. Non –controlling interests include the sum of these interests on the date of the business combination (see below) as well as the share of minority Non –controlling interests in the changes that occurred in the capital of the consolidated company subsequent to the date of the business combination.
Losses of subsidiaries, applicable to non-controlling interests that exceed the non-controlling interests in the subsidiary's equity, are allocated to non-controlling interest, while ignoring the obligations and abilities of those minority-interest holders to make additional investments in the subsidiary. The results of transactions with non-controlling interests, concerning the partial divestiture of the group's investment in the subsidiary, while control is retained, are attributed to equity of the owners of the parent company.
In transactions with non-controlling interests, where additional shares in the subsidiary are acquired after control is obtained, the excess cost of acquisition over the carrying value of the non-controlling interests on the acquisition date is attributed to the equity of the owners of the parent company.
Where a put option is granted to non-controlling interests, the option is measured at present value of expected future payments. The put option is charged against non-controlling interest.
| I. | Business combinations |
Acquisition of activities and subsidiaries that constitute a business combination, are measured by using the acquisition method. The cost of the business combination is measured as the aggregate of the fair values (on the date of exchange) of the assets given, the liabilities incurred or assumed, the equity instruments issued by the group in exchange for obtaining control in the acquire, the fair value of the group's holdings in the acquired entity prior to the business combination
Transaction costs that are directly related to the business combination, are recognized in profit or loss as incurred.
The acquirer's identifiable assets and liabilities, which satisfy the recognition conditions in accordance with IFRS 3 (Revised) "Business Combinations" are recognized at fair value on the acquisition date, except for several types of assets, which are measured in accordance with the provisions of the relating standards.
Goodwill arising from the acquisition of a subsidiary is measured as the excess of the cost of acquisition, over the net fair value of the identifiable assets, liabilities and contingent liabilities of the subsidiary, that were recognized on the acquisitions date. If, after revaluation, the group's net interest in the net fair value of the identifiable assets, liabilities and contingent liabilities exceeds the cost of the business combination is immediately recognized in profit or loss.
Non-controlling interests in the acquire are initially measured at their acquisition-date fair value of the assets, liabilities and contingent liabilities of the acquired entity, excluding their share in the goodwill. Regarding the accounting treatment of non-controlling interests, see Note 2h 2.
F - 14
HADERA PAPER LTD
NOTES TO CONSOLIDATED FINANCIAL STATEMENTS
NOTE 2 - SUMMARY OF SIGNIFICANT ACCOUNTING POLICIES (Cont.)
| I. | Business combinations (Cont.) |
In business combinations, where control is obtained after several acquisitions (acquisition in stages), the acquiree's assets, liabilities and contingent liabilities are measured at fair value on the date control is obtained, while the difference between the carrying value of the company's holdings in the acquired entity prior to the business combination and their fair value on the business combination date is recognized in the statement of income, in the section of "other income" under profit from ordinary operation.
Regarding the effect of the initial implementation of IFRS 3 (Revised) "Business Combinations" on the Group's financial statements, see Note3a.
Regarding the publication of IFRS 3 (Revised) "Business Combinations" as part of the IASB's 2010 Annual Improvements Project, see Note 3c.
| J. | Investment in associated companies |
An associated company is an entity over which the Group has significant influence and that is neither a subsidiary nor an interest in joint venture. Significant influence is the power to participate in the financial and operating policy decisions of the investee but is not control or joint control over those policies.
The financial statements of the associated companies adapted to the accounting policies of the group.
The results and assets and liabilities of associates are incorporated in these financial statements using the equity method of accounting. Under the equity method, investments in associates are carried in the consolidated balance sheet at cost as adjusted for post-acquisition change in the Group's share of the net assets, including capital reserves, of the associate, less any impairment in the value of individual investments. Losses of an associate in excess of the Group's interests in that associate (which includes any long-term interest that, in substance, form part of the Group's net investment in the associate) are recognized only to the extent that the Group has incurred legal or constructive obligations or made payments on behalf of the associate.
Where a group entity transacts with an associate of the Group material, profits and losses are eliminated to the extent of the Group's interest in the relevant associate.
As for revision to IAS 28 "Investments in associates", in conjunction with the effective start date of IAS 27 (Revised) "Consolidated and separate financial statements", see Note 3b.
| K. | Goodwill |
Goodwill arising on the acquisition of a subsidiary represents the excess of the cost of acquisition over the Company’s interest in the net fair value of the identifiable assets, liabilities and contingent liabilities of the subsidiary recognized.
Goodwill is initially recognized as an asset at cost and is subsequently measured at cost less any accumulated impairment losses.
For the purpose of impairment testing, goodwill is allocated to each of the Group’s cash-generating units expected to benefit from the synergies of the combination. Cash-generating units to which goodwill has been allocated are tested for impairment annually, or more frequently when there is an indication that the unit may be impaired. If the recoverable amount of the cash-generating unit is less than the carrying amount of the unit, the impairment loss is allocated first to reduce the carrying amount of any goodwill allocated to the unit and then, the remaining impairment loss is allocated to the other assets of the unit pro-rata on the basis of the carrying amount of each asset in the unit. An impairment loss recognized for goodwill is not reversed in a subsequent period.
F - 15
HADERA PAPER LTD
NOTES TO CONSOLIDATED FINANCIAL STATEMENTS
NOTE 2 - SUMMARY OF SIGNIFICANT ACCOUNTING POLICIES (Cont.)
| K. | Goodwill (Cont.) |
On disposal of a subsidiary, the attributable amount of goodwill is included in the determination of the profit or loss of disposal.
Regarding the amendment of IAS 36 as part of the IASB's annual improvements project for 2009, with respect to allocation of goodwill for the purpose of impairment, see note 3b, below.
As to the publication of IFRS 3 (amended) "Business Combinations" see note 3a below.
| L. | Property, plant and equipment |
| 1) | General |
Property, plant and equipments are tangible items, which are held for use in the manufacture or supply of goods or services, or leased to others, which are predicted to be used for more than one period. The Company presents its property, plant and equipments items according to the following method:
Under the cost method - a property, plant and equipment are presented at the balance sheet at cost (net of any investment grants), less any accumulated depreciation and any accumulated impairment losses. The cost includes the cost of the asset's acquisition as well as costs that can be directly attributable to bringing the asset to the location and condition necessary for it to be capable of operating in the manner intended by management. The cost of qualifying assets also includes borrowing costs that should be capitalized as stated in Note 2q, below.
| 2) | Reduction of fixed assets |
Depreciation is calculated using the straight-line method at rates considered adequate to depreciate the assets over their estimated useful lives. The depreciation starts once the asset is ready for use and takes into consideration of the anticipated scrap value at the end of the asset's useful lives.
Spare parts which are not used on a current basis are designated for use in the context of items of fixed assets, where necessary. The reason for holding them is to prevent delays in the manufacturing process and to avoid a shortage in spare parts in the future. The spare parts that are not used on a current basis have not been installed on items of fixed assets and are, therefore, not available for use in their present state. In the light of this, spare parts that are not being used currently are presented with fixed assets and are depreciated at the date that they are installed on the items of fixed assets.
Assets leased under financial leases are amortized over their expected useful life on the same basis as owned assets, or over the term of the lease - whichever is shorter.
| The annual depreciation and amortization rates are: | Useful life length |
| Buildings | 10-50 |
| Machinery and equipment | 7-20 |
| Motor vehicles | 5-7 |
| Office furniture and equipment | 3-17 |
Scrap value, depreciation method and the assets useful lives are being reviewed by management in the end of every financial year. Changes are handled as a change of estimation and are applied from here on.
The gain or loss arising on the disposal or retirement of an item of property, plant and equipment is determined as the difference between the sales proceeds and the carrying amount of the asset and is recognized in income statement.
F - 16
HADERA PAPER LTD
NOTES TO CONSOLIDATED FINANCIAL STATEMENTS
NOTE 2 - SUMMARY OF SIGNIFICANT ACCOUNTING POLICIES (Cont.)
| M. | Investment property |
Investment property is property ( land or building or a part of building or both) held by the group and leased to an associate company for the purpose of its activities and not for use in the production or supply of goods or services or for administrative purposes, or sale during the ordinary course of business. The Group's investment property includes buildings and lands under financial lease. Real estate for investment is initially recognized at a cost that includes the transaction costs. In periods subsequent to initial recognition, investment property is measured at fair value. Profits or losses arising from changes in the fair value of investment property are recognized in the statement of income in the period in which they are created, under "Other income (expenses), net".
| N. | Intangible assets, except for goodwill |
Intangible assets are identifiable, non-monetary assets which have no physical essence.
Intangible assets with a definite useful life are amortized using the straight line method over the estimated useful life of the assets subject to an impairment test. The accounting treatment of the change in the estimated useful life of an intangible asset with a finite life is carried out prospectively.
As to the accounting treatment of goodwill see note 2k, above.
The useful life which is used to amortize intangible assets with a finite useful life is as follows:
| Customer relations | 5-10 years | |
| Software | 3 years |
The group's intangible assets are recognized and measured in accordance with the manner in which they were created and were all acquired as part of a business combination.
Intangible assets acquired under a business combination are identified and recognized separately from goodwill when the meet with the definition of intangible asset and their fair value can be measured reliably. The cost of these intangible assets is their fair value on the date of the business combination.
In subsequent periods to the initial recognition, intangible assets acquired under a business combination are presented at cost less any accumulated amortization and subsequent accumulated impairment loss. The amortization of intangible assets with a finite life is calculated based on the straight line method over the estimated useful life of these assets. The estimated useful life and method of amortization are tested at the end of each reporting year while the effect of changes in the estimates useful life is accounted for prospectively.
As to the publication of IFRS 3 (amended) "Business Combinations" see note 3A below.
| O. | Impairment of value of tangible and intangible assets, excluding goodwill |
At the end of each reporting period, the Group examines the book value of its tangible and intangible assets, other than inventory for the purpose of determining whether there are any indications that point towards losses from impairment of value of these assets. Should there be any such indications, the recoverable amount of the asset is estimated for the purpose of determining the amount of the loss from impairment of value that was created, if at all. If it is not possible to estimate the recoverable value of an individual asset, the Group estimates the recoverable value of the cash- generating unit to which the asset is relevant. Shared assets are also allocated to individual cash generating units to the extent that a reasonable and consistent basis can be identified for such allotment. Should allocating the shared assets to individual cash generating units on the above basis not be feasible, the shared assets are allocated to the smallest groups of cash generating units as to which a reasonable and consistent basis for allocation can be identified.
F - 17
HADERA PAPER LTD
NOTES TO CONSOLIDATED FINANCIAL STATEMENTS
NOTE 2 - SUMMARY OF SIGNIFICANT ACCOUNTING POLICIES (Cont.)
| O. | Impairment of value of tangible and intangible assets, excluding goodwill (Cont.) |
Intangible assets with an indefinite useful life and intangible assets that are still not available for use are tested for impairment once a year or more frequently if indications exist that there may a decline in the value of the asset.
The recoverable amount is the higher of the sales price of the asset, less selling costs, and of its utility value. In estimating utility value, an approximation of future cash flows is discounted to their present value, using a pre- tax discount rate which reflects the current market estimates of the value of money over time and the specific risks for the asset for which the estimate of future cash flows has not been adjusted.
If the carrying value of the asset (or of the cash generating unit) exceeds recoverable amount, the book value of the asset (or of the cash generating unit) is reduced to its recoverable amount. The impairment loss is recognized immediately to as an expense in the statement of income.
If an impairment loss that was recognized in previous periods is reversed, the book value of the asset (or of the cash generating unit) will be restored back to the estimate of the up to date recoverable value but not to exceed the book value of the asset (or of the cash generating unit) that would have existed, had a related impairment loss not been recognized in prior periods. The reversal of the loss from impairment of value is immediately recognized in the statement of income.
As to the impairment of goodwill see note 2k, above.
As to the impairment of investment in an associated company, see note 2p, below.
| P. | Impairment of equity-accounted investments |
The Group reviews existence of indications of impairment of equity-accounted investments. Such impairment occurs when objective evidence indicates that expected future cash flows from such investment have been negatively impacted.
Review for impairment of an investment is conducted with reference to the investment as a whole. Therefore, recognized impairment loss from the investment is not attributed to assets comprising the investment account, including goodwill, but is attributed to the investment as a whole; therefore, the Group recognizes reversal of recognized loss with respect to equity-accounted investments, if their recoverable amount has increased.
| Q. | Borrowing costs |
Borrowing costs directly attributable to the acquisition, construction or production of qualifying assets, which are assets that necessarily take a substantial period of time to get ready for their intended use or sale, are assed to the costs of those assets, until such time as the assets are substantially ready for their intended use or sale. Exchange rate differences with respect to loans denominated in currencies other than NIS are capitalized to the cost of said assets to such extent as to be deemed as adjustments to interest cost.
Investment income earned on the temporary investment of specific borrowings pending their expenditure on qualifying assets is deducted from the borrowing costs eligible for capitalization.
The rest of the borrowing costs are recognized in the income statement on the date they were incurred.
F - 18
HADERA PAPER LTD
NOTES TO CONSOLIDATED FINANCIAL STATEMENTS
NOTE 2 - SUMMARY OF SIGNIFICANT ACCOUNTING POLICIES (Cont.)
| R. | Inventories |
Inventories are assets held for sale in the ordinary course of business, in the process of production for such sale or in the form of materials or supplies to be consumed in the production process or in the rendering of services.
Inventories are stated at the lower of cost and net realizable value. Cost of inventories includes all the cost of purchase, direct labor, fixed and variable production over heads and other cost that are incurred, in bringing the inventories to their present location and condition.
Net realizable value is the estimated selling price in the ordinary course of business less the estimated costs of completion and the estimated costs necessary to make the sale.
Inventories that purchased on differed settlement terms, which contains a financing element, are stated in purchase price for normal credit terms. The difference between the purchase price for normal credit terms and the amount paid is recognized as interest expense over the period of the financing.
Cost determined as follows:
| Raw, auxiliary materials and others | - Based on weighted-average basis. |
Finished products and products in process | - Based on overhead absorption costing. At cost, calculated based on the absorption pricing of production costs incurred during the production of finished goods |
| Products | - Based on weighted –average basis. |
The spare parts that are in continuous use, are not associated with the specific fixed assets. Some of these spare parts are even sold to the Group's associated companies, as needed, and are part of the inventory. Based on the experience accumulated by the Company, these spare parts are held for no longer than 12 months. In light of the above, the spare parts that are in continuous use are presented in inventory clause, and recognized in the profit and loss report when used.
| S. | Financial assets |
| (1) | General |
Financial assets are recognized in the statement of financial position of the Company when the Company becomes a party to the contractual terms of the instrument. Investments are recognized and derecognized on trade date (the date on which the Group has a commitment to buy or sell an asset) where the purchase or sale of an investment is under a contract whose terms require delivery of the investment within the timeframe established by the market concerned, and are initially measured at fair value, plus transaction costs, except for those financial assets classified as at fair value through profit or loss, which are initially measured at fair value.
Financial assets are classified into loans and receivables, financial assets through profit and loss and financial assets available for sale. The classification of those categories arises from the reason of the financial asset holding and it is determined at its initial recognition.
Regarding the amendment of IFRS7, Financial Instruments: Disclosures", see note 3c below.
Regarding the amendment of IAS39 "Financial Instruments: Recognition and Measurement", as part of the IASB's annual improvements project for 2009 regarding the date of implementation of the standard, see Note 3b, below.
As to the publication of IFRS 9 "Financial assets" see note 3C below.
F - 19
HADERA PAPER LTD
NOTES TO CONSOLIDATED FINANCIAL STATEMENTS
NOTE 2 - SUMMARY OF SIGNIFICANT ACCOUNTING POLICIES (Cont.)
| S. | Financial assets (Cont.) |
| (2) | Loans and receivables |
Trade receivables, loans, and other receivables that have fixed or determinable payments that are not quoted in an active market are classified as loans and receivables. Loans and receivables are measured at amortized cost using the effective interest method, less any impairment. Interest income is recognized by applying the effective interest rate, except for short-term receivables when the recognition of interest would be immaterial.
| (3) | Financial assets at Fair Value through Profit and Loss (FVTPL) |
Financial assets are classified as at FVTPL where the financial asset is either held for trading or it is designated as at FVTPL.
A financial asset is classified as held for trading if:
| ● | It has been acquired principally for the purpose of selling in the near future; or |
● | It is a part of an identified portfolio of financial instruments that the Group manages together and has a recent actual pattern of short-term profit-taking; or |
● | It is a derivative that is not designated and effective as a hedging instrument. |
The Company has derivatives that are not designated and effective as hedging instruments, and which are presented at fair value. Each profit or loss arising from changes in the fair value, including those originating from changes in exchange rates, is recognized in the statement of income in the period in which the change occurred.
| (4) | Financial assets available for sale |
Investments in non-marketable equity instruments (shares), which are not derivative financial instruments and which were not classified as financial assets at fair value through profit and loss, as investments held for maturity or as loans and receivables, are classified as available-for-sale financial assets, and are presented at their fair value.
Profit or losses arising from changes in fair value are recognized in other comprehensive income as "profit (losses) in respect of available-for-sale financial assets", except for impairment losses which, under certain conditions, are recognized in the statement of income.
Upon the disposal of investments in, or impairment of financial assets, the profits or losses which have accumulated until the date of disposal or impairment, as the case may be, and which were recognized in other comprehensive income, are reclassified to profit and loss in the period in which the disposal or impairment occurred.
Income from dividends in respect of investment in available-for-sale equity instruments are recognized in the statement of income when the group becomes entitled to receive payments in respect thereof.
| (5) | Impairment of financial assets |
Financial assets, except for financial assets classified as at fair value through profit or loss, are assessed for indicators of impairment at each balance sheet date.
Financial assets are impaired where there is objective evidence that, as a result of one or more events that occurred after the initial recognition of the financial asset, the estimated future cash flows of the investment have been impacted.
For investments in equity instruments classified as available-for-sale, a significant or prolonged decline in fair value below cost is an indication of impairment. For other financial instruments, indications of impairment may include:
F - 20
HADERA PAPER LTD
NOTES TO CONSOLIDATED FINANCIAL STATEMENTS
NOTE 2 - SUMMARY OF SIGNIFICANT ACCOUNTING POLICIES (Cont.)
| S. | Financial assets (Cont.) |
| (5) | Impairment of financial assets (cont.) |
● | Significant financial difficulty of the issuer or counterparty; or |
● | Default or delinquency in interest or principal payments; or |
● | It becoming probable that the borrower will enter bankruptcy or financial re-organization. |
For certain financial assets, such as customers as to which no indications of value impairment have been identified, the company evaluates value impairment on a specific basis, in reliance on past experience for groups of receivables with similar attributes and changes in the level of delinquency in payments, as well as economic changes related to the sector and the economic environment in which it operates.
When there is objective evidence of such impairment, for available-for-sale financial assets, the cumulative loss recognized under other comprehensive income due to impairment of fair value of these financial assets, is re-classified to the income statement. Impairment loss thus recognized on the income statement with respect to investment in equity instruments classified as available for sale, are not reversed on the income statement. Any increase in fair value of investments in equity instruments classified as available for sale in periods subsequent to the period in which impairment loss was recognized, is charged to other comprehensive income.
With the exception of equity instruments classified as available for sale, if in a subsequent period the impairment amount of a financial asset decreases, and said decrease is objectively related to an event which occurred after impairment had been recognized, then the previously recognized impairment loss is reversed, in full or in part, on the income statement. The carrying amount of the investment in the asset upon reversal of impairment loss shall not exceed the amortized cost of said asset as of that date had no impairment been previously recognized.
Impairment loss on financial assets is allocated to reduce the carrying amount of the financial asset, except for impairment losses of accounts receivable and trade receivables, which is carried to a provision account. The write-off of uncollectible debt is carried to the provision account.
Subsequent recoveries of amounts previously written off are credited against the allowance account. Changes in the carrying amount of the allowance account are recognized the income statement.
| T. | Financial liabilities and equity instruments issued by the Group |
| (1) | Classification as debt or equity |
Debt and equity instruments are classified as either financial liabilities or as equity in accordance with the substance of the contractual arrangement.
An equity instrument is any contract that evidences a residual interest in the assets of an entity after deducting all of its liabilities. Equity instruments issued by the Group are recorded at the proceeds received, net of direct issue costs.
Financial liabilities are classified as either financial liabilities "at FVTPL" or "Other financial liabilities".
F - 21
HADERA PAPER LTD
NOTES TO CONSOLIDATED FINANCIAL STATEMENTS
NOTE 2 - SUMMARY OF SIGNIFICANT ACCOUNTING POLICIES (Cont.)
| T. | Financial liabilities and equity instruments issued by the Group (Cont.) |
| (2) | Options to sell shares of an associated company |
Until December 31, 2010, the company had a liability, which stems from an option that was given for the sale of shares of an associated company, which provide the holder thereof with the right to sell its holdings in the associated company in consideration of a variable amount of cash.
The value of the option was computed according to the economic value of the option and it was presented with current liabilities, and was classified as a liability at fair value through profit and loss.
Any gain or loss that results from changes in the fair value of the option was recognized in the income statement.
On December 31, 2010, upon the rise in the holding in shares in 25.1% of the associate and its initial consolidation as set forth in Note 17, the option to non-controlling interests remained in effect and was adjusted for the new holding structure. This option is blocked for 36 months after the acquisition date.
The option is measured as a liability at the present value of the payment amount of the option, and is presented under long-term liabilities. Changes in its value are recognized in the income statement.
For additional details on the terms of the options, see note 17 below.
| (3) | CPI-linked liabilities |
The group has liabilities that are linked to the Consumer Price Index (hereinafter – the CPI), which are not measured at fair value under the statement of income. The Company determines the effective interest rate in respect of these liabilities as a real rate with the addition of linkage differences in line with actual changes in the CPI until the end of the reporting period.
| (4) | Extinguishing Financial liabilities |
A financial liability is extinguished when, and only when. It is settled- i.e. when the obligation defined in the contract is settled, cancelled or expires.
| U. | Derivative financial instruments and Hedge Accounting |
| (1) | General |
The Group enters into a variety of derivative financial instruments to manage its exposure to foreign exchange rate risk, including foreign exchange forward contracts on exchange rate, options on exchange rate and contracts on the CPI due to notes.
Derivatives are initially recognized at fair value at the date a derivative contract is entered into and are subsequently premeasured to their fair value at the end of each period. The resulting gain or loss is recognized in profit or loss immediately unless the derivative is designated and effective as a hedging instrument, in which event the timing of the recognition in profit or loss depends on the nature of the hedge relationship, as detailed in section 2 below.
The classification of derivative financial instruments used for hedging purposes in the statement of financial position is determined based on the contractual term of the derivative financial instrument.
A derivative is presented as a non-current asset or a non-current liability if the remaining maturity of the instrument is more than 12 months other derivatives are presented as current assets or current liabilities.
Regarding the amendment of IFRS7, "Financial Instruments: Disclosures", see note 3c below.
F - 22
HADERA PAPER LTD
NOTES TO CONSOLIDATED FINANCIAL STATEMENTS
NOTE 2 - SUMMARY OF SIGNIFICANT ACCOUNTING POLICIES (Cont.)
| U. | Derivative financial instruments and Hedge Accounting (Cont.) |
| (2) | Hedge accounting |
The Group designates certain hedging instruments, which include derivatives, and non-derivatives in respect of foreign currency risk, as cash flow hedges.
At the inception of the hedge relationship, the entity documents the relationship between the hedging instrument and the hedged item, along with its risk management objectives and its strategy for undertaking various hedge transactions. Furthermore, at the inception of the hedge and on an ongoing basis, the Group documents whether the hedging instrument that is used in a hedging relationship is highly effective in offsetting changes in fair values or cash flows of the hedged item.
The classification in the statement of financial position of hedging instruments is determined in accordance with the remaining life of the hedging relationship, at the end of the reporting period – if at the end of the reporting period the remaining life of the hedging relationship exceeds 12 months, the hedging instrument is recognized in the statement of financing position as a non-current asset or liability. If at the end of the reporting period the remaining life of the hedging relationship does not exceed 12 months, the hedging instrument is classified in the statement of financial position as a current asset or liability.
The Group implements cash flow hedge accounting both in respect of future transactions, foreign currency deposits and options transactions on foreign currency that are designed to secure payments for the acquisition of fixed assets in foreign currency in respect of future transactions for the purchase or sale of foreign currency that are designed to secure payments for imports and which are linked to foreign currency and in respect of future transaction on the Consumer Price Index, which are designed to secure payments on CPI-linked bonds.
The effective part of the changes in the value of financial instruments designed for cash flow hedging is in recognized in the other comprehensive income under "Profit (loss) in respect of cash flow hedging" and the non-effective part is immediately recognized in the statement of income.
Hedge accounting for cash flows is discontinued when the hedging instrument expires, sold or realized of when the hedging relations no longer meet the threshold conditions for hedging. After the discontinuation of hedge accounting, the amounts carried to the other comprehensive income are carried to the income statement while the hedged item or the hedged projected transactions are recorded in the income statement.
When hedging a forecasted transaction on non-monetary assets (fixed assets), the profits or losses that were carried in the other comprehensive income, are carried to the initial cost of the hedged item immediately upon the initial recognition of said item and recorded in the income statement over the period of amortization of the fixed assets in respect of which it was recorded.
Regarding the amendment of IAS39 "Financial Instruments: Recognition and Measurement" as part of the IASB's annual improvements project for 2009 regarding the recognition in profit and loss of gains (losses) included in other comprehensive income due to changes in the value of hedging instruments, see Note 3B, below.
F - 23
HADERA PAPER LTD
NOTES TO CONSOLIDATED FINANCIAL STATEMENTS
NOTE 2 - SUMMARY OF SIGNIFICANT ACCOUNTING POLICIES (Cont.)
| V. | Revenue recognition |
Revenue is measured at the fair value of the consideration received or receivable. Revenue is reduced for estimated customer returns, rebates and other similar allowances.
| (1) | Sale of goods |
Revenue from the sale of goods is recognised when all the following conditions are satisfied:
| · | The Group has transferred to the buyer the significant risks and rewards of ownership of the goods; |
| · | The Group retains neither continuing managerial involvement to the degree usually associated with ownership nor effective control over the goods sold |
| · | The amount of revenue can be reliably measured; |
| · | It is probable that the economic benefits associated with the transaction will flow to the entity; and |
| · | The costs incurred or to be incurred in respect of the transaction can be reliably measured. |
| (2) | Revenue from recycling services |
Recycling services revenue is recognized when all the following conditions are satisfied:
| · | The amount of revenue can be reliably measured |
| · | It is probable that the economic benefits associated with the transaction will flow to the entity, as well as |
| · | The company performed the service in question |
| · | The costs incurred or to be incurred in respect of the transaction can be reliably measured. |
| (3) | Interest revenue |
Interest revenue is accrued on a time basis, by reference to the principal outstanding and by using the effective interest rate method.
| (4) | Dividends |
Revenue is recognized when the Group's right to receive the payment is established.
| (5) | Reporting of revenues on a gross basis or a net basis |
The Company's revenues as an agency or intermediary from providing electricity, water, steam, and logistical services to the Group without bearing the risks and returns that derive from the transaction are presented on a net basis.
| W. | Leasing |
| (1) | General |
Leases are classified as finance leases whenever the term of the lease transfer substantially all the risks and rewinds of ownership to the lessee. All other leases are classified as operating leases.
| (2) | Lease of equipment, land and buildings from the Group |
Operating lease
Lease income from an operating lease is recognized on the straight line basis over the leasing period. In operating lease agreements where no lease payments or reduced lease payments are received at the inception of the lease period, and additional benefits are provided to the lessor, the group recognized income on the straight line basis over the lease period.
F - 24
HADERA PAPER LTD
NOTES TO CONSOLIDATED FINANCIAL STATEMENTS
NOTE 2 - SUMMARY OF SIGNIFICANT ACCOUNTING POLICIES (Cont.)
| W. | Leasing (Cont.) |
| (3) | Lease of land, vehicles and buildings by the Group |
Financial lease
Lease of land (which is not investment property measured at fair value) from the Israel Land Administration, the payment for which is made periodically, are classified as financial lease. At the commencement of the lease period, the group includes the leased asset in "fixed assets" and recognizes a corresponding liability at the lower of the fair value of the land and the current value of the minimum lease payments. In subsequent periods, the liability is accounted for as stated above and the land is amortized over the remaining period of the lease according to the straight line basis, including the extension option.
Lease of land (which is not investment property measured at fair value) from the Israel Land Administration, with pre-paid lease payments are classified as financial lease. The deferred lease payments, which were paid at the commencement of the lease period, are presented in the statement of financial position in "fixed assets" and amortized at the straight line basis over the remaining period of the lease, including the extension option.
Operating lease
Lease of land from Tel–Aviv municipality, which do not meet the terms of classification as financial lease pursuant to the standard, are classified as operating lease. The deferred lease payments, which were paid at the commencement of the lease period, are presented in the statement of financial position in "prepaid-expenses in respect of an operating lease" and amortized at the straight line basis over the remaining period of the lease, including the extension option.
Lease expenses in respect of an operating lease are recognized at the straight line basis over the lease period.
Regarding the classification of operating leases as investment property assets, which is measured at fair value, see Note 8.
As for the publication of the amendment to IAS17 "leases", as part of the IABS's annual improvements project for 2009, see note 3a below.
| X. | Provisions |
Provisions are recognized when the Group has a present obligation (legal or constructive) as a result of a past event, it is probable that the Group will be required to settle the obligation, and a reliable estimate can be made of the amount of the obligation.
The amount recognized as a provision is the best estimate of the consideration required to settle the present obligation at the end of reporting period, taking into account the risks and uncertainties surrounding the obligation.
Where a provision is measured using the cash flows estimated to settle the present obligation, its carrying amount is the present value of those cash flows. Changes due to time value are charged to the income statement.
When some or all of the economic benefits required to settle a provision are expected to be recovered from a third party, the receivable is recognized as an asset if it is virtually certain that reimbursement will be received and the amount of the receivable can be measured reliably.
| Y. | Share - Based payments |
Equity-settled share based payments to employees and others providing similar services are measured at the fair value of the equity instruments at the grant date.
The Group determines the fair value of equity-settled share-based transaction according to the Black-Scholes model. (Details regarding the determination of the fair value of share-based transactions are set out in note 12).
The Group recognizes share-based payment arrangements in the financial statements over the term of the vesting period against an increase in shareholders' equity, under the item "Capital reserve for share-based payment".
F - 25
HADERA PAPER LTD
NOTES TO CONSOLIDATED FINANCIAL STATEMENTS
NOTE 2 - SUMMARY OF SIGNIFICANT ACCOUNTING POLICIES (Cont.)
| Y. | Share - Based payments (Cont.) |
At each end of reporting period date, the Group revises its estimate of the number of equity instruments expected to vest. The impact of the revision of the original estimates, if any, is recognized in profit or loss over the remaining vesting period.
| Z. | Taxation |
| (1) | General |
Income tax expense represents the sum of the tax currently payable and change in deferred tax excluding deferred tax as result of transaction that was attribute directly to the equity.
| (2) | Current tax |
The tax currently payable is based on taxable profit of the company and its subsidiaries for the reporting period. Taxable profit differs from profit as reported in the income statement because it excludes items of income or expense that are taxable or deductible in other years and it further excludes items that are never taxable or deductible. The Group’s liability for current tax is calculated using tax rates that have been enacted or substantively enacted by the end of reporting period.
Current tax assets and liabilities are stated with offset, when the entity has an enforceable legal right to offset the recognized amounts, as well as the intention to discharge on net basis, or to realize the asset and discharge the liability concurrently.
| (3) | Deferred tax |
Deferred tax is recognised on differences between the carrying amounts of assets and liabilities in the financial statements.
Deferred tax assets and liabilities are measured at the tax rates that are expected to apply in the period in which the liability is settled or the asset realised, based on tax rates (and tax laws) that have been enacted or substantively enacted by the end of the reporting period.
Deferred tax liabilities are generally recognised for all taxable temporary differences, and deferred tax assets are generally recognised for all deductible temporary differences to the extent that it is probable that taxable profits will be available against which those deductible temporary differences can be utilised. The Group does not generate deferred taxes with respect to temporary differences due to initial recognition of goodwill.
In calculating the deferred taxes, the taxes that would have applied in the event of a realization of investments in investee companies are not taken into consideration, since it is the Group's intention to hold and develop these investments. Deferred taxes on account of the distribution of earnings at these investee companies are also not taken into consideration, since it is the Group's policy not to distribute any dividends that are liable for taxes in the foreseeable future.
Deferred tax assets and liabilities are offset when there is a legally enforceable right to set off current tax assets against current tax liabilities and when they relate to income taxes levied by the same taxation authority and the Group intends to settle its current tax assets and liabilities on a net basis.
| AA. | Employee benefits |
| (1) | Post-Employment Benefits |
The Group's post-employment benefits include: benefits to retirees and liabilities for severance and retirement benefits. The Group's post-employment benefits are classified as either defined contribution plans or defined benefit plans. Most of the Group's employees have signed Section 14 to the Severance Law, 1963, pursuant to which the Group's regular deposits with pension funds and/or insurance policies exempt it from any further obligations to the workers, for whom said amounts were deposited. The Group's deposits under the Defined Contribution Plan are carried to the income statements on the date of the provision of work services, in respect of which the Group is obligated to make the deposit and no additional provision in the financial statements is required.
F - 26
HADERA PAPER LTD
NOTES TO CONSOLIDATED FINANCIAL STATEMENTS
NOTE 2 - SUMMARY OF SIGNIFICANT ACCOUNTING POLICIES (Cont.)
| AA. | Employee benefits (Cont.) |
| (1) | Post-Employment Benefits (Cont.) |
Expenses in respect of a Defined Benefit Plan are carried to the income statement in accordance with the Projected Unit Credit Method, while using actuarial estimates that are performed at the end of each reporting period. The current value of the Group's obligation in respect of the defined benefit plan is determined by discounting the future projected cash flows from the plan by the market yields on government bonds, denominated in the currency in which the benefits in respect of the plan will be paid, and whose redemption periods are approximately identical to the projected settlement dates of the plan.
Actuarial profits and losses are carried to the other comprehensive income on the date they were incurred. The Past Service Cost is immediately recognized in the Group's income statement to the extent the benefit has vested.
The Group's liability in respect of the Defined Benefit Plan which is presented in the Group's statement of financial position includes the current value of the obligation in respect of the defined benefit, net of the fair value of the plan's assets
| (2) | Short term employee benefits |
Short term employee benefits are benefits which are going to be paid during a period that does not exceed 12 months from the end of the period in which the service that creates entitlement to the benefit was provided.
Short term company benefits include the Group's liability for short term absences, vacations, payment of grants, bonuses, double profit and compensation. These benefits are recorded to the income statement, on a non capitalized basis, which the company is expected to pay when created. The benefits are measured on a non capitalized basis. The difference between the amount of the short term benefits to which the employee is entitled and the amount paid is therefore recognized as an asset or liability.
| BB. | Net income per share |
The computation of basic net income per share is generally based on earnings available for distribution to holders of ordinary shares, divided by the weighted average number of ordinary shares outstanding during the period.
In computing diluted net income per share, the weighted average number of shares to be issued, assuming that all dilutive potential shares are converted into shares, is to be added to the average number of ordinary shares used in the computation of the basic income (loss) per share. Potential shares are taken into account, as above, only when their effect is dilutive.
| CC. | Exchange Rates and Linkage Basis |
| (1) | Foreign currency balance, or balances linked to foreign currency are included in the financial statements according to the exchange rate announced by the Bank of Israel at the end of reporting period. |
| (2) | Balances linked to the CPI are presented according to index of the last month of the report period. |
F - 27
HADERA PAPER LTD
NOTES TO CONSOLIDATED FINANCIAL STATEMENTS
NOTE 2 - SUMMARY OF SIGNIFICANT ACCOUNTING POLICIES (Cont.)
| CC. | Exchange Rates and Linkage Basis (Cont.) |
| (3) | Following are the changes in the representative exchange rates of the Euro and the U.S. dollar vis-a-vis the NIS and in the Israeli Consumer Price Index (“CPI”): |
As of: | Representative exchange rates of the dollar (NIS per $1) | Representative exchange rates of the Euro (NIS per €1) | CPI “in respect of” (in points) * | |||||||||
| December 31, 2010 | 3.549 | 4.738 | 211.67 | |||||||||
| December 31, 2009 | 3.775 | 5.442 | 206.19 | |||||||||
| Increase (decrease) during the: | % | % | % | |||||||||
| Year ended December 31, 2010 | (5.99 | ) | (12.94 | ) | 2.7 | |||||||
| Year ended December 31, 2009 | (0.71 | ) | 2.74 | 3.9 | ||||||||
| (*) | Based on the CPI for the month ending at the end of each reporting period, on an average basis of 100 = 1993. |
NOTE 3 - RECENTLY PUBLISHED IFRS AND INTERPRETATIONS:
| A. | New Standards and interpretations that influence this reporting period and/or previous reporting periods: |
| · | Revision of IAS 1 (Revised) - "Presentation of Financial Statements" |
The Group has elected early adoption of the revision to IAS 1 (Revised) ("Presentation of Financial Statements") as from 2010. The revision stipulates that other comprehensive income items shall be presented on the statement of changes to equity or in notes, in accordance with Company accounting policy. Therefore, the Company states other comprehensive income items on the statement of changes to equity.
| · | IFRS 3 (Amended) “Business Combinations” |
The new standard stipulates the rules for the accounting treatment of business combinations as detailed below:
| · | The transaction costs directly connected with the business combination will be recorded to the income statement when incurred. |
| · | As for business combinations where control is achieved after a number of acquisitions (acquisition in stages), the earlier purchases of the acquired company will be measured at the time that control is achieved On that date, equity interests will be premeasured at fair value prior to the date of acquisition, On that date, equity interests will be remeasured at fair value prior to the date of acquisition while recording the difference to the income statement. |
The standard applies to business combinations which occur on or after January 1, 2010. As a result of applying the standard, the Company recognized transaction costs amounting to NIS 267 thousand, and gain amounting to NIS 5,760 thousand, due to measurement at fair value of equity rights owned prior to the acquisition date.
F - 28
HADERA PAPER LTD
NOTES TO CONSOLIDATED FINANCIAL STATEMENTS
NOTE 3 - RECENTLY PUBLISHED IFRS AND INTERPRETATIONS: (Cont.)
| A. | New Standards and interpretations that influence this reporting period and/or previous reporting periods: (Cont.) |
| · | Amendment to IAS 17, “Leases" |
As part of the annual improvements project, for 2009 ,IAS 17 "Leases" was amended.
Amendment to IAS 17, “Leases”, provides for the classification of land leases as a financing lease or an operating lease in accordance with the general principles of the Standard, taking into consideration the fact that the land is an asset with an infinite economic life. As part of the amendment, the sweeping prohibition to classify land as an operating lease was canceled when the land is not transferred to the lessee or at the end of the leasing period.
The Amendment is to be retroactively applied in annual reporting periods commencing on January 1, 2010 or thereafter.
The Amendment is to be retroactively applied to existing leases for which the required information is available at the initial date of the lease. Land leases for which the required information is unavailable are to be reviewed as for the date of the adoption of the Amendment.
| 1) | The Group has lands and buildings that are leased to an associated company and which, until the amendment of IAS 17, have been presented as an operating lease. In accordance with the Amendment to IAS 17, these leases meet the definition of financing lease and therefore are classified as investment property measured at fair value, in accordance with the Group's policy. Since the information on the fair value of the lands in previous periods is not available, the Company has recognized the property at fair value as of the date of implementation of the amendment. As a result of implementing the amendment, as of January 1, 2010, a sum of NIS 24,349 thousands was recognized in investment property, a sum of NIS 787 thousands was recognized in deferred tax liabilities and a sum of NIS 74 thousands in account payables and accrued expenses (in respect of liability for a financing lease). Pursuant to the transitional provisions of the amendment, the difference in the amount of NIS 3,590 thousands was recognized in retained earnings. |
| 2) | The Group has lands (which do not constitute investment property at fair value), which have been leased from the Israel Land Administration and the leasing fees in respect thereof have been paid in full. Following the amendment, amounts in respect of the above leases, which have been presented in the financial statements as of December 31, 2009 under "prepaid expenses in respect of an operating lease" are now presented under "fixed assets". |
The effect of the retroactive implementation of the amendment on the statement of financial position in the current and previous periods:
December 31 | December 31 | |||||||
2010 | 2009 | |||||||
NIS in thousands | ||||||||
| Increase in fixed assets | 14,573 | 7,534 | ||||||
| Decrease in long-term expenses for lease | (14,573 | ) | (7,534 | ) | ||||
| 3) | The Group has lands (which do not constitute investment property measured at fair value) which are held as part of a leasing agreement with the Israel Land Administration, the payment in respect thereof is made periodically. Since the information as of the date the commencement of the leases is not available, the Company recognizes the asset and liability related to the lease of the land, which was recognized again as a financing lease, at fair value as of the date of implementation of the amendment; the difference between the fair value of the asset and the fair value of the related liability was recognized in "retained earnings". |
F - 29
HADERA PAPER LTD
NOTES TO CONSOLIDATED FINANCIAL STATEMENTS
NOTE 3 - RECENTLY PUBLISHED IFRS AND INTERPRETATIONS: (cont.)
| A. | New Standards and interpretations that influence this reporting period and/or previous reporting periods: (cont.) |
| · | Amendment to IAS 17, “Leases" (cont.) |
As a result of implementing the amendment, commencing from 2010, some of the leases that were treated until December 31, 2009 as operating leases, have been reclassified as financing leases.
Following the implementation of the amendment, on January 1, 2010, a sum of NIS 407 thousands was recognized in "fixed assets" and a sum of NIS 73 thousands was recognized in "accounts payable and accrued expenses" (in respect of a liability for a financing lease). In addition, prepaid expenses in respect of a lease have decreased by NIS 334 thousands.
| B. | New standards and interpretations that are effective and that do not have a material effect on the reporting period and/or previous reporting periods: |
The following standards, interpretations and amendments, which entered into effect in the current year, do not have a material impact on the current period and/or previous periods, but their entry into effect could have an impact on future periods.
| · | IAS 27 (Amended) “Consolidated and Separate Financial Statements “ |
The new standard prescribes the rules for the accounting treatment of consolidated and separate financial statements. The provisions of the standard apply to annual financial reporting periods which start on January 1, 2010 and thereafter. The standard will be implemented retrospectively, excluding a number of exceptions, as to which the provisions of the standard will be implemented prospectively.
| · | Amendment of IAS 28 "Investment in Associates" (regarding the loss of significant influence in an associated company) |
Following the adoption of Amended IAS 27 as aforesaid, certain provisions in IAS 28 "Investment in Associates" have been amended.
This amendment prescribes the accounting for the loss of significant influence in an associated company, while the entity continues to retain some interest in the investee.
The amendment will be implemented prospectively in annual reporting periods commencing on or after January 1, 2010.
| · | Amendment of IAS 39 "Financial Instruments: Recognition and Measurement" (regarding the designation of exposure to inflationary risks as hedging items). |
The amendment, inter alia, determines that changes in cash flows arising from exposure to inflationary risks can be designated as hedging items. Furthermore, pursuant to the amendment, the intrinsic value, unlike the time value of acquired options, qualifies as a hedging instrument of one-party risk arising from a forecast transaction. The amendment is implemented retroactively for annual accounting periods commencing on or subsequent to January 1, 2010.
| · | Amendment to IAS 7, “Statements of Cash Flows” |
Amendment to IAS 7, "Statements of Cash Flows" Clarifies that only as cash expenditure for an asset recognized in the statement of financial position qualifies for classification as cash flows used in investing activities.
F - 30
HADERA PAPER LTD
NOTES TO CONSOLIDATED FINANCIAL STATEMENTS
NOTE 3 - RECENTLY PUBLISHED IFRS AND INTERPRETATIONS: (cont.)
| B. | New standards and interpretations that are effective and that do not have a material effect on the reporting period and/or previous reporting periods: (cont.) |
| · | Amendment to IAS 36, “Impairment of Assets�� |
Amendment to IAS 36, “Impairment of Assets”, stipulates that the cash-generating units or groups of cash-generating units to which goodwill is allocated within the framework of impairment testing shall not be larger than an operating segment, excluding the grouping of segments with similar financial characteristics.
The Amendment is to be applied prospectively in annual reporting periods commencing on January 1, 2010 or thereafter.
| · | Amendment of IAS 39 "Financial Instruments: Recognition and Measurement" (regarding the scope of the standard, the date of recognition of gains and losses in profit or loss with respect to hedging instruments and an option for early repayment in debt instruments) |
Amendment to IAS 39, “Financial Instruments: Recognition and Measurement", stipulates some amendments to the standard provisions. Additionally, the amendment clarifies that gains or losses attributed to a cash flow hedge are to be reclassified to profit or loss during the period in which the hedged anticipated cash flows affect the profit or loss.
The amendment is to be applied prospectively to in annual periods commencing on January 1, 2010 or thereafter.
The amendment further determines a clarification regarding the treatment in case of early repayment option that is embedded in a host debt regarding the separation of an embedded derivative.
The amendment is to be applied prospectively in annual periods commencing on January 1, 2010 or thereafter.
| C. | Standards, Amended Standards and Clarifications that have been Published but not yet Become Effective, and have not been Adopted by the Company in Early Adoption that might have or expected to have an effect on future periods: |
| · | IFRS 9: "Financial instruments" |
The new standard lays out requirements for classifying and measuring financial assets. The Standard requires that all financial assets be treated as follows:
| · | Debt instruments are to be classified and measured after initial recognition at amortized cost or at fair value through profit and loss. The measurement model will be determined based on the business model of the entity with respect to the management of financial assets and accordingly, the characteristics of contractual cash flows arising from the same financial assets. |
| · | A debt instrument which, according to tests, is measured at depreciated cost, can be designated through profit and loss only if the designation cancels inconsistency in recognition and measurement that would have been created had the asset been measured at amortized cost. |
| · | Equity instruments are measured at fair value through profit and loss. |
| · | On the date of initial recognition equity instruments can be designated as measured at fair value when profits or losses are recognized in other comprehensive income. Instruments designated as aforesaid will no longer be subject to impairment testing and any profit or loss in respect thereof will not be recognized in profit and loss, including during the disposal thereof. |
| · | Embedded derivatives will not be separated from the host contract which falls under the application of the standard. Instead, compound contracts will be measured as a whole at amortized cost or at fair value, in accordance with the business model tests and contractual cash flow tests. |
F - 31
HADERA PAPER LTD
NOTES TO CONSOLIDATED FINANCIAL STATEMENTS
NOTE 3 - RECENTLY PUBLISHED IFRS AND INTERPRETATIONS: (cont.)
| C. | Standards, Amended Standards and Clarifications that have been Published but not yet Become Effective, and have not been Adopted by the Company in Early Adoption that might have or expected to have an effect on future periods: (cont.) |
| · | IFRS 9: "Financial instruments"(cont.) |
| · | Debt instruments will be reclassified from depreciated cost to fair value and vice versa only when the entity changes its business model to financial asset management. |
| · | Investments in equity instruments that do not have a quoted price in an active market including derivatives on these instruments will always be measured at fair value. The alternative of measurement at cost under certain circumstances has been cancelled. At the same time, the standard specifies that under specific circumstances cost may constitute a proper estimate of fair value. |
The standard stipulates the following provisions regarding financial liabilities:
| · | The change in the fair value of a financial liability which, upon initial recognition, is designated at fair value through profit or loss, which is attributed to changes in the credit risk of the liability, is directly recognized in other comprehensive income, unless this recognition creates or increases accounting mismatch. |
| · | When the financial liability is settled or extinguished, the fair value amount which was recognized in other comprehensive income, will not be classified in the statement of income. |
| · | All derivatives, whether assets or liabilities, will be measured at fair value, including a derivative financial instruments that constitutes a liability, which is related to an unquoted equity instrument whose fair value cannot be measured reliably. |
The provisions of the standard are to be applied retroactively, with exceptions as set forth in the standard, in periods commencing on or after January 1, 2013. Early adoption is permitted. Entities electing to make an early adoption of the standard before January 1, 2012 are permitted not to implement the standard retroactively.
At this stage, the Company's management cannot estimate the effect of implementing the stands on its financial position and operating results.
| · | Revision to IFRS 3 (Revised) "Business Combinations" (regarding measurement of rights that do not grant control) |
The revision stipulates that the possibility of selecting the method of measurement, at the date of business combination, of rights that do not grant control, exists only for rights that do not grant control, that constitute existing ownership rights in the company being acquired. Rights that do not grant control, that do not constitute existing ownership rights, shall be measured at the date of business combination exclusively at fair value. The revision will be implemented prospectively, starting with the adoption date of the directives of IFRS 3 (Revised). At this stage the company's management is unable to estimate the effect of implementing the amendment on its financial condition and operating results.
| · | Revision of IAS 27 (Revised) - "Consolidated and Separate Financial Statements" |
The revision clarifies the transitional provisions of revisions to other standards regarding the adoption of IAS 27 (Revised), namely the revisions of IAS 21 "Impact of changes in foreign currency exchange rates", IAS 28 "Investment and associated companies" and IAS 31 "Rights in Joint Transactions" and it was determined that these revisions to the other standards will be implemented prospectively, commencing on the adoption date of the directives of IAS 27 (Revised). The standard is to be applied for annual accounting periods commencing on or after January 1, 2011. Early adoption is permitted. At this stage, the Company's management cannot estimate the effect of implementing the stands on its financial position and operating results.
F - 32
HADERA PAPER LTD
NOTES TO CONSOLIDATED FINANCIAL STATEMENTS
NOTE 3 - RECENTLY PUBLISHED IFRS AND INTERPRETATIONS: (cont.)
| C. | Standards, Amended Standards and Clarifications that have been Published but not yet Become Effective, and have not been Adopted by the Company in Early Adoption that might have or expected to have an effect on future periods: (cont.) |
| · | Amendment to IFRS 7 "Financial Instruments: Disclosure" |
The Amendment encourages qualitative disclosure with respect to the quantitative disclosure, which is required to assist the readers of the financial statements in creating an overall picture of the nature and extent of the risks associated with financial instruments.
In addition, the Amendment classifies the required level of disclosure regarding credit risk and collateral and provides disclosure exemptions with respect to loans whose terms were renegotiated. The amendment is to applied retroactively for annual reporting periods commencing on or after January 1, 2011. Early adoption is permitted.
| D. | New standards and interpretations which have been issued but not yet entered into effect and have not been adopted early by the Group, and are not expected to affect the Group's financial statements |
| · | IFRIC 19 "Extinguishing Financial Liabilities with Equity Instruments" |
The interpretation provides guidance on how to account for the extinguishment of a financial liability by the issue of equity instruments. The interpretation determines that upon the occurrence of such an event, the difference between the carrying amount of the financial liability extinguished and the initial measurement amount of the equity instruments issued is included in the entity’s profit or loss for the period.
The interpretation will be retroactively period commencing at January 1, 2011, or thereafter. Early adoption is possible.
At this stage, the Company's management cannot estimate the effect of implementing the interpretation on its financial position and operating results.
| · | Amendment of IFRIC 14: "Prepayments of a Minimum Funding Requirement" |
The amendment determines that the measurement of plan assets regarding defined benefit plans, prepayments of a minimum funding requirement will be included under available economic benefits in the form of refunds or reduction of future deposits in a plan. The interpretation is to be applied retroactively for annual reporting periods commencing on or after January 1, 2011. At this stage, the Company's management cannot estimate the effect of implementing the interpretation on its financial position and operating results.
| · | Amendment to IAS 32 "Financial Instruments: Presentation" |
The amendment determines that derivative instruments issued as part of a rights issue to existing shareholders, which allow the holder to purchase a fixed number of equity instruments in exchange for a fixed amount of cash or another financial asset in a currency that is not the company's functional currency, will be classified as equity instruments provided that the rights were offered to all the holders of the entity's equity instruments, pro-rata to their holding rate. The amendment is to applied retroactively for annual reporting periods commencing on or after January 1, 2011. At this stage, the Company's management cannot estimate the effect of implementing the interpretation on its financial position and operating results.
| · | Amendment to IFRS 3 (Revised) "Business Combinations" (with respect to share-based payment in the acquired entity) |
The amendment stipulates that liabilities and equity instruments generated with respect to share-based payment arrangements of the acquired entity not replaced in conjunction with the business combination shall be measured pursuant to provisions of IFRS 2 "Share-based Payment". Furthermore, the amendment stipulates that when the acquiring entity replaces the share-based payment grants of the acquired entity, all or part of the market-based measurement of the replacement grants of the acquiring entity shall be included in measurement of the consideration given in the business combination, ignoring the acquiring entity's obligation to replace the acquired entity's grants. The amendment shall be applied prospectively as from the adoption date of provisions of IFRS 3 (Revised). Company management is currently unable to estimate the impact of application of the amendment on the Company's financial standing and operating results.
F - 33
HADERA PAPER LTD
NOTES TO CONSOLIDATED FINANCIAL STATEMENTS
NOTE 3 - RECENTLY PUBLISHED IFRS AND INTERPRETATIONS: (cont.)
| D. | New standards and interpretations which have been issued but not yet entered into effect and have not been adopted early by the Group, and are not expected to affect the Group's financial statements: (cont.) |
| · | IAS 24 (Amended) "Related Party Disclosures" |
The new standard eliminates the number of disclosure requirement of an entity related to a government, a government authority or a similar entity with respect to transactions performed with entities related to the same government, government authority or similar entity. In addition, the standard changes the definition of related party. The standard is to be applied retroactively for annual accounting periods commencing on or after January 1, 2011.
| · | Amendment to IFRS 7 "Financial Instruments: Disclosure" |
The Amendment includes disclosure requirements regarding the entity's exposure to risks relating to the transfer of financial assets under which the transferor is left with a certain level of continued exposure to the asset ("continued involvement") and relating to the transfers of fully amortized financial assets, which were carried out close to the end of the reporting period.
The provisions of the Amendment are applied prospectively in annual periods commencing January 1, 2012. Early adoption is permitted. The new disclosures are not required in respect of reporting periods prior to the date of initial implementation.
NOTE 4- CRITICAL ACCOUNTING JUDGEMENTS AND KEY SOURCES OF ESTIMATION UNCERTAINTY
| A. | General |
In the application of the Group’s accounting policies, which are described in Note 2 above, management is required to make judgments, estimates and assumptions about the carrying amounts of assets and liabilities that are not readily apparent from other sources. The estimates and associated assumptions are based on historical experience and other factors that are considered to be relevant. Actual results may differ from these estimates.
The estimates and underlying assumptions are reviewed on an ongoing basis. Revisions to accounting estimates are recognized in the period in which the estimate is revised if the revision affects only that period or in the period of the revision and future periods if the revision affects both current and future periods.
| B. | Critical judgments in applying accounting policies |
The main items in which uncertainty of estimates and critical judgments are involved, and that have the most significant effect on the amounts recognized in the financial statements is:
| · | Deferred taxes- |
The company recognizes deferred tax assets for all of the deductible temporary differences up to the amounts as to which it is anticipated that there will be taxable income against which the temporary difference will be deductible. During each period, for purposes of calculation of the utilizable temporary difference, management uses estimates and approximations as a basis which it evaluates each period.
| · | Approximation of length of life of items of fixed assets- |
Each period, the company’s management evaluates salvage values, depreciation methods and length of useful lives of the fixed assets.
| · | Measuring provisions and contingent liabilities and contingent liabilities- see C(1) below. |
| · | Measuring obligation for defined benefits and employee benefits- see C(2) below. |
| · | Measuring share based payments- see note 11 below. |
F - 34
HADERA PAPER LTD
NOTES TO CONSOLIDATED FINANCIAL STATEMENTS
NOTE 4 - CRITICAL ACCOUNTING JUDGEMENTS AND KEY SOURCES OF ESTIMATION UNCERTAINTY (cont.)
| B. | Critical judgments in applying accounting policies (cont.) |
| · | Measuring the fair value on account of the allocation of the cost of acquisition - see C(3) below. |
| · | Examination of the impairment of cash generating units – see C(4) below. |
| C. | Key factor of estimation uncertainty |
| 1. | Provisions for legal proceeding |
For purposes of evaluating the legal relevance of these claims, as well as determining the reasonableness that they will be realized to its detriment, the company’s management relies on the opinion of legal and professional advisors. After the company’s advisors expound their legal position and the probabilities of the company as regards the subject of the claim, whether the company will have to bear its consequences or whether it is will be able to rebuff it, the company approximates the amount which it must record in the financial statements, if at all.
An interpretation that differs from that of the legal advisors of the company as to the existing legal situation, a varying understanding by the company’s management of the contractual agreements as well as changes derived from relevant legal rulings or the addition of new facts may influence the value of the overall provision with respect to the legal proceedings that are pending against the company and, thus material affect the company’s financial condition and operating results.
See also note 14 as follows.
| 2. | Employee benefits |
The present value of the company’s obligation for the payment of benefits to pensioners and severance pay to employees that are not covered under Section 14 to the Severance Pay Law is based upon a great amount of data, which are determined on the basis of an actuarial estimation, through the utilization of a large number of assumptions, including the capitalization rate. Changes in the actuarial assumptions could affect the book value of the obligation of the company for employees’ benefits payments, vacation and severance pay.
The company approximates the capitalization rate once annually, on the basis of the capitalization rate of government bonds.
Other key assumptions are determined on the basis of conditions present in the market, and on the basis of the cumulative past experience of the company.
| 3. | Measurement at fair value on account of the allocation of the cost of acquisition |
For the purpose of allocating the cost of acquisition and determining the fair value of the tangible and intangible assets and the liabilities of the consolidated subsidiaries at the date of consolidation, the Company's management based itself primarily on valuations prepared by external and independent real-estate appraisers and assessors, possessing the required know-how, experience and expertise.
The fair value was determined according to generally-accepted valuation methods, including: Proposed market prices in active markets, discounting of cash flows and the comparison of selling prices of similar assets and company assets in the immediate proximity. When the discounted cash flows method was employed, the interest rate for discounting the net cash flows expected from the assets possesses a material impact on its fair value.
F - 35
HADERA PAPER LTD
NOTES TO CONSOLIDATED FINANCIAL STATEMENTS
NOTE 4 - CRITICAL ACCOUNTING JUDGEMENTS AND KEY SOURCES OF ESTIMATION UNCERTAINTY (cont.)
| C. | Key factor of estimation uncertainty (cont.) |
| 3. | Measurement at fair value on account of the allocation of the cost of acquisition (cont.) |
In determining the fair value, the business/operational risk associated with the company's operations is taken into account, to the extent relevant. Part of the said risk is the risk associated with the nature of the sector wherein the company operates, while part of the risk stems from the Company's specific characteristics.
The Group strives to determine a fair value that is as objective as possible, yet the process of estimating the fair value also includes subjective elements, originating inter alia from the past experience of the Company's management and its understanding of expected events in the market wherein the Group operates at the date when the fair value was determined.
In light of the above, and in view of the aforementioned in the preceding paragraph, the setting of the fair value of the Group calls for employing judgment. Changes in the assumptions that serve for setting the fair value can materially affect the Group's situation and results of operation.
| 4. | Examination of the impairment of cash generating units |
To determine whether there may be a need for impairment provision with respect to cash-generating units in accordance with IAS 36, the Company's management has primarily used appraisals performed by external independent land appraisers with the required knowledge, expertise and experience. In light of indications that occurred during 2009 and in accordance with IAS-36, the company examined the need for a provision for impairment of the value of the packaging paper sector as a cash-generating unit.
From the external assessment that was done on the discounting of cash flows using a discount rate of 9.5%, indicates that the expected utilization value of the packaging paper cash-generating unit is higher than its carrying value and in accordance with IAS-36, no recognition is necessary of a loss on account of the impairment of the fixed assets.
The Company strives to determine the fair value of the cash generating units that is as objective as possible, yet the process of estimating the fair value also includes subjective elements, originating inter alia from the past experience of the external assessors and land appraisers and of the Company's management and its understanding of expected events in the market wherein the Group operates at the date when the fair value was determined.
In light of the above, and in view of the aforementioned in the preceding paragraph, the setting of the fair values of the cash generating units of the Group calls for employing judgment. Changes in the assumptions that serve for setting of the fair values of the cash generating units, can materially affect the Group's situation and results of operation.
F - 36
HADERA PAPER LTD
NOTES TO CONSOLIDATED FINANCIAL STATEMENTS
NOTE 5 - INVESTMENTS IN ASSOCIATED COMPANIES:
| A. | Details of Subsidiaries and Associated Companies |
| Percentage of direct and indirect holding in shares conferring equity and voting rights | The amount investment in an associated company (*) | |||||||||||||||
at December 31 | at December 31 | |||||||||||||||
2010 | 2009 | 2010 | 2009 | |||||||||||||
% | NIS in thousands | |||||||||||||||
Main subsidiaries: (**) | ||||||||||||||||
| Amnir Recycling Industries Limited | 100.00 | 100.00 | 154,146 | 179,669 | ||||||||||||
| Graffiti Office Supplies and Paper Marketing Ltd. | 100.00 | 100.00 | (8,590 | ) | (10,619 | ) | ||||||||||
| Hadera Paper –packaging paper and recycling Ltd. | 100.00 | 100.00 | 123,146 | 137,965 | ||||||||||||
| Hadera Paper - Development and Infrastructure Ltd. | 100.00 | 100.00 | 145,970 | 161,930 | ||||||||||||
| Carmel Container Systems Limited (1) | 100.00 | 89.30 | 160,004 | 144,743 | ||||||||||||
| Hadera Paper-printing and writing paper Ltd.(2) | 75.00 | 49.90 | 157,485 | 114,124 | ||||||||||||
| Frenkel C.D. Limited(3) | 57.84 | 54.75 | 11,007 | 11,158 | ||||||||||||
| Main associated company: | ||||||||||||||||
| Hogla-Kimberly Ltd. | 49.90 | 49.90 | 239,116 | 227,883 | ||||||||||||
| * | The amount of investment in a directly held entity is calculated as the net amount based on the consolidated financial statements, which is attributed to the shareholders of the Company, of total assets less total liabilities, which present financial information on the investee company in the Company's consolidated financial statements, including goodwill. |
| ** | Not including dormant companies. |
| (1) | On October 4 the Company successfully completed its full tender offer to purchase shares of Carmel Container Systems Ltd. ("Carmel") a subsidiary of the Company for $22.50 per share in cash (Subject to withholding tax), for the total amount of approximately $4.2 million, In accordance with the Board decision dated 30, August 2010 regarding the full tender offer, under section 336 of the Companies Law, 1999. Carmel shares are not and were not traded on the Israeli Stock Exchange but were previously listed in the U.S. on American Stock Exchange. In 2005 Camel's shares were delisted from trade by Carmel's initiative. In accordance with the Companies Law, - 1999, the Company automatically acquires the entire number of shares subject to the tender offer, including all shares owned by shareholders who have not responded to the tender offer. The Company is currently completing the process of transferring the payment to shareholders that their shares were forcibly acquired, and it is also working on the completion of the technical procedure with the American stock exchange. Accordingly, when the technical procedure is completed, as of the date of the final expiration of the tender offer, on October 4, 2010, the Company would then own 100% of Carmel’s issued and outstanding share capital and voting rights. |
In light of indications that rose as a result of the tender offer to purchase shares as mentioned above, regarding the impairment of the Carmel cash-generating unit, the Company commissioned an external and independent appraiser to examine the need for a provision for impairment. The evaluation was made on the basis of its use value, based on the capitalized cash flows that are expected to be generated by the company, using a discount rate of 10.0% and it was found that the value of Carmel is actually higher than its book value and no recognition is necessary of a loss on account of impairment.
F - 37
HADERA PAPER LTD
NOTES TO CONSOLIDATED FINANCIAL STATEMENTS
NOTE 5 - INVESTMENTS IN ASSOCIATED COMPANIES: (cont.)
| A. | Details of Subsidiaries and Associated Companies (cont.) |
| (2) | For details about the acquisition of Hadera paper writing and printing paper ltd. see note 17 below. |
| (3) | Frenkel C.D. Limited is partly held through the Company in the rate of 28.92% and partly held through Carmel Container Systems Limited (in the rate of 28.92%) the holding in voting shares of C.D. Packaging Systems Limited is 57.72%. |
| B. | Investments in associated companies |
The Company has a number of investments in associated companies, which are held either directly or through investee companies on December 31, 2010. The financial statements of significant associated companies (Hadera Paper- printing and writing paper Ltd. formerly Mondi Hadera Paper Ltd), that is consolidated in the company's finance statements as of December 31 2010, and Hogla-Kimberly Ltd) are attached to these financial statements.
| 1. | Composed as follows: |
December 31 | ||||||||
2010 | 2009 | |||||||
NIS in thousands | ||||||||
| Investment in Shares: | ||||||||
| Cost | 1,875 | 1,875 | ||||||
| Gain on issuance of shares of an associated | ||||||||
| company to a third party | 40,241 | 40,241 | ||||||
| Adjustments from translation of foreign currency | ||||||||
| financial statements | (33,521 | ) | (22,872 | ) | ||||
| Share in cash flow hedging capital | (1,360 | ) | (940 | ) | ||||
| Share in Actuarial losses | (647 | ) | (451 | ) | ||||
| Initial consolidation of associate | (80,961 | ) | - | |||||
| Share in profits since acquisition, net | 292,692 | 268,670 | ||||||
| 218,319 | 286,523 | |||||||
| Long-term loans and capital notes * | 19,179 | 54,452 | ||||||
| 237,498 | 340,975 | |||||||
* Classified by linkage terms and rate of interest.
The total amounts of the loans and capital notes are as follows:
| Weighted average | ||||||||||||
| interest rate | ||||||||||||
| at December 31, | December 31 | |||||||||||
2010 | 2010 | 2009 | ||||||||||
% | NIS in thousands | |||||||||||
| Unlinked loans and capital notes | 5.5 | % | 19,179 | 54,452 | ||||||||
| 19,179 | 54,452 | |||||||||||
As of December 31, 2010, the repayment dates of the balance of the loans and capital notes have not yet been determined.
F - 38
HADERA PAPER LTD
NOTES TO CONSOLIDATED FINANCIAL STATEMENTS
NOTE 5 - INVESTMENTS IN ASSOCIATED COMPANIES: (cont.)
| B. | Investments in associated companies (cont.) |
| 2. | The changes in the investments during 2010 are as follows: |
| NIS in thousands | ||||
| Balance at the beginning of the year | 340,975 | |||
| Changes during the year: | ||||
| Share in profits of associated companies - net | 81,132 | |||
| Dividend distributed or declared by an associated company | (57,110 | ) | ||
| Differences from translation of foreign currency financial statements | (10,649 | ) | ||
| Share in capital surplus of hedging cash flows at associated companies | (420 | ) | ||
| Share in capital surplus from recording actuarial gains to reserves | (196 | ) | ||
| Initial consolidation of associate. | (80,961 | ) | ||
| Decrease in balance of long-term loans and capital notes - net | (35,273 | ) | ||
| Balance at end of year | 237,498 | |||
| 3. | Hadera Paper – printing and writing paper Ltd. (hereafter – "printing and writing"; formerly - Mondi Hadera Paper Ltd.) |
Until December 31, 2010, "printing and writing" was held to the extent of 49.9% by the Company and also by Mondi Business Paper LTD (hereafter - MBP), As part of an agreement dated November 21, 1999.
On December 31, 2010, the holding stake in "printing and writing" increased by 25.1% to 75%. For details about achievement of control, see Note 17 below.
| 4. | Hogla-Kimberly Ltd. (hereafter – Hogla-Kimberly) |
Hogla-Kimberly is held to the extent of 49.9% by the Company and to the extent of 50.1% by Kimberly Clark Corporation (hereafter- KC).
| 5. | Dividends from associated companies |
| a. | On January 20, 2010 a dividend in cash, in the amount of NIS 19.6 million, that was declared on October 22, 2009, was received from an associated company. |
| b. | On February 18, 2010, an associated company declared the distribution of a dividend in the amount of approximately NIS 20 million out of the unapproved retained earnings accumulated as of December 31, 2009. The Company’s share in the dividend is approximately NIS 10 million. The dividend was paid during May 2010. |
| c. | On April 22, 2010 an associated company declared the distribution of a dividend in the amount of approximately NIS 40 million from the retained earnings. The Company’s share in the dividend is approximately NIS 20 million. The dividend was paid during July 2010. |
| d. | On July 26, 2010 an associated company declared the distribution of a dividend in the amount of EURO 5.9 million. The Company’s share in the dividend is approximately NIS 3.0 million. The dividend was paid during August 2010. |
| e. | On July 27, 2010 an associated company declared the distribution of a dividend in the amount of NIS 40 million from the retained earnings. The timing of the payment is subject to availability of funds and consent of partners. The amount of NIS 35 million was paid during November 2010, and the amount of NIS 5 million will be paid during 2011. The Company’s share in the dividend is approximately NIS 20 million. |
| f. | On December 30, 2010 an associated company declared the distribution of a dividend in the amount of EURO 8.5 million. The company's share in the dividend is approximately NIS 4.3 million. The dividend was paid during January 2011. |
F - 39
HADERA PAPER LTD
NOTES TO CONSOLIDATED FINANCIAL STATEMENTS
NOTE 6 - FIXED ASSETS:
| A. | Composition of assets and the accumulated depreciation thereon, grouped by major classifications, and changes therein during 2010, are as follows: |
C o s t | Accumulated depreciation | |||||||||||||||||||||||||||||||||||||||||||||||||||
| Balance at beginning of year | Classified under Investment Property as of the start of the year | Additions during the year | Disposals during the year | Entry into consolidation | Balance at end of year | Balance at beginning of year | Classified under Investment Property as of the start of the year | Additions during the year | Disposals during the year | Entry into consolidation | Balance at end of year | Depreciated balance December 31 | ||||||||||||||||||||||||||||||||||||||||
| NIS in thousands | ||||||||||||||||||||||||||||||||||||||||||||||||||||
| Land and buildings thereon | 251,332 | (17,931 | ) | 132,029 | 1,500 | 5,958 | 369,888 | 139,971 | (3,834 | ) | 5,090 | 819 | 3,275 | 143,683 | 226,205 | |||||||||||||||||||||||||||||||||||||
| Machinery and equipment | 1,221,069 | - | 641,955 | 42,968 | 223,821 | 2,043,877 | 876,124 | 71,519 | 40,242 | 82,671 | 990,072 | 1,053,805 | ||||||||||||||||||||||||||||||||||||||||
| Vehicles | 39,057 | - | 1,493 | 3,934 | 3,781 | 40,397 | 25,387 | 4,195 | 3,612 | 3,010 | 28,980 | 11,417 | ||||||||||||||||||||||||||||||||||||||||
| Office furniture and equipment (including computers) | 63,858 | - | 3,893 | 708 | 4,608 | 71,651 | 37,662 | 2,897 | 697 | 3,352 | 43,214 | 28,437 | ||||||||||||||||||||||||||||||||||||||||
| Payments on account of machinery and equipment, net | 616,106 | - | (600,985 | ) | - | 250 | 15,371 | - | - | - | - | - | 15,371 | |||||||||||||||||||||||||||||||||||||||
| Spare parts – not current, net | 21,956 | - | 1,428 | - | - | 23,384 | - | - | - | - | - | 23,384 | ||||||||||||||||||||||||||||||||||||||||
| 2,213,378 | (17,931 | ) | 179,813 | 49,110 | 238,418 | 2,564,568 | 1,079,144 | (3,834 | ) | 83,701 | 45,370 | 92,308 | 1,205,949 | 1,358,619 | ||||||||||||||||||||||||||||||||||||||
F - 40
HADERA PAPER LTD
NOTES TO CONSOLIDATED FINANCIAL STATEMENTS
NOTE 6 - FIXED ASSETS: (Cont.)
| B. | Composition of assets and the accumulated depreciation thereon, grouped by major classifications, and changes therein during 2009, are as follows: |
C o s t | Accumulated depreciation | |||||||||||||||||||||||||||||||||||
Balance at beginning of year | Additions during the year | Disposals during the year | Balance at end of year | Balance at beginning of year | Additions during the year | Disposals during the year | Balance at end of year | Depreciated balance | ||||||||||||||||||||||||||||
December 31 | ||||||||||||||||||||||||||||||||||||
2009 | ||||||||||||||||||||||||||||||||||||
| NIS in thousands | ||||||||||||||||||||||||||||||||||||
| Land and buildings thereon | 241,194 | 10,138 | - | 251,332 | 135,288 | 4,683 | - | 139,971 | 111,361 | |||||||||||||||||||||||||||
| Machinery and equipment | 1,280,262 | 47,107 | 106,300 | 1,221,069 | 916,033 | 60,646 | 100,555 | 876,124 | 344,945 | |||||||||||||||||||||||||||
| Vehicles | 47,861 | 1,980 | 10,784 | 39,057 | 30,760 | 4,701 | 10,074 | 25,387 | 13,670 | |||||||||||||||||||||||||||
| Office furniture and equipment | ||||||||||||||||||||||||||||||||||||
| (including computers) | 98,371 | 2,055 | 36,568 | 63,858 | 75,500 | 3,507 | 41,345 | 37,662 | 26,196 | |||||||||||||||||||||||||||
| Payments on account of machinery and equipment, net | 238,845 | 377,261 | - | 616,106 | - | - | - | - | 616,106 | |||||||||||||||||||||||||||
| Spare parts – not current, net | 26,295 | - | 4,339 | 21,956 | - | - | - | - | 21,956 | |||||||||||||||||||||||||||
| 1,939,828 | 438,541 | 157,991 | 2,213,378 | 1,157,581 | 73,537 | 151,974 | 1,079,144 | 1,134,234 | ||||||||||||||||||||||||||||
F - 41
HADERA PAPER LTD
NOTES TO CONSOLIDATED FINANCIAL STATEMENTS
NOTE 6 - FIXED ASSETS: (Cont.)
| C. | The item is net of investment grants in respect of investments in “approved enterprises”. |
| D. | Depreciation expenses amounted to NIS 83,701 thousands and NIS 73,355 thousands NIS for the years ended December 31, 2010 and 2009 respectively. |
| E. | As of December 31, 2010 and 2009, the cost of fixed assets includes borrowing costs of NIS 24,228 thousands and NIS 31,918 thousands capitalized to the cost of machinery and equipment for the years ended December 31, 2010 and 2009, respectively. |
| F. | As of December 31, 2010 and 2009, the cost of fixed assets includes payroll costs of NIS 8,545 thousands and NIS 9,052 thousands capitalized to the cost of machinery and equipment for the years ended December 31, 2010 and 2009, respectively. |
| G. | As of December 31, 2010 and 2009, the cost of fixed assets includes running-in stage costs of NIS 8,417 thousands net, capitalized to the cost of machinery after the deduction of the proceeds from the sale of items during the running-in stage in the amount of NIS 69,996 thousands. |
| H. | For details of rights in lands – see note 7 as follows. |
NOTE 7 - RIGHTS LANDS:
| A. | The Company's real estate is partly owned and partly leased and some lease fees have been capitalized. The leasehold rights are for 49-59 year periods ending in the years 2012 to 2059, with options to extend for an additional 49 years. |
| B. | Details as of December 31, 2010: |
NIS in thousands | ||||
| Land owned | 75,500 | |||
Property under capitalized lease | 44,653 | |||
| Property under non-capitalized lease | 1,648 | |||
| 121,801 | ||||
| C. | Presented in the balance sheets as follows: |
December 31 | ||||||||
2010 | 2009 | |||||||
NIS in thousands | ||||||||
| In Fixed assets | 89,770 | 89,358 | ||||||
| In Expenditure for lease | 24,836 | 29,756 | ||||||
| In Investment property | 7,195 | - | ||||||
| 121,801 | 119,114 | |||||||
F - 42
HADERA PAPER LTD
NOTES TO CONSOLIDATED FINANCIAL STATEMENTS
NOTE 7 - RIGHTS LANDS: (cont.)
| D. | On July 27, 2010 the General meeting approved the company's entering into the agreement from June 1, 2010 for the sale of its rights to a plot of land with an area of approximately 7600 square meters in Totseret HaAretz Street in Tel Aviv, that is currently leased by the Company from the Tel Aviv municipality in consideration of NIS 64 million, plus VAT. The purchasing parties are Gev Yam Ltd., (“Gev Yam”), a company indirectly controlled by IDB Development Company Ltd., the controlling shareholder of the Company and by Amot Investments Ltd. (“Amot”), with holdings in Gev Yam of 71% and 29%, respectively. The transaction is subject to a two nullifying conditions. Pursuant to the finalization of the transaction according to the terms of the agreement, the Company is expected to record in its financial statements net capital gains totaling approximately NIS 27.5 million. As of the signing date of the financial statements, the suspending conditions have yet to be met. |
| E. | On July 25, 2010 a subsidiary company - Amnir Recycling Industries Ltd. was entered into an agreement for the sale of the leasing rights to a plot of land covering 9,200 m² located in Bnei-Brak, in return for a sum of NIS 20 million. Following the completion of the transaction, the Company's profit was in the amount of approximately NIS 16.3 million. |
NATE 8 - INVESTMENT PROPERTY
A. | Composition and changes in investment property measured at fair value |
| for the year ended December 31 | ||||||||||||
2010 | ||||||||||||
| Rental | ||||||||||||
Land | building | Total | ||||||||||
NIS in thousands | NIS in thousands | NIS in thousands | ||||||||||
| cost | ||||||||||||
| Balance - January 1, 2010 | 7,151 | 17,198 | 24,349 | |||||||||
| Additions during the year | ||||||||||||
| Adjustment to fair value | 44 | 107 | 151 | |||||||||
| Balance – December 31, 2010 | 7,195 | 17,305 | 24,500 | |||||||||
| B. | Sums recognized in the statement of income |
for the year ended December 31 | ||||
2010 | ||||
NIS in thousands | ||||
| Rental income from investment property | 2,704 | |||
| C. | Determining the fair value of the Group's investment property |
| Investment property is measured at fair value based on the valuation carried out by reputable external appraisers with experience regarding the location and type of the appraised property. The fair value represents the amount on the date of valuation, which is the amount for which the property could be exchanged between knowledgeable, willing parties in an arm's length transaction, in accordance with international valuation standards. Fair value is determined based on: |
| 1) | The fair value is measured based on current prices on an active market for similar property in the same location and condition and subject to similar lease and other contracts. |
| 2) | The fair value is measured based on recent prices on an active market for similar property, which is subject to similar lease and other contracts, with adjustments to reflect such differences. |
F - 43
HADERA PAPER LTD
NOTES TO CONSOLIDATED FINANCIAL STATEMENTS
NATE 8 - INVESTMENT PROPERTY (Cont.)
| C. | Determining the fair value of the Group's investment property (Cont.) |
| 3) | The fair value is measured using discounted cash flow projections, based on reliable estimates of future cash flows, which are supported by the conditions of similar lease and other contract and by external evidence, such as current rental prices for similar property in the same location and condition, as well as by using discount rates, which reflect current market valuations regarding the uncertainty of the amount and timing of the cash flows. |
The discount rate used in the calculation of the fair value as at December 31, 2010 was 8.5%.
NOTE 9 – OTHER INTANGIBLE ASSETS:
| A. | Composition and changes are as follows: |
Software | Order backlog | Goodwill | Portfolio of Customers | Total | ||||||||||||||||
NIS in thousands | ||||||||||||||||||||
| Cost | ||||||||||||||||||||
| Balance at January 1, 2010 | 1,458 | 3,082 | 599 | 34,992 | 40,131 | |||||||||||||||
| Additions during the year | 49 | - | - | 49 | ||||||||||||||||
| Entry into consolidation | - | - | 12,282 | - | 12,282 | |||||||||||||||
| Disposals | (86 | ) | - | - | (60 | ) | (146 | ) | ||||||||||||
| Balance at December 31, 2010 | 1,421 | 3,082 | 12,881 | 34,932 | 52,316 | |||||||||||||||
| Cost | ||||||||||||||||||||
| Balance at January 1, 2009 | 1,377 | 3,082 | 599 | 34,992 | 40,050 | |||||||||||||||
| Additions during the year | 81 | - | - | - | 81 | |||||||||||||||
| Balance at December 31, 2009 | 1,458 | 3,082 | 599 | 34,992 | 40,131 | |||||||||||||||
| Accumulation amortization and impairment: | ||||||||||||||||||||
| Balance at January 1, 2010 | 1,327 | 3,082 | 448 | 8,190 | 13,047 | |||||||||||||||
| Deduction | 112 | - | - | 3,589 | 3,701 | |||||||||||||||
| Disposals | (86 | ) | - | - | (60 | ) | (146 | ) | ||||||||||||
| Balance at December 31, 2010 | 1,353 | 3,082 | 448 | 11,719 | 16,602 | |||||||||||||||
| Accumulation amortization and impairment: | ||||||||||||||||||||
| Balance at January 1, 2009 | 1,081 | 3,082 | - | 4,368 | 8,531 | |||||||||||||||
| Deduction | 246 | 448 | 3,822 | 4,516 | ||||||||||||||||
| Balance at December 31, 2009 | 1,327 | 3,082 | 448 | 8,190 | 13,047 | |||||||||||||||
| Amortized cost: | ||||||||||||||||||||
| December 31, 2010 | 68 | - | 12,433 | 23,213 | 35,714 | |||||||||||||||
| December 31, 2009 | 131 | - | 151 | 26,802 | 27,084 | |||||||||||||||
| B. | Amortization of intangible assets is presented in the statement of income under the following items: |
Year ended December 31 | ||||||||
2010 | 2009 | |||||||
NIS in thousands | ||||||||
| Selling and marketing expenses | 2,908 | 2,908 | ||||||
| General and administrative expenses | 793 | 1,160 | ||||||
| C. | Additional information: |
As for testing the impairment of other intangible assets see note 2o above.
F - 44
HADERA PAPER LTD
NOTES TO CONSOLIDATED FINANCIAL STATEMENTS
NOTE 10 – FINANCIAL LIABILITIES:
| A. | Notes |
December 31 | ||||||||||||||||||||||||||||
2010 | 2009 | |||||||||||||||||||||||||||
NIS in thousands | ||||||||||||||||||||||||||||
Series V | Series IV | Series III | Series II | Series IV | Series III | Series II | ||||||||||||||||||||||
| Balance * | 181,519 | 196,298 | 179,847 | 101,020 | 235,557 | 197,815 | 131,689 | |||||||||||||||||||||
| Less - current maturities | - | 39,260 | 22,481 | 33,673 | 39,260 | 21,979 | 32,922 | |||||||||||||||||||||
| 181,519 | 157,038 | 157,366 | 67,347 | 196,297 | 175,836 | 98,767 | ||||||||||||||||||||||
Distribution according to repayment dates as of December 31, 2010:
Nis in thousands | ||||
1st year - Current maturity | 95,414 | |||
2nd year | 95,414 | |||
3rd year | 131,717 | |||
4th year | 98,044 | |||
5th year | 98,044 | |||
6th year and forward | 140,051 | |||
| 658,684 | ||||
| * | The aforementioned detailed balance does not include deferred issuance expenses in the amount of NIS 921 thousands (as of December 31, 2009 – NIS 915 thousand) which were deducted from the bonds balance. |
| 1) | Series II – December 2003 |
The unpaid balance of the notes bears annual interest of 5.65%, payable annually each December. The notes – principal and interest – are linked to the Israeli known CPI (based CPI of November 2003). The balance of the notes as of December 31, 2010 is redeemable in 3 equal, annual installments due in December of each of the years 2011-2013.
| 2) | Series III July – August 2008 |
On July 14, 2008 the Company contemplated a public offering pursuant to the shelf prospectus published by the Company in Israel on May 26, 2008 of a new series of debentures. The Company has offered an aggregate principal amount of NIS 187,500 thousands of debentures issued in return for approximately NIS 187,500 thousands bearing an interest rate of 4.65% and payable annually each on July 10th of the years 2011-2018. The notes-principal and interest – are linked to the Israeli known CPI (base CPI of May 2008)
| 3) | Series IV – July – August 2008 |
In July-August, 2008 the Company contemplated a public offering pursuant to the shelf prospectus published by the Company in Israel on May 26, 2008. The company has offered an aggregate principal amount of NIS 235,557 thousands of debentures issued in return for approximately NIS 240,360 thousands bearing an interest rate of 7.45%, and payable annually each on July 10th of the years 2011-2015. |
| 4) | Series V – May 2010 |
On May 23, 2010 the Company contemplated a public offering pursuant to the shelf prospectus published by the Company in Israel on May 26, 2008 of a new series of debentures. The Company has offered an aggregate principal amount of NIS 181,519 thousands of debentures (Series 5) issued in return for approximately NIS 181,519 thousands bearing an interest rate of 5.85%. The principal is payable in five annual equal payments, each on November 30th of the years 2013-2017. The interest is payable half annually each on May 31st and November 30th of the years 2011-2017.
The net proceed of the offering net of issue expenses is NIS 179,886 thousands.
F - 45
HADERA PAPER LTD
NOTES TO CONSOLIDATED FINANCIAL STATEMENTS
NOTE 10 - FINANCIAL LIABILITIES (cont.)
| A. | Notes (cont.) |
| 5) | As of December 31, 2010 the balance of the notes amounts to NIS 657,762 - thousands, is after deduction of issuance costs. (On December 31, 2009 the amounts was NIS 565,976 thousands). |
| B. | Credit from bank and others |
| 1) | Composition: |
| Yearly Interest Rate | Current Liabilities As of December 31 | Non-Current Liabilities As of December 31 | Total | |||||||||||||||||||||||||
| As of December 31 | ||||||||||||||||||||||||||||
31/12/10 | 2010 | 2009 | 2010 | 2009 | 2010 | 2009 | ||||||||||||||||||||||
% | NIS in thousands | NIS in thousands | NIS in thousands | |||||||||||||||||||||||||
| Banks: | ||||||||||||||||||||||||||||
| Short-term credit | 3.25%-4.5 | % | 144,622 | 131,572 | - | - | 144,622 | 131,752 | ||||||||||||||||||||
| Loans: | ||||||||||||||||||||||||||||
| linked to the CPI | 4.65%-5.15 | % | 9,140 | 8,218 | 9,110 | 19,925 | 18,250 | 28,143 | ||||||||||||||||||||
| Unlinked | 3.3%-6.3 | % | 71,382 | 47,561 | 242,107 | 205,877 | 313,555 | 253,438 | ||||||||||||||||||||
| Total credit from bank and others | 225,144 | 187,351 | 251,283 | 225,802 | 476,427 | 413,153 | ||||||||||||||||||||||
| 2) | Distribution according to repayment dates as of December 31, 2010: |
NIS in thousands | ||||
1st year - Current maturities of long-term loans | 80,522 | |||
2nd year | 74,406 | |||
3rd year | 59,049 | |||
4th year | 45,043 | |||
5th year | 27,867 | |||
6th year and forward | 44,918 | |||
| 331,805 | ||||
| 3) | Borrowing during the reporting period |
| a. | On February 11, 2010 the company assumed a long-term loan from banks in the sum of NIS 70 million, carrying a variable interest rate of prime+1.15%, and to be repaid within 7 years. The principal is to be repaid in quarterly installments, commencing from the second year. |
| b. | Between the months of May through October 2010, a consolidated subsidiary assumed long-term loans from banks for the purpose of acquiring fixed assets at the total sum of approximately NIS 22.7 million, at a variable rate of interest of Prime -0.1%. The loans are for a term of five years, with both principal and interest being paid in quarterly instalments. |
| C. | Financial Parameters and Covenant |
A consolidated subsidiary has a financial covenant with regard to long-term loans from bank, with a balance of NIS 13,537 thousand as of December 31, 2010 (at December 31,2009 a total sum of Nis 17,519 thousands), whereby the subsidiary has committed to the bank, that its ratio of tangible equity to total assets shall be no less than 18.5%.
An initially-consolidated subsidiary has a financial covenant with regard to long-term bank loans, with a balance of NIS 13,019 thousand as of December 31, 2010, whereby the subsidiary has committed to the bank, inter alia, that its ratio of tangible equity to total assets shall be no less than 22%.
As of the date of the financial statements the consolidated subsidiaries are in compliance with the required conditions.
F - 46
HADERA PAPER LTD
NOTES TO CONSOLIDATED FINANCIAL STATEMENTS
NOTE 11 - EMPLOYEE BENEFITS
| A. | Composition |
As of December 31 | ||||||||
2010 | 2009 | |||||||
| Post Employment Benefits at defined benefit plan: | ||||||||
| Severance pay and retirement liability, net | 2,364 | *2,398 | ||||||
| Benefits to retirees | 9,406 | 7,754 | ||||||
| 11,770 | 10,152 | |||||||
| Severance pay benefits | 6,569 | *4,110 | ||||||
| 18,339 | 14,262 | |||||||
| Short term employee benefits: | ||||||||
Salaries and wages, payroll and social benefits | 36,116 | 29,081 | ||||||
| Profit-sharing and bonus plans | 16,099 | 16,324 | ||||||
| Severance and retirement benefits** | - | 2,344 | ||||||
| Vacation employee benefits | 27,586 | 20,077 | ||||||
| 79,801 | 67,826 | |||||||
| Stated in the statement of financial position as follows: | ||||||||
| Employee benefit assets: | ||||||||
| Non-current assets | 793 | 649 | ||||||
| 793 | 649 | |||||||
| Employee benefit liabilities: | ||||||||
| Current liabilities – partly included in other payables | ||||||||
| -see note 15 d (2) | 79,801 | 67,826 | ||||||
| Non-current liabilities | 19,132 | 14,911 | ||||||
| 98,933 | 82,737 | |||||||
* Reclassified
** On December 31 2009, the Company's CEO retired from his position. The retirement bonus paid in January 2010 amounted to NIS 2.3 million (gross - before tax effects).
| B. | Post Employment Benefits |
| (1) | Post Employment Benefits at Defined benefit plan |
Plans for Severance pay obligations
Labor laws and the severance pay law in Israel and abroad require companies in the Group to pay severance benefits to employees who are dismissed, resign or retire from their employment under different specific circumstances. Liabilities for employee severance benefits are calculated pursuant to the employment agreement in effect at the time of their employment and based on the employee's wages which, in management's opinion, creates entitlement to the severance benefits, taking into consideration the number of years of employment.
The Company and its subsidiaries have an approval from the Ministry of Labor and Welfare in accordance with Section 14 of the Severance Pay Law, 1963, pursuant to which its regular deposits with pension funds and/or insurance policies, exempt it from any further obligation to employees, in respect of whom the aforementioned deposits were made. The Group deposits 8.33%-11.33% of the monthly wages of its employees in different benefit plans. The Groups has no legal or implied obligation to make additional payments if the plan will not have sufficient assets to pay the entire employee benefits relating to the employee's service during current and past periods. The total amount of the expenses recognized in the statement of income in respect of defined benefit plans in the year that ended on December 31, 2010 is NIS 35,185 thousands (2009 – NIS 22,803 thousands, 2008 – NIS 15,889 thousands).
F - 47
HADERA PAPER LTD
NOTES TO CONSOLIDATED FINANCIAL STATEMENTS
NOTE 11 - EMPLOYEE BENEFITS (cont.)
| B. | Post Employment Benefits (cont.) |
| (2) | Post Employment Benefits at defined deposit Plans |
| a) | General |
Severance pay obligation
Labor laws and the severance pay law in Israel and abroad require companies in the Group to pay severance benefits to employees who are dismissed, resign or retire from their employment under different specific circumstances. Liabilities for employee severance benefits are calculated pursuant to the employment agreement in effect at the time of their employment and based on the employee's wages which, in management's opinion, creates entitlement to the severance benefits, taking into consideration the number of years of employment.
The defined benefit liability was measured using actuarial assessments. The present value of the defined benefit liability and the related costs of current service and past service were measured using the projected unit credit method.
Benefits to retirees
Other long-term employee benefits are benefits which are expected to be utilized or which are payable during a period greater than 12 months from the end of the period in which the entitling service was provided.
Other employee benefits in the Company include liabilities in respect of retiree's holiday gift. These benefits are included in the retained earnings in accordance with the Projected Unit Credit Method, while using actuarial assessments at the end of each reporting period. The current value of the Company's liability for retirees benefits is determined by discounting the projected future cash flows from the plan based on market yields of government bonds, which are stated in the currency in which pensioners benefits will be paid, whose terms to maturity are identical to the projected pensioners benefits payment dates.
Profits and losses are carried to the income statement as incurred. Past service cost is immediately recognized in the Company's financial statements.
| b) | Changes in the current value of the liability in respect of severance pay |
For the year ended December 31 | ||||||||
2010 | 2009 | |||||||
NIS in thousand | ||||||||
| Opening Balance | 23,367 | *23,615 | ||||||
| Current service cost | 1,947 | *1,942 | ||||||
| Interest rate cost | 966 | 1,229 | ||||||
| Actuarial losses (gains) | (141 | ) | 284 | |||||
| Paid-up benefits | (3,688 | ) | (3,118 | ) | ||||
| Liabilities assumed in business combinations | 92 | - | ||||||
| Impact of any reduction or disposal | 580 | (585 | ) | |||||
| Closing balance | 23,123 | 23,367 | ||||||
* Reclassified
F - 48
HADERA PAPER LTD
NOTES TO CONSOLIDATED FINANCIAL STATEMENTS
NOTE 11 - EMPLOYEE BENEFITS (cont.)
| B. | Post Employment Benefits (cont.) |
| (2) | Post Employment Benefits at defined deposit Plans (cont.) |
| c) | Changes in the fair value of plan assets |
For the year ended December 31 | ||||||||
2010 | 2009 | |||||||
NIS in thousand | ||||||||
| Opening balance | 20,969 | *20,054 | ||||||
| Projected return on plan assets | 1,006 | 995 | ||||||
| Actuarial gains | 466 | 1,445 | ||||||
| Deposits by the employer | 1,237 | *1,715 | ||||||
| Paid-up benefits | (3,477 | ) | (2,316 | ) | ||||
| Impact of any reduction or disposal | 558 | (924 | ) | |||||
| Closing balance | 20,759 | 20,969 | ||||||
* Reclassified
| d) | Changes in the current value of the liability in respect of benefits to retirees |
As of December 31 | ||||||||
2010 | 2009 | |||||||
NIS in thousand | ||||||||
| Opening balance | 7,754 | 7,632 | ||||||
| Current service cost | 80 | 80 | ||||||
| Interest rate cost | 411 | 440 | ||||||
| Actuarial losses | 467 | 258 | ||||||
| Paid-up benefits | (625 | ) | (656 | ) | ||||
| Liabilities assumed in business combinations | 1,318 | - | ||||||
| Impact of any reduction or disposal | 1 | - | ||||||
| Closing balance | 9,406 | 7,754 | ||||||
| C. | Main actuarial assumptions as of the end of the reporting period of post employment benefits |
As of December 31 | ||||||||
2010 | 2009 | |||||||
% | % | |||||||
| Discount rate | 4.72 | % | 4.72 | % | ||||
| Projected rates of return regarding asset plans | 5.72 | % | 5.08 | % | ||||
| Projected rates of salary increases | 2.94 | % | 3.57 | % | ||||
| Churn and departure rates | 9.25 | % | 9.25 | % | ||||
Assumptions regarding future mortality rates are based on statistic data and mortality tables published by the Commissioner of the Capital Market in the Ministry of Finance in Pension Circular 2007-3-6, which are adjusted as of December 31, 2010. The average life expectancy for men that retired at the age of 67 is 17.4 while the average life expectancy for women that retired at the age of 62-64 is 22.5-24.3.
The projected rate of return on plan assets is based on a nominal rate of return that varies according to the type of fund.
F - 49
HADERA PAPER LTD
NOTES TO CONSOLIDATED FINANCIAL STATEMENTS
NOTE 11 - EMPLOYEE BENEFITS (cont.)
| D. | Amounts recognized in the statement of income in respect of post employment benefits |
For the year ended December 31 | ||||||||
2010 | 2009 | |||||||
NIS in thousand | ||||||||
| Current service cost | 2,027 | 2,022 | ||||||
| Interest rate cost | 1,377 | 1,669 | ||||||
| Projected return on the plan's assets | (1,006 | ) | (995 | ) | ||||
| past service cost | 23 | 339 | ||||||
| 2,421 | 3,035 | |||||||
| The expense were included in the following items: | ||||||||
| Cost of sales | 1,487 | 1,140 | ||||||
| Selling expenses | 252 | 476 | ||||||
| Administrative and general expenses | 311 | 745 | ||||||
| Financing expenses | 371 | 674 | ||||||
| 2,421 | 3,035 | |||||||
| E. | Severance pay benefits |
The benefits include only early retirement liability.
NOTE 12 - SHAREHOLDERS’ EQUITY
| A. | Share capital |
Composed of ordinary registered shares of NIS 0.01 par values, as follows:
December 31 | ||||||||||||
2010 | 2009 | |||||||||||
Authorized | Issued and paid | |||||||||||
| Number of shares of NIS 0.01 | 20,000,000 | 5,084,881 | 5,060,872 | |||||||||
| Amount in NIS | 200,000 | 50,849 | 50,609 | |||||||||
The shares are traded on stock exchanges in Tel-Aviv and in the U.S. ("AMEX"). The quoted prices per share, as of December 31, 2010 are NIS 296.0 and $ 82.22 (NIS 291.8), respectively.
| B. | Employee stock option plans |
| 1) | The 2008 plan for senior officers in the Group |
In January 2008, the Board of Directors of the Company approved a program for the allotment, for no consideration, of non marketable options to the CEO of the company, to employees and officers of the company and associated companies. In the context of the program, an allotment of 285,750 options was approved, of which 40,250 options were to the CEO of the company, 135,500 to management of the subsidiaries and 74,750 to management of the associated companies.
The granting date of the options was determined to January-March 2008, pursuant to the restrictions of Section 102 (equity track) of the Income Tax Ordinance.
As of May 11, 2008 , all of the options have been allocated, of which 35,250 allotted to a trustee, as a pool for future grants to officers in associated companies, subject to the approval of the Board of Directors.
F - 50
HADERA PAPER LTD
NOTES TO CONSOLIDATED FINANCIAL STATEMENTS
NOTE 12 - SHAREHOLDERS’ EQUITY: (cont.)
| B. | Employee stock option plans: (cont.) |
| 1) | The 2008 plan for senior officers in the Group (cont.) |
On January 8, 2009 34,000 options were allocated, each exercisable into an ordinary share of the Company, out of the allocated options to directors in an associated company, so that 1,250 options remain at the trustee, which were cancelled in accordance with the resolution of the Board of Directors of the Company dated August 9, 2009.
Each option is exercisable into one ordinary share of the company with NIS 0.01 par value against the payment of an exercise increment in the amount of NIS 223.965. The options will vest in installments as follows: 25% of the total options will be exercisable from January 14, 2009; 25% of the total options will be exercisable from January 14, 2010; 25% of the total options will be exercisable from January 14, 2011; and 25% of the total options will be exercisable from January 14, 2012. The vested options are exercisable through January 14, 2012, 2013, 2014 for the first and second, third and fourth portions, respectively.
The cost of the benefit embedded in the allotted options as above, on the basis of the fair value as of the date they are granted, was approximated to be the amount of approximately NIS 13.8 million. This amount was charged to the statement of operations over the vesting period. The debt for the grant to officers of the associated companies will be paid in cash.
The fair value of the options granted as aforementioned was estimated by applying the Black and Scholes model. In this context, the effect of the terms of vesting will not taken into account by the company, other than the market condition of fair value of the capital instruments granted.
The parameters which were used for implementation of the model are as follows:
| Share price (NIS) | 217.10-245.20 | |||
| Exercise price (NIS) | 223.965 | |||
| Anticipated volatility (*) | 27.04 | % | ||
| Length of life of the options (years) | 3-5 | |||
| Non risk interest rate | 5.25 | % |
(*) The anticipated volatility is determined on the basis of historical fluctuations of the share price of the company. The average length of life of the option was determined in accordance with management’s forecast as to the holding period by the employees of options granted to them, in consideration of their functions in the company and past experience of the company with employees leaving.
| 2) | Additional details of options granted to employees |
| 2010 | 2009 | |||||||||||||||
| No. Of options | Weighted average of the exercise price | No. Of options | Weighted average of the exercise price | |||||||||||||
| Options granted to employees which: | ||||||||||||||||
| Outstanding at the start of the period | 261,500 | 223.96 | 246,250 | 223.96 | ||||||||||||
| Granted | - | - | 34,000 | 223.96 | ||||||||||||
| Forfeited | - | - | (17,686 | ) | 223.96 | |||||||||||
| Exercised | (103,462 | ) | 223.96 | (1,064 | ) | 223.96 | ||||||||||
| Outstanding at the end of the period | 158,038 | 223.96 | 261,500 | 223.96 | ||||||||||||
F - 51
HADERA PAPER LTD
NOTES TO CONSOLIDATED FINANCIAL STATEMENTS
NOTE 13 - INCOME TAX CHARGE
| A. | Deferred income taxes |
The composition of the deferred taxes assets (liabilities), are as follows:
Balance at January 1, 2009 | Recognized in profit and loss | Recognized in equity | Balance at December 31, 2009 | Recognized in profit and loss | Recognized in equity | Entry into consolidation | Balance at December 31, 2010 | |||||||||||||||||||||||||
| NIS in thousands | ||||||||||||||||||||||||||||||||
| Temporary differences | ||||||||||||||||||||||||||||||||
| Hedging cash flow | (200 | ) | - | 200 | - | - | - | - | - | |||||||||||||||||||||||
| Intangible assets | (7,031 | ) | 2,021 | - | (5,010 | ) | 765 | - | - | (4,245 | ) | |||||||||||||||||||||
| Fixed assets | (69,410 | ) | 16,367 | - | (53,043 | ) | (17,255 | ) | (830 | ) | (25,255 | ) | (96,383 | ) | ||||||||||||||||||
| Employee benefits provisions | 8,493 | (326 | ) | (509 | ) | 7,658 | 378 | (26 | ) | 1,748 | 9,758 | |||||||||||||||||||||
| Doubtful debts | 5,930 | 1,390 | - | 7,320 | 400 | - | 1,680 | 9,400 | ||||||||||||||||||||||||
| Inventory | (169 | ) | 33 | - | (136 | ) | 168 | 112 | - | 144 | ||||||||||||||||||||||
| Total | (62,387 | ) | 19,485 | (309 | ) | (43,211 | ) | (15,544 | ) | (744 | ) | (21,827 | ) | (81,326 | ) | |||||||||||||||||
| unutilized losses and tax benefits | ||||||||||||||||||||||||||||||||
| losses for tax purposes | 15,594 | (691 | ) | - | 14,903 | 23,284 | 2 | - | 38,189 | |||||||||||||||||||||||
| Total | (46,793 | ) | 18,794 | (309 | ) | (28,308 | ) | 7,740 | (742 | ) | (21,827 | ) | (43,137 | ) | ||||||||||||||||||
F - 52
HADERA PAPER LTD
NOTES TO CONSOLIDATED FINANCIAL STATEMENTS
NOTE 13 - INCOME TAX CHARGE (cont.)
| A. | Deferred income taxes (cont.) |
Deferred taxes are presented in the statements of financial position as follows:
December 31 | ||||||||
2010 | 2009 | |||||||
NIS in thousands | ||||||||
| Among non-current assets - Deferred tax assets | 2,165 | 2,096 | ||||||
| Among non-current liabilities - Deferred tax liabilities | (45,302 | ) | (30,404 | ) | ||||
| Total | (43,137 | ) | (28,308 | ) | ||||
The Group anticipates the existence of taxable income in future periods apart from profits that will arise from the reversal of taxable temporary differences. The Group also recognized losses for tax purposes, which are expected to be utilized in the next few years against capital gains. As a result of the aforesaid, deferred tax assets were created.
| B. | Amounts in respect of which deferred tax assets were not recognized |
For the year ended December 31 | ||||||||
2010 | 2009 | |||||||
NIS in thousands | ||||||||
| Real losses from securities | 11,786 | 11,786 | ||||||
| Capital losses for tax purposes | - | 7,126 | ||||||
| Total | 11,786 | 18,912 | ||||||
Expiration dates:
in accordance with the tax laws in effect, there is no expiration date for the utilization of losses for tax purposes. The Company does not anticipate any profits in the foreseeable future that will allow it to utilize these losses and has therefore not created deferred tax assets in respect thereof.
| C. | Taxes that refer to components in the Other Comprehensive Income |
For the year ended December 31, 2010 | ||||||||||||
| Sums before Tax on income | Tax influence | Sums after tax on income | ||||||||||
NIS in thousands | ||||||||||||
| Other Comprehensive income (net, after reclassification to profit and loss): | ||||||||||||
| Profit from cash flow hedging | 1,044 | - | 1,044 | |||||||||
| Actuarial gain from a defined benefit plan | 140 | (24 | ) | 116 | ||||||||
| Total | 1,184 | (24 | ) | 1,160 | ||||||||
F - 53
HADERA PAPER LTD
NOTES TO CONSOLIDATED FINANCIAL STATEMENTS
NOTE 13 - INCOME TAX CHARGE (cont.)
| C. | Taxes that refer to components in the Other Comprehensive Income (cont.) |
For the year ended December 31, 2009 | ||||||||||||
| Sums before Tax on income | Tax influence | Sums after tax on income | ||||||||||
NIS in thousands | ||||||||||||
| Other Comprehensive income (net, after reclassification to profit and loss): | ||||||||||||
| Profit from cash flow hedging | 3,862 | 200 | 4,062 | |||||||||
| Actuarial gain from a defined benefit plan | 986 | (509 | ) | 477 | ||||||||
| Total | 4,848 | (309 | ) | 4,539 | ||||||||
For the year ended December 31 2008 | ||||||||||||
| Sums before Tax on income | Tax influence | Sums after tax on income | ||||||||||
NIS in thousands | ||||||||||||
| Other Comprehensive income (net, after reclassification to profit and loss): | ||||||||||||
| Loss from cash flow hedging | (1,937 | ) | (369 | ) | (2,306 | ) | ||||||
| Actuarial loss from a defined benefit plan | (1,501 | ) | - | (1,501 | ) | |||||||
| Capital reserve from revaluation from step acquisition | 17,288 | - | 17,288 | |||||||||
| Total | 13,850 | (369 | ) | 13,481 | ||||||||
| D. | Tax expense (income) on income recognized in profit and loss |
| 1) | As follows: |
For the year ended December 31 | ||||||||||||
2010 | 2009 | 2008 | ||||||||||
NIS in thousands | ||||||||||||
| For the reported year: | ||||||||||||
| Current | 5,002 | 11,727 | 7,826 | |||||||||
| Former Years | (212 | ) | - | - | ||||||||
| Deferred taxes in respect of the reporting period | (7,740 | ) | (18,794 | ) | (4,163 | ) | ||||||
| (2,950 | ) | (7,067 | ) | 3,663 | ||||||||
Current taxes in 2010 were computed at an average tax rate of 25%, 2009– 26% and 2008- 27%, see 2 below.
F - 54
HADERA PAPER LTD
NOTES TO CONSOLIDATED FINANCIAL STATEMENTS
NOTE 13 - INCOME TAX CHARGE (cont.)
| D. | Tax expense (income) on income recognized in profit and loss (cont.) |
| 2) | Following is a reconciliation of the “theoretical” tax expense, assuming all income is taxed at the regular rate applicable to companies in Israel, as stated in c above, and the actual tax expenses in the income statement, for the reported year: |
| 2010 | 2009 | 2008 | ||||||||||
| NIS in | NIS in | NIS in | ||||||||||
thousands | thousands | thousands | ||||||||||
| Income (loss) before taxes on income | 97,662 | 84,681 | 71,623 | |||||||||
| Tax expenses at statutory tax rate | 24,416 | (22,017 | ) | 19,338 | ||||||||
| Tax increments (savings) due to: | ||||||||||||
| Company's share of after-tax income of investees | (20,283 | ) | (22,713 | ) | (13,855 | ) | ||||||
| Adjustments due to tax rate changes | (5,186 | ) | (8,571 | ) | (803 | ) | ||||||
| Losses for tax purposes on whose account deferred tax assets were not recognized in the past, yet for whom deferred taxes were recognized during the reported period | - | (1,103 | ) | (2,103 | ) | |||||||
| Tax expenditures calculated by different tax rate | (2,362 | ) | 3,736 | - | ||||||||
| Non-taxable income | - | (500 | ) | (3,958 | ) | |||||||
| Non-deductible expenses | 772 | 1,135 | 4,629 | |||||||||
| Other differences, net | (96 | ) | (1,068 | ) | 415 | |||||||
| (2,739 | ) | (6,371 | ) | (1,820 | ) | |||||||
| Adjustments performed during the year in respect of prior years current taxes | (211 | ) | - | - | ||||||||
| Taxes on income as presented in profit and loss | (2,950 | ) | (7,067 | ) | 3,663 | |||||||
| E. | Tax assessments |
The Company and most of its subsidiaries have received final tax assessments through the year ended December 31, 2006.
| F. | Measurement of results for tax purposes under the Income Tax (Inflationary Adjustments) Law, 1985 (hereafter - the inflationary adjustments law) |
On February 26, 2008, the Knesset ratified the third reading of the Income Tax Law (Inflation Adjustments) (Amendment 20) (Limitation of Term of Validity) - 2008 (hereinafter: "The Amendment"), pursuant to which the application of the inflationary adjustment law will terminate in tax year 2007 and as of tax year 2008, the law will no longer apply, other than transition regulations whose intention it is to prevent distortions in tax calculations.
According to the amendment, from tax year 2008 and thereafter, the adjustment of revenues for tax purposes will no longer be considered a real-term basis for measurement.
Moreover, the linkage to the CPI of the depreciated sums of fixed assets and carryover losses for tax purposes will be discontinued, in a manner whereby these sums will be adjusted until the CPI at the end of 2007 and their linkage to the CPI will end as of that date.
F - 55
HADERA PAPER LTD
NOTES TO CONSOLIDATED FINANCIAL STATEMENTS
NOTE 13 - INCOME TAX CHARGE (cont.)
| G. | More details |
| 1. | In accordance with Amendment No. 147 of the Income Tax Ordinance, 2005, a tax rate of 34% which is applicable to companies was gradually reduced starting from 2006 (for which a tax rate of 31% was determined) until 2010 - for which a tax rate of 25% was determined (the tax rate in the years 2007, 2008 and 2009 is 29%, 27% and 26%, respectively). |
| 2. | The Economic Efficiency Law (Legal Amendments to the Implementation of the Economic Program for 2009 and 2010) of 2009 was published in July 23, 2009 (hereinafter: "The Settlement Law"). According to the Settlement Law, the tax rates of 26% and 25% that apply to companies in the years 2009 and 2010, respectively, will be gradually reduced starting in fiscal year 2011, for which a company tax rate of 24% was set, through to fiscal year 2016, for which a company tax rate of 18% was determined. Subsequent to this change, the company recognized deferred tax revenues in the amount of NIS 2,363 thousands, and NIS 8,571 thousands in 2010 and 2009, respectively. |
| 3. | On December 29, 2010 the KNESSET passed the Economic Policy Act for the years 2011-2012 (Legislative Amendments), 2011 - which was officially published on January 6, 2011. In conjunction with the Economic Policy Act, the Capital Investment Promotion Act, 1959 was amended (hereinafter: "the amendment to the Act"). Pursuant to the amendment to the Act, the different tax tracks have been eliminated and replaced by fixed tax rates for all of the entity's productive revenues. The fixed tax rates are: In 2011-2012- 15% (in Region A, 10% -') in 2013-12.5% 2014 (in Region A 7%) and from 2015 onwards (12% (in Region A( 6% - ' Provisions of the amendment to the Act became effective as from January 1, 2011. The Company may elect whether to be subject to the amendment to the Act and waive the remaining benefits to which it is entitled pursuant to the Act prior to its amendment. |
The Company does not anticipate that provisions of the amendment to the Act would significantly affect its taxable revenues.
NOTE 14 – COMMITMENTS AND CONTINGENT LIABILITIES
| A. | Subsidiaries provided guarantees to various entities, in connection with tenders, in the aggregate amount of approximately NIS 3,470 thousands. |
| B. | In accordance with the Companies Law, 1999, the Company issued new letters of indemnity to its officers in 2004 (with an amendment from 2006), pursuant to which the Company undertakes to indemnify the officers for any liability or expense, for which indemnification may be paid under the law, that may be incurred by the officers in connection with actions performed by them as part of their duties as officers in the Company, which are directly or indirectly related to the events specified in the addendum to the letters of indemnity, provided that the total amount of indemnification payable to the officers, shall not exceed 25% of the Company’s shareholders’ equity as per its latest financial statements published prior to the actual indemnification. The liability of officers in connection with the performance of their duties, as above, is partly covered by an insurance policy. |
| C. | During the years 2008 and 2009, the Company has engaged in a contract with the main equipment suppliers for the new manufacturing facility of packaging papers ("machine no. 8"), for the total sum of €62.3 million. Most of the equipment supplied during 2008 2009 and 2010. Balance at December 31, 2010 is approximately 4 million Euro. |
F - 56
HADERA PAPER LTD
NOTES TO CONSOLIDATED FINANCIAL STATEMENTS
NOTE 14 – COMMITMENTS AND CONTINGENT LIABILITIES (cont.)
| D. | In the last quarter of 2007, the Company signed an agreement with a gas company for the transmission of gas for a period of 6 years with a two-year extension option. The total financial value of the transaction is NIS 13.8 million. |
| E. | In November 3, 2008, the general meeting of the company approved the validity of a lease agreement signed on September 18, 2008 between the Company and Gev-Yam Lands Ltd (hereinafter – "the lessor"), a public company indirectly controlled by the controlling shareholder in the Company, pursuant to which the Company will rent a plot in Modiin, with a space of 74,500 square meters, and buildings that the lessor plans to build for the Company, covering a total space of 21,300 square meters, which will be used as a center for the purposes of logistics, industry and office (hereinafter – "the logistic center") for subsidiaries and associated companies of the Company and in part will substitute existing lease agreements. The term of the lease will be 15 years from the date of delivery of possession in the leased property in addition to which the Company will have an option to extend the lease by a further 9 years and 11 months. The cost of annual lease amounts to NIS 13.6 million linked to the Consumer Price Index for July 2008. |
| F. | In November 2006, the Environmental Protection Ministry announced that, even though the company plant at Hadera has made considerable investments in sewage treatment and environmental protection issues, an investigation may be launched against it to review deviations from certain emission standards into the air. Based on the opinion of its legal advisors, the Company anticipates that the investigation will not materially impact its operations. |
| G. | Against the company and its subsidiaries there are several pending and open claims and financial demands in a total amount of approximately NIS 14,738 thousands (December 31, 2009: NIS 11,550 thousands), in respect of them a provision was credited in a sum of NIS 9,593 thousands (December 31, 2009: NIS 5,345 thousands was recorded. See additional details in sections h-l below. |
| H. | In September 2008 the Municipality of Hadera submitted a request for payment of a land betterment levy in the amount of 1.4 million in respect of a change in the use of land which is designated for the construction of a new manufacturing line for packaging papers. The Company contested the amount of the levy with a counter assessment in the amount of NIS 28 thousands. The Company recorded a provision of NIS 900 thousands in these financial statements in light of an expected settlement between the parties. |
| I. | A demand to pay purchasing tax of NIS 1,460 thousands was submitted to the Company in respect of the extension of the lease on a plot of land located in Totzeret Haaretz Street in Tel Aviv (formerly the Shafir plant). A decision was handed down by the appeals committee pursuant to which the Company was required to pay a total of NIS 1,390 thousands and the Company paid the amount. Both the Company and the Tax Authority have appealed this decision to the Supreme Court. |
| J. | In December 2006 Israel Natural Gas Lines Ltd (hereinafter –"Natural Gas Lines") informed the Company that owners of lands close to the gas production plan have initiated a damages claim against Natural Gas Lines in respect of impairment. It should be noted that the agreement between the Company and Natural Gas Lines addresses the indemnification of Natural Gas Lines as part of the payment of compensation due to harm to adjacent land. The proceeding is conducted before the appeals committee and the Company is not a party to the proceedings. On February 25, 2010, the Company received the Committee decision to set the damages at NIS 2,670 thousand. Natural Gas Lines and the land owners have appealed the Committee's decision. On December 10, 2010, these appeals were rejected. The Company received a payment demand from Natural Gas Lines and recorded a provision on its financial statements as of December 31, 2010. |
F - 57
HADERA PAPER LTD
NOTES TO CONSOLIDATED FINANCIAL STATEMENTS
NOTE 14 – COMMITMENTS AND CONTINGENT LIABILITIES (cont.)
| K. | During the year of 2009, as part of a formal tax inspection of the Turkish Tax Authorities, the Financial Reports for the years 2004-2008 of KCTR the Turkish subsidiary ("KCTR") of the associated company Hogla- Kimberly Ltd, held by 49.9% were examined. |
On February 16, 2010, KCTR received a tax inspection report, following the aforementioned inspection, according to which KCTR is required to an additional tax payment for two matters audited, as detailed below, on the total amount of 135 millions YTL (approximately 89 millions USD) including interest and penalty.
Regarding the first matter (stamp tax), KCTR, paid YTL 264 thousands, (approximately USD 106 thousands) in July 2010.
Regarding the second matter, which is the essential part of the tax demand (tax on capital injection from Hogla- Kimberly to KCTR), KCTR, based on its tax consultant opinion, estimates that the likelihood that it will be demanded for the additional tax payment, is rather low, and therefore it has not provided a provision at its Financial Reports for December 31, 2010, with regards to this matter. Also note that KCTR, based on the opinion of its tax consultants in Turkey, appealed to the Court the demand by the Tax Authority with regard to the second matter. As of the date of these financial statements, the proceedings are on-going at the first instance of the Turkish Court system.
| L. | On June 15, 2010, an associated company Hogla-Kimberly Ltd. and another competitor company received a petition for the approval of a class action against them. |
According to the petition, the Competitor and Hogla-Kimberly Ltd. has misled the public by presenting plastic bags as oxo biodegradable and therefore environmentally friendly, while the products are breaking down into fragments.
The plaintiff estimates the scope of the petition against Hogla-Kimberly, if approved as class action, to be approximately NIS 111 million. Hogla-Kimberly estimates, based on its legal advisors opinion, that at this stage the probability of the request for approval of a class action lawsuit will be approved is not higher than the probability that it will be rejected, therefore Hogla-Kimberly did not provide a provision at its financial statements for this petition.
F - 58
HADERA PAPER LTD
NOTES TO CONSOLIDATED FINANCIAL STATEMENTS
NOTE 15 - SUPPLEMENTARY FINANCIAL STATEMENT INFORMATION:
Statement of financial position:
| A. | Account Receivables: |
December 31 | ||||||||
2010 | 2009 | |||||||
NIS in thousands | ||||||||
| 1) Trade receivables : | ||||||||
Open accounts | 516,690 | 293,682 | ||||||
Checks collectible | 48,239 | 30,200 | ||||||
| 564,929 | 323,882 | |||||||
The item is: | ||||||||
Net of allowance for doubtful accounts | 32,618 | 24,236 | ||||||
Includes associated companies | 11,005 | 12,556 | ||||||
December 31 | ||||||||
2010 | 2009 | |||||||
NIS in thousands | ||||||||
Aging of customers debts: | ||||||||
| Are not in delay | 526,217 | 275,020 | ||||||
| Delay till 6 months | 47,859 | 43,543 | ||||||
| Delay from 6 months to 12 months | 5,964 | 4,597 | ||||||
| Delay from 12 months to 24 months | 1,309 | 3,371 | ||||||
| Delay more then 24 months | 16,198 | 21,587 | ||||||
| Total | 597,547 | 348,118 | ||||||
| Deduction of allowance for doubtful accounts | 32,618 | 24,236 | ||||||
| 564,929 | 323,882 | |||||||
2010 | 2009 | |||||||
NIS in thousands | ||||||||
Movement in provision for doubtful debts during the year: | ||||||||
| Balance at beginning of the year | 24,236 | 22,652 | ||||||
| Impairment losses recognized on receivables | 4,165 | 2,848 | ||||||
| Amounts written off as uncollectible | (1,491 | ) | (261 | ) | ||||
| Amounts recovered during the year | (440 | ) | (340 | ) | ||||
| Reversal of impairment losses in respect of accounts receivable | (848 | ) | (663 | ) | ||||
| Entry into consolidation | 6,996 | - | ||||||
| Balance at the end of the year | 32,618 | 24,236 | ||||||
F - 59
HADERA PAPER LTD
NOTES TO CONSOLIDATED FINANCIAL STATEMENTS
NOTE 15 - SUPPLEMENTARY FINANCIAL STATEMENT INFORMATION: (cont.)
Statement of financial position: (cont.)
| A. | Account Receivables: (cont.) |
December 31 | ||||||||
2010 | 2009 | |||||||
NIS in thousands | ||||||||
| 2) Other receivables: | ||||||||
Employees and employee institutions | 1,049 | 1,702 | ||||||
Customs and VAT authorities | 180 | 2,036 | ||||||
Associated companies - current debt | 37,539 | 81,460 | ||||||
Prepaid expenses | 5,915 | 4,595 | ||||||
Advances to suppliers | 3,078 | 2,252 | ||||||
Accounts Receivable | 8,607 | 3,310 | ||||||
| Others | 691 | 3,542 | ||||||
| 57,059 | 98,897 | |||||||
| 3) | Available-for-sale financial assets: |
In November 2010, the Company acquired 18.37% (or 16.84% fully diluted) of shares of BONDEX, for consideration of USD 450 thousand. BONDEX is engaged in research and development of BONDER, a biological material intended to provide improved strength and water-resistance features to packaging paper. The other shareholders of BONDEX, as of the date of this report and to the best of the Company's knowledge, are third parties which are not interested parties in the Company, as follows: private investors - 2.49%, founders - 31.75%, R&D facility and other entities - 47.39%. As of the approval date of these financial statements, the Company was diluted to 16.33% (or 13.70% fully diluted), due to acquisition of 11.11% of BONDEX shares by a foreign investor.
| B. | Inventories: |
| December 31 | ||||||||
2010 | 2009 | |||||||
NIS in thousands | ||||||||
| For industrial activities: | ||||||||
Products in process | 14,066 | 2,603 | ||||||
Finished goods | 84,583 | 67,149 | ||||||
Raw materials and supplies | 140,482 | 65,881 | ||||||
| Total for industrial activities | 239,131 | 135,633 | ||||||
| For commercial activities - purchased products | 72,880 | 20,799 | ||||||
| 312,011 | 156,432 | |||||||
| Maintenance and spare parts * | 31,508 | 19,512 | ||||||
| 343,519 | 175,944 | |||||||
* Including inventories for the use of associated companies.
Additional information – the amount of inventory recognized during the period under cost of sale amounted to NIS 431,120 thousand in 2010 (2009 – NIS 345,610 thousand).
F - 60
HADERA PAPER LTD
NOTES TO CONSOLIDATED FINANCIAL STATEMENTS
NOTE 15 - SUPPLEMENTARY FINANCIAL STATEMENT INFORMATION: (cont.)
Statement of financial position: (cont.)
| C. | Credit from banks: |
| Weighted average Interest rate on December 31, 2010 | ||||||||||||
December 31 | ||||||||||||
2010 | 2009 | |||||||||||
% | NIS in thousands | |||||||||||
| Unlinked | 3.25-4.5 | 144,622 | 131,572 | |||||||||
See note 10b above
| D. | Trade payable and accruals - other: |
December 31 | |||||||||||
2010 | 2009 | ||||||||||
NIS in thousands | |||||||||||
| 1 | ) | Trade payables: | |||||||||
Open accounts | 365,745 | 250,235 | |||||||||
Checks payable | 4,320 | 5,660 | |||||||||
| 370,065 | 255,895 | ||||||||||
| 2 | ) | Other payables: | |||||||||
Payroll and related expenses | 52,215 | 45,405 | |||||||||
Institutions in respect of employees | 20,690 | 21,196 | |||||||||
Accrued interest | 17,809 | 19,194 | |||||||||
Accrued expenses | 18,398 | 14,619 | |||||||||
| Income in advance | 6,563 | - | |||||||||
Initial consolidation | 49,368 | - | |||||||||
Others | 7,252 | 12,331 | |||||||||
| 172,295 | 112,745 | ||||||||||
Statements of income:
| E. | Sales (1) |
Year ended December 31 | |||||||||||||
2010 | 2009 | 2008 | |||||||||||
NIS in thousands | |||||||||||||
| Industrial operations (2) | 933,540 | 733,938 | 542,244 | ||||||||||
| Commercial operations | 187,468 | 158,057 | 131,240 | ||||||||||
| 1,121,008 | 891,995 | 673,484 | |||||||||||
| (1) Including sales to associated companies | 191,222 | 186,410 | 132,375 | ||||||||||
| (2) Including sales to export | 175,028 | 69,800 | 55,757 | ||||||||||
F - 61
HADERA PAPER LTD
NOTES TO CONSOLIDATED FINANCIAL STATEMENTS
NOTE 15 - SUPPLEMENTARY FINANCIAL STATEMENT INFORMATION: (cont.)
Statements of income: (cont.)
| F. | Cost of sales: |
Year ended December 31 | ||||||||||||
2010 | 2009 | 2008 | ||||||||||
NIS in thousands | ||||||||||||
| Industrial operations: | ||||||||||||
| Materials consumed | 295,184 | 233,520 | 143,392 | |||||||||
| Expenditure on the basis of benefits to employees (see h below) | 215,102 | 206,903 | 149,212 | |||||||||
| Depreciation and amortization | 76,856 | 67,497 | 53,144 | |||||||||
| Other manufacturing costs | 204,743 | 160,383 | 115,027 | |||||||||
| increase in inventory of finished goods | 18,053 | (14,716 | ) | (11,879 | ) | |||||||
| 809,938 | 653,587 | 448,896 | ||||||||||
| Commercial operations - cost of products sold | 135,484 | 112,090 | 93,491 | |||||||||
| 945,422 | 765,677 | 542,387 | ||||||||||
| G. | Selling, marketing, administrative and general expenses: |
Year ended December 31 | ||||||||||||
2010 | 2009 | 2008 | ||||||||||
NIS in thousands | ||||||||||||
| Selling and marketing: | ||||||||||||
Expenditure on the basis of benefits to employees (see h below) | 35,097 | 30,095 | 18,568 | |||||||||
Packaging, transport and shipping | 35,372 | 27,843 | 15,670 | |||||||||
Commissions | 4,250 | 2,405 | 2,684 | |||||||||
Depreciation and amortization | 3,933 | 4,101 | 1,246 | |||||||||
Other | 8,549 | 7,554 | 7,506 | |||||||||
| 87,201 | 71,998 | 45,674 | ||||||||||
| Administrative and general: | ||||||||||||
Expenditure on the basis of benefits to employees (see h below) | 60,618 | 57,388 | 55,735 | |||||||||
Office supplies, rent and maintenance | 4,451 | 3,698 | 2,222 | |||||||||
Professional fees | 3,941 | 4,318 | 3,210 | |||||||||
Depreciation and amortization | 4,858 | 6,501 | 5,097 | |||||||||
Doubtful accounts and bad debts | 1,930 | 2,290 | 233 | |||||||||
Other | 12,621 | 12,873 | 15,006 | |||||||||
| 88,419 | 87,068 | 81,503 | ||||||||||
Less - rent and participation from associated companies | 28,816 | 28,101 | 26,533 | |||||||||
| 59,603 | 58,967 | 54,970 | ||||||||||
F - 62
HADERA PAPER LTD
NOTES TO CONSOLIDATED FINANCIAL STATEMENTS
NOTE 15 - SUPPLEMENTARY FINANCIAL STATEMENT INFORMATION: (cont.)
Statements of income: (cont.)
| H. | Expenses in respect of employee benefits |
Year ended December 31 | ||||||||||||
2010 | 2009 | 2008 | ||||||||||
NIS in thousands | ||||||||||||
| Composition: | ||||||||||||
| Payroll and bonuses | 277,917 | 271,585 | 201,856 | |||||||||
| Expenses in respect of a defined deposit plan | 35,185 | 22,803 | 15,889 | |||||||||
| Expenses in respect of a defined benefit plan | 2,421 | 3,035 | 477 | |||||||||
| Share-based payment transactions | 2,104 | 2,900 | 5,922 | |||||||||
| Severance benefits | 2,106 | 3,115 | 1,358 | |||||||||
| 319,733 | 303,438 | 225,502 | ||||||||||
| Net of capitalized amounts (see note 6f). | (8,545 | ) | (9,052 | ) | (1,987 | ) | ||||||
| 311,188 | 294,386 | 223,515 | ||||||||||
| I. | Depreciation and amortization |
Year ended December 31 | ||||||||||||
2010 | 2009 | 2008 | ||||||||||
| Composition: | NIS in thousands | |||||||||||
| Depreciation of fixed assets (see note 6) | 83,701 | 73,355 | 53,391 | |||||||||
| Depreciation of leased land | 514 | 913 | 1,178 | |||||||||
| Impairment of intangible assets (see note 8b) | 3,701 | 4,068 | 5,215 | |||||||||
Depreciation of other assets | 131 | 216 | - | |||||||||
| 88,047 | 78,552 | 59,784 | ||||||||||
| J. | Finance income * |
Year ended December 31 | ||||||||||||
2010 | 2009 | 2008 | ||||||||||
NIS in thousands | ||||||||||||
(1) interest income | ||||||||||||
| Interest income from short-term bank deposits | - | - | 108 | |||||||||
| Interest income from short-term balances | 2,039 | 3,436 | 3,912 | |||||||||
| Interest income from short-term loans | - | - | 96 | |||||||||
| Interest income from long-term loans | 2,468 | 3,763 | 592 | |||||||||
| Interest income from operational revaluation – net | 11,647 | 813 | 1,204 | |||||||||
| Total interest income | 16,154 | 8,012 | 5,912 | |||||||||
(2) Other | 148 | 113 | 286 | |||||||||
(3) Net Profit (loss) from financial assets, by groups | ||||||||||||
| Derivative financial instruments designated as hedging items | - | 6,221 | 5,871 | |||||||||
| Less: | ||||||||||||
Amounts capitalized to cost of fixed assets (see note 6e) | (6,988 | ) | (9,619 | ) | - | |||||||
| Total Finance income | 9,314 | 4,727 | 12,069 | |||||||||
| * include financial income of loans to associated companies | 2,468 | 3,763 | 4,790 | |||||||||
F - 63
HADERA PAPER LTD
NOTES TO CONSOLIDATED FINANCIAL STATEMENTS
NOTE 15 - SUPPLEMENTARY FINANCIAL STATEMENT INFORMATION: (cont.)
Statement of income: (cont.)
| K. | Finance expenses |
Year ended December 31 | ||||||||||||
2010 | 2009 | 2008 | ||||||||||
NIS in thousands | ||||||||||||
| 1) interest expenses | ||||||||||||
| Interest expenses from short-term bank loans | 1,359 | 894 | 224 | |||||||||
| Interest expenses from short-term loans | 2,251 | 574 | 3,618 | |||||||||
| Interest expenses from long-term loans | 16,709 | 10,338 | 4,927 | |||||||||
| Interest expenses on account of non-convertible bonds net of related hedges | 45,848 | 39,004 | 34,469 | |||||||||
| Interest expenses from operating monetary balance-net | 1,959 | 10,221 | - | |||||||||
| Other interest expenses | 1,162 | 1,331 | 8,077 | |||||||||
| Total interest expenses | 69,288 | 62,362 | 51,315 | |||||||||
| 2) other | ||||||||||||
| Changes in the fair value of derivative financial instruments designated as hedging items | 7,487 | 824 | - | |||||||||
| Bank commissions | 1,161 | 670 | 501 | |||||||||
| Interest costs from employee benefits | 371 | 673 | 1,360 | |||||||||
| Total other finance expenses | 9,019 | 2,167 | 1,861 | |||||||||
| Less: | ||||||||||||
Amounts capitalized to cost of fixed assets (see note 6e) | (24,228 | ) | (41,537 | ) | (26,064 | ) | ||||||
| Total finance expenses | 54,079 | 22,992 | 27,112 | |||||||||
| L. | Other income |
Year ended December 31 | ||||||||||||
2010 | 2009 | 2008 | ||||||||||
NIS in thousands | ||||||||||||
| Profit from written off a negative cost surplus (1) | - | - | 14,664 | |||||||||
| Capital gain from sale of fixed assets and spare parts inventory | 18,510 | 73 | 237 | |||||||||
| Profit (loss) from revaluation PUT option to associated company | (872 | ) | 1,922 | (10,003 | ) | |||||||
| Gain from revaluation of prior holding at fair value due to achieving control (2) | 5,760 | - | - | |||||||||
| Revenues from unilateral dividend | - | 16,418 | - | |||||||||
| Revenues from sale of other assets, net | (131 | ) | 1,321 | - | ||||||||
| Net allowance, Employer Mutual Fund (3) | 8,529 | - | - | |||||||||
| Other | 717 | 500 | - | |||||||||
| Total Other income | 32,513 | 20,234 | 4,898 | |||||||||
| (1) | In respect of the acquisition of Carmel the Company recognized, in the year 2008, profit of NIS 14,664 thousands because of negative goodwill which was measured as the difference between the fair value of the assets, liabilities and contingent liabilities of Carmel on the date of acquisition and the cost of acquisition. |
| (2) | With respect to acquiring control of Hadera Paper Printing & Writing Paper, effective as from December 31, 2010, the Company recognized gain from fair value measurement of equity interest in Hadera Paper Printing & Writing Paper, pre-acquisition at 49.9%, amounting to NIS 5,760 thousand. |
F - 64
HADERA PAPER LTD
NOTES TO CONSOLIDATED FINANCIAL STATEMENTS
NOTE 15 - SUPPLEMENTARY FINANCIAL STATEMENT INFORMATION: (cont.)
Statement of income: (cont.)
| L. | Other income (cont.) |
| (3) | On December 22, 2010, HADERA PAPER Group was reimbursed contributions amounting in total to NIS 8,529 thousands (hereinafter: "the reimbursement") from the Employer Mutual Fund, as reimbursement of contributions made by the Group to the Fund. The reimbursement was subject to Group commitment to repay these amounts, in whole or in part, in certain cases which the Company believes are unlikely to materialize. |
NOTE 16 - NET INCOME PER SHARE
Following are data relating to the profit and the number of shares (including adjustments to such data) used for the purpose of computing the basic and fully diluted net income per ordinary share. (see note 2BB)
| Net income | ||||||||||||
Year ended December 31 | ||||||||||||
2010 | 2009 | 2008 | ||||||||||
NIS in thousands | ||||||||||||
| Total profit for the period, as reported in the | ||||||||||||
income statements, used in computation of | ||||||||||||
basic net income per share | 100,728 | 91,230 | 69,710 | |||||||||
| Total profit for the purpose of computing | ||||||||||||
diluted income per share | 100,728 | 91,230 | 69,710 | |||||||||
| Number of shares | ||||||||||||
Year ended December 31 | ||||||||||||
| 2010 | 2009 | 2008 | ||||||||||
| Weighted average number of ordinary shares used for | ||||||||||||
computing the basic income per share | 5,078,156 | 5,060,788 | 5,060,774 | |||||||||
| Adjustment in respect of incremental shares of warrants | 40,260 | - | - | |||||||||
| Weighted average number of ordinary shares used for | ||||||||||||
computing the diluted income per share | 5,118,416 | 5,060,788 | 5,060,774 | |||||||||
NOTE 17 - ACQUISITION OF SUBSIDIARY
A. | Acquisition of additional shares of Hadera paper-printing and writing paper |
On September 7, 2010 the company signed an agreement with a subsidiary of Mondi Group ("Mondi Group"), that holds, prior to the transaction, 50.1% of the issued and outstanding share capital of Hadera Paper – Printing and Writing Paper Ltd. - an associated company, formerly "Mondi Hadera Paper Ltd.", (hereinafter – "Printing and Writing Paper Ltd.") pursuant to which Mondi Group will sell to the Company 25.1% of the issued and outstanding share capital of "Printing and Writing Paper" ("Acquisition Transaction").
Prior to the transaction, the Company held 49.9% of the issued and outstanding share capital of "Printing and Writing Paper". Subsequent to the completion of the Acquisition Transaction effective as of December 31 2010, the Company holds 75% of the issued and outstanding share capital of "Printing and Writing Paper", while Mondi Group will hold the remaining 25%.
In consideration of the shares being sold, the Company payed Mondi Group, from its own resources, upon finalization of the Acquisition Transaction, a sum of approximately EURO 10.364 million, on January 5, 2011.
F - 65
HADERA PAPER LTD
NOTES TO CONSOLIDATED FINANCIAL STATEMENTS
NOTE 17 - ACQUISITION OF SUBSIDIARY (cont.)
A. | Acquisition of additional shares of Hadera paper-printing and writing paper (cont.) |
The Acquisition Transaction includes, inter alia, the amendment of the existing shareholder agreement between the parties, pertaining to their holdings in "Printing and Writing Paper" that entered into force upon the finalization of the Acquisition Transaction), including also the changes necessary as a result of the modification of the holding percentages, including the protection of minority interests, rules for the continued cooperation between the shareholders and "Printing and Writing Paper", a non-competition clause, dividend distribution policy and the like, all subject to the provisions of the law.
Moreover, the Acquisition Transaction includes the amendment of the existing agreements between the shareholders and "Printing and Writing Paper" that entered into force upon the finalization of the Acquisition Transaction, (effective from December 31, 2010), including a marketing agreement, rental agreement, agreement for the provision of services and the signing of new agreements that entered into force upon the finalization of the Acquisition Transaction (effective from December 31, 2010), including a subletting agreement and an agreement governing the use of the Mondi brand.
As part of the previous agreement between Hadera Paper and Mondi Group dated November 21, 1999, as set forth in Note 5(3) above, MBP was granted an option to sell to the Company its holding stake in "Printing and Writing Paper", at a price 20% below the value (as defined in the agreement) or $20 million less 20%, whichever is higher. The Acquisition Transaction included the amendment of the Put option, stipulating that it may not be exercised during the first three years subsequent to the date of finalization of the Acquisition Transaction (except for specific circumstances outlined in the agreement). Moreover, it was determined that Mondi Group will be subject to the undertaking not to sell its shares in "Printing and Writing Paper" for a period of three years subsequent to the date of finalization of the Acquisition Transaction (except for specific circumstances outlined in the agreement).
On December 28, 2010, the suspending conditions set forth in the acquisition agreement have been fulfilled for the closing of the transaction. The ancillary agreements in the transaction have been signed and the closing date has been scheduled for December 31, 2010. The parties further determined that the consideration of the transaction will be transferred to the Mondi Group no later than January 10, 2011. Following the closing of the transaction, the Company consolidates the financial statements of "Printing and Writing Paper" into its own financial statements, as of December 31, 2010.
Below is the fair value of the consideration as of the acquisition date:
NIS in thousands | ||||
| Consideration (1) | 51,813 | |||
| Value attributed to change in value of Put option | 18,658 | |||
| Value of non-controlling interests | 14,845 | |||
| Total consideration | 85,316 | |||
| Fair value of investment "Printing and Writing Paper" prior to the business combination (2) | 86,721 | |||
| Total | 172,037 | |||
(1) The cash consideration in the sum of euro 10,364 millions, was paid subsequent to the reported period, on January 5, 2011.
(2) The Group recognized gain of NIS 5,760 thousand, due to fair value measurement of its 49.9% equity interest in "Printing and Writing Paper", held prior to the business combination. Fair value excludes a 1% control premium attributed in conjunction with attribution of the consideration. This gain was included under Other Revenues on the income statement for the year ended December 31, 2010.
F - 66
HADERA PAPER LTD
NOTES TO CONSOLIDATED FINANCIAL STATEMENTS
NOTE 17 - ACQUISITION OF SUBSIDIARY (cont.)
B. | Net cash flow upon acquisition |
NIS in thousands | ||||
| Total cost of acquisition | 51,813 | |||
| Less un-paid consideration | (51,813 | ) | ||
| Consideration paid in cash | - | |||
| Less cash and cash equivalents acquired | (13,111 | ) | ||
| Total | (13,111 | ) | ||
| C. | Amounts recognized with respect to assets and liabilities upon the acquisition date |
| NIS in thousands | ||||
| Financial Assets | 194,716 | |||
| Inventory | 161,649 | |||
Fixed assets | 146,111 | |||
| Goodwill | 12,282 | |||
| Financial Liabilities | (342,721 | ) | ||
| Total identifiable assets, net | 172,037 | |||
D. | Goodwill |
The cost of business combination includes payment of a control premium to acquire "Printing and Writing Paper". Further, the total acquisition cost includes amounts related to expected synergetic benefits (cooperation), revenue growth and future developments in the market in which "Printing and Writing Paper" operates. These benefits are not recognized separately from goodwill, since the future economic benefits there from may not be reliably measured.
Furthermore, the Company has acquired the customer base of " Printing and Writing Paper", which may not be recognized as an intangible asset separate from goodwill, since it cannot be separated from the Group by sale, lease or replacement there of separately or together with a related contract.
All these resulted in goodwill amounting to NIS 12,282 thousand generated by the business combination. It is not expected that any portion of the goodwill recognized would be tax deductible. For further details of the goodwill balance, see Note 9.
E. | Non-controlling interests |
The amount of non-controlling interests in "Printing and Writing Paper" (25%) recognized upon the acquisition date, amounts to NIS 14,845 thousand. The non-controlling interests were estimated at their share of fair value of assets, liabilities and contingent liabilities of the acquired entity, excluding their share of goodwill, plus adjustment of Put option to holders of non-controlling interests, from fair value measurement to measurement using the present value of expected future payment there for.
F. | Cost associated with acquisition |
The cost associated with acquisition, with respect to legal consulting, brokerage and professional services, are included on the income statement for the year ended December 31, 2010 under General and Administrative Expenses, amounting to NIS 267 thousand.
G. | Impact of acquisition on Group results |
Since "Printing and Writing Paper" is consolidated on the Company's financial statements as from December 31, 2010, total revenues and total income for the year ended December 31, 2010 do not include revenues and income attributed to "Printing and Writing Paper". Had the acquisition been made at the start of the year, total Group revenues would have amounted to NIS 1,806,210 thousand, and Group income would have amounted to NIS 106,937 thousand.
F - 67
HADERA PAPER LTD
NOTES TO CONSOLIDATED FINANCIAL STATEMENTS
NOTE 17 - ACQUISITION OF SUBSIDIARY (Cont.)
G. | Impact of acquisition on Group results (cont.) |
In determining the pro-forma income, the following assumptions have been used:
| · | Pro-forma information was compiled based on financial information for Hadera Paper Ltd. and "Printing and Writing Paper" The pro-forma information reflects the financial standing and operating results, on consolidated basis, had "Printing and Writing Paper" been acquired on January 1, 2008. |
| · | The gain realized by the Company, amounting to NIS 5,760 thousand, was not included on the pro-forma consolidated financial statements, as it was of a non-recurring nature. |
| · | Financing expenses on the pro-forma consolidated financial statements were calculated based on 5.85% interest with respect to financing obtained for this acquisition. Repayment of the acquisition is in accordance with terms and conditions of the aforementioned financing. |
Excess acquisition cost over carrying amount as of the acquisition date, amounting to NIS 12,282 thousand, was classified under goodwill.
| · | Other revenues include annual adjustment of the financial liability with respect to put option granted to non-controlling interests for the present value of the expected future payment with respect there to, assuming it would not be exercisable for three years. Profit and loss resulting from settled put options have been reversed. |
| · | Inter-company transactions and balances were reversed for the consolidation. Inter-company unrealized gain was not reversed, as it was not material. |
NOTE 18 - ACTIVITIES NOT INVOLVING CASH FLOWS:
| A. | As of December 31, 2010 the acquisition of fixed assets with suppliers credit amounted to NIS 30,805 thousand. |
| B. | As of December 31, 2009 the acquisition of fixed assets with suppliers credit amounted to NIS 70,541 thousands. |
| C. | As of December 31, 2010, the cost of acquisition of additional shares of "Printing and Writing Paper", amounting to NIS 49,368 thousand, has yet to be paid. See Note 17 a(1). |
NOTE 19 - FINANCIAL INSTRUMENTS AND RISK MANAGEMENT
| A. | The purpose of financial risk management |
The finance division of the Group supplies services to the business operation, provides "printing and writing" access to domestic and international financial markets, monitors and manages the financial risks associated with the Group's activities through internal reports that analyze the level of exposure to risks according to their degree and intensity. These risks include market risks (currency risk, fair value risk in respect of interest rates, price risk and cash flow risk in respect of interest rates), credit risks and liquidity risk.
The Group mitigates the effect of these risks by using deposits in derivative financial instruments in order to hedge the exposure to risks. The use of derivative financial instruments is made in accordance with the Group's policy that was approved by the board of directors, which stipulates principles regarding: currency risk management, interest rate risk, credit risk, use of derivative financial instruments and non-derivative financial instruments and investment of excess liquidity. Compliance with the policy and levels of exposure is reviewed by the internal auditors of the Company on an ongoing basis and examined from time to time by external advisors that specialize in this area.
F - 68
HADERA PAPER LTD
NOTES TO CONSOLIDATED FINANCIAL STATEMENTS
NOTE 19 - FINANCIAL INSTRUMENTS AND RISK MANAGEMENT (Cont.)
| A. | The purpose of financial risk management (Cont.) |
The financial management division of the Group makes quarterly reports to the Group's management committee, about the risks and the implementation of the policy which be assimilated in order to reduce the risks exposures.
The Group's activity exposes it primarily to financial risks of changes in foreign currency exchange rates (see section e below). The Group holds a range of derivative financial instruments in order to manage its exposure to market risks, including:
| · | Foreign currency swap contracts to hedge EURO currency risks arising from EURO payments result of imports of equipment for Machine 8 from the EU nations. |
| · | Foreign currency swap contracts to hedge currency risks arising from the purchase of raw materials in dollars according to the company's policy. |
| B. | Market risk |
Market risks reflect the risk of changes in value of financial instruments that are affected by changes in interest rates, CPI and exchange foreign currency, and also price changes in world commodity markets.
During the reporting period there was a change in exposure to market risks, primarily as a result of the volatility of global currency markets and due to the global crisis. The Group manages and measures the risks on a current basis in accordance with its business and cash flow operations.
| C. | Categories of financial instruments |
| Financial assets | ||||||||
| Deposits in the banks | 73,480 | 238,778 | ||||||
| Deposits in the banks designated as hedging items | 47,512 | 23,949 | ||||||
| Total deposits in the banks | 120,992 | 262,727 | ||||||
| Derivative financial instruments designated as hedging items | - | 4,356 | ||||||
| Available-for-sale investment | 1,646 | - | ||||||
Loans measured at amortised cost | 573,536 | 372,224 | ||||||
| 696,174 | 639,307 | |||||||
| Financial liabilities | ||||||||
| Derivative financial instruments designated as hedging items | - | 1,114 | ||||||
| Derivative financial instruments not designated as hedging items | 580 | - | ||||||
| Put option on an associated company at Fair – value through profit and loss | - | 11,982 | ||||||
Financial liabilities measured at measured at amortised cost | 1,134,189 | 979,129 | ||||||
| PUT option granted to the non controlling interests | 31,512 | - | ||||||
| 1,166,281 | 992,225 | |||||||
F - 69
HADERA PAPER LTD
NOTES TO CONSOLIDATED FINANCIAL STATEMENTS
NOTE 19 - FINANCIAL INSTRUMENTS AND RISK MANAGEMENT (Cont.)
| D. | Derivative financial instruments |
The Company has limited involvement with derivative financial instruments. The Company uses these instruments as hedges. The Company utilizes derivatives, mainly forward exchange contracts, to protect its expected cash flows in respect of existing assets and liabilities denominated in currencies other than the functional currency of the Company or that are linked to the CPI. As the counter-parties to these derivatives are Israeli banks, the Company considers the inherent credit risks remote.
| (1) | Forward transactions against increase in the CPI |
The Company is exposed to the CPI as a result of CPI-linked bonds that were issued (series 2 and 3). In accordance with the risk management policy, the Company wishes to minimize the CPI risk inherent in this obligation.
In January 2009, the Company entered into additional forward transactions for a period of one year, in order to hedge an amount of NIS 100 million against increases in the CPI, following the termination of the aforementioned transaction.
In January 2010 the company entered into additional forward transactions for a period of one year, in order to hedge an amount of NIS 30 million against increases in the CPI, following the termination of the transaction that was carried out in 2009. As for the accounting policy of the Group concerning cash flow hedges and derivative financial instruments see note 2R.
| (2) | Foreign currency swap contracts |
The Group's policy is to enter into foreign currency swap contracts in order to cover specific foreign currency payables and receivables to reduce the created exposure. In addition, the Group enters into foreign currency swap contracts to manage the risk arising from anticipated selling and buying transactions in a period of up to six months. As for the accounting policy of the Group concerning cash flow hedges and derivative financial instruments see note 2R.
| E. | Credit risks |
Credit risks relate to the risk that the counter party will not fulfill its contractual obligations for payment and cause the Group financial losses. The Group has a policy of entering transactions with parties that have a credit rating and obtaining sufficient collateral, when appropriate, as a means of reducing the risk for financial losses as a result of failures. When this information is not available, the Group draws on available public financial information and its commercial experience in order to grade its main customers. The Group's exposure and the credit ratings of counter parties are examined on a regular basis.
Most of these companies’ sales are made in Israel, to a large number of customers. The exposure to credit risks relating to trade receivables is limited due to the relatively large number of customers. The Group performs ongoing credit evaluations of its customers to determine the required amount of allowance for doubtful accounts. An appropriate allowance for doubtful accounts is included in the financial statements.
See note 14a details of the aging of customers' debts as of December 31, 2010.
| F. | Foreign currency risks |
Approximately half of the Company's sales are nominated in US dollars, while a substantial part of its expenditures and its liabilities are in NIS, and as a result, the Company has an exposure to the changes in the exchange rate of the NIS against the US dollar and the EURO. This exposure includes an economic exposure (resulting from the excess of receipts over payments, in foreign currency or linked to it) and accounting exposure (relating to the excess of dollar linked assets over liabilities).
F - 70
HADERA PAPER LTD
NOTES TO CONSOLIDATED FINANCIAL STATEMENTS
NOTE 19 - FINANCIAL INSTRUMENTS AND RISK MANAGEMENT: (cont.)
| F. | Foreign currency risks (cont.) |
December 31, 2010 | December 31, 2009 | |||||||||||||||||||||||||||||||
In, or linked to, foreign currency (mainly dollar) | In Euro | Linked to the Israeli CPI | Unlinked | In, or linked to, foreign currency (mainly dollar) | In Euro | Linked to the Israeli CPI | Unlinked | |||||||||||||||||||||||||
| NIS in thousands | NIS in thousands | |||||||||||||||||||||||||||||||
| Assets: | ||||||||||||||||||||||||||||||||
Current assets: | ||||||||||||||||||||||||||||||||
Cash and cash equivalents and designated deposits | 27,780 | 48,920 | - | 44,292 | 4,952 | 25,976 | - | 122,933 | ||||||||||||||||||||||||
Receivables | 37,147 | 9,829 | 1,950 | 564,068 | 13,338 | 5,075 | 1,053 | 398,718 | ||||||||||||||||||||||||
Investments in associated companies | ||||||||||||||||||||||||||||||||
- long-term loans and capital notes | - | - | - | 19,178 | - | - | 36,674 | 17,777 | ||||||||||||||||||||||||
| 64,927 | 58,749 | 1,950 | 627,538 | 18,290 | 31,051 | 37,727 | 539,428 | |||||||||||||||||||||||||
| Liabilities: | ||||||||||||||||||||||||||||||||
Current liabilities: | ||||||||||||||||||||||||||||||||
Short-term credit from banks | - | - | - | 144,622 | - | - | - | 131,572 | ||||||||||||||||||||||||
Accounts payables and accruals | 110,329 | 106, 883 | - | 318,584 | 43,437 | 72,583 | - | 277,801 | ||||||||||||||||||||||||
| Financial liabilities at fair value through profit and loss | - | - | 31,512 | 11,982 | - | - | - | |||||||||||||||||||||||||
| Long-term liabilities (including current maturities): | ||||||||||||||||||||||||||||||||
| Long –term loans | - | - | 18,250 | 313,555 | - | - | 28,143 | 253,438 | ||||||||||||||||||||||||
| Notes | - | - | 279,765 | 377,997 | - | - | 328,069 | 237,907 | ||||||||||||||||||||||||
| Other liability | - | - | - | 31,512 | - | - | - | 14,911 | ||||||||||||||||||||||||
| 110,329 | 106,883 | 298,015 | 1,186,270 | 55,419 | 72,583 | 356,212 | 915,629 | |||||||||||||||||||||||||
| (45,402 | ) | (48,134 | ) | (296,065 | ) | (558,731 | ) | (37,129 | ) | (41,532 | ) | (318,485 | ) | (376,201 | ) | |||||||||||||||||
As to exposures relating to fluctuations in foreign currency exchange rates and the use of derivatives for hedging purposes - see a above.
As to sensitivity analyze of foreign currency – see g below.
F - 71
HADERA PAPER LTD
NOTES TO CONSOLIDATED FINANCIAL STATEMENTS
NOTE 19 - FINANCIAL INSTRUMENTS AND RISK MANAGEMENT: (cont.)
| F. | Foreign currency risks (cont.) |
Sensitivity analysis of foreign currency:
The group is primarily exposed to the US dollar and the euro.
The following table illustrates the sensitivity to a decrease of 5% in the NIS vis-à-vis the other currencies. 5% was the rate of sensitivity that was used in reporting to key executives. This index also represents management estimates regarding the reasonable potential change in exchange rates. The sensitivity analysis includes the existing balances of monetary items denominated in foreign currency and adjusts their translation at the end of the period to a change of 5% in the foreign exchange rates.
Impacts of a decrease of 5% in the NIS vis-à-vis the other currencies, after the impact of taxes and net of discounted sums:
The influence of the Euro | The influence of the US Dollar | |||||||||||||||
| December 31 | December 31 | |||||||||||||||
2010 | 2009 | 2010 | 2009 | |||||||||||||
| NIS in thousands | NIS in thousands | |||||||||||||||
| Profit or (loss) | (1,659 | ) | 268 | (1,336 | ) | (1,518 | ) | |||||||||
| Other sections in the shareholders' equity | - | 995 | - | - | ||||||||||||
The following table specifies the existing foreign currency swap agreements as of the reporting date:
Average foreign exchange rate | Foreign currency | Contract value | Fair value | |||||||||||||||||||||||||||||||||||||
2010 | 2009 | 2010 | 2009 | 2010 | 2009 | 2010 | 2009 | 2010 | 2009 | |||||||||||||||||||||||||||||||
NIS | Dollar in thousands | Euro in thousands | NIS in thousands | |||||||||||||||||||||||||||||||||||||
| Hedging cash flow | ||||||||||||||||||||||||||||||||||||||||
| Purchase EURO | ||||||||||||||||||||||||||||||||||||||||
| till 6 months | 4.82 | 5.55 | - | 3,895 | 11,674 | 18,756 | 64,745 | (311 | ) | (1,113 | ) | |||||||||||||||||||||||||||||
| Purchase Dollar | ||||||||||||||||||||||||||||||||||||||||
| till 6 months | 3.64 | 3.88 | 2,100 | 1,133 | - | - | 7,651 | 4,400 | 29 | 18 | ||||||||||||||||||||||||||||||
EURO deposit | 4.74 | 5.44 | - | - | 10,028 | 4,041 | 47,512 | 23,949 | - | - | ||||||||||||||||||||||||||||||
During the year expenses in amount of NIS 5,506 thousands were recognized in the comprehensive income in respect of cash-flow hedge. During the year an amount of NIS 6,757 thousands was recorded from the cash-flow hedging reserve to the fix assets.
F - 72
HADERA PAPER LTD
NOTES TO CONSOLIDATED FINANCIAL STATEMENTS
NOTE 19 - FINANCIAL INSTRUMENTS AND RISK MANAGEMENT: (cont.)
| G. | Interest rate and liquidity risk |
Liquidity risk management
The Group manages liquidity risks by maintaining suitable funds, banking and loans, ongoing monitoring of actual and anticipated cash flows and adjusting the vesting of financial assets and liabilities.
| 1. | Financial liabilities that do not constitute derivative financial instruments |
The following tables specify the remaining contractual repayment dates of the Group in respect of financial liabilities, which do not constitute a derivative financial instrument. These tables were prepared based on the non-discounted cash flows of financial liabilities, based on the earliest date in which the Group may be required to repay them. The tables include cash flows in respect of the interest and the principal.
Average effective interest rate | Till 1 month | 1-3 months | From 3 months to 1 year | From 1 year to 5 years | Above 5 years | Total | ||||||||||||||||||||||
% | NIS in thousands | |||||||||||||||||||||||||||
| 2010 | ||||||||||||||||||||||||||||
| Short-term credit | 3.26 | 76,348 | 68,457 | - | - | - | 144,805 | |||||||||||||||||||||
| Loans from banks | 4.62 | 8,156 | 12,454 | 58,068 | 170,125 | 14,462 | 263,265 | |||||||||||||||||||||
| Long-term credit from others | 6.30 | 8,052 | - | 8,052 | 64,423 | 33,302 | 113,829 | |||||||||||||||||||||
| Index linked notes carrying permanent interest | 4.99 | - | - | 69,610 | 184,308 | 72,345 | 326,263 | |||||||||||||||||||||
| Notes carrying permanent interest | 6.68 | 7,352 | - | 57,111 | 331,284 | 78,990 | 474,737 | |||||||||||||||||||||
| 99,908 | 80,911 | 192,841 | 750,140 | 199,099 | 1,322,899 | |||||||||||||||||||||||
| 2009 | ||||||||||||||||||||||||||||
| Short-term credit | 2.75 | 44,544 | 67,270 | 20,138 | - | - | 131,952 | |||||||||||||||||||||
| Loans from banks | 4.27 | 3,364 | 5,327 | 35,380 | 146,996 | 1,083 | 192,150 | |||||||||||||||||||||
| Long-term credit from others | 6.30 | 8,053 | - | 8,053 | 64,424 | 48,318 | 128,848 | |||||||||||||||||||||
| Index linked notes carrying permanent interest | 5.05 | - | - | 71,540 | 224,436 | 98,148 | 394,124 | |||||||||||||||||||||
| Notes carrying permanent interest | 7.45 | 8,847 | - | 47,961 | 198,018 | 42,184 | 297,010 | |||||||||||||||||||||
| 64,808 | 72,597 | 183,072 | 633,874 | 189,733 | 1,144,084 | |||||||||||||||||||||||
F - 73
HADERA PAPER LTD
NOTES TO CONSOLIDATED FINANCIAL STATEMENTS
NOTE 19 - FINANCIAL INSTRUMENTS AND RISK MANAGEMENT: (cont.)
| G. | Interest rate and liquidity risk (cont.) |
| 2. | Derivative financial instruments |
The following table specifies the Group's liquidity analysis with respect to its derivative financial instruments. The table was prepared based on cash payments/ receivables for derivative instruments settled in net and the gross non-discounted cash payments/receivables for these derivatives that require net settlement. When the amount payable or receivable is not fixed, the disclosed amount is determined based on the projected interest rates as described by the interest yield curve at the end of the reporting period.
Till 1 month | 1-3 months | From 3 months to 1 year | Total | |||||||||||||
NIS in thousands | ||||||||||||||||
| 2010 | ||||||||||||||||
| Derivative financial instruments not designated as hedging items | ||||||||||||||||
| Foreign currency swap contracts | 272 | 39 | 29 | 340 | ||||||||||||
Forwarded contracts on the CPI | 240 | - | - | 240 | ||||||||||||
| 512 | 39 | 29 | 580 | |||||||||||||
| 2009 | ||||||||||||||||
| Derivative financial instruments designated as hedging items | ||||||||||||||||
| Foreign currency swap contracts | 1,114 | - | - | 1,114 | ||||||||||||
| 3. | Financial assets that do not constitute derivative financial instruments |
The following tables present the expected repayment dates of the group on account of financial instruments that are not derivatives. The tables were prepared on the basis of the expected, non-discounted repayment dates of the financial assets, including the interest that will accrue from these assets, except for those cases where the group anticipates that the cash flows will be generated in a different period. The tables were prepared based on cash payments/receipts for derivative instruments settled on a net basis and the gross non-discounted cash payments/receipts for those derivatives that require net settlement. When the amount payable or receivable is not fixed, the disclosed amount was determined based on the projected interest rates as described by the existing interest yield curve as at the end of the reporting period.
Till 1 month | 1-3 months | From 3 months to 1 year | Total | |||||||||||||
| 2010 | ||||||||||||||||
| Loans measured at depreciated cost | ||||||||||||||||
| Loans to related parties | - | - | 675 | 675 | ||||||||||||
| Bank Deposits (1) | 120,992 | - | - | 120,992 | ||||||||||||
| 120,992 | - | 675 | 121,667 | |||||||||||||
| (1) | Bank deposits include deposits in foreign currency used for cash flow hedging in amounts of NIS 47,512 thousand and NIS 23,949 thousand at December 31, 2010 and 2009 respectively |
F - 74
HADERA PAPER LTD
NOTES TO CONSOLIDATED FINANCIAL STATEMENTS
NOTE 19 - FINANCIAL INSTRUMENTS AND RISK MANAGEMENT: (cont.)
| G. | Interest rate and liquidity risk (cont.) |
| 3. | Financial assets that do not constitute derivative financial instruments (cont.) |
Till 1 month | 1-3 months | From 3 months to 1 year | Total | |||||||||||||
| NIS in thousands | ||||||||||||||||
| 2010 | ||||||||||||||||
| Trade receivables and other receivables | ||||||||||||||||
| Other accounts | 154,577 | 278,369 | 83,744 | 516,690 | ||||||||||||
| Checks collectible | 17,688 | 17,693 | 12,858 | 48,239 | ||||||||||||
| Accounts receivable | 3,607 | 5,000 | - | 8,607 | ||||||||||||
| 175,872 | 301,062 | 96,602 | 573,536 | |||||||||||||
| 296,864 | 301,062 | 97,277 | 695,203 | |||||||||||||
Till 1 month | 1-3 months | From 3 months to 1 year | From 1 year to 5 years | Total | ||||||||||||||||
NIS in thousands | ||||||||||||||||||||
| 2009 | ||||||||||||||||||||
| Loans measured at depreciated cost | ||||||||||||||||||||
| Loans to related parties | 1,004 | 2,008 | 7,195 | 48,012 | 58,219 | |||||||||||||||
| Deposits in the banks | 154,153 | - | - | - | 154,153 | |||||||||||||||
| 155,157 | 2,008 | 7,195 | 48,012 | 212,372 | ||||||||||||||||
| Trade receivables and other receivables | ||||||||||||||||||||
| Open accounts | 62,114 | 160,566 | 70,772 | 565 | 294,017 | |||||||||||||||
| Checks collectible | 10,027 | 16,848 | 3,569 | - | 30,444 | |||||||||||||||
| Accounts receivable | 258 | 49 | - | - | 307 | |||||||||||||||
| 72,399 | 177,463 | 74,341 | 565 | 324,768 | ||||||||||||||||
| 227,556 | 179,471 | 81,536 | 48,577 | 537,140 | ||||||||||||||||
| 4. | Financial assets that constitute derivative financial instruments |
The following table specifies the Group's liquidity analysis with respect to its derivative financial instruments. The table was prepared based on the cash payments/receipts pertaining to derivative instruments not designated for hedging purposes and to financial instruments designated as hedging items. When the amount payable or receivable is not fixed, the disclosed amount was determined based on the projected interest rates as described by the existing interest yield curve as at the end of the reporting period.
F - 75
HADERA PAPER LTD
NOTES TO CONSOLIDATED FINANCIAL STATEMENTS
NOTE 19 - FINANCIAL INSTRUMENTS AND RISK MANAGEMENT: (cont.)
| G. | Interest rate and liquidity risk (cont.) |
| 4. | Financial assets that constitute derivative financial instruments (cont.) |
Till 1 month | 1-3 months | From 3 months to 1 year | Total | |||||||||||||
NIS in thousands | ||||||||||||||||
Derivative financial instruments designated as hedging items: | ||||||||||||||||
| 2009 | ||||||||||||||||
| Foreign currency swap contracts | 3,052 | - | - | 3,052 | ||||||||||||
| 5. | Interest risk |
The group is exposed to interest rate risks due to the fact that the group companies lend and borrow funds at both fixed and variable interest rates. The risk is managed by the group by maintaining a suitable ratio between loans at a variable rate of interest and loans at a fixed rate of interest.
The group's exposure to interest rates on financial assets and liabilities is described in the section regarding liquidity risk management that is presented further below in this Note.
In the course of the year, the exposure to interest rate risk grew by NIS 151,235 thousands.
Disregarding the effect of consolidation of "Printing and Writing Paper", the exposure, grow by NIS 57,203 thousands.
Sensitivity analysis of interest rates:
The sensitivity analysis was determined on the basis of the exposure to the interest rates of both derivative and non-derivative financial instruments at the end of the reported period. The sensitivity analysis regarding liabilities carrying a variable rate of interest was prepared under the assumption that the sum of liabilities at the end of the reported period was the actual sum throughout the entire reported year. For the purpose of internal reporting to key executives regarding interest rate risks, a rate of increase or decrease in base points of 5% was used, representing management estimates regarding the reasonable potential change in interest rates.
Assuming that interest rates would have increased by 5% while all other parameters would have remained constant, the impact after taxes would have been as follows:
| § | The earnings of the group for the year ended December 31, 2010 would have been reduced by NIS 11,061 thousands (2009: NIS 5,734 thousands). This change originates primarily from the group's exposure to interest rates on account of variable-interest loans. |
F - 76
HADERA PAPER LTD
NOTES TO CONSOLIDATED FINANCIAL STATEMENTS\
NOTE 19 - FINANCIAL INSTRUMENTS AND RISK MANAGEMENT: (cont.)
H. | Exposure to the Consumer Price Index |
The group is exposed to cash flow risks on account of changes in the consumer price index, due to bonds issued by the group, forward contracts on the consumer price index and loans assumed by the group, that are linked to the CPI.
The net carrying value of the balances that are exposed to CPI risks, as at December 31, 2010, totals NIS 296,065 thousands (2009: NIS 356,216 thousands).
The influence of a 2% change in the CPI on the profit and loss after taxes, would have been as follows:
| · | The earnings for the year ended December 31, 2010 would have been reduced by NIS 3,991 thousands (2009: increase of NIS 888 thousands) |
The group's sensitivity to changes in the CPI did not change materially since last year.
The difference in the influence on the income statement stems from the termination of the costs capitalization of machine 8.
| I. | Fair value of financial instruments |
The fair value of financial assets and liabilities were determined as follows:
| · | The fair value of financial assets and liabilities with customary terms that are traded in active markets is determined based on quoted market prices. |
| · | The fair value of other financial assets and liabilities (except for derivative instruments) is determined through accepted pricing techniques based on the analysis of discounted cash flows, using observed current market prices and traders' quotes for similar instruments. |
| · | The fair value of derivative financial instruments is calculated based on quoted prices. When such prices are not available, a discounted cash flow analysis is utilized, using the appropriate yield curve for the duration of the instruments for derivatives that are not options while for derivatives which are options, option pricing models are used. |
The following table specifies the carrying amount and fair value of financial instrument groups that are not presented in the financial statements at their value, the rest of the assets and liabilities are presented in the statement of financial position at their fair value, or approximately:
Carrying Amount | Fair Value | Carrying Amount | Fair Value | |||||||||||||
December 31, 2010 | December 31, 2009 | |||||||||||||||
NIS in thousands | NIS in thousands | |||||||||||||||
| Financial Assets | ||||||||||||||||
| Long term loans and capital note | 675 | 675 | 54,452 | 50,980 | ||||||||||||
| Financial Liabilities | ||||||||||||||||
| Notes – series 2 * | 100,806 | 104,144 | 131,362 | 136,715 | ||||||||||||
| Notes – series 3 * | 178,959 | 184,231 | 196,708 | 207,266 | ||||||||||||
| Notes – series 4 * | 197,982 | 212,453 | 237,906 | 235,557 | ||||||||||||
| Notes – series 5 * | 180,015 | 197,494 | - | - | ||||||||||||
| Financial liability with respect to PUT option granted to the non controlling interests (2) | 31,512 | 31,512 | - | - | ||||||||||||
| Long term loans with fixed interest | 125,731 | 133,671 | 149,809 | 159,915 | ||||||||||||
| 815,005 | 863,505 | 715,785 | 739,453 | |||||||||||||
| (1) | The fair value of long-term Assets and Liabilities are based on the calculation of the current value of cash flows at real interest rate of 4%. |
| (2) | The value of the option is determined by economic calculation laid down in the "Acquisition Transaction". For details, see note 17. |
F - 77
HADERA PAPER LTD
NOTES TO CONSOLIDATED FINANCIAL STATEMENTS
NOTE 19 - FINANCIAL INSTRUMENTS AND RISK MANAGEMENT: (cont.)
J. | Financial instruments that are presented in the statement of financial position at fair value |
For the purpose of measuring the fair value of its financial instruments, the group classifies its financial instruments - as measured in the report of the financial situation - at their fair value, on the basis of a system that includes three rating levels:
| Level 1: | Quoted prices (unadjusted) in active markets for identical financial liabilities and assets. |
| Level 2: | Data other than quoted prices included in Level 1, that are observed directly (i.e.- prices) or indirectly (data derived from prices), regarding financial assets and liabilities. |
| Level 3: | Data regarding financial assets and liabilities that are not based on observable market data. |
The classification of the measured financial instruments at fair value is done on the basis of the lowest level that was significantly used for the purpose of measuring the fair value of the instrument in its entirety.
Following below is a detailed account of the financial instruments of the group, measured at fair value, according to levels:
Financial assets at fair – value:
December 31 | ||||||||||||||||
2010 | 2009 | |||||||||||||||
Level 2 | Total | Level 2 | Total | |||||||||||||
NIS in thousands | NIS in thousands | |||||||||||||||
| Financial assets at Fair – value through profit and loss: | ||||||||||||||||
| Derivatives | - | - | 3,052 | 3,052 | ||||||||||||
| Financial assets at Fair – value through OCI: | ||||||||||||||||
| Shares | 1,646 | 1,646 | - | - | ||||||||||||
December 31 | ||||||||||||||||||||
2010 | 2009 | |||||||||||||||||||
Level 2 | Total | Level 2 | Level 3 | Total | ||||||||||||||||
NIS in thousands | NIS in thousands | |||||||||||||||||||
| Financial liabilities at Fair – value through profit and loss: | ||||||||||||||||||||
| Derivatives | (580 | ) | (580 | ) | (1,114 | ) | - | (1,114 | ) | |||||||||||
| Put option on an associated company | - | - | (11,982 | ) | (11,982 | ) | ||||||||||||||
| Total | (580 | ) | (580 | ) | (1,114 | ) | (11,982 | ) | (13,096 | ) | ||||||||||
| (1) | The Put option on a consolidated company (in 2009 an associated company) is assessed according to the valuation of an external assessor. The estimation was done in 2009 according to the binomial model. The non-risk interest rate used for the estimation is 5.63%. |
F - 78
HADERA PAPER LTD
NOTES TO CONSOLIDATED FINANCIAL STATEMENTS
NOTE 19 - FINANCIAL INSTRUMENTS AND RISK MANAGEMENT: (cont.)
| K. | Financial instruments at fair-value that are measured according to level 3: |
Year ended December 31, 2010 | ||||
NIS in thousands | ||||
| Balance – January 1, 2010 | (11,982 | ) | ||
| Recognized in profit and loss | (872 | ) | ||
Disposals | 12,854 | |||
| Balance – December 31, 2010 | - | |||
NOTE 20 - INTERESTED AND RELATED PARTIES-TRANSACTIONS AND BALANCES:
| A. | General |
The interested parties and the related parties of the Company are the Parent Company – "Clal Industries and Investments LTD.", the indirectly Controlling Shareholder - IDB Holdings and their related parties, associated companies, directors and key executives of the Company or the Parent Company, and a close member of the family of any person that was mentioned above (hereinafter - IDB Group).
| B. | Transactions with interested and related parties |
| The Company and its subsidiaries perform transactions at market terms with interested parties during their ordinary course of business. |
| Negligible transactions: |
On august 8, 2010, the board of directors of the Company determined, that in the absence of unique quality considerations that arise from the circumstances of the matter, an interested party transaction shall be considered negligible if the relevant criterion for Calculated the transaction is less than 0.5%, And that transaction amount shall not exceed NIS 8 million (adjusted for increase in CPI over the known CPI as of start of 2010).
At every interested party transaction examined classified as a negligible transaction, one or more of the criterions relevant to the specific transaction will be calculated based on the recent annual consolidated financial statements of the Company: (a) Sales ratio – total sales covered by the interested party transaction divided by total annual sales; (b) Sales cost ration – cost of the interested party transaction divided by the total cost of annual sales; (c) Earnings ratio – the actual or projected profit or losses attributed to the interested party transaction divided by the average annual profit or loss in the last three years, calculated on the basis of the last 12 quarters for which reviewed or audited financial statements were published; (d) Assets ratio – the amount of assets covered by the interested party transaction divided by total assets; (e) Liabilities ratio - the liability covered by the interested party transaction divided by total liabilities; (f) Operating expenses ratio – the amount of expenses covered by the interested party transaction divided by the total annual operating expenses.
In cases in which all the quantitative above criteria are not relevant, a transaction shall be considered negligible based on another relevant criterion established by the Company, provided the criterion calculated for said transaction is less than 0.5%, And that transaction amount shall not exceed NIS 8 million (adjusted for increase in CPI over the known CPI as of start of 2010).
F - 79
HADERA PAPER LTD
NOTES TO CONSOLIDATED FINANCIAL STATEMENTS
NOTE 20 - INTERESTED AND RELATED PARTIES-TRANSACTIONS AND BALANCES: (cont.)
| B. | Transactions with interested and related parties (cont.) |
Classified and characterized transactions, as follows:
| 1. | Transactions for purchase of services from interested parties and related parties: communication services, tourism services, services of operating the Company's logistic center, investment consulting services and other financial services. |
| 2. | Transactions for the purchase and/or rent of goods from interested parties and related parties: trucks and hauling equipment, vehicles, insurance products. |
| 3. | Transactions in connection with marketing campaigns, advertising and discounts with interested parties and related parties or related to the products of interested parties and related parties. |
| 4. | Transactions with interested parties and related parties in connection with the purchase of gift coupons of interested parties and related parties. |
| 5. | Transactions for rent buildings and real-estate assets. |
| 6. | Sale of paper products and cardboard, office equipment and other products to companies in the IDB Group. |
The negligibility of the transaction is examined on an annual basis for the purposes of this report, by adding all transactions of the same type that the Company made with the interested party and other corporations controlled thereby.
Below is a general description of transactions made with interested parties in the Company, while except for the transactions specified below, should be viewed as negligible transactions based on the tests specified above:
Income (expenses)
| Year ended December 31, | ||||||||||||
| Interested parties: | 2010 | 2009 | 2008 | |||||||||
| NIS in thousands | ||||||||||||
| Sales (1) | 56,096 | 27,097 | 33,286 | |||||||||
| Cost of sales (2) | 23,366 | 10,689 | 3,976 | |||||||||
selling, marketing, general and administrative expenses (3) | 6,764 | - | - | |||||||||
| Financing expenses in respect of bonds | 1,810 | 1,363 | 1,584 | |||||||||
| Related parties: | ||||||||||||
| Sales (1) | 61,944 | 55,833 | 95,448 | |||||||||
| Cost of sales (2) | 42,762 | 29,521 | 13,607 | |||||||||
| Selling, marketing, general and administrative expenses (3) | 26,083 | 25,368 | 24,243 | |||||||||
F - 80
HADERA PAPER LTD
NOTES TO CONSOLIDATED FINANCIAL STATEMENTS
NOTE 20 - INTERESTED AND RELATED PARTIES-TRANSACTIONS AND BALANCES: (cont.)
| B. | Transactions with interested and related parties (cont.) |
Classified and characterized transactions, as follows: (cont.)
| (1) | Sales |
The Company deals with many companies from IDB group in the sale of paper products, office equipment and other products, in a very large number of transactions, each at a negligible amount. The transactions are made with numerous companies from the IDB Group. The prices and are established through negotiations and during the ordinary course of business.
| a. | 1. | The Company sold during the year to interested party from the IDB Group and Clal Industries packaging paper. Total transactions with interested parties in the years 2010, 2009 and 2008 amounted to NIS 48.5 million, NIS 27.1 million, NIS 33.3 million and, respectively. |
| 2. | The Company sold cardboard products during the year to an interested party from the IDB Group. Total transactions with the interested party in the year 2010 amounted to NIS 7.6 million. Total value of transactions with the interested party in 2009 and 2008 is negligible. |
| b. | The Company sold during the year to associated companies, which are related parties, packaging paper, office supplies and products and white paper waste. Total transactions with interested parties in the years 2010, 2009 and 2008 amounted to NIS 61.9 million, NIS 55.8 million, NIS 95.4 million, respectively. |
| (2) | Cost of sales |
During the year the Company performed a large number of transactions with suppliers that are interested parties and related parties from the IDB Group, Clal Industries and Discount Investments. The transactions included the acquisition of foodstuffs and other items for Group companies. The prices and credit terms are established with all the suppliers through negotiations and during the ordinary course of business (hereinafter - IDB Group).
| a. | 1. | The Company has transactions with interested party from the IDB Group relating to building rental services. Total transactions in the years 2010, 2009 and 2008 aggregated to NIS_13 million , NIS 11 million and NIS 4 million, respectively. |
| 2. | The Company has transactions with an interested party from IDB Group relating to insurance services. Total transactions in the year 2010 amounts to NIS 10.2 million. Total value of transactions with the interested party in 2009 and 2008 is negligible. |
| b. | The Company purchased during the year from associated companies, which are related parties, white paper and cleaning and toiletry products which are sold by the company. Total transactions with interested parties in the years 2010 ,2009 and 2008 amounted to NIS 42.8 million,NIS 29.5 million and NIS 13.6 million, respectively. |
F - 81
HADERA PAPER LTD
NOTES TO CONSOLIDATED FINANCIAL STATEMENTS
NOTE 20 - INTERESTED AND RELATED PARTIES-TRANSACTIONS AND BALANCES: (cont.)
| B. | Transactions with interested and related parties (cont.) |
Classified and characterized transactions, as follows: (cont.)
| (3) | Selling, marketing, general and administrative expenses |
| a. | 1. | The Company has transactions with an interested party from IDB Group relating to insurance services. Total transactions in the year 2010 amounts to NIS 1.4 million. Total value of transactions with the interested party in 2009 and 2008 is negligible. |
| 2. | The Company has transactions with an interested party from IDB Group relating to cellular services. Total transactions in the year 2010 amounts to NIS 2.7 million. Total value of transactions with the interested party in 2009 and 2008 is negligible. |
| 3. | The Company has transactions with an interested party from IDB Group relating to leasing services. Total transactions in the year 2010 amounts to NIS 1.1 million. Total value of transactions with the interested party in 2009 and 2008 is negligible. |
| 4. | The Company has transactions with an interested party from IDB Group relating to fuel services for vehicles. Total transactions in the year 2010 amounts to NIS 3.8 million including a transaction that is not negligible in amount of NIS 1.5 million, which is recorded to selling, marketing, general and administrative expenses. Total value of transactions with the interested party in 2009 and 2008 is negligible. |
| b. | The Company has transactions with associated companies, which are related parties, of revenue from rental buildings and computerization services. Total transactions in the years 2010, 2009 and 2008 amounted to NIS 26.1 million, NIS 25.4 million and NIS 24.2 million, respectively. |
The amounts of the aforementioned transactions relate to transactions that the Company makes during the ordinary course of business with interested parties (by virtue of being companies held by the company) at similar conditions and prices to those used by the Company for other customers and suppliers.
Sale of land in TEL AVIV:
On June 1, 2010, the Company entered into agreement to sell its rights to a plot of land in TEL AVIV to an interested party which is part of IDB Group. For further details, see Note 7d.
Agreement for leasing of a Logistics Center:
On September 18, 2008, a lease was signed by the Company and by an interested party which is part of IDB Group, whereby the Company would lease land and buildings in MODI'IN. For further details, see Note 14e.
Benefits to key executives
The senior managers in the Group are entitled, in addition to wages, to non-cash benefits (such as vehicles etc). The Group makes deposits in their name in a defined benefit plan after the completion of the transaction. Senior managers also participate in the stock option plan of the Company (see note 12 on Share-based Payments).
F - 82
HADERA PAPER LTD
NOTES TO CONSOLIDATED FINANCIAL STATEMENTS
NOTE 20 - INTERESTED AND RELATED PARTIES-TRANSACTIONS AND BALANCES: (cont.)
| B. | Transactions with interested and related parties (cont.) |
Benefits to key executives:(cont.)
| (1) | Remuneration of key executives: |
For the year ended December 31 | ||||||||||||
2010 | 2009 | 2008 | ||||||||||
NIS in thousand | ||||||||||||
| Short-term benefits | 8,486 | 8,084 | 8,934 | |||||||||
| Benefits after the completion of the transaction | 6 | 7 | 7 | |||||||||
| Other long-term benefits | - | - | - | |||||||||
| Severance benefits | - | 2,335 | 2,205 | |||||||||
| Share-based payment | 152 | 2,136 | 2,047 | |||||||||
| 8,644 | 12,562 | 13,193 | ||||||||||
| (2) | Benefits to interested parties: |
2010 | 2009 | 2008 | ||||||||||
| Payroll to interested parties employed | ||||||||||||
by the Company - NIS in thousands * | 2,629 | 3,503 | 2,503 | |||||||||
| Number of people to whom the benefits relate | 1 | 1 | 1 | |||||||||
| Remuneration of directors who are not | ||||||||||||
employed by the Company - | ||||||||||||
NIS in thousands | 933 | 807 | 793 | |||||||||
| Number of people to whom | ||||||||||||
the benefits relate | 11 | 12 | 12 | |||||||||
| * | Refers to the payroll of CEO. |
| (3) | The company granted to an interested party employed by the Company (the outgoing CEO) during 2008, 40,250 options, as part of the 2008 plan for senior officers in the Group. On March 7, 2010 the Company Board of Directors approved the grant conditions for the third and fourth batches to the outgoing CEO in light of his retirement from managing the Company, as a result of his disability. The total impact on profit and loss amounts to approximately NIS 641 thousand. |
| C. | Related parties and interested parties balance: |
As of December 31, | ||||||||
2010 | 2009 | |||||||
NIS in thousands | ||||||||
| Accounts receivable - commercial operations (1) | 42,361 | 24,562 | ||||||
| Accounts payables and accruals | 1,424 | 5,740 | ||||||
| Notes (2) | 29,540 | 38,793 | ||||||
F - 83
HADERA PAPER LTD
NOTES TO CONSOLIDATED FINANCIAL STATEMENTS
NOTE 20 - INTERESTED AND RELATED PARTIES-TRANSACTIONS AND BALANCES: (cont.)
| C. | Related parties and interested parties balance: (cont.) |
| (1) | There were no significant changes in the balance during the year. |
| (2) | Notes |
| · | Non-tradable notes |
In the year 2003 the Company issued bonds that are not traded on the stock exchange (see Note 10a). The balance of outstanding debt as of December 31, 2010 and 2009 to interested parties from the IDB Group was NIS 14.9 million and NIS 19.4 million, respectively.
| · | Tradable notes |
In 2008 and 2010 the Company issued bonds that are traded on the stock exchange (see Note 10a). The balance of outstanding debt as of December 31, 2010 and 2009 to interested parties from the IDB Group was NIS 14.6 million and NIS 19.4 million, respectively.
| (3) | See note 15 in respect of associated companies balance. |
NOTE 21 - SEGMENT INFORMATION:
| A. | General |
The Group has been implementing IFRS 8 "operating segments" (hereinafter – "IFRS 8") as of January 1, 2009. In accordance with the provisions of IFRS 8, operating segments are identified on the basis of internal reports on the Group's components, which are regularly reviewed by the chief operational decision maker of the Group for the purpose of allocating resources and evaluating the performance of the operating segments.
In contrast, the previous standard (IAS 14 "segment reporting") required an entity to identify two segment systems (business and geographic), based on the risk-reward approach, while the internal financial reporting system for the key managerial staff of the entity served only as the starting point for the identification of said segments.
Following the adoption of the new standard the Group identified reportable segments that were different than those presented in previous reporting periods.
The identified operating segments, accordingly to IFRS8, are:
The packaging paper and recycling segment – generates revenue from the sale of paper products to paper manufacturing companies as well as from the recycling of paper and cardboard.
The office supplies marketing segment – generates revenue from the sale of office supplies to customers.
The packaging and cardboard products segment – generates revenue from the sale of packaging and cardboard products to customers.
The Hogla Kimberly segment – an associated company that generates revenue from the manufacture and marketing of household paper products, hygiene products, disposable diapers and complementary kitchen products, in Israel and in Turkey.
Printing and writing paper segment – an associated company that generates revenue from the manufacture and marketing of printing and writing paper (On December 31, 2010 the holding in shares in the associated company increased in 25.1% and its was initial consolidated, for more details see Note 17 above).
Information relating to these segments is reported below. Amounts that were reported with respect to previous reporting periods are reported on the basis of the new segment reporting.
F - 84
HADERA PAPER LTD
NOTES TO CONSOLIDATED FINANCIAL STATEMENTS
NOTE 21 - SEGMENT INFORMATION: (cont.)
| B. | Business segment data 2010: |
Packaging Paper and recycling | Marketing of office supplies | Packaging and carton products | Hogla Kimberly | Printing and writing paper | Adjustments to consolidation | Total | ||||||||||||||||||||||
| NIS in thousands | ||||||||||||||||||||||||||||
Sales to external | 393,439 | 176,580 | 489,543 | 1,691,918 | 691,069 | (2,382,986 | ) | 1,059,563 | ||||||||||||||||||||
| Sales between Segments | 117,927 | 2,267 | 20,102 | 5,591 | 37,633 | (122,075 | ) | 61,445 | ||||||||||||||||||||
Total sales of the segment | 511,366 | 178,847 | 509,645 | 1,697,509 | 728,702 | (2,505,061 | ) | 1,121,008 | ||||||||||||||||||||
Profit from ordinary operations | 50,159 | 5,127 | 7,105 | 186,603 | 31,072 | 218,771 | 61,295 | |||||||||||||||||||||
| Financial income | 9,314 | |||||||||||||||||||||||||||
| Financial expenses | 54,079 | |||||||||||||||||||||||||||
Profit before taxes on income | 16,530 | |||||||||||||||||||||||||||
| Taxes on income | (2,950 | ) | ||||||||||||||||||||||||||
Profit from operations of the Company and its subsidiaries | 19,480 | |||||||||||||||||||||||||||
Share in profits of associated companies | 81,132 | |||||||||||||||||||||||||||
Net Profit for the year | 100,612 | |||||||||||||||||||||||||||
Segment's assets | 1,689,167 | 53,425 | 376,061 | 979,817 | 425,379 | (1,029,341 | ) | 2,494,454 | ||||||||||||||||||||
Join assets that were not allocated between segments(1) | 279,180 | |||||||||||||||||||||||||||
Total assets in the consolidated statements | 2,773,634 | |||||||||||||||||||||||||||
Segment's liabilities | 138,405 | 35,920 | 75,931 | 501,213 | 119,809 | (501,213 | ) | 370,065 | ||||||||||||||||||||
| Join liabilities that were not allocated between segments | 1,449,967 | |||||||||||||||||||||||||||
Total liabilities in the consolidated statements | 1,820,032 | |||||||||||||||||||||||||||
| Depreciation and amortization | 68,880 | 1,103 | 18,063 | 31,195 | 11,901 | (43,096 | ) | 88,046 | ||||||||||||||||||||
Capital investments in non-current assets | 131,071 | 11,044 | 39,013 | 62,564 | 10,622 | (73,186 | ) | 181,128 | ||||||||||||||||||||
(1) Including investments in associated companies
F - 85
HADERA PAPER LTD
NOTES TO CONSOLIDATED FINANCIAL STATEMENTS
NOTE 21 - SEGMENT INFORMATION: (cont.)
| C. | Business segment data 2009: |
Packaging Paper and recycling | Marketing of office supplies | Packaging and carton products | Hogla Kimberly | Printing and writing paper | Adjustments to consolidation | Total | ||||||||||||||||||||||
| NIS in thousands | ||||||||||||||||||||||||||||
Sales to external | 219,866 | 149,107 | 468,339 | 1,722,613 | 645,972 | (2,368,582 | ) | 837,315 | ||||||||||||||||||||
Sales between Segments | 119,433 | 1,904 | 15,965 | 4,014 | 23,250 | (109,886 | ) | 54,680 | ||||||||||||||||||||
Total sales of the segment | 339,299 | 151,011 | 484,304 | 1,726,627 | 669,222 | (2,478,468 | ) | 891,995 | ||||||||||||||||||||
Profit from ordinary operations | (2,737 | ) | 3,983 | 14,712 | 193,805 | 40,541 | (234,717 | ) | 15,587 | |||||||||||||||||||
| Financial income | 4,727 | |||||||||||||||||||||||||||
| Financial expenses | 22,992 | |||||||||||||||||||||||||||
Loss before taxes on income | (2,678 | ) | ||||||||||||||||||||||||||
| Taxes on income | 7,067 | |||||||||||||||||||||||||||
Profit from operations of the Company and its subsidiaries | 4,389 | |||||||||||||||||||||||||||
Share in profits of associated companies | 87,359 | |||||||||||||||||||||||||||
Net Profit for the year | 91,748 | |||||||||||||||||||||||||||
Segment's assets | 1,638,895 | 43,542 | 356,742 | 990,670 | 461,786 | (1,575,061 | ) | 1,916,574 | ||||||||||||||||||||
Join assets that were not allocated between segments(1) | 372,102 | |||||||||||||||||||||||||||
| Total assets in the consolidated statements | 2,288,676 | |||||||||||||||||||||||||||
| Segment's liabilities | 141,911 | 31,327 | 82,657 | 534,577 | 306,478 | (841,055 | ) | 255,895 | ||||||||||||||||||||
| Join liabilities that were not allocated between segments | 1,174,352 | |||||||||||||||||||||||||||
| Total liabilities in the consolidated statements | 1,430,247 | |||||||||||||||||||||||||||
| Depreciation and amortization | 56,503 | 1,502 | 20,547 | 29,213 | 12,028 | (41,241 | ) | 78,552 | ||||||||||||||||||||
Capital investments in non-current assets* | 421,533 | 1,212 | 15,797 | 42,484 | 4,383 | (46,868 | ) | 438,541 | ||||||||||||||||||||
(1) Including investments in associated companies
* retroactively adjusted in respect of implementation of amendment to IAS 17, see note 3a
F - 86
HADERA PAPER LTD
NOTES TO CONSOLIDATED FINANCIAL STATEMENTS
NOTE 21 - SEGMENT INFORMATION: (cont.)
| D. | Business segment data 2008: |
Packaging Paper and recycling | Marketing of office supplies | Packaging and carton products | Hogla Kimberly | Printing and writing paper | Adjustments to consolidation | Total | ||||||||||||||||||||||
| NIS in thousands | ||||||||||||||||||||||||||||
Sales to externals | 273,436 | 129,068 | 500,069 | 1,605,376 | 717,424 | (2,660,433 | ) | 564,940 | ||||||||||||||||||||
| Sales between Segments | 133,331 | 2,046 | 12,508 | 3,200 | 14,923 | (57,464 | ) | 108,544 | ||||||||||||||||||||
Total sales of the segment | 406,767 | 131,114 | 512,577 | 1,608,576 | 732,347 | (2,717,897 | ) | 673,484 | ||||||||||||||||||||
Profit from ordinary operations | 37,773 | 3,233 | (6,226 | ) | 135,753 | 34,090 | (169,272 | ) | 35,351 | |||||||||||||||||||
| Financial income | 12,069 | |||||||||||||||||||||||||||
| Financial expenses | 27,112 | |||||||||||||||||||||||||||
Profit before taxes on income | 20,308 | |||||||||||||||||||||||||||
| Taxes on income | 3,663 | |||||||||||||||||||||||||||
Profit from operations of the Company and its subsidiaries | 16,645 | |||||||||||||||||||||||||||
Share in profits of associated companies | 51,315 | |||||||||||||||||||||||||||
Net Profit for the year | 67,960 | |||||||||||||||||||||||||||
| Segment's assets | 803,279 | 72,624 | 415,666 | 946,156 | 483,962 | (1,430,118 | ) | 1,291,569 | ||||||||||||||||||||
Join assets that were not allocated between segments(1) | 752,525 | |||||||||||||||||||||||||||
| Total assets in the consolidated statements | 2,044,094 | |||||||||||||||||||||||||||
Segment's liabilities | 82,925 | 35,258 | 76,837 | 505,167 | 361,404 | (866,571 | ) | 195,020 | ||||||||||||||||||||
| Join liabilities that were not allocated between segments | 1,091,445 | |||||||||||||||||||||||||||
| Total liabilities in the consolidated statements | 1,286,465 | |||||||||||||||||||||||||||
| Depreciation and amortization | 51,946 | 1,445 | 25,604 | 24,367 | 11,649 | (55,227 | ) | 59,784 | ||||||||||||||||||||
Capital investments in non-current assets | 254,494 | 1,694 | 18,027 | 53,334 | 11,649 | (32,971 | ) | 306,227 | ||||||||||||||||||||
(1) Including investments in associated companies
F - 87
HADERA PAPER LTD
NOTES TO CONSOLIDATED FINANCIAL STATEMENTS
NOTE 21 - SEGMENT INFORMATION: (cont.)
| E. | Reconciliation of total segment revenues and results to revenues and results on the consolidated statement |
| (1) | Segments' income: |
For the year ended December 31 | ||||||||||||
2010 | 2009 | 2008 | ||||||||||
NIS in thousands | ||||||||||||
| Income | ||||||||||||
| Total segments' income | 3,626,069 | 3,370,464 | 3,391,381 | |||||||||
| Less: | ||||||||||||
| Inter-company sales among Group's consolidated subsidiaries | (78,850 | ) | (82,620 | ) | (25,285 | ) | ||||||
| Sales of segment which are associated companies | (2,426,211 | ) | (2,395,849 | ) | (2,692,612 | ) | ||||||
| Income in the consolidated statement | 1,121,008 | 891,995 | 673,484 | |||||||||
| (2) | Segments' results: |
For the year ended December 31 | ||||||||||||
2010 | 2009 | 2008 | ||||||||||
NIS in thousands | ||||||||||||
| Profit from ordinary operations | ||||||||||||
| Total profit from ordinary operations of the segments | 280,066 | 250,304 | 204,623 | |||||||||
| Less: | ||||||||||||
| Unrealized gain | (1,096 | ) | (371 | ) | (318 | ) | ||||||
| Profits of segment which are associated | (217,675 | ) | (234,346 | ) | (163,954 | ) | ||||||
| Profit from ordinary operations in the consolidated statement | 61,295 | 15,587 | 35,351 | |||||||||
NOTE 22 – SUBSEQUENT EVENT
| A. | On January 23, 2010, an associate declared a dividend amounting to NIS 30 million, out of retained earnings. This dividend is payable in the second quarter of 2011, subject to absence of material negative developments with respect to the tax event in Turkey, as set forth above in Note 14k. The Company's share of this dividend is NIS 15 million. |
| B. | On January 30, 2011 the Ministry for the Protection of the Environment (hereinafter: "the Ministry") held a hearing for the Company regarding suspicion of pollution of water by discharging low quality waste water into the Hadera Stream. During the hearing the positions of the Ministry and of the Company were heard. The Company presented its position that the decline in the quality of the treated waste water was the result of the use of a new raw material. Upon discovery of the source of the problem, the Company ceased the use of that raw material. The Company works in full transparency opposite the authorities, and was in fact even the one who reported to representatives of the Ministry regarding this harm to the quality of the waste water. On February 8, 2011 the Company received the summary of the hearing in which it was found, inter alia, that the Company had a duty to improve the quality of the waste water, and a duty of reporting weekly to the Ministry regarding the quality of the treated waste water. The Ministry further noted in this summary that if the Company does not fulfill the values prescribed in the permit order for discharge into the Hadera River given on August 11, 2010 within one month from the date of the hearing, the Ministry’s Director of the Haifa District will issue, under his authority, an order to cease operations of Machine 8 which the Company operates, without requiring any advance warnings or additional hearings. Under section 20 to the Business Licensing Law 5728 – 1968, the aforesaid order remains in effect for 30 days from the date of issue. The Company has been acting for some time for the improvement of the treated waste water by the performance of a number of measures, and as a result of these measures, an improvement may already be seen in the quality of the treated waste water discharged into the river. However, the company at this stage cannot estimate the rate or timetable for improvement of the treated waste water, and cannot at this stage estimate the impact of the above in the event of failure to fulfill the required values. |
F - 88
HADERA PAPER LTD
NOTES TO CONSOLIDATED FINANCIAL STATEMENTS
NOTE 22 – SUBSEQUENT EVENT (cont.)
| C. | On February 28, the Audit Committee approved and on March 6, 2011 the Board of Directors approved the agreement entered into by the Company, whereby the Company would lease to CLAL PV Projects Ltd. ("CLAL PV"), a private company indirectly held and controlled by CLAL Industries, roofs of buildings at the Company facility in HADERA, with a total area of up to 19,200 m2, of which the Company has the option not to lease part of this space with an area of up to 14,300 m2 - for construction of power generating facilities using photo-voltaic technology and its transmission to the power grid during the lease term, pursuant to a generation license to be granted to CLAL PV. The rent would range between NIS 90 thousand and NIS 802 thousand per year, based on the area actually leased, and shall be determined based on the tariff per generated kilowatt/hour of power as set for CLAL PV in its generation license. The agreement also specifies that the Company would be paid additional rent up to NIS 70 thousand per year, with respect to excess power generated (if any), as per provisions of the agreement. The lease term runs from the date of taking possession of the leased property through the 20th anniversary of commercial operation of the leased property (as defined in the agreement); CLAL PV was granted an option to extend the lease, provided that the total lease term would not exceed 24 years and 11 months. The agreement includes customary provisions with regard to circumstances under which the parties may terminate the agreement, and the Company was granted the option to terminate the agreement should it announce its desire to use the leased property for its own operations which do not allow operation of the facility in the leased property; in such case, CLAL PV committed to vacate the leased property within the time specified, in return for payment of the economic value of the generation facility based on an independent economic valuation. The agreement is subject to certain suspending conditions being met within 15 months from its signing date, including, inter alia, obtaining approvals, permits and licenses for construction of the facility, obtaining approval of the General Meeting of Company shareholders to be convened to approve this contract and other conditions. |
| D. | On March 6, 2011, the Board of Directors approved incorporation of a foreign entity (hereinafter: "the foreign entity"), wholly-owned by the Company, which is to be incorporated for entering into agreement with an overseas business partner (an unrelated third party) for operations in removal of paper and cardboard waste and recycling operations overseas under a Joint Venture (hereinafter: "JV"). The Company's share of this operation is expected to be 65%. This operation shall require an initial investment, to be made in stages based on JV needs, amounting to USD 5.2 million, by way of owners loan or guarantee, 80% of which would be invested by the Company. The agreement is expected to include restrictions on partner rights to transfer their JV shares, to grant the foreign entity the right to appoint two thirds of the JV Board members as well as its CEO, to grant the Company the right to purchase up to 75% of the paper and cardboard waste collected by JV at market prices, and to include certain non-compete provisions. The Company is acting to conclude this agreement, but it is uncertain that the foregoing with regard to feasibility of the JV and final agreement on the aforementioned understandings would materialize, in full or in part. |
NOTE 23 – RECLASSIFICATION
The Group reclassified an amount of NIS 27,649 thousand from Deferred tax assets to Deferred tax liabilities in the comparative figures as at December 31, 2009. The re-classification is due to offset of deferred tax assets against deferred tax liabilities, under the terms of offset, in IAS12. The impact of re-classification in respect to total assets on comparative data in the statement of financial position, for prior periods to year 2009 is immaterial and therefore no re-classification effect was presented.
| As of December 31, 2009 | ||||||||||||
As was classified in the past | The change | As classified in these statements | ||||||||||
| NIS in thousands | NIS in thousands | NIS in thousands | ||||||||||
| Deferred tax assets | 29,745 | (27,649 | ) | 2,096 | ||||||||
| Deferred tax liabilities | 58,053 | (27,649 | ) | 30,404 | ||||||||
F - 89

| OPINION REGARDING PURCHASE | ||
PRICE ALLOCATION (PPA) MONDI HADERA PAPER LTD. | ||
| **** | ||
| PREPARED AT THE REQUEST OF | ||
| HADERA PAPER LTD. | ||
| MARCH 2011 |

| To | ||
| Mr. Shaul Gliksberg, Chief Financial Officer | ||
| Hadera Paper Ltd. | ||
| Dear Sir or Madam, | ||
We were requested by Hadera Paper Ltd. (Hereinafter “Hadera Paper”) through Mr. Shaul Gliksberg, the Chief Financial Officer of Hadera Paper, to assist in the process of purchase price allocation while ascertaining and assessing the value of the tangible and intangible assets and liabilities of Mondi Hadera Paper Ltd. (Hereinafter: “Mondi” and/or “the Company”) and updating the valuation of put options held by the Mondi Group. | ||
| The objective of this valuation is to provide an opinion regarding the manner of allocating the purchase consideration and calculating the fair value (Hereinafter: “fair value” and/or “economic value”) of the intangible assets, the tangible assets and the liabilities of the Company as at 31/12/2010 (Hereinafter: “the opinion date” and/or “the representative transaction date”), the finalization date of the transaction to acquire the Company (Hereinafter: “the transaction”) and on the basis of internal unaudited financial data as at 31/12/2010. | ||
| It will be mentioned that the objective of our opinion is not to directly evaluate the intangible asset of the Company’s goodwill (if such exists), which is a residual effect of our opinion and the other purchase data (the transaction consideration, accounting equity on the date of the transaction, etc.). | ||
| It will be further mentioned that in accordance with clarifications of the Company management, the purchase process satisfies the requisite criteria for effectuation of purchase price allocation. | ||
| We understand that our findings will be used in order to assist management in allocation of the purchase price set in the transaction for the purchased tangible and intangible assets and liabilities and this for financial reporting purposes. This evaluation report is intended solely for purposes of the information and use of the acquiring company, its independent auditors and its legal advisers. It should not be used, distributed, quoted from or referred to in any manner whatsoever for any other purpose, including, but not limited to, for registration, purchase or sale of securities, and it should not be submitted or referred to, in whole or in part, in a registration report or in any other document, however reference thereto is permitted in documents filed with the Stock Exchange Authority. In this context, we are aware that the opinion findings are to be used for the purpose of public reporting to the Securities Authority. We consent to this opinion being included and/or mentioned in the financial statements of the Company for 31.12.2010 and/or in any other immediate report. In accordance with the Securities Regulations (Electronic Signature and Reporting), 5763-2003, we hereby authorize the party so empowered on behalf of the Company, to report in our name and in our place, electronically, to the Securities Authority regarding our signature on the opinion. |

2
| For the purpose of this evaluation, unaudited financial information, records and other documents have been submitted to us by the Company. | ||
| When formulating the opinion, Giza Zinger Even Ltd. (Hereinafter: “Giza Singer Even”) assumed and relied on the accuracy, completeness and currentness of the information received from the Company, including the financial data and including forward looking information. Giza Singer Even is not responsible for independent self-inspection of the information that it received and accordingly it did not conduct an independent self-inspection of this information, save prima facie general reasonability tests. | ||
| In this opinion, we also addressed future forecasts conveyed to us, as stated, by the Company management. Future forecasts are uncertain information with respect to the future, based on existing information at the Company as at the date of evaluation, and includes assessments of the Company management and its intentions as at the evaluation date. If these assessments of the management are not realized, for any reason whatsoever, the actual results may materially differ from the results estimated or implied from this information, insofar as use was made thereof in the opinion. | ||
| In addition, the opinion, in and of itself, contains future forecasts, which reflect our assessment with respect to various parameters and based on information that was before us. If these assessments are not realized, for any reason whatsoever, the actual results may materially differ. |
3
| An economic opinion is not an exact science and it should reasonably and fairly reflect a true situation at a certain time, on the basis of known data, established basic assumptions and estimated forecasts. Changes in the main variables and/or information may change the basis for the basic assumptions and accordingly the conclusions. | ||
| The opinion does not constitute due diligence work and does not purport to include the information, the tests and the examinations or any other information included in due diligence work, including inspection of contracts and engagements of the Company. It will be emphasized that the opinion does not constitute advice or a legal opinion. Interpretation of different documents, which we studied, was carried out solely for purposes of this opinion. | ||
| The information appearing in the opinion does not purport to include all the information that a potential investor would require and is not intended to determine the value of the Company and/or its assets for a specific investor. Different investors may have different objectives, different considerations and testing methods based on other assumptions and accordingly, the price that they would be prepared to pay for the Company and/or its various assets is different. | ||
| This opinion does not constitute a valuation of the Company. | ||
| We hereby certify that we do not have a personal interest in the Company and we do not have a personal interest in the described transaction, save the fact that we are receiving a fee for preparing the opinion. | ||
| We perform from time to time, in return for payment, different economic works for the Company and for shareholders and/or for companies held by the shareholders and/or related thereto. We do not have a personal interest in shares of the Company and/or in the acquirers and our fee for this work is not contingent on the results of this valuation. | ||
| In relation to the opinion, the acquirers undertook toward Giza Singer Even as follows: Should Giza Singer Even be sued in a legal proceeding to pay any amount to a third party for a legal proceeding in respect of a cause that could stem, directly or indirectly, from this opinion, the acquirers shall indemnify Giza Singer Even in relation to any reasonable expenses that Giza Singer Even shall disburse or be required to pay for legal representation, legal advice, professional advice, defense against legal proceedings, negotiation, etc., and the acquirers shall indemnify Giza Singer Even in respect of an amount that is shall be required, in a legal proceeding, to pay to a third party. The obligation to indemnify shall not apply if Giza Singer Even acted maliciously in relation to provision of the services that are the object of the opinion. |
4
| DETAILS OF THE EVALUATING COMPANY AND THE APPRAISER | ||
The evaluating company: Giza Singer Even is the leading independent economic and financial consulting firm in Israel. The firm has been operating for more than 25 years. The advisory services of Giza Singer Even are divided into four fields: Advising corporations and governmental authorities; mergers and acquisitions; issuances; tenders and infrastructure projects. | ||
| Giza Singer Even provides its services by means of a few departments: Value planning, financing and capital market, applied economic research, economic accounting and risk management, project and infrastructure financing and a professional department. | ||
| The partners leading the firm are: The Chairman Yechiel Even and the CEO Yariv Philosoph, together with Prof. Eli Kraizberg, Yuval Zilberstein, Eli Goldberg, Avshalom Herscovici and Udi Rosenberg who also serves as head of the professional department of the firm. Eyal Jeb Wab, Yuval Lapidot and Yuval Barak from the finance department, Asher Shklar from the economic accounting and risk management department, Varda Stern, from the project and national infrastructure financing department and Alex Schechter from the value planning department. |
| Sincerely, | |||
 | |||
| Giza Singer Even Ltd. |
5
| LIMITATION OF LIABILITY | ||
| Our work is intended for the use of the Company management. In no case shall we bear any liability toward a third party to which our opinion has been forwarded in accordance with our consent, as set forth above. | ||
| During the course of the work we received information, explanations and representations from the acquiring company, the acquiree company and/or from anyone on their behalf. The liability for the aforementioned information, representations and explanations is on the providers of this information. Our work framework did not include inspection and/or verification of such data. In light of this, our work shall not be deemed and shall not constitute confirmation of the correctness, completeness or accuracy of the data forwarded to us. In no case shall we be liable for any loss, damage, cost or expenses that shall be caused in any way or manner from acts of fraud, misrepresentation, deception, conveying incorrect and incomplete information or withholding information from the acquiring company, the acquiree company and/or anyone on their behalf, or any other reliance on such information, subject to the aforesaid. | ||
| In general, forecasts relate to future events and are based on reasonable assumptions as at the day of the forecast. These assumptions may change over the forecast period and therefore forecasts that were carried out for the evaluation days may differ from the actual financial results and/or from evaluations that are to be carried our at a later date. Therefore, forecasts made cannot be regarded with the level of certainty ascribed to audited financial statement data. We are not expressing an opinion with regard to the conformance of the forecasts made by the acquiring company, the acquiree company and/or anyone on their behalf and the financial results that are to be actually attained. | ||
| Economic evaluations do not purport to be an exact science and the conclusions thereof are contingent in many cases on the subjective judgment of the appraiser. Although we believe that the fair value of the tangible and intangible assets and liabilities set by us is reasonable, based on the information provided to us, another appraiser could have reached a different value. | ||
| Our work does not constitute due diligence and it should not be relied upon as due diligence. In addition, our work is not to be used as a substitute for any action that the Acquirer must take in connection with the acquisition transactions. |
6
TABLE OF CONTENTS
| 8 | ||||
| 10 | ||||
| SECTION C – ANALYSIS OF BUSINESS RESULTS | 16 | |||
| 19 | ||||
| 26 | ||||
| 34 | ||||
| 35 |
7
| 1 | GENERAL | ||
The objective of this work is to provide an opinion with regard to the fair value of the tangible and intangible assets and liabilities related to the acquisition transaction (Hereinafter: “the transaction”) of Mondi Hadera Paper Ltd. by Hadera Paper Ltd. as at 31.12.2010. | |||
| The methodology of the fair value assessment of the tangible and intangible assets and liabilities conforms to the guidelines of the following publications: |
| 1. | International Financial Reporting Standard Number 3, regarding “Business Combinations”. | |||
| 2. | International Accounting Standard Number 38, regarding “Intangible Assets”. | |||
| 3. | AICPA Practice Aid Series: “Assets Acquired in a Business Combination to Be Used in Research and Development Activities: A Focus on Software, Electronic Devices, and Pharmaceutical Industries”. |
| 2 | PRINCIPAL SOURCES OF INFORMATION AND WORK PROCEDURES | ||
| The principal sources of information used in the preparation of the opinion are specified below: |
| ü | The acquisition agreement and additional agreements among the shareholders | |||
| ü | Financial information of the Company for 2010 and for 2007-2009 | |||
| ü | Diverse financial and operating data with regard to the Company’s activity | |||
| ü | Data and clarifications received from the Company at our request | |||
| ü | Diverse industry data from varied private and public sources | |||
| ü | Meetings and conversations with the Company management |
8
| Liaisons at the Company with whom we spoke within the framework of preparing this opinion: |
| ü | Mr. Shaul Gliksberg, Chief Financial Officer, Hadera Paper | |||
| ü | Mr. Shmuel Molad, Controller, Hadera Paper | |||
| ü | Mr. David Muhlgay, Financial Director, Mondi Hadera Paper |
| 3 | THE EVALUATION SUMMARY | ||
| Below is a summary of the purchase price allocation to tangible and intangible assets (NIS Thousands): |
NIS Thousands | Amortization period in years | |||||||||
| Consideration paid: | ||||||||||
| Payment in cash (1) | 51,813 | |||||||||
| Value attributed to change in put option value | (6,436 | ) | ||||||||
| Consideration paid for 25.1% of the shares | 45,377 | |||||||||
| Fair value of existing holding (49.9% of the shares) | 86,721 | |||||||||
| Value of non controlling rights (2) | 39,939 | |||||||||
| Total consideration paid | 172,037 | |||||||||
| Allocation of the consideration to assets and liabilities: | ||||||||||
| Equity | 162,932 | |||||||||
| Equity adjustments | ||||||||||
| Neutralization of goodwill in respect of a subsidiary | (3,177 | ) | ||||||||
| Adjusted equity | 159,755 | |||||||||
| Intangible assets | ||||||||||
| Goodwill (3) | 12,282 | |||||||||
| 172,037 | ||||||||||
| (1) | Calculated based on an exchange rate of 4.99 that was set within the framework of a hedging transaction effectuated by the Company on 3.10.2010. | |||
| (2) | The value of non controlling rights was calculated in accordance with their share (25%) of the adjusted equity. | |||
| (3) | The goodwill was calculated as a residual value “residual method” |
9
| 1. | Description of the transaction |
| On September 8, 2010 a share acquisition agreement was signed, below are the main details: | ||
| Hadera Paper signed an agreement with Neusiedler Holding BV of the Mondi Group (Hereinafter: “Mondi Group”, or “MBP”), which holds on the eve of the transaction 50.1% of the share capital of Mondi, whereby the Mondi Group would sell to Hadera Paper 25.1% of the share capital of Mondi in consideration of 10.34 million Euro (Hereinafter: “the acquisition transaction”). | ||
| Hadera Paper held, on the eve of the acquisition transaction, 49.9% of Mondi’s capital, and shall hold subsequent to finalization of the acquisition transaction 75% of Mondi’s share capital, where the Mondi Group shall hold the remaining 25%. The acquisition transaction comprises, inter alia, amendment of the existing shareholder agreement between the Mondi Group and Hadera Paper in relation to their holdings in Mondi, including, inter alia, revisions necessitated by the change in holdings, including, protection of non-controlling interests, rules for the continued cooperation between the shareholders and Mondi, non-competition undertakings, dividend distribution policy, etc. | ||
| In addition, the acquisition transaction comprises amendment of the existing agreements between the Mondi Group and Hadera Paper, including a marketing agreement, lease agreement and provision of services agreement and signature of new agreements, including a sub-lease agreement and a Mondi brand user agreement. | ||
| Likewise, a call option for Hadera Paper and for the Mondi Group and a put option for the Mondi Group, existing as at the transaction date, shall remain in force subsequent to finalization of the acquisition transaction, with adjustment for the new holdings structure. |
10
| The put option, whereby the seller has the right to sell its remaining holdings in Mondi to the acquirer, is to be adjusted to the new holdings balance of the seller in Mondi (25%) and in addition a limitation is to be imposed, whereby the option shall not be exercisable during the first 3 years subsequent to finalization of the transaction. | ||
| The Mondi Group undertakes not to sell its shares in Mondi for a period of three years subsequent to finalization of the acquisition transaction. | ||
| Below is a key for the names of companies appearing in the work: |
| Names of the companies | |
| Neusiedler Holding BV (Hereinafter “ the Seller”) | |
| Mondi Hadera Paper (Hereinafter “Mondi” / “the Acquirer”) | |
| Hadera Paper Ltd. (Hereinafter “the Company”) |
| Hadera Paper Ltd. is a dual company traded in Israel and on the New York Stock Exchange (NYSE), held at a rate of 59.43% by Clal Industries and Investments Ltd., of the IDB Group. | ||
| Neusiedler Holding BV is an Austrian company, controlled by the Mondi Group. Mondi Hadera Paper is a private Israeli company. |
| 2. | DESCRIPTION OF THE COMPANY’S ACTIVITY - GENERAL |
| Mondi engages in the manufacture and marketing of writing and printing papers, including special papers and coated paper. The Company’s activity is carried out through the subsidiary, Mondi Hadera Paper Marketing Ltd. Mondi is active in Israel and worldwide. | ||
| In the Israeli market, Mondi and its competitors in the field market writing and printing papers to customers that are active as printing presses, publishing houses, marketers of office supplies and manufacturers of paper products as notebooks, envelopes and the like as well as to wholesalers operating vis-à-vis smaller customers. Products from a wide variety of manufacturers are marketed in the market, which are only slightly distinct in their technical properties, where all the competitors are importers and not local manufacturers. The writing and printing paper market in Israel is a stable market with slow growth, where the variables affecting it are mainly worldwide supply and demand ratios for paper products and the level of economic activity in the economy, which affects the quantity of the printing and advertising products. The main products marketed in the field in Israel are manufactured products for which the Company has an advantage of a local manufacturer capable of providing small quantities within short timetables, however, there are also imported products. |
11
| Mondi has four wholly owned subsidiaries: Mondi Hadera Paper Marketing Ltd., Grafinir Paper Marketing Ltd., Yavnir (1999) Ltd. and Mitrani Paper Marketing 2000 Ltd. | |||
| 3. | PRODUCTS AND SERVICES OF THE COMPANY | ||
| Mondi is the only manufacturer of writing and printing papers in Israel. Nonetheless, numerous importers operate in the Israeli market, which import writing and printing papers, mainly from Europe. The Company’s products, which it manufactures, are mainly sold to the domestic market (approximately 77% according to a 2010 data estimate), where the remainder is exported to the United States, Italy, Egypt, Jordan and Turkey. | ||
| In the assessment of the Company, the volume of exports to the United States markets, which have a higher profitability rate than the Middle East, is expected to grow in the coming years. | ||
| In addition, Mondi is supplementing its product basket by importing paper from Europe and from the Far East (such as coated paper and special papers that Mondi does not manufacture). The imported products are being sold in their entirety to the domestic market. |
| 4. | COMPETITION |
| The competitive advantage of the Company in the Israeli market stems from it being the only local manufacturer. The massive investments in the paper machines required to manufacture the paper constitute an entry barrier to manufacturing writing and printing papers. On the other hand, since no restrictions, barriers and quotas are imposed on the paper imported into Israel, Mondi is exposed to competition on the part of paper importers. |
12
| The main competitors of Mondi in Israel are the following paper importers: Niris Ltd., Fonymar Ltd., Elenfer Trade Ltd., Mey Hanachal Ltd. and B.O.R. Brotherhood of the Rose Ltd. In the assessment of the Company, Mondi has the highest market share among its competitors, although there is no precise official data so indicating. |
| 5. | RAW MATERIALS AND SUPPLIERS |
| The Company’s activity is carried out using four main raw materials: |
| 5.1 | Pulp – the main raw material of the Company. The engagement for purchasing the pulp for Mondi and for the other factories of MBP is brokered by the mother company, MBP, in Europe. Mondi pays the supplier directly as well as a brokerage fee of 1% to MBP. The pulp prices are regularly set according to the global market prices for pulp. | |||
| 5.2 | Coated paper – Mondi imports coated paper mainly from the APP Group and from Stora Enso. | |||
| 5.3 | Lime – The Company purchases lime from Omya Shfeya Ltd., an Israeli company that has a factory for the production of lime in Israel. | |||
| 5.4 | Starch – Mondi purchases starch from Galam Ltd., used for the manufacture of paper. Until 2009, Mondi was dependent on Galam as the sole manufacturer of starch in Israel. However, in light of the entry of a competing starch importer, this dependence has lessened. |
13
| 6. | CUSTOMERS |
| Mondi markets its products in Israel and overseas, where its key customers are printing presses, with the following segmentation (according to 2009 data): |

| Mondi markets overseas to large wholesalers in the paper field. |
| 7. | DISTRIBUTION |
| Mondi distributes its products from three logistical sites throughout Israel: In Hadera and Modiin. The aforementioned geographic distribution enables accessibility to most of Israel and thereby the Company manages to generate most of its revenues from existing inventory and not through preorders. |
| 8. | RISK FACTORS FOR THE COMPANY |
| 8.1 | COMPETITION | |||
| As set forth above, the competition in the paper market is a price competition, which is affected by the global market. | ||||
| 8.2 | RAW MATERIAL PRICES | |||
| The Company is significantly affected by the raw material prices, particularly the pulp price, as mentioned above, but as well as by chemical prices, such as: starches. | ||||
14
| 8.3 | DEPENDENCE ON ENERGY PRICES | |||
| �� | ||||
| Mondi’s manufacturing activity cost is materially dependent on the energy prices, regardless of the transition to natural gas, which reduced this dependence. | ||||
| 8.4 | CUSTOMER CREDIT RISK | |||
| Most of Mondi’s sales are made in Israel, where a portion of the sales are made without full collateral. Accordingly, Mondi is exposed to customer repayment risk. | ||||
| 9. | EFFECTS OF THE GLOBAL MARKET |
| The paper industry in the world is historically a cyclical industry, characterized by more profitable years producing a wave of investments in the paper industry and expansion of the production capacity. Consequently, in the following years a supply surplus is created, which causes a substantial decrease in the profitability until renewed balancing of the supply and demand. In light of this, and since this involves a capital intensive industry, the paper industry customarily exports the surplus production at relatively low prices and at a marginal price, inter alia to Israel, as occurred in the global economic crisis in 2008-2009. | |||
| China is the driving force in the global paper industry, where its economy is capable of supplying its needs in providing the raw materials and therefore it encourages the paper industry in South America to build paper production stations and factories in order to supply the consumption demand. | |||
| Likewise, many companies in the paper manufacturing and distribution field have united in recent years and it is apparent that the consolidation process in the field throughout the world will continue to increase. |
15
| 1 | STATEMENT OF INCOME | ||
| Below are the essentials of the statement of income for 2010 (unaudited), 2009, 2008 and 2007, of Mondi Hadera Paper Ltd.: |
| For the year ended | ||||||||||||
| 31/12/2010 | 31/12/2009 | 31/12/2008 | 31/12/2007 | |||||||||
| NIS Thousands | NIS Thousands | NIS Thousands | NIS Thousands | |||||||||
| (Unaudited) | (Audited) | (Audited) | (Audited) | |||||||||
| Sales | 728,702 | 669,222 | 732,347 | 770,032 | ||||||||
| Cost of sales | (640,310 | ) | (578,537 | ) | (649,640 | ) | (688,000 | ) | ||||
| Gross profit | 88,392 | 90,685 | 82,707 | 82,032 | ||||||||
| Percentage of sales | 12 | % | 14 | % | 11 | % | 11 | % | ||||
| Selling, administrative and general expenses | (57,499 | ) | (50,520 | ) | (48,033 | ) | (48,421 | ) | ||||
| Percentage of sales | 8 | % | 8 | % | 7 | % | 6 | % | ||||
| Other revenues / expenses | 34 | 376 | (584 | ) | 313 | |||||||
| Percentage of sales | 0 | % | 0 | % | 0 | % | 0 | % | ||||
| Operating profit | 30,927 | 40,541 | 34,090 | 33,924 | ||||||||
| Percentage of salesz | 4 | % | 6 | % | 5 | % | 4 | % | ||||
| 1.1 | SALES | |||
| The sales decrease in 2008 – 2009 stemmed mainly from a sale price decrease. In 2009 for instance, the prices in the domestic market decreased compared to 2008 by a rate of 10/%, and in the export markets the prices decreased by a rate of 8% in Shekel terms. | ||||
| 1.2 | GROSS PROFIT RATE | |||
| The gross profit rate has been relatively stable over the years at a rate of approximately 11%, save 2009 wherein a significant decrease occurred in the global price of the main raw material for manufacturing paper (pulp), which began in mid-2008. | ||||
16
| 1.3 | SELLING ADMINISTRATIVE AND GENERAL EXPENSES | |||
| These costs have been relatively stable over the years, particularly due to the significant share of fixed costs. | ||||
| 1.4 | OPERATING PROFIT RATE | |||
| The operating profit rate has been relatively stable over the years at a rate of approximately 5%, save a slight increase in 2009, as set forth above. | ||||
| 2 | BALANCE SHEET | ||
| Below is financial data from the Company’s balance sheets as at the relevant dates: |
| 31/12/2010 | 31/12/2009 | 31/12/2008 | 31/12/2007 | |||||||||
| (Unaudited) | (Audited) | (Audited) | (Audited) | |||||||||
| Current Assets | ||||||||||||
| Cash and cash equivalents | 13 | 17 | 13 | – | ||||||||
| Negotiable securities | – | – | 2 | – | ||||||||
| Customers | 176 | 185 | 170 | 193 | ||||||||
| Accounts receivable and debit balances | 6 | 2 | 1 | 2 | ||||||||
| Inventory | 162 | 108 | 140 | 143 | ||||||||
| 357 | 312 | 326 | 338 | |||||||||
| Long term investments, loans and debit balances | ||||||||||||
| Long term customers | – | 0 | 0 | 0 | ||||||||
| Fixed assets, net | 146 | 147 | 154 | 156 | ||||||||
| Goodwill | 3 | 3 | 3 | 3 | ||||||||
| 506 | 462 | 483 | 497 | |||||||||
| Current liabilities | ||||||||||||
Short term credit from banking corporations | 93 | 69 | 105 | 102 | ||||||||
| Current maturities of long term loans | 4 | 11 | 16 | 14 | ||||||||
| Capital notes | – | – | – | 6 |
17
| 31/12/2010 | 31/12/2009 | 31/12/2008 | 31/12/2007 | |||||||||
| (Unaudited) | (Audited) | (Audited) | (Audited) | |||||||||
| Suppliers | 120 | 106 | 97 | 119 | ||||||||
| Related parties | 54 | 58 | 70 | 71 | ||||||||
| Other financial liabilities | – | – | 6 | – | ||||||||
| Short term deferred taxes | 10 | 4 | – | – | ||||||||
| Accounts payable and credit balances | 19 | 21 | 18 | 15 | ||||||||
| Dividend payable | 9 | – | – | – | ||||||||
| Compensation fund, net | – | – | – | – | ||||||||
| 309 | 269 | 312 | 327 | |||||||||
| Long term liabilities | ||||||||||||
| Long term credit from banking corporations | 9 | 13 | 23 | 38 | ||||||||
| Long term deferred taxes | 22 | 23 | 24 | 19 | ||||||||
| Liabilities due to termination of employer-employee relations | 3 | 2 | 1 | 6 | ||||||||
| 34 | 38 | 48 | 63 | |||||||||
| Equity | 163 | 155 | 123 | 107 | ||||||||
| 506 | 462 | 483 | 497 |
18
| 1 | METHODOLOGY |
| 1.1 | GENERAL | |||
| Below is the composition of the consideration: | ||||
| NIS Thousands | |||
| Consideration paid: | |||
| Payment in cash | 51,813 | ||
| Value attributed to change in put option value | (6,436 | ) | |
| Consideration paid for 25.1% of the shares | 45,377 | ||
| Fair value of existing holding (49.9% of the shares) | 86,721 | ||
| Value of non controlling rights | 39,939 | ||
| Total consideration paid | 172,037 |
| The consideration paid in the transaction was used, in economic terms, to acquire a number of components as specified below: |
| 1. | To acquire 25.1% of the Company’s shares. | ||||
| 2. | To attain control. | ||||
| 3. | Likewise, after the settlement the terms of the original put option granted to MBP were revised, whereby Hadera Paper Ltd. would acquire from MBP the entire share balance thereof in Mondi (50.1%). According to the new terms, Hadera Paper Ltd. would acquire from MBP the entire new balance in Mondi (25%). |
| 1.2 | THE MODEL FOR CALCULATING THE FAIR VALUE OF THE OPTIONS: | |||
| There are numerous methods for valuating options, where all of them are based on the same methodology (continuousness or near-continuousness), such as the Black & Scholes model, the binomial model of Cox,xRossX&xRubinstein developed for the Lattice model, which is prevalent among accounting personnel in the United States and numeric methods of the type known as finite difference method. | ||||
19
| According to the terms of the option that is the object of this evaluation, the exercise may occur at any given time (American option) and it is not limited by time (perpetual). According to the B&S model, the value of a put option with a perpetual life equals 0. In other words, the option value increases up to a certain point in time (depending on the standard deviation and the risk free interest) and from there it begins to decrease. This situation is unreasonable for our option, since, for the entire world, the option value should be higher as time goes by (since it can be exercised at any given time). The explanation for this is that since the return expectancy of the underlying asset is positive, every passing period acts to the detriment of the put holder, since the cumulative probability grows smaller and according to the model he cannot exercise it until expiration. Likewise, this can be regarded as a case of put-call parity in perpetuity, since the value of a perpetual call option is equal to the share value and therefore it ensues that the put option value is zero. | ||
In this case the binomial model was used for evaluating the option. |
| 2 | DESCRIPTION OF THE OPTIONS |
| 2.1 | DESCRIPTION OF THE ORIGINAL OPTION | |||
| Prior to the transaction, the holding rates of Mondi shares were: | ||||
| ● | Hadera Paper – 49.9% | |||
| ● | MBP – 50.1% | |||
| MBP was granted the option to require Hadera Paper to acquire their entire share balance in Mondi from them at any time and for an unlimited period in consideration of an amount to be determined in accordance with the higher of: | ||||
| 1. | The value of a multiplier of 5 for Mondi EBIT multiplied by MBP’s holdings in Mondi less 20%. (*) | |||
| 2. | The value derived from the acquisition transaction of MBP for Mondi shares less 20%. |
20
| 2.2 | DESCRIPTION OF THE OPTION GRANTED SUBSEQUENT TO THE ACQUISITION |
| Subsequent to the acquisition, the holding rates of Mondi shares are: | ||||
| ● | Hadera Paper – 75% | |||
| ● | MBP – 25% | |||
| MBP was granted the right to require Hadera Paper to acquire their entire share balance in Mondi from them. This right exists as of the end of a period of 36 months from the transaction date and continues for an unlimited period. The exercise premium shall be in accordance with the amount that is to be determined as the higher of: | ||||
| 1. | A multiplier of 5 for the amount to be determined in the following manner: Value of Mondi EBIT during the course of the last 3 years and in addition Mondi EBIT according to the projected budget for the subsequent year, multiplied by MBP’s holdings in Mondi less 20% (*). | |||
| 2. | The value derived from the acquisition transaction of MBP for Mondi shares less 20%. | |||
| The value of the Company shall not be less than 40 million Dollars for the entire Company. | ||||
| (*) | Since in each one of the instances the varying exercise price (in accordance with EBIT) reflects company value less 20%, it is not economical for the option holders to exercise their right to sell at this price and de facto the effective exercise price for determining the option value is the fixed exercise price, i.e., the MBP acquisition transaction (20 million Dollars). |
| 3 | THE WORKING ASSUMPTIONS |
| 3.1 | FOR CALCULATING THE VALUE OF THE ORIGINAL OPTION |
| Value of the underlying asset | ||||
The value of the underlying asset is the value of MBP’s holdings in Mondi prior to the acquisition transaction. The value of the holdings is based on the value of the underlying asset and amounts to NIS 88,824 thousand and includes the control component. |
21
| The exercise price | |||
As stated, the exercise price is 16 million Dollars, which are NIS 56,784 thousand. | |||
| Risk free interest | |||
| The risk free interest used in the valuation is the yield to maturity on a treasury bond of the United States government for 100 years (extrapolation of American interest rates), which is set at 5.87%. | |||
| Standard deviation | |||
| The theoretically correct standard deviation in Merton methodology is the instantaneous standard deviation whose adjustment for time is accomplished through the logarithm that is the instantaneous standard deviation multiplied by the root of time. | |||
| There is no correlation between the estimation period of the standard deviation and the application thereof as an expected standard deviation. When we estimate a standard deviation for the B& S model we search for what is called “the instantaneous standard deviation” (momentary) and we perform a time adjustment for it (under the Brownian Motion assumption) of: |

| The best estimate of the instantaneous standard deviation is the standard deviation for the last period before performance of an evaluation. | |||
In this case, due to the fact that Mondi is a private company, an estimate cannot be derived for the instantaneous standard deviation of the Company share on the basis of historical data of share price quotes. Accordingly, the estimation calculation for the standard deviation is carried out according to the standard deviation of the parent company – Hadera Paper, which is traded on the Tel Aviv Stock Exchange, since the area of activity of Mondi is very close to that of the parent company1. |
1 Mondi engages in the manufacture, import, sale and marketing of writing and printing paper. |
22
| The standard deviation was calculated based on daily observations of the share price of the parent company during the course of the three years preceding the evaluation date, and was set at approximately 40.62%, in annual terms. |
| 3.2 | FOR CALCULATING THE VALUE OF THE NEW OPTION: | |||
| Value of the underlying asset | ||||
The value of the underlying asset is the value of MBP’s holdings in Mondi as at 31/12/2010. The value of the holdings is based on a valuation derived from the agreement, which includes sale of 25% of the Company, but does not include sale of the control component of the Company, since this component is already held by Hadera Paper, the underlying asset value amounts to NIS 43,436 thousand. | ||||
| The exercise price | ||||
As set forth in the preceding section the exercise price is 8 million Dollars, which are NIS 28,392 thousand. | ||||
| Risk free interest | ||||
| As described in the preceding section. | ||||
| Standard deviation | ||||
| As described in the preceding section. | ||||
| 3.3 | VALUE OF CONTROL: | |||
| In calculating the value of the control, a reduction of approximately 1% from the total value of the Company was made. This reduction is based on the management of Hadera Paper having influence over Mondi’s activity in preventing operating decisions also prior to the transaction in light of their familiarity with the domestic market. Subsequent to the transaction, control was attained by Hadera Paper, therefore we assumed that a certain value should be attributed to this component. |
23
| 4 | CONSIDERATION ATTRIBUTED TO A LIABILITY ASSUMED IN RESPECT OF ACQUISITION OF FUTURE RIGHTS | ||
| At the request of the Company management and for the purpose of examining the non-controlling interest measurement alternative in accordance with the present value of the exercise price of the granted option, the calculation described below was performed: | |||
| The exercise price that is to be in effect in another 3 years from the transaction day (which is the earliest exercise date in light of the contractual terms whereby the option is not exercisable for a period of 3 years), was determined according to the higher of: |
| (1) | The value of the Company for the purpose of determining the exercise price is to be determined in accordance with the EBIT in the three years prior to the exercise date and the contractual EBIT in accordance with the Company budgets for the subsequent year. | |||
| (2) | In accordance with the contract a minimum company value was determined according to 40,000 thousand Dollars. | |||
| The exercise price was discounted in accordance with the long term Company debt rate – 6%. | ||||
| The value obtained in accordance with the above-described calculation is NIS 31,511 thousand. | ||||
24
| 5 | FAIR VALUE OF EXISTING HOLDING | ||
| Assuming a contractual control value of 1%: |
| NIS Thousand | |||
| Consideration paid for shares and options | 51,813 | ||
| Value of old option (put 50.1%) | (12,853 | ) | |
| Value of new option (put 25%) | 6,417 | ||
| Options value difference | (6,436 | ) | |
| The net consideration for 25.1%, including control | 45,377 | ||
| Control value rate | 1 | % | |
| Control value | (1,755 | ) | |
| Value of 25.1%, without control | 43,621 | ||
| Value of 49.9% (previous holding) | 86,721 |
25
| 1 | FAIR VALUE ESTIMATE | ||
| For financial reporting purposes, the fair value of an asset is defined as the amount at which the asset can be acquired or sold within the framework of a transaction between a willing buyer/buyers and willing seller/sellers, as opposed to a case of forced sale or company liquidation. Market prices offered in active markets are the best evidence of fair value and are to be used as a basis for measurement, if available. If a market price is not available, the fair value estimate should approximate the price at which the asset is expected to be bought or sold within the framework of a current transaction between a willing buyer/buyers and willing seller/sellers, and the price is to be based on the best available information under these circumstances. | |||
| The fair value estimate must take into consideration the price of similar assets and the result of valuation methods, should they be available under these circumstances. The method chosen to determine the fair value must be consistent with the definition of fair value, as established in the generally accepted accounting principles. The method must include assumptions that are to be used by the market participants in their estimates of fair value, future revenues, future expenses and discount rates (if applicable). | |||
| 2 | RECOGNITION OF INTANGIBLE ASSETS | ||
| In general, the accounting standardization regarding “business combinations” and “intangible assets” defines an intangible asset as a non-monetary asset, which is identifiable and without physical substance. | |||
| Consequently, the basic criteria for defining an intangible asset are adherence to the definition of asset in accordance with the accounting standardization and the identifiability thereof: |
26
Definition of asset – the accounting standardization allows recognition of an asset if it is probable that future economic benefits are to be obtained therefrom in the future, which can be measured reliably. | |||
Identifiability – an item is identifiable, for the purpose of defining it as an intangible asset, if it is: Separable, or derives from contractual rights or from other legal rights | |||
| Below are a number of examples of assets satisfying the definition of an intangible asset: |
| 1. | Marketing-related intangible assets – this group includes trademarks, trade names, service marks, collective marks, certification marks, internet domain names and non-competition agreements. | |||
| 2. | Customer-related intangible assets – this group includes customer lists, order or production backlog, customer contracts and related customer relationships, non-contractual customer relationships. | |||
| 3. | Contract-based intangible assets – this group includes licensing and royalties, franchise agreements, contracts with suppliers and so forth. | |||
| In determining the fair value of any intangible asset, each evaluation must take into consideration asset-specific factors, including (but not limited to): |
| ● | The economic benefit stemming therefrom; | ||||
| ● | Its remaining economic life; | ||||
| ● | Its risk profile (relative to the risk of the overall activity of the Company). | ||||
| Within the framework of our work intangible assets with substantial value were not identified. | |||||
27
| 3 | POTENTIAL INTANGIBLE ASSETS THAT WERE EXAMINED, BUT DID NOT MEET THE FUNDAMENTAL OR ACCOUNTING CRITERIA SO AS TO FORMULATE INTO AN ASSET WERE: | |||
| 1. | Customer relationships – the Company sells its products to printing presses, paper wholesalers and office equipment wholesalers, paper manufacturers and end consumers. Most of the Company’s sales do not stem from long term contracts, save paper supply tenders for the institutional market, which the Company is awarded from time to time. In accordance with clarifications of the Company, although the Company’s sales are of a recurring nature and the abandonment rate is negligible, the market structure (which is based on price competition and Mondi having the largest market share) indicates that the Company does not have an asset in respect of customer relationships. | |||
| 2. | Non-competition agreement – the Company, the acquirer and the seller have an agreement whereby the seller shall not compete with the Company within the borders of Israel (including the Judea and Samaria Region and Gaza Strip). The agreement is in force so long as the seller holds 25% of the share capital of the Company as well as four years thereafter. In accordance with the Company’s assessment, the chance of competition following expiration of the agreement, or in the alternative if there had not been an agreement, is minimal. The Company’s assessment is based on Mondi’s strength in the domestic market in Israel as well as on the logistical costs required in order to enter the competition. In addition, Mondi has significant leverage that will preclude the seller from competing. Firstly, Mondi buys pulp from the seller on a significant scale for the seller (approximately 15% of its total sales) and in addition Mondi has capabilities to compete with the Seller in the European market, should the status quo not be maintained. Accordingly, in our assessment, the value of the agreement is insubstantial. | |||
| 3. | Brand – brand is a term from the marketing field, which refers to the total external characteristics of a corporation, product, product line, or service, which distinguish them from their competitors. When the brand is perceived as valuable the consumer will be prepared to pay more for it than for its competitors, the value of the premium that can be obtained in respect of the brand reflects the fair economic value of the brand. Mondi has independent brands, such as: “Zohar” and “Hadar”. In accordance with clarifications of the Company and the nature of the market, which is based on price competition, it is impossible to collect a premium from the customers in the domestic market in respect of the brand. | |||
28
| 4. | Order backlog – the Company stores inventory in accordance with the sales forecast, supply of the products is carried our proximate to making the orders. | |||
| 5. | Technology – according to the Company’s declaration, the Company does not possess unique technology or know-how that does not exist at competing companies and the obtaining of which entails significant costs. | |||
| 6. | Commercial agreements – the Company does not have commercial agreements with suppliers or customers that materially differ from market conditions. | |||
| 4 | THE PURCHASE PRICE ALLOCATION METHODOLOGY | |||
| The methodology of the purchase price allocation to the tangible and intangible assets and liabilities, which were acquired within the framework of the transaction, conforms to the guidelines of the following publications: | ||||
| 1. | International Financial Reporting Standard Number 3, with regard to “Business Combinations”. | |||
| 2. | International Accounting Standard Number 38 – with regard to “Intangible Assets”. | |||
| 3. | Guide of the American Institute of Certified Public Accountants (Hereinafter “the Institute guide”): AICPA Practice Aid Series: “Assets Acquired in a Business Combination to Be Used in Research and Development Activities: A Focus on Software, Electronic Devices, and Pharmaceutical Industries”. | |||
29
| The accounting standardization defines a business as “an integrated set of activities or assets managed for the purpose of providing (a) a return to investors, or (b) lower costs or other economic benefits directly attributable to the holder. | ||||
| A business generally consists of inputs, processes applied to those inputs and resulting outputs that are, or will be, used in the future to generate revenues. | ||||
| Inputs – an economic source producing or with the potential to produce revenues by being used in one or more processes (such as fixed assets, knowhow, personnel sources).2 | ||||
| Process – method or rule, or protocol applied to the inputs, and manifested by output yielding, or likely to yield, revenues. | ||||
| Output – outcome of input and the process applied to yield revenues, for the purpose of producing a return for investors or lower costs or other economic advantages directly attributable to the participants. | ||||
| In accordance with the Standard, a business combination may include acquisition of net assets, including goodwill or other entities, compared to acquisition of equity of another entity. Such business combination does not include parent-subsidiary relations. The result of such business combination (acquisition of activity) is that the economic value of the attributed differences does not include deferred taxes. | ||||
| 4.1 | EVALUATION APPROACHES | |||
In accordance with international standardization and the American Institute guide, there are three principal methodological approaches to performing the valuation of the tangible and intangible assets and liabilities. | ||||
| In order to implement the most suitable approach for evaluating an asset, the nature of the evaluated asset should be considered, prior to implementation of any one of the three following approaches: |
2 It will be mentioned that the American standardization, in contrast, prescribes that a business is an economic source that actually yields revenues. |
30
| 1. | The market approach – in accordance with this approach, the fair value takes into consideration the prices recently paid in consideration of similar assets, with adjustments made for the quoted market prices, in order to reflect the situation and the usefulness of the evaluated asset relative to the corresponding assets in the market. | ||||
| 2. | The income approach – in accordance with this approach, the fair value depends on the present value of future economic benefits to be derived from ownership of the asset. Analysis of the profit potential represented by the asset and of the fundamental risks associated with obtaining these profits occupies a key position in this approach. The economic value of this future economic benefit is evaluated by discounting the net cash flows according to the prevailing rates of return in the market for similar assets. | ||||
| 3. | The cost approach – in accordance with this approach, the fair value is evaluated based on the replacement cost of the asset less depreciation, which denotes functional, economic or technological obsolescence of the existing asset compared with the new one. The evaluation results stemming from use of the cost approach can be regarded as the upper limit of the value in cases where the asset can be easily replaced or refurbished, inasmuch as even a cautious investor would not acquire an existing asset at a more expensive price than it would cost him to manufacture a comparable asset. | ||||
| 4.2 | CHARGES IN RESPECT OF “CONTRIBUTORY ASSETS” | ||||
| Under the methodology of individually evaluating the intangible assets of the Company, it should be taken into account that these assets do not fully stand alone, in the sense that they “require” different services from other assets of the Company that have an economic cost that is not denoted by flow, but should be denoted in evaluating the economic value of the asset under the assumption that the asset that is stand alone (the assumption at the basis of its evaluation as an intangible asset) would have had to pay for these services. This cost is calculated by including a “contributory charge” in respect of the use of those other assets of the intangible asset. In general, the contributory assets are usually fixed assets, personnel, working capital, brand (if any), etc. | |||||
31
| Although personnel, pursuant to our examination, is not an intangible asset that can be evaluated separately, a contributory charge should be included in respect thereof. This charge should denote the cost of hiring and training the personnel from a situation where the Company has no personnel. | |||||
| 4.3 | TAX REDUCTION BENEFITS | ||||
| After evaluation of the economic value of the asset (according to each one of the evaluation approaches) adjustment to the economic value determined for the asset is necessary in order to reflect the tax benefit stemming from the real or theoretical amortization of the asset for income tax purposes. | |||||
| In accordance with Section 5.3.102 of the Institute guide, the fair value of intangible assets includes the value of the tax benefit stemming from amortization of these assets. The tax benefit stemming (as stated, real or theoretical) from amortization of the intangible assets evaluated by us are added to the “net” economic value of the assets and are presented as one amount. | |||||
| As stated, we assumed that the amortization of the intangible assets acquired would be recognized for income tax reporting purposes. In the absence of a position announced by the tax authority either way, our assumption is based on the provisions of the American Institute guide and the prevailing practice as expressed in purchase price allocation works published in the past year. It is possible that the tax authority position will differ from the assumption at the basis of this work and accordingly, we detailed, for each intangible asset, the tax shield component included therein. | |||||
32
| The tax shield calculation is an iterative calculation, which includes two calculations made simultaneously: (1) Calculation of the tax shield value is the cash flow stemming from amortization of the intangible asset multiplied by the tax rate; (2) calculation of the amortized asset value including the tax shield value. |
| 4.4 | TAX RATES | ||||
On July 23, 2009 the Economic Streamlining Law, 5759-2009, was published in the Official Gazette [1], which prescribed, inter alia, a gradual reduction of the corporate tax rates for the tax years 2011 onward. In accordance with this Law, the corporate tax rate is to be reduced every year by a percent, beginning from 25% in 2010 to 20% in 2015 and is to be set at 18% as of 2016 onward. | |||||
[1] On July 23, 2009 the Economic Streamlining Law, 5759-2009 - Legislative Amendments for Implementation of the Economic Plan for 2009 and 2010 was published in the Official Gazette. |
33
| 1 | OPERATING WORKING CAPITAL | ||
| We did not valuate the items included in working capital. | |||
| The carrying amount of the operating working capital, customers, inventory, accounts receivable and debit balances, deferred taxes, suppliers, accounts payable, etc., constitutes, in the assessment of the Company, adequate approximation of the fair value of these assets. | |||
| 2 | FIXED ASSETS | ||
| We did not valuate the fixed assets. | |||
| It will be mentioned that the fixed assets in the financial statements are in a significant scope in relation to the total assets of the Company (as at 31.12.10 the carrying amount of the fixed assets was set at approximately 30% of the assets). This asset mainly consists of a paper manufacturing machine, a finished product processing machine and negligible arrays of equipment, furnishings, leasehold improvements and vehicles. In accordance with clarifications of the Company, and according to an appraiser’s evaluation, the fair value of the fixed assets approximately corresponds to its carrying amount. | |||
| 3 | SHORT TERM FINANCIAL ASSETS AND LIABILITIES | ||
| Include cash balance and short term bank credit, presented at their fair value. | |||
| 4 | LONG TERM LOAN | ||
| According to the Company’s declaration, the carrying amount of the loan reflects the fair value of the loan. | |||
| 5 | CONTINGENT LIABILITIES | ||
| According to the Company’s declaration, the Company has no contingent liabilities, as at the opinion date. |
34
| PURCHASE PRICE ALLOCATION SUMMARY | |||
| Below is a summary of the purchase price allocation to tangible and intangible assets (NIS Thousands): | |||
| NIS Thousands | Amortization period in years | |||||||
| Consideration paid: | ||||||||
| Payment in cash (1) | 51,813 | |||||||
| Value attributed to change in put option value | (6,436 | ) | ||||||
| Consideration paid for 25.1% of the shares | 45,377 | |||||||
| Fair value of existing holding (49.9% of the shares) | 86,721 | |||||||
| Value of non controlling rights (2) | 39,939 | |||||||
| Total consideration paid | 172,037 | |||||||
Allocation of the consideration to assets and liabilities: | ||||||||
| Equity | 162,932 | |||||||
| Equity adjustments | ||||||||
| Neutralization of goodwill in respect of a subsidiary | ||||||||
| (3,177 | ) | |||||||
| Adjusted equity | 159,755 | |||||||
| Intangible assets | ||||||||
| Goodwill (3) | 12,282 | |||||||
| 172,037 | ||||||||
| (1) | Calculated based on an exchange rate of 4.99 that was set within the framework of a hedging transaction effectuated by the Company on 3.10.2010. | ||
| (2) | The value of rights that do not confer control was calculated in accordance with their share (25%) of the adjusted equity. | ||
| (3) | The goodwill was calculated as a residual value – “residual method” |
35

Financial Valuation of
Hadera Paper Ltd.
| To: | To: |
| Hadera Paper Ltd. | Clal Industries and Investments Ltd. |
| Hadera | Tel Aviv |
Dear Sir/Madam,
Re: Valuation of Hadera Paper Ltd.
I have been requested by you to conduct a financial valuation of the equity capital of Hadera Paper Ltd. (“the Company” or “Hadera Paper”) as at December 31, 2010. The purpose of the valuation is to examine the value of the Company and the value of its investee companies in accordance with the directives of International Accounting Standard IAS 36 – Impairment of Assets, for the purpose of the financial reporting of the Company and of Clal Industries and Investments Ltd. (“CII”).
Based on the information that I have received, I estimate that the value of the share capital of the Company as at December 31, 2010 lies in the range between NIS 1,657-1,869 million, which reflects a premium of approximately 21% on average over the average market value of the Company on the Tel Aviv Stock Exchange in the six months preceding the date of this opinion.
The value of the Company’s shares in this valuation is an average of 89% higher than the shareholders’ equity capital of Hadera Paper as at December 31, 2010, and an average of 54% higher than the value of the Company per a valuation dated June 30, 2009 and by an average of approximately 54% over the value of the company in the transaction when CII acquired 21.45% of the company shares from Discount Investments Ltd. (hereinafter: “DIC”) on September 30, 2010. This is in comparison to an increase of 71% in the Company’s value on the Tel Aviv Stock Exchange between June 30, 2009 and December 31, 2010.
This valuation was prepared in the midst of the global financial and economic crisis. The crisis and the steps taken to deal with it will have a significant effect on future economic activity globally, and in Israel in particular, and at this point it is impossible to estimate the scope of its effect. In 2010 there were a number of signs that seemed to indicate that the crisis is coming to an end, though it seems that recovery will not be fast. In the next few years it is expected that the central banks will increase their interest rates and that the countries leading the global economy will take care of the exceptional public debts that have arisen in an attempt to protect the financial system from collapse and to encourage demand during the crisis.
Israel, which has been affected only slightly by the crisis, has specific economic problems such as a sharp increase in real estate prices, a strong local currency which makes an increase in the interest rate in the local market difficult, and so forth.
For the purpose of the valuation it has been assumed that a further economic shake-up at the level that we experienced in 2008 is not expected and that the global economic recovery will be gradual and will continue for the period of the forecast used in the valuation as detailed in section 2c of the opinion.
For the purpose of preparing this opinion I have used the following sources of information:
| · | Hadera Paper’s reports to the public, including the Company’s consolidated financial statements; |
| · | Information and explanations that I have received from Company management and from the management of the significant companies owned by Hadera Paper including the work plans and strategic plans of the group companies; |
| · | Sector information and public information regarding the Company’s competitors and the companies held by Hadera Paper; |
| · | A valuation of Carmel Container Systems Ltd., prepared by Giza Zinger Even Ltd; |
In the preparation of this opinion no independent checks were carried out on the reports and data that I received and no actions were taken which involved any due diligence or audit, except for reasonable general checks, and therefore the inclusion of the data in this opinion is not intended as proof of the correctness or completeness of these data.
As with any financial valuation, this valuation is supposed to reasonably and fairly reflect a given situation at a particular time, on the basis of known data and with reference to basic assumptions and forecasts that were made on the basis of this information. The description of the business activities, and the assumptions and the estimates that have been made do not presume to be complete and relate only to the principal among them.
The historical data in this opinion are presented in nominal New Israeli Shekels (NIS) unless otherwise stated. The historical data in foreign currency have been translated for the purpose of convenience into NIS, unless otherwise stated. All forward-looking data, including business forecasts and costs of capital are presented in real values unless otherwise stated. Differences in amounts in the report below, such as they exist, derive from the rounding of the data for presentation purposes only, in accordance with accepted rounding conventions.
I give my consent for this opinion to be included or cited in the financial reports of the Company and of CII.
In recent years I have performed valuations and other financial projects for Hadera Paper and other companies in the IDB Group, in return for a fee. I have no personal interest in the shares of the Company or the companies in its control/held by it or in the interested parties in the Company and no dependence exists between myself and the Company, the companies in its control/held by it or the interested parties in the Company.
It should be noted that in the context of our engagement to carry out a valuation of Hadera Paper my liability was limited, in respect of damage of any kind or type excluding damage caused negligently and/or maliciously and/or willfully, to the amount of the fee paid in respect of the engagement. I have also received from you indemnification in respect of any amount for which I am liable towards a third party in a peremptory ruling in connection with the preparation of this opinion as well as in respect of reasonable legal expenses unless it is determined that I acted negligently and/or maliciously and/or willfully.
Below is the economic opinion.
| Yours faithfully, | |
Vadim Portnoy1 |
Date: March 6, 2011
1 Below are the details of my education and professional experience:
Graduate of the Hebrew University of Jerusalem in Economics and Accounting (1994), CPA (from 1997), MBA from the Hebrew University of Jerusalem (1998).
Thirteen years of experience in business and financial consulting, including examination and performance of valuations and financial opinions including for companies operating in the industrial sector. I gained my professional experience, inter alia, as an employee at the Israel Securities Authority and at Swary Yuchman Ltd., and since 2004 as an independent consultant. Since 2000 I have been a lecturer in courses on the subject of company valuations at the School of Business Administration of the Hebrew University of Jerusalem.
Table of Contents
| Chapter | Page | ||
| 1 | |||
| 3 | |||
a. | Operational structure | 4 | |
b. | Valuation methodology | 10 | |
c. | Business environment | 13 | |
| 18 | |||
a. | Packaging paper and recycling | 18 | |
b. | Office supplies marketing | 25 | |
c. | Printing and writing paper | 26 | |
d. | Packaging and carton products | 33 | |
| e. | Other assets and liabilities | 38 | |
| f. | Financial analysis | 41 | |
| g. | Valuation | 49 | |
| 62 | |||
a. | HOGLA operations | 64 | |
b. | Financial analysis | 77 | |
c. | Valuation | 85 | |
Appendices
| Appendix A - | Information about Company securities traded on the TEL AVIV Stock Exchange. |
| Appendix B - | Valuation by GIZA-SINGER-EVEN Ltd. of CARMEL Container Systems Ltd. |
| Appendix C - | Examining the need for impairment of the packaging paper operations, according to IAS 36 |
| Appendix D - | Further information pursuant to Securities Regulations (Periodic and immediate reports), 1970 |
| Valuation Summary |
The value of HADERA PAPER for its shareholders as of December 31, 2010 is estimated at between NIS 1,657-1,869 million, as follows:
| Holding stake | High value | Low value | ||||||||||
| NIS in millions | ||||||||||||
| Enterprise valuation (EV) - HADERA PAPER, consolidated* | 1,460 | 1,332 | ||||||||||
| Value of excess real estate | 74 | 74 | ||||||||||
| Value of holding stake in CARMEL | 100.0 | % | 160 | 160 | ||||||||
| Value of holding stake in HADERA PAPER PRINTING | 75.0 | % | 157 | 157 | ||||||||
| Liability with respect to MBP | (32 | ) | (32 | ) | ||||||||
| Value of holding stake in FRENKEL | 28.9 | % | 19 | 19 | ||||||||
| Net financial debt | (922 | ) | (922 | ) | ||||||||
| Valuation of HADERA PAPER, consolidated, net | 917 | 789 | ||||||||||
| Value of holding stake in HOGLA | 49.9 | % | 977 | 887 | ||||||||
| Value of equity, HADERA PAPER | 1,894 | 1,676 | ||||||||||
| Value of stock options to employees | (25 | ) | (19 | ) | ||||||||
| Value of HADERA PAPER to shareholders | 1,869 | 1,657 | ||||||||||
* Excluding HADERA PAPER PRINTING, CARMEL and FRENKEL.
HADERA PAPER was valuated using the Discounted Cash Flow method (DCF); for valuation methodology see section 2b above. above.
1
This valuation of HADERA PAPER is higher by 21% on average than the Company's average market capitalization over the six months preceding the valuation date, and is higher by 89% on average than the Company's shareholder equity as of December 31, 2010, as follows:
| Market cap | Difference between value in model and market cap | |||||||||||||||
| High value | Low value | Average | ||||||||||||||
| NIS in millions | NIS in millions | |||||||||||||||
| Company value in valuation | 1,869 | 1,657 | 1,763 | |||||||||||||
| Market cap* of equity during six months prior to effective date | ||||||||||||||||
| Highest | 1,616 | 16 | % | 3 | % | 9 | % | |||||||||
| Lowest | 1,314 | 42 | % | 26 | % | 34 | % | |||||||||
| Average | 1,454 | 29 | % | 14 | % | 21 | % | |||||||||
| Market cap* as of December 31, 2010 | 1,505 | 24 | % | 10 | % | 17 | % | |||||||||
| Shareholders' equity on balance sheet as of December 31, 2010 | 930 | 101 | % | 78 | % | 90 | % | |||||||||
| Value in transaction as of September 30, 2009** | 1,147 | 63 | % | 44 | % | 54 | % | |||||||||
| Value in valuation as of June 30, 2009** | 1,144 | 63 | % | 45 | % | 54 | % | |||||||||
| * | Value derived from price of Company share on TEL AVIV Stock Exchange. |
| ** | Value in acquisition of 21.45% of Company shares by CII from Discount Investments was determined taking into account the valuation as of June 30, 2009 which was prepared by myself for negotiations between the parties. |
For further information pursuant to Securities Regulations (Periodic and immediate reports), 1970, see Appendix D.
Between June 30, 2009 and December 31, 2010, the Company's market capitalization increased by 71%; for evolution of share price and trading volume, see Appendix A.
Group company operations are primarily based on the state of Israel's economy, population size, change in living standards and in business activity, change over the past two years in sectors in which the Group operates and change in the Company's production capacity and product mix in the packaging segment.
In the course of the last year, the change was recorded in the economic atmosphere and in investor expectations following the peak of the economic crisis in the years 2008-2009. The rise in stock market indices and in commodity prices in 2010, alongside initial indications of growth in real demand and in the demand for new employees, may serve as a harbinger of the initial emergence from the current economic crisis. Nevertheless, the emergence from the crisis will be slow and will most likely last for several years, during which certain aftershocks may be felt in the global economy.
2
The most significant event at the company in 2010 was the operation of Machine 8, that effectively doubles the output capacity of packaging paper, as of June 1, 2010. In parallel to the operation of the machine, surplus demand for recycled packaging paper was created on the European market. As a result of the surplus demand for such products, average paper prices overseas and on the local market increased, as paper exports grew by approximately 245% in financial terms in relation to the exports in 2009. The development of new recycled products and primarily substitutes for virgin Kraft liner, serve to diversify the company's product mix, while opening up new market segments and rendering it possible - subject to economic feasibility considerations - to expand the future output capacity using an old machine (Machine 1), without material investments in equipment and new machines.
The impact of the moderating economic crisis on the Hogla business results was relatively slight. The principal raw materials used by Hogla grew more expensive this year, while in parallel Hogla found it difficult to raise the prices of its products due to escalating competition, primarily versus its the central competitor, Procter & Gamble, in the diaper and feminine hygiene sectors. The strengthening local currency in Israel (NIS) vis-à-vis other currencies is harming the competitive capabilities of Hogla in Israel due to the fact that Procter & Gamble products are produced overseas.
In 2010, the company acquired 25.1% of the shares of Hadera Paper Printing and completed a complete tender offer in the United States for Carmel shares.
| Background |
We have been commissioned by HADERA PAPER Ltd. (hereinafter: "the Company" or "HADERA PAPER") and by CII and Investment Ltd. (hereinafter: "CII") to provide an economic valuation of shareholders' equity of HADERA PAPER as of December 31, 2010. The objective of this valuation is to review the Company valuation and composition there of, pursuant to provisions of international accounting standard IAS 36 "Asset Impairment" for the purpose of IFRS-based financial reporting.
3
CII' holding stake in Company shares as of December 31, 2010 was 59.1%. On September 30, 2010, CII acquired 21.45% of the Company shares from Discount Investments Ltd. (hereinafter: "DIC") at a Company value of NIS 1,147 million.
| a. | Operational structure |
HADERA PAPER operates via subsidiaries and associates (hereinafter: "the Group") in the following segments*:
| Operating segment | Revenues | Operating income | Net Income | Holding | ||||||||||||||||||||||||
| 2009 | 2010 | 2009 | 2010 | 2009 | 2010 | stake | ||||||||||||||||||||||
| NIS in millions | NIS in millions | NIS in millions | ||||||||||||||||||||||||||
| Packaging paper and recycling | 339 | 511 | (3 | ) | 50 | (6 | ) | 17 | 100 | % | ||||||||||||||||||
| Office equipment marketing | 151 | 179 | 4 | 5 | 100 | % | ||||||||||||||||||||||
| Packaging and corrugated cardboard | 484 | 510 | 15 | 7 | 10 | 3 | **100 | % | ||||||||||||||||||||
| Writing and printing paper | 669 | 729 | 38 | 31 | 28 | 22 | 75 | % | ||||||||||||||||||||
| Consumables | 1,727 | 1,698 | 194 | 187 | 151 | 145 | 49.9 | % | ||||||||||||||||||||
* Data in this table is for 100% of segment operations, without reversal of inter-company operations.
** Reflects the holding stake in CARMEL.
Packaging paper and recycling
In this segment, the Company produces recycled packaging paper via HADERA PAPER - Packaging Paper & Recycling Ltd. (formerly: HADERA PAPER Industries Ltd. and before that: AIPM Paper Industries (1995) Ltd.") (hereinafter: "Packaging"). Recycled paper is primarily used as raw material in production of corrugated cardboard packaging. Paper waste is collected for recycling by AMNIR Recycling Industries Ltd. (hereinafter: "AMNIR"). This segment also includes operations of HADERA PAPER - Development & Infrastructure Ltd. (hereinafter: "HADERA PAPER Infrastructure"), which provides infrastructure, energy and other services to Group companies. All companies in this segment are wholly-owned by HADERA PAPER.
4
Office equipment marketing
Graffiti Office Equipment and Paper Marketing Ltd. (hereinafter: "Graffiti"), which is wholly-owned by HADERA PAPER, is engaged in import, marketing and sale of office equipment, primarily to business- and institutional customers.
Writing & printing paper
HADERA PAPER owns, as from December 31, 2010, 75% of shares of HADERA PAPER - Printing & Writing Paper Ltd. (formerly: "MONDI HADERA PAPER Ltd.") (hereinafter: "HADERA PAPER PRINTING"), which is engaged in production, marketing and sale of writing- and printing paper. On December 31, 2010, the Company acquired 25.1% of shares of HADERA PAPER PRINTING from MONDI Business Paper Ltd. (hereinafter: "MBP"). After conclusion of this transaction, MBP owns 25% of HADERA PAPER PRINTING; for details see section 3c below.
Packaging and carton products
In this segment, the Company is engaged in production, marketing and sale of corrugated cardboard packaging and sheets via CARMEL Container Systems Ltd. (hereinafter: "CARMEL") and FRENKEL CD Ltd. (hereinafter: "FRENKEL"). Through October 4, 2010, the Company owned 89.3% of CARMEL shares. Upon conclusion of a complete buy-back offer for the remainder CARMEL shares, as from October 4, 2010 HADERA PAPER owns 100% of CARMEL shares. Hadera Paper holds - directly and indirectly - approximately 57.8% of the Frenkel shares while the Company and CARMEL each hold 28.9% of the shares.
Consumables
HADERA PAPER owns 49.9% of HOGLA-Kimberly Ltd. (hereinafter: "HOGLA"), which is engaged in production, marketing and sale in the domestic market of disposable paper products (toilet paper, tissue paper), diapers and wet wipes, female hygiene products, cleaning products etc. 50.1% of HOGLA shares are owned by Kimberly Clark Corp. (hereinafter: "KC").
HOGLA wholly-owns a Turkey-resident company, KIMBERLY-CLARK TUKETIM MALLARI SANAYIVE TICARET (hereinafter: "KCTR"), which is engaged in production, marketing and sale of diapers and female hygiene products in Turkey. KCTR is the sole representative of KC in Turkey.
5
Inter-company operations
| - | Purchase of goods and services from Group companies |
Operations of the Company, its subsidiaries and investees (hereinafter jointly: "Group companies") is vertically- and horizontally integrated, and in the normal course of business, Group companies contract the leasing of assets and purchase of goods and services from other Group companies. These are contracted at market terms and conditions.
| - | Contracting between HOGLA and HADERA PAPER with interested parties |
HOGLA receives from KC R&D services, procurement services, marketing knowledge etc. HOGLA receives from HADERA PAPER various services, including land leases, energy center services, IT and other services.
HADERA PAPER PRINTING receives from MBP procurement services of cellulose and other raw materials via MBP's procurement department. HADERA PAPER PRINTING receives from HADERA PAPER various services, including land leases, energy center services, IT and other services.
| - | Construction of new logistics center |
In 2008, HADERA PAPER entered into a contract with GAV-YAM Land Ltd.1 for leasing of a dedicated logistics center (hereinafter: "the new logistics center"). The logistics center in MODI'IN covers a built area of 21 thousand m2 over land with an area of 74.5 thousand m2. In the final quarter of 2010, the logistics operations of HADERA PAPER PRINTING and of AMNIR were relocated to the new logistics center, and in the second half of 2011, Graffiti is expected to relocate to the new logistics center.
1 A public company controlled by DIC.
6
Classification of the major holdings of HADERA PAPER by major operating sector is as follows:

Packaging paper and recycling
Office equipment
marketing
marketing
Writing and
printing paper
printing paper
Packaging and
carton products
HADER PAPER1
HADERA
PAPER
PRINTING
PAPER
PRINTING
CARMEL
AMNIR
GRAFITTI
PACKAGING
FRENKEL
100%
375%
100%
100%
2100%
Consum-
ables
ables
HOGLA
KCTR
49.9%
100%
28.9%
28.9%
| 1 | This holding structure only includes the major companies. There are other active companies, wholly owned by some of the aforementioned companies. |
| 2 | As from October 4, 2010, see section 3d below. |
| 3 | As from December 31, 2010, see section 3c below. |
| 2 | Due to the fact that control over Hadera Paper Printing was acquired on December 31, 2010, the above consolidated financial statements of the company include the business results of Hadera Paper Packaging based on equity value, while the assets and liabilities of Hadera Paper Printing are consolidated as at the date of the report. The financial statements that serve as the basis for the valuation of the company operations (EV) in Chapter 3 below, present the results and the investment in Hadera Paper Printing, Carmel and Frenkel on the basis of equity value, as stated in Section 1.3, below. |
7
Below is a summary of consolidated financial statements of the Company2:
| 2006 | 2007 | 2008 | 2009 | 2010 | ||||||||||||||||
| NIS in Millions | ||||||||||||||||||||
| Revenues | 530 | 584 | 674 | 892 | 1,121 | |||||||||||||||
| Cost of Revenues | 419 | 441 | 542 | 766 | 945 | |||||||||||||||
| Gross income | 111 | 142 | 131 | 126 | 176 | |||||||||||||||
| Selling and marketing expenses | 31 | 31 | 46 | 72 | 87 | |||||||||||||||
| General and administrative expenses | 30 | 36 | 55 | 59 | 60 | |||||||||||||||
| Other revenues (expenses) | 37 | (5 | ) | 5 | 20 | 33 | ||||||||||||||
| Operating income | 88 | 70 | 35 | 15 | 62 | |||||||||||||||
| Financing expenses | 31 | 21 | 15 | 18 | 45 | |||||||||||||||
| Income Before Taxes | 57 | 49 | 20 | (3 | ) | 17 | ||||||||||||||
| Tax expense (benefit) | 17 | 18 | 4 | (7 | ) | (3 | ) | |||||||||||||
| After-tax income of Company and subsidiaries | 40 | 31 | 16 | 4 | 20 | |||||||||||||||
| Share of net income (loss) of associates | (27 | ) | 1 | 51 | 87 | 81 | ||||||||||||||
| Net income (loss) | 13 | 32 | 68 | 91 | 101 | |||||||||||||||
| Change in revenues | 9.9 | % | 10.1 | % | 15.4 | % | 32.4 | % | 25.7 | % | ||||||||||
| Gross margin | 21.0 | % | 24.4 | % | 19.5 | % | 14.1 | % | 15.7 | % | ||||||||||
| Operating margin | 16.6 | % | 12.0 | % | 5.2 | % | 1.7 | % | 5.5 | % | ||||||||||
| Net margin | 2.4 | % | 5.4 | % | 10.0 | % | 10.2 | % | 9.0 | % | ||||||||||
| EBITDA | 22.6 | % | 18.2 | % | 14.1 | % | 10.5 | % | 14.5 | % | ||||||||||
| Effective tax rate | 29.5 | % | 37.4 | % | 18.6 | % | 233.3 | % | (17.6 | )% | ||||||||||
8
| December 31, 2009 | December 31, 2010 | December 31, 2009 | December 31, 2010 | ||||||||||||||
| NIS in Millions | NIS in Millions | ||||||||||||||||
| Cash and designated deposits | 154 | 121 | Short-term credit from banks | 132 | 145 | ||||||||||||
| Trade receivables | 324 | 565 | Current maturities of debentures and long-term borrowing | 150 | 176 | ||||||||||||
| Other accounts receivable | 99 | 57 | Trade payables | 182 | 341 | ||||||||||||
| Inventory | 176 | 344 | Accounts payable with respect to investment in Machine 8 | 74 | 29 | ||||||||||||
| Others | 137 | 219 | |||||||||||||||
| Total current assets | 753 | 1,087 | Total current liabilities | 675 | 910 | ||||||||||||
| Investment in affiliated companies | 341 | 237 | Deferred taxes on income | 30 | 45 | ||||||||||||
| Deferred taxes on income | 2 | 2 | Long-term borrowing net of current maturities | 226 | 251 | ||||||||||||
| Investment property and leasing fees | 30 | 25 | Debentures | 472 | 562 | ||||||||||||
| Intangible and other assets | 28 | 38 | Liabilities with respect to employees, net | 15 | 19 | ||||||||||||
| Liability on account of MBP option | 12 | 32 | |||||||||||||||
| Total long-term investments | 401 | 302 | Total long-term liabilities | 755 | 909 | ||||||||||||
| Minority interest | 26 | 24 | |||||||||||||||
| Fixed assets, net | 1,134 | 1,384 | Shareholders' equity | 832 | 930 | ||||||||||||
| Total assets | 2,288 | 2,773 | Total shareholders’ equity and liabilities | 2,288 | 2,773 | ||||||||||||
HADERA PAPER has no specified policy with regard to dividend distribution. Since 2007, the Company has not distributed any dividends to shareholders. The Company's distributable earnings as of December 31, 2010 amounted to NIS 506 million.
The Company’s securities are listed for trading on the TEL AVIV Stock Exchange and on the AMEX.
9
| b. | Valuation methodology |
The Company valuation was achieved using the discounted cash flow method (DCF), which I believe to be the most appropriate method for valuation of the Company and investees there of; the following valuation methods have been applied:
| Operating segment / asset | Company | Valuation method | ||
| Packaging paper and recycling | PACKAGING, AMNIR etc. | DCF | ||
| Office equipment marketing | Graffiti | DCF | ||
| Consumables | HOGLA | DCF | ||
| Writing & printing paper | HADERA PAPER PRINTING | Value in transaction | ||
| Packaging and corrugated cardboard | CARMEL | Independent valuation | ||
| Packaging and corrugated cardboard | FRENKEL | Carrying amount of investment | ||
| Real estate not used for operations | HADERA PAPER | Value in transaction, historical cost | ||
| Liability with respect to HADERA PAPER PRINTING | HADERA PAPER | Independent valuation | ||
| Employee stock options | HADERA PAPER | Black & Scholes |
Discounted Cash Flow method (DCF)
The Discounted Cash Flow method (DCF) assumes that the value of the company to its shareholders is the company's enterprise value (EV) less net financial debt as of the valuation date.
The enterprise value (EV) is determined by discounting free cash flows from normal operations, using the company's weighted average capital cost (WACC). Free cash flows (FCF) are derived from the detailed business forecast for a specified period - in this opinion a business plan was created for 8 years: The years 2011-2017 and the representative year. The representative year in the forecast serves for calculation of the value of the long term operations (residual value).
10
Free cash flows (FCF) are derived from after-tax operating income after adjustment for depreciation, investment and changes in working capital. We assume that cash flows are received in the middle of each year, on average.
The Weighted Average Cost of capital (WACC) is calculated as follows:
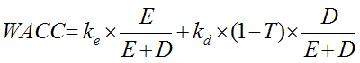
Where:
ke | - | Equity cost; |
kd | - | Foreign equity cost; |
| T | - | Corporate tax rate; |
| D | - | Estimated value of net financial debt; |
| E | - | Estimated equity value. |
The equity cost (Ke) is determined based on the CAPM model, as follows:
Where:
Rf | - | Risk-free interest; |
Rm-Rf | - | Market risk premium for share which is part of the market portfolio; |
β | - | Beta, coefficiency coordinate of share returns and market portfolio returns. |
Taxation in Israel
This valuation assumes that in 2011-2016, the corporate tax would be reduced, pursuant to the Economic Streamlining Act (Legislation Amendments for Implementing the 2009-2010 Economic Plan), 2009 which was enacted in July 2009. The act stipulates a reduction in corporate tax rate, from 26% in 2009 to 18% in 2016.
11
The group companies do not possess a valid benefit program, other than accelerated depreciation at immaterial sums and other than accelerated depreciation of the investment in Machine 8 over the course of three years, as stated in Section 3.a.(3), below. For the purpose of this valuation, we assume, based on past experience, that the effective tax rate over the forecast period would be similar to the statutory tax rate, other than the benefit inherent in the accelerated depreciation of Machine 8. Following below are the depreciation rates that served in the valuation:
| 2011 | 2012 | 2013 | 2014 | 2015 | 2016 | 2017 | 2018 | Typical year | ||||||||||||||||||||||||||||
| Effective tax rate in valuation | 24.0% | 23.0% | 22.0% | 21.0% | 20.0% | 18.0% | 18.0% | 18.0% | 18.0% | |||||||||||||||||||||||||||
Overseas taxation and taxation of value of holding in foreign entity
KCTR is a Turkey-resident company wholly owned by HOGLA. Starting in 2006, a corporate tax rate of 20% applies in Turkey, and dividend distributions to Israeli companies are subject to 10% tax withholding. Carry-forward tax losses in Turkey may be offset against income only over a 5-year term. In 2010, KCTR received demand from Tax Authorities in Turkey concerning payment of back taxes, for details see Section 4.b.(1), below.
Investment by Israeli companies in foreign entities, unlike investment by Israeli companies in Israeli entities, is subject to additional taxation, in the form of a 25% tax on dividends received from overseas. Usually, a credit may be applied for dividend tax paid overseas, such that the total tax liability, in Israel and overseas, shall not exceed 25% (assuming that the dividend tax rate overseas is not higher than 25%). In valuations, it is customary to account for excess tax with respect to investment by Israeli companies in foreign entities.
Due to our estimate that the value of HOGLA's holding stake in KCTR does not materially differ from the carrying amount of investment in KCTR on HOGLA's financial statements, we assumed that taxation of the value of holding in a foreign entity is non-material in this case.
12
c. | The Business Environment |
| This valuation was performed during a very challenging period, making it difficult to develop forecasts and estimates of growth rates and profit margins for the sectors. The difficulty stems from the rapid changes and upheavals in the leading economies, including the loss of stability of assets which for generations were considered the cornerstone of the global economy (the US dollar, European government bonds, commodities, etc), dramatic changes in the cost of capital, inflating public debt, doubts on the future of the Euro bloc, political instability in North African and Middle Eastern countries, etc. |
| Global developments |
| The current crisis broke in late 2007, amid soaring prices of commodities such as oil, wheat and corn and demonstrations were held across the globe, driven by the escalating food prices. This began as a financial crisis, triggered the US sub-prime mortgage market, the collapse of which led to huge write-offs in the balance sheets of global financial institutions. In 2008, the majority of the leading financial institutions needed massive capital injections from governments/central banks in order to survive and maintain regular business activity. Despite government bailout plans, in the US alone more than 330 banks collapsed during 2007-2010, while between July 2004 and February 2007 no bank closed its doors in the US. |
| At the same time, central banks in most Western countries took measures to solve the business and consumer credit crisis. The main steps to alleviate the credit crunch included rapid interest rate cuts and expanding credit supply to financial institutions. As a result, the availability of credit in the markets increased and financing costs for borrowers decreased. |
The crisis, which began in the financial markets, expanded into all sectors of the economy, fueling unemployment and pushing down demand. Amid the crisis, the value of financial assets eroded considerably, while the price drops across stock markets culminated in the first half of 2009. As indicated by the S&P 500 Index graph, in the first quarter of 2009 the index was 50% below its peak in late 2007. Since the index bottomed out in 2007, investors' expectations reversed as the S&P 500 rose 85% from its lowest point. From the date of the last Hadera paper valuation, which was carried out on June 30, 2009, the TA-25 Index rose 54%. The graph below shows the development of the TA-25 Index in the last five years:
13
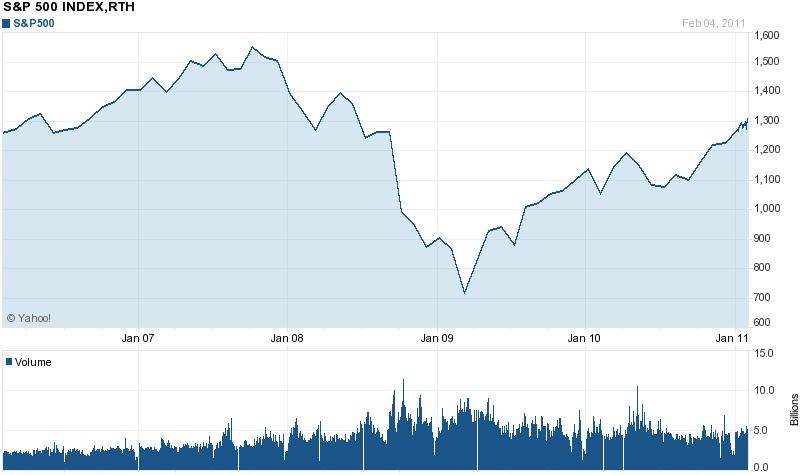
| In 2010 economic indicators seemed to suggest that the global economic crisis was coming to an end. These signs included relatively sharp price gains in global stock markets, interest rate hikes by the central banks of Australia and Canada, indicators of declining unemployment in the US, etc. |
Investors' VIX-Fear Index, which measures the implied volatility in trading of S&P 500 futures on the Chicago Board Options Exchange, fell by one third in the last year and a half. The index peaked at more than 70 points during 2008 but later traded around 30 points in mid-2009. In late 2010 the index fell below 20 points, to its pre-economic crisis levels (10-20 points).
The warning signs at the end of 2010 included, among others, an all-time-high public debt in the US and in other countries, financial woes in the Euro bloc, including a bailout plan offered to some of the Euro countries, soaring unemployment in Europe and lack of government stability in Mediterranean countries.
Forecasts by the International Monetary Fund point to 2011-2012 as years of stability, after the negative growth of the years 2008-2009 was curbed in 2010. Below are the global GDP estimates published by the IMF in January 2011:
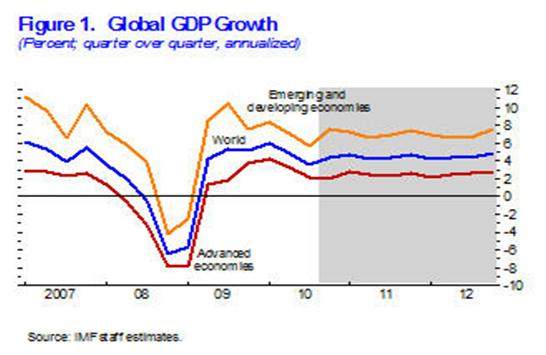
14
The low interest rates in the US and other Western countries were first perceived as temporary, but as the crisis progressed, central banks, led by the Federal Reserve and the European Central Bank (ECB) postponed their planned rate hikes. Given the enormity of the public debt, which creates inflationary pressures, raising interest rates will become inevitable in the next few years. The pace of rate increase will be affected by the pace of improvement in the economy and the price indices, but it seems that the interest rate hike will be slower than expectations during the height of the crisis.
In Israel
The global economic crisis had limited repercussions on the Israeli economy. The local stock market reacted sharply to the global crisis, with the TA-25 falling more than 50% in November 2008 from its peak in late 2007. Since the market bottomed out in the last quarter of 2008 and until the end of 2010 the TA-25 index soared 125%, buttressed by economic news that Israel's economy was hit far less than other Western countries. Since the date of the last Hadera Paper valuation, which was carried out on June 30, 2009, the TA-25 Index soared by 54%. The graph below shows the development of TA-25 over the last five years:
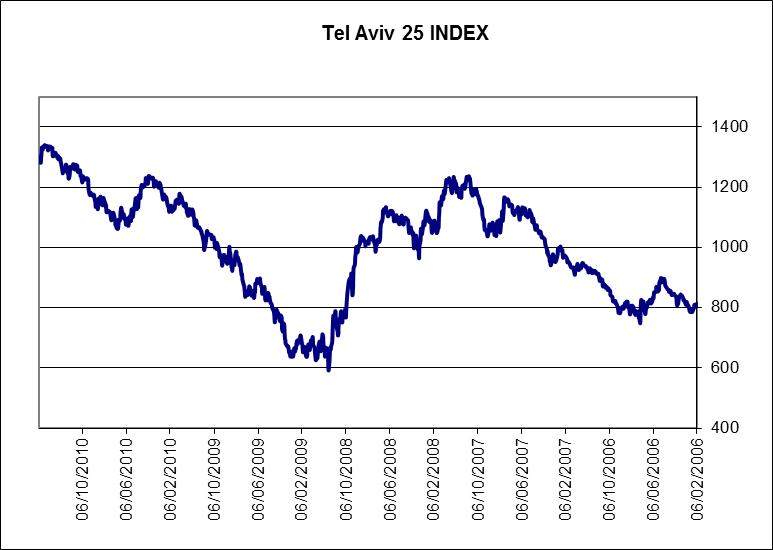
Unlike most Western countries, whose real estate markets were also hit by the crisis, Israel recorded relatively sharp gains in property prices. The reasons, inter alia, include a consistently higher demand over supply of residential real estate, the low interest rate and competition between banks over lenient mortgage terms.
The main impact on the economy during the crisis period was the shekel's appreciation against major currencies, especially the US dollar. A small economy, open to free capital movements, with exports being a crucial component of domestic activity, the shekel's appreciation can hurt Israel's competitive status and employment. However, unemployment in Israel is amongst the lowest in the world and at the end of 2010 came at 6.6%, compared to 9.6% in the US and 10% in the Euro bloc.
15
Over the last two years the Bank of Israel adopted a policy of gradual interest rate hike in order to cool the soaring equity and real estate markets and in the last few months accelerated the pace of rate increase. Naturally, the risk may raise the value of the shekel, thereby hurting the local industry somewhat restricts the Bank of Israel's freedom of action. Below is a development of the Prime interest rate3:

The increase in the Prime interest rate has not yet been reflected in the long-term real interest rate, probably due to inflation expectations in the next few years. A study of the annual structure of the yield-to-maturity of CPI-linked bonds at a fixed interest rate (Sagi and Galil) shows that in each of the years 2007-2010 (except for 2008) the interest rate curve has fallen, all along the curve. At the end of 2010, the yield-to maturity for a period longer than 25 years for CPI-linked government bonds fell to 2.7%, as follows:

3 The Prime interest rate is derived from the Bank of Israel's interest to financial institutions and is used to set the price of unlinked credit at a floating interest rate.
16
The Bank of Israel's forecast for GDP growth in the next few years points to stability in the growth pace: GDP is projected to grow by 3.8% in 2011 compared to an estimated growth of 4.5% in 2010 and 0.8% in 2009, as follows:
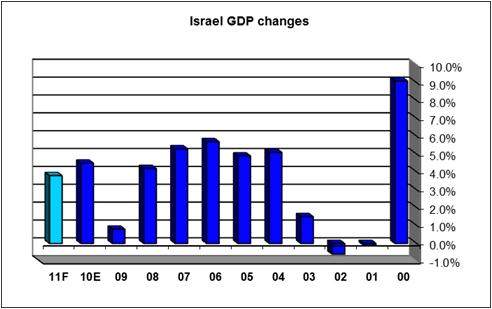
Source: "Israel and the global economy", taken from a lecture by the Bank of Israel's Governor, January 31, 2011
| For the purposes of this valuation it was assumed that in the next few years the slow improvement in the global economy will continue, while Israel will maintain a relatively higher growth pace. It was further assumed that despite nominal interest rate hikes in the years ahead, there will not be any significant change in the real interest rate environment due to inflation expectations. |
17
| Hadera Paper |
The Company operates through wholly-controlled companies in two operating segments4: the packaging paper and recycling segment and the office supplies marketing segment, as follows: |
| a. | Packaging paper and recycling |
| The following is a summary of the business results of the packaging paper and recycling segment: |
| 2006 | 2007 | 2008 | 2009 | 2010 | ||||||||||||||||
| NIS in million | ||||||||||||||||||||
| Revenues* | 412 | 465 | 407 | 339 | 511 | |||||||||||||||
| Operating profit | 50 | 71 | 39 | (3 | ) | 50 | ||||||||||||||
| Rate of change in revenues | 10.5 | % | 13.0 | % | (12.5 | )% | (16.6 | )% | 50.7 | % | ||||||||||
| Operating profit margin | 12.2 | % | 15.3 | % | 9.6 | % | (0.9 | )% | 9.8 | % | ||||||||||
* Including inter-company sales, in 2010 excluding business results in respect of Machine No. 8 during its testing period | ||||||||||||||||||||
| (1) | The business environment |
| Hadera Paper is the single manufacturer in Israel of recycled packaging paper made of waste paper and paperboard. Packaging paper consumers in Israel are companies engaged in the manufacture of corrugated board containers and packaging for every sector of the economy. Demand for packaging paper is ultimately dependent on the level of economy activity in agriculture, the food industry and other industries. In fact, the demand for these products stems from domestic and overseas demand for agricultural produce and other consumer goods manufactured in Israel. |
The supply of packaging paper in Israel is driven by domestic production by Hadera Paper and overseas production. Packaging paper is usually imported by manufacturers of corrugated board containers and packaging and includes imports of virgin paper and recycled paper. Packaging paper imports grew in the years 2008-2009 due to excess supply of this paper in Europe. The economic recovery in 2010 created a shortage in packaging paper in Europe, which diminished imports on the one hand and allowed Hadera Paper to scale up their overseas exports, on the other hand.
In the Company's estimation, in 2010 the domestic market grew 3% per annum in quantitative terms. The company's sales to the domestic market rose in 2010 by 40% in quantitative terms from 93,000 tons in 2009 to 129,000 tons in 2010.
4 The following description and analysis of the Company relate to its business activity excluding the operation of Hadera Paper Printing, Carmel and Frankel, the value of the Company's holding therein has been determined separately. For a description of Hadera Paper Printing see section 3c below; for a description of Carmel and Frankel, see section 3d below.
18
Hadera Paper enjoys the structured advantages of a domestic supplier of packaging paper, which is preferable to imports from the point of view of the customer (saving in transportation costs, availability of local inventory and service) and works to increase its market share in Israel, especially with the manufacture of new products, as specified below:
Excess demand for recycled packaging paper overseas in 2010 allowed the Company to increase its exports from NIS 57 million in 2009 to NIS 197 million5 in 2010. This increase in sales symbolizes the dramatic change in the field of packaging paper since the height of the economic crisis in 2008-2009. During these years, packaging paper was imported to Israel at particularly low prices, exports contracted and this hurt the Company's profits. In January 2009 the Company even filed a complaint with the Commissioner of Trade Levies (Anti-Dumping Restrictions) in the Ministry of Industry and Trade regarding imports of packaging papers at dumping prices from several European countries. After examining this complaint, the Commissioner of Trade Levies decided to launch an investigation at the end of which it imposed a temporary levy on imports of packaging paper from specific countries in Europe. In August 2010, the antitrust supervisor announced that the advisory committee regarding levies and dumping had recommended to impose a levy for a limited period and that the minister of industry trade and employment had received the recommendation. However, following the refusal of the ministry of finance to approve the levy, no dumping levy was imposed on the import of brown paper products.
The Company is a monopoly in the manufacture and marketing of paper in cylinders and sheets as this term is defined in the Restrictive Trade Practices Law, 1988 (hereinafter – "Antitrust Law"). In 1989 the Company was declared a monopoly in this area by the Antitrust Commissioner and in 1998 this declaration was partially cancelled in connection with the manufacture and marketing of writing and printing papers in cylinders and sheets (the core operation of Hadera Paper Printing). Except for the provisions of the antitrust law, no special instructions were issued to the Company by the Antitrust Commissioner in relation to its monopoly status. The Company is working to cancel the monopoly declaration.
The collection of the main raw material in the manufacture of packaging paper – waste paper and paperboard – is carried out through Amnir. With extensive experience in the field of recycling, in the last few years Amnir expanded its collection capacity and takes steps to identify new waste sources including the import of waste paper to Israel in order to meet the needs of packaging paper production. With the operation of Machine 8, about 78% of the waste paper sold by Amnir is used for the manufacture of packaging paper while only 22% of the waste is sold to external customers, mainly for the production of tissue paper.
Amnir's competitors in the recycling market are: KMM Recycling Enterprises Ltd, Tal-El Collection and Recycling Ltd as well as other rivals that usually focus on a certain geographic area. Amnir's share of the waste paper and paperboard market is estimated by the Company at 61%.
5 About NIS 160 million net of sales during the testing period of Machine no. 8.
19
In 2007, the Knesset approved an amendment (No. 9) to the Maintenance of Cleanliness Law, 2007 (hereinafter – "the cleanliness law"), which require landfill operators to pay a levy for every ton of waste landfilled. Pursuant to the Cleanliness Law the landfill levy of unsorted waste will be five times higher than the landfill levy for waste residues after sorting. The levy gradually increases from NIS 10 and NIS 0.8 per ton in 2007 to NIS 50 and NIS 4 per ton of unsorted waste and waste residues after sorting, respectively. The Cleanliness law is designed to encourage waste sorting and recycling of waste paper instead of landfilling. During January 2011, the Knesset passed the Packaging Law (hereinafter – "the packaging Law") which imposes direct responsibility on manufacturers and importers in Israel to collect and recycle the packaging waste of their products. The Packaging Law is based on the principle that the manufacturer or importer is responsible for recycling the packaging of the products that were produced or imported by it for sale in Israel and to bear the cost associated with the collection and recycling of the waste. In order to ensure that the undertakings of the manufacturers and importers are met, any such manufacturer or importer must enter into a legal engagement with a known body, that would be a company whose sole purpose would be to uphold the obligations of all the manufacturers and importers with whom it has engaged and that has been recognized by virtue of the Packaging Law. The packaging and arrangements provisions stipulated thereunder with respect to the assignment of responsibility between manufacturers and local municipalities for the handling of waste, determining recycling quotas for each material, assigning duty of separation of the waste at its source and other directives of the Packaging Law - are also expected to increase the supply of waste paper and waste board in the local market.
The percentage of recycling in the total consumption of paper and cardboard in Israel in 2010 is estimated at 40% compared to 57% in West Europe. In 2008, The Confederation of European Paper Industries (CEPI) declared a recycling target of 65% of the cardboard and paper consumed in the EU. These data and the efforts of the Israeli government to encourage recycling in Israel are indicative of considerable potential for continued growth in recycling in this sector.
| (2) | Products |
| The quality of packaging paper in terms of strength, resistance to humidity, price and other qualities dictates the use of this paper. Packaging paper can be classified into two main product groups: paper used for the manufacture of the external layer of corrugated cardboard and paper used for the manufacture of the external and internal layer of corrugated cardboard. |
Historically, corrugated cardboard was made from Craft Liner paper, which is high-quality virginal paper (mostly made from wood pulp). This paper is not manufactured in Israel. Due to the high price of Craft Liner paper and the trend of recycling materials, the global paper industry has developed recycled packaging paper that are cheaper than Craft Liner: fluting paper, test liner, white liner etc, which account for 70% of the packaging papers used in the manufacture of corrugated cardboard in Israel in quantitative terms. In comparison, the use of recycled packaging paper is sometimes as high as 90%. Until 2010, the packaging paper manufactured by Hadera paper was only suitable for this segment of the market, but with the introduction of new products for serial manufacture, Hadera Paper products can substitute the bulk of packaging papers used in the manufacture of corrugated cardboard.
20
In the last few years the Company has been engaged in the development of new products from waste paper (100% recycled), to be used as substitutes for virginal paper, mainly Craft Liner. The main advantages of the new products are as follows:
| √ | Environment-friendly products. Governments encourage the use of recycled products and end customers prefer recycled products to virginal products. This trend is expected to grow in the future. |
| √ | Substitutes for virginal packaging papers enable the Company to penetrate a new market segment, which is estimated at 30% of the packaging paper market in quantitative terms. Until 2010 this segment was based on imported virginal paper only. Naturally, the penetration of these products into the local industry could take several years. |
| √ | The potential to increase exports, as evidenced in 2010 in the growing demand overseas for recycled packaging paper. |
| √ | The price of new products is lower than the price of virginal products. |
| √ | The specification of new products allow top utilize the production capacity of Machine no. 1 whose operation was discontinued with the operation of Machine no. 8, as set forth below. |
In 2010, for the first time, the Company manufactured and marketed substantial quantities of the new products.
The price of packaging paper in Israel is based on the prices of these products overseas, while taking into account the advantages of working with local suppliers. The price of recycled packaging paper has risen sharply in 2010 while the prices of virginal papers have been eroded.
Amnir's products include waste paper and paperboard as well as plastic waste as well as shredding of material and disposal and shredding of waste paper and magnetic media.
| (3) | Manufacture, distribution and collection |
| On June 1, 2010 the testing of the operation of Machine 8, with an annual production capacity of 230,000 ton packaging paper, was completed. The construction of the new machine at a total cost of NIS 690 million was approved in 2007, as part of the Company's forecast that demand for recycled products will grow in the long term. The annual production capacity of packaging paper at year-end 2010 was 320,000 ton. In 2010, due to the testing of the machine, the Company's production capacity was 270,000 ton. The business results of Machine 8 during the testing period were capitalized to the cost of the machine. |
| Exploiting the potential of the new equipment is subject to the availability of waste paper and paperboard and an increase in Company sales to the local market: - |
| - | Amnir will continue to increase the pace of collection of waste paper and paperboard. In order to prepare for the operation of Machine 8, in 2008-2009 Amnir accumulated an inventory of waste paper and paperboard which, at year-end 2009, reached 100,000 tons. Most of the inventory was used up during 2010 and at December 31, 2010 Amnir's waste paper inventory is estimated at 15,000 ton. The Company is examining alternatives to supplement the sources of raw materials used in the manufacture of packaging paper, including the import of waste paper and paperboard. In the medium and long term the pace of collection is expected to catch up with the pace of processing of the waste. |
21
| - | The Company should encourage local customers to purchase packaging paper manufactured by the Company instead of importing the paper. Despite the clear advantages of buying raw materials from a local supplier, this process is expected to be gradual and until it is completed, the Company will export the excess paper to markets abroad. Export prices are usually lower than prices on the local market, in addition to which the seller incurs the transportation costs. It should be noted that due to the risks involved in international trade, the terms of credit for customers abroad are significantly better than the terms of credit for local customers. The completion of development of new products is expected to facilitate the above process. |
The investments in equipment for Machine 8 are amortized in the financial statements over a period of 25 years while for tax purposes over three years only, by 20%, 40% and 40% each year.
On the eve of the operation of Machine 8, the Company's production capacity reached 150-160 thousand tons per year. Once Machine 8 became operational, the old Machine 1, which had a production capacity of 50-60 thousand tons, was shut down. Machine 1 is operated periodically in order to preserve its production capacity without any significant investment. The old machine is suitable for the manufacture of new products with a relatively high weight per square meter and it may be operated in the future. Since its production capacity is not included in the overall production capacity of 320,000 per year, the operation of machine 1 could save investments in the short and medium term in production equipment.
At the Hadera site Amnir operates a plant for waste paper sorting, cleaning and pressing, paper shredders, magnetic media and other equipment. The production capacity in this site is estimated at 130,000 ton paper per year and only 82% of this capacity was utilized in 2010. In November 2010 Amnir's operation was relocated from Bney Brak to the new logistic center in Modi'in, which has an annual production capacity of 290,000 ton. In 2010, the Bney Brak and Modi’in sites treated 150,000 ton of waste paper, accounting for 52% of the production capacity in the new logistic center. Amnir has a fleet of 612 trucks, while 37 additional trucks are operated by subcontractors.
In addition to the manufacture and recycling of packaging paper, the Company operates an energy center through Hadera Paper Infrastructures, for the generation of steam and electricity and supplies additional services to Group companies (warehouse management, acquisitions, catering, transportation of employees, cleaning, etc). Companies using steam, electricity and other services pay Hadera paper Infrastructures for the cost of the steam and services while inter-company electricity charges are based on electricity fees set by the Israel Electric Corporation (hereinafter – "IEC"). In 2007 the Company began using natural gas in the generation of steam and electricity. The natural gas supply agreement that was signed in 2005 with the Yam Tethys partners is effective until July 1, 2011. The company is conducting negotiations with EMG and with additional potential suppliers regarding the purchase of natural gas by the company for the continued operation, subsequent to the termination of the agreement with Yam Tethys, as well as for the power plant whose construction is being considered by the company, as stated in Section 3.e.(4), below.
22
The price of natural gas used in the generation of steam and electricity by Hadera Paper Infrastructures is expected to increase. The cost of purchasing natural gas for the operation of the packaging paper segment in 2010 was NIS 30 million.
| (4) | Customers |
There are five manufacturers of packaging paper and corrugated board containers in Israel: Carmel, Kargal Ltd6, Best Carton Ltd, Y.M.A 1990 Manufacture of Packaging Products Ltd and Ordea Print Industries Ltd. These companies purchase the products manufactured by Hadera Paper while importing virginal and recycled packaging paper from Germany, Spain, Austria, Italy, France and China. |
| The Company's customers manufacture corrugated board through corrugators. They process the corrugated board into board containers for their customers or sell the corrugated boards to small processers, which manufacture packaging for niche or small end customers. |
| Corrugated board containers are hygienic, disposable packages, which are relatively cheap and considered environment-friendly. Board containers are used in every sector of industry. The food and beverage industry and agricultural industry represent the biggest demand for corrugated board containers in Israel. Additional sectors that widely use corrugated board containers are: cosmetics, technology and industry. The import of board containers is not economically feasible due to the volume of the product, lack of supply availability and other factors, while its global price serves as a "shadow price" for the local product (in practice, imports are limited). |
| Demand for packaging paper stems from the basic consumption of food, beverages and agricultural produce and the use of substitutes (plastic containers, nylon bags etc). Demand is also affected by the extent of agricultural and industrial exports. For example, the rapid growth of agricultural exports in the last few years (exports of niche crops such as peppers, where farmers enjoy a high profit margin) has boosted demand for high-quality corrugated board containers. On the other hand – the relocation of industrial production from Israel to overseas markets, the import of packaged products and the increase in the price of water for agricultural uses is hurting the packaging sector. |
| The operation of Machine 8 has made the packaging segment Amnir's main customer, with 78% of Amnir's sales channeled to this segment in quantitative terms. Other Amnir customers include: Hogla, Shaniv Paper Industries Ltd, Panda Paper Enterprises (1997) Ltd and Jerusalem White Paper 2000 Ltd. |
23
| (5) | SWOT analysis |
| Strengths |
| - | The Company's products are intended for the local market and are based on local raw materials. |
| - | The successful operation of Machine 8 has doubled the Company's packaging paper production capacity. |
| - | A "green" image due to the use of waste paper as the main raw material and recycling activity. |
| - | The Company's product mix is complete following the development of a recycled packaging paper as a substitute for virginal paper. |
| - | High entry barriers in the packaging paper segment including hefty investments in production and availability of waste paper and paperboard. Major manufacturers of packaging paper will have a small chance of successfully entering the market. |
| - | Amnir is branded as the leading waste paper and paperboard collector in Israel. |
Weaknesses
| - | The Company is dependent on a natural gas supplier and the gas price after July 1, 2011, when the current gas agreement ends. Disruptions in the gas supply and higher gas costs could have an adverse impact on the Company's business results. |
| - | Statutory limitations applicable to the Company by virtue of its status as a declared monopoly in the manufacture and marketing of papers in cylinders and sheets. |
Opportunities
| - | The successful testing of Machine 8 has occurred at a time of economic recovery, which increases the Company's chance of expanding its market share in Israel. |
| - | The development of new products that replace virginal paper could potentially increase sales to the local market by dozens of percents. |
| - | The marketing of new products overseas as "green" products that substitute virginal paper. |
| - | Increased collection of waste paper and paperboard in the next few years owing to higher collection capacity and the entry into force of the Cleanliness Law and the Packaging Law. |
Threats
| - | The advent of a double dip recession will hurt demand for packaging paper in Israel and overseas. |
| - | Exposure to the price of packaging paper overseas. |
| - | Unlike the white paper industry, where there is high correlation between the product's price and the cost of the main raw material – wood pulp, in the recycled paper industry, the correlation between the cost of waste paper and the product's price is relatively low. A decline in the prices of products could hurt the Company's profitability. |
24
| - | Imports of packaging paper by manufacturers of corrugated board containers and packaging at cheaper prices. |
| - | Lack of available sources of raw materials for the operation of the new machine and the need to import waste paper. |
| - | A sharp increase in the price of natural gas which is used to operate the energy center, once the current agreement with the Yam Tethys partnership ends in June 2011. |
| b. | Marketing of office supplies |
| The revenues of the office supplies marketing segment have grown by a double digit rate in the last few years while the operating profitability margin has been maintained at a range of 2.5%-3.5%, as follows: |
| 2006 | 2007 | 2008 | 2009 | 2010 | ||||||||||||||||
| NIS in million | ||||||||||||||||||||
| Revenues | 122 | 119 | 131 | 151 | 179 | |||||||||||||||
| Operating profit | 0 | 1 | 3 | 5 | 5 | |||||||||||||||
| Rate of change in revenues | 7.4 | % | (2.5 | )% | 9.9 | % | 15.5 | % | 18.5 | % | ||||||||||
| Operating profit margin | 0.0 | % | 0.7 | % | 2.4 | % | 3.3 | % | 2.8 | % | ||||||||||
| (1) | The business environment |
| Graffiti is engaged in the acquisition, imports, marketing and sale of office supplies and related products, mainly in the institutional market. The marketing and sale of office equipment is primarily carried out through participation in tenders, exhibitions, catalogues, websites and sales people. Graffiti provides services to large business customers (government offices, banks, health funds, etc) which usually offer the winning bidder a two-four year contract. In 2010 and 2009, Graffiti's revenues as a result of winning tenders accounted for 32% and 34% of its total revenues, respectively. |
| Graffiti offerings consist of about 12,000 items including, among others, dry food products and beverages and cleaning products. The marketed items are acquired from local suppliers (Hadera Paper Printing, Hogla, office equipment importers, consumer electronics importers, food and beverage manufacturers and others) or imported through a wholly-owned subsidiary which represents Artline, Mitsubishi, Max, Sneider and other international brands in Israel. Graffiti is not dependent on any of its suppliers. |
| Graffiti's main competitors are: Kravitz (1974) Ltd, Office Depot (Israel) Ltd, New Horizon Ltd, Pythagoras (1986) Ltd, Arta Graphics Art and Office Equipment Ltd, Lautman Rimon Ltd, Fun Manufacture and Imports of Office Supplies Ltd and additional office supplies marketers, some operating in niche markets. |
| In November 2010 Office Depot (Israel) Ltd was acquired by the New Hamashbir Lazarchan Ltd and Office Depot customers were added to the acquirer's consumer club. At this stage it is unclear how this acquisition will affect activity in the institutional market in which Graffiti specializes. |
25
| Graffiti operates several sites, the main one located in Park Afek in Rosh Ha'ayin, which houses Graffiti's main logistic centre, including a warehouse, sales and management centre. Graffiti is in the process of building a new logistic centre in Modi’in, as stated in section 2.a, above. The transition to the new logistic centre is scheduled for the second half of 2011, right after the lease agreement in Park Afek expires. Graffiti plans to consolidate its operations in the new logistic center. Graffiti's distribution centre includes 38 distribution vehicles. |
Graffiti's business operation is seasonal while its revenues in the second half of the year are usually higher than those in the first half.
| (2) | SWOT analysis |
| Strengths |
| - | A strong brand among business and institutional customers; services provided countrywide. |
| - | Exclusive franchise to import several international brands such as Artline and Mitsubishi (Uni-ball pens). |
Weaknesses
| - | Very low entry barriers to the office supplies sector and fierce competition, primarily in the center of Israel. |
| - | Strong competitors with long-standing brands such as Office Depot and Kravitz. |
Opportunities
| - | Graffiti is taking advantage of the market decentralization and its own economies of scale to promote growth through mergers and acquisitions. |
| - | It is also using the advantages of the new logistic center to reduce operating costs. The new logistic center is expected to computerize and streamline inventory and order management. |
Threats
| - | Graffiti is exposed to customers from every sector of the economy. The collapse of companies during the economic crisis, especially in the real estate, diamond and technology sectors, and the cutback in procurement budgets among institutional and business customers could hurt Graffiti's day-to-day operations and its assets (trade receivable). |
| - | The acquisition of Office Depot by the New Hamashbir Lazarchan could escalate competition in the market. |
| c. | Printing and Writing Paper |
Until 1999 the Printing and Writing Paper segment (hereinafter – "printing paper") was managed as a division of Hadera Paper and as part of its core business. In 1999 Mondi Business Paper Ltd (formerly Neusiedler AG) (hereinafter – "MBP") acquired 50.1% of the division which, on the eve of the transaction, was transferred to Hadera Paper – Printing and Writing Paper Ltd (formerly – Mondi Hadera Paper Ltd) (hereinafter – "Hadera Paper Printing"), which was established for that purpose. On December 31, 2010 the Company acquired 25.1% of the shares of Hadera Paper Printing from MBP for a consideration of €10.4 million and as of that date the Company holds 75% of the shares of Hadera Paper Printing. |
26
As part of acquiring 25.1% of the shares, Hadera paper Printing gave MBP a put option to sell its remaining holdings in Hadera Paper Printing to the Company (hereinafter – "undertaking to MBP"). The price of exercise of the option was set as the market value of Hadera Paper Printing after deducting 20% but no less than a fixed amount, as it is defined in the purchase agreement. The put option will be blocked for the first three years from the date of closing of the transaction, and shall be exercisable at any time thereafter. |
| 2006 | 2007 | 2008 | 2009 | 2010 | ||||||||||||||||
| NIS in million | ||||||||||||||||||||
| Revenues | 712 | 770 | 732 | 669 | 729 | |||||||||||||||
| Operating profit | (2 | ) | 34 | 34 | 40 | 31 | ||||||||||||||
| Rate of change in revenues | 7.3 | % | 8.2 | % | (4.9 | )% | (8.6 | )% | 8.9 | % | ||||||||||
| Operating profit margin | (0.3 | )% | 4.4 | % | 4.7 | % | 6.0 | % | 4.2 | % | ||||||||||
The value of the Company's holdings in the shares of Hadera Paper Printing and the value of the option given to MBP were recorded in the financial statements as of the transaction date, December 31, 2010, based on the paper on the Purchase Price Allocation (PPA) of Mondi Hadera Paper Ltd, which was prepared by Giza Even Singer Ltd. Due to the fact that the date of financial reporting and the closing date of the translation are identical, no adjustments were made to the value of investment in Mondi in the company balance sheet as at December 31, 2010. The value of holdings in Hadera Paper Printing and the undertaking in respect of the MBP option in this valuation were also determined based on the results of the above PPA. |
Below is a description of the business activity of Hadera Paper Printing and a summary of its financial statements:
| (1) | The business environment |
| Hadera Paper Printing is engaged in the manufacture, imports, marketing and sale of writing and printing paper and the only manufacturer in Israel that specializes in the manufacture of these products. The main product offered by Hadera Paper Printing is uncoated white paper made of pulp, weighting 70-90 grams per square meters, which is the most common paper in Israel for these uses. To supplement its products basket Hadera paper Printing imports high-density paper, coated paper, colored paper and other types of paper and imports the surplus white paper it manufactures. |
| Hadera Paper Printing's competitors in the domestic market are the leading paper importers in Israel: Niris Ltd, Ronimer Ltd, Elenfer Trading, Mey Hanachal Ltd, B.O.R. Rose Brotherhood Ltd and others. Some of the competing imports are based on spot transactions for inventories in Europe, and carried out by office supplies and paper distributors. The volume of these imports changes from one year to the next as a function of the availability and price of white paper in Europe. |
27
| In the last few years Hadera Paper has been working to expand its exports. In 2007-2008 the company's products were exported directly rather than through MBP, with most of the exports directed to Mediterranean Basin countries: Cyprus, Egypt and Jordan. In 2010 efforts were made to shift exports to the US, which offered higher profit margins. Exports to the US in 2010 accounted for 66% of total exports compared to 90% of exports to Egypt and Jordan in 2008-2009. The following graph a development of the company's exports in the last few years: |
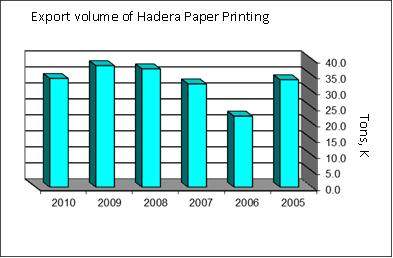
The price of writing and printing paper is usually derived from excess production capacity in the sector. Due to the high transportation costs, Israel is mainly affected by excess production costs in Europe. RISI, which specializes in economic reviews for the paper industry, published a forecast at the end of 2010 according to which demand for writing and printing paper in Europe will remain relatively stable in the foreseeable future due to the transition of consumers to substitute products such as digital media. This situation is expected to maintain excess production capacity, at the level recorded in late 2010, about 10% of installed production capacity.
Domestic demand for the products of Hadera Paper Printing mainly stems from economic activity and the size of the population, and is affected by long-term trends such as environmental conservation, printed media consumption habits, demand for books, etc. Very few changes are expected in demand for printing and writing paper in Israel, with erosion in demand for paper per capita on the one hand, and population growth on the other.
The supply of printing and writing paper products in Israel is derived from the production capacity of Hadera Paper Printing and the volume of imported paper. The volume of import is affected by the difference between the price of white paper overseas and its price in Israel, exchange rates, transportation costs and other factors. Excess demand/supply overseas is derived from the level of demand and the pace of construction/shutting down of production plants, mainly in Europe. Hadera Paper Printing estimates its share of the domestic market at 50%.
28
| (2) | Customers |
| Hadera Paper Printing operates in four segments of the Israeli market: |
| - | The printing segment |
Marketing of white paper manufactured by Hadera Paper Printing and imported coated paper. The paper is usually supplied in large sheets or cylinders.
| - | Office supply retailers |
Marketing and sale of writing paper for private and office uses (mainly A4) to office supply retailers. Hadera Paper Printing's customers include the three biggest office supply retailers in Israel: Office Depot, Kravitz and Graffiti, smaller retailers and large business and institutional customers such as government offices, banks, etc.
| - | Independent distributors |
Hadera Paper Printing markets its products to small customers through independent distributors.
| - | Paper product manufacturers |
In this segment Hadera Paper Printing markets white paper to manufacturers of paper products: envelopes, notebooks and writing pads, and to businesses specializing in digital printing (office letterheads, greeting cards, etc).
In Israel, Hadera Paper Printing possesses approximately 450 customers, with the central customers being printing houses (approximately 21%), paper wholesalers (approximately 19%), office supplies wholesalers (approximately 32%), manufacturers of paper products (approximately 28%) and end users.
| (3) | Raw materials and suppliers |
| Hadera Paper Printing's main raw material is pulp which on average constitutes 50% of the cost of production. Hadera Paper Printing purchases pulp from several suppliers, mainly European, as part of MBP's long-term purchase agreements and in its opinion, is not dependent on these suppliers or on MBP. |
| The price of pulp soared in 2007 and in the first half of 2008 amid the steep rise in the prices of most commodities and fell in the second half of 2008 and in the first half of 2009. In the second half of 2009 pulp prices began climbing again, a trend which continued until the last quarter of 2010. The graph below is a development of global pulp prices in 2009-2010 and a forecast for 2011: |
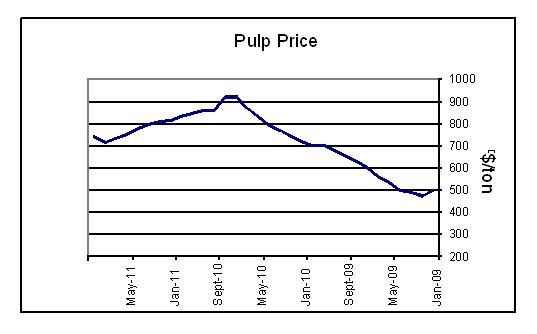
29
| Additional raw materials in the manufacture of white paper are chemical substances, mainly chalk and starch. These materials are acquired from two local manufacturers, Oumia Shfeya Ltd and Galam Ltd. These are the sole manufacturers of these materials in Israel and therefore Hadera Paper Printing is dependent on these suppliers. |
Hadera Paper Printing buys electricity and steam from Hadera Paper Infrastructures7. At the end of 2007 Hadera Paper's energy center began using natural gas instead of fuel oil. As a result, in 2008 Hadera paper Printing's energy costs began dropping. Once the natural gas agreement with the Yam Tethys partners expires in 2011, energy prices are expected to increase. The company is conducting negotiations with several entities regarding the purchase of natural gas, as stated in Section 3.a.(3), above. |
| Hadera Paper Printing uses MBP's purchase system to buy imported pulp and chemicals. For these services Hadera Paper Printing pays MBP a fee at the rate of 1% of the purchase volume. Hadera Paper Printing works with three major pulp suppliers overseas and in its opinion, it is not dependent on any of these pulp suppliers. No change is anticipated in the purchasing of pulp via MBP as a result of the transition of 75% of the holdings in Hadera Paper Printing to Hadera Paper as of December 31, 2010. |
| Most of the raw materials used in the manufacture of white paper are commodities or their prices are derived from the prices of commodities, and they are stated in foreign currency. On the other hand, the prices of Hadera Paper's products on the local market are stated in shekels and are not directly linked to the prices of commodities. As a result, Hadera Paper Printing is exposed to fluctuations in the prices of pulp and chemical as well as fluctuations in currency exchange rates. Hadera Paper Printing is also exposed to energy prices, mainly electricity and steam. |
| (4) | Production and distribution |
| Hadera Paper Printing's production plant is located in Hadera and has a fully-utilized production capacity of 141,000 ton. In 1999 the plant's production capacity was 90,000 ton per year, but owing to MBP's know-how, its production capacity rose to 120,000 ton per year. In 2005 the plant's production capacity was increased by 20,000 ton per year as a result of improvements in the paper machine and optimization of the production process with a $12 million investment. In the last few years, the production capacity remained stable, as follows: |
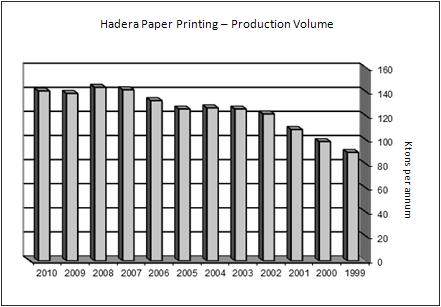
30
| Until the last quarter of 2010, the company's products in Israel were distributed from three sites in Hadera, Holon and Haifa. In the fourth quarter Hadera Paper Printing relocated its operation to the new logistic center in Modi’in. |
| (5) | SWOT analysis |
| Strengths |
| - | The sole manufacturer of writing and printing paper in Israel. |
| - | The required capital investment constitutes a high entry barrier for paper manufacturers and consequently, the odds of building an additional white paper plant in Israel are slim. |
| - | 25% of the shares of Hadera Paper Printing are owned by MBP, one of the leading global manufacturers of printing and writing paper. Hadera Paper Printing has access to MBP's international know-how and purchase system. |
| - | The company's papers are notable for their high quality. |
| - | A diverse products basket |
Weaknesses
| - | Full utilization of production capacity, increasing production above the potential in the optimization of the production process requires investments in the paper machines. |
| - | The main raw material – pulp, is imported to Israel. The chances of significantly expanding the plant or acquiring a new paper machine are slim. |
| - | Dependence on two chemical suppliers with local production plants. |
| - | Exposure to prices of raw materials, exchange rates and energy prices. |
Opportunities
| - | Additional expansion of production capacity through optimization of the process at a small investment. |
31
Threats
| - | Waning demand for Hadera Paper's products in the medium and long term due to changes in consumers' preferences, the "green" trend and a shift to digital media. |
| - | Competing imports from Europe at cheaper prices. |
| - | A deepening economic crisis will erode domestic demand for printing and writing paper or create large paper surpluses in Europe. |
| - | Deterioration of the security situation in the region could impact direct exports. |
| (6) | Summary of business results and financial situation |
| The following tables include a summary of the consolidated financial statements of Hadera Paper Printing: |
| 2006 | 2007 | 2008 | 2009 | 2010 | ||||||||||||||||
| NIS in million | ||||||||||||||||||||
| Revenues | 712 | 770 | 732 | 669 | 729 | |||||||||||||||
| Cost of revenues | 660 | 688 | 650 | 579 | 640 | |||||||||||||||
| Gross profit | 52 | 82 | 83 | 91 | 88 | |||||||||||||||
| Selling and marketing expenses | 45 | 38 | 38 | 40 | 43 | |||||||||||||||
| Administrative and general expenses | 9 | 11 | 10 | 11 | 14 | |||||||||||||||
| Other income (expenses) | - | - | (1 | ) | - | - | ||||||||||||||
| Operating profit (loss) | (2 | ) | 34 | 34 | 40 | 31 | ||||||||||||||
| Financing expenses | 7 | 8 | 8 | 11 | 2 | |||||||||||||||
| Pre-tax income (expenses) | (9 | ) | 25 | 26 | 29 | 29 | ||||||||||||||
| Tax expenses (income) | (1 | ) | 7 | 7 | 1 | 7 | ||||||||||||||
| Net income (loss) | (8 | ) | 18 | 19 | 28 | 22 | ||||||||||||||
| EBITDA | 9 | 44 | 46 | 52 | 43 | |||||||||||||||
| Rate of change in revenues | 7.3 | % | 8.2 | % | (4.9 | )% | (8.6 | )% | 8.9 | % | ||||||||||
| Gross profit margin | 7.3 | % | 10.6 | % | 11.3 | % | 13.6 | % | 12.1 | % | ||||||||||
| Operating profit margin | (0.3 | )% | 4.4 | % | 4.7 | % | 6.0 | % | 4.2 | % | ||||||||||
| Net income margin | (1.1 | )% | 2.3 | % | 2.6 | % | 4.2 | % | 3.0 | % | ||||||||||
| EBITDA margin | 1.3 | % | 5.8 | % | 6.2 | % | 7.8 | % | 5.9 | % | ||||||||||
| Effective tax rate | 12.5 | % | 28.6 | % | 26.8 | % | 2.1 | % | 24.9 | % |
32
| 31/12/09 | 31/12/10 | 31/12/09 | 31/12/10 | ||||||||||||||
| NIS million | NIS million | ||||||||||||||||
| Cash and cash equivalents | 17 | 13 | Short-term bank credit | 69 | 93 | ||||||||||||
| Trade receivable | 184 | 176 | Current maturities of long-term credit | 11 | 4 | ||||||||||||
| Other receivables | 2 | 6 | Suppliers and service providers | 106 | 120 | ||||||||||||
| Inventory | 108 | 162 | Commercial debt to Hadera Paper | 58 | 55 | ||||||||||||
| Declared dividend | - | 9 | |||||||||||||||
| Other | 26 | 30 | |||||||||||||||
| Total current | 312 | 356 | Total current maturities | 269 | 309 | ||||||||||||
| assets | Deferred income tax | 23 | 22 | ||||||||||||||
| Long-term credit net of current maturities | 13 | 9 | |||||||||||||||
| Intangible assets | 3 | 3 | Liabilities in respect of employees, net | 2 | 3 | ||||||||||||
| Total long-term investments | 3 | 3 | Total long-term liabilities | 38 | 34 | ||||||||||||
| Fixed assets, net | 147 | 146 | Shareholders' equity | 155 | 163 | ||||||||||||
| Total assets | 462 | 506 | Total equity and liabilities | 462 | 506 | ||||||||||||
| d. | Packaging and carton products |
Carmel Containers was established in 1983 and is engaged in the planning, manufacture, marketing and sale of containers, corrugated cardboard panels, wooden surfaces and other products. In 1986 its shares were listed for trading on the AMEX in the US, in 2005 they were delisted from trading and on October 4, 2010 a public purchase offer for 10.7% of the shares was completed. As of the date of this opinion, the Company holds 100% of the shares of Carmel. Below is a summary of Carmel's business results:
| 2006 | 2007 | 2008 | 2009 | 2010 | ||||||||||||||||
| NIS million | ||||||||||||||||||||
| Revenues | 420 | 471 | 418 | 383 | 397 | |||||||||||||||
| Operating profit | 17 | 14 | (7 | ) | 13 | 4 | ||||||||||||||
| Rate of change in revenues | 1.1 | % | 12.3 | % | (11.4 | )% | (8.3 | )% | 3.7 | % | ||||||||||
| Operating profit margin | 4.0 | % | 3.0 | % | (1.7 | )% | 3.4 | % | 1.0 | % | ||||||||||
33
Frenkel is engaged in the planning, manufacture, marketing and sale of shelf cardboard packaging, stands for the display of products on the selling floor, etc. Frenkel was established following a merger between C.D. Packaging Systems Ltd and Frenkel and Sons Ltd in January 2006. On the eve of the transaction, C.D. Packaging Systems Ltd was owned by the Company (50%) and Carmel (50%) while Frenkel and Sons Ltd was controlled by a third party. Following the transaction, the Company and Carmel each hold 28.9% of the shares of Frenkel, while Frenkel and Sons Ltd hold the remaining 42.2%. Below is a summary of Frenkel's business results:
| 2006 | 2007 | 2008 | 2009 | 2010 | ||||||||||||||||
| NIS million | ||||||||||||||||||||
| Revenues | 113 | 123 | 117 | 120 | 131 | |||||||||||||||
| Operating profit | (1 | ) | 1 | 1 | 2 | 3 | ||||||||||||||
| Rate of change in revenues | NR | 8.6 | % | (4.4 | )% | 2.3 | % | 9.2 | % | |||||||||||
| Operating profit margin | (0.6 | )% | 0.9 | % | 0.6 | % | 1.7 | % | 2.3 | % | ||||||||||
The value of the Company's holdings in Carmel in this valuation was determined based on the valuation of Carmel Containers Ltd, which was prepared by Giza Singer Even Ltd, enclosed as Appendix B. The value of the Company's holdings in Frenkel was determined, due to lack of materiality, based on the balance of investment in Frenkel in the Company's balance sheets at December 31, 2010 |
Below is a description of the business activity of Carmel and Frenkel and a summary of their financial statements:
| (1) | The business environment |
| In the Company's estimation, in 2010 the local packaging market grew at a rate of 3% as a result of higher demand for food and beverages, agricultural and technological products, among others. |
Carmel's competitors in the corrugated market are four local manufacturers of corrugated cardboard and its products: Kargal Ltd8, Best Carton Ltd, Y.M.A. 1990 Manufacturing of Packaging Products Ltd and Ordea Print Industries Ltd. These companies manufacture corrugated cardboard panels and containers and sell the containers to customers that use them for packaging purposes, and the corrugated cardboard panels to companies that manufacture small series of containers for small customers. The entry barrier to the corrugated cardboard market is relatively high because of the need to invest in corrugators. Small corrugators have a production capacity of 40,000 ton per year while bigger corrugators produce up to 80,000 ton per year. Investing in a corrugator requires the manufacturer to sell large volumes to customers in a saturated market and therefore entails a high risk. |
| The import of paper and cardboard packaging is limited due to their physical volume and the high availability required for packaging products. Several companies import packaging products directly but the volume of these imports is small. |
| Carmel's customers in the corrugated cardboard market include leading food and beverage companies, agricultural wholesalers, farmers, technology companies, government offices and banks. Its customers in the corrugated cardboard panels are companies that process the panels into packaging products and printing companies that use corrugated cardboard as a raw material for printing or adhering. |
8 About 26% of Kargal's share capital is held by CII Ltd., the controlling shareholder of the company
34
| Carmel has 250 active customers, with revenues from the 20 biggest customers accounting for more than 50% of Carmel's total income. Although sales to one customer represented 12.7% of Carmel's revenues in 2010, it is not dependent on a single customer. The packaging products are sold by sales persons and in exhibitions and trade fairs, while some customers conduct periodic tenders among packaging suppliers. |
| In 2010, out of the total packaging paper used by Carmel 55% was recycled paper manufactured by Hadera Paper and 45% was imported virginal paper. In Europe, by comparison, recycled packaging paper accounts for 90% of total paper consumption in the corrugated cardboard packaging industry. The transition to recycled packaging paper by Carmel can lead to cost saving on the one hand, and boost demand for Hadera Paper's products on the other. |
| In addition to corrugated cardboard packaging, Carmel is engaged in the manufacture of reinforced containers from multi-layered corrugated cardboard. The manufacture of multi-layered cardboard containers is a niche area with a limited growth potential and the products usually replace wooden crates. The entry barrier to this sector is rather high due to the know-how required in the planning of unique highly-resilient packaging solutions. In this area Carmel's main competitor is Triplex Containers (2003) Ltd. |
| The wooden surfaces sector comprises several manufacturers and marketers, mostly regional. The entry barrier is low and the sector is characterized by a relatively high turnover. |
| As of December 31, 2010, Carmel's production capacity at its Caesarean plant was estimated at 100,000 ton per year and 15,000 ton at its Carmiel plant. The actual production utilizes 80% of the company's production capacity in Caesaria and 85% of its capacity in Carmiel. Carmel's production system comprises corrugators and machines for processing corrugated cardboard panels (mainly printing and cutting), warehouses for raw materials and finished products and a truck fleet operated by subcontractors. |
| Frenkel's operation requires it to supply high-quality printing on packaging products. The field has changed in the last decade with the entry of digital printing, making the manufacture of packaging products by smaller printing firms economically viable. Frenkel's main competitors are: the Ducarte Group, Graphics Bezalel Ltd, Hanamal, Copy Center and various small companies. Most of Frenkel's customers are food and beverage companies. Frenkel is not dependent on any particular customer. |
35
| (2) | SWOT analysis |
| Strengths |
| - | Reputation and extensive know-how in the manufacture of packaging |
| - | A diverse products basket comprising small and unique packaging products, serial production of corrugated cardboard containers and custom-made large containers from multi-layered corrugated cardboard. |
| - | Carmel's customers come from essential sectors such as agriculture, food, beverages, etc, whose exposure to an economic crisis is relatively low. |
Weaknesses
| - | Low entry barrier (unlike the manufacture of corrugated cardboard) leads to fierce competition. |
| - | Competitive market (four large players) which is affected by the gap between supply and demand due to the structure of investments in the sector (efficient corrugators are large corrugators, where the investment in a single corrugator can reach tens of millions of dollars and where a new corrugator possesses a significant impact on the sector). |
Opportunities
| - | Taking advantage of the synergy from the acquisition of control in Carmel and Frenkel on the one hand and expansion of the production capacity of packaging paper, on the other. |
| - | Carmel's transition to recycled packaging paper could reduce the cost of materials and improve its profit margins. |
Threats
| - | The agriculture industry is one of the biggest consumers of corrugated cardboard containers, especially for exports. Cutting back water quotas for farmers could reduce crop yields and as an outcome – the demand for packaging products. |
| - | The transition to multi-use plastic packaging from paper and cardboard packaging as part of the "green" trend will reduce demand for Carmel's products. |
| - | Carmel is exposed to changes in exchange rates due to the fact that 60% of its packaging paper is imported while product prices are in shekels. |
36
| (3) | Summary of Carmel and Frenkel's business results |
| The following tables present a summary of financial position and financial results for Carmel and Frenkel: |
| Carmel | Frenkel | Carmel | Frenkel | ||||||||||||||
| 31/12/2010 | 31/12/2010 | ||||||||||||||||
| NIS million | NIS million | ||||||||||||||||
| Cash and cash equivalents | 1 | Short-term bank credit | 43 | 28 | |||||||||||||
| Trade receivable | 178 | 40 | Current maturities of short term credit | 6 | |||||||||||||
| Other receivable | 4 | 1 | Suppliers and service providers | 91 | 35 | ||||||||||||
| Inventory | 54 | 25 | Others | 23 | 7 | ||||||||||||
| Total current assets | 237 | 66 | Total current liabilities | 157 | 76 | ||||||||||||
| Deferred and other income taxes | 4 | 3 | |||||||||||||||
| Investment in associates | 8 | Long-term credit net of current maturities | 39 | 8 | |||||||||||||
| Intangible and other assets | 4 | Liabilities in respect of employees , net | 2 | 3 | |||||||||||||
| Total long-term investments | 8 | 4 | Total long-term liabilities | 45 | 14 | ||||||||||||
| Fixed assets, net | 81 | 43 | Shareholders' equity | 124 | 23 | ||||||||||||
| Total assets | 326 | 113 | Total equity and liabilities | 326 | 113 | ||||||||||||
| Carmel: |
| 2006 | 2007 | 2008 | 2009 | 2010 | ||||||||||||||||
| NIS million | ||||||||||||||||||||
| Revenues | 420 | 471 | 418 | 383 | 397 | |||||||||||||||
| Cost of revenues | 369 | 417 | 384 | 329 | 353 | |||||||||||||||
| Gross profit | 51 | 55 | 34 | 54 | 44 | |||||||||||||||
| Selling and marketing expenses | 23 | 24 | 23 | 23 | 24 | |||||||||||||||
| Administrative and general expenses | 16 | 17 | 20 | 19 | 19 | |||||||||||||||
| Other income (expenses) | 5 | 0 | 2 | 1 | 3 | |||||||||||||||
| Operating expenses | 17 | 14 | (7 | ) | 13 | 4 | ||||||||||||||
| Financing expenses | 2 | 5 | 3 | 3 | - | |||||||||||||||
| Pre-tax income | 15 | 10 | (10 | ) | 10 | 4 | ||||||||||||||
| Tax income (expenses) | 3 | 2 | (3 | ) | 1 | 1 | ||||||||||||||
| Profit after tax | 12 | 8 | (7 | ) | 9 | 3 | ||||||||||||||
| Share in loss of associates, net | - | - | (1 | ) | - | - | ||||||||||||||
| Net income (loss) | 12 | 8 | (7 | ) | 9 | 3 | ||||||||||||||
| EBITDA | 36 | 35 | 14 | 29 | 17 | |||||||||||||||
| Rate of change in revenues | 1.1 | % | 12.3 | % | (11.4 | )% | (8.3 | )% | 3.7 | % | ||||||||||
| Gross profit margin | 12.2 | % | 11.6 | % | 8.0 | % | 14.1 | % | 11.1 | % | ||||||||||
| Operating profit margin | 4.0 | % | 3.0 | % | (1.7 | )% | 3.4 | % | 1.0 | % | ||||||||||
| Net income margin | 2.9 | % | 1.6 | % | (1.8 | )% | 2.3 | % | 0.8 | % | ||||||||||
| EBITDA margin | 8.5 | % | 7.3 | % | 3.4 | % | 7.6 | % | 4.3 | % |
37
Frenkel:
| 2006 | 2007 | 2008 | 2009 | 2010 | ||||||||||||||||
| NIS million | ||||||||||||||||||||
| Revenues | 113 | 123 | 117 | 120 | 131 | |||||||||||||||
| Cost of revenues | 99 | 111 | 105 | 105 | 114 | |||||||||||||||
| Gross profit | 14 | 12 | 13 | 15 | 17 | |||||||||||||||
| Selling and marketing expenses | 9 | 6 | 6 | 7 | 8 | |||||||||||||||
| Administrative and general expenses | 6 | 5 | 7 | 6 | 6 | |||||||||||||||
| Operating expenses | (1 | ) | 1 | 1 | 2 | 3 | ||||||||||||||
| Financing expenses | 2 | 3 | 4 | 3 | 3 | |||||||||||||||
| Pre-tax income | (3 | ) | (2 | ) | (4 | ) | (1 | ) | 0 | |||||||||||
| Tax income (expenses) | (1 | ) | (0 | ) | (1 | ) | (2 | ) | 0 | |||||||||||
| Net income (loss) | (2 | ) | (1 | ) | (3 | ) | 1 | 0 | ||||||||||||
| EBITDA | 3 | 4 | 5 | 5 | 8 | |||||||||||||||
| Rate of change in revenues | NR | 8.6 | % | (4.4 | )% | 2.3 | % | 9.2 | % | |||||||||||
| Gross profit margin | 12.7 | % | 9.9 | % | 10.8 | % | 12.5 | % | 13.0 | % | ||||||||||
| Operating profit margin | (0.6 | )% | 0.9 | % | 0.6 | % | 1.7 | % | 2.3 | % | ||||||||||
| Net income margin | (1.9 | )% | (0.9 | )% | (2.2 | )% | 0.8 | % | 0.0 | % | ||||||||||
| EBITDA margin | 2.4 | % | 3.3 | % | 4.1 | % | 4.2 | % | 6.1 | % | ||||||||||
e. | Other assets and liabilities |
| (1) | Real estate not used in current operations |
HADERA PAPER owns two real estate properties not used in its current operations:
| Location | Company having ownership rights | Land area | Buildings on property | Current use | Value | Net value* | |||||||||||
| m2 | NIS in millions | NIS in millions | |||||||||||||||
| TEL AVIV, 6-8 TOZERET HA-ARETZ Street | HADERA PAPER | 7,590 | None | Vacant | 58 | 50 | |||||||||||
| HADERA, adjacent to Company compound | HADERA PAPER | 119,000 | None | Vacant | 24 | 24 | |||||||||||
| Total value | 81 | 74 | |||||||||||||||
* Value net of tax
38
| - | Land in TEL AVIV |
A plot of land with an area of 7,590 m2 at TOZERET HA-ARETZ Street, leased from City of TEL AVIV. On June 1, 2010, the Company entered into agreement with GAV-YAM Land Ltd.9 to sell its rights to this land, for total consideration amounting to NIS 64 million and received a 10% down payment. As of December 31, 2010, the contingent conditions for closing of this transaction have yet to be fulfilled. The value of the property in this valuation is derived from the consideration in this transaction.
| - | Land in HADERA |
In 2005, the Company acquired a plot of land with an area of 119 thousand m2 adjacent to the HADERA PAPER facility, with the intention to construct on it a co-generation power plant; see section 3e(3) below. The value of this land was set at its acquisition cost.
| (2) | Holdings in BONDEX Technologies Ltd. |
In 2010, the Company acquired 18.37% (or 16.84% fully diluted) of shares of BONDEX Technologies Ltd. (hereinafter: "BONDEX") for consideration of $450 thousand. BONDEX is engaged in research and development of BONDER, a biological material designed to enhance qualities of packaging paper. As of December 31, 2010, the Company holds 18.37% of BONDEX shares. In February 2011, a foreign investor acquired 11.11% of BONDEX shares for $500 thousand. This investor was also granted an option to acquire additional shares. Subsequent to this investment, the Company's stake in BONDEX decreased to 16.33%, or 13.70% fully diluted - including the aforementioned option granted to the foreign investor.
9 A company indirectly controlled by IDB Development Ltd., the controlling shareholder of the Company, and by AMOT Investment Ltd., with holdings of 71% and 29%, respectively.
39
| (3) | Leasing of facility roof for construction of solar power plant |
In February 2011, subsequent to this valuation, the Company entered into agreement with an affiliate, CLAL PV Projects Ltd. ("CLAL PV") - a private company indirectly owned and controlled by CII - to lease the roofs of buildings at the Company campus in HADERA, with a total area of up to 19,100 m2 (the Company was granted an option not to lease part of this area, of up to 14,300 m2) for construction of power generation facilities using photo-voltaic technology and its transmission to the power grid during the lease term pursuant to a generation license to be granted to CLAL PV.
The rent would amount to NIS 90-802 thousand per year, based on the actual area leased, and shall be determined on the tariff for generation of 1 kilowatt/hour of electricity to be approved for CLAL PV in the generation license to be awarded. The agreement also stipulates that the Company would be paid additional rent of up to NIS 70 thousand per year, for generation of excess power (if any), pursuant to provisions of this agreement. The lease term shall be from 20 years to 24 years and 11 months.
| (4) | Construction of co-generation power plant |
The Company plans to construct a co-generation power plant using natural gas at its HADERA site. Advantages of this location are the connection point to the natural gas pipeline, and its proximity to the IEC power plant and relay in HADERA. The Company acquired land adjacent to its campus for future construction of this power plant, see section 3e(1) below, and in 2007 signed a memorandum of understanding with Egyptian gas provider, EMG; a binding delivery agreement has yet to be signed. Currently it is challenging to estimate if and whether this power plant would be constructed, its generation capacity and profitability, and its impact on the Company cost structure.
40
The TAMAR and LEVIATHAN gas fields discovered, according to reports, offshore from Israel in 2009-2010 may serve as an alternative source for Egyptian gas, thereby facilitating construction of private power plants in Israel, including the Company's.
| f. | Financial analysis |
Below is a summary of consolidated financial statements of HADERA PAPER. For the purpose of financial analysis, these statements present investments in HADERA PAPER Print Paper, CARMEL and FRENKEL, which have been separately valued, using the equity accounting method:
| December 31, 2009 | December 31, 2010 | December 31, 2009 | December 31, 2010 | ||||||||||||||
| NIS in millions | NIS in millions | ||||||||||||||||
| Cash and designated deposits | 138 | 106 | Short-term credit from banks | 86 | 5 | ||||||||||||
| Trade receivables | 94 | 158 | Current maturities of debentures and long-term credit | 144 | 142 | ||||||||||||
| Other accounts receivable | 92 | 143 | Trade payables | 107 | 142 | ||||||||||||
| Inventory | 108 | 103 | Others | 113 | 162 | ||||||||||||
| Total current assets | 432 | 510 | Total current liabilities | 450 | 451 | ||||||||||||
| Investment in affiliated companies | 451 | 566 | Deferred taxes on income | 24 | 7 | ||||||||||||
| Deferred taxes on income | 2 | 2 | Long-term credit net of current maturities | 172 | 193 | ||||||||||||
| Lease and investment property | 38 | 25 | Debentures | 472 | 562 | ||||||||||||
| Intangible and other assets | 24 | 2 | Liabilities on account of MBP option | 12 | 32 | ||||||||||||
| Liabilities with respect to employees, net | 8 | 12 | |||||||||||||||
| Total long-term investments | 515 | 595 | Total long-term liabilities | 688 | 806 | ||||||||||||
| Fixed assets, net | 1,023 | 1,082 | Shareholders' equity | 832 | 930 | ||||||||||||
| Total assets | 1,970 | 2,187 | Total shareholders’ equity and liabilities | 1,970 | 2,187 | ||||||||||||
* Pro-forma information - consolidated financial statements in which investments in HADERA Print Paper, CARMEL and FRENKEL are stated on equity basis.
41
| 2006 | 2007 | 2008 | 2009 | 2010 | ||||||||||||||||
| NIS in millions | ||||||||||||||||||||
| Revenues | 530 | 584 | 537 | 475 | 689 | |||||||||||||||
| Cost of Revenues | 419 | 441 | 419 | 418 | 575 | |||||||||||||||
| Gross income | 111 | 142 | 118 | 57 | 114 | |||||||||||||||
| Selling and marketing expenses | 31 | 31 | 36 | 43 | 55 | |||||||||||||||
| General and administrative expenses | 30 | 36 | 46 | 34 | 35 | |||||||||||||||
| Other revenues (expenses) | 37 | (5 | ) | 4 | 20 | 31 | ||||||||||||||
| Operating income | 88 | 70 | 39 | 0 | 55 | |||||||||||||||
| Financing expenses | 31 | 21 | 12 | 11 | 42 | |||||||||||||||
| Income Before Taxes | 57 | 49 | 27 | (11 | ) | 13 | ||||||||||||||
| Tax expense (benefit) | 17 | 18 | 6 | (5 | ) | (4 | ) | |||||||||||||
| After-tax income of Company and subsidiaries | 40 | 31 | 22 | (6 | ) | 17 | ||||||||||||||
| Share of net income (loss) of associates | (27 | ) | 1 | 48 | 97 | 84 | ||||||||||||||
| Net income (loss) | 13 | 32 | 70 | 91 | 101 | |||||||||||||||
| Change in revenues | 9.9 | % | 10.1 | % | (8.0 | )% | (11.6 | )% | 45.1 | % | ||||||||||
| Gross margin | 21.0 | % | 24.4 | % | 21.9 | % | 12.0 | % | 16.8 | % | ||||||||||
| Operating margin | 16.6 | % | 12.0 | % | 7.3 | % | 0.0 | % | 8.0 | % | ||||||||||
| Net margin | 2.4 | % | 5.4 | % | 13.0 | % | 19.2 | % | 14.7 | % | ||||||||||
| EBITDA | 22.6 | % | 18.2 | % | 16.9 | % | 11.3 | % | 17.5 | % | ||||||||||
| Effective tax rate | 29.5 | % | 37.4 | % | 20.9 | % | 45.5 | % | (30.8 | )% | ||||||||||
* Pro-forma information - consolidated financial statements in which results of HADERA Print Paper, CARMEL and FRENKEL are stated on equity basis.
42
| (1) | Revenues and profitability |
Revenues of HADERA PAPER on its pro-forma financial statements are derived from industrial operations of the packaging paper and recycling segment, and from trading operations in the office equipment marketing segment, as follows:
| 2006 | 2007 | 2008 | 2009 | 2010 | ||||||||||||||||
| NIS in millions | ||||||||||||||||||||
| Revenues from industrial operations | 404 | 463 | 406 | 317 | 502 | |||||||||||||||
| Revenues from trading operations | 126 | 121 | 131 | 158 | 187 | |||||||||||||||
| Total revenues | 530 | 584 | 537 | 475 | 689 | |||||||||||||||
| Export revenues | 48 | 49 | 56 | 70 | 175 | |||||||||||||||
| Change in revenues from industrial operations | 10.8 | % | 14.5 | % | (12.3 | )% | (21.9 | )% | 58.4 | % | ||||||||||
| Change in revenues from trading operations | 6.9 | % | (4.0 | )% | 8.3 | % | 20.4 | % | 18.4 | % | ||||||||||
| Share of revenues from industrial operations | 76.2 | % | 79.3 | % | 75.6 | % | 66.7 | % | 72.9 | % | ||||||||||
| Change in export revenues | 10.4 | % | 1.7 | % | 14.6 | % | 25.4 | % | 150.0 | % |
The decrease in revenues from industrial operations in 2009 was due to the crisis in packaging paper operations at that time, due to implications of the global economic crisis on these operations in Israel. Excess packaging paper produced in Europe in the second half of 2008 and in the first half of 2009 enabled importation of packaging paper to Israel at dumping pricing10 on the one hand, and reduced demand for exportation of packaging paper from Israel on the other hand. In 2010, two events caused a sharp increase in revenues from industrial operations: excess demand for packaging paper world-wide due to the economic recovery, which resulted in 150% growth in exports, along with higher product prices on the local market, as well as operation of Machine 8, starting on June 1, 2010, which doubled the production capacity of packaging paper.
Revenues from trading operations reflect the evolution in recent years of the office equipment marketing segment. Growth in this segment is primarily organic, but some of the revenue growth in 2008-2009 is due to acquired trading operations.
10 For complaint filed by the Company with the Ministry of Industry, Trade and Labor on this matter in January 2009, see section 3a(1) below.
43
Gross margin for the packaging paper segment, which in 2007-2008 reached 20%-22%, was sharply eroded in 2009 due to implications of the economic crisis on packaging paper operations in Israel, as described above. In 2010, gross margin rose sharply, and income grew due to higher product prices and the launch of Machine 8 - as described above. It would appear that the closer the Company is to its objective - doubling the production capacity of packaging paper - the more it would realize economies of scale inherent there in. Composition of gross margin in 2006-2010:
| 2006 | 2007 | 2008 | 2009 | 2010 | ||||||||||||||||
| NIS in Millions | ||||||||||||||||||||
| Revenues | 530 | 584 | 537 | 475 | 689 | |||||||||||||||
| Materials | 86 | 93 | 85 | 54 | 96 | |||||||||||||||
| Cost of labor | 105 | 116 | 122 | 118 | 115 | |||||||||||||||
| Changes in inventory of work-in-progress and finished goods | (0 | ) | (2 | ) | (13 | ) | (19 | ) | 20 | |||||||||||
| Depreciation | 28 | 31 | 45 | 47 | 60 | |||||||||||||||
| Cost of goods sold in trading operations | 94 | 89 | 94 | 112 | 135 | |||||||||||||||
| Total cost of revenues | 419 | 441 | 419 | 418 | 575 | |||||||||||||||
| Gross income | 111 | 142 | 118 | 57 | 114 | |||||||||||||||
| Change in revenues | 10 | % | 10 | % | (8 | )% | (12 | )% | 45 | % | ||||||||||
| Gross margin | 21 | % | 24 | % | 22 | % | 12 | % | 17 | % | ||||||||||
The Company's rate of selling and marketing expenses is relatively low, due to how it markets its products to business and institutional customers, primarily distributed by sales staff. In 2010, the change in cost of sales and marketing staff, including management, was only 13% - compared to 81% growth in volume of packaging paper marketed and 45% overall growth in revenues on the consolidated financial statements above.
Rent and contribution of associates is primarily composed of rent and contribution towards HQ and IT expenses of HADERA PAPER; for details of contribution towards expenses, see section 2a(2) above.
44
| 2006 | 2007 | 2008 | 2009 | 2010 | ||||||||||||||||
| NIS in millions | ||||||||||||||||||||
| Cost of labor | 14 | 14 | 15 | 19 | 22 | |||||||||||||||
| Packaging, transportation and shipping | 9 | 10 | 10 | 17 | 24 | |||||||||||||||
| Commissions | 2 | 2 | 3 | 2 | 4 | |||||||||||||||
| Others | 5 | 5 | 7 | 1 | 1 | |||||||||||||||
| Depreciation | 1 | 1 | 1 | 4 | 4 | |||||||||||||||
| Total selling and marketing expenses | 31 | 31 | 36 | 43 | 55 | |||||||||||||||
| Cost of labor | 43 | 46 | 51 | 44 | 47 | |||||||||||||||
| Others | 10 | 14 | 17 | 11 | 12 | |||||||||||||||
| Depreciation | 3 | 3 | 5 | 7 | 5 | |||||||||||||||
| Less rent and contribution of associates | (27 | ) | (26 | ) | (27 | ) | (28 | ) | (29 | ) | ||||||||||
| Total general and administrative expenses | 30 | 36 | 46 | 34 | 35 | |||||||||||||||
| Change in cost of labor | 7.7 | % | 2.8 | % | 11.7 | % | (4.4 | )% | 9.5 | % | ||||||||||
| Variable selling and marketing expenses as percentage of revenues* | 3.0 | % | 2.8 | % | 3.7 | % | 4.2 | % | 4.2 | % | ||||||||||
| Change in general, administrative and other expenses | 32.9 | % | 44.3 | % | 20.7 | % | (34.9 | )% | 9.1 | % | ||||||||||
| Change in rent and contribution of associates | 9.4 | % | (1.5 | )% | 0.8 | % | 5.7 | % | 3.6 | % | ||||||||||
* Packaging, transportation, shipping, commissions and other expenses
The Company’s other revenues amounted to approximately NIS 31 million and possess a non-recurring nature, as follows:
| NIS millions | ||||
| Capital gains on account of fixed assets and spare parts inventories | 19 | |||
| Refund of Hadadit fund to employers, net | 6 | |||
| Earnings from valuation of investment in investee company | 6 | |||
| Total other revenues | 31 | |||
The Company's financing expenses increased in 2010, due to sharp increase in debt, primarily due to the discontinuation of discounting of financial expenses associated with the construction cost of Machine 8, as of May 2010, coupled with the changes in inflation rate and in the Prime lending rate in Israel's economy during that year.
45
Fluctuations in the effective tax rate in 2009-2010 are due to adjustment of deferred tax balances with respect to accelerated depreciation of Machine 8 for tax purposes, in view of the downward trend in corporate tax rate through 2016.
| (2) | Net financial debt |
HADERA PAPER finances its operations using equity and foreign capital. At the most recent issuance of debentures (Series 5) in May 2010, the Company raised NIS 180 million, net. At the most recent issuance of debentures (Series 5) in May 2010, the Company raised NIS 180 million, net. The debentures mature in five equal annual installments on November 30 of each year between 2013-2017. Interest is payable in equal semi-annual installments on May 31 and November 30 of each year between 2010-2017.
HADERA PAPER's financial debt as of December 31, 2010 is estimated at NIS 922 million, as follows:
| December 31, 2010 | ||||
| NIS in millions | ||||
| Long-term debenture balance* | 595 | |||
| Long-term borrowing net of current maturities | 193 | |||
| Short-term borrowing and current maturities of debentures | 147 | |||
| Accounts payable with respect to acquisition of MONDI shares | 49 | |||
| Accounts receivable with respect to investment in fixed assets | 29 | |||
| Other financial obligations, net | 17 | |||
| Less: | ||||
| Cash and deposits | 106 | |||
| Value of holding stake in BONDEX ** | 2 | |||
| Net financial debt | 922 | |||
* Includes mark-to-market of negotiable debentures (Series 3-5).
** See section 3e(2) above.
46
| (3) | Working capital requirements |
The Company's operating working capital at the end of 2008, and primarily in 2009, was relatively high - due to accumulation of inventory of paper and cardboard waste at AMNIR pending operation of Machine 8. In 2010, the rate of working capital dropped below its typical level at the Company prior to construction of Machine 8. This decrease was due to consumption of most of the waste inventory and to increase in packaging paper exports, for which customer credit is relatively low. Composition of the Company's working capital is as follows:
| December 31, 2009 | December 31, 2010 | |||||||
| NIS in millions | ||||||||
| Trade receivables | 94 | 158 | ||||||
| Inventory | 108 | 103 | ||||||
| Trade payables* | 36 | 113 | ||||||
| Operating working capital, Net | 166 | 148 | ||||||
| Percentage of revenues** | 35 | % | 21 | % | ||||
* Net of payables on account of fixed assets.
** Approx. 20% in 2010 due to running-in results of Machine 8.
| (4) | Investment and depreciation |
Company investment (excluding Machine 8), between the years 2006-2010, in the sum of NIS 219 million, are similar to the accrued depreciation expenses for that period, amounting to NIS 239 million, as follows:
| 2006 | 2007 | 2008 | 2009 | 2010 | ||||||||||||||||
| NIS in millions | ||||||||||||||||||||
| Investment, excluding Machine 8 | 53 | 73 | 31 | 26 | 36 | |||||||||||||||
| Depreciation | 32 | 36 | 51 | 54 | 66 | |||||||||||||||
| Investment to depreciation ratio | 166 | % | 203 | % | 60 | % | 48 | % | 54 | % | ||||||||||
Through 2007, Company investments exceeded depreciation expense, where some of this investment was of non-recurring nature, such as conversion of the energy center to using natural gas. In coming years, the Company anticipates significant excess depreciation over investment, due to completion of Machine 8 construction and to potential increase of the Company's production capacity of packaging paper using the older Machine 1.
47
| (5) | Stock options to employees |
In the first half of 2008, the Company granted to employees 263 thousand stock options, net, which vest in four equal lots as follows:
Lot 1 - from January 14, 2009 through January 13, 2012.
Lot 2 - from January 14, 2010 through January 13, 2012.
Lot 3 - from January 14, 2011 through January 13, 2013.
Lot 4 - from January 14, 2012 through January 13, 2014.
The exercise price is NIS 224; upon the exercise date, employees will receive the number of shares equal to the value of the benefit inherent in exercise of their stock options, and would only pay to the Company the par value of shares allotted.
As of December 31, 2010, there were 158 thousand stock options outstanding, as follows:
| Lot 1: | 12,275 stock options. |
| Lot 2: | 15,013 stock options. |
| Lot 3: | 65,375 stock options. |
| Lot 4: | 65,375 stock options. |
48
| g. | Valuation |
The value of HADERA PAPER for its shareholders as of December 31, 2010 is estimated at between NIS 1,657-1,869 million, as follows:
| Holding stake | High value | Low value | See section | |||||||||||||
| NIS in millions | ||||||||||||||||
| Enterprise valuation (EV) - HADERA PAPER, consolidated* | 1,460 | 1,332 | ** | |||||||||||||
| Value of excess real estate | 74 | 74 | Section 3e(1) | |||||||||||||
| Value of holding stake in CARMEL | 100.0 | % | 160 | 160 | ** | |||||||||||
| Value of holding stake in HADERA PAPER PRINTING | 75.0 | % | 157 | 157 | ** | |||||||||||
| Liability with respect to MBP | (32 | ) | (32 | ) | ** | |||||||||||
| Value of holding stake in FRENKEL | 28.9 | % | 19 | 19 | ** | |||||||||||
| Net financial debt | (922 | ) | (922 | ) | Section 3f(2) | |||||||||||
| Valuation of HADERA PAPER, consolidated, net | 917 | 789 | ||||||||||||||
| Value of holding stake in HOGLA | 49.9 | % | 977 | 887 | Section 4c | |||||||||||
| Value of equity, HADERA PAPER | 1,894 | 1,676 | ||||||||||||||
| Value of stock options to employees | (25 | ) | (19 | ) | ** | |||||||||||
| Value of HADERA PAPER to shareholders | 1,869 | 1,657 | ||||||||||||||
* Excluding HADERA PAPER PRINTING, CARMEL and FRENKEL.
** See below.
HADERA PAPER was valuated using the Discounted Cash Flow method (DCF); for valuation methodology see section 2b abov
49
This valuation of HADERA PAPER is higher by 21% on average than the Company's average market capitalization over the six months preceding the valuation date, and is higher by 89% on average than the Company's shareholder equity as of December 31, 2010, as follows:
| Difference between value in model and market cap | ||||||||||||||||
| Market cap | High value | Low value | Average | |||||||||||||
| NIS in millions | NIS in millions | |||||||||||||||
| Company value in valuation | 1,869 | 1,657 | 1,763 | |||||||||||||
| Market cap* of equity during six months prior to effective date | ||||||||||||||||
| Highest | 1,616 | 16 | % | 3 | % | 9 | % | |||||||||
| Lowest | 1,314 | 42 | % | 26 | % | 34 | % | |||||||||
| Average | 1,454 | 29 | % | 14 | % | 21 | % | |||||||||
| Market cap* as of December 31, 2010 | 1,505 | 24 | % | 10 | % | 17 | % | |||||||||
| Shareholders' equity on balance sheet as of December 31, 2010 | 930 | 101 | % | 78 | % | 90 | % | |||||||||
| Value in transaction as of September 30, 2009** | 1,147 | 63 | % | 44 | % | 54 | % | |||||||||
| Value in valuation as of June 30, 2009** | 1,144 | 63 | % | 45 | % | 54 | % | |||||||||
* Value derived from price of Company share on TEL AVIV Stock Exchange.
** Value in acquisition of 21.45% of Company shares by CII from Discount Investments was determined taking into account the valuation as of June 30, 2009 which was prepared by myself for negotiations between the parties.
For further information pursuant to Securities Regulations (Periodic and immediate reports), 1970, see Appendix D.
Between June 30, 2009 through to December 31, 2010, the Company's market value increased by 71%; for evolution of share price and trading volume, see Appendix A.
Volatility in Company valuation on the TEL AVIV Stock Exchange is due to the financial and economic crisis in global capital markets, including the Israeli one, see section 2c above. The scope of operations of Group companies is derived from the state of Israel's economy, its population, changes in standard of living and business activity, and it would appear that change in market cap of HADERA PAPER is due both to macro-economic changes and to Company-specific changes, primarily doubling of packaging paper production capacity.
50
| (1) | Enterprise valuation (EV) - HADERA PAPER |
The valuation of HADERA PAPER is composed of expected operating income for the packaging paper and recycling segment, and for the office equipment marketing segment. After consolidating operating income forecasts for each segment, we made some model assumptions at level of HADERA PAPER consolidated financial statements, excluding HADERA PAPER PRINTING, CARMEL and FRENKEL, whose valuation was determined as set forth in section 3g(2) below.
Assumptions of the model are as follows:
Packaging paper and recycling segment
| - | Packaging paper production capacity shall increase to 309 thousand tones in 2011, and to 320 thousand tons per year starting in 2012. This compares to 160 thousand tones in 2009, and to 270 thousand tons in 2010, when Machine 8 was in operation as from June 1, 2010; |
| - | The domestic market for packaging paper (in volume terms) shall grow at 3% annually during the forecast period, and at 1.5% for the long term; the Company's market share shall gradually increase from 38% in 2010 to 60% in 2014 and there after; excess production shall be exported. The share of export (in volume terms) shall gradually decline over the forecast period, from 45% in 2011 to 18% for the long term; |
| - | Packaging paper price in Israel in 2011 shall be 10% higher than the average price in 2010, similar to actual selling price in late 2010. The average price shall increase by 3% in 2012 and by 1% annually between 2013-2014, while from 2015 and after which time the selling price shall remain unchanged. These assumptions reflect a slow economic improvement compared to the sector condition in late 2010; |
| - | Exported packaging paper price in 2011 shall be 18% higher than the average price in 2010, similar to actual selling price in late 2010. The average price shall increase by 3% in 2012, and shall remain unchanged in 2013 and there after. These assumptions reflect a slow economic improvement compared to the sector condition in late 2010; |
51
| - | We assume that material cost per ton of packaging paper shall increase by 8% in 2011 compared to 2010, due to the need to import raw materials that year, and shall decrease by 5% in 2012 due to the reduction in waste imports and shall remain unchanged from 2013 and for the remainder of the forecast. |
| - | It was assumed that other variable production costs represent approximately 83% of total other production costs. It was thus assumed that other variable production costs per ton shall increase by 7% between the years 2011-2012, and shall remain unchanged for the remainder of the forecast. Other fixed production cost shall increase by 5% annually between 2011-2012 and then by 1.5% annually for the remainder of the forecast. The increase in other production costs reflect expectations for higher cost of natural gas, used in energy generation by Hadera Paper Infrastructures; |
| - | Production labor cost shall increase by 6% in 2011, by 3% annually in 2012-2013, and by 1.5% annually in 2014 and there after; |
| - | Gross income contribution of other operations, primarily the leasing of property, electricity generation, provision of IT services and the provision of other services to third parties shall amount to NIS 12 million in year 1 of the forecast, as compared with NIS 4 million in 2010. The contribution from other activities in 2010 was affected by the malfunction of an electrical turbine, that served to reduce the contribution from other activities by approx. NIS 6 million. Moreover, the charge fees for provided services were updated by Headquarters and Infrastructures toward the end of 2010. It was assumed that starting in 2011, the said contribution would grow by some 1.5% per annum. The company estimates that the rising gas prices will not materially affect the profitability of generating electricity. |
| - | Operations of the recycling segment shall be based on demand for paper and cardboard waste for production of packaging paper and other products (tissue paper and white paper). We assume that collection and purchasing of paper and cardboard waste can be increased so as to satisfy this demand starting in 2012. |
52
| - | Collection and purchase of paper and cardboard waste by AMNIR shall gradually increase from 338 thousand tones in year 1 of the forecast, to 452 thousand tones in the typical year, compared to collection and purchase of 210 thousand tons, 241 thousand tons and 267 thousand tons in 2008, 2009 and 2010, respectively; |
| - | The weighted selling price of paper and cardboard waste sold by AMNIR shall increase by 7% in 2011 compared to the average selling price in 2010, and shall be similar to the selling price per ton in late 2010 - due to higher prices of waste used in production of packaging paper. In 2012 and there after, the weighted selling price per ton of paper and cardboard waste shall remain unchanged; |
| - | AMNIR revenues from collection of plastic shall increase by 7% in 2011, and by 1.5% annually in 2012 and there after; |
| - | AMNIR revenues from service provision shall increase by 7% in 2011, and by 1.5% annually in 2012 and there after; |
| - | We assume that the ratio of material cost to revenues for AMNIR in the forecast period shall be 34% of revenues, as compared with 28% in 2010, due to the assumption of increased price of paper waste, due to possible shortage in the domestic market in coming years. |
| - | We assume that the ratio of other production costs to revenues for AMNIR in the forecast period shall be 32%, compared to 30% in 2010; |
| - | We assumed that labor cost in collection and processing at AMNIR shall increase by 16%, 10%, 5% and 5% in years 1-4 of the forecast, respectively, and shall increase by 1.5% annually in 2015 and there after. This is due to the assumption that additional staff would have to be recruited in order to increase capacity collection of paper and cardboard waste in coming years. |
| - | We assume that the ratio of selling and marketing expenses to revenues for the packaging paper and recycling segment, during the forecast period, shall be equal to 3.0% of sector revenues, similar to the level of expenses in 2010. |
| - | We assume that general and administrative expenses for the packaging paper and recycling segment, during the forecast period, shall increase by 1.5% annually. |
| - | We assume that contribution of the agreement with CLAL PV, as set forth in section 3a(f) above, shall amount to NIS 0.5 million starting in 2012. This contribution was deducted from the Company's general and administrative expenses. |
53
Below is a summary business plan for the packaging paper and recycling segment:
| 2010 | 2011 | 2012 | 2013 | 2014 | 2015 | 2016 | 2017 | Typical year | ||||||||||||||||||||||||||||
| Actual | Forecast | |||||||||||||||||||||||||||||||||||
| NIS in millions | ||||||||||||||||||||||||||||||||||||
| Revenues* | 511 | 746 | 798 | 819 | 845 | 862 | 870 | 879 | 887 | |||||||||||||||||||||||||||
| Cost of Revenues | 449 | 585 | 599 | 608 | 621 | 632 | 636 | 646 | 656 | |||||||||||||||||||||||||||
| Gross income | 62 | 108 | 144 | 155 | 167 | 173 | 176 | 179 | 181 | |||||||||||||||||||||||||||
| Selling and marketing, less depreciation | 15 | 22 | 23 | 24 | 25 | 25 | 26 | 26 | 26 | |||||||||||||||||||||||||||
| General & administrative, less depreciation | 20 | 20 | 20 | 20 | 21 | 21 | 21 | 22 | 22 | |||||||||||||||||||||||||||
| Depreciation, general & administrative | 8 | 8 | 8 | 8 | 8 | 8 | 8 | 8 | 5 | |||||||||||||||||||||||||||
| Others | 31 | |||||||||||||||||||||||||||||||||||
| Operating income | 50 | 58 | 92 | 103 | 114 | 119 | 121 | 123 | 128 | |||||||||||||||||||||||||||
| Change in revenues | 50.7 | % | 37.4 | % | 6.9 | % | 2.7 | % | 3.1 | % | 2.1 | % | 0.9 | % | 1.0 | % | 0.9 | % | ||||||||||||||||||
| Gross margin | 12.1 | % | 14.5 | % | 18.0 | % | 19.0 | % | 19.8 | % | 20.1 | % | 20.2 | % | 20.3 | % | 20.4 | % | ||||||||||||||||||
| Operating margin | 9.8 | % | 7.8 | % | 11.6 | % | 12.6 | % | 13.5 | % | 13.8 | % | 13.9 | % | 14.0 | % | 14.4 | % | ||||||||||||||||||
| * 2010 revenues exclude revenues in the run-in period of Machine 8, which were capitalized under fixed assets. | ||||||||||||||||||||||||||||||||||||
Office equipment marketing segment
Operations of this segment are derived, in part, from volume of business activity in the economy (business customers) and in part, from public expenditure (government ministries, local authorities, educational institutions etc.); these are the model-specific assumptions for the recycling segment:
| - | Segment revenues shall increase by 1.5% annually over the forecast period; |
54
| - | Gross margin shall gradually increase in 2011 and in 2012, to 30% of revenues, compared to 29% of revenues in 2010 - similar to gross margin in 2009; |
| - | Selling and marketing expenses shall gradually decrease from 20% in 2011 to 19.7% in 2014 and there after, due to expected higher efficiency after relocating to the new logistics center at MODI'IN. The ratio of these expenses to revenues in 2010 was 20.1%; |
| - | General and administrative expenses for the segment shall increase by 1.5% annually over the forecast period. |
Below is a summary business plan for the office equipment marketing segment:
| 2010 | 2011 | 2012 | 2013 | 2014 | 2015 | 2016 | 2017 | Typical year | ||||||||||||||||||||||||||||
| Actual | Forecast | |||||||||||||||||||||||||||||||||||
| NIS in millions | ||||||||||||||||||||||||||||||||||||
| Revenues | 179 | 182 | 184 | 187 | 190 | 193 | 196 | 199 | 202 | |||||||||||||||||||||||||||
| Cost of goods sold in trading operations | 127 | 129 | 130 | 132 | 134 | 136 | 138 | 140 | 142 | |||||||||||||||||||||||||||
| Cost of Revenues | 127 | 129 | 130 | 132 | 134 | 136 | 138 | 140 | 142 | |||||||||||||||||||||||||||
| Gross income | 52 | 53 | 55 | 55 | 56 | 57 | 58 | 59 | 60 | |||||||||||||||||||||||||||
| Selling and marketing | 36 | 36 | 37 | 37 | 37 | 38 | 39 | 39 | 40 | |||||||||||||||||||||||||||
| General and administrative | 10 | 10 | 10 | 10 | 11 | 11 | 11 | 11 | 11 | |||||||||||||||||||||||||||
| Depreciation | 1 | 2 | 3 | 3 | 3 | 3 | 3 | 3 | 1 | |||||||||||||||||||||||||||
| Operating income | 5 | 5 | 5 | 5 | 5 | 5 | 6 | 6 | 8 | |||||||||||||||||||||||||||
| Change in revenues | 18.5 | % | 1.5 | % | 1.5 | % | 1.5 | % | 1.5 | % | 1.5 | % | 1.5 | % | 1.5 | % | 1.5 | % | ||||||||||||||||||
| Gross margin | 29.1 | % | 29.3 | % | 29.7 | % | 29.7 | % | 29.7 | % | 29.7 | % | 29.7 | % | 29.7 | % | 29.7 | % | ||||||||||||||||||
| Operating margin | 2.8 | % | 2.6 | % | 2.5 | % | 2.6 | % | 2.8 | % | 2.8 | % | 2.8 | % | 2.8 | % | 3.9 | % |
Taxation
Due to absence of approved investment plans and other tax incentives, other than accelerated amortization for tax purposes of the investment in Machine 8, as set forth in section 3a(1) above, based on past experience, we assumed that the effective tax rate for HADERA PAPER during the forecast period shall be the same as the statutory tax rate. For determination of the tax rate during the forecast period, see section 2b above.
55
The economic benefit associated with accelerated amortization for tax purposes of the investment in Machine 8 is due to these two factors: Deferment of tax payment to future years, even had the tax rate not decreased over time, and economic benefit from reduction of the corporate tax rate from 24% in 2010 to 18% in 2016, with a higher tax rate saved in early years compared to the tax rate in the future. For calculation of the estimated value of this benefit, we have prepared an estimated cash flow over the loss utilization period, and in the period in which the taxable income would be higher than income on the financial statements ("reversal period"), capitalized as of the valuation date. The discounted value of the tax benefit associated with accelerated amortization of equipment for tax purposes is estimated at NIS 20 million.
Investment and depreciation
We assumed that upon completion of Machine 8, HADERA PAPER would invest NIS 36 million in 2011, and later on during the forecast, annual investment would gradually increase to NIS 45 million in 2017 and to NIS 69 million in the typical year.
Depreciation and amortization is expected to amount to NIS 84 million in 2011, gradually decreasing to NIS 69 million in the typical year.
In order to reflect Company estimates, whereby in the first twenty years of Machine 8, the investment there in shall be lower than depreciation with respect there to, we assume that the gap between investment and depreciation is expected to continue beyond year 8 of the forecast (the typical year), in which we assume that investment would equal depreciation. Therefore, we calculated the excess depreciation over investment between 2018-2027 assuming that the gap between depreciation and investment in 2017 would decrease by NIS 2 million annually, down to zero in 2028. The excess depreciation over investment in this period, capitalized as of the valuation date, is estimated at NIS 50 million.
56
Working capital requirements
We assume that in 2011, HADERA PAPER would require operating working capital at 20% of revenues, similar to the working capital percentage in 2010. Later on, the ratio of working capital to revenues would gradually increase to 22%, due to diversion of export sales to the domestic market - which requires higher customer credit. This will be partially offset by the optimization of working capital for the new output capacity.
Weighted average cost of capital (WACC) and long-term growth rate (g)
The real capital cost was set between 9.25-9.75% p.a., or an average of 9.5% p.a. The WACC reflected the following assumptions: capital cost - 12% p.a.; debt cost - 5% p.a.; tax rate - 18%; and financial leverage - 35%.
The capital cost of 12% p.a. was calculated using the CAPM model, as set forth in section 2b above. We assume long-term risk-free interest rate to be 2.7% p.a., long-term market risk premium to be between 7-9% p.a. and Company beta to be between 1.1-1.25. The beta range is derived from typical beta values world-wide for the paper, lumber and packaging industry11.
The risk-free cost of capital in the model, 2.7% p.a., is derived from the yield to maturity on Government of Israel CPI-linked debentures with duration of 10 years or more, as of December 31, 2010. The debt cost for HADERA PAPER in the model was determined to be the risk-free capital cost in the model, plus the Company's risk premium. The risk premium is determined as the difference, upon the valuation date, between the yield to maturity of corporate debentures with similar rating to that of the Company, and the yield to maturity of Government of Israel CPI-linked debentures with similar duration.
For details of determination of the risk-free capital cost and debt cost for the Company, see section 2b above.
11 See summary of beta values by Aswath Damodaran:
http://pages.stern.nyu.edu/~adamodar/New_Home_Page/datafile/Betas.html
57
We assume that free cash flow (FCF) for HADERA PAPER would grow in the long term at 1.25-1.75% annually, on average at 1.5% annually - similar to the population growth rate. This assumes that technology improvements, use of Machine 1 for packaging paper and growth of recycling volume in Israel would support this long-term growth in production capacity without investment in excess of depreciation.
Calculation of enterprise value (EV) for Hadera Paper on a consolidated basis12:
| 2011 | 2012 | 2013 | 2014 | 2015 | 2016 | 2017 | Typical year | |||||||||||||||||||||||||
| Forecast | ||||||||||||||||||||||||||||||||
| NIS in millions | ||||||||||||||||||||||||||||||||
| Operating income - packaging and recycling | 58 | 92 | 103 | 114 | 119 | 121 | 123 | 128 | ||||||||||||||||||||||||
Operating income - office equipment | 5 | 5 | 5 | 5 | 5 | 6 | 6 | 8 | ||||||||||||||||||||||||
| Total operating income | 62 | 97 | 108 | 119 | 124 | 127 | 129 | 135 | ||||||||||||||||||||||||
| Tax rate | 24 | % | 23 | % | 22 | % | 21 | % | 20 | % | 18 | % | 18 | % | 18 | % | ||||||||||||||||
| Tax | 15 | 22 | 24 | 25 | 25 | 23 | 23 | 24 | ||||||||||||||||||||||||
| After-tax operating income | 47 | 75 | 84 | 94 | 99 | 104 | 106 | 111 | ||||||||||||||||||||||||
| Depreciation | 84 | 78 | 78 | 78 | 78 | 78 | 78 | 69 | ||||||||||||||||||||||||
| Investment in fixed assets | (36 | ) | (36 | ) | (37 | ) | (39 | ) | (41 | ) | (43 | ) | (45 | ) | (69 | ) | ||||||||||||||||
| Changes to working capital | (37 | ) | (16 | ) | (10 | ) | (11 | ) | (4 | ) | (2 | ) | (3 | ) | (2 | ) | ||||||||||||||||
| Free cash flow (FCF) | 58 | 101 | 115 | 122 | 132 | 136 | 136 | 109 | ||||||||||||||||||||||||
| Discounted cash flow | 55 | 88 | 92 | 89 | 88 | 83 | 75 | |||||||||||||||||||||||||
| Value of excess depreciation over investment and tax incentives | 70 | |||||||||||||||||||||||||||||||
| Residual value | 753 | |||||||||||||||||||||||||||||||
| High value | Low value | |||||||
| NIS in millions | ||||||||
| Calculation assumptions | ||||||||
| Weighted Average Cost of capital (WACC) | 9.25 | % | 9.75 | % | ||||
| Long-term growth rate (g) | 1.75 | % | 1.25 | % | ||||
| Model results | ||||||||
| EV for HADERA PAPER, net | 1,460 | 1,332 | ||||||
12 Excluding Hadera Paper Printing, Carmel and Frenkel.
58
| Long-term real growth rate (g) | ||||||||||||||||||||||||||||||||
| 2.25 | % | 2.00 | % | 1.75 | % | 1.50 | % | 1.25 | % | 1.00 | % | 0.75 | % | |||||||||||||||||||
Weighted Average Cost of Capital (WACC) for discounting cash flow | 8.50 | % | 1,686 | 1,646 | 1,610 | 1,576 | 1,545 | 1,515 | 1,488 | |||||||||||||||||||||||
| 8.75 | % | 1,626 | 1,590 | 1,557 | 1,526 | 1,497 | 1,470 | 1,444 | ||||||||||||||||||||||||
| 9.00 | % | 1,570 | 1,538 | 1,507 | 1,478 | 1,452 | 1,427 | 1,403 | ||||||||||||||||||||||||
| 9.25 | % | 1,519 | 1,489 | 1,460 | 1,434 | 1,410 | 1,386 | 1,365 | ||||||||||||||||||||||||
| 9.50 | % | 1,471 | 1,443 | 1,417 | 1,393 | 1,370 | 1,348 | 1,328 | ||||||||||||||||||||||||
| 9.75 | % | 1,425 | 1,400 | 1,376 | 1,354 | 1,332 | 1,312 | 1,294 | ||||||||||||||||||||||||
| 10.00 | % | 1,383 | 1,360 | 1,337 | 1,317 | 1,297 | 1,278 | 1,261 | ||||||||||||||||||||||||
| 10.25 | % | 1,344 | 1,322 | 1,301 | 1,282 | 1,263 | 1,246 | 1,230 | ||||||||||||||||||||||||
| 10.50 | % | 1,306 | 1,286 | 1,267 | 1,249 | 1,232 | 1,216 | 1,200 | ||||||||||||||||||||||||
| (2) | Value of other assets and liabilities |
Value of excess real estate
Excess real estate value amounting to NIS 74 million was calculated as set forth in section 3e(1) above.
Value of holding stake in CARMEL
The value of the holding stake in CARMEL was determined based on valuation by GIZA-SINGER-EVEN Ltd. dated September 30, 2010 - enclosed as Appendix B. Note that this valuation excludes the value of CARMEL holding stake in FRANKEL - about 28.9%. The value of this holding stake is included in the value of HADERA PAPER's holding stake in FRENKEL, as set forth below.
Value of holding stake in HADERA PAPER PRINTING and liability to MBP
The value of the holding stake in HADERA PAPER PRINTING and liability to MBP with respect to put option granted to MBP is derived from consideration in the transaction by which the Company acquired 25.1% of HADERA PAPER PRINTING shares on December 31, 2010, based on the opinion by GIZA-SINGER-EVEN Ltd. with regard to purchase price allocation (PPA) for HADERA PAPER PRINTING, attached to the financial statements of the company as at December 31 ,2010. Due to the fact that the date of closing of the transaction is identical to the date of the financial statements of the company, no adjustments were made for the value of Hadera Paper in the balance sheet of the company at this time.
59
Value of holding stake in FRENKEL
The value of holding stake in FRENKEL was determined, as it is not material, to be equal to the carrying amount of the investment in FRENKEL on HADERA PAPER financial statements as of December 31, 2010, plus the carrying amount of investment in FRENKEL on CARMEL financial statements as of said date, which was excluded from valuation of CARMEL, as set forth above.
Value of other investments
The value of investment in BONDEX shares was determined – due to the immateriality – on the basis of the cost of investment, as stated in Section 3.e.(2), above. The investment in Bondex was included in the calculation of financial debt, net, as a financial asset.
We assume that expected economic contribution from leasing roofs to CLAL PV, as set forth in section 3a(f) above, shall amount to NIS 0.5 million starting in 2012. This contribution was offset against general and administrative expenses on the Company's business forecast, as set forth in section 3g(1) above.
Due to uncertainty and absence of schedule for construction of the power plant, as set forth in section 3e(4) above, no value was attributed to this project.
Net financial debt
HADERA PAPER's net financial debt as of December 31, 2010 amounted to NIS 922 million - see section 3f(2) above.
60
Stock options to employees
The value of stock options granted to employees in 2008, as set forth in section 3f(5) above, was calculated using the Black & Scholes model - based on share prices derived from Company valuation using the valuation model, standard deviation derived from changes in share price, and risk-free interest as published by the TEL AVIV Stock Exchange. The following parameters were used to calculate the value of stock options:
| Share price (NIS)* | 324-366 | |||
| Exercise price (NIS) | 223.97 | |||
| Risk-free capital cost** | 3%-4% | |||
| Standard deviation | 22.5% | |||
| Exercise date | At the end of each period | |||
| * | The share price derived from the range of Company valuation in this opinion. |
| ** | The risk-free capital cost is derived from the yield to maturity of Government of Israel NIS-denominated debentures for duration similar to the exercise dates of stock option tranches 1-4. |
61
| HOGLA |
HOGLA-KIMBERLY Ltd. (hereinafter: "HOGLA") was incorporated in 1963, and later became a major provider of personal hygiene and consumables in Israel. In 1996, Kimberly Clark Corporation (hereinafter: "KC") acquired 49.9% of HOGLA shares, and in 2000 acquired further shares, such that it currently owns 50.1% of HOGLA shares. In Israel, HOGLA is engaged independently and via wholly-owned subsidiaries in production, import, marketing and sale of disposable paper products, diapers, female hygiene products, cleaning products etc. (hereinafter: "Israel operations").
In 1999, HOGLA started to develop the market for KC personal hygiene products in Turkey. Due to its population size and consumer trends, Turkey is considered a geography with high potential growth for personal hygiene products. HOGLA wholly owns a Turkey-resident company, KIMBERLY-CLARK TUKETIM MALLARI SANAYIVE TICARET (hereinafter: "KCTR"), which is engaged in production, marketing and sale of diapers and female hygiene products in Turkey. KCTR is the sole representative of KC in Turkey.
Below is a summary of HOGLA business results, on consolidated basis:
Consolidated income statement
| 2006 | 2007 | 2008 | 2009 | 2010 | ||||||||||||||||
| NIS in millions | ||||||||||||||||||||
| Revenues | 1,255 | 1,376 | 1,609 | 1,727 | 1,698 | |||||||||||||||
| Cost of Revenues | 884 | 969 | 1,098 | 1,165 | 1,164 | |||||||||||||||
| Gross income | 371 | 407 | 511 | 562 | 534 | |||||||||||||||
| Selling and marketing expenses | 269 | 286 | 309 | 305 | 288 | |||||||||||||||
| General and administrative expenses | 58 | 60 | 67 | 63 | 62 | |||||||||||||||
| Other expenses (revenues) | (1 | ) | - | - | - | (4 | ) | |||||||||||||
| Operating income (loss) | 45 | 62 | 136 | 194 | 187 | |||||||||||||||
| Financing and other expenses | 26 | 28 | (1 | ) | (1 | ) | (3 | ) | ||||||||||||
| Pre-tax revenues (expenses) | 19 | 34 | 137 | 195 | 190 | |||||||||||||||
| Tax expense (benefit) | 36 | 65 | 47 | 44 | 46 | |||||||||||||||
| After-tax income of Company and subsidiaries | (17 | ) | (31 | ) | 90 | 151 | 145 | |||||||||||||
| Minority interest in subsidiaries | 6 | - | - | - | - | |||||||||||||||
| Net income (loss) | (11 | ) | (31 | ) | 90 | 151 | 145 | |||||||||||||
| EBITDA | 69 | 88 | 159 | 223 | 218 | |||||||||||||||
| Change in revenues | 9.5 | % | 9.6 | % | 16.9 | % | 7.3 | % | (1.7 | )% | ||||||||||
| Gross margin | 29.6 | % | 29.6 | % | 31.8 | % | 32.5 | % | 31.5 | % | ||||||||||
| Operating margin | 3.6 | % | 4.5 | % | 8.4 | % | 11.2 | % | 11.0 | % | ||||||||||
| Net margin | (0.8 | )% | (2.2 | )% | 5.6 | % | 8.7 | % | 8.5 | % | ||||||||||
| EBITDA | 5.5 | % | 6.4 | % | 9.9 | % | 12.9 | % | 12.9 | % | ||||||||||
62
Consolidated balance sheet
| December 31, 2009 | December 31, 2010 | December 31, 2009 | December 31, 2010 | ||||||||||||||
| NIS in millions | NIS in millions | ||||||||||||||||
| Cash and cash equivalents | 107 | 17 | Short-term borrowing from banks | 26 | 37 | ||||||||||||
| Trade receivables | 290 | 289 | Trade payables | 296 | 330 | ||||||||||||
| Other accounts receivable | 6 | 7 | Payables in respect of dividend | 40 | 5 | ||||||||||||
| Inventory | 181 | 242 | Others | 97 | 79 | ||||||||||||
| Total current assets | 584 | 555 | Total current liabilities | 459 | 451 | ||||||||||||
| Deferred taxes on income and others | 5 | 5 | Deferred taxes on income | 34 | 35 | ||||||||||||
| VAT receivable | 47 | 51 | Long-term borrowing net of current maturities | 34 | 7 | ||||||||||||
| Intangible and other assets | 19 | 17 | Liabilities with respect to employees, net | 8 | 8 | ||||||||||||
| Total long-term investments | 71 | 73 | Total long-term liabilities | 76 | 50 | ||||||||||||
| Fixed assets, net | 336 | 352 | Shareholders' equity | 456 | 479 | ||||||||||||
| Total assets | 991 | 980 | Total shareholders’ equity and liabilities | 991 | 980 | ||||||||||||
63
a. | Hogla Operations |
| (1) | Israel operations |
Below is a summary of business results for Israel operations:
| 2006 | 2007 | 2008 | 2009 | 2010 | ||||||||||||||||
| NIS in millions | ||||||||||||||||||||
| Revenues | 1,060 | 1,134 | 1,209 | 1,238 | 1,229 | |||||||||||||||
| Gross income | 355 | 380 | 435 | 475 | 460 | |||||||||||||||
| Operating income | 128 | 136 | 169 | 210 | 194 | |||||||||||||||
| Change in revenues | 7.2 | % | 7.0 | % | 6.6 | % | 2.4 | % | (0.7 | )% | ||||||||||
| Gross margin | 33.5 | % | 33.5 | % | 36.0 | % | 38.4 | % | 37.5 | % | ||||||||||
| Operating margin | 12.1 | % | 12.0 | % | 14.0 | % | 17.0 | % | 15.8 | % | ||||||||||
| (a) | Products and competition |
Israel operations include production, marketing and distribution of the following product groups: diapers for children and adults, toilet paper, paper for home use (tissue, paper towels, wet wipes etc.), female hygiene products as well as cleaning and kitchen products.
Through 2008, HOGLA revenues grew at an average 7% annually, in 2009 growth slowed down to 2% annually, and in 2010 revenues declines slightly. The sharp decrease in growth rate is due to stronger competition from imports, which benefit from advantageous exchange rates and from changes in product mix. Sales of the two leading product groups, diapers and hygienic paper, constitute over 50% of sales in the domestic market.
HOGLA markets a range of products to all population segments, specializing in high-quality products. Demand for most Company products is relatively stable, and is primarily based on the population size, birth rates etc. Products offered on the domestic market are both locally-produced and imported, as follows:
Diapers
Alternative products for this product group are difficult to pinpoint - they are highly convenient and demand is derived from basic user needs. Demand for this product group is stable, and derived primarily from change in birth rates and population ageing. In the field of baby diapers, customers are relatively loyal to the brand, and impact of the economic crisis on demand was minimal. The compound aggregate growth rate (CAGR) for domestic demand in 2004-2010 is estimated at 2.4% annually, in terms of volume.
64
In Israel, two major competitors operate in this area: HOGLA with HUGGIES, TITULIM and other brands, and Procter & Gamble (P&G) with its Pampers brand13. All HOGLA diaper products are produced in Israel (except for imports designed to complement the product mix or in response to shortage of local production capacity from time to time), while all P&G products are imported. Domestic production offers HOGLA some operating, design and marketing advantages. P&G, on the other hand, has benefited in recent years from a stronger local currency, which effectively lowers the cost of imports denominated in foreign currency.
In 2010, HOGLA market share eroded due to stronger competition from P&G; the following are market shares (in volume terms) of competitors at retail chains:
| 2009 | 2010 | |||||||
| HOGLA | 74 | % | 72 | % | ||||
| P&G | 18 | % | 22 | % | ||||
| SANO | 7 | % | 5 | % | ||||
| Others | 1 | % | 1 | % | ||||
| Total market | 100 | % | 100 | % | ||||
| Source: Nielsen Israel Ltd. | ||||||||
The increase in SANO's market share since 2006, primarily at the expense of P&G, is due to better penetration of SANO products into discount chains. SANO products are not international brands.
13 P&G is also HOGLA's main competitor in female hygienic products.
65
A material change in diaper supply may result from importation of new brands to Israel, but this is a limited threat, due to consumer sensitivities to quality and safety of baby products, in the aftermath of several cases in recent years. KC and P&G brands are perceived as leading, safe and high-quality brands, and therefore it would seem that chances for success of other producers / importers in the domestic market over time are limited.
Hygienic paper
Toilet- and other hygienic paper have become part and parcel of the basic product list at every household and workplace. It would appear that demand for hygienic paper is also relatively stable, and is derived primarily from the population size and standards of living.
Toilet paper is a high-volume product, whose importation is of doubtful feasibility. Naturally, toilet paper supplies in Israel are locally produced, except for super-premium quality paper, which is imported.
HOGLA offers, in this operating segment, a varied product mix at different price- and quality levels to answer the needs of all demographics in Israel. HOGLA products are marketed under brands such as LILY, MOLLETT, KLEENEX and others. For the mid- to long-term, HOGLA benefits from higher standards of living, which result in consumers trending towards higher-quality products, which are identified with HOGLA. In this segment, HOGLA's market share reached 65% (in volume terms) in 2008, and in the past two years, the following market shares were recorded by competitors at retail chains:
| 2009 | 2010 | |||||||
| HOGLA-Kimberly | 64 | % | 62 | % | ||||
| Private label* | 17 | % | 19 | % | ||||
| SANO | 14 | % | 16 | % | ||||
| SHANIV Paper Industries | 3 | % | 2 | % | ||||
| Others | 1 | % | 1 | % | ||||
| Total market | 100 | % | 100 | % | ||||
* Private label brands of retail chains. | ||||||||
| Source: Nielsen Israel Ltd. | ||||||||
66
Other products
Other products from HOGLA, which are also basic consumer products, are sold under the following brands: KOTEX, LILY (female hygiene), NICOLE (consumables for kitchen and home) and others. These products are in daily use in almost every household in Israel.
Definition of markets served by HOGLA
Due to the nature of HOGLA products, the size of the domestic market for its products is determined by two major variables:
| - | Population change |
This factor impacts the volume of consumption. Population growth rate in Israel decreased from 2-2.5% annually through 2000, to 1.8% annually on average between 2001-2010. The number of births over this period grew at a pace similar to the population growth rate.
| - | Consumer habits and higher living standards |
This factor impacts both the consumption volume of consumables, as well as the product mix and the price paid for these products. Examples of changes in consumption habits include use of diapers through an older age with babies, and the transition to using disposable towels instead of cloth towels. The increase in living standards may improve HOGLA sales and profitability.
(b) | Customers |
HOGLA markets its products in two separate channels: Marketing to individual customers (households) by sales to consumer retailers, as well as marketing and sale to institutional customers. HOGLA sales in the institutional segment account for 20% of its revenues.
Marketing to individual consumers is via retail chain stores, drugstore (pharma) chains and private supermarkets. In recent years, the trend has been for stronger retail chains at the expense of private supermarkets, and proliferation of smaller retail chains at the expense of larger ones.
67
HOGLA sales to the two major retail chains in 2007-2009 reached a record 33% of HOGLA sales. In 2010, this trend was reversed and sales to these chains declined to 30% of HOGLA sales, as follows:
| 2006 | 2007 | 2008 | 2009 | 2010 | ||||||||||||||||
| NIS in millions | ||||||||||||||||||||
| SUPERSOL Ltd. | 185 | 212 | 213 | 242 | 224 | |||||||||||||||
| Customer B | 138 | 162 | 169 | 163 | 143 | |||||||||||||||
| Total two major customers | 323 | 374 | 383 | 405 | 367 | |||||||||||||||
| Percentage of HOGLA revenues in Israel | 30 | % | 33 | % | 32 | % | 33 | % | 30 | % | ||||||||||
To the institutional market HOGLA supplies diapers, female hygiene products, disposable towels, cleaning products etc. Customers in the institutional market are hospitals (general, maternity and nursing), government, HMOs, business real estate management companies, large and medium businesses etc. Sales to these customers are made by HOGLA's Sales Department, which is separate from sales to retail chains. Sales to small institutional customers are made by wholesalers. HOGLA is not dependent on any customer in the institutional segment.
(c) | Raw materials and suppliers |
HOGLA uses three types of raw materials: Raw materials purchased from overseas suppliers, goods purchased overseas for trading and raw materials and trading goods purchased from domestic suppliers.
Raw materials purchased overseas are intended for production of diapers and tissue paper (toilet paper), and are mostly purchased under global procurement agreements of KC.
Goods imported for trading are primarily purchased from KC group companies, including female hygiene products, certain types of diapers, certain types of toilet- and tissue paper etc.
68
Domestic procurement includes raw material purchase - paper and cardboard waste from AMNIR and goods for trading from various domestic suppliers.
In addition to using the KC procurement system, HOGLA also receives professional knowledge and support from KC world wide. For these services, HOGLA pays royalties for some of its products. In recent years, these royalties were on average 2.4% of HOGLA revenues in Israel.
HOGLA purchases power and steam for its plant at HADERA from HADERA PAPER Infrastructure14. Upon termination of the agreement for supply of natural gas under the current agreement with YAM TETHIS partners, in June 2011, energy costs are expected to rise. The impact of termination of this agreement on HOGLA would be limited, because the plants at AFULA and HADERA do not purchase power and steam from HADERA PAPER Infrastructure.
| (d) | Production and distribution |
The AFULA diaper-producing plant, with annual production capacity of 500 million children diapers and 42 million adult diapers, utilizes most of its production capacity. The plant was most recently upgraded in 2005, and since then the Company has been improving its production capacity by optimizing production so as to meet domestic demand. In late 2010, the Company approved a $4 million investment in upgrading production lines.
Toilet- and tissue paper is produced at two plants: in HADERA and in NAHARIA, with total annual production capacity of 58 thousand tons, which is fully utilized. HOGLA has two toilet paper processing systems (rolling) with annual production capacity of 44 thousand tons.
14 For production of power and steam, see section 3a(1) above.
69
HOGLA operates its distribution system out of its facilities in TZRIFIN and HAIFA. Due to the high volume and regular use of HOGLA products, customers maintain minimum inventory, which requires high-quality distribution service. The distribution department operates a fleet of 98 trucks, some under operating leases.
| (e) | SWOT Analysis |
Strengths
| - | Strong brands and reputation as producer of high-quality products. |
| - | HOGLA is controlled by KC - a world-leading international conglomerate in the operating segments on which HOGLA is focused. HOGLA has access to KC's R&D and procurement systems. |
| - | HOGLA products have relatively large and stable market shares in most of its operating segments. |
| - | The internal sales and distribution departments offer operating flexibility and enable high-quality customer service. |
| - | HOGLA products are basic products which enjoy a relatively stable demand. Importation of some HOGLA products is not feasible, due to their high volume - except for diapers. |
Weaknesses
| - | Production capacity is fully utilized in most production systems. |
| - | Restrictions on approaching overseas markets because of ownership by multi-national conglomerate. |
| - | Lack of leverage despite high debt capacity. Company leverage improves its value to equity holders. Bank loan obtained by HOGLA in 2008 for financing KCTR operations, has been mostly repaid. |
Opportunities
| - | Entry into new operating segments, synergetic with Israel operations, as was the case in cleaning and hygiene products for home use ("NICOLE"). |
70
| - | Relying on KC product development allows the Company to introduce new products developed world-wide by KC. |
| - | Improving living standards in Israel over time reflected in improved HOGLA product mix and margins. |
| - | Improvement in KCTR results. |
Threats
| - | Worsening of the global economic crisis may result in excess production capacity, which would be reflected, inter alia, in excess industrial production capacity and optional importation of goods from overseas at rock-bottom prices. |
| - | To date, KCTR investments and losses have been financed by HOGLA. Continued losses would require further capital infusion to KCTR. |
| - | HOGLA purchases most of its raw material and some of the products it trades in foreign currency, while its sales are made in NIS. Therefore, HOGLA is exposed to fluctuations in commodity prices and exchange rates. HOGLA enters into exchange rate hedging transactions for terms of several months. Rise in commodity prices or sharp devaluation of the NIS may impact Company profitability over the short term. Over the mid- to long term, the market is expected to adjust NIS-denominated prices to these changes, because competitors also import their raw materials or products (diapers, female hygiene). |
| - | Continued strength of the NIS improves attractiveness of product importation compared to production in Israel. |
| - | High dependence on few brands based on public trust (baby products, body health etc.) Discovery of a malfunction resulting in health risk in these products may severely impact brand strength. |
| - | Dependence on customers - sales to two retail chains account for one third of HOGLA sales. |
| - | Continued penetration of private labels by retail chains may impact HOGLA profitability. |
| - | The higher energy costs of the Hogla plant in Hadera as a result of the anticipated increase in the price of natural gas purchased by Hadera Paper Infrastructures may adversely affect the results of Hogla in Israel. |
71
| (2) | Turkey operations (KCTR) |
KCTR is engaged in production and marketing of diapers (HUGGIES brand) and in import and marketing of female hygiene products (KOTEX brand).
KC has identified the Turkish market as having strong growth potential, and KCTR has been defined as KC's regional operations center. This is due to the population size (over 77 million), relatively high growth and birth rates, proximity to Europe and anticipated change in local consumer preferences. Note that operations in Turkey entail specific risk, such as geo-political unrest, exposure to financial and economic crises, inflation risk and devaluation of the local currency.
KC has formulated a multi-year strategic plan for KCTR, which has been implemented since 2005. Currently, KCTR operates based on a strategic plan for 2009-2015, and is expected to reach operating profitability in 2012.
Despite the global economic crisis, which specifically impacts Turkey, KCTR revenues in NIS terms (convenience translation) continued to grow in 2009-2012, with improving margins. Below is a summary of KCTR business results:
| 2006 | 2007 | 2008 | 2009 | 2010 | ||||||||||||||||
| NIS in millions, convenience translation | ||||||||||||||||||||
| Revenues | 216 | 260 | 413 | 494 | 495 | |||||||||||||||
| Gross income | 16 | 28 | 75 | 86 | 73 | |||||||||||||||
| Operating loss | (83 | ) | (74 | ) | (33 | ) | (16 | ) | (10 | ) | ||||||||||
| Change in revenues | 14.7 | % | 20.6 | % | 58.6 | % | 19.6 | % | 0.3 | % | ||||||||||
| Gross margin | 7.2 | % | 10.7 | % | 18.3 | % | 17.5 | % | 14.8 | % | ||||||||||
| Operating loss rate | (38.5% | ) | (28.3% | ) | (8.1% | ) | (3.3% | ) | (2.1% | ) | ||||||||||
72
HOGLA views KCTR as a strategic investment and major future growth engine. HOGLA's CEO has served as CEO of KCTR until the beginning of 2009, and is currently serving as CEO of Hogla. KCTR operations are wholly financed by equity provided by HOGLA on regular basis over the past years. Beyond joint management, KCTR and HOGLA cooperate on ad-hoc basis with regard to production, marketing and other issues. There is no material commercial activity between these companies.
| (a) | Products and competition |
Products in the diaper segment are marketed on the domestic market and exported using the HUGGIES brand. KCTR's strategic plan is based on expansion of domestic market operations at the expense of exports, which is currently used to ensure full utilization of KCTR's production capacity.
Since KC defined the Turkish market as a strategic target, KCTR's market share in the diaper market (in monetary terms) has doubled:
| 2007 | 2008 | 2009 | 2010 | |||||||||||||
| PRIMA | 28.6 | % | 30.9 | % | 32.1 | % | 39.0 | % | ||||||||
| MOLFIX | 21.7 | % | 22.8 | % | 19.2 | % | 21.0 | % | ||||||||
| CANBEBE | 14.5 | % | 11.8 | % | 10.6 | % | 10.0 | % | ||||||||
| HUGGIES | 5.7 | % | 6.8 | % | 10.4 | % | 9.9 | % | ||||||||
| Others | 29.5 | % | 27.7 | % | 27.7 | % | 20.1 | % | ||||||||
| Total | 100.0 | % | 100.0 | % | 100.0 | % | 100.0 | % | ||||||||
Source: Nielsen Turkey. | ||||||||||||||||
Penetration of the female hygiene product market started in 2006, and KCTR's market share (in monetary terms) is currently estimated at 10.5%:
| 2007 | 2008 | 2009 | 2010 | |||||||||||||
| P&G | 60.9 | % | 58.7 | % | 55.4 | % | 56.0 | % | ||||||||
| MOLPED | 17.8 | % | 18.0 | % | 19.4 | % | 20.0 | % | ||||||||
| KOTEX | 3.3 | % | 6.4 | % | 9.5 | % | 10.5 | % | ||||||||
| Others | 18.0 | % | 16.9 | % | 15.7 | % | 13.5 | % | ||||||||
| Total | 100.0 | % | 100.0 | % | 100.0 | % | 100.0 | % | ||||||||
Source: Nielsen Turkey. | ||||||||||||||||
73
KCTR strives to increase the market share of HUGGIES and KOTEX products in the domestic market. Market penetration is typically accompanied by pricing pressures, and to date, prices have remained low compared to other European markets and to Israel. The diaper market in Turkey is highly decentralized with many players. In more developed economies, such markets have undergone consolidation by M&A or by small players exiting the market.
(b) | Customers |
KCTR products for the domestic market are marketed to retail chains and to the private market. KCTR directly markets and sells its products to retail chains.
Sales to the private market are made by Unilever Turkey. KCTR and Unilever signed the strategic cooperation agreement in March 2007. According to this agreement, Unilever will provide selling, distribution and collection services for KCTR products in Turkey, except for sales to nation-wide retail chains. The agreement with Unilever, which owns a nation-wide distribution network, allows KCTR access to private market points of sale. KCTR believes it is not dependent on Unilever Turkey, and should the agreement be terminated, it would not incur excessive expenses with respect to replacement of this distributor.
The Company exports its products to 20 countries, with the major export markets being Eastern European countries and South Africa. Product exports are in conjunction with KC's world-wide production and distribution facilities.
(c) | Production, raw materials and suppliers |
Most of the diaper products are produced at KCTR's plant in Turkey, which has been extended and improved in recent years, and is not considered to be one of the most efficient KC plants in Europe. Production capacity at this plant has increased by 500 million diapers annually in 2007, and by a further 100 million diapers in 2010 as a result of optimizing the production process, to reach annual production capacity of 1.2 billion diapers in late 2010, and is operating at full capacity.
74
KCTR is putting in place its production facility for female hygiene products in Turkey, which is designed to become the regional production center for such products. The investment in this production line is estimated at $8 million.
Similarly to HOGLA, KCTR makes use of the KC procurement system to purchase most of its raw materials. KCTR believes it is not dependent on raw material suppliers.
Most of the raw materials are purchased overseas, in USD or EUR, hence KCTR is exposed to exchange rate fluctuations of the local currency, in which it sets prices for its products on the domestic market. The Turkish Lira is relatively volatile compared to other currencies. Exportation of goods reduces, to a large degree, KCTR's exposure to local currency fluctuations.
| (f) | SWOT Analysis |
Strengths
| - | Turkey identified as strategic target country for KC, and KCTR defined as regional center for KC. |
| - | Access to KC systems, including technology, procurement etc. |
| - | KCTR established as third major player in the diaper and female hygiene market in Turkey within a few years. |
| - | Financing resources available for development of market and production in Turkey, without requiring foreign capital, which proved critical during the economic crisis, which made raising financing a challenge. |
| - | KCTR is identified as a future growth engine for HOGLA, since the market in Israel is fairly saturated. |
75
Weaknesses
| - | Exposure to Turkish economy, which is well known for political, financial and economic crises, inflation, currency devaluation etc. |
| - | Currency exposure, since most KCTR raw materials are purchased in foreign currency and its products are sold for Turkish Lira on the domestic market. Exportation of company products reduces this exposure to a large extent. |
| - | The Turkish market typically has lower prices than in European countries and in Israel, primarily for diapers, which impacts KCTR profitability. |
Opportunities
| - | Consolidation of Turkish market to be naturally accompanied by higher product prices, which would allow for reasonable profitability. |
| - | Renewed growth of Turkish economy and revaluation of local currency. |
| - | Continued growth in KCTR market share, mainly for diapers. |
| - | Establishment of local production of female hygiene products. |
Threats
| - | Worsening of the economic crisis in Turkey may extend KCTR losses and impact its strategic objectives. |
| - | Tougher price war in diaper market. |
| - | Discontinuation of contract with Unilever Turkey. |
| - | Discontinuation of product exports to KC centers around the world. |
| - | Payment as per demand from Turkish tax authorities dated February 2010, as set forth in section 4b(1) below, of material amounts, may destabilize KCTR's financial standing. |
76
| b. | Financial analysis |
Below is a summary of HOGLA consolidated financial statements:
Consolidated income statement
| 2006 | 2007 | 2008 | 2009 | 2010 | ||||||||||||||||
| NIS in millions | ||||||||||||||||||||
| Revenues | 1,255 | 1,376 | 1,609 | 1,727 | 1,698 | |||||||||||||||
| Cost of Revenues | 884 | 969 | 1,098 | 1,165 | 1,164 | |||||||||||||||
| Gross income | 371 | 407 | 511 | 562 | 534 | |||||||||||||||
| Selling and marketing expenses | 269 | 286 | 309 | 305 | 288 | |||||||||||||||
| General and administrative expenses | 58 | 60 | 67 | 63 | 62 | |||||||||||||||
| Other expenses (revenues) | (1 | ) | - | - | - | (4 | ) | |||||||||||||
| Operating income (loss) | 45 | 62 | 136 | 194 | 187 | |||||||||||||||
| Financing and other expenses | 26 | 28 | (1 | ) | (1 | ) | (3 | ) | ||||||||||||
| Pre-tax revenues (expenses) | 19 | 34 | 137 | 195 | 190 | |||||||||||||||
| Tax expense (benefit) | 36 | 65 | 47 | 44 | 46 | |||||||||||||||
| After-tax income of Company and subsidiaries | (17 | ) | (31 | ) | 90 | 151 | 145 | |||||||||||||
| Minority interest in subsidiaries | 6 | - | - | - | ||||||||||||||||
| Net income (loss) | (11 | ) | (31 | ) | 90 | 151 | 145 | |||||||||||||
| EBITDA | 69 | 88 | 159 | 223 | 218 | |||||||||||||||
| Change in revenues | 9.5 | % | 9.6 | % | 16.9 | % | 7.3 | % | (1.7 | )% | ||||||||||
| Gross margin | 29.6 | % | 29.6 | % | 31.8 | % | 32.5 | % | 31.5 | % | ||||||||||
| Operating margin | 3.6 | % | 4.5 | % | 8.4 | % | 11.2 | % | 11.0 | % | ||||||||||
| Net margin | (0.8 | )% | (2.2 | )% | 5.6 | % | 8.7 | % | 8.5 | % | ||||||||||
| EBITDA | 5.5 | % | 6.4 | % | 9.9 | % | 12.9 | % | 12.9 | % |
77
Consolidated balance sheet
| December 31, 2009 | December 31, 2010 | December 31, 2009 | December 31, 2010 | ||||||||||||||
| NIS in millions | NIS in millions | ||||||||||||||||
| Cash and cash equivalents | 107 | 17 | Short-term borrowing from banks | 26 | 37 | ||||||||||||
| Trade receivables | 290 | 289 | Trade payables | 296 | 330 | ||||||||||||
| Other accounts receivable | 6 | 7 | Payables in respect of dividend | 40 | 5 | ||||||||||||
| Inventory | 181 | 242 | Others | 97 | 79 | ||||||||||||
| Total current assets | 584 | 555 | Total current liabilities | 459 | 451 | ||||||||||||
| Deferred taxes on income and others | 5 | 5 | Deferred taxes on income | 34 | 35 | ||||||||||||
| VAT receivable | 47 | 51 | Long-term borrowing net of current maturities | 34 | 7 | ||||||||||||
| Intangible and other assets | 19 | 17 | Liabilities with respect to employees, net | 8 | 8 | ||||||||||||
| Total long-term investments | 71 | 73 | Total long-term liabilities | 76 | 50 | ||||||||||||
| Fixed assets, net | 336 | 352 | Shareholders' equity | 456 | 479 | ||||||||||||
| Total assets | 991 | 980 | Total shareholders’ equity and liabilities | 991 | 980 | ||||||||||||
78
| (1) | Revenues and profitability |
Israel operations
HOGLA revenues in Israel grew on average by 7% annually between 2005-2008, but this trend was reversed in 2009, with revenues growing at only 2%, and decreasing by 1% in 2010. Gross margin of Israel operations increased in recent years from 33% in 2006-2007, to 36-38% in 2009-2010. The growth in margins in the past two years is due to lower prices of raw materials due to the global economic crisis, but this trend was reversed in 2010. This compares with the relative stability of HOGLA product prices. The operating margin grew at a similar pace to that of gross margin. Below is a summary of business results of HOGLA in Israel:
| 2006 | 2007 | 2008 | 2009 | 2010 | ||||||||||||||||
| NIS in millions | ||||||||||||||||||||
| Revenues | 1,060 | 1,134 | 1,209 | 1,238 | 1,229 | |||||||||||||||
| Gross income | 355 | 380 | 435 | 475 | 460 | |||||||||||||||
| Operating income | 128 | 136 | 169 | 210 | 194 | |||||||||||||||
| Change in revenues | 7.2 | % | 7.0 | % | 6.6 | % | 2.4 | % | (0.7 | )% | ||||||||||
| Gross margin | 33.5 | % | 33.5 | % | 36.0 | % | 38.4 | % | 37.5 | % | ||||||||||
| Operating margin | 12.1 | % | 12.0 | % | 14.0 | % | 17.0 | % | 15.8 | % | ||||||||||
The ratio of materials (raw materials and goods purchased for commercial operations) to revenues at HOGLA decreased in recent years from an average 47% in 2006-2007 to 44% in 2008-2010, due to lower material cost as a result of the economic crisis. In 2010, raw material prices started to climb, but was mostly offset by the lower exchange rates.
Selling and marketing expenses in Israel are primarily composed of variable expenses for transportation, advertising and royalties paid to KC, which in 2010 accounted for 62% of all selling and marketing expenses. The ratio of variable selling and marketing expenses to revenues at HOGLA in recent years was on average 12%. For royalties paid to KC at 2.5% of HOGLA revenues on average, see section 4a(3) above.
79
Cost of labor, under selling and marketing expenses and under general and administrative expenses, increased on average at 2% annually between 2008-2010. Composition of HOGLA overheads in Israel is as follows:
| 2006 | 2007 | 2008 | 2009 | 2010 | ||||||||||||||||
| NIS in millions | ||||||||||||||||||||
| Cost of labor | 56 | 66 | 66 | 70 | 71 | |||||||||||||||
| Transportation, shipping and maintenance | 44 | 49 | 56 | 54 | 56 | |||||||||||||||
| Advertising and sales promotion | 52 | 44 | 49 | 48 | 48 | |||||||||||||||
| Commissions | 1 | 1 | 1 | 1 | 0 | |||||||||||||||
| Royalties | 26 | 29 | 30 | 31 | 30 | |||||||||||||||
| Others | 7 | 8 | 10 | 9 | 9 | |||||||||||||||
| Depreciation | 2 | 2 | 2 | 2 | 1 | |||||||||||||||
| Total selling and marketing expenses | 187 | 200 | 212 | 214 | 216 | |||||||||||||||
| Cost of labor | 20 | 23 | 27 | 29 | 25 | |||||||||||||||
| Administration and IT service | 11 | 12 | 13 | 13 | 14 | |||||||||||||||
| Office expenses | 5 | 5 | 4 | 3 | 4 | |||||||||||||||
| Provision for doubtful debt | 0 | (4 | ) | 0 | (4 | ) | (1 | ) | ||||||||||||
| Others | 5 | 7 | 10 | 10 | 9 | |||||||||||||||
| Total general and administrative expenses | 41 | 44 | 54 | 51 | 51 | |||||||||||||||
| Change in cost of labor | 13.1 | % | 18.0 | % | 3.2 | % | 7.1 | % | (2.5 | )% | ||||||||||
| Variable selling and marketing expenses as percentage of revenues* | 12.2 | % | 11.6 | % | 12.0 | % | 11.5 | % | 11.7 | % | ||||||||||
| Change in general and administrative expenses** | (0.5 | )% | 16.3 | % | 11.9 | % | (3.8 | )% | 0.7 | % | ||||||||||
* Excluding labor and doubtful debt. | ||||||||||||||||||||
HOGLA's average effective tax rate in recent years was similar to the statutory tax rate.
80
KCTR operations
KCTR revenues grew at double-digit pace in recent years - 59% and 20% in 2008 and 2009, respectively. In 2010, KCTR revenues (in NIS terms) remained unchanged. Its revenues (in local currency) grew by 5% in 2010. Gross margin increased from 7% in 2006 to 18% in 2008-2009, due to improved product mix, production optimization and lower raw material prices due to the economic crisis, and decreased by 15% in 2010, primarily due to higher cost of labor in production, due to pay increase and additional staffing, along with higher cost of raw materials. The percentage operating loss decreased from 39% in 2006 to 2% in 2010, due to economies of scale resulting from rapid growth of KCTR business:
| 2006 | 2007 | 2008 | 2009 | 2010 | ||||||||||||||||
| NIS in millions, convenience translation | ||||||||||||||||||||
| Revenues | 216 | 260 | 413 | 494 | 495 | |||||||||||||||
| Gross income | 16 | 28 | 75 | 86 | 73 | |||||||||||||||
| Operating loss | (83 | ) | (74 | ) | (33 | ) | (16 | ) | (10 | ) | ||||||||||
| Change in revenues | 14.7 | % | 20.6 | % | 58.6 | % | 19.6 | % | 0.3 | % | ||||||||||
| Gross margin | 7.2 | % | 10.7 | % | 18.3 | % | 17.5 | % | 14.8 | % | ||||||||||
| Operating loss rate | (38.5 | )% | (28.3 | )% | (8.1 | )% | (3.3 | )% | (2.1 | )% | ||||||||||
The ratio of cost of materials (raw materials and imported goods for trading) to revenues at KCTR decreased in recent years from 78% in 2006 to 70% in 2008, and then increased in 2009-2010 to 71-73% of revenues.
Selling and marketing expenses at KCTR are primarily composed of variable expenses for transportation and advertising, which account for 65% of total selling and marketing expenses in 2010. The ratio of variable selling and marketing expenses to revenues at KCTR decreased from 33% in 2006 to 12% in 2010 - due to lower advertising budget and higher revenues at KCTR.
81
Cost of labor, under selling and marketing expenses and under general and administrative expenses, increased at double-digit pace in 2006-2008. This trend was reversed in 2009, due to improved efficiency of selling and marketing:
| 2006 | 2007 | 2008 | 2009 | 2010 | ||||||||||||||||
| NIS in millions, convenience translation | ||||||||||||||||||||
| Cost of labor | 10 | 12 | 16 | 11 | 13 | |||||||||||||||
| Transportation, shipping and maintenance | 33 | 26 | 38 | 29 | 29 | |||||||||||||||
| Advertising and sales promotion | 29 | 34 | 36 | 35 | 19 | |||||||||||||||
| Others | 10 | 14 | 6 | 16 | 12 | |||||||||||||||
| Total selling and marketing expenses | 82 | 86 | 97 | 91 | 72 | |||||||||||||||
| Cost of labor | 9 | 9 | 8 | 7 | 6 | |||||||||||||||
| Administration and IT service | 1 | 1 | 1 | 1 | 1 | |||||||||||||||
| Others | 8 | 6 | 3 | 3 | 4 | |||||||||||||||
| Total general and administrative expenses | 17 | 16 | 12 | 12 | 11 | |||||||||||||||
| Change in cost of labor | 29.0 | % | 10.4 | % | 19.4 | % | (24.8 | )% | 0.1 | % | ||||||||||
| Variable selling and marketing expenses as percentage of revenues* | 33.2 | % | 28.3 | % | 19.5 | % | 16.1 | % | 12.1 | % | ||||||||||
| Change in general and administrative expenses | 57.8 | % | (17.5 | )% | (45.8 | )% | 13.0 | % | 30.4 | % | ||||||||||
* Excluding labor. | ||||||||||||||||||||
On February 16, 2010 KCTR received notification from the Tax Authority in Turkey, whereby it is required to pay stamp duty and tax with respect to capital injection by HOGLA to finance KCTR, plus interest and fines, amounting to $89 million.
For the first item (stamp duty), KCTR paid $106 thousand in July 2010. For the second item, taxation of capital transfer from HOGLA to KCTR, KCTR believes, based on the opinion of its tax consultants and the appeal it filed with the Court, that the likelihood of being required to pay additional taxes is low. No provision for this issue has been recorded on financial statements of either KCTR or HADERA PAPER.
82
| (2) | Net financial debt |
Analysis of the consolidated balance sheet indicates that HOGLA operations are primarily financed using shareholders' equity. In 2008, HOGLA borrowed for the first time to finance its investment in KCTR. As of the December 31, 2010, most of this debt has been repaid and net financing debt for HOGLA, on consolidated basis as of December 31, 2010, amounted to only NIS 19 million:
| December 31, 2010 | ||||
| NIS in millions | ||||
| Short-term credit from banks | 37 | |||
| Payables in respect of dividend | 5 | |||
| Long term borrowing | 7 | |||
| Long-term deferred income tax, net | 30 | |||
| Liabilities with respect to employees, net | 8 | |||
| Total financial liabilities | 87 | |||
| Less: | ||||
| Cash and cash equivalents | 17 | |||
| VAT receivable | 51 | |||
| Net financial debt | 19 | |||
In 2009 and 2010, the HOGLA Board of Directors approved dividend distributions amounting to NIS 133 million and NIS 100 million, respectively.
| (3) | Working capital requirements |
Operating working capital used for operations in Israel increased in the first half of 2009, primarily due to increase in trade receivables, with change in inventory and in trade payables offsetting each other out. Working capital as of December 31, 2010 amounted to 9% of revenues in Israel:
| December 31, 2009 | December 31, 2010 | |||||||
| NIS in millions | ||||||||
| Trade receivables | 227 | 220 | ||||||
| Inventory | 121 | 158 | ||||||
| Trade payables | 241 | 270 | ||||||
| Operating working capital, Net | 107 | 108 | ||||||
| Percentage of revenues | 9 | % | 9 | % | ||||
83
Operating working capital used for operations in Turkey decreased in late 2009 to 14% of revenues, due to aggressive inventory management. In 2010, this ratio increased to a typical level for operations, due to inventory renewal:
| December 31, 2009 | December 31, 2010 | |||||||
| NIS in millions | ||||||||
| Trade receivables | 63 | 69 | ||||||
| Inventory | 59 | 83 | ||||||
| Trade payables | 55 | 60 | ||||||
| Operating working capital, Net | 67 | 93 | ||||||
| Percentage of revenues | 14 | % | 19 | % | ||||
| (4) | Investment and depreciation |
In recent years, HOGLA has invested amounts in excess of depreciation, in order to resolve production bottlenecks and to increase production capacity in both Israel and Turkey. The following are investment and depreciation on HOGLA consolidated financial statements:
| 2006 | 2007 | 2008 | 2009 | 2010 | ||||||||||||||||
| NIS in millions | ||||||||||||||||||||
| Investment | 28 | 43 | 48 | 43 | 63 | |||||||||||||||
| Depreciation | 24 | 27 | 24 | 29 | 31 | |||||||||||||||
| Investment to depreciation ratio | 114 | % | 161 | % | 205 | % | 146 | % | 203 | % | ||||||||||
84
| c | Valuation |
The value of the HOGLA shareholders' equity, on a consolidated basis, is estimated between NIS 1,778-1,958 million and the value of Company holding stake in HOGLA (49.9%) is estimated between NIS 887-977 million.
HOGLA was valuated using the Discounted Cash Flow method (DCF); for valuation methodology see section 2b above.
| (1) | Model assumptions |
Revenues
Operations in Israel are derived from population size, changes in consumer habits and living standards. Subject to working assumptions with regard to the financial crisis (see section 2c above) and reversal of the growth trend in revenues in the past two years, we assume no real change in revenues in Israel in 2011-2014 and 1.5% annual revenue growth in 2015 and there after.
The business forecast assumes that KCTR revenues would grow at 1%, 21%, 11%, 7% and 4% annually in 2011, 2012, 2013, 2014 and 2015, respectively. Revenues would grow at 1.5% annually in 2016 and there after. This compares with revenue growth of 20% and 5% in foreign currency terms (20% and 0% in convenience translation to NIS) in 2009 and 2010, respectively.
Cost of Revenues
We assume that the ratio of cost of materials to revenues in Israel would increase over the forecast period to an average 45%, compared to an average 43% in 2009-2010, due to the assumption that higher raw material prices world-wide would also be reflected in the domestic market. The ratio of other production costs to revenues in Israel during the forecast period would be 10%, compared to 9.5% in 2009-2010, due to expected higher prices of natural gas purchased by HADER PAPER Infrastructure. Note that HOGLA production facilities at AFULA and NAHARIA do not purchase power and steam from HADERA PAPER Infrastructure. We assume that the ratio of cost of labor to revenues would grow at 7% in year 1 of the forecast, and at 1.5% annually in year 2 and there after.
85
As for operations in Turkey, we assume that the ration of cost of materials to revenues would be 74%, 73%, 72% and 70% in 2011, 2012, 2013 and 2014, respectively, and would then remain stable at 68% in 2015 and there after, compared to 71% and 72% in 2009 and 2010, respectively. We assume that the ratio of other production costs to revenues in Turkey would gradually decline over the forecast period, from 3.6% in 2011 to 3.0% over the long term, compared to 3.3% and 3.6% in 2009 and 2010, respectively. The ratio of labor costs to revenues would increase by 5% in 2011 and by 1.5% annually in 2012 and there after. These assumptions reflect continued expectations for higher raw material prices in the first years of the forecast period, along with production optimization and change in product mix due to construction of the production line for female hygiene products in 2011-2012, in accordance with the KCTR strategic plan.
Overhead
We assume that in Israel, the cost of labor under selling and marketing expenses and under general and administrative expenses, as well as non-payroll general and administrative expenses, would increase by 1.5% annually over the forecast period. We assume that non-payroll selling and marketing expenses would be at 12% of revenues in Israel - similar to 2008 and the first half of 2009.
We assume that in Turkey, the cost of labor under selling and marketing expenses and under general and administrative expenses would grow by 5% in 2011 and by 1.5% annually in 2012 and there after. Non-payroll general and administrative expenses in the model would increase by 1.5% annually over the forecast period. We assume that non-payroll selling and marketing expenses during the forecast period would be at 8% of KCTR revenues, compared to 10% in 2010, due to expected reduction in advertising budget.
86
Taxation
In absence of approved investment plans and other tax benefits, and based on past experience, we assume that the effective tax rate for HOGLA in Israel over the forecast period would be the same as the statutory tax rate.
For determination of the tax rate during the forecast period, see section 2c above.
In absence of past experience at KCTR, we assume that the applicable tax rate during the forecast period would be the statutory tax rate in Turkey - 20%. KCTR has carry-forward tax losses for which no deferred taxes were recorded on the financial statements, due to restrictions on utilization of carry-forward tax losses in Turkey, primarily the 5-year restriction on offsetting such losses.
In view of the time restriction on utilization of KCTR carry-forward tax losses, and due to the Tax Authority's demand from February 2010, as set forth in section 4b(1) above, we did not attribute any value to income tax benefit / liability in Turkey.
87
After-tax operating income
Below is the summary business forecast in Israel, based on the assumptions above:
| 2010 | 2011 | 2012 | 2013 | 2014 | 2015 | 2016 | 2017 | Typical year | ||||||||||||||||||||||||||||
| Actual | Forecast | |||||||||||||||||||||||||||||||||||
| NIS in millions | ||||||||||||||||||||||||||||||||||||
| Revenues | 1,229 | 1,229 | 1,229 | 1,229 | 1,229 | 1,248 | 1,266 | 1,285 | 1,304 | |||||||||||||||||||||||||||
| Cost of Revenues | 769 | 781 | 787 | 788 | 790 | 801 | 813 | 825 | 837 | |||||||||||||||||||||||||||
| Gross income | 460 | 448 | 442 | 441 | 439 | 446 | 453 | 460 | 468 | |||||||||||||||||||||||||||
| Selling and marketing expenses | 216 | 219 | 220 | 221 | 222 | 226 | 229 | 232 | 236 | |||||||||||||||||||||||||||
| General and administrative expenses | 51 | 53 | 55 | 57 | 59 | 61 | 62 | 64 | 66 | |||||||||||||||||||||||||||
| Operating income | 194 | 176 | 167 | 163 | 159 | 160 | 162 | 164 | 166 | |||||||||||||||||||||||||||
| Effective tax rate | 24.0 | % | 23.0 | % | 22.0 | % | 21.0 | % | 20.0 | % | 18.0 | % | 18.0 | % | 18.0 | % | ||||||||||||||||||||
| Tax | (42 | ) | (38 | ) | (36 | ) | (33 | ) | (32 | ) | (29 | ) | (29 | ) | (30 | ) | ||||||||||||||||||||
| After-tax operating income | 134 | 129 | 127 | 125 | 128 | 133 | 134 | 136 | ||||||||||||||||||||||||||||
| Change in revenues | (0.7 | )% | 0.0 | % | 0.0 | % | 0.0 | % | 0.0 | % | 1.5 | % | 1.5 | % | 1.5 | % | 1.5 | % | ||||||||||||||||||
| Gross margin | 37.5 | % | 36.5 | % | 36.0 | % | 35.9 | % | 35.8 | % | 35.8 | % | 35.8 | % | 35.8 | % | 35.9 | % | ||||||||||||||||||
| Operating margin | 15.8 | % | 14.3 | % | 13.6 | % | 13.2 | % | 12.9 | % | 12.8 | % | 12.8 | % | 12.7 | % | 12.7 | % | ||||||||||||||||||
88
Below is the summary business forecast for KCTR, based on the assumptions above:
| 2010 | 2011 | 2012 | 2013 | 2014 | 2015 | 2016 | 2017 | Typical year | ||||||||||||||||||||||||||||
| Actual | Forecast | |||||||||||||||||||||||||||||||||||
| NIS in millions | ||||||||||||||||||||||||||||||||||||
| Revenues | 495 | 502 | 609 | 675 | 720 | 746 | 757 | 769 | 780 | |||||||||||||||||||||||||||
| Cost of Revenues | 422 | 437 | 518 | 561 | 581 | 588 | 596 | 604 | 613 | |||||||||||||||||||||||||||
| Gross income | 73 | 65 | 91 | 114 | 139 | 158 | 161 | 165 | 167 | |||||||||||||||||||||||||||
| Selling and marketing expenses | 72 | 64 | 73 | 79 | 82 | 85 | 86 | 87 | 89 | |||||||||||||||||||||||||||
| General and administrative expenses | 11 | 11 | 12 | 12 | 12 | 12 | 12 | 12 | 13 | |||||||||||||||||||||||||||
| Operating income | (10 | ) | (10 | ) | 6 | 23 | 45 | 61 | 63 | 65 | 66 | |||||||||||||||||||||||||
| Effective tax rate* | 20 | % | 20 | % | 20 | % | 20 | % | 20 | % | 20 | % | 20 | % | 20 | % | ||||||||||||||||||||
| Tax | 2 | (1 | ) | (5 | ) | (9 | ) | (12 | ) | (13 | ) | (13 | ) | (13 | ) | |||||||||||||||||||||
| After-tax operating income | (8 | ) | 5 | 19 | 36 | 49 | 50 | 52 | 53 | |||||||||||||||||||||||||||
| Change in revenues | 0.3 | % | 1.3 | % | 21.2 | % | 10.9 | % | 6.7 | % | 3.6 | % | 1.5 | % | 1.5 | % | 1.5 | % | ||||||||||||||||||
| Gross margin | 14.8 | % | 13.0 | % | 14.9 | % | 16.8 | % | 19.4 | % | 21.1 | % | 21.3 | % | 21.4 | % | 21.4 | % | ||||||||||||||||||
| Operating margin | (2.1 | )% | (2.1 | )% | 1.0 | % | 3.4 | % | 6.3 | % | 8.1 | % | 8.3 | % | 8.4 | % | 8.4 | % | ||||||||||||||||||
| * In this forecast, the effective tax rate is identical to the statutory tax rate in Turkey. | ||||||||||||||||||||||||||||||||||||
89
Investment and depreciation
We assume that investment in Israel over the forecast period would be equal to depreciation, at NIS 23 million annually. This is due to the fact that higher production capacity would require investment to eliminate bottlenecks. Actual investment in recent years were higher than depreciation.
KCTR investment in 2011, amounting to NIS 60 million, primarily for construction of the production line for female hygiene products, the decrease in investment to NIS 10 million annually in 2012-2013 and the gradual increase in investment to the level of depreciation for the typical year, NIS 15 million annually, are based on the KCTR strategic plan.
Working capital requirements
We assume that during the forecast period, the ratio of operating working capital to revenues in Israel would be 9% - similar to the ratio in 2010.
We assume that during the forecast period, the ratio of operating working capital to revenues in Turkey would be 19% - similar to the ratio in 2010.
Weighted average cost of capital (WACC) and long-term growth rate (g)
The real capital cost was set between 9.5-10.5% p.a., or an average of 10.0% p.a. The WACC reflected the following assumptions: capital cost - 11.5% p.a. on average; real debt cost - 5.0% p.a.; tax rate - 19%; and financial leverage - 20%.
The capital cost of 11.5% p.a. was calculated using the CAPM model, as set forth in section 2b above. We assume long-term risk-free interest rate to be 2.7% p.a., long-term market risk premium to be between 7-9% p.a. and HOGLA beta to be 1.1. This beta was determined relative to commonly-used beta values around the world15.
15 See summary of beta values by Aswath Damodaran:
http://pages.stern.nyu.edu/~adamodar/New_Home_Page/datafile/Betas.html
90
The risk-free cost of capital in the model, 2.7% p.a., is derived from the yield to maturity on Government of Israel CPI-linked debentures with duration of 10 years or more, as of December 31, 2010. The debt cost for HADERA PAPER in the model was determined to be the risk-free capital cost in the model, plus the Company's risk premium. The risk premium is determined as the difference, upon the valuation date, between the yield to maturity of corporate debentures with similar rating to that of the Company, and the yield to maturity of Government of Israel CPI-linked debentures with similar duration. The valuation is based on the assumption that the debt cost for HOGLA is the same as for HADERA PAPER.
HOGLA assumed no significant financial debt through 2007. In 2008, HOGLA assumed net financial debt amounting to NIS 119 million, to finance its investment in KCTR, which decreased to NIS 24 million as of the valuation date, as set forth in section 4b(2) above. This debt reflects a ratio of leverage to enterprise value (EV) of only 1% for HOGLA in the model.
Assuming that KC knowingly chose not to leverage HOGLA at typical leverage for the basic products industry, in HOGLA's case there are restrictions on applying the debt capacity approach. Using this approach, calculation of the weighted average capital cost would be based on the customary level of financial leverage for the sector, as distinct from the actual leverage level of the company, as set forth in section 2b above. It would appear that in this case, had KC not elected not to leverage, HOGLA may have achieved a leverage of 30-50% of enterprise value (EV). Due to KC's approach, we assume that the potential financial leverage would be at 20% of EV.
We assume that free cash flow (FCF) for HOGLA and KCTR would grow in the long term at 1.25-1.75% annually, on average at 1.5% annually - similar to the population growth rate. This assumes that technology improvements would allow to expand the production capacity at this pace over the long term, without investment in excess of depreciation.
91
Net financial debt
HOGLA's net financial debt as of December 31, 2010 amounted to NIS 19 million - see section 4b(2) above.
Value of KC control premium
KC's involvement in HOGLA is not materially different to that of HADERA PAPER. KC does not benefit from any management fees or other benefits, other than royalties at an average 2.5% of HOGLA revenues. These royalties are paid in exchange for technological knowledge, research and development and use of KC's procurement system. It would appear that the economic benefit to HOGLA due to economies of scale at KC is no less than the amount of royalties.
One of HOGLA's plants is at HADERA, and uses the energy center and other services provided by HADERA PAPER at this site. Furthermore, HOGLA contributes to cost of administrative and IT resources of HADERA PAPER, and it would appear that in this case, the positive implications of control premium (steering of the company, setting its business direction and enforcing efficient management), its negative implications (payroll and benefits at the expense of minority interest) and synergy with other businesses16 of KC are not material.
In view of the foregoing, we assume that the value of control premium for KC is not material.
16 As defined in "Value and Achievement of Control" by ALONA BAR-ON and YITZHAK SUARI, KASIERER Institute, December 2005.
92
| (2) | Valuation |
Below is calculation of HOGLA valuation:
| 2011 | 2012 | 2013 | 2014 | 2015 | 2016 | 2017 | Typical year | |||||||||||||||||||||||||
| Forecast | ||||||||||||||||||||||||||||||||
| NIS in millions | ||||||||||||||||||||||||||||||||
| After-tax operating income - Israel | 134 | 129 | 127 | 125 | 128 | 133 | 135 | 137 | ||||||||||||||||||||||||
| After-tax operating income - Turkey | (8 | ) | 5 | 19 | 36 | 49 | 50 | 51 | 52 | |||||||||||||||||||||||
| After-tax operating income | 126 | 134 | 145 | 161 | 177 | 183 | 186 | 189 | ||||||||||||||||||||||||
| Depreciation | 33 | 38 | 38 | 38 | 38 | 38 | 38 | 38 | ||||||||||||||||||||||||
| Investment in fixed assets | (83 | ) | (33 | ) | (33 | ) | (34 | ) | (35 | ) | (36 | ) | (38 | ) | (38 | ) | ||||||||||||||||
| Changes to working capital | (1 | ) | (21 | ) | (12 | ) | (8 | ) | (6 | ) | (4 | ) | (4 | ) | (4 | ) | ||||||||||||||||
| Free cash flow (FCF) | 74 | 118 | 138 | 157 | 173 | 181 | 182 | 185 | ||||||||||||||||||||||||
| Discounted cash flow, years 1-7 | 71 | 102 | 109 | 112 | 113 | 107 | 98 | |||||||||||||||||||||||||
| Residual value | 1,170 | |||||||||||||||||||||||||||||||
| High value | Low value | |||||||
| NIS in millions | ||||||||
| Calculation assumptions | ||||||||
| Weighted Average Cost of capital (WACC) | 9.75 | % | 10.25 | % | ||||
| Long-term growth rate (g) | 1.25 | % | 1.75 | % | ||||
| Model results | ||||||||
| Enterprise Value (EV) | 1,977 | 1,797 | ||||||
| Less financial debt as of | (19 | ) | (19 | ) | ||||
| Equity value - HOGLA | 1,958 | 1,778 | ||||||
| NIS in millions | Holding stake | |||||||||||
| Value of KC holding stake* | 981 | 891 | 50.1 | % | ||||||||
| Value of HADERA PAPER holding stake | 977 | 887 | 49.9 | % | ||||||||
| Equity value - HOGLA | 1,958 | 1,778 | ||||||||||
93
| Long-term real growth rate (g) | ||||||||||||||||||||||||||||||||
| 2.25% | 2.00% | 1.75% | 1.50% | 1.25% | 1.00% | 0.75% | ||||||||||||||||||||||||||
Weighted Average Cost of Capital (WACC) for discounting cash flow | 9.00 | % | 2,270 | 2,218 | 2,169 | 2,124 | 2,081 | 2,042 | 2,004 | |||||||||||||||||||||||
| 9.25 | % | 2,187 | 2,139 | 2,094 | 2,052 | 2,013 | 1,976 | 1,942 | ||||||||||||||||||||||||
| 9.50 | % | 2,109 | 2,065 | 2,024 | 1,985 | 1,949 | 1,915 | 1,883 | ||||||||||||||||||||||||
| 9.75 | % | 2,036 | 1,995 | 1,958 | 1,922 | 1,889 | 1,857 | 1,827 | ||||||||||||||||||||||||
| 10.00 | % | 1,968 | 1,931 | 1,896 | 1,863 | 1,832 | 1,802 | 1,775 | ||||||||||||||||||||||||
| 10.25 | % | 1,904 | 1,870 | 1,837 | 1,807 | 1,778 | 1,751 | 1,725 | ||||||||||||||||||||||||
| 10.50 | % | 1,844 | 1,812 | 1,782 | 1,754 | 1,727 | 1,702 | 1,678 | ||||||||||||||||||||||||
| 10.75 | % | 1,788 | 1,758 | 1,730 | 1,704 | 1,679 | 1,656 | 1,633 | ||||||||||||||||||||||||
| 11.00 | % | 1,735 | 1,707 | 1,681 | 1,657 | 1,634 | 1,612 | 1,591 | ||||||||||||||||||||||||
94
Appendix A
Valuation of HADERA PAPER Ltd.
Information about Company securities traded on the TEL AVIV Stock Exchange

Adjusted share price of Hadera Paper Ltd.
The price of the share, as derived from the
valuation, lies in the range NIS 320-360
valuation, lies in the range NIS 320-360
Share price on December 31, 2010:
NIS 296
NIS 296
Share price on June 30, 2009:
NIS 173
NIS 173
A - 1
Appendix B
Valuation by GIZA-SINGER-EVEN Ltd.
Of CARMEL Container Systems Ltd.
B - 1
| Industry And Trade Branch | ||
| Carmel Container Systems Ltd. | ||
| Valuation For Impairment Testing | ||
| November 2010 |
B - 2
| Saul Glicksberg | ||
| Hadera Paper Ltd. (hereinafter: “Hadera Paper”) | ||
| General | ||
| At your request, we were asked by Hadera Paper Ltd. (hereinafter: “the Company”) to perform a valuation of the activity of Carmel Container Systems Ltd. (hereinafter: “Carmel”) for the purpose of testing for impairment of its goodwill, correct to September 30, 2010 (hereinafter: “the Work”). | ||
| This opinion includes a description of the methodology and the principal assumptions and analyses used to examine the value of the Company. Nonetheless, the description does not purport to be a complete and detailed description of all procedures that we implemented during the formation of this opinion. | ||
| When formulating its opinion, Giza Singer Even Ltd. (“Giza Singer Even”) assumed and relied upon the information received from the Company as being accurate, complete and up-to-date, including the financial data and forward-looking information. Giza Singer Even is not responsible for an independent examination of the information that it received, and accordingly, did not perform an independent examination of this information, apart from general overall tests of reasonability. | ||
| In this valuation, we also took into account, inter alia, forecasts furnished to us by the Company’s Management. These assessments are conjectures and uncertain expectations regarding the future, which are based, in part, on information existing in the Company when the assessments were made, as well as on various assumptions and expectations concerning both the Company and many external factors, including the state of the market in which the Company operates, potential competitors and the state of the economy as a whole. We emphasize that there is no certainty that these conjectures and expectations shall materialize fully or partially. The assessments and forecasts of the Company’s Management, besides being based on the aforesaid assumptions, relate to the Company’s intentions and future objectives, correct to the date of the assessment. These intentions and objectives are materially influenced by the Company’s situation and the market situation, and are continuously being adjusted to the various changes in the working assumptions, in the Company’s situation and in the overall economic situation. It is reasonable to assume that any such change would affect the chances of these assessments materializing and, if these assessments of the Management do not materialize, the actual results may materially differ from the assessed or implied results of these assessments, to the extent that they were used in this opinion, considering that the fair value was assessed within the scope of the Work, as specified in the section on accounting standardization. | ||
| In this valuation, we also considered forward-looking information that was furnished to us by the Company’s Management. Forward-looking information is uncertain information about the future, which is based on information existing in the Company at the time of the assessment, and includes the Company Management’s assessments or intentions correct to the date of the assessment. Should these assessments by the Management not materialize, the actual results may materially differ from the assessed or implied results of this information, to the extent that it was used in this opinion. | ||
Furthermore, the valuation, per se, contains forward-looking information, which reflects our assessment of various parameters based on information in our possession. Should these assessments not materialize, the actual results may materially differ. |
B - 3
| An economic assessment is not an exact science, and is supposed to reasonably and fairly reflect an accurate situation at a particular time, based on known data, basic assumptions that were made and forecasts that were estimated. Changes in the principal variables and/or in the information may change the foundation for the basic assumptions and, accordingly, change the conclusions. | ||
| This opinion does not constitute a due diligence and does not purport to include the information, examinations and tests or any other information included in a due diligence, which includes an examination of contracts and engagements of the company. | ||
| It is emphasized that this opinion in no way constitutes counseling or a legal opinion. We interpreted various documents that we perused solely for the purposes of this opinion. | ||
| The information appearing in this Work and valuation does not purport to include all information that a potential investor would require, and is not intended to determine the Company’s value for a specific investor. Different investors may have differing objectives and considerations, and examination methods based on different assumptions; accordingly, the price that they would be willing to pay would also be different. | ||
| We hereby affirm that we have no personal interest in Carmel, apart from the fact that we are receiving a fee for this counseling; our fee is not contingent upon the results of the valuation. | ||
| It should be noted that, in recent years, Giza Singer Even prepared a number of economic assignments pertaining to Carmel, including the PPA work and additional goodwill impairment tests. | ||
| Furthermore, from time to time Giza Singer Even prepares economic opinions and provides economic and financial consulting services to the controlling shareholders of the Company and/or to their related companies and to the Company itself, including an impairment test for the purposes of financial statements of previous years. | ||
| At the time this Work is being performed, the parties have no contractual engagement and there is no dependency between them. | ||
| We point out in relation to this opinion that Giza Singer Even shall receive a letter of indemnification from the parties commissioning this Work (“the clients”), for any instance whereby it shall be sued in a legal proceeding to pay any sum to a third party in a legal proceeding in respect of a cause that is liable to derive, directly or indirectly, from this opinion. The clients shall indemnify Giza Singer Even in respect of all reasonable expenses that Giza Singer Even shall incur or be required to pay for legal representation, legal counseling, professional counseling, and/or defense during legal proceedings, negotiations, etc. The clients shall also indemnify Giza Singer Even in respect of a sum that it shall be adjudged to pay, in a legal proceeding, to a third party. The indemnity obligation shall not apply if Giza Singer Even acted maliciously or with gross negligence in relation to provision of the services pertaining to this opinion. | ||
| We are not agreeing to this opinion being mentioned in the Company’s financial statements for example, or in reports to the Securities Authority and/or the Ministry of Finance. No other use may be made of this opinion without receiving express prior written permission from Giza Singer Even. | ||
| Any party that makes use of this Work, in whole or in part, other than for the purposes for which it was submitted, and without the prior written authorization of Giza Singer Even Ltd., may be sued as a result. |
B - 4
Limits of Liability | ||
| Our Work is intended solely for the use of the Company’s Management and solely for the purpose described above; no other use may be made thereof, including forwarding of our opinion to a third party or mentioning it, without receiving our prior written consent. In no instance, whether or not our consent has been given, shall we bear any liability towards any third party to whom our opinion has been forwarded. | ||
| During the course of the Work, we received information, explanations, data and representations from the Company and/or from any party acting on its behalf (hereinafter: “the Information”). The responsibility for the aforesaid Information is that of the suppliers of this Information. The framework of our Work did not include an examination and/or verification of the Information as stated. In light of this, our Work shall not be deemed and shall not constitute confirmation that the Information forwarded to us is correct, complete or accurate. In no instance shall we be liable for any loss, damage, cost or expense that might be caused in any way and manner due to acts of fraud, false representation, deception, the furnishing of incorrect and incomplete information or the withholding of information on the part of the Company and/or any party acting on its behalf, or any other reliance on such Information, subject to that stated above. | ||
| As a rule, forecasts relate to future events and are based on reasonable assumptions at the time of the forecast. Since these assumptions may change over the period of the forecast, forecasts made at the time of the assessment may differ from the actual financial results and/or from assessments that might be made at a later date. Therefore, one cannot relate to forecasts made at the same level of assurance as is attributed to data in audited financial statements. We are not expressing an opinion as to the correspondence of the forecasts made by the companies and/or by any party on their behalf with the financial results that shall actually be obtained. | ||
| Our Work does not constitute a due diligence and it should not be relied upon as a due diligence. | ||
| Furthermore, economic valuations do not purport to be an exact science and the conclusions thereof depend, in many instances, upon the subjective judgment of the appraiser. Despite the fact that we believe that the value determined by us is reasonable, based on the Information supplied to us, another appraiser might have reached a different value. | ||
Sources of Information | ||
| The principal sources of Information used in the preparation of this opinion are specified hereunder: |
| ü | the Company’s financial statements for the year 2009 (audited) and the unaudited financial statements as on 30.9.2010 (reviewed); | ||
| ü | background material and market data, taken from overt information publicized on websites, in newspaper articles or in other public sources; | ||
| ü | the Company’s budget for the year 2011 (updated on the basis of the results of the first half of the year); | ||
| ü | clarifications and data forwarded to us by the Company at our request, as specified in the body of the Work; | ||
| ü | meetings and/or telephone conversations with the following officers in the Company: |
B - 5
| ● | Mr. Saul Glicksberg, V.P. Finance, of Hadera Paper Ltd.; | |||
| ● | Mr. Shmuel Molad, Comptroller, Hadera Paper Ltd.; | |||
| ● | Mr. Avishai Ali, V.P. Finance, of Carmel. |
| Accounting Standardization | ||
| At the request of the clients, the valuation shall be used for the purpose of implementing International Accounting Standard number 36, “Asset Impairment” (hereinafter: “the Standard”) in their financial statements. | ||
| The purpose of the Standard is to prescribe procedures that a corporation must implement in order to ensure that its assets are not presented at a sum that exceeds their recoverable amount. An asset is presented at a sum higher than its recoverable amount when its book value exceeds the sum that would be obtained from realizing or selling the asset. In such instance, asset impairment has occurred and the Standard requires the corporation to recognize a loss due to impairment. The Standard also specifies when a corporation must write off a loss due to impairment and requires particular disclosures about impaired assets, as well as about investments in nonsubsidiary investee companies presented in the financial statements at a sum that significantly exceeds their market value or their net selling price. | ||
| The Standard prescribes the accounting handling and presentation required in the event of asset impairment. If a corporation prepares consolidated (including proportionately consolidated) financial statements, the Standard must be implemented for the accounting handling of impairment of all assets stated in the corporation’s consolidated statement of financial position, including investments in nonsubsidiary investee companies, goodwill deriving from the acquisition of subsidiaries and fair-value adjustments. This Standard applies, in essence, also to investments in subsidiaries and jointly-venture companies, so that provisions for impairment, which are recognized in the consolidated financial statements in respect of the assets of the subsidiary or the jointly-venture company, including goodwill and fair-value adjustments, are presented in the parent company’s separate financial statements as a reduction of the investment account in the subsidiary or jointly-controlled company. | ||
| The Standard prescribes that the recoverable amount of an asset must be estimated whenever there are indications that an asset may be impaired. | ||
| This Standard requires a company to recognize a loss due to asset impairment (i.e., the value of the asset declines) whenever the book value of the asset exceeds its recoverable amount. A loss due to impairment must be recognized in the statement of operations in relation to those assets that are presented at cost and must be handled as a reduction of a revaluated sum, but only in relation to those assets that are presented at a revaluated sum according to other accounting standards or provisions of law. | ||
| The Standard prescribes that the recoverable amount must be calculated as the net selling price or value in use, whichever is higher: |
| (1) | The net selling price is the sum that may be obtained from selling the asset in an arm’s-length transaction between knowledgeable willing buyers and willing sellers, less any direct incremental disposal costs. | ||
| (2) | The asset’s value in use is the present value of the estimated future cash flows expected to derive from continued use of the asset and from disposal of the asset at the end of its useful life. | ||
| This Standard requires a corporation to use, inter alia, the following, in order to determine the asset’s value in use: | |||
B - 6
| (1) | cash-flow forecasts on the basis of reasonable, substantiated assumptions that: | |||
| ● | reflect the present situation of the asset; | |||
| ● | represent the Management’s best assessment of the economic conditions likely to prevail during the balance of the asset’s useful life. | |||
| (2) | the pre-tax discount rate, which reflects current market assessments of the time value of the money, and the risks that are specific to the asset. The discount rate will not reflect risks relating to future cash flows that have already been adjusted in respect thereof.1 | |||
| An estimate of the recoverable amount will be calculated for each asset separately. If this is not possible, this Standard requires the corporation to determine the recoverable amount for the cash-generating unit to which the asset is attributed. A cash-generating unit is the smallest identifiable group of assets that generates cash inflows from continued use, which are essentially independent of the cash inflows from other assets, or from other groups of assets. Nonetheless, if the output produced by an asset or by a group of assets is traded on an active market, the asset or group of assets will be identified as a distinct cash-generating unit, even if a portion or the entire output being produced by the asset or by a group of assets is earmarked for internal use. | ||
| When testing for impairment of a cash-generating unit, this Standard requires that goodwill and joint assets (such as assets of a head office) relating to that same cash-generating unit must also be taken into account. | ||
| Examining the possibility of impaired goodwill is based on rules and guidelines prescribed, as stated, in International Accounting Standard no. 36. | ||
| Since goodwill cannot be measured separately from the operations, the customary methodology employed to test for possible impairment of goodwill is to measure the recoverable value of each cash-generating unit to which all or a portion of the acquired goodwill is attributed, and compare it with the book value of the assets and liabilities (including the acquired goodwill) attributed to that unit. If the recoverable amount is lower than the book value of the cash-generating unit, the difference will be deducted from the goodwill attributed to that unit. If a gap remains after reducing all of the goodwill, the balance of the assets attributed to that unit must be reduced on a pro rata basis, subject to the limit of the recoverable value of these assets. | ||
| As a rule, an examination of goodwill impairment includes the following stages: |
| (1) | identifying the cash-generating units and the book value of their assets and liabilities – this stage includes determining the units that are relevant for measuring the value of the goodwill, and attributing the assets and liabilities to the various units, including attribution of the acquired goodwill. | ||
| (2) | measuring the recoverable value of each unit, considering the anticipated cash flow in respect thereof and/or its realization value, whichever is higher. |
| 1 | According to clause 85 of the summary of considerations and rationale behind the conclusions, which were presented in International Accounting Standard number 36 – “Asset Impairment”: “Theoretically, discounting of post-tax cash flows at a post-tax discount rate and the discounting of pre-tax cash flows at a pre-tax discount rate should give the same result, as long as the pre-tax discount rate is equal to the post-tax discount rate, and adjusted to reflect the specific sum and timing of the cash flows in respect of taxes.” For the sake of convenience, and according to customary practice, we performed the valuation according to post-tax cash flows and at a post-tax discount rate. | ||
B - 7
| (3) | comparing the recoverable value with the book value – according to that stated above. |
| Details about the valuating company and the appraiser | ||
| Giza Singer Even is the leading independent financial and economic consulting firm in Israel, with more than 25 years of experience. | ||
| The consulting services of Giza Singer Even are divided into four spheres: consulting services to corporations and government authorities; mergers and acquisitions; securitization; tenders and infrastructure projects. | ||
| Giza Singer Even provides its services through a number of departments: economic valuations, financing and capital markets, applicable economic research, economic accounting and risk management, project and infrastructure financing and a professional department. | ||
| The firm’s leading partners are: the Chairman, Yechiel Even, and the C.E.O., Yariv Philosoph, together with Prof. Eli Kraizberg, Yuval Zilberstein, Eli Goldberg, Avshalom Herscovic and Udi Rosenberg, who also serves as the head of the firm’s professional department. Additional partners in the firm are Eyal Jed Wab, Yuval Lapidot and Yuval Barak of the finance department, Asher Shklar of the economic accounting and risk management department, Varda Stern of the project and national infrastructure financing department, and Alex Shechter of the economic valuation department. | ||
The team who performed the Work: | ||
| The Work was performed by a team headed by Mr. Eli Goldberg. | ||
| Mr. Eli Goldberg is a founding partner of the company, whose experience spans more than 30 years. | ||
| Following are Mr. Goldberg’s educational credentials: | ||
| Mr. Goldberg received a BA in economics from Bar-Ilan University in 1977. |
| Sincerely, | |||
 | |||
| Giza Singer Even Ltd. | |||
Date: November 7, 2010 |
B - 8
| TABLE OF CONTENTS | |||
| 9 | |||
| 10 | |||
| 16 | |||
| 18 | |||
| 20 |
B - 9
| 1. | Introduction | ||
| Carmel Container Systems Ltd. (hereinafter: “Carmel”) is an industrial company engaging in the design, manufacture and marketing of paper-based packaging. The Company designs, manufactures and sells shipping packages and corrugated carton sheets. The Company’s sales are mainly to a large number of customers in Israel. | |||
| The Company has two subsidiaries: Frenkel – C.D. Ltd. (hereinafter: “Frenkel”), an industrial company engaging in the development, manufacture and marketing of packaging products based on paper, carton and other materials; and Tri-Wall Containers (Israel) Ltd. (hereinafter: “Tri-Wall”), an industrial company manufacturing triple-layer packaging, pallets and wooden crates. | |||
In July 2008, Hadera Paper signed an agreement for the acquisition of the shares of the principal shareholder of the Company, for the consideration of approximately ILS 79 million. The transaction was consummated on August 24, 2008 and, as a result, Hadera Paper increased its stake in Carmel from 36.2% to 89.3%.2 On October 4, 2010, Hadera Paper completed its acquisition of the remaining Carmel shares, and, for the consideration of USD 4.2 million, increased its stake in the Company to 100%. |
| 2 | All holding ratios mentioned in the description of Carmel are the effective holding ratios, after neutralizing treasury shares previously acquired by Carmel and its subsidiaries. | ||
B - 10
| 1. | General | |||
| 1.1 | Carmel Container Systems Ltd. | |||
| Carmel was founded in 1983 and engages in the design, manufacture, marketing and sales of packaging containers, corrugated carton sheets, wooden pallets, etc. The Company was founded as a private company and, in 1986, became a public company after listing its shares on the American Stock Exchange (“AMEX”). In July 2005, Carmel’s shares were delisted from the AMEX at its initiative, inter alia, due to the insignificant number of Carmel shareholders in the U.S., the poor trading and the high administrative costs, and taking into account the fact that, at that time, Carmel had no plans for capital recruitments via the AMEX. | ||||
In July 2008, Hadera Paper signed an agreement for the acquisition of the shares of the Company’s principal shareholder for the consideration of approximately NIS 79 million. The transaction was consummated on August 24, 2008 and, as a result, Hadera Paper increased its stake in Carmel from 36.2% to 89.3%.3 On October 4, 2010, Hadera Paper completed its acquisition of the remaining 10.7% of Carmel’s shares for the consideration of USD 4.2 million, and thus increased its stake in the Company to 100%. | ||||
| Carmel has two investee companies: Frenkel – C.D. Ltd. (hereinafter: “Frenkel”) and Tri-Wall Containers (Israel) Ltd. (hereinafter: “Tri-Wall”). | ||||
| 1.2 | Frenkel C.D. Ltd. | |||
| �� | ||||
| Frenkel engages in the design, manufacture, marketing and sales of carton shelf packaging (packaging for single products, such as cornflakes, beer packs, carton baking trays, etc.), product display stands for setup on sales floors, etc. Frenkel offers unique packaging solutions to its customers, customized to their requirements, in the fields of industry, agriculture, the food and beverage industries, and knowledge-intensive industries. | ||||
| Frenkel was founded following a merger transaction between C.D. Packaging Systems Ltd. and Frenkel and Sons Ltd. in January 2006. Prior to the transaction, C.D. Packaging Systems Ltd. had been jointly owned by Hadera Paper (50%) and Carmel (50%), while Frenkel and Sons Ltd. had been controlled by a third party. Subsequent to the execution of the transaction, Hadera Paper and the Company each hold 28.92% of Frenkel’s shares, while Frenkel and Sons Ltd. hold the remaining 42.16%. The objective of the merger had been to combine the operations in the segment and to create a more significant player in this competitive market, while combining the advantages of both companies and realizing the potential for savings in costs, as a result of the synergies between the operations. | ||||
| 1.3 | Tri-Wall Containers (Israel) Ltd. | |||
| A wholly owned subsidiary of Carmel, which was acquired in 1988 from Koor Food Ltd. Tri-Wall engages in the design, manufacture and marketing of special triple-wall corrugated carton containers (produced by Carmel), in combination with additional materials, which are intended for the packaging and shipping of products, mainly for the high-tech market, bulk shipments and more. In addition, Tri-Wall manufactures wooden pallets for the domestic market and for exports. | ||||
| 3 | All holding ratios mentioned in the description of Carmel are the effective holding ratios, after neutralizing treasury shares previously acquired by Carmel and its subsidiaries. | ||
B - 11
| Recently, Tri-Wall underwent streamlining, the objective being to improve its profitability in the short term. The main processes that Tri-Wall is implementing as part of its program to increase efficiency include: |
| – | continuing the process of downsizing its manpower; | ||||
| – | raising prices, the aim being to offset the increase in input prices; | ||||
| – | developing the package manufacturing operations at the industrial plant site in northern Israel; | ||||
| – | upgrading the information systems and renovating machinery; | ||||
| – | focusing on various industries offering high potential profitability. |
| 2. | Products and services | ||||
| 2.1 | Carmel | ||||
| Carmel’s products are divided into the following categories: | |||||
| 2.1.1 | Corrugated carton products | ||||
| The corrugated carton products are manufactured and processed according to customers specific requirements, which are determined according to the type of goods being stored, the type of packaging, the weight expected to be applied to the packaging during transport, the temperature and humidity conditions during storage and transport, the graphic design of the package, etc. The corrugated carton products being manufactured and processed include: (1) “standard” packaging containers of corrugated carton, boxes manufactured in various sizes that are closed by adhering tabs and the bottom of the box; (2) containers and boxes in a variety of geometric shapes that may be assembled by manual folding of the carton sheet, without mechanized folding or adhesion using hot glue. These products are sold mainly to high-speed, mechanization-intensive industries, such as the soft-drinks industry; (3) boxes for agriculture, trays that are assembled merely by using an assembly machine having matching moulds. | |||||
| This year, Carmel acquired a seven-color printing and cutting machine at an investment of approximately NIS 25 million, which affords the Company a quality advantage over its competitors in the industry and enables Carmel to better meet the demands during peak months, due to its increased processing capacity. | |||||
| 2.1.2 | Corrugated carton sheets | ||||
| Corrugated carton sheets are used as raw material and are marketed to corrugated carton processors that use them as raw material for the production of packaging. The carton processors are small processing plants that sell their products to small and medium-sized customers. Carmel has the unique ability to manufacture triple-wall corrugated sheets that are used to manufacture special packaging by its subsidiary, Tri-Wall, mainly for high-tech industries. | |||||
B - 12
| 2.1.3 | Production of digital (print) sales promotion products | ||||
| Planning, design and production of digital print products for a variety of applications relating to sales promotion, display stands, decorations for trade-show pavilions and outdoor advertising. The superior quality, ink-jet printing technology is applied to the work surface, with synchronized cutting, without the need for dies. | |||||
| 2.2 | Frenkel | ||||
| Frenkel designs, manufactures and markets shelf packaging and display stands. Frenkel uses mainly duplex carton and some corrugated carton as the raw materials for its products. The duplex carton is, for the most part, imported directly from Europe and the U.S., while another portion is imported indirectly through local agents. The supply of the corrugated carton from Carmel constitutes approximately 20% of Frenkel’s raw materials. | |||||
| 2.3 | Tri-Wall | ||||
| Tri-Wall’s products include the following products | |||||
| ● | Packaging made from triple-wall corrugated carton, which is used mainly for exporting heavy and large volume products, such as chemicals, electronics equipment, high-tech equipment, medical equipment, security equipment and more. | ||||
| ● | Packaging assembled mainly for exporting high-tech products, which are made of wood, plywood, triple-wall corrugated carton, padding material, metal components and more. | ||||
| ● | Ordinary and unique wooden pallets which are used, inter alia, as bases for the above-mentioned packages. | ||||
| 3. | Customers | ||||
| The majority of Carmel’s production is channeled to the domestic market to business customers from the sectors of industry and agriculture (as specified hereunder), while approximately 1-2% of its production is channeled to direct exports, mainly agricultural exports. A significant portion of the industrial customers export their products in corrugated carton packages, such that a significant share of Carmel’s sales is also directed towards indirect exports. Products are supplied according to orders forwarded from customers either through sales representatives or directly opposite Carmel’s customer service department. Orders are drawn up according to price quotes that customers receive and according to the commercial arrangements between the parties. A small portion of the products is manufactured for inventory, at the request of customers. | |||||
| Carmel has a wide variety of customers, including leading companies in the economy operating in a broad range of sectors, including: (a) the industrial sector, which includes customers in the food, soft drink, dairy and textile sectors, etc.; (b) the agricultural sector, which includes customers that are farmers, packing houses and marketing organizations, whereby the products target both the domestic market and exports; (c) carton processors – small factories for processing corrugated cartons in small production series; (d) digital printing customers, which include mainly advertising agencies; (e) others – cellular operators, government ministries and banks. | |||||
| Carmel has approximately 350 active customers, and has no dependency on any particular customer. | |||||
B - 13
| 4. | Marketing and distribution | ||||
| Carmel distributes its products in a variety of ways, including direct sales to end customers and sales through agents. | |||||
| 5. | Seasonality | ||||
| The majority of the sectoral demand for the marketing of carton packaging products is during the winter months, mainly in November and March, due to the high demand deriving from agricultural crops (mainly citrus fruit and peppers), the majority of which is channeled to exports. During the winter, the sector fully utilizes its entire production capacity. | |||||
| 6. | Production capacity | ||||
| Carmel’s production capacity is estimated at approximately 100 thousand tons of corrugated carton per annum and is utilized for the most part. Carmel’s operations in the field of corrugated carton are concentrated at the plant in Caesaria, while a small portion of the operations is carried out at the plant in Carmiel. Carmel’s production setup includes corrugators and machines to process corrugated carton sheets into packaging (mainly printing and cutting), warehouses for raw materials and finished goods and a fleet of trucks operated by subcontractors. The entire corrugating operations and the majority of the processing operations are performed in Caesaria, on 12 processing machines. In addition, Carmel has an additional assembly center in Ein Yahav, serving customers in the Arava region. During 2005 – 2006, Carmel executed investments to optimize its production setup, including increasing its production capacity and modifying equipment to accommodate lighter packaging paper in order to improve profitability. Furthermore, the Company increased its printing and carton processing capacity by adding a sophisticated cutting and printing machine. Additionally, the Company reached a decision to relocate a portion of its wood production operations (of Tri-Wall) from Netanya to Netivot. | |||||
| 7. | Fixed assets and facilities | ||||
| Carmel owns real estate in Netivot and, in addition, rents real estate and buildings in the Caesaria industrial zone, in Carmiel, Netivot and in Netanya from a company owned by the Company’s controlling shareholder. | |||||
| Carmel’s fixed assets include mainly manufacturing machinery and equipment for paper corrugation, and processng machines, which perform operations of cutting, printing, adhesion and folding to complete the final product. Carmel’s manufacturing operations in the field of corrugated carton are carried out in Carmiel and in Caesaria. All of the corrugation operations and the majority of the processing operations are carried out at the plant in Caesaria. | |||||
| Furthermore, Carmel owns two digital printing machines (that produce six-color, high-quality printing on corrugated carton and other rigid surfaces), with a variety of diverse applications in the fields of sales promotion, display stands and outdoor advertising. | |||||
| 8. | Raw materials and suppliers | ||||
| The purchasing of the raw materials from Carmel’s shareholders is done at competitive prices customary in the sector in Israel. | |||||
| Wrapping paper, which constitutes approximately 55% of the finished goods cost, is purchased from Hadera Paper (approximately 50% is recycled paper), and from additional overseas suppliers (approximately 50% is paper based on wood cellulose). Carmel has no dependency upon its raw materials suppliers. | |||||
B - 14
| Additional main ancillary materials that Carmel uses in the production of corrugated carton are starch and fuel oil. Starch constitutes a main ingredient of the adhesive for the paper sheets. The starch supplier is Galam Ltd. Other ancillary materials used by Carmel are dies and plates purchased from a number of local suppliers, and wooden pallets produced by Tri-Wall. | |||||
| The main raw materials that Tri-Wall uses for the manufacture of packages (in its plants in Netanya and in Netivot) are Tri-Wall sheets, which are manufactured by Carmel, and a variety of packaging materials, such as plywood, padding materials, and metal parts, which are purchased from a variety of local suppliers. | |||||
| 9. | S.W.O.T. analysis | ||||
| 9.1 | Strengths | ||||
| ● | Its reputation and considerable knowledge in the field of package manufacturing; | ||||
| ● | Its varied product basket, from special small packages, through production lines of corrugated carton packaging to large packages of multi-layer corrugated carton by special order. | ||||
| ● | Carmel’s customers represent basic, economic operating sectors – agriculture, food, beverages, etc. – whose exposure to the economic crisis is low relative to other sectors. | ||||
| 9.2 | Weaknesses | ||||
| ● | Relatively low entry barrier for package manufacturing operations (to differentiate from corrugated carton manufacturing) causes stiff competition over every customer. | ||||
| ● | Competitive market (four major players); affected mainly by the gap between supply and demand, due to the cost structure (high capital investment, which is executed in phases). | ||||
| 9.3 | Opportunities | ||||
| ● | Exploiting the synergies deriving from acquisition of the control of Carmel and strengthening the holding of Frenkel on the one hand, and expanding the production capacity of wrapping paper on the other hand. | ||||
| ● | Carmel’s switch to craft substitutes. Hadera Paper’s output may cut the cost of materials and improve Carmel’s profitability. | ||||
| ● | Development of the field of printing on packaging, and the creation of a qualitative and quantitative advantage over competitors deriving from the purchase of a modern printing machine. | ||||
| ● | Increasing the production volume and the ability to meet demands during peak months, which derives from the purchase of a modern processing machine. | ||||
B - 15
| 9.4 | Threats | ||||
| ● | The agricultural sector, and particularly considering its exports of agricultural produce, is one of the largest consumers of corrugated carton packaging in the economy. Reductions in the water quotas to farmers is liable to reduce the agricultural crops and, as a result, the demand for packaging. | ||||
| ● | The transition to use of re-useable plastic packaging in lieu of corrugated carton and paper packaging as part of the “green” trend is liable to reduce demands for Carmel’s products. | ||||
| ● | Carmel is exposed to fluctuations in the exchange rates, due to the fact that about 50% of the wrapping paper consumption is imported, while the product prices are quoted in shekels. | ||||
| ● | Increases in raw materials prices and in paper prices adversely impacts the Company’s short-term profitability, due to the time gap until the additional costs are “passed” to the Company’s customers. | ||||
B - 16
| 1. | General | ||
| Carmel deals in the design, manufacture, and marketing, of cardboard packaging products. Below is a short survey of the cardboard packaging market. | |||
| 2. | Market Size | ||
| The size of the corrugated cardboard packaging market in Israel (as of 2010) is estimated – in terms of quantity – at 315 thousand tons annually, coming to approximately 1.5 billion NIS annually in monetary terms. Carmel’s share of the market is estimated at 27%. According to company estimates, in the years 2007-2009, the market contracted by a total amount of approximately 10% in terms of quantity. This contraction was determined by changes in industrial output in sectors such as food, beverages, technology, and others, as well as from changes in the activities of the agricultural sector, including export of agricultural produce, which were affected by the global economic crisis. | |||
| The corrugated cardboard industry is directly affected by any change in GDP. Any improvement in GDP results in additional demand for packaging products including corrugated cardboard, and a decline in GDP has opposite results. Additionally, increased exports also support demand for packaging and cardboard products. | |||
| 3. | Competition | ||
Carmel’s competitors in the field of corrugated cardboard are four local companies that manufacture corrugated cardboard and its products: Cargal Ltd.4, Best Carton Ltd., I.M.A. Corrugated Packaging Ltd., and Orda Print Industries Ltd. These manufacturers make corrugated cardboard sheets and packaging containers, and market the containers to customers who use them for packaging needs, and the cardboard sheets to box makers who manufacture containers for small customers and in small series. According to industry estimates, in 2009 most of the manufacturing capability of the sector was utilized. | |||
| The corrugated cardboard industry is capital intensive due to the need to invest in a corrugator having a production capacity starting at 40 thousand tons per annum, and reaching up to 80 thousand tons per annum for the largest corrugators in the local market. This fact serves as a natural barrier for entry and exit of competitors in the industry. The investment in a corrugator involves large-scale recruitment of customers in a relatively short period of time, in a saturated market, and thus the investment in a corrugator entails high risk. The most significant investment in the industry in a new corrugator was made by Best Carton Ltd approximately 8 years ago, and turned that company into the third-biggest player in the industry. | |||
| Importation of paper and cardboard packaging is limited due to their large volumes and the degree of availability generally required of packaging products, and thus importation is not a real quantitative threat to the cardboard packaging market. Local manufacturers have a real advantage, due to flexibility in production, low freight costs, and also due to inventory holding costs. A number of customers import packaging through direct imports, but the extent of this importation is not significant. |
| 4 | Approximately 26% of stock of Cargal Ltd. is held by Clal Industries. | ||
B - 17
| Frankel’s field of activity is characterized by high quality requirements for printing on packaging. The field has changed in the last decade with the introduction of digital printing, which has made packaging manufacturing by small print houses economically worthwhile. Currently, Frankel’s main competitors are the Ducart Group, Grafica Bezalel Ltd., Hanamal Packaging, Mercaz Ha’atakot, as well as many small competitors. | |||
| Additionally, Carmel is involved, through Tri-Wall, in the field of manufacture of reinforced packaging from multi-ply corrugated cardboard, and in the field of wood sheets. The manufacture of packaging from multi-ply cardboard is a niche field with limited growth potential. The fields products represent an alternative to wood packaging. The threshold of entry into the field is relatively high, due to the knowledge required in the design of high-durability special packaging. In this field, Carmel mainly competes with Triplex Containers (2003) Ltd., and Tlaton Ltd. In the field of wood sheets, a number of manufacturers and distributors operate in Israel, mostly regionally. The entry threshold to this field is low, and there is a relatively high turnover rate of parties dealing in this field. | |||
| 4. | Raw Materials | ||
| The raw materials in the industry are virgin paper rolls and recycled paper rolls. The recycled paper used in the industry is mostly manufactured by and purchased from Hadera Paper, and the virgin paper in imported mainly from Europe and the US. | |||
| Increases in demand for paper, mainly in China and Europe, lead to a sharp rise in the price of paper. Additionally, the strong effect of exchange rates should be noted. Any change in exchange rates has a direct, sharp, effect on cost structure. | |||
| The timeframe for ordering the imported raw materials is particularly long, roughly 4 months, and requires the maintaining of especially large inventories. Also, the large variety of packaging, with differing characteristics, requires a large variety of types of paper. |
B - 18
| Balance Sheet | ||
| Below is a company balance sheet for the dates 9.30.2009 and 9.30.2010 (surveyed) and for 12.31.2009 (audited), in thousands of NIS: |
| For date of Sep. 30 | For date of Dec. 31 | ||||||||||||
| 2010 | 2009 | 2009 | |||||||||||
| Unaudited | Audited | ||||||||||||
| Current Assets | |||||||||||||
| Cash and cash equivalents | 1,073 | 16,128 | 16,439 | ||||||||||
| Customers, net | 158,287 | 147,519 | 161,037 | ||||||||||
| Debtors and debt balances | 3,904 | 3,328 | 5,556 | ||||||||||
| Financial derivatives | 244 | – | 19 | ||||||||||
| Inventory | 60,979 | 36,408 | 47,245 | ||||||||||
| 244,478 | 203,383 | 230,296 | |||||||||||
| Noncurrent Assets | |||||||||||||
| Long-term loans | 204 | ||||||||||||
| Long-term debtors | – | 1,706 | |||||||||||
| Included investment in the company | 8,125 | 7,983 | 8,087 | ||||||||||
| Fixed assets, net | 80,181 | 55,985 | 58,874 | ||||||||||
| 88,510 | 65,674 | 66,961 | |||||||||||
| 312,988 | 269,057 | 297,257 | |||||||||||
| Current Liabilities | |||||||||||||
| Credit from banking corporations | 36,706 | 19,343 | 19,097 | ||||||||||
| Liabilities to suppliers and service providers | 91,661 | 61,942 | 88,902 | ||||||||||
| Taxed to be paid | 5,128 | 2,100 | 3,606 | ||||||||||
| Creditors and credit balances | 13,232 | 14,833 | 15,217 | ||||||||||
| Financial derivatives | – | – | – | ||||||||||
| 146,727 | 98,218 | 126,822 | |||||||||||
| Long-term Liabilities | |||||||||||||
| Long-term loans from banking corporations | 38,058 | 46,701 | 42,083 | ||||||||||
| Liabilities due to worker benefits, net | 1,958 | 2,668 | 1,995 | ||||||||||
| Postponed taxes | 3,938 | 5,054 | 5,365 | ||||||||||
| 43,954 | 54,423 | 49,443 | |||||||||||
| Equity Attributed to Company Stockholders | 122,307 | 116,416 | 120,992 | ||||||||||
| Total Liabilities and Equity | 312,988 | 269,057 | 297,257 | ||||||||||
B - 19
| 1. | Reporting and Loss | ||
| Below is the company balance sheet for the nine months ending on 9.30.2010 (unaudited), the nine months ending on 9.30.2009, and for the year ending 12.31.2009 (audited, in thousands of NIS) |
| For 9 months ending Sep. 30 | For year ending Dec. 31 | |||||||||||||
| 2010 | 2009 | 2009 | ||||||||||||
| Sales revenues | 283,396 | 283,353 | 383,049 | |||||||||||
| Cost of sales | 249,782 | 245,515 | 328,997 | |||||||||||
| Gross profit | 33,614 | 37,838 | 54,052 | |||||||||||
Sales and marketing expenditures | 18,287 | 16,648 | 22,671 | |||||||||||
Management and general expenditures | 14,218 | 14,281 | 18,985 | |||||||||||
Other expenditures (revenues), net | – | – | 500 | |||||||||||
| Operational profit (loss) | 1,109 | 6,909 | 12,896 | |||||||||||
| Profit from realization of fixed assets | 91 | 41 | (67 | ) | ||||||||||
| Financing expenditures | (1,557 | ) | (3,257 | ) | (3,488 | ) | ||||||||
| Financing revenues | 1,425 | 317 | 424 | |||||||||||
| Share in profit of associated company | 36 | 88 | 189 | |||||||||||
| Profit (loss) before taxes on revenue | 1,104 | 4,098 | 9,954 | |||||||||||
| Tax benefits | 34 | 182 | 1,333 | |||||||||||
Net profit (loss) attributed to company stockholders | 1,070 | 4,280 | 8,621 | |||||||||||
| (Audited), in thousands of NIS: | ||||||||||||||
B - 20
| 1. | Methodology of the Valuation | |||
| The valuation was conducted in accordance with standard guidelines and definitions of utility value. | ||||
| The valuation of company activity is based on a basic assumption that the company is an ongoing concern that will continue operating in its current format for an infinite period of activity. The valuation of company activity was conducted according to the method of capitalization of unleveraged cash flow. The forecast cash flow is derived from the company’s profit forecast. | ||||
The cash flows will be capitalized at a capital price that matches the risk level of company activity5. The value received is the economic value of company activity. The economic value of the activity is not dependent on the makeup of the capital of the activity. In other words, it is not dependent on the manner the company is financed, whether by equity or foreign capital. | ||||
| 2. | Specific Methodological Comments | |||
| The valuation is based, among other things, on company forecasts for the years 2010 and 2011, and on estimations and forecasts for the following years, which reflect our estimation of various parameters, taking into consideration the information that was at our disposal. | ||||
| For the purpose of the valuation, the company cash flows were capitalized according to the relevant capitalization rate. Estimation of the residual value, after the 5 years of the forecast, was estimated through use of the formula of the Gordon model, and is based on the capital price and permanent growth rate. The representative year for the purpose of figuring the residual value is the year 2016. | ||||
| 3. | Cash Flow Forecast | |||
| Below is a detailing of all the assumptions that were used in the building of a company cash flow forecast model: | ||||
| 3.1 | Revenues | |||
| The company budget for 2011 foresees a rise in revenues of roughly 18%. This budget, which was conducted by the company management and approved by the company directorate, assumes that the growth forecast is realistic due to a number of factors: | ||||
| ● | A rise in prices of roughly 13%, which the company intends to implement starting in the fourth quarter of 2010, and which was decided upon in a company board of directors meeting. The price raise that the company foresees is part of an industry-wide trend and is a result of higher-priced raw materials |
| 5 | The cash flows are continuous and are received during the course of the entire year, and on average, the flow for a year’s activity is received in the middle of the year. Therefore, the period of capitalization is adjusted to the date of reception of the average flow. See also the description below, in the section relating to the capitalization rate. | ||
B - 21
| ● | Growth in the quantity of cardboard that will be sold of approximately 4%, in line with the forecast growth in Israeli GDP | ||||
| ● | Acquisition of a modern machine for processing and printing that is expected to increase production output (and meet demand in peak months), and also to expand the company’s product line to premium products that are sold at higher prices than basic products | ||||
| To be conservative, in the cash flow forecast we assumed that the expected price raise at the company would harm its sales capacity, and that the company revenues in 2011 would grow at a rate of only 6%. For the rest of the years of the forecast, we assumed a rise of about 3% in company revenues each year, based on assumptions of the company management regarding the rate of market growth. In this context it should be noted that the company possesses production capacity that is currently not fully exploited, and it is capable of producing the quantities of products derived from the forecast with no increase in production capacity. |
| 3.2. | Cost of Sales | |||||
| For 2011, our estimates were based on the company management’s budget, and reflect a cost of sales sold equaling 86.8%-87.7% of adjusted revenues. Based on the data received from the company management, according to which the component of fixed costs in the cost of sales represents 30% of the total cost, and based on the assumption that the effects of the optimization process that the company is implementing will continue (and similarly for the reorganization process at Tri-wall), we assumed a minimal improvement (roughly 1%) in the company’s cost of goods sold for the entire forecast period. Thus the cost of goods sold in a representative year will stand at 85.6% of revenues. | ||||||
| 3.3 | Selling, marketing, general and administrative expenses | |||||
| For 2011, our estimates were based on the company management’s budget, and reflect the cost of sales, management, and general expenditures at a level of 9.7% of revenues. For the years 2012-2015, it was assumed that due to the character of the expenditures and their significant fixed component, the rate of growth in expenditures would represent half the growth rate of sales, such that the rate of sales expenditures would be as represented in the following table: | ||||||
| 2010 | 2011 | 2012 | 2013 | 2014 | 2015 | |||||||||||||||
| Year | Q4 | Year 1 | Year 2 | Year 3 | Year 4 | Year 5 | ||||||||||||||
| Percentage of expenditures out of total sales | 9.7 | % | 9.6 | % | 9.5 | % | 9.3 | % | 9.2 | % | 9.1 | % | ||||||||
B - 22
| 3.4. | Tax | ||||
| Even though according to standard guidelines tax should not be included in the cash flow forecast, in practice, and in accordance with the explanations accompanying the standard, tax effects can be included in the cash flow as long as the capitalization rate is adjusted for this. | |||||
| The tax rates that were used for calculating tax expenditures in the model are in accordance with the updated statutory tax rate expected in Israel in the years of the forecast, in accordance with the decision of the government of Israel of July 2009 (the economic optimization program). In the representative year, the tax rate has been set in accordance with the tax rate over the long term – 18%: | |||||
| 2010 | 2011 | 2012 | 2013 | 2014 | 2015 | |||||||||||||||
| Year | Q4 | Year 1 | Year 2 | Year 3 | Year 4 | Year 5 | ||||||||||||||
| Tax Rate | 25.0 | % | 24.0 | % | 23.0 | % | 22.0 | % | 21.0 | % | 20.0 | % | ||||||||
| 3.5. | Working Capital | ||||
| The company’s working capital includes customers, debtors, and debt and inventory balances, minus liabilities to suppliers and service providers, creditors, and credit balances. | |||||
| Following is a calculation of working capital for the years 2008-2009 and up to 9.30.2010, in thousands of NIS: | |||||
| Working Capital | 9.30.2010 | 2009 | 2008 | ||||||||
| Customers, Net | 158,278 | 161,037 | 164,563 | ||||||||
| Debtors and debt balances | 3,904 | 5,556 | 3,015 | ||||||||
| Inventory | 60,979 | 47,245 | 60,935 | ||||||||
| With deduction | |||||||||||
| Liabilities to suppliers and service providers | (91,661 | ) | (88,902 | ) | (84,220 | ) | |||||
| Creditors and credit balances | (13,232 | ) | (15,217 | ) | (18,404 | ) | |||||
| Net working capital | 118,268 | 109,719 | 125,889 | ||||||||
| Percentage of sales (for assumed annual sales) | 31.3 | % | 28.6 | % | 30.1 | % | |||||
According to the 2011 company budget, the rate of working capital will stand at 28.6% of revenues (similar to the results of 2009)6. Therefore, in 2011, we applied the updated company budget recommendations in regard to the rate of working capital. For the rest of the model period, we assumed that the percentage of revenues represented by working capital would remain unchanged. | |||||
| 3.6. | Depreciation and Investments | ||||
| In accordance with clarifications received from the company management, the majority of fixed assets is represented by machinery and equipment with an expected economic life lasting many decades. In financial reports, this equipment depreciates significantly over short terms (about 10 years), and therefore there is a significant gap between the need for additional investment and the amount of periodic depreciation. Also, during 2010, the company invested significantly in equipment (approximately 31 million NIS, representing roughly 60% of the net fixed assets of the company before the purchase). Therefore, the company does not foresee significant investments in equipment over the next few years. It has been assumed that the company will invest roughly 5 million NIS annually for fixed assets, in 2011 and in the forecast period (representing on average about half of the depreciation for that period). For a representative year it has been assumed that the level of investment will equal the level of annual depreciation. | |||||
| 6 | It should be noted that the company budget for 2011 set a rate of working capital of 31.3% of revenues. The company was directed by the parent company to meet a budgetary target for 2011 of a ratio of working capital at a rate of 28%, comparable to the ratio in 2009. The company accepted the directive from Hadera Paper, and the budget was adjusted. | ||
B - 23
| 3.7. | Summary of the Assumptions for the Cash Flow Forecast Model | ||||
| The following table summarizes the assumptions for the company cash flow forecast model: | |||||
| Represent | ||||||||||||||||||||||||||||
| Explanation | ative year | 2015F | 2014F | 2013F | 2012F | 2011B | 2010A* | 2009A | ||||||||||||||||||||
| See section 3.1 above | 2.5 | % | 3.0 | % | 3.0 | % | 3.0 | % | 3.0 | % | 6.0 | % | 3.7 | % | Rate of revenue growth (%) | |||||||||||||
| See section 3.2 above | 85.6 | % | 85.6 | % | 85.9 | % | 86.2 | % | 86.5 | % | 86.8 | % | 88.0 | % | 85.9 | % | Cost of goods sold (% of revenue) | |||||||||||
| 14.4 | % | 14.4 | % | 14.1 | % | 13.8 | % | 13.5 | % | 13.2 | % | 12.0 | % | 14.1 | % | Gross profit (% of revenue) | ||||||||||||
| See section 3.3 above | 9.0 | % | 9.0 | % | 9.2 | % | 9.3 | % | 9.4 | % | 9.6 | % | 10.9 | % | 10.9 | % | Management and general (% of revenue) | |||||||||||
Improvement in operating profit as a result of: (1) Improvement of gross profit; (2) Fixed component of management and general costs | 5.3 | % | 5.3 | % | 4.9 | % | 4.5 | % | 4.0 | % | 3.6 | % | 1.0 | % | 3.3 | % | operating profit (% of revenue) | |||||||||||
depreciation model based on fixed assets and investments | 5,000 | 6,200 | 13,900 | 13,700 | 16,300 | 16,900 | 13,600 | 16,700 | depreciation | |||||||||||||||||||
| See section 3.6 above | 5,000 | 5,000 | 5,000 | 5,000 | 5,000 | 5,000 | 31,400 | 7,200 | investment | |||||||||||||||||||
| See section 3.5 above | 28.6 | % | 28.6 | % | 28.6 | % | 28.6 | % | 28.6 | % | 28.6 | % | 31.3 | % | 28.6 | % | working capital | |||||||||||
| Based on actual data of the first three quarters, and the company’s forecast for Q4 2010 | |||||
| As can be seen in the above summary table, the cash flow forecast model is based mostly on the 2011 company budget (except for the forecast of growth and investment), a budget that assumes higher profitability than that presented by the company in 2010 financial reports. | |||||
| On the basis of conversations with the company management regarding ongoing company operations and its long-term plans, and after extensive examinations of company outcomes in recent years, the nature of the market for such activity, and outcomes of similar companies in Israel and abroad, we became convinced that the company outcomes in 2010 do not reflect the company’s profitability potential, and that the company budget for 2011 represents a representative index for future profitability potential of the company. This was due to a number of central reasons: | |||||
| ● | 2010 was characterized by a significant rise in the cost of raw materials used by the company, which form a good part its cost of goods sold. For the third quarter of 2010, the company began raising its products’ sale prices in order to shift the raw material cost rise to the company’s customers, as is accepted industry practice. This trend, which is expected to continue in 2011, and which was approved at a meeting of the company board of directors, in part of an industry-wide trend. | ||||
B - 24
| ● | The company initiated optimization processes with the goal of lowering costs of goods sold, and general and management expenditures, and also of improving the company’s operational profit. Also, the company initiated a significant reorganization process in Tri-wall activities (specified above), with the goal of bringing the activity of the packaging, sheeting, and boxes sector to positive operational profitability. | ||||
| ● | The company recently carried out a large investment in equipment (specified above) that is expected to expand company production capability in general, and in peak months in particular, and it is also expected to develop the premium product market for the company, which is characterized by high profitability rates. | ||||
| Despite the above, to be conservative in the cash flow forecast, we have chosen to significantly lower the rate of revenue growth that the company expects for 2011 (from 18% to 6%), and also to significantly increase the forecast company investments for 2011, thus changing the forecast (from roughly 1 million NIS to about 5 million NIS). | |||||
| 3.8. | Following is the company cash flow forecast for the period 2010Q4-2015 (in millions of NIS): | ||||
| 2009 | 2010 | 2010 | 2010 | 2011 | 2012 | 2013 | 2014 | 2015 | ||||||||||||||||||||||
| Q1-Q4 | Q1-Q3 | 2010E | Q4E | Year | Year | Year | Year | Year | Representative | |||||||||||||||||||||
| Year | 1 | 2 | 3 | 4 | 5 | year | ||||||||||||||||||||||||
| Sales | 383.0 | 283.4 | 397.4 | 114.0 | 421.2 | 433.9 | 446.9 | 460.3 | 474.1 | 486.0 | ||||||||||||||||||||
| cost of goods sold | 329.0 | 249.8 | 349.8 | 100.0 | 365.7 | 375.4 | 385.3 | 395.5 | 405.9 | 415.8 | ||||||||||||||||||||
| gross profit | 54.0 | 33.6 | 47.6 | 14.0 | 55.6 | 58.5 | 61.6 | 64.8 | 68.2 | 70.1 | ||||||||||||||||||||
| Sales management and general | 41.6 | 32.5 | 43.5 | 11.0 | 40.4 | 41.0 | 41.7 | 42.3 | 42.9 | 43.5 | ||||||||||||||||||||
| operating profit | 12.8 | 1.1 | 4.1 | 3.0 | 15.1 | 17.5 | 20.0 | 22.6 | 25.3 | 25.9 | ||||||||||||||||||||
| tax payment | (0.8 | ) | (3.6 | ) | (4.0 | ) | (4.4 | ) | (4.7 | ) | (5.1 | ) | (4.7 | ) | ||||||||||||||||
| operating profit after tax | 2.3 | 11.5 | 13.5 | 15.6 | 17.8 | 20.2 | 21.3 | |||||||||||||||||||||||
| depreciation | 16.7 | 10.2 | 13.6 | 3.4 | 16.9 | 16.3 | 13.7 | 13.9 | 6.2 | 5.0 | ||||||||||||||||||||
| investment | (7.2 | ) | (31.4 | ) | (32.7 | ) | (1.3 | ) | (5.0 | ) | (5.0 | ) | (5.0 | ) | (5.0 | ) | (5.0 | ) | (5.0 | ) | ||||||||||
changes in working capital | (6.1 | ) | 3.9 | (3.6 | ) | (3.7 | ) | (3.8 | ) | (3.9 | ) | (3.4 | ) | |||||||||||||||||
| FCF | (1.7 | ) | 27.3 | 21.2 | 20.6 | 22.8 | 17.4 | 238.3 | ||||||||||||||||||||||
| 0.125 | 0.750 | 1.750 | 2.750 | 3.750 | 4.750 | 4.750 | ||||||||||||||||||||||||
| flow to capitalization | (1.7 | ) | 25.4 | 17.9 | 15.8 | 16.0 | 11.1 | 151.5 | ||||||||||||||||||||||
| 4. | Cost of Capital | ||||
| In accordance with the guidelines of the standard, the rate of capitalization needs to be the discount rate before taxes that reflects the ongoing market estimates of: | |||||
| A. The money’s time value. | |||||
| B. The specific risks due to which the cash flows have been adjusted. | |||||
| Nevertheless, even though according to the standard’s guidelines before-tax capitalization rates should be used, in practice, and in accordance with explanations accompanying the standard, the outcome of the calculation that will be obtained from flow capitalization before taxes at a suitable discount rate before taxes, needs to be identical with the outcome to be obtained from flow capitalization after taxes and use of a suitable discount rate after taxes. For these reasons, we have chosen to execute our calculations on the basis of after-tax flows while using the after-tax discount rate. In the valuation model we assumed a weighted cost of capital (WACC) of 10%. | |||||
B - 25
| The cost of capitalization reflects, among other things, the commercial-operational risk in the company’s activities. Part of the above risk is the risk stemming from the nature of the industry in which the company operates, and part of the risk stems from the company’s particular characteristics. | |||||
| The normative costs of capitalization accepted in the market for various industries (based on professional literature and other public information, including valuations of public corporations, as well as the professional experience of Giza Singer Even in the field) generally range between 6%, for net cash flows of real estate holdings with yields, and 8-10% for companies with relatively low expected commercial-operational fluctuations (such as Osem, Shufersal, etc.). Costs of capital for relatively wealthy hi-tech firms and for companies characterized by relatively high expected commercial-operational fluctuations range between 11-15%. Costs of capital of over 15% are characteristic of, mostly, hi-tech firms in early stages of development, and companies that operate in riskier fields. Additionally, to the normative industry capitalization rates will be added the premium for specific risks for each company. | |||||
| The cost of capital for Carmel is set on the basis of our experience and professional judgment, as well as on the capitalization rates accepted in our firm for systematic commercial-operational risk for operational cash flows in similar industries, and in addition, on the basis of the commercial-operational risk specific to the company’s and industry’s activities, and on the fact that the company functions in an especially competitive market characterized by a multiplicity of competitors. | |||||
| Based on our experience and professional judgment, along with adjustments stemming from our estimation of the company’s exposure to industry risks and macroeconomic risks, we evaluated the company’s weighted cost of capital in the range of 10%. | |||||
As a complementary check for the purpose of estimating the company’s cost of capital, an estimation was done of the weighted cost of capital, the WACC (while using the CAPM model to calculate cost of equity), while comparing to similar public companies. The weighted cost of capital that was obtained from this estimation is roughly 9.2%, calculated as follows: | |||||
| Parameter | Value | Comment | ||||||
| Risk-free interest | 2.80 | % | 1 | |||||
| Beta | 1.41 | 2 | ||||||
| Market premium | 6.7 | % | 3 | |||||
| Cost of company equity | 12.27 | % | ||||||
| Cost of debt | 5.0 | % | 4 | |||||
| Tax rate | 18.0 | % | 5 | |||||
| D/V | 38 | % | ||||||
| WACC | 9.2 | % | ||||||
| Comments regarding the table: | ||||
| 1. | The rate of real return on multiyear redemption of Israel government bonds is linked to the CPI for a 30-year period. | |||
B - 26
| 2. | In order to determine the beta of the company, we examined a group of similar companies. With respect to the different levels of beta of the chosen companies, the updated datum appears in the table. | ||||
| 3. | For the purpose of estimating this rate, we took the average gap between annual return of the general stock market index of the Tel Aviv stock exchange, and the economy’s risk-free interest. | ||||
| 4. | In accordance with the level of interest the company pays on long-term loans. | ||||
| 5. | The long-term tax rate in the State of Israel. | ||||
| 5. | Long-term Growth | ||||
| The company’s permanent rate of growth that we assumed in the model is 2.5%. This rate was determined through consideration of the growth rates of the population and GDP, which represent indicators for the growth rate of products the company manufactures and sells. | |||||
| 6. | Summary of the Value of Operation | ||||
Following all of the assumptions specified above, the derived utility value is roughly 236 million NIS. Since the utility value that was obtained does not indicate a need for devaluation, we will not examine the net sale price value of the unit, and the returnable valuation was thus determined based on utility value alone. | |||||
For this utility value, we conducted a number of sensitivity tests, relating to various parameters as detailed in the following tables: | |||||
| A. | Analysis of sensitivity to cost of capital and permanent rate of growth, in thousands of NIS: | ||||
| Long-term Growth | ||||||||||||||||||||
| 236.0 | 2.00% | 2.25% | 2.50% | 2.75% | 3.00% | |||||||||||||||
| 9.50 | % | 245.3 | 248.2 | 251.4 | 254.7 | 258.4 | ||||||||||||||
| 9.75 | % | 238.0 | 240.6 | 243.4 | 246.5 | 249.7 | ||||||||||||||
| Capitalization | 10.00 | % | 231.1 | 233.5 | 236.0 | 238.7 | 241.6 | |||||||||||||
| 10.25 | % | 224.7 | 226.8 | 229.1 | 231.5 | 234.1 | ||||||||||||||
| 10.50 | % | 218.6 | 220.6 | 222.6 | 224.8 | 227.1 | ||||||||||||||
| B. | Analysis of sensitivity to changes in cost of capital and rate of growth in 2011, in thousands of NIS: |
| Growth in 2011 | ||||||||||||||||||||
| 236.0 | 2.00% | 6.00% | 10.00% | 12.00% | 18.00% | |||||||||||||||
| 9.50 | % | 247.5 | 251.4 | 255.2 | 257.2 | 262.9 | ||||||||||||||
| 9.75 | % | 239.9 | 243.4 | 247.0 | 248.8 | 254.2 | ||||||||||||||
| Capitalization | 10.00 | % | 232.7 | 236.0 | 239.4 | 241.0 | 246.0 | |||||||||||||
| 10.25 | % | 226.1 | 229.1 | 232.2 | 233.7 | 238.3 | ||||||||||||||
| 10.50 | % | 219.8 | 222.6 | 225.4 | 226.9 | 231.1 | ||||||||||||||
B - 27
| APPENDIX A | ||
| Appendix to the valuation for impairment testing dated 7/11/2010 |
| 1. | On November 7, 2010, we evaluated the operations of Carmel Container Systems Ltd. (hereinafter: “Carmel” and/or “the Company”) as on September 30, 2010, in relation to a test for impairment of the Company’s goodwill for its parent company, Hadera Paper Ltd. (hereinafter: “Hadera Paper”). The value of Carmel’s operations determined in the aforesaid valuation is NIS 236.04 million (hereinafter: “the Valuation”). | ||
| 2. | The surplus value of Carmel’s net financial liabilities as on September 30, 2010 was approximately NIS 77.63 million. | ||
| 3. | Accordingly, the value of the equity deriving from the value of the operations determined in the valuation as aforesaid is approximately NIS 158.41 million, as follows: |
| NIS millions | |
| Value of the Company’s operations | 236.04 |
| Less | |
| Net financial liabilities | 77.63 |
| Equals | |
| Eq uity value | 158.41 |
| 4. | It should be noted that, according to Hadera Paper’s declaration dated February 3, 2011, no material events relating to the Company transpired since the date of the valuation. |
| Sincerely, | |||
| |||
| Giza Singer Even | |||
| Date: February 13, 2011 |
| APPENDIX B | ||
| Comparison with valuations from previous years |
| 1. | On November 7, 2010, we evaluated the operations of Carmel Container Systems Ltd. (hereinafter: “Carmel” and/or “the Company”) as on September 30, 2010, in relation to a test for impairment of the Company’s goodwill for its parent company, Hadera Paper Ltd. (hereinafter: “Hadera Paper”). The value of Carmel’s operations determined in the aforesaid valuation is NIS 236.04 million (hereinafter: “the Valuation”). | ||
| 2. | It should be noted that Giza Singer Even (hereinafter: “Giza”) had prepared a number of economic analyses concerning the Company in recent years, including a test for impairment for the purposes of financial statements of previous years, as follows: |
| Valuation of Carmel’s operations (in NIS millions) | ||
| Date | 30.9.2010 | 30.9.2009 |
| Subject of the Work | Goodwill impairment | Goodwill impairment |
| test | test | |
| Methodology | DCF | DCF |
| Value | 236.04 | 229.5 |
| Following are those factors that led to the rise in the Company’s value compared with the previous valuation: | |||||
● | The Company invested heavily in the purchase of a modern manufacturing machine which: | ||||
| O | should increase production capacity efficiency and improve product quality; | ||||
| O | shall manufacture products that are expected to be sold at premium prices; | ||||
| O | furthermore, in light of the heavy investment in 2010, the Company’s future investments are expected to diminish. | ||||
| ● | The Company implemented processes to increase efficiency, the aims being to reduce selling costs and operating expenses. The Company also implemented a significant reorganization process in the operations of the subsidiary, Tri-Wall, which, according to the assessment of the Company’s Management, is expected to lead the packaging segment operations to positive operating profitability. | ||||
| ● | The Company is expecting a process of price increases, the aim being to compensate for the rise in the raw materials prices, with the objective of sustaining and improving the Company’s gross profitability. | ||||
| ● | The forecasted improvement in the economic situation in Israel and gradual extrication from the global recession, which affected the Company’s results between 2008 and 2010. | ||||
| Sincerely, | |||
| |||
| Giza Singer Even | |||
| Date: February 23, 2011 |
2
Appendix C
Conducting an impairment testing for the assets
of the packaging paper business under the
provisions of IAS 36
C - 1
An impairment test for the assets of Hadera Paper – Packaging Paper and Recycling Ltd (hereinafter – "Hadera Paper Packaging") at December 31, 2010, was conducted at the Company's request, for the purposes of financial reporting as of that date. The testing below was conducted in accordance with the guidelines of International Accounting Standard (IAS) 36 "Impairment of Assets".
The Enterprise Value (EV) of Hadera Paper Packaging as of December 31, 2010 was estimated at NIS 887-975 million compared to the value of net operating assets on the balance sheet of Hadera Paper Packaging at that date, in the amount of NIS 736 million.
The EV of Hadera Paper Packaging was derived from the complete valuation pertaining to the economic value of Hadera Paper, including a description of its operation, the business environment, financial analysis and Discount Cash Flow (DCF) methodology, etc. The above valuation is based on the valuation of Hadera Paper on a consolidated basis17 and does not determine the EV of Hadera Paper as an independent business unit.
For convenience purposes, the assumptions used in determining the enterprise value of Hadera Paper Packaging include all the relevant assumptions, even if they were included in the valuation of Hadera Paper, as follows:
Revenues and profitability
| - | The production capacity of Hadera Paper Packaging in 2011 will increase to 309,000 tons and from 2012 it will stabilize at 320,000 ton packaging paper per annum, compared to 160,000 ton in 2009 and 270,000 in 2010, in which Machine 8 became operational on June 1, 2010; |
| - | Sales of packaging paper to the domestic market in quantitative terms will grow by 3% per annum during the forecast period and by 1.5% in the long term; the company's market share will gradually increase from 38% in 2010 to 60% in 2014 and thereafter, while surplus production will be directed to exports. Exports in quantitative terms will gradually decline during the forecast period from 45% in 2011 to 18% in the long term; |
17 Net of Hadera Paper Printing, Carmel and Frenkel
C - 2
| - | The price of packaging paper in Israel in 2011 will be 10% higher than the average price in 2010, similar to the actual selling price at the end of 2010. The average price will increase 3% in 2012 and 1% per annum in 2013-2014 and in 2015 and thereafter there will be no change in the selling price. These assumptions reflect a slow economic improvement relative to the situation in the sector in the last quarter of 2010; |
| - | The price of exported packaging paper in 2011 will be 18% higher than the average price in 2010, and similar to the actual selling price late in 2010. The average price will increase 3% in 2012, stabilizing at this level from 2013. These assumptions reflect a slow economic improvement relative to the situation in the sector in the last quarter of 2010; |
| - | It was assumed that the cost of materials for a ton of packaging paper will increase by 8% in 2011 relative to 2010 due to the need to supplement raw materials through imports, and will decline by 5% in 2012 following a reduction in waste paper imports. The cost of materials will remain unchanged in 2013 and thereafter. |
| - | It was assumed that other variable production costs account for 83% of total other production costs. It was also assumed that the other variable production costs will increase by 7% in 2011-2012 and will remained unchanged during the remaining forecast period. Other fixed production costs will grow by 5% per annum in 2011-2012 and during the remaining forecast period will grow by 1.5% per annum. The increase in other production costs reflects expectations for the rise in natural gas prices, which is used in the generation of energy by Hadera Paper Infrastructures; |
| - | The cost of production manpower will increase by 6% in 2011, by 3% per annum in 2012-2013 and by 1.5% per annum in 2014 and thereafter; |
| - | It was assumed that selling and marketing expenses will represent 4% of revenues, similar to the percentage of these expenses in 2010; |
| - | It was assumed that administrative and general expenses will increase by 1.5% per annum during the forecast period, compared to stability in these expenses in 2010 relative to 2009; |
| - | It was assumed that the contribution for Hadera Paper Packaging from the agreement with Clal P.V., as stated in section 3(a)(f) will amount to NIS 0.3 million per annum as of 2012. This contribution was deducted from the company's administrative and general expenses; |
C - 3
The table below is a summary of the business forecast for Hadera Paper Packaging:
| 2009 | *2010 | 2011 | 2012 | 2013 | 2014 | 2015 | 2016 | 2017 | Typical year | |||||||||||||||||||||||||||||||
| Actual | Forecast | |||||||||||||||||||||||||||||||||||||||
| NIS million | ||||||||||||||||||||||||||||||||||||||||
| Revenues | 211 | 367 | 588 | 633 | 645 | 656 | 659 | 662 | 664 | 666 | ||||||||||||||||||||||||||||||
| Cost of revenue | 232 | 342 | 518 | 534 | 535 | 536 | 538 | 539 | 540 | 541 | ||||||||||||||||||||||||||||||
| Gross profit | (21 | ) | 25 | 70 | 99 | 110 | 120 | 121 | 123 | 124 | 125 | |||||||||||||||||||||||||||||
| Selling & marketing | 8 | 15 | 24 | 26 | 26 | 27 | 27 | 27 | 27 | 27 | ||||||||||||||||||||||||||||||
| Administrative & general | 6 | 6 | 6 | 6 | 7 | 7 | 7 | 7 | 7 | 7 | ||||||||||||||||||||||||||||||
| Operating profit | (35 | ) | 4 | 39 | 66 | 77 | 87 | 88 | 89 | 90 | 91 | |||||||||||||||||||||||||||||
| * 2010 results are net of the testing results for Machine 8, which were capitalized to fixed assets | ||||||||||||||||||||||||||||||||||||||||
Taxation
Due to the absence of approved investment plans and other tax benefits, other than accelerated depreciation for tax purposes of the investment in Machine 8, as stated in section 3(a)(1) of the opinion, based on past experience, it was assumed that the effective tax rate for Hadera Paper during the forecast period will be identical to the statutory tax rate. Regarding the method of determining the tax rate in the forecast period, see section 2(b) of the opinion.
The economic benefit from the accelerated depreciation for tax purposes of the investment in Machine 8 stems from two factors: postponement of tax payments to later years, even if the tax rate had not been reduced, and economic benefit from the reduction of corporate tax from 24% in 2010 to 18% in 2016, while in the first few years the company will not be subject to a tax rate as high as that of the next few years. For the purpose of assessing the value of this benefit an estimated cash flow was calculated for the loss utilization period and for the period in which the profit for tax purposes will exceed the profit recorded in the books ("the reversal period") and was discounted as of the valuation date. The value of the tax benefit from the accelerated depreciation of equipment for tax purposes is estimated at NS 29 million.
C - 4
Investments and depreciation
It was assumed that once Machine 8 becomes operational, the level of investment of Hadera Paper Packaging during the forecast period will be NIS 14 million and in the representative year will be NIS 36 million, equal to the amount of depreciation.
The amount of depreciation and amortization during the forecast period is expected to be NIS 36 million.
In order to reflect the company's assessment that in the first twenty years of the life of Machine 8, the capital investment in this machine will be lower than the amount of depreciation in respect thereof, it was assumed that the difference between the investments and the depreciation will continue after the eighth year of the forecast (the representative year), where it was assumed that investments will match depreciation. In light of this, the excess of depreciation over capital expenditures was calculated for the years 2018-2027 under the assumption that the difference between depreciation and investment in 2017 will decrease each year by NIS 2 million down to zero in 2028. The excess of depreciation over capital expenditures during this period is discounted as of the date of valuation and estimated at NIS 41 million.
Working capital
It was assumed that in 2011 Hadera Paper Packaging will need an operating working capital of 20% of revenues, similar to the working capital as a percentage of revenues in 2010 – which was 19%. In subsequent years the percentage of working capital will increase to 23% of revenues as a result of diverting sales from exports to the local market, which will require extending higher credit to customers.
Weighted Average Cost of Capital (WACC) and Long-term growth rate
A real cost of capital was determined at 9.25%-9.75% per annum and 9.5% on average. The average cost of capital represents the following assumptions: cost of equity of 12% per annum, cost of debt of 5% per annum, tax rate of 18% per annum and financial leverage of 35%.
C - 5
The cost of equity of 12% per annum was calculated using the CAPM model as stated in section 2(b) above. It was assumed that the long-term risk-free interest rate is 2.7% a year, the long-term risk premium of the market is 7-9% a year and the beta coefficient of the company is 1.1-1.25. The range of the beta coefficient was derived from the accepted beta coefficients in the paper, wood and packaging industry18.
The risk-free cost of capital in the model, 2.7% per annum, was derived from the yield to maturity of CPI-linked bonds of the Israeli government for periods above 10 years on December 31, 2010. The cost of debt of Hadera Paper in the model was determined as the risk-free cost of capital with the addition the company's risk premium. The risk premium was determined as the difference on the valuation date between the yield-to-maturity of corporate bonds with a similar rating to that of the company's bonds and the yield to maturity of CPI-linked bonds of the Israeli government with a similar duration.
Regarding the method of determining the risk-free cost of capital and the cost of debt of the company, see section 2(b) in the above opinion.
It was assumed that the Free Cash Flow (FCF) of Hadera Paper would grow in the long term at a rate of 1.25%-1.75% per annum with an average of 1.5% per annum, similar to the growth rate of the population. This is under the assumption that technological enhancements, use of Machine 1 for the manufacture of packaging paper and the increase in the turnover of domestic sales will enable production capacity to grow at this rate in the long term without capital expenditures in excess of depreciation.
18 See list of beta coefficients by Aswath Damodaran
http://pages.stern.nyu.edu/~adamodar/New_Home_Page/datafile/Betas.html
C - 6
Below is the method of calculating the EV of Hadera Paper Packaging
| 2011 | 2012 | 2013 | 2014 | 2015 | 2016 | 2017 | Typical year | |||||||||||||||||||||||||
| Forecast | ||||||||||||||||||||||||||||||||
| NIS million | ||||||||||||||||||||||||||||||||
| Packaging operating profit | 39 | 66 | 77 | 87 | 88 | 89 | 90 | 91 | ||||||||||||||||||||||||
| Tax rate | 24 | % | 23 | % | 22 | % | 21 | % | 20 | % | 18 | % | 18 | % | 18 | % | ||||||||||||||||
| Tax | 9 | 15 | 17 | 18 | 18 | 16 | 16 | 16 | ||||||||||||||||||||||||
| Operating profit after tax | 30 | 51 | 60 | 68 | 70 | 73 | 74 | 74 | ||||||||||||||||||||||||
| Depreciation | 35 | 35 | 35 | 35 | 35 | 35 | 35 | 35 | ||||||||||||||||||||||||
| Investment in fixed assets | (14 | ) | (14 | ) | (14 | ) | (14 | ) | (14 | ) | (14 | ) | (14 | ) | (35 | ) | ||||||||||||||||
| Changes in working capital | (34 | ) | (12 | ) | (6 | ) | (6 | ) | (4 | ) | (4 | ) | (1 | ) | (0 | ) | ||||||||||||||||
| Free cash flow | 17 | 60 | 75 | 84 | 87 | 90 | 94 | 74 | ||||||||||||||||||||||||
| Discounted cash flow | 16 | 52 | 60 | 61 | 58 | 55 | 52 | |||||||||||||||||||||||||
| Excess depreciation over capital expenditure | 61 | |||||||||||||||||||||||||||||||
| Residual value | 513 | |||||||||||||||||||||||||||||||
| High | Low | |||||||
| value | value | |||||||
| NIS million | ||||||||
| Calculation assumptions | ||||||||
| Weighted average cost of capital | 9.25 | % | 9.75 | % | ||||
| Long-term growth rate (g) | 1.75 | % | 1.25 | % | ||||
| Model results | ||||||||
| EV of Hadera Paper Packaging | 975 | 887 | ||||||
| Long-term real growth rate (g) | ||||||||||||||||||||||||||||||||
| 2.25% | 2.00% | 1.75% | 1.50% | 1.25% | 1.00% | 0.75% | ||||||||||||||||||||||||||
Weighted average cost of capital for discounting cash flows | 8.50 | % | 1,129 | 1,102 | 1,077 | 1,054 | 1,033 | 1,013 | 994 | |||||||||||||||||||||||
| 8.75 | % | 1,088 | 1,063 | 1,041 | 1,020 | 1,000 | 982 | 964 | ||||||||||||||||||||||||
| 9.00 | % | 1,050 | 1,028 | 1,007 | 987 | 969 | 952 | 936 | ||||||||||||||||||||||||
| 9.25 | % | 1,015 | 994 | 975 | 957 | 940 | 924 | 910 | ||||||||||||||||||||||||
| 9.50 | % | 982 | 963 | 945 | 928 | 913 | 898 | 885 | ||||||||||||||||||||||||
| 9.75 | % | 951 | 933 | 917 | 902 | 887 | 874 | 861 | ||||||||||||||||||||||||
| 10.00 | % | 922 | 906 | 891 | 876 | 863 | 850 | 838 | ||||||||||||||||||||||||
| 10.25 | % | 894 | 880 | 866 | 852 | 840 | 828 | 817 | ||||||||||||||||||||||||
| 10.50 | % | 869 | 855 | 842 | 830 | 818 | 807 | 797 | ||||||||||||||||||||||||
C - 7
Appendix D
| Additional Information Pursuant to Securities Regulations |
| (Periodic and Immediate Reports), 1970 |
D - 1
The following information is provided in accordance with Securities Regulations (Periodic and Immediate Reports), 1970 (hereinafter: "the regulations") that require disclosure of additional information about a material valuation, as described in section 8b and in Addendum 3 to the regulations.
The following information complements the information disclosed in the above opinion, pursuant to provisions of the regulations:
| 1. | This valuation was commissioned by the VP, Comptroller of CII and Investments Ltd. and by the VP, Finance and Business Development of HADERA PAPER Ltd. on January 25, 2011. |
| 2. | Following below is summarized information regarding Section 8B(9) of the regulations |
| Regulation No. | Information Required in Regulation |
| 8B. (9)(2) | The objective of this valuation is to review the value of the CII holdings in Company shares and the enterprise value (EV) of Hadera Paper Packaging for the purpose of examining the need for impairment in the company’s financial statements, pursuant to provisions of IAS 36 "Asset Impairment", for the purpose of accounting reporting. |
| 8B. (9)(2) | The valuation was prepared as at December 31, 2010 |
| 8B. (9)(3)+(4) | The value of shareholders’ equity of the company as at December 31, 2010 lies in the range between NIS 1,657-1,869 million. The Enterprise Value (EV) of Hadera Paper Packaging lies in the range between NIS 887-975 million, as compared with operating assets, net, in the balance sheets of the company as at that date, in the sum of NIS 736 million. |
| 8B. (9)(5) | This valuation was created by VADIM PORTNOY, CPA of VADIM PORTNOY Business Consulting Ltd. Below are highlights of education and professional experience of the valuator: Undergraduate degree from Hebrew University, Jerusalem in Economics and Accounting (1994), CPA (since 1997), MBA from Hebrew University, Jerusalem (1998). Experience: 13 years in business and economic consulting, including review and compilation of valuations and economic opinions, for companies in the industrial sector, inter alia. My professional experience includes, inter alia, positions with the Israel Securities Authority and with SUARI YUCHMAN Ltd., and as independent consultant since 2004. In recent years, I have provided valuations for companies such as: HENSON Ltd., CARELINE Group, ORMAT Industries Ltd., HADERA PAPER Ltd., CELLCOM Israel Ltd., PAZ Oil Ltd., HOT Communication Systems Ltd., Israel Discount Bank Ltd. etc. Since 2000, I have been delivering course on corporate valuations at the Business School, Hebrew University, Jerusalem. I have no personal interest in shares of the Company and of companies controlled / owned thereby, nor in interested parties in the Company, and there is no dependency between me, the Company, companies controlled / owned there by, and interested parties in the Company, In conjunction with contracting this valuation of HADERA PAPER, my maximum liability for any damage, other than damage incurred by negligence and/or maliciousness and/or intentionally, has been limited to the fee paid for this contract. I have also received from you indemnification for any amount I shall be required to pay to any third party by finalized verdict with respect to preparation of this opinion, as well as for any reasonable legal expenses - unless it would be determined that I have acted negligently and/or maliciously and/or intentionally with regard to this opinion. |
| 8B. (9)(6)+(7) | See Section 3, below. |
D - 2
| 3. | The major business units were valuated using the DCF method as follows: |
| Average value | Valuation method | Average capital cost | Average growth rate | Residual value | |||||||||||||
| NIS in millions | |||||||||||||||||
| Enterprise value (EV) - HADERA PAPER, consolidated* | 1,396 | DCF | 9.5 | % | 1.5 | % | 59 | % | |||||||||
| Value of excess real estate | 74 | Transaction + cost | |||||||||||||||
| Value of holding stake in CARMEL | 160 | Reliance (DCF) | |||||||||||||||
| Value of holding stake in HADERA PAPER PRINTING | 157 | Transaction dated December 31, 2010 | |||||||||||||||
| Liability with respect to MBP | (32 | ) | Reliance | ||||||||||||||
| Value of holding stake in FRENKEL | 19 | Shareholders' equity | |||||||||||||||
| Net financial debt | (922 | ) | Debentures - market cap | ||||||||||||||
| Valuation of HADERA PAPER, consolidated, net | 853 | ||||||||||||||||
| Value of holding stake in HOGLA | 932 | DCF | 10.0 | % | 1.5 | % | 63 | % | |||||||||
| Value of equity, HADERA PAPER | 1,785 | ||||||||||||||||
| Value of stock options to employees | (22 | ) | B&S | ||||||||||||||
| Value of HADERA PAPER to shareholders | 1,763 | ||||||||||||||||
| * Excluding HADERA PAPER PRINTING, CARMEL and FRENKEL. | |||||||||||||||||
D - 3
| 4. | Below is a comparison of Company valuation to market cap, shareholders' equity and value in transaction and most recent valuation compiled by me as of June 30, 2009: |
| Differential between value in model and market cap | ||||||||||||||||
| Market cap | High value | Low value | Average | |||||||||||||
| NIS in millions | ||||||||||||||||
| Company value in valuation | 1,869 | 1,657 | 1,763 | |||||||||||||
| Market cap* of equity during six months prior to effective date | ||||||||||||||||
| Highest | 1,616 | 16 | % | 3 | % | 9 | % | |||||||||
| Lowest | 1,314 | 42 | % | 26 | % | 34 | % | |||||||||
| Average | 1,454 | 29 | % | 14 | % | 21 | % | |||||||||
| Market cap* as of December 31, 2010 | 1,505 | 24 | % | 10 | % | 17 | % | |||||||||
| Shareholders' equity on balance sheet as of December 31, 2010 | 930 | 101 | % | 78 | % | 90 | % | |||||||||
| Value in transaction dated September 30, 2009** | 1,147 | 63 | % | 44 | % | 54 | % | |||||||||
| Value in valuation dated June 30, 2009** | 1,144 | 63 | % | 45 | % | 54 | % | |||||||||
| * Value derived from price of Company share on TEL AVIV Stock Exchange. | ||||||||||||||||
| ** Value in acquisition of 21.45% of Company shares by CII from Discount Investments was determined taking into account the valuation as of June 30, 2009 which was prepared by myself for negotiations between the parties. | ||||||||||||||||
D - 4
| 5. | Below is a comparison between the valuation as of June 30, 2009 and the valuation as of December 31, 2010: |
| Valuation as of June 30, 2009 | Valuation as of December 31, 2010 | Difference in average value | ||||||||||||||||||||||||||||||||||||
Holding stake | Average value | Valuation method | Weighted average capital cost (WACC) | Average growth rate (g) | Holding stake | Average value | Valuation method | Weighted average capital cost (WACC) | Average growth rate (g) | |||||||||||||||||||||||||||||
| NIS in millions | NIS in millions | NIS in millions | ||||||||||||||||||||||||||||||||||||
| Enterprise valuation (EV) - HADERA PAPER, consolidated* | 995 | DCF | 10 | % | 1.5 | % | 1,396 | DCF | 9.5 | % | 1.5 | % | 402 | |||||||||||||||||||||||||
Value of excess real estate | 81 | Assessment + cost | 74 | Transaction + cost | (7 | ) | ||||||||||||||||||||||||||||||||
| Value of holding stake in CARMEL | 89.3 | % | 101 | Shareholders' equity | 100.0 | % | 160 | Reliance | 59 | |||||||||||||||||||||||||||||
| Value of holding stake in HADERA PAPER PRINTING | 49.9 | % | 115 | DCF | 10.0 | % | 1.5 | % | 75.0 | % | 157 | Transaction | 43 | |||||||||||||||||||||||||
| Liability with respect to MBP | (13 | ) | Reliance | (32 | ) | Reliance | (19 | ) | ||||||||||||||||||||||||||||||
| Value of holding stake in FRENKEL | 28.9 | % | 7 | Shareholders' equity | 28.9 | % | 19 | Shareholders' equity | 12 | |||||||||||||||||||||||||||||
| Net liability to complete Machine 8** | (249 | ) | 249 | |||||||||||||||||||||||||||||||||||
| Net financial debt | (819 | ) | (922 | ) | (103 | ) | ||||||||||||||||||||||||||||||||
| Value of HADERA PAPER, December 31, 2010*** | 217 | 853 | 636 | |||||||||||||||||||||||||||||||||||
| Value of holding stake in HOGLA | 49.9 | % | 948 | DCF | 10.5 | % | 1.5 | % | 49.9 | % | 932 | DCF | 10.0 | % | 1.5 | % | (16 | ) | ||||||||||||||||||||
| Value of equity, HADERA PAPER | 1,165 | 1,785 | 620 | |||||||||||||||||||||||||||||||||||
| Value of stock options to employees | (21 | ) | B&S | (22 | ) | B&S | (1 | ) | ||||||||||||||||||||||||||||||
| Value of HADERA PAPER to shareholders | 1,144 | 1,763 | 619 | |||||||||||||||||||||||||||||||||||
| * As of June 30, 2009 excludes CARMEL and FRENKEL, as of December 31, 2010 excludes HADERA PAPER PRINTING, CARMEL and FRENKEL. | ||||||||||||
| ** In valuation as of June 30, 2009, the net liability to complete Machine 8 was offset against enterprise value (EV) of HADERA PAPER. In the table above, this liability is presented separately to enable comparison. | ||||||||||||
| *** As of June 30, 2009, the value of HADERA PAPER, consolidated was NIS 115 million, net of value of holding stake in HADERA PAPER PRINTING, an associate as of that date. | ||||||||||||
D - 5
The table above shows that the difference between results of the valuation as of June 30, 2009 and results of the valuation as of December 31, 2010 is due to change in three major assets / liabilities: Enterprise value (EV) of HADERA PAPER, liability with respect to completion of Machine 8 and net financial debt. Explanations of changes in these parameters follow:
| - | General |
The earlier valuation was prepared in the midst of the economic crisis, as indicated in section 2c of the valuation. The first half of 2009 saw extraordinary uncertainty, extreme volatility in prices of financial assets, frequent changes to the yield curve etc. At that time, leading world economists estimated that the crisis was similar in scope to the great depression of 1929 in the USA, and that likelihood of a W scenario was high.
The Investor Fear Benchmark (VIX), which measures inherent variance in the CBOE index, decreased by one third over the past 18 months. The benchmark recorded an all time high of over 70 points in 2008, and traded around 30 points in mid-2009. In late 2010, the benchmark declined below 20 points, and traded in the same range, 10-20 points, as it did prior to the economic crisis.
The 18 months since the previous valuation saw dramatic improvement in investor expectations. General equity benchmarks in the USA and in Israel rose in this period by 40% and 54%, respectively, as per section 2c of this valuation. The market cap of HADERA PAPER rose 71% in this period.
Unlike expectations in 2009 of rapid rise in central bank interest rates, the interest rate hike was delayed, and current debenture yields predict a gradual raising of global interest rates. Thus, for example, the expected real interest rate for Government of Israel CPI-linked debentures with terms over 20 years decreased from 3.5% p.a. in the previous valuation period to 2.7% in late 2010.
The change in real capital cost used for the valuations in the table above reflect the aforementioned economic changes.
D - 6
| - | Enterprise value (EV) - HADERA PAPER, consolidated |
The enterprise value (EV) of HADERA PAPER on consolidated basis19 in the valuation as of December 31, 2010 is NIS 402 million higher than in the valuation as of June 30, 2009. This value includes two operating segments: the packaging and recycling segment and the office equipment marketing segment; the lion's share of the value is due to the former. In 2010, results of all operating segments improved, but the packaging segment was transformed, both in terms of profitability and of production capacity, as follows:
| · | Construction of Machine 8, with production capacity of 230 thousand tons and a total cost of NIS 690 million, was completed and regular operation commenced in June 2010. This machine has yet to realize its full potential, with average packaging paper production capacity in 2010 estimated at 270 thousand tons annually, compared to planned production capacity of 320 thousand tons annually20. Since in 2011 the machine would be in operation for 12 months, and due to the expected progress on the learning curve for this new equipment, material improvement is expected in HADERA PAPER business results in 2011-2012. |
| · | The Company's financial results, which served as basis for the valuation as of June 30, 2009, showed a relatively sharp decline in Company profitability. The financial results at the base of the current valuation show operating income amounting to NIS 55 million in the base period, accounting for the fact that Machine 8 has been in operation for only 6 months: |
| 2007 | 2008 | H1/09 | ||||||||||
| NIS millions | ||||||||||||
| Operating income - base as of June 30, 2009 | 75 | 35 | (9 | ) | ||||||||
| 2008 | 2009 | 2010 | ||||||||||
| NIS millions | ||||||||||||
| Operating income - base as of December 31, 2010 | 35 | 0 | 55 | |||||||||
19 As of June 30, 2009 excludes CARMEL and FRENKEL, as of December 31, 2010 excludes HADERA PAPER PRINTING, CARMEL and FRENKEL.
D - 7
Improvement in business results is primarily due to these two reasons: The increase in production capacity with the launch of Machine 8, and higher packaging paper prices world-wide, due to the change in the global (and Israeli) economy. The increase in prices of recycled packaging paper started in late 2009 and accelerated in 2010. The increase in demand overseas, and higher exports, resulted in the average price of packaging paper sold by the Company in late 2010 being significantly higher than in 2009.
Also note, in this regard, that in the first half of 2009, the situation was the opposite - the domestic market was flooded with low-priced imported paper, and demand for exports was on a down trend. In January 2009, the Company filed a complaint with the Supervisor of Trade Tariffs at the Ministry of Industry, Trade and Labor, concerning imports at dumping prices of packaging paper from several European countries to Israel. After reviewing this complaint, the Supervisor of Trade Tariffs decided to launch an investigation of this matter, and imposed a temporary tariff on paper imported from the EU.
| · | The Company developed, in recent years, new products based on paper waste (100% recycled), to serve as substitute for virgin paper (made of cellulose), such as carpet liner. Prior to 2010, all virgin raw material for the packaging segment was imported. In 2010, the Company first produced and marketed these new products in significant volumes. The price of recycled packaging paper increased sharply in 2010, whereas prices of virgin packaging paper declined. The marketing advantage of these new products as far as the Company is concerned, other than being environmentally friendly, is the relatively low cost of these products compared to virgin product cost. |
Another advantage is the potential production of these products using Machine 121, with a production capacity of 50-60 thousand tons annually, in addition to the current production capacity, estimated at 320 thousand tons annually. Due to the foregoing, the expected investment in equipment and machines in the forecast period of the valuation as of December 31, 2010 is lower than assumed investment in the valuation as of June 30, 2009.
21 Production using Machine 1 was discontinued with the launch of Machine 8, and the former is operated from time to time in order to maintain production worthiness. Regular operation of Machine 1 does not require any significant investment.
D - 8
| · | The forecasted cash flow in the typical year is 18 months earlier, i.e. the impact of lean years in the cash flow, namely the second half of 2009 and 2010, is outside the scope of the forecast as of December 31, 2010. Below is a comparison of operating income used as basis for the two valuations: |
Data from valuation as of June 30, 2009
| 2007 | 2008 | H1/09 | Year 1* | Year 2 | Year 3 | Year 4 | Year 5 | Year 6 | Year 7 | Typical year | ||||||||||||||||||||||||||||||||||
| Actual | Forecast | |||||||||||||||||||||||||||||||||||||||||||
| NIS in millions | ||||||||||||||||||||||||||||||||||||||||||||
| Operating income | 75 | 35 | (9 | ) | (2 | ) | 49 | 78 | 102 | 121 | 129 | 131 | 133 | |||||||||||||||||||||||||||||||
Data from valuation as of December 31, 2010
| 2008 | 2009 | 2010 | 2011 | 2012 | 2013 | 2014 | 2015 | 2016 | 2017 | Typical year | ||||||||||||||||||||||||||||||||||
| Actual | Forecast | |||||||||||||||||||||||||||||||||||||||||||
| NIS in millions | ||||||||||||||||||||||||||||||||||||||||||||
| Operating income | 35 | 0 | 55 | 62 | 97 | 108 | 119 | 124 | 127 | 129 | 135 | |||||||||||||||||||||||||||||||||
* Year starting July 1.
The expected operating income for the typical year is similar in both valuations.
| - | Net liability to complete Machine 8 |
In the valuation as of June 30, 2009, when construction of Machine 8 was on-going, the balance of investment in Machine 8, amounting to NIS 249 million22 as of that date, was offset against the enterprise value (EV). As of December 31, 2010, construction of Machine 8 was completed and trade payables with respect to the project, amounting to NIS 20 million, was included under the Company's net financial debt as of said date.
| - | Net financial debt |
The increase in financial debt is primarily due to financing the construction of Machine 8.
HADERA PAPER LTD
CONSOLIDATED INCOME STATEMENT PROFORMA
AS OF DECEMBER 31, 2010
HADERA PAPER LTD
CONSOLIDATED INCOME STATEMENT PROFORMA
AS OF DECEMBER 31, 2010
TABLE OF CONTENTS
| Page | |
| P - 3 | |
| P - 4 | |
| P - 5 | |
| P - 6 - P - 7 |
P - 2
Report of Independent Registered Public Accounting Firm
To the shareholders of
Hadera Paper ltd.
We have audited the accompanying proforma consolidated statements of income and comprehensive income of Hadera Paper Ltd. (“the Company”) for each of the three years in the period ended December 31, 2010. These proforma consolidated statements are the responsibility of the Company's board of directors and management. Our responsibility is to express an opinion on these proforma consolidated statements based on our audit.
We did not audit the financial statements of certain subsidiaries, which statements reflect total Proforma revenues constituting approximately 28%, 32% and 12% of consolidated total Proforma revenues as of December 31, 2010, 2009 and 2008, respectively.
Likewise we did not audit the financial statements of certain associated companies, in which the Company's share in their proforma profits or losses is a net amount of 1,440 Thousandss NIS, for the year ended December 31, 2008. The financial statements of those companies were audited by other Auditors whose reports have been furnished to us, and our opinion, insofar as it relates to amounts included for those companies, is based solely on the reports of the other auditors.
We conducted our audits in accordance with generally accepted auditing standards in Israel, including those prescribed under the Auditors' Regulations (Auditor's Mode of Performance), 1973. Those standards require that we plan and perform the audit to obtain reasonable assurance whether the proforma statements are free of material misstatement. An audit also includes examining, on a test basis, evidence supporting the amounts and disclosures in the proforma statements. An audit also includes assessing the accounting principles used and significant estimates made by the company's Board of Directors and management, as well as evaluating the overall proforma statement presentation. We believe that our audits and the reports of the other independent auditors provide a reasonable basis for our opinion
In our opinion, based on our audits and the reports of other auditors, such proforma statements present fairly, in all material respects, the proforma results of the Company and subsidiaries for each of the three years in the period ended December 31, 2010, in conformity with Regulation 9A of the Securities Regulations (Period and Immediate Reports) – 1970, based on the assumptions listed in note 4.
Brightman Almagor Zohar& Co.
Certified Public Accountants
A Member Firm of Deloitte Touche Tohmatsu
Israel
March 6, 2011
P - 3
HADERA PAPER LTD
CONSOLIDATED INCOME STATMENTS PROFORMA
Year ended December 31 | ||||||||||||
2 0 1 0 | 2 0 0 9 | 2 0 0 8 | ||||||||||
NIS in thousands | ||||||||||||
| Revenue | 1,806,210 | 1,532,855 | 1,383,886 | |||||||||
| Cost of sales | 1,539,247 | 1,312,710 | 1,167,228 | |||||||||
| Gross profit | 266,963 | 220,145 | 216,658 | |||||||||
| Selling, marketing, general and administrative expenses | ||||||||||||
| Selling and marketing expenses | 130,455 | 111,692 | 83,967 | |||||||||
| General and administrative expenses | 76,714 | 73,316 | 67,683 | |||||||||
| Other income, net | (31,185 | ) | (11,774 | ) | (6,034 | ) | ||||||
| Total expenses | 175,984 | 173,234 | 145,616 | |||||||||
| Profit from ordinary operations | 90,979 | 46,911 | 71,042 | |||||||||
| Finance income | 11,563 | 1,482 | 14,200 | |||||||||
| Finance expenses | 61,328 | 34,437 | 40,281 | |||||||||
| Finance expenses, net | 49,765 | 32,955 | 26,081 | |||||||||
| Profit (loss) after financial expenses | 41,214 | 13,956 | 44,961 | |||||||||
| Share in profit of associated companies, net | 70,059 | 73,242 | 41,716 | |||||||||
| Profit before taxes on income | 111,273 | 87,198 | 86,677 | |||||||||
| Taxes on income | ||||||||||||
| 4,336 | (6,456 | ) | 10,790 | |||||||||
| Profit for the year | 106,937 | 93,654 | 75,887 | |||||||||
| Attributed to: | ||||||||||||
| Company shareholders | 101,505 | 86,063 | 72,828 | |||||||||
| Non Controlling interests | 5,432 | 7,591 | 3,059 | |||||||||
| 106,937 | 93,654 | 75,887 | ||||||||||
| Earning for regular share of NIS 0.01 par value | NIS | |||||||||||
| Primary attributed to Company shareholders | 19.99 | 17.01 | 14.39 | |||||||||
| Fully diluted attributed to company shareholders | 19.83 | 17.01 | 14.39 | |||||||||
| Number of share used to compute the primary earnings per share | 5,078,156 | 5,060,788 | 5,060,774 | |||||||||
| Number of share used to compute the fully diluted earnings per share | 5,118,416 | 5,060,788 | 5,060,774 | |||||||||
| Z. Livnat | O. Bloch | S. Gliksberg | ||
| Chairman of the Board of Directors | Chief Executive Officer | Chief Financial and Business Development Officer |
Approval date of the separate financial statements: March 6, 2010
The accompanying notes are an integral part of the consolidated financial statements
P - 4
HADERA PAPER LTD
CONSOLIDATED STATEMENT
OF COMPREHENSIVE INCOME PROFORMA
| Year ended | ||||||||||||
December 31 | ||||||||||||
2 0 1 0 | 2 0 0 9 | 2 0 0 8 | ||||||||||
NIS in thousands | ||||||||||||
| Comprehensive Income | 106,937 | 93,654 | 75,887 | |||||||||
| Other Comprehensive Income | ||||||||||||
| Profit (loss) on cash flow hedges, net | 1,044 | 5,271 | (6,385 | ) | ||||||||
| Allocation to the income statement on account of cash flow hedging transactions, net | - | 2,871 | - | |||||||||
| Actuarial profit (loss) from defined benefit plans, net | (4 | ) | 398 | (1,382 | ) | |||||||
| Revaluation from step acquisition | - | - | 17,288 | |||||||||
| Share in Other Comprehensive Income of associated companies, net | (11,652 | ) | (507 | ) | (27,135 | ) | ||||||
| Share in other comprehensive income of associated companies, which allocated to the income statements, net | 446 | (833 | ) | 1,017 | ||||||||
| Total Other Comprehensive Income for the period, net | (10,166 | ) | 7,200 | (16,597 | ) | |||||||
| Total Comprehensive Income for the period | 96,771 | 100,854 | 59,290 | |||||||||
| Attributed to: | ||||||||||||
| Company shareholders | 91,293 | 92,265 | 57,239 | |||||||||
| Non Controlling interests | 5,479 | 8,589 | 2,051 | |||||||||
| 96,771 | 100,854 | 59,290 | ||||||||||
P - 5
HADERA PAPER LTD
NOTES TO CONSOLIDATED INCOME STATEMENT PROFORMA
NOTE 1 - GENERAL
| The proforma consolidated statements of income of the Company are prepared in accordance with the provisions of Regulation 9a to the Securities Regulations (Immediate and Periodic Reports), 1970. |
NOTE 2 - PROFORMA EVENT
On September 7 2010 the company signed an agreement with a subsidiary of Mondi Group ("Mondi Group"), that holds, prior to the transaction, 50.1% of the issued and outstanding share capital of Hadera Paper – Printing and Writing Paper Ltd. - an associated company, formerly "Mondi Hadera Paper Ltd.", (hereinafter – "Printing and Writing Paper Ltd.") pursuant to which Mondi Group will sell to the Company 25.1% of the issued and outstanding share capital of "Printing and Writing Paper" ("Acquisition Transaction").
Prior to the transaction, the Company held 49.9% of the issued and outstanding share capital of Mondi Hadera. upon to the completion of the Acquisition Transaction effective as of December 31 2010, the Company holds 75% of the issued and outstanding share capital of "Printing and Writing Paper", while Mondi Group holds the remaining 25%.
In consideration of the shares being sold, the Company paid Mondi Group, from its own resources, upon to the completion of the Acquisition Transaction, a sum of approximately EURO 10.364 million, on January 5, 2011.
The Acquisition Transaction includes, inter alia, the amendment of the existing shareholder agreement between the parties, pertaining to their holdings in "Printing and Writing Paper" that entered into force upon to the completion of the Acquisition Transaction, including also the changes necessary as a result of the modification of the holding percentages, including the protection of minority interests, rules for the continued cooperation between the shareholders and "Printing and Writing Paper", a non-competition clause, dividend distribution policy and the like, all subject to the provisions of the law.
Moreover, the Acquisition Transaction includes the amendment of the existing agreements between the shareholders and Mondi Hadera that entered into force upon the finalization of the Acquisition Transaction, (effective from December 31, 2010), including a marketing agreement, rental agreement, agreement for the provision of services and the signing of new agreements (that enter into force upon to the completion of the Acquisition Transaction), including a subletting agreement and an agreement governing the use of the Mondi brand.
P - 6
HADERA PAPER LTD
NOTES TO CONSOLIDATED INCOME STATEMENT PROFORMA
NOTE 2 - PROFORMA EVENT (cont.)
As part of the previous agreement between HADERA PAPER and MONDI GROUP dated November 21, 1999, as set forth in Note 5(3) of the consolidated financial statements of the Company, MBP was granted an option to sell to the Company itsHolding stake in "Printing and Writing Paper", at a price 20% below the value (as defined in the agreement) or $20 million less 20%, whichever is higher. The Acquisition Transaction included the amendment of the Put option, stipulating that it may not be exercised during the first three years subsequent to the date of finalization of the Acquisition Transaction (except for specific circumstances outlined in the agreement). Moreover, it was determined that Mondi Group will be subject to the undertaking not to sell its shares in "Printing and Writing Paper" for a period of three years subsequent to the date of finalization of the Acquisition Transaction (except for specific circumstances outlined in the agreement).
On December 28, 2010, the suspending conditions set forth in the acquisition agreement have been fulfilled for the closing of the transaction. The ancillary agreements in the transaction have been signed and the closing date has been scheduled for December 31, 2010. The parties further determined that the consideration of the transaction will be transferred to the Mondi Group no later than January 10, 2011. Following the closing of the transaction, the Company consolidates the financial statements of "Printing and Writing Paper" into its own financial statements, as of December 31, 2010.
NOTE 3 - ACCOUNTING POLICY:
The proforma consolidated statements have been compiled pursuant to the accounting policy set forth in Note 2 to the Company's consolidated financial statements as of December 31, 2010, based on assumptions set forth in Note 4 below.
NOTE 4 - ASSUMPPTION USED AS THE BASIS FOR THE PREPARATION OF THE PROFORMA CONSOLIDATED STATEMANTS
| a. | Pro-forma information was compiled based on financial information for HADERA PAPER Ltd. and MONDI HADERA PAPER Ltd. The pro-forma information reflects the operating results, on consolidated basis, had MONDI HADERA PAPER Ltd. been acquired on January 1, 2008. |
| b. | The gain realized by the Company, amounting to NIS 5,760 thousand result from the acquisition, was not included on the pro-forma consolidated statements, as it was of a non-recurring nature. |
| c. | Financing expenses on the pro-forma consolidated statements including financing cost, which were calculated based on 5.85% interest with respect to financing obtained for this acquisition. |
| d. | Excess acquisition cost over carrying amount as of the acquisition date, amounting to NIS 12,282 thousand, was classified under goodwill |
| e. | Other revenues include annual adjustment of the financial liability with respect to put option granted to non-controlling interests for the present value of the expected future payment with respect there to, assuming it would not be exercisable for three years. . Profit and loss resulting from settled put options has been reversed. |
| f. | Inter-company transactions and balances were reversed for the consolidation. Inter-company unrealized gain was not reversed, as it was not material. |
P - 7
HADERA PAPER LTD
SEPARATE FINANCIAL STATEMENTS
AS OF DECEMBER 31, 2010
HADERA PAPER LTD
SEPARATE FINANCIAL STATEMENTS
AS OF DECEMBER 31, 2010
TABLE OF CONTENTS
| Page | |
| H - 1 | |
| Separate Financial Statements | |
| H - 2 | |
| H - 3 | |
| H - 3 | |
| H - 4 - H - 6 | |
| H - 7 - H - 8 | |
| H - 9 - H - 16 |
| | Brightman Almagor Zohar Haifa office 5 Ma’aleh Hashichrur Street P.O.B. 5648, Haifa 31055 Israel Tel: +972 (4) 860 7333 Fax: +972 (4) 867 2528 info-haifa@deloitte.co.il www.deloitte.co.il |
To the shareholders of
Hadera Paper Ltd.
Re: Auditor's Special Report on the separate financial information according to regulation 9C of the Securities Regulations (Periodic and Immediate Reports) – 1970.
We have audited the separate financial information that is given according to Regulation 9C of the Securities Regulations (Periodic and Immediate Reports) – 1970, Hadera Paper Ltd. (hereafter – "the Company") as at December 31, 2010 and 2009. The separate financial information is the responsibility of the management and board of directors of the Company. Our responsibility is to express an opinion on the separate financial information based on our audit.
We did not audit the separate financial information from the financial statements of subsidiaries that the total investment in them is a net amount of 127,104 thousands NIS and 111,045 thousands NIS as of December 31, 2010 and 2009, respectively, and the profits from those subsidiaries is a net amount of 2,826 thousands NIS, 7,884 thousands NIS and 7,427 thousands NIS, respectively, for the years ended in December 31, 2010, 2009 and 2008, respectively. The financial statements of those companies were audited by other auditors, whose reports have been submitted to us, and our conclusion, insofar as it relates to amounts included for those companies, is based on the reports of the other auditors.
We conducted our audits in accordance with generally accepted auditing standards in Israel. Those standards require that we plan and perform the audit for the purpose of obtaining a reasonable measure of assurance that the separate financial information does not include a materially misleading presentation. An audit involves examining, on a test basis, evidence supporting the amounts and disclosures in the separate financial information. An audit also includes evaluating the appropriateness of accounting principles used in preparing the separate financial information and significant estimates made by the board of directors and management, as well as evaluating the overall separate financial information presentation. We believe that our audit and the reports of other auditors provide appropriate basis for our opinion.
In our opinion, based on our audit and the reports of other auditors, the separate financial information is edited, in all material respects, in conformity with Regulation 9C of the Securities Regulations (Period and Immediate Reports) – 1970.
Brightman Almagor Zohar & Co.
Certified Public Accountants
A Member Firm of Deloitte Touche Tohmatsu
Israel
March 6, 2011

H - 1
HADERA PAPER LTD
SEPARATE STATEMENTS OF FINANCIAL POSITION
December 31, | ||||||||
2 0 10 | 2 0 0 9 | |||||||
NIS in thousands | ||||||||
| Current Assets | ||||||||
| Cash and cash equivalents | 43,738 | 363 | ||||||
| Designated deposits | - | 127,600 | ||||||
| Trade receivables | 942 | 4,347 | ||||||
| Subsidiaries and associated companies, net | 264,368 | 548,181 | ||||||
| Current tax assets | - | 96 | ||||||
| Total Current Assets | 309,048 | 680,587 | ||||||
| Non-Current Assets | ||||||||
| Investment in subsidiaries and associated companies | 970,874 | 918,771 | ||||||
| Loans to subsidiaries and associated companies | 580,615 | 69,706 | ||||||
| Fixed assets | 85,647 | * 101,746 | ||||||
| Investment Property | 24,500 | - | ||||||
| Prepaid leasing expenses | 24,837 | * 29,756 | ||||||
| Financial assets - available for sale | 1,646 | - | ||||||
| Other assets | 323 | 370 | ||||||
| Deferred tax assets | 12,536 | 13,223 | ||||||
| Total Non-Current Assets | 1,700,978 | 1,133,572 | ||||||
| Total Assets | 2,010,026 | 1,814,159 | ||||||
| Current Liabilities | ||||||||
| Credit from banks | - | 102,446 | ||||||
| Current maturities of long-term notes and long term loans | 142,079 | 125,805 | ||||||
| Trade payables | 9,731 | 3,068 | ||||||
| Other payables and accrued expenses | 130,527 | 87,765 | ||||||
| Financial liabilities at fair value through profit and loss | - | 11,982 | ||||||
| Short term employee benefit liabilities | 3,411 | 5,303 | ||||||
| Current tax liabilities | 2,078 | - | ||||||
| Total Current Liabilities | 287,826 | 336,369 | ||||||
| Non-Current Liabilities | ||||||||
| Loans from banks and others | 193,490 | 170,155 | ||||||
| Notes | 562,348 | 471,815 | ||||||
| Employee benefit liabilities | 4,880 | 3,775 | ||||||
| Put option granted to the non controlling interests | 31,512 | - | ||||||
| Total Non-Current Liabilities | 792,230 | 645,745 | ||||||
| Capital and reserves | 929,970 | 832,045 | ||||||
| Total Liabilities and Equity | 2,010,026 | 1,814,159 | ||||||
| Z. Livnat | O. Bloch | S. Gliksberg | ||
| Chairman of the Board of Directors | Chief Executive Officer | Chief Financial and Business Development Officer |
Approval date of the separate financial statements: March 6, 2010
*Retroactively adjusted in respect of implementation of amendment to IAS17, see note 3a of the consolidated financial statements/
The accompanying notes are an integral part of the separate financial statements.
H - 2
HADERA PAPER LTD
SEPARATE INCOME STATEMENTS
| Year ended | ||||||||||||
December 31 | ||||||||||||
2 0 10 | 2009 | 2008 | ||||||||||
NIS in thousands | ||||||||||||
| Income | ||||||||||||
| Revenues from services, net | 12,478 | 6,430 | (8,352 | ) | ||||||||
| Other income | 11,271 | 19,624 | 4,665 | |||||||||
| Share in profits of subsidiaries and associated companies - net | 94,363 | 87,010 | 71,116 | |||||||||
| Finance income | 28,115 | 5,557 | 11,692 | |||||||||
| 146,227 | 118,621 | 79,121 | ||||||||||
| Cost and expenses | ||||||||||||
| Finance expenses | (43,627 | ) | (18,318 | ) | (22,959 | ) | ||||||
| Profit before taxes on income | 102,600 | 100,303 | 56,162 | |||||||||
| Tax (income) expenses on the income | (1,872 | ) | (9,073 | ) | 13,548 | |||||||
| profit for the year | 100,728 | 91,230 | 69,710 | |||||||||
SEPARATE STATEMENT
OF COMPREHENSIVE INCOME
| Year ended | ||||||||||||
December 31, | ||||||||||||
2 0 10 | 2 0 0 9 | 2 0 0 8 | ||||||||||
NIS in thousands | ||||||||||||
| Comprehensive Income | 100,728 | 91,230 | 69,710 | |||||||||
| Actuarial loss and defined benefit plans, net | (228 | ) | 14 | (131 | ) | |||||||
| Revaluation from step acquisition | - | - | 17,288 | |||||||||
| Share in Other Comprehensive Income of subsidiaries and associated companies, net | (9,895 | ) | 5,184 | (31,752 | ) | |||||||
| Comprehensive Income (loss) for the year | (10,123 | ) | 5,198 | (14,595 | ) | |||||||
| Total other comprehensive income for the year | 90,605 | 96,428 | 55,115 | |||||||||
The accompanying notes are an integral part of the separate financial statements
H - 3
Share capital | Premium of share | Share based payments reserves | Capital reserves resulting from tax benefit on exercise of employee options | Capital reserve from revaluation from step acquisition | Hedging reserves | Foreign currency translation reserves | Retained earnings | Total | ||||||||||||||||||||||||||||
| NIS in thousands | ||||||||||||||||||||||||||||||||||||
| Balance - December 31, 2009 | 125,267 | 301,695 | 10,531 | 3,397 | 14,164 | 517 | (22,872 | ) | 399,346 | 832,045 | ||||||||||||||||||||||||||
| Adjustment of retained earnings in respect of implementation of amendment to IAS 17 (see note 3a of the consolidated financial statements) | - | - | - | - | - | - | - | 3,590 | 3,590 | |||||||||||||||||||||||||||
| Balance - January 1, 2010 | 125,267 | 301,695 | 10,531 | 3,397 | 14,164 | 517 | (22,872 | ) | 402,936 | 835,635 | ||||||||||||||||||||||||||
For the Year ended December 31, 2010: | ||||||||||||||||||||||||||||||||||||
Exchange differences arising on translation of foreign operations | - | - | - | - | - | - | (10,649 | ) | - | (10,649 | ) | |||||||||||||||||||||||||
| Profit on cash flow hedges, net | - | - | - | - | - | 606 | - | - | 606 | |||||||||||||||||||||||||||
| Actuarial loss from defined benefit plans, net | - | - | - | - | - | (80 | ) | (80 | ) | |||||||||||||||||||||||||||
| Profit for the year | - | - | - | - | - | - | 100,728 | 100,728 | ||||||||||||||||||||||||||||
| Total Comprehensive Income for the Year | - | - | - | - | - | 606 | (10,649 | ) | 100,648 | 90,605 | ||||||||||||||||||||||||||
| Acquisition of additional shares in a subsidiary | - | - | - | - | - | - | - | 1,117 | 1,117 | |||||||||||||||||||||||||||
| Depreciation of capital from revaluation from step acquisition to retained earnings | - | - | - | - | (1,744 | ) | - | - | 1,744 | - | ||||||||||||||||||||||||||
| Conversion of employee options into shares | - | 5,156 | (5,156 | ) | - | - | - | - | - | - | ||||||||||||||||||||||||||
| Share based payment | - | - | 2,163 | - | - | - | - | - | 2,163 | |||||||||||||||||||||||||||
| Balance – December 31, 2010 | 125,267 | 306,851 | 7,988 | 3,397 | 12,420 | 1,123 | (33,521 | ) | 506,445 | 929,970 | ||||||||||||||||||||||||||
The accompanying notes are an integral part of the separate financial statements.
H - 4
HADERA PAPER LTD
SEPARATE FINANCIAL STATEMENTS OF CHANGES IN EQUITY
(NIS in thousands)
Share capital | Capital reserves | Share based payments reserves | Capital reserves resulting from tax benefit on exercise of employee options | Capital reserve from revaluation from step acquisition | Cash Flows Hedging reserves | Foreign currency translation reserves | Retained earnings | Total | ||||||||||||||||||||||||||||
| NIS in thousands | ||||||||||||||||||||||||||||||||||||
| Balance - January 1, 2009 | 125,267 | 301,695 | 6,227 | 3,397 | 15,908 | (5,092 | ) | (22,186 | ) | 306,097 | 731,313 | |||||||||||||||||||||||||
For the Year ended December 31, 2009: | ||||||||||||||||||||||||||||||||||||
Exchange differences arising on translation of foreign operations | - | - | - | - | - | - | (686 | ) | - | (686 | ) | |||||||||||||||||||||||||
| Profit on cash flow hedges, net | - | - | - | - | 5,609 | 5,609 | ||||||||||||||||||||||||||||||
| Actuarial profit from defined benefit plans, net | - | - | - | - | - | - | - | 275 | 275 | |||||||||||||||||||||||||||
| Profit for the year | - | - | - | - | - | - | 91,230 | 91,230 | ||||||||||||||||||||||||||||
| Total Comprehensive Income for the Year | - | - | - | - | - | 5,609 | (686 | ) | 91,505 | 96,428 | ||||||||||||||||||||||||||
| Depreciation of capital from revaluation from step acquisition to retained earnings | - | - | - | - | (1,744 | ) | - | - | 1,744 | - | ||||||||||||||||||||||||||
| Share based payment | - | - | 4,304 | - | - | - | - | - | 4,304 | |||||||||||||||||||||||||||
| Balance – December 31, 2009 | 125,267 | 301,695 | 10,531 | 3,397 | 14,164 | 517 | (22,872 | ) | 399,346 | 832,045 | ||||||||||||||||||||||||||
The accompanying notes are an integral part of the separate financial statements.
H - 5
HADERA PAPER LTD
SEPARATE FINANCIAL STATEMENTS OF CHANGES IN EQUITY
(NIS in thousands)
Share capital | Capital reserves | Share based payments reserves | Capital reserves resulting from tax benefit on exercise of employee options | Capital reserve from revaluation from step acquisition | Cash Flows Hedging reserves | Foreign currency translation reserves | Retained earnings | Total | ||||||||||||||||||||||||||||
| NIS in thousands | ||||||||||||||||||||||||||||||||||||
| Balance - January 1, 2008 | 125,267 | 301,695 | - | 3,397 | - | (635 | ) | 3,810 | 236,437 | 669,971 | ||||||||||||||||||||||||||
For the Year ended December 31, 2008: | ||||||||||||||||||||||||||||||||||||
| Exchange differences arising on translation of foreign operations | - | - | - | - | - | - | (25,996 | ) | - | (25,996 | ) | |||||||||||||||||||||||||
| Profit (loss) on cash flow hedges, net | - | - | - | - | (4,457 | ) | (4,457 | ) | ||||||||||||||||||||||||||||
| Revaluation from step acquisition | - | 17,288 | 17,288 | |||||||||||||||||||||||||||||||||
| Actuarial profit (loss) from defined benefit plans, net | - | - | - | - | - | - | - | (1,430 | ) | (1,430 | ) | |||||||||||||||||||||||||
| Profit for the year | - | - | - | - | - | - | 69,710 | 69,710 | ||||||||||||||||||||||||||||
| Total Comprehensive Income for the Year | - | - | - | - | 17,288 | (4,457 | ) | (25,996 | ) | 68,280 | 55,115 | |||||||||||||||||||||||||
| Depreciation of capital from revaluation from step acquisition to retained earnings | - | - | - | - | (1,380 | ) | - | - | 1,380 | - | ||||||||||||||||||||||||||
| Share based payment | - | - | 6,227 | - | - | - | - | - | 6,227 | |||||||||||||||||||||||||||
| Balance – December 31, 2008 | 125,267 | 301,695 | 6,227 | 3,397 | 15,908 | (5,092 | ) | (22,186 | ) | 306,097 | 731,313 | |||||||||||||||||||||||||
The accompanying notes are an integral part of the condensed separate financial statements.
H - 6
HADERA PAPER LTD
SEPARATE STATEMENTS OF CASH FLOWS
| Year ended | ||||||||||||
December 31 | ||||||||||||
2010 | 2 0 0 9 | 2 0 0 8 | ||||||||||
NIS in thousands | ||||||||||||
| Cash flows – operating activities | ||||||||||||
| Profit for the year | 100,728 | 91,230 | 69,710 | |||||||||
| Tax expenses (income) recognized in profit and loss | 1,872 | 9,073 | (13,548 | ) | ||||||||
| Financial expenses recognized in profit and loss, net | 15,512 | 12,761 | 11,267 | |||||||||
| Share in profit of subsidiaries and associated companies, net | (94,363 | ) | (87,010 | ) | (71,116 | ) | ||||||
| Dividend received | 70,319 | 61,814 | - | |||||||||
| Income from repayment of capital note to associated company | - | (16,418 | ) | - | ||||||||
| Capital loss (income) on sales of fixed assets | (1,394 | ) | 34 | - | ||||||||
| Gain from revaluation of prior holding at fair value due to achieving control | (5,760 | ) | - | - | ||||||||
| Income from revaluation of investment property | (151 | ) | - | - | ||||||||
| Depreciation and amortization | 3,313 | 5,127 | 4,792 | |||||||||
| Share based payments expenses | 1,086 | 1,880 | 2,754 | |||||||||
| Gain from negative goodwill | - | - | (14,664 | ) | ||||||||
| 91,162 | 78,491 | (10,805 | ) | |||||||||
| Changes in assets and liabilities: | ||||||||||||
| Increase in trade and other receivables | (134,380 | ) | (313,050 | ) | (121,419 | ) | ||||||
| Increase (Decrease) in trade and other payables | 23,707 | 21,702 | 1,106 | |||||||||
| Increase (Decrease) in financial liabilities at fair value through profit and loss | 872 | (1,922 | ) | 10,003 | ||||||||
| Increase (Decrease) in employee benefits and provisions | (1,186 | ) | 1,418 | 398 | ||||||||
| Cash used in operating activities | (19,825 | ) | (213,361 | ) | (120,717 | ) | ||||||
| Tax Payments, net | (1,323 | ) | - | 3,685 | ||||||||
| Net cash used in operating activities | (21,148 | ) | (213,361 | ) | (117,032 | ) | ||||||
The accompanying notes are an integral part of the separate financial statements
H - 7
HADERA PAPER LTD
SEPARATE STATEMENTS OF CASH FLOWS
| Year ended | ||||||||||||
December 31 | ||||||||||||
2010 | 2 0 0 9 | 2 0 0 8 | ||||||||||
NIS in thousands | ||||||||||||
| Cash flows – investing activities | ||||||||||||
| Acquisition of fixed assets and prepaid leasing expenses | (13,493 | ) | (5,089 | ) | (10,485 | ) | ||||||
| Acquisition of subsidiaries | (15,703 | ) | - | (74,741 | ) | |||||||
| Acquisition of other assets and financial assets | (1,724 | ) | - | - | ||||||||
| Proceeds from fixed assets | 1,483 | 747 | - | |||||||||
| Investment in designated deposits, net | 127,600 | 124,614 | (255,244 | ) | ||||||||
| Interest received | 1,718 | 1,292 | 5,193 | |||||||||
| Collection of loans of subsidiaries and associated companies | - | - | 3,085 | |||||||||
| Net cash generated (used in) investing activities | 99,881 | 121,564 | (332,192 | ) | ||||||||
| Cash flows – financing activities | ||||||||||||
| Proceeds from issuing notes | 179,886 | - | 424,617 | |||||||||
| Short-term bank credit – net | (102,446 | ) | 59,778 | (100,812 | ) | |||||||
| Borrowings received from banks | 70,000 | 156,490 | 35,000 | |||||||||
| Repayment of borrowings from banks and other | (31,644 | ) | (12,568 | ) | (10,634 | ) | ||||||
Repayment of capital note | - | (32,770 | ) | - | ||||||||
| Interest Paid | (53,896 | ) | (38,753 | ) | (16,718 | ) | ||||||
| Redemption of notes | (94,994 | ) | (40,427 | ) | (38,904 | ) | ||||||
| Net cash generated by(used in) financing activities | (33,094 | ) | 91,750 | 292,549 | ||||||||
| Increase (Decrease) in cash and cash equivalents | 45,639 | (47 | ) | (156,675 | ) | |||||||
| Effects of exchange rate changes on the balance of cash held in foreign currencies | (2,264 | ) | ||||||||||
| Cash and cash equivalents – beginning of period | 363 | 410 | 157,085 | |||||||||
| Cash and cash equivalents – end of period | 43,738 | 363 | 410 | |||||||||
* Reclassified.
The accompanying notes are an integral part of the separate financial statements.
H - 8
NOTE 1 - GENERAL
| The separate financial statements of the Company are prepared in accordance with the provisions of Regulation 9c and the tenth addition to the Securities Regulations (Immediate and Periodic Reports), 1970. |
| A. | Definitions: |
| The Company | - | Hadera Paper Limited. |
| Affiliated Companies | - | As defined by note 1b of the conciliated financial statement of the company as of December 31, 2010. |
| B. | Accounting policy: |
| The separate financial statements were drawn up in accordance with the accounting policy set forth in Note 2 of the consolidated financial statements of the Company, except for the amounts of assets, liabilities, revenues, expenses and cash flows relating to investee companies, as specified below: |
| a. | The assets and liabilities are presented in the same amount as in the consolidated financial statements of the Company as a parent company, except for investments in investee companies. |
| b. | Investments in investee companies are presented as the net amount of the total assets less total liabilities, which present financial information in the Company's consolidated financial statements in respect of investee companies, including goodwill. |
| c. | The amounts of revenues and expenses reflect the revenues and expenses included in the consolidated financial statements of the Company as a parent company, divided between profits or losses and other comprehensive income, except for amounts of revenues and expenses in respect of investee companies. |
| d. | The Company's share in the results of investee companies is presented as a net amount of total revenues less total expenses, which present operating results in the Company's consolidated financial statements, in respect of investee companies, including impairment of goodwill or reversal of impairment loss, divided between profit or loss and other comprehensive income. |
| e. | Amounts of cash flows reflect the amounts included in the consolidated financial statements of the Company as a parent company, except for the amounts of cash flows in respect of investee companies. |
| f. | Loans provided and/or received from investee companies are presented at the amount attributed to the Company as a parent company. |
| g. | Balances, revenues and expenses with respect to transactions with investees, which were reversed on the consolidated financial statements, are measured and presented under the relevant items of the statement of financial standing and the statement of income or comprehensive income, in the same way these transactions would have been measured and presented had they been transacted with third parties. Deferred net gain is presented net of the Company's share of earnings of investees and of investments in investees. |
H - 9
HADERA PAPER LTD
NOTES TO SEPARATE FINANCIAL STATMENTS
NOTE 2 - SUPPLEMENTARY FINANCIAL STATEMENT INFORMATION:
| A. | Cash and cash equivalents |
December 31 | ||||||||
2010 | 2009 | |||||||
NIS in thousands | ||||||||
| Cash and cash equivalents in NIS | 41,453 | 363 | ||||||
| Cash and equivalents in EURO | 2,285 | - | ||||||
NOTE 3 - FINANCIAL INSTRUMENTS AND RISK MANAGEMENT:
| A. | Liquidity risk management |
The Group manages liquidity risks by maintaining suitable funds, banking and loans, ongoing monitoring of actual and anticipated cash flows and adjusting the vesting of financial assets and liabilities. Interest rate and liquidity risk tables |
| 1. | Financial liabilities that do not constitute derivative financial instruments |
| The following tables specify the remaining contractual repayment dates of the Group in respect of financial liabilities, which do not constitute a derivative financial instrument. These tables were prepared based on the non-discounted cash flows of financial liabilities, based on the earliest date in which the Group may be required to repay them. The tables include cash flows in respect of the interest and the principal. |
Average effective interest rate | Till 1 month | 1-3 months | From 3 months to 1 year | From 1 year to 5 years | Above 5 years | Total | ||||||||||||||||||||||
% | NIS in thousands | |||||||||||||||||||||||||||
| 2010 | ||||||||||||||||||||||||||||
| Loans from banks | 4.72 | 5,183 | 5,523 | 31,651 | 110,853 | 14,462 | 167,672 | |||||||||||||||||||||
| Long-term credit from others | 6.30 | 8,052 | - | 8,052 | 64,423 | 32,210 | 112,737 | |||||||||||||||||||||
| Index linked notes carrying permanent interest | 4.99 | - | - | 69,910 | 184,308 | 72,345 | 326,263 | |||||||||||||||||||||
| Notes carrying permanent interest | 6.68 | 7,352 | - | 57,111 | 331,284 | 78,990 | 474,737 | |||||||||||||||||||||
| 20,587 | 5,523 | 166,424 | 690,868 | 198,007 | 1,081,409 | |||||||||||||||||||||||
| 2009 | ||||||||||||||||||||||||||||
| Short-term credit | 2.8 | 42,425 | 40,270 | 20,138 | - | - | 102,833 | |||||||||||||||||||||
| Loans from banks | 4.2 | 1,575 | 2,065 | 21,334 | 86,311 | - | 111,285 | |||||||||||||||||||||
| Long-term credit from others | 6.3 | 8,053 | - | 8,053 | 64,424 | 48,318 | 128,848 | |||||||||||||||||||||
Index linked notes carrying permanent interest (1) | 5.1 | - | - | 71,540 | 224,436 | 98,148 | 394,124 | |||||||||||||||||||||
| Notes carrying permanent interest | 7.5 | 8,847 | - | 47,961 | 198,018 | 42,184 | 297,010 | |||||||||||||||||||||
| 60,900 | 42,335 | 169,026 | 573,189 | 188,650 | 1,034,100 | |||||||||||||||||||||||
H - 10
HADERA PAPER LTD
NOTES TO SEPARATE FINANCIAL STATMENTS
NOTE 3 - FINANCIAL INSTRUMENTS AND RISK MANAGEMENT: (cont.)
| A. | Liquidity risk management (cont.) |
| Interest rate and liquidity risk tables (cont.) |
| 2. | Derivative financial instruments |
| The following table specifies the Group's liquidity analysis with respect to its derivative financial instruments. The table was prepared based on cash payments/ receivables for derivative instruments settled in net and the gross non-discounted cash payments/receivables for these derivatives that require net settlement. When the amount payable or receivable is not fixed, the disclosed amount is determined based on the projected interest rates as described by the interest yield curve as the balance sheet date. |
Till 1 month | ||||
| 2010 | ||||
| Derivative financial instruments not designated as hedging items | ||||
| CPI swap contracts | (238 | ) | ||
| Foreign currency swap contracts | (240 | ) | ||
| Total | (478 | ) | ||
| 2009 | ||||
| Derivative financial instruments designated as hedging items | ||||
| Foreign currency swap contracts | (1,114 | ) | ||
| 3. | Financial assets that do not constitute derivative financial instruments |
| The following tables present the expected repayment dates of the group on account of financial instruments that are not derivatives. The tables were prepared on the basis of the expected, non-discounted repayment dates of the financial assets, including the interest that will accrue from these assets, except for those cases where the group anticipates that the cash flows will be generated in a different period. The tables were prepared based on cash payments/receipts for derivative instruments settled on a net basis and the gross non-discounted cash payments/receipts for those derivatives that require net settlement. When the amount payable or receivable is not fixed, the disclosed amount was determined based on the projected interest rates as described by the existing interest yield curve as at the end of the reporting period |
Till 1 month | 1-3 month | From 3 months to 1 year | From 1 years to 5 year | Total | ||||||||||||||||
| 2010 | ||||||||||||||||||||
| Deposits in the banks | 43,736 | - | - | - | - | |||||||||||||||
| 2009 | ||||||||||||||||||||
| Loans to related parties at depreciated cost | 1,004 | 2,008 | 7,028 | 47,840 | 57,880 | |||||||||||||||
| Deposits in the banks | 128,544 | - | - | - | 128,544 | |||||||||||||||
| 129,548 | 2,008 | 7,028 | 47,840 | 186,424 | ||||||||||||||||
H - 11
HADERA PAPER LTD
NOTES TO SEPARATE FINANCIAL STATMENTS
NOTE 3 - FINANCIAL INSTRUMENTS AND RISK MANAGEMENT: (cont.)
| A. | Liquidity risk management (cont.) |
| 4. | Financial assets that do not constitute derivative financial instruments |
| The following table specifies the Group's liquidity analysis with respect to its derivative financial instruments. The table was prepared based on the cash payments/receipts pertaining to derivative instruments not designated for hedging purposes and to financial instruments designated as hedging items. When the amount payable or receivable is not fixed, the disclosed amount was determined based on the projected interest rates as described by the existing interest yield curve as at the end of the reporting period. |
| Till 1 month | ||||
Derivative financial instruments designated as hedging items: | ||||
| 2009 | ||||
| Foreign currency swap contracts | 3,052 | |||
H - 12
HADERA PAPER LTD
NOTES TO SEPARATE FINANCIAL STATMENTS
NOTE 3 - FINANCIAL INSTRUMENTS AND RISK MANAGEMENT: (cont.)
| B. | Analysis of financial assets and liabilities according to linkage bases and foreign currency |
December 31, 2010 | December 31, 2009 | |||||||||||||||||||||||||||||||
In, or linked to, foreign currency (mainly dollar) | In Euro | Linked to the Israeli CPI | Unlinked | In, or linked to, foreign currency (mainly dollar) | In Euro | Linked to the Israeli CPI | Unlinked | |||||||||||||||||||||||||
NIS in thousands | NIS in thousands | |||||||||||||||||||||||||||||||
| Assets: | ||||||||||||||||||||||||||||||||
| Current assets: | ||||||||||||||||||||||||||||||||
| Cash and cash equivalents and designated deposits | - | 2,285 | - | 41,453 | 9 | 23,952 | - | 104,002 | ||||||||||||||||||||||||
| Receivables | - | - | - | 167,753 | - | - | - | 544,979 | ||||||||||||||||||||||||
| Investments in subsidiaries and associated companies - | ||||||||||||||||||||||||||||||||
| long-term loans and capital notes | 20,487 | - | 52,484 | 585,871 | - | - | 36,674 | 26,258 | ||||||||||||||||||||||||
| 20,487 | 2,285 | 52,484 | 795,077 | 9 | 23,952 | 36,674 | 675,239 | |||||||||||||||||||||||||
| Liabilities: | ||||||||||||||||||||||||||||||||
| Current liabilities: | ||||||||||||||||||||||||||||||||
| Short-term credit from banks | - | - | - | - | - | - | - | 102,446 | ||||||||||||||||||||||||
| Accounts payables and accruals | 13 | 49,575 | 2,078 | 90,669 | 15 | - | - | 90,818 | ||||||||||||||||||||||||
| Financial liabilities at fair value through profit and loss | 11,982 | - | - | - | ||||||||||||||||||||||||||||
| Long-term liabilities (including current maturities): | ||||||||||||||||||||||||||||||||
| Long –term loans | - | - | - | 240,155 | - | - | - | 201,798 | ||||||||||||||||||||||||
| Notes | - | - | 279,765 | 377,997 | - | - | 328,069 | 237,908 | ||||||||||||||||||||||||
| Put option granted to the non controlling interests | - | - | - | 31,512 | - | - | - | - | ||||||||||||||||||||||||
| 13 | 49,575 | 281,843 | 740,333 | 11,997 | - | 328,069 | 632,970 | |||||||||||||||||||||||||
As to exposures relating to fluctuations in foreign currency exchange rates and the use of derivatives for hedging purposes - see a above.
H - 13
HADERA PAPER LTD
NOTES TO SEPARATE FINANCIAL STATMENTS
NOTE 4 - INCOME TAX CHARGE
| A. | Deferred income taxes |
| The composition of the deferred taxes assets (liabilities) are as follows: |
Balance at January 1, 2009 | Recognized in profit and loss | Balance at December 31, 2009 | Recognized in profit and loss | Recognized in equity | Balance at December 31, 2010 | |||||||||||||||||||
| NIS in thousands | ||||||||||||||||||||||||
| Temporary differences | ||||||||||||||||||||||||
| Fixed assets | 3,561 | (1,378 | ) | 2,183 | 154 | (787 | ) | 1,550 | ||||||||||||||||
| Employee benefits provisions | 1,356 | 48 | 1,404 | 260 | 50 | 1,714 | ||||||||||||||||||
| Doubtful debts | 1,672 | (64 | ) | 1,608 | (64 | ) | - | 1,544 | ||||||||||||||||
| 6,589 | (1,394 | ) | 5,195 | 350 | (737 | ) | 4,808 | |||||||||||||||||
| unutilized losses and tax benefits | ||||||||||||||||||||||||
| losses for tax purposes | 7,728 | 300 | 8,028 | (300 | ) | - | 7,728 | |||||||||||||||||
| Total | 14,317 | (1,094 | ) | 13,223 | 50 | (737 | ) | 12,536 | ||||||||||||||||
| Deferred taxes are presented in the balance sheets as follows: |
December 31 | ||||||||
2010 | 2009 | |||||||
NIS in thousands | ||||||||
| Among non-current assets - Deferred tax assets | 12,536 | 13,223 | ||||||
| The Group anticipates the existence of taxable income in future periods apart from profits that will arise from the reversal of taxable temporary differences. The Group also recognized losses for tax purposes, which are expected to be utilized in the next few years against capital gains. As a result of the aforesaid, deferred tax assets were created. |
| B. | Amounts in respect of which deferred tax assets were not recognized |
For the year ended December 31 | ||||||||
2010 | 2009 | |||||||
NIS in thousands | ||||||||
| Real losses from securities | 11,786 | 11,786 | ||||||
| Capital losses for tax purposes | - | 6,975 | ||||||
| Total | 11,786 | 18,762 | ||||||
Expiration dates: in accordance with the tax laws in effect, there is no expiration date for the utilization of losses for tax purposes. The Company does not anticipate any profits in the foreseeable future that will allow it to utilize these losses and has therefore not created deferred tax assets in respect thereof. |
H - 14
HADERA PAPER LTD
NOTES TO SEPARATE FINANCIAL STATMENTS
NOTE 4 - INCOME TAX CHARGE (cont.)
| C. | Tax expense (income) on income recognized in profit and loss |
| 1) | As follows: |
For the year ended December 31 | ||||||||||||
2010 | 2009 | 2008 | ||||||||||
NIS in thousands | ||||||||||||
| For the reported year: | ||||||||||||
| Current | 1,990 | 7,979 | (5,296 | ) | ||||||||
| Previous years | (50 | ) | - | - | ||||||||
| Deferred taxes in respect of the reporting period | (68 | ) | 1,094 | (8,252 | ) | |||||||
| 1,872 | 9,073 | (13,548 | ) | |||||||||
| Current taxes in 2010 were computed at an average tax rate of 25%, 2009– 26% . |
| D. | Tax assessments |
| The Company have received final tax assessments through the year ended December 31, 2005. |
(Adjustments) Law, 1985 (hereafter - the inflationary adjustments law) |
| On February 26, 2008, the Knesset ratified the third reading of the Income Tax Law (Inflation Adjustments) (Amendment 20) (Limitation of Term of Validity) - 2008 (hereinafter: "The Amendment"), pursuant to which the application of the inflationary adjustment law will terminate in tax year 2007 and as of tax year 2008, the law will no longer apply, other than transition regulations whose intention it is to prevent distortions in tax calculations. |
| According to the amendment, from tax year 2008 and thereafter, the adjustment of revenues for tax purposes will no longer be considered a real-term basis for measurement. |
| Moreover, the linkage to the CPI of the depreciated sums of fixed assets and carryover losses for tax purposes will be discontinued, in a manner whereby these sums will be adjusted until the CPI at the end of 2007 and their linkage to the CPI will end as of that date. |
| E. | Additional information |
| In accordance with Amendment No. 147 of the Income Tax Ordinance, 2005, a tax rate of 34% which is applicable to companies was gradually reduced starting from 2006 (for which a tax rate of 31% was determined) until 2010 - for which a tax rate of 25% was determined (the tax rate in the years 2007, 2008 and 2009 is 29%, 27% and 26%, respectively). |
| The Economic Efficiency Law (Legal Amendments to the Implementation of the Economic Program for 2009 and 2010) of 2009, was published in July 23, 2009 (hereinafter: " The Settlement Law"). According to the Settlement Law, the tax rates of 26% and 25% that apply to companies in the years 2009 and 2010, respectively, will be gradually reduced starting in fiscal year 2011, for which a company tax rate of 24% was set, through to fiscal year 2016, for which a company tax rate of 18% was determined. Subsequent to this change, the company recognized deferred tax expense in the amount of NIS 2,022 thousands in 2009. |
H - 15
HADERA PAPER LTD
NOTES TO SEPARATE FINANCIAL STATMENTS
NOTE 5 - MATERIAL ENGAGEMENTS AND TRANSACTIONS WITH INVESTEE COMPANIES
| 1. | Loans: |
| a. | The company granted a loan to an investee company. The loan carries an interest rate of 6% annually, linked to the US dollar. |
The repayment date has yet to be set. The balance of the loan as at December 31, 2010, is NIS 20,487 thousands. |
| b. | The company granted a loan to an investee company. The loan is linked to the CPI and carries interest at a rate of 4% per annum. |
The repayment date has yet to be set. The balance of the loan as at December 31, 2010, is NIS 15,810 thousands. |
| c. | The company granted a loan to an investee company. The loan is linked to the CPI and carries interest at a rate of 4% per annum. |
The balance of the loan as at December 31, 2010, is NIS 27,543 thousands. |
| d. | During 2010 the company granted a loan to an investee company. The loan is carries interest at a rate of 6.55% per annum. |
| The balance of the loan as at December 31, 2010, is NIS 595,000 thousands. |
| 2. | Leasing agreements: |
| The company leases out production areas, offices and warehouses to investee companies, amounting to a total area of 275,000 m², gross, in return for a sum of NIS 34,848 thousands per annum. The period of the lease is not limited. |
| 3. | Other services: |
The company provides its subsidiaries and associated companies with IT services, purchasing management and financing services in return for a sum of NIS 29,146 thousands and NIS 26,899 thousands in the years 2010 and 2009, respectively. |
| The company has made available unlimited guarantees to its subsidiaries companies, in benefit of banks in Israel. |
| 4. | Dividends from investee companies |
| a. | On September 2, 2010 an investee company declared the distribution of a dividend in the amount of approximately NIS 50 million from the retained earnings. The Company’s share in the dividend is approximately NIS 50 million. |
| b. | On September 2, 2010 an investee company declared the distribution of a dividend in the amount of approximately NIS 20 million from the retained earnings. The Company’s share in the dividend is approximately NIS 20 million. |
H - 16
Enclosed please find the financial reports of the following associated companies:
| - | Hadera Paper – Printing and Writing Paper Ltd. |
| - | Hogla-Kimberly Ltd. |
Hadera-Paper LTD group
Meizer st' Industrial Zone,
P.O.B 142 Hadera 38101,Israel
Tel: 972-4-6349402
Fax: 972-4-6339740
hq@hadera-paper.co.il
www.hadera-paper.co.il
Exhibit 5
HADERA PAPER - PRINTING & WRITING PAPER LTD.
FINANCIAL STATEMENTS
AS OF DECEMBER 31, 2010
HADERA PAPER - PRINTING & WRITING PAPER LTD.
FINANCIAL STATEMENTS
AS OF DECEMBER 31, 2010
TABLE OF CONTENTS
Page | |
| M-1 | |
| Consolidated Financial Statements: | |
| M-2 | |
| M-3 | |
| M-4 | |
| M-5 | |
| M-6- M-7 | |
| M-8- M-43 |
 | Brightman Almagor Zohar Haifa Office 5 Ma'aleh Hashichrur Street Haifa, 33284 P.O.B. 5648, Haifa 31055 Israel Tel: +972 (4) 860 7373 Fax: +972 (4) 867 2528 Info-haifa@deloitte.co.il www.deloitte.com |
REPORT OF INDEPENDENT REGISTERED PUBLIC ACCOUNTING FIRM
To the Shareholders of
HADERA PAPER - PRINTING & WRITING PAPER Ltd.
We have audited the accompanying consolidated statements of financial positions of HADERA PAPER - PRINTING & WRITING PAPER Ltd. (“the Company”) as of December 31, 2010 and 2009, and the consolidated income statements, statements of comprehensive income, changes in shareholders’ equity and cash flows of the Company for each of the three years in the period ended December 31, 2010. These financial statements are the responsibility of the Company's board of directors and management. Our responsibility is to express an opinion on these financial statements based on our audit.
We conducted our audits in accordance with generally accepted auditing standards in Israel, including those prescribed under the Auditors' Regulations (Auditor's Mode of Performance), 1973 and the standards of the Public Company Accounting Oversight Board (United States) Those standards require that we plan and perform the audit to obtain reasonable assurance whether the financial statements are free of material misstatement. The Company is not required to have, nor were we engaged to perform, an audit of its internal control over financial reporting. Our audit included consideration of internal control over financial reporting as a basis for designing audit procedures that are appropriate in the circumstances, but not for the purpose of expressing an opinion on the effectiveness of the Company's internal control over financial reporting. Accordingly, we express no such opinion. An audit also includes examining, on a test basis, evidence supporting the amounts and disclosures in the financial statements, assessing the accounting principles used and significant estimates made by the Board of Directors and management, as well as evaluating the overall financial statement presentation. We believe that our audits provide a reasonable basis for our opinion.
In our opinion the consolidated financial statements referred to above present fairly, in all material respects, the financial position of the Company and its subsidiaries as of December 31, 2010 and 2009, and the results of operations, changes in shareholders’ equity and cash flows of the Company on consolidated basis, for each of the three years in the period ended December 31, 2010, in conformity with international financial reporting standards.
Brightman Almagor Zohar & Co.
Certified Public Accountants
A Member Firm of Deloitte Touche Tohmatsu
Israel
21, February, 2011
M - 1
CONSOLIDATED STATEMENTS OF FINANCIAL POSITION
(NIS in thousands)
December 31, | ||||||||||||
Note | 2010 | 2009 | ||||||||||
| Assets | ||||||||||||
| Current assets | ||||||||||||
| Cash and cash equivalents | 4 | 13,111 | 17,076 | |||||||||
| Trade receivables | 5 | 175,575 | 184,415 | |||||||||
| Other receivables | 6 | 6,030 | 2,018 | |||||||||
| Inventories | 7 | 161,649 | 108,202 | |||||||||
| Total current assets | 356,365 | 311,711 | ||||||||||
| Non-current assets | ||||||||||||
| Property, plant and equipment | 10 | 146,111 | 146,731 | |||||||||
| Goodwill | 8A | 3,177 | 3,177 | |||||||||
| Long term trade receivables | - | 167 | ||||||||||
| Total non-current assets | 149,288 | 150,075 | ||||||||||
| Total assets | 505,653 | 461,786 | ||||||||||
| Equity and liabilities | ||||||||||||
| Current liabilities | ||||||||||||
| Short-term bank credit | 13 | 92,852 | 69,440 | |||||||||
| Current maturities of long-term bank loans | 13 | 3,662 | 10,599 | |||||||||
| Trade payables | 11 | 119,809 | 105,624 | |||||||||
| Hadera Paper Ltd. Group, net | 54,455 | 57,595 | ||||||||||
| Other financial liabilities | 14 | - | 432 | |||||||||
| Current tax liabilities | 10,370 | 3,701 | ||||||||||
| Other payables and accrued expenses | 12 | 19,205 | 21,079 | |||||||||
| Dividend declared | 24 | 8,528 | - | |||||||||
| Accrued severance pay, net | 15 | 92 | 206 | |||||||||
| Total current liabilities | 308,973 | 268,676 | ||||||||||
| Non-current liabilities | ||||||||||||
| Long-term bank loans | 13 | 9,357 | 13,019 | |||||||||
| Deferred taxes | 23 | 21,828 | 22,704 | |||||||||
| Employees Benefits | 15 | 2,563 | 2,079 | |||||||||
| Total non-current liabilities | 33,748 | 37,802 | ||||||||||
| Commitments and contingent liabilities | 16 | |||||||||||
| Shareholders' equity | 17 | |||||||||||
| Share capital | 1 | 1 | ||||||||||
| Premium | 43,352 | 43,352 | ||||||||||
| Capital reserves | 929 | 929 | ||||||||||
| Retained earnings | 118,650 | 111,026 | ||||||||||
| 162,932 | 155,308 | |||||||||||
| Total equity and liabilities | 505,653 | 461,786 | ||||||||||
D. Muhlgay Financial Director | A. Solel General Manager | O. Bloch Chairman of the Supervisory Board |
Approval date of the financial statements: February 21, 2011.
The accompanying notes are an integral part of the financial statements.
M - 2
CONSOLIDATED INCOME STATEMENT
(NIS in thousands)
Year ended December 31, | ||||||||||||||||
Note | 2010 | 2009 | 2008 | |||||||||||||
| Revenue | 18 | 728,702 | 669,222 | 732,347 | ||||||||||||
| Cost of sales | 19 | 640,310 | (*) 577,995 | (*) 649,177 | ||||||||||||
| Gross profit | 88,392 | 91,227 | 83,170 | |||||||||||||
| Operating costs and expenses | ||||||||||||||||
| Selling expenses | 20 | 43,254 | (*) 40,236 | (*) 38,756 | ||||||||||||
| General and administrative expenses | 21 | 14,245 | 10,826 | 9,740 | ||||||||||||
| Other (income) expenses | (34 | ) | (376 | ) | 584 | |||||||||||
| 57,465 | 50,686 | 49,080 | ||||||||||||||
| Operating profit | 30,927 | 40,541 | 34,090 | |||||||||||||
| Finance income | (4,293 | ) | (104 | ) | (5,889 | ) | ||||||||||
| Finance costs | 5,862 | 11,363 | 13,496 | |||||||||||||
| Finance costs, net | 22 | 1,569 | 11,259 | 7,607 | ||||||||||||
| Profit before tax | 29,358 | 29,282 | 26,483 | |||||||||||||
| Income tax charge | 23 | 7,286 | 611 | 7,127 | ||||||||||||
| Profit for the year | 22,072 | 28,671 | 19,356 | |||||||||||||
(*) Reclassified.
The accompanying notes are an integral part of the financial statements.
M - 3
HADERA PAPER - PRINTING & WRITING PAPER LTD. AND SUBSIDIARIES
CONSOLIDATED STATEMENTS OF COMPREHENSIVE INCOME
(NIS in thousands)
Year ended December 31, | ||||||||||||
2010 | 2009 | 2008 | ||||||||||
| Profit for the year | 22,072 | 28,671 | 19,356 | |||||||||
| Cash flow hedges, net. | - | 80 | (4,079 | ) | ||||||||
| Transfer to profit or loss from equity on cash flow hedge, net | - | 3,999 | - | |||||||||
| Total comprehensive income for the year (net of tax) | 22,072 | 32,750 | 15,277 | |||||||||
The accompanying notes are an integral part of the financial statements.
M - 4
HADERA PAPER - PRINTING & WRITING PAPER LTD. AND SUBSIDIARIES
(NIS in thousands)
| Share | Capital | Retained | ||||||||||||||||||
capital | Premium | reserves | earnings | Total | ||||||||||||||||
| Year ended December 31, 2010 | ||||||||||||||||||||
| Balance - January 1, 2010 | 1 | 43,352 | 929 | 111,026 | 155,308 | |||||||||||||||
| Profit for the period | - | - | - | 22,072 | 22,072 | |||||||||||||||
| Total comprehensive income for the period | - | - | - | 22,072 | 22,072 | |||||||||||||||
| Dividend paid to shareholders | - | - | - | (5,920 | ) | (5,920 | ) | |||||||||||||
| Dividend declared to shareholders | - | - | - | (8,528 | ) | (8,528 | ) | |||||||||||||
| Balance - December 31, 2010 | 1 | 43,352 | 929 | 118,650 | 162,932 | |||||||||||||||
| Year ended December 31, 2009 | ||||||||||||||||||||
| Balance - January 1, 2009 | 1 | 43,352 | (3,150 | ) | 82,355 | 122,558 | ||||||||||||||
| Profit for the period | - | - | - | 28,671 | 28,671 | |||||||||||||||
| Other comprehensive income for the period | - | - | 4,079 | - | 4,079 | |||||||||||||||
| Total comprehensive income for the period | - | - | 4,079 | 28,671 | 32,750 | |||||||||||||||
| Balance - December 31, 2009 | 1 | 43,352 | 929 | 111,026 | 155,308 | |||||||||||||||
| Year ended December 31, 2008 | ||||||||||||||||||||
| Balance - January 1, 2008 | 1 | 43,352 | 929 | 62,999 | 107,281 | |||||||||||||||
| Profit for the period | - | - | - | 19,356 | 19,356 | |||||||||||||||
| Other comprehensive income for the period | - | - | (4,079 | ) | - | (4,079 | ) | |||||||||||||
| Total comprehensive income for the period | - | - | (4,079 | ) | 19,356 | 15,277 | ||||||||||||||
| Balance - December 31, 2008 | 1 | 43,352 | (3,150 | ) | 82,355 | 122,558 | ||||||||||||||
The accompanying notes are an integral part of the financial statements.
M - 5
HADERA PAPER - PRINTING & WRITING PAPER LTD. AND SUBSIDIARIES
CONSOLIDATED STATEMENTS OF CASH FLOWS
(NIS in thousands)
Year ended December 31, | ||||||||||||
2010 | 2009 | 2008 | ||||||||||
| Cash flows - operating activities | ||||||||||||
| Profit for the year | 22,072 | 28,671 | 19,356 | |||||||||
| Adjustments to reconcile net profit to net | ||||||||||||
| cash used in operating activities | ||||||||||||
| (Appendix A) | (22,315 | ) | 38,406 | 28,840 | ||||||||
| Net cash from operating activities | (243 | ) | 67,077 | 47,196 | ||||||||
| Cash flows - investing activities | ||||||||||||
| Acquisition of property plant and equipment | (5,215 | ) | (4,383 | ) | (9,655 | ) | ||||||
| Proceeds from sale of property plant and Equipment | 506 | 676 | 287 | |||||||||
| Interest received | - | 104 | 415 | |||||||||
| Net cash used in investing activities | (4,709 | ) | (3,603 | ) | (8,953 | ) | ||||||
| Cash flows - financing activities | ||||||||||||
| Short-term bank credit, net | 23,412 | (35,948 | ) | 3,628 | ||||||||
| Repayment of long-term bank loans | (10,619 | ) | (15,929 | ) | (14,024 | ) | ||||||
| Dividend paid to shareholders | (5,920 | ) | - | - | ||||||||
| Repayment of capital notes to shareholders | - | - | (5,700 | ) | ||||||||
| Interest paid | (5,608 | ) | (7,894 | ) | (10,852 | ) | ||||||
| Net cash from (used in) financing activities | 1,265 | (59,771 | ) | (26,948 | ) | |||||||
(Decrease) Increase in cash and cash equivalents | (3,687 | ) | 3,703 | 11,295 | ||||||||
| Cash and cash equivalents at the | ||||||||||||
| beginning of the financial period | 17,076 | 13,315 | 323 | |||||||||
Net foreign exchange difference on cash and cash equivalents | (278 | ) | 58 | 1,697 | ||||||||
| Cash and cash equivalents of the | ||||||||||||
| end of the financial period | 13,111 | 17,076 | 13,315 | |||||||||
The accompanying notes are an integral part of the financial statements.
M - 6
HADERA PAPER - PRINTING & WRITING PAPER LTD. AND SUBSIDIARIES
APPENDICES TO CONSOLIDATED STATEMENTS OF CASH FLOWS
(NIS in thousands)
Year ended December 31, | ||||||||||||
2010 | 2009 | 2008 | ||||||||||
A. Adjustments to reconcile net profit to net cash provided by operating activities | ||||||||||||
| Finance expenses recognized in profit and loss | 1,569 | 11,259 | 7,607 | |||||||||
| Taxes on income recognized in profit and loss | 7,286 | 611 | 7,127 | |||||||||
| Depreciation and amortization | 11,901 | 12,028 | 11,649 | |||||||||
Capital loss (gain) on disposal of property plant and equipment | (34 | ) | (376 | ) | 584 | |||||||
| Changes in assets and liabilities: | ||||||||||||
| Decrease (Increase) in trade receivables and other receivables | 3,316 | (16,582 | ) | 21,652 | ||||||||
| (Increase) Decrease in inventories | (54,578 | ) | 31,565 | 2,551 | ||||||||
| Increase (Decrease) in trade and other payables, and accrued expenses | 12,867 | 11,991 | (21,728 | ) | ||||||||
| Decrease in Hadera Paper Ltd. Group, net | (3,140 | ) | (12,019 | ) | (1,495 | ) | ||||||
| (20,813 | ) | 38,477 | 27,947 | |||||||||
| Income tax paid | (1,502 | ) | (71 | ) | (107 | ) | ||||||
| (22,315 | ) | 38,406 | 27,840 | |||||||||
The accompanying notes are an integral part of the financial statements.
M - 7
HADERA PAPER - PRINTING & WRITING PAPER LTD.
NOTES TO CONSOLIDATED FINANCIAL STATEMENTS
NOTE 1 - DESCRIPTION OF BUSINESS AND GENERAL
| A. | Description of Business |
| 1) | Hadera Paper - Printing & Writing Paper Ltd. (“the Company”) was incorporated and commenced operations on January 1, 2000. The Company and its Subsidiaries are engaged in the production and marketing of paper, mainly in Israel. Following the share purchase agreement signed on September 7, 2010 between the shareholders, on December 31, 2010 the completion of said agreement occurred. At the completion, Neusiedler Holding BV (NL) Ltd sold 25.1% of the issued and outstanding share capital of the Company to Hadera Paper Ltd. In accordance with the above the Company is presently owned by Hadera Paper Ltd. (75%) (the “Parent Company”) and Neusiedler Holding BV (NL) (25%). |
| 2) | On January 24, 2011 the company changed its name from Mondi Hadera Paper Ltd. to Hadera Paper - Printing & Writing Paper Ltd. |
| B. | Definitions: |
The Company | - | Hadera Paper - Printing & Writing Paper Ltd. (formerly Mondi Hadera Paper Ltd.) |
The Group | - | the Company and its Subsidiaries, a list of which is presented in Note 8. |
Subsidiaries | - | companies in which the Company exercises control (as defined by IAS 27), and whose financial statements are fully consolidated with those of the Company. |
Related Parties | - | as defined by IAS 24. |
Interested Parties | - | as defined by IAS 24. |
Controlling Shareholder | - | as defined by IAS 24. |
NIS | - | New Israeli Shekel. |
CPI | - | the Israeli consumer price index. |
Dollar | - | the U.S. dollar. |
Euro | - | the United European currency. |
M - 8
HADERA PAPER - PRINTING & WRITING PAPER LTD.
NOTES TO CONSOLIDATED FINANCIAL STATEMENTS
NOTE 2 - SUMMARY OF SIGNIFICANT ACCOUNTING POLICIES
| A. | Applying international accounting standards (IFRS) |
Statement of compliance
The consolidated financial statements have been prepared using accounting policies consistent with International Financial Reporting Standards as issued by the International Accounting Standards Board (IASB) for all reporting periods presented.
| B. | Basis of preparation |
Until December 31, 2003, Israel was considered a country in which hyper-inflation conditions exist. Therefore, non-monetary balances in the balance sheet were presented on the historical nominal amount and were adjusted to changes in the exchange rate of the U.S. dollar. As of December 31, 2003 when the economy ceased to be hyper-inflationary and the Company no longer adjusted its financial statements to the U.S. dollar, the adjusted amounts as of this date were used as the historical costs. The financial statements were edited on the basis of the historical cost, except for:
| § | Assets and liabilities measured by fair value: changes in the fair value of financial assets and liabilities that are measured by fair value are recorded directly as profit or loss, and changes in the fair value of hedging financial instruments recorded to comprehensive income. |
| § | Non-current assets held for sale are measured at the lower of their previous carrying amount and fair value less costs of sale. |
| § | Inventories are stated at the lower of cost and net realizable value. |
| § | Property, plant and equipment and intangibles assets are presented at the lower of the cost less accumulated amortizations and the recoverable amount. |
| § | Liabilities to employees as described in note 15. |
| C. | Format for presentation of financial position |
The classification of assets and liabilities in the statement of financial position is based on current and noncurrent items.
| D. | Operating cycle |
The operating cycle of the group is 12 months.
E. | Classification of expenses recognized in the statement of income |
The classification of expenses recognized in the statement of income is based on the function of the expense
M - 9
HADERA PAPER - PRINTING & WRITING PAPER LTD.
NOTES TO CONSOLIDATED FINANCIAL STATEMENTS
NOTE 2 - SUMMARY OF SIGNIFICANT ACCOUNTING POLICIES (Cont.)
| F. | Foreign currencies The individual financial statements of each group entity are presented in New Israeli Shekel ("NIS"), the currency of the primary economic environment in which the entity operates (its functional currency). The consolidated financial statements are also presented in NIS which is the functional currency of the Group and the presentation currency for the consolidated financial statements. In preparing the financial statements of the individual entities, transactions in currencies other than the entity’s functional currency (foreign currencies) are recorded at the rates of exchange prevailing at the dates of the transactions. At each balance sheet date, monetary items denominated in foreign currencies are retranslated at the rates prevailing at the balance sheet date. (Non-monetary items carried at fair value that are denominated in foreign currencies are retranslated at the rates prevailing at the date when the fair value was determined). Non-monetary items that are measured in terms of historical cost in a foreign currency are not retranslated. Exchange differences are recognised in profit or loss in the period in which they accrue. |
| G. | Cash and cash equivalents Cash and cash equivalents comprise cash balances available for immediate use and call deposits. Cash equivalents comprise short-term highly liquid investments (with original maturities of three months or less) |
| H. | Basis of consolidation The consolidated financial statements incorporate the financial statements of the Company and entities controlled by the Company (its subsidiaries). Control is achieved where the Company has the power to govern the financial and operating policies of an entity so as to obtain benefits from its activities. Where necessary, adjustments are made to the financial statements of subsidiaries to bring their accounting policies into line with those used by other members of the Group. All intra-group transactions, balances, income and expenses are eliminated in full on consolidation. |
I. | Goodwill Goodwill arising on the acquisition of a subsidiary represents the excess of the cost of acquisition over the Group's interest in the net fair value of the identifiable assets, liabilities and contingent liabilities of the subsidiary or jointly controlled entity recognised at the date of acquisition. Goodwill is initially recognised as an asset at cost and is subsequently measured at cost less any accumulated impairment losses. |
M - 10
HADERA PAPER - PRINTING & WRITING PAPER LTD.
NOTES TO CONSOLIDATED FINANCIAL STATEMENTS
NOTE 2 - SUMMARY OF SIGNIFICANT ACCOUNTING POLICIES (Cont.)
I. | Goodwill (cont.) |
For the purpose of impairment testing, goodwill is allocated to each of the Group’s cash-generating units expected to benefit from the synergies of the combination. Cash-generating units to which goodwill has been allocated are tested for impairment annually, or more frequently when there is an indication that the unit may be impaired. If the recoverable amount of the cash-generating unit is less than the carrying amount of the unit, the impairment loss is allocated first to reduce the carrying amount of any goodwill allocated to the unit and then to the other assets of the unit pro-rata on the basis of the carrying amount of each asset in the unit. An impairment loss recognised for goodwill is not reversed in a subsequent period. On disposal of a subsidiary, the attributable amount of goodwill is included in the determination of the profit or loss on disposal. As of 31.12.10 no impairment is recognised. |
J. | Property, plant and equipment |
Property, plant and equipments are tangible items, which are held for use in the manufacture or supply of goods, which are predicted to be used for more than one period. The Group presents its property, plant and equipments items according to the cost model. Under the cost method - a property, plant and equipment are presented at the balance sheet at cost (net of any investment grants), less any accumulated depreciation and any accumulated impairment losses. The cost includes the cost of the assets acquisition as well as costs that can be directly attributable to bringing the asset to the location and condition necessary for it to be capable of operating in the manner intended by management. Depreciation is calculated using the straight-line method at rates considered adequate to depreciate the assets over their estimated useful lives. Amortization of leasehold improvements is computed over the shorter of the term of the lease, including any option period, where the Group intends to exercise such option, or their useful life. |
| The annual depreciation rates are: | % | |
| Leasehold improvements | 10 | |
| Machinery and equipment | 5-20 | (Mainly 5%) |
| Motor vehicles | 20 | |
| Office furniture and equipment | 6-33 |
Scrap value, depreciation method and the assets useful lives are being reviewed by management at the end of every financial year. Changes are handled as a change of estimation and are applied from here on. The gain or loss arising on the disposal or retirement of an item of property, plant and equipment is determined as the difference between the sales proceeds and the carrying amount of the asset and is recognized in the income statement. The cost of replacing part of a fixed asset item is recognized in the carrying amount of the item if it is probable that the future economic benefits embodied within the part will flow to the Group and its cost can be measured reliably. The carrying amount of the replaced part is derecognized. The costs of day-to-day servicing are recognized in profit or loss as incurred. |
M - 11
HADERA PAPER - PRINTING & WRITING PAPER LTD.
NOTES TO CONSOLIDATED FINANCIAL STATEMENTS
NOTE 2 - SUMMARY OF SIGNIFICANT ACCOUNTING POLICIES (Cont.)
| K. | Impairment of tangible and intangible assets other than goodwill At each balance sheet date, the Group reviews the carrying amounts of its tangible and intangible assets to determine whether there is any indication that those assets have suffered an impairment loss. If any such indication exists, the recoverable amount of the asset is estimated in order to determine the extent of the impairment loss (if any). Where it is not possible to estimate the recoverable amount of an individual asset, the Group estimates the recoverable amount of the cash-generating unit to which the asset belongs. Where a reasonable and consistent basis of allocation can be identified, corporate assets are also allocated to individual cash-generating units, or otherwise they are allocated to the smallest group of cash-generating units for which a reasonable and consistent allocation basis can be identified. Intangible assets with indefinite useful lives and intangible assets not yet available for use are tested for impairment annually, and whenever there is an indication that the asset may be impaired. Recoverable amount is the higher of fair value less costs to sell and value in use. In assessing value in use, the estimated future cash flows are discounted to their present value using a pre-tax discount rate that reflects current market assessments of the time value of money and the risks specific to the asset for which the estimates of future cash flows have not been adjusted. If the recoverable amount of an asset (or cash-generating unit) is estimated to be less than its carrying amount, the carrying amount of the asset (cash-generating unit) is reduced to its recoverable amount. An impairment loss is recognised immediately in profit or loss. Where an impairment loss subsequently reverses, the carrying amount of the asset (cash-generating unit) is increased to the revised estimate of its recoverable amount, but so that the increased carrying amount does not exceed the carrying amount that would have been determined had no impairment loss been recognised for the asset (cash-generating unit) in prior years. A reversal of an impairment loss is recognised immediately in profit or loss. |
M - 12
HADERA PAPER - PRINTING & WRITING PAPER LTD.
NOTES TO CONSOLIDATED FINANCIAL STATEMENTS
NOTE 2 - SUMMARY OF SIGNIFICANT ACCOUNTING POLICIES (Cont.)
| L. | Inventories Inventories are assets held for sale in the ordinary course of business, in the process of production for such sale or in the form of materials or supplies to be consumed in the production process or in the rendering of services. Inventories are stated at the lower of cost and net realizable value. Cost of inventories includes all the cost of purchase, direct labor, fixed and variable production over heads and other cost that are incurred, in bringing the inventories to their present location and condition. Net realizable value is the estimated selling price in the ordinary course of business less the estimated costs of completion and the estimated costs necessary to make the sale. Cost determined as follows: |
| Finished products | - | Based on moving-average basis. |
| Raw, auxiliary materials and other | - | Based on moving-average basis. |
| M. | Provisions Provisions are recognized when the Group has a present obligation (legal or constructive) as a result of a past event, it is probable that the Group will be required to settle the obligation, and a reliable estimate can be made of the amount of the obligation. The amount recognized as a provision is the best estimate of the consideration required to settle the present obligation at the balance sheet date, taking into account the risks and uncertainties surrounding the obligation. Where a provision is measured using the cash flows estimated to settle the present obligation, its carrying amount is the present value of those cash flows. When some or all of the economic benefits to settle a provision are expected to be recovered from a third party, the receivable is recognized as an asset if it is virtually certain that reimbursement will be received and the amount of the receivable can be measured reliably. |
| N. | Financial assets |
| (1) | General Investments are recognized and derecognized on trade date where the purchase or sale of an investment is under a contract whose terms require delivery of the investment within the timeframe established by the market concerned, and are initially measured at fair value, plus transaction costs, except for those financial assets classified as at fair value through profit or loss, which are initially measured at fair value. Financial assets are classified into the following specified categories: |
| · | Financial assets ‘at fair value through profit or loss’ (FVTPL) |
| · | Loans and receivables |
M - 13
HADERA PAPER - PRINTING & WRITING PAPER LTD.
NOTES TO CONSOLIDATED FINANCIAL STATEMENTS
NOTE 2 - SUMMARY OF SIGNIFICANT ACCOUNTING POLICIES (Cont.)
| N. | Financial assets (cont.) |
| (2) | Financial assets at FVTPL Financial assets are classified as at FVTPL where the financial asset is either held for trading or it is designated as at FVTPL. A financial asset is classified as held for trading if: |
| ● | it has been acquired principally for the purpose of selling in the near future; or |
| ● | it is a part of an identified portfolio of financial instruments that the Group manages together and has a recent actual pattern of short-term profit-taking; or |
| ● | it is a derivative that is not designated and effective as a hedging instrument. |
Financial assets at FVTPL are stated at fair value, with any resultant gain or loss recognized in profit or loss. The net gain or loss recognized in profit or loss incorporates any dividend or interest earned on the financial asset.
| (3) | Loans and receivables |
Trade receivables, loans, and other receivables that have fixed or determinable payments that are not quoted in an active market are classified as loans and receivables. Loans and receivables are measured at amortized cost using the effective interest method, less any impairment. Interest income is recognized by applying the effective interest rate, except for short-term receivables when the recognition of interest would be immaterial.
| (4) | Impairment of financial assets |
Financial assets, other than those at FVTPL, are assessed for indicators of impairment at each balance sheet date.
Financial assets are impaired where there is objective evidence that, as a result of one or more events that occurred after the initial recognition of the financial asset, the estimated future cash flows of the investment have been impacted.
For all other financial assets, an objective evidence of impairment could include:
| ● | significant financial difficulty of the issuer or counterparty; or |
| ● | default or delinquency in interest or principal payments; or |
| ● | it becoming probable that the borrower will enter bankruptcy or financial re-organization. |
For financial assets carried at amortized cost, the amount of the impairment is the difference between the asset’s carrying amount and the present value of estimated future cash flows, discounted at the financial asset’s original effective interest rate.
The carrying amount of the financial asset is reduced by the impairment loss directly for all financial assets with the exception of trade receivables, where the carrying amount is reduced through the use of an allowance account.
When a trade receivable is considered uncollectible, it is written off against the allowance account. Subsequent recoveries of amounts previously written off are credited against the allowance account. Changes in the carrying amount of the allowance account are recognized in profit or loss.
M - 14
HADERA PAPER - PRINTING & WRITING PAPER LTD.
NOTES TO CONSOLIDATED FINANCIAL STATEMENTS
NOTE 2 - SUMMARY OF SIGNIFICANT ACCOUNTING POLICIES (Cont.)
| N. | Financial assets (cont.) |
| (4) | Impairment of financial assets (cont.) |
In a subsequent period, the amount of the impairment loss decreases and the decrease can be related objectively to an event occurring after the impairment was recognized, the previously recognized impairment loss is reversed through profit or loss to the extent that the carrying amount of the investment at the date the impairment is reversed does not exceed what the amortized cost would have been had the impairment not been recognized.
| O. | Borrowings |
Borrowings are initially measured at fair value, net of transaction costs and subsequently measured at amortized cost using the effective interest method, with interest expense recognized on an effective yield basis.
The effective interest method is a method of calculating the amortized cost of a financial liability and of allocating interest expense over the relevant period. The effective interest rate is the rate that exactly discounts estimated future cash payments through the expected life of the financial liability, or, where appropriate, a shorter period.
| P. | Derivative financial instruments |
(1) General
The Group entered into a variety of derivative financial instruments to manage its exposure to foreign exchange rate risk and commodity price risk.
Derivatives are initially recognized at fair value at the date a derivative contract is entered into and are subsequently re-measured to their fair value at each balance sheet date. The resulting gain or loss is recognized in profit or loss immediately unless the derivative is designated and effective as a hedging instrument, in which event the timing of the recognition in profit or loss depends on the nature of the hedge relationship. The Group designates certain derivatives as hedges of commodity price risk (cash flow hedges).
A derivative is presented as a non-current asset or a non-current liability if the remaining maturity of the instrument is more than 12 months and it is not expected to be realised or settled within 12 months. Other derivatives are presented as current assets or current liabilities.
(2) Hedge accounting
The Group designates certain hedging instruments, as cash flow hedges.
At the inception of the hedge relationship, the entity documents the relationship between the hedging instrument and the hedged item, along with its risk management objectives and its strategy for undertaking various hedge transactions. Furthermore, at the inception of the hedge and on an ongoing basis, the Group documents whether the hedging instrument that is used in a hedging relationship is highly effective in offsetting changes in cash flows of the hedged item.
M - 15
HADERA PAPER - PRINTING & WRITING PAPER LTD.
NOTES TO CONSOLIDATED FINANCIAL STATEMENTS
NOTE 2 - SUMMARY OF SIGNIFICANT ACCOUNTING POLICIES (Cont.)
| P. | Derivative financial instruments (cont.) |
| (2) | Hedge accounting (cont.) |
The effective part of the changes in the value of financial instruments designated for cash flow hedging is immediately recognized in shareholders' equity and the non-effective part is immediately recognized in the statement of income.
Hedge accounting for cash flows is discontinued when the hedging instrument expires, sold or realized or when the hedging relations no longer meet the threshold conditions for hedging. After the discontinuation of hedge accounting, the amounts carried to shareholders' equity are carried to the income statement while hedged projected transactions are recorded in the income statement.
As of 31.12.10 there are no outstanding cash flow hedge contracts.
| Q. | Revenue recognition |
Revenue is measured at the fair value of the consideration received or receivable. Revenue is reduced for estimated customer returns, rebates and other similar allowances.
(1) Sale of goods
Revenue from the sale of goods is recognised when all the following conditions are satisfied:
| · | The Group has transferred to the buyer the significant risks and rewards of ownership of the goods; |
| · | The Group retains neither continuing managerial involvement to the degree usually associated with ownership nor effective control over the goods sold |
| · | The amount of revenue can be measured reliably; |
| · | It is probable that the economic benefits associated with the transaction will flow to the entity; and |
| · | The costs incurred or to be incurred in respect of the transaction can be measured reliably. |
(2) Interest revenue
Interest revenue is accrued on a time basis, by reference to the principal outstanding and at the effective interest rate applicable, which is the rate that exactly discounts estimated future cash receipts through the expected life of the financial asset to that asset’s net carrying amount.
| R. | Leasing |
Leases are classified as finance leases whenever the terms of the lease transfer substantially all the risks and rewards of ownership to the lessee. All other leases are classified as operating leases.
Operating lease payments are recognised as an expense on a straight-line basis over the lease agreement.
M - 16
HADERA PAPER - PRINTING & WRITING PAPER LTD.
NOTES TO CONSOLIDATED FINANCIAL STATEMENTS
NOTE 2 - SUMMARY OF SIGNIFICANT ACCOUNTING POLICIES (Cont.)
| S. | Taxation |
Income tax expense represents the sum of the tax currently payable and deferred tax.
(1) Current tax
The tax currently payable is based on taxable profit for the year. Taxable profit differs from profit as reported in the income statement because it excludes items of income or expense that are taxable or deductible in other years and it further excludes items that are never taxable or deductible. The Group’s liability for current tax is calculated using tax rates that have been enacted or substantively enacted by the balance sheet date.
(2) Deferred tax
Deferred tax is recognised on differences between the carrying amounts of assets and liabilities in the financial statements and the corresponding tax bases used in the computation of taxable profit, and are accounted for using the balance sheet liability method. Deferred tax liabilities are generally recognised for all taxable temporary differences, and deferred tax assets are generally recognised for all deductible temporary differences to the extent that it is probable that taxable profits will be available against which those deductible temporary differences can be utilised. Such assets and liabilities are not recognised if the temporary difference arises from goodwill or from the initial recognition (other than in a business combination) of other assets and liabilities in a transaction that affects neither the taxable profit nor the accounting profit.
The carrying amount of deferred tax assets is reviewed at each balance sheet date and reduced to the extent that it is no longer probable that sufficient taxable profits will be available to allow all or part of the asset to be recovered.
Deferred tax assets and liabilities are measured at the tax rates that are expected to apply in the period in which the liability is settled or the asset realised, based on tax rates (and tax laws) that have been enacted or substantively enacted by the balance sheet date. The measurement of deferred tax liabilities and assets reflects the tax consequences that would follow from the manner in which the Group expects, at the reporting date, to recover or settle the carrying amount of its assets and liabilities.
Deferred tax assets and liabilities are offset when there is a legally enforceable right to set off current tax assets against current tax liabilities and when they relate to income taxes levied by the same taxation authority and the Group intends to settle its current tax assets and liabilities on a net basis.
(3) Current and deferred tax for the period
Current and deferred tax are recognized as an expense or income in profit or loss, except when they relate to items credited or debited directly to equity, in which case the tax is also recognized directly in equity, or where they arise from the initial accounting for a business combination. In the case of a business combination, the tax effect is taken into account in calculating goodwill or in determining the excess of the acquirer’s interest in the net fair value of the acquirer's identifiable assets, liabilities and contingent liabilities over the cost of the business combination.
M - 17
HADERA PAPER - PRINTING & WRITING PAPER LTD.
NOTES TO CONSOLIDATED FINANCIAL STATEMENTS
NOTE 2 - SUMMARY OF SIGNIFICANT ACCOUNTING POLICIES (Cont.)
| T. | Employee benefits |
| (1) | Post-Employment Benefits |
The Group's post-employment benefits include: benefits to retirees and liabilities for severance benefits. The Group's post-employment benefits are classified as either defined contribution plans or defined benefit plans. Most of the Group's employees are covered by Article 14 to the Severance Law and therefore the Group's companies makes regular deposits (contributions) in the name of their employees and do not have an obligation to pay further contributions. The Group's deposits under the Defined Contribution Plan are carried to the income statements on the date of the provision of work services, in respect of which the Group is obligated to make the deposit and no additional provision in the financial statements is required.
Expenses in respect of a Defined Benefit Plan are carried to the income statement in accordance with the Projected Unit Credit Method, while using actuarial estimates that are performed at each balance sheet date. The current value of the Group's obligation in respect of the defined benefit plan is determined by discounting the future projected cash flows from the plan by the market yields on government bonds, denominated in the currency in which the benefits in respect of the plan will be paid, and whose redemption periods are approximately identical to the projected settlement dates of the plan.
Actuarial profits and losses are carried to the income statements on the date they were incurred. The Past Service Cost is immediately recognized in the Group's income statement to the extent the benefit has vested. A past service cost which has not yet vested is amortized on a straight-line basis over the average vesting period until the benefit becomes vested.
The Group's liability in respect of the Defined Benefit Plan which is presented in the Group's balance sheet includes the current value of the obligation in respect of the defined benefit. A net plan, which is created from said calculation, is limited to the amount of the actuarial losses and past service cost that were not yet recognized with the addition of the current value of available economic benefits in the shape of returns from the plan or in the shape of reduction in future contributions to the plan.
| (2) | Other long term employee benefits |
Other long term employee benefits are benefits which it is anticipated will be utilized or which are to be paid during a period that exceeds 12 months from the end of the period in which the service that creates entitlement to the benefit was provided.
M - 18
HADERA PAPER - PRINTING & WRITING PAPER LTD.
NOTES TO CONSOLIDATED FINANCIAL STATEMENTS
NOTE 2 - SUMMARY OF SIGNIFICANT ACCOUNTING POLICIES (Cont.)
| T. | Employee benefits (cont.) |
| (2) | Other long term employee benefits (Cont.) Other employee benefits of the Group include liabilities for early retirement. These liabilities are recorded to statement of operations in accordance with the projected unit credit method. The present value of the Group’s obligation for early retirement was determined by means of the capitalization of anticipated future cash flows from the program at market yields of government bonds, denominated in the currency in which the benefits for early retirement will be paid. |
| (3) | Short term employee benefits Short term employee benefits are benefits which it is anticipated will be utilized or which are to be paid during a period that does not exceed 12 months from the end of the period in which the service that creates entitlement to the benefit was provided. Short term Group benefits include the Group’s liability for short term absences, payment of grants, bonuses and compensation. These benefits are recorded to the statement of operations when created. The benefits are measured on a non capitalized basis. The difference between the amount of the short term benefits to which the employee is entitled and the amount paid is therefore recognized as an asset or liability. |
| U. | Exchange Rates and Linkage Basis Following are the change in the representative exchange rates of the Euro and the U.S. dollar vis-à-vis the NIS and in the Israeli Consumer Price Index (“CPI”): |
As of: | Representative exchange rate of the Euro (NIS per €1) | Representative exchange rate of the dollar (NIS per $1) | CPI “in respect of” (in points) | |||||||||
| December 31, 2010 | 4.7379 | 3.549 | 117.82 | |||||||||
| December 31, 2009 | 5.4417 | 3.775 | 114.88 | |||||||||
| December 31, 2008 | 5.2973 | 3.802 | 110.55 | |||||||||
| Increase (decrease) during the: | % | % | % | |||||||||
| Year ended December 31, 2010 | (12.93 | ) | (5.99 | ) | 2.66 | |||||||
| Year ended December 31, 2009 | 2.72 | (0.71 | ) | 3.90 | ||||||||
| Year ended December 31, 2008 | (6.40 | ) | (1.14 | ) | 3.90 | |||||||
| V. | Reclassification |
Comparative figures relating to years 2008 and 2009 were reclassified in these financial statements as follows: NIS 463 thousand in 2008 and NIS 542 thousand in 2009 were reclassified from depreciation in cost of sales to depreciation in selling expenses.
M - 19
HADERA PAPER - PRINTING & WRITING PAPER LTD.
NOTES TO CONSOLIDATED FINANCIAL STATEMENTS
NOTE 2 - SUMMARY OF SIGNIFICANT ACCOUNTING POLICIES (Cont.)
| W. | Adoption of new and revised Standards and interpretations |
| A. | Standards and Interpretations Affecting Amounts Reported in the Current Period (and/ or prior periods) |
Standards Affecting Presentation and Disclosure
IAS 1 - Presentation of Financial Statements
Amendment IAS 1 "presentation of financial statements", which stipulates that changes in the components of the other comprehensive income will be presented in the statement of changes in equity or in the notes to the financial statements, according to the company's policy.
In accordance to the above, the company presents the changes in the components of the other comprehensive income in the changes in shareholder equity statements.
| B. | Standards and Interpretations which have not been applied in these financial statements were in issue but not yet effective |
IFRS 7 - Disclosures of Financial Instruments
The amendments to IFRS 7 clarify the required level of disclosures about credit risk and collateral held and provide relief from disclosures previously required regarding renegotiated loans. The Group has applied the amendments in advance of their effective date (annual periods beginning on or after 1 January 2011). The amendments have been applied retrospectively.
IFRS 9 “Financial Instruments”
The new Standard provides for the classification and measurement of financial assets and liabilities. In accordance with the Standard, all financial assets are to be treated as follows:
| · | Debt instruments will be classified and measured subsequent to initial recognition at amortized cost or at fair value through profit or loss. The mode of measurement will be determined based on the entity’s business model for managing financial assets and in accordance with the characteristics of the contractual cash flows deriving from such financial assets. |
| · | A debt instrument which, according to the criteria, is measured at amortized cost may only be designated at fair value through profit or loss if such designation eliminates inconsistencies in the recognition and measurement that would have arose had the asset been measured at amortized cost. |
| · | Equity instruments will be measured at fair value through profit or loss. |
| · | Equity instruments may be designated at fair value through profit or loss, with any gains or losses being recognized in other comprehensive income. Instruments that have been designated as aforesaid will cease to be tested for impairment and any related gain or loss will not be recognized in profit or loss, including in the event of disposal. |
M - 20
HADERA PAPER - PRINTING & WRITING PAPER LTD.
NOTES TO CONSOLIDATED FINANCIAL STATEMENTS
NOTE 2 - SUMMARY OF SIGNIFICANT ACCOUNTING POLICIES (Cont.)
| W. | Adoption of new and revised Standards and interpretations |
| B. | Standards and Interpretations which have not been applied in these financial statements were in issue but not yet effective |
| · | Embedded derivatives in financial assets will not be separated from the host contract. Instead, hybrid contracts will be measured as a whole at amortized cost or at fair value, in accordance with the business model and the contractual cash flows criteria. |
| · | Debt instruments will be reclassified from amortized cost to fair value and vice versa only if the entity changes its business model for managing financial assets. |
| · | Investments in equity instruments that are not quoted on an active market, including derivatives on such assets, will be measured solely at fair value. The alternative measurement at cost under certain circumstances has been eliminated. Nevertheless, the Standard determines that, under limited circumstances, cost may be an appropriate estimate of fair value. |
The Standard also prescribes the following provisions with respect to financial liabilities:
| · | The change in the fair value of a financial liability that is designated at fair value through profit or loss upon initial recognition, which is attributed to changes in the credit risk of the liability, is recognized directly in other comprehensive income, unless such recognition gives rise to or increases accounting disparity. |
| · | Upon the repayment or settlement of a financial liability, the amount of the fair value recognized in other comprehensive income will not be classified to profit or loss. |
| · | All derivatives, whether assets or liabilities, will be measured at fair value, including a derivative financial instrument that constitutes a liability, which is related to an unquoted equity instrument for which a fair value cannot be determined reliably. |
The provisions of the Standard are to be applied retrospectively, other than in a number of exceptions provided for in the Standard, to annual reporting periods commencing on January 1, 2013 or thereafter. Early adoption is permitted. Entities that opt for early adoption of the Standard prior to January 1, 2012 are not required to apply the Standard retrospectively. Additionally, subject to the transitional provisions of the Standard, early adoption solely of the provisions of the Standard with respect to financial assets, excluding the aforesaid provisions relating to financial liabilities, is permissible.
The Company’s management estimates that the effect of the adoption of the Standard on the financial statements of the Group will be insignificant.
M - 21
HADERA PAPER - PRINTING & WRITING PAPER LTD.
NOTES TO CONSOLIDATED FINANCIAL STATEMENTS
NOTE 3 - SIGNIFICANT ACCOUNTING JUDGEMENT AND KEY SOURCES OF ESTIMATION UNCERTAINTY
| A. | General |
In the application of the Group’s accounting policies, which are described in Note 2, the management is required to make judgments, estimates and assumptions about the carrying amounts of assets and liabilities. The estimates and associated assumptions are based on historical experience and other factors that are considered to be relevant. Actual results may differ from these estimates.
The estimates and underlying assumptions are reviewed on an ongoing basis. Revisions to accounting estimates are recognized in the period in which the estimate is revised if the revision affects only that period or in the period of the revision and future periods if the revision affects both current and future periods.
| B. | Significant judgments in applying accounting policies |
The following are the significant judgments, apart from those involving estimations (see below), that the management have made in the process of applying the entity’s accounting policies and that have the most significant effect on the amounts recognized in financial statements.
| • | Useful lives of property, plant and equipment - As described at 2J above, the Group reviews the estimated useful lives of property, plant and equipment at the end of each annual reporting period. |
| • | Impairment of goodwill - Determining whether goodwill is impaired requires an estimation of the value in use of the cash-generating units to which goodwill has been allocated. The value in use calculation requires the management to estimate the future cash flows expected to arise from the cash-generating unit and a suitable discount rate in order to calculate present value. The carrying amount of goodwill at the balance sheet date was NIS 3,177 thousand. |
| • | Deferred taxes- the company recognizes deferred tax assets for all of the deductible temporary differences up to the amount as to which it is anticipated that there will be taxable income against which the temporary difference will be deductible. During each period, for purposes of calculation of the utilizable temporary difference, management uses estimates and approximations as a basis which it evaluates each period. |
| C. | Key sources of estimation uncertainty |
| • | In determining the recoverability of a trade receivable, the Group considers any change in the credit quality of the trade receivable from the date credit was initially granted up to the end of the reporting period. The concentration of credit risk is limited due to the customer base being large and unrelated. Included in the allowance for doubtful debts are individually impaired trade receivables. The impairment recognized represents the difference between the carrying amount of these trade receivable and the present value of the expected proceeds. The Group does not hold any collateral over these balances. |
M - 22
HADERA PAPER - PRINTING & WRITING PAPER LTD.
NOTES TO CONSOLIDATED FINANCIAL STATEMENTS
NOTE 4 - CASH AND CASH EQUIVALANTS
As of December 31, | ||||||||
2010 | 2009 | |||||||
| Cash in bank – NIS | 627 | 4,697 | ||||||
| Cash in bank - foreign currency | 12,484 | 12,379 | ||||||
| 13,111 | 17,076 | |||||||
NOTE 5 - TRADE RECEIVABLES
As of December 31, | ||||||||
2010 | 2009 | |||||||
| Domestic | ||||||||
| Open accounts | 151,251 | 145,914 | ||||||
| Checks receivable | 18,285 | 21,621 | ||||||
| 169,536 | 167,535 | |||||||
| Foreign | ||||||||
| Open accounts | 13,035 | 20,676 | ||||||
| 182,571 | 188,211 | |||||||
Less - allowance for doubtful accounts | (6,996 | ) | (3,796 | ) | ||||
| 175,575 | 184,415 | |||||||
The average credit period on sales of goods is 94 days. Trade receivables are provided for based on estimated irrecoverable amounts from the sale of goods, determined by reference to past default experience.
Before accepting any new customer, the Group assesses the potential customer's credit quality and defines credit limits by customer.
Of the trade receivables balance at the end of the year, NIS 13.7 million (2009: NIS 14.9 million) is due from Company A, the Group's largest customer and NIS 10.1 million (2009: NIS 8.3 million) from Company B and NIS 9.7 million (2009: NIS 6.2 million) from Company C There are no other customers who represent more than 5% of the total balance of trade receivables.
Included in the Group's trade receivable balance are debtors with a carrying amount of NIS 7.8 million which are past due at the reporting date for which the Group has not provided as there has not been a significant change in credit quality and the amounts are still considered recoverable. The Group does not hold any collateral over these balances.
Aging of past due but not impaired
31/12/10 | ||||
| 30-60 days | 6,580 | |||
| 60-90 days | 1,154 | |||
| 90-120 days | 112 | |||
| Total | 7,846 | |||
The Group has a policy for the allowance for doubtful debts which calls for an increasing rate of allowance for outstanding debts that are unsecured. The rate of impairment increases in line with the age of the debt.
M - 23
HADERA PAPER - PRINTING & WRITING PAPER LTD.
NOTES TO CONSOLIDATED FINANCIAL STATEMENTS
NOTE 5 - TRADE RECEIVABLES (Cont.)
Movement in the allowance for doubtful debts
Year ended December 31, | |||||||||
2010 | 2009 | ||||||||
| Balance at beginning of the year | 3,796 | 4,160 | |||||||
| Impairment losses recognized on receivables | 3,837 | 2,599 | |||||||
| Amounts written off as uncollectable | (637 | ) | (2,963 | ) | |||||
| Balance at end of the year | 6,996 | 3,796 | |||||||
NOTE 6 - OTHER RECEIVABLES
As of December 31, | |||||||||
2010 | 2009 | ||||||||
| Prepaid expenses | 87 | 1,369 | |||||||
| Advances to suppliers | 506 | 285 | |||||||
| Value Added Tax | 5,065 | - | |||||||
| Others | 372 | 364 | |||||||
| 6,030 | 2,018 | ||||||||
NOTE 7 - INVENTORIES
As of December 31, | |||||||
2010 | 2009 | ||||||
| Raw and auxiliary materials | 68,657 | 42,235 | |||||
| Good in process | 10,017 | 5,734 | |||||
| Finished products | 82,975 | 60,233 | |||||
| 161,649 | 108,202 | ||||||
| Includes products in transit | 24,372 | 22,600 | |||||
| The inventories are presented net of impairment provision | 2,792 | 3,218 | |||||
M - 24
HADERA PAPER - PRINTING & WRITING PAPER LTD.
NOTES TO CONSOLIDATED FINANCIAL STATEMENTS
NOTE 8 - INVESTMENTS IN SUBSIDIARIES
As of December 31, | ||||||||
2010 | 2009 | |||||||
A. Goodwill, Net | 3,177 | 3,177 | ||||||
Impairment tests for goodwill are discussed in note 2E.
B. Consolidated Subsidiaries
The consolidated financial statements as of December 31, 2010, include the financial statements of the following Subsidiaries:
| Ownership and control | ||||
As of December 31, | ||||
2010 | ||||
% | ||||
| Hadera Paper Printing & Writing Paper Marketing Ltd. | 100.00 | |||
| Grafinir Paper Marketing Ltd. | 100.00 | |||
| Yavnir (1999) Ltd. | 100.00 | |||
| Miterani Paper Marketing 2000 (1998) Ltd. | 100.00 | |||
NOTE 9 - FINANCIAL ASSETS
The carrying amounts of the group's financial assets are presented as follows:
As of December 31, | ||||||||
2010 | 2009 | |||||||
| Trade and other receivables | 176,453 | 185,231 | ||||||
| Cash and cash equivalents | 13,111 | 17,076 | ||||||
| 189,564 | 202,307 | |||||||
M - 25
HADERA PAPER - PRINTING & WRITING PAPER LTD.
NOTES TO CONSOLIDATED FINANCIAL STATEMENTS
NOTE 10 - PROPERTY PLANT AND EQUIPMENT
| Office | ||||||||||||||||||||
| Furniture, | ||||||||||||||||||||
| �� | Machinery | Computers | ||||||||||||||||||
| Leasehold | and | Motor | and | |||||||||||||||||
improvements | equipment | vehicles | equipment | Total | ||||||||||||||||
| Consolidated | ||||||||||||||||||||
| Cost: | ||||||||||||||||||||
| Balance - January 1, 2009 | 4,403 | 212,279 | 5,166 | 3,630 | 225,478 | |||||||||||||||
| Changes during 2009 | ||||||||||||||||||||
| Additions | 628 | 3,454 | - | 301 | 4,383 | |||||||||||||||
| Dispositions | - | (1,206 | ) | (380 | ) | - | (1,586 | ) | ||||||||||||
| Increase spare parts stock | - | 235 | - | - | 235 | |||||||||||||||
| Balance - December 31, 2009 | 5,031 | 214,762 | 4,786 | 3,931 | 228,510 | |||||||||||||||
| Changes during 2010: | ||||||||||||||||||||
| Additions | 1,124 | 8,547 | 23 | 928 | 10,622 | |||||||||||||||
| Dispositions | (197 | ) | (368 | ) | (1,028 | ) | (251 | ) | (1,844 | ) | ||||||||||
| Increase spare parts stock | - | 1,131 | - | - | 1,131 | |||||||||||||||
| Balance - December 31, 2010 | 5,958 | 224,072 | 3,781 | 4,608 | 238,419 | |||||||||||||||
| Accumulated depreciation | ||||||||||||||||||||
| Balance - January 1, 2009 | 2,573 | 63,139 | 2,886 | 2,439 | 71,037 | |||||||||||||||
| Changes during 2009 | ||||||||||||||||||||
| Additions | 517 | 10,189 | 756 | 566 | 12,028 | |||||||||||||||
| Dispositions | - | (1,007 | ) | (279 | ) | - | (1,286 | ) | ||||||||||||
| Balance - December 31, 2009 | 3,090 | 72,321 | 3,363 | 3,005 | 81,779 | |||||||||||||||
| Changes during 2010: | ||||||||||||||||||||
| Additions | 358 | 10,419 | 547 | 577 | 11,901 | |||||||||||||||
| Dispositions | (173 | ) | (69 | ) | (900 | ) | (230 | ) | (1,372 | ) | ||||||||||
| Balance - December 31, 2010 | 3,275 | 82,671 | 3,010 | 3,352 | 92,308 | |||||||||||||||
| Net book value: | ||||||||||||||||||||
| December 31, 2010 | 2,683 | 141,401 | 771 | 1,256 | 146,111 | |||||||||||||||
| December 31, 2009 | 1,941 | 142,441 | 1,423 | 926 | 146,731 | |||||||||||||||
M - 26
HADERA PAPER - PRINTING & WRITING PAPER LTD.
NOTES TO CONSOLIDATED FINANCIAL STATEMENTS
(NIS in thousands)
NOTE 11 - TRADE PAYABLES
As of December 31, | ||||||||
2010 | 2009 | |||||||
| In Israeli currency | 24,538 | 29,355 | ||||||
In foreign currency or linked thereto (1) | 95,271 | 76,269 | ||||||
| 119,809 | 105,624 | |||||||
As of December 31, | ||||||||
2010 | 2009 | |||||||
| (1) | ||||||||
USD | 77,408 | 55,588 | ||||||
EUR | 17,863 | 20,681 | ||||||
| 95,271 | 76,269 | |||||||
NOTE 12 - OTHER PAYABLES AND ACCRUED EXPENSES
As of December 31, | ||||||||
2010 | 2009 | |||||||
| Accrued payroll and related expenses | 15,142 | 14,048 | ||||||
| Value Added Tax | - | 4,238 | ||||||
| Advances from customers | 1,323 | 314 | ||||||
| Interest payable | 288 | 265 | ||||||
| Other | 2,452 | 2,214 | ||||||
| 19,205 | 21,079 | |||||||
NOTE 13 - BORROWINGS
Interest rate | As of December 31, | ||||||||||||
| %(*) | 2010 | 2009 | |||||||||||
A. Secured | |||||||||||||
In NIS – Short term Bank loans | 3.08 | 92,852 | 69,440 | ||||||||||
In NIS – not linked | 5.72 | 13,019 | 19,966 | ||||||||||
In NIS indexed to the CPI | - | 3,652 | |||||||||||
| 105,871 | 93,058 | ||||||||||||
(*) Average interest rate as of December 31, 2010.
M - 27
HADERA PAPER - PRINTING & WRITING PAPER LTD.
NOTES TO CONSOLIDATED FINANCIAL STATEMENTS
(NIS in thousands)
NOTE 13 - BORROWINGS (Cont.)
As of December 31, | ||||
2010 | ||||
B. Maturities of long term loans | ||||
First year - 2011 | 3,662 | |||
Second year - 2012 | 2,563 | |||
Third year - 2013 | 2,649 | |||
Fourth year - 2014 | 2,740 | |||
Fifth year - 2015 | 1,405 | |||
| 13,019 | ||||
| C. | According to the loan agreements with the banks, as amended in the second half of 2005, the Company has to achieve, inter alia, financial ratio at the end of each audited fiscal year of total shareholders' equity (which includes capital notes to shareholders) to total assets to be no less than 22%. In case the Company fails to fulfill these covenants, the banks are entitled to demand early repayment of the loans, in whole or in part. |
As of December 31, 2010, the Company was in full compliance with the covenants stipulated in the bank agreements and this financial ratio amounted to 32.2%.
| D. | As to a "negative pledge agreement" signed by the Company, see Note 16B. |
| E. | The Company and its Subsidiaries have been granted a total bank credit facility, pursuant to which the Company and its Subsidiaries may, from time to time, borrow an aggregate principal amount of up to adjusted NIS 305,823 thousand. As of the balance sheet date, the Group utilized NIS 93,284 thousand of the credit facility as long & short term borrowings and as bank guarantees granted to third parties. |
NOTE 14 - OTHER FINANCIAL LIABILITIES
As of December 31, | ||||||||
2010 | 2009 | |||||||
| Derivatives carried at fair value through profit or loss | - | 432 | ||||||
M - 28
HADERA PAPER - PRINTING & WRITING PAPER LTD.
NOTES TO CONSOLIDATED FINANCIAL STATEMENTS
(NIS in thousands)
NOTE 15 - EMPLOYEE BENEFITS
| A. | Composition |
As of December 31, | ||||||||||||
2010 | 2009 | 2008 | ||||||||||
| Post Employment Benefits: | ||||||||||||
| Benefits to retirees | 2,563 | 2,079 | 1,364 | |||||||||
| Accrued severance pay | 92 | 206 | 214 | |||||||||
| Short term employee benefits: | ||||||||||||
| Accrued payroll and related expenses | 9,048 | 8,121 | 8,791 | |||||||||
| Liability for vacation pay | 6,094 | 5,927 | 5,163 | |||||||||
| 17,797 | 16,333 | 15,532 | ||||||||||
| B. | Defined contribution plan Most of the Group's employees are covered by Article 14 to the Severance Law and therefore the Group's companies makes regular deposits (contributions) in the name of their employees and do not have an obligation to pay further contributions. The Group's deposits under the Defined Contribution Plan are carried to the income statements on the date of the provision of work services, in respect of which the Group is obligated to make the deposit and no additional provision in the financial statements is required. The total expense recognized in the income statement of NIS 6,916 thousand represents contributions to these plans by the group. |
| C. | Actuarial assumptions The groups defined benefit plans has been calculated by estimating the present value of the future probable obligation used actual valuation methods. The discounted rate is based on field on government bonds at a fixed interest rate which have an average lifetime equal to that of the gross liability. The actuarial assumptions used in the plan are detailed bellow. |
| D. | Defined benefit plans The groups defined benefit plans include early retirement and benefits to retirees – holiday gifts and paper distribution. The principal assumptions used for the purposes of the actuarial valuations were as follows: |
Valuation at | ||||||||||||
2010 | 2009 | 2008 | ||||||||||
| Discount rate | 4.9%-5.7 | % | 5.54%-6 | % | 5.9 | % | ||||||
| Expected rate of inflation | 2.7%-2.8 | % | 2.6%-2.7 | % | 2.1 | % | ||||||
| Expected rate of leaving | 3%-14 | % | 3%-14 | % | 3%-11 | % | ||||||
M - 29
HADERA PAPER - PRINTING & WRITING PAPER LTD.
NOTES TO CONSOLIDATED FINANCIAL STATEMENTS
(NIS in thousands)
NOTE 15 - EMPLOYEE BENEFITS (Cont.)
| D. | Defined benefit plans (cont.) |
Amounts recognized in profit or loss in respect of these defined benefit plans are as follows:
Year ended December 31, | ||||||||||||
2010 | 2009 | 2008 | ||||||||||
| Current service cost | 25 | 20 | 17 | |||||||||
| Interest on obligations | 65 | 61 | 66 | |||||||||
| Actuarial losses (gains) recognized in the year | 145 | 44 | (382 | ) | ||||||||
| Benefit paid during the year | (51 | ) | (49 | ) | (42 | ) | ||||||
| 184 | 76 | (341 | ) | |||||||||
The amount included in the balance sheet arising from the entity's obligation in respect of its defined benefit plans is as follows:
As of December 31, | ||||||||||||
2010 | 2009 | 2008 | ||||||||||
| Present value of funded defined benefit obligation | 1,318 | 1,134 | 1,058 | |||||||||
Movements in the present value of the defined benefit obligation in the current period were as follows:
As of December 31, | ||||||||||||
2010 | 2009 | 2008 | ||||||||||
| Opening defined benefit obligation | 1,134 | 1,058 | 1,399 | |||||||||
| Current service cost | 25 | 20 | 17 | |||||||||
| Interest cost | 65 | 61 | 66 | |||||||||
| Actuarial losses (gains) | 145 | 44 | (382 | ) | ||||||||
| Benefits paid | (51 | ) | (49 | ) | (42 | ) | ||||||
| Closing defined benefit obligation | 1,318 | 1,134 | 1,058 | |||||||||
M - 30
HADERA PAPER - PRINTING & WRITING PAPER LTD.
NOTES TO CONSOLIDATED FINANCIAL STATEMENTS
(NIS in thousands)
NOTE 15 - EMPLOYEE BENEFITS (Cont.)
| D. | Other long term employee benefits Other long term employee benefits are benefits which it is anticipated will be utilized or which are to be paid during a period that exceeds 12 months from the end of the period in which the service that creates entitlement to the benefit was provided. Other employee benefits of the Group include liabilities for early retirement. The obligation in respect of early retirement includes an obligation for pension of the period starting the date of the early retirement up to reaching the legal retirement age. The amount included in the balance sheet arising from the entity's obligation in respect of early retirement is as follows: |
Year ended December 31, | ||||||||||||
2010 | 2009 | 2008 | ||||||||||
NIS in thousands | ||||||||||||
| Present value of defined benefit obligation | 1,245 | 945 | 306 | |||||||||
Movements in the present value of obligation for early retirement in the current period were as follows:
Year ended December 31, | ||||||||||||
2010 | 2009 | 2008 | ||||||||||
NIS in thousands | ||||||||||||
| Opening defined benefit obligation | 945 | 306 | - | |||||||||
| Interest cost | 64 | 54 | - | |||||||||
| Current service cost | 474 | 759 | 306 | |||||||||
| Benefits paid | (238 | ) | (174 | ) | - | |||||||
| Closing defined benefit obligation | 1,245 | 945 | 306 | |||||||||
M - 31
HADERA PAPER - PRINTING & WRITING PAPER LTD.
NOTES TO CONSOLIDATED FINANCIAL STATEMENTS
(NIS in thousands)
NOTE 16 - COMMITMENTS AND CONTINGENT LIABILITIES
| A. | Commitments: |
The Company and its Subsidiaries lease certain of their facilities under operating leases for varying periods with renewal options primarily from Hadera Paper Group. In November 2010, the group moved to a new logistics center in Modi'in ("the site"), Hadera Paper has signed an operational lease agreement on September, 28 under which it has undertaken to lease the site for the Company along with two of Hadera paper's subsidiaries. The Company has signed a guarantee for her part of the site agreement. At the balance sheet date, the group had outstanding commitments under non cancellable operating leases, which fall due as follows:
Consolidated | ||||
| Within 1 Year | 7,844 | |||
| Between 1 to 2 Years | 7,844 | |||
| Between 2 to 5 Years | 23,531 | |||
| 39,218 | ||||
| B. | Liens To secure long-term bank loans and short-term bank credits (the balance of which as of December, 31 2010 is NIS 105,871 thousand), the Company entered into a “negative pledge agreement” under which the Company is committed not to pledge any of its assets, excluding fixed pledges relating to assets financed by others, prior to the consent of the banks. |
| C. | Guarantees The Company from time to time and in the course of its ongoing operations provides guarantees. |
NOTE 17 - SHAREHOLDERS' EQUITY
| A. | As of December 31, 2010, 2009 and 2008, share capital is composed of ordinary shares of NIS 1.00 par value each. Authorized - 38,000 shares; issued and paid up - 1,000 shares. |
| B. | Holders of ordinary shares are entitled to participate equally in the payment of cash dividends and bonus share (stock dividend) distributions and, in the event of the liquidation of the Company, in the distribution of assets after satisfaction of liabilities to creditors. |
M - 32
HADERA PAPER - PRINTING & WRITING PAPER LTD.
NOTES TO CONSOLIDATED FINANCIAL STATEMENTS
(NIS in thousands)
NOTE 18 - REVENUE
Year ended December 31, | ||||||||||||
2010 | 2009 | 2008 | ||||||||||
| Industrial operations | 570,202 | 531,453 | 569,772 | |||||||||
| Commercial operations | 158,500 | 137,769 | 162,575 | |||||||||
| 728,702 | 669,222 | 732,347 | ||||||||||
NOTE 19 - COST OF SALES
Year ended December 31, | ||||||||||||
2010 | 2009 | 2008 | ||||||||||
| Purchases (**) | 129,680 | 117,080 | 141,478 | |||||||||
| Materials consumed | 392,095 | 292,083 | 373,131 | |||||||||
| Salaries and related expenses | 46,794 | 44,018 | 42,760 | |||||||||
| Subcontracting | 2,883 | 3,075 | 4,494 | |||||||||
| Energy costs | 42,808 | 47,535 | 49,240 | |||||||||
| Depreciation | 11,353 | (*)11,361 | (*)11,024 | |||||||||
| Other manufacturing costs | ||||||||||||
| and expenses (including rent) | 26,433 | 31,114 | 34,796 | |||||||||
| 652,046 | 546,266 | 656,923 | ||||||||||
| Change in finished goods , goods in | ||||||||||||
| process, and products in transit (***) | (11,736 | ) | 31,729 | (7,746 | ) | |||||||
| 640,310 | 577,995 | 649,177 | ||||||||||
| (*) | Reclassified. |
| (**) | The purchases of the Group are related principally to commercial operations. |
| (***) | Change in raw and auxiliary materials are included in materials consumed. |
NOTE 20 - SELLING EXPENSES
Year ended December 31, | ||||||||||||
2010 | 2009 | 2008 | ||||||||||
| Salaries and related expenses | 20,009 | 20,029 | 19,780 | |||||||||
| Packaging and shipping to customers | 9,445 | 8,095 | 6,512 | |||||||||
| Maintenance and rent | 9,408 | 7,961 | 8,408 | |||||||||
| Vehicles | 2,407 | 1,755 | 1,855 | |||||||||
| Advertising | 307 | 250 | 126 | |||||||||
| Depreciation | 455 | (*) 619 | (*) 587 | |||||||||
| Others | 1,223 | 1,527 | 1,488 | |||||||||
| 43,254 | 40,236 | 38,756 | ||||||||||
| (*) | Reclassified. |
M - 33
HADERA PAPER - PRINTING & WRITING PAPER LTD.
NOTES TO CONSOLIDATED FINANCIAL STATEMENTS
(NIS in thousands)
NOTE 21 - GENERAL AND ADMINISTRATIVE EXPENSES
Year ended December 31, | ||||||||||||
2010 | 2009 | 2008 | ||||||||||
| Salaries and related expenses | 4,934 | 4,356 | 4,025 | |||||||||
| Office maintenance | 125 | 234 | 147 | |||||||||
| Professional and management fees | 1,474 | 1,549 | 1,413 | |||||||||
| Depreciation | 93 | 48 | 57 | |||||||||
| Bad and doubtful debts | 3,837 | 2,599 | 1,334 | |||||||||
| Other | 3,782 | 2,040 | 2,764 | |||||||||
| 14,245 | 10,826 | 9,740 | ||||||||||
NOTE 22 - FINANCE COSTS
Year ended December 31, | ||||||||||||
2010 | 2009 | 2008 | ||||||||||
| A. Financing income: | ||||||||||||
| Interest income | - | 104 | 415 | |||||||||
| Foreign currency gains (see note C) | 4,293 | - | 5,474 | |||||||||
| Total financing income | 4,293 | 104 | 5,889 | |||||||||
| B. Financing costs: | ||||||||||||
| Interest expenses | ||||||||||||
| Interest on bank loans | 5,797 | 8,329 | 13,134 | |||||||||
| Interest on defined benefit arrangements (see note 15) | 65 | 61 | 362 | |||||||||
| Foreign currency losses (see note C) | - | 2,973 | - | |||||||||
| Total interest expenses | 5,862 | 11,363 | 13,496 | |||||||||
| Net finance cost | 1,569 | 11,259 | 7,607 | |||||||||
C. Foreign Exchange | ||||||||||||
| The amounts credited to the consolidated income statement are presented below: | ||||||||||||
| Included in net financing costs | ||||||||||||
| Foreign currency gains (losses) | 3,861 | (159 | ) | 3,092 | ||||||||
| Fair value gains (losses) on forward foreign exchange contracts (see note 25) | 432 | (2,814 | ) | 2,382 | ||||||||
| Net foreign currency gains (losses) | 4,293 | (2,973 | ) | 5,474 | ||||||||
M - 34
HADERA PAPER - PRINTING & WRITING PAPER LTD.
NOTES TO CONSOLIDATED FINANCIAL STATEMENTS
(NIS in thousands)
NOTE 23 - INCOME TAXES
| A. | The Company and its Subsidiaries are taxed according to the provisions of The Income Tax Ordinance and the Income Tax Law (Inflationary Adjustments), 1985. The Company is an industrial company in conformity with the Law for the Encouragement of Industry (Taxes), 1969. The major benefit the Company is entitled to under this law is accelerated depreciation rates. |
| B. | Composition |
Year ended December 31, | ||||||||||||
2010 | 2009 | 2008 | ||||||||||
| Current taxes | 8,162 | 3,614 | 97 | |||||||||
| Deferred taxes (D. below) | (876 | ) | (3,003 | ) | 7,030 | |||||||
| 7,286 | 611 | 7,127 | ||||||||||
| C. | Reconciliation of the statutory tax rate to the effective tax rate |
Year ended December 31, | ||||||||||||
2010 | 2009 | 2008 | ||||||||||
| Income before income taxes | 29,358 | 29,282 | 26,483 | |||||||||
| Statutory tax rate | 25 | % | 26 | % | 27 | % | ||||||
| Tax computed by statutory tax rate | 7,340 | 7,613 | 7,150 | |||||||||
| Tax increments (savings) due to: | ||||||||||||
| Non-deductible expenses | - | - | 75 | |||||||||
| Loss on disposal not recognized as deferred tax asset | - | - | 158 | |||||||||
| Utilization of tax losses not previously recognized | - | (483 | ) | - | ||||||||
| Change in tax rate | - | (6,379 | ) | - | ||||||||
| Differences arising from basis of measurement | (54 | ) | (140 | ) | (256 | ) | ||||||
| 7,286 | 611 | 7,127 | ||||||||||
| D. | Deferred Taxes |
Year ended December 31, | ||||||||||||
2010 | 2009 | 2008 | ||||||||||
| Balance as of beginning of year | (22,704 | ) | (24,274 | ) | (18,677 | ) | ||||||
| Charged to the consolidated income statements | 876 | 3,003 | (7,030 | ) | ||||||||
| Charged directly to equity | - | (1,433 | ) | 1,433 | ||||||||
| Balance as of end of year | (21,828 | ) | (22,704 | ) | (24,274 | ) | ||||||
M - 35
HADERA PAPER - PRINTING & WRITING PAPER LTD.
NOTES TO CONSOLIDATED FINANCIAL STATEMENTS
(NIS in thousands)
NOTE 23 - INCOME TAXES (Cont.)
E. | Deferred Taxes (cont.) |
As of December 31, | ||||||||||||
2010 | 2009 | 2008 | ||||||||||
| Deferred taxes arise from the following: | ||||||||||||
| Allowance for doubtful accounts | 1,680 | 949 | 744 | |||||||||
| Vacation and recreation pay | 1,726 | 1,709 | 1,586 | |||||||||
| Carry forward tax losses | - | - | 2,533 | |||||||||
| Depreciable fixed assets | (25,255 | ) | (25,412 | ) | (30,624 | ) | ||||||
| Accrued severance pay, net | 21 | 50 | 54 | |||||||||
| Cash flow hedges | - | - | 1,433 | |||||||||
| (21,828 | ) | (22,704 | ) | (24,274 | ) | |||||||
For 2010 - Deferred taxes were computed at rates between 24%-18%, primarily - 24%.
Deferred taxes are not recognized in respect of all losses of subsidiaries amounted to NIS 589 thousands as of December 31, 2010.
| F. | The Company and its Subsidiaries have tax assessments that are final through the 2005 tax year. |
| G. | Measurement of results for tax purposes under the Income Tax (Inflationary Law, 1985 (hereafter - the inflationary adjustments law) On February 26, 2008, the Knesset ratified the third reading of the Income Tax Law (Inflation Adjustments) (Amendment 20) (Limitation of Term of Validity) - 2008 (hereinafter: "The Amendment"), pursuant to which the application of the inflationary adjustment law will terminate in tax year 2007 and as of tax year 2008, the law will no longer apply, other than transition regulations whose intention it is to prevent distortions in tax calculations. According to the amendment, from tax year 2008 and thereafter, the adjustment of revenues for tax purposes will no longer be considered a real-term basis for measurement. Moreover, the linkage to the CPI of the depreciated sums of fixed assets and carryover losses for tax purposes will be discontinued, in a manner whereby these sums will be adjusted until the CPI at the end of 2007 and their linkage to the CPI will end as of that date. |
| G. | In July 2005, the Israeli Knesset passed the Law for Amending the Income Tax Ordinance (No. 147), 2005, according to which commencing in 2006 the corporate income-tax rate would be gradually reduced, for which a 31% tax rate was established, through 2010, in respect of which a 25% tax rate was established. |
| H. | On July 23, 2009 the Knesset (The legislative branch of the Israeli government), passed the Economic Efficiency Law (legislative amendments to implement the economic plan for the years 2009 and 2010) – 2009, which stipulates, inter alia, and additional gradual reduction in the rate of companies tax to 18% in the 2016 tax year and thereafter. According to these amendments, the rate of Group tax applying to the 2010 tax year and thereafter are as follows: 2010 tax year – 25%, 2011 tax year – 24%, 2012 tax year – 23%, 2013 tax year – 22%, 2014 texture – 21%, 2015 tax year – 20%, , and in the 2016 tax year and thereafter there will be companies tax rate of 18%. The change in the tax rates have decreased the deferred taxes liability as of December 31, 2009 in the amount of NIS 6,379 thousand. |
M - 36
HADERA PAPER - PRINTING & WRITING PAPER LTD.
NOTES TO CONSOLIDATED FINANCIAL STATEMENTS
(NIS in thousands)
NOTE 23 - INCOME TAXES (Cont.)
| I. | On the 29th December, 2010 the Knesset ratified the Economic Policy 2011-2012 Law (amendments), 2011 that was published in the articles on the 6th January, 2011. Within this law, the Law for the Encouragement of Capital Investments – 1959 was amended (hereafter "amendment"). According to the amendment the different income tax channels were abolished & instead fixed income tax rates on the industrial taxable income were set as follows: |
2011-2012: 15% (area "A" – 10%)
2013-2014: 12.5% (area "A" – 7%)
2015 onwards: 12% (area "A" -6%)
These amendments came in force as from 1st January, 2011. Each company is entitled to choose whether to be included within this amendment & to forego the outstanding benefits of the previous law or to waive this amendment.
The company has uncertainty as to its ability to confirm to the amendments stipulations &, as such, has not recognized the tax income derived from the amendment.
NOTE 24 - DIVIDEND
On August 11, 2010 a dividend of 1.2 million EUR was paid to shareholders (1,200 EUR per share).
On December 30, 2010 the company declared a dividend distribution of 1.8 million EUR to shareholders (1,800 EUR per share). The dividend was paid on January 31, 2011. (See note 27).
NOTE 25 - FINANCIAL INSTRUMENTS
A. | Significant accounting policies Details of the significant accounting policies and methods adopted, including the criteria for recognition, the basis of measurement and the basis on which income and expenses are recognized, in respect of each class of financial asset, financial liability and equity instrument are disclosed in note 2 to the financial statements. |
B. | Categories of financial instruments |
As of December 31, | ||||||||
2010 | 2009 | |||||||
| Financial assets | ||||||||
| Loans and receivables (including cash and cash equivalents) | 189,564 | 202,037 | ||||||
| Financial liabilities | ||||||||
| Derivative instruments | - | 432 | ||||||
| Amortized cost | 296,581 | 263,827 | ||||||
M - 37
HADERA PAPER - PRINTING & WRITING PAPER LTD.
NOTES TO CONSOLIDATED FINANCIAL STATEMENTS
(NIS in thousands)
NOTE 25 - FINANCIAL INSTRUMENTS (Cont.)
C. | Credit risk |
The Group's cash and cash equivalents as of December 31, 2010 and 2009 are deposited mainly with major banks. The group considers the credit risks in respect of these balances to be remote.
Most of the group's sales are made in Israel, to a large number of customers. The exposure to credit risks relating to trade receivables is limited due to the relatively large number of customers. The Group performs ongoing credit evaluations of its customers to determine the required amount of allowance for doubtful accounts. An appropriate allowance for doubtful accounts is included in the financial statements.
The group uses a credit insurance policy to manage its exposure to the risk of customers defaulting on sales invoices raised.
Total amount of trade receivables insured against credit insurance is NIS 55,564 thousands as of December 31, 2010. (2009: NIS 50,632 thousands).
The carrying amount of financial assets recorded in the financial statements, net of insured amount, represents the group's exposure to credit risk.
D. | Liquidity risk |
Liquidity risk is the risk that the Group could experience difficulties in meeting its commitments to creditors as financial liabilities fall due for payment. The Group manages its liquidity risk by using reasonable and retrospectively-assessed assumptions to forecast the future cash-generative capabilities and working capital requirements of the businesses it operates and by maintaining sufficient reserves, committed borrowing facilities and other credit lines as appropriate.
Forecast liquidity represents the Group's expected cash inflows, principally generated from sales made to customers, less the Group's contractually – determined cash outflows, principally related to supplier payments and the repayment of borrowings, plus the payment of any interest accruing thereon. The matching of these cash inflows and outflows rests on the expected ageing profiles of the underlying assets and liabilities. Short-term financial assets and financial liabilities are represented primarily by the Group's trade receivables and trade payables respectively. The matching of the cash flows that result from trade receivables and trade payables takes place typically over a period of three to four months from recognition in the balance sheet and is managed to ensure the ongoing operating liquidity of the Group. Financing cash outflows may be longer-term in nature. The Group does not hold long-term financial assets to match against these commitments, but is significantly invested in long-term non-financial assets, which generate the sustainable future cash inflows, net of future capital expenditure requirements, needed to service and repay the Group's borrowings.
The following table presents the Group's outstanding contractual maturity profile for its non-derivative financial liabilities. The analysis presented is based on the undiscounted contractual maturities of the Group's financial liabilities, including any interest that will accrue. Non-interest bearing financial liabilities which are due to be settled in less than 12 months from maturity equal their carrying values, since the impact of the time value of money is immaterial over such a short duration.
M - 38
HADERA PAPER - PRINTING & WRITING PAPER LTD.
NOTES TO CONSOLIDATED FINANCIAL STATEMENTS
(NIS in thousands)
NOTE 25 - FINANCIAL INSTRUMENTS (Cont.)
| D. | Liquidity risk (cont.) |
Maturity profile of outstanding financial liabilities'
1 year | 1-2 years | 2-5 years | Total | |||||||||||||
| 2010 | ||||||||||||||||
| Supplier payables | 182,182 | - | - | 182,182 | ||||||||||||
| Borrowings' | 97,375 | 3,062 | 7,355 | 107,729 | ||||||||||||
| Dividend declared | 8,528 | - | - | 8,528 | ||||||||||||
| Total | 288,085 | 3,062 | 7,355 | 298,502 | ||||||||||||
| 2009 | ||||||||||||||||
| Supplier Payables | 170,337 | - | - | 170,337 | ||||||||||||
| Borrowings' | 81,027 | 4,318 | 10,419 | 95,764 | ||||||||||||
| Total | 251,364 | 4,318 | 10,419 | 266,101 | ||||||||||||
| Average days of credit for trade payables are 114 days. |
| E. | Exchange rate risk |
The Group undertakes certain transactions denominated in foreign currencies. Hence, exposures to exchange rate fluctuations arise. Exchange rate exposures are managed within approved policy parameters utilizing forward foreign exchange contracts.
The carrying amounts of the Group's foreign currency denominated monetary assets and monetary liabilities at reporting date are as follows:
Liabilities | Assets | |||||||||||||||
2010 | 2009 | 2010 | 2009 | |||||||||||||
NIS | NIS | NIS | NIS | |||||||||||||
| USD | 77,408 | 56,020 | 27,852 | 37,692 | ||||||||||||
| EUR | 26,391 | 20,681 | 1,694 | 1,079 | ||||||||||||
The Group is mainly exposed to USD and EUR.
The following table details the Group's sensitivity to a 10% increase and decrease in the NIS against the relevant foreign currencies. 10% is the sensitivity rate used when reporting foreign currency risk internally to key management personnel and represents management's assessment of the reasonably possible change in foreign exchange rates. The sensitivity analysis includes only outstanding foreign currency denominated monetary items and adjusts their translation at the period end for a 10% change in foreign currency rates. A positive number below indicates an increase in profit and other equity where the NIS strengthens 10% against the relevant currency. For a 10% weakening of the NIS against the relevant currency, there would be an equal and opposite impact on the profit and other equity, and the balances below would be negative.
M - 39
HADERA PAPER - PRINTING & WRITING PAPER LTD.
NOTES TO CONSOLIDATED FINANCIAL STATEMENTS
(NIS in thousands)
NOTE 25 - FINANCIAL INSTRUMENTS (Cont.)
| E. | Exchange rate risk (cont.) |
USD Impact | EUR Impact | |||||||
2010 | 2010 | |||||||
NIS | NIS | |||||||
| Profit or loss (1) | 4,956 | 2,470 | ||||||
| (1) | This is mainly attributable to the exposure outstanding on receivables, cash and payables at year end in the Group, and forward foreign exchange contracts. |
| F. | Fair value of financial instruments |
The financial instruments of the Group consist of non derivative assets and liabilities. Non-derivative assets include cash and cash equivalents, receivables and other current assets. Non-derivative liabilities include short-term bank credit, trade payables, other current liabilities and long-term loans from banks. Due to the nature of these financial instruments, their fair value, generally, is identical or close to the value at which they are presented in the financial statements, unless stated otherwise.
The fair value of the long-term loans approximates their carrying value, since they bear interest at rates close to the prevailing market rates.
M - 40
HADERA PAPER - PRINTING & WRITING PAPER LTD.
NOTES TO CONSOLIDATED FINANCIAL STATEMENTS
(NIS in thousands)
NOTE 25 - FINANCIAL INSTRUMENTS (Cont.)
| G. | Linkage Terms of Financial Instruments |
December 31, 2010 | December 31, 2009 | |||||||||||||||||||||||
In, or linked to, foreign currency (mainly Dollar and Euro) | Linked to the Israeli CPI | Not Linked | In, or linked to, foreign currency (mainly Dollar and Euro) | Linked to the Israeli CPI | Not Linked | |||||||||||||||||||
NIS in thousands | NIS in thousands | |||||||||||||||||||||||
| Assets: | ||||||||||||||||||||||||
Cash and cash equivalents | 12,484 | - | 627 | 12,379 | - | 4,697 | ||||||||||||||||||
Trade and other receivables | 17,062 | - | 159,391 | 26,392 | - | 158,839 | ||||||||||||||||||
| 29,546 | - | 160,018 | 38,771 | - | 163,536 | |||||||||||||||||||
| Liabilities: | ||||||||||||||||||||||||
Short-term credit from banks | - | - | 92,852 | - | - | 69,440 | ||||||||||||||||||
Trade and other payables | 103,799 | 27,662 | 59,249 | 76,269 | 39,230 | 54,838 | ||||||||||||||||||
Other financial liabilities | - | - | - | 432 | - | - | ||||||||||||||||||
| Long term loans (including current maturities) | - | - | 13,019 | - | 3,653 | 19,965 | ||||||||||||||||||
| 103,799 | 27,662 | 165,120 | 76,701 | 42,882 | 144,243 | |||||||||||||||||||
M - 41
HADERA PAPER - PRINTING & WRITING PAPER LTD.
NOTES TO CONSOLIDATED FINANCIAL STATEMENTS
(NIS in thousands)
NOTE 26 - RELATED PARTIES
The Group is owned by Hadera Paper Ltd (The "Parent Company") (75%) and Neusiedler Holding (25%). See note 2(a).
Transactions between the Company and its subsidiaries, which are related parties of the Company, have been eliminated on consolidation and are not disclosed in this note. Details of transactions between the group and other related parties are disclosed below:
| A. | Transactions with Related Parties |
Hadera Paper and its subsidiaries | Neusiedler Holding and its subsidiaries | |||||||||||||||
Year ended December 31, | Year ended December 31, | |||||||||||||||
2010 | 2009 | 2010 | 2009 | |||||||||||||
| Sales to related parties | 37,972 | 23,453 | - | - | ||||||||||||
| Purchases of goods | - | - | 1,780 | 6,225 | ||||||||||||
| Cost of sales | 84,644 | 85,709 | 2,494 | 1,818 | ||||||||||||
| Selling expenses, net | ||||||||||||||||
(Participation in selling expenses, net) | - | - | - | 166 | ||||||||||||
| General and administrative expenses | 2,823 | 3,020 | - | - | ||||||||||||
| Financing expenses ,net | 2,045 | 3,349 | - | - | ||||||||||||
| B. | Balances with Related Parties |
Hadera Paper and its subsidiaries | Neusiedler Holding and its subsidiaries | |||||||||||||||
As of December 31, | As of December 31, | |||||||||||||||
2010 | 2009 | 2010 | 2009 | |||||||||||||
| Dividend declared | 4,255 | - | 4,273 | - | ||||||||||||
| Trade payables | 54,455 | 57,595 | 796 | 2,752 | ||||||||||||
| Other payables and accrued expenses | - | - | - | 166 | ||||||||||||
| C. | (1) | The Group leases its premises from Hadera Paper and receives services (including energy, water, maintenance and professional services) under agreements, which are renewed based on shareholders agreements. See also Note 16A above. |
| (2) | The Group pays commissions to Mondi Neusiedler GmbH for pulp purchase. |
M - 42
HADERA PAPER - PRINTING & WRITING PAPER LTD.
NOTES TO CONSOLIDATED FINANCIAL STATEMENTS
(NIS in thousands)
NOTE 26 - RELATED PARTIES (Cont.)
| D. | Compensation of key management personnel |
Total remuneration of key management during the year was as follows:
Year ended December 31, | ||||||||
2010 | 2009 | |||||||
| Short term benefits | 6,030 | 5,175 | ||||||
| Share options | 530 | 648 | ||||||
| 6,560 | 5,823 | |||||||
The Company's senior management was rewarded by allotment of Mondi Plc's and Hadera Paper's share options. The cost of the benefit was determined as the fair value on the grant day and this amount is being charged to the income statement over the vesting period. The company's debt resulting from the grant will be paid in cash to both shareholders.
The fair value of the options granted as aforementioned was estimated by applying the economic models.
NOTE 27 - SUBSEQUENT EVENTS
On January 31, 2011 the Company paid dividend of 1.8 million EUR to shareholders (1,800 EUR per share). The dividend was declared on December 30, 2010.
M - 43
Exhibit 6
HOGLA-KIMBERLY LTD.
FINANCIAL STATEMENTS
AS OF DECEMBER 31, 2010
HOGLA-KIMBERLY LTD.
FINANCIAL STATEMENTS
AS OF DECEMBER 31, 2010
TABLE OF CONTENTS
| Page | |
| K - 1 | |
| Consolidated Financial Statements: | |
| K - 2 | |
| K - 3 | |
| K - 4 | |
| K - 5 - K - 6 | |
| K - 7 - K - 8 | |
| K - 9 - K - 51 |
| | Brightman Almagor Zohar Haifa Office 5 Ma'aleh Hashichrur Street Haifa, 33284 P.O.B. 5648, Haifa 31055 Israel Tel: +972 (4) 860 7373 Fax: +972 (4) 867 2528 Info-haifa@deloitte.co.il www.deloitte.com |
REPORT OF INDEPENDENT REGISTERED PUBLIC ACCOUNTING FIRM
To the Shareholders of
Hogla-Kimberly Ltd.
We have audited the accompanying consolidated statements of financial position of Hogla-Kimberly Ltd. (“the Company”) as of December 31, 2010 and 2009, and the related consolidated income statements, consolidated statements of comprehensive income, consolidated changes in shareholders' equity and consolidated statements of cash flows of the Company for each of the three years in the period ended December 31, 2010. These financial statements are the responsibility of the Company's board of directors and management. Our responsibility is to express an opinion on these financial statements based on our audit.
We conducted our audits in accordance with generally accepted auditing standards in Israel, including those prescribed under the Auditors' Regulations (Auditor's Mode of Performance), 1973 and the standards of the Public Company Accounting Oversight Board (United States) Those standards require that we plan and perform the audit to obtain reasonable assurance whether the financial statements are free of material misstatement. The Company is not required to have, nor were we engaged to perform, an audit of its internal control over financial reporting. Our audit included consideration of internal control over financial reporting as a basis for designing audit procedures that are appropriate in the circumstances, but not for the purpose of expressing an opinion on the effectiveness of the Company's internal control over financial reporting. Accordingly, we express no such opinion. An audit also includes examining, on a test basis, evidence supporting the amounts and disclosures in the financial statements, assessing the accounting principles used and significant estimates made by the Board of Directors and management, as well as evaluating the overall financial statement presentation. We believe that our audits provide a reasonable basis for our opinion.
In our opinion the consolidated financial statements referred to above present fairly, in all material respects, the statements of financial position of the Company and its subsidiaries as of December 31, 2010 and 2009, and the consolidated income statements, consolidated statements of comprehensive income, consolidated changes in shareholders' equity and the consolidated statements of cash flows of the Company, for each of the three years then ended, in conformity with international financial reporting standards.
Brightman Almagor Zohar & Co.
Certified Public Accountants
A Member Firm of Deloitte Touche Tohmatsu
Israel
23 February, 2011
K - 1
HOGLA-KIMBERLY LTD. AND SUBSIDIARIES
CONSOLIDATED STATEMENT
OF FINANCIAL POSITION
(NIS in thousands)
As of December 31, | ||||||||||||
Note | 2 0 1 0 | 2 0 0 9 | ||||||||||
| Current Assets | ||||||||||||
| Cash and cash equivalents | 4 | 16,732 | 106,996 | |||||||||
| Trade receivables | 5 | 289,094 | 289,680 | |||||||||
| Inventories | 6 | 241,803 | 180,631 | |||||||||
| Current tax assets | 22 | 54 | - | |||||||||
| Other current assets | 7 | 7,178 | 5,757 | |||||||||
| 554,861 | 583,064 | |||||||||||
| Non-Current Assets | ||||||||||||
| VAT Receivable | 51,223 | 47,171 | ||||||||||
| Property plant and equipment | 8A | 350,560 | 334,604 | |||||||||
| Goodwill | 9 | 17,033 | 18,650 | |||||||||
| Employee benefit assets | 10 | 639 | 517 | |||||||||
| Deferred tax assets | 22 | 3,864 | 4,899 | |||||||||
| Prepaid expenses for operating lease | 8B | 1,637 | 1,765 | |||||||||
| 424,956 | 407,606 | |||||||||||
| 979,817 | 990,670 | |||||||||||
| Current Liabilities | ||||||||||||
| Borrowings | 11 | 36,640 | 25,977 | |||||||||
| Trade payables | 12 | 329,916 | 296,359 | |||||||||
| Employee benefit obligations | 10 | 12,810 | 12,855 | |||||||||
| Current tax liabilities | 22 | 22,583 | 26,631 | |||||||||
| Dividend payables | 5,000 | 40,000 | ||||||||||
| Other payables and accrued expenses | 13 | 44,054 | 57,873 | |||||||||
| 451,003 | 459,695 | |||||||||||
| Non-Current Liabilities | ||||||||||||
| Borrowings | 12 | 6,941 | 33,736 | |||||||||
| Employee benefit obligations | 10 | 7,899 | 7,515 | |||||||||
| Deferred tax liabilities | 22 | 35,370 | 33,631 | |||||||||
| 50,210 | 74,882 | |||||||||||
| Commitments and Contingent Liabilities | 14 | |||||||||||
| Capital and reserves | 15 | |||||||||||
| Issued capital | 265,246 | 265,246 | ||||||||||
| Reserves | (82,338 | ) | (60,156 | ) | ||||||||
| Retained earnings | 295,696 | 251,003 | ||||||||||
| 478,604 | 456,093 | |||||||||||
| 979,817 | 990,670 | |||||||||||
G .Calvo Paz | O. Lux | A. Melamud | ||
| Chairman of the Board of Directors | Chief Financial Officer | Chief Executive Officer |
Approval date of the financial statements: 23 February, 2011.
The accompanying notes are an integral part of the consolidated financial statements.
K - 2
HOGLA-KIMBERLY LTD. AND SUBSIDIARIES
CONSOLIDATED INCOME STATEMENTS
(NIS in thousands)
Year ended December 31, | ||||||||||||||||
Note | 2 0 1 0 | 2 0 0 9 | 2 0 0 8 | |||||||||||||
| Revenue | 16 | 1,697,509 | 1,726,627 | 1,608,576 | ||||||||||||
| Cost of sales | 17 | 1,165,219 | 1,164,949 | 1,097,567 | ||||||||||||
| Gross profit | 532,290 | 561,678 | 511,009 | |||||||||||||
| Operating costs and expenses | ||||||||||||||||
| Selling and marketing expenses | 19 | 288,061 | 304,776 | 308,737 | ||||||||||||
| General and administrative expenses | 20 | 62,357 | 63,097 | 66,519 | ||||||||||||
| Other income | 18 | (4,731 | ) | - | - | |||||||||||
| 345,687 | 367,873 | 375,256 | ||||||||||||||
| Operating profit | 186,603 | 193,805 | 135,753 | |||||||||||||
| Finance expenses | 21B | (8,110 | ) | (3,041 | ) | (12,355 | ) | |||||||||
| Finance income | 21A | 12,104 | 4,557 | 13,702 | ||||||||||||
| Finance expenses, net | 3,994 | 1,516 | 1,347 | |||||||||||||
| Profit before tax | 190,597 | 195,321 | 137,100 | |||||||||||||
| Income taxes charge | 22 | (45,904 | ) | ( 44,226 | ) | (47,473 | ) | |||||||||
| Profit for the year | 144,693 | 151,095 | 89,627 | |||||||||||||
The accompanying notes are an integral part of the consolidated financial statements.
K - 3
HOGLA-KIMBERLY LTD. AND SUBSIDIARIES
CONSOLIDATED STATEMENTS OF COMPREHENSIVE INCOME
(NIS in thousands)
Year Ended December, 31 | ||||||||||||
2 0 1 0 | 2 0 0 9 | 2 0 0 8 | ||||||||||
| Profit for year | 144,693 | 151,095 | 89,627 | |||||||||
| Exchange differences arising on translation of foreign operations | (21,341 | ) | (1,375 | ) | (52,096 | ) | ||||||
| Cash flow hedges | (2,315 | ) | 766 | (572 | ) | |||||||
| Transfer to profit or loss from equity on cash flow hedge | 1,192 | (2,270 | ) | 4,081 | ||||||||
| Income tax relating to components of other comprehensive income | 282 | 403 | (987 | ) | ||||||||
| Other comprehensive income (loss) for the year (net of tax) | (22,182 | ) | (2,476 | ) | (49,574 | ) | ||||||
| Total comprehensive income for the year | 122,511 | 148,619 | 40,053 | |||||||||
K - 4
HOGLA-KIMBERLY LTD. AND SUBSIDIARIES
CONSOLIDATED STATEMENTS OF CHANGES IN EQUITY
(NIS in thousands)
Share capital | Capital reserves | Foreign currency translation reserve | Cash flow hedges | Retained earnings | Total | |||||||||||||||||||
| Year ended December 31, 2010 | ||||||||||||||||||||||||
| Balance - January 1, 2010 | 29,638 | 235,608 | (60,228 | ) | 72 | 251,003 | 456,093 | |||||||||||||||||
| Profit for the year | - | - | - | - | 144,693 | 144,693 | ||||||||||||||||||
Exchange differences arising on translation of foreign operations | - | - | (21,341 | ) | - | - | (21,341 | ) | ||||||||||||||||
| Cash flow hedges | - | - | - | (841 | ) | - | (841 | ) | ||||||||||||||||
| Dividend | - | - | - | - | (100,000 | ) | (100,000 | ) | ||||||||||||||||
| Balance - December 31, 2010 | 29,638 | 235,608 | (81,569 | ) | (769 | ) | 295,696 | 478,604 | ||||||||||||||||
Share capital | Capital reserves | Foreign currency translation reserve | Cash flow hedges | Retained earnings | Total | |||||||||||||||||||
| Year ended December 31, 2009 | ||||||||||||||||||||||||
| Balance - January 1, 2009 | 29,638 | 235,608 | (58,853 | ) | 1,173 | 233,423 | 440,989 | |||||||||||||||||
| Profit for the year | - | - | - | - | 151,095 | 151,095 | ||||||||||||||||||
Exchange differences arising on translation of foreign operations | - | - | (1,375 | ) | - | - | (1,375 | ) | ||||||||||||||||
| Cash flow hedges | - | - | - | (1,101 | ) | - | (1,101 | ) | ||||||||||||||||
| Dividend | - | - | - | - | (133,515 | ) | (133,515 | ) | ||||||||||||||||
| Balance - December 31, 2009 | 29,638 | 235,608 | (60,228 | ) | 72 | 251,003 | 456,093 | |||||||||||||||||
K - 5
HOGLA-KIMBERLY LTD. AND SUBSIDIARIES
CONSOLIDATED STATEMENTS OF CHANGES IN EQUITY
(NIS in thousands)
Share capital | Capital reserves | Foreign currency translation reserve | Cash flow hedges | Retained earnings | Total | |||||||||||||||||||
| Year ended December 31, 2008 | ||||||||||||||||||||||||
| Balance - January 1, 2008 | 29,638 | 235,608 | (6,757 | ) | (1,349 | ) | 143,796 | 400,936 | ||||||||||||||||
| Profit for the year | - | - | - | - | 89,627 | 89,627 | ||||||||||||||||||
Exchange differences arising on translation of foreign operations | - | - | (52,096 | ) | - | - | (52,096 | ) | ||||||||||||||||
| Cash flow hedges | - | - | - | 2,522 | - | 2,522 | ||||||||||||||||||
| Balance - December 31, 2008 | 29,638 | 235,608 | (58,853 | ) | 1,173 | 233,423 | 440,989 | |||||||||||||||||
K - 6
HOGLA-KIMBERLY LTD. AND SUBSIDIARIES
CONSOLIDATED STATEMENTS OF CASH FLOWS
(NIS in thousands)
Year ended December 31, | ||||||||||||
2 0 1 0 | 2 0 0 9 | 2 0 0 8 | ||||||||||
| Cash flows – operating activities | ||||||||||||
| Net income for the year | 144,693 | 151,095 | 89,627 | |||||||||
Adjustments to reconcile operating profit to net cash provided by operating activities (Appendix A) | (22,424 | ) | 90,548 | 12,972 | ||||||||
Net cash generated by operating activities | 122,269 | 241,643 | 102,599 | |||||||||
| Cash flows – investing activities | ||||||||||||
| Acquisition of property plant and equipment | (62,564 | ) | (42,484 | ) | (53,334 | ) | ||||||
| Proceeds from disposal of Property plant and equipment | 168 | 32 | 4,851 | |||||||||
| Proceeds from realization of trademark | 3,131 | - | - | |||||||||
| Repayment of capital note by shareholders | - | 32,770 | - | |||||||||
| Interest received | 2,532 | 1,495 | 1,525 | |||||||||
| Net cash used in investing activities | (56,733 | ) | (8,187 | ) | (46,958 | ) | ||||||
| Cash flows – financing activities | ||||||||||||
| Dividend paid | (135,000 | ) | (93,515 | ) | - | |||||||
| Borrowings received | - | - | 82,947 | |||||||||
| Borrowing paid | (25,307 | ) | (23,904 | ) | - | |||||||
| Short-term bank credit | 9,975 | (28,139 | ) | (124,286 | ) | |||||||
| Interest paid | (4,048 | ) | (3,381 | ) | (8,353 | ) | ||||||
| Net cash used in financing activities | (154,380 | ) | (148,939 | ) | (49,692 | ) | ||||||
| Net increase (decrease) in cash and cash equivalents | (88,844 | ) | 84,517 | 5,949 | ||||||||
| Cash and cash equivalents – beginning of year | 106,996 | 23,219 | 23,082 | |||||||||
| Effects of exchange rate changes on the balance of cash held in foreign currencies | (1,420 | ) | (740 | ) | (5,812 | ) | ||||||
| Cash and cash equivalents - end of year | 16,732 | 106,996 | 23,219 | |||||||||
The accompanying notes are an integral part of the consolidated financial statements.
K - 7
HOGLA-KIMBERLY LTD. AND SUBSIDIARIES
CONSOLIDATED STATEMENTS OF CASH FLOWS
(NIS in thousands)
Year ended December 31, | ||||||||||||
2 0 1 0 | 2 0 0 9 | 2 0 0 8 | ||||||||||
A. Adjustments to reconcile operating profit to net cash provided by | ||||||||||||
| operating activities | ||||||||||||
| Finance expenses adjustments to profit | 1,516 | 4,426 | 6,828 | |||||||||
| Taxes on income recognized in profit and loss | 45,904 | 44,226 | 47,473 | |||||||||
| Depreciation and amortization | 31,195 | 29,213 | 24,367 | |||||||||
| Capital loss on disposal of property, plant and equipment | 991 | 948 | 2,878 | |||||||||
| Effect of discounting capital note to shareholder | - | - | (1,560 | ) | ||||||||
| Capital gain from realization of trademark | (3,131 | ) | - | - | ||||||||
| Changes in assets and liabilities: | ||||||||||||
| Decrease (Increase) in trade receivables | (13,419 | ) | (19,566 | ) | 5,465 | |||||||
| Decrease (Increase) in other current assets | (1,485 | ) | 597 | 3,872 | ||||||||
| Decrease (Increase) in inventories | (68,657 | ) | 54,144 | (66,659 | ) | |||||||
| Increase in trade payables | 33,914 | 11,927 | 18,407 | |||||||||
| Net change in balances with related parties | 27,266 | (12,911 | ) | 1,339 | ||||||||
| Increase (Decrease) in other payables and accrued expenses | (21,357 | ) | 12,303 | 3,195 | ||||||||
| Effect of exchange rate differences on dividend payables | - | (2,540 | ) | - | ||||||||
| Decrease in other long term asset | (8,795 | ) | (5,947 | ) | (9,163 | ) | ||||||
| Change in employee benefit obligations, net | 507 | 1,089 | 5,414 | |||||||||
| 24,449 | 117,909 | 41,856 | ||||||||||
| Income taxes received | 7,273 | 10,880 | 7,065 | |||||||||
| Income taxes paid | (54,146 | ) | (38,241 | ) | (35,949 | ) | ||||||
| (22,424 | ) | 90,548 | 12,972 | |||||||||
The accompanying notes are an integral part of the consolidated financial statements.
K - 8
HOGLA-KIMBERLY LTD. AND SUBSIDIARIES
NOTES TO THE FINANCIAL STATEMENTS AS OF DECEMBER 31, 2010
| NOTE 1 | - | DESCRIPTION OF BUSINESS AND GENERAL |
| A. | Description Of Business |
| Hogla Kimberly Ltd. (“the Company”) and its Subsidiaries are engaged principally in the production and marketing of paper and hygienic products. The Company’s results of operations are affected by transactions with shareholders and affiliated companies. |
| The Company is owned by Kimberly Clark Corp. (“KC” or the “Parent Company”) (50.1%) Hadera Paper Ltd. (49.9%). |
| B. | Definitions: |
| The Company | - | Hogla-Kimberly Ltd. |
| The Group | - | the Company and its Subsidiaries. |
| Subsidiaries | - | companies in which the Company control, (as defined by IAS 27) directly or indirectly, and whose financial statements are fully consolidated with those of the Company. |
Related Parties | - | as defined by IAS 24. |
Interested Parties | - | as defined in the Israeli Securities Regulations (Annual Financial Statements), 2010. |
Controlling Shareholder | - | as defined in the 1968 Israeli Securities law and Regulations. |
| NIS | - | New Israeli Shekel. |
| CPI | - | the Israeli consumer price index. |
| Dollar | - | the U.S. dollar. |
| YTL | - | the Turkish New Lira. |
| NOTE 2 | - | SUMMARY OF SIGNIFICANT ACCOUNTING POLICIES |
| A. | Applying International Accounting Standards (IFRS) |
| Statement of compliance |
| The consolidated financial statements have been prepared using accounting policies consistent with International Financial Reporting Standards as issued by the International Accounting Standards Board (IASB) for all reporting periods presented. |
K - 9
HOGLA-KIMBERLY LTD. AND SUBSIDIARIES
NOTES TO THE FINANCIAL STATEMENTS AS OF DECEMBER 31, 2010
| NOTE 2 | - | SUMMARY OF SIGNIFICANT ACCOUNTING POLICIES (Cont.) |
| B. | Basis of preparation |
| Until December 31, 2003, Israel was considered a country in which hyper-inflation conditions exist. Therefore, non-monetary balances in the balance sheet were presented on the historical nominal amount and were adjusted to changes in the exchange rate of the U.S. dollar. As of December 31, 2003 when the economy ceases to be hyper-inflationary and the Company no longer adjusted its financial statements to the U.S. dollar, the adjusted amounts as of this date were used as the historical costs. The financial statements were edited on the basis of the historical cost, except for: |
| · | Assets and liabilities measured by fair value and derivative financial instruments. |
| · | Inventories are stated at the lower of cost and net realizable value. |
| · | Property, plant and equipment and intangibles assets are presented at the lower of the cost less accumulated amortizations and the recoverable amount. |
| · | Liabilities to employees as described in note 2Q. |
| C. | Foreign currencies |
| The individual financial statements of each group entity are presented in the currency of the primary economic environment in which the entity operates (its functional currency). For the purpose of the consolidated financial statements, the results and financial position of each entity are expressed in the New Israeli Shekel ("NIS"), which is the functional currency of the Company and the presentation currency for the consolidated financial statements. |
| In preparing the financial statements of the individual entities, transactions in currencies other than the entity’s functional currency (foreign currencies) are recorded at the rates of exchange prevailing at the dates of the transactions. At each balance sheet date, monetary items denominated in foreign currencies are retranslated at the rates prevailing at the balance sheet date. Non-monetary items carried at fair value that are denominated in foreign currencies are retranslated at the rates prevailing at the date when the fair value was determined. Non-monetary items that are measured in terms of historical cost in a foreign currency are not retranslated. |
| Exchange differences are recognised in profit or loss in the period in which they occur except for: |
| Ÿ | Exchange differences on transactions entered into in order to hedge certain foreign currency risks. |
| Ÿ | Exchange differences on monetary items receivable from or payable to a foreign operation for which settlement is neither planned nor likely to occur, which form part of the net investment in a foreign operation, and which are recognized in the foreign currency translation reserve and recognized in profit or loss on disposal of the net investment. |
K - 10
HOGLA-KIMBERLY LTD. AND SUBSIDIARIES
NOTES TO THE FINANCIAL STATEMENTS AS OF DECEMBER 31, 2010
| NOTE 2 | - | SUMMARY OF SIGNIFICANT ACCOUNTING POLICIES (Cont.) |
| C. | Foreign currencies (Cont.) |
| For the purpose of presenting consolidated financial statements, the assets and liabilities of the Group’s foreign operations are expressed in NIS using exchange rates prevailing at the balance sheet date. Income and expense items are translated at the average exchange rates for the period, unless exchange rates fluctuated significantly during that period, in which case the exchange rates at the dates of the transactions are used. |
| Goodwill and fair value adjustments arising on the acquisition of a foreign operation are treated as assets and liabilities of the foreign operation and translated at the closing rate. |
| D. | Cash and Cash Equivalents |
| Cash and cash equivalents include bank deposits, available for immediate withdrawal, as well as unrestricted short-term deposits with maturities of less than three months from the date of deposit. |
| E. | Basis of consolidation |
| The consolidated financial statements incorporate the financial statements of the Company and entities controlled by the Company (its subsidiaries). Control is achieved where the Company has the power to govern the financial and operating policies of an entity so as to obtain benefits from its activities. |
| The results of subsidiaries acquired or disposed of during the year are included in the consolidated income statement from the effective date of acquisition or up to the effective date of disposal, as appropriate. |
| Where necessary, adjustments are made to the financial statements of subsidiaries to bring their accounting policies into line with those used by other members of the Group. |
| All intra-group transactions, balances, income and expenses are eliminated in full on consolidation. |
| F. | Goodwill |
| Goodwill arising on the acquisition of a subsidiary represents the excess of the cost of acquisition over the Group's interest in the net fair value of the identifiable assets, liabilities and contingent liabilities of the subsidiary recognised at the date of acquisition. Goodwill is initially recognised as an asset at cost and is subsequently measured at cost less any accumulated impairment losses. |
| For the purpose of impairment testing, goodwill is allocated to each of the Group’s cash-generating units expected to benefit from the synergies of the combination. Cash-generating units to which goodwill has been allocated are tested for impairment annually, or more frequently when there is an indication that the unit may be impaired. If the recoverable amount of the cash-generating unit is less than the carrying amount of the unit, the impairment loss is allocated first to reduce the carrying amount of any goodwill allocated to the unit and then to the other assets of the unit pro-rata on the basis of the carrying amount of each asset in the unit. An impairment loss recognised for goodwill is not reversed in a subsequent period. |
| On disposal of a subsidiary, the attributable amount of goodwill is included in the determination of the profit or loss on disposal. |
K - 11
HOGLA-KIMBERLY LTD. AND SUBSIDIARIES
NOTES TO THE FINANCIAL STATEMENTS AS OF DECEMBER 31, 2010
| NOTE 2 | - | SUMMARY OF SIGNIFICANT ACCOUNTING POLICIES (Cont.) |
| G. | Property, plant and equipment |
| Property, plant and equipments are tangible items, which are held for use in the manufacture or supply of goods or services, or leased to others, which are predicted to be used for more than one period. The Company presents its property, plant and equipments items according to the cost model. |
| Under the cost method - a property, plant and equipment are presented at the balance sheet at cost (net of any investment grants), less any accumulated depreciation and any accumulated impairment losses. The cost includes the cost of the asset's acquisition as well as costs that can be directly attributable to bringing the asset to the location and condition necessary for it to be capable of operating in the manner intended by management. |
| Depreciation is calculated using the straight-line method at rates considered adequate to depreciate the assets over their estimated useful lives. Amortization of leasehold improvements is computed over the shorter of the term of the lease, including any option period, where the Company intends to exercise such option, or their useful life. |
| The annual depreciation and amortization rates are: | % |
| Buildings | 2-4 |
| Leasehold improvements | 10-25 |
| Machinery and equipment | 5-10 |
| Motor vehicles | 15-20 |
| Office furniture and equipment | 6-33 |
| Scrap value, depreciation method and the assets useful lives are being reviewed by management in the end of every financial year. Changes are handled as a change of estimation and are applied from here on. |
| The gain or loss arising on the disposal or retirement of an item of property, plant and equipment is determined as the difference between the sales proceeds and the carrying amount of the asset and is recognized in the income statement. |
| H. | Impairment of tangible and intangible assets excluding goodwill |
| At each balance sheet date, the Group reviews the carrying amounts of its tangible and intangible assets to determine whether there is any indication that those assets have suffered an impairment loss. If any such indication exists, the recoverable amount of the asset is estimated in order to determine the extent of the impairment loss (if any). Where it is not possible to estimate the recoverable amount of an individual asset, the Group estimates the recoverable amount of the cash-generating unit to which the asset belongs. Where a reasonable and consistent basis of allocation can be identified, corporate assets are also allocated to individual cash-generating units, or otherwise they are allocated to the smallest group of cash-generating units for which a reasonable and consistent allocation basis can be identified. |
| Intangible assets with indefinite useful lives and intangible assets not yet available for use are tested for impairment annually, and whenever there is an indication that the asset may be impaired. |
K - 12
HOGLA-KIMBERLY LTD. AND SUBSIDIARIES
NOTES TO THE FINANCIAL STATEMENTS AS OF DECEMBER 31, 2010
| NOTE 2 | - | SUMMARY OF SIGNIFICANT ACCOUNTING POLICIES (Cont.) |
| H. | Impairment of tangible and intangible assets excluding goodwill (cont.) |
| Recoverable amount is the higher of fair value less costs to sell and value in use. In assessing value in use, the estimated future cash flows are discounted to their present value using a pre-tax discount rate that reflects current market assessments of the time value of money and the risks specific to the asset for which the estimates of future cash flows have not been adjusted. |
| If the recoverable amount of an asset (or cash-generating unit) is estimated to be less than its carrying amount, the carrying amount of the asset (cash-generating unit) is reduced to its recoverable amount. An impairment loss is recognised immediately in profit or loss, unless the relevant asset is carried at a revalued amount, in which case the impairment loss is treated as a revaluation decrease. |
| I. | Inventories |
| Inventories are assets held for sale in the ordinary course of business, in the process of production for such sale or in the form of materials or supplies to be consumed in the production process or in the rendering of services. |
| Inventories are stated at the lower of cost and net releasable value. Cost of inventories includes all the cost of purchase, direct labor, fixed and variable production over heads and other cost that are incurred, in bringing the inventories to their present location and condition. |
| Net releasable value is the estimated selling price in the ordinary course of business less the estimated costs of completion and the estimated costs necessary to make the sale. |
| Cost determined as follows: |
| Manufactured finished products | Based on standard cost method |
| Purchased finished goods raw, auxiliary materials and other | Based on moving-average basis. |
| Inventories that are purchased on differed settlement terms, which contains a financing element, are stated in purchase price for normal credit terms. The difference between the purchase price for normal credit terms and the amount paid is recognized as interest expense over the period of the financing. |
| J. | Financial assets |
| (1) | General |
| Investments are recognised and derecognised on trade date where the purchase or sale of an investment is under a contract whose terms require delivery of the investment within the timeframe established by the market concerned, and are initially measured at fair value, plus transaction costs, except for those financial assets classified as at fair value through profit or loss, which are initially measured at fair value. |
| Financial assets are classified into Loans and receivables |
K - 13
HOGLA-KIMBERLY LTD. AND SUBSIDIARIES
NOTES TO THE FINANCIAL STATEMENTS AS OF DECEMBER 31, 2010
| NOTE 2 | - | SUMMARY OF SIGNIFICANT ACCOUNTING POLICIES (Cont.) |
| J. | Financial assets (Cont.) |
| (2) | Loans and receivables |
| Trade receivables, loans, and other receivables that have fixed or determinable payments that are not quoted in an active market are classified as loans and receivables. Loans and receivables are measured at amortized cost using the effective interest method, less any impairment. Interest income is recognized by applying the effective interest rate, except for short-term receivables when the recognition of interest would be immaterial. |
| (3) | Impairment of financial assets |
| Financial assets, are assessed for indicators of impairment at each balance sheet date. |
| Financial assets are impaired where there is objective evidence that, as a result of one or more events that occurred after the initial recognition of the financial asset, the estimated future cash flows of the investment have been impacted. |
| For all other financial assets, objective evidence of impairment could include: |
| ● | Significant financial difficulty of the issuer or counterparty; or |
| ● | Default or delinquency in interest or principal payments; or |
| ● | It becoming probable that the borrower will enter bankruptcy or financial re-organization. |
| For financial assets carried at amortized cost, the amount of the impairment is the difference between the asset’s carrying amount and the present value of estimated future cash flows, discounted at the financial asset’s original effective interest rate. |
The carrying amount of the financial asset is reduced by the impairment loss directly for all financial assets with the exception of trade receivables, where the carrying amount is reduced through the use of an allowance account. When a trade receivable is considered uncollectible, it is written off against the allowance account. Subsequent recoveries of amounts previously written off are credited against the allowance account. Changes in the carrying amount of the allowance account are recognized in profit or loss. |
| If, in a subsequent period, the amount of the impairment loss decreases and the decrease can be related objectively to an event occurring after the impairment was recognized, the previously recognized impairment loss is reversed through profit or loss to the extent that the carrying amount of the investment at the date the impairment is reversed does not exceed what the amortized cost would have been had the impairment not been recognized. |
K - 14
HOGLA-KIMBERLY LTD. AND SUBSIDIARIES
NOTES TO THE FINANCIAL STATEMENTS AS OF DECEMBER 31, 2010
| NOTE 2 | - | SUMMARY OF SIGNIFICANT ACCOUNTING POLICIES (Cont.) |
| K. | Other financial liabilities |
| Other financial liabilities, including borrowings, are initially measured at fair value, net of transaction costs. Other financial liabilities are subsequently measured at amortized cost using the effective interest method, with interest expense recognized on an effective yield basis. |
The effective interest method is a method of calculating the amortized cost of a financial liability and of allocating interest expense over the relevant period. The effective interest rate is the rate that exactly discounts estimated future cash payments through the expected life of the financial liability, or, where appropriate, a shorter period. |
| L. | Provisions |
| Provisions are recognized when the Group has a present obligation (legal or constructive) as a result of a past event, it is probable that the Group will be required to settle the obligation, and a reliable estimate can be made of the amount of the obligation. The amount recognized as a provision is the best estimate of the consideration required to settle the present obligation at the balance sheet date, taking into account the risks and uncertainties surrounding the obligation. |
| Where a provision is measured using the cash flows estimated to settle the present obligation, its carrying amount is the present value of those cash flows. |
| When some or all of the economic benefits required to settle a provision are expected to be recovered from a third party, the receivable is recognized as an asset if it is virtually certain that reimbursement will be received and the amount of the receivable can be measured reliably. |
| M. | Derivative financial instruments |
| (1) | General |
| The Group enters into a variety of derivative financial instruments to manage its exposure to foreign exchange rate risk, including foreign exchange forward contracts. |
| Derivatives are initially recognized at fair value at the date a derivative contract is entered into and are subsequently remeasured to their fair value at each balance sheet date. The resulting gain or loss is recognized in profit or loss immediately unless the derivative is designated and effective as a hedging instrument, in which event the timing of the recognition in profit or loss depends on the nature of the hedge relationship. The Group designates certain derivatives as hedges of highly probable forecast transactions or hedges of foreign currency risk of firm commitments (cash flow hedges), |
| A derivative is presented as a non-current asset or a non-current liability if the remaining maturity of the instrument is more than 12 months and it is not expected to be realised or settled within 12 months. Other derivatives are presented as current assets or current liabilities. |
K - 15
HOGLA-KIMBERLY LTD. AND SUBSIDIARIES
NOTES TO THE FINANCIAL STATEMENTS AS OF DECEMBER 31, 2010
| NOTE 2 | - | SUMMARY OF SIGNIFICANT ACCOUNTING POLICIES (Cont.) |
| M. | Derivative financial instruments (Cont.) |
| (2) | Hedge accounting |
| The Group designates certain hedging instruments, which include derivatives, and non-derivatives in respect of foreign currency risk, as cash flow hedges. |
| At the inception of the hedge relationship, the entity documents the relationship between the hedging instrument and the hedged item, along with its risk management objectives and its strategy for undertaking various hedge transactions. Furthermore, at the inception of the hedge and on an ongoing basis, the Group documents whether the hedging instrument that is used in a hedging relationship is highly effective in offsetting changes in fair values or cash flows of the hedged item. |
| Cash flow hedges |
| The effective portion of changes in the fair value of derivatives that are designated and qualify as cash flow hedges are deferred in equity. The gain or loss relating to the ineffective portion is recognised immediately in profit or loss, and is included in the “finance income” or "finance expenses" lines of the income statement. Amounts deferred in equity are recycled in profit or loss in the periods when the hedged item is recognised in profit or loss, in the same line of the income statement as the recognised hedged item. However, when the forecast transaction that is hedged results in the recognition of a non-financial asset or a non-financial liability, the gains and losses previously deferred in equity are transferred from equity and included in the initial measurement of the cost of the asset or liability. |
| Hedge accounting is discontinued when the Group revokes the hedging relationship, the hedging instrument expires or is sold, terminated, or exercised, or no longer qualifies for hedge accounting. Any cumulative gain or loss deferred in equity at that time remains in equity and is recognised when the forecast transaction is ultimately recognised in profit or loss. When a forecast transaction is no longer expected to occur, the cumulative gain or loss that was deferred in equity is recognised immediately in profit or loss. |
| N. | Revenue recognition |
| Revenue is measured at the fair value of the consideration received or receivable. Revenue is reduced for estimated customer returns, rebates and other similar allowances. |
| (1) | Sale of goods |
| Revenue from the sale of goods is recognised when all the following conditions are satisfied: |
| · | The Group has transferred to the buyer the significant risks and rewards of ownership of the goods; |
| · | The Group retains neither continuing managerial involvement to the degree usually associated with ownership nor effective control over the goods sold |
| · | The amount of revenue can be measured reliably; |
| · | It is probable that the economic benefits associated with the transaction will flow to the entity; and |
| · | The costs incurred or to be incurred in respect of the transaction can be measured reliably. |
K - 16
HOGLA-KIMBERLY LTD. AND SUBSIDIARIES
NOTES TO THE FINANCIAL STATEMENTS AS OF DECEMBER 31, 2010
| NOTE 2 | - | SUMMARY OF SIGNIFICANT ACCOUNTING POLICIES (Cont.) |
| N. | Revenue recognition (Cont.) |
| (2) | Interest revenue |
| Interest revenue is accrued on a time basis, by reference to the principal outstanding and at the effective interest rate applicable, which is the rate that exactly discounts estimated future cash receipts through the expected life of the financial asset to that asset’s net carrying amount. |
| O. | Taxation |
| Income tax expense represents the sum of the tax currently payable and deferred tax. |
| (1) | Current tax |
| The tax currently payable is based on taxable profit for the year. Taxable profit differs from profit as reported in the income statement because it excludes items of income or expense that are taxable or deductible in other years and it further excludes items that are never taxable or deductible. The Group’s liability for current tax is calculated using tax rates that have been enacted or substantively enacted by the balance sheet date. |
| (2) | Deferred tax |
| Deferred tax is recognised on differences between the carrying amounts of assets and liabilities in the financial statements and the corresponding tax bases used in the computation of taxable profit, and is accounted for using the balance sheet liability method. Deferred tax liabilities are generally recognised for all taxable temporary differences, and deferred tax assets are generally recognised for all deductible temporary differences to the extent that it is probable that taxable profits will be available against which those deductible temporary differences can be utilised. Such assets and liabilities are not recognised if the temporary difference arises from goodwill or from the initial recognition (other than in a business combination) of other assets and liabilities in a transaction that affects neither the taxable profit nor the accounting profit. |
| The carrying amount of deferred tax assets is reviewed at each balance sheet date and reduced to the extent that it is no longer probable that sufficient taxable profits will be available to allow all or part of the asset to be recovered. |
| Deferred tax assets and liabilities are measured at the tax rates that are expected to apply in the period in which the liability is settled or the asset realised, based on tax rates (and tax laws) that have been enacted or substantively enacted by the balance sheet date. The measurement of deferred tax liabilities and assets reflects the tax consequences that would follow from the manner in which the Group expects, at the reporting date, to recover or settle the carrying amount of its assets and liabilities. |
| Deferred tax assets and liabilities are offset when there is a legally enforceable right to set off current tax assets against current tax liabilities and when they relate to income taxes levied by the same taxation authority and the Group intends to settle its current tax assets and liabilities on a net basis. |
K - 17
HOGLA-KIMBERLY LTD. AND SUBSIDIARIES
NOTES TO THE FINANCIAL STATEMENTS AS OF DECEMBER 31, 2010
| NOTE 2 | - | SUMMARY OF SIGNIFICANT ACCOUNTING POLICIES (Cont.) |
| O. | Taxation (Cont.) |
| (3) | Current and deferred tax for the period |
| Current and deferred tax are recognized as an expense or income in profit or loss, except when they relate to items credited or debited directly to equity, in which case the tax is also recognized directly in equity, or where they arise from the initial accounting for a business combination. In the case of a business combination, the tax effect is taken into account in calculating goodwill or in determining the excess of the acquirer’s interest in the net fair value of the acquiree’s identifiable assets, liabilities and contingent liabilities over the cost of the business combination. |
| P. | prepaid expenses of operating lease |
| Operating lease payments are recognised as an expense on a straight-line basis over the lease term. the Company's lands in Afula which were leased from the Israel Land Administration, shall be presented in the Company's balance sheet as prepaid expenses for operating lease in respect of lease, and amortized over the remaining period of the lease. |
| Q. | Employee benefits |
| (1) | Post-Employment Benefits |
The Group's post-employment benefits include: benefits to retirees and liabilities for severance benefits. The Group's post-employment benefits are classified as either defined contribution plans or defined benefit plans. Most of the Group's employees are covered by Article 14 to the Severance Law and therefore the Group's companies makes regular deposits (contributions) in the name of their employees and do not have an obligation to pay further contributions. The Group's deposits under the Defined Contribution Plan are carried to the income statements on the date of the provision of work services, in respect of which the Group is obligated to make the deposit and no additional provision in the financial statements is required. |
Expenses in respect of a Defined Benefit Plan are carried to the income statement in accordance with the Projected Unit Credit Method, while using actuarial estimates that are performed at each balance sheet date. The current value of the Group's obligation in respect of the defined benefit plan is determined by discounting the future projected cash flows from the plan by the market yields on government bonds, denominated in the currency in which the benefits in respect of the plan will be paid, and whose redemption periods are approximately identical to the projected settlement dates of the plan. |
Actuarial profits and losses are carried to the income statements on the date they were incurred. The Past Service Cost is immediately recognized in the Group's income statement to the extent the benefit has vested. A past service cost which has not yet vested is amortized on a straight-line basis over the average vesting period until the benefit becomes vested. |
K - 18
HOGLA-KIMBERLY LTD. AND SUBSIDIARIES
NOTES TO THE FINANCIAL STATEMENTS AS OF DECEMBER 31, 2010
| NOTE 2 | - | SUMMARY OF SIGNIFICANT ACCOUNTING POLICIES (Cont.) |
| Q. | Employee benefits (Cont.) |
| (1) | Post-Employment Benefits (Cont.) |
The Group's liability in respect of the Defined Benefit Plan which is presented in the Group's balance sheet, includes the current value of the obligation in respect of the defined benefit, with the addition (net of) actuarial past service cost that was not yet recognized. A net plan, which is created from said calculation, is limited to the amount of the actuarial losses and past service cost that were not yet recognized with the addition of the current value of available economic benefits in the shape of returns from the plan or in the shape of reduction in future contributions to the plan. |
| (2) | Other long term employee benefits |
| Other long term employee benefits are benefits which it is anticipated will be utilized or which are to be paid during a period that exceeds 12 months from the end of the period in which the service that creates entitlement to the benefit was provided. |
| R. | Exchange Rates and Linkage Basis |
| Following are the changes in the representative exchange rates of the U.S. dollar vis-a-vis the NIS and the Turkish Lira and in the Israeli Consumer Price Index (“CPI”): |
As of: | Turkish Lira exchange rate vis-a-vis the U.S. dollar (TL’000 per $1) | Representative exchange rate of the dollar (NIS per $1) | CPI “in respect of” (in points) | |||||||||
| December 31, 2010 | 1,560 | 3.549 | 117.38 | |||||||||
| December 31, 2009 | 1,515 | 3.775 | 114.77 | |||||||||
| December 31, 2008 | 1,521 | 3.802 | 110.55 | |||||||||
| Increase (decrease) during the: | % | % | % | |||||||||
| Year ended December 31, 2010 | 2.97 | (5.99 | ) | 2.3 | ||||||||
| Year ended December 31, 2009 | (0.4 | ) | (0.71 | ) | 3.7 | |||||||
| Year ended December 31, 2008 | 29.38 | (1.14 | ) | 3.9 | ||||||||
K - 19
HOGLA-KIMBERLY LTD. AND SUBSIDIARIES
NOTES TO THE FINANCIAL STATEMENTS AS OF DECEMBER 31, 2010
| NOTE 2 | - | SUMMARY OF SIGNIFICANT ACCOUNTING POLICIES (Cont.) |
| S. | Adoption of new and revised Standards and interpretations |
| (1) | Standards and Interpretations Affecting Amounts Reported in the Current Period (and/ or prior periods) Standards Affecting Presentation and Disclosure |
| IAS 1 - Presentation of Financial Statements |
| Amendment IAS 1 "presentation of financial statements", which stipulates that changes in the components of the other comprehensive income will be presented in the statement of changes in equity or in the notes to the financial statements, according to the company's policy. |
| In accordance to the above, the company presents the changes in the components of the other comprehensive income in the changes in shareholder equity statements. |
| IAS 36 |
| The amendment to IAS 36 "Impairment of Assets" clarifies that in allocation of goodwill to cash-generating units or to groups of cash-generating units for impairment examination, each unit or group of units will not be larger than a segment, before grouping segments with similar economic characteristics to one segment. The amendment is implemented by way of "From now on" annual reporting periods beginning on January 1, 2010 or thereafter. The financial statements have not been effected by the amendment. |
| IAS 17 - "Leases" |
| According to the amendment land lease will be classified as operating lease or finance lease according to the standard's general guidance . |
| The amendment is effective commencing January 1 , 2010. |
| The amendment have no material effect on the financial statements |
| (2) | Standards and Interpretations which have not been applied in these financial statements were in issue but not yet effective |
| IFRS 2 |
The amendments clarify the scope of IFRS 2, as well as the accounting for group cash-settled share-based payment transactions in the separate (or individual) financial statements of an entity receiving the goods or services when another group entity or shareholder has the obligation to settle the award. |
| IFRS 7 - Disclosures of Financial Instruments |
| The amendments to IFRS 7 clarify the required level of disclosures about credit risk and collateral held and provide relief from disclosures previously required regarding renegotiated loans. The Group has applied the amendments in advance of their effective date (annual periods beginning on or after 1 January 2011). |
K - 20
HOGLA-KIMBERLY LTD. AND SUBSIDIARIES
NOTES TO THE FINANCIAL STATEMENTS AS OF DECEMBER 31, 2010
| NOTE 2 | - | SUMMARY OF SIGNIFICANT ACCOUNTING POLICIES (Cont.) |
| S. | Adoption of new and revised Standards and interpretations (Cont) |
| (2) | Standards and Interpretations which have not been applied in these financial statements were in issue but not yet effective(Cont) |
| IFRS 9 “Financial Instruments” |
| The new Standard provides for the classification and measurement of financial assets and liabilities. In accordance with the Standard, all financial assets are to be treated as follows: |
| · | Debt instruments will be classified and measured subsequent to initial recognition at amortized cost or at fair value through profit or loss. The mode of measurement will be determined based on the entity’s business model for managing financial assets and in accordance with the characteristics of the contractual cash flows deriving from such financial assets. |
| · | A debt instrument which, according to the criteria, is measured at amortized cost may only be designated at fair value through profit or loss if such designation eliminates inconsistencies in the recognition and measurement that would have arose had the asset been measured at amortized cost. |
| · | Equity instruments will be measured at fair value through profit or loss. |
| · | Equity instruments may be designated at fair value through profit or loss, with any gains or losses being recognized in other comprehensive income. Instruments that have been designated as aforesaid will cease to be tested for impairment and any related gain or loss will not be recognized in profit or loss, including in the event of disposal. |
| · | Embedded derivatives in financial assets will not be separated from the host contract. Instead, hybrid contracts will be measured as a whole at amortized cost or at fair value, in accordance with the business model and the contractual cash flows criteria. |
| · | Debt instruments will be reclassified from amortized cost to fair value and vice versa only if the entity changes its business model for managing financial assets. |
| · | Investments in equity instruments that are not quoted on an active market, including derivatives on such assets, will be measured solely at fair value. The alternative measurement at cost under certain circumstances has been eliminated. Nevertheless, the Standard determines that, under limited circumstances, cost may be an appropriate estimate of fair value. |
| The Standard also prescribes the following provisions with respect to financial liabilities: |
| · | The change in the fair value of a financial liability that is designated at fair value through profit or loss upon initial recognition, which is attributed to changes in the credit risk of the liability, is recognized directly in other comprehensive income, unless such recognition gives rise to or increases accounting disparity. |
K - 21
HOGLA-KIMBERLY LTD. AND SUBSIDIARIES
NOTES TO THE FINANCIAL STATEMENTS AS OF DECEMBER 31, 2010
| NOTE 2 | - | SUMMARY OF SIGNIFICANT ACCOUNTING POLICIES (Cont.) |
| S. | Adoption of new and revised Standards and interpretations (Cont) |
| (2) | Standards and Interpretations which have not been applied in these financial statements were in issue but not yet effective (Cont) |
| · | Upon the repayment or settlement of a financial liability, the amount of the fair value recognized in other comprehensive income will not be classified to profit or loss. |
| · | All derivatives, whether assets or liabilities, will be measured at fair value, including a derivative financial instrument that constitutes a liability, which is related to an unquoted equity instrument for which a fair value cannot be determined reliably. |
| The provisions of the Standard are to be applied retrospectively, other than in a number of exceptions provided for in the Standard, to annual reporting periods commencing on January 1, 2013 or thereafter. Early adoption is permitted. |
| Entities that opt for early adoption of the Standard prior to January 1, 2012 are not required to apply the Standard retrospectively. Additionally, subject to the transitional provisions of the Standard, early adoption solely of the provisions of the Standard with respect to financial assets, excluding the aforesaid provisions relating to financial liabilities, is permissible. |
| The Company’s management estimates that the effect of the adoption of the Standard on the financial statements of the Group will be unsignificant. |
| NOTE 3 | - | CRITICAL ACCOUNTING JUDGEMENTS AND KEY SOURCES OF ESTIMATION UNCERTAINTY |
| A. | General |
| In the application of the Group’s accounting policies, which are described in Note 2, management is required to make judgments, estimates and assumptions about the carrying amounts of assets and liabilities that are not readily apparent from other sources. The estimates and associated assumptions are based on historical experience and other factors that are considered to be relevant. Actual results may differ from these estimates. |
| The estimates and underlying assumptions are reviewed on an ongoing basis. Revisions to accounting estimates are recognized in the period in which the estimate is revised if the revision affects only that period or in the period of the revision and future periods if the revision affects both current and future periods. |
| B. | Critical judgments in applying accounting policies |
| The following are the critical judgments, apart from those involving estimations (see below), that the management have made in the process of applying the entity’s accounting policies and that have the most significant effect on the amounts recognized in financial statements. |
K - 22
HOGLA-KIMBERLY LTD. AND SUBSIDIARIES
NOTES TO THE FINANCIAL STATEMENTS AS OF DECEMBER 31, 2010
| NOTE 3 | - | CRITICAL ACCOUNTING JUDGEMENTS AND KEY SOURCES OF ESTIMATION UNCERTAINTY (Cont) |
| Revenue recognition |
| In making their judgment, the management considered the detailed criteria for the recognition of revenue from the sale of goods set out in IAS 18 Revenue and, in particular, whether the Group had transferred to the buyer the significant risks and rewards of ownership of the goods. Following the detailed quantification of the Group’s liability in respect of rectification work, and the agreed limitation on the customer’s ability to require further work or to require replacement of the goods, the management is satisfied that the significant risks and rewards have been transferred and that recognition of the revenue in the current year is appropriate, in conjunction with the recognition of an appropriate provision for the rectification costs. |
| Impairment of goodwill |
Determining whether goodwill is impaired requires an estimation of the value in use of the cash-generating units to which goodwill has been allocated. The value in use calculation requires the management to estimate the future cash flows expected to arise from the cash-generating unit and a suitable discount rate in order to calculate present value. |
| The carrying amount of goodwill at the balance sheet date was NIS 17 million. |
| Useful lives of property, plant and equipment |
| As described at 2G above, the Group reviews the estimated useful lives of property, plant and equipment at the end of each annual reporting period. |
| Contingent liabilities |
| As of December 31, 2010 the company has a legal dispute with the tax authorities in Turkey regarding tax inspection that was performed during 2009.(see note 14) |
| According to the tax report the company need to pay additional tax and penalties in the amount of 90 million Dollar. The company's management , based on the legal advisors, estimates that the possibility of a negative cash flow is not probable therefore did not provide any provisions. |
| C. | Key sources of estimation uncertainty |
| The following are the key assumptions concerning the future, and other key sources of estimation uncertainty at the balance sheet date, that have a significant risk of causing a material adjustment to the carrying amounts of assets and liabilities within the next financial year. |
| Employee retirement benefits |
| The present value of the employee retirement benefits is based on an actuarial valuation using many assumptions inter alia the capitalization rate. Changes in the assumptions may influence the book value of the liabilities for retirement benefits. The Company determines the capitalization rate once a year based on the basis of the capitalization rate of government bonds. Other key assumptions are based on the current prevailing terms in the market and the past experience of the Company (see also note 10). |
K - 23
HOGLA-KIMBERLY LTD. AND SUBSIDIARIES
NOTES TO THE FINANCIAL STATEMENTS AS OF DECEMBER 31, 2010
| NOTE 4 | - | CASH AND CASH EQUIVALENTS |
As of December 31, | ||||||||
2010 | 2009 | |||||||
NIS in thousands | ||||||||
| Cash in banks | 747 | 1,788 | ||||||
| Short term bank deposits | 15,985 | 105,208 | ||||||
| Cash and cash equivalents | 16,732 | 106,996 | ||||||
| NOTE 5 | - | TRADE RECEIVABLES |
| Composition |
As of December 31, | ||||||||
2010 | 2009 | |||||||
NIS in thousands | ||||||||
Domestic - Open accounts | 177,147 | 179,902 | ||||||
- Checks receivable | 40,979 | 38,957 | ||||||
- Related parties | 1,519 | 940 | ||||||
| 219,645 | 219,799 | |||||||
| Foreign - Open accounts | 45,450 | 38,470 | ||||||
- Related parties | 26,489 | 34,742 | ||||||
| 71,939 | 73,212 | |||||||
| 291,584 | 293,011 | |||||||
| Less - allowance for doubtful accounts | 2,490 | 3,331 | ||||||
| 289,094 | 289,680 | |||||||
| The average credit period on sales of goods is 65 days. |
| For each customer, where possible, the Company checks its credit rating with an external credit rating companies to assess the potential customer’s credit quality and help in defining its credit limit. Credit limit for each customer is determined and approved according to the Company's policy taking into account its rating and collaterals. |
| Of the trade receivables balance at the end of the year, 40.3 million NIS (2009: 49.4 million) is due from Company A, and 27.8 million Nis (2009: 36 million) is due from customer B which are the Group’s largest customers .There are no other customers who represent more than 10% of the total balance of trade receivables. |
| Hogla Kimberly exposure to credit and currency risks and impairment losses related to trade and other receivables are disclosed in note 23. |
| Included in the Group's trade receivable balance, are debtors with a carrying amount of NIS 9,415 thousands which are past due at the reporting date for which the Group has not provided as there has not been a significant change in credit quality and the amounts are still considered recoverable. The Group is insured for NIS 130 million of these balances. |
K - 24
HOGLA-KIMBERLY LTD. AND SUBSIDIARIES
NOTES TO THE FINANCIAL STATEMENTS AS OF DECEMBER 31, 2010
| NOTE 5 | - | TRADE RECEIVABLES (Cont.) |
| Ageing of past due but not impaired |
As of December 31, 2010 | ||||
| 30-90 days | 931 | |||
| More then 90 days | 8,484 | |||
| 9,415 | ||||
| Movement in provision for doubtful debts during the year |
As of December 31 | ||||||||
2010 | 2009 | |||||||
NIS in thousands | ||||||||
| Balance at beginning of the year | 3,331 | 7,465 | ||||||
| Impairment losses recognized on receivables | 112 | 315 | ||||||
| Amounts written off as uncollectible | (379 | ) | (2,943 | ) | ||||
| Amounts recovered during the year | (439 | ) | (1,506 | ) | ||||
| Foreign currency exchange rate differences | (135 | ) | - | |||||
| Balance at end of the year | 2,490 | 3,331 | ||||||
| NOTE 6 | - | INVENTORIES |
| Composition |
As of December 31, | ||||||||
2010 | 2009 | |||||||
NIS in thousands | ||||||||
| Raw and auxiliary materials | 114,281 | 80,660 | ||||||
| Finished goods | 106,345 | 79,012 | ||||||
| Spare parts and other | 21,177 | 20,959 | ||||||
| 241,803 | 180,631 | |||||||
In 2010 raw materials and changes in finished goods recognized as cost of sales amounted to NIS 618,740 (2009 – NIS 597,791). |
As of December 31, 2010 and 2009 allowance for impairment of inventory amounted to NIS 7.1and NIS 5.7 million, respectively. |
| All Finish goods and Raw and auxiliary materials inventories are expected to be recovered in period of no more than twelve months. |
| NOTE 7 | - | OTHER CURRENT ASSETS |
As of December 31, | ||||||||
2010 | 2009 | |||||||
NIS in thousands | ||||||||
| Prepaid expenses | 2,913 | 2,976 | ||||||
| Loans to employees | 489 | 473 | ||||||
| Other | 3,776 | 2,308 | ||||||
| 7,178 | 5,757 | |||||||
K - 25
HOGLA-KIMBERLY LTD. AND SUBSIDIARIES
NOTES TO THE FINANCIAL STATEMENTS AS OF DECEMBER 31, 2010
| NOTE 8 | - | PROPERTY PLANT AND EQUIPMENT |
| A. | Composition and movement |
| Machinery | Furniture | |||||||||||||||||||||||
Buildings | Improvements | Equipment | Vehicles | Equipment | Total | |||||||||||||||||||
NIS in thousands | ||||||||||||||||||||||||
| Cost: | ||||||||||||||||||||||||
| Balance - January 1, 2010 | 53,267 | 18,150 | 515,556 | 12,338 | 14,440 | 613,751 | ||||||||||||||||||
| Changes during 2010: | ||||||||||||||||||||||||
| Additions | 890 | 1,328 | 52,342 | - | 1,035 | 55,595 | ||||||||||||||||||
| Dispositions | (211 | ) | - | (7,392 | ) | (667 | ) | (124 | ) | (8,394 | ) | |||||||||||||
| Foreign currency translation adjustments | (2,624 | ) | (105 | ) | (7,568 | ) | (75 | ) | (472 | ) | (10,844 | ) | ||||||||||||
| Balance - December 31, 2010 | 51,322 | 19,373 | 552,938 | 11,596 | 14,879 | 650,108 | ||||||||||||||||||
| Accumulated depreciation: | ||||||||||||||||||||||||
| Balance - January 1, 2010 | 21,323 | 9,538 | 225,707 | 11,225 | 11,354 | 279,147 | ||||||||||||||||||
| Changes during 2010: | ||||||||||||||||||||||||
| Additions | 1,313 | 1,535 | 26,731 | 460 | 1,028 | 31,067 | ||||||||||||||||||
| Dispositions | (183 | ) | - | (6,310 | ) | (666 | ) | (76 | ) | (7,235 | ) | |||||||||||||
| Foreign currency translation adjustments | (478 | ) | (106 | ) | (2,464 | ) | (75 | ) | (308 | ) | (3,431 | ) | ||||||||||||
| Balance - December 31, 2010 | 21,975 | 10,967 | 243,664 | 10,944 | 11,998 | 299,548 | ||||||||||||||||||
| Net book value: | ||||||||||||||||||||||||
| December 31, 2010 | 29,347 | 8,406 | 309,274 | 652 | 2,881 | 350,560 | ||||||||||||||||||
| Machinery | Furniture | |||||||||||||||||||||||
Buildings | Improvements | Equipment | Vehicles | Equipment | Total | |||||||||||||||||||
NIS in thousands | ||||||||||||||||||||||||
| Cost: | ||||||||||||||||||||||||
| Balance - January 1, 2009 | 51,090 | 15,718 | 482,521 | 12,343 | 13,862 | 575,534 | ||||||||||||||||||
| Changes during 2009: | ||||||||||||||||||||||||
| Additions | 2,412 | 2,431 | 42,428 | - | 618 | 47,889 | ||||||||||||||||||
| Dispositions | (130 | ) | - | (8,984 | ) | - | (18 | ) | (9,132 | ) | ||||||||||||||
| Foreign currency translation adjustments | (105 | ) | 1 | (409 | ) | (5 | ) | (22 | ) | (540 | ) | |||||||||||||
| Balance - December 31, 2009 | 53,267 | 18,150 | 515,556 | 12,338 | 14,440 | 613,751 | ||||||||||||||||||
| Accumulated depreciation: | ||||||||||||||||||||||||
| Balance - January 1, 2009 | 20,208 | 8,241 | 209,087 | 10,663 | 10,161 | 258,360 | ||||||||||||||||||
| Changes during 2009: | ||||||||||||||||||||||||
| Additions | 1,268 | 1,293 | 24,732 | 567 | 1,218 | 29,078 | ||||||||||||||||||
| Dispositions | (130 | ) | - | (8,004 | ) | - | (18 | ) | (8,152 | ) | ||||||||||||||
| Foreign currency translation adjustments | (23 | ) | 4 | (108 | ) | (5 | ) | (7 | ) | (139 | ) | |||||||||||||
| Balance - December 31, 2009 | 21,323 | 9,538 | 225,707 | 11,225 | 11,354 | 279,147 | ||||||||||||||||||
| Net book value: | ||||||||||||||||||||||||
| December 31, 2009 | 31,944 | 8,612 | 289,849 | 1,113 | 3,086 | 334,604 | ||||||||||||||||||
K - 26
HOGLA-KIMBERLY LTD. AND SUBSIDIARIES
NOTES TO THE FINANCIAL STATEMENTS AS OF DECEMBER 31, 2010
| NOTE 8 | - | PROPERTY PLANT AND EQUIPMENT (Cont.) |
| B. | Prepaid expenses for operating lease |
| Hogla-Kimberly leased land in Afula from the Israel Land Administration on January 1988 at the amount of NIS 4,600 thousand, the end of the leasing period is September 2023. |
As of December 31, | ||||||||
2 0 1 0 | 2 0 0 9 | |||||||
NIS in thousands | ||||||||
| Prepaid expenses for operating leases as of January, 1988 | 4,600 | 4,600 | ||||||
| Accumulated expenses recognized in profit and loss | (2,963 | ) | (2,835 | ) | ||||
| 1,637 | 1,765 | |||||||
| NOTE 9 | - | INVESTMENTS IN SUBSIDIARIES |
| A. | Goodwill |
As of December 31, | ||||||||
2 0 1 0 | 2 0 0 9 | |||||||
NIS in thousands | ||||||||
| Cost | 26,009 | 26,009 | ||||||
| Translation adjustments | (8,976 | ) | (7,359 | ) | ||||
| 17,033 | 18,650 | |||||||
| B. | Annual impairment test |
| The goodwill is allocated to KCTR's activity, which is the cash generating unit for the purpose of calculating the recoverable amount. |
| The recoverable amount value is based on the fair value of investment in KCTR less cost to sell, calculated by five years DCF forecast approved by the company's management and based on the following assumptions, determined by KC experience in similar markets. : |
| 1. | Long term growth ratio of 2.5%. |
| 2. | Weighted cost of capital of 14.5%. |
| C. | Investment in Kimberli Clark Tuketim Mallari Sanayi Ve Ticaret A.Ş. ("KCTR") |
| As of December 31, 2010 and 2009, the Group’s investment in KCTR (a Turkish Subsidiary) amounted to NIS 224,099 and NIS 250,813 thousand respectively (including (including goodwill – see above). In recent years KCTR incurred significant losses from operations. |
| The company examined the investment in KCTR for impairment in accordance to its revocable amount. |
| Based on the said examination, the company's business forecast and estimates made, no impairment is required. (see note 10 B above) |
| During years 2005 - 2010, the Company provided KCTR NIS 583,758 thousand for the continuation of its on going operations. In addition, the Company has committed to financially support KCTR in 2011. Such finance support may be granted to KCTR either by cash injections, long-term loans, or guaranties if required so by banks according to the financing needs of KCTR. |
K - 27
HOGLA-KIMBERLY LTD. AND SUBSIDIARIES
NOTES TO THE FINANCIAL STATEMENTS AS OF DECEMBER 31, 2010
| NOTE 9 | - | INVESTMENTS IN SUBSIDIARIES (Cont.) |
| D. | Consolidated Subsidiaries |
| The consolidated financial statements as of December 31, 2010, include the financial statements of the following Subsidiaries: |
Ownership and control as of December 31, 2010 | ||||
% | ||||
| Hogla-Kimberly Marketing Ltd. (“Marketing”) | 100 | |||
Kimberly Clark Tuketim Mallari Sanayi Ve Ticaret A.Ş. (“KCTR”) | 100 | |||
| Mollet Marketing Ltd. (“Mollet”) | 100 | |||
| H-K Overseas (Holland) B.V. (*) | 100 | |||
| Hogla-Kimberly Holding Anonim Sirketi (*) | 100 | |||
| (*) The company is inactive. |
| NOTE 10 | - | EMPLOYEE BENEFITS |
| A. | Composition |
As of December 31, | ||||||||
2 0 1 0 | 2 0 0 9 | |||||||
NIS in thousands | ||||||||
| Post Employment Benefits: | ||||||||
| Severance pay benefits: | ||||||||
| Severance pay liability | 4,759 | 4,176 | ||||||
| Less – Amounts deposited with a general fund | (2,205 | ) | (2,160 | ) | ||||
| Severance pay net | 2,554 | 2,016 | ||||||
| Liability for early retirement | 3,410 | 4,237 | ||||||
| Benefits to retirees | 2,308 | 1,910 | ||||||
| Other short term employee benefits: | ||||||||
| Liability for vacation pay | 11,798 | 11,690 | ||||||
| Stated in the balance sheet as follows: | ||||||||
| Non current Assets | 639 | 517 | ||||||
| Short-term Liabilities | 12,810 | 12,855 | ||||||
| Long-term Liabilities | 7,899 | 7,515 | ||||||
| 20,070 | 19,853 | |||||||
K - 28
HOGLA-KIMBERLY LTD. AND SUBSIDIARIES
NOTES TO THE FINANCIAL STATEMENTS AS OF DECEMBER 31, 2010
| NOTE 10 | - | EMPLOYEE BENEFITS (Cont.) |
| B. | Defined contribution plan |
Most of the Company and its Israeli subsidiaries employees are covered by Article 14 to the Severance Law and therefore the Company and its Israeli subsidiaries makes regular deposits (contributions) in the name of their employees and do not have an obligation to pay further contributions. The Group's deposits under the Defined Contribution Plan are carried to the income statements on the date of the provision of work services, in respect of which the Group is obligated to make the deposit and no additional provision in the financial statements is required. |
| During the year 2010 a sum of NIS 22,623 thousand was recognized in the income statement due to the defined contribution plan. |
| C. | Actuarial assumptions |
| The groups defined benefit plans and other long term employee benefits provisions, has been calculated by estimating the present value of the future probable obligation using actuarial valuation methods. The discounted rate is based on yield on government bonds at a fixed interest rate which have an average lifetime equal to that of the gross liability. The actuarial assumptions used in each plan are detailed bellow. |
| D. | Defined benefit plans |
| The groups defined benefit plans include benefits to retirees and severance pay |
| 1. | The group's Severance pay liability. |
| Severance pay provisions resulting from the Israeli companies and included in the financial statements of the group are due to increased severance pay which are not covered by deposits made on monthly basis. In respect of this part of the obligation, there is a reserve deposited in the Company's name in a recognized compensation fund |
Under the Turkish Labor Law, the Company is required to pay employment termination benefits to each employee who has qualified. Also, employees are required to be paid their retirement pay provisions who retired by gaining right to receive retirement pay provisions according to current 506 numbered Social Insurance Law’s 6 March 1981 dated, 2422 numbered, 25 August 1999 dated and 4447 numbered with 60th article that has been changed. Some transition provisions related to the pre-retirement service term was excluded from the law since the related law was changed as of 23 May 2002. |
K - 29
HOGLA-KIMBERLY LTD. AND SUBSIDIARIES
NOTES TO THE FINANCIAL STATEMENTS AS OF DECEMBER 31, 2010
| NOTE 10 | - | EMPLOYEE BENEFITS (Cont.) |
| D. | Defined benefit plans (Cont.) |
| 1. | The group's Severance pay liability. (Cont.) |
| The principal assumptions used for the Severance pay liability in Israel actuarial valuations were as follows: |
Valuation at | ||||||||
2010 | 2009 | |||||||
| Discount rate | 4.88 | % | 5.47 | % | ||||
| Expected rate of inflation | 2.81 | % | 2.64 | % | ||||
| Expected rate of salary increase | 4.25 | % | 4.25 | % | ||||
| The provisions at the respective balance sheet dates in Turkish subsidiary have been calculated assuming an annual inflation rate of 5.1% and a discount rate of 10%, the anticipated rate of forfeitures is considered. |
| The amounts recognized in profit or loss in respect of Severance pay liability are as follows: |
Year ended December 31, | ||||||||||||
2010 | 2009 | 2008 | ||||||||||
NIS in thousands | ||||||||||||
| Current service cost | 1,293 | 1,257 | 2,724 | |||||||||
| Interest on obligations | 232 | 192 | 135 | |||||||||
| Actuarial losses recognized during the year | 17 | 143 | 51 | |||||||||
| Benefit paid during the year | (669 | ) | (744 | ) | (440 | ) | ||||||
| Foreign currency translation affect | (290 | ) | (13 | ) | (271 | ) | ||||||
| 583 | 835 | 2,199 | ||||||||||
| The amount included in the balance sheet arising from the entity's obligation in respect of Severance pay liability is as follows: |
As of December 31, | ||||||||
2010 | 2009 | |||||||
NIS in thousands | ||||||||
| Present value of Severance pay liability | 4,759 | 4,176 | ||||||
| The amount of Severance pay liability of 4,759 consists of: NIS 3,194 thousands (2009 – NIS 2,533 thousands) due to severance pay liability for of the Turkish subsidiary employees according to the Turkish law and NIS 1,565 thousand(2009 – NIS 1,643 thousands) due to liability for increased severance pay for certain employees according to a collective agreement. |
K - 30
HOGLA-KIMBERLY LTD. AND SUBSIDIARIES
NOTES TO THE FINANCIAL STATEMENTS AS OF DECEMBER 31, 2010
| NOTE 10 | - | EMPLOYEE BENEFITS (Cont.) |
| D. | Defined benefit plans (cont.) |
| 1. | The group's Severance pay liability. (Cont.) |
Movements in the present value of Severance pay liability in the current period were as follows: |
As of December 31, | ||||||||
2010 | 2009 | |||||||
NIS in thousands | ||||||||
| Opening defined benefit obligation | 4,176 | 3,341 | ||||||
| Current service cost | 1,293 | 1,257 | ||||||
| Interest cost | 232 | 192 | ||||||
| Actuarial losses | 17 | 143 | ||||||
| Benefit paid during the year | (669 | ) | (744 | ) | ||||
| Foreign currency translation affect | (290 | ) | (13 | ) | ||||
| Closing defined benefit obligation | 4,759 | 4,176 | ||||||
| 2. | Benefits to retirees of holiday vouchers. |
| The financial statements include liability to benefits given to retirees – holiday gifts. |
| Employees who are not temporary are entitled to received holiday vouchers, after retirement, until the end of their life. In cases of death, the remaining spouses are entitled to receive the benefits until the end of their life. |
| The principal assumptions used for the purposes of the actuarial valuations were as follows: |
Valuation at | ||||||||
2010 | 2009 | |||||||
| Discount rate | 4.88 | % | 5.54 | % | ||||
| Expected rate of inflation | 2.81 | % | 2.61 | % | ||||
| Expected rate of leaving | 2.6%-15.1 | % | 2.6%-15.1 | % | ||||
| The amounts recognized in profit or loss in respect of these defined benefit plans are as follows: |
Year ended December 31, | ||||||||||||
2010 | 2009 | 2008 | ||||||||||
NIS in thousands | ||||||||||||
| Current service cost | 43 | 59 | 48 | |||||||||
| Interest on obligations | 106 | 105 | 92 | |||||||||
| Actuarial losses recognized in the year | 363 | 68 | 58 | |||||||||
| Benefit paid during the year | (114 | ) | (112 | ) | (104 | ) | ||||||
| 398 | 120 | 94 | ||||||||||
K - 31
HOGLA-KIMBERLY LTD. AND SUBSIDIARIES
NOTES TO THE FINANCIAL STATEMENTS AS OF DECEMBER 31, 2010
| NOTE 10 | - | EMPLOYEE BENEFITS (Cont.) |
| D. | Defined benefit plans (cont.) |
| 2. | Benefits to retirees of holiday vouchers (Cont.) |
The amount included in the balance sheet arising from the entity's obligation in respect of its benefits to retirees' plans is as follows: |
As of December 31, | ||||||||
2010 | 2009 | |||||||
NIS in thousands | ||||||||
| Present value of funded defined benefit obligation | 2,308 | 1,910 | ||||||
| Movements in the present value of the defined benefit obligation in the current period were as follows: |
As of December 31, | ||||||||
2010 | 2009 | |||||||
NIS in thousands | ||||||||
| Opening defined benefit obligation | 1,910 | 1,995 | ||||||
| Current service cost | 43 | 31 | ||||||
| Interest cost | 106 | 100 | ||||||
| Actuarial losses | 363 | 59 | ||||||
| Benefits paid | (114 | ) | (275 | ) | ||||
| Closing defined benefit obligation | 2,308 | 1,910 | ||||||
| E. | Other short term employee benefits |
| Other short term employee benefits are benefits which it is anticipated will be utilized or which are to be paid during a period that exceeds 12 months from the end of the period in which the service that creates entitlement to the benefit was provided. |
| F. | Early retirement |
| The obligation in respect of early retirement includes an obligation for pension for the period starting the date of the early retirement up to reaching the legal retirement age. |
| The amount included in the balance sheet arising from the entity's obligation in respect of early retirement is as follows: |
As of December 31, | ||||||||
2010 | 2009 | |||||||
NIS in thousands | ||||||||
| Present value of funded defined benefit obligation | 3,410 | 4,237 | ||||||
K - 32
HOGLA-KIMBERLY LTD. AND SUBSIDIARIES
NOTES TO THE FINANCIAL STATEMENTS AS OF DECEMBER 31, 2010
| NOTE 10 | - | EMPLOYEE BENEFITS (Cont.) |
| F. | Early retirement (Cont) |
| Movements in the present value of early retirement in the current period were as follows: |
As of December 31, | ||||||||
2010 | 2009 | |||||||
NIS in thousands | ||||||||
| Opening defined benefit obligation | 4,237 | 5,009 | ||||||
| Interest cost | 207 | 220 | ||||||
| Additions | 163 | 402 | ||||||
| Benefits paid | (1,197 | ) | (1,394 | ) | ||||
| Closing defined benefit obligation | 3,410 | 4,237 | ||||||
| Stated in balance sheet | As of December 31, | |||||||
2010 | 2009 | |||||||
NIS in thousands | ||||||||
| Short term liabilities | 1,013 | 1,165 | ||||||
| Long term liabilities | 2,397 | 3,072 | ||||||
| 3,410 | 4,237 | |||||||
| NOTE 11 | - | BORROWINGS |
| This Note provides information about the contractual terms of the interest-bearing loans and borrowings. For more information about the exposure of the Group to interest rate and foreign currency risks, see Note 23 |
| A. | Composition |
December 31, 2010 | December 31, 2009 | |||||||
NIS thousands | ||||||||
| Current liabilities to banks | ||||||||
| Short-term borrowings | 9,845 | 670 | ||||||
| Current maturities of long term bank loans (*) | 26,795 | 25,307 | ||||||
| 36,640 | 25,977 | |||||||
| Non-current liabilities to banks and others | ||||||||
| Long tern bank loans | 6,941 | 33,736 | ||||||
| 43,581 | 59,713 | |||||||
| (*) | The loans are not linked and bear interest at a variable rate. The principal of the loan and interest are paid quarterly. |
K - 33
HOGLA-KIMBERLY LTD. AND SUBSIDIARIES
NOTES TO THE FINANCIAL STATEMENTS AS OF DECEMBER 31, 2010
| NOTE 11 | - | BORROWINGS (Cont.) |
| B. | Terms and debt repayment table |
| Nominal interest | Current Liabilities | Non-Current liabilities | |||||||||||||||||||
| rate (*) | December 31, | December 31, | |||||||||||||||||||
| 2010 | 2009 | 2010 | 2009 | ||||||||||||||||||
| Currency | % | NIS in thousands | |||||||||||||||||||
| Loans and borrowings from banks: | |||||||||||||||||||||
| Borrowing: | |||||||||||||||||||||
| NIS nominated | NIS | 3.8-4.7 | - | - | - | - | |||||||||||||||
| YTL nominated | YTL | 7.8 | 9,845 | 670 | - | - | |||||||||||||||
| Loans: | |||||||||||||||||||||
| NIS nominated | NIS | 3.5 | 26,795 | 25,307 | 6,941 | 33,736 | |||||||||||||||
| 36,640 | 25,977 | 6,941 | 33,736 | ||||||||||||||||||
| Terms and debt repayment table |
| On January 2008, the Company made an agreement with an Israeli bank for prime linked interest loan in the amount of NIS 100 million which will be repaid during a four years period. As part of the agreement the Company agreed to the following covenants: |
| 1. | It's shareholder's equity will not be less than NIS 250 million and not less than 25% of the total consolidated assets. |
| 2. | Both the Company's shareholder's Kimberly Clark and Hadera Paper separately or together, will not hold less than 51% of the Company's share capital. |
| As of December 31, 2010 the Company meets all covenants agreed with banks. |
As of December 31, | ||||
2 0 1 0 | ||||
NIS in thousands | ||||
| Maturities of long term loans | ||||
| First year - 2011 | 26,795 | |||
| Second year - 2012 | 6,941 | |||
| 33,736 | ||||
| NOTE 12 | - | TRADE PAYABLES |
As of December 31, | ||||||||
2 0 1 0 | 2 0 0 9 | |||||||
NIS in thousands | ||||||||
| In Israeli currency: | ||||||||
| Open accounts | 145,420 | 143,957 | ||||||
| Related parties | 32,767 | 28,611 | ||||||
| In foreign currency: | ||||||||
| Open accounts | 115,085 | 95,164 | ||||||
| Related parties | 36,644 | 28,626 | ||||||
| 329,916 | 296,358 | |||||||
| The average credit period is 103 days. |
| Regarding exposure to currency risks are disclosed in note 23. |
| The Trade payables balance include an amount of NIS 8,485 Thousands (2009: NIS 15,454 thousands) due to fixed assets purchases. |
K - 34
HOGLA-KIMBERLY LTD. AND SUBSIDIARIES
NOTES TO THE FINANCIAL STATEMENTS AS OF DECEMBER 31, 2010
| NOTE 13 | - | OTHER PAYABLES AND ACCRUED EXPENSES |
As of December 31, | ||||||||
2 0 1 0 | 2 0 0 9 | |||||||
NIS in thousands | ||||||||
| Accrued payroll and related expenses | 30,926 | 36,689 | ||||||
| Value Added Tax | 4,472 | 7,955 | ||||||
| Advances from customers | 142 | 278 | ||||||
| Derivatives liabilities (*) | 2,124 | 119 | ||||||
| Sales Agent fee accrual | 3,594 | 6,534 | ||||||
| Other | 2,796 | 6,298 | ||||||
| 44,054 | 57,873 | |||||||
| (*) Derivatives liabilities see note 23. |
| NOTE 14 | - | COMMITMENTS CONTINGENT LIABILITIES AND OTHER INFORMATION |
| A. | Commitments |
| (1) | The Group is obligated to pay royalties to a shareholder - see also Note 24B. |
| (2) | The Company and its Subsidiaries lease a number of their facilities under operating leases for varying periods with renewal options. The Company does not have an option to purchase the leased assets at the end of the lease period .In addition the company has a vehicles lease agreement for the period between 2008-2014 Future minimum lease and vehicles leasing rentals as of December 31, 2010 are as follows: |
NIS in thousands | ||||
| 2011 | 27,846 | |||
| 2012-2015 | 86,665 | |||
| 2016 and thereafter | 77,149 | |||
| 191,660 | ||||
| B. | Guarantees |
| (1) | As part of their normal course of business, the Company and its Subsidiaries provided third parties with bank guarantees for contract performance, the balance of which as of December 31, 2010 amounted to NIS 180 thousand. |
| (2) | A Subsidiary has given letter of guarantees to the local banks for a number of contingent liabilities that have arisen as a result of the Company’s importing transactions. The amount disclosed of NIS 2,425 thousands represents the aggregate amount of such contingent liabilities for which the Company as an importer is liable. |
K - 35
HOGLA-KIMBERLY LTD. AND SUBSIDIARIES
NOTES TO THE FINANCIAL STATEMENTS AS OF DECEMBER 31, 2010
| NOTE 14 | - | COMMITMENTS CONTINGENT LIABILITIES AND OTHER INFORMATION (Cont.) |
| C. | Legal proceedings |
| 1. | In July 2005, Clubmarket Marketing Chains Ltd. (“Clubmarket”), a customer of the Company and one of the largest retail groups in Israel, applied for the regional court in Tel-Aviv (“Court”) for a staying of procedures by creditors. In December 2005, the Court approved a creditors settlement submitted by the trustees, according to which, amongst other matters, the Company is to receive about 51% of Clubmarket’s debt to the Company. |
| On September 2007 a compromise was made between the trustees and the company, which was approved by the court, that the total approved debt of clubmarket to the company is NIS 23.9 million. Until December 31, 2010, NIS 11 million was received as part of the creditors' settlement. |
| There is not any remaining net balance of Clubmarket's debt as of December 31, 2010, that is in excess of the doubtful accounts provision recorded in the financial statements. |
| 2. | On July 12, 2007 a lawsuit was filled against KCTR, a Hogla Kimberly subsidiary, by a former distributor, claiming financial loss caused to him. The amount claimed is approximately YTL 832 thousands (NIS 2,045 thousands).KCTR filed a counter claim for it's damage in the amount of approximately YTL 355 thousands ( NIS 873 thousands). Based on the Company’s legal counsels, management estimates that the Company has valid arguments to oppose the lawsuit, and it is probable that its arguments will be accepted. Therefore, no provision was recorded in the financial statements relating to this lawsuit. |
| 3. | During 2009, as part of a formal tax inspection of the Turkish Tax Authorities, KCTR's Financial Reports for the years 2004-2008 were examined. |
On February 16, 2010, KCTR received a tax inspection report, following the aforementioned inspection, according to which KCTR is required to an additional tax payment for two matters audited, as detailed below, on the total amount of 135 millions YTL (approximately 90 millions USD) including interest and penalty. On July 2010, an amount of 264 thousands YTL was paid to Turkish Tax Authorities regarding settlement in the stamp duty issue. |
| Regarding the second matter, which is the essential part of the tax demand (tax on capital injection from Hogla- Kimberly to KCTR), KCTR, based on its tax consultant opinion, estimates that the likelihood that it will be demanded for the additional tax payment in this matter, is not probable, and therefore it will not provide a provision at Its Financial Reports for December 31, 2010. |
| Based on its tax consultant opinion, during 2010, KCTR decided to pursuit a law case against the Turkish Tax Authorities demands regarding the second matter. First level court proceedings are continuing as date of this report . |
K - 36
HOGLA-KIMBERLY LTD. AND SUBSIDIARIES
NOTES TO THE FINANCIAL STATEMENTS AS OF DECEMBER 31, 2010
| NOTE 14 | - | COMMITMENTS CONTINGENT LIABILITIES AND OTHER INFORMATION (Cont.) |
| C. | Legal proceedings (Cont.) |
| 4. | On June 15, 2010, a petition was filed against Hogla-Kimberly and against another competitor for the approval of a class action. According to the petition, the Competitor and Hogla-Kimberly has misled the public by presenting plastic bags as oxo biodegradable and therefore environmentally friendly, while the products are breaking down into fragments. |
| The plaintiff estimates the scope of the petition, if approved as class action, to be approximately NIS 111 million. At this early stage Hogla-Kimberly legal advisor opinion is that the probability of the request for approval of a class action lawsuit will be rejected is higher than the probability that it will be approved. |
| 5. | On October 24, 2010 a new lawsuit was received, filed against the company in the amount of approximately NIS 1.5 million, by a former distributer, regarding termination of distribution agreement by the company. The former distributor claims for the existence of employer-employee relations. Due to the preliminary stage of the proceedings, management is unable to estimate the possible outcome of the lawsuit. |
| NOTE 15 | - | SHARE CAPITAL |
| A. | Composition of Share Capital in Nominal NIS as of December 31, 2010, 2009 and 2008: |
Number of Shares | ||||||||
| Issued and | ||||||||
Authorized | fully paid up | |||||||
| Ordinary Shares of NIS 1.00 par value | 11,000,000 | 9,113,473 | ||||||
| B. | Holders of ordinary shares are entitled to participate equally in the payment of cash dividends and bonus share (stock dividend) distributions and, in the event of the liquidation of the Company, in the distribution of assets after satisfaction of liabilities to creditors. Each ordinary share is entitled to one vote on all matters to be voted on by shareholders. |
| C. | The company issued one preference Share to Hadera Paper Ltd, which gives Hadera Paper the right to receive special dividends according to the decision of the Board from time to time. |
K - 37
HOGLA-KIMBERLY LTD. AND SUBSIDIARIES
NOTES TO THE FINANCIAL STATEMENTS AS OF DECEMBER 31, 2010
| NOTE 16 | - | REVENUE |
Year ended December 31, | ||||||||||||
2 0 1 0 | 2 0 0 9 | 2 0 0 8 | ||||||||||
NIS in thousands | ||||||||||||
| A. Sales of the Turkish subsidiary | 471,304 | 489,560 | 404,024 | |||||||||
| B. Sales to major customers | ||||||||||||
| (as percentage from total net sales) | ||||||||||||
| Customer A | 13.2 | % | 14 | % | 13.2 | % | ||||||
| Customer B | 8.4 | % | 9.5 | % | 10.5 | % | ||||||
| NOTE 17 | - | COST OF SALES |
Year ended December 31, | ||||||||||||
2 0 1 0 | 2 0 0 9 | 2 0 0 8 | ||||||||||
NIS in thousands | ||||||||||||
| Material consumed | 618,740 | 597,791 | 564,455 | |||||||||
| Purchases (*) | 280,127 | 267,842 | 271,688 | |||||||||
| Salaries and related expenses | 122,222 | 119,867 | 110,844 | |||||||||
| Manufacturing expenses | 134,872 | 133,098 | 140,991 | |||||||||
| Depreciation | 29,449 | 27,387 | 21,883 | |||||||||
| 1,185,410 | 1,145,985 | 1,109,861 | ||||||||||
Change in finished goods inventory | (20,191 | ) | 18,964 | (12,294 | ) | |||||||
| 1,165,219 | 1,164,949 | 1,097,567 | ||||||||||
| (*) | The purchases of the group are related principally to commercial operations. |
| NOTE 18 | - | OTHER INCOME |
Year ended December 31, | ||||||||||||
2 0 1 0 | 2 0 0 9 | 2 0 0 8 | ||||||||||
NIS in thousands | ||||||||||||
| Capital gain from realization of trademark | 3,131 | - | - | |||||||||
| Refund from mutual fund | 1,600 | - | - | |||||||||
| 4,731 | - | - | ||||||||||
K - 38
HOGLA-KIMBERLY LTD. AND SUBSIDIARIES
NOTES TO THE FINANCIAL STATEMENTS AS OF DECEMBER 31, 2010
| NOTE 19 | - | SELLING AND MARKETING EXPENSES |
Year ended December 31, | ||||||||||||
2 0 1 0 | 2 0 0 9 | 2 0 0 8 | ||||||||||
NIS in thousands | ||||||||||||
| Salaries and related expenses | 83,611 | 80,930 | 81,744 | |||||||||
| Maintenance and transportation expenses | 84,547 | 83,132 | 82,676 | |||||||||
| Advertising and sales promotion | 66,923 | 82,936 | 85,589 | |||||||||
| Commissions to distributors | 9,819 | 11,941 | 11,541 | |||||||||
| Royalties | 29,780 | 31,117 | 29,584 | |||||||||
| Depreciation | 1,460 | 1,668 | 1,695 | |||||||||
| Other | 11,921 | 13,052 | 15,908 | |||||||||
| 288,061 | 304,776 | 308,737 | ||||||||||
| NOTE 20 | - | GENERAL AND ADMINISTRATIVE EXPENSES |
Year ended December 31, | ||||||||||||
2 0 1 0 | 2 0 0 9 | 2 0 0 8 | ||||||||||
NIS in thousands | ||||||||||||
| Salaries and related expenses | 31,312 | 36,434 | 35,224 | |||||||||
| Administrative and computer services | 12,506 | 13,005 | 12,118 | |||||||||
| Services provided by Shareholder | 1,400 | 1,373 | 1,380 | |||||||||
| Office maintenance | 4,507 | 3,549 | 4,392 | |||||||||
| Depreciation | 730 | 832 | 749 | |||||||||
| Provision for doubtful accounts | (710 | ) | (1,724 | ) | 1,459 | |||||||
| Other | 12,612 | 9,628 | 11,197 | |||||||||
| 62,357 | 63,097 | 66,519 | ||||||||||
| NOTE 21 | - | FINANCING INCOME AND EXPENSES |
| A. | Financing income |
Year ended December 31, | ||||||||||||
2 0 1 0 | 2 0 0 9 | 2 0 0 8 | ||||||||||
NIS in thousands | ||||||||||||
| Exchange rate differences | 9,318 | 1,024 | 8,388 | |||||||||
| Interest from long-term and short-term bank deposits | 144 | 213 | 612 | |||||||||
| Interest income from tax authorities | 2,382 | 1,164 | 631 | |||||||||
| Application of amortized cost method on Receivables and payables. | 251 | 1,434 | 2,379 | |||||||||
| Finance expense from derivative | - | 683 | ||||||||||
| Due to capital note to related parties | - | - | 1,560 | |||||||||
| Other | 9 | 39 | 132 | |||||||||
| 12,104 | 4,557 | 13,702 | ||||||||||
K - 39
HOGLA-KIMBERLY LTD. AND SUBSIDIARIES
NOTES TO THE FINANCIAL STATEMENTS AS OF DECEMBER 31, 2010
| NOTE 21 | - | FINANCING INCOME AND EXPENSES (Cont.) |
| B. | Financing expenses |
Year ended December 31, | ||||||||||||
2 0 1 0 | 2 0 0 9 | 2 0 0 8 | ||||||||||
NIS in thousands | ||||||||||||
| Interest on long-term bank loans | 1,360 | 1,395 | 4,595 | |||||||||
| Interest on Short-term bank loans | 1,290 | 807 | 4,499 | |||||||||
| Interest expenses to tax authorities | 1,267 | - | ||||||||||
| Finance Expenses from derivative | 3,560 | - | 3,002 | |||||||||
| Other | 633 | 839 | 259 | |||||||||
| 8,110 | 3,041 | 12,355 | ||||||||||
| 3,995 | 1,516 | 1,347 | ||||||||||
K - 40
HOGLA-KIMBERLY LTD. AND SUBSIDIARIES
NOTES TO THE FINANCIAL STATEMENTS AS OF DECEMBER 31, 2010
| NOTE 22 | - | INCOME TAX |
| A. | Recognised tax assets and deferred tax liabilities |
Tax assets and deferred tax liabilities are attributed to the following items Changes in temporary differences during the year (NIS in thousands) |
Balance at January 1, 2009 | Charged to profit and loss | Charged to other comprehensive income | Change in Tax rate | Balance at December 31, 2009 | Charged to profit and loss | Charged to other comprehensive income | Exchange difference | Change in Tax rate | Balance at December 31, 2010 | |||||||||||||||||||||||||||||||
| Property, plant and equipment | (39,498 | ) | (1,562 | ) | - | 6,287 | (34,773 | ) | (1,729 | ) | - | 79 | - | (36,423 | ) | |||||||||||||||||||||||||
| Doubtful debts | 1,399 | (975 | ) | - | 27 | 451 | (200 | ) | - | - | 9 | 260 | ||||||||||||||||||||||||||||
| Derivatives | ( 433 | ) | - | 401 | - | (32 | ) | - | 282 | - | - | 250 | ||||||||||||||||||||||||||||
| Employee benefits | 4,848 | 791 | - | (50 | ) | 5,589 | (1,252 | ) | - | - | 82 | 4,419 | ||||||||||||||||||||||||||||
| Expenses accruals | - | - | - | - | - | - | - | - | - | - | ||||||||||||||||||||||||||||||
| Tax carry forward losses | - | - | - | - | - | - | - | - | - | - | ||||||||||||||||||||||||||||||
| Other | 59 | (25 | ) | - | - | 33 | (45 | ) | - | - | - | (12 | ) | |||||||||||||||||||||||||||
| (33,625 | ) | (1,772 | ) | 401 | 6,264 | ( 28,732 | ) | (3,226 | ) | 282 | 79 | 91 | (31,506 | ) | ||||||||||||||||||||||||||
K - 41
HOGLA-KIMBERLY LTD. AND SUBSIDIARIES
NOTES TO THE FINANCIAL STATEMENTS AS OF DECEMBER 31, 2010
| NOTE 22 | - | INCOME TAX (Cont.) |
| B. | Deferred taxes are presented in the balance sheet as follows: |
2010 | 2009 | |||||||
NIS in thousands | ||||||||
| Long-term liabilities (in respect of depreciable assets) | 35,370 | 33,631 | ||||||
| Long-term Assets | (3,864 | ) | (4,899 | ) | ||||
| 31,506 | 28,732 | |||||||
| For 2010-2011 - Deferred taxes were computed at rates between 18%-25%, primarily – 20.5%. |
| As of December 31, 2010 deferred tax assets at the amount of NIS 250 thousand (2009 – NIS 32 thousand tax liability) due to revaluation of financial instruments treated as cash flow hedges was recognized directly to equity. |
| C. | Deferred tax assets that were not recognised |
The calculation of deferred taxes does not take into account the taxes that would be applicable in case of realization of the investment in subsidiaries and associates, since the Group intends to retain the investment. Deferred taxes in respect of a distribution of profit in Israeli subsidiaries were also not taken into account, since the dividends are not taxable. In addition, unutilized deferred tax assets in respect of losses carried forward, were not recognized in cases where future taxable income against which they can be utilized, is not foreseen. As of December 31, 2010 carry forward tax losses deriving from the Turkish subsidiary sum up to NIS 165.7 (72.8 YTL) millions. The Company has examined the validity of the deferred tax assets deriving from its Turkish subsidiary. As of December 31, 2010 deferred tax assets were not recognized in respect of utilizing tax losses in the Turkish subsidiary since it is not anticipated that there will be taxable income against which the tax benefits can be utilized. |
According to the Turkish law, carry forward tax losses can be utilized for a five years period only, unrecognized tax losses of KCTR will expire as follow: An amount of NIS 74.5, 73.6, 7, 6.3 and 4.2 will expire between 2011-2015, respectively. |
| D. | Income tax attributable directly to other comprehensive income |
2010 | 2009 | 2008 | ||||||||||
NIS in thousands | ||||||||||||
| Total tax recognized directly in equity | 579 | (199 | ) | 155 | ||||||||
K - 42
HOGLA-KIMBERLY LTD. AND SUBSIDIARIES
NOTES TO THE FINANCIAL STATEMENTS AS OF DECEMBER 31, 2010
| NOTE 22 | - | INCOME TAX (Cont.) |
| E. | Tax Composition |
2010 | 2009 | |||||||
NIS in thousands | ||||||||
| Current taxes | 42,771 | 48,715 | ||||||
| Taxes in respect of prior years | - | - | ||||||
| Deferred taxes - A. above | 3,133 | (4,489 | ) | |||||
| 45,904 | 44,226 | |||||||
| F. | Reconciliation of the statutory tax rate to the effective tax rate: |
2 0 1 0 | 2 0 0 9 | 2 0 0 8 | ||||||||||
NIS in thousands | ||||||||||||
| Income before income taxes | 190,598 | 195,321 | 137,100 | |||||||||
| Statutory tax rate (see H. below) | 25 | % | 26 | % | 27 | % | ||||||
| Tax computed by statutory tax rate- | 47,650 | 50,783 | 37,017 | |||||||||
| Tax increments (savings) due to: | ||||||||||||
| Income (Expenses) in reduced tax rate | (3,561 | ) | (4,268 | ) | (2,104 | ) | ||||||
| Non-deductible expenses | 1,483 | 1,024 | 2,297 | |||||||||
| Non-taxable income | (797 | ) | (48 | ) | (90 | ) | ||||||
| Unrecorded deferred taxes in connection with tax loss carry forward | 1,074 | 3,027 | 5,483 | |||||||||
| Amortizing differed taxes | - | - | 4,244 | |||||||||
| Reduction in corporate tax rates (see H. below) | (239 | ) | (6,177 | ) | 651 | |||||||
| Differences arising from basis of measurement | (178 | ) | (185 | ) | 579 | |||||||
| Income (Expenses) taxes for prior years | - | - | 221 | |||||||||
| Other differences, net | 472 | 70 | (825 | ) | ||||||||
| 45,904 | 44,226 | 47,473 | ||||||||||
| G. | Current Tax Balance |
2010 | 2009 | |||||||
NIS in thousands | ||||||||
| Current taxes assets | 54 | - | ||||||
| Current tax liabilities | 22,583 | 26,631 | ||||||
K - 43
HOGLA-KIMBERLY LTD. AND SUBSIDIARIES
NOTES TO THE FINANCIAL STATEMENTS AS OF DECEMBER 31, 2010
| NOTE 22 | - | INCOME TAX (Cont.) |
| H. | The Company and its Israeli Subsidiaries are subject to the Income Tax Ordinance and the Income Tax Law (Inflationary Adjustments), 1985. Under the inflationary adjustments law, results for tax purposes are measured in real terms, having regard to the changes in the Israeli CPI. The Company and its subsidiaries in Israel are taxed under this law. |
| On February 26, 2008, the Knesset ratified the third reading of the Income Tax Law ("Inflation Adjustments") (Amendment 20) (Limitation of Term of Validity) - 2008 (hereinafter: "The Amendment"), pursuant to which the application of the inflationary adjustment law will terminate in tax year 2007 and as of tax year 2008, the law will no longer apply, other than transition regulations whose intention it is to prevent distortions in tax calculations. |
| According to the amendment, in tax year 2008 and thereafter, the adjustment of revenues for tax purposes will no longer be considered a real-term basis for measurement. Moreover, the linkage to the CPI of the depreciated sums of fixed assets and carryover losses for tax purposes will be discontinued, in a manner whereby these sums will be adjusted until the CPI at the end of 2007 and their linkage to the CPI will end as of that date. |
| Non-Israeli Subsidiaries are subject to income tax provisions of their home country. |
| The Company is an industrial company in conformity with the Law for the Encouragement of Industry (Taxes), 1969. The principal benefit that the Company is entitled to under this law is accelerated depreciation rates and reduced tax rates. |
| According to this law the Company and Shikma (formerly a subsidiary) filed consolidated tax returns until December 31, 2005. On December 31, 2005, Shikma was merged into the Company. |
| On January 15,2009 the Company received an approval from the investment center for the merger of the Company and its subsidiary Shikma which took place at the end of 2005. |
| During 2002, the Company’s program for the establishment of a new facility for manufacturing paper was granted Approved Enterprise status in accordance with the Law for the Encouragement of Capital Investments, 1959, under “alternative benefits” track. The approval program was originally for total investments of approximately NIS 97 million. According to the terms of the program, income derived from the Approved Enterprise will be tax-exempt for a period of 10 years commencing in the year in which the program was substantially completed. Distribution of dividends from tax exempt profits of the Approved Enterprise will be subject to income tax at a rate equal to the income tax rate of the Approved Enterprise had the Company not elected the alternative benefits track. The Company completed the investments relating to the new facility. Commencement of operations was during 2003. |
| During May 2010,the Company recived the approval of the final report from the Investment center for total investments of NIS 109, and approval for the merger of Shikma into the company. |
The Company and its subsidiary Shikma Ltd. possess final tax assessments through 2003. Hogla Kimberly Marketing Ltd., a subsidiary of the Company, posses' final tax assessments through 2004. |
K - 44
| NOTE 22 | - | INCOME TAX (Cont.) |
| H. | (Cont.) |
| Mollet Marketing Ltd., a subsidiary of the Company, posses' final tax assessments through 2004. |
| On July 14, 2009 Knesset passed the Economic Efficiency Law (legislative amendments to implement the economic plan for the years 2009 and 2010) - 2009, which stipulates, inter alia, an additional gradual reduction in the rate of companies tax to 18% in the 2016. tax year and thereafter. According to these amendments, the rate of company tax applying to the 2010 tax year and thereafter are as follows: 2009 tax year - 26%, 2010 tax year - 25%, 2011 tax year - 24%, 2012 tax year - 23%, 2013 texture - 22%, 2014 tax year - 21%, 2015 tax year - 20%, and in the 2016 tax year and thereafter there will be a companies tax rate of 18%. |
| The change in the tax rates have decreased the deferred taxes liability as of December 31, 2009 in the amount of NIS 6,177 thousand. |
| I. | On the 29th December, 2010 the Knesset ratified the Economic Policy 2011-2012 Law (amendments), 2011 that was published in the articles on the 6th January, 2011. Within this law, the Law for the Encouragement of Capital Investments – 1959 was amended (hereafter "amendment"). According to the amendment the different income tax channels were abolished & instead fixed income tax rates on the industrial taxable income were set as follows: |
| 2011-2012: 15% (area "A" – 10%) |
| 2013-2014: 12.5% (area "A" – 7%) |
| 2015 onwards: 12% (area "A" -6%) |
These amendments came in force as from 1st January, 2011. Each company is entitled to to choose whether to be included within this amendment & to forego the outstanding benefits of the previous law or to waive this amendment. |
| The company has uncertainty as to its ability to confirm to the amendments stipulations &, as such, has not recognized the tax income derived from the amendment. |
| J. | Tax inspection report was received during 2010 to KCTR, see note 14 C . |
| NOTE 23 | - | FINANCIAL INSTRUMENTS |
| General |
| In the normal course of business, Hogla-Kimberly is exposed to credit, liquidity and market risks, as well as interest and currency risks. The Company monitors these risks on a constants basis. |
| The Group's policy is to hedge the exposure from fluctuations in foreign exchange rates to minimize its exposure to fluctuations of foreign currency rates. The hedging is according to a policy adopted by the Company's Board of Directors. |
| A. | Significant accounting policies |
Details as to the significant accounting policies and methods adopted, including the criteria for recognition, the basis of measurement and the basis on which income and expenses are recognized, in respect of each class of financial asset, financial liability and equity instrument are disclosed in note 2 to the financial statements. |
K - 45
HOGLA-KIMBERLY LTD. AND SUBSIDIARIES
NOTES TO THE FINANCIAL STATEMENTS AS OF DECEMBER 31, 2010
| NOTE 23 | - | FINANCIAL INSTRUMENTS (Cont.) |
| B. | Categories of financial instruments |
As of December 31, | ||||||||
2010 | 2009 | |||||||
NIS in thousands | ||||||||
| Financial assets | ||||||||
| Cash (including cash equivalents) and Trade receivables | 310,091 | 399,457 | ||||||
| Financial liabilities | ||||||||
| Borrowings and Trade payables | 366,556 | 322,336 | ||||||
| Derivative instruments in designated hedge accounting relationships | 2,124 | 119 | ||||||
| Measured at the fair value |
| C. | Credit risk |
| Credit risk refers to the possibility that counterparty will fail to meet its contractual obligations, resulting in financial loss to the Company. |
| Commencing November 2007 Hogla Kimberly is covered by a credit insurance policy, which partially covers it's most major customers. In accordance with its policy conditions, the company will be reimbursed starting from an annual loss of US dollars 200 thousands to a maximum of US dollars 10 million, subject to deductible conditions. |
| The revenues of the Company and its Israeli subsidiaries are mainly in Israel and derived from two major customers and a large number of smaller customers. Trade receivables in the Turkish subsidiary consist of a limited number of customers, where no single counterparty or any company of counterparties having similar characteristics. |
| The Company has a policy of creditworthy customers and obtaining sufficient collaterals where possible as a means of mitigating the risk of financial loss from defaults, |
| For each customer, where possible, the Company checks its credit rating with an external credit rating companies to assess the potential customer’s credit quality and help in defining its credit limit. Credit limit for each customer is determined and approved according to the Company's policy taking into account its rating and collaterals. |
| Management regularly monitors the balance of trade receivables and the financial statements include an allowance for doubtful accounts based on management's estimation. |
| The exposure to credit risks relating to trade receivables is limited due to the relatively large number of customers and to the credit insurance. |
| The carrying amount of financial assets recorded in the financial statements, which is net of impairment losses, represents the group's maximum exposure to credit risk (without taking account of the value of any collateral obtained). |
| Cash and cash equivalents are deposited with major banks in Israel and abroad. Therefore, it is not expected that such banks will fail to meet their obligations. |
K - 46
HOGLA-KIMBERLY LTD. AND SUBSIDIARIES
NOTES TO THE FINANCIAL STATEMENTS AS OF DECEMBER 31, 2010
| NOTE 23 | - | FINANCIAL INSTRUMENTS (Cont.) |
| D. | Liquidity risk |
| Liquidity risk is the risk that the Group could experience difficulties in meeting its commitments to creditors as financial liabilities fall due for payment. The Group manages its liquidity risk by maintaining sufficient reserves, committed borrowing facilities and other credit lines as appropriate. |
| The following table presents the Group's outstanding contractual maturity profile for its non-derivative financial liabilities. The analysis presented is based on the undiscounted contractual maturities of the Group's financial liabilities, including any interest that will accrue. Non-interest bearing financial liabilities which are due to be settled in less than 12 months from maturity equal their carrying values, since the impact of the time value of money is immaterial over such a short duration. |
| Maturity profile of outstanding financial liabilities |
1 year | 1-2 years | 2-4 years | Total | |||||||||||||
NIS in thousands | ||||||||||||||||
| 2010 | ||||||||||||||||
| Supplier payables | 329,916 | - | - | 329,916 | ||||||||||||
| Borrowings | 36,640 | 6,941 | - | 43,581 | ||||||||||||
| Total | 366,556 | 6,941 | - | 373,497 | ||||||||||||
| 2009 | ||||||||||||||||
| Supplier payables | 296,359 | - | - | 296,359 | ||||||||||||
| Borrowings | 25,977 | 26,795 | 6,941 | 59,713 | ||||||||||||
| Total | 322,336 | 26,795 | 6,941 | 356,072 | ||||||||||||
| E. | Exchange rate risk |
| The Group is exposed to foreign currency risks mainly due to payments for purchases of raw materials and finished goods inventory and purchases of equipment and spare parts linked to the dollar or the Euro. In applying a policy of minimizing the exposure, the Group makes forward transactions against the dollar and euro. |
| The carrying amounts of the Group's foreign currency denominated monetary assets and monetary liabilities at the reporting date are as follows: |
31, December 2010 NIS thousands | ||||||||||||
USD | EURO | YTL | ||||||||||
NIS in thousands | ||||||||||||
| Cash and cash equivalents | 4,146 | 2,127 | 3,058 | |||||||||
| Trade receivables | 30,116 | - | 40,354 | |||||||||
| 34,262 | 2,127 | 43,412 | ||||||||||
| Borrowings | - | - | 9,845 | |||||||||
| Trade payables | 109,449 | 30,499 | 15,829 | |||||||||
| 109,449 | 30,499 | 25,674 | ||||||||||
K - 47
HOGLA-KIMBERLY LTD. AND SUBSIDIARIES
NOTES TO THE FINANCIAL STATEMENTS AS OF DECEMBER 31, 2010
| NOTE 23 | - | FINANCIAL INSTRUMENTS (Cont.) |
| E. | Exchange rate risk (Cont) |
31, December 2009 NIS thousands | ||||||||||||
USD | EURO | YTL | ||||||||||
NIS in thousands | ||||||||||||
| Cash and cash equivalents | 38,586 | 748 | 22,975 | |||||||||
| Trade receivables | 35,583 | 1,328 | 34,738 | |||||||||
| 74,168 | 2,076 | 57,713 | ||||||||||
| Borrowings | - | - | 670 | |||||||||
| Trade payables | 61,536 | 25,002 | 30,576 | |||||||||
| 61,536 | 25,002 | 31,246 | ||||||||||
| The following table details the Group's sensitivity to a 10% increase and decrease in the NIS against the relevant foreign currencies. 10% is the sensitivity rate used when reporting foreign currency risk internally to key management personnel and represents management's assessment of the reasonably possible change in foreign exchange rates. The sensitivity analysis includes only outstanding foreign currency denominated monetary items and adjusts their translation at the period end for a 10% change in foreign currency rates. A positive number below indicates an increase in profit and other equity where the NIS strengthens 10% against the relevant currency. For a 10% weakening of the NIS against the relevant currency, there would be an equal and opposite impact on the profit and other equity, and the balances below would be negative. |
USD Impact | EUR Impact | YTL Impact | ||||||||||||||||||||||
2010 | 2009 | 2010 | 2009 | 2010 | 2009 | |||||||||||||||||||
NIS in thousands | ||||||||||||||||||||||||
| Profit or loss (1) | (2,465 | ) | (5,671 | ) | (160 | ) | (542 | ) | 2,068 | 2,008 | ||||||||||||||
| Other equity (2) | 1,692 | 1,737 | 1,457 | 740 | - | - | ||||||||||||||||||
| (1) | This is mainly attributable to the exposure outstanding on receivables, cash and payables at year end in the Group, and forward foreign exchange contracts. |
| (2) | This is as a result of the changes in fair value of derivative instruments designated as cash flow hedges. |
| Forward foreign exchange contracts |
| The Company hedges its exposure of itself and its Israeli subsidiaries by entering into forward foreign exchange contracts, according to a policy adopted by the Company's Board of Directors, to manage the risk associated with anticipated purchase transaction. The Company hedges 80% of its forecasted payments to suppliers of its forecasted exposure for a period of six month forward. |
| These hedging transactions are treated as cash flow hedges and the resulting gain or loss is recognized in other comprehensive income. |
K - 48
HOGLA-KIMBERLY LTD. AND SUBSIDIARIES
NOTES TO THE FINANCIAL STATEMENTS AS OF DECEMBER 31, 2010
| NOTE 23 | - | FINANCIAL INSTRUMENTS (Cont.) |
| E. | Exchange rate risk (Cont.) |
| The following table details the forward foreign currency (FC) contracts outstanding as at the reporting date: |
| Outstanding contracts | Buy Currency | Sell Currency | Fair value NIS | ||||
| Less than 3 months | USD | NIS | 1,224 | ||||
| 3 to 6 months | USD | NIS | 254 | ||||
| Less than 3 months | EUR | NIS | 460 | ||||
| 3 to 6 months | EUR | NIS | 185 | ||||
| The Company does not hedge its foreign currency exposure to the YTL in respect of its investment in the Turkish subsidiary. |
| F. | Fair Value of Financial Instruments |
| The financial instruments of the Group consist primarily of non-derivative assets and liabilities. Non-derivative assets include cash and cash equivalents, receivables and other current assets. Non-derivative liabilities include trade payables and other current liabilities. Due to the nature of these financial instruments, their fair value, generally, is identical or close to the value at which they are presented in the financial statements, unless stated otherwise. |
| NOTE 24 | - | RELATED PARTIES AND INTERESTED PARTIES |
| The Company is owned by Kimberly Clark Corp. (“KC” or the “Parent Company”) (50.1%) and Hadera Paper Ltd. (“Hadera Paper”) (49.9%). |
| Transactions between the Company and its subsidiaries, which are related parties of the Company, have been eliminated on consolidation and are not disclosed in this note. Details of transactions between the group and other related parties are disclosed below: |
| A. | Balances with Related Parties |
December 31, | ||||||||
2 0 1 0 | 2 0 0 9 | |||||||
NIS Thousands | ||||||||
| Trade receivables | 27,968 | 35,682 | ||||||
| Other current assets | 3,228 | 948 | ||||||
| Trade payables | 84,629 | 72,339 | ||||||
K - 49
HOGLA-KIMBERLY LTD. AND SUBSIDIARIES
NOTES TO THE FINANCIAL STATEMENTS AS OF DECEMBER 31, 2010
| NOTE 24 | - | RELATED PARTIES AND INTERESTED PARTIES (Cont.) |
| B. | Transactions with Related Parties |
December 31, | ||||||||||||
2 0 1 0 | 2 0 0 9 | 2 0 0 8 | ||||||||||
NIS Thousands | ||||||||||||
| Sales to related parties (1) | 222,018 | 243,212 | 216,841 | |||||||||
| Cost of sales (2) | 328,466 | 256,696 | 268,476 | |||||||||
| Royalties to the shareholders (3) | 29,780 | 31,117 | 29,584 | |||||||||
| General and administrative expenses (*) (4) | 9,707 | 11,980 | 12,488 | |||||||||
| (*) | Company - excludes Subsidiaries. |
C. |
| (1) | Sales of finished goods to companies in KC group and Hadera Paper. |
| (2) | Mainly purchase of finished goods from companies in KC group and Hadera Paper group. |
| (3) | The group is obligated to pay royalties to KC. |
| (4) | The Company leases its premises in Hadera and Naharia from Hadera Paper and receives certain services (including energy, water, maintenance, computer and professional services) under agreements, which are renewed based on shareholders agreements. |
| D. | Compensation of key management personnel |
| Total remuneration of key management during the year was NIS 9,344 thousands (2009: NIS 9,891 thousands). The amounts include costs relating to options (*) granted to senior managements to shares of the Company's shareholders. |
| (*) | The Company's senior management was rewarded by allotment of KC's and Hadera Paper's share options. The cost of the benefit was determined as the fair value on the grant day and this amount is being charged to the income statement over the vesting period. The company's debt resulting from the grant will be paid in cash to both shareholders. |
| The fair value of the options granted as aforementioned was estimated by applying the economic models. |
| The total expenses resulting from the aforementioned grant for the year ended December 31, 2010 was NIS 1,042 thousand (2009: NIS 589 thousands). |
K - 50
HOGLA-KIMBERLY LTD. AND SUBSIDIARIES
NOTES TO THE FINANCIAL STATEMENTS AS OF DECEMBER 31, 2010
| NOTE 25 | - | DIVIDENDS |
| A. | On October 22, 2009 the board of directors decided to distribute Dividend in the amount of NIS 40 million from the unapproved enterprise retained earnings accumulated as of September 30, 2009 to the holders of the ordinary shares. The dividend was paid on January 20, 2010. |
| B. | On February 18, 2010 the board of directors decided to distribute Dividend in the amount of NIS 20 million from the unapproved enterprise retained earnings to the holders of the ordinary shares. The dividend was paid on May 12, 2010. |
| C. | On April 22, 2010, the board of directors decided to distribute Dividend in the amount of NIS 40 million from the unapproved enterprise retained earnings to the holders of the ordinary shares. The dividend was paid on July 15, 2010. |
| D. | Following the last Board's decision from July 27, 2010 to distribute a dividend in the amount of NIS 40 million from unapproved enterprise earnings, the payment is subject to availability of funds and the agreement of KC, The Board approved to pay at the fourth quarter of 2010 the amount of NIS 35 million and at 2011 the amount of NIS 5 million. A divided of NIS 35 million was paid on November 29, 2010. |
| NOTE 26 | - | SUBSEQENT EVENTS |
| On February 23, 2011 the board of directors declared dividend distribution of NIS 30 million from the unapproved enterprise retained earnings. Actual payment will take place at Q2/2011 subject to no major negative development in the tax case in KCTR. |