Exhibit 1
Financial Valuation of
Hogla-Kimberly Ltd.
Pursuant to the Directives of IAS 36
To the attention of:
Clal Industries and Investments Ltd.
Tel Aviv
Dear Sir/Madam:
| Re: | Financial Valuation of Hogla-Kimberly Ltd. |
I was commissioned by Clal Industries and Investments Ltd. (hereinafter: "CII") to conduct a financial valuation of the shareholders' equity of Hogla-Kimberly Ltd. (hereinafter: "Hogla") as at September 30, 2011. The objective of this professional opinion is to examine the need for impairment of the outstanding investment in Hogla, in the financial statements of CII, in accordance with the directives of IAS 36.
Hadera Paper Ltd. (hereinafter: "Hadera Paper") holds 49.9% of the shares of Hogla, while Kimberly Clark Corporation (hereinafter: "KC") holds 50.1% of the shares of Hogla. CII holds a 59.09% stake in Hadera Paper.
In my estimation, in view of the data I received, the value of the shareholders' equity of Hogla, as at September 30, 2011, is estimated to lie in the range between NIS 1,248-1,353 million. Hadera Paper's holding stake in Hogla (49.9%), as presented in the financial statement of CII as at the present time, amounts to NIS 623-675 million.
| Vadim Portnoy Business Consulting LTD. | ואדים פורטנוי יעוץ עסקי בע"מ | |
| Gibor Sport Tower | Tel.טל' 03-6005585 | בית גיבור ספורט |
| 7 Menachem Begin st. Ramat Gan 52681 | info@portnoy.co.il | רח' מנחם בגין, 7 רמת גן 52681 |
- a -
This valuation was prepared in the midst of a global financial and economic crisis. The said crisis may have a significant effect on future economic activity globally, and in Israel in particular, and at this point it is impossible to estimate the scope of its effect. True to the date of preparation of this professional opinion, there are increasing signs pointing toward a certain easing up of the crisis in the United States, along with the deepening the crisis in Europe. The main impact of the crisis is reflected in difficulties in raising capital, a decrease in real term demand and an erosion in the profitability of the business sector, inter alia, on account of the social protests that began in 2011 various countries around the world, including Israel. We note that the intensity of the crisis in Israel has thus far been significantly lower than its intensity in other nations. We emphasize that this is a crisis that crosses both continents and sectors and it is therefore not possible, at this stage, to estimate neither the depth nor the duration of this crisis.
A relatively sharp decrease was recorded in the profitability of Hogla in Israel, in 2011. This is attributed to several factors, including an increase in the principal raw materials’ costs and a decrease in product prices, due to the social protests against the cost of living that erupted in Israel this year, as mentioned in Section 1.b. of the professional opinion.
Hogla wholly owns a Turkish company, Kimberly-Clark Tuketim Mallari SanayiVe Ticaret (hereinafter: "KCTR"), that is engaged in the manufacture, marketing and sale of diapers and feminine hygiene products in Turkey. KCTR is the sole representative of KC in Turkey. A decrease was recorded in the revenues of KCTR in the third quarter of 2011, while deviating from its strategic plan for the years 2009-2015. For details see Section 2.b.(1) to the professional opinion.
For the purpose of the valuation, it was assumed that the economic crisis will moderate in the coming years, as the global economy gradually recovers, as detailed in Section 1.b of the professional opinion.
- b-
For the purpose of preparing this opinion, I relied on the following sources of information:
| - | Financial statements of Hogla for the years 2008-2010 and for the period between Jan-Sept/2011; |
| - | Public announcements made by Hadera Paper; |
| - | Information and clarifications received from the management of Hogla and from the management of Hadera Paper; |
| - | Sector-specific information. |
In the preparation of this opinion no independent checks were carried out on the reports and data that I received and no actions were taken which involved any due diligence or audit according to accounting principles, except for reasonable general checks, and therefore the inclusion of the data in this opinion is not intended as proof of the correctness or completeness of these data.
As with any financial valuation, this valuation is supposed to reasonably and fairly reflect a given situation at a particular time, on the basis of known data and with reference to basic assumptions and forecasts that were made on the basis of this information. The description of business operations and the assumptions and estimates made do not presume to be comprehensive and relate only to the key data.
All the historical data in this opinion are presented in nominal New Israeli Shekels (NIS) unless otherwise stated. All forward-looking data, including business forecasts and costs of capital are presented in real values unless otherwise stated. Differences in total sums in the report below, such as they exist, derive from the rounding off of the data for presentation purposes only, in accordance with accepted rounding conventions.
I give my consent for this opinion to be included and/or cited in the financial statements and reports of Hadera Paper and CII.
I have no personal interest in Hogla and in any companies controlled / owned thereby, nor in interested parties in the Company, nor does there exist any dependency between myself, Hogla and interested parties in the Company.
- c -
In the context of our engagement to carry out this professional opinion, my liability was limited, in respect of damage of any kind or type, excluding damage caused negligently and/or maliciously and/or willfully, to the amount of the fee paid in respect of the engagement. I have also received from you indemnification for any amount I shall be required to pay to any third party by finalized verdict with respect to the preparation of this opinion, as well as for any reasonable legal expenses - unless it would be determined that I have acted negligently and/or maliciously and/or intentionally with regard to this opinion.
For further information pursuant to the Securities Law Regulations (Periodic and Immediate Statements), 1970, see Appendix A to the professional opinion.
Please find the detailed professional opinion below.
Sincerely,
Vadim Portnoy1
Date: November 20, 2011
Undergraduate degree from Hebrew University, Jerusalem in Economics and Accounting (1994), CPA (since 1997), MBA from Hebrew University, Jerusalem (1998).
Experience: 13 years in business and economic consulting, including review and compilation of valuations and economic opinions, for companies in the paper, paper products and household products sectors, among others. My professional experience includes, inter alia, positions with the Israel Securities Authority and with Swary Yochman Ltd., and as an independent consultant since 2004. Since 2000, I have been a lecturer on corporate valuations at the Hebrew University School of Business, in Jerusalem.
- d -
Table of Contents
| Chapter | Page | ||
1. | Background | 1 | |
| a. | General | 1 | |
| b. | Macro-Economic Environment | 2 | |
2. | Business Environment | 11 | |
| a. | Operations in Israel | 11 | |
| b. | Operations in Turkey | 17 | |
3. | Financial Analysis | 23 | |
| a. | Revenues and Profitability | 24 | |
| b. | Financial situation | 27 | |
4. | Valuation | 29 | |
| a. | Methodology | 29 | |
| b. | Model assumptions | 30 | |
| c. | Valuation | 37 | |
Appendices
| Appendix A - | Further information pursuant to Securities Law Regulations (Periodic and Immediate Statements), 1970 |
| 1. | Background |
I was commissioned by Clal Industries and Investments Ltd. (hereinafter: "CII") to conduct a financial valuation of the shareholders' equity of Hogla-Kimberly Ltd. (hereinafter: "Hogla") as at September 30, 2011. The objective of this professional opinion is to examine the need for impairment of the outstanding investment in Hogla, in the financial statements of CII, in accordance with the directives of IAS 36.
Hadera Paper Ltd. (hereinafter: "Hadera Paper") holds 49.9% of the shares of Hogla, while Kimberly Clark Corporation holds 50.1% of the shares of Hogla (hereinafter: "KC"). CII holds 59.09% of the Hadera Paper shares.
| a. | General |
Hogla was incorporated in 1963, and later became a major provider of personal hygiene and consumables in Israel. In 1996, Kimberly Clark Corporation (hereinafter: "KC") acquired 49.9% of the Hogla shares, and in 2000 acquired additional shares, such that its holding percentage reached 50.1% of Hogla shares. In Israel, Hogla is engaged independently and via wholly-owned subsidiaries in the manufacture, importing, marketing and sale of disposable paper products, diapers, feminine hygiene products, cleaning products etc. (hereinafter: "Israel operations").
In 1999, Hogla started to develop the market for KC personal hygiene products in Turkey. Due to its population size and consumer trends, Turkey is considered a geographical area with high potential growth for personal hygiene products. Hogla wholly owns a Turkish company, Kimberly-Clark Tuketim Mallari SanayiVe Ticaret (hereinafter: "KCTR"), that is engaged in the manufacture, marketing and sale of diapers and feminine hygiene products in Turkey (hereinafter: "Operations in Turkey"). KCTR is the sole representative of KC in Turkey.
Below is a summary of the Hogla business results, on a consolidated basis:
| 2007 | 2008 | 2009 | 2010 | Jan-Sept/10 | Jan-Sept/11 | |||||||||||||||||||
| NIS millions | ||||||||||||||||||||||||
| Revenues | 1,376 | 1,609 | 1,727 | 1,698 | 1,286 | 1,199 | ||||||||||||||||||
| Gross Profit | 407 | 511 | 562 | 534 | 413 | 361 | ||||||||||||||||||
| Operating Income | 62 | 136 | 194 | 187 | 137 | 80 | ||||||||||||||||||
| % change in revenues | 9.6 | % | 16.9 | % | 7.3 | % | (1.7 | )% | (6.8 | )% | ||||||||||||||
| Gross margin | 29.6 | % | 31.8 | % | 32.5 | % | 31.5 | % | 32.1 | % | 30.1 | % | ||||||||||||
| Operating margin | 4.5 | % | 8.4 | % | 11.2 | % | 11.0 | % | 10.7 | % | 6.7 | % | ||||||||||||
Hogla numbers approximately 1,090 employees in Israel and approximately 340 employees in Turkey.
1
Hogla has no predetermined dividend distribution policy. During the past several years, Hogla distributed dividends in the following sums:
| Period | Dividend | |||
| NIS millions | ||||
| 2008 | - | |||
| 2009 | 134 | |||
| 2010 | 100 | |||
| Jan-Sept/2011 | 60 | |||
| Total | 294 | |||
| b. | Macro-Economic Environment |
This valuation was performed during a very challenging period, making it difficult to develop forecasts and estimates of growth rates and profit margins. The main difficulty stems from the uncertainty that characterizes the global economy since the beginning of the global economic crisis in 2008. The level of macro-economic risk remains high, including frequent changes in commodity prices, low interest and elevated risk premiums, in relation to the forecast for these parameters in the long term, high unemployment rates and extraordinary government debts in the nations that lead the global economy (United States, part of the European Union countries and others). The considerable variance between the various countries in the euro bloc - and especially the condition of Greece, Spain, Ireland, Portugal and Italy - is threatening the political and economic stability of the union. The unsettling of the political stability in Mediterranean nations (Libya, Tunisia, Egypt, Syria and others) may also possess an adverse effect on the global economy, primarily as concerns the prices of energy sources and the migration of refugees into neighboring nations.
We emphasize that alongside the risks, there also exist encouraging signs for the global economy, such as the continued growth of large economies such as Canada, Australia, China and others - despite the economic crisis, the relatively rapid recovery of financial markets and commodity prices from the 2008 crisis, and the willingness of the leaders of the countries in crisis to jump start their economies using both fiscal and monetary measures.
Global Developments
The recovery of the global economy from the 2008 crisis was more rapid than anticipated. In 2010, the growth rate of the global economy reached 4.1%, after having shrunk 1.9% in 2009. Nevertheless, the economic events that transpired in the summer of 2011, chief among which were concerns regarding the re-emergence of the economic crisis as a result of fears from the bankruptcy of nations and banks in Europe, serve to prove that the path towards economic recovery will be long.
The recovery of the global economy from the 2008 crisis was not uniform in its intensity. Whereas South-East Asia, China, India, Brazil and some of the developed nations, including Canada, Australia and Israel - the slowdown was purely of a temporary nature, most developed nations were relatively hard-hit and have yet to recover. Slower-than-anticipated growth is observed primarily in the European Union countries, the United Kingdom and Japan, coupled with severe economic crises in Spain, Portugal and Greece. The labor markets in the developed nations reflect a lower-than-desired growth rate, with unemployment rates in the United States and in Western Europe remaining above 9%, with extraordinary unemployment rates in Southern European nations such as Spain (20%) and Portugal (12%).
2
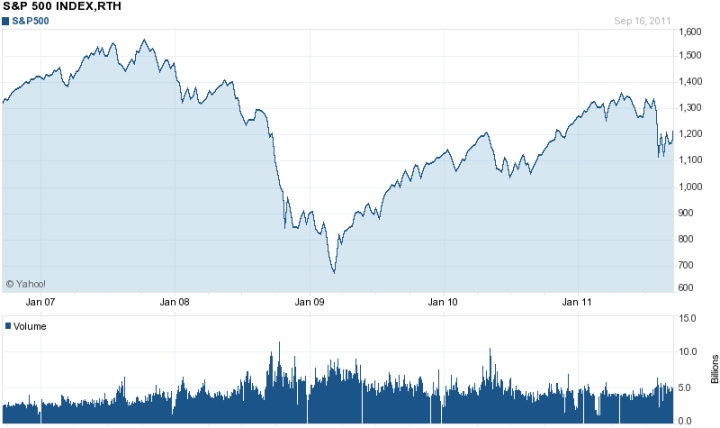
The rise in commodity prices in early 2011, the deterioration of the debt crisis in Greece and the situation of Spain, Ireland, Portugal and even Italy - alongside an unprecedented level of public debt in the United States have all raised concerns regarding a double-dip recession.
In this manner, the S&P 500 Index, that recovered to a great extent during 2009-2010 from the slump at the peak of the crisis in 2008, began losing ground again in 2011:
S&P 500 Index
The forecasts of the International Monetary Fund (IMF) were recently updated in light of the above-mentioned state of the markets. The forecasts that reflect a rise in the probability of a "double dip" recession indicate expectations for continued economic growth, albeit at a relatively low rate, over the next two years. According to this forecast1, the global growth rate is expected to total approximately 4% in the years 2011-2012. However, the growth process is imbalanced and the forecast is for accelerated growth in developing nations (approximately 7%), while in developed nations, the forecast growth rate is only 2%. In light of the events of the summer of 2011, the updated forecasts of the IMF indicate a potential decrease in the global growth rate, from approx. 4% to approx. 3% per annum. In this context, we emphasize that accelerated growth in developing nations is usually accompanied by a sharper rise in demand for basic consumer goods, than accelerated growth in developed nations. This explains the risk for a continued increase in commodity prices in general and in food prices in particular.
The investor "Volatility Index" (VIX) that measures the inherent variance in the S&P 500 Index, also indicates a decrease in investor concerns in the years 2009 and 2010, along with a rise in concerns in the summer of 2011. The index recorded an all time high of over 70 points in 2008, and moderated to around 30 points in mid-2009. In late 2010, the index fell to under 20 points, and traded in the same range, 10-20 points, as it did prior to the economic crisis. During the summer of 2011, the index soared to a level of 45 points, due to concerns regarding a debt crisis in Europe, as mentioned above.
1 IMF, World Economic Outlook Update, June 17, 2011.
3
At the present time, the warning signs include unprecedented public debt in the United States and in additional countries, concerns for the fate of the euro bloc and the euro as a currency, escalating unemployment in Europe, lack of political stability in Mediterranean nations and more. The encouraging signs include an improvement in economic indexes in the United States, rising willingness on the part of European leaders for involvement in the economy of the euro bloc, relative stability in Asia economies and more.
Israel
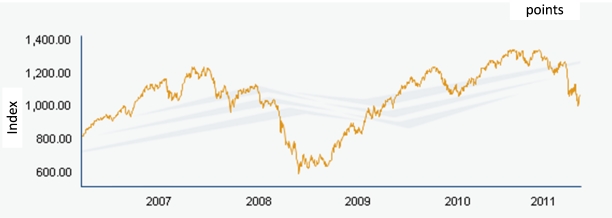
In Israel, the influence of the global economic crisis of 2008 on the local economy was relatively limited. The local capital market did indeed respond strongly to the global crisis, but when it was discovered that the Israeli economy was not as hard hit from the crisis as other western nations, the stock indexes bounced back in 2010 and even exceeded the peak levels recorded prior to the crisis. The indexes decreased in 2011, as follows:
TA 25 Index
In the first half of 2011, the Israeli economy continued to grow relatively rapidly, with GDP growing at 4%, unemployment reaching a record low of 5.5% and inflation rising as a result of the low interest rate, rise in commodity prices and surplus domestic real-term demand. The low interest rate accelerated the process of rising residential real estate prices, due to surplus demand over supply in the local market.
4
According to Bank of Israel forecasts, the expected growth rate in 2011 is 5.2%, while the unemployment rate is expected to decrease to only 5.8%. The forecast for 2012 indicates expected growth of 4.2% in GDP, along with a low unemployment rate of 5.8%.
GDP change in Israel, including forecast for 2011-2012
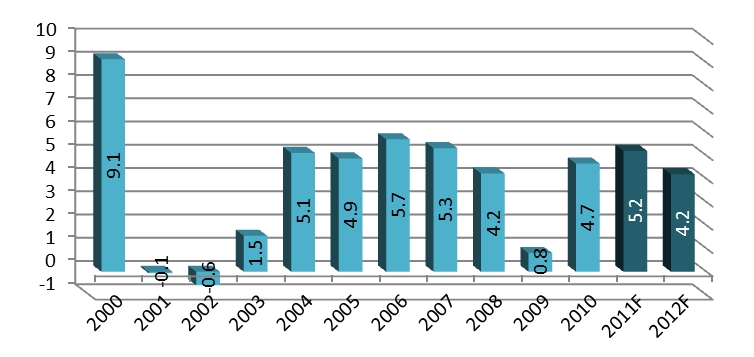
Source: Bank of Israel. Updated forecast - June 2011.
It should be noted that the Bank of Israel estimates that were published in proximity to the completion of this professional opinion, indicate that the growth rate in Israel years 2011-2012, similarly to the growth rate of the global economy, will be lower than the above-mentioned earlier forecasts.
The principal economic risks to the Israeli economy currently stem from the unique situation of the domestic economy. The cooling down of the capital market and real estate market, that recorded record highs in 2010, necessitated the raising of the NIS-denominated interest rate, by the Bank of Israel in 2010 and in the first half of 2011, as opposed to the interest trend globally. Moreover, the strengthening of the NIS during the past several years, vis-à-vis the principal currencies, primarily the US dollar, is jeopardizing exports and industrial manufacturing. This trend may grow stronger as the NIS interest rate rises.
5
Over the last two years, the Bank of Israel has adopted a policy of gradual interest rate hikes in order to cool down the soaring capital and real estate markets and has accelerated the pace of interest rate increases during the first half of 2011. During the past several months, the interest rate in the economy remained unchanged and was even reduced by 0.25% per annum. The following illustrates the development of the Prime2 interest rate in the economy:
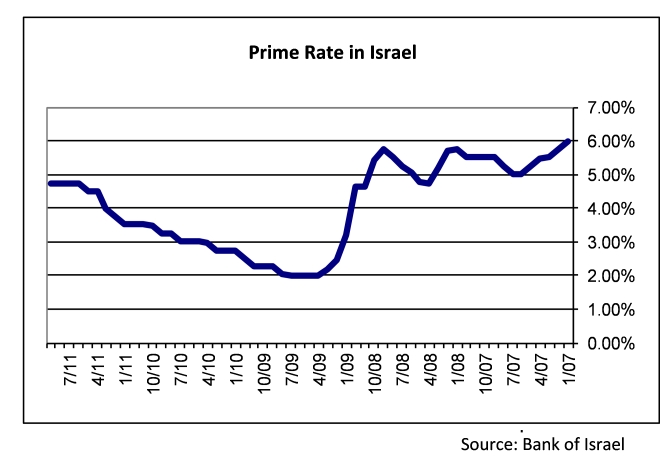
In order to reduce the influence of the above mentioned increase on the exchange rates of the NIS, the Bank of Israel purchased foreign currency valued at approximately $50 billion during the years 2009-2010. At this stage, it remains unclear whether and at what intensity, will the Bank of Israel continue to intervene in foreign currency trading. It would appear that this instrument has run its course and that there exists a risk from the continued strengthening of the NIS, as interest continues to rise.
The raising of prime interest rate has brought about a higher rate of interest in the long term NIS track, as the yield to maturity on government bonds at a fixed nominal interest rate (Shachar) for the medium-term and long-term has increased the level of 5-5.5% per annum. However, the raising of the Prime interest rate by the Bank of Israel has not yet been reflected in the long-term real interest rate, probably due to inflation expectations in the next few years.
2 The Prime interest rate is derived from the interest rate offered by the Bank of Israel to financial institutions and is used to set the price of unlinked credit at a variable interest rate.
6
A study of the seasonal structure of the yield-to-maturity of CPI-linked government bonds at a fixed interest rate (Sagi and Galil) shows that in each of the years 2007-2011, the interest rate curve has fallen, all along the curve. In early 2011 however, the yield-to maturity for a period longer than 25 years for CPI-linked government bonds fell to 3% per annum, as follows:
Gross Yield to Maturity Rate - CPI-linked, fixed interest government bonds

Source: Bank of Israel data.
In 2011, social protests broke out across Israel, widely referred to as the "Cottage Cheese Protests". The protests erupted due to the cost of living in Israel, as compared with other western nations. A considerable proportion of the claims of the protesters are directed toward producers and marketers in the food sector, basic products and retail.
One of the outcomes of the social protests is the anticipated involvement on the part of the government in certain sectors, first and foremost the food sector, real estate, holding companies and more. A byproduct of the social protests is an increase in consumer awareness toward the management of the household budget, including a reduction in demand for consumer goods and a transition toward more inexpensive products. This process may possess repercussions on the level of local consumption. Nevertheless, it would appear that the said protests will not have a material impact on the growth rate of Israel in the medium and long term.
Turkey
Turkey is one of the most promising economies in the world thanks to its proximity to Europe, relatively low labor wages and a population of approximately 74 million, similar to the population of the United Kingdom and greater than the population of either France or Italy. The Turkish population is growing at a rate of 1.2-1.3% annually, a rate that is higher than the population growth rate among most European union nations.
7
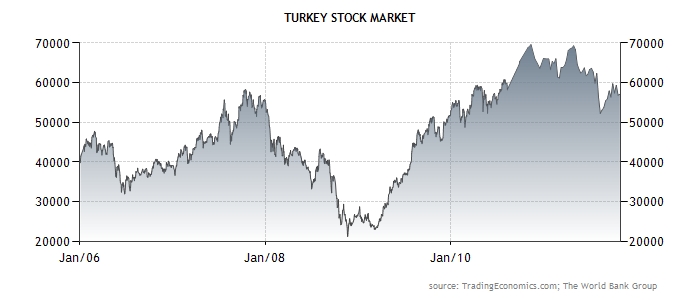
The impact of the global economic crisis of 2008 on the Turkish economy was strong, but so was the rapid recovery from the crisis. The local capital market did indeed respond to the global crisis, but when it was discovered that the Turkish economy was not as hard hit from the crisis as other nations, the stock indexes bounced back in 2010 and even exceeded the peak levels recorded prior to the crisis. The indexes decreased in 2011, as follows:
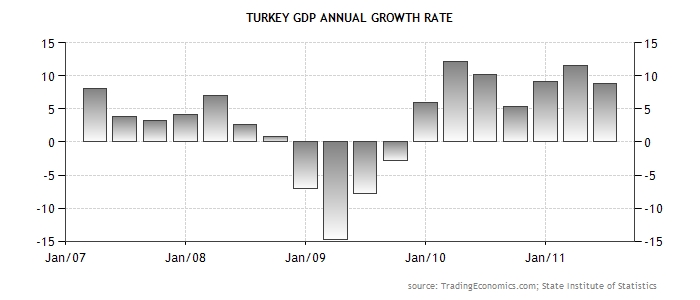
Following a sharp drop in GDP in 2009, the Turkish economy continued to grow in the years 2010-2011 at a faster rate than the growth recorded prior to the economic crisis. The Gross Domestic Product in Turkey grew at an annual rate of approximately 8% in 2011, as follows:
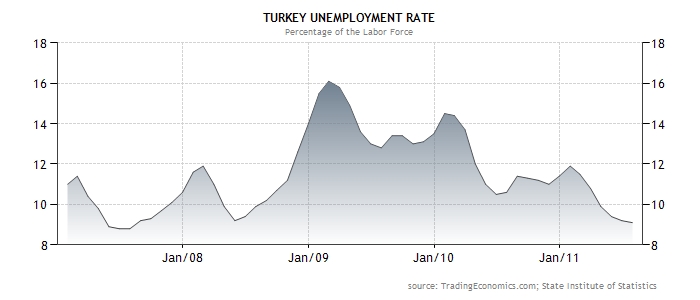
The unemployment rate in Turkey is at an all-time low of approximately 9%, after having reached a record of approximately 16% in early 2009, as follows:
8
The Turkish economy has, in the past decade, transition from a state of hyperinflation to a state of relative price stability, as a result of the aggressive inflation curbing policy of the central bank. The interest rates that were in effect in Turkey in order to stabilize the economy, reached approximately 60% per annum in 2002. The interest rates have moderated since then to a level of approximately 6-9% per annum during the years 2010 and 2011, as follows:

In October 2011, the yield to maturity rates of Turkish government bonds for a period of two years, rose to a level of approximately 10%, as a result of a decision on the part of the Turkish central bank, to raise the bank interest rate in response to an increase in inflationary forecasts in the country.
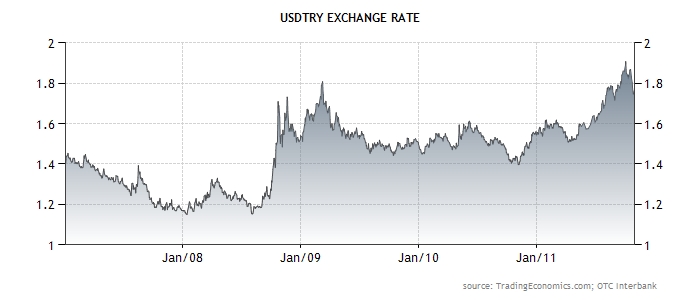
Since the beginning of 2011, an aggregate devaluation of approximately 14% was recorded in the exchange rate of the Turkish lira, that reached a record high of approximately 25%. The Turkish currency is prone to relatively frequent devaluations and revaluation, as follows:
9
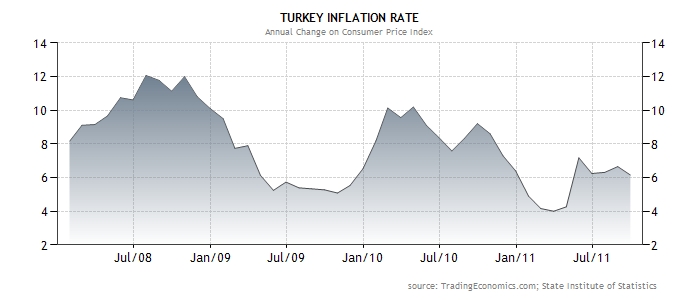
The inflation rate in Turkey has been equal to approximately 6% per annum during the past several months, as compared with an average inflation rate of approximately 7% in the years 2009-2011, as follows:
Turkey may find itself in a difficult economic situation, as the European economic crisis deteriorates. This is on account of the following reasons:
| - | The dependence of the Turkish economy, that has become the preferred manufacturing location in the past several years for automobile manufacturers, consumer goods and industrial products for the entire Western world and primarily - for European nations. |
| - | The heating up of the local economy and the relatively sharp increase in real term domestic demand. The reaction of the Turkish central bank to the rise in inflationary expectations, as mentioned above, may serve to impair the country's growth rates, against the background of a decrease in demand overseas for local production. |
| - | The absence of economic stability in Turkey is characterized by relatively sharp fluctuations in central economic parameters, as evident in the above graphs. |
For the purpose of the preparation of the following professional opinion, it was assumed that a slow improvement in the economic situation would continue over the next several years, both globally and in Israel and Turkey. It was further assumed that despite nominal interest rate changes anticipated in the years ahead, there will not be any significant change in the real-term interest rate environment in Israel and in Turkey. |
10
| 2. | Business Environment |
| a. | Operations in Israel |
Below is a summary of the business results of the Israel operations:
| 2007 | 2008 | 2009 | 2010 | Jan-Sept/10 | Jan-Sept/11 | |||||||||||||||||||
| NIS millions | ||||||||||||||||||||||||
| Revenues | 1,134 | 1,209 | 1,238 | 1,229 | 917 | 910 | ||||||||||||||||||
| Gross Profit | 380 | 435 | 475 | 460 | 354 | 311 | ||||||||||||||||||
| Operating Income | 136 | 169 | 210 | 194 | 148 | 94 | ||||||||||||||||||
| % change in revenues | 7.0 | % | 6.6 | % | 2.4 | % | (0.7 | )% | (0.8 | )% | ||||||||||||||
| Gross margin | 33.5 | % | 36.0 | % | 38.4 | % | 37.5 | % | 38.6 | % | 34.2 | % | ||||||||||||
| Operating margin | 12.0 | % | 14.0 | % | 17.0 | % | 15.8 | % | 16.1 | % | 10.3 | % | ||||||||||||
| (1) | Products and Competition |
The Israel operations include production, marketing and distribution of the following product groups: Diapers for children and incontinent adults, toilet paper, paper for household use (tissue, paper towels, wet wipes, etc.), feminine hygiene products as well as cleaning and kitchen products.
Through 2008, The Hogla revenues grew at an average of 7% annually. In 2009, growth slowed down to 2% annually, while in 2010 the revenues declined slightly. The erosion in revenues continued during the first nine months of 2011, as compared with the corresponding period last year. The decrease in the growth rate is attributed to stronger competition from imports, which benefit from advantageous exchange rates and from changes in the product mix. Moreover, in 2011, the prices of the Hogla products were influenced by the social protests, as mentioned in Section 1.b, above, along with the temporary parallel imports of diapers in the autumn of 2011.
Hogla markets a range of products to all population segments, specializing in high-quality products. The sales of the two leading product groups - diapers and hygienic paper - constitute over 50% of sales in the domestic market. Demand for most Hogla products is relatively inflexible, and is primarily based on the population size, birth rates, etc. The supply of products offered on the domestic market are both locally-produced and imported, as follows:
Hogla manufactures some of its products under an agreement with KC granting Hogla the right to use certain trademarks and technical services associated with the manufacture of the products outlined in the agreement. The agreement was signed in June 1996 and has been renewed annually since then.
Diapers
The demand for these products originates from basic user needs. The consumption of diapers is primarily derived from changes in the population birth rates and elderly population proportion. In the baby diapers sector, there exists relatively high customer loyalty to the brand. The compound aggregate growth rate (CAGR) of domestic demand in the years 2004-2011 is estimated at approximately 2.4% annually, in quantitative terms.
11
Two large competitors are active in this sector in Israel: Hogla with the brands Huggies, Titulim and others, and Procter & Gamble (P&G) with the Pampers brand3. All Hogla diaper products are produced in Israel (except for imports designed to complement the product mix or in response to a shortage of local production capacity from time to time), Turkey. Domestic production offers Hogla certain operating, design and marketing advantages. P&G, on the other hand, has benefited in recent years from a stronger local currency, which effectively lowers the cost of imports denominated in foreign currency.
In 2010-2011, Hogla's market share eroded due to stronger competition in the sector and the malfunction that occurred in the manufacture of a new product in early 2011. The following are the market shares (in quantitative terms) of competitors at retail chains:
| 2009 | 2010 | 1-9/11 | ||||||||||
| Hogla | 74 | % | 72 | % | 70 | % | ||||||
| P&G | 18 | % | 22 | % | 24 | % | ||||||
| Sano | 7 | % | 5 | % | 3 | % | ||||||
| Others | 1 | % | 1 | % | 3 | % | ||||||
| Total market | 100 | % | 100 | % | 100 | % | ||||||
| Source: Nielsen Israel Ltd. | ||||||||||||
A material change in diaper supply in Israel may result from the importing of new brands into Israel, yet this is a limited threat, due to consumer sensitivities to quality and safety of baby products, in the aftermath of several cases in recent years. The KC and P&G brands are perceived as leading, safe and high-quality brands, and therefore it would seem that the chances for success of other producers or importers in the domestic market, over time, are limited.
Hygienic paper
Toilet-paper and other hygienic paper types have become part and parcel of the basic product list at every household and workplace. It would appear that the demand for hygienic paper is also relatively inflexible, and is derived primarily from the population size and the standard of living.
Toilet paper is a high-volume product, whose importing is of doubtful feasibility. Naturally, toilet paper supplies in Israel are locally produced, except for super-premium quality paper, which is imported.
3 P&G is also Hogla's main competitor in feminine hygiene products.
12
Hogla offers, in this operating segment, a varied product mix at different price and quality levels. to answer the needs of all demographic groups in Israel. Hogla products are marketed under brands such as Lily, Mollett, Kleenex and others. For the medium to long term, Hogla benefits from a rise in the standard of living, which results in consumers transitioning towards higher-quality products, which are identified with Hogla. In this area, Hogla's market share reached approximately 67% in 2011 (in quantitative terms). The increase in the Hogla market share, at the expense of private labels, is attributed to a preference for its products over private label products in terms of the consumer's cost/utility ratio, coupled with the lowering of product prices in this sector. The following are the market shares of the competitors at retail chains:
| 2009 | 2010 | 1-9/11 | ||||||||||
| Hogla Kimberly | 65 | % | 62 | % | 67 | % | ||||||
| Private labels* | 17 | % | 19 | % | 16 | % | ||||||
| Sano | 14 | % | 16 | % | 15 | % | ||||||
| Shaniv Paper Industries | 3 | % | 2 | % | 1 | % | ||||||
| Others | 1 | % | 1 | % | 0 | % | ||||||
| Total market | 100 | % | 100 | % | 100 | % | ||||||
| * Private labels of marketing chains | ||||||||||||
| Source: Nielsen Israel Ltd. | ||||||||||||
Other products
Other products from Hogla, which are also basic consumer products, are sold under the following brands: Kotex, Lily (feminine hygiene), Nicole (consumables for kitchen and home) and others. These products are found in daily use in practically all households in Israel. The competitors in this sector include manufacturers and importers in the sectors wherein Hogla operates.
| (2) | Customers |
Hogla markets its products in two separate channels: Marketing to individual customers (households) by sale to consumer retailers, as well as marketing and sale to institutional customers. Hogla sales in the institutional segment account for 20% of its revenues.
The demand for Hogla household products is influenced by two central factors:
| - | Changes in the population This factor impacts the volume of consumption. The population growth rate in Israel has decreased from 2-2.5% per annum until 2000 to an average of approximately 1.8% per annum in the years 2001-2010. The number of births during this period grew by a rate similar to the population growth rate. |
| - | Consumer habits and higher living standards This factor impacts both the consumption volume of consumables, as well as the product mix and the price paid for these products. Examples of changes in consumption habits include the use of diapers through an older age with babies and the transition to using disposable towels instead of cloth towels. An increase in living standards may improve Hogla sales and profitability. |
13
Marketing to individual consumers is made via retail marketing chains, drugstore (pharma) chains and private supermarkets. In recent years, the trend has been toward stronger retail chains at the expense of private supermarkets, along with the growth of smaller retail chains at the expense of larger ones. Hogla sales to the two major retail chains in 2007-2009 reached a record 33% of Hogla sales. In 2010, this trend was reversed and sales to these chains declined to 30% of total Hogla sales, as follows:
| 2007 | 2008 | 2009 | 2010 | 1-9/10 | 1-9/11 | |||||||||||||||||||
NIS millions | ||||||||||||||||||||||||
| Supersal Ltd. | 212 | 212 | 242 | 225 | 172 | 170 | ||||||||||||||||||
| Customer B | 158 | 167 | 162 | 142 | 108 | 94 | ||||||||||||||||||
| Total - 2 principal customers | 370 | 379 | 405 | 367 | 279 | 265 | ||||||||||||||||||
| % of Hogla Israel revenues | 33 | % | 31 | % | 33 | % | 30 | % | 30 | % | 29 | % | ||||||||||||
In the institutional market, Hogla supplies diapers, feminine hygiene products, disposable towels, cleaning products, etc. The demand in this sector is derived primarily from the population growth rate and the level of economic activity in the market, including the pace of change in commercial and office space in Israel.
Customers in the institutional market include hospitals (general, maternity and nursing), government, HMOs, commercial real estate management companies, large and medium businesses, etc. Sales to these customers are made by Hogla's sales network, which is separated from the network of sales to retail chains. Sales to small institutional customers are made by wholesalers. Hogla is not dependent upon any customer in the institutional segment.
| (3) | Raw Materials and Suppliers |
Hogla uses three principal types of raw materials: Raw materials purchased from overseas suppliers, goods purchased overseas for trading and raw materials and trading goods purchased from domestic suppliers.
Raw materials purchased overseas are intended for the manufacture of diapers and tissue paper (toilet paper), and are mostly purchased under global procurement agreements of KC.
Goods imported for trading are primarily purchased from KC group companies and include feminine hygiene products, certain types of diapers, certain types of toilet-paper and tissue paper, etc.
Domestic procurement includes raw material purchase - paper and board waste from Amnir and the purchase of goods for trading from various domestic suppliers.
In addition to using the KC procurement system, as mentioned above, Hogla also receives professional know-how and support from KC world wide. For these services, Hogla pays royalties on some of its products. In recent years, these royalties amounted to an average of 2.4% of the Hogla revenue turnover in Israel.
Hogla purchases energy for its plant in Hadera from Hadera Paper. At the end of 2007, Hadera Paper's energy center began using natural gas instead of fuel oil, to generate electricity and steam. As a result, in 2008, Hogla's steam costs began to drop. In 2011, a new agreement for the supply of natural gas was signed between Hadera Paper and Yam-Tethys Group, for a period of two years starting July 1, 2011. The price of gas in the agreement was derived from a formula that takes into account several parameters, including the price of petroleum. In 2011, the price of gas derived from the said formula was considerably higher than the gas price paid by Hadera Paper until June 30, 2011. Consequently, Hogla's energy costs rose by approximately NIS 2.5 million per annum.
14
According to sources in the Israeli energy market, with the completion of the development of sufficient natural gas sources in the years 2012-2013, the cost of gas to Israeli consumers is expected to decrease. At the same time, a decrease is expected in the energy costs of Hogla, upon termination of the current natural gas purchasing agreement, that is expected to terminate in June 2013.
| (4) | Manufacturing and Distribution |
The Afula diaper production plant, with an annual production capacity of 500 million baby diapers and 50 million diapers for incontinent adults, utilizes most of its output capacity. The output capacity of adult incontinent diapers rose during the past year, as a result of an investment in processing and packaging equipment. Hogla is working to improve its output capacity by optimizing manufacturing in order to meet domestic demand.
Toilet-paper and tissue paper is produced at two plants: In Hadera and in Nahariya, with total annual output capacity of 59 thousand tons, which is fully utilized. Hogla has two toilet paper processing systems (rolling) with an annual output capacity of 44 thousand tons.
Hogla operates its distribution network out of its sites in Tzrifin and in Haifa. Due to the bulkiness and regular use of Hogla products, customers tend to maintain minimum inventories, which require a high level of service in distribution. The distribution network operates a fleet of 110 trucks, some under operating leases.
15
(5) | SWOT Analysis |
Strengths
| - | Strong brands and a reputation as a producer of high-quality products. |
| - | Hogla is controlled by KC - a world-leading international conglomerate in the operating segments in which Hogla is focused. Hogla has access to KC's R&D and procurement systems. |
| - | Hogla products have relatively large and stable market shares in most of the Company's operating segments. |
| - | The internal sales and distribution networks offer operational flexibility and enable high-quality customer service. |
| - | Hogla products are basic products which enjoy relatively inflexible demand. The importing of some Hogla products is not feasible, due to their high volume and bulkiness. |
| - | The entry barriers into the sector are relatively high. |
Weaknesses
| - | Output capacity is fully utilized in most production arrays. |
| - | Limitations on approaching overseas markets because of ownership by a multi-national conglomerate. |
| - | Lack of significant leverage, despite a relatively high debt capacity. Company leverage improves its value to equity holders. The ratio of financial leverage, as at the date of this valuation, is estimated at only 10%. |
Opportunities
| - | Entry into new operating segments, that are synergistic with the Israel operations, as was the case with household cleaning and hygiene products ("Nicole"). |
| - | Development of new products, including the adoption of new KC products. |
| - | Improving living standards in Israel over time, are reflected in an improved Hogla product mix and profit margins. |
| - | Improvement in the KCTR results. |
| - | The lowering of natural gas costs, that serve as a source of energy generation by Hadera Paper for the Hogla plant in Hadera, may serve to reduce the energy costs at Hogla's hygienic paper manufacturing plant. |
Threats
| - | Worsening of the global economic crisis may result in surplus output capacity, which would be reflected, inter alia, in surplus industrial output capacity and the potential importing of products from overseas at opportunity prices. Until 2010, the KCTR investments and losses were financed by Hogla. Additional losses or the obligation to make extraordinary tax payments in Turkey, as mentioned in Section 2.b.(4) below, would necessitate an influx of capital into KCTR. |
| - | Hogla purchases most of its raw materials and some of the products it markets using foreign currency, while its sales are recorded in NIS. Hogla is consequently exposed to fluctuations in commodity prices and exchange rates. Hogla enters into exchange rate hedging transactions for terms of several months. A rise in commodity prices or a sharp devaluation of the NIS may adversely impact the short-term profitability. In the medium to long term, the market is expected to adjust the NIS-denominated prices to these changes, since the competitors also import their raw materials or products from overseas (diapers, feminine hygiene). |
16
| - | The continued strength of the NIS serves to increase the relative attractiveness of importing products, as opposed to manufacturing them in Israel. |
| - | A high degree of dependence on a few brands or products based on public trust (baby products, body health, etc.). The discovery of a defect or malfunction resulting in a health risk in these products may severely impact brand strength. |
| - | Dependence on customers - Sales to the two largest customers constitute approximately one third of total Hogla sales in Israel. |
| - | The continued penetration of private labels by retail chains may adversely impact Hogla's profitability. |
| b. | Operations in Turkey |
KCTR is engaged in the manufacture and marketing of diapers (Huggies brand) and in the importing and marketing of feminine hygiene products (Kotex brand).
KC has identified the Turkish market as possessing strong growth potential, and KCTR has been defined as a KC regional operations center. This is due to the population size (over 77 million), relatively high growth and birth rates, proximity to Europe and the anticipated changes in the tastes of local consumers. We note that the operations in Turkey entail unique inherent risks, such as political unrest, exposure to financial and economic crises, inflation risk and a potential devaluation of the local currency.
Despite the global economic crisis that has also specifically impacted Turkey, the KCTR revenues in NIS terms (convenience translation) continued to grow in the years 2009-2010, with improving profit margins. The KCTR revenues decreased for the first time in the third quarter of 2011, in relation to the corresponding period last year, thereby deviating from the track of the strategic plan for the years 2009-2015, that has yet to be updated. Most of the deviation is reflected - at this stage - in the pace of revenue development, with the KCTR losses not differing significantly from the plan.
Below is a summary of the KCTR business results:
| 2007 | 2008 | 2009 | 2010 | Jan-Sept/10 | Jan-Sept/11 | |||||||||||||||||||
| NIS millions, convenience translation | ||||||||||||||||||||||||
| Revenues | 260 | 413 | 494 | 495 | 375 | 310 | ||||||||||||||||||
| Gross Profit | 28 | 75 | 86 | 73 | 59 | 51 | ||||||||||||||||||
| Operating loss | (74 | ) | (33 | ) | (16 | ) | (10 | ) | (14 | ) | (13 | ) | ||||||||||||
| % change in revenues | 20.6 | % | 58.6 | % | 19.6 | % | 0.3 | % | (17.3 | )% | ||||||||||||||
| Gross margin | 10.7 | % | 18.3 | % | 17.5 | % | 14.8 | % | 15.7 | % | 16.5 | % | ||||||||||||
| Operating loss % | (28.3 | )% | (8.1 | )% | (3.3 | )% | (2.1 | )% | (3.7 | )% | (4.2 | )% | ||||||||||||
Hogla views KCTR as a strategic investment and a central growth engine in the future. The Hogla CEO previously served as CEO of KCTR until early 2009. Until 2010, the KCTR operations were entirely financed by shareholders' equity that was provided by Hogla, according to the operational requirements of KCTR. In the years 2010-2011, the KCTR losses were financed from its own internal resources, such as improved working capital efficiency, coupled with bank credit that amounted to NIS 33 million as at September 30, 2011. KCTR and Hogla are cooperating ad hoc in issues concerning manufacturing, marketing and more. There exists no material commercial activity between the two companies.
17
| (1) | Strategic Plan |
KCTR is operating according to a multi-annual strategic plan that is being implemented since 2005. At this stage, KCTR is operating according to a strategic plan for the years 2009-2015 (hereinafter: "The Strategic Plan"), pursuant to which it is expected to transition to operating profit in 2012. In the third quarter of 2011, a deviation was recorded from the objectives of the strategic plan, primarily in terms of the volume of sales.
The decrease in KCTR sales in the third quarter of 2011 is primarily a result of the decrease in the export of products overseas as a result of the operation of new KC plants in Eastern Europe. Moreover, the KCTR sales in the local market were also eroded during this period.
KCTR is analyzing the implications of the events that brought about the deviation from the strategic plan in 2011, on the coming years. At this stage, no findings and conclusions have been formulated as a result of the said analysis and KCTR has yet to present an updated strategic plan.
| (2) | Products and Competition |
Products in the diaper segment are marketed on the domestic market and are exported under the Huggies brand. KCTR's strategic plan is based on the expansion of domestic market operations at the expense of the exports, that currently serve to ensure the full utilization of KCTR's output capacity.
During the first nine months of 2011, the Huggies market share has decreased to approximately 7% (in financial terms), as follows:
| 2007 | 2008 | 2009 | 2010 | 1-9/11 | ||||||||||||||||
| PRIMA | 29 | % | 31 | % | 32 | % | 39 | % | 42 | % | ||||||||||
| MOLFIX | 22 | % | 23 | % | 19 | % | 21 | % | 18 | % | ||||||||||
| CANBEBE | 15 | % | 12 | % | 11 | % | 10 | % | 10 | % | ||||||||||
| HUGGIES | 6 | % | 7 | % | 10 | % | 8 | % | 7 | % | ||||||||||
| Others | 30 | % | 28 | % | 28 | % | 22 | % | 23 | % | ||||||||||
| Total | 100 | % | 100 | % | 100 | % | 100 | % | 100 | % | ||||||||||
| Source: Nielsen Turkey | ||||||||||||||||||||
The decrease in the Huggies market share originated from the escalating competition on the part of other brands, chief among which was Prima, the local Procter & Gamble brand.
18
The penetration into the feminine hygiene product market began in 2006. KCTR's market share (in monetary terms) is currently estimated at 11%, as follows:
| 2007 | 2008 | 2009 | 2010 | 1-9/11 | ||||||||||||||||
| P&G | 61 | % | 59 | % | 55 | % | 56 | % | 53 | % | ||||||||||
| MOLPED | 18 | % | 18 | % | 19 | % | 20 | % | 18 | % | ||||||||||
| KOTEX | 3 | % | 6 | % | 10 | % | 10 | % | 11 | % | ||||||||||
| Others | 18 | % | 17 | % | 16 | % | 14 | % | 18 | % | ||||||||||
| Total | 100 | % | 100 | % | 100 | % | 100 | % | 100 | % | ||||||||||
| Source: Nielsen Turkey | ||||||||||||||||||||
Regarding the establishment of a manufacturing network for feminine hygiene products, see Section 2.b.(3), below.
KCTR is making considerable efforts to increase and preserve the market share of Huggies and Kotex products in the domestic market. During the past two years, these efforts have borne fruit in the feminine hygiene products market only. Market penetration is typically accompanied by pricing pressures, and to date, prices have remained low compared to other European markets and to Israel. The diaper market in Turkey is decentralized with numerous players. In more developed economies, such markets have undergone consolidation through merger and acquisition (M&A) processes or as a result of smaller players exiting the market.
| (3) | Customers |
KCTR products for the domestic market are marketed to retail marketing chains and to the private market. KCTR directly markets and sells its products to retail marketing chains.
Sales to the private market are made by Unilever Turkey. The strategic cooperation agreement between KCTR and Unilever was signed in March 2007. According to the agreement, Unilever would perform sales, distribution and collection for KCTR products in Turkey, except for sales to nationwide retail marketing chains. The agreement with Unilever, which operates a nationwide distribution network, allows KCTR access to private market points of sale. KCTR believes it is not dependent on Unilever Turkey, and should the agreement be terminated, it would not incur excessive expenses with respect to replacement of this distributor.
KCTR exports its products to 20 countries, with the major export markets being Eastern European countries and South Africa. Product exports are made in conjunction with KC's worldwide production and distribution facilities.
19
| (4) | Manufacturing, Raw Materials and Suppliers |
Most of the diaper products are produced at KCTR's plant in Turkey, that has been expanded and improved in recent years, and is now considered to be one of the most efficient KC plants in Europe. Production capacity at this plant has increased by 500 million diapers annually in 2007, and by an additional 100 million diapers in 2010, by optimizing the production process, ultimately reaching an annual output capacity of approximately 1.1 billion diapers at the end of 2010. The manufacturing array operated at full capacity in 2010. During the months preceding the date of the valuation, the output of the line decreased to approximately 60%, in view of difficulties in exporting the products and the erosion of market share on the local market, as mentioned above.
KCTR is nearing completion of the establishment of a manufacturing array for feminine hygiene products in Turkey, that is designed to become the regional production center for such products. The investment in this production line is estimated at $8 million. True to the date of the valuation, a sum of $6 million was invested, while the outstanding sum will be invested in the last quarter of 2011. Feminine hygiene products that will be manufactured in Turkey will serve to replace imports of products into the domestic market and will be targeted at exports. The running-in of the manufacturing array is expected to begin in late 2011.
Similarly to Hogla, KCTR makes use of the KC procurement system to purchase most of its raw materials. KCTR believes it is not dependent on any raw material suppliers.
Most of the raw materials are purchased overseas, in USD or EUR, hence KCTR is exposed to exchange rate fluctuations of the local currency, in which it sets prices for its products on the domestic market. The Turkish lira is relatively volatile compared to other currencies. The exporting of goods reduces, to a large degree, KCTR's exposure to local currency fluctuations.
| (5) | Demand for Tax Payment in Turkey |
In February 2010, KCTR received a demand from the Turkish tax authorities to make an additional tax payment totaling approximately $82 million, on account of two issues that were allegedly discovered during a routine examination by the tax authorities.
On account of one of these issue (taxation of capital influxes from Hogla to KCTR in the years 2004 and thereafter) which constitutes the bulk of the tax claim, KCTR has submitted appeals to the court objecting to the demands of the tax authorities. On July 28, 2011, August 4, 2011 and November 1, 2011, decisions were handed down by the court concerning part of the cases under discussion (approximately 43.9% of the principal of the claim), pursuant to which KCTR must pay the tax authorities a sum of $31 million, including interest and linkage differences until the date of the decision. The outstanding balance, net of the offsetting of part of the sum against a VAT debt to KCTR, amounted to $28 million.
20
KCTR intends to appeal the decision of the court in Turkey, based on the expert opinion of its legal consultants, claiming that - despite the said ruling of the court - KCTR possesses valid claims against the requirement and that the chances of success in the said appeal, are greater than 50%. In parallel, KCTR intends to file a petition with the Supreme Court to delay the execution of the verdict until such time when the Supreme Court hands down a ruling regarding the appeals.
It should be noted that the court in Turkey is still discussing several additional appeals regarding the outstanding tax demand, totaling $45 million, concerning which no decision has yet been made.
In accordance with the Hogla accounting policy, a tax provision was included in the financial statements as at September 30, 2011, , in the amount of NIS 118 million (approx. NIS 105 million after offsetting a debt of the VAT authorities in Turkey).
On October 17, 2011, the Board of Directors of Hogla approved the issue of a guarantee in favor of a banking corporation (HSBC), up to a sum of $17.7 million, plus interest and other expenses, in order to secure potential payment of KCTR to the Turkish tax authorities, in the event that such a payment will be demanded.
21
| (6) | SWOT Analysis |
Strengths
| - | Turkey identified as strategic target country for KC, and KCTR defined as a regional center for KC. |
| - | Access to KC systems, including technology, procurement, etc. |
| - | KCTR established as third major player in the diaper and feminine hygiene market in Turkey within several years. |
| - | Financing sources available for development of market and manufacturing in Turkey, without requiring foreign capital, which proved critical during the economic crisis, which made raising financing a challenge. |
| - | KCTR is identified as a central growth engine for Hogla in the future, since the market in Israel is fairly saturated. |
Weaknesses
| - | Exposure to Turkish economy, which is well known for political, financial and economic crises, inflation, currency devaluation, etc. |
| - | Currency exposure, stemming from the fact that most KCTR raw materials are purchased using foreign currency, whereas its products are sold for Turkish lira on the domestic market. Exporting of company products considerably reduces this exposure. |
| - | The Turkish market is typically characterized by lower prices than those of European countries and Israel, primarily for diapers, which impacts the KCTR profitability. |
Opportunities
| - | Consolidation of the Turkish market, to be naturally accompanied by higher product prices, which would allow for reasonable profitability. |
| - | Renewed growth of the Turkish economy and a revaluation of the local currency. |
| - | Continued growth in the KCTR market share, mainly for diapers. |
| - | Establishment of local manufacture of feminine hygiene products. |
Threats
| - | The continued deviation from the objectives of the KCTR strategic plan may serve to jeopardize KCTR's standing as a regional marketing center and as a strategic investment by KC in the region, thereby also jeopardizing KCTR's future. |
| - | The worsening of the economic crisis in Turkey may deepen the KCTR losses and impair its results. |
| - | Escalating price war in the diaper market. |
| - | Discontinuation of the engagement with Unilever Turkey. |
| - | Discontinuation of product exports to KC centers around the world. |
| - | Payment according to the demand of the Turkish tax authorities from February 2010 as aforesaid in Section 2.b.(4), above, in significant amounts, may serve to destabilize KCTR's financial situation and will necessitate a considerable influx of capital on the part of the KCTR shareholders. |
22
| 3. | Financial Analysis |
Below is a summary of Hogla's consolidated financial statements:
| 2007 | 2008 | 2009 | 2010 | Jan-Sept/10 | Jan-Sept/11 | |||||||||||||||||||
| NIS millions | ||||||||||||||||||||||||
| Revenues | 1,376 | 1,609 | 1,727 | 1,698 | 1,286 | 1,199 | ||||||||||||||||||
| Cost of Revenues | 969 | 1,098 | 1,165 | 1,164 | 873 | 838 | ||||||||||||||||||
| Gross Profit | 407 | 511 | 562 | 534 | 413 | 361 | ||||||||||||||||||
| Selling and Marketing Expenses | 286 | 309 | 305 | 288 | 231 | 227 | ||||||||||||||||||
| General and Administrative Expenses | 60 | 67 | 63 | 62 | 48 | 54 | ||||||||||||||||||
| Other expenses (revenues) | - | - | - | (4 | ) | (3 | ) | - | ||||||||||||||||
| Operating Income (loss) | 62 | 136 | 194 | 187 | 137 | 80 | ||||||||||||||||||
| Financing and other expenses | 28 | (1 | ) | (1 | ) | (3 | ) | 2 | 4 | |||||||||||||||
| Pre-tax income (expenses) | 34 | 137 | 195 | 190 | 135 | 76 | ||||||||||||||||||
| Tax expenses (income) | 65 | 47 | 44 | 46 | 34 | 138 | ||||||||||||||||||
| Net Income (loss) | (31 | ) | 90 | 151 | 145 | 101 | (62 | ) | ||||||||||||||||
| EBITDA | 88 | 159 | 223 | 218 | 160 | 104 | ||||||||||||||||||
| % change in revenues | 9.6 | % | 16.9 | % | 7.3 | % | (1.7 | )% | (6.8 | )% | ||||||||||||||
| Gross margin | 29.6 | % | 31.8 | % | 32.5 | % | 31.5 | % | 32.1 | % | 30.1 | % | ||||||||||||
| Operating margin | 4.5 | % | 8.4 | % | 11.2 | % | 11.0 | % | 10.7 | % | 6.7 | % | ||||||||||||
| Net margin | (2.2 | )% | 5.6 | % | 8.7 | % | 8.5 | % | 7.9 | % | (5.2 | )% | ||||||||||||
| EBITDA % | 6.4 | % | 9.9 | % | 12.9 | % | 12.9 | % | 12.4 | % | 8.7 | % | ||||||||||||
| 31/12/10 | 30/9/11 | 31/12/10 | 30/9/11 | ||||||||||||||
| NIS millions | NIS millions | ||||||||||||||||
| Cash and cash equivalents | 17 | 19 | Short-term bank credit | 37 | 96 | ||||||||||||
| Accounts receivable | 289 | 294 | Suppliers and service providers | 330 | 322 | ||||||||||||
| Other accounts receivable | 7 | 11 | Payables in respect of dividend | 5 | 30 | ||||||||||||
| Inventories | 242 | 253 | Provision for taxes | - | 105 | ||||||||||||
| Others | 79 | 69 | |||||||||||||||
| Total current assets | 555 | 577 | Total current liabilities | 451 | 622 | ||||||||||||
| Deferred taxes on income and others | 5 | 4 | Deferred taxes on income | 35 | 37 | ||||||||||||
| VAT receivable | 51 | 35 | Long term credit | 7 | - | ||||||||||||
| Intangible and other assets | 17 | 15 | Liabilities in respect of employees, net | 8 | 8 | ||||||||||||
| Total long-term investments | 73 | 54 | Total long-term liabilities | 50 | 45 | ||||||||||||
| Fixed assets, net | 352 | 370 | Shareholders' equity | 479 | 334 | ||||||||||||
| Total Assets | 980 | 1,001 | Total Capital and Liabilities | 980 | 1,001 | ||||||||||||
23
| a. | Revenues and Profitability |
| (1) | Operations in Israel |
The Hogla revenues in Israel grew by an average rate of 7% annually between the years 2007-2008, but this trend was halted in 2009, as revenues grew by only 2%, and then proceeded to decrease by 1% annually in 2010-2011.
The gross margin of the Israel operations reached a record of approximately 38% in the years 2009-2010 and fell to approximately 34% in the first nine months of 2011. The rise in the profitability in the years 2009-2010 is attributed to the lowering of raw materials prices on account of the global economic crisis and the relative stability in the prices of Hogla products. Global raw material prices increased in 2011 and starting in July 2011 - so did the Hogla energy prices - as mentioned in Section 2.a.(3), above. A decrease was recorded in the Hogla product prices in Israel in 2011, as a result of the escalating competition, inter alia against the background of the social protests, as mentioned in Section 1.b, above.
The operating margin, that reached 16-17% of revenues in the years 2009-2010, decreased to approximately 10% in the first nine months of 2011. In addition to the erosion of the gross margin, the operating margin was affected by the rise of overhead expenses in Israel, as detailed below.
Following below are the summarized business results of Hogla in Israel:
| 2007 | 2008 | 2009 | 2010 | Jan-Sept/10 | Jan-Sept/11 | |||||||||||||||||||
| NIS millions | ||||||||||||||||||||||||
| Revenues | 1,134 | 1,209 | 1,238 | 1,229 | 917 | 910 | ||||||||||||||||||
| Gross Profit | 380 | 435 | 475 | 460 | 354 | 311 | ||||||||||||||||||
| Operating Income | 136 | 169 | 210 | 194 | 148 | 94 | ||||||||||||||||||
| % change in revenues | 7.0 | % | 6.6 | % | 2.4 | % | (0.7 | )% | (0.8 | )% | ||||||||||||||
| Gross margin | 33.5 | % | 36.0 | % | 38.4 | % | 37.5 | % | 38.6 | % | 34.2 | % | ||||||||||||
| Operating margin | 12.0 | % | 14.0 | % | 17.0 | % | 15.8 | % | 16.1 | % | 10.3 | % | ||||||||||||
The percentage of materials (raw materials and products purchased for commercial activity) out of the Hogla revenues, increased to 47% during the first nine months of 2011, as compared with 43-45% of revenues in the years 2009-2010, due to the higher raw material prices in the world, coupled with the erosion in the selling prices of Hogla products.
Selling and marketing expenses in Israel are primarily composed of variable expenses for transportation, advertising and royalties paid to KC, which in 2010 and during the first nine months of 2011, accounted for 62% and 63% of total selling and marketing expenses, respectively. The percentage of variable marketing and selling expenses out of the Hogla revenues, amounted to an average of 12% over the past several years. During the first nine months of 2011, this percentage increased to approximately 13% of revenues. For royalties paid to KC at an average percentage of 2.4% of the Hogla revenues, see Section 2.a.(3) above.
24
The cost of labor in the marketing and selling expenses and in the general and administrative expenses increased in the years 2008-2010 and during the first nine months of 2011, by an average rate of 4% annually. Following below is the composition of the overhead expenses of Hogla in Israel:
| 2007 | 2008 | 2009 | 2010 | Jan-Sept/10 | Jan-Sept/11 | |||||||||||||||||||
| NIS millions | ||||||||||||||||||||||||
| Cost of labor | 66 | 66 | 70 | 71 | 54 | 55 | ||||||||||||||||||
| Transportation, shipping and maintenance | 49 | 56 | 54 | 56 | 41 | 51 | ||||||||||||||||||
| Advertising and Sales Promotion | 44 | 49 | 48 | 48 | 43 | 37 | ||||||||||||||||||
| Commissions and Fees | 1 | 1 | 1 | 0 | 0 | 0 | ||||||||||||||||||
| Royalties | 29 | 30 | 31 | 30 | 22 | 22 | ||||||||||||||||||
| Others | 8 | 10 | 9 | 9 | 7 | 8 | ||||||||||||||||||
| Depreciation | 2 | 2 | 2 | 1 | 1 | 1 | ||||||||||||||||||
| Total selling and marketing expenses | 200 | 212 | 214 | 216 | 168 | 174 | ||||||||||||||||||
| Cost of labor | 23 | 27 | 29 | 25 | 19 | 24 | ||||||||||||||||||
| Administration and IT service | 12 | 13 | 13 | 14 | 10 | 8 | ||||||||||||||||||
| Office | 5 | 4 | 3 | 4 | 3 | 3 | ||||||||||||||||||
| Provision for doubtful debt | (4 | ) | 0 | (4 | ) | (1 | ) | 0 | 0 | |||||||||||||||
| Others | 7 | 10 | 10 | 9 | 6 | 8 | ||||||||||||||||||
| Total general and administrative expenses | 44 | 54 | 51 | 51 | 38 | 43 | ||||||||||||||||||
| % Change in cost of labor | 18.0 | % | 3.2 | % | 7.1 | % | (2.5 | )% | 8.2 | % | ||||||||||||||
| % Change - variable selling and marketing | 11.6 | % | 12.0 | % | 11.5 | % | 11.7 | % | 12.3 | % | 13.0 | % | ||||||||||||
| % change - general and administrative* | 16.3 | % | 11.9 | % | (3.8 | )% | 0.7 | % | 0.0 | % | ||||||||||||||
| * Excluding labor and doubtful debt. | ||||||||||||||||||||||||
Hogla's average effective tax rate, net of a provision for taxes in Turkey, that was recorded in the third quarter of 2011, is similar to the statutory tax rate, net of benefits inherent in Hogla's Approved Enterprise plan in Israel (effective discount of 2% in the overall tax rate, valid through to and including 2013).
| (2) | KCTR Operations |
The KCTR revenues grew at a double-digit pace in recent years, reaching 59% and 20% in 2008 and 2009, respectively. In 2010, the KCTR revenues (in NIS terms) remained unchanged. Its revenues in local currency grew by approximately 5% in 2010. In the first nine months of 2011, the KCTR revenues decreased by 17% in relation to the corresponding period last year, primarily as a result of the decrease in exports in the third quarter of 2011, originating from the operation of new KC plants in Eastern Europe, as mentioned above. Furthermore, an erosion was recorded in the KCTR market share in the local market in the third quarter of 2011.
The gross margin increased in the first nine months of 2011 to 17%, as compared with 15% in 2010, as a result of a change in the sales mix, coupled with savings in the cost of labor employed in manufacturing.
The operating loss margin in the first nine months of 2011, equal to 4% of revenues, was similar to the margin in the corresponding period last year.
25
Below is a summary of the KCTR business results:
| 2007 | 2008 | 2009 | 2010 | Jan-Sept/10 | Jan-Sept/11 | |||||||||||||||||||
| NIS millions, convenience translation | ||||||||||||||||||||||||
| Revenues | 260 | 413 | 494 | 495 | 375 | 310 | ||||||||||||||||||
| Gross Profit | 28 | 75 | 86 | 73 | 59 | 51 | ||||||||||||||||||
| Operating loss | (74 | ) | (33 | ) | (16 | ) | (10 | ) | (14 | ) | (13 | ) | ||||||||||||
| % change in revenues | 20.6 | % | 58.6 | % | 19.5 | % | 0.3 | % | (17.3 | )% | ||||||||||||||
| Gross margin | 10.7 | % | 18.3 | % | 17.5 | % | 14.8 | % | 15.7 | % | 16.5 | % | ||||||||||||
| Operating loss % | (28.3 | )% | (8.1 | )% | (3.3 | )% | (2.1 | )% | (3.7 | )% | (4.2 | )% | ||||||||||||
The ratio of cost of materials (raw materials and imported goods for commercial activity) to revenues at KCTR in the first nine months of 2011, remained similar to the ratio in 2010, at 73%.
The KCTR selling and marketing expenses are composed primarily of variable expenses on account of transportation and advertising, representing approximately two thirds of total selling and marketing expenses over the past several years. The ratio of variable selling and marketing expenses to revenues at KCTR has increased from 10% in 2010, to 11% in the first nine months of 2011, despite the decrease in the sum of expenses, as a result of the decrease in the KCTR revenues during this period.
The cost of labor in the marketing and selling expenses and in the general and administrative expenses remained unchanged in 2010 and during the first nine months of 2011, as follows:
| 2007 | 2008 | 2009 | 2010 | Jan-Sept/10 | Jan-Sept/11 | |||||||||||||||||||
| NIS millions, convenience translation | ||||||||||||||||||||||||
| Cost of labor | 12 | 16 | 11 | 13 | 9 | 9 | ||||||||||||||||||
| Transportation, shipping and maintenance | 26 | 38 | 29 | 29 | 23 | 21 | ||||||||||||||||||
| Advertising and Sales Promotion | 34 | 36 | 35 | 19 | 19 | 14 | ||||||||||||||||||
| Others | 14 | 6 | 16 | 12 | 12 | 9 | ||||||||||||||||||
| Total selling and marketing expenses | 86 | 97 | 91 | 72 | 63 | 53 | ||||||||||||||||||
| Cost of labor | 9 | 8 | 7 | 6 | 5 | 5 | ||||||||||||||||||
| Administration and IT service | 1 | 1 | 1 | 1 | 4 | 4 | ||||||||||||||||||
| Others | 6 | 3 | 3 | 4 | 1 | 2 | ||||||||||||||||||
| Total general and administrative expenses | 16 | 12 | 12 | 11 | 10 | 11 | ||||||||||||||||||
| % Change in cost of labor | 10.4 | % | 19.4 | % | (24.8 | )% | 0.1 | % | 0.0 | % | ||||||||||||||
| % Change - variable selling and marketing | 23.0 | % | 18.0 | % | 13.0 | % | 9.6 | % | 11.2 | % | 11.3 | % | ||||||||||||
| % change - general and administrative* | (17.5 | )% | (45.8 | )% | 13.0 | % | 30.4 | % | (5.6 | )% | 20.0 | % | ||||||||||||
| * Excluding labor. | ||||||||||||||||||||||||
On February 16, 2010, KCTR received a report from the Turkish tax authorities, pursuant to which it was required to make considerable tax payments. For details see Section 2.b.(4), above.
26
| b. | Financial Situation |
| (1) | Net Financial Debt |
An analysis of the Hogla consolidated balance sheets indicates that the Hogla operations are primarily financed using shareholders' equity. During the first nine months of 2011, Hogla's financial debt has increased by NIS 170 million and amounted to NIS 194 million. The increase in the debt originated primarily from credit assumed by KCTR in order to finance the investment in the new manufacturing array, as mentioned in Section 2.b.(3) above, coupled with the recording of a provision for taxes in Turkey, in the Hogla financial statements, as mentioned in Section 2.b.(4), above.
Following below is the composition of the net financial debt of Hogla, on a consolidated basis, as at the date of the valuation.
| 30/9/11 | ||||
| NIS millions | ||||
| Short-term bank credit | 96 | |||
| Provision for taxes | 105 | |||
| Long-term deferred income tax, net* | 39 | |||
| Liabilities in respect of employees, net | 8 | |||
| Total financial liabilities | 248 | |||
| Less: | ||||
| Cash and cash equivalents | 19 | |||
| VAT receivable | 35 | |||
| Net financial debt | 194 | |||
| * Deferred tax calculation for purposes of valuation only. Performed assuming that | ||||
| Corporate tax rate would increase to 25%, starting in 2012, as stated in Section 4.b. below. | ||||
On October 17, 2011, the Board of Directors of Hogla approved the issue of a guarantee for the purpose of securing a future payment by KCTR to the Turkish tax authorities. For details see Section 2.b.(5), above.
| (2) | Working Capital Requirements |
Operating working capital that serves for the Israel operations, increased to 12% of revenues in the first nine months of 2011, as a result of an increase in accounts receivable and inventories, on the one hand, coupled with a decrease in supplier credit, on the other hand. As follows:
| 31/12/10 | 30/9/11 | |||||||
| NIS millions | ||||||||
| Accounts receivable | 220 | 235 | ||||||
| Inventories | 158 | 177 | ||||||
| Suppliers and service providers | 270 | 259 | ||||||
| Operating working capital, net | 108 | 153 | ||||||
| Percentage of revenues | 9 | % | 12 | % | ||||
The increase in inventories originated from a temporary decrease in sales in the third quarter of 2011, coupled with a change in the product mix that necessitated increasing the raw materials inventory that serves for the manufacture of the old products and the new products. Hogla is working to reduce the inventories by the end of 2011. The increase in accounts receivable is a temporary increase, resulting from the timing of the holidays in Israel this year. The decrease in accounts payable is temporary and is attributed to the decrease in purchasing for the sake of reducing Hogla's inventories in Israel.
27
The operating working capital that serves for the operations in Turkey, decreased during the first nine months of 2011 to 17%, as compared with 19% of revenues in 2010, due to the decrease in sales and the more efficient use of working capital, as follows:
| 31/12/10 | 30/9/11 | |||||||
| NIS millions | ||||||||
| Accounts receivable | 69 | 59 | ||||||
| Inventories | 83 | 75 | ||||||
| Suppliers and service providers | 60 | 63 | ||||||
| Operating working capital, net | 93 | 72 | ||||||
| Percentage of revenues | 19 | % | 17 | % | ||||
| (3) | Investments and Depreciation |
During the past several years, Hogla has been investing sums that exceed the depreciation, with the intention of resolving bottlenecks in manufacturing and increasing the output capacity in Israel and in Turkey, in addition to the creation of new manufacturing arrays. The following are the investments and depreciation in Hogla's consolidated financial statements:
| 2007 | 2008 | 2009 | 2010 | Jan-Sept/10 | Jan-Sept/11 | |||||||||||||||||||
| NIS millions | ||||||||||||||||||||||||
| Investments | 43 | 48 | 43 | 63 | 37 | 55 | ||||||||||||||||||
| Depreciation | 27 | 24 | 29 | 31 | 23 | 24 | ||||||||||||||||||
| Investment to depreciation ratio | 161 | % | 205 | % | 146 | % | 203 | % | 161 | % | 229 | % | ||||||||||||
| (4) | Dividend Distribution |
In the years 2008-2011, Hogla distributed dividends in the aggregate sum of NIS 294 million, as follows:
| Dividend | ||||
| Period | NIS millions | |||
| 2008 | - | |||
| 2009 | 134 | |||
| 2010 | 100 | |||
| Jan-Sept/2011 | 60 | |||
| Total | 294 | |||
28
| 4. | Valuation |
The value of Hogla's shareholders' equity, on a consolidated basis, as at September 30, 2011, is estimated to lie in the range between NIS 1,248-1,353 million, while the value of Hadera Paper's holding stake in Hogla (49.9%) as presented in the financial statements of CII, as at the present time, is estimated between NIS 623-675 million.
| a. | Methodology |
The valuation of Hogla was made using the discounted cash flows method (DCF), which I believe to be the most appropriate method for the valuation of this company.
The discounted cash flows method (DCF) assumes that the Enterprise Value (EV) of a company is determined by discounting the Free Cash Flows (FCF) originating from operating activities, using the Weighted Average Cost of Capital (WACC) of the company. Free Cash Flows (FCF) are derived from a detailed business plan for a determined period of time. In this professional opinion, this period was five years with the addition of one representative year for calculating the residual value.
Free cash flows (FCF) are derived from operating income after taxes, subsequent to adjustments for depreciation, investments and changes in working capital. It was assumed that the cash flows are received in the middle of each year, on average.
The Weighted Average Cost of capital (WACC) is calculated as follows:

Where:
ke | = | Cost of shareholders' equity; |
kd | = | Cost of external capital; |
| T | = | Corporate tax rate; |
| D | = | Estimated value of net financial debt; |
| E | = | Estimated value of shareholders' equity; |
29
The equity cost (ke) is determined based on the CAPM model, as follows:

| Where: |
Rf | = | Risk-free interest rate; |
Rm-Rf | = | Market risk-free premium on account of a share that forms part of the market portfolio; |
| β = Beta, the correlation coefficient of share return with market portfolio return; |
| δ = Specific risk premium reflecting the unique risks of the company. |
In this professional opinion, the risk premium was estimated on the basis of historical differences in the returns of companies possessing a relative low market cap in the American market.
| b. | Model assumptions |
Revenues
The volume of operations in Israel is derived from population size, changes in consumer habits and living standards in the economy. Subject to the working assumptions concerning the economic crisis and the social protests in Israel, as mentioned in Section 1b, above and on the basis of the management forecast, it was assumed that during the forecast period, the revenues in Israel would grow at a real-term rate of 1.5% per annum. We note that the erosion of 2.6% in the revenues in Israel in the four quarters that ended on the valuation date (hereinafter: "The year preceding the valuation date") originated from the decrease in product prices as a result of escalating competition in the sector, as mentioned above.
In light of the KCTR business results in the third quarter of 2011 and the deviation from the strategic plan for the years 2009-2015, as mentioned in Section 2.b.(1), above, it was assumed that the KCTR revenues would decrease during the first year of the forecast by 5% and then increase by 10%, 10%, 10% and 5% per annum, during years 2, 3, 4 and 5 of the forecast, respectively. It was assumed that during the representative year, the revenues would grow at a rate of 1.5% per annum. This compares to a revenue growth rate of 20%, 0% and an erosion of 13% in the years 2009 and 2010 and the year preceding the valuation date, respectively.
The Compound Annual Growth Rate (CAGR) of the KCTR revenues in years 1-5 of the forecast is equal to 6% per annum, as compared with a CAGR of 14% per annum in the strategic plan for the years 2011-2015.
Cost of Revenues
It was assumed that the ratio of cost of materials to revenues in Israel would decrease during the forecast period, to an average of 47%, as compared with 48%, 45% and 43% in the year preceding the valuation date and in the years 2010 and 2009, respectively. This is under the assumption that the increase in raw material prices in 2011 was extraordinary and that the ratio of cost of materials to revenues would grow more moderate in the following years, although it will not return to the ratio of materials recorded in the years 2009-2010. It was assumed that the ratio of other manufacturing costs of the Israel operations would equal 9.8% of revenues during the first two years of the forecast. This is attributed to the rise in energy prices at the Hadera manufacturing site, that is expected to continue during the first two years of the forecast and then grow more moderate, as mentioned in Section 2.a.(3). It was assumed that starting from Year 3 of the forecast and thereafter, the ratio of other manufacturing costs to revenues would equal 9.6% and would be similar to the ratio of these costs in the year preceding the date of the valuation. It was assumed that the cost of labor in the cost of revenues would grow at a rate of 1.5% per annum during the term of the forecast.
30
It was assumed that the gradual decrease in the ratio of cost of materials to revenues in Turkey would continue, from 73% and 71% of revenues in 2010 and in the year preceding the valuation date, respectively, to 66% of revenues in the long term. Due to the decrease in the KCTR revenues in the year preceding the valuation date, the ratio of other manufacturing costs to revenues in Turkey, reached a record high of 4.4%, as compared with 3.6% and 3.3% of revenues in the years 2010 and 2009, respectively. It was assumed that this ratio would gradually decrease during the forecast period, to 4% of revenues during the representative year. It was assumed that the cost of labor in the KCTR manufacturing would increase during the forecast period by 1.5% per annum, subsequent to a decrease of some 13% in this cost in the year preceding the valuation date, as a result of efficiency measures initiated by KCTR. The above assumptions reflect the anticipated moderation in raw material prices in the first years of the forecast, alongside the optimization of manufacturing and the change in the product mix, as a result of the operation of the feminine hygiene product line in 2012, as mentioned in Section 2.b.(4), above.
Overhead Expenses
It was assumed that in Israel, the cost of labor under selling and marketing expenses and under general and administrative expenses, as well as non-payroll general and administrative expenses, would increase by 1.5% annually over the forecast period. It was assumed that the ratio of non-payroll selling and marketing expenses to revenues would decrease during the forecast period, to 12% of revenues, as compared with 12.4%, 11.7% and 11.5% of revenues in the year preceding the valuation date and in the years 2010 and 2009, respectively.
It was assumed that due to the cutbacks in personnel in Turkey that were implemented in the past several months, the cost of labor in the selling and marketing expenses and in the general and administrative expenses would decrease by 5% in the first year of the forecast and would subsequently increase by 1.5% per annum starting in Year 2 of the forecast and thereafter. Non-payroll general and administrative expenses in the model would increase by 1.5% annually over the forecast period. It was assumed that the ratio of non-payroll selling and marketing expenses to revenues be equal to 6.2% of the KCTR revenues, as compared with 6.2%, 5.8% and 5.9% of revenues in the year preceding the valuation date and in the years 2010 and 2009, respectively.
31
Taxation
In July 2009, the Economic Efficiency Law for the years 2009-2010 was ratified (legislative amendments for the implementation of the economic plan 2009 and 2010), 2009. The Law stipulates a path for the lowering of corporate tax rates, from 26% in 2009 to 18% by 2016, as follows:
| 2016 | 2015 | 2014 | 2013 | 2012 | 2011 | |||||||||||||||||
| 18 | % | 20 | % | 21 | % | 22 | % | 23 | % | 24 | % | |||||||||||
| In view of the government resolution dated October 30, 2011, to cancel the tax reduction described above and to raise the corporate tax rate to 25% in the year 2012, inter alia, due to the social protests mentioned in Section 1.b.,above, it was assumed that the corporate tax rate that will be effective in Israel from the year 2012 and thereafter, shall be equal to 25%. It was assumed that Hogla's effective tax rate in Israel would be identical to the statutory tax rate, net of benefits inherent in Hogla's Approved Enterprise plan in Israel (effective discount of 2% in the overall tax rate, valid through to and including 2013). |
It was assumed that the applicable tax rate for KCTR, during the forecast period, would be the statutory tax rate in Turkey, i.e. 20%. KCTR has carry-forward tax losses for tax purposes for which no deferred taxes were recorded in the financial statements, due to restrictions on the utilization of carry-forward tax losses in Turkey, primarily the 5-year restriction on offsetting such losses.
In view of the time restriction on the utilization of KCTR's carry-forward tax losses, and due to the Tax Authority's demand from February 2010, as set forth in Section 2.b.(4) above, we did not attribute any value to the KCTR losses for tax purposes.
Operating income after taxes
Below is the summary business forecast in Israel, based on the assumptions above:
| 2009 | 2010 | *2011E | Year 1 | Year 2 | Year 3 | Year 4 | Year 5 | Representative year | ||||||||||||||||||||||||||||
| Actual | Forecast | |||||||||||||||||||||||||||||||||||
| NIS millions | ||||||||||||||||||||||||||||||||||||
| Revenues | 1,238 | 1,229 | 1,197 | 1,215 | 1,233 | 1,252 | 1,271 | 1,290 | 1,309 | |||||||||||||||||||||||||||
| Cost of Revenues | 762 | 769 | 805 | 818 | 825 | 830 | 839 | 847 | 859 | |||||||||||||||||||||||||||
| Gross Profit | 475 | 460 | 392 | 397 | 409 | 421 | 432 | 443 | 450 | |||||||||||||||||||||||||||
| Selling and Marketing Expenses | 214 | 216 | 222 | 222 | 223 | 226 | 230 | 233 | 237 | |||||||||||||||||||||||||||
| General and Administrative Expenses | 51 | 51 | 56 | 60 | 61 | 62 | 63 | 64 | 65 | |||||||||||||||||||||||||||
| Operating Income | 210 | 194 | 115 | 115 | 125 | 133 | 140 | 146 | 148 | |||||||||||||||||||||||||||
| Effective tax rate | 22 | % | 22 | % | 24 | % | 25 | % | 25 | % | 25 | % | ||||||||||||||||||||||||
| Taxes | (25 | ) | (27 | ) | (32 | ) | (35 | ) | (36 | ) | (37 | ) | ||||||||||||||||||||||||
| Operating income after taxes | 90 | 98 | 101 | 105 | 109 | 111 | ||||||||||||||||||||||||||||||
% change in revenues | 2.4 | % | (0.7 | )% | (2.6 | )% | 1.5 | % | 1.5 | % | 1.5 | % | 1.5 | % | 1.5 | % | 1.5 | % | ||||||||||||||||||
| Gross margin | 38.4 | % | 37.5 | % | 32.8 | % | 32.7 | % | 33.1 | % | 33.7 | % | 34.0 | % | 34.3 | % | 34.3 | % | ||||||||||||||||||
| Operating margin | 17.0 | % | 15.8 | % | 9.6 | % | 9.5 | % | 10.1 | % | 10.7 | % | 11.0 | % | 11.3 | % | 11.3 | % | ||||||||||||||||||
* Based on results in four quarters ended September 30, 2011, with the required adjustments | ||||||||||||||||||||||||||||||||||||
32
Below is the summary business forecast for KCTR, based on the assumptions above:
| 2009 | 2010 | *2011E | Year 1 | Year 2 | Year 3 | Year 4 | Year 5 | Representative year | ||||||||||||||||||||||||||||
| Actual | Forecast | |||||||||||||||||||||||||||||||||||
| NIS millions | ||||||||||||||||||||||||||||||||||||
| Revenues | 494 | 495 | 430 | 409 | 450 | 495 | 544 | 571 | 580 | |||||||||||||||||||||||||||
| Cost of Revenues | 407 | 422 | 365 | 347 | 375 | 405 | 435 | 449 | 456 | |||||||||||||||||||||||||||
| Gross Profit | 86 | 73 | 65 | 62 | 75 | 89 | 109 | 122 | 124 | |||||||||||||||||||||||||||
| Selling and Marketing Expenses | 91 | 72 | 62 | 57 | 61 | 66 | 70 | 73 | 74 | |||||||||||||||||||||||||||
| General and Administrative Expenses | 12 | 11 | 12 | 12 | 12 | 12 | 13 | 13 | 13 | |||||||||||||||||||||||||||
| Operating Income | (16 | ) | (10 | ) | (9 | ) | (8 | ) | 1 | 11 | 26 | 36 | 37 | |||||||||||||||||||||||
| ** Effective tax rate | 20 | % | 20 | % | 20 | % | 20 | % | 20 | % | 20 | % | ||||||||||||||||||||||||
| Taxes | 2 | (0 | ) | (2 | ) | (5 | ) | (7 | ) | (7 | ) | |||||||||||||||||||||||||
| Operating income after taxes | (6 | ) | 1 | 9 | 21 | 29 | 30 | |||||||||||||||||||||||||||||
% change in revenues | 19.6 | % | 0.3 | % | (13.1 | )% | (5.0 | )% | 10.0 | % | 10.0 | % | 10.0 | % | 5.0 | % | 1.5 | % | ||||||||||||||||||
| Gross margin | 17.5 | % | 14.8 | % | 15.2 | % | 15.1 | % | 16.6 | % | 18.1 | % | 20.0 | % | 21.4 | % | 21.4 | % | ||||||||||||||||||
| Operating margin | (3.3 | )% | (2.1 | )% | (2.2 | )% | (1.9 | )% | 0.2 | % | 2.3 | % | 4.7 | % | 6.4 | % | 6.4 | % | ||||||||||||||||||
| * Based on results in four quarters ended September 30, 2011, with the required adjustments | ||||||||||||||||||||||||||||||||||||
| ** In this forecast, the effective tax rate is identical to the statutory tax rate in Turkey. | ||||||||||||||||||||||||||||||||||||
We emphasize that given the KCTR business results in the year preceding the date of the valuation and the deviation from the strategic plan that was created during this period, as mentioned in Section 2.b.(1), above, the operating income in the representative year of the business forecast of KCTR above, represents approximately one half of the operating income in the last year of the KCTR strategic plan for the years 2009-2015.
33
Investments and Depreciation
It was assumed that investments in Israel over the forecast period would be equal to the depreciation, at NIS 24 million annually. This is due to the fact that a higher output capacity would require investment to eliminate bottlenecks. The actual investments in recent years were higher than the depreciation.
The KCTR investments in the first year of the forecast are expected to amount to NIS 15 million, primarily on account of the completion of the construction of a manufacturing line for feminine hygiene products. In the second year of the forecast, KCTR anticipates a decrease in investments to approximately NIS 4 million, due to the absence of significant development plans. It was assumed that starting with the third year of the forecast and thereafter, the KCTR investments would be equal to the level of annual depreciation, at NIS 13 million per annum.
Working Capital Requirements
The ratio of operating working capital out of the Hogla revenues in Israel stood at 8.8% and 8.6% of revenues in the years 2010 and 2009. The working capital as at September 30, 2011, increased to 12.7% of revenues as a result of several reasons, as described in Section 3.b.(2), above. The reasons for the said increase are of a temporary nature and it was therefore assumed that during the first year of the forecast, the ratio of working capital to revenues would decrease to 10% and would remain at that level throughout the forecast.
The ratio of operating working capital out of the KCTR revenues stood at 19% and 14% in the years 2010 and 2009, respectively. This ratio was equal to 17% as at September 30, 2011. It was assumed that the ratio of operating working capital out of the KCTR revenues would equal 17% of revenues during the forecast period.
Weighted Average Cost of Capital (WACC) and long-term growth rate (g)
The real-term weighted average cost of capital (WACC) was determined to be between 9-11% per annum, or an average of 10% per annum. The WACC reflects the following assumptions: Cost of shareholders' equity of 11.4% per annum; cost of debt of 5% per annum; tax rate of 25% and financial leverage of 20%.
The cost of shareholders' equity of 11.4% per annum was calculated using the CAPM model, in addition to the specific risk premium (δ), as mentioned above.
The real-term risk-free cost of capital in the model, at approximately 3% per annum, is derived from the yield to maturity rate of CPI-linked Israel government bonds for periods in excess of 10 years, as at September 30, 2011. The cost of debt was determined as the risk-free cost of capital in the model, in addition to the estimated risk premium of Hogla, that was derived from the difference between the yield to maturity rate of the CPI-linked bonds of Hadera Paper and the yield to maturity rate of CPI-linked Israel government bonds with a similar average life span, as at the date of the valuation.
34
The market risk premium was estimated at 6% per annum, on the basis of the average implied ERP in the United States4 during the six months preceding the date of the valuation. The selection of a six-month average is attributed to the relatively high volatility of the Implied ERP rate in 2011.
Due to the absence of similar companies in Israel and the difficulty in locating similar companies overseas, given the characteristics of Hogla, the unlevered beta (β) for the model was calculated as the average unlevered β of the household products sector in the United States and in emerging markets5. The operating β that was estimated in this manner was leveraged according to the leveraged rate of Hogla in the model (relevered β). The beta that was estimated in this manner is equal to 0.91.
The specific risk premium (δ) was determined at the level of the risk premium for a sample of companies whose value resembles that of Hogla (90th percentile), at a rate of 2.94%6 per annum.
Hogla did not assume any significant financial debt until 2007. In 2008, Hogla assumed net financial debt of NIS 119 million for the purpose of financing an investment in KCTR, that amounted to NIS 24 million, as at December 31, 2010. In the first nine months of 2011, Hogla's financial debt increased primarily on account of a provision associated with the legal proceedings surrounding the taxation issue in Turkey and the assuming of credit by KCTR, as mentioned in Section 3.b.(1), above. This debt reflects a ratio of leverage to enterprise value (EV) of 13% for Hogla in the model.
Assuming that KC knowingly chose not to leverage Hogla at typical level of leverage for the basic products industry, in Hogla's case there exist restrictions on applying the debt capacity approach. Using this approach, a calculation of the weighted average cost of capital would be based on the customary level of financial leverage for the sector, while ignoring the actual leverage level of the company. It would appear that in this case, had KC not elected not to leverage the company, Hogla may have achieved a leverage level of 30-50% of enterprise value (EV). Due to KC's approach, it was assumed that the mean financial leverage would be at 20% of EV.
It was assumed that the free cash flows (FCF) for Hogla and KCTR would grow in the long term at 0.5-2.5% annually, on average at 1.5% annually, similar to the population growth rate. This assumes that technological improvements would allow to expand the output capacity at this pace over the long term, without investment in excess of depreciation.
Net financial debt
Hogla's net financial debt as at September 30, 2011, amounted to NIS 194 million - see Section 3.b.(1), above.
35
Value of the KC Control Premium
KC's involvement in Hogla is not materially different to that of Hadera Paper. KC does not benefit from any management fees or other benefits, other than royalties at an average rate equal to 2.4% of the Hogla revenues. These royalties are paid in exchange for technological know-how, research and development and the use of KC's procurement system. It would appear that the economic benefit to Hogla due to the ability to exploit the economies of scale of KC, is no less than the amount of royalties.
One of Hogla's plants is at Hadera, and uses the energy center and other services provided by Hadera Paper at this site. Furthermore, Hogla contributes to the cost of administrative and IT resources of Hadera Paper, and it would appear that in this case, the positive implications of the control premium (steering of the company, setting its business direction and enforcing efficient management), its negative implications (payroll and benefits at the expense of minority interest) and synergy with other KC businesses7, is immaterial.
In view of the foregoing, it was assumed that the value of the control premium for KC is immaterial.
7 As defined in "Value and Achievement of Control" by Alona Bar-On and Yitzhak Swari, Kasierer Institute, December 2005.
36
| c. | Valuation |
Following below is a summary of the calculation of the value of Hogla on a consolidated basis:
Year 1 | Year 2 | Year 3 | Year 4 | Year 5 | Representative year | |||||||||||||||||||
Forecast | ||||||||||||||||||||||||
| NIS millions | ||||||||||||||||||||||||
| After-tax operating income - Israel | 90 | 98 | 101 | 105 | 109 | 111 | ||||||||||||||||||
| After-tax operating income - Turkey | (6 | ) | 1 | 9 | 21 | 29 | 30 | |||||||||||||||||
| Operating income after taxes | 84 | 98 | 110 | 125 | 138 | 141 | ||||||||||||||||||
| Depreciation | 34 | 35 | 37 | 37 | 37 | 37 | ||||||||||||||||||
| Investments in fixed assets | (40 | ) | (28 | ) | (37 | ) | (37 | ) | (37 | ) | (37 | ) | ||||||||||||
| Change in working capital | 34 | (9 | ) | (9 | ) | (10 | ) | (6 | ) | (3 | ) | |||||||||||||
| Free Cash Flows (FCF) | 112 | 97 | 101 | 115 | 132 | 138 | ||||||||||||||||||
| Discounted cash flows | 107 | 84 | 79 | 82 | 86 | |||||||||||||||||||
| Remainder value | 1,054 | |||||||||||||||||||||||
| High | Low | |||||||
| Value | Value | |||||||
| NIS millions | ||||||||
| Calculation assumption | ||||||||
| Weighted Average Cost of Capital (WACC) | 9.00 | % | 11.00 | % | ||||
| Long-term growth rate (g) | 0.50 | % | 2.50 | % | ||||
| Model results | ||||||||
| Enterprise Value (EV) | 1,547 | 1,442 | ||||||
| Net of financial debt | (194 | ) | (194 | ) | ||||
| Equity value - Hogla | 1,353 | 1,248 | ||||||
| NIS millions | Holding | |||||||||||
| Value of KC holding stake | 678 | 625 | 50.1 | % | ||||||||
| Value of Hadera Paper holding stake | 675 | 623 | 49.9 | % | ||||||||
| Equity value - Hogla | 1,353 | 1,248 | ||||||||||
| Long-term real growth rate (g) | ||||||||||||||||||||||||||||||||
| 0.00% | 0.50% | 1.00% | 1.50% | 2.00% | 2.50% | 3.00% | ||||||||||||||||||||||||||
| Weighted Average Cost of Capital (WACC) for discounting cash flows | 8.00 | % | 1,481 | 1,563 | 1,655 | 1,762 | 1,887 | 2,034 | 2,211 | |||||||||||||||||||||||
| 8.50 | % | 1,381 | 1,451 | 1,531 | 1,622 | 1,726 | 1,849 | 1,993 | ||||||||||||||||||||||||
| 9.00 | % | 1,292 | 1,353 | 1,422 | 1,500 | 1,589 | 1,691 | 1,811 | ||||||||||||||||||||||||
| 9.50 | % | 1,213 | 1,266 | 1,326 | 1,393 | 1,469 | 1,556 | 1,657 | ||||||||||||||||||||||||
| 10.00 | % | 1,141 | 1,188 | 1,241 | 1,299 | 1,365 | 1,440 | 1,525 | ||||||||||||||||||||||||
| 10.50 | % | 1,076 | 1,118 | 1,164 | 1,216 | 1,273 | 1,338 | 1,411 | ||||||||||||||||||||||||
| 11.00 | % | 1,018 | 1,055 | 1,096 | 1,141 | 1,192 | 1,248 | 1,311 | ||||||||||||||||||||||||
| 11.50 | % | 964 | 997 | 1,034 | 1,074 | 1,118 | 1,168 | 1,223 | ||||||||||||||||||||||||
| 12.00 | % | 915 | 945 | 978 | 1,013 | 1,053 | 1,096 | 1,145 | ||||||||||||||||||||||||
37
Appendix A
Additional Information Pursuant to
Securities Law Regulations
(Periodic and Immediate Statements), 1970
38
The information following below is provided in accordance with the Securities Law Regulations (Periodic and Immediate Statements), 1970 (hereinafter: "The Regulations") requiring disclosure of additional information concerning a material valuation, as detailed in Section 8b and in Addendum 3 to the regulations. The following information complements the information disclosed in the above opinion:
| 1. | The engagement for the performance of the valuation was commissioned by Mr. Yehuda Ben-Ezra, VP comptroller of CII, on September 19, 2011. |
| 2. | Following below is the summarized information regarding Section 8b(i) to the regulations |
| Regulation No. | Required Details |
| 8b. (i)(1) | The subject of the valuation is to determine the value of shareholders' equity of Hogla-Kimberly Ltd., for the purpose of determining the impairment of the investment in the financial statements of CII, as at September 30, 2011, according to the directives of IAS 36. |
| 8b. (i)(2) | The date of the valuation is September 30, 2011. |
| 8b. (i)(3) | The value of Hogla-Kimberly Ltd. in the CII books is NIS 832 million. |
| 8b. (i)(4) | The value of shareholders' equity of Hogla-Kimberly Ltd. in the valuation, lies in the range between NIS 1,248-1,353 million. The value of the CII holdings, derived from this range, is NIS 648 million, on average. |
| 8b. (i)(5) | The valuation was performed by Vadim Portnoy, CPA, of Vadim Portnoy Business Consulting Ltd. Following below are the highlights of the education and professional experience of the valuator: Undergraduate degree from Hebrew University, Jerusalem in Economics and Accounting (1994), CPA (since 1997), MBA from Hebrew University, Jerusalem (1998). Experience of 13 years in business and economic consulting, including review and compilation of valuations and economic opinions for accounting purposes, including for reporting companies and at similar sizes to the volumes of operation of Hogla-Kimberly Ltd. The valuator earned his professional experience, inter alia, as an employee of the Israel Securities Authority and of Swary Yochman Ltd. and since 2004, at Vadim Portnoy Business Consulting Ltd. Since 2000, Vadim has served as a lecturer on corporate valuations at the Hebrew University School of Business, in Jerusalem. Vadim has no personal interest nor a dependency between himself, Hogla Kimberly Ltd., companies controlled / owned thereby, and interested parties in the Company. In conjunction with the engagement for performing this valuation, our maximum liability for any damage, other than damage incurred by negligence and/or maliciousness and/or intentionally, has been limited to the fee paid for this engagement. Vadim also received indemnification for any amount Vadim may be required to pay to any third party by finalized verdict with respect to the preparation of this opinion, as well as for any reasonable legal expenses - unless it would be determined that Vadim has acted negligently and/or maliciously and/or intentionally with regard to this opinion. |
| 8b. (i)(6) | The valuation model that served for the performance of the valuation is the Discounted Cash Flows (DCF) model. |
| 8b. (i)(7) | The assumptions under which the valuator performed the valuation: (a) The real-term weighted average cost of capital (WACC) that served for determining the Enterprise Value of Hogla Kimberly Ltd. was determined at 10% per annum. (b) The real long-term growth rate was determined at 1.5% per annum. (c) The residual value represents approx.71% of the enterprise value of Hogla Kimberly Ltd. (d) Irrelevant (e) Irrelevant (f) Irrelevant |
39
| 3. | Following below is a summary of information regarding Section 5 to the third addendum of the regulations: |
During the last three years, I performed three valuations of Hogla, the last of which was on December 31, 2010 (hereinafter: "Previous Valuation"). The previous valuation was performed as part of a valuation of Hadera Paper, in accordance with the directives of IAS 36.
In the previous valuation, the value of the shareholders' equity of Hogla was found to be in the range between NIS 1,778-1,958 million. The value of the Hogla shareholders' equity in this valuation is lower by NIS 564 million (approx. 30%) than the value of shareholders' equity determined in the previous valuation.
The deviation, amounting to NIS 564 million, is attributed to two factors: A decrease in the Enterprise Value (EV) of NIS 389 million (approx. 21%) and an increase in net financial debt, in the amount of NIS 175 million, as follows:
| Average value | ||||||||||||||||
| Dec-31-10 | Sept-30-11 | Change | Change | |||||||||||||
| NIS millions | % | |||||||||||||||
| EV | 1,882 | 1,493 | 389 | 21 | % | |||||||||||
| Net of financial debt | (19 | ) | (194 | ) | 175 | |||||||||||
| Value of shareholders’ equity | 1,863 | 1,299 | 564 | 30 | % | |||||||||||
Following below are the reasons for these changes:
Decrease in Enterprise Value (EV)
The decrease in Enterprise Value was created as a result of three principal reasons:
| - | Decrease in the profitability of Hogla Israel in the first nine months of 2011, in relation to the corresponding period last year and in relation to the 2011 budget. Following below is a comparison of the operating income forecast in the first five years of the forecast, as at December 31, 2010 and as at September 30, 2011. |
40
| - |
| Hogla Israel forecast as at September 30, 2011 | ||||||||||||||||||||||||||||||||||||
| 2009 | 2010 | 2011E* | Year 1 | Year 2 | Year 3 | Year 4 | Year 5 | Representative year | ||||||||||||||||||||||||||||
| Actual | Forecast | |||||||||||||||||||||||||||||||||||
| NIS millions | ||||||||||||||||||||||||||||||||||||
| Operating Income | 210 | 194 | 115 | 115 | 125 | 133 | 140 | 146 | 148 | |||||||||||||||||||||||||||
| * Based on results in four quarters ended September 30, 2011, with the required adjustments | ||||||||||||||||||||||||||||||||||||
| Hogla Israel forecast as at December 31, 2010 | ||||||||||||||||||||||||||||||||||||
| 2008 | 2009 | 2010 | Year 1 | Year 2 | Year 3 | Year 4 | Year 5 | Representative year | ||||||||||||||||||||||||||||
| Actual | Forecast | |||||||||||||||||||||||||||||||||||
| NIS millions | ||||||||||||||||||||||||||||||||||||
| Operating Income | 169 | 210 | 194 | 176 | 167 | 163 | 159 | 160 | 162 | |||||||||||||||||||||||||||
| - | Decrease in the KCTR revenues, while deviating from its strategic plan, as mentioned in Section 2.b.(1) in the professional opinion, resulted in the lowering of the objectives in the business forecast, as follows: |
| KCTR forecast as at September 30, 2011 | ||||||||||||||||||||||||||||||||||||
| 2009 | 2010 | 2011E* | Year 1 | Year 2 | Year 3 | Year 4 | Year 5 | Representative year | ||||||||||||||||||||||||||||
| Actual | Forecast | |||||||||||||||||||||||||||||||||||
| NIS millions | ||||||||||||||||||||||||||||||||||||
| Operating Income | (16 | ) | (10 | ) | (9 | ) | (8 | ) | 1 | 11 | 26 | 36 | 37 | |||||||||||||||||||||||
| * Based on results in four quarters ended September 30, 2011, with the required adjustments | ||||||||||||||||||||||||||||||||||||
| KCTR forecast as at December 31, 2010 | ||||||||||||||||||||||||||||||||||||
| 2008 | 2009 | 2010 | Year 1 | Year 2 | Year 3 | Year 4 | Year 5 | Representative year | ||||||||||||||||||||||||||||
| Actual | Forecast | |||||||||||||||||||||||||||||||||||
| NIS millions | ||||||||||||||||||||||||||||||||||||
| Operating Income | (33 | ) | (16 | ) | (10 | ) | (10 | ) | 6 | 23 | 45 | 61 | 63 | |||||||||||||||||||||||
| - | Additional events such as the expected increase in the corporate tax rate in Israel, the lowering of the anticipated investments in the future as a result of having performed most of the investment in the manufacturing line for feminine hygiene products in Turkey by the end of the third quarter of 2011, and so on - also influenced the Enterprise Value of Hogla on a consolidated basis. |
Increase in Net Financial Debt
The increase in the net financial debt, was created primarily as a result of recording a provision for taxes in Turkey and the assuming of credit by KCTR, as stated in Section 3.b.(1) to the professional opinion.
41