UNITED STATES
SECURITIES AND EXCHANGE COMMISSION
Washington, D.C. 20549
FORM N-CSR
CERTIFIED SHAREHOLDER REPORT OF REGISTERED MANAGEMENT
INVESTMENT COMPANIES
Investment Company Act file number | 811-524 |
| |
| The Dreyfus/Laurel Funds Trust | |
| (Exact name of Registrant as specified in charter) | |
| | |
| c/o The Dreyfus Corporation 200 Park Avenue New York, New York 10166 | |
| (Address of principal executive offices) (Zip code) | |
| | |
| John Pak, Esq. 200 Park Avenue New York, New York 10166 | |
| (Name and address of agent for service) | |
|
Registrant's telephone number, including area code: | (212) 922-6000 |
| |
Date of fiscal year end: | 5/31 | |
Date of reporting period: | 11/30/13 | |
| | | | | | | |
This N-CSR relates only to the series of the Registrant listed below, and does not affect the other series of the Registrant, which have different fiscal year ends and, therefore, different N-CSR reporting requirements. Separate N-CSR Forms will be filed for those series, as appropriate.
Dreyfus Emerging Markets Debt Local Currency Fund
Dreyfus Equity Income Fund
FORM N-CSR
Item 1. Reports to Stockholders.
|
| Dreyfus |
| Emerging Markets Debt |
| Local Currency Fund |
SEMIANNUAL REPORT November 30, 2013

Save time. Save paper. View your next shareholder report online as soon as it’s available. Log into www.dreyfus.com and sign up for Dreyfus eCommunications. It’s simple and only takes a few minutes.
The views expressed in this report reflect those of the portfolio manager only through the end of the period covered and do not necessarily represent the views of Dreyfus or any other person in the Dreyfus organization. Any such views are subject to change at any time based upon market or other conditions and Dreyfus disclaims any responsibility to update such views.These views may not be relied on as investment advice and, because investment decisions for a Dreyfus fund are based on numerous factors, may not be relied on as an indication of trading intent on behalf of any Dreyfus fund.
|
| Not FDIC-Insured • Not Bank-Guaranteed • May Lose Value |
| | Contents |
| | THE FUND |
| 2 | A Letter from the President |
| 3 | Discussion of Fund Performance |
| 6 | Understanding Your Fund’s Expenses |
| 6 | Comparing Your Fund’s Expenses With Those of Other Funds |
| 7 | Statement of Investments |
| 12 | Statement of Assets and Liabilities |
| 13 | Statement of Operations |
| 14 | Statement of Changes in Net Assets |
| 16 | Financial Highlights |
| 20 | Notes to Financial Statements |
| | FOR MORE INFORMATION |
| | Back Cover |
Dreyfus
Emerging Markets Debt
Local Currency Fund
The Fund
A LETTER FROM THE PRESIDENT
Dear Shareholder:
We are pleased to present this semiannual report for Dreyfus Emerging Markets Debt Local Currency Fund, covering the six-month period from June 1, 2013, through November 30, 2013. For information about how the fund performed during the reporting period, as well as general market perspectives, we provide a Discussion of Fund Performance on the pages that follow.
The reporting period produced a relatively challenging environment for most fixed-income securities, as a gradually strengthening U.S. economy and expectations of a more moderately stimulative monetary policy drove longer term interest rates higher and bond prices lower. Municipal bonds proved particularly sensitive to these developments, as the negative effects of rising rates were exacerbated by selling pressure among investors seeking safer havens.
We currently expect U.S. economic conditions to continue to improve in 2014, with accelerating growth and credit conditions supported by the fading drags of tighter federal fiscal policies and downsizing on the state and local levels. Moreover, inflation is likely to remain muted, so monetary policy can remain stimulative. Globally, we anticipate stronger growth in developed countries due to past and continuing monetary ease, while emerging markets seem poised for more moderate economic expansion. For more information on how these observations may affect your investments, we encourage you to speak with your financial advisor.
Thank you for your continued confidence and support.

J. Charles Cardona
President
The Dreyfus Corporation
December 16, 2013
2
DISCUSSION OF FUND PERFORMANCE
For the period of June 1, 2013, through November 30, 2013, as provided by Alexander Kozhemiakin and Javier Murcio, Primary Portfolio Managers
Fund and Market Performance Overview
For the six-month period ended November 30, 2013, Dreyfus Emerging Markets Debt Local Currency Fund’s Class A shares produced a total return of –2.93%, Class C shares returned –3.29%, Class I shares returned –2.82%, and Class Y shares returned 1.20%.1 In comparison, the fund’s benchmark, the JPMorgan Government Bond Index – Emerging Markets Diversified (the “Index”), produced a –2.09% total return for the same period.2
Emerging-markets bonds and currencies encountered heightened volatility early in the reporting period amid economic and liquidity concerns. The fund lagged its benchmark due to overweighted exposure to Brazilian bonds and the effects of fees and expenses that are not reflected in the benchmark’s results.
The Fund’s Investment Approach
The fund seeks to maximize total return.To pursue its goal, the fund normally invests at least 80% of its assets in emerging market bonds and other debt instruments denominated in the local currency of issue, and in derivative instruments that provide investment exposure to such securities.
When choosing investments, we employ in-depth fundamental country analysis supported by the discipline of quantitative valuation models.A “top down” analysis of macroeconomics and financial and political variables guides country and currency allocations.We also consider technical market factors and the global risk environment. We seek to identify shifts in country fundamentals and consider the risk-adjusted attractiveness of currency and duration returns for each emerging market country.
Emerging Markets Encountered Heightened Volatility
The reporting period began in the midst of pronounced weakness in emerging debt and currency markets. Investors reacted negatively to remarks from Federal Reserve Board (the “Fed”) Chairman Ben Bernanke that U.S. monetary policymakers would begin backing away from their massive quantitative easing program sooner than
DISCUSSION OF FUND PERFORMANCE (continued)
expected. Bernanke’s unexpectedly hawkish comments sparked shifts in investment capital from the emerging markets to more developed nations, causing emerging-markets bond prices to fall and currency exchange rates to decline sharply against the U.S. dollar. In addition, concerns intensified regarding economic slowdowns in some markets, including China, India, and Brazil.Widening current account deficits and budget deficits in countries such as Indonesia, Turkey, and South Africa also weighed on investor sentiment.
Markets generally stabilized in July and rallied from August through October when the Fed refrained from tapering its quantitative easing program and some countries considered financial reforms to shore up their economies and attract investment capital. Local institutional investors took advantage of attractive valuations after the sell-off, and foreign investors soon followed their lead. However, investors proved highly selective, favoring countries with current account surpluses and balanced budgets. Investors also weighed the credibility of individual nations’ central banks, avoiding nations that do not appear to be handling inflationary pressures effectively.While the rally erased many of the emerging debt and currency markets’ earlier losses, it was not sufficient to push the Index into positive territory by the reporting period’s end.
Currency and Duration Strategies Buoyed Fund Results
The fund’s returns compared to its benchmark were undermined to a degree by overweighted exposure to Brazilian bonds, offsetting relative strength in other positions.
For example, our currency allocation strategy proved relatively successful. Over much of the reporting period, the fund benefited from overweighted exposure to the U.S. dollar, which helped to cushion the brunt of relative weakness in most other currencies.The fund also was helped by relatively heavy exposure to the Nigerian naira, which recently was added to the benchmark. Conversely, the fund largely avoided weakness in the Turkish lira and Indonesian rupiah, as current account and budget deficits weighed on investor sentiment in those markets.The fund also scored successes from tactical trades in the Czech koruna and Brazilian real, as well as from an underweighted position in the weak Indian rupee.We employed currency forward contracts to establish currency positions in some markets.
With the notable exception of Brazil, our strategies in emerging bond markets also generally fared better than market averages. Overweighted exposure to longer term
4
bonds in Russia and Nigeria helped the fund participate more fully in their relative strength, while underweighted positions in Indonesia and Turkey helped minimize participation in some of the weaker bond markets.
Finding Opportunities in Attractively Valued Markets
Although we expect heightened volatility to persist over the near term, we believe that some markets already have priced in more moderately accommodative monetary policies and higher interest rates in a recovering global economy. In our view, short-term volatility is likely to create opportunities for active currency and bond traders who recognize the significant structural and economic differences among various developing nations. As of the reporting period’s end, we have maintained overweighted exposure to the currencies of Nigeria, Poland, Russia, and Mexico, and to the bonds of Colombia and Russia.
December 16, 2013
Bond funds are subject generally to interest rate, credit, liquidity and market risks, to varying degrees, all of which are more fully described in the fund’s prospectus. Generally, all other factors being equal, bond prices are inversely related to interest-rate changes, and rate increases can cause price declines.
Foreign bonds are subject to special risks including exposure to currency fluctuations, changing political and economic conditions, and potentially less liquidity. Investments in foreign currencies are subject to the risk that those currencies will decline in value relative to the U.S. dollar. Foreign currencies are also subject to risks caused by inflation, interest rates, budget deficits and low savings rate, political factors and government control.The fixed income securities of issuers located in emerging markets can be more volatile and less liquid than those of issuers in more mature economies and emerging markets generally have less diverse and less mature economic structures and less stable political systems than those of developed countries.The securities of issuers located or doing substantial business in emerging markets are often subject to rapid and large changes in price.
The fund may use derivative instruments, such as options, futures and options on futures, forward contracts, swaps (including credit default swaps on corporate bonds and asset-backed securities), options on swaps and other credit derivatives. A small investment in derivatives could have a potentially large impact on the fund’s performance.
|
| 1 Total return includes reinvestment of dividends and any capital gains paid, and does not take into consideration the |
| maximum initial sales charge in the case of Class A shares, or the applicable contingent deferred sales charge imposed |
| on redemptions in the case of Class C shares. Had these charges been reflected, returns would have been lower. Past |
| performance is no guarantee of future results. Share price and investment return fluctuate such that upon redemption, |
| fund shares may be worth more or less than their original cost. ClassY shares returns are since inception 7/1/13. |
| 2 SOURCE: FACTSET — The JPMorgan Government Bond Index – Emerging Markets Diversified is a |
| comprehensive global local emerging markets index, and consists of regularly traded, liquid fixed-rate, domestic currency |
| government bonds.The Index does not include fund fees and expenses to which the fund is subject. Investors cannot |
| invest directly in any index. |
UNDERSTANDING YOUR FUND’S EXPENSES (Unaudited)
As a mutual fund investor, you pay ongoing expenses, such as management fees and other expenses. Using the information below, you can estimate how these expenses affect your investment and compare them with the expenses of other funds.You also may pay one-time transaction expenses, including sales charges (loads) and redemption fees, which are not shown in this section and would have resulted in higher total expenses. For more information, see your fund’s prospectus or talk to your financial adviser.
Review your fund’s expenses
The table below shows the expenses you would have paid on a $1,000 investment in Dreyfus Emerging Markets Debt Local Currency Fund from June 1, 2013 to November 30, 2013. It also shows how much a $1,000 investment would be worth at the close of the period, assuming actual returns and expenses.
Expenses and Value of a $1,000 Investment
assuming actual returns for the six months ended November 30, 2013 †
| | | | | | | | |
| | | Class A | | Class C | | Class I | | Class Y |
| Expenses paid per $1,000†† | $ | 6.27 | $ | 9.86 | $ | 5.19 | $ | 4.06 |
| Ending value (after expenses) | $ | 970.70 | $ | 967.10 | $ | 971.80 | $ | 1,012.00 |
COMPARING YOUR FUND’S EXPENSES
WITH THOSE OF OTHER FUNDS (Unaudited)
Using the SEC’s method to compare expenses
The Securities and Exchange Commission (SEC) has established guidelines to help investors assess fund expenses. Per these guidelines, the table below shows your fund’s expenses based on a $1,000 investment, assuming a hypothetical 5% annualized return. You can use this information to compare the ongoing expenses (but not transaction expenses or total cost) of investing in the fund with those of other funds.All mutual fund shareholder reports will provide this information to help you make this comparison. Please note that you cannot use this information to estimate your actual ending account balance and expenses paid during the period.
Expenses and Value of a $1,000 Investment
assuming a hypothetical 5% annualized return for the six months ended November 30, 2013
| | | | | | | | |
| | | Class A | | Class C | | Class I | | Class Y |
| Expenses paid per $1,000†††† | $ | 6.43 | $ | 10.10 | $ | 5.32 | $ | 4.91 |
| Ending value (after expenses) | $ | 1,018.70 | $ | 1,015.04 | $ | 1,019.80 | $ | 1,020.21 |
| |
| † | From July 1, 2013 (commencement of initial offering) to November 30, 2013 for ClassY shares. |
| †† | Expenses are equal to the fund’s annualized expense ratio of 1.27% for Class A, 2.00% for Class C and 1.05% |
| | for Class I, multiplied by the average account value over the period, multiplied by 183/365 (to reflect the one-half |
| | year period). Expenses are equal to the fund’s annualized expense ratio of .97% for ClassY, multiplied by the |
| | average account value over the period, multiplied by 152/365 (to reflect the actual days in the period). |
| ††† | Please note that while ClassY shares commenced operations on July 1, 2013, the hypothetical expenses paid |
| | during the period reflect projected activity for the full six month period for purposes of comparability.This projection |
| | assumes that annualized expense ratios were in effect during the period June 1, 2013 to November 30, 2013. |
| †††† | Expenses are equal to the fund’s annualized expense ratio of 1.27% for Class A, 2.00% for Class C, 1.05% for |
| | Class I and .97% for ClassY, multiplied by the average account value over the period, multiplied by 183/365 (to |
| | reflect the one-half year period). |
6
|
| STATEMENT OF INVESTMENTS |
| November 30, 2013 (Unaudited) |
| | | | | | |
| | | Coupon | Maturity | Principal | | |
| Bonds and Notes—86.3% | | Rate (%) | Date | Amount ($)a | Value ($) |
| Foreign/Governmental | | | | | | |
| AHML Finance, | | | | | | |
| Unscd. Notes | RUB | 7.75 | 2/13/18 | 332,200,000 | b | 9,861,298 |
| AHML Finance, | | | | | | |
| Unscd. Notes | RUB | 7.75 | 2/13/18 | 2,283,500,000 | | 67,785,294 |
| Brazil Notas do | | | | | | |
| Tesouro Nacional, | | | | | | |
| Notes, Ser. B | BRL | 6.00 | 8/15/22 | 148,980,000 | c | 148,300,790 |
| Brazil Notas do | | | | | | |
| Tesouro Nacional, | | | | | | |
| Notes, Ser. F | BRL | 10.00 | 1/1/23 | 126,720,000 | | 48,743,594 |
| Colombian Government, | | | | | | |
| Sr. Unscd. Bonds | COP | 4.38 | 3/21/23 | 23,613,000,000 | | 10,920,401 |
| Colombian Government, | | | | | | |
| Bonds, Ser. B | COP | 6.00 | 4/28/28 | 32,259,500,000 | | 14,997,662 |
| Colombian Government, | | | | | | |
| Bonds, Ser. B | COP | 7.00 | 5/4/22 | 114,825,700,000 | | 59,689,157 |
| Colombian Government, | | | | | | |
| Sr. Unscd. Bonds | COP | 9.85 | 6/28/27 | 50,232,000,000 | | 32,757,400 |
| Eskom Holdings, | | | | | | |
| Sr. Scd. Bonds | ZAR | 0.00 | 12/31/18 | 373,600,000 | d | 23,162,778 |
| Hungarian Government, | | | | | | |
| Bonds, Ser. 23/A | HUF | 6.00 | 11/24/23 | 19,283,620,000 | | 86,654,079 |
| Hungarian Government, | | | | | | |
| Bonds, Ser. 22/A | HUF | 7.00 | 6/24/22 | 3,410,220,000 | | 16,347,233 |
| Hungarian Government, | | | | | | |
| Bonds, Ser. 20/A | HUF | 7.50 | 11/12/20 | 2,672,330,000 | | 13,308,507 |
| Malaysian Government, | | | | | | |
| Sr. Unscd. Bonds, | | | | | | |
| Ser. 0312 | MYR | 3.20 | 10/15/15 | 25,800,000 | | 8,027,706 |
| Malaysian Government, | | | | | | |
| Sr. Unscd. Bonds, | | | | | | |
| Ser. 0213 | MYR | 3.26 | 3/1/18 | 22,225,000 | | 6,800,360 |
| Malaysian Government, | | | | | | |
| Sr. Unscd. Bonds, | | | | | | |
| Ser. 0512 | MYR | 3.31 | 10/31/17 | 47,000,000 | | 14,457,465 |
| Malaysian Government, | | | | | | |
| Sr. Unscd. Bonds, | | | | | | |
| Ser. 0112 | MYR | 3.42 | 8/15/22 | 27,920,000 | | 8,156,287 |
STATEMENT OF INVESTMENTS (Unaudited) (continued)
| | | | | | |
| | | Coupon | Maturity | Principal | | |
| Bonds and Notes (continued) | Rate (%) | Date | Amount ($)a | | Value ($) |
| Foreign/Governmental | | | | | | |
| (continued) | | | | | | |
| Malaysian Government, | | | | | | |
| Sr. Unscd. Bonds, | | | | | | |
| Ser. 0211 | MYR | 3.43 | 8/15/14 | 130,440,000 | | 40,591,609 |
| Malaysian Government, | | | | | | |
| Sr. Unscd. Bonds, | | | | | | |
| Ser. 0110 | MYR | 3.84 | 8/12/15 | 96,170,000 | | 30,207,913 |
| Malaysian Government, | | | | | | |
| Sr. Unscd. Bonds, | | | | | | |
| Ser. 0212 | MYR | 3.89 | 3/15/27 | 40,000,000 | | 11,911,908 |
| Malaysian Government, | | | | | | |
| Sr. Unscd. Bonds, | | | | | | |
| Ser. 1/06 | MYR | 4.26 | 9/15/16 | 320,760,000 | | 102,223,814 |
| Mexican Government, | | | | | | |
| Bonds, Ser. S | MXN | 4.00 | 11/15/40 | 51,547,000 | | 20,359,772 |
| Mexican Government, | | | | | | |
| Bonds, Ser. M | MXN | 7.75 | 5/29/31 | 390,745,000 | | 31,150,788 |
| Mexican Government, | | | | | | |
| Bonds, Ser. M 30 | MXN | 8.50 | 11/18/38 | 242,175,000 | | 20,393,603 |
| Mexican Government, | | | | | | |
| Bonds, Ser. M 30 | MXN | 10.00 | 11/20/36 | 316,790,000 | | 30,547,571 |
| Nigerian Government, | | | | | | |
| Treasury Bills, Ser. OMO | NGN | 0.00 | 2/27/14 | 1,408,400,000 | d | 8,643,371 |
| Nigerian Government, | | | | | | |
| Bonds, Ser. 5YR | NGN | 4.00 | 4/23/15 | 7,050,000,000 | | 39,723,011 |
| Nigerian Government, | | | | | | |
| Bonds, Ser. 5YR | NGN | 15.10 | 4/27/17 | 6,355,560,000 | | 42,763,610 |
| Nigerian Government, | | | | | | |
| Bonds, Ser. 7 | NGN | 16.00 | 6/29/19 | 7,825,155,000 | | 55,862,912 |
| Nigerian Government, | | | | | | |
| Bonds, Ser. 10YR | NGN | 16.39 | 1/27/22 | 9,816,405,000 | | 73,418,529 |
| Peruvian Government, | | | | | | |
| Gtd. Bonds | PEN | 6.90 | 8/12/37 | 112,420,000 | | 40,720,353 |
| Peruvian Government, | | | | | | |
| Gtd. Bonds | PEN | 6.95 | 8/12/31 | 179,000,000 | | 65,726,113 |
| Peruvian Government, | | | | | | |
| Bonds | PEN | 8.20 | 8/12/26 | 184,575,000 | | 79,243,540 |
| Petroleos Mexicanos, | | | | | | |
| Gtd. Notes | MXN | 7.65 | 11/24/21 | 118,000,000 | | 9,496,700 |
8
| | | | | | |
| | | Coupon | Maturity | Principal | | |
| Bonds and Notes (continued) | Rate (%) | Date | Amount ($)a | | Value ($) |
| Foreign/Governmental | | | | | | |
| (continued) | | | | | | |
| Petroleos Mexicanos, | | | | | | |
| Gtd. Notes | MXN | 7.65 | 11/24/21 | 875,700,000 | b | 70,476,782 |
| Philippine Government, | | | | | | |
| Sr. Unscd. Notes | PHP | 4.95 | 1/15/21 | 2,180,000,000 | | 52,290,120 |
| Philippine Government, | | | | | | |
| Sr. Unscd. Bonds | PHP | 6.25 | 1/14/36 | 538,000,000 | | 13,273,330 |
| Polish Government, | | | | | | |
| Bonds, Ser. 1023 | PLN | 4.00 | 10/25/23 | 61,800,000 | | 19,190,086 |
| Polish Government, | | | | | | |
| Bonds, Ser. 0416 | PLN | 5.00 | 4/25/16 | 48,000,000 | | 16,231,209 |
| Polish Government, | | | | | | |
| Bonds, Ser. 1017 | PLN | 5.25 | 10/25/17 | 79,000,000 | | 27,122,925 |
| Polish Government, | | | | | | |
| Bonds, Ser. 1020 | PLN | 5.25 | 10/25/20 | 63,565,000 | | 21,865,000 |
| Polish Government, | | | | | | |
| Bonds, Ser. 0922 | PLN | 5.75 | 9/23/22 | 112,270,000 | | 39,779,541 |
| Romanian | | | | | | |
| Government, | | | | | | |
| Bonds, Ser. 5Y | RON | 5.90 | 7/26/17 | 175,080,000 | | 56,389,228 |
| RusHydro, | | | | | | |
| Sr. Unscd. Notes | RUB | 7.88 | 10/28/15 | 1,098,900,000 | | 33,020,210 |
| Russian Agricultural Bank, | | | | | | |
| Sr. Unscd. Notes | RUB | 7.88 | 2/7/18 | 938,300,000 | | 27,387,665 |
| Russian Agricultural Bank, | | | | | | |
| Sr. Unscd. Notes | RUB | 8.63 | 2/17/17 | 1,697,700,000 | | 51,297,465 |
| Russian Agricultural Bank, | | | | | | |
| Sr. Unscd. Notes | RUB | 8.70 | 3/17/16 | 786,400,000 | | 23,772,429 |
| Russian Government, | | | | | | |
| Bonds, Ser. 6212 | RUB | 7.05 | 1/19/28 | 312,575,000 | | 8,744,537 |
| Russian Government, | | | | | | |
| Bonds, Ser. 6208 | RUB | 7.50 | 2/27/19 | 965,500,000 | | 29,608,880 |
| Russian Government, | | | | | | |
| Bonds, Ser. 6205 | RUB | 7.60 | 4/14/21 | 890,075,000 | | 27,188,419 |
| Russian Government, | | | | | | |
| Bonds, Ser. 6209 | RUB | 7.60 | 7/20/22 | 516,600,000 | | 15,678,868 |
| Russian Government, | | | | | | |
| Bonds, Ser. 6207 | RUB | 8.15 | 2/3/27 | 565,410,000 | | 17,450,242 |
STATEMENT OF INVESTMENTS (Unaudited) (continued)
| | | | | | |
| | | Coupon | Maturity | Principal | | |
| Bonds and Notes (continued) | Rate (%) | Date | Amount ($)a | Value ($) |
| Foreign/Governmental | | | | | | |
| (continued) | | | | | | |
| South African Government, | | | | | | |
| Bonds, Ser. R212 | ZAR | 2.75 | 1/31/22 | 126,250,000 | e | 16,206,712 |
| South African Government, | | | | | | |
| Sr. Unscd. Bonds, | | | | | | |
| Ser. R209 | ZAR | 6.25 | 3/31/36 | 317,445,000 | | 22,826,565 |
| South African Government, | | | | | | |
| Sr. Unscd. Bonds, | | | | | | |
| Ser. R208 | ZAR | 6.75 | 3/31/21 | 48,850,000 | | 4,535,176 |
| South African Government, | | | | | | |
| Bonds, Ser. R213 | ZAR | 7.00 | 2/28/31 | 399,685,000 | | 32,715,031 |
| South African Government, | | | | | | |
| Bonds, Ser. R207 | ZAR | 7.25 | 1/15/20 | 473,455,000 | | 45,794,866 |
| South African Government, | | | | | | |
| Bonds, Ser. 2023 | ZAR | 7.75 | 2/28/23 | 64,260,000 | | 6,209,352 |
| South African Government, | | | | | | |
| Bonds, Ser. R204 | ZAR | 8.00 | 12/21/18 | 185,305,000 | | 18,752,813 |
| South African Government, | | | | | | |
| Bonds, Ser. 2048 | ZAR | 8.75 | 2/28/48 | 42,000,000 | | 3,913,391 |
| South African Government, | | | | | | |
| Bonds, Ser. R186 | ZAR | 10.50 | 12/21/26 | 681,470,000 | | 78,423,246 |
| Transnet, | | | | | | |
| Sr. Unscd. Notes | ZAR | 9.50 | 5/13/21 | 153,620,000 | b | 14,755,481 |
| Turkish Government, | | | | | | |
| Bonds | TRY | 4.00 | 4/29/15 | 98,835,000 | f | 63,546,285 |
| Turkish Government, | | | | | | |
| Bonds | TRY | 7.10 | 3/8/23 | 41,110,000 | | 17,747,446 |
| Turkish Government, | | | | | | |
| Bonds | TRY | 9.00 | 1/27/16 | 81,540,000 | | 40,526,919 |
| Turkish Government, | | | | | | |
| Bonds | TRY | 10.00 | 6/17/15 | 57,500,000 | | 28,934,217 |
| Turkish Government, | | | | | | |
| Bonds | TRY | 11.00 | 8/6/14 | 76,100,000 | | 38,338,992 |
| Total Bonds and Notes | | | | | | |
| (cost $2,453,588,932) | | | | | | 2,256,948,556 |
| | | | |
| Short-Term Investments—.8% | | | |
| | U.S. Treasury Bills; | | | |
| | 0.03%, 1/2/14 | | | |
| | (cost $21,496,377) | 21,497,000 | g | 21,496,914 |
10
| | | |
| Other Investment—10.7% | Shares | | Value ($) |
| Registered Investment Company; | | | |
| Dreyfus Institutional Preferred | | | |
| Plus Money Market Fund | | | |
| (cost $279,414,562) | 279,414,562 | h | 279,414,562 |
| |
| Total Investments (cost $2,754,499,871) | 97.8 | % | 2,557,860,032 |
| Cash and Receivables (Net) | 2.2 | % | 58,339,751 |
| Net Assets | 100.0 | % | 2,616,199,783 |
|
| a Principal amount stated in U.S. Dollars unless otherwise noted. |
| BRL—Brazilian Real |
| COP—Colombian Peso |
| HUF—Hungarian Forint |
| MXN—Mexican New Peso |
| MYR—Malaysian Ringgit |
| NGN— Nigerian Naira |
| PEN—Peruvian New Sol |
| PHP—Philippine Peso |
| PLN—Polish Zloty |
| RON—Romanian Leu |
| RUB—Russian Ruble |
| TRY—Turkish Lira |
| ZAR—South African Rand |
| b Securities exempt from registration pursuant to Rule 144A under the Securities Act of 1933.These securities may be |
| resold in transactions exempt from registration, normally to qualified institutional buyers.At November 30, 2013, |
| these securities were valued at $95,093,561 or 3.6% of net assets. |
| c Principal amount for accrual purposes is periodically adjusted based on changes in the Brazilian Consumer Price Index. |
| d Security issued with a zero coupon. Income is recognized through the accretion of discount. |
| e Principal amount for accrual purposes is periodically adjusted based on changes in the South African Consumer |
| Price Index. |
| f Principal amount for accrual purposes is periodically adjusted based on changes in the Turkish Consumer Price Index. |
| g Held by a broker as collateral for open forward foreign currency exchange contracts. |
| h Investment in affiliated money market mutual fund. |
| | | |
| Portfolio Summary (Unaudited)† | | |
| |
| | Value (%) | | Value (%) |
| Russia | 11.9 | Peru | 7.1 |
| Short-Term/ | | Mexico | 7.0 |
| Money Market Investments | 11.5 | Poland | 4.8 |
| South Africa | 10.2 | Colombia | 4.5 |
| Malaysia | 8.5 | Hungary | 4.5 |
| Nigeria | 8.4 | Philippines | 2.5 |
| Brazil | 7.5 | Romania | 2.2 |
| Turkey | 7.2 | | 97.8 |
|
| † Based on net assets. |
| See notes to financial statements. |
|
| STATEMENT OF ASSETS AND LIABILITIES |
| November 30, 2013 (Unaudited) |
| | | | | |
| | | | Cost | Value | |
| Assets ($): | | | | | |
| Investments in securities—See Statement of Investments: | | | |
| Unaffiliated issuers | | | 2,475,085,309 2,278,445,470 | |
| Affiliated issuers | | | 279,414,562 | 279,414,562 | |
| Cash | | | | 2,025,893 | |
| Cash denominated in foreign currencies | | 15,913,252 | 15,676,941 | |
| Dividends and interest receivable | | | | 48,036,567 | |
| Unrealized appreciation on forward foreign | | | | |
| currency exchange contracts—Note 4 | | | 4,292,154 | |
| Receivable for investment securities sold | | | 1,624,377 | |
| Receivable for shares of Beneficial Interest subscribed | | 1,272,543 | |
| Prepaid expenses | | | | 143,761 | |
| | | | 2,630,932,268 | |
| Liabilities ($): | | | | | |
| Due to The Dreyfus Corporation and affiliates—Note 3(c) | | 3,615,206 | |
| Unrealized depreciation on swap agreements—Note 4 | | | 4,008,363 | |
| Unrealized depreciation on forward foreign | | | | |
| currency exchange contracts—Note 4 | | | 3,384,602 | |
| Payable for shares of Beneficial Interest redeemed | | | 2,241,037 | |
| Payable for investment securities purchased | | | 634,311 | |
| Accrued expenses | | | | 848,966 | |
| | | | | 14,732,485 | |
| Net Assets ($) | | | 2,616,199,783 | |
| Composition of Net Assets ($): | | | | | |
| Paid-in capital | | | 2,854,696,322 | |
| Accumulated undistributed investment income—net | | | 37,212,243 | |
| Accumulated net realized gain (loss) on investments | | | (75,390,092 | ) |
| Accumulated net unrealized appreciation (depreciation) on | | | |
| investments, swap transactions and foreign currency transactions | (200,318,690 | ) |
| Net Assets ($) | | | 2,616,199,783 | |
| |
| |
| Net Asset Value Per Share | | | | | |
| | Class A | Class C | Class I | Class Y | |
| Net Assets ($) | 63,867,400 | 19,766,768 | 2,457,372,112 | 75,193,503 | |
| Shares Outstanding | 4,582,823 | 1,440,055 | 176,085,837 | 5,383,317 | |
| Net Asset Value Per Share ($) | 13.94 | 13.73 | 13.96 | 13.97 | |
| |
| See notes to financial statements. | | | | | |
12
| | |
| STATEMENT OF OPERATIONS | | |
| Six Months Ended November 30, 2013 (Unaudited) | | |
| |
| |
| |
| |
| Investment Income ($): | | |
| Income: | | |
| Interest | 101,167,878 | |
| Dividends; | | |
| Affiliated issuers | 86,007 | |
| Total Income | 101,253,885 | |
| Expenses: | | |
| Management fee—Note 3(a) | 13,425,511 | |
| Shareholder servicing costs—Note 3(c) | 3,007,227 | |
| Custodian fees—Note 3(c) | 1,944,189 | |
| Prospectus and shareholders’ reports | 201,952 | |
| Trustees’ fees and expenses—Note 3(d) | 125,323 | |
| Distribution fees—Note 3(b) | 84,202 | |
| Registration fees | 45,145 | |
| Professional fees | 41,812 | |
| Loan commitment fees—Note 2 | 18,890 | |
| Interest expense—Note 2 | 1,847 | |
| Miscellaneous | 60,817 | |
| Total Expenses | 18,956,915 | |
| Less—reduction in fees due to earnings credits—Note 3(c) | (2,590 | ) |
| Net Expenses | 18,954,325 | |
| Investment Income—Net | 82,299,560 | |
| Realized and Unrealized Gain (Loss) on Investments—Note 4 ($): | | |
| Net realized gain (loss) on investments and foreign currency transactions | (141,958,061 | ) |
| Net realized gain (loss) on forward foreign currency exchange contracts | 34,258,773 | |
| Net Realized Gain (Loss) | (107,699,288 | ) |
| Net unrealized appreciation (depreciation) on | | |
| investments and foreign currency transactions | (85,623,726 | ) |
| Net unrealized appreciation (depreciation) on swap transactions | (2,438,443 | ) |
| Net unrealized appreciation (depreciation) on | | |
| forward foreign currency exchange contracts | 7,671,528 | |
| Net Unrealized Appreciation (Depreciation) | (80,390,641 | ) |
| Net Realized and Unrealized Gain (Loss) on Investments | (188,089,929 | ) |
| Net (Decrease) in Net Assets Resulting from Operations | (105,790,369 | ) |
| |
| See notes to financial statements. | | |
STATEMENT OF CHANGES IN NET ASSETS
| | | | |
| | Six Months Ended | | | |
| | November 30, 2013 | | Year Ended | |
| | (Unaudited)a | | May 31, 2013 | |
| Operations ($): | | | | |
| Investment income—net | 82,299,560 | | 144,295,349 | |
| Net realized gain (loss) on investments | (107,699,288 | ) | 100,773,064 | |
| Net unrealized appreciation | | | | |
| (depreciation) on investments | (80,390,641 | ) | 32,646,514 | |
| Net Increase (Decrease) in Net Assets | | | | |
| Resulting from Operations | (105,790,369 | ) | 277,714,927 | |
| Dividends to Shareholders from ($): | | | | |
| Investment income—net: | | | | |
| Class A | (1,078,242 | ) | (1,936,327 | ) |
| Class C | (269,125 | ) | (422,203 | ) |
| Class I | (61,750,355 | ) | (82,908,789 | ) |
| Class Y | (470,790 | ) | — | |
| Total Dividends | (63,568,512 | ) | (85,267,319 | ) |
| Beneficial Interest Transactions ($): | | | | |
| Net proceeds from shares sold: | | | | |
| Class A | 6,825,315 | | 44,956,693 | |
| Class C | 1,273,965 | | 10,135,628 | |
| Class I | 719,767,489 | | 1,932,479,050 | |
| Class Y | 76,877,756 | | — | |
| Dividends reinvested: | | | | |
| Class A | 870,228 | | 1,554,917 | |
| Class C | — | | 176,981 | |
| Class I | 21,173,379 | | 18,880,289 | |
| Class Y | 470,783 | | — | |
| Cost of shares redeemed: | | | | |
| Class A | (29,722,229 | ) | (41,981,442 | ) |
| Class C | (6,856,155 | ) | (10,173,846 | ) |
| Class I | (2,092,727,361 | ) | (947,073,528 | ) |
| Increase (Decrease) in Net Assets from | | | | |
| Beneficial Interest Transactions | (1,302,046,830 | ) | 1,008,954,742 | |
| Total Increase (Decrease) in Net Assets | (1,471,405,711 | ) | 1,201,402,350 | |
| Net Assets ($): | | | | |
| Beginning of Period | 4,087,605,494 | | 2,886,203,144 | |
| End of Period | 2,616,199,783 | | 4,087,605,494 | |
| Undistributed (distributions in excess of) | | | | |
| investment income—net | 37,212,243 | | (11,956,582 | ) |
14
| | | | |
| | Six Months Ended | | | |
| | November 30, 2013 | | Year Ended | |
| | (Unaudited)a | | May 31, 2013 | |
| Capital Share Transactions: | | | | |
| Class Ab | | | | |
| Shares sold | 486,211 | | 2,981,461 | |
| Shares issued for dividends reinvested | 62,458 | | 102,433 | |
| Shares redeemed | (2,095,616 | ) | (2,838,012 | ) |
| Net Increase (Decrease) in Shares Outstanding | (1,546,947 | ) | 245,882 | |
| Class Cb | | | | |
| Shares sold | 91,414 | | 679,141 | |
| Shares issued for dividends reinvested | — | | 11,805 | |
| Shares redeemed | (495,203 | ) | (697,358 | ) |
| Net Increase (Decrease) in Shares Outstanding | (403,789 | ) | (6,412 | ) |
| Class I | | | | |
| Shares sold | 51,095,772 | | 127,248,526 | |
| Shares issued for dividends reinvested | 1,517,492 | | 1,241,984 | |
| Shares redeemed | (148,488,361 | ) | (65,179,355 | ) |
| Net Increase (Decrease) in Shares Outstanding | (95,875,097 | ) | 63,311,155 | |
| Class Y | | | | |
| Shares sold | 5,349,881 | | — | |
| Shares issued for dividends reinvested | 33,436 | | — | |
| Net Increase (Decrease) in Shares Outstanding | 5,383,317 | | — | |
|
| a Effective July 1, 2013, the fund commenced offering ClassY shares. |
| b During the period ended May 31, 2013, 7,260 Class C shares representing $110,715 were exchanged for 7,152 |
| Class A shares. |
See notes to financial statements.
FINANCIAL HIGHLIGHTS
The following tables describe the performance for each share class for the fiscal periods indicated. All information (except portfolio turnover rate) reflects financial results for a single fund share.Total return shows how much your investment in the fund would have increased (or decreased) during each period, assuming you had reinvested all dividends and distributions.These figures have been derived from the fund’s financial statements.
| | | | | | | | | | | | |
| Six Months Ended | | | | | | | | | | | |
| November 30, 2013 | | | | Year Ended May 31, | | | |
| Class A Shares | (Unaudited) | | 2013 | | 2012 | | 2011 | | 2010 | | 2009 | a |
| Per Share Data ($): | | | | | | | | | | | | |
| Net asset value, | | | | | | | | | | | | |
| beginning of period | 14.57 | | 13.32 | | 15.22 | | 13.39 | | 12.11 | | 12.50 | |
| Investment Operations: | | | | | | | | | | | | |
| Investment income—netb | .31 | | .61 | | .67 | | .65 | | .55 | | .45 | |
| Net realized and unrealized | | | | | | | | | | | | |
| gain (loss) on investments | (.73 | ) | .98 | | (1.87 | ) | 1.61 | | .96 | | (.59 | ) |
| Total from Investment Operations | (.42 | ) | 1.59 | | (1.20 | ) | 2.26 | | 1.51 | | (.14 | ) |
| Distributions: | | | | | | | | | | | | |
| Dividends from | | | | | | | | | | | | |
| investment income—net | (.21 | ) | (.34 | ) | (.59 | ) | (.36 | ) | (.18 | ) | (.25 | ) |
| Dividends from net realized | | | | | | | | | | | | |
| gain on investments | — | | — | | (.11 | ) | (.07 | ) | (.05 | ) | — | |
| Total Distributions | (.21 | ) | (.34 | ) | (.70 | ) | (.43 | ) | (.23 | ) | (.25 | ) |
| Net asset value, end of period | 13.94 | | 14.57 | | 13.32 | | 15.22 | | 13.39 | | 12.11 | |
| Total Return (%)c | (2.93 | )d | 11.83 | | (8.12 | ) | 17.21 | | 12.56 | | (.95 | )d |
| Ratios/Supplemental Data (%): | | | | | | | | | | | | |
| Ratio of total expenses | | | | | | | | | | | | |
| to average net assets | 1.27 | e | 1.24 | | 1.22 | | 1.27 | | 1.50 | | 3.08 | e |
| Ratio of net expenses | | | | | | | | | | | | |
| to average net assets | 1.27 | e | 1.24 | | 1.22 | | 1.27 | | 1.32 | | 1.35 | e |
| Ratio of net investment income | | | | | | | | | | | | |
| to average net assets | 4.43 | e | 4.09 | | 4.64 | | 4.48 | | 4.22 | | 5.67 | e |
| Portfolio Turnover Rate | 31.87 | d | 58.82 | | 112.87 | | 97.99 | | 74.25 | | 108.46 | d |
| Net Assets, end of period | | | | | | | | | | | | |
| ($ x 1,000) | 63,867 | | 89,327 | | 78,351 | | 79,957 | | 38,428 | | 17,469 | |
| |
| a | From September 12, 2008 (commencement of operations) to May 31, 2009. |
| b | Based on average shares outstanding at each month end. |
| c | Exclusive of sales charge. |
| d | Not annualized. |
| e | Annualized. |
See notes to financial statements.
16
| | | | | | | | | | | | |
| Six Months Ended | | | | | | | | | | | |
| November 30, 2013 | | | | Year Ended May 31, | | | |
| Class C Shares | (Unaudited) | | 2013 | | 2012 | | 2011 | | 2010 | | 2009 | a |
| Per Share Data ($): | | | | | | | | | | | | |
| Net asset value, | | | | | | | | | | | | |
| beginning of period | 14.35 | | 13.14 | | 15.06 | | 13.29 | | 12.07 | | 12.50 | |
| Investment Operations: | | | | | | | | | | | | |
| Investment income—netb | .25 | | .48 | | .55 | | .53 | | .46 | | .39 | |
| Net realized and unrealized | | | | | | | | | | | | |
| gain (loss) on investments | (.71 | ) | .97 | | (1.85 | ) | 1.60 | | .95 | | (.59 | ) |
| Total from Investment Operations | (.46 | ) | 1.45 | | (1.30 | ) | 2.13 | | 1.41 | | (.20 | ) |
| Distributions: | | | | | | | | | | | | |
| Dividends from | | | | | | | | | | | | |
| investment income—net | (.16 | ) | (.24 | ) | (.51 | ) | (.29 | ) | (.14 | ) | (.23 | ) |
| Dividends from net realized | | | | | | | | | | | | |
| gain on investments | — | | — | | (.11 | ) | (.07 | ) | (.05 | ) | — | |
| Total Distributions | (.16 | ) | (.24 | ) | (.62 | ) | (.36 | ) | (.19 | ) | (.23 | ) |
| Net asset value, end of period | 13.73 | | 14.35 | | 13.14 | | 15.06 | | 13.29 | | 12.07 | |
| Total Return (%)c | (3.29 | )d | 10.98 | | (8.83 | ) | 16.28 | | 11.73 | | (1.49 | )d |
| Ratios/Supplemental Data (%): | | | | | | | | | | | | |
| Ratio of total expenses | | | | | | | | | | | | |
| to average net assets | 2.00 | e | 2.00 | | 1.96 | | 1.99 | | 2.27 | | 3.84 | e |
| Ratio of net expenses | | | | | | | | | | | | |
| to average net assets | 2.00 | e | 2.00 | | 1.96 | | 1.99 | | 2.09 | | 2.10 | e |
| Ratio of net investment income | | | | | | | | | | | | |
| to average net assets | 3.57 | e | 3.25 | | 3.84 | | 3.65 | | 3.53 | | 4.92 | e |
| Portfolio Turnover Rate | 31.87 | d | 58.82 | | 112.87 | | 97.99 | | 74.25 | | 108.46 | d |
| Net Assets, end of period | | | | | | | | | | | | |
| ($ x 1,000) | 19,767 | | 26,463 | | 24,306 | | 14,953 | | 1,888 | | 966 | |
| |
| a | From September 12, 2008 (commencement of operations) to May 31, 2009. |
| b | Based on average shares outstanding at each month end. |
| c | Exclusive of sales charge. |
| d | Not annualized. |
| e | Annualized. |
See notes to financial statements.
FINANCIAL HIGHLIGHTS (continued)
| | | | | | | | | | | | | |
| Six Months Ended | | | | | | | | | | | |
| November 30, 2013 | | | | | | Year Ended May 31, | | | |
| Class I Shares | (Unaudited) | | 2013 | | 2012 | | 2011 | | 2010 | | 2009 | a |
| Per Share Data ($): | | | | | | | | | | | | | |
| Net asset value, | | | | | | | | | | | | | |
| beginning of period | | 14.60 | | 13.34 | | 15.25 | | 13.42 | | 12.12 | | 12.50 | |
| Investment Operations: | | | | | | | | | | | | | |
| Investment income—netb | | .33 | | .65 | | .70 | | .69 | | .41 | | .47 | |
| Net realized and unrealized | | | | | | | | | | | | |
| gain (loss) on investments | (.73 | ) | .99 | | (1.88 | ) | 1.62 | | 1.14 | | (.59 | ) |
| Total from | | | | | | | | | | | | | |
| Investment Operations | | (.40 | ) | 1.64 | | (1.18 | ) | 2.31 | | 1.55 | | (.12 | ) |
| Distributions: | | | | | | | | | | | | | |
| Dividends from | | | | | | | | | | | | | |
| investment income—net | | (.24 | ) | (.38 | ) | (.62 | ) | (.41 | ) | (.20 | ) | (.26 | ) |
| Dividends from net realized | | | | | | | | | | | | |
| gain on investments | | — | | — | | (.11 | ) | (.07 | ) | (.05 | ) | — | |
| Total Distributions | | (.24 | ) | (.38 | ) | (.73 | ) | (.48 | ) | (.25 | ) | (.26 | ) |
| Net asset value, | | | | | | | | | | | | | |
| end of period | | 13.96 | | 14.60 | | 13.34 | | 15.25 | | 13.42 | | 12.12 | |
| Total Return (%) | | (2.82 | )c | 12.18 | | (7.94 | ) | 17.45 | | 12.94 | | (.79 | )c |
| Ratios/Supplemental | | | | | | | | | | | | | |
| Data (%): | | | | | | | | | | | | | |
| Ratio of total expenses | | | | | | | | | | | | | |
| to average net assets | | 1.05 | d | .94 | | .93 | | .97 | | 1.02 | | 2.84 | d |
| Ratio of net expenses | | | | | | | | | | | | | |
| to average net assets | | 1.05 | d | .94 | | .93 | | .97 | | 1.01 | | 1.10 | d |
| Ratio of net investment | | | | | | | | | | | | | |
| income to average | | | | | | | | | | | | | |
| net assets | | 4.61 | d | 4.35 | | 4.88 | | 4.73 | | 3.60 | | 5.92 | d |
| Portfolio Turnover Rate | | 31.87 | c | 58.82 | | 112.87 | | 97.99 | | 74.25 | | 108.46 | c |
| Net Assets, end of period | | | | | | | | | | | | | |
| ($ x 1,000) | 2,457,372 | | 3,971,815 | | 2,783,546 | | 2,304,400 | | 561,401 | | 970 | |
| |
| a | From September 12, 2008 (commencement of operations) to May 31, 2009. |
| b | Based on average shares outstanding at each month end. |
| c | Not annualized. |
| d | Annualized. |
See notes to financial statements.
18
| | |
| | Period Ended | |
| Class Y Shares | November 30, 2013 a | |
| Per Share Data ($): | | |
| Net asset value, beginning of period | 13.89 | |
| Investment Operations: | | |
| Investment income—netb | .19 | |
| Net realized and unrealized | | |
| gain (loss) on investments | (.02 | ) |
| Total from Investment Operations | .17 | |
| Distributions: | | |
| Dividends from investment income—net | (.09 | ) |
| Net asset value, end of period | 13.97 | |
| Total Return (%)c | 1.20 | |
| Ratios/Supplemental Data (%): | | |
| Ratio of total expenses to average net assetsd | .97 | |
| Ratio of net expenses to average net assetsd | .97 | |
| Ratio of net investment income | | |
| to average net assetsd | 4.28 | |
| Portfolio Turnover Ratec | 31.87 | |
| Net Assets, end of period ($ x 1,000) | 75,194 | |
| |
| a | From July 1, 2013 (commencement of initial offering) to November 30, 2013. |
| b | Based on average shares outstanding at each month end. |
| c | Not annualized. |
| d | Annualized. |
See notes to financial statements.
NOTES TO FINANCIAL STATEMENTS (Unaudited)
NOTE 1—Significant Accounting Policies:
Dreyfus Emerging Markets Debt Local Currency Fund (the “fund”) is a separate non-diversified series of The Dreyfus/Laurel Funds Trust (the “Trust”), which is registered under the Investment Company Act of 1940, as amended (the “Act”), as an open-end management investment company and operates as a series company offering five series, including the fund.The fund’s investment objective seeks to maximize total return. The Dreyfus Corporation (the “Manager” or “Dreyfus”), a wholly-owned subsidiary of The Bank of New York Mellon Corporation (“BNY Mellon”), serves as the fund’s investment adviser.
At a meeting held on April 24-25, 2013, the Trust’s Board of Trustees (the “Board”) approved, effective July 1, 2013 for the fund to offer Class Y shares.
MBSC Securities Corporation (the “Distributor”), a wholly-owned subsidiary of the Manager, is the distributor of the fund’s shares. The fund is authorized to issue an unlimited number of $.001 par value shares of Beneficial Interest in each of the following classes of shares: Class A, Class C, Class I and ClassY. Class A and Class C shares are sold primarily to retail investors through financial intermediaries and bear a Distribution and/or Shareholder Services Plan fees. Class A shares generally are subject to a sales charge imposed at the time of purchase. Class C shares are subject to a contingent deferred sales charge (“CDSC”) imposed on Class C shares redeemed within one year of purchase. Class I shares are sold primarily to bank trust departments and other financial service providers (including The Bank of NewYork Mellon, a subsidiary of BNY Mellon and an affiliate of Dreyfus, and its affiliates), acting on behalf of customers having a qualified trust or investment account or relationship at such institution, and bear no Distribution or Shareholder Services Plan fees. Class I shares are offered without a front-end sales charge or CDSC. Class Y shares are
20
offered at net asset value, generally to institutional investors. Other differences between the classes include the services offered to and the expenses borne by each class, the allocation of certain transfer agency costs and certain voting rights. Income, expenses (other than expenses attributable to a specific class), and realized and unrealized gains or losses on investments are allocated to each class of shares based on its relative net assets.
The Trust accounts separately for the assets, liabilities and operations of each series. Expenses directly attributable to each series are charged to that series’ operations; expenses which are applicable to all series are allocated among them on a pro rata basis.
The Financial Accounting Standards Board (“FASB”) Accounting Standards Codification is the exclusive reference of authoritative U.S. generally accepted accounting principles (“GAAP”) recognized by the FASB to be applied by nongovernmental entities. Rules and interpretive releases of the Securities and Exchange Commission (“SEC”) under authority of federal laws are also sources of authoritative GAAP for SEC registrants. The fund’s financial statements are prepared in accordance with GAAP, which may require the use of management estimates and assumptions.Actual results could differ from those estimates.
(a) Portfolio valuation: The fair value of a financial instrument is the amount that would be received to sell an asset or paid to transfer a liability in an orderly transaction between market participants at the measurement date (i.e., the exit price). GAAP establishes a fair value hierarchy that prioritizes the inputs of valuation techniques used to measure fair value. This hierarchy gives the highest priority to unadjusted quoted prices in active markets for identical assets or liabilities (Level 1 measurements) and the lowest priority to unobservable inputs (Level 3 measurements).
NOTES TO FINANCIAL STATEMENTS (Unaudited) (continued)
Additionally, GAAP provides guidance on determining whether the volume and activity in a market has decreased significantly and whether such a decrease in activity results in transactions that are not orderly. GAAP requires enhanced disclosures around valuation inputs and techniques used during annual and interim periods.
Various inputs are used in determining the value of the fund’s investments relating to fair value measurements.These inputs are summarized in the three broad levels listed below:
Level 1—unadjusted quoted prices in active markets for identical investments.
Level 2—other significant observable inputs (including quoted prices for similar investments, interest rates, prepayment speeds, credit risk, etc.).
Level 3—significant unobservable inputs (including the fund’s own assumptions in determining the fair value of investments).
The inputs or methodology used for valuing securities are not necessarily an indication of the risk associated with investing in those securities.
Changes in valuation techniques may result in transfers in or out of an assigned level within the disclosure hierarchy. Valuation techniques used to value the fund’s investments are as follows:
Registered investment companies that are not traded on an exchange are valued at their net asset value and are categorized within Level 1 of the fair value hierarchy.
Investments in securities, excluding short-term investments (other than U.S. Treasury Bills) and forward foreign currency exchange contracts (“forward contracts”) are valued each business day by an independent pricing service (the “Service”) approved by the Board. Investments for which quoted bid prices are readily available and are representative of the bid side of the market in the judgment of the Service are valued at the mean between the quoted bid prices (as obtained by the Service from dealers in such securities) and asked prices (as calculated by the
22
Service based upon its evaluation of the market for such securities). Other investments (which constitute a majority of the portfolio securities) are valued as determined by the Service, based on methods which include consideration of the following: yields or prices of securities of comparable quality, coupon, maturity and type; indications as to values from dealers; and general market conditions.These securities are generally categorized within Level 2 of the fair value hierarchy.
U.S. Treasury Bills are valued at the mean price between quoted bid prices and asked prices by the Service. These securities are generally categorized within Level 2 of the fair value hierarchy.
The Service’s procedures are reviewed by Dreyfus under the general supervision of the Board.
When market quotations or official closing prices are not readily available, or are determined not to reflect accurately fair value, such as when the value of a security has been significantly affected by events after the close of the exchange or market on which the security is principally traded (for example, a foreign exchange or market), but before the fund calculates its net asset value, the fund may value these investments at fair value as determined in accordance with the procedures approved by the Board. Certain factors may be considered when fair valuing investments such as: fundamental analytical data, the nature and duration of restrictions on disposition, an evaluation of the forces that influence the market in which the securities are purchased and sold, and public trading in similar securities of the issuer or comparable issuers. These securities are either categorized within Level 2 or 3 of the fair value hierarchy depending on the relevant inputs used.
For restricted securities where observable inputs are limited, assumptions about market activity and risk are used and are categorized within Level 3 of the fair value hierarchy.
Investments denominated in foreign currencies are translated to U.S. dollars at the prevailing rates of exchange.
NOTES TO FINANCIAL STATEMENTS (Unaudited) (continued)
Investments in swap transactions are valued each business day by the Service. Swaps are valued by the Service by using a swap pricing model which incorporates among other factors, default probabilities, recovery rates, credit curves of the underlying issuer and swap spreads on interest rates and are generally categorized within Level 2 of the fair value hierarchy. Forward contracts are valued at the forward rate and are generally categorized within Level 2 of the fair value hierarchy.
The following is a summary of the inputs used as of November 30, 2013 in valuing the fund’s investments:
| | | | | | |
| | | Level 2—Other | | Level 3— | | |
| | Level 1— | Significant | | Significant | | |
| Unadjusted | Observable | | Unobservable | | |
| | Quoted Prices | Inputs | | Inputs | Total | |
| Assets ($) | | | | | | |
| Investments in Securities: | | | | | |
| Foreign | | | | | | |
| Government | — | 2,256,948,556 | | — | 2,256,948,556 | |
| Mutual Funds | 279,414,562 | — | | — | 279,414,562 | |
| U.S. Treasury | — | 21,496,914 | | — | 21,496,914 | |
| Other Financial | | | | | | |
| Instruments: | | | | | | |
| Forward Foreign | | | | | | |
| Currency Exchange | | | | | |
| Contracts† | — | 4,292,154 | | — | 4,292,154 | |
| Liabilities ($) | | | | | | |
| Other Financial | | | | | | |
| Instruments: | | | | | | |
| Forward Foreign | | | | | | |
| Currency Exchange | | | | | |
| Contracts† | — | (3,384,602 | ) | — | (3,384,602 | ) |
| Swaps† | — | (4,008,363 | ) | — | (4,008,363 | ) |
| |
| † | Amount shown represents unrealized appreciation (depreciation) at period end. |
At November 30, 2013, there were no transfers between Level 1 and Level 2 of the fair value hierarchy.
(b) Foreign currency transactions: The fund does not isolate that portion of the results of operations resulting from changes in foreign exchange rates on investments from the fluctuations arising from changes
24
in the market prices of securities held. Such fluctuations are included with the net realized and unrealized gain or loss on investments.
Net realized foreign exchange gains or losses arise from sales of foreign currencies, currency gains or losses realized on securities transactions between trade and settlement date, and the difference between the amounts of dividends, interest and foreign withholding taxes recorded on the fund’s books and the U.S. dollar equivalent of the amounts actually received or paid. Net unrealized foreign exchange gains and losses arise from changes in the value of assets and liabilities other than investments resulting from changes in exchange rates. Foreign currency gains and losses on foreign currency transactions are also included with net realized and unrealized gain or loss on investments.
(c) Securities transactions and investment income: Securities transactions are recorded on a trade date basis. Realized gains and losses from securities transactions are recorded on the identified cost basis. Dividend income is recognized on the ex-dividend date and interest income, including, where applicable, accretion of discount and amortization of premium on investments, is recognized on the accrual basis.
(d) Affiliated issuers: Investments in other investment companies advised by Dreyfus are defined as “affiliated” under the Act. Investments in affiliated investment companies during the period ended November 30, 2013 were as follows:
| | | | | |
| Affiliated | | | | | |
| Investment | Value | | Value | | Net |
| Company | 5/31/2013 ($) | Purchases ($) | Sales ($) | 11/30/2013 ($) | Assets (%) |
| Dreyfus | | | | | |
| Institutional | | | | | |
| Preferred | | | | | |
| Plus Money | | | | | |
| Market | | | | | |
| Fund | 272,304,675 | 1,774,750,203 | 1,767,640,316 | 279,414,562 | 10.7 |
(e) Risk: The fund invests primarily in debt securities. Failure of an issuer of the debt securities to make timely interest or principal payments, or a decline or the perception of a decline in the credit quality
NOTES TO FINANCIAL STATEMENTS (Unaudited) (continued)
of a debt security, can cause the debt security’s price to fall, potentially lowering the fund’s share price. In addition, the value of debt securities may decline due to general market conditions that are not specifically related to a particular issuer, such as real or perceived adverse economic conditions, changes in outlook for corporate earnings, changes in interest or currency rates or adverse investor sentiment.They may also decline because of factors that affect a particular industry or country.
Investing in foreign markets may involve special risks and considerations not typically associated with investing in the U.S. These risks include revaluation of currencies, high rates of inflation, repatriation restrictions on income and capital, and adverse political and economic developments. Moreover, securities issued in these markets may be less liquid, subject to government ownership controls and delayed settlements, and their prices may be more volatile than those of comparable securities in the U.S.
(f) Dividends to shareholders: Dividends are recorded on the ex-dividend date. Dividends from investment income-net are normally declared and paid quarterly. Dividends from net realized capital gains, if any, are normally declared and paid annually, but the fund may make distributions on a more frequent basis to comply with the distribution requirements of the Internal Revenue Code of 1986, as amended (the “Code”).To the extent that net realized capital gains can be offset by capital loss carryovers, it is the policy of the fund not to distribute such gains. Income and capital gain distributions are determined in accordance with income tax regulations, which may differ from GAAP.
(g) Federal income taxes: It is the policy of the fund to continue to qualify as a regulated investment company, if such qualification is in the best interests of its shareholders, by complying with the applicable provisions of the Code, and to make distributions of taxable income sufficient to relieve it from substantially all federal income and excise taxes.
As of and during the period ended November 30, 2013, the fund did not have any liabilities for any uncertain tax positions.The fund recognizes
26
interest and penalties, if any, related to uncertain tax positions as income tax expense in the Statement of Operations. During the period ended November 30, 2013, the fund did not incur any interest or penalties.
Each tax year in the three-year period ended May 31, 2013 remains subject to examination by the Internal Revenue Service and state taxing authorities.
The tax character of distributions paid to shareholders during the fiscal year ended May 31, 2013 was as follows: ordinary income $85,267,319. The tax character of current year distributions will be determined at the end of the current fiscal year.
NOTE 2—Bank Lines of Credit:
The fund participates with other Dreyfus-managed funds in a $265 million unsecured credit facility led by Citibank, N.A. and a $300 million unsecured credit facility provided by The Bank of New York Mellon (each, a “Facility”), each to be utilized primarily for temporary or emergency purposes, including the financing of redemptions. Prior to October 9, 2013, the unsecured credit facility with Citibank, N.A. was $210 million. In connection therewith, the fund has agreed to pay its pro rata portion of commitment fees for each Facility. Interest is charged to the fund based on rates determined pursuant to the terms of the respective Facility at the time of borrowing.
The average amount of borrowings outstanding under the Facilities during the period ended November 30, 2013 was approximately $333,300 with a related weighted average annualized interest rate of 1.11%.
NOTE 3—Management Fee and Other Transactions With Affiliates:
(a) Pursuant to a management agreement between the Manager and the fund, the fund has agreed to pay the Manager a management fee computed at the annual rate of .75% of the value of the fund’s average daily net assets and is payable monthly.
NOTES TO FINANCIAL STATEMENTS (Unaudited) (continued)
During the period ended November 30, 2013, the Distributor retained $281 from commissions earned on sales of the fund’s Class A shares and $20,045 from CDSCs on redemptions of the fund’s Class C shares.
(b) Under the Distribution Plan adopted pursuant to Rule 12b-1 under the Act, Class C shares pay the Distributor for distributing its shares at an annual rate of .75% of the value of its average daily net assets. During the period ended November 30, 2013, Class C shares were charged $84,202 pursuant to the Distribution Plan.
(c) Under the Shareholder Services Plan, Class A and Class C shares pay the Distributor at an annual rate of .25% of the value of their average daily net assets for the provision of certain services.The services provided may include personal services relating to shareholder accounts, such as answering shareholder inquiries regarding the fund and providing reports and other information, and services related to the maintenance of shareholder accounts.The Distributor may make payments to Service Agents (securities dealers, financial institutions or other industry professionals) with respect to these services. The Distributor determines the amounts to be paid to Service Agents. During the period ended November 30, 2013, Class A and Class C shares were charged $89,160 and $28,067, respectively, pursuant to the Shareholder Services Plan.
Under its terms, the Distribution Plan and Shareholder Services Plan shall remain in effect from year to year, provided such continuance is approved annually by a vote of a majority of those Trustees who are not “interested persons” of the Trust and who have no direct or indirect financial interest in the operation of or in any agreement related to the Distribution Plan or Shareholder Services Plan.
The fund has arrangements with the transfer agent and the custodian whereby the fund may receive earnings credits when positive cash balances are maintained, which are used to offset transfer agency and custody fees. For financial reporting purposes, the fund includes net earnings credits as an expense offset in the Statement of Operations.
28
The fund compensates DreyfusTransfer, Inc., a wholly-owned subsidiary of the Manager, under a transfer agency agreement for providing transfer agency and cash management services for the fund.The majority of transfer agency fees are comprised of amounts paid on a per account basis, while cash management fees are related to fund subscriptions and redemptions. During the period ended November 30, 2013, the fund was charged $626,253 for transfer agency services and $42,554 for cash management services. These fees are included in Shareholder servicing costs in the Statement of Operations. Cash management fees were partially offset by earnings credits of $2,588.
The fund compensates The Bank of NewYork Mellon under a custody agreement for providing custodial services for the fund. These fees are determined based on net assets, geographic region and transaction activity. During the period ended November 30, 2013, the fund was charged $1,944,189 pursuant to the custody agreement.
The fund compensated The Bank of New York Mellon under a cash management agreement that was in effect until September 30, 2013 for performing certain cash management services related to fund subscriptions and redemptions. During the period ended November 30, 2013, the fund was charged $11,440 pursuant to the cash management agreement, which is included in Shareholder servicing costs in the Statement of Operations.These fees were partially offset by earnings credits of $2.
During the period ended November 30, 2013, the fund was charged $4,571 for services performed by the Chief Compliance Officer and his staff.
The components of “Due to The Dreyfus Corporation and affiliates” in the Statement of Assets and Liabilities consist of: management fees $1,641,427, Distribution Plan fees $12,515, Shareholder Services Plan fees $17,687, custodian fees $1,627,155, Chief Compliance Officer fees $3,833 and transfer agency fees $312,589.
NOTES TO FINANCIAL STATEMENTS (Unaudited) (continued)
(d) Each Board member also serves as a Board member of other funds within the Dreyfus complex. Annual retainer fees and attendance fees are allocated to each fund based on net assets.
(e) A 2% redemption fee is charged and retained by the fund on certain shares redeemed within sixty days following the date of issuance, subject to exceptions, including redemptions made through use of the fund’s exchange privilege. During the period ended November 30, 2013, redemption fees charged and retained by the fund amounted to $130,390.
NOTE 4—Securities Transactions:
The aggregate amount of purchases and sales of investment securities, excluding short-term securities, forward contracts and swap transactions, during the period ended November 30, 2013, amounted to $1,009,392,166 and $2,048,915,119, respectively.
Derivatives: A derivative is a financial instrument whose performance is derived from the performance of another asset. Each type of derivative instrument that was held by the fund during the period ended November 30, 2013 is discussed below.
Forward Foreign Currency Exchange Contracts: The fund enters into forward contracts in order to hedge its exposure to changes in foreign currency exchange rates on its foreign portfolio holdings, to settle foreign currency transactions or as a part of its investment strategy.When executing forward contracts, the fund is obligated to buy or sell a foreign currency at a specified rate on a certain date in the future. With respect to sales of forward contracts, the fund incurs a loss if the value of the contract increases between the date the forward contract is opened and the date the forward contract is closed. The fund realizes a gain if the value of the contract decreases between those dates.With respect to purchases of forward contracts, the fund incurs a loss if the value of the contract decreases between the date the forward contract is opened and the date the forward contract is closed. The fund realizes a gain if the value of the contract increases between those dates. Any realized or unrealized gains or losses which occurred during the period are reflected
30
in the Statement of Operations.The fund is exposed to foreign currency risk as a result of changes in value of underlying financial instruments. The fund is also exposed to credit risk associated with counterparty nonperformance on these forward contracts, which is generally limited to the unrealized gain on each open contract.The following summarizes open forward contracts at November 30, 2013:
| | | | | | | |
| | | | Foreign | | | Unrealized | |
| Forward Foreign Currency | Currency | | | Appreciation | |
| Exchange Contracts | | | Amounts | Cost ($) | Value ($) (Depreciation) ($) | |
| Purchases: | | | | | | | |
| Brazilian Real, | | | | | | | |
| Expiring: | | | | | | | |
| 1/3/2014 a | | | 20,670,000 | 8,876,196 | 8,779,183 | (97,013 | ) |
| 1/3/2014 b | | | 30,830,000 | 13,146,561 | 13,094,446 | (52,115 | ) |
| 2/4/2014 b | | | 36,765,000 | 15,717,920 | 15,492,960 | (224,960 | ) |
| Chilean Peso, | | | | | | | |
| Expiring | | | | | | | |
| 1/31/2014 c | | 10,396,380,000 | 19,738,713 | 19,389,901 | (348,812 | ) |
| Colombian Peso, | | | | | | | |
| Expiring | | | | | | | |
| 12/13/2013 b | | 63,668,000,000 | 32,994,946 | 32,910,065 | (84,881 | ) |
| Euro, | | | | | | | |
| Expiring: | | | | | | | |
| 1/31/2014 c | | | 8,840,000 | 11,956,349 | 12,012,404 | 56,055 | |
| 1/31/2014 d | | | 25,125,000 | 34,006,688 | 34,141,589 | 134,901 | |
| Hungarian Forint, | | | | | | | |
| Expiring: | | | | | | | |
| 1/31/2014 e | | 6,269,665,000 | 28,253,436 | 28,158,394 | (95,042 | ) |
| 1/31/2014 f | | 6,789,320,000 | 30,675,101 | 30,492,274 | (182,827 | ) |
| 1/31/2014 g | | 8,894,860,000 | 40,168,262 | 39,948,700 | (219,562 | ) |
| Malaysian Ringgit, | | | | | | | |
| Expiring | | | | | | | |
| 1/30/2014 a | | | 67,895,000 | 21,302,397 | 20,982,511 | (319,886 | ) |
| Mexican New Peso, | | | | | | | |
| Expiring: | | | | | | | |
| 1/31/2014 b | | 230,025,000 | 17,545,766 | 17,445,141 | (100,625 | ) |
| 1/31/2014 e | | 884,285,000 | 67,445,009 | 67,064,347 | (380,662 | ) |
| 1/31/2014 f | | 570,690,000 | 43,536,538 | 43,281,241 | (255,297 | ) |
| Polish Zloty, | | | | | | | |
| Expiring: | | | | | | | |
| 1/31/2014 a | | | 56,980,000 | 18,277,465 | 18,347,235 | 69,770 | |
| 1/31/2014 c | | | 62,145,000 | 19,931,046 | 20,010,336 | 79,290 | |
| 1/31/2014 d | | | 58,020,000 | 18,614,052 | 18,682,110 | 68,058 | |
| 1/31/2014 e | | 179,940,000 | 57,741,552 | 57,939,655 | 198,103 | |
| 1/31/2014 f | | 101,035,000 | 32,394,975 | 32,532,695 | 137,720 | |
| 1/31/2014 h | | | 63,495,000 | 20,368,588 | 20,445,028 | 76,440 | |
NOTES TO FINANCIAL STATEMENTS (Unaudited) (continued)
| | | | | | | |
| | | | Foreign | | | Unrealized | |
| Forward Foreign Currency | Currency | | | Appreciation | |
| Exchange Contracts | | | Amounts | Cost ($) | Value ($) (Depreciation) ($) | |
| Purchases (continued): | | | | |
| Romanian Leu, | | | | | | | |
| Expiring: | | | | | | | |
| 12/13/2013 h | | | 42,000,000 | 12,755,916 | 12,871,719 | 115,803 | |
| 1/14/2014 f | | | 80,000,000 | 24,757,316 | 24,478,041 | (279,275 | ) |
| 1/28/2014 c | | | 50,000,000 | 15,435,567 | 15,287,949 | (147,618 | ) |
| 1/30/2014 c | | | 44,300,000 | 13,465,439 | 13,543,756 | 78,317 | |
| Russian Ruble, | | | | | | | |
| Expiring | | | | | | | |
| 1/31/2014 d | | 257,580,000 | 7,745,945 | 7,684,196 | (61,749 | ) |
| Thai Baht, | | | | | | | |
| Expiring | | | | | | | |
| 1/31/2014 c | | 511,705,000 | 16,066,091 | 15,886,871 | (179,220 | ) |
| Turkish Lira, | | | | | | | |
| Expiring | | | | | | | |
| 1/31/2014 f | | | 90,040,000 | 44,228,313 | 44,005,519 | (222,794 | ) |
| Sales: | | | | Proceeds ($) | | | |
| Chilean Peso, | | | | | | | |
| Expiring | | | | | | | |
| 1/31/2014 b | | 3,428,520,000 | 6,516,860 | 6,394,405 | 122,455 | |
| Colombian Peso, | | | | | | | |
| Expiring: | | | | | | | |
| 12/13/2013 a | | 93,239,135,000 | 49,407,379 | 48,195,420 | 1,211,959 | |
| 1/31/2014 b | | 5,000,000,000 | 2,577,984 | 2,572,827 | 5,157 | |
| 1/31/2014 c | | 90,152,100,000 | 46,713,353 | 46,389,153 | 324,200 | |
| Euro, | | | | | | | |
| Expiring: | | | | | | | |
| 12/13/2013 h | | | 9,470,000 | 12,784,500 | 12,867,965 | (83,465 | ) |
| 1/14/2014 f | | | 18,020,000 | 24,782,906 | 24,486,069 | 296,837 | |
| 1/28/2014 c | | | 11,260,000 | 15,501,079 | 15,300,784 | 200,295 | |
| Nigerian Naira, | | | | | | | |
| Expiring | | | | | | | |
| 2/21/2014 a | | 1,253,000,000 | 7,751,315 | 7,762,703 | (11,388 | ) |
| Peruvian New Sol, | | | | | | | |
| Expiring: | | | | | | | |
| 12/13/2013 a | | | 30,105,000 | 10,813,578 | 10,738,546 | 75,032 | |
| 1/31/2014 a | | | 14,770,000 | 5,222,772 | 5,232,023 | (9,251 | ) |
| 1/31/2014 d | | | 65,030,000 | 23,007,618 | 23,035,778 | (28,160 | ) |
| Philippine Peso, | | | | | | | |
| Expiring | | | | | | | |
| 1/30/2014 a | | 771,960,000 | 17,803,506 | 17,664,989 | 138,517 | |
| Russian Ruble, | | | | | | | |
| Expiring: | | | | | | | |
| 1/31/2014 c | | 409,590,000 | 12,285,243 | 12,218,999 | 66,244 | |
| 1/31/2014 e | | 571,560,000 | 17,143,371 | 17,050,931 | 92,440 | |
32
| | | | | | | |
| | | | Foreign | | | Unrealized | |
| Forward Foreign Currency | Currency | | | Appreciation | |
| Exchange Contracts | | | Amounts | Proceeds ($) | Value ($) (Depreciation) ($) | |
| Sales (continued): | | | | | | | |
| Thai Baht, | | | | | | | |
| Expiring | | | | | | | |
| 1/31/2014 f | | 1,811,425,000 | 56,909,362 | 56,239,192 | 670,170 | |
| South African Rand, | | | | | | | |
| Expiring | | | | | | | |
| 1/31/2014 d | | | 78,615,000 | 7,714,917 | 7,640,526 | 74,391 | |
| Gross Unrealized | | | | | | | |
| Appreciation | | | | | | 4,292,154 | |
| Gross Unrealized | | | | | | | |
| Depreciation | | | | | | (3,384,602 | ) |
| |
| Counterparties: |
| a | Citigroup |
| b | Morgan Stanley Capital Services |
| c | Barclays Bank |
| d | Deutsche Bank |
| e | Goldman Sachs International |
| f | JP Morgan Chase Bank |
| g | Royal Bank of Scotland |
| h | Credit Suisse |
Swap Transactions: The fund enters into swap agreements to exchange the interest rate on, or return generated by, one nominal instrument for the return generated by another nominal instrument. Swap agreements are privately negotiated in the over-the-counter (“OTC”) market or centrally cleared.The fund enters into these agreements to hedge certain market or interest rate risks, to manage the interest rate sensitivity (sometimes called duration) of fixed income securities, to provide a substitute for purchasing or selling particular securities or to increase potential returns.
For OTC swaps, the fund accrues for the interim payments on a daily basis, with the net amount recorded within unrealized appreciation (depreciation) on swap agreements in the Statement of Assets and Liabilities. Once the interim payments are settled in cash, the net
NOTES TO FINANCIAL STATEMENTS (Unaudited) (continued)
amount is recorded as a realized gain (loss) on swaps, in addition to realized gain (loss) recorded upon the termination of swap transactions in the Statement of Operations. Upfront payments made and/or received by the fund, are recorded as an asset and/or liability in the Statement of Assets and Liabilities and are recorded as a realized gain or loss ratably over the agreement’s term/event with the exception of forward starting interest rate swaps which are recorded as realized gains or losses on the termination date.
Fluctuations in the value of swap agreements are recorded for financial statement purposes as unrealized appreciation or depreciation on swap transactions.
Interest Rate Swaps: Interest rate swaps involve the exchange of commitments to pay and receive interest based on a notional principal amount.The fund may elect to pay a fixed rate and receive a floating rate, or receive a fixed rate and pay a floating rate on a notional principal amount. The net interest received or paid on interest rate swap agreements is included within realized gain (loss) on swap transactions in the Statement of Operations. Interest rate swap agreements are subject to general market risk, liquidity risk, counterparty risk and interest rate risk.
For OTC swaps, the fund’s maximum risk of loss from counterparty risk is the discounted value of the cash flows to be received from the coun-terparty over the agreement’s remaining life, to the extent that the amount is positive.This risk is mitigated by master netting arrangements (“MNA”) between the fund and the counterparty and the posting of collateral by the counterparty to the fund to cover the fund’s exposure to the counterparty.The following summarizes open interest rate swaps entered into by the fund at November 30, 2013:
| | | | | | |
| OTC—Interest Rate Swaps | | | | | |
| |
| Notional | Currency/ | | (Pay) Receive | | Unrealized | |
| Amount ($) | Floating Rate | Counterparty | Fixed Rate (%) | Expiration | (Depreciation) ($) | |
| |
| 396,200,000 | BRL—1 Year | Barclays | | | | |
| | LIBOR | Bank | 8.06 | 1/2/2015 | (4,008,363 | ) |
34
The following tables show the fund’s exposure to different types of market risk as it relates to the Statement of Assets and Liabilities and the Statement of Operations, respectively.
Fair value of derivative instruments as of November 30, 2013 is shown below:
| | | | |
| | Derivative | | Derivative | |
| | Assets ($) | | Liabilities ($) | |
| Foreign exchange risk1 | 4,292,154 | Foreign exchange risk2 | (3,384,602 | ) |
| | | Interest rate risk3 | (4,008,363 | ) |
| Gross fair value of | | | | |
| derivatives contracts | 4,292,154 | | (7,392,965 | ) |
| |
| Statement of Assets and Liabilities location: |
| 1 | Unrealized appreciation on forward foreign currency exchange contracts. |
| 2 | Unrealized depreciation on forward foreign currency exchange contracts. |
| 3 | Unrealized depreciation on swap agreements. |
The effect of derivative instruments in the Statement of Operations during the period ended November 30, 2013 is shown below:
| |
| | Amount of realized gain (loss) on derivatives recognized in income ($) |
| | Forward |
| Underlying risk | Contracts4 |
| Foreign exchange | 34,258,773 |
| | | | | |
| Change in unrealized appreciation (depreciation) on derivatives recognized in income ($) | |
| | Forward | Swap | | | |
| Underlying risk | Contracts5 | Transactions6 | | Total | |
| Interest rate | — | (2,438,443 | ) | (2,438,443 | ) |
| Foreign exchange | 7,671,528 | — | | 7,671,528 | |
| Total | 7,671,528 | (2,438,443 | ) | 5,233,085 | |
| |
| Statement of Operations location: |
| 4 | Net realized gain (loss) on forward foreign currency exchange contracts. |
| 5 | Net unrealized appreciation (depreciation) on forward foreign currency exchange contracts. |
| 6 | Net unrealized appreciation (depreciation) on swap transactions. |
In December 2011, with clarification in January 2013, FASB issued guidance that expands disclosure requirements with respect to the offsetting of certain assets and liabilities.The fund adopted these disclosure
NOTES TO FINANCIAL STATEMENTS (Unaudited) (continued)
provisions during the current reporting period. These disclosures are required for certain investments, including derivative financial instruments subject to MNA or similar agreements which are eligible for offsetting in the Statement of Assets and Liabilities and require the fund to disclose both gross and net information with respect to such investments. For financial reporting purposes, the fund does not offset derivative assets and derivative liabilities that are subject to MNA in the Statement of Assets and Liabilities.
At November 30, 2013, derivative assets and liabilities (by type) on a gross basis are as follows:
| | | |
| Derivative Financial Instruments: | Assets ($) | Liabilities ($) | |
| Forward contracts | 4,292,154 | (3,384,602 | ) |
| Swaps | — | (4,008,363 | ) |
| Total gross amount of derivative assets | | | |
| and liabilities in the Statement of | | | |
| Assets and Liabilities | 4,292,154 | (7,392,965 | ) |
| Derivatives not subject to MNA or | | | |
| similar agreements | 1,601,958 | (4,702,769 | ) |
| Total gross amount of assets and | | | |
| liabilities subject to MNA or | | | |
| similar agreements | 2,690,196 | (2,690,196 | ) |
The following tables present derivative assets and liabilities net of amounts available for offsetting under MNA and net of related collateral received or pledged, if any, as of November 30, 2013:
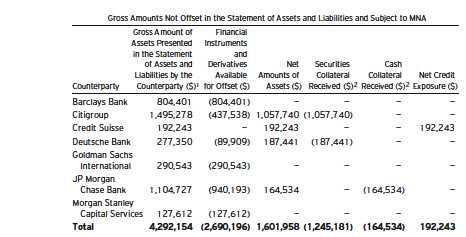
36
| | | | | | | | | |
| | Gross Amount of | | Financial | | | | | | |
| Liabilities Presented | | Instruments | | | | | | |
| | in the Statement | | and | | | | | | |
| | of Assets and | | Derivatives | Net | | Securities | Cash | | |
| | Liabilities by the | | Available Amounts of | | Collateral | Collateral | Net Credit | |
| Counterparty | Counterparty ($)1 | | for Offset ($) | Liabilities ($) | | Pledged ($)2 | Pledged ($)2 Exposure ($) | |
| Barclays Bank | (4,684,013 | ) | 804,401 | (3,879,612 | ) | 3,879,612 | — | — | |
| Citigroup | (437,538 | ) | 437,538 | — | | — | — | — | |
| Credit Suisse | (83,465 | ) | — | (83,465 | ) | — | — | (83,465 | ) |
| Deutsche Bank | (89,909 | ) | 89,909 | — | | — | — | — | |
| Goldman Sachs | | | | | | | | | |
| International | (475,704 | ) | 290,543 | (185,161 | ) | 185,161 | — | — | |
| JP Morgan | | | | | | | | | |
| Chase Bank | (940,193 | ) | 940,193 | — | | — | — | — | |
| Morgan Stanley | | | | | | | | | |
| Capital Services | (462,581 | ) | 127,612 | (334,969 | ) | — | — | (334,969 | ) |
| Royal Bank of | | | | | | | | | |
| Scotland | (219,562 | ) | — | (219,562 | ) | — | — | (219,562 | ) |
| Total | (7,392,965 | ) | 2,690,196 | (4,702,769 | ) | 4,064,773 | — | (637,996 | ) |
| |
| 1 | Absent a default event or early termination, over-the-counter derivative assets and liabilities are |
| | presented at gross amounts and are not offset in the Statement of Assets and Liabilities. |
| 2 | In some instances, the actual collateral received and/or pledged may be more than the amount |
| | shown due to overcollateralization. |
The following summarizes the average market value of derivatives outstanding during the period ended November 30, 2013:
| |
| | Average Market Value ($) |
| Forward contracts | 1,252,172,493 |
The following summarizes the average notional value of swap agreements outstanding during the period ended November 30, 2013:
| |
| | Average Notional Value ($) |
| Interest rate swap agreements | 175,375,536 |
At November 30, 2013, accumulated net unrealized depreciation on investments was $196,639,839, consisting of $18,207,636 gross unrealized appreciation and $214,847,475 gross unrealized depreciation.
At November 30, 2013, the cost of investments for federal income tax purposes was substantially the same as the cost for financial reporting purposes (see the Statement of Investments).
For More Information
Telephone Call your financial representative or 1-800-DREYFUS
Mail The Dreyfus Family of Funds, 144 Glenn Curtiss Boulevard, Uniondale, NY 11556-0144
The fund files its complete schedule of portfolio holdings with the Securities and Exchange Commission (“SEC”) for the first and third quarters of each fiscal year on Form N-Q. The fund’s Forms N-Q are available on the SEC’s website at http://www.sec.gov and may be reviewed and copied at the SEC’s Public Reference Room in Washington, DC. Information on the operation of the Public Reference Room may be obtained by calling 1-800-SEC-0330.
A description of the policies and procedures that the fund uses to determine how to vote proxies relating to portfolio securities, and information regarding how the fund voted these proxies for the most recent 12-month period ended June 30 is available at http://www.dreyfus.com and on the SEC’s website at http://www.sec.gov. The description of the policies and procedures is also available without charge, upon request, by calling 1-800-DREYFUS.

|
| Dreyfus |
| Equity Income Fund |
SEMIANNUAL REPORT November 30, 2013

Save time. Save paper. View your next shareholder report online as soon as it’s available. Log into www.dreyfus.com and sign up for Dreyfus eCommunications. It’s simple and only takes a few minutes.
The views expressed in this report reflect those of the portfolio manager only through the end of the period covered and do not necessarily represent the views of Dreyfus or any other person in the Dreyfus organization. Any such views are subject to change at any time based upon market or other conditions and Dreyfus disclaims any responsibility to update such views.These views may not be relied on as investment advice and, because investment decisions for a Dreyfus fund are based on numerous factors, may not be relied on as an indication of trading intent on behalf of any Dreyfus fund.
|
| Not FDIC-Insured • Not Bank-Guaranteed • May Lose Value |
| | Contents |
| | THE FUND |
| 2 | A Letter from the President |
| 3 | Discussion of Fund Performance |
| 6 | Understanding Your Fund’s Expenses |
| 6 | Comparing Your Fund’s Expenses With Those of Other Funds |
| 7 | Statement of Investments |
| 12 | Statement of Assets and Liabilities |
| 13 | Statement of Operations |
| 14 | Statement of Changes in Net Assets |
| 16 | Financial Highlights |
| 20 | Notes to Financial Statements |
| | FOR MORE INFORMATION |
| | Back Cover |
Dreyfus
Equity Income Fund
The Fund
A LETTER FROM THE PRESIDENT
Dear Shareholder:
We are pleased to present this semiannual report for Dreyfus Equity Income Fund, covering the six-month period from June 1, 2013, through November 30, 2013. For information about how the fund performed during the reporting period, as well as general market perspectives, we provide a Discussion of Fund Performance on the pages that follow.
Although expectations of higher long-term interest rates and a more moderately stimulative monetary policy sparked volatility in the U.S. stock market early in the reporting period, improved U.S. economic conditions subsequently drove stock prices higher. Even the 16-day U.S. government shutdown in October failed to derail the market’s advance, enabling some broad measures of stock market performance to reach new record highs by the reporting period’s end. Stocks across most capitalization ranges and investment styles produced strong results.
We currently expect U.S. economic conditions to continue to improve in 2014, with accelerating growth supported by the fading drags of tighter federal fiscal policies and downsizing on the state and local levels. Moreover, inflation is likely to remain muted, so monetary policy can remain stimulative. Globally, we anticipate stronger growth in many developed countries due to past and continuing monetary ease, while emerging markets seem poised for more moderate economic expansion. For more information on how these observations may affect your investments, we encourage you to speak with your financial advisor.
Thank you for your continued confidence and support.

J. Charles Cardona
President
The Dreyfus Corporation
December 16, 2013
2
DISCUSSION OF FUND PERFORMANCE
For the period of June 1, 2013, through November 30, 2013, as provided byWarren Chiang, C.Wesley Boggs, and Ronald Gala, Portfolio Managers
Fund and Market Performance Overview
For the six-month period ended November 30, 2013, Dreyfus Equity Income Fund’s Class A shares produced a total return of 9.50%, Class C shares returned 9.06%, and Class I shares returned 9.66%.1 In comparison, the fund’s benchmark, the Standard & Poor’s 500 Composite Stock Price Index (“S&P 500 Index”), provided a total return of 11.91% for the same period.2 The fund’s Class Y shares produced a total return of 10.47% for the period since its inception of July 1, 2013, through November 30, 2013.
U.S. stocks rallied over the reporting period in response to improving economic conditions and an aggressively accommodative monetary policy from the Federal Reserve Board (the “Fed”).The fund produced lower returns than the S&P 500 Index, mainly due to its focus on dividend-paying stocks at a time when more speculative, growth-oriented companies led the rally.
The Fund’s Investment Approach
The fund seeks total return consisting of capital appreciation and income.To pursue its goal, the fund invests primarily in equity securities, with a particular focus on dividend-paying stocks and other investments and investment techniques that provide income.When selecting securities, we use a computer model to identify and rank stocks within an industry or sector. Next, based on fundamental analysis, we generally select what we believe to be the most attractive of the higher ranked securities.We manage risk by diversifying the fund’s investments across companies and industries, seeking to limit the potential adverse impact of a decline in any one stock or industry.
Recovering Economy Fueled Market’s Gains
U.S. stocks had rallied strongly amid a sustained economic recovery in the months prior to the start of the reporting period, as domestic growth was supported by employment gains, rebounding housing markets, and greater manufacturing activity. Investors were particularly encouraged by a new, open-ended round of quantitative easing that was launched by the Fed during the fall of 2012.
DISCUSSION OF FUND PERFORMANCE (continued)
However, just days before the reporting period began, the Fed indicated that it would back away from its quantitative easing program sooner than most analysts had expected, sparking heightened stock market volatility in June. Equity markets generally stabilized over the summer, and stocks advanced strongly in the fall when the Fed unexpectedly refrained from tapering its bond purchasing program. Even a federal government shutdown in October failed to derail the rally, enabling the S&P 500 Index to reach new record highs by the reporting period’s end. Moreover, all 10 of the market sectors represented in the benchmark posted positive absolute returns for the reporting period.
The stock market rally was led during the reporting period by lower quality, growth-oriented companies. Although the well-established, dividend-paying stocks in which the fund primarily invests participated in the market’s advance, they generally lagged their more speculative counterparts.
Security Selection Strategy Produced Mixed Results
In this environment, the four primary factors considered by our quantitative investment process—valuations, earnings quality, behavioral characteristics, and dividend income—proved more effective in identifying individual winners in some market sectors than in others. For example, the fund encountered disappointments in the financials sector, where mortgage-backed securities investor Annaly Capital Management proved sensitive to rising long-term interest rates despite strong earnings and a dividend distribution rate of more than 10%. Likewise, results from the materials sector were undermined by metals producer Southern Copper, which was hurt by falling commodity prices. In the consumer discretionary sector, the fund did not own some of the market segment’s top performers, such as Internet retailer Amazon.com, which did not meet our valuation, earnings quality, or dividend income criteria.
On a more positive note, the fund achieved above-average returns in the industrials sector, which ranked among the market’s better performing segments.The fund’s results were bolstered by robust gains posted by physical and digital communications company Pitney Bowes, which received high scores on all four of our statistical models. Printing services provider R.R. Donnelley & Sons also fared well as it successfully transitioned from a focus on telephone directories to catalogs and other commercial printing.
4
Finding Income Opportunities in Certain Sectors
Despite richer equity valuations in some industry groups, our investment process has continued to identify dividend-paying companies with attractive valuations and high levels of earnings quality in several market sectors.We have continued to find an ample number of income-oriented opportunities in the utilities, telecommunications services, and consumer staples sectors, where dividend yields historically have been generous. Conversely, we have maintained underweighted exposure to the information technology sector, which contains a substantial number of high-growth companies that pay low or no dividends. While the fund ended the reporting period with an underweighted position in the financials sector, we may increase the fund’s exposure to large banks if their earnings continue to recover from the 2008 financial crisis and dividend payments resume.
December 16, 2013
Equity funds are subject generally to market, market sector, market liquidity, issuer and investment style risks, among other factors, to varying degrees, all of which are more fully described in the fund’s prospectus.
|
| 1 Total return includes reinvestment of dividends and any capital gains paid, and does not take into consideration the |
| maximum initial sales charge in the case of Class A shares, or the applicable contingent deferred sales charge imposed |
| on redemptions in the case of Class C shares. Had these charges been reflected, returns would have been lower. Past |
| performance is no guarantee of future results. Share price and investment return fluctuate such that upon redemption, |
| fund shares may be worth more or less than their original cost. Return figures provided reflect the absorption of certain |
| fund expenses by The Dreyfus Corporation pursuant to an undertaking in effect through October 1, 2014, at which |
| time it may be extended, terminated or modified. Had these expenses not been absorbed, the fund’s returns would |
| have been lower. |
| 2 SOURCE: LIPPER INC. — Reflects reinvestment of dividends and, where applicable, capital gain distributions. |
| The Standard & Poor’s 500 Composite Stock Price Index is a widely accepted, unmanaged index of U.S. stock |
| market performance. Investors cannot invest directly in any index. |
UNDERSTANDING YOUR FUND’S EXPENSES (Unaudited)
As a mutual fund investor, you pay ongoing expenses, such as management fees and other expenses. Using the information below, you can estimate how these expenses affect your investment and compare them with the expenses of other funds.You also may pay one-time transaction expenses, including sales charges (loads) and redemption fees, which are not shown in this section and would have resulted in higher total expenses. For more information, see your fund’s prospectus or talk to your financial adviser.
Review your fund’s expenses
The table below shows the expenses you would have paid on a $1,000 investment in Dreyfus Equity Income Fund from June 1, 2013 to November 30, 2013. It also shows how much a $1,000 investment would be worth at the close of the period, assuming actual returns and expenses.
Expenses and Value of a $1,000 Investment
assuming actual returns for the six months ended November 30, 2013 †
| | | | | | | | |
| | | Class A | | Class C | | Class I | | Class Y |
| Expenses paid per $1,000†† | $ | 5.83 | $ | 9.75 | $ | 4.52 | $ | 3.73 |
| Ending value (after expenses) | $ | 1,095.00 | $ | 1,090.60 | $ | 1,096.60 | $ | 1,104.70 |
COMPARING YOUR FUND’S EXPENSES
WITH THOSE OF OTHER FUNDS (Unaudited)
Using the SEC’s method to compare expenses
The Securities and Exchange Commission (SEC) has established guidelines to help investors assess fund expenses. Per these guidelines, the table below shows your fund’s expenses based on a $1,000 investment, assuming a hypothetical 5% annualized return. You can use this information to compare the ongoing expenses (but not transaction expenses or total cost) of investing in the fund with those of other funds.All mutual fund shareholder reports will provide this information to help you make this comparison. Please note that you cannot use this information to estimate your actual ending account balance and expenses paid during the period.
Expenses and Value of a $1,000 Investment
assuming a hypothetical 5% annualized return for the six months ended November 30, 2013
| | | | | | | | |
| | | Class A | | Class C | | Class I | | Class Y |
| Expenses paid per $1,000†††† | $ | 5.62 | $ | 9.40 | $ | 4.36 | $ | 4.31 |
| Ending value (after expenses) | $ | 1,019.50 | $ | 1,015.74 | $ | 1,020.76 | $ | 1,020.81 |
| |
| † | From July 1, 2013 (commencement of initial offering) to November 30, 2013 for ClassY shares. |
| †† | Expenses are equal to the fund’s annualized expense ratio of 1.11% for Class A, 1.86% for Class C and .86% for |
| | Class I, multiplied by the average account value over the period, multiplied by 183/365 (to reflect the one-half year |
| | period). Expenses are equal to the fund’s annualized expense ratio of .85% for Class Y, multiplied by the average |
| | account value over the period, multiplied by 152/365 (to reflect the actual days in the period). |
| ††† | Please note that while ClassY shares commenced operations on July 1, 2013, the hypothetical expenses paid during |
| | the period reflect projected activity for the full six month period for purposes of comparability.This projection assumes |
| | that annualized expense ratios were in effect during the period June 1, 2013 to November 30, 2013. |
| †††† Expenses are equal to the fund’s annualized expense ratio of 1.11% for Class A, 1.86% for Class C, .86% for |
| | Class I and .85% for Class Y, multiplied by the average account value over the period, multiplied by 183/365 (to |
| | reflect the one-half year period). |
6
|
| STATEMENT OF INVESTMENTS |
| November 30, 2013 (Unaudited) |
| | | |
| Common Stocks—98.9% | Shares | | Value ($) |
| Banks—2.4% | | | |
| Bank of Hawaii | 3,600 | | 212,940 |
| Commerce Bancshares | 5,665 | | 255,605 |
| New York Community Bancorp | 125,200 | | 2,068,304 |
| People’s United Financial | 20,760 | | 314,306 |
| Wells Fargo & Co. | 38,800 | | 1,707,976 |
| | | | 4,559,131 |
| Capital Goods—5.4% | | | |
| General Dynamics | 3,060 | | 280,480 |
| General Electric | 234,400 | | 6,249,104 |
| Lockheed Martin | 1,910 | | 270,590 |
| Northrop Grumman | 19,000 | | 2,140,920 |
| Raytheon | 12,920 | | 1,145,746 |
| | | | 10,086,840 |
| Commercial & Professional Services—7.2% | | | |
| Pitney Bowes | 290,415 | | 6,728,916 |
| R.R. Donnelley & Sons | 364,000 | | 6,734,000 |
| | | | 13,462,916 |
| Consumer Durables & Apparel—2.5% | | | |
| Garmin | 29,400 | | 1,427,664 |
| Hasbro | 34,010 | | 1,830,418 |
| Leggett & Platt | 20,300 | | 613,263 |
| Mattel | 16,020 | | 741,245 |
| | | | 4,612,590 |
| Consumer Services—3.1% | | | |
| H&R Block | 167,190 | | 4,662,929 |
| Starwood Hotels & Resorts Worldwide | 12,850 | a | 957,068 |
| Wynn Resorts | 1,100 | | 182,457 |
| | | | 5,802,454 |
| Diversified Financials—5.0% | | | |
| American Express | 8,070 | | 692,406 |
| Ares Capital | 197,500 | | 3,630,050 |
| JPMorgan Chase & Co. | 50,955 | | 2,915,645 |
| SLM | 83,600 | | 2,227,940 |
| | | | 9,466,041 |
STATEMENT OF INVESTMENTS (Unaudited) (continued)
| | |
| Common Stocks (continued) | Shares | Value ($) |
| Energy—7.5% | | |
| Chevron | 24,510 | 3,001,004 |
| ConocoPhillips | 44,415 | 3,233,412 |
| Exxon Mobil | 61,710 | 5,768,651 |
| Phillips 66 | 5,900 | 410,699 |
| RPC | 25,000 | 441,750 |
| Schlumberger | 8,450 | 747,149 |
| Valero Energy | 9,300 | 425,196 |
| | | 14,027,861 |
| Food & Staples Retailing—5.5% | | |
| CVS Caremark | 36,770 | 2,462,119 |
| Wal-Mart Stores | 74,990 | 6,074,940 |
| Walgreen | 28,440 | 1,683,648 |
| | | 10,220,707 |
| Food, Beverage & Tobacco—5.8% | | |
| Altria Group | 172,720 | 6,387,186 |
| Campbell Soup | 8,000 | 309,840 |
| ConAgra Foods | 13,830 | 456,252 |
| Dr. Pepper Snapple Group | 7,210 | 347,955 |
| Philip Morris International | 40,290 | 3,446,407 |
| | | 10,947,640 |
| Health Care Equipment & Services—1.6% | | |
| Abbott Laboratories | 23,980 | 915,796 |
| Humana | 2,120 | 220,459 |
| Medtronic | 19,350 | 1,109,142 |
| WellPoint | 7,200 | 668,736 |
| | | 2,914,133 |
| Household & Personal Products—.6% | | |
| Procter & Gamble | 12,450 | 1,048,539 |
| Insurance—1.5% | | |
| Cincinnati Financial | 4,300 | 225,363 |
| MetLife | 30,750 | 1,604,842 |
| Old Republic International | 40,900 | 703,480 |
| Prudential Financial | 4,105 | 364,360 |
| | | 2,898,045 |
| Materials—2.6% | | |
| Dow Chemical | 60,300 | 2,355,318 |
| Packaging Corporation of America | 30,400 | 1,862,304 |
8
| | | |
| Common Stocks (continued) | Shares | | Value ($) |
| Materials (continued) | | | |
| Southern Copper | 26,256 | | 659,026 |
| | | | 4,876,648 |
| Media—1.5% | | | |
| Gannett | 40,150 | | 1,086,459 |
| Regal Entertainment Group, Cl. A | 75,100 | | 1,462,948 |
| Viacom, Cl. B | 3,090 | | 247,725 |
| | | | 2,797,132 |
| Pharmaceuticals, Biotech & Life Sciences—11.0% | | | |
| AbbVie | 7,430 | | 359,983 |
| Bristol-Myers Squibb | 119,560 | | 6,142,993 |
| Eli Lilly & Co. | 87,770 | | 4,407,809 |
| Johnson & Johnson | 9,500 | | 899,270 |
| Merck & Co. | 45,110 | | 2,247,831 |
| Pfizer | 204,407 | | 6,485,834 |
| | | | 20,543,720 |
| Real Estate—4.9% | | | |
| Annaly Capital Management | 434,760 | a | 4,417,162 |
| CBL & Associates Properties | 30,850 | a | 557,151 |
| CommonWealth | 13,810 | a | 329,645 |
| Corrections Corporation of America | 29,800 | a | 993,830 |
| Hatteras Financial | 31,850 | a | 532,213 |
| HCP | 5,400 | a | 198,558 |
| Hospitality Properties Trust | 20,640 | a | 560,789 |
| Kimco Realty | 8,900 | a | 183,518 |
| Macerich | 7,400 | a | 421,356 |
| MFA Financial | 145,600 | a | 1,061,424 |
| | | | 9,255,646 |
| Retailing—1.9% | | | |
| American Eagle Outfitters | 17,650 | | 287,165 |
| Foot Locker | 12,950 | | 503,625 |
| Genuine Parts | 3,170 | | 262,603 |
| Home Depot | 27,840 | | 2,245,853 |
| Target | 5,500 | | 351,615 |
| | | | 3,650,861 |
| Semiconductors & Semiconductor Equipment—3.6% | | | |
| Intel | 207,745 | | 4,952,641 |
| Maxim Integrated Products | 23,005 | | 655,182 |
STATEMENT OF INVESTMENTS (Unaudited) (continued)
| | |
| Common Stocks (continued) | Shares | Value ($) |
| Semiconductors & Semiconductor | | |
| Equipment (continued) | | |
| Microchip Technology | 9,900 | 428,571 |
| Texas Instruments | 18,000 | 774,000 |
| | | 6,810,394 |
| Software & Services—5.9% | | |
| CA | 88,200 | 2,910,600 |
| International Business Machines | 5,040 | 905,587 |
| Microsoft | 159,585 | 6,084,976 |
| Oracle | 33,740 | 1,190,685 |
| | | 11,091,848 |
| Technology Hardware & Equipment—5.4% | | |
| Apple | 6,710 | 3,731,230 |
| Cisco Systems | 25,800 | 548,250 |
| Hewlett-Packard | 38,200 | 1,044,770 |
| Seagate Technology | 98,400 | 4,825,536 |
| | | 10,149,786 |
| Telecommunication Services—6.0% | | |
| AT&T | 145,160 | 5,111,084 |
| CenturyLink | 13,500 | 414,450 |
| Frontier Communications | 115,400 | 540,072 |
| Verizon Communications | 86,170 | 4,275,755 |
| Windstream Holdings | 101,550 | 819,508 |
| | | 11,160,869 |
| Transportation—1.9% | | |
| Union Pacific | 1,200 | 194,448 |
| United Parcel Service, Cl. B | 32,520 | 3,329,398 |
| | | 3,523,846 |
| Utilities—6.1% | | |
| Ameren | 32,210 | 1,154,728 |
| American Electric Power | 120,610 | 5,675,907 |
| Consolidated Edison | 6,240 | 344,510 |
| Duke Energy | 2,000 | 139,920 |
| Edison International | 7,500 | 346,575 |
| Pepco Holdings | 21,290 | 406,213 |
| Pinnacle West Capital | 22,950 | 1,224,612 |
| Public Service Enterprise Group | 10,560 | 345,206 |
10
| | | |
| Common Stocks (continued) | Shares | | Value ($) |
| Utilities (continued) | | | |
| Southern | 13,850 | | 562,726 |
| Wisconsin Energy | 28,950 | | 1,209,242 |
| | | | 11,409,639 |
| Total Common Stocks | | | |
| (cost $158,309,593) | | | 185,317,286 |
| |
| Other Investment—.7% | | | |
| Registered Investment Company; | | | |
| Dreyfus Institutional Preferred | | | |
| Plus Money Market Fund | | | |
| (cost $1,369,335) | 1,369,335 | b | 1,369,335 |
| |
| Total Investments (cost $159,678,928) | 99.6 | % | 186,686,621 |
| Cash and Receivables (Net) | .4 | % | 757,357 |
| Net Assets | 100.0 | % | 187,443,978 |
| |
| a | Investment in real estate investment trust. |
| b | Investment in affiliated money market mutual fund. |
| | | |
| Portfolio Summary (Unaudited)† | | |
| |
| | Value (%) | | Value (%) |
| Pharmaceuticals, Biotech & | | Semiconductors & Semiconductor | |
| Life Sciences | 11.0 | Equipment | 3.6 |
| Energy | 7.5 | Consumer Services | 3.1 |
| Commercial & Professional Services | 7.2 | Materials | 2.6 |
| Utilities | 6.1 | Consumer Durables & Apparel | 2.5 |
| Telecommunication Services | 6.0 | Banks | 2.4 |
| Software & Services | 5.9 | Retailing | 1.9 |
| Food, Beverage & Tobacco | 5.8 | Transportation | 1.9 |
| Food & Staples Retailing | 5.5 | Health Care Equipment & Services | 1.6 |
| Capital Goods | 5.4 | Insurance | 1.5 |
| Technology Hardware & | | Media | 1.5 |
| Equipment | 5.4 | Money Market Investment | .7 |
| Diversified Financials | 5.0 | Household & Personal Products | .6 |
| Real Estate | 4.9 | | 99.6 |
| |
| † Based on net assets. | | | |
| See notes to financial statements. | | | |
|
| STATEMENT OF ASSETS AND LIABILITIES |
| November 30, 2013 (Unaudited) |
| | | | |
| | | | Cost | Value |
| Assets ($): | | | | |
| Investments in securities—See Statement of Investments: | | |
| Unaffiliated issuers | | 158,309,593 185,317,286 |
| Affiliated issuers | | | 1,369,335 | 1,369,335 |
| Cash | | | | 835,638 |
| Dividends receivable | | | | 655,475 |
| Receivable for shares of Beneficial Interest subscribed | | | 183,873 |
| Prepaid expenses | | | | 40,386 |
| | | | 188,401,993 |
| Liabilities ($): | | | | |
| Due to The Dreyfus Corporation and affiliates—Note 3(c) | | | 183,551 |
| Payable for investment securities purchased | | | 712,750 |
| Payable for shares of Beneficial Interest redeemed | | | 6,031 |
| Accrued expenses | | | | 55,683 |
| | | | | 958,015 |
| Net Assets ($) | | | 187,443,978 |
| Composition of Net Assets ($): | | | | |
| Paid-in capital | | | 159,069,372 |
| Accumulated undistributed investment income—net | | | 578,066 |
| Accumulated net realized gain (loss) on investments | | | 788,847 |
| Accumulated net unrealized appreciation | | | |
| (depreciation) on investments | | | | 27,007,693 |
| Net Assets ($) | | | 187,443,978 |
| |
| |
| Net Asset Value Per Share | | | | |
| | Class A | Class C | Class I | Class Y |
| Net Assets ($) | 151,208,835 | 12,068,361 | 24,165,686 | 1,096 |
| Shares Outstanding | 9,074,142 | 732,288 | 1,445,263 | 65.531 |
| Net Asset Value Per Share ($) | 16.66 | 16.48 | 16.72 | 16.72 |
| See notes to financial statements. | | | | |
12
| | |
| STATEMENT OF OPERATIONS | | |
| Six Months Ended November 30, 2013 (Unaudited) | | |
| |
| |
| |
| |
| Investment Income ($): | | |
| Income: | | |
| Cash dividends: | | |
| Unaffiliated issuers | 3,013,722 | |
| Affiliated issuers | 540 | |
| Income from securities lending—Note 1(b) | 6,288 | |
| Total Income | 3,020,550 | |
| Expenses: | | |
| Management fee—Note 3(a) | 582,862 | |
| Shareholder servicing costs—Note 3(c) | 220,948 | |
| Custodian fees—Note 3(c) | 42,282 | |
| Registration fees | 41,857 | |
| Distribution fees—Note 3(b) | 37,449 | |
| Professional fees | 33,294 | |
| Prospectus and shareholders’ reports | 10,475 | |
| Trustees’ fees and expenses—Note 3(d) | 4,641 | |
| Loan commitment fees—Note 2 | 749 | |
| Miscellaneous | 10,789 | |
| Total Expenses | 985,346 | |
| Less—reduction in expenses due to undertaking—Note 3(a) | (109,528 | ) |
| Less—reduction in fees due to earnings credits—Note 3(c) | (52 | ) |
| Net Expenses | 875,766 | |
| Investment Income—Net | 2,144,784 | |
| Realized and Unrealized Gain (Loss) on Investments—Note 4 ($): | | |
| Net realized gain (loss) on investments | 468,174 | |
| Net unrealized appreciation (depreciation) on investments | 12,358,211 | |
| Net Realized and Unrealized Gain (Loss) on Investments | 12,826,385 | |
| Net Increase in Net Assets Resulting from Operations | 14,971,169 | |
| |
| See notes to financial statements. | | |
STATEMENT OF CHANGES IN NET ASSETS
| | | | |
| | Six Months Ended | | | |
| | November 30, 2013 | | Year Ended | |
| | (Unaudited)a | | May 31, 2013 | |
| Operations ($): | | | | |
| Investment income—net | 2,144,784 | | 3,121,456 | |
| Net realized gain (loss) on investments | 468,174 | | 829,348 | |
| Net unrealized appreciation | | | | |
| (depreciation) on investments | 12,358,211 | | 13,817,460 | |
| Net Increase (Decrease) in Net Assets | | | | |
| Resulting from Operations | 14,971,169 | | 17,768,264 | |
| Dividends to Shareholders from ($): | | | | |
| Investment income—net: | | | | |
| Class A | (1,606,143 | ) | (2,527,413 | ) |
| Class C | (90,580 | ) | (158,274 | ) |
| Class I | (232,518 | ) | (221,283 | ) |
| Class Y | (8 | ) | — | |
| Net realized gain on investments: | | | | |
| Class A | — | | (811,125 | ) |
| Class C | — | | (65,432 | ) |
| Class I | — | | (44,405 | ) |
| Total Dividends | (1,929,249 | ) | (3,827,932 | ) |
| Beneficial Interest Transactions ($): | | | | |
| Net proceeds from shares sold: | | | | |
| Class A | 44,451,328 | | 59,328,002 | |
| Class C | 4,117,904 | | 4,032,308 | |
| Class I | 13,317,941 | | 14,737,847 | |
| Class Y | 1,000 | | — | |
| Dividends reinvested: | | | | |
| Class A | 1,482,989 | | 3,132,117 | |
| Class C | 55,690 | | 137,589 | |
| Class I | 127,171 | | 164,383 | |
| Cost of shares redeemed: | | | | |
| Class A | (12,753,245 | ) | (18,929,946 | ) |
| Class C | (666,685 | ) | (1,551,671 | ) |
| Class I | (2,750,174 | ) | (7,082,265 | ) |
| Increase (Decrease) in Net Assets from | | | | |
| Beneficial Interest Transactions | 47,383,919 | | 53,968,364 | |
| Total Increase (Decrease) in Net Assets | 60,425,839 | | 67,908,696 | |
| Net Assets ($): | | | | |
| Beginning of Period | 127,018,139 | | 59,109,443 | |
| End of Period | 187,443,978 | | 127,018,139 | |
| Undistributed investment income—net | 578,066 | | 362,531 | |
14
| | | | |
| | Six Months Ended | | | |
| | November 30, 2013 | | Year Ended | |
| | (Unaudited)a | | May 31, 2013 | |
| Capital Share Transactions: | | | | |
| Class Ab | | | | |
| Shares sold | 2,827,176 | | 4,130,568 | |
| Shares issued for dividends reinvested | 95,958 | | 224,896 | |
| Shares redeemed | (813,937 | ) | (1,323,224 | ) |
| Net Increase (Decrease) in Shares Outstanding | 2,109,197 | | 3,032,240 | |
| Class Cb | | | | |
| Shares sold | 265,869 | | 285,139 | |
| Shares issued for dividends reinvested | 3,658 | | 10,023 | |
| Shares redeemed | (42,887 | ) | (107,907 | ) |
| Net Increase (Decrease) in Shares Outstanding | 226,640 | | 187,255 | |
| Class I | | | | |
| Shares sold | 845,104 | | 1,026,488 | |
| Shares issued for dividends reinvested | 8,203 | | 11,641 | |
| Shares redeemed | (175,626 | ) | (513,658 | ) |
| Net Increase (Decrease) in Shares Outstanding | 677,681 | | 524,471 | |
| Class Y | | | | |
| Shares sold | 65.531 | | — | |
|
| a Effective July 1, 2013, the fund commenced offering ClassY shares. |
| b During the period ended May 31, 2013, 24,234 Class C shares representing $378,294 were exchanged for to |
| 23,988 Class A shares. |
See notes to financial statements.
FINANCIAL HIGHLIGHTS
The following tables describe the performance for each share class for the fiscal periods indicated. All information (except portfolio turnover rate) reflects financial results for a single fund share.Total return shows how much your investment in the fund would have increased (or decreased) during each period, assuming you had reinvested all dividends and distributions.These figures have been derived from the fund’s financial statements.
| | | | | | | | | | | | |
| Six Months Ended | | | | | | | | | | | |
| November 30, 2013 | | | | Year Ended May 31, | | | |
| Class A Shares | (Unaudited) | | 2013 | | 2012 | | 2011 | | 2010 | | 2009 | |
| Per Share Data ($): | | | | | | | | | | | | |
| Net asset value, | | | | | | | | | | | | |
| beginning of period | 15.42 | | 13.16 | | 13.23 | | 10.52 | | 9.24 | | 13.17 | |
| Investment Operations: | | | | | | | | | | | | |
| Investment income—neta | .22 | | .50 | | .39 | | .23 | | .16 | | .19 | |
| Net realized and unrealized | | | | | | | | | | | | |
| gain (loss) on investments | 1.23 | | 2.40 | | .01 | | 2.66 | | 1.27 | | (3.93 | ) |
| Total from Investment Operations | 1.45 | | 2.90 | | .40 | | 2.89 | | 1.43 | | (3.74 | ) |
| Distributions: | | | | | | | | | | | | |
| Dividends from | | | | | | | | | | | | |
| investment income—net | (.21 | ) | (.49 | ) | (.36 | ) | (.18 | ) | (.15 | ) | (.19 | ) |
| Dividends from net realized | | | | | | | | | | | | |
| gain on investments | — | | (.15 | ) | (.11 | ) | — | | — | | — | |
| Total Distributions | (.21 | ) | (.64 | ) | (.47 | ) | (.18 | ) | (.15 | ) | (.19 | ) |
| Net asset value, end of period | 16.66 | | 15.42 | | 13.16 | | 13.23 | | 10.52 | | 9.24 | |
| Total Return (%)b | 9.50 | c | 22.65 | | 3.18 | | 27.70 | | 15.55 | | (28.60 | ) |
| Ratios/Supplemental Data (%): | | | | | | | | | | | | |
| Ratio of total expenses | | | | | | | | | | | | |
| to average net assets | 1.24 | d | 1.30 | | 1.80 | | 5.40 | | 9.40 | | 11.74 | |
| Ratio of net expenses | | | | | | | | | | | | |
| to average net assets | 1.11 | d | 1.15 | | 1.19 | | 1.50 | | 1.50 | | 1.50 | |
| Ratio of net investment income | | | | | | | | | | | | |
| to average net assets | 2.78 | d | 3.48 | | 2.99 | | 1.85 | | 1.49 | | 1.95 | |
| Portfolio Turnover Rate | 9.65 | c | 53.66 | | 66.38 | | 121.84 | | 76.05 | | 29.06 | |
| Net Assets, end of period | | | | | | | | | | | | |
| ($ x 1,000) | 151,209 | | 107,425 | | 51,754 | | 2,312 | | 1,236 | | 957 | |
| |
| a | Based on average shares outstanding at each month end. |
| b | Exclusive of sales charge. |
| c | Not annualized. |
| d | Annualized. |
See notes to financial statements.
16
| | | | | | | | | | | | |
| Six Months Ended | | | | | | | | | | | |
| November 30, 2013 | | | | Year Ended May 31, | | | |
| Class C Shares | (Unaudited) | | 2013 | | 2012 | | 2011 | | 2010 | | 2009 | |
| Per Share Data ($): | | | | | | | | | | | | |
| Net asset value, | | | | | | | | | | | | |
| beginning of period | 15.26 | | 13.03 | | 13.10 | | 10.43 | | 9.18 | | 13.12 | |
| Investment Operations: | | | | | | | | | | | | |
| Investment income—neta | .16 | | .39 | | .30 | | .13 | | .09 | | .11 | |
| Net realized and unrealized | | | | | | | | | | | | |
| gain (loss) on investments | 1.21 | | 2.37 | | .01 | | 2.65 | | 1.26 | | (3.92 | ) |
| Total from Investment Operations | 1.37 | | 2.76 | | .31 | | 2.78 | | 1.35 | | (3.81 | ) |
| Distributions: | | | | | | | | | | | | |
| Dividends from | | | | | | | | | | | | |
| investment income—net | (.15 | ) | (.38 | ) | (.27 | ) | (.11 | ) | (.10 | ) | (.13 | ) |
| Dividends from net realized | | | | | | | | | | | | |
| gain on investments | — | | (.15 | ) | (.11 | ) | — | | — | | — | |
| Total Distributions | (.15 | ) | (.53 | ) | (.38 | ) | (.11 | ) | (.10 | ) | (.13 | ) |
| Net asset value, end of period | 16.48 | | 15.26 | | 13.03 | | 13.10 | | 10.43 | | 9.18 | |
| Total Return (%)b | 9.06 | c | 21.74 | | 2.47 | | 26.79 | | 14.57 | | (29.07 | ) |
| Ratios/Supplemental Data (%): | | | | | | | | | | | | |
| Ratio of total expenses | | | | | | | | | | | | |
| to average net assets | 2.06 | d | 2.11 | | 2.96 | | 6.19 | | 10.13 | | 13.47 | |
| Ratio of net expenses | | | | | | | | | | | | |
| to average net assets | 1.86 | d | 1.90 | | 2.00 | | 2.25 | | 2.25 | | 2.25 | |
| Ratio of net investment income | | | | | | | | | | | | |
| to average net assets | 2.02 | d | 2.76 | | 2.30 | | 1.09 | | .78 | | 1.21 | |
| Portfolio Turnover Rate | 9.65 | c | 53.66 | | 66.38 | | 121.84 | | 76.05 | | 29.06 | |
| Net Assets, end of period | | | | | | | | | | | | |
| ($ x 1,000) | 12,068 | | 7,715 | | 4,148 | | 913 | | 286 | | 129 | |
| |
| a | Based on average shares outstanding at each month end. |
| b | Exclusive of sales charge. |
| c | Not annualized. |
| d | Annualized. |
See notes to financial statements.
FINANCIAL HIGHLIGHTS (continued)
| | | | | | | | | | | | |
| Six Months Ended | | | | | | | | | | | |
| November 30, 2013 | | | | Year Ended May 31, | | | |
| Class I Shares | (Unaudited) | | 2013 | | 2012 | | 2011 | | 2010 | | 2009 | |
| Per Share Data ($): | | | | | | | | | | | | |
| Net asset value, | | | | | | | | | | | | |
| beginning of period | 15.47 | | 13.20 | | 13.26 | | 10.54 | | 9.25 | | 13.19 | |
| Investment Operations: | | | | | | | | | | | | |
| Investment income—neta | .24 | | .55 | | .42 | | .25 | | .18 | | .22 | |
| Net realized and unrealized | | | | | | | | | | | | |
| gain (loss) on investments | 1.24 | | 2.39 | | .02 | | 2.67 | | 1.28 | | (3.95 | ) |
| Total from Investment Operations | 1.48 | | 2.94 | | .44 | | 2.92 | | 1.46 | | (3.73 | ) |
| Distributions: | | | | | | | | | | | | |
| Dividends from | | | | | | | | | | | | |
| investment income—net | (.23 | ) | (.52 | ) | (.39 | ) | (.20 | ) | (.17 | ) | (.21 | ) |
| Dividends from net realized | | | | | | | | | | | | |
| gain on investments | — | | (.15 | ) | (.11 | ) | — | | — | | — | |
| Total Distributions | (.23 | ) | (.67 | ) | (.50 | ) | (.20 | ) | (.17 | ) | (.21 | ) |
| Net asset value, end of period | 16.72 | | 15.47 | | 13.20 | | 13.26 | | 10.54 | | 9.25 | |
| Total Return (%) | 9.66 | b | 22.96 | | 3.47 | | 28.04 | | 15.73 | | (28.35 | ) |
| Ratios/Supplemental Data (%): | | | | | | | | | | | | |
| Ratio of total expenses | | | | | | | | | | | | |
| to average net assets | 1.01 | c | 1.12 | | 1.60 | | 5.25 | | 9.28 | | 11.55 | |
| Ratio of net expenses | | | | | | | | | | | | |
| to average net assets | .86 | c | .90 | | .93 | | 1.25 | | 1.25 | | 1.25 | |
| Ratio of net investment income | | | | | | | | | | | | |
| to average net assets | 2.99 | c | 3.74 | | 3.31 | | 2.07 | | 1.72 | | 2.19 | |
| Portfolio Turnover Rate | 9.65 | b | 53.66 | | 66.38 | | 121.84 | | 76.05 | | 29.06 | |
| Net Assets, end of period | | | | | | | | | | | | |
| ($ x 1,000) | 24,166 | | 11,878 | | 3,208 | | 72 | | 81 | | 53 | |
| |
| a | Based on average shares outstanding at each month end. |
| b | Not annualized. |
| c | Annualized. |
See notes to financial statements.
18
| | |
| | Period Ended | |
| Class Y Shares | November 30, 2013 a | |
| Per Share Data ($): | | |
| Net asset value, beginning of period | 15.26 | |
| Investment Operations: | | |
| Investment income—netb | .19 | |
| Net realized and unrealized gain (loss) on investments | 1.40 | |
| Total from Investment Operations | 1.59 | |
| Distributions: | | |
| Dividends from investment income—net | (.13 | ) |
| Net asset value, end of period | 16.72 | |
| Total Return (%)c | 10.47 | |
| Ratios/Supplemental Data (%): | | |
| Ratio of total expenses to average net assetsd | .90 | |
| Ratio of net expenses to average net assetsd | .85 | |
| Ratio of net investment income to average net assetsd | 2.95 | |
| Portfolio Turnover Ratec | 9.65 | |
| Net Assets, end of period ($ x 1,000) | 1 | |
| |
| a | From July 1, 2013 (commencement of initial offering) to November 30, 2013. |
| b | Based on average shares outstanding at each month end. |
| c | Not annualized. |
| d | Annualized. |
See notes to financial statements.
NOTES TO FINANCIAL STATEMENTS (Unaudited)
NOTE 1—Significant Accounting Policies:
Dreyfus Equity Income Fund (the “fund”) is a separate diversified series of The Dreyfus/Laurel Funds Trust (the “Trust”), which is registered under the Investment Company Act of 1940, as amended (the “Act”), as an open-end management investment company and operates as a series company currently offering five series, including the fund. The fund’s investment objective is to seek total return (consisting of capital appreciation and income).The Dreyfus Corporation (the “Manager” or “Dreyfus”), a wholly-owned subsidiary of The Bank of New York Mellon Corporation (“BNY Mellon”), serves as the fund’s investment adviser.
MBSC Securities Corporation (the “Distributor”), a wholly-owned subsidiary of the Manager, is the distributor of the fund’s shares. The fund is authorized to issue an unlimited number of $.001 par value shares of Beneficial Interest in each of the following classes of shares: Class A, Class C, Class I and ClassY. Class A and Class C shares are sold primarily to retail investors through financial intermediaries and bear a Distribution and/or Shareholder Services Plan fee. Class A shares generally are subject to a sales charge imposed at the time of purchase. Class C shares are subject to a contingent deferred sales charge (“CDSC”) imposed on Class C shares redeemed within one year of purchase. Class I shares are sold primarily to bank trust departments and other financial service providers (including The Bank of NewYork Mellon, a subsidiary of BNY Mellon and an affiliate of Dreyfus, and its affiliates), acting on behalf of customers having a qualified trust or an investment account or relationship at such institution, and bear no Distribution or Shareholder Services Plan fees. Class I shares are offered without a front-end sales charge or CDSC. Class Y shares are offered at net asset value generally to institutional investors. Other differences between the classes include the services offered to and the expenses borne by each class, the allocation of certain transfer agency costs and certain voting rights. Income, expenses (other than expenses attributable to a specific class), and real-
20
ized and unrealized gains or losses on investments are allocated to each class of shares based on its relative net assets.
As of November 30, 2013, MBC Investments Corp., an indirect subsidiary of BNY Mellon, held all of the outstanding Class Y shares of the fund.
The Trust accounts separately for the assets, liabilities and operations of each series. Expenses directly attributable to each series are charged to that series’ operations; expenses which are applicable to all series are allocated among them on a pro rata basis.
The Financial Accounting Standards Board (“FASB”) Accounting Standards Codification is the exclusive reference of authoritative U.S. generally accepted accounting principles (“GAAP”) recognized by the FASB to be applied by nongovernmental entities. Rules and interpretive releases of the Securities and Exchange Commission (“SEC”) under authority of federal laws are also sources of authoritative GAAP for SEC registrants. The fund’s financial statements are prepared in accordance with GAAP, which may require the use of management estimates and assumptions.Actual results could differ from those estimates.
(a) Portfolio valuation: The fair value of a financial instrument is the amount that would be received to sell an asset or paid to transfer a liability in an orderly transaction between market participants at the measurement date (i.e., the exit price). GAAP establishes a fair value hierarchy that prioritizes the inputs of valuation techniques used to measure fair value. This hierarchy gives the highest priority to unadjusted quoted prices in active markets for identical assets or liabilities (Level 1 measurements) and the lowest priority to unobservable inputs (Level 3 measurements).
Additionally, GAAP provides guidance on determining whether the volume and activity in a market has decreased significantly and whether such a decrease in activity results in transactions that are not
NOTES TO FINANCIAL STATEMENTS (Unaudited) (continued)
orderly. GAAP requires enhanced disclosures around valuation inputs and techniques used during annual and interim periods.
Various inputs are used in determining the value of the fund’s investments relating to fair value measurements.These inputs are summarized in the three broad levels listed below:
Level 1—unadjusted quoted prices in active markets for identical investments.
Level 2—other significant observable inputs (including quoted prices for similar investments, interest rates, prepayment speeds, credit risk, etc.).
Level 3—significant unobservable inputs (including the fund’s own assumptions in determining the fair value of investments).
The inputs or methodology used for valuing securities are not necessarily an indication of the risk associated with investing in those securities.
Changes in valuation techniques may result in transfers in or out of an assigned level within the disclosure hierarchy. Valuation techniques used to value the fund’s investments are as follows:
Investments in securities are valued at the last sales price on the securities exchange or national securities market on which such securities are primarily traded. Securities listed on the National Market System for which market quotations are available are valued at the official closing price or, if there is no official closing price that day, at the last sales price. Securities not listed on an exchange or the national securities market, or securities for which there were no transactions, are valued at the average of the most recent bid and asked prices, except for open short positions, where the asked price is used for valuation purposes. Bid price is used when no asked price is available. Registered investment companies that are not traded on an exchange are valued at their net asset value. All of the preceding securities are categorized within Level 1 of the fair value hierarchy.
Fair valuing of securities may be determined with the assistance of a pricing service using calculations based on indices of domestic securi-
22
ties and other appropriate indicators, such as prices of relevant American Depository Receipts and financial futures. Utilizing these techniques may result in transfers between Level 1 and Level 2 of the fair value hierarchy.
When market quotations or official closing prices are not readily available, or are determined not to reflect accurately fair value, such as when the value of a security has been significantly affected by events after the close of the exchange or market on which the security is principally traded (for example, a foreign exchange or market), but before the fund calculates its net asset value, the fund may value these investments at fair value as determined in accordance with the procedures approved by the Board. Certain factors may be considered when fair valuing investments such as: fundamental analytical data, the nature and duration of restrictions on disposition, an evaluation of the forces that influence the market in which the securities are purchased and sold, and public trading in similar securities of the issuer or comparable issuers.These securities are either categorized within Level 2 or 3 of the fair value hierarchy depending on the relevant inputs used.
For restricted securities where observable inputs are limited, assumptions about market activity and risk are used and are categorized within Level 3 of the fair value hierarchy.
The following is a summary of the inputs used as of November 30, 2013 in valuing the fund’s investments:
| | | | |
| | | Level 2—Other | Level 3— | |
| | Level 1— | Significant | Significant | |
| | Unadjusted | Observable | Unobservable | |
| | Quoted Prices | Inputs | Inputs | Total |
| Assets ($) | | | | |
| Investments in Securities: | | | |
| Equity Securities— | | | | |
| Domestic Common | | | |
| Stocks† | 185,317,286 | — | — | 185,317,286 |
| Mutual Funds | 1,369,335 | — | — | 1,369,335 |
| |
| † | See Statement of Investments for additional detailed categorizations. |
NOTES TO FINANCIAL STATEMENTS (Unaudited) (continued)
At November 30, 2013, there were no transfers between Level 1 and Level 2 of the fair value hierarchy.
(b) Securities transactions and investment income: Securities transactions are recorded on a trade date basis. Realized gains and losses from securities transactions are recorded on the identified cost basis. Dividend income is recognized on the ex-dividend date and interest income, including, where applicable, accretion of discount and amortization of premium on investments, is recognized on the accrual basis.
Pursuant to a securities lending agreement with The Bank of New York Mellon, the fund may lend securities to qualified institutions. It is the fund’s policy that, at origination, all loans are secured by collateral of at least 102% of the value of U.S. securities loaned and 105% of the value of foreign securities loaned. Collateral equivalent to at least 100% of the market value of securities on loan is maintained at all times. Collateral is either in the form of cash, which can be invested in certain money market mutual funds managed by the Manager or U.S. Government and Agency securities.The fund is entitled to receive all dividends, interest and distributions on securities loaned, in addition to income earned as a result of the lending transaction. Should a borrower fail to return the securities in a timely manner, The Bank of New York Mellon is required to replace the securities for the benefit of the fund or credit the fund with the market value of the unreturned securities and is subrogated to the fund’s rights against the borrower and the collateral. During the period ended November 30, 2013,The Bank of NewYork Mellon earned $1,354 from lending portfolio securities, pursuant to the securities lending agreement.
(c) Affiliated issuers: Investments in other investment companies advised by Dreyfus are defined as “affiliated” under the Act. Investments
24
in affiliated investment companies during the period ended November 30, 2013 were as follows:
| | | | | | | |
| Affiliated | | | | | | | |
| Investment | Value | | | | Value | | Net |
| Company | 5/31/2013 | ($) | Purchases ($) | Sales ($) | 11/30/2013 | ($) | Assets (%) |
| Dreyfus | | | | | | | |
| Institutional | | | | | | | |
| Preferred | | | | | | | |
| Plus Money | | | | | | | |
| Market Fund | 450,401 | | 36,599,503 | 35,680,569 | 1,369,335 | | .7 |
| Dreyfus | | | | | | | |
| Institutional | | | | | | | |
| Cash | | | | | | | |
| Advantage | | | | | | | |
| Fund | 8,079,227 | | 852,407 | 8,931,634 | — | | — |
| Total | 8,529,628 | | 37,451,910 | 44,612,203 | 1,369,335 | | .7 |
(d) Dividends to shareholders: Dividends are recorded on the ex-dividend date. Dividends from investment income-net are declared and paid monthly. Dividends from net realized capital gains, if any, are normally declared and paid annually, but the fund may make distributions on a more frequent basis to comply with the distribution requirements of the Internal Revenue Code of 1986, as amended (the “Code”).To the extent that net realized capital gains can be offset by capital loss carryovers, it is the policy of the fund not to distribute such gains. Income and capital gain distributions are determined in accordance with income tax regulations, which may differ from GAAP.
(e) Federal income taxes: It is the policy of the fund to continue to qualify as a regulated investment company, if such qualification is in the best interests of its shareholders, by complying with the applicable provisions of the Code, and to make distributions of taxable income sufficient to relieve it from substantially all federal income and excise taxes.
NOTES TO FINANCIAL STATEMENTS (Unaudited) (continued)
As of and during the period ended November 30, 2013, the fund did not have any liabilities for any uncertain tax positions. The fund recognizes interest and penalties, if any, related to uncertain tax positions as income tax expense in the Statement of Operations. During the period ended November 30, 2013, the fund did not incur any interest or penalties.
Each tax year in the three-year period ended May 31, 2013 remains subject to examination by the Internal Revenue Service and state taxing authorities.
The tax character of distributions paid to shareholders during the fiscal year ended May 31, 2013 was as follows: ordinary income $3,810,727 and long-term capital gains $17,205.The tax character of current year distributions will be determined at the end of the current fiscal year.
NOTE 2—Bank Lines of Credit:
The fund participates with other Dreyfus-managed funds in a $265 million unsecured credit facility led by Citibank, N.A. and a $300 million unsecured credit facility provided by The Bank of New York Mellon (each, a “Facility”), each to be utilized primarily for temporary or emergency purposes, including the financing of redemptions. Prior to October 9, 2013, the unsecured credit facility with Citibank, N.A. was $210 million. In connection therewith, the fund has agreed to pay its pro rata portion of commitment fees for each Facility. Interest is charged to the fund based on rates determined pursuant to the terms of the respective Facility at the time of borrowing. During the period ended November 30, 2013, the fund did not borrow under the Facilities.
NOTE 3—Management Fee and Other Transactions with Affiliates:
(a) Pursuant to a management agreement with the Manager, the management fee is computed at the annual rate of .75% of the value of the fund’s average daily net assets and is payable monthly.The Manager had contractually agreed, from June 1, 2013 through June 30, 2013, to
26
waive receipt of its fees and/or assume the expenses of the fund so that annual direct fund operating expenses (excluding Rule 12b-1 Distribution Plan fees, Shareholder Services Plan fees, taxes, interest expense, brokerage commissions, commitment fees on borrowings and extraordinary expenses) did not exceed .90% of the value of the fund’s average daily net assets. Thereafter, the Manager has contractually agreed, from July 1, 2013 through October 1, 2014, to waive receipt of its fees and/or assume the expenses of the fund so that annual direct fund operating expenses (excluding certain expenses as described above) do not exceed .85% of the value of the fund’s average daily net assets. The reduction in expenses, pursuant to the undertaking, amounted to $109,528 during the period ended November 30, 2013.
During the period ended November 30, 2013, the Distributor retained $18,692 from commissions earned on sales of the fund’s Class A shares and $1,201 from CDSC’s on redemptions of the fund’s Class C shares.
(b) Under the Distribution Plan adopted pursuant to Rule 12b-1 under the Act, Class C shares pay the Distributor for distributing its shares at an annual rate of .75% of the value of its average daily net assets. During the period ended November 30, 2013, Class C shares were charged $37,449, pursuant to the Distribution Plan.
(c) Under the Shareholder Services Plan, Class A and Class C shares pay the Distributor at an annual rate of .25% of the value of their average daily net assets for the provision of certain services. The services provided may include personal services relating to shareholder accounts, such as answering shareholder inquiries regarding the fund and providing reports and other information, and services related to the maintenance of shareholder accounts. The Distributor may make payments to Service Agents (securities dealers, financial institutions or other industry professionals) with respect to these services. The Distributor determines the amounts to be paid to Service Agents. During the period ended November 30, 2013, Class A and Class C shares were charged $159,254 and $12,483, respectively, pursuant to the Shareholder Services Plan.
NOTES TO FINANCIAL STATEMENTS (Unaudited) (continued)
Under its terms, the Distribution Plan and Shareholder Services Plan shall remain in effect from year to year, provided such continuance is approved annually by a vote of a majority of those Trustees who are not “interested persons” of the Trust and who have no direct or indirect financial interest in the operation of or in any agreement related to the Distribution Plan or Shareholder Services Plan.
The fund has arrangements with the transfer agent and the custodian whereby the fund may receive earnings credits when positive cash balances are maintained, which are used to offset transfer agency and custody fees. For financial reporting purposes, the fund includes net earnings credits as an expense offset in the Statement of Operations.
The fund compensates DreyfusTransfer, Inc., a wholly-owned subsidiary of the Manager, under a transfer agency agreement for providing transfer agency and cash management services for the fund.The majority of transfer agency fees are comprised of amounts paid on a per account basis, while cash management fees are related to fund subscriptions and redemptions. During the period ended November 30, 2013, the fund was charged $16,287 for transfer agency services and $898 for cash management services.These fees are included in Shareholder servicing costs in the Statement of Operations. Cash management fees were partially offset by earnings credits of $52.
The fund compensates The Bank of NewYork Mellon under a custody agreement for providing custodial services for the fund.These fees are determined based on net assets, geographic region and transaction activity. During the period ended November 30, 2013, the fund was charged $42,282 pursuant to the custody agreement.
The fund compensated The Bank of New York Mellon under a cash management agreement that was in effect until September 30, 2013 for performing certain cash management services related to fund subscriptions and redemptions. During the period ended November 30, 2013, the fund was charged $213 pursuant to the cash management agreement, which is included in Shareholder servicing costs in the Statement of Operations.
28
During the period ended November 30, 2013, the fund was charged $4,571 for services performed by the Chief Compliance Officer and his staff.
The components of “Due to The Dreyfus Corporation and affiliates” in the Statement of Assets and Liabilities consist of: management fees $113,112, Distribution Plan fees $7,303, Shareholder Services Plan fees $32,837, custodian fees $30,308, Chief Compliance Officer fees $3,833 and transfer agency fees $10,338, which are offset against an expense reimbursement currently in effect in the amount $14,180.
(d) Each Board member also serves as a Board member of other funds within the Dreyfus complex. Annual retainer fees and attendance fees are allocated to each fund based on net assets.
NOTE 4—Securities Transactions:
The aggregate amount of purchases and sales of investment securities, excluding short-term securities, during the period ended November 30, 2013, amounted to $60,994,761 and $14,833,393, respectively.
At November 30, 2013, accumulated net unrealized appreciation on investments was $27,007,693, consisting of $30,161,232 gross unrealized appreciation and $3,153,539 gross unrealized depreciation.
At November 30, 2013, the cost of investments for federal income tax purposes was substantially the same as the cost for financial reporting purposes (see the Statement of Investments).
For More Information
Telephone Call your financial representative or 1-800-DREYFUS
Mail The Dreyfus Family of Funds, 144 Glenn Curtiss Boulevard, Uniondale, NY 11556-0144
The fund files its complete schedule of portfolio holdings with the Securities and Exchange Commission (“SEC”) for the first and third quarters of each fiscal year on Form N-Q. The fund’s Forms N-Q are available on the SEC’s website at http://www.sec.gov and may be reviewed and copied at the SEC’s Public Reference Room in Washington, DC. Information on the operation of the Public Reference Room may be obtained by calling 1-800-SEC-0330.
A description of the policies and procedures that the fund uses to determine how to vote proxies relating to portfolio securities, and information regarding how the fund voted these proxies for the 12-month period ended June 30 is available at http://www.dreyfus.com and on the SEC’s website at http://www.sec.gov. The description of the policies and procedures is also available without charge, upon request, by calling 1-800-DREYFUS.

Item 2. Code of Ethics.
Not applicable.
Item 3. Audit Committee Financial Expert.
Not applicable.
Item 4. Principal Accountant Fees and Services.
Not applicable.
Item 5. Audit Committee of Listed Registrants.
Not applicable.
Item 6. Investments.
(a) Not applicable.
Item 7. Disclosure of Proxy Voting Policies and Procedures for Closed-End Management Investment Companies.
Not applicable.
Item 8. Portfolio Managers of Closed-End Management Investment Companies.
Not applicable.
Item 9. Purchases of Equity Securities by Closed-End Management Investment Companies and Affiliated Purchasers.
Not applicable.
Item 10. Submission of Matters to a Vote of Security Holders.
There have been no material changes to the procedures applicable to Item 10.
Item 11. Controls and Procedures.
(a) The Registrant's principal executive and principal financial officers have concluded, based on their evaluation of the Registrant's disclosure controls and procedures as of a date within 90 days of the filing date of this report, that the Registrant's disclosure controls and procedures are reasonably designed to ensure that information required to be disclosed by the Registrant on Form N-CSR is recorded, processed, summarized and reported within the required time periods and that information required to be disclosed by the Registrant in the reports that it files or submits on Form N-CSR is accumulated and communicated to the Registrant's management, including its principal executive and principal financial officers, as appropriate to allow timely decisions regarding required disclosure.
(b) There were no changes to the Registrant's internal control over financial reporting that occurred during the second fiscal quarter of the period covered by this report that have materially affected, or are reasonably likely to materially affect, the Registrant's internal control over financial reporting.
Item 12. Exhibits.
(a)(1) Not applicable.
(a)(2) Certifications of principal executive and principal financial officers as required by Rule 30a-2(a) under the Investment Company Act of 1940.
(a)(3) Not applicable.
(b) Certification of principal executive and principal financial officers as required by Rule 30a-2(b) under the Investment Company Act of 1940.
SIGNATURES
Pursuant to the requirements of the Securities Exchange Act of 1934 and the Investment Company Act of 1940, the Registrant has duly caused this Report to be signed on its behalf by the undersigned, thereunto duly authorized.
The Dreyfus/Laurel Funds Trust
By: /s/ Bradley J. Skapyak |
Bradley J. Skapyak, President |
Date: | January 23, 2014 |
|
Pursuant to the requirements of the Securities Exchange Act of 1934 and the Investment Company Act of 1940, this Report has been signed below by the following persons on behalf of the Registrant and in the capacities and on the dates indicated. |
|
By: /s/ Bradley J. Skapyak |
Bradley J. Skapyak, President |
Date: | January 23, 2014 |
|
By: /s/ James Windels |
James Windels, Treasurer |
Date: | January 23, 2014 |
|
EXHIBIT INDEX
(a)(2) Certifications of principal executive and principal financial officers as required by Rule 30a-2(a) under the Investment Company Act of 1940. (EX-99.CERT)
(b) Certification of principal executive and principal financial officers as required by Rule 30a-2(b) under the Investment Company Act of 1940. (EX-99.906CERT)