We are pleased to present this annual report for Dreyfus International Bond Fund, covering the 12-month period from November 1, 2015 through October 31, 2016. For information about how the fund performed during the reporting period, as well as general market perspectives, we provide a Discussion of Fund Performance on the pages that follow.
Stocks and bonds generally advanced over the reporting period in the midst of heightened market volatility stemming from various global economic developments. Toward the end of 2015, investor sentiment deteriorated amid sluggish global economic growth, falling commodity prices, and the first increase in short-term U.S. interest rates in nearly a decade. These worries sparked sharp stock market declines in January 2016, but equities began to rally in February when U.S. monetary policymakers refrained from additional rate hikes, other central banks eased their monetary policies further, and commodity prices began to rebound. Stocks generally continued to climb through the summer, driving several broad measures of U.S. stock market performance to record highs in July and August before moderating as a result of uncertainty regarding U.S. elections and potential rate hikes. In the bond market, yields of high-quality sovereign bonds generally moved lower and their prices increased in response to robust investor demand for current income in a low interest rate environment.
The outcome of the U.S. presidential election and ongoing global economic headwinds suggest that uncertainty will persist in the financial markets over the foreseeable future. Some asset classes and industry groups may benefit from a changing economic and political landscape, while others probably will face challenges. Consequently, selectivity could become a more important determinant of investment success. As always, we encourage you to discuss the implications of our observations with your financial advisor.
Thank you for your continued confidence and support.
DISCUSSION OF FUND PERFORMANCE
For the period of November 1, 2015 through October 31, 2016, as provided by David Leduc, CFA, Brendan Murphy, CFA, and Raman Srivastava, CFA, Portfolio Managers
Fund and Market Performance Overview
For the 12-month period ended October 31, 2016, Dreyfus International Bond Fund’s Class A shares produced a total return of 3.38%, Class C shares returned 2.78%, Class I shares returned 3.90%, and Class Y shares returned 3.94%.1 In comparison, the fund’s benchmark, the Bloomberg Barclays Global Aggregate ex-U.S. Index (unhedged) (the “Index”), produced a total return of 6.47% for the same period.2
Higher quality bonds generally benefited during the reporting period from falling long-term interest rates, and lower quality securities erased previous losses during a rally over the spring and summer of 2016. The fund lagged its benchmark, mainly due to shortfalls in its currency and asset allocation strategies.
As of August 24, 2016, the fund’s benchmark, the Barclays Global Aggregate ex-U.S. Index (unhedged), was renamed the Bloomberg Barclays Global Aggregate ex-U.S. Index (unhedged).
The Fund’s Investment Approach
The fund seeks to maximize total return through capital appreciation and income. To pursue its goal, the fund normally invests at least 80% of its net assets in fixed-income securities, and at least 65% of its assets in non-U.S. dollar-denominated fixed-income securities of foreign governments and companies located in various countries, including emerging markets.
Generally, the fund seeks to maintain investment-grade average credit quality. We focus on identifying undervalued government bond markets, currencies, sectors, and securities. We look for fixed-income securities with the most potential for added value, such as those involving the potential for credit upgrades, unique structural characteristics, or innovative features. We use fundamental economic research and quantitative analysis to allocate assets among countries and currencies. We then focus on sectors and individual securities that appear to be relatively undervalued.
Robust Investor Demand Supported International Bond Prices
Over the final four months of 2015, global economic concerns sparked heightened bond market turbulence. Sluggish growth in Europe and Japan and falling commodity prices caused global investors to flock to traditional safe havens, hurting riskier emerging-markets and corporate bonds while sending prices of high-quality sovereign bonds higher and their yields lower. Investors also anticipated at the time that U.S. monetary policymakers would raise short-term interest rates, as indeed they did in December 2015, a move that many worried could weigh on the U.S. and global economies.
Investor sentiment changed dramatically in mid-February 2016 when U.S. monetary policymakers indicated that they would delay additional rate hikes. In addition, investors were encouraged when commodity prices began to rebound, several central banks announced new stimulus measures, and foreign currencies gained value against the U.S. dollar. The Bank of Japan and European Central Bank adopted negative short-term interest rates, a move that drove international fixed-income investors to higher yielding market sectors such as corporate-backed securities, emerging-markets bonds, and U.S. government securities.
In June and early July, concerns surrounding a referendum in the United Kingdom to leave the European Union produced renewed market volatility. Yet, higher yielding bond market sectors quickly rebounded amid robust demand from international investors seeking more competitive yields than were available from sovereign bonds in overseas markets.
3
DISCUSSION OF FUND PERFORMANCE (continued)
Fund Strategies Produced Mixed Results
Although the fund participated in the international bond market’s moderate gains over the reporting period, its performance compared to the benchmark was hampered, in part, by its currency positions. Most notably, underweighted exposure to rallying Asian currencies and an overweighted position in the Mexican peso proved counterproductive. In addition, the fund’s allocation to inflation-linked bonds in Europe, Japan, and the United States lagged market averages when global inflationary pressures remained muted, and overweighted exposure to corporate-backed securities constrained relative results amid heightened market volatility early in the reporting period.
An emphasis on emerging-markets bonds produced better relative results, a strategy that enabled the fund to participate more fully in the rally during the spring and summer of 2016. The fund’s interest rate strategies also proved favorable, as relatively long duration positions in Australia, Europe, and Canada helped capture more of the benefits of falling long-term interest rates. In Japan, the fund benefited from a yield-curve position designed to profit from narrowing yield differences along the market’s maturity spectrum.
At times during the reporting period, the fund employed forward contracts, options, and futures contracts to establish its currency and interest rate strategies.
Continued Volatility Expected
As of the reporting period’s end, we have maintained a generally cautious investment posture in anticipation of continued volatility in the financial markets. Global economic uncertainty seems likely to persist, as does the choppy U.S. economic recovery. While most major central banks are expected to maintain accommodative monetary policies, U.S. policymakers appear likely to raise short-term interest rates gradually. Meanwhile, yields of longer term sovereign bonds remain near historical lows, and yield differences have narrowed along the market’s credit-quality spectrum.
Therefore, we currently intend to maintain a generally conservative duration posture, and we have retained the fund’s emphasis on emerging-market currencies and inflation-linked bonds that offer relatively attractive values.
November 15, 2016
Bonds are subject generally to interest rate, credit, liquidity, and market risks, to varying degrees, all of which are more fully described in the fund’s prospectus. Generally, all other factors being equal, bond prices are inversely related to interest-rate changes, and rate increases can cause price declines.
High yield bonds are subject to increased credit risk and are considered speculative in terms of the issuer’s perceived ability to continue making interest payments on a timely basis and to repay principal upon maturity.
Foreign bonds are subject to special risks including exposure to currency fluctuations, changing political and economic conditions, and potentially less liquidity. These risks are generally greater with emerging market countries than with more economically and politically established foreign countries.
The use of derivatives involves risks different from, or possibly greater than, the risks associated with investing directly in the underlying assets. Derivatives can be highly volatile, illiquid, and difficult to value, and there is the risk that changes in the value of a derivative held by the fund will not correlate with the underlying instruments or the fund’s other instruments.
Investments in foreign currencies are subject to the risk that those currencies will decline in value relative to the U.S. dollar, or, in the case of hedged positions, that the U.S. dollar will decline relative to the currency being hedged. Currency rates in foreign countries may fluctuate significantly over short periods of time. A decline in the value of foreign currencies relative to the U.S. dollar will reduce the value of securities held by the fund and denominated in those currencies. The use of leverage may magnify the fund’s gains or losses. For derivatives with a leveraging component, adverse changes in the value or level of the underlying asset can result in a loss that is much greater than the original investment in the derivative.
1 Total return includes reinvestment of dividends and any capital gains paid and does not take into consideration the maximum initial sales charge in the case of Class A shares or the applicable contingent deferred sales charge imposed on redemptions in the case of Class C shares. Had these charges been reflected, returns would have been lower. Class I and Class Y shares are not subject to any initial or deferred sales charge. Past performance is no guarantee of future results. Share price and investment return fluctuate such that upon redemption, fund shares may be worth more or less than their original cost.
2 Source: Lipper Inc. — Reflects reinvestment of dividends and, where applicable, capital gain distributions. The Bloomberg Barclays Global Aggregate ex-U.S. Index (unhedged) provides a broad-based measure of the global investment-grade fixed income markets. Investors cannot invest directly in any index.
4
FUND PERFORMANCE
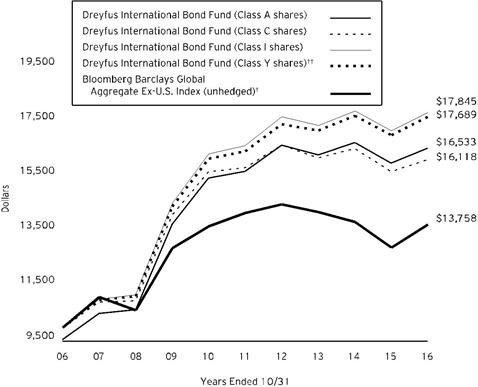
Comparison of change in value of $10,000 investment in Dreyfus International Bond Fund Class A shares, Class C shares, Class I shares and Class Y shares and the Bloomberg Barclays Global Aggregate Ex-U.S. Index (unhedged)
† Source: Lipper Inc.
†† The total return figures presented for Class Y shares of the fund reflect the performance of the fund’s Class A shares for the period prior to 7/1/13 (the inception date for Class Y shares), not reflecting the applicable sales charges for Class A shares.
Past performance is not predictive of future performance.
The above graph compares a $10,000 investment made in each of the Class A, Class C, Class I and Class Y shares of Dreyfus International Bond Fund on 10/31/06 to a $10,000 investment made in the Bloomberg Barclays Global Aggregate Ex-U.S. Index (unhedged) (the “Index”) on that date. All dividends and capital gain distributions are reinvested. The fund invests 80% of its assets primarily in fixed-income securities. The fund’s performance shown in the line graph above takes into account the maximum initial sales charge on Class A shares and all other applicable fees and expenses on all classes. The Index is designed to measure the performance of global investment-grade, fixed-rate debt markets, excluding the United States, hedged into U.S. dollars. Unlike a mutual fund, the Index is not subject to charges, fees and other expenses. Investors cannot invest directly in any index. Further information relating to fund performance, including expense reimbursements, if applicable, is contained in the Financial Highlights section of the prospectus and elsewhere in this report.
5
FUND PERFORMANCE (continued)
| | | | | | | |
Average Annual Total Returns as of 10/31/16 |
| Inception | 1 Year | 5 Years | | 10 Years | |
Date |
Class A shares | | | | |
with maximum sales charge (4.5%) | 12/30/05 | -1.25% | 0.12% | | 5.16% | |
without sales charge | 12/30/05 | 3.38% | 1.05% | | 5.64% | |
Class C shares | | | | |
with applicable redemption charge † | 12/30/05 | 1.79% | 0.37% | | 4.89% | |
without redemption | 12/30/05 | 2.78% | 0.37% | | 4.89% | |
Class I shares | 12/30/05 | 3.90% | 1.41% | | 5.96% | |
Class Y shares | 7/1/13 | 3.94% | 1.49% | †† | 5.87% | †† |
Bloomberg Barclay Global Aggregate | | | | |
Ex-U.S. Index (unhedged) | 12/30/05 | 6.47% | -0.61% | | 3.24% | |
Past performance is not predictive of future performance. The fund’s performance shown in the graph and table does not reflect the deduction of taxes that a shareholder would pay on the fund distributions or the redemption of fund shares. In addition to the performance of Class A shares shown with and without a maximum sales charge, the fund’s performance shown in the table takes into account all other applicable fees and expenses on all classes.
†The maximum contingent deferred sales charge for Class C shares is 1% for shares redeemed within one year of the date of purchase.
†† The total return performance figures presented for Class Y shares of the fund reflect the performance of the fund’s Class A shares for the period prior to 7/1/13 (the inception date for Class Y shares), not reflecting the applicable sales charges for Class A shares.
6
UNDERSTANDING YOUR FUND’S EXPENSES (Unaudited)
As a mutual fund investor, you pay ongoing expenses, such as management fees and other expenses. Using the information below, you can estimate how these expenses affect your investment and compare them with the expenses of other funds. You also may pay one-time transaction expenses, including sales charges (loads) and redemption fees, which are not shown in this section and would have resulted in higher total expenses. For more information, see your fund’s prospectus or talk to your financial adviser.
Review your fund’s expenses
The table below shows the expenses you would have paid on a $1,000 investment in Dreyfus International Bond Fund from May 1, 2016 to October 31, 2016. It also shows how much a $1,000 investment would be worth at the close of the period, assuming actual returns and expenses.
| | | | | | | | | | | | | | |
Expenses and Value of a $1,000 Investment | | |
assuming actual returns for the six months ended October 31, 2016 |
| | | | | | | | |
| | | | Class A | Class C | Class I | Class Y |
Expenses paid per $1,000† | | $6.16 | | $8.83 | | $3.78 | | $3.33 |
Ending value (after expenses) | | $977.10 | | $974.00 | | $979.80 | | $979.80 |
COMPARING YOUR FUND’S EXPENSES
WITH THOSE OF OTHER FUNDS (Unaudited)
Using the SEC’s method to compare expenses
The Securities and Exchange Commission (SEC) has established guidelines to help investors assess fund expenses. Per these guidelines, the table below shows your fund’s expenses based on a $1,000 investment, assuming a hypothetical 5% annualized return. You can use this information to compare the ongoing expenses (but not transaction expenses or total cost) of investing in the fund with those of other funds. All mutual fund shareholder reports will provide this information to help you make this comparison. Please note that you cannot use this information to estimate your actual ending account balance and expenses paid during the period.
| | | | | | | | | | | | |
Expenses and Value of a $1,000 Investment | | |
assuming a hypothetical 5% annualized return for the six months ended October 31, 2016 |
| | | | | | | | |
| | | | Class A | Class C | Class I | Class Y |
Expenses paid per $1,000† | | $6.29 | | $9.02 | | $3.86 | | $3.40 |
Ending value (after expenses) | | $1,018.90 | | $1,016.19 | | $1,021.32 | | $1,021.77 |
† Expenses are equal to the fund’s annualized expense ratio of 1.24% for Class A, 1.78% for Class C, .76% for Class I and .67% for Class Y, multiplied by the average account value over the period, multiplied by 184/366 (to reflect the one-half year period).
7
STATEMENT OF INVESTMENTS
October 31, 2016
| | | | | | | | | | | |
| |
Bonds and Notes - 97.0% | Coupon
Rate (%) | | Maturity
Date | | Principal
Amount ($) | a | Value ($) | |
Argentina - 1.7% | | | | | |
Argentine Government,
Sr. Unscd. Bonds | ARS | 15.50 | | 10/17/26 | | 70,700,000 | | 4,719,425 | |
Argentine Government,
Unscd. Bonds | ARS | 21.20 | | 9/19/18 | | 68,400,000 | | 4,662,019 | |
Buenos Aires Province,
Sr. Unscd. Notes | | 5.75 | | 6/15/19 | | 2,650,000 | b | 2,719,563 | |
Buenos Aires Province,
Sr. Unscd. Notes | | 9.13 | | 3/16/24 | | 2,775,000 | b | 3,080,250 | |
| | 15,181,257 | |
Bahrain - .5% | | | | | |
Bahraini Government,
Sr. Unscd. Bonds | | 7.00 | | 10/12/28 | | 4,825,000 | b | 4,981,812 | |
Brazil - .6% | | | | | |
Brazilian Government,
Sr. Unscd. Bonds | | 5.63 | | 2/21/47 | | 5,775,000 | | 5,544,000 | |
Canada - 3.5% | | | | | |
BMW Canada Auto Trust,
Ser. 2016-1A, Cl. A1 | CAD | 1.37 | | 9/20/18 | | 1,675,060 | b | 1,250,132 | |
Canadian Government,
Bonds | CAD | 0.75 | | 9/1/20 | | 12,350,000 | | 9,255,456 | |
Canadian Government,
Unscd. Bonds | CAD | 3.50 | | 12/1/45 | | 9,755,000 | | 9,943,365 | |
CNH Capital Canada Receivables Trust,
Ser. 2014-1A, Cl. A2 | CAD | 1.80 | | 10/15/20 | | 6,680,551 | b | 4,995,696 | |
MBARC Credit Canada,
Ser. 2016-AA, Cl. A1 | CAD | 1.26 | | 9/17/18 | | 5,250,000 | b | 3,923,464 | |
MBARC Credit Canada,
Ser. 2016-AA, Cl. A2 | CAD | 1.53 | | 6/17/19 | | 3,150,000 | b | 2,354,001 | |
MBARC Credit Canada,
Ser. 2016-AA. Cl. A3 | CAD | 1.72 | | 7/15/21 | | 900,000 | b | 672,566 | |
| | 32,394,680 | |
France - .2% | | | | | |
Bavarian Sky,
Ser. FRE1, Cl. A | EUR | 0.00 | | 4/20/24 | | 1,684,309 | c | 1,850,843 | |
Germany - 1.5% | | | | | |
Allianz,
Sub. Notes | EUR | 5.63 | | 10/17/42 | | 5,400,000 | c | 7,035,845 | |
Globaldrive Auto Receivables,
Ser. 2016-B, Cl. A | EUR | 0.13 | | 8/20/24 | | 4,546,482 | c | 5,019,711 | |
Volkswagen Car Lease,
Ser. 21, Cl. A | EUR | 0.00 | | 2/21/21 | | 1,289,122 | c | 1,417,410 | |
| | 13,472,966 | |
Hungary - 1.5% | | | | | |
Hungarian Development Bank,
Govt. Gtd. Notes | | 6.25 | | 10/21/20 | | 2,100,000 | b | 2,375,205 | |
Hungarian Government,
Bonds, Ser. 24/B | HUF | 3.00 | | 6/26/24 | | 1,081,250,000 | | 3,946,926 | |
Hungarian Government,
Bonds, Ser. 25/B | HUF | 5.50 | | 6/24/25 | | 1,778,650,000 | | 7,625,639 | |
| | 13,947,770 | |
8
| | | | | | | | | | | |
| |
Bonds and Notes - 97.0% (continued) | Coupon
Rate (%) | | Maturity Date | | Principal
Amount ($) | a | Value ($) | |
Iceland - .8% | | | | | |
Icelandic Government,
Unscd. Notes | | 5.88 | | 5/11/22 | | 6,100,000 | | 7,158,582 | |
Indonesia - 1.4% | | | | | |
Indonesian Government,
Sr. Unscd. Notes | EUR | 2.63 | | 6/14/23 | | 400,000 | b | 457,140 | |
Indonesian Government,
Sr. Unscd. Notes | EUR | 3.75 | | 6/14/28 | | 5,950,000 | b | 7,019,099 | |
Indonesian Government,
Sr. Unscd. Notes | | 6.75 | | 1/15/44 | | 4,100,000 | | 5,415,440 | |
| | 12,891,679 | |
Ireland - 1.4% | | | | | |
Aercap Ireland Capital,
Gtd. Notes | | 4.50 | | 5/15/21 | | 1,775,000 | | 1,849,550 | |
Aercap Ireland Capital,
Gtd. Notes | | 5.00 | | 10/1/21 | | 725,000 | | 772,125 | |
Irish Government,
Bonds | EUR | 2.40 | | 5/15/30 | | 6,370,000 | | 8,258,295 | |
Irish Government,
Bonds | EUR | 2.00 | | 2/18/45 | | 1,610,000 | | 1,970,405 | |
| | 12,850,375 | |
Italy - 4.5% | | | | | |
Enel,
Sr. Unscd. Bonds | EUR | 4.88 | | 2/20/18 | | 6,285,000 | | 7,333,666 | |
Intesa Sanpaolo,
Sr. Unscd. Notes | EUR | 3.00 | | 1/28/19 | | 3,565,000 | | 4,139,302 | |
Italian Government,
Sr. Unscd. Bonds | EUR | 2.35 | | 9/15/24 | | 17,920,000 | b,d | 22,581,437 | |
Italian Government,
Unscd. Bonds | EUR | 2.80 | | 3/1/67 | | 7,450,000 | | 7,484,202 | |
| | 41,538,607 | |
Japan - 23.2% | | | | | |
Japanese Government,
Sr. Unscd. Bonds, Ser. 118 | JPY | 0.20 | | 6/20/19 | | 1,687,500,000 | | 16,284,335 | |
Japanese Government,
Sr. Unscd. Bonds, Ser. 128 | JPY | 0.10 | | 6/20/21 | | 5,200,000,000 | | 50,268,683 | |
Japanese Government,
Sr. Unscd. Bonds, Ser. 156 | JPY | 0.40 | | 3/20/36 | | 2,300,500,000 | | 22,090,635 | |
Japanese Government,
Sr. Unscd. Bonds, Ser. 19 | JPY | 0.10 | | 9/10/24 | | 2,249,300,000 | e | 22,483,189 | |
Japanese Government,
Sr. Unscd. Bonds, Ser. 20 | JPY | 0.10 | | 3/10/25 | | 2,284,600,000 | e | 22,916,266 | |
Japanese Government,
Sr. Unscd. Bonds, Ser. 307 | JPY | 1.30 | | 3/20/20 | | 1,648,200,000 | | 16,529,700 | |
Japanese Government,
Sr. Unscd. Bonds, Ser. 330 | JPY | 0.80 | | 9/20/23 | | 1,327,350,000 | | 13,519,035 | |
Japanese Government,
Sr. Unscd. Bonds, Ser. 336 | JPY | 0.50 | | 12/20/24 | | 3,620,750,000 | | 36,327,651 | |
Japanese Government,
Sr. Unscd. Bonds, Ser. 44 | JPY | 1.70 | | 9/20/44 | | 988,550,000 | | 12,401,594 | |
| | 212,821,088 | |
Mexico - .6% | | | | | |
Banco Nacional de Comercio Exterior,
Sr. Unscd. Notes | | 4.38 | | 10/14/25 | | 5,100,000 | b,f | 5,290,740 | |
9
STATEMENT OF INVESTMENTS (continued)
| | | | | | | | | | | |
| |
Bonds and Notes - 97.0% (continued) | Coupon
Rate (%) | | Maturity
Date | | Principal
Amount ($) | a | Value ($) | |
Morocco - 2.6% | | | | | |
Moroccan Government,
Sr. Unscd. Bonds | EUR | 3.50 | | 6/19/24 | | 14,650,000 | | 17,405,429 | |
Moroccan Government,
Sr. Unscd. Notes | EUR | 4.50 | | 10/5/20 | | 5,000,000 | | 6,181,080 | |
| | 23,586,509 | |
Netherlands - 5.1% | | | | | |
ABN AMRO Bank,
Sub. Notes | | 4.75 | | 7/28/25 | | 7,250,000 | b | 7,643,602 | |
Equate Petrochemical,
Gtd. Notes | | 3.00 | | 3/3/22 | | 3,425,000 | b | 3,373,625 | |
Lukoil International Finance,
Gtd. Notes | | 4.75 | | 11/2/26 | | 4,275,000 | b | 4,283,935 | |
Mylan,
Gtd. Notes | | 2.50 | | 6/7/19 | | 2,275,000 | b | 2,299,563 | |
Rabobank Nederland,
Sub. Bonds | EUR | 2.50 | | 5/26/26 | | 4,391,000 | c | 5,046,992 | |
Shell International Finance,
Gtd. Notes | | 3.75 | | 9/12/46 | | 4,800,000 | | 4,608,307 | |
Teva Pharmaceutical Finance Netherlands II,
Gtd. Notes | EUR | 1.13 | | 10/15/24 | | 650,000 | | 708,113 | |
Teva Pharmaceutical Finance Netherlands II,
Gtd. Notes | EUR | 1.63 | | 10/15/28 | | 600,000 | | 646,421 | |
Teva Pharmaceutical Finance Netherlands III,
Gtd. Notes | | 2.80 | | 7/21/23 | | 1,200,000 | | 1,182,583 | |
Teva Pharmaceutical Finance Netherlands III,
Gtd. Notes | | 3.15 | | 10/1/26 | | 2,150,000 | | 2,096,710 | |
Volkswagen International Finance,
Gtd. Bonds | EUR | 3.75 | | 3/29/49 | | 4,500,000 | c | 5,044,871 | |
Volkswagen International Finance,
Gtd. Notes | | 2.38 | | 3/22/17 | | 3,050,000 | b | 3,063,057 | |
Volkswagen International Finance,
Gtd. Notes | | 1.60 | | 11/20/17 | | 280,000 | b | 279,607 | |
Vonovia Finance,
Gtd. Notes | EUR | 1.63 | | 12/15/20 | | 4,100,000 | | 4,744,433 | |
Vonovia Finance,
Gtd. Notes | EUR | 3.63 | | 10/8/21 | | 1,575,000 | | 2,001,093 | |
| | 47,022,912 | |
New Zealand - 1.7% | | | | | |
New Zealand Government,
Sr. Unscd. Bonds, Ser. 0925 | NZD | 2.00 | | 9/20/25 | | 20,754,000 | g | 15,969,958 | |
Norway - .3% | | | | | |
Norwegian Government,
Bonds, Ser. 474 | NOK | 3.75 | | 5/25/21 | | 17,145,000 | b | 2,331,399 | |
Peru - .3% | | | | | |
Peruvian Government,
Sr. Unscd. Bonds | EUR | 2.75 | | 1/30/26 | | 2,600,000 | | 3,160,600 | |
Poland - .7% | | | | | |
Polish Government,
Sr. Unscd. Notes | EUR | 1.50 | | 9/9/25 | | 1,975,000 | | 2,322,316 | |
10
| | | | | | | | | | | |
| |
Bonds and Notes - 97.0% (continued) | Coupon
Rate (%) | | Maturity
Date | | Principal
Amount ($) | a | Value ($) | |
Poland - .7% (continued) | | | | | |
Polish Government,
Unscd. Notes | EUR | 2.00 | | 10/25/46 | | 3,975,000 | | 4,306,937 | |
| | 6,629,253 | |
Qatar - .4% | | | | | |
Qatari Government,
Sr. Unscd. Notes | | 2.38 | | 6/2/21 | | 4,000,000 | b | 4,021,964 | |
Romania - 1.0% | | | | | |
Romanian Government,
Sr. Unscd. Notes | EUR | 2.75 | | 10/29/25 | | 3,200,000 | b | 3,767,158 | |
Romanian Government,
Unscd. Notes | EUR | 2.88 | | 5/26/28 | | 4,750,000 | b | 5,511,022 | |
| | 9,278,180 | |
Russia - .6% | | | | | |
Russian Government,
Sr. Unscd. Bonds | | 4.75 | | 5/27/26 | | 5,000,000 | b | 5,302,200 | |
Saudi Arabia - .5% | | | | | |
Saudi Arabian Government,
Sr. Unscd. Notes | | 2.38 | | 10/26/21 | | 4,675,000 | b | 4,664,837 | |
Serbia - .3% | | | | | |
Serbian Government,
Sr. Unscd. Notes | | 7.25 | | 9/28/21 | | 2,500,000 | | 2,876,268 | |
Singapore - 2.3% | | | | | |
Singapore Government,
Sr. Unscd. Bonds | SGD | 2.13 | | 6/1/26 | | 28,750,000 | | 21,106,788 | |
Spain - 3.9% | | | | | |
BBVA Subordinated Capital,
Gtd. Notes | EUR | 3.50 | | 4/11/24 | | 2,300,000 | c | 2,650,041 | |
Driver Espana,
Ser. 3, Cl. A | EUR | 0.68 | | 12/21/26 | | 2,878,016 | c | 3,186,976 | |
Santander Issuances,
Gtd. Notes | EUR | 2.50 | | 3/18/25 | | 2,800,000 | | 3,038,616 | |
Spanish Government,
Bonds | EUR | 5.75 | | 7/30/32 | | 5,560,000 | | 9,567,613 | |
Spanish Government,
Unscd. Notes | EUR | 1.60 | | 4/30/25 | | 12,475,000 | b | 14,399,364 | |
Telefonica Emisiones,
Gtd. Notes | EUR | 3.96 | | 3/26/21 | | 2,600,000 | | 3,292,389 | |
| | 36,134,999 | |
Sri Lanka - .6% | | | | | |
Sri Lankan Government,
Sr. Unscd. Bonds | | 5.75 | | 1/18/22 | | 5,125,000 | b,f | 5,208,901 | |
Supranational - 3.4% | | | | | |
European Investment Bank,
Sr. Unscd. Bonds | JPY | 1.40 | | 6/20/17 | | 36,300,000 | | 350,027 | |
European Investment Bank,
Sr. Unscd. Notes | CAD | 1.13 | | 9/16/21 | | 2,975,000 | b | 2,207,151 | |
International Bank for Reconstruction & Development,
Sr. Unscd. Notes | NZD | 3.50 | | 1/22/21 | | 24,875,000 | | 18,287,317 | |
Nordic Investment Bank,
Sr. Unscd. Notes | NOK | 1.38 | | 7/15/20 | | 85,000,000 | | 10,361,938 | |
| | 31,206,433 | |
11
STATEMENT OF INVESTMENTS (continued)
| | | | | | | | | | | |
| |
Bonds and Notes - 97.0% (continued) | Coupon
Rate (%) | | Maturity
Date | | Principal
Amount ($) | a | Value ($) | |
Sweden - 1.3% | | | | | |
Swedish Government,
Bonds, Ser. 1047 | SEK | 5.00 | | 12/1/20 | | 86,125,000 | | 11,729,197 | |
United Kingdom - 11.7% | | | | | |
Barclays,
Jr. Sub. Bonds | | 7.88 | | 12/29/49 | | 2,325,000 | c | 2,314,189 | |
Barclays,
Sub. Notes | | 5.20 | | 5/12/26 | | 2,925,000 | | 3,022,631 | |
British Telecommunications,
Sr. Unscd. Notes | EUR | 0.63 | | 3/10/21 | | 3,175,000 | | 3,516,455 | |
Diageo Finance,
Gtd. Notes | EUR | 2.38 | | 5/20/26 | | 3,050,000 | | 3,810,754 | |
E-Carat,
Ser. 2016-1, Cl. A | EUR | 0.08 | | 10/18/24 | | 3,100,000 | c | 3,416,221 | |
Lloyds Banking Group,
Gtd. Notes | | 3.10 | | 7/6/21 | | 1,600,000 | f | 1,648,200 | |
Royal Bank of Scotland Group,
Sr. Unscd. Notes | | 3.88 | | 9/12/23 | | 8,675,000 | | 8,509,906 | |
United Kingdom Gilt,
Bonds | GBP | 2.00 | | 9/7/25 | | 35,300,000 | | 46,362,688 | |
United Kingdom Gilt,
Unscd. Bonds | GBP | 3.25 | | 1/22/44 | | 12,885,000 | | 20,391,890 | |
United Kingdom Gilt,
Unscd. Bonds | GBP | 3.50 | | 1/22/45 | | 7,175,000 | | 11,913,122 | |
Vodafone Group,
Sr. Unscd. Notes | EUR | 1.25 | | 8/25/21 | | 2,400,000 | | 2,741,024 | |
| | 107,647,080 | |
United States - 18.9% | | | | | |
Aetna,
Sr. Unscd. Notes | | 1.90 | | 6/7/19 | | 3,050,000 | | 3,076,385 | |
Ally Financial,
Gtd. Notes | | 3.50 | | 1/27/19 | | 3,415,000 | | 3,423,538 | |
Amgen,
Sr. Unscd. Notes | | 4.40 | | 5/1/45 | | 1,075,000 | | 1,098,591 | |
Apple,
Sr. Unscd. Notes | | 3.25 | | 2/23/26 | | 3,760,000 | | 3,939,559 | |
Bear Stearns ALT-A Trust,
Ser. 2004-2, Cl. 2A1 | | 3.00 | | 3/25/34 | | 1,762,957 | c | 1,746,342 | |
Bear Stearns Commercial Mortgage Securities Trust,
Ser. 2005-PWR10, Cl. AJ | | 5.59 | | 12/11/40 | | 773,478 | c | 773,287 | |
Bear Stearns Commercial Mortgage Securities Trust,
Ser. 2007-PWR17, Cl. AJ | | 5.89 | | 6/11/50 | | 2,975,000 | c | 2,998,815 | |
Bear Stearns Commercial Mortgage Securities Trust,
Ser. 2007-PWR18, Cl. AJ | | 6.21 | | 6/11/50 | | 3,300,000 | c | 3,215,066 | |
Celgene,
Sr. Unscd. Notes | | 5.00 | | 8/15/45 | | 2,800,000 | | 3,018,879 | |
Citigroup,
Sr. Unscd. Notes | | 4.65 | | 7/30/45 | | 2,250,000 | | 2,473,290 | |
Citigroup,
Sub. Bonds | | 4.40 | | 6/10/25 | | 4,650,000 | | 4,921,541 | |
Colony Starwood Homes,
Ser. 2016-2A, Cl. A | | 1.79 | | 12/17/33 | | 4,200,000 | b,c | 4,206,721 | |
Countrywide Alternative Loan Trust,
Ser. 2004-18CB, Cl. 4A1 | | 5.50 | | 9/25/34 | | 2,826,287 | | 2,909,120 | |
12
| | | | | | | | | | | |
| |
Bonds and Notes - 97.0% (continued) | Coupon
Rate (%) | | Maturity
Date | | Principal
Amount ($) | a | Value ($) | |
United States - 18.9% (continued) | | | | | |
Cox Communications,
Sr. Unscd. Notes | | 3.35 | | 9/15/26 | | 1,150,000 | b | 1,136,925 | |
Crown Castle International,
Sr. Unscd. Notes | | 2.25 | | 9/1/21 | | 1,800,000 | | 1,787,168 | |
Daimler Finance North America,
Gtd. Notes | | 1.50 | | 7/5/19 | | 3,200,000 | b | 3,179,210 | |
Dell Equipment Finance Trust,
Ser. 2016-1, Cl. A2 | | 1.43 | | 9/24/18 | | 3,775,000 | b | 3,778,564 | |
Duke Energy,
Sr. Unscd. Notes | | 2.65 | | 9/1/26 | | 1,050,000 | | 1,024,335 | |
Duke Energy,
Sr. Unscd. Notes | | 3.75 | | 9/1/46 | | 2,050,000 | | 1,964,654 | |
Ford Motor Credit,
Sr. Unscd. Notes | | 3.34 | | 3/18/21 | | 3,750,000 | | 3,860,362 | |
Freeport-McMoRan,
Gtd. Notes | | 2.15 | | 3/1/17 | | 2,400,000 | | 2,397,000 | |
GAHR Commercial Mortgage Trust,
Ser. 2015-NRF, Cl. EFX | | 3.38 | | 12/15/34 | | 3,260,000 | b,c | 3,210,957 | |
GAHR Commercial Mortgage Trust,
Ser. 2015-NRF, Cl. FFX | | 3.38 | | 12/15/34 | | 2,770,000 | b,c | 2,652,640 | |
General Electric,
Jr. Sub. Debs., Ser. D | | 5.00 | | 12/29/49 | | 3,703,000 | c | 3,927,587 | |
General Motors Financial,
Gtd. Notes | | 2.35 | | 10/4/19 | | 4,850,000 | | 4,848,269 | |
JP Morgan Chase Commercial Mortgage Securities Trust,
Ser. 2006-CB17, Cl. AM | | 5.46 | | 12/12/43 | | 2,860,000 | | 2,857,706 | |
JP Morgan Chase Commercial Mortgage Securities Trust,
Ser. 2006-LDP9, Cl. AM | | 5.37 | | 5/15/47 | | 3,865,000 | | 3,876,622 | |
JP Morgan Chase Commercial Mortgage Securities Trust,
Ser. 2007-LDPX, Cl. AM | | 5.46 | | 1/15/49 | | 2,990,000 | c | 2,935,728 | |
KeyCorp Student Loan Trust,
Ser. 1999-B, Cl. CTFS | | 1.54 | | 11/25/36 | | 2,060,154 | c | 1,983,529 | |
Kraft Heinz Foods,
Gtd. Notes | EUR | 2.25 | | 5/25/28 | | 5,075,000 | | 5,967,168 | |
Long Beach Mortgage Loan Trust,
Ser. 2004-1, Cl. M2 | | 1.35 | | 2/25/34 | | 627,201 | c | 599,242 | |
ML-CFC Commercial Mortgage Trust,
Ser. 2006-4, Cl. AJ | | 5.24 | | 12/12/49 | | 3,075,000 | | 3,071,287 | |
Morgan Stanley Capital I Trust,
Ser. 2007-IQ14, Cl. AM | | 5.68 | | 4/15/49 | | 4,460,000 | c | 4,341,696 | |
Morgan Stanley Mortgage Loan Trust,
Ser. 2005-1, Cl. 4A1 | | 0.83 | | 3/25/35 | | 870,879 | c | 797,879 | |
Newell Brands,
Sr. Unscd. Notes | | 2.60 | | 3/29/19 | | 1,695,000 | f | 1,730,164 | |
Oracle,
Sr. Unscd. Notes | | 4.00 | | 7/15/46 | | 4,275,000 | | 4,237,230 | |
Scientific Games International,
Gtd. Notes | | 10.00 | | 12/1/22 | | 2,560,000 | | 2,368,000 | |
Southern,
Sr. Unscd. Notes | | 3.25 | | 7/1/26 | | 3,525,000 | f | 3,630,739 | |
Sprint Communications,
Sr. Unscd. Notes | | 7.00 | | 8/15/20 | | 1,335,000 | | 1,388,400 | |
13
STATEMENT OF INVESTMENTS (continued)
| | | | | | | | | | | |
| |
Bonds and Notes - 97.0% (continued) | Coupon
Rate (%) | | Maturity
Date | | Principal
Amount ($) | a | Value ($) | |
United States - 18.9% (continued) | | | | | |
Sprint Spectrum,
Sr. Scd. Notes | | 3.36 | | 3/20/23 | | 3,250,000 | b | 3,274,375 | |
T-Mobile USA,
Gtd. Notes | | 6.00 | | 3/1/23 | | 3,825,000 | | 4,035,375 | |
U.S. Treasury Inflation Protected Securities,
Notes | | 0.13 | | 4/15/20 | | 22,960,369 | h | 23,405,364 | |
U.S. Treasury Inflation Protected Securities,
Notes | | 0.63 | | 1/15/26 | | 9,578,709 | h | 10,004,396 | |
UBS-Barclays Commercial Mortgage Trust,
Ser. 2013-C5, Cl. C | | 4.09 | | 3/10/46 | | 1,700,000 | b,c | 1,711,103 | |
Verizon Owner Trust,
Ser. 2016-1A, Cl. A | | 1.42 | | 1/20/21 | | 3,100,000 | b | 3,107,582 | |
Volkswagen Group of America Finance,
Gtd. Notes | | 1.25 | | 5/23/17 | | 2,670,000 | b | 2,665,055 | |
Wachovia Bank Commercial Mortgage Trust,
Ser. 2007-C32, Cl. AJ | | 5.70 | | 6/15/49 | | 3,080,000 | c | 3,020,461 | |
Walgreens Boots Alliance,
Sr. Unscd. Notes | | 1.75 | | 5/30/18 | | 2,075,000 | | 2,085,580 | |
Walt Disney,
Sr. Unscd. Notes | | 3.00 | | 7/30/46 | | 900,000 | | 801,915 | |
ZFS Finance (USA) Trust V,
Jr. Sub. Cap. Secs. | | 6.50 | | 5/9/37 | | 7,785,000 | b,c | 7,860,904 | |
| | 173,326,305 | |
Total Bonds and Notes
(cost $894,671,182) | | 891,128,182 | |
Options Purchased - .2% | | | | | Face Amount Covered by Contracts | | Value ($) | |
Call Options - .1% | | | | | |
New Zealand Cross Currency,
December 2016 @ NZD 1.04 | | | | AUD | | 50,900,000 | | 976,972 | |
Put Options - .1% | | | | | |
Mexican Peso,
December 2016 @ MXN 18.68 | | | | | | 28,600,000 | | 573,471 | |
Mexican Peso,
December 2016 @ MXN 18.76 | | | | | | 19,300,000 | | 428,435 | |
Swedish Krona Cross Currency,
December 2016 @ SEK 9.46 | | | | EUR | | 17,200,000 | | 9,057 | |
| | 1,010,963 | |
Total Options Purchased
(cost $1,338,338) | | 1,987,935 | |
Short-Term Investments - 1.2% | Yield at
Date of
Purchase (%) | | Maturity Date | | Principal Amount ($) | | Value ($) | |
U.S. Treasury Bills
(cost $11,374,048) | | 0.46 | | 4/27/17 | | 11,400,000 | i | 11,372,674 | |
14
| | | | | | | | | | | |
| |
Other Investment - 1.2% | | | | | Shares | | Value ($) | |
Registered Investment Company; | | | | | |
Dreyfus Institutional Preferred Government Plus Money Market Fund
(cost $10,733,441) | | | | | | 10,733,441 | j | 10,733,441 | |
Investment of Cash Collateral for Securities Loaned - .7% | | | | | | | | |
Registered Investment Company; | | | | | |
Dreyfus Institutional Preferred Money Market Fund, Hamilton Shares
(cost $6,497,500) | | | | | | 6,497,500 | j | 6,497,500 | |
Total Investments (cost $924,614,509) | | 100.3% | 921,719,732 | |
Liabilities, Less Cash and Receivables | | (0.3%) | (3,129,613) | |
Net Assets | | 100.0% | 918,590,119 | |
AUD—Australian Dollar
EUR—Euro
a Principal amount stated in U.S. Dollars unless otherwise noted.
ARS—Argentine Peso
CAD—Canadian Dollar
EUR—Euro
GBP—British Pound
HUF—Hungarian Forint
JPY—Japanese Yen
NOK—Norwegian Krone
NZD—New Zealand Dollar
SEK—Swedish Krona
SGD—Singapore Dollar
b Security exempt from registration pursuant to Rule 144A under the Securities Act of 1933. These securities may be resold in transactions exempt from registration, normally to qualified institutional buyers. At October 31, 2016, these securities were valued at $166,842,526 or 18.16% of net assets.
c Variable rate security—rate shown is the interest rate in effect at period end.
d Principal amount for accrual purposes is periodically adjusted based on changes in the Italian Consumer Price Index.
e Principal amount for accrual purposes is periodically adjusted based on changes in the Japanese Consumer Price Index.
f Security, or portion thereof, on loan. At October 31, 2016, the value of the fund’s securities on loan was $7,925,941 and the value of the collateral held by the fund was $8,192,395, consisting of cash collateral of $6,497,500 and U.S. Government & Agency securities valued at $1,694,895.
g Principal amount for accrual purposes is periodically adjusted based on changes in the New Zealand Consumer Price Index.
h Principal amount for accrual purposes is periodically adjusted based on changes in the Consumer Price Index.
i Held by or on behalf of a counterparty for open derivative positions.
j Investment in affiliated money market mutual fund.
15
STATEMENT OF INVESTMENTS (continued)
| | |
Portfolio Summary (Unaudited) † | Value (%) |
Non-U.S. Government | 63.9 |
Corporate-Investment Grade | 18.5 |
Securitized | 8.9 |
U.S. Government | 4.9 |
Corporate-High Yield | 2.0 |
Cash & Equivalents | 1.9 |
Options Purchased | .2 |
| | 100.3 |
† Based on net assets.
See notes to financial statements.
16
STATEMENT OF FINANCIAL FUTURES
October 31, 2016
| | | | | | |
| | Contracts | Market Value Covered by Contracts ($) | Expiration | Unrealized Appreciation (Depreciation) ($) | |
| | | | | | |
Financial Futures Long | | | | | |
Australian 3 Year Bond | 1,811 | 155,060,189 | December 2016 | (544,942) | |
Canadian 10 year Bond | 311 | 33,532,260 | December 2016 | (428,845) | |
Euro 30 Year Bond | 78 | 15,402,206 | December 2016 | (997,002) | |
Euro-Bobl | 279 | 40,155,541 | December 2016 | (162,662) | |
Euro-Bond | 101 | 17,980,317 | December 2016 | (190,184) | |
Japanese 10 Year Bond | 49 | 70,885,763 | December 2016 | 1,209 | |
Long Gilt | 42 | 6,443,506 | December 2016 | (127,834) | |
Financial Futures Short | | | | | |
Australian 10 Year Bond | 118 | (11,904,520) | December 2016 | 185,461 | |
U.S. Treasury 10 Year Notes | 216 | (27,999,000) | December 2016 | 24,473 | |
U.S. Treasury 5 Year Notes | 33 | (3,986,297) | December 2016 | (3,870) | |
U.S. Treasury Ultra Long Bond | 95 | (16,714,062) | December 2016 | 347,160 | |
Gross Unrealized Appreciation | | | | 558,303 | |
Gross Unrealized Depreciation | | | | (2,455,339) | |
See notes to financial statements.
17
STATEMENT OF OPTIONS WRITTEN
October 31, 2016
| | | | | | | |
| | | Face Amount Covered by Contracts ($) | | Value ($) | |
Call Options: | | | | | |
Mexican Peso, | | | | | |
December 2016 @ MXN 21.25 | | 28,600,000 | | (161,220) | |
Mexican Peso, | | | | | |
December 2016 @ MXN 21.35 | | 19,300,000 | | (100,837) | |
Swedish Krona, | | | | | |
December 2016 @ SEK 9.85 | | 17,200,000 | | (264,236) | |
Total Options Written (premiums received $867,324) | | | | (526,293) | |
See notes to financial statements.
18
STATEMENT OF ASSETS AND LIABILITIES
October 31, 2016
| | | | | | | |
| | | | | | |
| | | Cost | | Value | |
Assets ($): | | | | |
Investments in securities—See Statement of Investments
(including securities on loan, valued at $7,925,941)—Note 1(c): | | | | |
Unaffiliated issuers | | 907,383,568 | | 904,488,791 | |
Affiliated issuers | | 17,230,941 | | 17,230,941 | |
Cash | | | | | 2,271,785 | |
Cash denominated in foreign currency | | | 3,389,046 | | 3,303,924 | |
Dividends, interest and securities lending income receivable | | | | | 6,232,247 | |
Cash collateral held by broker—Note 4 | | | | | 5,580,471 | |
Receivable for shares of Beneficial Interest subscribed | | | | | 4,155,400 | |
Receivable for investment securities sold | | | | | 3,102,120 | |
Unrealized appreciation on forward foreign
currency exchange contracts—Note 4 | | | | | 1,800,968 | |
Receivable for futures variation margin—Note 4 | | | | | 190,773 | |
Prepaid expenses | | | | | 50,141 | |
| | | | | 948,407,561 | |
Liabilities ($): | | | | |
Due to The Dreyfus Corporation and affiliates—Note 3(c) | | | | | 710,435 | |
Payable for investment securities purchased | | | | | 13,506,693 | |
Liability for securities on loan—Note 1(c) | | | | | 6,497,500 | |
Payable for shares of Beneficial Interest redeemed | | | | | 4,233,469 | |
Unrealized depreciation on forward foreign
currency exchange contracts—Note 4 | | | | | 2,915,731 | |
Payable for swap variation margin—Note 4 | | | | | 948,090 | |
Outstanding options written, at value (premiums received
$867,324)—See Statement of Options Written—Note 4 | | | | | 526,293 | |
Unrealized depreciation on swap agreements—Note 4 | | | | | 189,417 | |
Accrued expenses | | | | | 289,814 | |
| | | | | 29,817,442 | |
Net Assets ($) | | | 918,590,119 | |
Composition of Net Assets ($): | | | | |
Paid-in capital | | | | | 1,041,149,753 | |
Accumulated distributions in excess of investment income—net | | | | | (4,590,653) | |
Accumulated net realized gain (loss) on investments | | | | | (108,422,597) | |
Accumulated net unrealized appreciation (depreciation)
on investments, options transactions, swap transactions and
foreign currency transactions [including ($1,897,036) net
unrealized (depreciation) on financial futures and ($3,602,329)
net unrealized (depreciation) on centrally cleared swap
transactions] | | | | (9,546,384) | |
Net Assets ($) | | | 918,590,119 | |
| | | | | | |
Net Asset Value Per Share | Class A | Class C | Class I | Class Y | |
Net Assets ($) | 135,946,815 | 52,515,792 | 699,252,568 | 30,874,944 | |
Shares Outstanding | 8,856,450 | 3,506,954 | 45,156,856 | 1,993,159 | |
Net Asset Value Per Share ($) | 15.35 | 14.97 | 15.48 | 15.49 | |
| | | | | | |
See notes to financial statements. | | | | | |
19
STATEMENT OF OPERATIONS
Year Ended October 31, 2016
| | | | | | | |
| | | | | | |
| | | | | | |
Investment Income ($): | | | | |
Income: | | | | |
Interest | | | 24,756,746 | |
Dividends from affiliated issuers | | | 63,805 | |
Income from securities lending—Note 1(c) | | | 69,053 | |
Total Income | | | 24,889,604 | |
Expenses: | | | | |
Management fee—Note 3(a) | | | 5,990,327 | |
Shareholder servicing costs—Note 3(c) | | | 1,788,489 | |
Distribution fees—Note 3(b) | | | 440,746 | |
Custodian fees—Note 3(c) | | | 177,263 | |
Prospectus and shareholders’ reports | | | 148,796 | |
Professional fees | | | 87,252 | |
Trustees’ fees and expenses—Note 3(d) | | | 75,799 | |
Registration fees | | | 74,439 | |
Loan commitment fees—Note 2 | | | 18,248 | |
Miscellaneous | | | 64,325 | |
Total Expenses | | | 8,865,684 | |
Less—reduction in fees due to earnings credits—Note 3(c) | | | (5,581) | |
Net Expenses | | | 8,860,103 | |
Investment Income—Net | | | 16,029,501 | |
Realized and Unrealized Gain (Loss) on Investments—Note 4 ($): | | |
Net realized gain (loss) on investments and foreign currency transactions | (18,322,275) | |
Net realized gain (loss) on options transactions | (1,453,689) | |
Net realized gain (loss) on financial futures | (7,598,249) | |
Net realized gain (loss) on swap transactions | (11,553,008) | |
Net realized gain (loss) on forward foreign currency exchange contracts | 8,796,169 | |
Net Realized Gain (Loss) | | | (30,131,052) | |
Net unrealized appreciation (depreciation) on investments
and foreign currency transactions | | | 44,801,697 | |
Net unrealized appreciation (depreciation) on options transactions | | | 990,628 | |
Net unrealized appreciation (depreciation) on financial futures | | | (1,575,988) | |
Net unrealized appreciation (depreciation) on swap transactions | | | 6,362,546 | |
Net unrealized appreciation (depreciation) on
forward foreign currency exchange contracts | | | (425,157) | |
Net Unrealized Appreciation (Depreciation) | | | 50,153,726 | |
Net Realized and Unrealized Gain (Loss) on Investments | | | 20,022,674 | |
Net Increase in Net Assets Resulting from Operations | | 36,052,175 | |
| | | | | | | |
See notes to financial statements. | | | | | |
20
STATEMENT OF CHANGES IN NET ASSETS
| | | | | | | | | | |
| | | | Year Ended October 31, |
| | | | 2016 | | | | 2015 | |
Operations ($): | | | | | | | | |
Investment income—net | | | 16,029,501 | | | | 32,856,795 | |
Net realized gain (loss) on investments | | (30,131,052) | | | | (62,330,100) | |
Net unrealized appreciation (depreciation)
on investments | | 50,153,726 | | | | (36,135,115) | |
Net Increase (Decrease) in Net Assets
Resulting from Operations | 36,052,175 | | | | (65,608,420) | |
Dividends to Shareholders from ($): | | | | | | | | |
Investment income—net: | | | | | | | | |
Class A | | | (6,641,676) | | | | (11,830,026) | |
Class C | | | (2,006,675) | | | | (3,136,193) | |
Class I | | | (27,979,522) | | | | (51,922,794) | |
Class Y | | | (1,081,049) | | | | (1,396,734) | |
Total Dividends | | | (37,708,922) | | | | (68,285,747) | |
Beneficial Interest Transactions ($): | | | | | | | | |
Net proceeds from shares sold: | | | | | | | | |
Class A | | | 36,491,285 | | | | 72,976,571 | |
Class C | | | 3,976,649 | | | | 3,930,975 | |
Class I | | | 339,427,283 | | | | 387,179,454 | |
Class Y | | | 6,724,870 | | | | 17,212,084 | |
Dividends reinvested: | | | | | | | | |
Class A | | | 6,358,838 | | | | 10,985,354 | |
Class C | | | 1,418,925 | | | | 2,263,855 | |
Class I | | | 20,342,406 | | | | 28,717,742 | |
Class Y | | | 905,486 | | | | 1,156,096 | |
Cost of shares redeemed: | | | | | | | | |
Class A | | | (120,738,766) | | | | (163,597,731) | |
Class C | | | (21,996,065) | | | | (33,779,138) | |
Class I | | | (479,398,390) | | | | (729,044,279) | |
Class Y | | | (7,822,862) | | | | (14,361,745) | |
Increase (Decrease) in Net Assets
from Beneficial Interest Transactions | (214,310,341) | | | | (416,360,762) | |
Total Increase (Decrease) in Net Assets | (215,967,088) | | | | (550,254,929) | |
Net Assets ($): | | | | | | | | |
Beginning of Period | | | 1,134,557,207 | | | | 1,684,812,136 | |
End of Period | | | 918,590,119 | | | | 1,134,557,207 | |
Undistributed (distributions in excess of)
investment income—net | (4,590,653) | | | | 37,949,175 | |
21
STATEMENT OF CHANGES IN NET ASSETS (continued)
| | | | | | | | | | |
| | | | Year Ended October 31, |
| | | | 2016 | | | | 2015 | |
Capital Share Transactions (Shares): | | | | | | | | |
Class Aa | | | | | | | | |
Shares sold | | | 2,386,978 | | | | 4,545,871 | |
Shares issued for dividends reinvested | | | 434,242 | | | | 678,739 | |
Shares redeemed | | | (7,967,669) | | | | (10,302,134) | |
Net Increase (Decrease) in Shares Outstanding | (5,146,449) | | | | (5,077,524) | |
Class Ca | | | | | | | | |
Shares sold | | | 265,437 | | | | 248,932 | |
Shares issued for dividends reinvested | | | 99,037 | | | | 142,604 | |
Shares redeemed | | | (1,483,126) | | | | (2,154,584) | |
Net Increase (Decrease) in Shares Outstanding | (1,118,652) | | | | (1,763,048) | |
Class Ia | | | | | | | | |
Shares sold | | | 21,928,494 | | | | 24,012,368 | |
Shares issued for dividends reinvested | | | 1,381,261 | | | | 1,765,708 | |
Shares redeemed | | | (31,023,950) | | | | (45,870,000) | |
Net Increase (Decrease) in Shares Outstanding | (7,714,195) | | | | (20,091,924) | |
Class Ya | | | | | | | | |
Shares sold | | | 426,395 | | | | 1,066,600 | |
Shares issued for dividends reinvested | | | 61,541 | | | | 71,176 | |
Shares redeemed | | | (516,603) | | | | (911,484) | |
Net Increase (Decrease) in Shares Outstanding | (28,667) | | | | 226,292 | |
| | | | | | | | | | |
a | During the period ended October 31, 2016, 513 Class A shares representing $7,943 were exchanged for 509 Class I shares, 2,600 Class C shares representing $36,634 were exchanged for 2,548 Class A shares and 150,972 Class I shares representing $2,379,285 were exchanged for 150,971 Class Y shares. | |
See notes to financial statements. | | | | | | | | |
22
FINANCIAL HIGHLIGHTS
The following tables describe the performance for each share class for the fiscal periods indicated. All information (except portfolio turnover rate) reflects financial results for a single fund share. Total return shows how much your investment in the fund would have increased (or decreased) during each period, assuming you had reinvested all dividends and distributions. These figures have been derived from the fund’s financial statements.
| | | | | | | |
| | | |
| | | Year Ended October 31, |
Class A Shares | | 2016 | 2015 | 2014 | 2013 | 2012 |
Per Share Data ($): | | | | | | |
Net asset value, beginning of period | | 15.38 | 16.75 | 16.53 | 17.48 | 16.85 |
Investment Operations: | | | | | | |
Investment income—neta | | .19 | .31 | .39 | .39 | .34 |
Net realized and unrealized
gain (loss) on investments | | .30 | (1.03) | .06 | (.75) | .65 |
Total from Investment Operations | | .49 | (.72) | .45 | (.36) | .99 |
Distributions: | | | | | | |
Dividends from Investment
income—net | | (.52) | (.65) | (.23) | (.37) | (.19) |
Dividends from net realized
gain on investments | | - | - | - | (.22) | (.17) |
Total Distributions | | (.52) | (.65) | (.23) | (.59) | (.36) |
Net asset value, end of period | | 15.35 | 15.38 | 16.75 | 16.53 | 17.48 |
Total Return (%)b | | 3.38 | (4.45) | 2.77 | (2.14) | 6.04 |
Ratios/Supplemental Data (%): | | | | | | |
Ratio of total expenses
to average net assets | | 1.23 | 1.12 | 1.08 | 1.07 | 1.02 |
Ratio of net expenses
to average net assets | | 1.23 | 1.12 | 1.08 | 1.07 | 1.02 |
Ratio of net investment income
to average net assets | | 1.27 | 1.93 | 2.31 | 2.28 | 2.02 |
Portfolio Turnover Rate | | 126.57 | 216.56 | 209.53 | 169.41 | 192.50 |
Net Assets, end of period ($ x 1,000) | | 135,947 | 215,337 | 319,588 | 552,695 | 683,387 |
a Based on average shares outstanding.
b Exclusive of sales charge.
See notes to financial statements.
23
FINANCIAL HIGHLIGHTS (continued)
| | | | | | | |
| | | |
| | | Year Ended October 31, |
Class C Shares | | 2016 | 2015 | 2014 | 2013 | 2012 |
Per Share Data ($): | | | | | | |
Net asset value, beginning of period | | 15.05 | 16.39 | 16.17 | 17.11 | 16.54 |
Investment Operations: | | | | | | |
Investment income—neta | | .11 | .20 | .27 | .26 | .21 |
Net realized and unrealized
gain (loss) on investments | | .29 | (1.01) | .07 | (.72) | .64 |
Total from Investment Operations | | .40 | (.81) | .34 | (.46) | .85 |
Distributions: | | | | | | |
Dividends from investment
income—net | | (.48) | (.53) | (.12) | (.26) | (.11) |
Dividends from net realized
gain on investments | | - | - | - | (.22) | (.17) |
Total Distributions | | (.48) | (.53) | (.12) | (.48) | (.28) |
Net asset value, end of period | | 14.97 | 15.05 | 16.39 | 16.17 | 17.11 |
Total Return (%)b | | 2.78 | (5.09) | 2.09 | (2.78) | 5.23 |
Ratios/Supplemental Data (%): | | | | | | |
Ratio of total expenses
to average net assets | | 1.78 | 1.77 | 1.76 | 1.75 | 1.76 |
Ratio of net expenses
to average net assets | | 1.78 | 1.77 | 1.76 | 1.75 | 1.76 |
Ratio of net investment income
to average net assets | | .71 | 1.29 | 1.63 | 1.60 | 1.31 |
Portfolio Turnover Rate | | 126.57 | 216.56 | 209.53 | 169.41 | 192.50 |
Net Assets, end of period ($ x 1,000) | | 52,516 | 69,609 | 104,681 | 152,333 | 198,824 |
a Based on average shares outstanding.
b Exclusive of sales charge.
See notes to financial statements.
24
| | | | | | | | |
| | | |
| | | Year Ended October 31, |
Class I Shares | | 2016 | 2015 | 2014 | 2013 | 2012 |
Per Share Data ($): | | | | | | |
Net asset value, beginning of period | | 15.48 | 16.86 | 16.65 | 17.58 | 16.94 |
Investment Operations: | | | | | | |
Investment income—neta | | .27 | .38 | .44 | .44 | .39 |
Net realized and unrealized
gain (loss) on investments | | .29 | (1.04) | .07 | (.74) | .64 |
Total from Investment Operations | | .56 | (.66) | .51 | (.30) | 1.03 |
Distributions: | | | | | | |
Dividends from Investment
income—net | | (.56) | (.72) | (.30) | (.41) | (.22) |
Dividends from net realized
gain on investments | | - | - | - | (.22) | (.17) |
Total Distributions | | (.56) | (.72) | (.30) | (.63) | (.39) |
Net asset value, end of period | | 15.48 | 15.48 | 16.86 | 16.65 | 17.58 |
Total Return (%) | | 3.90 | (4.07) | 3.08 | (1.78) | 6.27 |
Ratios/Supplemental Data (%): | | | | | | |
Ratio of total expenses
to average net assets | | .75 | .74 | .75 | .74 | .80 |
Ratio of net expenses
to average net assets | | .75 | .74 | .75 | .74 | .80 |
Ratio of net investment income
to average net assets | | 1.74 | 2.32 | 2.65 | 2.60 | 2.29 |
Portfolio Turnover Rate | | 126.57 | 216.56 | 209.53 | 169.41 | 192.50 |
Net Assets, end of period ($ x 1,000) | | 699,253 | 818,322 | 1,230,266 | 875,269 | 934,809 |
a Based on average shares outstanding.
See notes to financial statements.
25
FINANCIAL HIGHLIGHTS (continued)
| | | | | | |
| | Year Ended October 31, |
| |
Class Y Shares | 2016 | 2015 | 2014 | 2013 | a |
Per Share Data ($): | | | | | |
Net asset value, beginning of period | 15.48 | 16.86 | 16.65 | 16.33 | |
Investment Operations: | | | | | |
Investment income—netb | .28 | .39 | .47 | .14 | |
Net realized and unrealized
gain (loss) on investments | .30 | (1.03) | .05 | .26 | |
Total from Investment Operations | .58 | (.64) | .52 | .40 | |
Distributions: | | | | | |
Dividends from Investment
income—net | (.57) | (.74) | (.31) | (.08) | |
Net asset value, end of period | 15.49 | 15.48 | 16.86 | 16.65 | |
Total Return (%) | 3.94 | (3.98) | 3.13 | 2.43 | c |
Ratios/Supplemental Data (%): | | | | | |
Ratio of total expenses
to average net assets | .67 | .67 | .68 | .74 | d |
Ratio of net expenses
to average net assets | .67 | .67 | .68 | .74 | d |
Ratio of net investment income
to average net assets | 1.82 | 2.39 | 2.71 | 2.63 | d |
Portfolio Turnover Rate | 126.57 | 216.56 | 209.53 | 169.41 | |
Net Assets, end of period ($ x 1,000) | 30,875 | 31,290 | 30,278 | 1 | |
a From July 1, 2013 (commencement of initial offering) to October 31, 2013.
b Based on average shares outstanding.
c Not annualized.
d Annualized.
See notes to financial statements.
26
NOTES TO FINANCIAL STATEMENTS
NOTE 1—Significant Accounting Policies:
Dreyfus International Bond Fund (the “fund”) is a separate non-diversified series of The Dreyfus/Laurel Funds Trust (the “Trust”), which is registered under the Investment Company Act of 1940, as amended (the “Act”), as an open-end management investment company and operates as a series company currently offering five series, including the fund. The fund’s investment objective is to seek to maximize total return through capital appreciation and income. The Dreyfus Corporation (the “Manager” or “Dreyfus”), a wholly-owned subsidiary of The Bank of New York Mellon Corporation (“BNY Mellon”), serves as the fund’s investment adviser.
MBSC Securities Corporation (the “Distributor”), a wholly-owned subsidiary of Dreyfus, is the distributor of the fund’s shares. The fund is authorized to issue an unlimited number of $.001 par value shares of Beneficial Interest in each of the following classes of shares: Class A, Class C, Class I and Class Y. Class A and Class C shares are sold primarily to retail investors through financial intermediaries and bear Distribution and/or Shareholder Services Plan fees. Class A shares generally are subject to a sales charge imposed at the time of purchase. Class C shares are subject to a contingent deferred sales charge (“CDSC”) imposed on Class C shares redeemed within one year of purchase. Class I shares are sold primarily to bank trust departments and other financial service providers (including The Bank of New York Mellon, a subsidiary of BNY Mellon and an affiliate of Dreyfus, and its affiliates), acting on behalf of customers having a qualified trust or an investment account or relationship at such institution, and bear no Distribution or Shareholder Services Plan fees. Class Y shares are sold at net asset value per share generally to institutional investors, and bear no Distribution or Shareholder Services Plan fees. Class I and Class Y shares are offered without a front-end sales charge or CDSC. Other differences between the classes include the services offered to and the expenses borne by each class, the allocation of certain transfer agency costs, and certain voting rights. Income, expenses (other than expenses attributable to a specific class), and realized and unrealized gains or losses on investments are allocated to each class of shares based on its relative net assets.
The Trust accounts separately for the assets, liabilities and operations of each series. Expenses directly attributable to each series are charged to that series’ operations; expenses which are applicable to all series are allocated among them on a pro rata basis.
27
NOTES TO FINANCIAL STATEMENTS (continued)
The Financial Accounting Standards Board (“FASB”) Accounting Standards Codification ("ASC") is the exclusive reference of authoritative U.S. generally accepted accounting principles (“GAAP”) recognized by the FASB to be applied by nongovernmental entities. Rules and interpretive releases of the Securities and Exchange Commission (“SEC”) under authority of federal laws are also sources of authoritative GAAP for SEC registrants. The fund’s financial statements are prepared in accordance with GAAP, which may require the use of management estimates and assumptions. Actual results could differ from those estimates.
(a) Portfolio valuation: The fair value of a financial instrument is the amount that would be received to sell an asset or paid to transfer a liability in an orderly transaction between market participants at the measurement date (i.e., the exit price). GAAP establishes a fair value hierarchy that prioritizes the inputs of valuation techniques used to measure fair value. This hierarchy gives the highest priority to unadjusted quoted prices in active markets for identical assets or liabilities (Level 1 measurements) and the lowest priority to unobservable inputs (Level 3 measurements).
Additionally, GAAP provides guidance on determining whether the volume and activity in a market has decreased significantly and whether such a decrease in activity results in transactions that are not orderly. GAAP requires enhanced disclosures around valuation inputs and techniques used during annual and interim periods.
Various inputs are used in determining the value of the fund’s investments relating to fair value measurements. These inputs are summarized in the three broad levels listed below:
Level 1—unadjusted quoted prices in active markets for identical investments.
Level 2—other significant observable inputs (including quoted prices for similar investments, interest rates, prepayment speeds, credit risk, etc.).
Level 3—significant unobservable inputs (including the fund’s own assumptions in determining the fair value of investments).
The inputs or methodology used for valuing securities are not necessarily an indication of the risk associated with investing in those securities.
Changes in valuation techniques may result in transfers in or out of an assigned level within the disclosure hierarchy. Valuation techniques used to value the fund’s investments are as follows:
28
Registered investment companies that are not traded on an exchange are valued at their net asset value and are generally categorized within Level 1 of the fair value hierarchy.
Investments in securities, excluding short-term investments (other than U.S. Treasury Bills), financial futures, options and forward foreign currency exchange contracts (“forward contracts”) are valued each business day by an independent pricing service (the “Service”) approved by the Trust’s Board of Trustees (the “Board”). Investments for which quoted bid prices are readily available and are representative of the bid side of the market in the judgment of the Service are valued at the mean between the quoted bid prices (as obtained by the Service from dealers in such securities) and asked prices (as calculated by the Service based upon its evaluation of the market for such securities). Other investments (which constitute a majority of the portfolio securities) are valued as determined by the Service, based on methods which include consideration of the following: yields or prices of securities of comparable quality, coupon, maturity and type; indications as to values from dealers; and general market conditions. These securities are generally categorized within Level 2 of the fair value hierarchy.
U.S. Treasury Bills are valued at the mean price between quoted bid prices and asked prices by the Service. These securities are generally categorized within Level 2 of the fair value hierarchy.
The Service is engaged under the general supervision of the Board.
When market quotations or official closing prices are not readily available, or are determined not to reflect accurately fair value, such as when the value of a security has been significantly affected by events after the close of the exchange or market on which the security is principally traded (for example, a foreign exchange or market), but before the fund calculates its net asset value, the fund may value these investments at fair value as determined in accordance with the procedures approved by the Board. Certain factors may be considered when fair valuing investments such as: fundamental analytical data, the nature and duration of restrictions on disposition, an evaluation of the forces that influence the market in which the securities are purchased and sold, and public trading in similar securities of the issuer or comparable issuers. These securities are either categorized within Level 2 or 3 of the fair value hierarchy depending on the relevant inputs used.
For restricted securities where observable inputs are limited, assumptions about market activity and risk are used and are generally categorized within Level 3 of the fair value hierarchy.
29
NOTES TO FINANCIAL STATEMENTS (continued)
Investments denominated in foreign currencies are translated to U.S. dollars at the prevailing rates of exchange.
Financial futures and options, which are traded on an exchange, are valued at the last sales price on the securities exchange on which such securities are primarily traded or at the last sales price on the national securities market on each business day and are generally categorized within Level 1 of the fair value hierarchy. Options traded over-the-counter (“OTC”) are valued at the mean between the bid and asked price and are generally categorized within Level 2 of the fair value hierarchy. Investments in swap transactions are valued each business day by the Service. Swaps are valued by the Service by using a swap pricing model which incorporates among other factors, default probabilities, recovery rates, credit curves of the underlying issuer and swap spreads on interest rates and are generally categorized within Level 2 of the fair value hierarchy. Forward contracts are valued at the forward rate and are generally categorized within Level 2 of the fair value hierarchy.
The following is a summary of the inputs used as of October 31, 2016 in valuing the fund’s investments:
| | | | | |
| | Level 1 - Unadjusted Quoted Prices | Level 2 - Other Significant Observable Inputs | Level 3 -Significant Unobservable Inputs | Total |
Assets ($) | | | | |
Investments in Securities: | | | | |
Asset-Backed | - | 41,762,658 | - | 41,762,658 |
Commercial Mortgage-Backed | - | 34,665,368 | - | 34,665,368 |
Corporate Bonds† | - | 188,819,803 | - | 188,819,803 |
Foreign Government | - | 587,017,252 | - | 587,017,252 |
Mutual Funds | 17,230,941 | - | - | 17,230,941 |
Residential Mortgage-Backed | - | 5,453,341 | - | 5,453,341 |
U.S. Treasury | - | 44,782,434 | - | 44,782,434 |
Other Financial Instruments: | | | | |
Financial Futures†† | 558,303 | - | - | 558,303 |
Forward Foreign Currency Exchange Contracts†† | - | 1,800,968 | - | 1,800,968 |
Options Purchased | - | 1,987,935 | - | 1,987,935 |
30
| | | | | |
| | Level 1 - Unadjusted Quoted Prices | Level 2 - Other Significant Observable Inputs | Level 3 -Significant Unobservable Inputs | Total |
Assets ($) | | | | |
Swaps†† | - | 2,333,099 | - | 2,333,099 |
Liabilities ($) | | | | |
Other Financial Instruments: | | | | |
Financial Futures†† | (2,455,339) | - | - | (2,455,339) |
Forward Foreign Currency Exchange Contracts†† | - | (2,915,731) | - | (2,915,731) |
Options Written | - | (526,293) | - | (526,293) |
Swaps†† | - | (6,124,845) | - | (6,124,845) |
† See Statement of Investments for additional detailed categorizations.
†† Amount shown represents unrealized appreciation (depreciation) at period end.
At October 31, 2016, there were no transfers between levels of the fair value hierarchy.
(b) Foreign currency transactions: The fund does not isolate that portion of the results of operations resulting from changes in foreign exchange rates on investments from the fluctuations arising from changes in the market prices of securities held. Such fluctuations are included with the net realized and unrealized gain or loss on investments.
Net realized foreign exchange gains or losses arise from sales of foreign currencies, currency gains or losses realized on securities transactions between trade and settlement date, and the difference between the amounts of dividends, interest and foreign withholding taxes recorded on the fund’s books and the U.S. dollar equivalent of the amounts actually received or paid. Net unrealized foreign exchange gains and losses arise from changes in the value of assets and liabilities other than investments resulting from changes in exchange rates. Foreign currency gains and losses on foreign currency transactions are also included with net realized and unrealized gain or loss on investments.
(c) Securities transactions and investment income: Securities transactions are recorded on a trade date basis. Realized gains and losses from securities transactions are recorded on the identified cost basis. Dividend income is recognized on the ex-dividend date and interest income, including, where applicable, accretion of discount and
31
NOTES TO FINANCIAL STATEMENTS (continued)
amortization of premium on investments, is recognized on the accrual basis.
Pursuant to a securities lending agreement with The Bank of New York Mellon, the fund may lend securities to qualified institutions. It is the fund’s policy that, at origination, all loans are secured by collateral of at least 102% of the value of U.S. securities loaned and 105% of the value of foreign securities loaned. Collateral equivalent to at least 100% of the market value of securities on loan is maintained at all times. Collateral is either in the form of cash, which can be invested in certain money market mutual funds managed by Dreyfus, or U.S. Government and Agency securities. The fund is entitled to receive all dividends, interest and distributions on securities loaned, in addition to income earned as a result of the lending transaction. Should a borrower fail to return the securities in a timely manner, The Bank of New York Mellon is required to replace the securities for the benefit of the fund or credit the fund with the market value of the unreturned securities and is subrogated to the fund’s rights against the borrower and the collateral. Additionally, the contractual maturity of security lending transactions are on an overnight and continuous basis. During the period ended October 31, 2016, The Bank of New York Mellon earned $16,840 from lending portfolio securities, pursuant to the securities lending agreement.
(d) Affiliated issuers: Investments in other investment companies advised by Dreyfus are defined as “affiliated” under the Act. Investments in affiliated investment companies during the period ended October 31, 2016 were as follows:
| | | | | | |
Affiliated Investment Company | Value
10/31/2015 ($) | Purchases ($) | Sales ($) | Value
10/31/2016 ($) | Net
Assets (%) |
Dreyfus Institutional Cash Advantage Fund, Institutional Share0s† | 34,870,217 | 49,911,967 | 84,782,184 | - | - |
Dreyfus Institutional Preferred Government Plus Money Market Fund†† | 23,368,331 | 639,163,822 | 651,798,712 | 10,733,441 | 1.2 |
32
| | | | | | |
Affiliated Investment Company | Value
10/31/2015 ($) | Purchases ($) | Sales ($) | Value
10/31/2016 ($) | Net
Assets (%) |
Dreyfus Institutional Preferred Money Market Fund, Hamilton Shares† | - | 8,452,100 | 1,954,600 | 6,497,500 | .7 |
Total | 58,238,548 | 697,527,889 | 738,535,496 | 17,230,941 | 1.9 |
† During the period ended October 31, 2016, Dreyfus Institutional Cash Advantage Fund was acquired by Dreyfus Institutional Preferred Money Market Fund.
†† Formerly Dreyfus Institutional Preferred Plus Money Market Fund.
(e) Risk: Investing in foreign markets may involve special risks and considerations not typically associated with investing in the U.S. These risks include revaluation of currencies, high rates of inflation, repatriation restrictions on income and capital, and adverse political and economic developments. Moreover, securities issued in these markets may be less liquid, subject to government ownership controls and delayed settlements, and their prices may be more volatile than those of comparable securities in the U.S.
The fund invests primarily in debt securities. Failure of an issuer of the debt securities to make timely interest or principal payments, or a decline or the perception of a decline in the credit quality of a debt security, can cause the debt security’s price to fall, potentially lowering the fund’s share price. In addition, the value of debt securities may decline due to general market conditions that are not specifically related to a particular issuer, such as real or perceived adverse economic conditions, changes in outlook for corporate earnings, changes in interest or currency rates or adverse investor sentiment. They may also decline because of factors that affect a particular industry or country.
(f) Dividends to shareholders: Dividends are recorded on the ex-dividend date. Dividends from investment income-net are normally declared and paid quarterly. Dividends from net realized capital gains, if any, are normally declared and paid annually, but the fund may make distributions on a more frequent basis to comply with the distribution requirements of the Internal Revenue Code of 1986, as amended (the “Code”). To the extent that net realized capital gains can be offset by capital loss carryovers, it is the policy of the fund not to distribute such gains. Income and capital gain distributions are determined in accordance with income tax regulations, which may differ from GAAP.
33
NOTES TO FINANCIAL STATEMENTS (continued)
On October 31, 2016, the Board declared a cash dividend of $.027, $.006, $.047 and $.051 per share from undistributed investment income-net for Class A, Class C, Class I and Class Y shares, respectively, payable on November 1, 2016, (ex-dividend date), to shareholders of record as of the close of business on October 31, 2016.
(g) Federal income taxes: It is the policy of the fund to continue to qualify as a regulated investment company, if such qualification is in the best interests of its shareholders, by complying with the applicable provisions of the Code, and to make distributions of taxable income sufficient to relieve it from substantially all federal income and excise taxes.
As of and during the period ended October 31, 2016, the fund did not have any liabilities for any uncertain tax positions. The fund recognizes interest and penalties, if any, related to uncertain tax positions as income tax expense in the Statement of Operations. During the period ended October 31, 2016, the fund did not incur any interest or penalties.
Each tax year in the four-year period ended October 31, 2016 remains subject to examination by the Internal Revenue Service and state taxing authorities.
At October 31, 2016, the components of accumulated earnings on a tax basis were as follows: undistributed ordinary income $2,903,907, accumulated capital losses $108,967,586 and unrealized depreciation $16,495,955.
Under the Regulated Investment Company Modernization Act of 2010, the fund is permitted to carry forward capital losses for an unlimited period. Furthermore, capital loss carryovers retain their character as either short-term or long-term capital losses.
The accumulated capital loss carryover is available for federal income tax purposes to be applied against future net realized capital gains, if any, realized subsequent to October 31, 2016. The fund has $64,215,267 of short-term capital losses and $44,752,319 of long-term capital losses which can be carried forward for an unlimited period.
The tax character of distributions paid to shareholders during the fiscal periods ended October 31, 2016 and October 31, 2015 were as follows: ordinary income $37,708,922 and $68,285,747, respectively.
During the period ended October 31, 2016, as a result of permanent book to tax differences, primarily due to the tax treatment for paydown gains and losses, foreign currency transactions and swap periodic payments, the fund decreased accumulated undistributed investment income-net by $20,860,407 and increased accumulated net realized gain (loss) on
34
investments by the same amount. Net assets and net asset value per share were not affected by this reclassification.
NOTE 2—Bank Lines of Credit:
The fund participates with other Dreyfus-managed funds in a $810 million unsecured credit facility led by Citibank, N.A. and a $300 million unsecured credit facility provided by The Bank of New York Mellon (each, a “Facility”), each to be utilized primarily for temporary or emergency purposes, including the financing of redemptions. Prior to October 5, 2016, the unsecured credit facility with Citibank, N.A. was $555 million and prior to January 11, 2016, the unsecured credit facility with Citibank, N.A. was $480 million. In connection therewith, the fund has agreed to pay its pro rata portion of commitment fees for each Facility. Interest is charged to the fund based on rates determined pursuant to the terms of the respective Facility at the time of borrowing. During the period ended October 31, 2016, the fund did not borrow under the Facilities.
NOTE 3—Management Fee and Other Transactions with Affiliates:
(a) Pursuant to a management agreement with the Dreyfus and the Trust, the Trust has agreed to pay Dreyfus a management fee computed at the annual rate of .60% of the value of the fund’s average daily net assets and is payable monthly.
During the period ended October 31, 2016, the Distributor retained $1,680 from commissions earned on sales of the fund’s Class A shares and $1,583 from CDSCs on redemptions of the fund’s Class C shares.
(b) Under the Distribution Plan adopted pursuant to Rule 12b-1 under the Act, Class C shares pay the Distributor for distributing its shares at an annual rate of .75% of the value of its average daily net assets. During the period ended October 31, 2016, Class C shares were charged $440,746 pursuant to the Distribution Plan.
(c) Under the Shareholder Services Plan, Class A and Class C shares pay the Distributor at an annual rate of .25% of the value of their average daily net assets for the provision of certain services. The services provided may include personal services relating to shareholder accounts, such as answering shareholder inquiries regarding the fund and providing reports and other information, and services related to the maintenance of shareholder accounts. The Distributor may make payments to Service Agents (securities dealers, financial institutions or other industry professionals) with respect to these services. The Distributor determines the amounts to be paid to Service Agents. During the period ended
35
NOTES TO FINANCIAL STATEMENTS (continued)
October 31, 2016, Class A and Class C shares were charged $405,836 and $146,915, respectively, pursuant to the Shareholder Services Plan.
Under its terms, the Distribution Plan and Shareholder Services Plan shall remain in effect from year to year, provided such continuance is approved annually by a vote of a majority of those Trustees who are not “interested persons” of the Trust and who have no direct or indirect financial interest in the operation of or in any agreement related to the Distribution Plan or Shareholder Services Plan.
The fund has arrangements with the transfer agent and the custodian whereby the fund may receive earnings credits when positive cash balances are maintained, which are used to offset transfer agency and custody fees. For financial reporting purposes, the fund includes net earnings credits as an expense offset in the Statement of Operations.
The fund compensates Dreyfus Transfer, Inc., a wholly-owned subsidiary of Dreyfus, under a transfer agency agreement for providing transfer agency and cash management services for the fund. The majority of transfer agency fees are comprised of amounts paid on a per account basis, while cash management fees are related to fund subscriptions and redemptions. During the period ended October 31, 2016, the fund was charged $215,549 for transfer agency services and $13,931 for cash management services. These fees are included in Shareholder servicing costs in the Statement of Operations. Cash management fees were partially offset by earnings credits of $5,581.
The fund compensates The Bank of New York Mellon under a custody agreement for providing custodial services for the fund. These fees are determined based on net assets, geographic region and transaction activity. During the period ended October 31, 2016, the fund was charged $177,263 pursuant to the custody agreement.
During the period ended October 31, 2016, the fund was charged $9,804 for services performed by the Chief Compliance Officer and his staff.
The components of “Due to The Dreyfus Corporation and affiliates” in the Statement of Assets and Liabilities consist of: management fees $474,749, Distribution Plan fees $34,236, Shareholder Services Plan fees $40,700, custodian fees $126,032, Chief Compliance Officer fees $5,688 and transfer agency fees $29,030.
(d) Each Board member also serves as a Board member of other funds within the Dreyfus complex. Annual retainer fees and attendance fees are allocated to each fund based on net assets.
36
NOTE 4—Securities Transactions:
The aggregate amount of purchases and sales (including paydowns) of investment securities, excluding short-term securities, forward contracts, financial futures, options transactions and swap transactions, during the period ended October 31, 2016, amounted to $1,209,132,154 and $1,428,684,684, respectively.
Derivatives: A derivative is a financial instrument whose performance is derived from the performance of another asset. The fund enters into International Swaps and Derivatives Association, Inc. Master Agreements or similar agreements (collectively, “Master Agreements”) with its over-the counter (“OTC”) derivative contract counterparties in order to, among other things, reduce its credit risk to counterparties. Master Agreements include provisions for general obligations, representations, collateral and events of default or termination. Under a Master Agreement, the fund may offset with the counterparty certain derivative financial instrument’s payables and/or receivables with collateral held and/or posted and create one single net payment in the event of default or termination.
Each type of derivative instrument that was held by the fund during the period ended October 31, 2016 is discussed below.
Financial Futures: In the normal course of pursuing its investment objective, the fund is exposed to market risk, including interest rate risk, as a result of changes in value of underlying financial instruments. The fund invests in financial futures in order to manage its exposure to or protect against changes in the market. A financial futures contract represents a commitment for the future purchase or a sale of an asset at a specified date. Upon entering into such contracts, these investments require initial margin deposits with a counterparty, which consist of cash or cash equivalents. The amount of these deposits is determined by the exchange or Board of Trade on which the contract is traded and is subject to change. Accordingly, variation margin payments are received or made to reflect daily unrealized gains or losses which are recorded in the Statement of Operations. When the contracts are closed, the fund recognizes a realized gain or loss which is reflected in the Statement of Operations. There is minimal counterparty credit risk to the fund with financial futures since they are exchange traded, and the exchange guarantees the financial futures against default. Financial futures open at October 31, 2016 are set forth in the Statement of Financial Futures.
Options Transactions: The fund purchases and writes (sells) put and call options to hedge against changes in foreign currencies, or as a substitute for an investment. The fund is subject to market risk and currency risk in
37
NOTES TO FINANCIAL STATEMENTS (continued)
the course of pursuing its investment objectives through its investments in options contracts. A call option gives the purchaser of the option the right (but not the obligation) to buy, and obligates the writer to sell, the underlying financial instrument at the exercise price at any time during the option period, or at a specified date. Conversely, a put option gives the purchaser of the option the right (but not the obligation) to sell, and obligates the writer to buy the underlying financial instrument at the exercise price at any time during the option period, or at a specified date.
As a writer of call options, the fund receives a premium at the outset and then bears the market risk of unfavorable changes in the price of the financial instrument underlying the option. Generally, the fund realizes a gain, to the extent of the premium, if the price of the underlying financial instrument decreases between the date the option is written and the date on which the option is terminated. Generally, the fund incurs a loss if the price of the financial instrument increases between those dates.
As a writer of put options, the fund receives a premium at the outset and then bears the market risk of unfavorable changes in the price of the financial instrument underlying the option. Generally, the fund realizes a gain, to the extent of the premium, if the price of the underlying financial instrument increases between the date the option is written and the date on which the option is terminated. Generally, the fund incurs a loss if the price of the financial instrument decreases between those dates.
As a writer of an option, the fund has no control over whether the underlying financial instrument may be sold (call) or purchased (put) and as a result bears the market risk of an unfavorable change in the price of the financial instrument underlying the written option. There is a risk of loss from a change in value of such options which may exceed the related premiums received. This risk is mitigated by Master Agreements between the fund and the counterparty and the posting of collateral, if any, by the counterparty to the fund to cover the fund’s exposure to the counterparty. The Statement of Operations reflects any unrealized gains or losses which occurred during the period as well as any realized gains or losses which occurred upon the expiration or closing of the option transaction. At October 31, 2016, there were no written options outstanding.
The following summarizes the fund’s call/put options written during the period ended October 31, 2016:
38
| | | | | |
| | Face Amount | | Options Terminated |
| | Covered by | Premiums | | Net Realized |
Options Written: | Contracts ($) | Received ($) | Cost ($) | Gain ($) |
Contracts outstanding
October 31, 2015 | - | - | | |
Contracts written | 65,100,000 | 867,324 | | |
Contracts terminated: | | | | |
Contracts closed | - | - | - | - |
Contracts expired | - | - | - | - |
Total contracts
terminated | - | - | - | - |
Contracts outstanding
October 31 2016 | 65,100,000 | 867,324 | | |
Forward Foreign Currency Exchange Contracts: The fund enters into forward contracts in order to hedge its exposure to changes in foreign currency exchange rates on its foreign portfolio holdings, to settle foreign currency transactions or as a part of its investment strategy. When executing forward contracts, the fund is obligated to buy or sell a foreign currency at a specified rate on a certain date in the future. With respect to sales of forward contracts, the fund incurs a loss if the value of the contract increases between the date the forward contract is opened and the date the forward contract is closed. The fund realizes a gain if the value of the contract decreases between those dates. With respect to purchases of forward contracts, the fund incurs a loss if the value of the contract decreases between the date the forward contract is opened and the date the forward contract is closed. The fund realizes a gain if the value of the contract increases between those dates. Any realized or unrealized gains or losses which occurred during the period are reflected in the Statement of Operations. The fund is exposed to foreign currency risk as a result of changes in value of underlying financial instruments. The fund is also exposed to credit risk associated with counterparty nonperformance on these forward contracts, which is generally limited to the unrealized gain on each open contract. This risk may be mitigated by Master Agreements, if any, between the fund and the counterparty and the posting of collateral, if any, by the counterparty to the fund to cover the fund’s exposure to the counterparty. The following summarizes open forward contracts at October 31, 2016:
39
NOTES TO FINANCIAL STATEMENTS (continued)
| | | | | |
Forward Foreign Currency Exchange Contracts | Foreign Currency
Amounts | Cost/
Proceeds ($) | Value ($) | Unrealized Appreciation (Depreciation)($) |
Purchases: | | | |
Bank of America | | | |
Australian Dollar, | | | | |
Expiring | | | | |
11/30/2016 | 5,435,000 | 4,154,270 | 4,131,195 | (23,075) |
Euro, | | | | |
Expiring | | | | |
11/30/2016 | 184,570,000 | 202,082,002 | 202,855,383 | 773,381 |
Indonesian Rupiah, | | | | |
Expiring | | | | |
1/13/2017 | 133,010,045,000 | 10,055,190 | 10,078,046 | 22,856 |
Thai Baht, | | | | |
Expiring | | | | |
1/13/2017 | 146,435,000 | 4,181,467 | 4,179,707 | (1,760) |
Citigroup | | | |
South Korean Won, | | | | |
Expiring | | | | |
1/13/2017 | 9,276,805,000 | 8,150,202 | 8,105,387 | (44,815) |
Goldman Sachs International | | | |
British Pound, | | | | |
Expiring | | | | |
11/30/2016 | 7,820,000 | 9,529,960 | 9,577,230 | 47,270 |
Canadian Dollar, | | | | |
Expiring | | | | |
11/30/2016 | 11,490,000 | 8,606,999 | 8,567,913 | (39,086) |
Colombian Peso, | | | | |
Expiring | | | | |
1/13/2017 | 13,982,900,000 | 4,703,296 | 4,599,719 | (103,577) |
Polish Zolty, | | | | |
Expiring | | | | |
1/13/2017 | 13,420,000 | 3,378,124 | 3,415,914 | 37,790 |
Russian Ruble, | | | | |
Expiring | | | | |
1/13/2017 | 766,435,000 | 12,102,816 | 11,854,083 | (248,733) |
Swiss Franc, | | | | |
Expiring | | | | |
11/30/2016 | 1,850,000 | 1,866,444 | 1,872,413 | 5,969 |
HSBC | | | |
Australian Dollar, | | | | |
Expiring | | | | |
11/30/2016 | 22,060,000 | 16,721,877 | 16,768,014 | 46,137 |
40
| | | | | |
Forward Foreign Currency Exchange Contracts | Foreign Currency
Amounts | Cost/
Proceeds ($) | Value ($) | Unrealized Appreciation (Depreciation)($) |
Purchases: (continued) |
HSBC (continued) |
Japanese Yen, | | | | |
Expiring | | | | |
11/30/2016 | 9,381,680,000 | 90,367,647 | 89,547,617 | (820,030) |
Mexican New Peso, | | | | |
Expiring | | | | |
11/30/2016 | 562,650,000 | 29,939,723 | 29,661,553 | (278,170) |
JP Morgan Chase Bank | | | |
Brazilian Real, | | | | |
Expiring | | | | |
12/2/2016 | 31,300,000 | 9,468,207 | 9,708,497 | 240,290 |
Indian Rupee, | | | | |
Expiring | | | | |
1/13/2017 | 994,125,000 | 14,679,932 | 14,721,344 | 41,412 |
Turkish Lira, | | | | |
Expiring | | | | |
1/13/2017 | 137,520,000 | 43,933,295 | 43,735,163 | (198,132) |
UBS | | | |
Euro, | | | | |
Expiring | | | | |
11/30/2016 | 970,000 | 1,057,164 | 1,066,098 | 8,934 |
Mexican New Peso, | | | | |
Expiring | | | | |
1/13/2017 | 428,810,000 | 22,502,033 | 22,500,652 | (1,381) |
Swedish Krona, | | | | |
Expiring | | | | |
11/30/2016 | 193,715,000 | 21,736,545 | 21,476,021 | (260,524) |
Sales: | | | |
Bank of America | | | |
Singapore Dollar, | | | | |
Expiring | | | | |
11/30/2016 | 39,860,000 | 28,628,477 | 28,657,086 | (28,609) |
South African Rand, | | | | |
Expiring | | | | |
1/13/2017 | 236,495,000 | 16,745,973 | 17,272,945 | (526,972) |
Citigroup | | | |
British Pound, | | | | |
Expiring | | | | |
11/30/2016 | 5,845,000 | 7,114,650 | 7,158,428 | (43,778) |
Euro, | | | | |
Expiring | | | | |
11/30/2016 | 3,075,000 | 3,361,356 | 3,379,641 | (18,285) |
41
NOTES TO FINANCIAL STATEMENTS (continued)
| | | | | |
Forward Foreign Currency Exchange Contracts | Foreign Currency
Amounts | Cost/
Proceeds ($) | Value ($) | Unrealized Appreciation (Depreciation)($) |
Sales: (continued) |
Goldman Sachs International | | | |
Mexican New Peso, | | | | |
Expiring | | | | |
1/13/2017 | 367,225,000 | 19,606,247 | 19,269,145 | 337,102 |
HSBC | | | |
Canadian Dollar, | | | | |
Expiring | | | | |
11/30/2016 | 3,100,000 | 2,325,229 | 2,311,621 | 13,608 |
New Zealand Dollar, | | | | |
Expiring | | | | |
11/30/2016 | 71,795,000 | 51,185,312 | 51,277,381 | (92,069) |
South Korean Won, | | | | |
Expiring | | | | |
1/13/2017 | 6,029,180,000 | 5,308,685 | 5,267,852 | 40,833 |
JP Morgan Chase Bank | | | |
Hungarian Forint, | | | | |
Expiring | | | | |
1/13/2017 | 3,371,040,000 | 11,889,536 | 12,001,594 | (112,058) |
South Korean Won, | | | | |
Expiring | | | | |
1/13/2017 | 21,107,425,000 | 18,605,046 | 18,442,110 | 162,936 |
Taiwan Dollar, | | | | |
Expiring | | | | |
1/13/2017 | 316,035,000 | 9,957,936 | 10,032,613 | (74,677) |
UBS | | | |
Norwegian Krone, | | | | |
Expiring | | | | |
11/30/2016 | 86,420,000 | 10,482,362 | 10,459,912 | 22,450 |
Gross Unrealized Appreciation | | | 1,800,968 |
Gross Unrealized Depreciation | | | (2,915,731) |
Swap Transactions: The fund enters into swap agreements to exchange the interest rate on, or return generated by, one nominal instrument for the return generated by another nominal instrument. Swap agreements are privately negotiated in the OTC market or centrally cleared. The fund enters into these agreements to hedge certain market or interest rate risks, to manage the interest rate sensitivity (sometimes called duration) of fixed income securities, to provide a substitute for purchasing or selling particular securities or to increase potential returns.
42
For OTC swaps, the fund accrues for interim payments on a daily basis, with the net amount recorded within unrealized appreciation (depreciation) on swap agreements in the Statement of Assets and Liabilities. Once the interim payments are settled in cash, the net amount is recorded as a realized gain (loss) on swaps, in addition to realized gain (loss) recorded upon the termination of swap transactions in the Statement of Operations. Upfront payments made and/or received by the fund, are recorded as an asset and/or liability in the Statement of Assets and Liabilities and are recorded as a realized gain or loss ratably over the agreement’s term/event with the exception of forward starting interest rate swaps which are recorded as realized gains or losses on the termination date.
Upon entering into centrally cleared swap agreements, an initial margin deposit is required with a counterparty, which consists of cash or cash equivalents. The amount of these deposits is determined by the exchange on which the agreement is traded and is subject to change. The change in valuation of centrally cleared swaps is recorded as a receivable or payable for variation margin in the Statement of Assets and Liabilities. Payments received from (paid to) the counterparty, including upon termination, are recorded as realized gain (loss) in the Statement of Operations.
Fluctuations in the value of swap agreements are recorded for financial statement purposes as unrealized appreciation or depreciation on swap transactions.
Interest Rate Swaps: Interest rate swaps involve the exchange of commitments to pay and receive interest based on a notional principal amount. The fund may elect to pay a fixed rate and receive a floating rate, or receive a fixed rate and pay a floating rate on a notional principal amount. The net interest received or paid on interest rate swap agreements is included within realized gain (loss) on swap transactions in the Statement of Operations. Interest rate swap agreements are subject to general market risk, liquidity risk, counterparty risk and interest rate risk.
For OTC swaps, the fund’s maximum risk of loss from counterparty risk is the discounted value of the cash flows to be received from the counterparty over the agreement’s remaining life, to the extent that the amount is positive. This risk may be mitigated by Master Agreements, if any, between the fund and the counterparty and the posting of collateral, if any, by the counterparty to the fund to cover the fund’s exposure to the counterparty. There is minimal counterparty risk to the fund with centrally cleared swaps since they are exchange traded and the exchange guarantees these swaps against default. The following summarizes open interest rate swaps entered into by the fund at October 31, 2016:
43
NOTES TO FINANCIAL STATEMENTS (continued)
| | | | | | |
OTC Interest Rate Swaps | | | | |
| | | | | | |
Notional
Amount ($) | Currency/ Floating Rate | Counterparty | (Pay)
Receive
Fixed
Rate (%) | Expiration | Unrealized
(Depreciation) ($) |
7,600,000 | GBP - 1 YEAR LIBOR | Goldman Sachs International | 3.36 | 10/17/2026 | (189,417) |
| | | | | | |
Gross Unrealized Depreciation | | | (189,417) |
| | | | | | |
Centrally Cleared Interest Rate Swaps | | | |
| | | | | | |
Notional
Amount($)† | Currency/ Floating Rate | Counterparty | (Pay)
Receive
Fixed
Rate (%) | Expiration | Unrealized Appreciation (Depreciation) ($) |
104,700,000 | USD - 6 MONTH LIBOR | Deutsche Bank | 2.48 | 1/10/2021 | (5,935,428) |
36,000,000 | USD - 3 MONTH LIBOR | Morgan Stanley Capital Services | 1.79 | 10/3/2046 | 2,040,850 |
55,000,000 | USD - 3 MONTH LIBOR | Goldman Sachs International | 1.63 | 10/13/2026 | 292,249 |
Gross Unrealized Appreciation | | | 2,333,099 |
Gross Unrealized Depreciation | | | (5,935,428) |
† Clearing House-Chicago Mercantile Exchange
Credit Default Swaps: Credit default swaps involve commitments to pay a fixed interest rate in exchange for payment if a credit event affecting a third party (the referenced obligation or index) occurs. Credit events may include a failure to pay interest or principal, bankruptcy, or restructuring. The fund enters into these agreements to manage its exposure to the market or certain sectors of the market, to reduce its risk exposure to defaults of corporate and sovereign issuers, or to create exposure to corporate or sovereign issuers to which it is not otherwise exposed. For those credit default swaps in which the fund is paying a fixed rate, the fund is buying credit protection on the instrument. In the event of a credit event, the fund would receive the full notional amount for the reference obligation. For those credit default swaps in which the fund is receiving a fixed rate, the fund is selling credit protection on the underlying instrument. The maximum payouts for these agreements are limited to the notional amount of each swap. Credit default swaps may involve greater
44
risks than if the fund had invested in the reference obligation directly and are subject to general market risk, liquidity risk, counterparty risk and credit risk. This risk may be mitigated by Master Agreements, if any, between the fund and the counterparty and the posting of collateral, if any, by the counterparty to the fund to cover the fund’s exposure to the counterparty. At October 31, 2016, there were no credit default swap agreements outstanding.
The following tables show the fund’s exposure to different types of market risk as it relates to the Statement of Assets and Liabilities and the Statement of Operations, respectively.
Fair value of derivative instruments as of October 31, 2016 is shown below:
| | | | | | | | |
| | Derivative
Assets ($) | | | | Derivative
Liabilities ($) | |
Interest rate risk | 2,891,402 | 1,2 | Interest rate risk | | (8,580,184) | 1,2 |
Foreign exchange risk | 3,788,903 | 3,4 | Foreign exchange risk | | (3,442,024) | 4,5 |
Gross fair value of
derivative contracts | 6,680,305 | | | | (12,022,208) | |
| | | | | | | |
| | Statement of Assets and Liabilities location: | |
1 | Includes cumulative appreciation (depreciation) on financial futures as reported in the Statement
of Financial Futures, but only the unpaid variation margin is reported in the Statement of
Assets and Liabilities. |
2 | Includes cumulative appreciation (depreciation) on swap agreements as reported in the
swap tables in Note 4. Unrealized appreciation (depreciation) on OTC swap agreements
and only unpaid variation margin on cleared swap agreements, are reported in the
Statement of Assets and Liabilities. |
3 | Options purchased are included in Investments in securities—Unaffiliated issuers, at value. |
4 | Unrealized appreciation (depreciation) on forward foreign currency exchange contracts. |
5 | Outstanding options written, at value. | |
The effect of derivative instruments in the Statement of Operations during the period ended October 31, 2016 is shown below:
| | | | | | | | | | | |
Amount of realized gain (loss) on derivatives recognized in income ($) | |
Underlying
risk | Financial
Futures | 1 | Options
Transactions | 2 | Forward
Contracts | 3 | Swap
Transactions | 4 | Total | |
Interest
rate | (7,598,249) | | - | | - | | (6,635,813) | | (14,234,062) | |
Foreign
exchange | - | | (1,453,689) | | 8,796,169 | | - | | 7,342,480 | |
Credit | - | | - | | - | | (4,917,195) | | (4,917,195) | |
Total | (7,598,249) | | (1,453,689) | | 8,796,169 | | (11,553,008) | | (11,808,777) | |
| | | | | | | | | | | |
45
NOTES TO FINANCIAL STATEMENTS (continued)
| | | | | | | | | | | | |
Change in unrealized appreciation (depreciation) on derivatives recognized in income ($) | |
Underlying
risk | Financial
Futures | 5 | Options
Transactions | 6 | Forward
Contracts | 7 | Swap
Transactions | 8 | Total | |
Interest
rate | (1,575,988) | | - | | - | | 5,823,285 | | 4,247,297 | |
Foreign
exchange | - | | 990,628 | | (425,157) | | - | | 565,471 | |
Credit | - | | - | | - | | 539,261 | | 539,261 | |
Total | (1,575,988) | | 990,628 | | (425,157) | | 6,362,546 | | 5,352,029 | |
| | | | | | | | | | | | |
| | Statement of Operations location: | | | | | | | |
1 | Net realized gain (loss) on financial futures. | | |
2 | Net realized gain (loss) on options transactions. |
3 | Net realized gain (loss) on forward foreign currency exchange contracts. | | |
4 | Net realized gain (loss) on swap transactions. | | |
5 | Net unrealized appreciation (depreciation) on financial futures. | | |
6 | Net unrealized appreciation (depreciation) on options transactions. | | |
7 | Net unrealized appreciation (depreciation) on forward foreign currency exchange contracts. | |
8 | Net unrealized appreciation (depreciation) on swap transactions. | | |
The provisions of ASC Topic 210 “Disclosures about Offsetting Assets and Liabilities” require disclosure on the offsetting of financial assets and liabilities. These disclosures are required for certain investments, including derivative financial instruments subject to Master Agreements which are eligible for offsetting in the Statement of Assets and Liabilities and require the fund to disclose both gross and net information with respect to such investments. For financial reporting purposes, the fund does not offset derivative assets and derivative liabilities that are subject to Master Agreements in the Statement of Assets and Liabilities.
At October 31, 2016, derivative assets and liabilities (by type) on a gross basis are as follows:
| | | | | | |
Derivative Financial Instruments: | | Assets ($) | | Liabilities ($) | |
Financial futures | | 558,303 | | (2,455,339) | |
Options | | 1,987,935 | | (526,293) | |
Forward contracts | | 1,800,968 | | (2,915,731) | |
Swaps | | 2,333,099 | | (6,124,845) | |
Total gross amount of derivative | | | | | |
assets and liabilities in the | | | | | |
Statement of Assets and Liabilities | | 6,680,305 | | (12,022,208) | |
Derivatives not subject to | | | | | |
Master Agreements | | (2,891,402) | | 8,390,767 | |
Total gross amount of assets | | | | | |
and liabilities subject to | | | | | |
Master Agreements | | 3,788,903 | | (3,631,441) | |
46
The following tables present derivative assets and liabilities net of amounts available for offsetting under Master Agreements and net of related collateral received or pledged, if any, as of October 31, 2016:†
| | | | | | | |
| | | | Financial | | | |
| | | | Instruments | | | |
| | | | and Derivatives | | | |
| | Gross Amount of | | Available | Collateral | | Net Amount of |
Counterparty | Assets ($) | 1 | for Offset ($) | Received ($) | 2 | Assets ($) |
Bank of America | 1,224,672 | | (681,253) | - | | 543,419 |
Goldman Sachs
International | 1,978,574 | | (742,033) | (380,000) | | 856,541 |
HSBC | 100,578 | | (100,578) | - | | - |
JP Morgan
Chase Bank | 453,695 | | (453,695) | - | | - |
UBS | 31,384 | | (31,384) | - | | - |
Total | 3,788,903 | | (2,008,943) | (380,000) | | 1,399,960 |
| | | | | | | |
| | | | Financial | | | |
| | | | Instruments | | | |
| | | | and Derivatives | | | |
| | Gross Amount of | | Available | Collateral | | Net Amount of |
Counterparty | Liabilities ($) | 1 | for Offset ($) | Pledged ($) | 2 | Liabilities ($) |
Bank of America | (681,253) | | 681,253 | - | | - |
Citigroup | (106,878) | | - | 106,878 | | - |
Goldman Sachs
International | (742,033) | | 742,033 | - | | - |
HSBC | (1,190,269) | | 100,578 | - | | (1,089,691) |
JP Morgan
Chase Bank | (649,103) | | 453,695 | 165,000 | | (30,408) |
UBS | (261,905) | | 31,384 | - | | (230,521) |
Total | (3,631,441) | | 2,008,943 | 271,878 | | (1,350,620) |
| | | | | | | |
1 Absent a default event or early termination, OTC derivative assets and liabilities are presented at gross amounts and are
not offset in the Statement of Assets and Liabilities. |
2 In some instances, the actual collateral received and/or pledged may be more than the amount shown due to
overcollateralization. |
† See Statement of Investments for detailed information regarding collateral held for open financial
futures contracts. |
The following summarizes the average market value of derivatives outstanding during the period ended October 31, 2016:
| | | |
| | Average Market Value ($) |
Interest rate financial futures | | 303,916,502 |
Foreign currency options contracts | | 464,745 |
Forward contracts | | 1,068,136,282 |
| | | |
The following summarizes the average notional value of swap agreements outstanding during the period ended October 31, 2016:
47
NOTES TO FINANCIAL STATEMENTS (continued)
| | | |
| | Average Notional Value ($) |
Interest rate swap agreements | | 239,614,803 |
Credit default swap agreements | | 15,633,846 |
| | | |
At October 31, 2016, the cost of investments for federal income tax purposes was $925,762,356; accordingly, accumulated net unrealized depreciation on investments was $4,042,624, consisting of $20,935,790 gross unrealized appreciation and $24,978,414 gross unrealized depreciation.
48
REPORT OF INDEPENDENT REGISTERED
PUBLIC ACCOUNTING FIRM
The Board of Trustees and Shareholders of
The Dreyfus/Laurel Funds Trust
We have audited the accompanying statement of assets and liabilities of Dreyfus International Bond Fund (the “Fund”), a series of The Dreyfus/Laurel Funds Trust, including the statements of investments, financial futures and options written, as of October 31, 2016, and the related statement of operations for the year then ended, the statements of changes in net assets for each of the years in the two-year period then ended, and the financial highlights for each of the years or periods in the five-year period then ended. These financial statements and financial highlights are the responsibility of the Fund’s management. Our responsibility is to express an opinion on these financial statements and financial highlights based on our audits.
We conducted our audits in accordance with the standards of the Public Company Accounting Oversight Board (United States). Those standards require that we plan and perform the audit to obtain reasonable assurance about whether the financial statements and financial highlights are free of material misstatement. An audit includes examining, on a test basis, evidence supporting the amounts and disclosures in the financial statements. Our procedures included confirmation of securities owned as of October 31, 2016, by correspondence with the custodian and brokers or by other appropriate auditing procedures. An audit also includes assessing the accounting principles used and significant estimates made by management, as well as evaluating the overall financial statement presentation. We believe that our audits provide a reasonable basis for our opinion.
In our opinion, the financial statements and financial highlights referred to above present fairly, in all material respects, the financial position of Dreyfus International Bond Fund as of October 31, 2016, the results of its operations for the year then ended, the changes in its net assets for each of the years in the two-year period then ended, and the financial highlights for each of the years or periods in the five-year period then ended, in conformity with U.S. generally accepted accounting principles.

New York, New York
December 29, 2016
49
IMPORTANT TAX INFORMATION (Unaudited)
For federal tax purposes the fund designates the maximum amount allowable but not less than 33.39% as interest-related dividends in accordance with Sections 871(k)(1) and 881(e) of the Internal Revenue Code.
50
BOARD MEMBERS INFORMATION (Unaudited)
INDEPENDENT BOARD MEMBERS
Joseph S. DiMartino (73)
Chairman of the Board (1999)
Principal Occupation During Past 5 Years:
· Corporate Director and Trustee (1995-present)
Other Public Company Board Memberships During Past 5 Years:
· CBIZ (formerly, Century Business Services, Inc.), a provider of outsourcing functions for small and medium size companies, Director (1997-present)
No. of Portfolios for which Board Member Serves: 135
———————
Francine J. Bovich (65)
Board Member (2012)
Principal Occupation During Past 5 Years:
· Trustee, The Bradley Trusts, private trust funds (2011-present)
Other Public Company Board Memberships During Past 5 Years:
· Annaly Capital Management, Inc., Board Member (May 2014-present)
No. of Portfolios for which Board Member Serves: 76
———————
Kenneth A. Himmel (70)
Board Member (1988)
Principal Occupation During Past 5 Years:
· Managing Partner, Gulf Related, an international real estate development company (2010-present)
· President and CEO, Related Urban Development, a real estate development company (1996-present)
· President and CEO, Himmel & Company, a real estate development company (1980-present)
· CEO, American Food Management, a restaurant company (1983-present)
No. of Portfolios for which Board Member Serves: 28
———————
51
BOARD MEMBERS INFORMATION (Unaudited) (continued)
INDEPENDENT BOARD MEMBERS (continued)
Stephen J. Lockwood (69)
Board Member (1993)
Principal Occupation During Past 5 Years:
· Chairman of the Board, Stephen J. Lockwood and Company LLC, a real estate investment company (2000-present)
No. of Portfolios for which Board Member Serves: 28
———————
Roslyn M. Watson (67)
Board Member (1992)
Principal Occupation During Past 5 Years:
· Principal, Watson Ventures, Inc., a real estate investment company (1993-present)
No. of Portfolios for which Board Member Serves: 62
———————
Benaree Pratt Wiley (70)
Board Member (1998)
Principal Occupation During Past 5 Years:
· Principal, The Wiley Group, a firm specializing in strategy and business development (2005-present)
Other Public Company Board Memberships During Past 5 Years:
· CBIZ (formerly, Century Business Services, Inc.), a provider of outsourcing functions for small and medium size companies, Director (2008-present)
No. of Portfolios for which Board Member Serves: 86
———————
Once elected all Board Members serve for an indefinite term, but achieve Emeritus status upon reaching age 80. The address of the Board Members and Officers is c/o The Dreyfus Corporation, 200 Park Avenue, New York, New York 10166. Additional information about the Board Members is available in the fund’s Statement of Additional Information which can be obtained from Dreyfus free of charge by calling this toll free number: 1-800-DREYFUS.
James M. Fitzgibbons, Emeritus Board Member
J. Tomlinson Fort, Emeritus Board Member
52
OFFICERS OF THE FUND (Unaudited)
BRADLEY J. SKAPYAK, President since January 2010.
Chief Operating Officer and a director of the Manager since June 2009, Chairman of Dreyfus Transfer, Inc., an affiliate of the Manager and the transfer agent of the funds, since May 2011 and Executive Vice President of the Distributor since June 2007. From April 2003 to June 2009, Mr. Skapyak was the head of the Investment Accounting and Support Department of the Manager. He is an officer of 64 investment companies (comprised of 135 portfolios) managed by the Manager. He is 57 years old and has been an employee of the Manager since February 1988.
BENNETT A. MACDOUGALL, Chief Legal Officer since October 2015.
Chief Legal Officer of the Manager since June 2015; from June 2005 to June 2015, he served in various capacities with Deutsche Bank – Asset & Wealth Management Division, including as Director and Associate General Counsel, and Chief Legal Officer of Deutsche Investment Management Americas Inc. from June 2012 to May 2015. He is an officer of 65 investment companies (comprised of 160 portfolios) managed by the Manager. He is 45 years old and has been an employee of the Manager since June 2015.
JANETTE E. FARRAGHER, Vice President and Secretary since December 2011.
Assistant General Counsel of BNY Mellon, and an officer of 65 investment companies (comprised of 160 portfolios) managed by the Manager. She is 53 years old and has been an employee of the Manager since February 1984.
JAMES BITETTO, Vice President and Assistant Secretary since August 2005.
Managing Counsel of BNY Mellon and Secretary of the Manager, and an officer of 65 investment companies (comprised of 160 portfolios) managed by the Manager. He is 50 years old and has been an employee of the Manager since December 1996.
JONI LACKS CHARATAN, Vice President and Assistant Secretary since August 2005.
Managing Counsel of BNY Mellon, and an officer of 65 investment companies (comprised of 160 portfolios) managed by the Manager. She is 60 years old and has been an employee of the Manager since October 1988.
JOSEPH M. CHIOFFI, Vice President and Assistant Secretary since August 2005.
Managing Counsel of BNY Mellon, and an officer of 65 investment companies (comprised of 160 portfolios) managed by the Manager. He is 54 years old and has been an employee of the Manager since June 2000.
MAUREEN E. KANE, Vice President and Assistant Secretary since April 2015.
Managing Counsel of BNY Mellon since July 2014; from October 2004 until July 2014, General Counsel, and from May 2009 until July 2014, Chief Compliance Officer of Century Capital Management. She is an officer of 65 investment companies (comprised of 160 portfolios) managed by the Manager. She is 54 years old and has been an employee of the Manager since July 2014.
SARAH S. KELLEHER, Vice President and Assistant Secretary since April 2014.
Senior Counsel of BNY Mellon, and an officer of 65 investment companies (comprised of 160 portfolios) managed by the Manager; from August 2005 to March 2013, Associate General Counsel of Third Avenue Management. She is 41 years old and has been an employee of the Manager since March 2013.
JEFF PRUSNOFSKY, Vice President and Assistant Secretary since August 2005.
Senior Managing Counsel of BNY Mellon, and an officer of 65 investment companies (comprised of 160 portfolios) managed by the Manager. He is 51 years old and has been an employee of the Manager since October 1990.
JAMES WINDELS, Treasurer since November 2001.
Director – Mutual Fund Accounting of the Manager, and an officer of 65 investment companies (comprised of 160 portfolios) managed by the Manager. He is 58 years old and has been an employee of the Manager since April 1985.
RICHARD CASSARO, Assistant Treasurer since January 2008.
Senior Accounting Manager – Money Market, Municipal Bond and Equity Funds of the Manager, and an officer of 65 investment companies (comprised of 160 portfolios) managed by the Manager. He is 57 years old and has been an employee of the Manager since September 1982.
53
OFFICERS OF THE FUND (Unaudited) (continued)
GAVIN C. REILLY, Assistant Treasurer since December 2005.
Tax Manager of the Investment Accounting and Support Department of the Manager, and an officer of 65 investment companies (comprised of 160 portfolios) managed by the Manager. He is 48 years old and has been an employee of the Manager since April 1991.
ROBERT S. ROBOL, Assistant Treasurer since December 2002.
Senior Accounting Manager of the Manager, and an officer of 65 investment companies (comprised of 160 portfolios) managed by the Manager. He is 52 years old and has been an employee of the Manager since October 1988.
ROBERT SALVIOLO, Assistant Treasurer since July 2007.
Senior Accounting Manager – Equity Funds of the Manager, and an officer of 65 investment companies (comprised of 160 portfolios) managed by the Manager. He is 49 years old and has been an employee of the Manager since June 1989.
ROBERT SVAGNA, Assistant Treasurer since December 2002.
Senior Accounting Manager – Fixed Income and Equity Funds of the Manager, and an officer of 65 investment companies (comprised of 160 portfolios) managed by the Manager. He is 49 years old and has been an employee of the Manager since November 1990.
JOSEPH W. CONNOLLY, Chief Compliance Officer since October 2004.
Chief Compliance Officer of the Manager and The Dreyfus Family of Funds (65 investment companies, comprised of 160 portfolios). He is 59 years old and has served in various capacities with the Manager since 1980, including manager of the firm’s Fund Accounting Department from 1997 through October 2001.
CARIDAD M. CAROSELLA, Anti-Money Laundering Compliance Officer since January 2016
Anti-Money Laundering Compliance Officer of the Dreyfus Family of Funds and BNY Mellon Funds Trust since January 2016; from May 2015 to December 2015, Interim Anti-Money Laundering Compliance Officer of the Dreyfus Family of Funds and BNY Mellon Funds Trust and the Distributor; from January 2012 to May 2015, AML Surveillance Officer of the Distributor and from 2007 to December 2011, Financial Processing Manager of the Distributor. She is an officer of 60 investment companies (comprised of 155 portfolios) managed by the Manager. She is 48 years old and has been an employee of the Distributor since 1997.
54
NOTES
55
NOTES
56
NOTES
57
Dreyfus International Bond Fund
200 Park Avenue
New York, NY 10166
Manager
The Dreyfus Corporation
200 Park Avenue
New York, NY 10166
Custodian
The Bank of New York Mellon
225 Liberty Street
New York, NY 10286
Transfer Agent &
Dividend Disbursing Agent
Dreyfus Transfer, Inc.
200 Park Avenue
New York, NY 10166
Distributor
MBSC Securities Corporation
200 Park Avenue
New York, NY 10166
| | |
Ticker Symbols: | Class A: DIBAX Class C: DIBCX Class I: DIBRX Class Y: DIBYX |
Telephone Call your financial representative or 1-800-DREYFUS
Mail The Dreyfus Family of Funds, 144 Glenn Curtiss Boulevard, Uniondale, NY 11556-0144
E-mail Send your request to info@dreyfus.com
Internet Information can be viewed online or downloaded at www.dreyfus.com
The fund files its complete schedule of portfolio holdings with the Securities and Exchange Commission (“SEC”) for the first and third quarters of each fiscal year on Form N-Q. The fund’s Forms N-Q are available on the SEC’s website at www.sec.gov and may be reviewed and copied at the SEC’s Public Reference Room in Washington, DC. (phone 1-800-SEC-0330 for information).
A description of the policies and procedures that the fund uses to determine how to vote proxies relating to portfolio securities and information regarding how the fund voted these proxies for the most recent 12-month period ended June 30 is available at www.dreyfus.com and on the SEC’s website at www.sec.gov and without charge, upon request, by calling 1-800-DREYFUS.
| | |
© 2016 MBSC Securities Corporation
6091AR1016 | 
|