UNITED STATES
SECURITIES AND EXCHANGE COMMISSION
Washington, D.C. 20549
FORM N-CSR
CERTIFIED SHAREHOLDER REPORT OF REGISTERED MANAGEMENT
INVESTMENT COMPANIES
Investment Company Act file number | 811-00524 | |||||
|
| |||||
| BNY Mellon Investment Funds III |
| ||||
| (Exact name of Registrant as specified in charter) |
| ||||
|
|
| ||||
|
c/o BNY Mellon Investment Adviser, Inc. 240 Greenwich Street New York, New York 10286 |
| ||||
| (Address of principal executive offices) (Zip code) |
| ||||
|
|
| ||||
| Bennett A. MacDougall, Esq. 240 Greenwich Street New York, New York 10286 |
| ||||
| (Name and address of agent for service) |
| ||||
| ||||||
Registrant's telephone number, including area code: | (212) 922-6400 | |||||
|
| |||||
Date of fiscal year end:
| 10/31 |
| ||||
Date of reporting period: | 10/31/2020
|
| ||||
The following N-CSR relates only to the Registrant's series listed below and does not relate to any series of the Registrant with a different fiscal year end and, therefore, different N-CSR reporting requirements. A separate N-CSR will be filed for any series with a different fiscal year end, as appropriate.
BNY Mellon Global Equity Income Fund
BNY Mellon International Bond Fund
FORM N-CSR
Item 1. Reports to Stockholders.
BNY Mellon Global Equity Income Fund
ANNUAL REPORT October 31, 2020 |
|

Save time. Save paper. View your next shareholder report online as soon as it’s available. Log into www.bnymellonim.com/us and sign up for eCommunications. It’s simple and only takes a few minutes. |
The views expressed in this report reflect those of the portfolio manager(s) only through the end of the period covered and do not necessarily represent the views of BNY Mellon Investment Adviser, Inc. or any other person in the BNY Mellon Investment Adviser, Inc. organization. Any such views are subject to change at any time based upon market or other conditions and BNY Mellon Investment Adviser, Inc. disclaims any responsibility to update such views. These views may not be relied on as investment advice and, because investment decisions for a fund in the BNY Mellon Family of Funds are based on numerous factors, may not be relied on as an indication of trading intent on behalf of any fund in the BNY Mellon Family of Funds. |
Not FDIC-Insured • Not Bank-Guaranteed • May Lose Value |
Contents
THE FUND
BNY Mellon Investment Adviser, Inc. | |
With Those of Other Funds | |
in Affiliated Issuers | |
Public Accounting Firm | |
FOR MORE INFORMATION
Back Cover
| The Fund |
A LETTER FROM THE PRESIDENT OF BNY MELLON INVESTMENT ADVISER, INC.
Dear Shareholder:
We are pleased to present this annual report for BNY Mellon Global Equity Income Fund, covering the 12-month period from November 1, 2019 through October 31, 2020. For information about how the fund performed during the reporting period, as well as general market perspectives, we provide a Discussion of Fund Performance on the pages that follow.
Accommodative rate policies from the U.S. Federal Reserve (the “Fed”) and progress towards a U.S./China trade deal stoked optimism about future economic growth prospects the final months of 2019, fueling an equity rally. As we entered 2020, optimism turned to concern as COVID-19 began to spread across portions of Asia and Europe. When the virus reached the U.S. in March 2020, stocks became volatile. U.S. equities posted historic losses during the month due to investor concern over the economic impact of a widespread quarantine. Global central banks and governments launched emergency stimulus measures to support their respective economies, and equity valuations began to rebound, trending upward until the fall. Volatility returned in September 2020 and continued through October, as concerns over rising COVID-19 infection rates, continued trade tensions, the U.S. Congress’ failure to pass additional financial assistance and anxiety over the upcoming U.S. election constrained equity valuations.
In fixed-income markets, interest rates were heavily influenced by changes in Fed policy and investor concern over COVID-19. In 2019, as stocks rallied in response to Fed rate cuts, risk-asset valuations also rose while Treasuries lagged. When COVID-19 began to emerge, a flight to quality ensued, and Treasury rates fell significantly. The Fed cut rates twice in March 2020, resulting in an overnight lending target rate of nearly zero, and the government launched a large stimulus package. Risk-asset prices began to rebound, and bond indices generally rose until September 2020, when investment-grade instrument prices stalled. Yields in the intermediate and long portions of the Treasury curve rose during October, further constraining bond prices.
We believe the near-term outlook for the U.S. will be challenging, as the country continues to battle COVID-19. As always, we will monitor relevant data for meaningful developments. We encourage you to discuss the risks and opportunities in today’s investment environment with your financial advisor.
Thank you for your continued confidence and support.
Sincerely,

Renee LaRoche-Morris
President
BNY Mellon Investment Adviser, Inc.
November 16, 2020
2
DISCUSSION OF FUND PERFORMANCE (Unaudited)
For the period from November 1, 2019 through October 31, 2020, as provided by portfolio managers Jon Bell, Nick Clay, Paul Flood, Ilga Haubelt, Robert Hay and Andrew MacKirdy of Newton Investment Management (North America) Limited, Sub-Investment Adviser
Market and Fund Performance Overview
For the 12-month period ended October 31, 2020, BNY Mellon Global Equity Income Fund’s Class A shares produced a total return of -8.72%, Class C shares returned -9.42%, Class I shares returned -8.53%, and Class Y shares returned -8.47%.1 In comparison, the fund’s benchmark, the FTSE World Index (the “Index”), produced a total return of 4.26% for the same period.2
Global markets encountered volatility during the reporting period, due in part to the COVID-19 outbreak and resulting economic uncertainty. The fund underperformed the Index, partly due to positioning within the consumer discretionary and information technology sectors.
The Fund’s Investment Approach
The fund seeks total return (consisting of capital appreciation and income). To pursue its goal, the fund normally invests at least 80% of its net assets, plus any borrowings for investment purposes, in equity securities. The fund seeks to focus on dividend-paying stocks of companies located in the developed capital markets, such as the United States, Canada, Japan, Australia, Hong Kong and Western Europe. The fund may invest in the securities of companies of any market capitalization, and it may invest up to 30% of its assets in emerging markets. The fund’s portfolio managers typically will purchase stocks that, at the time of purchase, have a yield premium to the yield of the Index.
The portfolio managers will combine a top-down approach, emphasizing current economic trends and current investment themes on a global basis, with a bottom-up stock selection, based on fundamental research. Within markets and sectors determined to be relatively attractive, the portfolio managers seek what are believed to be attractively priced companies that possess a sustainable competitive advantage in their market or sector.
Central Bank Policy and COVID-19 Influence Markets
Equities gained over the end of 2019, as investor optimism regarding trade and future economic growth prospects bolstered sentiment. Continued accommodative policies by the U.S. Federal Reserve (the “Fed”), coupled with encouraging economic data releases, worked to fuel a risk-on environment. Greater certainty as to the timing of Brexit was also forthcoming and aided investor optimism. In addition, as the year-end approached, both the U.S. and China indicated that a ‘Phase-One’ trade deal would be signed in early 2020.
Markets gave way to extreme risk aversion in early 2020, as the global scope of the COVID-19 pandemic became apparent. Equity valuations in the U.S. remained robust throughout January and February 2020, while markets in areas that experienced the virus earlier, such as China, began to experience volatility closer to the start of the calendar year. Financial markets also had to contend with a second major shock in the form of an oil-price war between Saudi Arabia and Russia, which caused oil prices to fall precipitously in March 2020. Worldwide, governments and central banks launched an unprecedented array of fiscal initiatives that sought to offset the economic impact of widespread lockdown measures and bolster asset prices. The intervention provided comfort to investors, and indices began to rally towards the end of March 2020. Supported by the intervention, equities generally went on to stage a recovery that lasted through August 2020. However, the recovery was company and sector specific, as several industries that
3
DISCUSSION OF FUND PERFORMANCE (Unaudited) (continued)
remained affected by COVID-19 prevention procedures did not fully participate. In September, volatility crept back into equity markets, as increasing COVID-19 infection rates began to concern investors. By October, several countries had begun to reinstitute some degree of behavioral restriction among residents in order to stem the spread of the virus. In addition, mounting political rhetoric in the U.S. due to the election, renewed trade difficulties between the U.S. and China, and other geopolitical events stoked investor anxiety. Stocks continued to exhibit volatility through the end of the period.
Retail, Technology and U.S.-based Stocks Constrained Results
At a sector level, positioning within the consumer and information technology sectors were the biggest detractors. At a country level, companies based within the U.S. provided the largest headwind. Few foresaw the pandemic and the severe restrictions that would be imposed as a result. The crisis hit the fund’s retail-facing companies particularly hard. Cosmetics manufacturer Coty, motorcycle manufacturer Harley-Davidson, retail group Tapestry and fashion chain Hennes & Mauritz saw their shares fall significantly and were among the period’s biggest detractors. Telecommunication services holding group Omnicom Group has been impacted by the same uncertainty as the consumer discretionary names, while trade-fair company Informa was also hard hit, as global travel disruption meant many conferences were cancelled or postponed. Within the U.S., a lack of exposure to large-cap growth companies, which generously outperformed the broader market, took a nearly 5% bite out of relative performance. These FAANG stocks, (Facebook, Apple, Amazon, Netflix and Google (Alphabet)), as well as Microsoft and Tesla have led the market. Given the strategy’s strict buy and sell discipline, none of these stocks are eligible for the strategy. A further drag within the technology sector was the Fund’s holding in Cisco Systems, which has experienced weakness in its core infrastructure division.
Conversely, the fund benefited most from positioning within financials, owing largely to the underweight in banks. The strategy has been underweight financials and banks in particular for a number of years, and not owning JP Morgan, Wells Fargo, Bank of America and HSBC has made a positive contribution. A further positive came from an underweight in the oil & gas sector. At a country level, India and South Korea were the largest contributors, owing to the holdings in technology stocks Infosys and Samsung Electronics. In addition, some of the biggest losers in the market decline were ‘commodity countries’ such as Brazil and Australia, where the Fund has no exposure, aiding relative performance as asset prices and currencies fell. Elsewhere in the market, the information technology sector as a whole has proved challenging from a relative performance perspective; however, many of the strategy’s holdings have actually performed well, with Qualcomm, Samsung Electronics, Infosys and Maxim among the fund’s top individual contributors to performance.
Anticipating a Shift
After a year that has been dominated by COVID-19, which has benefited many growth stocks with strong balance sheets, we believe that there are a number of potential catalysts for a change in market leadership. The first relates to valuation. Simply put, the valuations of the COVID-19 pandemic beneficiaries cannot expand indefinitely. The second is the anticipation of a normalization in economic conditions, almost certainly catalyzed by a COVID-19 vaccine, would allow companies to give the market guidance on their expected earnings growth. To illustrate the issue, only a quarter of companies in the Russell 1000® are currently providing forward guidance, compared to almost half at this time last year. Management confidence should also mean that companies will reinstate dividends, reversing the cuts that we have seen this year. Income should return, not least because investors, who need income, are reliant on equities given the vanishingly
4
small yields on offer in fixed-income markets. As a result, we believe that over the medium term, the prospects for income equities are superior to those of the market as a whole.
Given the nature of the COVID-19 crisis, it is extremely difficult to predict when the normalization in economies will come through. Although there is clear evidence of economic recovery, activity remains well below pre-pandemic levels, and both the path of the virus and the political response to it remain unpredictable. To navigate such a challenging backdrop, and with volatility likely to be elevated, we believe following an active, disciplined approach that emphasizes quality and income is as relevant today as it has ever been.
November 16, 2020
1 Total return includes reinvestment of dividends and any capital gains paid and does not take into consideration the maximum initial sales charge in the case of Class A shares, or the applicable contingent deferred sales charge imposed on redemptions in the case of Class C shares. Had these charges been reflected, returns would have been lower. Share price and investment return fluctuate such that upon redemption, fund shares may be worth more or less than their original cost. Past performance is no guarantee of future results.
2 Source: Lipper Inc. — The FTSE World Index is a market capitalization-weighted index representing the performance of the large- and mid-cap stocks from the Developed and Advanced Emerging segments of the FTSE Global Equity Index Series. It reflects reinvestment of net dividends and, where applicable, capital gain distributions. Investors cannot invest directly in any index.
Please note: the position in any security highlighted with italicized typeface was sold during the reporting period.
Equities are subject generally to market, market sector, market liquidity, issuer and investment style risks, among other factors, to varying degrees, all of which are more fully described in the fund’s prospectus.
Recent market risks include pandemic risks related to COVID-19. The effects of COVID-19 have contributed to increased volatility in global markets and will likely affect certain countries, companies, industries and market sectors more dramatically than others. To the extent the fund may overweight its investments in certain countries, companies, industries or market sectors, such positions will increase the fund’s exposure to risk of loss from adverse developments affecting those countries, companies, industries or sectors.
The fund’s performance will be influenced by political, social and economic factors affecting investments in foreign companies. Special risks associated with investments in foreign companies include exposure to currency fluctuations, less liquidity, less developed or less efficient trading markets, lack of comprehensive company information, political instability and differing auditing and legal standards. These risks generally are greater with emerging-market countries than with more economically and politically established foreign countries.
The fund may, but is not required to, use derivative instruments. A small investment in derivatives could have a potentially large impact on the fund’s performance. The use of derivatives involves risks different from, or possibly greater than, the risks associated with investing directly in the underlying assets.
5
FUND PERFORMANCE (Unaudited)
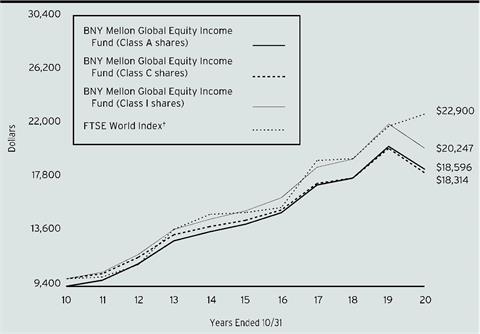
Comparison of change in value of a $10,000 investment in Class A shares, Class C shares, and Class I shares of BNY Mellon Global Equity Income Fund with a hypothetical investment of $10,000 in the FTSE World Index (the “Index”)
† Source: Lipper Inc.
Past performance is not predictive of future performance.
The above graph compares a hypothetical investment of $10,000 made in each of the Class A shares, Class C shares, and Class I shares of BNY Mellon Global Equity Income Fund on 10/31/10 to a hypothetical investment of $10,000 made in the Index on that date. All dividends and capital gain distributions are reinvested.
The fund’s performance shown in the line graph above takes into account the maximum initial sales charge on Class A shares and all other applicable fees and expenses on Class A shares, Class C shares, and Class I shares. The Index is a market capitalization-weighted index representing the performance of the large- and mid-cap stocks from the Developed and Advanced Emerging segments of the FTSE Global Equity Index Series. Unlike a mutual fund, the Index is not subject to charges, fees and other expenses. Investors cannot invest directly in any index. Further information relating to fund performance, including expense reimbursements, if applicable, is contained in the Financial Highlights section of the prospectus and elsewhere in this report.
6
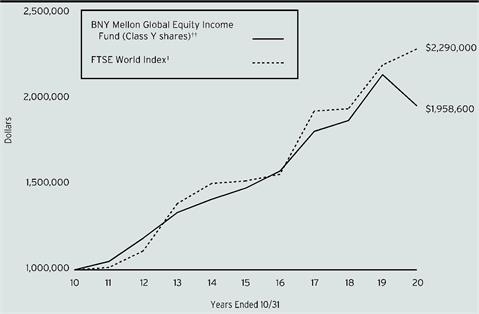
Comparison of change in value of a $1,000,000 investment in Class Y shares of BNY Mellon Global Equity Income Fund with a hypothetical investment of $1,000,000 in the FTSE World Index (the “Index”)
† Source: Lipper Inc.
†† The total return figures presented for Class Y shares of the fund reflect the performance of the fund’s Class A shares for the period prior to 7/1/13 (the inception date for Class Y shares), not reflecting the applicable sales charges for Class A shares.
Past performance is not predictive of future performance.
The above graph compares a hypothetical investment of $1,000,000 made in Class Y shares of BNY Mellon Global Equity Income Fund on 10/31/10 to a hypothetical investment of $1,000,000 made in the Index on that date. All dividends and capital gain distributions are reinvested.
The fund’s performance shown in the line graph above takes into account all applicable fees and expenses of the fund’s Class Y shares. The Index is a market capitalization-weighted index representing the performance of the large- and mid-cap stocks from the Developed and Advanced Emerging segments of the FTSE Global Equity Index Series. Unlike a mutual fund, the Index is not subject to charges, fees and other expenses. Investors cannot invest directly in any index. Further information relating to fund performance, including expense reimbursements, if applicable, is contained in the Financial Highlights section of the prospectus and elsewhere in this report.
7
FUND PERFORMANCE (Unaudited) (continued)
Average Annual Total Returns as of 10/31/2020 | ||||
Inception | ||||
| Date | 1 Year | 5 Years | 10 Years |
Class A shares | ||||
with maximum sales charge (5.75%) | 10/18/07 | -13.95% | 4.19% | 6.40% |
without sales charge | 10/18/07 | -8.72% | 5.43% | 7.03% |
Class C shares | ||||
with applicable redemption charge† | 10/18/07 | -10.31% | 4.66% | 6.24% |
without redemption | 10/18/07 | -9.42% | 4.66% | 6.24% |
Class I shares | 10/18/07 | -8.53% | 5.73% | 7.31% |
Class Y shares | 7/1/13 | -8.47% | 5.80% | 6.95%†† |
FTSE World Index | 4.26% | 8.55% | 8.64% | |
† The maximum contingent deferred sales charge for Class C shares is 1% for shares redeemed within one year of the date of purchase.
†† The total return performance figures presented for Class Y shares of the fund reflect the performance of the fund’s Class A shares for the period prior to 7/1/13 (the inception date for Class Y shares), not reflecting the applicable sales charges for Class A shares.
The performance data quoted represents past performance, which is no guarantee of future results. Share price and investment return fluctuate and an investor’s shares may be worth more or less than original cost upon redemption. Current performance may be lower or higher than the performance quoted. Go to www.bnymellonim.com/us for the fund’s most recent month-end returns.
The fund’s performance shown in the graphs and table does not reflect the deduction of taxes that a shareholder would pay on fund distributions or the redemption of fund shares. In addition to the performance of Class A shares shown with and without a maximum sales charge, the fund’s performance shown in the table takes into account all other applicable fees and expenses on all classes.
8
UNDERSTANDING YOUR FUND’S EXPENSES (Unaudited)
As a mutual fund investor, you pay ongoing expenses, such as management fees and other expenses. Using the information below, you can estimate how these expenses affect your investment and compare them with the expenses of other funds. You also may pay one-time transaction expenses, including sales charges (loads) and redemption fees, which are not shown in this section and would have resulted in higher total expenses. For more information, see your fund’s prospectus or talk to your financial adviser.
Review your fund’s expenses
The table below shows the expenses you would have paid on a $1,000 investment in BNY Mellon Global Equity Income Fund from May 1, 2020 to October 31, 2020. It also shows how much a $1,000 investment would be worth at the close of the period, assuming actual returns and expenses.
Expenses and Value of a $1,000 Investment |
| |||||
Assume actual returns for the six months ended October 31, 2020 |
| |||||
|
|
|
|
|
|
|
|
| Class A | Class C | Class I | Class Y |
|
Expense paid per $1,000† | $6.21 | $10.08 | $4.93 | $4.41 |
| |
Ending value (after expenses) | $1,040.80 | $1,036.30 | $1,041.70 | $1,042.10 |
| |
COMPARING YOUR FUND’S EXPENSES
WITH THOSE OF OTHER FUNDS (Unaudited)
Using the SEC’s method to compare expenses
The Securities and Exchange Commission (“SEC”) has established guidelines to help investors assess fund expenses. Per these guidelines, the table below shows your fund’s expenses based on a $1,000 investment, assuming a hypothetical 5% annualized return. You can use this information to compare the ongoing expenses (but not transaction expenses or total cost) of investing in the fund with those of other funds. All mutual fund shareholder reports will provide this information to help you make this comparison. Please note that you cannot use this information to estimate your actual ending account balance and expenses paid during the period.
Expenses and Value of a $1,000 Investment |
| |||||
Assuming a hypothetical 5% annualized return for the six months ended October 31, 2020 |
| |||||
|
|
|
|
|
|
|
|
| Class A | Class C | Class I | Class Y |
|
Expense paid per $1,000† | $6.14 | $9.98 | $4.88 | $4.37 |
| |
Ending value (after expenses) | $1,019.05 | $1,015.23 | $1,020.31 | $1,020.81 |
| |
† Expenses are equal to the fund’s annualized expense ratio of 1.21% for Class A, 1.97% for Class C, .96% for Class I and .86% for Class Y, multiplied by the average account value over the period, multiplied by 184/366 (to reflect the one-half year period). | ||||||
9
STATEMENT OF INVESTMENTS
October 31, 2020
Description | Shares | Value ($) | |||||
Common Stocks - 94.1% | |||||||
China - 1.5% | |||||||
Ping An Insurance Group Company of China, Cl. H | 373,500 | 3,834,304 | |||||
France - 4.0% | |||||||
Sanofi | 83,981 | 7,591,824 | |||||
Total | 88,285 | 2,673,524 | |||||
10,265,348 | |||||||
Germany - 3.9% | |||||||
Bayer | 119,632 | 5,622,317 | |||||
Continental | 42,961 | 4,569,682 | |||||
10,191,999 | |||||||
Hong Kong - 1.2% | |||||||
Link REIT | 422,500 | 3,226,291 | |||||
India - 3.9% | |||||||
Infosys, ADR | 711,912 | 10,158,984 | |||||
Japan - 2.0% | |||||||
KDDI | 194,700 | 5,214,163 | |||||
Netherlands - .9% | |||||||
Royal Dutch Shell, Cl. A | 175,226 | 2,239,538 | |||||
New Zealand - .4% | |||||||
Spark New Zealand | 383,619 | 1,138,503 | |||||
South Korea - 1.3% | |||||||
Macquarie Korea Infrastructure Fund | 350,068 | 3,395,625 | |||||
Spain - 2.3% | |||||||
Industria de Diseno Textil | 236,355 | 5,848,558 | |||||
Sweden - 3.8% | |||||||
Hennes & Mauritz, Cl. B | 295,945 | a | 4,811,746 | ||||
Svenska Handelsbanken, Cl. A | 610,193 | 4,947,730 | |||||
9,759,476 | |||||||
Switzerland - 13.3% | |||||||
Cie Financiere Richemont, CI. A | 95,688 | 5,993,648 | |||||
Nestle | 52,101 | 5,853,726 | |||||
Novartis | 95,771 | 7,474,551 | |||||
Roche Holding | 21,933 | 7,040,837 | |||||
Zurich Insurance Group | 24,876 | 8,237,167 | |||||
34,599,929 | |||||||
United Kingdom - 14.1% | |||||||
BAE Systems | 1,017,303 | 5,233,372 | |||||
British American Tobacco | 188,171 | 5,978,552 | |||||
British American Tobacco, ADR | 65,923 | a | 2,101,625 | ||||
Ferguson | 29,546 | 2,964,788 | |||||
Informa | 1,181,869 | 6,414,548 | |||||
10
Description | Shares | Value ($) | |||||
Common Stocks - 94.1% (continued) | |||||||
United Kingdom - 14.1% (continued) | |||||||
RELX | 195,598 | 3,871,502 | |||||
Unilever | 176,660 | 10,073,161 | |||||
36,637,548 | |||||||
United States - 41.5% | |||||||
Brixmor Property Group | 126,203 | b | 1,383,185 | ||||
Cisco Systems | 330,647 | 11,870,227 | |||||
Citigroup | 94,908 | 3,931,089 | |||||
CME Group | 25,676 | 3,869,887 | |||||
CMS Energy | 86,756 | 5,494,257 | |||||
Emerson Electric | 89,051 | 5,769,614 | |||||
Eversource Energy | 75,940 | 6,627,284 | |||||
Gilead Sciences | 36,776 | 2,138,524 | |||||
Merck & Co. | 101,543 | 7,637,049 | |||||
Omnicom Group | 52,858 | 2,494,898 | |||||
Paychex | 64,211 | 5,281,355 | |||||
PepsiCo | 74,991 | 9,995,550 | |||||
Philip Morris International | 56,488 | 4,011,778 | |||||
Principal Financial Group | 105,761 | 4,147,946 | |||||
Qualcomm | 97,758 | 12,059,427 | |||||
Tapestry | 101,469 | 2,255,656 | |||||
Texas Instruments | 39,859 | 5,763,213 | |||||
The Procter & Gamble Company | 53,920 | 7,392,432 | |||||
The Western Union Company | 121,347 | 2,358,986 | |||||
Verizon Communications | 55,560 | 3,166,364 | |||||
107,648,721 | |||||||
Total Common Stocks (cost $210,381,473) | 244,158,987 | ||||||
Preferred Dividend | |||||||
Preferred Stocks - 3.8% | |||||||
South Korea - 3.8% | |||||||
Samsung Electronics | 2.42 | 224,332 | 9,953,671 | ||||
1-Day | |||||||
Investment Companies - 1.4% | |||||||
Registered Investment Companies - 1.4% | |||||||
Dreyfus Institutional Preferred Government Plus Money Market Fund | 0.10 | 3,706,898 | c | 3,706,898 | |||
11
STATEMENT OF INVESTMENTS (continued)
Description | 1-Day | Shares | Value ($) | ||||
Investment of Cash Collateral for Securities Loaned - .5% | |||||||
Registered Investment Companies - .5% | |||||||
Dreyfus Institutional Preferred Government Plus Money Market Fund | 0.10 | 1,166,358 | c | 1,166,358 | |||
Total Investments (cost $222,392,343) | 99.8% | 258,985,914 | |||||
Cash and Receivables (Net) | .2% | 448,273 | |||||
Net Assets | 100.0% | 259,434,187 | |||||
ADR—American Depository Receipt
REIT—Real Estate Investment Trust
aSecurity, or portion thereof, on loan. At October 31, 2020, the value of the fund’s securities on loan was $2,739,138 and the value of the collateral was $2,826,695, consisting of cash collateral of $1,166,358 and U.S. Government & Agency securities valued at $1,660,337.
bInvestment in real estate investment trust within the United States.
cInvestment in affiliated issuer. The investment objective of this investment company is publicly available and can be found within the investment company’s prospectus.
Portfolio Summary (Unaudited) † | Value (%) |
Pharmaceuticals Biotechnology & Life Sciences | 14.4 |
Food, Beverage & Tobacco | 10.8 |
Technology Hardware & Equipment | 8.4 |
Semiconductors & Semiconductor Equipment | 6.9 |
Software & Services | 6.8 |
Household & Personal Products | 6.7 |
Insurance | 6.2 |
Capital Goods | 5.4 |
Utilities | 4.7 |
Retailing | 4.1 |
Telecommunication Services | 3.7 |
Media & Entertainment | 3.4 |
Banks | 3.4 |
Consumer Durables & Apparel | 3.2 |
Diversified Financials | 2.8 |
Energy | 1.9 |
Investment Companies | 1.9 |
Real Estate | 1.8 |
Automobiles & Components | 1.8 |
Commercial & Professional Services | 1.5 |
99.8 |
† Based on net assets.
See notes to financial statements.
12
STATEMENT OF INVESTMENTS IN AFFILIATED ISSUERS
Investment Companies | Value | Purchases($)† | Sales($) | Value | Net | Dividends/ Distributions($) |
Registered Investment Companies: | ||||||
Dreyfus Institutional Preferred Government Plus Money Market Fund | 8,377,345 | 103,862,103 | (108,532,550) | 3,706,898 | 1.4 | 75,193 |
Investment of Cash Collateral for Securities Loaned: | ||||||
Dreyfus Institutional Preferred Government Plus Money Market Fund | - | 43,560,032 | (42,393,674) | 1,166,358 | .5 | - |
Total | 8,377,345 | 147,422,135 | (150,926,224) | 4,873,256 | 1.9 | 75,193 |
† Includes reinvested dividends/distributions.
See notes to financial statements.
13
STATEMENT OF ASSETS AND LIABILITIES
October 31, 2020
|
|
|
|
|
|
|
|
|
| Cost |
| Value |
|
Assets ($): |
|
|
|
| ||
Investments in securities—See Statement of Investments |
|
|
| |||
Unaffiliated issuers | 217,519,087 |
| 254,112,658 |
| ||
Affiliated issuers |
| 4,873,256 |
| 4,873,256 |
| |
Cash denominated in foreign currency |
|
| 942 |
| 990 |
|
Tax reclaim receivable |
| 1,335,161 |
| |||
Dividends and securities lending income receivable |
| 1,005,243 |
| |||
Receivable for shares of Beneficial Interest subscribed |
| 487,657 |
| |||
Prepaid expenses |
|
|
|
| 46,169 |
|
|
|
|
|
| 261,861,134 |
|
Liabilities ($): |
|
|
|
| ||
Due to BNY Mellon Investment Adviser, Inc. and affiliates—Note 3(c) |
| 229,958 |
| |||
Liability for securities on loan—Note 1(c) |
| 1,166,358 |
| |||
Payable for shares of Beneficial Interest redeemed |
| 911,126 |
| |||
Trustees’ fees and expenses payable |
| 5,813 |
| |||
Other accrued expenses |
|
|
|
| 113,692 |
|
|
|
|
|
| 2,426,947 |
|
Net Assets ($) |
|
| 259,434,187 |
| ||
Composition of Net Assets ($): |
|
|
|
| ||
Paid-in capital |
|
|
|
| 229,463,099 |
|
Total distributable earnings (loss) |
|
|
|
| 29,971,088 |
|
Net Assets ($) |
|
| 259,434,187 |
| ||
Net Asset Value Per Share | Class A | Class C | Class I | Class Y |
|
Net Assets ($) | 44,268,733 | 24,255,148 | 190,882,979 | 27,327 |
|
Shares Outstanding | 3,570,924 | 1,888,152 | 16,235,294 | 2,325 |
|
Net Asset Value Per Share ($) | 12.40 | 12.85 | 11.76 | 11.75 |
|
|
|
|
|
|
|
See notes to financial statements. |
|
|
|
|
|
14
STATEMENT OF OPERATIONS
Year Ended October 31, 2020
|
|
|
|
|
|
|
|
|
|
|
|
|
|
Investment Income ($): |
|
|
|
| ||
Income: |
|
|
|
| ||
Cash dividends (net of $900,893 foreign taxes withheld at source): |
| |||||
Unaffiliated issuers |
|
| 11,527,533 |
| ||
Affiliated issuers |
|
| 74,961 |
| ||
Income from securities lending—Note 1(c) |
|
| 18,233 |
| ||
Total Income |
|
| 11,620,727 |
| ||
Expenses: |
|
|
|
| ||
Management fee—Note 3(a) |
|
| 2,749,992 |
| ||
Shareholder servicing costs—Note 3(c) |
|
| 479,441 |
| ||
Distribution fees—Note 3(b) |
|
| 300,229 |
| ||
Professional fees |
|
| 100,920 |
| ||
Registration fees |
|
| 84,118 |
| ||
Custodian fees—Note 3(c) |
|
| 67,698 |
| ||
Trustees’ fees and expenses—Note 3(d) |
|
| 51,666 |
| ||
Prospectus and shareholders’ reports |
|
| 44,656 |
| ||
Chief Compliance Officer fees—Note 3(c) |
|
| 14,076 |
| ||
Loan commitment fees—Note 2 |
|
| 11,183 |
| ||
Interest expense—Note 2 |
|
| 4,127 |
| ||
Miscellaneous |
|
| 34,713 |
| ||
Total Expenses |
|
| 3,942,819 |
| ||
Investment Income—Net |
|
| 7,677,908 |
| ||
Realized and Unrealized Gain (Loss) on Investments—Note 4 ($): |
|
| ||||
Net realized gain (loss) on investments and foreign currency transactions | (2,141,629) |
| ||||
Net realized gain (loss) on forward foreign currency exchange contracts | (28,796) |
| ||||
Capital gain distributions from affiliated issuers | 232 |
| ||||
Net Realized Gain (Loss) |
|
| (2,170,193) |
| ||
Net change in unrealized appreciation (depreciation) on investments | (50,021,717) |
| ||||
Net Realized and Unrealized Gain (Loss) on Investments |
|
| (52,191,910) |
| ||
Net (Decrease) in Net Assets Resulting from Operations |
| (44,514,002) |
| |||
|
|
|
|
|
|
|
See notes to financial statements. | ||||||
15
STATEMENT OF CHANGES IN NET ASSETS
|
|
|
| Year Ended October 31, | |||||
|
|
|
| 2020 |
| 2019 |
| ||
Operations ($): |
|
|
|
|
|
|
|
| |
Investment income—net |
|
| 7,677,908 |
|
|
| 11,206,527 |
| |
Net realized gain (loss) on investments |
| (2,170,193) |
|
|
| 3,991,925 |
| ||
Net change in unrealized appreciation |
| (50,021,717) |
|
|
| 40,901,395 |
| ||
Net Increase (Decrease) in Net Assets | (44,514,002) |
|
|
| 56,099,847 |
| |||
Distributions ($): |
| ||||||||
Distributions to shareholders: |
|
|
|
|
|
|
|
| |
Class A |
|
| (1,478,263) |
|
|
| (4,299,767) |
| |
Class C |
|
| (898,027) |
|
|
| (3,650,449) |
| |
Class I |
|
| (9,087,320) |
|
|
| (24,224,672) |
| |
Class Y |
|
| (1,014,590) |
|
|
| (4,006,486) |
| |
Total Distributions |
|
| (12,478,200) |
|
|
| (36,181,374) |
| |
Beneficial Interest Transactions ($): |
| ||||||||
Net proceeds from shares sold: |
|
|
|
|
|
|
|
| |
Class A |
|
| 14,341,558 |
|
|
| 24,183,695 |
| |
Class C |
|
| 2,459,474 |
|
|
| 8,280,596 |
| |
Class I |
|
| 65,550,396 |
|
|
| 127,875,082 |
| |
Class Y |
|
| 44,160 |
|
|
| 1,004,214 |
| |
Distributions reinvested: |
|
|
|
|
|
|
|
| |
Class A |
|
| 1,155,036 |
|
|
| 3,728,378 |
| |
Class C |
|
| 655,358 |
|
|
| 2,849,169 |
| |
Class I |
|
| 7,118,845 |
|
|
| 19,399,115 |
| |
Class Y |
|
| 1,014,590 |
|
|
| 4,006,486 |
| |
Cost of shares redeemed: |
|
|
|
|
|
|
|
| |
Class A |
|
| (20,723,278) |
|
|
| (24,774,239) |
| |
Class C |
|
| (23,436,144) |
|
|
| (12,837,805) |
| |
Class I |
|
| (149,982,669) |
|
|
| (113,364,628) |
| |
Class Y |
|
| (36,564,936) |
|
|
| (10,459,223) |
| |
Increase (Decrease) in Net Assets | (138,367,610) |
|
|
| 29,890,840 |
| |||
Total Increase (Decrease) in Net Assets | (195,359,812) |
|
|
| 49,809,313 |
| |||
Net Assets ($): |
| ||||||||
Beginning of Period |
|
| 454,793,999 |
|
|
| 404,984,686 |
| |
End of Period |
|
| 259,434,187 |
|
|
| 454,793,999 |
| |
16
|
|
|
| Year Ended October 31, | |||||
|
|
|
| 2020 |
| 2019 |
| ||
Capital Share Transactions (Shares): |
| ||||||||
Class Aa,b |
|
|
|
|
|
|
|
| |
Shares sold |
|
| 1,089,867 |
|
|
| 1,853,562 |
| |
Shares issued for distributions reinvested |
|
| 87,007 |
|
|
| 300,159 |
| |
Shares redeemed |
|
| (1,619,798) |
|
|
| (1,887,094) |
| |
Net Increase (Decrease) in Shares Outstanding | (442,924) |
|
|
| 266,627 |
| |||
Class Ca |
|
|
|
|
|
|
|
| |
Shares sold |
|
| 174,016 |
|
|
| 630,678 |
| |
Shares issued for distributions reinvested |
|
| 46,799 |
|
|
| 222,809 |
| |
Shares redeemed |
|
| (1,776,282) |
|
|
| (949,979) |
| |
Net Increase (Decrease) in Shares Outstanding | (1,555,467) |
|
|
| (96,492) |
| |||
Class Ib |
|
|
|
|
|
|
|
| |
Shares sold |
|
| 5,267,063 |
|
|
| 10,358,929 |
| |
Shares issued for distributions reinvested |
|
| 567,218 |
|
|
| 1,635,834 |
| |
Shares redeemed |
|
| (12,851,302) |
|
|
| (9,176,481) |
| |
Net Increase (Decrease) in Shares Outstanding | (7,017,021) |
|
|
| 2,818,282 |
| |||
Class Y |
|
|
|
|
|
|
|
| |
Shares sold |
|
| 3,369 |
|
|
| 82,433 |
| |
Shares issued for distributions reinvested |
|
| 80,506 |
|
|
| 338,868 |
| |
Shares redeemed |
|
| (3,061,011) |
|
|
| (815,705) |
| |
Net Increase (Decrease) in Shares Outstanding | (2,977,136) |
|
|
| (394,404) |
| |||
|
|
|
|
|
|
|
|
|
|
a During the period ended October 31, 2020, 106 Class C shares representing $1,489 were automatically converted to 109 Class A shares and during the period ended October 31, 2019, 1,024 Class C shares representing $14,235 were automatically converted to 1,056 Class A shares. | |||||||||
b During the period ended October 31, 2020, 953 Class A shares representing $11,016 were exchanged for 1,004 Class I shares and during the period ended October 31, 2019, 2,172 Class A shares representing $29,470 were exchanged for 2,283 Class I shares. | |||||||||
See notes to financial statements. | |||||||||
17
FINANCIAL HIGHLIGHTS
The following tables describe the performance for each share class for the fiscal periods indicated. All information (except portfolio turnover rate) reflects financial results for a single fund share. Total return shows how much your investment in the fund would have increased (or decreased) during each period, assuming you had reinvested all dividends and distributions. These figures have been derived from the fund’s financial statements.
Year Ended October 31, | ||||||
Class A Shares | 2020 | 2019 | 2018 | 2017 | 2016 | |
Per Share Data ($): | ||||||
Net asset value, beginning of period | 13.99 | 13.45 | 13.65 | 12.57 | 12.62 | |
Investment Operations: | ||||||
Investment income—neta | .26 | .33 | .31 | .24 | .27 | |
Net realized and unrealized | (1.45) | 1.36 | .13 | 1.49 | .48 | |
Total from Investment Operations | (1.19) | 1.69 | .44 | 1.73 | .75 | |
Distributions: | ||||||
Dividends from | (.27) | (.33) | (.32) | (.27) | (.27) | |
Dividends from net realized | (.13) | (.82) | (.32) | (.38) | (.53) | |
Total Distributions | (.40) | (1.15) | (.64) | (.65) | (.80) | |
Net asset value, end of period | 12.40 | 13.99 | 13.45 | 13.65 | 12.57 | |
Total Return (%)b | (8.72) | 13.85 | 3.14 | 14.30 | 6.31 | |
Ratios/Supplemental Data (%): | ||||||
Ratio of total expenses | 1.19 | 1.17 | 1.18 | 1.28 | 1.27 | |
Ratio of net investment income | 1.95 | 2.54 | 2.26 | 1.93 | 2.16 | |
Portfolio Turnover Rate | 18.42 | 27.51 | 21.82 | 26.35 | 27.90 | |
Net Assets, end of period ($ x 1,000) | 44,269 | 56,173 | 50,382 | 54,546 | 108,189 | |
a Based on average shares outstanding.
b Exclusive of sales charge.
See notes to financial statements.
18
Year Ended October 31, | ||||||
Class C Shares | 2020 | 2019 | 2018 | 2017 | 2016 | |
Per Share Data ($): | ||||||
Net asset value, beginning of period | 14.47 | 13.86 | 13.98 | 12.79 | 12.84 | |
Investment Operations: | ||||||
Investment income—neta | .17 | .24 | .22 | .18 | .18 | |
Net realized and unrealized | (1.51) | 1.41 | .12 | 1.50 | .48 | |
Total from Investment Operations | (1.34) | 1.65 | .34 | 1.68 | .66 | |
Distributions: | ||||||
Dividends from | (.15) | (.22) | (.14) | (.11) | (.18) | |
Dividends from net realized | (.13) | (.82) | (.32) | (.38) | (.53) | |
Total Distributions | (.28) | (1.04) | (.46) | (.49) | (.71) | |
Net asset value, end of period | 12.85 | 14.47 | 13.86 | 13.98 | 12.79 | |
Total Return (%)b | (9.42) | 13.00 | 2.41 | 13.56 | 5.49 | |
Ratios/Supplemental Data (%): | ||||||
Ratio of total expenses | 1.94 | 1.91 | 1.91 | 2.01 | 2.02 | |
Ratio of net investment income | 1.21 | 1.79 | 1.53 | 1.36 | 1.42 | |
Portfolio Turnover Rate | 18.42 | 27.51 | 21.82 | 26.35 | 27.90 | |
Net Assets, end of period ($ x 1,000) | 24,255 | 49,830 | 49,068 | 56,969 | 57,459 | |
a Based on average shares outstanding.
b Exclusive of sales charge.
See notes to financial statements.
19
FINANCIAL HIGHLIGHTS (continued)
Year Ended October 31, | ||||||
Class I Shares | 2020 | 2019 | 2018 | 2017 | 2016 | |
Per Share Data ($): | ||||||
Net asset value, beginning of period | 13.30 | 12.83 | 13.10 | 12.11 | 12.19 | |
Investment Operations: | ||||||
Investment income—neta | .28 | .35 | .33 | .31 | .28 | |
Net realized and unrealized | (1.39) | 1.30 | .12 | 1.39 | .47 | |
Total from Investment Operations | (1.11) | 1.65 | .45 | 1.70 | .75 | |
Distributions: | ||||||
Dividends from | (.30) | (.36) | (.40) | (.33) | (.30) | |
Dividends from net realized | (.13) | (.82) | (.32) | (.38) | (.53) | |
Total Distributions | (.43) | (1.18) | (.72) | (.71) | (.83) | |
Net asset value, end of period | 11.76 | 13.30 | 12.83 | 13.10 | 12.11 | |
Total Return (%) | (8.53) | 14.20 | 3.43 | 14.65 | 6.65 | |
Ratios/Supplemental Data (%): | ||||||
Ratio of total expenses | .94 | .91 | .90 | .99 | 1.01 | |
Ratio of net investment income | 2.22 | 2.78 | 2.55 | 2.42 | 2.32 | |
Portfolio Turnover Rate | 18.42 | 27.51 | 21.82 | 26.35 | 27.90 | |
Net Assets, end of period ($ x 1,000) | 190,883 | 309,206 | 262,268 | 296,215 | 222,595 | |
a Based on average shares outstanding.
See notes to financial statements.
20
Year Ended October 31, | ||||||
Class Y Shares | 2020 | 2019 | 2018 | 2017 | 2016 | |
Per Share Data ($): | ||||||
Net asset value, beginning of period | 13.29 | 12.82 | 13.09 | 12.11 | 12.19 | |
Investment Operations: | ||||||
Investment income—neta | .32 | .37 | .34 | .31 | .30 | |
Net realized and unrealized | (1.42) | 1.29 | .12 | 1.39 | .46 | |
Total from Investment Operations | (1.10) | 1.66 | .46 | 1.70 | .76 | |
Distributions: | ||||||
Dividends from | (.31) | (.37) | (.41) | (.34) | (.31) | |
Dividends from net realized | (.13) | (.82) | (.32) | (.38) | (.53) | |
Total Distributions | (.44) | (1.19) | (.73) | (.72) | (.84) | |
Net asset value, end of period | 11.75 | 13.29 | 12.82 | 13.09 | 12.11 | |
Total Return (%) | (8.47) | 14.29 | 3.53 | 14.68 | 6.72 | |
Ratios/Supplemental Data (%): | ||||||
Ratio of total expenses | .85 | .84 | .83 | .92 | .94 | |
Ratio of net investment income | 2.48 | 2.93 | 2.61 | 2.45 | 2.52 | |
Portfolio Turnover Rate | 18.42 | 27.51 | 21.82 | 26.35 | 27.90 | |
Net Assets, end of period ($ x 1,000) | 27 | 39,585 | 43,267 | 40,786 | 33,342 | |
a Based on average shares outstanding.
See notes to financial statements.
21
NOTES TO FINANCIAL STATEMENTS
NOTE 1—Significant Accounting Policies:
BNY Mellon Global Equity Income Fund (the “fund”) is a separate diversified series of BNY Mellon Investment Funds III (the “Trust”), which is registered under the Investment Company Act of 1940, as amended (the “Act”), as an open-end management investment company and operates as a series company currently offering four series, including the fund. The fund’s investment objective is to seek total return (consisting of capital appreciation and income). BNY Mellon Investment Adviser, Inc. (the “Adviser”), a wholly-owned subsidiary of The Bank of New York Mellon Corporation (“BNY Mellon”), serves as the fund’s investment adviser. Effective December 31, 2019, Newton Investment Management (North America) Limited (“NIMNA”) reorganized into Newton Investment Management Limited (“NIM” or the “Sub-Adviser”), a wholly-owned subsidiary of BNY Mellon and an affiliate of the Adviser. Consequently, the sub-investment advisory agreement between the Adviser and NIMNA was terminated and NIM now serves as the fund’s sub-adviser pursuant to a sub-investment advisory agreement between the Adviser and NIM. There was no change to the fund’s investment objective, polices or strategies as a result of the reorganization of NIMNA into Sub-Adviser.
The Trust’s Board of Trustees (the “Board”) approved, effective December 31, 2019 (the “Effective Date”), the termination of the fund’s authorized Class T shares. Prior to the Effective Date, the fund did not offer such Class T shares for purchase.
BNY Mellon Securities Corporation (the “Distributor”), a wholly-owned subsidiary of the Adviser, is the distributor of the fund’s shares. The fund is authorized to issue an unlimited number of $.001 par value shares of Beneficial Interest in each of the following classes of shares: Class A, Class C, Class I and Class Y. Class A and Class C shares are sold primarily to retail investors through financial intermediaries and bear Distribution and/or Shareholder Services Plan fees. Class A shares generally are subject to a sales charge imposed at the time of purchase. Class A shares bought without an initial sales charge as part of an investment of $1 million or more may be charged a contingent deferred sales charge (“CDSC”) of 1.00% if redeemed within one year. Class C shares are subject to a CDSC imposed on Class C shares redeemed within one year of purchase. Class C shares automatically convert to Class A shares ten years after the date of purchase, without the imposition of a sales charge. Class I shares are sold primarily to bank trust departments and other financial service providers
22
(including The Bank of New York Mellon, a subsidiary of BNY Mellon and an affiliate of the Adviser, and its affiliates), acting on behalf of customers having a qualified trust or an investment account or relationship at such institution, and bear no Distribution or Shareholder Services Plan fees. Class Y shares are sold at net asset value per share generally to institutional investors, and bear no Distribution or Shareholder Services Plan fees. Class I and Class Y shares are offered without a front-end sales charge or CDSC. Other differences between the classes include the services offered to and the expenses borne by each class, the allocation of certain transfer agency costs and certain voting rights. Income, expenses (other than expenses attributable to a specific class), and realized and unrealized gains or losses on investments are allocated to each class of shares based on its relative net assets.
The Trust accounts separately for the assets, liabilities and operations of each series. Expenses directly attributable to each series are charged to that series’ operations; expenses which are applicable to all series are allocated among them on a pro rata basis.
The Financial Accounting Standards Board (“FASB”) Accounting Standards Codification (“ASC”) is the exclusive reference of authoritative U.S. generally accepted accounting principles (“GAAP”) recognized by the FASB to be applied by nongovernmental entities. Rules and interpretive releases of the Securities and Exchange Commission (“SEC”) under authority of federal laws are also sources of authoritative GAAP for SEC registrants. The fund is an investment company and applies the accounting and reporting guidance of the FASB ASC Topic 946 Financial Services-Investment Companies. The fund’s financial statements are prepared in accordance with GAAP, which may require the use of management estimates and assumptions. Actual results could differ from those estimates.
The Trust enters into contracts that contain a variety of indemnifications. The fund’s maximum exposure under these arrangements is unknown. The fund does not anticipate recognizing any loss related to these arrangements.
(a) Portfolio valuation: The fair value of a financial instrument is the amount that would be received to sell an asset or paid to transfer a liability in an orderly transaction between market participants at the measurement date (i.e., the exit price). GAAP establishes a fair value hierarchy that prioritizes the inputs of valuation techniques used to measure fair value. This hierarchy gives the highest priority to unadjusted quoted prices in active markets for identical assets or liabilities (Level 1 measurements) and the lowest priority to unobservable inputs (Level 3 measurements).
23
NOTES TO FINANCIAL STATEMENTS (continued)
Additionally, GAAP provides guidance on determining whether the volume and activity in a market has decreased significantly and whether such a decrease in activity results in transactions that are not orderly. GAAP requires enhanced disclosures around valuation inputs and techniques used during annual and interim periods.
Various inputs are used in determining the value of the fund’s investments relating to fair value measurements. These inputs are summarized in the three broad levels listed below:
Level 1—unadjusted quoted prices in active markets for identical investments.
Level 2—other significant observable inputs (including quoted prices for similar investments, interest rates, prepayment speeds, credit risk, etc.).
Level 3—significant unobservable inputs (including the fund’s own assumptions in determining the fair value of investments).
The inputs or methodology used for valuing securities are not necessarily an indication of the risk associated with investing in those securities.
Changes in valuation techniques may result in transfers in or out of an assigned level within the disclosure hierarchy. Valuation techniques used to value the fund’s investments are as follows:
Investments in equity securities are valued at the last sales price on the securities exchange or national securities market on which such securities are primarily traded. Securities listed on the National Market System for which market quotations are available are valued at the official closing price or, if there is no official closing price that day, at the last sales price. For open short positions, asked prices are used for valuation purposes. Bid price is used when no asked price is available. Registered investment companies that are not traded on an exchange are valued at their net asset value. All of the preceding securities are generally categorized within Level 1 of the fair value hierarchy.
Securities not listed on an exchange or the national securities market, or securities for which there were no transactions, are valued at the average of the most recent bid and asked prices. These securities are generally categorized within Level 2 of the fair value hierarchy.
Fair valuing of securities may be determined with the assistance of a pricing service using calculations based on indices of domestic securities and other appropriate indicators, such as prices of relevant ADRs and
24
futures. Utilizing these techniques may result in transfers between Level 1 and Level 2 of the fair value hierarchy.
When market quotations or official closing prices are not readily available, or are determined not to accurately reflect fair value, such as when the value of a security has been significantly affected by events after the close of the exchange or market on which the security is principally traded (for example, a foreign exchange or market), but before the fund calculates its net asset value, the fund may value these investments at fair value as determined in accordance with the procedures approved by the Board. Certain factors may be considered when fair valuing investments such as: fundamental analytical data, the nature and duration of restrictions on disposition, an evaluation of the forces that influence the market in which the securities are purchased and sold, and public trading in similar securities of the issuer or comparable issuers. These securities are either categorized within Level 2 or 3 of the fair value hierarchy depending on the relevant inputs used.
For securities where observable inputs are limited, assumptions about market activity and risk are used and such securities are generally categorized within Level 3 of the fair value hierarchy.
Investments denominated in foreign currencies are translated to U.S. dollars at the prevailing rates of exchange.
The following is a summary of the inputs used as of October 31, 2020 in valuing the fund’s investments:
Level 1 - Unadjusted Quoted Prices | Level 2 - Other Significant Observable Inputs | Level 3 -Significant Unobservable Inputs | Total | |
Assets ($) | ||||
Investments in Securities: † | ||||
Equity Securities - | 119,909,330 | 124,249,657†† | - | 244,158,987 |
Equity Securities - | - | 9,953,671†† | - | 9,953,671 |
Investment Companies | 4,873,256 | - | - | 4,873,256 |
† See Statement of Investments for additional detailed categorizations, if any.
†† Securities classified within Level 2 at period end as the values were determined pursuant to the fund’s fair valuation procedures.
(b) Foreign currency transactions: The fund does not isolate that portion of the results of operations resulting from changes in foreign exchange rates on investments from the fluctuations arising from changes in the market prices of securities held. Such fluctuations are included with the net realized and unrealized gain or loss on investments.
25
NOTES TO FINANCIAL STATEMENTS (continued)
Net realized foreign exchange gains or losses arise from sales of foreign currencies, currency gains or losses realized on securities transactions between trade and settlement date, and the difference between the amounts of dividends, interest and foreign withholding taxes recorded on the fund’s books and the U.S. dollar equivalent of the amounts actually received or paid. Net unrealized foreign exchange gains and losses arise from changes in the value of assets and liabilities other than investments resulting from changes in exchange rates. Foreign currency gains and losses on foreign currency transactions are also included with net realized and unrealized gain or loss on investments.
Foreign Taxes: The fund may be subject to foreign taxes (a portion of which may be reclaimable) on income, stock dividends, realized and unrealized capital gains on investments or certain foreign currency transactions. Foreign taxes are recorded in accordance with the fund’s understanding of the applicable foreign tax regulations and rates that exist in the foreign jurisdictions in which the fund invests. These foreign taxes, if any, are paid by the fund and are reflected in the Statement of Operations. Foreign taxes payable or deferred as of October 31, 2020, if any, are disclosed in the fund’s Statement of Assets and Liabilities.
(c) Securities transactions and investment income: Securities transactions are recorded on a trade date basis. Realized gains and losses from securities transactions are recorded on the identified cost basis. Dividend income is recognized on the ex-dividend date and interest income, including, where applicable, accretion of discount and amortization of premium on investments, is recognized on the accrual basis.
Pursuant to a securities lending agreement with The Bank of New York Mellon, a subsidiary of BNY Mellon and an affiliate of the Adviser, the fund may lend securities to qualified institutions. It is the fund’s policy that, at origination, all loans are secured by collateral of at least 102% of the value of U.S. securities loaned and 105% of the value of foreign securities loaned. Collateral equivalent to at least 100% of the market value of securities on loan is maintained at all times. Collateral is either in the form of cash, which can be invested in certain money market mutual funds managed by the Adviser, or U.S. Government and Agency securities. The fund is entitled to receive all dividends, interest and distributions on securities loaned, in addition to income earned as a result of the lending transaction. Should a borrower fail to return the securities in a timely manner, The Bank of New York Mellon is required to replace the securities for the benefit of the fund or credit the fund with the market value of the unreturned securities and is subrogated to the fund’s rights
26
against the borrower and the collateral. Additionally, the contractual maturity of security lending transactions are on an overnight and continuous basis. During the period ended October 31, 2020, The Bank of New York Mellon earned $3,745 from the lending of the fund’s portfolio securities, pursuant to the securities lending agreement.
(d) Affiliated issuers: Investments in other investment companies advised by the Adviser are considered “affiliated” under the Act.
(e) Risk: Investing in foreign markets may involve special risks and considerations not typically associated with investing in the U.S. These risks include revaluation of currencies, high rates of inflation, repatriation restrictions on income and capital, and adverse political, economic developments and public health conditions. Moreover, securities issued in these markets may be less liquid, subject to government ownership controls and delayed settlements, and their prices may be more volatile than those of comparable securities in the U.S. In addition, turbulence in financial markets and reduced liquidity in equity, credit and/or fixed income markets may negatively affect many issuers, which could adversely affect the fund. Global economies and financial markets are becoming increasingly interconnected, and conditions and events in one country, region or financial market may adversely impact issuers in a different country, region or financial market. These risks may be magnified if certain events or developments adversely interrupt the global supply chain; in these and other circumstances, such risks might affect companies world-wide. Recent examples include pandemic risks related to COVID-19 and aggressive measures taken world-wide in response by governments, including closing borders, restricting international and domestic travel, and the imposition of prolonged quarantines of large populations, and by businesses, including changes to operations and reducing staff. To the extent the fund may overweight its investments in certain countries, companies, industries or market sectors, such positions will increase the fund’s exposure to risk of loss from adverse developments affecting those countries, companies, industries or sectors.
(f) Dividends and distributions to shareholders: Dividends and distributions are recorded on the ex-dividend date. Dividends from investment income-net are normally declared and paid quarterly. Dividends from net realized capital gains, if any, are normally declared and paid annually, but the fund may make distributions on a more frequent basis to comply with the distribution requirements of the Internal Revenue Code of 1986, as amended (the “Code”). To the extent that net realized capital gains can be offset by capital loss carryovers, it is the policy of the fund not to distribute such gains. Income and capital gain distributions are
27
NOTES TO FINANCIAL STATEMENTS (continued)
determined in accordance with income tax regulations, which may differ from GAAP.
(g) Federal income taxes: It is the policy of the fund to continue to qualify as a regulated investment company, if such qualification is in the best interests of its shareholders, by complying with the applicable provisions of the Code, and to make distributions of taxable income and net realized capital gain sufficient to relieve it from substantially all federal income and excise taxes.
As of and during the period ended October 31, 2020, the fund did not have any liabilities for any uncertain tax positions. The fund recognizes interest and penalties, if any, related to uncertain tax positions as income tax expense in the Statement of Operations. During the period ended October 31, 2020, the fund did not incur any interest or penalties.
Each tax year in the four-year period ended October 31, 2020 remains subject to examination by the Internal Revenue Service and state taxing authorities.
At October 31, 2020, the components of accumulated earnings on a tax basis were as follows: undistributed ordinary income $917,570, accumulated capital losses $2,029,439 and unrealized appreciation $31,082,957.
The fund is permitted to carry forward capital losses for an unlimited period. Furthermore, capital loss carryovers retain their character as either short-term or long-term capital losses.
The accumulated capital loss carryover is available for federal income tax purposes to be applied against future net realized capital gains, if any, realized subsequent to October 31, 2020. If not applied, the fund has $2,029,439 of short-term capital losses which can be carried forward for an unlimited period.
The tax character of distributions paid to shareholders during the fiscal periods ended October 31, 2020 and October 31, 2019 were as follows: ordinary income $8,251,503 and $15,043,941, and long-term capital gains $4,226,697 and $21,137,433, respectively.
NOTE 2—Bank Lines of Credit:
The fund participates with other long-term open-end funds managed by the Adviser in a $823.5 million unsecured credit facility led by Citibank, N.A. (the “Citibank Credit Facility”) and a $300 million unsecured credit facility provided by The Bank of New York Mellon (the “BNYM Credit Facility”), each to be utilized primarily for temporary or emergency
28
purposes, including the financing of redemptions (each, a “Facility”). The Citibank Credit Facility is available in two tranches: (i) Tranche A is in an amount equal to $688.5 million and is available to all long-term open-ended funds, including the fund, and (ii) Tranche B is an amount equal to $135 million and is available only to BNY Mellon Floating Rate Income Fund, a series of BNY Mellon Investment Funds IV, Inc. Prior to September 30, 2020, the Citibank Credit Facility was $927 million with Tranche A available in an amount equal to $747 million and Tranche B available in an amount equal to $180 million. Prior to March 11, 2020, the Citibank Credit Facility was $1.030 billion with Tranche A available in an amount equal to $830 million and Tranche B available in an amount equal to $200 million. In connection therewith, the fund has agreed to pay its pro rata portion of commitment fees for Tranche A of the Citibank Credit Facility and the BNYM Credit Facility. Interest is charged to the fund based on rates determined pursuant to the terms of the respective Facility at the time of borrowing.
The average amount of borrowings outstanding under the Facilities during the period ended October 31, 2020 was approximately $275,683 with a related weighted average annualized interest rate of 1.50%.
NOTE 3—Management Fee, Sub-Investment Advisory Fee and Other Transactions with Affiliates:
(a) Pursuant to a management agreement with the Adviser and the Trust, the Trust had agreed to pay the Adviser a management fee computed at the annual rate of .75% of the value of the fund’s average daily net assets and is payable monthly.
Pursuant to a sub-investment advisory agreement between the Adviser and the Sub-Adviser, the Adviser pays the Sub-Adviser a monthly fee at an annual rate of .36% of the value of the fund’s average daily net assets.
During the period ended October 31, 2020, the Distributor retained $7,676 from commissions earned on sales of the fund’s Class A shares, $22,666 and 12,622 from CDSC fees on redemptions of the fund’s Class A and Class C shares, respectively..
(b) Under the Distribution Plan adopted pursuant to Rule 12b-1 under the Act, Class C shares pay the Distributor for distributing its shares at an annual rate of .75% of the value of its average daily net assets. During the period ended October 31, 2020, Class C shares were charged $300,229 pursuant to the Distribution Plan.
(c) Under the Shareholder Services Plan, Class A and Class C shares pay the Distributor at an annual rate of .25% of the value of their average daily
29
NOTES TO FINANCIAL STATEMENTS (continued)
net assets for the provision of certain services. The services provided may include personal services relating to shareholder accounts, such as answering shareholder inquiries regarding the fund and providing reports and other information, and services related to the maintenance of shareholder accounts. The Distributor may make payments to Service Agents (securities dealers, financial institutions or other industry professionals) with respect to these services. The Distributor determines the amounts to be paid to Service Agents. During the period ended October 31, 2020, Class A and Class C shares were charged $121,828 and $100,076, respectively, pursuant to the Shareholder Services Plan.
Under its terms, the Distribution Plan and Shareholder Services Plan shall remain in effect from year to year, provided such continuance is approved annually by a vote of a majority of those Trustees who are not “interested persons” of the Trust and who have no direct or indirect financial interest in the operation of or in any agreement related to the Distribution Plan or Shareholder Services Plan.
The fund has an arrangement with the transfer agent whereby the fund may receive earnings credits when positive cash balances are maintained, which are used to offset transfer agency fees. For financial reporting purposes, the fund includes net earnings credits, if any, as an expense offset in the Statement of Operations.
The fund has an arrangement with the custodian whereby the fund will receive interest income or be charged an overdraft fees when cash balances are maintained. For financial reporting purposes, the fund includes this interest income and overdraft fees, if any, as interest income in the Statement of Operations.
The fund compensates BNY Mellon Transfer, Inc., a wholly-owned subsidiary of the Adviser, under a transfer agency agreement for providing transfer agency and cash management services for the fund. The majority of transfer agency fees are comprised of amounts paid on a per account basis, while cash management fees are related to fund subscriptions and redemptions. During the period ended October 31, 2020, the fund was charged $9,957 for transfer agency services. These fees are included in Shareholder servicing costs in the Statement of Operations.
The fund compensates The Bank of New York Mellon under a custody agreement for providing custodial services for the fund. These fees are determined based on net assets, geographic region and transaction activity. During the period ended October 31, 2020, the fund was charged $67,698 pursuant to the custody agreement.
30
During the period ended October 31, 2020, the fund was charged $14,076 for services performed by the Chief Compliance Officer and his staff. These fees are included in Chief Compliance Officer fees in the Statement of Operations.
The components of “Due to BNY Mellon Investment Adviser, Inc. and affiliates” in the Statement of Assets and Liabilities consist of: management fees of $176,545, Distribution Plan fees of $16,728, Shareholder Services Plan fees of $15,506, custodian fees of $15,000, Chief Compliance Officer fees of $4,546 and transfer agency fees of $1,633.
(d) Each Board member also serves as a Board member of other funds in the BNY Mellon Family of Funds complex. Annual retainer fees and attendance fees are allocated to each fund based on net assets.
NOTE 4—Securities Transactions:
The aggregate amount of purchases and sales of investment securities, excluding short-term securities and forward foreign currency exchange contracts (“forward contracts”), during the period ended October 31, 2020, amounted to $65,275,351 and $201,830,917, respectively.
Derivatives: A derivative is a financial instrument whose performance is derived from the performance of another asset. The fund enters into International Swaps and Derivatives Association, Inc. Master Agreements or similar agreements (collectively, “Master Agreements”) with its over-the-counter (“OTC”) derivative contract counterparties in order to, among other things, reduce its credit risk to counterparties. Master Agreements include provisions for general obligations, representations, collateral and events of default or termination. Under a Master Agreement, the fund may offset with the counterparty certain derivative financial instruments’ payables and/or receivables with collateral held and/or posted and create one single net payment in the event of default or termination.
Each type of derivative instrument that was held by the fund during the period ended October 31, 2020 is discussed below.
Forward Foreign Currency Exchange Contracts: The fund enters into forward contracts in order to hedge its exposure to changes in foreign currency exchange rates on its foreign portfolio holdings, to settle foreign currency transactions or as a part of its investment strategy. When executing forward contracts, the fund is obligated to buy or sell a foreign currency at a specified rate on a certain date in the future. With respect to sales of forward contracts, the fund incurs a loss if the value of the contract increases between the date the forward contract is opened and the date the forward contract is closed. The fund realizes a gain if the value of
31
NOTES TO FINANCIAL STATEMENTS (continued)
the contract decreases between those dates. With respect to purchases of forward contracts, the fund incurs a loss if the value of the contract decreases between the date the forward contract is opened and the date the forward contract is closed. The fund realizes a gain if the value of the contract increases between those dates. Any realized or unrealized gains or losses which occurred during the period are reflected in the Statement of Operations. The fund is exposed to foreign currency risk as a result of changes in value of underlying financial instruments. The fund is also exposed to credit risk associated with counterparty nonperformance on these forward contracts, which is generally limited to the unrealized gain on each open contract. This risk may be mitigated by Master Agreements, if any, between the fund and the counterparty and the posting of collateral, if any, by the counterparty to the fund to cover the fund’s exposure to the counterparty. At October 31, 2020, there were no forward contracts outstanding.
The following summarizes the average market value of derivatives outstanding during the period ended October 31, 2020:
|
| Average Market Value ($) |
Forward contracts |
| 92,539 |
|
|
|
At October 31, 2020, the cost of investments for federal income tax purposes was $227,973,475; accordingly, accumulated net unrealized appreciation on investments was $31,012,439, consisting of $57,913,480 gross unrealized appreciation and $26,901,041 gross unrealized depreciation.
32
REPORT OF INDEPENDENT REGISTERED PUBLIC ACCOUNTING FIRM
To the Shareholders of the Fund and Board of Trustees of
BNY Mellon Investment Funds III:
Opinion on the Financial Statements
We have audited the accompanying statement of assets and liabilities of BNY Mellon Global Equity Income Fund (the “Fund”), a series of BNY Mellon Investment Funds III, including the statement of investments, as of October 31, 2020, and the statement of investments in affiliated issuers as of and for the year then ended, the related statement of operations for the year then ended, the statements of changes in net assets for each of the years in the two-year period then ended, and the related notes (collectively, the financial statements), and the financial highlights for each of the years in the five-year period then ended. In our opinion, the financial statements and financial highlights present fairly, in all material respects, the financial position of the Fund as of October 31, 2020, the results of its operations for the year then ended, the changes in its net assets for each of the years in the two-year period then ended, and the financial highlights for each of the years in the five-year period then ended, in conformity with U.S. generally accepted accounting principles.
Basis for Opinion
These financial statements and financial highlights are the responsibility of the Fund’s management. Our responsibility is to express an opinion on these financial statements and financial highlights based on our audits. We are a public accounting firm registered with the Public Company Accounting Oversight Board (United States) (PCAOB) and are required to be independent with respect to the Fund in accordance with the U.S. federal securities laws and the applicable rules and regulations of the Securities and Exchange Commission and the PCAOB.
We conducted our audits in accordance with the standards of the PCAOB. Those standards require that we plan and perform the audit to obtain reasonable assurance about whether the financial statements and financial highlights are free of material misstatement, whether due to error or fraud. Our audits included performing procedures to assess the risks of material misstatement of the financial statements and financial highlights, whether due to error or fraud, and performing procedures that respond to those risks. Such procedures included examining, on a test basis, evidence regarding the amounts and disclosures in the financial statements and financial highlights. Such procedures also included confirmation of securities owned as of October 31, 2020, by correspondence with the custodian and brokers or by other appropriate auditing procedures when replies from brokers were not received. Our audits also included evaluating the accounting principles used and significant estimates made by management, as well as evaluating the overall presentation of the financial statements and financial highlights. We believe that our audits provide a reasonable basis for our opinion.

We have served as the auditor of one or more BNY Mellon Investment Adviser, Inc. investment companies since 1994.
New York, New York
December 18, 2020
33
IMPORTANT TAX INFORMATION (Unaudited)
For federal tax purposes, the fund elects to provide each shareholder with their portion of the fund’s income sourced from foreign countries and taxes paid from foreign countries. The fund reports the maximum amount allowable but not less than $12,358,445 as income sourced from foreign countries for the fiscal year ended October 31, 2020 in accordance with Section 853(c)(2) of the Internal Revenue Code and also the fund reports the maximum amount allowable but not less than $838,981 as taxes paid from foreign countries for the fiscal year ended October 31, 2020 in accordance with Section 853(a) of the Internal Revenue Code. Where required by federal tax rules, shareholders will receive notification of their proportionate share of foreign sourced income and foreign taxes paid for the 2020 calendar year with Form 1099-DIV which will be mailed in early 2021. Also the fund designates the maximum amount allowable, but not less than $9,090,484 as ordinary income dividends paid during the fiscal year ended October 31, 2020 as qualified dividend income in accordance with Section 854(b)(1)(B) of the Internal Revenue Code. Also the fund reports the maximum amount allowable but not less than $.1257 per share as a capital gain dividend in accordance with Section 852(b)(3)(C) of the Internal Revenue Code. Also, the fund reports the maximum amount allowable but not less than 63.94% of ordinary income dividends paid during the year ended October 31, 2020 as eligible for the corporate dividends received deduction provided under Section 243 of the Internal Revenue Code in accordance with Section 854(b)(1)(A) of the Internal Revenue Code.
34
BOARD MEMBERS INFORMATION (Unaudited)
INDEPENDENT BOARD MEMBERS
Joseph S. DiMartino (77)
Chairman of the Board (1999)
Principal Occupation During Past 5 Years:
· Director or Trustee of funds in the BNY Mellon Family of Funds and certain other entities (as described in the fund’s Statement of Additional Information) (1995-Present)
Other Public Company Board Memberships During Past 5 Years:
· CBIZ, Inc., a public company providing professional business services, products and solutions, Director (1997-Present)
No. of Portfolios for which Board Member Serves: 110
———————
Francine J. Bovich (69)
Board Member (2012)
Principal Occupation During Past 5 Years:
· Trustee, The Bradley Trusts, private trust funds (2011-Present)
Other Public Company Board Memberships During Past 5 Years:
· Annaly Capital Management, Inc., a real estate investment trust, Director (2014-Present)
No. of Portfolios for which Board Member Serves: 67
———————
Andrew J. Donohue (70)
Board Member (2019)
Principal Occupation During Past 5 Years:
· Of Counsel, Shearman & Sterling LLP (2017-2019)
· Chief of Staff to the Chair of the SEC (2015-2017)
· Managing Director and Investment Company General Counsel of Goldman Sachs (2012-2015)
Other Public Company Board Memberships During Past 5 Years:
· Oppenheimer Funds (58 funds), Director (2017-2019)
No. of Portfolios for which Board Member Serves: 53
———————
35
BOARD MEMBERS INFORMATION (Unaudited) (continued)
INDEPENDENT BOARD MEMBERS (continued)
Kenneth A. Himmel (74)
Board Member (1994)
Principal Occupation During Past 5 Years:
· Managing Partner, Gulf Related, an international real estate development company (2010-Present)
· President and CEO, Related Urban Development, a real estate development company (1996-Present)
· CEO, American Food Management, a restaurant company (1983-Present)
· President and CEO, Himmel & Company, a real estate development company (1980-Present)
No. of Portfolios for which Board Member Serves: 22
———————
Stephen J. Lockwood (73)
Board Member (1994)
Principal Occupation During Past 5 Years:
· Chairman of the Board, Stephen J. Lockwood and Company LLC, a real estate investment company (2000-Present)
No. of Portfolios for which Board Member Serves: 22
———————
Roslyn M. Watson (71)
Board Member (1994)
Principal Occupation During Past 5 Years:
· Principal, Watson Ventures, Inc., a real estate investment company (1993-Present)
Other Public Company Board Memberships During Past 5 Years:
· American Express Bank, FSB, Director (1993-2018)
No. of Portfolios for which Board Member Serves: 53
———————
36
Benaree Pratt Wiley (74)
Board Member (1998)
Principal Occupation During Past 5 Years:
· Principal, The Wiley Group, a firm specializing in strategy and business development (2005-Present)
Other Public Company Board Memberships During Past 5 Years:
· CBIZ, Inc., a public company providing professional business services, products and solutions, Director (2008-Present)
· Blue Cross-Blue Shield of Massachusetts, Director (2004-Present)
No. of Portfolios for which Board Member Serves: 71
———————
Once elected all Board Members serve for an indefinite term, but achieve Emeritus status upon reaching age 80. The address of the Board Members and Officers is c/o BNY Mellon Investment Adviser, Inc. 240 Greenwich Street, New York, New York 10286. Additional information about the Board Members is available in the fund’s Statement of Additional Information which can be obtained from the Adviser free of charge by calling this toll free number: 1-800-373-9387.
James M. Fitzgibbons, Emeritus Board Member
37
OFFICERS OF THE FUND (Unaudited)
RENEE LAROCHE-MORRIS, President since May 2019.
President and a director of BNY Mellon Investment Adviser, Inc. since January 2018. She is an officer of 61 investment companies (comprised of 110 portfolios) managed by the Adviser. She is 49 years old and has been an employee of BNY Mellon since 2003.
JAMES WINDELS, Treasurer since November 2001.
Director-BNY Mellon Fund Administration, and an officer of 63 investment companies (comprised of 141 portfolios) managed by the Adviser or an affiliate of the Adviser. He is 62 years old and has been an employee of the Adviser since April 1985.
BENNETT A. MACDOUGALL, Chief Legal Officer since October 2015.
Chief Legal Officer of the Adviser and Associate General Counsel and Managing Director of BNY Mellon since June 2015; Director and Associate General Counsel of Deutsche Bank–Asset & Wealth Management Division from June 2005 to June 2015, and as Chief Legal Officer of Deutsche Investment Management Americas Inc. from June 2012 to May 2015. He is an officer of 63 investment companies (comprised of 141 portfolios) managed by the Adviser or an affiliate of the Adviser. He is 49 years old and has been an employee of the Adviser since June 2015.
DAVID DIPETRILLO, Vice President since May 2019.
Head of North America Product, BNY Mellon Investment Management since January 2018, Director of Product Strategy, BNY Mellon Investment Management from January 2016 to December 2017; Head of US Retail Product and Channel Marketing, BNY Mellon Investment Management from January 2014 to December 2015. He is an officer of 62 investment companies (comprised of 118 portfolios) managed by the Adviser or an affiliate of the Adviser. He is 42 years old and has been an employee of BNY Mellon since 2005.
JAMES BITETTO, Vice President since August 2005 and Secretary since February 2018.
Senior Managing Counsel of BNY Mellon since December 2019; Managing Counsel of BNY Mellon from April 2014 to December 2019; Secretary of the Adviser, and an officer of 63 investment companies (comprised of 141 portfolios) managed by the Adviser or an affiliate of the Adviser. He is 54 years old and has been an employee of the Adviser since December 1996.
SONALEE CROSS, Vice President and Assistant Secretary since March 2018.
Counsel of BNY Mellon since October 2016; Associate at Proskauer Rose LLP from April 2016 to September 2016; Attorney at EnTrust Capital from August 2015 to February 2016; Associate at Sidley Austin LLP from September 2013 to August 2015. She is an officer of 63 investment companies (comprised of 141 portfolios) managed by the Adviser or an affiliate of the Adviser. She is 33 years old and has been an employee of the Adviser since October 2016.
DEIRDRE CUNNANE, Vice President and Assistant Secretary since March 2019.
Counsel of BNY Mellon since August 2018; Senior Regulatory Specialist at BNY Mellon Investment Management Services from February 2016 to August 2018; Trustee Associate at BNY Mellon Trust Company (Ireland) Limited from August 2013 to February 2016. She is an officer of 63 investment companies (comprised of 141 portfolios) managed by the Adviser or an affiliate of the Adviser. She is 30 years old and has been an employee of the Adviser since August 2018.
SARAH S. KELLEHER, Vice President and Assistant Secretary since April 2014.
Managing Counsel of BNY Mellon since December 2017, Senior Counsel of BNY Mellon from March 2013 to December 2017. She is an officer of 63 investment companies (comprised of 141 portfolios) managed by the Adviser or an affiliate of the Adviser. She is 45 years old and has been an employee of the Adviser since March 2013.
JEFF PRUSNOFSKY, Vice President and Assistant Secretary since August 2005.
Senior Managing Counsel of BNY Mellon, and an officer of 63 investment companies (comprised of 141 portfolios) managed by the Adviser or an affiliate of the Adviser. He is 55 years old and has been an employee of the Adviser since October 1990.
AMANDA QUINN, Vice President and Assistant Secretary since March 2020.
Counsel of BNY Mellon since June 2019; Regulatory Administration Manager at BNY Mellon Investment Management Services from September 2018 to May 2019; Senior Regulatory Specialist at BNY Mellon Investment Management Services from April 2015 to August 2018. She is an officer of 63 investment companies (comprised of 141 portfolios) managed by the Adviser or an affiliate of the Adviser. She is 35 years old and has been an employee of the Adviser since June 2019.
38
PETER M. SULLIVAN, Vice President and Assistant Secretary since March 2019.
Managing Counsel of BNY Mellon since March 2009, Senior Counsel of BNY Mellon from April 2004 to March 2009, and an officer of 63 investment companies (comprised of 141 portfolios) managed by the Adviser or an affiliate of the Adviser. He is 52 years old and has been an employee of the Adviser since January 2019.
NATALYA ZELENSKY, Vice President and Assistant Secretary since March 2017.
Managing Counsel of BNY Mellon since December 2019; Counsel of BNY Mellon from May 2016 to December 2019; Attorney at Wildermuth Endowment Strategy Fund/Wildermuth Advisory, LLC from November 2015 to May 2016 and Assistant General Counsel at RCS Advisory Services from July 2014 to November 2015. She is an officer of 63 investment companies (comprised of 141 portfolios) managed by the Adviser or an affiliate of the Adviser. She is 35 years old and has been an employee of the Adviser since May 2016.
GAVIN C. REILLY, Assistant Treasurer since December 2005.
Tax Manager-BNY Mellon Fund Administration, and an officer of 63 investment companies (comprised of 141 portfolios) managed by the Adviser or an affiliate of the Adviser. He is 52 years old and has been an employee of the Adviser since April 1991.
ROBERT S. ROBOL, Assistant Treasurer since August 2005.
Senior Accounting Manager-BNY Mellon Fund Administration, and an officer of 63 investment companies (comprised of 141 portfolios) managed by the Adviser or an affiliate of the Adviser. He is 56 years old and has been an employee of the Adviser since October 1988.
ROBERT SALVIOLO, Assistant Treasurer since July 2007.
Senior Accounting Manager–BNY Mellon Fund Administration, and an officer of 63 investment companies (comprised of 141 portfolios) managed by the Adviser or an affiliate of the Adviser. He is 53 years old and has been an employee of the Adviser since June 1989.
ROBERT SVAGNA, Assistant Treasurer since December 2002.
Senior Accounting Manager–BNY Mellon Fund Administration, and an officer of 63 investment companies (comprised of 141 portfolios) managed by the Adviser or an affiliate of the Adviser. He is 53 years old and has been an employee of the Adviser since November 1990.
JOSEPH W. CONNOLLY, Chief Compliance Officer since October 2004.
Chief Compliance Officer of the Adviser, the BNY Mellon Family of Funds and BNY Mellon Funds Trust (62 investment companies, comprised of 133 portfolios). He is 63 years old and has served in various capacities with the Adviser since 1980, including manager of the firm’s Fund Accounting Department from 1997 through October 2001.
CARIDAD M. CAROSELLA, Anti-Money Laundering Compliance Officer since January 2016.
Anti-Money Laundering Compliance Officer of the BNY Mellon Family of Funds and BNY Mellon Funds Trust since January 2016; from May 2015 to December 2015, Interim Anti-Money Laundering Compliance Officer of the BNY Mellon Family of Funds and BNY Mellon Funds Trust and the Distributor; from January 2012 to May 2015, AML Surveillance Officer of the Distributor. She is an officer of 56 investment companies (comprised of 134 portfolios) managed by the Adviser or an affiliate of the Adviser. She is 52 years old and has been an employee of the Distributor since 1997.
39
This page intentionally left blank.
40
This page intentionally left blank.
41
BNY Mellon Global Equity Income Fund
240 Greenwich Street
New York, NY 10286
Adviser
BNY Mellon Investment Adviser, Inc.
240 Greenwich Street
New York, NY 10286
Sub-Adviser
Newton Investment Management Limited
160 Queen Victoria Street
London, EC4V, 4LA, UK
Custodian
The Bank of New York Mellon
240 Greenwich Street
New York, NY 10286
Transfer Agent &
Dividend Disbursing Agent
BNY Mellon Transfer, Inc.
240 Greenwich Street
New York, NY 10286
Distributor
BNY Mellon Securities Corporation
240 Greenwich Street
New York, NY 10286
Ticker Symbols: | Class A: DEQAX Class C: DEQCX Class I: DQEIX Class Y: DEQYX |
Telephone Call your financial representative or 1-800-373-9387
Mail The BNY Mellon Family of Funds, 144 Glenn Curtiss Boulevard, Uniondale, NY 11556-0144
E-mail Send your request to info@bnymellon.com
Internet Information can be viewed online or downloaded at www.bnymellonim.com/us
The fund files its complete schedule of portfolio holdings with the Securities and Exchange Commission (“SEC”) for the first and third quarters of each fiscal year on Form N-PORT. The fund’s Forms N-PORT are available on the SEC’s website at www.sec.gov.
A description of the policies and procedures that the fund uses to determine how to vote proxies relating to portfolio securities and information regarding how the fund voted these proxies for the most recent 12-month period ended June 30 is available at www.bnymellonim.com/us and on the SEC’s website at www.sec.gov and without charge, upon request, by calling 1-800-373-9387.
© 2020 BNY Mellon Securities Corporation |
|

BNY Mellon International Bond Fund
ANNUAL REPORT October 31, 2020 |
|

Save time. Save paper. View your next shareholder report online as soon as it’s available. Log into www.bnymellonim.com/us and sign up for eCommunications. It’s simple and only takes a few minutes. |
The views expressed in this report reflect those of the portfolio manager(s) only through the end of the period covered and do not necessarily represent the views of BNY Mellon Investment Adviser, Inc. or any other person in the BNY Mellon Investment Adviser, Inc. organization. Any such views are subject to change at any time based upon market or other conditions and BNY Mellon Investment Adviser, Inc. disclaims any responsibility to update such views. These views may not be relied on as investment advice and, because investment decisions for a fund in the BNY Mellon Family of Funds are based on numerous factors, may not be relied on as an indication of trading intent on behalf of any fund in the BNY Mellon Family of Funds. |
Not FDIC-Insured • Not Bank-Guaranteed • May Lose Value |
Contents
THE FUND
BNY Mellon Investment Adviser, Inc. | |
With Those of Other Funds | |
in Affiliated Issuers | |
Currency Exchange Contracts | |
Public Accounting Firm | |
FOR MORE INFORMATION
Back Cover
| The Fund |
A LETTER FROM THE PRESIDENT OF BNY MELLON INVESTMENT ADVISER, INC.
Dear Shareholder:
We are pleased to present this annual report for BNY Mellon International Bond Fund, covering the 12-month period from November 1, 2019 through October 31, 2020. For information about how the fund performed during the reporting period, as well as general market perspectives, we provide a Discussion of Fund Performance on the pages that follow.
Accommodative rate policies from the U.S. Federal Reserve (the “Fed”) and progress towards a U.S./China trade deal stoked optimism about future economic growth prospects the final months of 2019, fueling an equity rally. As we entered 2020, optimism turned to concern as COVID-19 began to spread across portions of Asia and Europe. When the virus reached the U.S. in March 2020, stocks became volatile. U.S. equities posted historic losses during the month due to investor concern over the economic impact of a widespread quarantine. Global central banks and governments launched emergency stimulus measures to support their respective economies, and equity valuations began to rebound, trending upward until the fall. Volatility returned in September 2020 and continued through October, as concerns over rising COVID-19 infection rates, continued trade tensions, the U.S. Congress’ failure to pass additional financial assistance and anxiety over the upcoming U.S. election constrained equity valuations.
In fixed-income markets, interest rates were heavily influenced by changes in Fed policy and investor concern over COVID-19. In 2019, as stocks rallied in response to Fed rate cuts, risk-asset valuations also rose while Treasuries lagged. When COVID-19 began to emerge, a flight to quality ensued, and Treasury rates fell significantly. The Fed cut rates twice in March 2020, resulting in an overnight lending target rate of nearly zero, and the government launched a large stimulus package. Risk-asset prices began to rebound, and bond indices generally rose until September 2020, when investment-grade instrument prices stalled. Yields in the intermediate and long portions of the Treasury curve rose during October, further constraining bond prices.
We believe the near-term outlook for the U.S. will be challenging, as the country continues to battle COVID-19. As always, we will monitor relevant data for meaningful developments. We encourage you to discuss the risks and opportunities in today’s investment environment with your financial advisor.
Thank you for your continued confidence and support.
Sincerely,

Renee LaRoche-Morris
President
BNY Mellon Investment Adviser, Inc.
November 16, 2020
2
DISCUSSION OF FUND PERFORMANCE (Unaudited)
For the period from November 1, 2019 through October 31, 2020, as provided by David Leduc, CFA, Brendan Murphy, CFA and Scott Zaleski, CFA, Portfolio Managers
Market and Fund Performance Overview
For the 12-month period ended October 31, 2020, the BNY Mellon International Bond Fund’s Class A shares produced a total return of 1.93%, Class C shares returned 1.23%, Class I shares returned 2.30%, and Class Y shares returned 2.36%.1 In comparison, the fund’s benchmark, the Bloomberg Barclays Global Aggregate ex USD Index (Unhedged) (the “Index”), produced a total return of 4.96% for the same period.2
International bond markets posted positive returns during the period, due in part to central bank policies which supported asset valuations. The fund trailed the Index, resulting partially from an overweight to inflation-linked securities and the fund’s currency positioning.
The Fund’s Investment Approach
The fund seeks to maximize total return through capital appreciation and income. To pursue its goal, the fund normally invests at least 80% of its net assets, plus any borrowings for investment purposes, in fixed-income securities. The fund also normally invests at least 65% of its assets in non-U.S. dollar-denominated, fixed-income securities of foreign governments and companies located in various countries, including emerging markets.
Generally, the fund seeks to maintain a portfolio with an average credit quality of investment grade. The fund’s portfolio managers focus on identifying undervalued government bond markets, currencies, sectors and securities and look for fixed-income securities with the most potential for added value, such as those involving the potential for credit upgrades, unique structural characteristics, or innovative features. The portfolio managers select securities for the fund’s portfolio by using fundamental economic research and quantitative analysis to allocate assets among countries and currencies, focusing on sectors and individual securities that appear to be relatively undervalued, and actively trading among sectors.
COVID-19 and Central Bank Activity Drives Markets
It was an eventful 12 months for fixed-income markets. The period started out with an optimistic tone, with clarity around Brexit and a possible resolution to the U.S./China trade disagreement on the horizon. Investors were looking forward to a new calendar year filled with higher economic growth rates and continued expansion. Emerging-market economies had begun to stabilize after being disrupted by trade disputes. Risk asset spreads were tight through the middle of February 2020. However, the tone changed as COVID-19 wreaked havoc globally, causing a dramatic decline in economic activity and consequent increase in corporate and emerging-market bond spreads. Liquidity tightened in March 2020. Spreads widened, affecting even some high-quality positions. The adverse impact was compounded by an oil price collapse as a result of disagreement between OPEC members Saudi Arabia and Russia. There was a partial recovery in riskier bonds in April 2020, as massive monetary and fiscal responses were unleashed by governments and central banks. The European Central Bank expanded their bond buying program to provide more assistance to countries on the European periphery.
3
DISCUSSION OF FUND PERFORMANCE (Unaudited) (continued)
Risk assets rallied in response to central bank intervention. Investor sentiment also improved as COVID-19 infection rates fell during the summer, and lockdown measures eased, allowing economic activity to pick up in some parts of the world. Emerging-market sovereign debt and some high yield debt recovered some of the ground lost in March. Spreads generally continued to tighten through much of the period, and many fixed-income instruments posted gains through the end of October despite pockets of volatility the last months of the period.
Inflation-Linked Securities and Currency Decisions Constrain Fund Performance
The fund’s performance compared to the Index was constrained during the period by four main factors. First, the fund held an overweight to inflation-linked securities. Expectations for rising inflation that were present at the start of the period due to the sunny economic climate at the end of 2019 did not come to fruition, leading inflation-linked investments to underperform the broader market. In addition, the fund’s currency positions weighed on relative results. The fund was underweight both the U.S. dollar and the euro, both of which rallied during the period. The February and March 2020 drawdown inspired many investors to exit mutual funds, leading to high redemption rates. Having to sell securities to meet redemptions during that time of depressed valuations also hampered performance for the period. Finally, the fund was underweight duration. In a time when rates generally fell, this was not beneficial to relative performance.
On a more positive note, the fund’s yield-curve positioning strategies were beneficial, particularly among credits issued by places along the European periphery, New Zealand and Canada. In addition, the fund added to its investment-grade corporate credit positioning in April 2020. These securities proceeded to rally throughout much of the rest of the period. Increasing the allocation to this asset class prior to the period of strong performance was beneficial to relative results. Security selection within corporate credit also helped. Positions in REIT companies CyrusOne and W.P. Carey were top contributors, as well as credits issued by communications companies Comcast, Vodafone Group and AT&T.
Security and Country Selection is Paramount
Central banks remain accommodative and have indicated the low-rate environment is here to stay for the foreseeable future. Since variation in central bank intervention is essentially off the table, we believe the next six-to-12 months of market activity will be dependent on the virus, the potential for a vaccine and trying to get economic output back to where it was. It is our belief this may not happen until the end of next year. The economic and market rebound seems to be slowing. The ability of central banks to influence market activity is less now than it was back in March. To provide impact and back stop markets, we think more fiscal stimulus from the government may be needed.
Given this outlook, we are looking at security selection to drive performance in the corporate bond space. Not all corporations are equally protected from a balance sheet or business risk standpoint, so security selection is important. We consider “fallen angels” to be attractive in the high yield space. Cheaper valuations still exist in emerging markets, but we believe it’s important to be selective there, as different countries are subject to varying geopolitical issues, which can affect market activity. Securitized markets have returned to near-pandemic valuation levels, so there isn’t as much value there, but we think they still
4
offer downside protection on the grounds that they are highly-rated securities. Sovereign debt seems rich but continued accommodative interest-rate policies should keep a cap on future rate increases. We have decreased our exposure to inflation-linked securities, as we do not currently detect high inflationary pressures in the global economy. From a currency standpoint, we expect the dollar to continue to weaken as deficits in the U.S. continue to move higher, and other countries recover from the pandemic and grow economically.
November 16, 2020
1 Total return includes reinvestment of dividends and any capital gains paid and does not take into consideration the maximum initial sales charge in the case of Class A shares or the applicable contingent deferred sales charge imposed on redemptions in the case of Class C shares. Had these charges been reflected, returns would have been lower. Class I and Class Y shares are not subject to any initial or deferred sales charge. Past performance is no guarantee of future results. Share price and investment return fluctuate such that upon redemption, fund shares may be worth more or less than their original cost. The fund’s return reflects the absorption of certain fund expenses by BNY Mellon Investment Adviser, Inc. pursuant to an agreement in effect through February 28, 2021, at which time it may be extended, modified or terminated. Had these expenses not been absorbed, returns would have been lower.
2 Source: Lipper Inc. — The Bloomberg Barclays Global Aggregate ex USD Index (Unhedged) is a flagship measure of global investment-grade debt from 24 local currency markets, excluding U.S. dollar-denominated bonds. This multi-currency benchmark includes treasury, government-related, corporate and securitized fixed-rate bonds from both developed- and emerging-market issuers. Investors cannot invest directly in any index.
Bonds are subject generally to interest-rate, credit, liquidity and market risks, to varying degrees, all of which are more fully described in the fund’s prospectus. Generally, all other factors being equal, bond prices are inversely related to interest-rate changes, and rate increases can cause price declines.
Recent market risks include pandemic risks related to COVID-19. The effects of COVID-19 have contributed to increased volatility in global markets and will likely affect certain countries, companies, industries and market sectors more dramatically than others. To the extent the fund may overweight its investments in certain countries, companies, industries or market sectors, such positions will increase the fund's exposure to risk of loss from adverse developments affecting those countries, companies, industries or sectors.
High yield bonds are subject to increased credit risk and are considered speculative in terms of the issuer’s perceived ability to continue making interest payments on a timely basis and to repay principal upon maturity.
Foreign bonds are subject to special risks, including exposure to currency fluctuations, changing political and economic conditions and potentially less liquidity. These risks are generally greater with emerging-market countries than with more economically and politically established foreign countries.
The fund may, but is not required to, use derivative instruments. A small investment in derivatives could have a potentially large impact on the fund’s performance. The use of derivatives involves risks different from, or possibly greater than, the risks associated with investing directly in the underlying assets.
Investments in foreign currencies are subject to the risk that those currencies will decline in value relative to the U.S. dollar, or, in the case of hedged positions, that the U.S. dollar will decline relative to the currency being hedged. Currency rates in foreign countries may fluctuate significantly over short periods of time. A decline in the value of foreign currencies relative to the U.S. dollar will reduce the value of securities held by the fund and denominated in those currencies. The use of leverage may magnify the fund’s gains or losses. For derivatives with a leveraging component, adverse changes in the value or level of the underlying asset can result in a loss that is much greater than the original investment in the derivative.
Please note: the position in any security highlighted with italicized typeface was sold during the reporting period.
5
FUND PERFORMANCE (Unaudited)
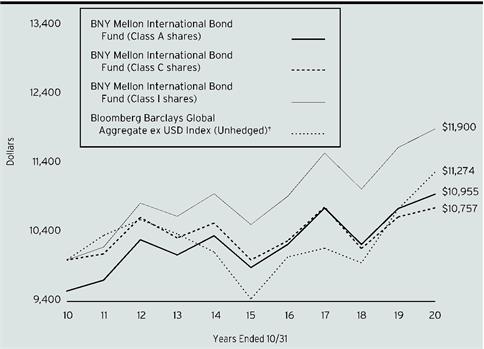
Comparison of change in value of a $10,000 investment in Class A shares, Class C shares and Class I shares of BNY Mellon International Bond Fund with a hypothetical investment of $10,000 in the Bloomberg Barclays Global Aggregate ex USD Index (Unhedged) (the “Index”)
† Source: Lipper Inc.
Past performance is not predictive of future performance.
The above graph compares a hypothetical investment of $10,000 made in Class A sahres, Class C shares, and Class I shares of BNY Mellon International Bond Fund on 10/31/10 to a hypothetical investment of $10,000 made in the Index on that date. All dividends and capital gain distributions are reinvested.
The fund’s performance shown in the line graph above takes into account the maximum initial sales charge on Class A shares and all other applicable fees and expenses on all classes. The Index is a flagship measure of global investment-grade debt from 24 local currency markets, excluding U.S. dollar-denominated bonds. This multi-currency benchmark includes treasury, government-related, corporate and securitized fixed-rate bonds from both developed and emerging markets issuers. Unlike a mutual fund, the Index is not subject to charges, fees and other expenses. Investors cannot invest directly in any index. Further information relating to fund performance, including expense reimbursements, if applicable, is contained in the Financial Highlights section of the prospectus and elsewhere in this report.
6

Comparison of change in value of a $1,000,000 investment in Class Y shares of BNY Mellon International Bond Fund with a hypothetical investment of $1,000,000 in the Bloomberg Barclays Global Aggregate ex USD Index (Unhedged) (the “Index”)
† Source: Lipper Inc.
†† The total return figures presented for Class Y shares of the fund reflect the performance of the fund’s Class A shares for the period prior to 7/1/13 (the inception date for Class Y shares), not reflecting the applicable sales charges for Class A shares.
Past performance is not predictive of future performance.
The above graph compares a hypothetical investment of $1,000,000 made in Class Y shares of BNY Mellon International Bond Fund on 10/31/10 to a hypothetical investment of $1,000,000 made in the Index on that date. All dividends and capital gain distributions are reinvested.
The fund’s performance shown in the line graph above takes into account all applicable fees and expenses of the fund’s Class Y shares. The Index is a flagship measure of global investment-grade debt from 24 local currency markets, excluding U.S. dollar-denominated bonds. This multi-currency benchmark includes treasury, government-related, corporate and securitized fixed-rate bonds from both developed and emerging markets issuers. Unlike a mutual fund, the Index is not subject to charges, fees and other expenses. Investors cannot invest directly in any index. Further information relating to fund performance, including expense reimbursements, if applicable, is contained in the Financial Highlights section of the prospectus and elsewhere in this report.
7
FUND PERFORMANCE (Unaudited) (continued)
Average Annual Total Returns as of 10/31/2020 | ||||
| Inception | 1 Year | 5 Years | 10 Years |
Date | ||||
Class A shares | ||||
with maximum sales charge (4.5%) | 12/30/05 | -2.67% | 1.14% | 0.92% |
without sales charge | 12/30/05 | 1.93% | 2.06% | 1.38% |
Class C shares | ||||
with applicable redemption charge† | 12/30/05 | 0.23% | 1.47% | 0.73% |
without redemption | 12/30/05 | 1.23% | 1.47% | 0.73% |
Class I shares | 12/30/05 | 2.30% | 2.51% | 1.76% |
Class Y shares | 7/1/13 | 2.36% | 2.58% | 1.81%†† |
Bloomberg Barclay Global Aggregate | ||||
ex USD Index (Unhedged) | 4.96% | 3.62% | 1.21% | |
† The maximum contingent deferred sales charge for Class C shares is 1% for shares redeemed within one year of the date of purchase.
†† The total return performance figures presented for Class Y shares of the fund reflect the performance of the fund’s Class A shares for the period prior to 7/1/13 (the inception date for Class Y shares), not reflecting the applicable sales charges for Class A shares.
The performance data quoted represents past performance, which is no guarantee of future results. Share price and investment return fluctuate and an investor’s shares may be worth more or less than original cost upon redemption. Current performance may be lower or higher than the performance quoted. Go to www.bnymellonim.com/us for the fund’s most recent month-end returns.
The fund’s performance shown in the graphs and table does not reflect the deduction of taxes that a shareholder would pay on fund distributions or the redemption of fund shares. In addition to the performance of Class A shares shown with and without a maximum sales charge, the fund’s performance shown in the table takes into account all other applicable fees and expenses on all classes.
8
UNDERSTANDING YOUR FUND’S EXPENSES (Unaudited)
As a mutual fund investor, you pay ongoing expenses, such as management fees and other expenses. Using the information below, you can estimate how these expenses affect your investment and compare them with the expenses of other funds. You also may pay one-time transaction expenses, including sales charges (loads) and redemption fees, which are not shown in this section and would have resulted in higher total expenses. For more information, see your fund’s prospectus or talk to your financial adviser.
Review your fund’s expenses
The table below shows the expenses you would have paid on a $1,000 investment in BNY Mellon International Bond Fund from May 1, 2020 to October 31, 2020. It also shows how much a $1,000 investment would be worth at the close of the period, assuming actual returns and expenses.
Expenses and Value of a $1,000 Investment |
| |||||
Assume actual returns for the six months ended October 31, 2020 |
| |||||
|
|
|
|
|
|
|
|
| Class A | Class C | Class I | Class Y |
|
Expense paid per $1,000† | $5.36 | $9.03 | $3.63 | $3.16 |
| |
Ending value (after expenses) | $1,091.90 | $1,088.50 | $1,094.00 | $1,093.90 |
| |
COMPARING YOUR FUND’S EXPENSES
WITH THOSE OF OTHER FUNDS (Unaudited)
Using the SEC’s method to compare expenses
The Securities and Exchange Commission (“SEC”) has established guidelines to help investors assess fund expenses. Per these guidelines, the table below shows your fund’s expenses based on a $1,000 investment, assuming a hypothetical 5% annualized return. You can use this information to compare the ongoing expenses (but not transaction expenses or total cost) of investing in the fund with those of other funds. All mutual fund shareholder reports will provide this information to help you make this comparison. Please note that you cannot use this information to estimate your actual ending account balance and expenses paid during the period.
Expenses and Value of a $1,000 Investment |
| |||||
Assuming a hypothetical 5% annualized return for the six months ended October 31, 2020 |
| |||||
|
|
|
|
|
|
|
|
| Class A | Class C | Class I | Class Y |
|
Expense paid per $1,000† | $5.18 | $8.72 | $3.51 | $3.05 |
| |
Ending value (after expenses) | $1,020.01 | $1,016.49 | $1,021.67 | $1,022.12 |
| |
† Expenses are equal to the fund’s annualized expense ratio of 1.02% for Class A, 1.72% for Class C, .69% for Class I and .60% for Class Y, multiplied by the average account value over the period, multiplied by 184/366 (to reflect the one-half year period). | ||||||
9
STATEMENT OF INVESTMENTS
October 31, 2020
Description | Coupon | Maturity | Principal | a | Value ($) | ||||
Bonds and Notes - 95.9% | |||||||||
Australia - 3.4% | |||||||||
Australia, Sr. Unscd. Bonds, Ser. 150 | AUD | 3.00 | 3/21/2047 | 11,850,000 | 10,601,416 | ||||
Queensland Treasury, Govt. Gtd. Bonds | AUD | 1.75 | 7/20/2034 | 3,900,000 | b | 2,788,541 | |||
13,389,957 | |||||||||
Canada - 4.3% | |||||||||
BMW Canada Auto Trust, Ser. 2019-1, Cl. A3 | CAD | 2.35 | 2/20/2024 | 1,600,000 | 1,228,672 | ||||
Canada, Bonds | CAD | 1.25 | 6/1/2030 | 15,725,000 | 12,463,860 | ||||
Enbridge, Gtd. Notes | 4.00 | 11/15/2049 | 375,000 | 389,555 | |||||
Ford Auto Securitization Trust, Ser. 2019-AA, Cl. A2 | CAD | 2.35 | 6/15/2023 | 1,046,643 | b | 795,379 | |||
Ford Auto Securitization Trust, Ser. 2020-AA, Cl. A3 | CAD | 1.15 | 11/15/2025 | 1,075,000 | b | 806,875 | |||
Silver Arrow Canada, Ser. 2018-1A, Cl. A3 | CAD | 3.17 | 8/15/2025 | 1,250,000 | b | 955,059 | |||
Teck Resources, Sr. Unscd. Notes | 6.25 | 7/15/2041 | 315,000 | 359,544 | |||||
16,998,944 | |||||||||
Cayman Islands - 1.6% | |||||||||
Bain Capital Credit CLO, Ser. 2020-3A, Cl. A, 3 Month LIBOR +1.38% | 1.64 | 10/23/2032 | 1,155,000 | b,c | 1,153,032 | ||||
CK Hutchison Europe Finance 18, Gtd. Bonds | EUR | 1.25 | 4/13/2025 | 660,000 | 803,817 | ||||
Magnetite XVII CLO, Ser. 2016-17A, Cl. AR, 3 Month LIBOR +1.10% | 1.32 | 7/20/2031 | 1,400,000 | b,c | 1,384,860 | ||||
Magnetite XXVIII CLO, Ser. 2020-28A, Cl. A, 3 Month LIBOR +1.27% | 1.49 | 10/25/2031 | 800,000 | b,c | 799,042 | ||||
Sands China, Sr. Unscd. Notes | 4.38 | 6/18/2030 | 1,000,000 | b | 1,028,020 | ||||
Taconic Park CLO, Ser. 2016-1A, Cl. A1R, 3 Month LIBOR +1.00% | 1.22 | 1/20/2029 | 1,300,000 | b,c | 1,286,694 | ||||
6,455,465 | |||||||||
Chile - .1% | |||||||||
VTR Comunicaciones, Sr. Scd. Notes | 5.13 | 1/15/2028 | 375,000 | b | 396,225 | ||||
China - 5.1% | |||||||||
China, Bonds, Ser. 1827 | CNY | 3.25 | 11/22/2028 | 67,800,000 | 10,119,427 | ||||
China, Unscd. Bonds | CNY | 3.81 | 9/14/2050 | 21,300,000 | 3,150,176 | ||||
China Development Bank, Unscd. Bonds, Ser. 1905 | CNY | 3.48 | 1/8/2029 | 49,000,000 | 7,186,844 | ||||
20,456,447 | |||||||||
Croatia - .7% | |||||||||
Croatia, Sr. Unscd. Bonds | EUR | 2.75 | 1/27/2030 | 2,000,000 | 2,723,883 | ||||
Cyprus - 1.4% | |||||||||
Cyprus, Sr. Unscd. Notes | EUR | 1.25 | 1/21/2040 | 1,800,000 | 2,187,625 | ||||
10
Description | Coupon | Maturity | Principal | a | Value ($) | ||||
Bonds and Notes - 95.9% (continued) | |||||||||
Cyprus - 1.4% (continued) | |||||||||
Cyprus, Sr. Unscd. Notes | EUR | 2.75 | 5/3/2049 | 2,220,000 | 3,493,566 | ||||
5,681,191 | |||||||||
Egypt - .2% | |||||||||
Egypt, Sr. Unscd. Notes | 5.25 | 10/6/2025 | 675,000 | b | 671,625 | ||||
France - 1.4% | |||||||||
Credit Agricole, Sub. Notes | 3.25 | 1/14/2030 | 630,000 | 673,505 | |||||
Credit Agricole Home Loan SFH, Covered Notes | EUR | 1.25 | 3/24/2031 | 1,600,000 | 2,151,088 | ||||
Engie, Jr. Sub. Bonds | EUR | 1.38 | 4/16/2023 | 1,500,000 | d | 1,745,806 | |||
Orange, Sr. Unscd. Notes | EUR | 0.02 | 9/4/2026 | 700,000 | 818,488 | ||||
5,388,887 | |||||||||
Germany - .6% | |||||||||
Allianz, Sub. Notes | EUR | 5.63 | 10/17/2042 | 1,800,000 | 2,313,958 | ||||
Greece - 3.6% | |||||||||
Hellenic Republic, Bonds | EUR | 1.50 | 6/18/2030 | 7,925,000 | b | 9,710,957 | |||
Hellenic Republic, Sr. Unscd. Notes | EUR | 1.88 | 2/4/2035 | 3,775,000 | b | 4,811,842 | |||
14,522,799 | |||||||||
Hungary - .4% | |||||||||
Hungary, Sr. Unscd. Notes | 7.63 | 3/29/2041 | 825,000 | 1,475,735 | |||||
Indonesia - .9% | |||||||||
Indonesia, Sr. Unscd. Notes | EUR | 1.40 | 10/30/2031 | 1,065,000 | 1,230,398 | ||||
Indonesia, Sr. Unscd. Notes | EUR | 3.75 | 6/14/2028 | 860,000 | 1,179,036 | ||||
Perusahaan Listrik Negara, Sr. Unscd. Notes | EUR | 1.88 | 11/5/2031 | 940,000 | 1,052,217 | ||||
3,461,651 | |||||||||
Ireland - 1.0% | |||||||||
AerCap Global Aviation Trust, Gtd. Notes | 4.45 | 10/1/2025 | 500,000 | 505,936 | |||||
AerCap Global Aviation Trust, Gtd. Notes | 6.50 | 7/15/2025 | 650,000 | 716,043 | |||||
Ireland, Bonds | EUR | 2.00 | 2/18/2045 | 1,610,000 | 2,668,370 | ||||
3,890,349 | |||||||||
Italy - 5.5% | |||||||||
Italy Buoni Poliennali Del Tesoro, Sr. Unscd. Bonds | EUR | 1.65 | 12/1/2030 | 2,825,000 | b | 3,588,647 | |||
Italy Buoni Poliennali Del Tesoro, Sr. Unscd. Bonds | EUR | 2.70 | 3/1/2047 | 5,150,000 | b | 7,549,557 | |||
Italy Buoni Poliennali Del Tesoro, Sr. Unscd. Bonds, Ser. CAC | EUR | 2.45 | 9/1/2050 | 7,525,000 | b | 10,572,879 | |||
21,711,083 | |||||||||
Japan - 9.0% | |||||||||
Japan, Bonds, Ser. 21 | JPY | 0.10 | 3/10/2026 | 2,482,598,256 | e | 23,601,223 | |||
Japan (10 Year Issue), Bonds, Ser. 348 | JPY | 0.10 | 9/20/2027 | 220,950,000 | 2,138,141 | ||||
11
STATEMENT OF INVESTMENTS (continued)
Description | Coupon | Maturity | Principal | a | Value ($) | ||||
Bonds and Notes - 95.9% (continued) | |||||||||
Japan - 9.0% (continued) | |||||||||
Japan (20 Year Issue), Bonds, Ser. 156 | JPY | 0.40 | 3/20/2036 | 933,400,000 | 9,086,327 | ||||
Takeda Pharmaceutical, Sr. Unscd. Notes | EUR | 2.00 | 7/9/2040 | 920,000 | 1,168,546 | ||||
35,994,237 | |||||||||
Kazakhstan - .1% | |||||||||
Development Bank of Kazakhstan, Sr. Unscd. Notes | 4.13 | 12/10/2022 | 475,000 | 497,919 | |||||
Luxembourg - 1.7% | |||||||||
CK Hutchison Group Telecom Finance, Gtd. Notes | EUR | 1.13 | 10/17/2028 | 2,315,000 | 2,838,002 | ||||
DH Europe Finance II, Gtd. Bonds | EUR | 0.20 | 3/18/2026 | 2,325,000 | 2,732,948 | ||||
Medtronic Global Holdings, Gtd. Notes | EUR | 0.75 | 10/15/2032 | 420,000 | 501,895 | ||||
Medtronic Global Holdings, Gtd. Notes | EUR | 1.63 | 3/7/2031 | 475,000 | 623,695 | ||||
Millicom International Cellular, Sr. Unscd. Notes | 4.50 | 4/27/2031 | 250,000 | b | 254,063 | ||||
6,950,603 | |||||||||
Malaysia - 1.1% | |||||||||
Malaysia, Bonds, Ser. 219 | MYR | 3.89 | 8/15/2029 | 7,530,000 | 1,988,054 | ||||
Petronas Capital, Gtd. Notes | 4.55 | 4/21/2050 | 1,950,000 | b | 2,462,740 | ||||
4,450,794 | |||||||||
Mexico - .6% | |||||||||
Infraestructura Energetica Nova, Sr. Unscd. Notes | 4.88 | 1/14/2048 | 755,000 | f | 722,758 | ||||
Mexico, Bonds, Ser. M | MXN | 5.75 | 3/5/2026 | 35,000,000 | 1,680,426 | ||||
2,403,184 | |||||||||
Netherlands - 5.4% | |||||||||
ABN AMRO Bank, Sub. Notes | EUR | 2.88 | 1/18/2028 | 1,100,000 | 1,341,840 | ||||
Cooperatieve Rabobank, Sub. Bonds | EUR | 2.50 | 5/26/2026 | 2,141,000 | 2,525,622 | ||||
EDP Finance, Sr. Unscd. Notes | EUR | 0.38 | 9/16/2026 | 2,300,000 | 2,728,519 | ||||
Enel Finance International, Gtd. Notes | EUR | 0.38 | 6/17/2027 | 2,315,000 | 2,741,395 | ||||
Iberdrola International, Gtd. Notes | EUR | 2.63 | 3/26/2024 | 1,400,000 | d | 1,694,744 | |||
ING Groep, Sub. Bonds | EUR | 2.00 | 3/22/2030 | 900,000 | 1,089,217 | ||||
ING Groep, Sub. Notes | EUR | 3.00 | 4/11/2028 | 2,100,000 | 2,579,649 | ||||
Mamoura Diversified Global Holding, Gtd. Notes | 2.50 | 11/7/2024 | 755,000 | 791,661 | |||||
VEON Holdings, Sr. Unscd. Notes | 3.95 | 6/16/2021 | 1,400,000 | 1,416,541 | |||||
WPC Eurobond, Gtd. Bonds | EUR | 2.25 | 7/19/2024 | 950,000 | 1,186,064 | ||||
WPC Eurobond, Gtd. Notes | EUR | 1.35 | 4/15/2028 | 2,485,000 | 2,964,399 | ||||
WPC Eurobond, Gtd. Notes | EUR | 2.13 | 4/15/2027 | 195,000 | 243,826 | ||||
21,303,477 | |||||||||
12
Description | Coupon | Maturity | Principal | a | Value ($) | ||||
Bonds and Notes - 95.9% (continued) | |||||||||
Philippines - .7% | |||||||||
Philippine, Sr. Unscd. Notes | EUR | 0.13 | 2/3/2023 | 1,500,000 | 1,744,835 | ||||
Philippine, Sr. Unscd. Notes | EUR | 0.88 | 5/17/2027 | 750,000 | 876,912 | ||||
2,621,747 | |||||||||
Portugal - 2.2% | |||||||||
Portugal, Sr. Unscd. Bonds | EUR | 3.88 | 2/15/2030 | 4,125,000 | b | 6,514,331 | |||
Portugal, Sr. Unscd. Notes | EUR | 0.90 | 10/12/2035 | 1,925,000 | b | 2,384,832 | |||
8,899,163 | |||||||||
Romania - .7% | |||||||||
Romania, Bonds | EUR | 3.62 | 5/26/2030 | 1,600,000 | b | 2,141,698 | |||
Romania, Sr. Unscd. Notes | EUR | 2.50 | 2/8/2030 | 405,000 | b | 500,189 | |||
2,641,887 | |||||||||
Serbia - .7% | |||||||||
Serbia, Sr. Unscd. Notes | EUR | 3.13 | 5/15/2027 | 2,100,000 | b | 2,664,991 | |||
Singapore - 1.9% | |||||||||
Singapore, Bonds | SGD | 2.63 | 5/1/2028 | 6,560,000 | 5,469,077 | ||||
Temasek Financial I, Gtd. Notes | EUR | 1.25 | 11/20/2049 | 950,000 | 1,288,951 | ||||
Temasek Financial I, Gtd. Notes | 2.50 | 10/6/2070 | 1,000,000 | b,f | 955,353 | ||||
7,713,381 | |||||||||
Spain - 4.4% | |||||||||
Banco Santander, Covered Notes | EUR | 0.88 | 5/9/2031 | 1,500,000 | 1,950,740 | ||||
Banco Santander, Sub. Notes | EUR | 2.50 | 3/18/2025 | 2,300,000 | 2,847,764 | ||||
Spain, Sr. Unscd. Bonds | EUR | 2.90 | 10/31/2046 | 5,864,000 | b | 10,118,100 | |||
Telefonica Emisiones, Gtd. Notes | EUR | 1.53 | 1/17/2025 | 2,100,000 | 2,609,636 | ||||
17,526,240 | |||||||||
Supranational - 1.3% | |||||||||
Banque Ouest Africaine de Developpement, Sr. Unscd. Notes | 5.00 | 7/27/2027 | 1,635,000 | 1,759,260 | |||||
Corp. Andina de Fomento, Sr. Unscd. Notes | 3.25 | 2/11/2022 | 1,300,000 | 1,339,144 | |||||
The African Export-Import Bank, Sr. Unscd. Notes | 5.25 | 10/11/2023 | 1,850,000 | 2,008,823 | |||||
5,107,227 | |||||||||
Sweden - 1.2% | |||||||||
Sweden, Bonds, Ser. 1061 | SEK | 0.75 | 11/12/2029 | 38,125,000 | b | 4,638,783 | |||
Thailand - 2.3% | |||||||||
PTT Treasury Center, Gtd. Notes | 3.70 | 7/16/2070 | 525,000 | b | 514,919 | ||||
Thailand, Bonds | THB | 2.88 | 12/17/2028 | 243,270,000 | 8,778,669 | ||||
9,293,588 | |||||||||
Ukraine - .5% | |||||||||
Ukraine, Sr. Unscd. Notes | 1.17 | 5/31/2040 | 725,000 | 630,337 | |||||
Ukraine, Sr. Unscd. Notes | 7.25 | 3/15/2033 | 1,600,000 | b | 1,510,010 | ||||
2,140,347 | |||||||||
13
STATEMENT OF INVESTMENTS (continued)
Description | Coupon | Maturity | Principal | a | Value ($) | ||||
Bonds and Notes - 95.9% (continued) | |||||||||
United Arab Emirates - .4% | |||||||||
Abu Dhabi Crude Oil Pipeline, Sr. Scd. Bonds | 4.60 | 11/2/2047 | 1,225,000 | b | 1,464,573 | ||||
United Kingdom - 9.9% | |||||||||
Anglo American Capital, Gtd. Notes | EUR | 1.63 | 3/11/2026 | 2,430,000 | 2,976,251 | ||||
Anglo American Capital, Gtd. Notes | EUR | 1.63 | 9/18/2025 | 325,000 | 399,988 | ||||
Barclays, Jr. Sub. Bonds | 7.88 | 3/15/2022 | 850,000 | d | 879,155 | ||||
BAT International Finance, Gtd. Notes | EUR | 2.25 | 1/16/2030 | 2,375,000 | 2,998,544 | ||||
BP Capital Markets, Gtd. Notes | 4.38 | 6/22/2025 | 1,000,000 | d | 1,035,000 | ||||
Lanark Master Issuer, Ser. 2020-1A, Cl. 2A, 3 Month SONIA +.57% | GBP | 0.63 | 12/22/2069 | 1,025,000 | b,c | 1,335,956 | |||
Lloyds Banking Group, Jr. Sub. Bonds | 7.50 | 6/27/2024 | 454,000 | d | 479,978 | ||||
Penarth Master Issuer, Ser. 2019-1A, Cl. A2, 1 Month SONIA +.70% | GBP | 0.75 | 7/18/2024 | 1,180,000 | b,c | 1,533,374 | |||
Rolls-Royce, Gtd. Notes | EUR | 2.13 | 6/18/2021 | 625,000 | 729,726 | ||||
Silverstone Master Issuer, Ser. 2020-1A, Cl. 1A, 3 Month SONIA +.47% | GBP | 0.53 | 1/21/2070 | 1,150,000 | b,c | 1,497,578 | |||
United Kingdom, Bonds | GBP | 1.50 | 7/22/2047 | 1,165,000 | 1,755,342 | ||||
United Kingdom, Bonds | GBP | 3.50 | 1/22/2045 | 11,175,000 | 23,044,393 | ||||
Vodafone Group, Jr. Sub. Bonds | EUR | 3.10 | 1/3/2079 | 771,000 | 911,414 | ||||
39,576,699 | |||||||||
United States - 21.5% | |||||||||
AbbVie, Sr. Unscd. Bonds | EUR | 1.38 | 5/17/2024 | 2,180,000 | 2,653,194 | ||||
Air Lease, Sr. Unscd. Notes | 2.88 | 1/15/2026 | 1,550,000 | 1,537,203 | |||||
Air Products & Chemicals, Sr. Unscd. Notes | EUR | 0.50 | 5/5/2028 | 1,025,000 | 1,226,927 | ||||
Air Products & Chemicals, Sr. Unscd. Notes | EUR | 0.80 | 5/5/2032 | 275,000 | 335,038 | ||||
Ally Financial, Sub. Notes | 5.75 | 11/20/2025 | 1,075,000 | 1,222,973 | |||||
AT&T, Sr. Unscd. Notes | EUR | 0.25 | 3/4/2026 | 1,000,000 | 1,169,876 | ||||
AT&T, Sr. Unscd. Notes | EUR | 1.80 | 9/14/2039 | 800,000 | 955,057 | ||||
AT&T, Sr. Unscd. Notes | EUR | 2.05 | 5/19/2032 | 600,000 | 776,992 | ||||
BBCMS Mortgage Trust, Ser. 2019-BWAY, Cl. A, 1 Month LIBOR +.96% | 1.10 | 11/15/2034 | 1,250,000 | b,c | 1,219,815 | ||||
Berkshire Hathaway, Sr. Unscd. Notes | EUR | 0.46 | 3/12/2025 | 2,250,000 | 2,629,123 | ||||
Cameron LNG, Sr. Scd. Notes | 2.90 | 7/15/2031 | 600,000 | b | 649,806 | ||||
CarMax Auto Owner Trust, Ser. 2018-1, Cl. D | 3.37 | 7/15/2024 | 365,000 | 376,715 | |||||
Carrier Global, Sr. Unscd. Notes | 2.49 | 2/15/2027 | 1,050,000 | b | 1,103,680 | ||||
Carrier Global, Sr. Unscd. Notes | 2.72 | 2/15/2030 | 350,000 | b | 366,432 | ||||
CCO Holdings, Sr. Unscd. Notes | 4.50 | 8/15/2030 | 865,000 | b | 899,604 | ||||
Centene, Sr. Unscd. Notes | 3.00 | 10/15/2030 | 1,050,000 | 1,091,688 | |||||
14
Description | Coupon | Maturity | Principal | a | Value ($) | ||||
Bonds and Notes - 95.9% (continued) | |||||||||
United States - 21.5% (continued) | |||||||||
Centene, Sr. Unscd. Notes | 3.38 | 2/15/2030 | 650,000 | 676,153 | |||||
CenturyLink, Sr. Scd. Notes | 4.00 | 2/15/2027 | 160,000 | b | 163,800 | ||||
CGDB Commercial Mortgage Trust, Ser. 2019-MOB, Cl. A, 1 Month LIBOR +.95% | 1.10 | 11/15/2036 | 1,075,000 | b,c | 1,069,610 | ||||
CHC Commercial Mortgage Trust, Ser. 2019-CHC, Cl. B, 1 Month LIBOR +1.50% | 1.65 | 6/15/2034 | 871,240 | b,c | 826,145 | ||||
Cheniere Corpus Christi Holdings, Sr. Scd. Notes | 3.70 | 11/15/2029 | 1,850,000 | 1,939,113 | |||||
Cheniere Energy, Sr. Scd. Notes | 4.63 | 10/15/2028 | 575,000 | b | 594,406 | ||||
Comcast, Gtd. Notes | EUR | 0.75 | 2/20/2032 | 2,400,000 | 2,857,572 | ||||
Concho Resources, Gtd. Notes | 3.75 | 10/1/2027 | 1,075,000 | 1,196,630 | |||||
Crown Americas, Gtd. Notes | 4.75 | 2/1/2026 | 1,075,000 | 1,119,140 | |||||
CyrusOne, Gtd. Notes | EUR | 1.45 | 1/22/2027 | 2,475,000 | 2,890,773 | ||||
CyrusOne, Gtd. Notes | 2.90 | 11/15/2024 | 225,000 | 239,151 | |||||
CyrusOne, Gtd. Notes | 3.45 | 11/15/2029 | 650,000 | 692,542 | |||||
Danaher, Sr. Unscd. Notes | EUR | 2.50 | 3/30/2030 | 375,000 | 516,129 | ||||
DaVita, Gtd. Notes | 3.75 | 2/15/2031 | 1,200,000 | b | 1,155,750 | ||||
Dell Equipment Finance Trust, Ser. 2018-2, Cl. C | 3.72 | 10/22/2023 | 1,300,000 | b | 1,332,242 | ||||
Diamondback Energy, Gtd. Notes | 2.88 | 12/1/2024 | 1,285,000 | 1,302,078 | |||||
Diamondback Energy, Gtd. Notes | 5.38 | 5/31/2025 | 650,000 | 672,650 | |||||
Digital Euro Finco, Gtd. Bonds | EUR | 2.63 | 4/15/2024 | 1,275,000 | 1,611,812 | ||||
Edison International, Sr. Unscd. Notes | 4.13 | 3/15/2028 | 540,000 | 565,358 | |||||
Elanco Animal Health, Sr. Unscd. Notes | 5.90 | 8/28/2028 | 775,000 | 904,483 | |||||
Energy Transfer Operating, Gtd. Notes | 4.20 | 4/15/2027 | 600,000 | 624,333 | |||||
Energy Transfer Operating, Gtd. Notes | 5.25 | 4/15/2029 | 685,000 | 741,872 | |||||
Energy Transfer Operating, Jr. Sub. Debs., Ser. A | 6.25 | 2/15/2023 | 680,000 | d | 457,263 | ||||
Energy Transfer Operating, Jr. Sub. Debs., Ser. F | 6.75 | 5/15/2025 | 260,000 | d | 208,572 | ||||
EQT, Sr. Unscd. Notes | 3.00 | 10/1/2022 | 1,555,000 | f | 1,555,467 | ||||
Fidelity National Information Services, Sr. Unscd. Notes | EUR | 1.50 | 5/21/2027 | 2,195,000 | 2,750,019 | ||||
General Electric, Jr. Sub. Debs., Ser. D | 5.00 | 1/21/2021 | 1,325,000 | d | 1,087,186 | ||||
Genesis Energy, Gtd. Notes | 7.75 | 2/1/2028 | 799,000 | f | 663,921 | ||||
HCA, Gtd. Notes | 3.50 | 9/1/2030 | 348,000 | 355,855 | |||||
HCA, Gtd. Notes | 5.88 | 2/1/2029 | 435,000 | 512,515 | |||||
Icahn Enterprises, Gtd. Notes | 5.25 | 5/15/2027 | 1,000,000 | 1,037,932 | |||||
15
STATEMENT OF INVESTMENTS (continued)
Description | Coupon | Maturity | Principal | a | Value ($) | ||||
Bonds and Notes - 95.9% (continued) | |||||||||
United States - 21.5% (continued) | |||||||||
Intown Hotel Portfolio Trust, Ser. 2018-STAY, Cl. A, 1 Month LIBOR +.70% | 0.85 | 1/15/2033 | 1,075,000 | b,c | 1,055,303 | ||||
Intown Hotel Portfolio Trust, Ser. 2018-STAY, Cl. B, 1 Month LIBOR +1.05% | 1.20 | 1/15/2033 | 725,000 | b,c | 707,487 | ||||
KeyCorp Student Loan Trust, Ser. 1999-B, Cl. CTFS, 3 Month LIBOR +.90% | 1.15 | 11/25/2036 | 214,451 | c | 214,183 | ||||
Kraft Heinz Foods, Gtd. Notes | 4.63 | 1/30/2029 | 525,000 | 585,528 | |||||
Kraft Heinz Foods, Gtd. Notes | 4.88 | 10/1/2049 | 255,000 | b | 268,940 | ||||
Lamar Media, Gtd. Notes | 3.75 | 2/15/2028 | 1,150,000 | 1,144,250 | |||||
Lennar, Gtd. Notes | 4.75 | 11/29/2027 | 820,000 | 937,875 | |||||
Lennar, Gtd. Notes | 5.25 | 6/1/2026 | 255,000 | 290,384 | |||||
Level 3 Financing, Gtd. Notes | 4.25 | 7/1/2028 | 990,000 | b | 995,940 | ||||
Long Beach Mortgage Loan Trust, Ser. 2004-1, Cl. M2, 1 Month LIBOR +.83% | 0.97 | 2/25/2034 | 348,242 | c | 347,688 | ||||
Marsh & McLennan, Sr. Unscd. Bonds | EUR | 1.98 | 3/21/2030 | 2,190,000 | 2,892,466 | ||||
MGM Growth Properties Operating Partnership, Gtd. Notes | 5.75 | 2/1/2027 | 775,000 | 837,543 | |||||
Molina Healthcare, Sr. Unscd. Notes | 4.38 | 6/15/2028 | 525,000 | b | 538,650 | ||||
Occidental Petroleum, Sr. Unscd. Notes | 8.88 | 7/15/2030 | 950,000 | 931,594 | |||||
Pepsico, Sr. Unscd. Notes | EUR | 0.50 | 5/6/2028 | 1,594,000 | 1,919,980 | ||||
Pioneer Natural Resources, Sr. Unscd. Notes | 1.90 | 8/15/2030 | 425,000 | 398,153 | |||||
Plains All American Pipeline, Sr. Unscd. Notes | 3.55 | 12/15/2029 | 420,000 | 403,043 | |||||
Quicken Loans, Gtd. Notes | 3.63 | 3/1/2029 | 1,950,000 | b | 1,924,406 | ||||
Raytheon Technologies, Sr. Unscd. Bonds | EUR | 2.15 | 5/18/2030 | 1,950,000 | 2,560,456 | ||||
SBA Tower Trust, Scd. Notes | 2.84 | 1/15/2025 | 1,675,000 | b | 1,778,599 | ||||
SCF Equipment Leasing, Ser. 2019-1A, Cl. A2 | 3.23 | 10/20/2024 | 800,000 | b | 803,412 | ||||
SLM, Sr. Unscd. Notes | 4.20 | 10/29/2025 | 260,000 | 263,900 | |||||
Southern California Edison, First Mortgage Bonds | 3.65 | 2/1/2050 | 1,075,000 | 1,121,272 | |||||
Southern Copper, Sr. Unscd. Notes | 5.88 | 4/23/2045 | 465,000 | f | 635,907 | ||||
Spirit Realty, Gtd. Notes | 3.20 | 2/15/2031 | 630,000 | 628,232 | |||||
Spirit Realty, Gtd. Notes | 4.00 | 7/15/2029 | 370,000 | 388,063 | |||||
Steel Dynamics, Sr. Unscd. Notes | 2.40 | 6/15/2025 | 240,000 | 252,090 | |||||
Steel Dynamics, Sr. Unscd. Notes | 3.25 | 1/15/2031 | 295,000 | 319,027 | |||||
Sunoco Logistics Partners Operations, Gtd. Notes | 4.00 | 10/1/2027 | 1,180,000 | 1,206,511 | |||||
16
Description | Coupon | Maturity | Principal | a | Value ($) | ||||
Bonds and Notes - 95.9% (continued) | |||||||||
United States - 21.5% (continued) | |||||||||
Targa Resources Partners, Gtd. Bonds | 5.13 | 2/1/2025 | 595,000 | 598,341 | |||||
Taylor Morrison Communities, Sr. Unscd. Notes | 5.13 | 8/1/2030 | 300,000 | b | 326,267 | ||||
The AES, Sr. Unscd. Notes | 5.13 | 9/1/2027 | 80,000 | 85,992 | |||||
The AES, Sr. Unscd. Notes | 6.00 | 5/15/2026 | 340,000 | 356,896 | |||||
The Procter & Gamble Company, Sr. Unscd. Notes | EUR | 2.00 | 11/5/2021 | 2,100,000 | 2,503,536 | ||||
T-Mobile USA, Gtd. Notes | 4.75 | 2/1/2028 | 1,075,000 | 1,153,095 | |||||
United Rentals North America, Gtd. Notes | 4.00 | 7/15/2030 | 850,000 | 868,148 | |||||
VICI Properties, Gtd. Notes | 3.50 | 2/15/2025 | 171,000 | b | 170,893 | ||||
Western Midstream Operating, Sr. Unscd. Notes | 4.10 | 2/1/2025 | 275,000 | 259,520 | |||||
Western Midstream Operating, Sr. Unscd. Notes | 4.65 | 7/1/2026 | 940,000 | 904,750 | |||||
Western Midstream Operating, Sr. Unscd. Notes | 5.05 | 2/1/2030 | 1,650,000 | 1,567,500 | |||||
85,680,415 | |||||||||
Uruguay - .1% | |||||||||
Uruguay, Sr. Unscd. Bonds | 4.38 | 1/23/2031 | 275,000 | 332,493 | |||||
Total Bonds and Notes | 381,439,947 | ||||||||
Description /Number of Contracts/Counterparty | Exercise | Expiration Date | Notional Amount ($) | ||||||
Options Purchased - .0% | |||||||||
Call Options - .0% | |||||||||
Swaption 6 Month, USD 10 Year Fixed Rate, Receiver Option, Contracts 4,210,000 J.P. Morgan Securities | 0.54 | 2/4/2021 | 4,210,000,000 | 11,307 | |||||
Put Options - .0% | |||||||||
Swaption 6 Month, USD 10 Year Fixed Rate, Payer Option, Contracts 4,210,000 J.P. Morgan Securities | 0.54 | 2/4/2021 | 4,210,000,000 | 164,972 | |||||
Total Options Purchased | 176,279 | ||||||||
Description | Annualized | Maturity Date | Principal Amount ($) | ||||||
Short-Term Investments - 1.2% | |||||||||
U.S. Government Securities | |||||||||
U.S. Treasury Bills | 0.11 | 1/14/2021 | 4,935,000 | g,h | 4,934,225 | ||||
17
STATEMENT OF INVESTMENTS (continued)
Description | 1-Day | Shares | Value ($) | ||||||
Investment Companies - .2% | |||||||||
Registered Investment Companies - .2% | |||||||||
Dreyfus Institutional Preferred Government Plus Money Market Fund | 0.10 | 864,509 | i | 864,509 | |||||
Investment of Cash Collateral for Securities Loaned - .5% | |||||||||
Registered Investment Companies - .5% | |||||||||
Dreyfus Institutional Preferred Government Plus Money Market Fund | 0.10 | 1,910,909 | i | 1,910,909 | |||||
Total Investments (cost $367,531,356) | 97.8% | 389,325,869 | |||||||
Cash and Receivables (Net) | 2.2% | 8,586,985 | |||||||
Net Assets | 100.0% | 397,912,854 | |||||||
LIBOR—London Interbank Offered Rate
SONIA—Sterling Overnight Index Average
AUD—Australian Dollar
CAD—Canadian Dollar
CNY—Chinese Yuan Renminbi
EUR—Euro
GBP—British Pound
JPY—Japanese Yen
MXN—Mexican Peso
MYR—Malaysian Ringgit
SEK—Swedish Krona
SGD—Singapore Dollar
THB—Thai Baht
a Amount stated in U.S. Dollars unless otherwise noted above.
b Security exempt from registration pursuant to Rule 144A under the Securities Act of 1933. These securities may be resold in transactions exempt from registration, normally to qualified institutional buyers. At October 31, 2020, these securities were valued at $106,741,911 or 26.83% of net assets.
c Variable rate security—rate shown is the interest rate in effect at period end.
d Security is a perpetual bond with no specified maturity date, Maturity date shown is next reset date of the bond.
e Principal amount for accrual purposes is periodically adjusted based on changes in the Consumer Price Index.
f Security, or portion thereof, on loan. At October 31, 2020, the value of the fund’s securities on loan was $2,481,882 and the value of the collateral was $2,559,902, consisting of cash collateral of $1,910,909 and U.S. Government & Agency securities valued at $648,993.
g Held by a counterparty for open exchange traded derivative contracts.
h Security is a discount security. Income is recognized through the accretion of discount.
i Investment in affiliated issuer. The investment objective of this investment company is publicly available and can be found within the investment company’s prospectus.
18
Portfolio Summary (Unaudited) † | Value (%) |
Foreign Governmental | 50.9 |
Energy | 5.6 |
Banks | 5.5 |
Telecommunication Services | 3.6 |
Real Estate | 3.4 |
Health Care | 3.4 |
Diversified Financials | 3.2 |
Utilities | 3.2 |
Insurance | 2.0 |
Commercial Mortgage Pass-Through Ctfs. | 1.9 |
Supranational Bank | 1.3 |
Metals & Mining | 1.2 |
U.S. Treasury Securities | 1.2 |
Collateralized Loan Obligations Debt | 1.2 |
Asset-Backed Ctfs./Auto Receivables | 1.1 |
Media | .9 |
Aerospace & Defense | .8 |
Agriculture | .8 |
Investment Companies | .7 |
Information Technology | .7 |
Consumer Discretionary | .7 |
Consumer Staples | .6 |
Asset-Backed Certificates | .6 |
Beverage Products | .5 |
Chemicals | .4 |
Asset-Backed Ctfs./Credit Cards | .4 |
Building Materials | .4 |
Advertising | .3 |
Materials | .3 |
Industrial | .3 |
Commercial & Professional Services | .2 |
Food Products | .2 |
Retailing | .2 |
Asset-Backed Ctfs./Student Loans | .1 |
Options Purchased | .0 |
97.8 |
† Based on net assets.
See notes to financial statements.
19
STATEMENT OF INVESTMENTS IN AFFILIATED ISSUERS
Investment Companies | Value | Purchases ($)† | Sales ($) | Value | Net | Dividends/ |
Registered Investment Companies: | ||||||
Dreyfus Institutional Preferred Government Plus Money Market Fund | 10,131,495 | 344,800,795 | (354,067,781) | 864,509 | .2 | 55,387 |
Investment of Cash Collateral for Securities Loaned: | ||||||
Dreyfus Institutional Preferred Government Plus Money Market Fund | 3,006,155 | 30,132,608 | (31,227,854) | 1,910,909 | .5 | - |
Total | 13,137,650 | 374,933,403 | (385,295,635) | 2,775,418 | .7 | 55,387 |
† Includes reinvested dividends/distributions.
See notes to financial statements.
20
STATEMENT OF FUTURES
October 31, 2020
Description | Number of | Expiration | Notional | Market | Unrealized Appreciation (Depreciation) ($) | |
Futures Long | ||||||
Australian 3 Year Bond | 125 | 12/15/2020 | 10,278,207a | 10,319,852 | 41,645 | |
Canadian 10 Year Bond | 45 | 12/18/2020 | 5,131,027a | 5,101,554 | (29,473) | |
Euro BTP Italian Government Bond | 63 | 12/8/2020 | 10,639,682a | 10,975,860 | 336,178 | |
Euro-Bobl | 6 | 12/8/2020 | 944,350a | 949,446 | 5,096 | |
Euro-Bond | 49 | 12/8/2020 | 10,036,502a | 10,052,502 | 16,000 | |
Japanese 10 Year Bond | 45 | 12/14/2020 | 65,282,609a | 65,281,054 | (1,555) | |
Ultra 10 Year U.S. Treasury Notes | 17 | 12/21/2020 | 2,688,785 | 2,673,781 | (15,004) | |
Futures Short | ||||||
Australian 10 Year Bond | 23 | 12/15/2020 | 2,397,197a | 2,417,150 | (19,953) | |
Euro 30 Year Bond | 68 | 12/8/2020 | 17,266,883a | 18,116,923 | (850,040) | |
Long Gilt | 34 | 12/29/2020 | 5,967,005a | 5,976,297 | (9,292) | |
Long Term French Government Future | 5 | 12/8/2020 | 970,089a | 990,593 | (20,504) | |
U.S. Treasury 10 Year Notes | 190 | 12/21/2020 | 26,377,588 | 26,261,563 | 116,025 | |
U.S. Treasury Ultra Long Bond | 158 | 12/21/2020 | 34,920,369 | 33,970,000 | 950,369 | |
Gross Unrealized Appreciation | 1,465,313 | |||||
Gross Unrealized Depreciation | (945,821) | |||||
a Notional amounts in foreign currency have been converted to USD using relevant foreign exchange rates.
See notes to financial statements.
21
STATEMENT OF FORWARD FOREIGN CURRENCY EXCHANGE CONTRACTS October 31, 2020
Counterparty/ Purchased | Purchased Currency | Currency | Sold | Settlement Date | Unrealized Appreciation (Depreciation) ($) |
Barclays Capital | |||||
Euro | 21,717,741 | United States Dollar | 25,595,990 | 11/30/2020 | (285,700) |
Mexican Peso | 223,000,000 | United States Dollar | 10,468,943 | 12/17/2020 | (11,668) |
United States Dollar | 839,316 | Euro | 720,622 | 11/2/2020 | (12) |
United States Dollar | 4,854,451 | Euro | 4,167,841 | 11/3/2020 | (54) |
United States Dollar | 6,866,844 | Swedish Krona | 60,105,000 | 11/30/2020 | 110,102 |
Citigroup | |||||
Japanese Yen | 6,491,660,133 | United States Dollar | 61,875,837 | 11/30/2020 | 150,937 |
Canadian Dollar | 34,590,000 | United States Dollar | 26,193,136 | 11/30/2020 | (227,981) |
United States Dollar | 3,323,486 | Canadian Dollar | 4,440,000 | 11/30/2020 | (9,422) |
Chinese Yuan Renminbi | 141,400,000 | United States Dollar | 20,564,880 | 12/17/2020 | 454,251 |
Czech Koruna | 26,540,000 | United States Dollar | 1,178,643 | 12/17/2020 | (43,270) |
HSBC | |||||
United States Dollar | 1,641,006 | British Pound | 1,266,746 | 11/2/2020 | (96) |
British Pound | 1,266,746 | United States Dollar | 1,641,291 | 11/30/2020 | 82 |
United States Dollar | 13,393,715 | Australian Dollar | 18,816,737 | 11/30/2020 | 165,361 |
Chinese Yuan Renminbi | 18,355,000 | United States Dollar | 2,680,423 | 12/17/2020 | 51,073 |
United States Dollar | 1,245,094 | South Korean Won | 1,465,475,000 | 12/17/2020 | (46,430) |
Indian Rupee | 317,600,000 | United States Dollar | 4,284,944 | 12/17/2020 | (17,766) |
United States Dollar | 3,803,084 | Singapore Dollar | 5,175,000 | 12/17/2020 | 14,456 |
J.P. Morgan Securities | |||||
United States Dollar | 3,340,414 | Chinese Yuan Renminbi | 22,800,000 | 12/17/2020 | (52,564) |
Russian Ruble | 1,349,350,000 | United States Dollar | 17,755,306 | 12/17/2020 | (859,070) |
Indonesian Rupiah | 39,116,620,000 | United States Dollar | 2,570,080 | 12/17/2020 | 92,557 |
United States Dollar | 7,968,333 | Polish Zloty | 31,000,000 | 12/17/2020 | 136,352 |
22
Counterparty/ Purchased | Purchased Currency | Currency | Sold | Settlement Date | Unrealized Appreciation (Depreciation) ($) |
J.P. Morgan Securities(continued) | |||||
Polish Zloty | 35,750,000 | United States Dollar | 9,526,500 | 12/17/2020 | (494,458) |
British Pound | 1,640,000 | United States Dollar | 2,125,153 | 11/30/2020 | (139) |
Danish Krone | 15,330,000 | United States Dollar | 2,441,703 | 11/30/2020 | (41,804) |
United States Dollar | 8,640,381 | Euro | 7,350,000 | 11/30/2020 | 74,544 |
United States Dollar | 6,158,948 | Thai Baht | 193,160,000 | 12/17/2020 | (37,107) |
United States Dollar | 404,875 | Norwegian Krone | 3,745,000 | 11/30/2020 | 12,652 |
Merrill Lynch, Pierce, Fenner & Smith | |||||
United States Dollar | 1,647,604 | Mexican Peso | 36,090,000 | 12/17/2020 | (44,786) |
Morgan Stanley | |||||
Malaysian Ringgit | 1,775,000 | United States Dollar | 425,870 | 12/17/2020 | 777 |
Polish Zloty | 32,350,000 | United States Dollar | 8,622,298 | 12/17/2020 | (449,247) |
United States Dollar | 9,925,464 | British Pound | 7,636,000 | 11/30/2020 | 31,193 |
United States Dollar | 5,189,606 | New Zealand Dollar | 7,770,000 | 11/30/2020 | 51,927 |
United States Dollar | 8,158,012 | Canadian Dollar | 10,862,639 | 11/30/2020 | 3,918 |
UBS Securities | |||||
Swiss Franc | 11,860,000 | United States Dollar | 13,107,580 | 11/30/2020 | (162,525) |
Hungarian Forint | 363,940,000 | United States Dollar | 1,203,386 | 12/17/2020 | (48,563) |
South Korean Won | 11,174,405,000 | United States Dollar | 9,419,305 | 12/17/2020 | 428,704 |
Chinese Yuan Renminbi | 16,500,000 | United States Dollar | 2,403,146 | 12/17/2020 | 49,581 |
Gross Unrealized Appreciation | 1,828,467 | ||||
Gross Unrealized Depreciation | (2,832,662) | ||||
See notes to financial statements.
23
STATEMENT OF ASSETS AND LIABILITIES
October 31, 2020
|
|
|
|
|
|
|
|
|
| Cost |
| Value |
|
Assets ($): |
|
|
|
| ||
Investments in securities—See Statement of Investments |
|
|
| |||
Unaffiliated issuers | 364,755,938 |
| 386,550,451 |
| ||
Affiliated issuers |
| 2,775,418 |
| 2,775,418 |
| |
Cash denominated in foreign currency |
|
| 2,074,489 |
| 2,024,819 |
|
Receivable for investment securities sold |
| 8,115,788 |
| |||
Dividends, interest and securities lending income receivable |
| 3,036,556 |
| |||
Unrealized appreciation on forward foreign |
| 1,828,467 |
| |||
Receivable for shares of Beneficial Interest subscribed |
| 1,096,483 |
| |||
Cash collateral held by broker—Note 4 |
| 399,903 |
| |||
Receivable for futures variation margin—Note 4 |
| 95,320 |
| |||
Prepaid expenses |
|
|
|
| 39,649 |
|
|
|
|
|
| 405,962,854 |
|
Liabilities ($): |
|
|
|
| ||
Due to BNY Mellon Investment Adviser, Inc. and affiliates—Note 3(c) |
| 199,166 |
| |||
Cash overdraft due to Custodian |
|
|
|
| 784,657 |
|
Unrealized depreciation on forward foreign |
| 2,832,662 |
| |||
Payable for shares of Beneficial Interest redeemed |
| 2,145,549 |
| |||
Liability for securities on loan—Note 1(c) |
| 1,910,909 |
| |||
Trustees’ fees and expenses payable |
| 14,172 |
| |||
Other accrued expenses |
|
|
|
| 162,885 |
|
|
|
|
|
| 8,050,000 |
|
Net Assets ($) |
|
| 397,912,854 |
| ||
Composition of Net Assets ($): |
|
|
|
| ||
Paid-in capital |
|
|
|
| 553,154,265 |
|
Total distributable earnings (loss) |
|
|
|
| (155,241,411) |
|
Net Assets ($) |
|
| 397,912,854 |
| ||
Net Asset Value Per Share | Class A | Class C | Class I | Class Y |
|
Net Assets ($) | 43,273,932 | 8,367,554 | 274,030,415 | 72,240,953 |
|
Shares Outstanding | 2,822,100 | 566,981 | 17,574,321 | 4,626,230 |
|
Net Asset Value Per Share ($) | 15.33 | 14.76 | 15.59 | 15.62 |
|
|
|
|
|
|
|
See notes to financial statements. |
|
|
|
|
|
24
STATEMENT OF OPERATIONS
Year Ended October 31, 2020
|
|
|
|
|
|
|
|
|
|
|
|
|
|
Investment Income ($): |
|
|
|
| ||
Income: |
|
|
|
| ||
Interest (net of $7,016 foreign taxes withheld at source) |
|
| 9,147,368 |
| ||
Dividends from affiliated issuers |
|
| 55,288 |
| ||
Income from securities lending—Note 1(c) |
|
| 12,411 |
| ||
Total Income |
|
| 9,215,067 |
| ||
Expenses: |
|
|
|
| ||
Management fee—Note 3(a) |
|
| 2,444,097 |
| ||
Shareholder servicing costs—Note 3(c) |
|
| 908,614 |
| ||
Professional fees |
|
| 105,705 |
| ||
Distribution fees—Note 3(b) |
|
| 89,310 |
| ||
Registration fees |
|
| 86,981 |
| ||
Custodian fees—Note 3(c) |
|
| 80,360 |
| ||
Trustees’ fees and expenses—Note 3(d) |
|
| 49,973 |
| ||
Prospectus and shareholders’ reports |
|
| 36,892 |
| ||
Loan commitment fees—Note 2 |
|
| 15,624 |
| ||
Chief Compliance Officer fees—Note 3(c) |
|
| 14,076 |
| ||
Interest expense—Note 2 |
|
| 122 |
| ||
Miscellaneous |
|
| 36,988 |
| ||
Total Expenses |
|
| 3,868,742 |
| ||
Less—reduction in expenses due to undertaking—Note 3(a) |
|
| (302,348) |
| ||
Net Expenses |
|
| 3,566,394 |
| ||
Investment Income—Net |
|
| 5,648,673 |
| ||
Realized and Unrealized Gain (Loss) on Investments—Note 4 ($): |
|
| ||||
Net realized gain (loss) on investments and foreign currency transactions | 5,563,359 |
| ||||
Net realized gain (loss) on options transactions | (1,164,615) |
| ||||
Net realized gain (loss) on futures | 1,209,559 |
| ||||
Net realized gain (loss) on swap agreements | (15,751,879) |
| ||||
Net realized gain (loss) on forward foreign currency exchange contracts | 2,921,359 |
| ||||
Capital gain distributions from affiliated issuers | 99 |
| ||||
Net Realized Gain (Loss) |
|
| (7,222,118) |
| ||
Net change in unrealized appreciation (depreciation) on investments | (537,443) |
| ||||
Net change in unrealized appreciation (depreciation) on | 24,224 |
| ||||
Net change in unrealized appreciation (depreciation) on futures | 706,696 |
| ||||
Net change in unrealized appreciation (depreciation) on swap agreements | 4,258,589 |
| ||||
Net change in unrealized appreciation (depreciation) on | (2,222,543) |
| ||||
Net Change in Unrealized Appreciation (Depreciation) |
|
| 2,229,523 |
| ||
Net Realized and Unrealized Gain (Loss) on Investments |
|
| (4,992,595) |
| ||
Net Increase in Net Assets Resulting from Operations |
| 656,078 |
| |||
|
|
|
|
|
|
|
See notes to financial statements. | ||||||
25
STATEMENT OF CHANGES IN NET ASSETS
|
|
|
| Year Ended October 31, | |||||
|
|
|
| 2020 |
| 2019 |
| ||
Operations ($): |
|
|
|
|
|
|
|
| |
Investment income—net |
|
| 5,648,673 |
|
|
| 14,554,347 |
| |
Net realized gain (loss) on investments |
| (7,222,118) |
|
|
| (36,881,109) |
| ||
Net change in unrealized appreciation |
| 2,229,523 |
|
|
| 63,306,626 |
| ||
Net Increase (Decrease) in Net Assets | 656,078 |
|
|
| 40,979,864 |
| |||
Distributions ($): |
| ||||||||
Distributions to shareholders: |
|
|
|
|
|
|
|
| |
Class A |
|
| - |
|
|
| (1,468,334) |
| |
Class C |
|
| - |
|
|
| (647,808) |
| |
Class I |
|
| - |
|
|
| (19,092,774) |
| |
Class Y |
|
| - |
|
|
| (2,506,636) |
| |
Total Distributions |
|
| - |
|
|
| (23,715,552) |
| |
Beneficial Interest Transactions ($): |
| ||||||||
Net proceeds from shares sold: |
|
|
|
|
|
|
|
| |
Class A |
|
| 12,631,255 |
|
|
| 18,899,379 |
| |
Class C |
|
| 142,003 |
|
|
| 616,944 |
| |
Class I |
|
| 80,560,368 |
|
|
| 151,634,904 |
| |
Class Y |
|
| 15,785,115 |
|
|
| 18,241,222 |
| |
Distributions reinvested: |
|
|
|
|
|
|
|
| |
Class A |
|
| - |
|
|
| 1,381,813 |
| |
Class C |
|
| - |
|
|
| 516,170 |
| |
Class I |
|
| - |
|
|
| 16,174,910 |
| |
Class Y |
|
| - |
|
|
| 2,318,525 |
| |
Cost of shares redeemed: |
|
|
|
|
|
|
|
| |
Class A |
|
| (25,401,818) |
|
|
| (23,251,411) |
| |
Class C |
|
| (8,459,595) |
|
|
| (15,828,122) |
| |
Class I |
|
| (283,062,741) |
|
|
| (519,915,317) |
| |
Class Y |
|
| (23,087,441) |
|
|
| (34,287,040) |
| |
Increase (Decrease) in Net Assets | (230,892,854) |
|
|
| (383,498,023) |
| |||
Total Increase (Decrease) in Net Assets | (230,236,776) |
|
|
| (366,233,711) |
| |||
Net Assets ($): |
| ||||||||
Beginning of Period |
|
| 628,149,630 |
|
|
| 994,383,341 |
| |
End of Period |
|
| 397,912,854 |
|
|
| 628,149,630 |
| |
26
|
|
|
| Year Ended October 31, | |||||
|
|
|
| 2020 |
| 2019 |
| ||
Capital Share Transactions (Shares): |
| ||||||||
Class Aa,b |
|
|
|
|
|
|
|
| |
Shares sold |
|
| 865,289 |
|
|
| 1,279,053 |
| |
Shares issued for distributions reinvested |
|
| - |
|
|
| 96,372 |
| |
Shares redeemed |
|
| (1,715,679) |
|
|
| (1,573,712) |
| |
Net Increase (Decrease) in Shares Outstanding | (850,390) |
|
|
| (198,287) |
| |||
Class Cb |
|
|
|
|
|
|
|
| |
Shares sold |
|
| 9,762 |
|
|
| 43,390 |
| |
Shares issued for distributions reinvested |
|
| - |
|
|
| 36,981 |
| |
Shares redeemed |
|
| (591,629) |
|
|
| (1,102,515) |
| |
Net Increase (Decrease) in Shares Outstanding | (581,867) |
|
|
| (1,022,144) |
| |||
Class Ia |
|
|
|
|
|
|
|
| |
Shares sold |
|
| 5,355,402 |
|
|
| 10,237,031 |
| |
Shares issued for distributions reinvested |
|
| - |
|
|
| 1,114,315 |
| |
Shares redeemed |
|
| (19,152,740) |
|
|
| (34,999,471) |
| |
Net Increase (Decrease) in Shares Outstanding | (13,797,338) |
|
|
| (23,648,125) |
| |||
Class Y |
|
|
|
|
|
|
|
| |
Shares sold |
|
| 1,072,542 |
|
|
| 1,222,649 |
| |
Shares issued for distributions reinvested |
|
| - |
|
|
| 159,842 |
| |
Shares redeemed |
|
| (1,558,387) |
|
|
| (2,310,948) |
| |
Net Increase (Decrease) in Shares Outstanding | (485,845) |
|
|
| (928,457) |
| |||
|
|
|
|
|
|
|
|
|
|
a During the period ended October 31, 2020 52 Class A shares representing $781 were exchanged for 52 Class I shares. | |||||||||
b During the period ended October 31, 2020, 1,340 Class C shares representing $19,358 were automatically converted to 1,297 Class A shares and during the period ended October 31, 2019, 1,135 Class C shares representing $16,121 were automatically converted for 1,104 Class A shares. | |||||||||
See notes to financial statements. | |||||||||
27
FINANCIAL HIGHLIGHTS
The following tables describe the performance for each share class for the fiscal periods indicated. All information (except portfolio turnover rate) reflects financial results for a single fund share. Total return shows how much your investment in the fund would have increased (or decreased) during each period, assuming you had reinvested all dividends and distributions. These figures have been derived from the fund’s financial statements.
Year Ended October 31, | ||||||
Class A Shares | 2020 | 2019 | 2018 | 2017 | 2016 | |
Per Share Data ($): | ||||||
Net asset value, beginning of period | 15.04 | 14.68 | 16.09 | 15.35 | 15.38 | |
Investment Operations: | ||||||
Investment income—neta | .12 | .23 | .41 | .25 | .19 | |
Net realized and unrealized | .17b | .51 | (1.17) | .54 | .30 | |
Total from Investment Operations | .29 | .74 | (.76) | .79 | .49 | |
Distributions: | ||||||
Dividends from | - | (.38) | (.65) | (.05) | (.52) | |
Net asset value, end of period | 15.33 | 15.04 | 14.68 | 16.09 | 15.35 | |
Total Return (%)c | 1.93 | 5.10 | (4.90) | 5.16 | 3.38 | |
Ratios/Supplemental Data (%): | ||||||
Ratio of total expenses | 1.66 | 1.41 | 1.29 | 1.35 | 1.23 | |
Ratio of net expenses | 1.02 | 1.02 | 1.02 | 1.35 | 1.23 | |
Ratio of net investment income | .83 | 1.53 | 2.59 | 1.64 | 1.27 | |
Portfolio Turnover Rate | 103.49 | 107.73 | 95.31 | 118.36 | 126.57 | |
Net Assets, end of period ($ x 1,000) | 43,274 | 55,243 | 56,842 | 73,657 | 135,947 | |
a Based on average shares outstanding.
b In addition to net realized and unrealized losses on investments, this amount includes an increase in net asset value per share resulting from the timing of issuances and redemptions of shares in relation to fluctuating market values for the fund’s investments.
c Exclusive of sales charge.
See notes to financial statements.
28
Year Ended October 31, | ||||||
Class C Shares | 2020 | 2019 | 2018 | 2017 | 2016 | |
Per Share Data ($): | ||||||
Net asset value, beginning of period | 14.58 | 14.28 | 15.67 | 14.97 | 15.05 | |
Investment Operations: | ||||||
Investment income—neta | .03 | .13 | .31 | .18 | .11 | |
Net realized and unrealized | .15b | .50 | (1.14) | .53 | .29 | |
Total from Investment Operations | .18 | .63 | (.83) | .71 | .40 | |
Distributions: | ||||||
Dividends from | - | (.33) | (.56) | (.01) | (.48) | |
Net asset value, end of period | 14.76 | 14.58 | 14.28 | 15.67 | 14.97 | |
Total Return (%)c | 1.23 | 4.51 | (5.56) | 4.74 | 2.78 | |
Ratios/Supplemental Data (%): | ||||||
Ratio of total expenses | 1.71 | 1.68 | 1.65 | 1.79 | 1.78 | |
Ratio of net expenses | 1.71 | 1.68 | 1.65 | 1.79 | 1.78 | |
Ratio of net investment income | .21 | .94 | 1.99 | 1.20 | .71 | |
Portfolio Turnover Rate | 103.49 | 107.73 | 95.31 | 118.36 | 126.57 | |
Net Assets, end of period ($ x 1,000) | 8,368 | 16,745 | 31,007 | 38,224 | 52,516 | |
a Based on average shares outstanding.
b In addition to net realized and unrealized losses on investments, this amount includes an increase in net asset value per share resulting from the timing of issuances and redemptions of shares in relation to fluctuating market values for the fund’s investments.
c Exclusive of sales charge.
See notes to financial statements.
29
FINANCIAL HIGHLIGHTS (continued)
Year Ended October 31, | |||||||
Class I Shares | 2020 | 2019 | 2018 | 2017 | 2016 | ||
Per Share Data ($): | |||||||
Net asset value, beginning of period | 15.24 | 14.85 | 16.28 | 15.48 | 15.48 | ||
Investment Operations: | |||||||
Investment income—neta | .18 | .29 | .49 | .35 | .27 | ||
Net realized and unrealized | .17b | .50 | (1.18) | .54 | .29 | ||
Total from Investment Operations | .35 | .79 | (.69) | .89 | .56 | ||
Distributions: | |||||||
Dividends from | - | (.40) | (.74) | (.09) | (.56) | ||
Net asset value, end of period | 15.59 | 15.24 | 14.85 | 16.28 | 15.48 | ||
Total Return (%) | 2.30 | 5.49 | (4.53) | 5.73 | 3.90 | ||
Ratios/Supplemental Data (%): | |||||||
Ratio of total expenses | .69 | .66 | .63 | .75 | .75 | ||
Ratio of net expenses | .69 | .66 | .63 | .75 | .75 | ||
Ratio of net investment income | 1.21 | 1.94 | 3.09 | 2.23 | 1.74 | ||
Portfolio Turnover Rate | 103.49 | 107.73 | 95.31 | 118.36 | 126.57 | ||
Net Assets, end of period ($ x 1,000) | 274,030 | 478,195 | 816,809 | 657,117 | 699,253 | ||
a Based on average shares outstanding.
b In addition to net realized and unrealized losses on investments, this amount includes an increase in net asset value per share resulting from the timing of issuances and redemptions of shares in relation to fluctuating market values for the fund’s investments.
See notes to financial statements.
30
Year Ended October 31, | ||||||||
Class Y Shares | 2020 | 2019 | 2018 | 2017 | 2016 | |||
Per Share Data ($): | ||||||||
Net asset value, beginning of period | 15.25 | 14.85 | 16.29 | 15.49 | 15.48 | |||
Investment Operations: | ||||||||
Investment income—neta | .19 | .30 | .50 | .37 | .28 | |||
Net realized and unrealized | .18b | .52 | (1.19) | .53 | .30 | |||
Total from Investment Operations | .37 | .82 | (.69) | .90 | .58 | |||
Distributions: | ||||||||
Dividends from | - | (.42) | (.75) | (.10) | (.57) | |||
Net asset value, end of period | 15.62 | 15.25 | 14.85 | 16.29 | 15.49 | |||
Total Return (%) | 2.36 | 5.65 | (4.52) | 5.85 | 3.94 | |||
Ratios/Supplemental Data (%): | ||||||||
Ratio of total expenses | .59 | .57 | .56 | .68 | .67 | |||
Ratio of net expenses | .59 | .57 | .56 | .68 | .67 | |||
Ratio of net investment income | 1.25 | 1.99 | 3.14 | 2.30 | 1.82 | |||
Portfolio Turnover Rate | 103.49 | 107.73 | 95.31 | 118.36 | 126.57 | |||
Net Assets, end of period ($ x 1,000) | 72,241 | 77,966 | 89,726 | 72,325 | 30,875 | |||
a Based on average shares outstanding.
b In addition to net realized and unrealized losses on investments, this amount includes an increase in net asset value per share resulting from the timing of issuances and redemptions of shares in relation to fluctuating market values for the fund’s investments.
See notes to financial statements.
31
NOTES TO FINANCIAL STATEMENTS
NOTE 1—Significant Accounting Policies:
BNY Mellon International Bond Fund (the “fund”) is a separate non-diversified series of BNY Mellon Investment Funds III (the “Trust”), which is registered under the Investment Company Act of 1940, as amended (the “Act”), as an open-end management investment company and operates as a series company currently offering four series, including the fund. The fund’s investment objective is to seek to maximize total return through capital appreciation and income. BNY Mellon Investment Adviser, Inc. (the “Adviser”), a wholly-owned subsidiary of The Bank of New York Mellon Corporation (“BNY Mellon”), serves as the fund’s investment adviser.
The Trust’s Board of Trustees (the “Board”) approved, effective December 31, 2019 (the “Effective Date”), the termination of the fund’s authorized Class T shares. Prior to the Effective Date, the fund did not offer such Class T shares for purchase.
BNY Mellon Securities Corporation (the “Distributor”), a wholly-owned subsidiary of the Adviser, is the distributor of the fund’s shares. The fund is authorized to issue an unlimited number of $.001 par value shares of Beneficial Interest in each of the following classes of shares: Class A, Class C, Class I and Class Y. Class A and Class C shares are sold primarily to retail investors through financial intermediaries and bear Distribution and/or Shareholder Services Plan fees. Class A shares generally are subject to a sales charge imposed at the time of purchase. Class A shares bought without an initial sales charge as part of an investment of $1 million or more may be charged a contingent deferred sales charge (“CDSC”) of 1.00% if redeemed within one year. Class C shares are subject to a CDSC imposed on Class C shares redeemed within one year of purchase. Class C shares automatically convert to Class A shares ten years after the date of purchase, without the imposition of a sales charge. Class I shares are sold primarily to bank trust departments and other financial service providers (including The Bank of New York Mellon, a subsidiary of BNY Mellon and an affiliate of the Adviser, and its affiliates), acting on behalf of customers having a qualified trust or an investment account or relationship at such institution, and bear no Distribution or Shareholder Services Plan fees. Class Y shares are sold at net asset value per share generally to institutional investors, and bear no Distribution or Shareholder Services Plan fees. Class I and Class Y shares are offered without a front-end sales charge or CDSC. Other differences between the classes include the services offered to and the expenses borne by each class, the allocation of
32
certain transfer agency costs, and certain voting rights. Income, expenses (other than expenses attributable to a specific class), and realized and unrealized gains or losses on investments are allocated to each class of shares based on its relative net assets.
The Trust accounts separately for the assets, liabilities and operations of each series. Expenses directly attributable to each series are charged to that series’ operations; expenses which are applicable to all series are allocated among them on a pro rata basis.
The Financial Accounting Standards Board (“FASB”) Accounting Standards Codification (“ASC”) is the exclusive reference of authoritative U.S. generally accepted accounting principles (“GAAP”) recognized by the FASB to be applied by nongovernmental entities. Rules and interpretive releases of the Securities and Exchange Commission (“SEC”) under authority of federal laws are also sources of authoritative GAAP for SEC registrants. The fund is an investment company and applies the accounting and reporting guidance of the FASB ASC Topic 946 Financial Services-Investment Companies. The fund’s financial statements are prepared in accordance with GAAP, which may require the use of management estimates and assumptions. Actual results could differ from those estimates.
The Trust enters into contracts that contain a variety of indemnifications. The fund’s maximum exposure under these arrangements is unknown. The fund does not anticipate recognizing any loss related to these arrangements.
(a) Portfolio valuation: The fair value of a financial instrument is the amount that would be received to sell an asset or paid to transfer a liability in an orderly transaction between market participants at the measurement date (i.e., the exit price). GAAP establishes a fair value hierarchy that prioritizes the inputs of valuation techniques used to measure fair value. This hierarchy gives the highest priority to unadjusted quoted prices in active markets for identical assets or liabilities (Level 1 measurements) and the lowest priority to unobservable inputs (Level 3 measurements).
Additionally, GAAP provides guidance on determining whether the volume and activity in a market has decreased significantly and whether such a decrease in activity results in transactions that are not orderly. GAAP requires enhanced disclosures around valuation inputs and techniques used during annual and interim periods.
Various inputs are used in determining the value of the fund’s investments relating to fair value measurements. These inputs are summarized in the three broad levels listed below:
33
NOTES TO FINANCIAL STATEMENTS (continued)
Level 1—unadjusted quoted prices in active markets for identical investments.
Level 2—other significant observable inputs (including quoted prices for similar investments, interest rates, prepayment speeds, credit risk, etc.).
Level 3—significant unobservable inputs (including the fund’s own assumptions in determining the fair value of investments).
The inputs or methodology used for valuing securities are not necessarily an indication of the risk associated with investing in those securities.
Changes in valuation techniques may result in transfers in or out of an assigned level within the disclosure hierarchy. Valuation techniques used to value the fund’s investments are as follows:
Registered investment companies that are not traded on an exchange are valued at their net asset value and are generally categorized within Level 1 of the fair value hierarchy.
Investments in debt securities, excluding short-term investments (other than U.S. Treasury Bills), futures, options and forward foreign currency exchange contracts (“forward contracts”) are valued each business day by one or more independent pricing services (each, a “Service”) approved by the Board. Investments for which quoted bid prices are readily available and are representative of the bid side of the market in the judgment of a Service are valued at the mean between the quoted bid prices (as obtained by the Service from dealers in such securities) and asked prices (as calculated by a Service based upon its evaluation of the market for such securities). Securities are valued as determined by a Service, based on methods which include consideration of the following: yields or prices of securities of comparable quality, coupon, maturity and type; indications as to values from dealers; and general market conditions. These securities are generally categorized within Level 2 of the fair value hierarchy.
U.S. Treasury Bills are valued at the mean price between quoted bid prices and asked prices by the Service. These securities are generally categorized within Level 2 of the fair value hierarchy.
Each Service and independent valuation firm is engaged under the general oversight of the Board.
When market quotations or official closing prices are not readily available, or are determined not to accurately reflect fair value, such as when the value of a security has been significantly affected by events after the close of the exchange or market on which the security is principally traded (for
34
example, a foreign exchange or market), but before the fund calculates its net asset value, the fund may value these investments at fair value as determined in accordance with the procedures approved by the Board. Certain factors may be considered when fair valuing investments such as: fundamental analytical data, the nature and duration of restrictions on disposition, an evaluation of the forces that influence the market in which the securities are purchased and sold, and public trading in similar securities of the issuer or comparable issuers. These securities are either categorized within Level 2 or 3 of the fair value hierarchy depending on the relevant inputs used.
For securities where observable inputs are limited, assumptions about market activity and risk are used and such securities are generally categorized within Level 3 of the fair value hierarchy.
Investments denominated in foreign currencies are translated to U.S. dollars at the prevailing rates of exchange.
Futures and options, which are traded on an exchange, are valued at the last sales price on the securities exchange on which such securities are primarily traded or at the last sales price on the national securities market on each business day and are generally categorized within Level 1 of the fair value hierarchy. Options traded over-the-counter (“OTC”) are valued at the mean between the bid and asked price and are generally categorized within Level 2 of the fair value hierarchy. Forward contracts are valued at the forward rate and are generally categorized within Level 2 of the fair value hierarchy.
The following is a summary of the inputs used as of October 31, 2020 in valuing the fund’s investments:
Level 1 - Unadjusted Quoted Prices | Level 2 - Other Significant Observable | Level 3 - | Total | |
Assets ($) | ||||
Investments in Securities:† | ||||
Asset-Backed | - | 8,393,599 | - | 8,393,599 |
Collateralized Loan | - | 4,623,628 | 4,623,628 | |
Commercial Mortgage-Backed | - | 7,711,894 | - | 7,711,894 |
Corporate Bonds | - | 158,124,123 | - | 158,124,123 |
Foreign Governmental | - | 202,586,703 | - | 202,586,703 |
Investment Companies | 2,775,418 | - | - | 2,775,418 |
U.S. Treasury Securities | - | 4,934,225 | - | 4,934,225 |
35
NOTES TO FINANCIAL STATEMENTS (continued)
Level 1 - Unadjusted Quoted Prices | Level 2 - Other Significant Observable | Level 3 - | Total | ||
Assets ($) | |||||
Investments in Securities:† | |||||
Other Financial Instruments: | |||||
Forward Foreign Currency Exchange Contracts†† | - | 1,828,467 | - | 1,828,467 | |
Futures†† | 1,465,313 | - | - | 1,465,313 | |
Options Purchased | - | 176,279 | - | 176,279 | |
Liabilities ($) | |||||
Other Financial Instruments: | |||||
Forward Foreign Currency Exchange Contracts†† | - | (2,832,662) | - | (2,832,662) | |
Futures†† | (945,821) | - | - | (945,821) | |
† See Statement of Investments for additional detailed categorizations, if any.
†† Amount shown represents unrealized appreciation (depreciation) at period end, but only variation margin on exchanged traded and centrally cleared derivatives, if any, are reported in the Statement of Assets and Liabilities.
(b) Foreign currency transactions: The fund does not isolate that portion of the results of operations resulting from changes in foreign exchange rates on investments from the fluctuations arising from changes in the market prices of securities held. Such fluctuations are included with the net realized and unrealized gain or loss on investments.
Net realized foreign exchange gains or losses arise from sales of foreign currencies, currency gains or losses realized on securities transactions between trade and settlement date, and the difference between the amounts of dividends, interest and foreign withholding taxes recorded on the fund’s books and the U.S. dollar equivalent of the amounts actually received or paid. Net unrealized foreign exchange gains and losses arise from changes in the value of assets and liabilities other than investments resulting from changes in exchange rates. Foreign currency gains and losses on foreign currency transactions are also included with net realized and unrealized gain or loss on investments.
Foreign Taxes: The fund may be subject to foreign taxes (a portion of which may be reclaimable) on income, stock dividends, realized and unrealized capital gains on investments or certain foreign currency transactions. Foreign taxes are recorded in accordance with the fund’s understanding of the applicable foreign tax regulations and rates that exist
36
in the foreign jurisdictions in which the fund invests. These foreign taxes, if any, are paid by the fund and are reflected in the Statement of Operations. Foreign taxes payable or deferred as of October 31, 2020, if any, are disclosed in the fund’s Statement of Assets and Liabilities.
(c) Securities transactions and investment income: Securities transactions are recorded on a trade date basis. Realized gains and losses from securities transactions are recorded on the identified cost basis. Dividend income is recognized on the ex-dividend date and interest income, including, where applicable, accretion of discount and amortization of premium on investments, is recognized on the accrual basis.
Pursuant to a securities lending agreement with The Bank of New York Mellon, the fund may lend securities to qualified institutions. It is the fund’s policy that, at origination, all loans are secured by collateral of at least 102% of the value of U.S. securities loaned and 105% of the value of foreign securities loaned. Collateral equivalent to at least 100% of the market value of securities on loan is maintained at all times. Collateral is either in the form of cash, which can be invested in certain money market mutual funds managed by the Adviser, or U.S. Government and Agency securities. The fund is entitled to receive all dividends, interest and distributions on securities loaned, in addition to income earned as a result of the lending transaction. Should a borrower fail to return the securities in a timely manner, The Bank of New York Mellon is required to replace the securities for the benefit of the fund or credit the fund with the market value of the unreturned securities and is subrogated to the fund’s rights against the borrower and the collateral. Additionally, the contractual maturity of security lending transactions are on an overnight and continuous basis. During the period ended October 31, 2020, The Bank of New York Mellon earned $2,397 from the lending of the fund’s portfolio securities, pursuant to the securities lending agreement.
(d) Affiliated issuers: Investments in other investment companies advised by the Adviser are considered “affiliated” under the Act.
(e) Risk: Investing in foreign markets may involve special risks and considerations not typically associated with investing in the U.S. These risks include revaluation of currencies, high rates of inflation, repatriation restrictions on income and capital, and adverse political, economic developments and public health conditions. Moreover, securities issued in these markets may be less liquid, subject to government ownership controls and delayed settlements, and their prices may be more volatile than those of comparable securities in the U.S. In addition, turbulence in financial markets and reduced liquidity in equity, credit and/or fixed
37
NOTES TO FINANCIAL STATEMENTS (continued)
income markets may negatively affect many issuers, which could adversely affect the fund. Global economies and financial markets are becoming increasingly interconnected, and conditions and events in one country, region or financial market may adversely impact issuers in a different country, region or financial market. These risks may be magnified if certain events or developments adversely interrupt the global supply chain; in these and other circumstances, such risks might affect companies world-wide. Recent examples include pandemic risks related to COVID-19 and aggressive measures taken world-wide in response by governments, including closing borders, restricting international and domestic travel, and the imposition of prolonged quarantines of large populations, and by businesses, including changes to operations and reducing staff. To the extent the fund may overweight its investments in certain countries, companies, industries or market sectors, such positions will increase the fund’s exposure to risk of loss from adverse developments affecting those countries, companies, industries or sectors.
The fund invests primarily in debt securities. Failure of an issuer of the debt securities to make timely interest or principal payments, or a decline or the perception of a decline in the credit quality of a debt security, can cause the debt security’s price to fall, potentially lowering the fund’s share price. In addition, the value of debt securities may decline due to general market conditions that are not specifically related to a particular issuer, such as real or perceived adverse economic conditions, changes in outlook for corporate earnings, changes in interest or currency rates or adverse investor sentiment. Such values may also decline because of factors that affect a particular industry or country.
The fund invests in collateralized loan obligations (“CLOs”). CLOs and other structured credit investments are generally backed by an asset or a pool of assets (typically senior secured loans, certain subordinated loans and other credit-related assets in the case of CLOs) which serve as collateral. The cash flows from CLOs and structured credit investments are split into two or more portions, called tranches, varying in risk and yield. The fund and other investors in CLOs and structured finance securities ultimately bear the credit risk of the underlying collateral. If there are defaults or the relevant collateral otherwise underperforms, scheduled payments to senior tranches of such securities take precedence over those of mezzanine tranches, and scheduled payments to mezzanine tranches take precedence over those to subordinated/equity tranches. The fund may invest in any tranche, including the equity tranche. The riskiest portion is the “equity” tranche, which is subordinate to the other tranches in the event of defaults. Senior tranches typically have higher ratings and lower yields than its underlying securities, and may be rated investment grade.
38
The ratings reflect both the credit quality of underlying collateral as well as how much protection a given tranche is afforded by tranches that are subordinate to it.
CLOs and other structured finance securities may present risks similar to those of the other types of debt obligations and, in fact, such risks may be of greater significance in the case of CLOs and other structured finance securities. In addition to the general risks associated with investing in debt securities, CLO securities carry additional risks, including, but not limited to: (1) the possibility that distributions from collateral assets will not be adequate to make interest or other payments; (2) the quality of the collateral may decline in value or default; (3) the possibility that the class of CLOs held by the fund is subordinate to other senior classes; and (4) the complex structure of the security may not be fully understood at the time of investment and may produce disputes with the issuer or unexpected investment results. Additionally, changes in the collateral held by a CLOs may cause payments on the instruments the fund holds to be reduced, either temporarily or permanently. Structured investments, particularly the subordinated interests in which the fund invests, are less liquid than many other types of securities and may be more volatile than the assets underlying the CLOs the fund may target. In addition, CLOs and other structured credit investments may be subject to prepayment risk.
(f) Dividends and distributions to shareholders: Dividends and distributions are recorded on the ex-dividend date. Dividends from investment income-net are normally declared and paid quarterly. Dividends from net realized capital gains, if any, are normally declared and paid annually, but the fund may make distributions on a more frequent basis to comply with the distribution requirements of the Internal Revenue Code of 1986, as amended (the “Code”). To the extent that net realized capital gains can be offset by capital loss carryovers, it is the policy of the fund not to distribute such gains. Income and capital gain distributions are determined in accordance with income tax regulations, which may differ from GAAP.
(g) Federal income taxes: It is the policy of the fund to continue to qualify as a regulated investment company, if such qualification is in the best interests of its shareholders, by complying with the applicable provisions of the Code, and to make distributions of taxable income and net realized capital gain sufficient to relieve it from substantially all federal income and excise taxes.
As of and during the period ended October 31, 2020, the fund did not have any liabilities for any uncertain tax positions. The fund recognizes interest and penalties, if any, related to uncertain tax positions as income
39
NOTES TO FINANCIAL STATEMENTS (continued)
tax expense in the Statement of Operations. During the period ended October 31, 2020, the fund did not incur any interest or penalties.
Each tax year in the four-year period ended October 31, 2020 remains subject to examination by the Internal Revenue Service and state taxing authorities.
At October 31, 2020, the components of accumulated earnings on a tax basis were as follows: undistributed ordinary income $9,494,082, accumulated capital and other losses $184,381,788 and unrealized appreciation $19,646,295.
The fund is permitted to carry forward capital losses for an unlimited period. Furthermore, capital loss carryovers retain their character as either short-term or long-term capital losses.
The accumulated capital loss carryover is available for federal income tax purposes to be applied against future net realized capital gains, if any, realized subsequent to October 31, 2020. The fund has $112,349,363 of short-term capital losses and $68,224,345 of long-term capital losses which can be carried forward for an unlimited period.
The tax character of distributions paid to shareholders during the fiscal periods ended October 31, 2020 and October 31, 2019 were as follows: ordinary income $0 and $23,715,552, respectively.
(h) New Accounting Pronouncements: In March 2020, the FASB issued Accounting Standards Update 2020-04, Reference Rate Reform (Topic 848)-Facilitation of the Effects of Reference Rate Reform on Financial Reporting (“ASU 2020-04”), which provides optional, temporary relief with respect to the financial reporting of contracts subject to certain types of modifications due to the planned discontinuation of the London Interbank Offered Rate (“LIBOR”) and other IBOR-based reference rates (change to “other interbank offered rates”) as of the end of 2021. The temporary relief provided by ASU 2020-04 is effective for certain reference rate-related contract modifications that occur during the period from March 12, 2020 through December 31, 2022. Management is evaluating the impact of ASU 2020-04 on the fund’s investments, derivatives, debt and other contracts that will undergo reference rate-related modifications as a result of the reference rate reform. Management is also currently actively working with other financial institutions and counterparties to modify contracts as required by applicable regulation and within the regulatory deadlines.
40
NOTE 2—Bank Lines of Credit:
The fund participates with other long-term open-end funds managed by the Adviser in a $823.5 million unsecured credit facility led by Citibank, N.A. (the “Citibank Credit Facility”) and a $300 million unsecured credit facility provided by The Bank of New York Mellon (the “BNYM Credit Facility”), each to be utilized primarily for temporary or emergency purposes, including the financing of redemptions (each, a “Facility”). The Citibank Credit Facility is available in two tranches: (i) Tranche A is in an amount equal to $688.5 million and is available to all long-term open-ended funds, including the fund, and (ii) Tranche B is an amount equal to $135 million and is available only to BNY Mellon Floating Rate Income Fund, a series of BNY Mellon Investment Funds IV, Inc. Prior to September 30, 2020, the Citibank Credit Facility was $927 million with Tranche A available in an amount equal to $747 million and Tranche B available in an amount equal to $180 million. Prior to March 11, 2020, the Citibank Credit Facility was $1.030 billion with Tranche A available in an amount equal to $830 million and Tranche B available in an amount equal to $200 million. In connection therewith, the fund has agreed to pay its pro rata portion of commitment fees for Tranche A of the Citibank Credit Facility and the BNYM Credit Facility. Interest is charged to the fund based on rates determined pursuant to the terms of the respective Facility at the time of borrowing.
The average amount of borrowings outstanding under the Facilities during the period ended October 31, 2020 was approximately $5,464 with a related weighted average annualized interest rate of 2.23%.
NOTE 3—Management Fee and Other Transactions with Affiliates:
(a) Pursuant to a management agreement with the Adviser and the Trust, the Trust has agreed to pay the Adviser a management fee computed at the annual rate of .50% of the value of the fund’s average daily net assets and is payable monthly. The Adviser has contractually agreed, from November 1, 2019 through February 28, 2021, to waive receipt of its fees and/or assume the direct expenses of the Class A shares of the fund, so that the direct expenses of Class A shares (excluding Shareholder Services Plan fees, taxes, interest expense, brokerage commissions, commitment fees on borrowing and extraordinary expenses) do not exceed .77% of the value of the fund’s average daily net assets. On or after February 28, 2021, the Adviser may terminate this expense limitation at any time. The reduction in expenses, pursuant to the undertaking, amounted to $302,348 during the period ended October 31, 2020.
41
NOTES TO FINANCIAL STATEMENTS (continued)
During the period ended October 31, 2020, the Distributor retained $462 from commissions earned on sales of the fund’s Class A shares and $233 from CDSC fees on redemptions of the fund’s Class C shares.
(b) Under the Distribution Plan adopted pursuant to Rule 12b-1 under the Act, Class C shares pay the Distributor for distributing its shares at an annual rate of .75% of the value of its average daily net assets. During the period ended October 31, 2020, Class C shares were charged $89,310 pursuant to the Distribution Plan.
(c) Under the Shareholder Services Plan, Class A and Class C shares pay the Distributor at an annual rate of .25% of the value of their average daily net assets for the provision of certain services. The services provided may include personal services relating to shareholder accounts, such as answering shareholder inquiries regarding the fund and providing reports and other information, and services related to the maintenance of shareholder accounts. The Distributor may make payments to Service Agents (securities dealers, financial institutions or other industry professionals) with respect to these services. The Distributor determines the amounts to be paid to Service Agents. During the period ended October 31, 2020, Class A and Class C shares were charged $119,175 and $29,770, respectively, pursuant to the Shareholder Services Plan.
Under its terms, the Distribution Plan and Shareholder Services Plan shall remain in effect from year to year, provided such continuance is approved annually by a vote of a majority of those Trustees who are not “interested persons” of the Trust and who have no direct or indirect financial interest in the operation of or in any agreement related to the Distribution Plan or Shareholder Services Plan.
The fund has an arrangement with the transfer agent whereby the fund may receive earnings credits when positive cash balances are maintained, which are used to offset transfer agency fees. For financial reporting purposes, the fund includes net earnings credits, if any, as an expense offset in the Statement of Operations.
The fund has an arrangement with the custodian whereby the fund will receive interest income or be charged an overdraft fees when cash balances are maintained. For financial reporting purposes, the fund includes this interest income and overdraft fees, if any, as interest income in the Statement of Operations.
The fund compensates BNY Mellon Transfer, Inc., a wholly-owned subsidiary of the Adviser, under a transfer agency agreement for providing transfer agency and cash management services for the fund. The majority of transfer agency fees are comprised of amounts paid on a per account
42
basis, while cash management fees are related to fund subscriptions and redemptions. During the period ended October 31, 2020, the fund was charged $33,052 for transfer agency services. These fees are included in Shareholder servicing costs in the Statement of Operations.
The fund compensates The Bank of New York Mellon under a custody agreement for providing custodial services for the fund. These fees are determined based on net assets, geographic region and transaction activity. During the period ended October 31, 2020, the fund was charged $80,360 pursuant to the custody agreement.
During the period ended October 31, 2020, the fund was charged $14,076 for services performed by the Chief Compliance Officer and his staff. These fees are included in Chief Compliance Officer fees in the Statement of Operations.
The components of “Due to BNY Mellon Investment Adviser, Inc. and affiliates” in the Statement of Assets and Liabilities consist of: management fees of $175,328, Distribution Plan fees of $5,464, Shareholder Services Plan fees of $11,319, custodian fees of $19,500, Chief Compliance Officer fees of $4,546 and transfer agency fees of $5,900, which are offset against an expense reimbursement currently in effect in the amount of $22,891.
(d) Each Board member also serves as a Board member of other funds in the BNY Mellon Family of Funds complex. Annual retainer fees and attendance fees are allocated to each fund based on net assets.
NOTE 4—Securities Transactions:
The aggregate amount of purchases and sales (including paydowns) of investment securities, excluding short-term securities, futures, options transactions, forward contracts and swap agreements, during the period ended October 31, 2020, amounted to $485,992,434 and $713,111,130, respectively.
Derivatives: A derivative is a financial instrument whose performance is derived from the performance of another asset. The fund enters into International Swaps and Derivatives Association, Inc. Master Agreements or similar agreements (collectively, “Master Agreements”) with its OTC derivative contract counterparties in order to, among other things, reduce its credit risk to counterparties. Master Agreements include provisions for general obligations, representations, collateral and events of default or termination. Under a Master Agreement, the fund may offset with the counterparty certain derivative financial instruments’ payables and/or receivables with collateral held and/or posted and create one single net payment in the event of default or termination.
43
NOTES TO FINANCIAL STATEMENTS (continued)
Each type of derivative instrument that was held by the fund during the period ended October 31, 2020 is discussed below.
Futures: In the normal course of pursuing its investment objective, the fund is exposed to market risk, including interest rate risk, as a result of changes in value of underlying financial instruments. The fund invests in futures in order to manage its exposure to or protect against changes in the market. A futures contract represents a commitment for the future purchase or a sale of an asset at a specified date. Upon entering into such contracts, these investments require initial margin deposits with a counterparty, which consist of cash or cash equivalents. The amount of these deposits is determined by the exchange or Board of Trade on which the contract is traded and is subject to change. Accordingly, variation margin payments are received or made to reflect daily unrealized gains or losses which are recorded in the Statement of Operations. When the contracts are closed, the fund recognizes a realized gain or loss which is reflected in the Statement of Operations. There is minimal counterparty credit risk to the fund with futures since they are exchange traded, and the exchange guarantees the futures against default. Futures open at October 31, 2020 are set forth in the Statement of Futures.
Options Transactions: The fund purchases and writes (sells) put and call options to hedge against changes in the values of foreign currencies and interest rate, or as a substitute for an investment. The fund is subject to market risk , currency risk and interest rate risk in the course of pursuing its investment objectives through its investments in options contracts. A call option gives the purchaser of the option the right (but not the obligation) to buy, and obligates the writer to sell, the underlying financial instrument at the exercise price at any time during the option period, or at a specified date. Conversely, a put option gives the purchaser of the option the right (but not the obligation) to sell, and obligates the writer to buy the underlying financial instrument at the exercise price at any time during the option period, or at a specified date.
As a writer of call options, the fund receives a premium at the outset and then bears the market risk of unfavorable changes in the price of the financial instrument underlying the option. Generally, the fund realizes a gain, to the extent of the premium, if the price of the underlying financial instrument decreases between the date the option is written and the date on which the option is terminated. Generally, the fund incurs a loss if the price of the financial instrument increases between those dates. The maximum payout for those contracts is limited to the number of call option contracts written and the related strike prices, respectively.
44
As a writer of put options, the fund receives a premium at the outset and then bears the market risk of unfavorable changes in the price of the financial instrument underlying the option. Generally, the fund realizes a gain, to the extent of the premium, if the price of the underlying financial instrument increases between the date the option is written and the date on which the option is terminated. Generally, the fund incurs a loss if the price of the financial instrument decreases between those dates. The maximum payout for those contracts is limited to the number of put option contracts written and the related strike prices, respectively.
As a writer of an option, the fund has no control over whether the underlying financial instrument may be sold (call) or purchased (put) and as a result bears the market risk of an unfavorable change in the price of the financial instrument underlying the written option. There is a risk of loss from a change in value of such options which may exceed the related premiums received. This risk is mitigated by Master Agreements between the fund and the counterparty and the posting of collateral, if any, by the counterparty to the fund to cover the fund’s exposure to the counterparty. The Statement of Operations reflects any unrealized gains or losses which occurred during the period as well as any realized gains or losses which occurred upon the expiration or closing of the option transaction. Swaptions purchase and write options on swaps (“swaptions”) primarily to preserve a return or spread on a particular investment or portion of the fund holdings. The purchaser and writer of a swaption is buying or granting the right to enter into a previously agreed upon interest rate or credit default swap agreement (interest rate risk and/or credit risk) at any time before the expiration of the option. At October 31, 2020, there were no options written outstanding.
Forward Foreign Currency Exchange Contracts: The fund enters into forward contracts in order to hedge its exposure to changes in foreign currency exchange rates on its foreign portfolio holdings, to settle foreign currency transactions or as a part of its investment strategy. When executing forward contracts, the fund is obligated to buy or sell a foreign currency at a specified rate on a certain date in the future. With respect to sales of forward contracts, the fund incurs a loss if the value of the contract increases between the date the forward contract is opened and the date the forward contract is closed. The fund realizes a gain if the value of the contract decreases between those dates. With respect to purchases of forward contracts, the fund incurs a loss if the value of the contract decreases between the date the forward contract is opened and the date the forward contract is closed. The fund realizes a gain if the value of the contract increases between those dates. Any realized or unrealized gains or losses which occurred during the period are reflected in the Statement of
45
NOTES TO FINANCIAL STATEMENTS (continued)
Operations. The fund is exposed to foreign currency risk as a result of changes in value of underlying financial instruments. The fund is also exposed to credit risk associated with counterparty nonperformance on these forward contracts, which is generally limited to the unrealized gain on each open contract. This risk may be mitigated by Master Agreements, if any, between the fund and the counterparty and the posting of collateral, if any, by the counterparty to the fund to cover the fund’s exposure to the counterparty. Forward contracts open at October 31, 2020 are set forth in the Statement of Forward Foreign Currency Exchange Contracts.
Swap Agreements: The fund enters into swap agreements to exchange the interest rate on, or return generated by, one nominal instrument for the return generated by another nominal instrument. Swap agreements are privately negotiated in the OTC market or centrally cleared. The fund enters into these agreements to hedge certain market or interest rate risks, to manage the interest rate sensitivity (sometimes called duration) of fixed income securities, to provide a substitute for purchasing or selling particular securities or to increase potential returns.
For OTC swaps, the fund accrues for interim payments on a daily basis, with the net amount recorded within unrealized appreciation (depreciation) on swap agreements in the Statement of Assets and Liabilities. Once the interim payments are settled in cash, the net amount is recorded as a realized gain (loss) on swaps, in addition to realized gain (loss) recorded upon the termination of swap agreements in the Statement of Operations. Upfront payments made and/or received by the fund, are recorded as an asset and/or liability in the Statement of Assets and Liabilities and are recorded as a realized gain or loss ratably over the agreement’s term/event with the exception of forward starting interest rate swaps which are recorded as realized gains or losses on the termination date.
Upon entering into centrally cleared swap agreements, an initial margin deposit is required with a counterparty, which consists of cash or cash equivalents. The amount of these deposits is determined by the exchange on which the agreement is traded and is subject to change. The change in valuation of centrally cleared swaps is recorded as a receivable or payable for variation margin in the Statement of Assets and Liabilities. Payments received from (paid to) the counterparty, including upon termination, are recorded as realized gain (loss) in the Statement of Operations.
Fluctuations in the value of swap agreements are recorded for financial statement purposes as unrealized appreciation or depreciation on swap agreements.
46
Interest Rate Swaps: Interest rate swaps involve the exchange of commitments to pay and receive interest based on a notional principal amount. The fund may elect to pay a fixed rate and receive a floating rate, or receive a fixed rate and pay a floating rate on a notional principal amount. The net interest received or paid on interest rate swap agreements is included within realized gain (loss) on swap agreements in the Statement of Operations. Interest rate swap agreements are subject to general market risk, liquidity risk, counterparty risk and interest rate risk. At October 31, 2020, there were no outstanding interest rate swaps.
Credit Default Swaps: Credit default swaps involve commitments to pay a fixed interest rate in exchange for payment if a credit event affecting a third party (the referenced obligation or index) occurs. Credit events may include a failure to pay interest or principal, bankruptcy, or restructuring. The fund enters into these agreements to manage its exposure to the market or certain sectors of the market, to reduce its risk exposure to defaults of corporate and sovereign issuers, or to create exposure to corporate or sovereign issuers to which it is not otherwise exposed. For those credit default swaps in which the fund is paying a fixed rate, the fund is buying credit protection on the instrument. In the event of a credit event, the fund would receive the full notional amount for the reference obligation. For those credit default swaps in which the fund is receiving a fixed rate, the fund is selling credit protection on the underlying instrument. The maximum payouts for these agreements are limited to the notional amount of each swap. Credit default swaps may involve greater risks than if the fund had invested in the reference obligation directly and are subject to general market risk, liquidity risk, counterparty risk and credit risk. This risk may be mitigated by Master Agreements, if any, between the fund and the counterparty and the posting of collateral, if any, by the counterparty to the fund to cover the fund’s exposure to the counterparty. At October 31, 2020, there were no credit default swap agreements outstanding.
The following tables show the fund’s exposure to different types of market risk as it relates to the Statement of Assets and Liabilities and the Statement of Operations, respectively.
47
NOTES TO FINANCIAL STATEMENTS (continued)
Fair value of derivative instruments as of October 31, 2020 is shown below:
|
| Derivative |
|
|
| Derivative |
|
Interest rate risk | 1,641,592 | 1,2 | Interest rate risk | (945,821) | 1 | ||
Foreign exchange risk | 1,828,467 | 3 | Foreign exchange risk | (2,832,662) | 3 | ||
Gross fair value of | 3,470,059 |
|
|
| (3,778,483) |
| |
|
|
|
|
|
|
| |
Statement of Assets and Liabilities location: |
| ||||||
1 Includes cumulative appreciation (depreciation) on futures as reported in the Statement of Futures, but only the unpaid variation margin is reported in the Statement of Assets and Liabilities. | |||||||
2 Options purchased are included in Investments in securities—Unaffiliated issuers, at value. | |||||||
3 Unrealized appreciation (depreciation) on forward foreign currency exchange contracts. | |||||||
The effect of derivative instruments in the Statement of Operations during the period ended October 31, 2020 is shown below:
Amount of realized gain (loss) on derivatives recognized in income ($) |
| ||||||||||
Underlying | Futures | 1 | Options | 2 | Forward | 3 | Swap | 4 | Total |
| |
Interest rate | 1,209,559 |
| 78,055 |
| - |
| (15,171,456) |
| (13,883,842) |
| |
Foreign | - |
| (1,242,670) |
| 2,921,359 |
| - |
| 1,678,689 |
| |
Credit | - |
| - |
| - |
| (580,423) |
| (580,423) |
| |
Total | 1,209,559 |
| (1,164,615) |
| 2,921,359 |
| (15,751,879) |
| (12,785,576) |
| |
|
|
|
|
|
|
|
|
|
|
| |
Net change in unrealized appreciation (depreciation) |
| ||||||||||
Underlying | Futures | 5 | Options | 6 | Forward | 7 | Swap | 8 | Total |
| |
Interest rate | 706,696 |
| 33,665 |
| - |
| 4,336,150 |
| 5,076,511 |
| |
Foreign | - |
| (9,441) |
| (2,222,543) |
| - |
| (2,231,984) |
| |
Credit | - |
| - |
| - |
| (77,561) |
| (77,561) |
| |
Total | 706,696 |
| 24,224 |
| (2,222,543) |
| 4,258,589 |
| 2,766,966 |
| |
|
|
|
|
|
|
|
|
|
|
|
|
Statement of Operations location: |
| ||||||||||
1 Net realized gain (loss) on futures. | |||||||||||
2 Net realized gain (loss) on options transactions. | |||||||||||
3 Net realized gain (loss) on forward foreign currency exchange contracts. | |||||||||||
4 Net realized gain (loss) on swap agreements. | |||||||||||
5 Net change in unrealized appreciation (depreciation) on futures. | |||||||||||
6 Net change in unrealized appreciation (depreciation) on options transactions. | |||||||||||
7 Net change in unrealized appreciation (depreciation) on forward foreign currency exchange contracts. | |||||||||||
8 Net change in unrealized appreciation (depreciation) on swap agreements. | |||||||||||
The provisions of ASC Topic 210 “Disclosures about Offsetting Assets and Liabilities” require disclosure on the offsetting of financial assets and
48
liabilities. These disclosures are required for certain investments, including derivative financial instruments subject to Master Agreements which are eligible for offsetting in the Statement of Assets and Liabilities and require the fund to disclose both gross and net information with respect to such investments. For financial reporting purposes, the fund does not offset derivative assets and derivative liabilities that are subject to Master Agreements in the Statement of Assets and Liabilities.
At October 31, 2020, derivative assets and liabilities (by type) on a gross basis are as follows:
Derivative Financial Instruments: |
| Assets ($) |
| Liabilities ($) |
|
Futures |
| 1,465,313 |
| (945,821) |
|
Options |
| 176,279 |
| - |
|
Forward contracts |
| 1,828,467 |
| (2,832,662) |
|
Total gross amount of derivative |
|
|
|
|
|
assets and liabilities in the |
|
|
|
|
|
Statement of Assets and Liabilities |
| 3,470,059 |
| (3,778,483) |
|
Derivatives not subject to |
|
|
|
|
|
Master Agreements |
| (1,465,313) |
| 945,821 |
|
Total gross amount of assets |
|
|
|
|
|
and liabilities subject to |
|
|
|
|
|
Master Agreements |
| 2,004,746 |
| (2,832,662) |
|
The following tables present derivative assets and liabilities net of amounts available for offsetting under Master Agreements and net of related collateral received or pledged, if any, as of October 31, 2020:†
|
|
| Financial |
|
|
|
|
|
| Instruments |
|
|
|
|
|
| and Derivatives |
|
|
|
| Gross Amount of |
| Available | Collateral |
| Net Amount of |
Counterparty | Assets ($) | 1 | for Offset ($) | Received ($) | 2 | Assets ($) |
Barclays Capital | 110,102 |
| (110,102) | - |
| - |
Citigroup | 605,188 |
| (280,673) | (324,515) |
| - |
HSBC | 230,972 |
| (64,292) | (54,000) |
| 112,680 |
J.P. Morgan Securities | 492,384 |
| (492,384) | - |
| - |
Morgan Stanley | 87,815 |
| (87,815) | - |
| - |
UBS Securities | 478,285 |
| (211,088) | (267,197) |
| - |
Total | 2,004,746 |
| (1,246,354) | (645,712) |
| 112,680 |
|
|
|
|
|
|
|
49
NOTES TO FINANCIAL STATEMENTS (continued)
|
|
| Financial |
|
|
|
|
|
| Instruments |
|
|
|
|
|
| and Derivatives |
|
|
|
| Gross Amount of |
| Available | Collateral |
| Net Amount of |
Counterparty | Liabilities ($) | 1 | for Offset ($) | Pledged ($) | 2 | Liabilities ($) |
Barclays Capital | (297,434) |
| 110,102 | 29,000 |
| (158,332) |
Citigroup | (280,673) |
| 280,673 | - |
| - |
HSBC | (64,292) |
| 64,292 | - |
| - |
J.P. Morgan Securities | (1,485,142) |
| 492,384 | 895,903 |
| (96,855) |
Merrill Lynch, Pierce, | (44,786) |
| - | - |
| (44,786) |
Morgan Stanley | (449,247) |
| 87,815 | 154,000 |
| (207,432) |
UBS Securities | (211,088) |
| 211,088 | - |
| - |
Total | (2,832,662) |
| 1,246,354 | 1,078,903 |
| (507,405) |
|
|
|
|
|
|
|
1 Absent a default event or early termination, OTC derivative assets and liabilities are presented at gross amounts and are not offset in the Statement of Assets and Liabilities. | ||||||
2 In some instances, the actual collateral received and/or pledged may be more than the amount shown due to over collateralization. | ||||||
† See Statement of Investments for detailed information regarding collateral held for open exchange traded derivative contracts. | ||||||
The following summarizes the average market value of derivatives outstanding during the period ended October 31, 2020:
|
| Average Market Value ($) |
Interest rate futures |
| 189,477,660 |
Interest rate options contracts |
| 57,939 |
Foreign currency options contracts |
| 228,600 |
Forward contracts |
| 344,036,352 |
|
|
|
The following summarizes the average notional value of swap agreements outstanding during the period ended October 31, 2020:
|
| Average Notional Value ($) |
Interest rate swap agreements |
| 107,145,422 |
Credit default swap agreements |
| 17,691,330 |
|
|
|
At October 31, 2020, the cost of investments for federal income tax purposes was $368,225,672; accordingly, accumulated net unrealized appreciation on investments inclusive of derivative contracts was $19,653,821, consisting of $27,261,825 gross unrealized appreciation and $7,608,004 gross unrealized depreciation.
50
REPORT OF INDEPENDENT REGISTERED PUBLIC ACCOUNTING FIRM
To the Shareholders of the Fund and Board of Trustees of
BNY Mellon Investment Funds III:
Opinion on the Financial Statements
We have audited the accompanying statement of assets and liabilities of BNY Mellon International Bond Fund (the “Fund”), a series of BNY Mellon Investment Funds III, including the statements of investments, futures and forward foreign currency exchange contracts, as of October 31, 2020, and the statement of investments in affiliated issuers as of and for the year then ended, the related statement of operations for the year then ended, the statements of changes in net assets for each of the years in the two-year period then ended, and the related notes (collectively, the financial statements), and the financial highlights for each of the years in the five-year period then ended. In our opinion, the financial statements and financial highlights present fairly, in all material respects, the financial position of the Fund as of October 31, 2020, the results of its operations for the year then ended, the changes in its net assets for each of the years in the two-year period then ended, and the financial highlights for each of the years in the five-year period then ended, in conformity with U.S. generally accepted accounting principles.
Basis for Opinion
These financial statements and financial highlights are the responsibility of the Fund’s management. Our responsibility is to express an opinion on these financial statements and financial highlights based on our audits. We are a public accounting firm registered with the Public Company Accounting Oversight Board (United States) (PCAOB) and are required to be independent with respect to the Fund in accordance with the U.S. federal securities laws and the applicable rules and regulations of the Securities and Exchange Commission and the PCAOB.
We conducted our audits in accordance with the standards of the PCAOB. Those standards require that we plan and perform the audit to obtain reasonable assurance about whether the financial statements and financial highlights are free of material misstatement, whether due to error or fraud. Our audits included performing procedures to assess the risks of material misstatement of the financial statements and financial highlights, whether due to error or fraud, and performing procedures that respond to those risks. Such procedures included examining, on a test basis, evidence regarding the amounts and disclosures in the financial statements and financial highlights. Such procedures also included confirmation of securities owned as of October 31, 2020, by correspondence with the custodian and brokers or by other appropriate auditing procedures when replies from brokers were not received. Our audits also included evaluating the accounting principles used and significant estimates made by management, as well as evaluating the overall presentation of the financial statements and financial highlights. We believe that our audits provide a reasonable basis for our opinion.

We have served as the auditor of one or more BNY Mellon Investment Adviser, Inc. investment companies since 1994.
New York, New York
December 18, 2020
51
BOARD MEMBERS INFORMATION (Unaudited)
INDEPENDENT BOARD MEMBERS
Joseph S. DiMartino (77)
Chairman of the Board (1999)
Principal Occupation During Past 5 Years:
· Director or Trustee of funds in the BNY Mellon Family of Funds and certain other entities (as described in the fund’s Statement of Additional Information) (1995-Present)
Other Public Company Board Memberships During Past 5 Years:
· CBIZ, Inc., a public company providing professional business services, products and solutions, Director (1997-Present)
No. of Portfolios for which Board Member Serves: 110
———————
Francine J. Bovich (69)
Board Member (2012)
Principal Occupation During Past 5 Years:
· Trustee, The Bradley Trusts, private trust funds (2011-Present)
Other Public Company Board Memberships During Past 5 Years:
· Annaly Capital Management, Inc., a real estate investment trust, Director (2014-Present)
No. of Portfolios for which Board Member Serves: 67
———————
Andrew J. Donohue (70)
Board Member (2019)
Principal Occupation During Past 5 Years:
· Of Counsel, Shearman & Sterling LLP (2017-2019)
· Chief of Staff to the Chair of the SEC (2015-2017)
· Managing Director and Investment Company General Counsel of Goldman Sachs (2012-2015)
Other Public Company Board Memberships During Past 5 Years:
· Oppenheimer Funds (58 funds), Director (2017-2019)
No. of Portfolios for which Board Member Serves: 53
———————
52
Kenneth A. Himmel (74)
Board Member (1988)
Principal Occupation During Past 5 Years:
· Managing Partner, Gulf Related, an international real estate development company (2010-Present)
· President and CEO, Related Urban Development, a real estate development company (1996-Present)
· CEO, American Food Management, a restaurant company (1983-Present)
· President and CEO, Himmel & Company, a real estate development company (1980-Present)
No. of Portfolios for which Board Member Serves: 22
———————
Stephen J. Lockwood (73)
Board Member (1993)
Principal Occupation During Past 5 Years:
· Chairman of the Board, Stephen J. Lockwood and Company LLC, a real estate investment company (2000-Present)
No. of Portfolios for which Board Member Serves: 22
———————
Roslyn M. Watson (71)
Board Member (1992)
Principal Occupation During Past 5 Years:
· Principal, Watson Ventures, Inc., a real estate investment company (1993-Present)
Other Public Company Board Memberships During Past 5 Years:
· American Express Bank, FSB, Director (1993-2018)
No. of Portfolios for which Board Member Serves: 53
———————
53
BOARD MEMBERS INFORMATION (Unaudited) (continued)
INDEPENDENT BOARD MEMBERS (continued)
Benaree Pratt Wiley (74)
Board Member (1998)
Principal Occupation During Past 5 Years:
· Principal, The Wiley Group, a firm specializing in strategy and business development (2005-Present)
Other Public Company Board Memberships During Past 5 Years:
· CBIZ, Inc., a public company providing professional business services, products and solutions, Director (2008-Present)
· Blue Cross-Blue Shield of Massachusetts, Director (2004-Present)
No. of Portfolios for which Board Member Serves: 71
———————
Once elected all Board Members serve for an indefinite term, but achieve Emeritus status upon reaching age 80. The address of the Board Members and Officers is c/o BNY Mellon Investment Adviser, Inc. 240 Greenwich Street, New York, New York 10286. Additional information about the Board Members is available in the fund’s Statement of Additional Information which can be obtained from the Adviser free of charge by calling this toll free number: 1-800-373-9387.
James M. Fitzgibbons, Emeritus Board Member
54
OFFICERS OF THE FUND (Unaudited)
RENEE LAROCHE-MORRIS, President since May 2019.
President and a director of BNY Mellon Investment Adviser, Inc. since January 2018. She is an officer of 61 investment companies (comprised of 110 portfolios) managed by the Adviser. She is 49 years old and has been an employee of BNY Mellon since 2003.
JAMES WINDELS, Treasurer since November 2001.
Director-BNY Mellon Fund Administration, and an officer of 63 investment companies (comprised of 141 portfolios) managed by the Adviser or an affiliate of the Adviser. He is 62 years old and has been an employee of the Adviser since April 1985.
BENNETT A. MACDOUGALL, Chief Legal Officer since October 2015.
Chief Legal Officer of the Adviser and Associate General Counsel and Managing Director of BNY Mellon since June 2015; Director and Associate General Counsel of Deutsche Bank–Asset & Wealth Management Division from June 2005 to June 2015, and as Chief Legal Officer of Deutsche Investment Management Americas Inc. from June 2012 to May 2015. He is an officer of 63 investment companies (comprised of 141 portfolios) managed by the Adviser or an affiliate of the Adviser. He is 49 years old and has been an employee of the Adviser since June 2015.
DAVID DIPETRILLO, Vice President since May 2019.
Head of North America Product, BNY Mellon Investment Management since January 2018, Director of Product Strategy, BNY Mellon Investment Management from January 2016 to December 2017; Head of US Retail Product and Channel Marketing, BNY Mellon Investment Management from January 2014 to December 2015. He is an officer of 62 investment companies (comprised of 118 portfolios) managed by the Adviser or an affiliate of the Adviser. He is 42 years old and has been an employee of BNY Mellon since 2005.
JAMES BITETTO, Vice President since August 2005 and Secretary since February 2018.
Senior Managing Counsel of BNY Mellon since December 2019; Managing Counsel of BNY Mellon from April 2014 to December 2019; Secretary of the Adviser, and an officer of 63 investment companies (comprised of 141 portfolios) managed by the Adviser or an affiliate of the Adviser. He is 54 years old and has been an employee of the Adviser since December 1996.
SONALEE CROSS, Vice President and Assistant Secretary since March 2018.
Counsel of BNY Mellon since October 2016; Associate at Proskauer Rose LLP from April 2016 to September 2016; Attorney at EnTrust Capital from August 2015 to February 2016; Associate at Sidley Austin LLP from September 2013 to August 2015. She is an officer of 63 investment companies (comprised of 141 portfolios) managed by the Adviser or an affiliate of the Adviser. She is 33 years old and has been an employee of the Adviser since October 2016.
DEIRDRE CUNNANE, Vice President and Assistant Secretary since March 2019.
Counsel of BNY Mellon since August 2018; Senior Regulatory Specialist at BNY Mellon Investment Management Services from February 2016 to August 2018; Trustee Associate at BNY Mellon Trust Company (Ireland) Limited from August 2013 to February 2016. She is an officer of 63 investment companies (comprised of 141 portfolios) managed by the Adviser or an affiliate of the Adviser. She is 30 years old and has been an employee of the Adviser since August 2018.
SARAH S. KELLEHER, Vice President and Assistant Secretary since April 2014.
Managing Counsel of BNY Mellon since December 2017, Senior Counsel of BNY Mellon from March 2013 to December 2017. She is an officer of 63 investment companies (comprised of 141 portfolios) managed by the Adviser or an affiliate of the Adviser. She is 45 years old and has been an employee of the Adviser since March 2013.
JEFF PRUSNOFSKY, Vice President and Assistant Secretary since August 2005.
Senior Managing Counsel of BNY Mellon, and an officer of 63 investment companies (comprised of 141 portfolios) managed by the Adviser or an affiliate of the Adviser. He is 55 years old and has been an employee of the Adviser since October 1990.
AMANDA QUINN, Vice President and Assistant Secretary since March 2020.
Counsel of BNY Mellon since June 2019; Regulatory Administration Manager at BNY Mellon Investment Management Services from September 2018 to May 2019; Senior Regulatory Specialist at BNY Mellon Investment Management Services from April 2015 to August 2018. She is an officer of 63 investment companies (comprised of 141 portfolios) managed by the Adviser or an affiliate of the Adviser. She is 35 years old and has been an employee of the Adviser since June 2019.
55
OFFICERS OF THE FUND (Unaudited) (continued)
PETER M. SULLIVAN, Vice President and Assistant Secretary since March 2019.
Managing Counsel of BNY Mellon since March 2009, Senior Counsel of BNY Mellon from April 2004 to March 2009, and an officer of 63 investment companies (comprised of 141 portfolios) managed by the Adviser or an affiliate of the Adviser. He is 52 years old and has been an employee of the Adviser since January 2019.
NATALYA ZELENSKY, Vice President and Assistant Secretary since March 2017.
Managing Counsel of BNY Mellon since December 2019; Counsel of BNY Mellon from May 2016 to December 2019; Attorney at Wildermuth Endowment Strategy Fund/Wildermuth Advisory, LLC from November 2015 to May 2016 and Assistant General Counsel at RCS Advisory Services from July 2014 to November 2015. She is an officer of 63 investment companies (comprised of 141 portfolios) managed by the Adviser or an affiliate of the Adviser. She is 35 years old and has been an employee of the Adviser since May 2016.
GAVIN C. REILLY, Assistant Treasurer since December 2005.
Tax Manager-BNY Mellon Fund Administration, and an officer of 63 investment companies (comprised of 141 portfolios) managed by the Adviser or an affiliate of the Adviser. He is 52 years old and has been an employee of the Adviser since April 1991.
ROBERT S. ROBOL, Assistant Treasurer since December 2002.
Senior Accounting Manager-BNY Mellon Fund Administration, and an officer of 63 investment companies (comprised of 141 portfolios) managed by the Adviser or an affiliate of the Adviser. He is 56 years old and has been an employee of the Adviser since October 1988.
ROBERT SALVIOLO, Assistant Treasurer since July 2007.
Senior Accounting Manager–BNY Mellon Fund Administration, and an officer of 63 investment companies (comprised of 141 portfolios) managed by the Adviser or an affiliate of the Adviser. He is 53 years old and has been an employee of the Adviser since June 1989.
ROBERT SVAGNA, Assistant Treasurer since December 2002.
Senior Accounting Manager–BNY Mellon Fund Administration, and an officer of 63 investment companies (comprised of 141 portfolios) managed by the Adviser or an affiliate of the Adviser. He is 53 years old and has been an employee of the Adviser since November 1990.
JOSEPH W. CONNOLLY, Chief Compliance Officer since October 2004.
Chief Compliance Officer of the Adviser, the BNY Mellon Family of Funds and BNY Mellon Funds Trust (62 investment companies, comprised of 133 portfolios). He is 63 years old and has served in various capacities with the Adviser since 1980, including manager of the firm’s Fund Accounting Department from 1997 through October 2001.
CARIDAD M. CAROSELLA, Anti-Money Laundering Compliance Officer since January 2016.
Anti-Money Laundering Compliance Officer of the BNY Mellon Family of Funds and BNY Mellon Funds Trust since January 2016; from May 2015 to December 2015, Interim Anti-Money Laundering Compliance Officer of the BNY Mellon Family of Funds and BNY Mellon Funds Trust and the Distributor; from January 2012 to May 2015, AML Surveillance Officer of the Distributor. She is an officer of 56 investment companies (comprised of 134 portfolios) managed by the Adviser or an affiliate of the Adviser. She is 52 years old and has been an employee of the Distributor since 1997.
56
This page intentionally left blank.
57
BNY Mellon International Bond Fund
240 Greenwich Street
New York, NY 10286
Adviser
BNY Mellon Investment Adviser, Inc.
240 Greenwich Street
New York, NY 10286
Custodian
The Bank of New York Mellon
240 Greenwich Street
New York, NY 10286
Transfer Agent &
Dividend Disbursing Agent
BNY Mellon Transfer, Inc.
240 Greenwich Street
New York, NY 10286
Distributor
BNY Mellon Securities Corporation
240 Greenwich Street
New York, NY 10286
Ticker Symbols: | Class A: DIBAX Class C: DIBCX Class I: DIBRX Class Y: DIBYX |
Telephone Call your financial representative or 1-800-373-9387
Mail The BNY Mellon Family of Funds, 144 Glenn Curtiss Boulevard, Uniondale, NY 11556-0144
E-mail Send your request to info@bnymellon.com
Internet Information can be viewed online or downloaded at www.bnymellonim.com/us
The fund files its complete schedule of portfolio holdings with the Securities and Exchange Commission (“SEC”) for the first and third quarters of each fiscal year on Form N-PORT. The fund’s Forms N-PORT are available on the SEC’s website at www.sec.gov.
A description of the policies and procedures that the fund uses to determine how to vote proxies relating to portfolio securities and information regarding how the fund voted these proxies for the most recent 12-month period ended June 30 is available at www.bnymellonim.com/us and on the SEC’s website at www.sec.gov and without charge, upon request, by calling 1-800-373-9387.
© 2020 BNY Mellon Securities Corporation |
|

Item 2. Code of Ethics.
The Registrant has adopted a code of ethics that applies to the Registrant's principal executive officer, principal financial officer, principal accounting officer or controller, or persons performing similar functions. There have been no amendments to, or waivers in connection with, the Code of Ethics during the period covered by this Report.
Item 3. Audit Committee Financial Expert.
The Registrant's Board has determined that Joseph S. DiMartino, a member of the Audit Committee of the Board, is an audit committee financial expert as defined by the Securities and Exchange Commission (the "SEC"). Mr. DiMartino is "independent" as defined by the SEC for purposes of audit committee financial expert determinations.
Item 4. Principal Accountant Fees and Services.
(a) Audit Fees. The aggregate fees billed for each of the last two fiscal years (the "Reporting Periods") for professional services rendered by the Registrant's principal accountant (the "Auditor") for the audit of the Registrant's annual financial statements or services that are normally provided by the Auditor in connection with the statutory and regulatory filings or engagements for the Reporting Periods, were $84,970 in 2019 and $80,970 in 2020.
(b) Audit-Related Fees. The aggregate fees billed in the Reporting Periods for assurance and related services by the Auditor that are reasonably related to the performance of the audit of the Registrant's financial statements and are not reported under paragraph (a) of this Item 4 were $10,740 in 2019 and $10,740 in 2020. These services consisted of one or more of the following: (i) agreed upon procedures related to compliance with Internal Revenue Code section 817(h), (ii) security counts required by Rule 17f-2 under the Investment Company Act of 1940, as amended, (iii) advisory services as to the accounting or disclosure treatment of Registrant transactions or events and (iv) advisory services to the accounting or disclosure treatment of the actual or potential impact to the Registrant of final or proposed rules, standards or interpretations by the Securities and Exchange Commission, the Financial Accounting Standards Boards or other regulatory or standard-setting bodies.
The aggregate fees billed in the Reporting Periods for non-audit assurance and related services by the Auditor to the Registrant's investment adviser (not including any sub-investment adviser whose role is primarily portfolio management and is subcontracted with or overseen by another investment adviser), and any entity controlling, controlled by or under common control with the investment adviser that provides ongoing services to the Registrant ("Service Affiliates"), that were reasonably related to the performance of the annual audit of the Service Affiliate, which required pre-approval by the Audit Committee were $0 in 2019 and $0 in 2020.
(c) Tax Fees. The aggregate fees billed in the Reporting Periods for professional services rendered by the Auditor for tax compliance, tax advice, and tax planning ("Tax Services") were $5,380 in 2019 and $0 in 2020. These services consisted of: (i) review or preparation of U.S. federal, state, local and excise tax returns; (ii) tax advice regarding tax qualification matters and/or treatment of various financial instruments held or proposed to be acquired or held, and (iii) determination of Passive Foreign Investment. The aggregate fees billed in the Reporting Periods for Tax Services by the Auditor to Service Affiliates, which required pre-approval by the Audit Committee were $0 in 2019 and $0 in 2020.
(d) All Other Fees. The aggregate fees billed in the Reporting Periods for products and services provided by the Auditor, other than the services reported in paragraphs (a) through (c) of this Item, were $0 in 2019 and $0 in 2020.
The aggregate fees billed in the Reporting Periods for Non-Audit Services by the Auditor to Service Affiliates, other than the services reported in paragraphs (b) through (c) of this Item, which required pre-approval by the Audit Committee, were $0 in 2019 and $0 in 2020.
(e)(1) Audit Committee Pre-Approval Policies and Procedures. The Registrant's Audit Committee has established policies and procedures (the "Policy") for pre-approval (within specified fee limits) of the Auditor's engagements for non-audit services to the Registrant and Service Affiliates without specific case-by-case consideration. The pre-approved services in the Policy can include pre-approved audit services, pre-approved audit-related services, pre-approved tax services and pre-approved all other services. Pre-approval considerations include whether the proposed services are compatible with maintaining the Auditor's independence. Pre-approvals pursuant to the Policy are considered annually.
(e)(2) Note. None of the services described in paragraphs (b) through (d) of this Item 4 were approved by the Audit Committee pursuant to paragraph (c)(7)(i)(C) of Rule 2-01 of Regulation S-X.
(f) None of the hours expended on the principal accountant's engagement to audit the registrant's financial statements for the most recent fiscal year were attributed to work performed by persons other than the principal accountant's full-time, permanent employees.
Non-Audit Fees. The aggregate non-audit fees billed by the Auditor for services rendered to the Registrant, and rendered to Service Affiliates, for the Reporting Periods were $463,000 in 2019 and $472,000 in 2020.
Auditor Independence. The Registrant's Audit Committee has considered whether the provision of non-audit services that were rendered to Service Affiliates, which were not pre-approved (not requiring pre-approval), is compatible with maintaining the Auditor's independence.
Item 5. Audit Committee of Listed Registrants.
Not applicable.
Item 6. Investments.
(a) Not applicable.
Item 7. Disclosure of Proxy Voting Policies and Procedures for Closed-End Management Investment Companies.
Not applicable.
Item 8. Portfolio Managers of Closed-End Management Investment Companies.
Not applicable.
Item 9. Purchases of Equity Securities by Closed-End Management Investment Companies and Affiliated Purchasers.
Not applicable.
Item 10. Submission of Matters to a Vote of Security Holders.
There have been no material changes to the procedures applicable to Item 10.
Item 11. Controls and Procedures.
(a) The Registrant's principal executive and principal financial officers have concluded, based on their evaluation of the Registrant's disclosure controls and procedures as of a date within 90 days of the filing date of this report, that the Registrant's disclosure controls and procedures are reasonably designed to ensure that information required to be disclosed by the Registrant on Form N-CSR is recorded, processed, summarized and reported within the required time periods and that information required to be disclosed by the Registrant in the reports that it files or submits on Form N-CSR is accumulated and communicated to the Registrant's management, including its principal executive and principal financial officers, as appropriate to allow timely decisions regarding required disclosure.
(b) There were no changes to the Registrant's internal control over financial reporting that occurred during the second fiscal quarter of the period covered by this report that have materially affected, or are reasonably likely to materially affect, the Registrant's internal control over financial reporting.
Item 12. Disclosure of Securities Lending Activities for Closed-End Management Investment Companies.
Not applicable.
Item 13. Exhibits.
(a)(1) Code of ethics referred to in Item 2.
(a)(3) Not applicable.
SIGNATURES
Pursuant to the requirements of the Securities Exchange Act of 1934 and the Investment Company Act of 1940, the Registrant has duly caused this Report to be signed on its behalf by the undersigned, thereunto duly authorized.
BNY Mellon Investment Funds III
By: /s/ Renee LaRoche-Morris
Renee LaRoche-Morris
President (Principal Executive Officer)
Date: December 22, 20202
Pursuant to the requirements of the Securities Exchange Act of 1934 and the Investment Company Act of 1940, this Report has been signed below by the following persons on behalf of the Registrant and in the capacities and on the dates indicated.
By: /s/ Renee LaRoche-Morris
Renee LaRoche-Morris
President (Principal Executive Officer)
Date: December 22, 20202
By: /s/ James Windels
James Windels
Treasurer (Principal Financial Officer)
Date: December 22, 20202
EXHIBIT INDEX
(a)(1) Code of ethics referred to in Item 2.
(a)(2) Certifications of principal executive and principal financial officers as required by Rule 30a-2(a) under the Investment Company Act of 1940. (EX-99.CERT)
(b) Certification of principal executive and principal financial officers as required by Rule 30a-2(b) under the Investment Company Act of 1940. (EX-99.906CERT)