UNITED STATES
SECURITIES AND EXCHANGE COMMISSION
Washington, D.C. 20549
FORM N-CSR
CERTIFIED SHAREHOLDER REPORT OF REGISTERED MANAGEMENT
INVESTMENT COMPANIES
| Investment Company Act file number | 811-00524 |
| | |
| | BNY Mellon Investment Funds III | |
| | (Exact name of Registrant as specified in charter) | |
| | | |
| | c/o BNY Mellon Investment Adviser, Inc. 240 Greenwich Street New York, New York 10286 | |
| | (Address of principal executive offices) (Zip code) | |
| | | |
| | Deirdre Cunnane, Esq. 240 Greenwich Street New York, New York 10286 | |
| | (Name and address of agent for service) | |
| |
| Registrant's telephone number, including area code: | (212) 922-6400 |
| | |
Date of fiscal year end: | 10/31 | |
| Date of reporting period: | 10/31/22 | |
| | | | | | | |
The following N-CSR relates only to the Registrant's series listed below and does not relate to any series of the Registrant with a different fiscal year end and, therefore, different N-CSR reporting requirements. A separate N-CSR will be filed for any series with a different fiscal year end, as appropriate.
BNY Mellon Global Equity Income Fund
BNY Mellon International Bond Fund
FORM N-CSR
Item 1. Reports to Stockholders.
BNY Mellon Global Equity Income Fund
| |
ANNUAL REPORT October 31, 2022 |
| |
Save time. Save paper. View your next shareholder report online as soon as it’s available. Log into www.im.bnymellon.com and sign up for eCommunications. It’s simple and only takes a few minutes. |
| |
The views expressed in this report reflect those of the portfolio manager(s) only through the end of the period covered and do not necessarily represent the views of BNY Mellon Investment Adviser, Inc. or any other person in the BNY Mellon Investment Adviser, Inc. organization. Any such views are subject to change at any time based upon market or other conditions and BNY Mellon Investment Adviser, Inc. disclaims any responsibility to update such views. These views may not be relied on as investment advice and, because investment decisions for a fund in the BNY Mellon Family of Funds are based on numerous factors, may not be relied on as an indication of trading intent on behalf of any fund in the BNY Mellon Family of Funds. |
| |
Not FDIC-Insured • Not Bank-Guaranteed • May Lose Value |
Contents
THE FUND
FOR MORE INFORMATION
Back Cover
DISCUSSION OF FUND PERFORMANCE (Unaudited)
For the period from November 1, 2021, through October 31, 2022, as provided by portfolio managers Jon Bell and Robert Hay of Newton Investment Management Limited, sub-adviser.
Market and Fund Performance Overview
For the 12-month period ended October 31, 2022, the BNY Mellon Global Equity Income Fund’s (the “fund”) Class A shares produced a total return of −6.84%, Class C shares returned −7.54%, Class I shares returned −6.56% and Class Y shares returned −6.59%.1 In comparison, the fund’s benchmark, the FTSE World Index (the “Index”), produced a total return of −18.39% for the same period.2
Global markets declined during the reporting period under pressure from increasing inflation, tightening central bank policies and uncertainties related to Russia’s invasion of Ukraine. The fund outperformed the Index by a substantial margin, largely due to its bias in favor of dividend yield, which led it to emphasize shares in cyclical and value-oriented companies at a time when the market favored such issues.
The Fund’s Investment Approach
The fund seeks total return (consisting of capital appreciation and income). To pursue its goal, the fund normally invests at least 80% of its net assets, plus any borrowings for investment purposes, in equity securities. The fund seeks to focus on dividend-paying stocks of companies located in the developed-capital markets, such as the United States, Canada, Japan, Australia, Hong Kong and Western Europe. The fund may invest in the securities of companies of any market capitalization, and it may invest up to 30% of its assets in emerging markets. The fund’s portfolio managers typically will purchase stocks that, at the time of purchase, have a yield premium to the yield of the Index.
The portfolio managers will combine a top-down approach, emphasizing current economic trends and current investment themes on a global basis, with a bottom-up stock selection, based on fundamental research. Within markets and sectors determined to be relatively attractive, the portfolio managers seek what are believed to be attractively priced companies that possess a sustainable competitive advantage in their market or sector.
Mounting Inflation Drives Markets Lower
While global equities moved higher toward the end of 2021, the start of 2022 represented the most challenging period faced by equity investors since the outbreak of the COVID-19 pandemic. Russia’s invasion of Ukraine was the defining geopolitical event contributing to equity market weakness during the period. However, by the time the invasion took place in February 2022, equity indices had already come under considerable pressure. The proximate cause was the U.S. Federal Reserve (the “Fed”) turning more hawkish, and the growing expectations that it was poised to hike rates more aggressively than previously expected, potentially complemented with quantitative tightening. Weakness in China also weighed on investor sentiment, given the implications for economic growth and supply chains. These forces drove government bond yields steeply higher and put acute pressure on higher-multiple equities. Stocks in energy producers surged along with oil and gas prices. Many other commodity producer stocks climbed as well, while sectors seen as “defensive,” such as utilities and consumer staples, proved relatively resilient. However, growth-oriented shares suffered as political instability and the threat of rising interest rates caused investors to question the relative value of future earnings.
2
The risk of recession loomed toward the end of June amid concerns regarding aggressive, global monetary tightening in response to rising inflation. However, stock markets started the third quarter on a firmer footing, bolstered, in part, by a quarterly corporate reporting season that proved better than feared. Additional positive momentum was generated when investors discerned a less hawkish tone from Fed Chair Powell as he announced a 0.75% increase in U.S. interest rates in July. However, a subsequent Powell speech just a month later disabused markets of any nascent hopes that a dovish policy pivot might materialize in the near future. September inflation numbers came in higher than expected, underscoring the argument in favor of maintaining tight U.S. monetary conditions. These factors placed downward pressure on risk assets, exacerbated by Russia’s actions to cut flows of natural gas to Europe ahead of winter. Global equities moved higher in October on hopes of easing monetary policy, although the risk of recession remained a real concern. China-linked equities declined as Xi Jinping, the country’s president, revealed a new leadership team that demonstrated his tightening grip on power, while data showed the Chinese economy falling short of Beijing’s growth target.
Cyclical- and Value-Stock Outperformance Bolstered the Fund
The fund benefited from the market’s rotation away from long-duration growth stocks, which are viewed as being particularly sensitive to inflation and the prospect of higher interest rates, in favor of cyclical and value companies. On a sector basis, the biggest positive contribution to the fund’s performance relative to the Index came from positioning in information technology, owing in part to the fund’s zero weightings in non-dividend-paying Meta Platforms and Alphabet, but also to good performance from several individual fund holdings including Qualcomm and Infosys. The fund’s relative returns also benefited from positions in the consumer staples sector, led by British American Tobacco, which found favor with investors due to its attractive valuation and robust cash flow attributable to strong cigarette pricing. PepsiCo also performed well due to the appeal of the company’s consistent profits and strong pricing power in an uncertain economic environment. Other areas of relatively positive performance included industrials and financials. Holdings in British aerospace and defense contractor BAE Systems benefited from announced increases in defense spending by several governments in response to the Russian invasion of the Ukraine. Shares in electrical equipment maker Hubbell rose on good financial results and a robust outlook supported by favorable secular trends in the electrification of U.S. infrastructure. U.S. regional bank First Horizon saw shares climb when a takeover by Canadian bank Toronto Dominion was announced during the period.
Due to the fund’s strong relative returns, few holdings detracted notably from performance compared to the Index. Underweight exposure to the energy sector resulted in a modest headwind as oil and gas prices soared. In information technology, where the fund’s enjoyed its best performance relative to the Index, lack of exposure to consumer electronics company Apple detracted from relative returns. The fund cannot hold Apple stock as it does not meet our strict yield criteria. Lagging holdings included German auto and auto parts companies Volkswagen and Continental, both of which were undermined by supply-chain disruptions and the potential impact of inflation on car demand. Finally, shares in Spain-based fast-fashion retailer Industria de Diseno Textil declined over questions related to the company’s management, along with input inflation and supply-chain issues.
Remaining Guided by Our Strict Yield Discipline
In our view, given recent economic shifts, inflation is likely to settle at higher rates than investors have lately become used to. Looking back over history, when inflation in developed markets rose above 5%, it took an average of ten years for it to settle back down to 2%. Critically, inflation has become a major political issue; as a result, central bankers have clearly indicated that interest rates
3
DISCUSSION OF FUND PERFORMANCE (Unaudited) (continued)
are set to be higher for longer, and quantitative-easing programs have been replaced by quantitative tightening. While markets are likely to remain volatile, this is a change that we believe will prompt a switch back to the long-term trend of dividend-compounding driving equity-market returns.
We continue to make changes to the portfolio as and when we judge it to be necessary, drawing on Newton’s multidimensional research process and the valuable guidance provided by our strict yield discipline. As of October 31, 2022, our investment approach continues to produce a clear sector bias in the fund, with a significantly underweight position in technology countered by overweight exposure to stable cash-generative businesses with sustainable dividend streams, in sectors such as consumer staples, health care and utilities, along with positive interest-rate sensitivity in financial holdings and exposure to the energy transition within industrials.
November 15, 2022
1 Total return includes reinvestment of dividends and any capital gains paid and does not take into consideration the maximum initial sales charge in the case of Class A shares, or the applicable contingent deferred sales charge imposed on redemptions in the case of Class C shares. Had these charges been reflected, returns would have been lower. Share price and investment return fluctuate such that upon redemption, fund shares may be worth more or less than their original cost. Had these expenses not been absorbed, returns would have been lower. Past performance is no guarantee of future results.
2 Source: Lipper Inc. — Reflects reinvestment of net dividends and, where applicable, capital gain distributions. The FTSE World Index is a market capitalization-weighted index representing the performance of the large- and mid-cap stocks from the Developed and Advanced Emerging segments of the FTSE Global Equity Index Series. Investors cannot invest directly in any index.
Please note: the position in any security highlighted with italicized typeface was sold during the reporting period.
Equities are subject generally to market, market sector, market liquidity, issuer and investment style risks, among other factors, to varying degrees, all of which are more fully described in the fund’s prospectus.
The fund may, but is not required to, use derivative instruments. A small investment in derivatives could have a potentially large impact on the fund’s performance. The use of derivatives involves risks different from, or possibly greater than, the risks associated with investing directly in the underlying assets.
Recent market risks include pandemic risks related to COVID-19. The effects of COVID-19 have contributed to increased volatility in global markets and will likely affect certain countries, companies, industries and market sectors more dramatically than others. To the extent the fund may overweight its investments in certain countries, companies, industries or market sectors, such positions will increase the fund’s exposure to risk of loss from adverse developments affecting those countries, companies, industries or sectors.
The fund’s performance will be influenced by political, social and economic factors affecting investments in foreign companies. Special risks associated with investments in foreign companies include exposure to currency fluctuations, less liquidity, less developed or less efficient trading markets, lack of comprehensive company information, political instability and differing auditing and legal standards. These risks generally are greater with emerging-market countries than with more economically and politically established foreign countries.
4
FUND PERFORMANCE (Unaudited)

Comparison of change in value of a $10,000 investment in Class A shares, Class C shares, and Class I shares of BNY Mellon Global Equity Income Fund with a hypothetical investment of $10,000 in the FTSE World Index (the “Index”).
† Source: Lipper Inc.
Past performance is not predictive of future performance.
The above graph compares a hypothetical investment of $10,000 made in each of the Class A shares, Class C shares, and Class I shares of BNY Mellon Global Equity Income Fund on 10/31/12 to a hypothetical investment of $10,000 made in the Index on that date. All dividends and capital gain distributions are reinvested.
The fund’s performance shown in the line graph above takes into account the maximum initial sales charge on Class A shares and all other applicable fees and expenses on Class A shares, Class C shares, and Class I shares. The Index is a market capitalization-weighted index representing the performance of the large- and mid-cap stocks from the Developed and Advanced Emerging segments of the FTSE Global Equity Index Series. Unlike a mutual fund, the Index is not subject to charges, fees and other expenses. Investors cannot invest directly in any index. Further information relating to fund performance, including expense reimbursements, if applicable, is contained in the Financial Highlights section of the prospectus and elsewhere in this report.
5
FUND PERFORMANCE (Unaudited) (continued)

Comparison of change in value of a $1,000,000 investment in Class Y shares of BNY Mellon Global Equity Income Fund with a hypothetical investment of $1,000,000 in the FTSE World Index (the “Index”).
† Source: Lipper Inc.
†† The total return figures presented for Class Y shares of the fund reflect the performance of the fund’s Class A shares for the period prior to 7/1/13 (the inception date for Class Y shares), not reflecting the applicable sales charges for Class A shares.
Past performance is not predictive of future performance.
The above graph compares a hypothetical investment of $1,000,000 made in Class Y shares of BNY Mellon Global Equity Income Fund on 10/31/12 to a hypothetical investment of $1,000,000 made in the Index on that date. All dividends and capital gain distributions are reinvested.
The fund’s performance shown in the line graph above takes into account all applicable fees and expenses of the fund’s Class Y shares. The Index is a market capitalization-weighted index representing the performance of the large- and mid-cap stocks from the Developed and Advanced Emerging segments of the FTSE Global Equity Index Series. Unlike a mutual fund, the Index is not subject to charges, fees and other expenses. Investors cannot invest directly in any index. Further information relating to fund performance, including expense reimbursements, if applicable, is contained in the Financial Highlights section of the prospectus and elsewhere in this report.
6
| | | | | |
Average Annual Total Returns as of 10/31/2022 |
| | Inception | | | |
| Date | 1 Year | 5 Years | 10 Years |
Class A shares | | | | |
with maximum sales charge (5.75%) | 10/18/07 | -12.19% | 4.65% | 6.91% |
without sales charge | 10/18/07 | -6.84% | 5.90% | 7.55% |
Class C shares | | | | |
with applicable redemption charge† | 10/18/07 | -8.38% | 5.10% | 6.74% |
without redemption | 10/18/07 | -7.54% | 5.10% | 6.74% |
Class I shares | 10/18/07 | -6.56% | 6.18% | 7.84% |
Class Y shares | 7/1/13 | -6.59% | 6.24% | 7.53%†† |
FTSE World Index | | -18.39% | 6.35% | 8.97% |
† The maximum contingent deferred sales charge for Class C shares is 1% for shares redeemed within one year of the date of purchase.
†† The total return performance figures presented for Class Y shares of the fund reflect the performance of the fund’s Class A shares for the period prior to 7/1/13 (the inception date for Class Y shares), not reflecting the applicable sales charges for Class A shares.
The performance data quoted represents past performance, which is no guarantee of future results. Share price and investment return fluctuate and an investor’s shares may be worth more or less than original cost upon redemption. Current performance may be lower or higher than the performance quoted. Go to www.im.bnymellon.com for the fund’s most recent month-end returns.
The fund’s performance shown in the graphs and table does not reflect the deduction of taxes that a shareholder would pay on fund distributions or the redemption of fund shares. In addition to the performance of Class A shares shown with and without a maximum sales charge, the fund’s performance shown in the table takes into account all other applicable fees and expenses on all classes.
7
UNDERSTANDING YOUR FUND’S EXPENSES (Unaudited)
As a mutual fund investor, you pay ongoing expenses, such as management fees and other expenses. Using the information below, you can estimate how these expenses affect your investment and compare them with the expenses of other funds. You also may pay one-time transaction expenses, including sales charges (loads) and redemption fees, which are not shown in this section and would have resulted in higher total expenses. For more information, see your fund’s prospectus or talk to your financial adviser.
Review your fund’s expenses
The table below shows the expenses you would have paid on a $1,000 investment in BNY Mellon Global Equity Income Fund from May 1, 2022 to October 31, 2022. It also shows how much a $1,000 investment would be worth at the close of the period, assuming actual returns and expenses.
| | | | | | | |
Expenses and Value of a $1,000 Investment | |
Assume actual returns for the six months ended October 31, 2022 | |
| | | | | | |
| | Class A | Class C | Class I | Class Y | |
Expenses paid per $1,000† | $5.79 | $9.55 | $4.52 | $4.18 | |
Ending value (after expenses) | $947.20 | $943.10 | $948.20 | $949.20 | |
COMPARING YOUR FUND’S EXPENSES WITH THOSE OF OTHER FUNDS (Unaudited)
Using the SEC’s method to compare expenses
The Securities and Exchange Commission (“SEC”) has established guidelines to help investors assess fund expenses. Per these guidelines, the table below shows your fund’s expenses based on a $1,000 investment, assuming a hypothetical 5% annualized return. You can use this information to compare the ongoing expenses (but not transaction expenses or total cost) of investing in the fund with those of other funds. All mutual fund shareholder reports will provide this information to help you make this comparison. Please note that you cannot use this information to estimate your actual ending account balance and expenses paid during the period.
| | | | | | | |
Expenses and Value of a $1,000 Investment | |
Assuming a hypothetical 5% annualized return for the six months ended October 31, 2022 | |
| | | | | | |
| | Class A | Class C | Class I | Class Y | |
Expenses paid per $1,000† | $6.01 | $9.91 | $4.69 | $4.33 | |
Ending value (after expenses) | $1,019.26 | $1,015.38 | $1,020.57 | $1,020.92 | |
† | Expenses are equal to the fund’s annualized expense ratio of 1.18% for Class A, 1.95% for Class C, .92% for Class I and .85% for Class Y, multiplied by the average account value over the period, multiplied by 184/365 (to reflect the one-half year period). |
8
STATEMENT OF INVESTMENTS
October 31, 2022
| | | | | | | | |
| |
Description | | | | Shares | | Value ($) | |
Common Stocks - 93.3% | | | | | |
Australia - .9% | | | | | |
Insurance Australia Group Ltd. | | | | 928,048 | | 2,900,843 | |
China - 1.1% | | | | | |
Ping An Insurance Group Company of China Ltd., Cl. H | | | | 902,500 | | 3,611,634 | |
France - 3.3% | | | | | |
Sanofi | | | | 95,378 | | 8,235,574 | |
TotalEnergies SE | | | | 42,595 | | 2,327,829 | |
| | | | | 10,563,403 | |
Germany - 7.3% | | | | | |
Bayer AG | | | | 130,130 | | 6,845,752 | |
Continental AG | | | | 59,000 | | 3,059,935 | |
Deutsche Post AG | | | | 170,584 | | 6,052,333 | |
Muenchener Rueckversicherungs-Gesellschaft AG | | | | 29,329 | | 7,748,750 | |
| | | | | 23,706,770 | |
Hong Kong - .9% | | | | | |
Link REIT | | | | 473,000 | | 2,798,326 | |
India - 1.7% | | | | | |
Infosys Ltd., ADR | | | | 292,092 | | 5,470,883 | |
Ireland - 3.0% | | | | | |
Medtronic PLC | | | | 110,667 | | 9,665,656 | |
Peru - 1.3% | | | | | |
Credicorp Ltd. | | | | 29,749 | | 4,354,064 | |
Spain - 1.7% | | | | | |
Industria de Diseno Textil SA | | | | 245,965 | | 5,570,914 | |
Sweden - 1.8% | | | | | |
Svenska Handelsbanken AB, Cl. A | | | | 625,284 | | 5,807,886 | |
Switzerland - 6.4% | | | | | |
Nestle SA | | | | 53,481 | | 5,820,946 | |
Roche Holding AG | | | | 23,617 | | 7,849,135 | |
Zurich Insurance Group AG | | | | 16,681 | | 7,112,437 | |
| | | | | 20,782,518 | |
Taiwan - .7% | | | | | |
Delta Electronics Inc. | | | | 303,000 | | 2,414,791 | |
United Kingdom - 15.9% | | | | | |
AstraZeneca PLC | | | | 60,406 | | 7,086,864 | |
BAE Systems PLC | | | | 847,948 | | 7,919,443 | |
British American Tobacco PLC | | | | 280,212 | | 11,069,963 | |
Informa PLC | | | | 877,893 | | 5,593,601 | |
RELX PLC | | | | 355,833 | | 9,564,881 | |
Smiths Group PLC | | | | 126,503 | | 2,263,874 | |
9
STATEMENT OF INVESTMENTS (continued)
| | | | | | | | |
| |
Description | | | | Shares | | Value ($) | |
Common Stocks - 93.3% (continued) | | | | | |
United Kingdom - 15.9% (continued) | | | | | |
Taylor Wimpey PLC | | | | 3,168,297 | | 3,403,971 | |
The Sage Group PLC | | | | 573,299 | | 4,773,225 | |
| | | | | 51,675,822 | |
United States - 47.3% | | | | | |
AbbVie Inc. | | | | 53,973 | | 7,901,647 | |
Broadcom Inc. | | | | 10,631 | | 4,997,846 | |
Chesapeake Energy Corp. | | | | 42,352 | a | 4,331,339 | |
Cisco Systems Inc. | | | | 271,144 | | 12,318,072 | |
CME Group Inc. | | | | 39,153 | | 6,785,215 | |
CMS Energy Corp. | | | | 98,039 | | 5,593,125 | |
Comerica Inc. | | | | 82,852 | | 5,841,066 | |
Dominion Energy Inc. | | | | 92,012 | | 6,438,080 | |
Emerson Electric Co. | | | | 101,848 | | 8,820,037 | |
Exelon Corp. | | | | 192,226 | | 7,418,001 | |
Flowserve Corp. | | | | 120,180 | | 3,446,762 | |
Gilead Sciences Inc. | | | | 69,556 | | 5,457,364 | |
Hasbro Inc. | | | | 79,730 | | 5,202,382 | |
Hewlett Packard Enterprise Co. | | | | 278,198 | | 3,969,885 | |
Hubbell Inc. | | | | 13,353 | | 3,171,070 | |
Johnson Controls International PLC | | | | 100,851 | | 5,833,222 | |
JPMorgan Chase & Co. | | | | 31,504 | | 3,965,723 | |
Marathon Petroleum Corp. | | | | 51,677 | | 5,871,541 | |
MetLife Inc. | | | | 105,739 | | 7,741,152 | |
Organon & Co. | | | | 149,211 | | 3,906,344 | |
PepsiCo Inc. | | | | 75,420 | | 13,694,764 | |
Sysco Corp. | | | | 57,252 | | 4,955,733 | |
Texas Instruments Inc. | | | | 19,844 | | 3,187,542 | |
The Goldman Sachs Group Inc. | | | | 16,292 | | 5,612,757 | |
The Interpublic Group of Companies | | | | 166,075 | | 4,947,374 | |
The Procter & Gamble Company | | | | 16,804 | | 2,262,995 | |
| | | | | 153,671,038 | |
Total Common Stocks (cost $287,812,519) | | | | 302,994,548 | |
| | | Preferred Dividend
Yield (%) | | | | | |
Preferred Stocks - 3.2% | | | | | |
Germany - 1.0% | | | | | |
Volkswagen AG | | 5.47 | | 25,073 | | 3,204,831 | |
South Korea - 2.2% | | | | | |
Samsung Electronics Co. | | 2.53 | | 189,923 | | 7,092,245 | |
Total Preferred Stocks (cost $12,749,215) | | | | 10,297,076 | |
10
| | | | | | | | |
| |
Description | | 1-Day
Yield (%) | | Shares | | Value ($) | |
Investment Companies - 2.5% | | | | | |
Registered Investment Companies - 2.5% | | | | | |
Dreyfus Institutional Preferred Government Plus Money Market Fund, Institutional Shares
(cost $8,258,809) | | 3.23 | | 8,258,809 | b | 8,258,809 | |
Total Investments (cost $308,820,543) | | 99.0% | | 321,550,433 | |
Cash and Receivables (Net) | | 1.0% | | 3,246,540 | |
Net Assets | | 100.0% | | 324,796,973 | |
ADR—American Depository Receipt
REIT—Real Estate Investment Trust
a Security, or portion thereof, on loan. At October 31, 2022, the value of the fund’s securities on loan was $4,258,523 and the value of the collateral was $4,156,653, consisting of U.S. Government & Agency securities. In addition, the value of collateral may include pending sales that are also on loan.
b Investment in affiliated issuer. The investment objective of this investment company is publicly available and can be found within the investment company’s prospectus.
| | |
Portfolio Summary (Unaudited) † | Value (%) |
Pharmaceuticals Biotechnology & Life Sciences | 14.6 |
Capital Goods | 9.7 |
Food, Beverage & Tobacco | 9.4 |
Insurance | 9.0 |
Technology Hardware & Equipment | 7.9 |
Banks | 6.1 |
Utilities | 6.0 |
Energy | 3.9 |
Diversified Financials | 3.8 |
Media & Entertainment | 3.2 |
Software & Services | 3.2 |
Health Care Equipment & Services | 3.0 |
Commercial & Professional Services | 2.9 |
Consumer Durables & Apparel | 2.7 |
Investment Companies | 2.5 |
Semiconductors & Semiconductor Equipment | 2.5 |
Automobiles & Components | 1.9 |
Transportation | 1.9 |
Retailing | 1.7 |
Food & Staples Retailing | 1.5 |
Real Estate | .9 |
Household & Personal Products | .7 |
| | 99.0 |
† Based on net assets.
See notes to financial statements.
11
STATEMENT OF INVESTMENTS (continued)
| | | | | | | |
Affiliated Issuers | | | |
Description | Value ($) 10/31/2021 | Purchases ($)† | Sales ($) | Value ($) 10/31/2022 | Dividends/
Distributions ($) | |
Registered Investment Companies - 2.5% | | |
Dreyfus Institutional Preferred Government Plus Money Market Fund, Institutional Shares - 2.5% | 7,082,007 | 133,398,369 | (132,221,567) | 8,258,809 | 122,620 | |
Investment of Cash Collateral for Securities Loaned - .0% | | |
Dreyfus Institutional Preferred Government Plus Money Market Fund, SL Shares - .0% | - | 21,059,427 | (21,059,427) | - | 3,241 | †† |
Total - 2.5% | 7,082,007 | 154,457,796 | (153,280,994) | 8,258,809 | 125,861 | |
† Includes reinvested dividends/distributions.
†† Represents securities lending income earned from the reinvestment of cash collateral from loaned securities, net of fees and collateral investment expenses, and other payments to and from borrowers of securities.
See notes to financial statements.
12
STATEMENT OF ASSETS AND LIABILITIES
October 31, 2022
| | | | | | | |
| | | | | | |
| | | Cost | | Value | |
Assets ($): | | | | |
Investments in securities—See Statement of Investments
(including securities on loan, valued at $4,258,523)—Note 1(c): | | | |
Unaffiliated issuers | 300,561,734 | | 313,291,624 | |
Affiliated issuers | | 8,258,809 | | 8,258,809 | |
Cash denominated in foreign currency | | | 123,311 | | 122,415 | |
Receivable for investment securities sold | | 2,509,805 | |
Tax reclaim receivable—Note 1(b) | | 1,693,150 | |
Dividends and securities lending income receivable | | 690,999 | |
Receivable for shares of Beneficial Interest subscribed | | 348,773 | |
Prepaid expenses | | | | | 55,780 | |
| | | | | 326,971,355 | |
Liabilities ($): | | | | |
Due to BNY Mellon Investment Adviser, Inc. and affiliates—Note 3(c) | | 246,643 | |
Payable for investment securities purchased | | 1,644,045 | |
Payable for shares of Beneficial Interest redeemed | | 172,362 | |
Trustees’ fees and expenses payable | | 5,053 | |
Other accrued expenses | | | | | 106,279 | |
| | | | | 2,174,382 | |
Net Assets ($) | | | 324,796,973 | |
Composition of Net Assets ($): | | | | |
Paid-in capital | | | | | 282,010,677 | |
Total distributable earnings (loss) | | | | | 42,786,296 | |
Net Assets ($) | | | 324,796,973 | |
| | | | | | |
Net Asset Value Per Share | Class A | Class C | Class I | Class Y | |
Net Assets ($) | 48,725,034 | 13,578,247 | 262,291,825 | 201,867 | |
Shares Outstanding | 3,606,083 | 963,767 | 20,636,994 | 15,891 | |
Net Asset Value Per Share ($) | 13.51 | 14.09 | 12.71 | 12.70 | |
| | | | | |
See notes to financial statements. | | | | | |
13
STATEMENT OF OPERATIONS
Year Ended October 31, 2022
| | | | | | | |
| | | | | | |
| | | | | | |
Investment Income ($): | | | | |
Income: | | | | |
Cash dividends (net of $562,311 foreign taxes withheld at source): | |
Unaffiliated issuers | | | 9,145,958 | |
Affiliated issuers | | | 122,620 | |
Income from securities lending—Note 1(c) | | | 3,241 | |
Total Income | | | 9,271,819 | |
Expenses: | | | | |
Management fee—Note 3(a) | | | 2,344,093 | |
Shareholder servicing costs—Note 3(c) | | | 387,689 | |
Distribution fees—Note 3(b) | | | 118,687 | |
Professional fees | | | 95,528 | |
Registration fees | | | 76,309 | |
Custodian fees—Note 3(c) | | | 44,113 | |
Trustees’ fees and expenses—Note 3(d) | | | 33,528 | |
Prospectus and shareholders’ reports | | | 19,894 | |
Chief Compliance Officer fees—Note 3(c) | | | 17,405 | |
Loan commitment fees—Note 2 | | | 6,871 | |
Miscellaneous | | | 23,431 | |
Total Expenses | | | 3,167,548 | |
Less—reduction in fees due to earnings credits—Note 3(c) | | | (286) | |
Net Expenses | | | 3,167,262 | |
Net Investment Income | | | 6,104,557 | |
Realized and Unrealized Gain (Loss) on Investments—Note 4 ($): | | |
Net realized gain (loss) on investments and foreign currency transactions | 39,991,746 | |
Net realized gain (loss) on forward foreign currency exchange contracts | (5,581) | |
Net Realized Gain (Loss) | | | 39,986,165 | |
Net change in unrealized appreciation (depreciation) on investments
and foreign currency transactions | (67,783,542) | |
Net Realized and Unrealized Gain (Loss) on Investments | | | (27,797,377) | |
Net (Decrease) in Net Assets Resulting from Operations | | (21,692,820) | |
| | | | | | |
See notes to financial statements. | | | | | |
14
STATEMENT OF CHANGES IN NET ASSETS
| | | | | | | | | | |
| | | | Year Ended October 31, |
| | | | 2022 | | 2021 | |
Operations ($): | | | | | | | | |
Net investment income | | | 6,104,557 | | | | 5,766,488 | |
Net realized gain (loss) on investments | | 39,986,165 | | | | 34,686,927 | |
Net change in unrealized appreciation
(depreciation) on investments | | (67,783,542) | | | | 43,729,454 | |
Net Increase (Decrease) in Net Assets
Resulting from Operations | (21,692,820) | | | | 84,182,869 | |
Distributions ($): | |
Distributions to shareholders: | | | | | | | | |
Class A | | | (6,038,712) | | | | (925,932) | |
Class C | | | (1,712,438) | | | | (192,813) | |
Class I | | | (28,097,586) | | | | (4,780,369) | |
Class Y | | | (5,650) | | | | (762) | |
Total Distributions | | | (35,854,386) | | | | (5,899,876) | |
Beneficial Interest Transactions ($): | |
Net proceeds from shares sold: | | | | | | | | |
Class A | | | 7,998,934 | | | | 11,932,795 | |
Class C | | | 1,316,993 | | | | 878,761 | |
Class I | | | 119,127,910 | | | | 46,660,220 | |
Class Y | | | 179,484 | | | | 7,881 | |
Distributions reinvested: | | | | | | | | |
Class A | | | 4,595,830 | | | | 701,787 | |
Class C | | | 1,481,989 | | | | 166,151 | |
Class I | | | 22,983,321 | | | | 3,912,304 | |
Class Y | | | 5,651 | | | | 762 | |
Cost of shares redeemed: | | | | | | | | |
Class A | | | (9,995,742) | | | | (14,670,732) | |
Class C | | | (4,482,590) | | | | (13,796,463) | |
Class I | | | (69,112,514) | | | | (65,254,810) | |
Class Y | | | (8,191) | | | | (2,732) | |
Increase (Decrease) in Net Assets
from Beneficial Interest Transactions | 74,091,075 | | | | (29,464,076) | |
Total Increase (Decrease) in Net Assets | 16,543,869 | | | | 48,818,917 | |
Net Assets ($): | |
Beginning of Period | | | 308,253,104 | | | | 259,434,187 | |
End of Period | | | 324,796,973 | | | | 308,253,104 | |
15
STATEMENT OF CHANGES IN NET ASSETS (continued)
| | | | | | | | | | |
| | | | Year Ended October 31, |
| | | | 2022 | | 2021 | |
Capital Share Transactions (Shares): | |
Class Aa,b | | | | | | | | |
Shares sold | | | 553,530 | | | | 778,886 | |
Shares issued for distributions reinvested | | | 312,974 | | | | 45,508 | |
Shares redeemed | | | (694,878) | | | | (960,861) | |
Net Increase (Decrease) in Shares Outstanding | 171,626 | | | | (136,467) | |
Class Ca,b | | | | | | | | |
Shares sold | | | 88,577 | | | | 53,790 | |
Shares issued for distributions reinvested | | | 96,310 | | | | 10,446 | |
Shares redeemed | | | (298,768) | | | | (874,740) | |
Net Increase (Decrease) in Shares Outstanding | (113,881) | | | | (810,504) | |
Class Ia | | | | | | | | |
Shares sold | | | 8,864,256 | | | | 3,197,764 | |
Shares issued for distributions reinvested | | | 1,668,799 | | | | 268,020 | |
Shares redeemed | | | (5,114,039) | | | | (4,483,100) | |
Net Increase (Decrease) in Shares Outstanding | 5,419,016 | | | | (1,017,316) | |
Class Y | | | | | | | | |
Shares sold | | | 13,397 | | | | 539 | |
Shares issued for distributions reinvested | | | 416 | | | | 52 | |
Shares redeemed | | | (644) | | | | (194) | |
Net Increase (Decrease) in Shares Outstanding | 13,169 | | | | 397 | |
| | | | | | | | | |
a | During the period ended October 31, 2022, 154 Class C shares representing $2,010 were exchanged for 171 Class I shares and 7 Class I shares representing $85 were exchanged for 7 Class A shares. | |
b | During the period ended October 31, 2021, 2,180 Class C shares representing $34,519 were automatically converted to 2,260 Class A shares. | |
See notes to financial statements. | | | | | | | | |
16
FINANCIAL HIGHLIGHTS
The following tables describe the performance for each share class for the fiscal periods indicated. All information (except portfolio turnover rate) reflects financial results for a single fund share. Net asset value total return is calculated assuming an initial investment made at the net asset value at the beginning of the period, reinvestment of all dividends and distributions at net asset value during the period, and redemption at net asset value on the last day of the period. Net asset value total return includes adjustments in accordance with accounting principles generally accepted in the United States of America and as such, the net asset value for financial reporting purposes and the returns based upon those net asset values may differ from the net asset value and returns for shareholder transactions. These figures have been derived from the fund’s financial statements.
| | | | | | | |
| | |
| | | Year Ended October 31, |
Class A Shares | | 2022 | 2021 | 2020 | 2019 | 2018 |
Per Share Data ($): | | | | | | |
Net asset value, beginning of period | | 16.25 | 12.40 | 13.99 | 13.45 | 13.65 |
Investment Operations: | | | | | | |
Net investment incomea | | .26 | .28 | .26 | .33 | .31 |
Net realized and unrealized
gain (loss) on investments | | (1.25) | 3.84 | (1.45) | 1.36 | .13 |
Total from Investment Operations | | (.99) | 4.12 | (1.19) | 1.69 | .44 |
Distributions: | | | | | | |
Dividends from net
investment income | | (.25) | (.27) | (.27) | (.33) | (.32) |
Dividends from net realized
gain on investments | | (1.50) | - | (.13) | (.82) | (.32) |
Total Distributions | | (1.75) | (.27) | (.40) | (1.15) | (.64) |
Net asset value, end of period | | 13.51 | 16.25 | 12.40 | 13.99 | 13.45 |
Total Return (%)b | | (6.84) | 33.36 | (8.72) | 13.85 | 3.14 |
Ratios/Supplemental Data (%): | | | | | | |
Ratio of total expenses
to average net assets | | 1.17 | 1.18 | 1.19 | 1.17 | 1.18 |
Ratio of net expenses
to average net assets | | 1.17 | 1.18 | 1.19 | 1.17 | 1.18 |
Ratio of net investment income
to average net assets | | 1.79 | 1.77 | 1.95 | 2.54 | 2.26 |
Portfolio Turnover Rate | | 52.78 | 26.61 | 18.42 | 27.51 | 21.82 |
Net Assets, end of period ($ x 1,000) | | 48,725 | 55,804 | 44,269 | 56,173 | 50,382 |
a Based on average shares outstanding.
b Exclusive of sales charge.
See notes to financial statements.
17
FINANCIAL HIGHLIGHTS (continued)
| | | | | | | |
| | |
| | | Year Ended October 31, |
Class C Shares | | 2022 | 2021 | 2020 | 2019 | 2018 |
Per Share Data ($): | | | | | | |
Net asset value, beginning of period | | 16.86 | 12.85 | 14.47 | 13.86 | 13.98 |
Investment Operations: | | | | | | |
Net investment incomea | | .15 | .15 | .17 | .24 | .22 |
Net realized and unrealized
gain (loss) on investments | | (1.29) | 4.00 | (1.51) | 1.41 | .12 |
Total from Investment Operations | | (1.14) | 4.15 | (1.34) | 1.65 | .34 |
Distributions: | | | | | | |
Dividends from net
investment income | | (.13) | (.14) | (.15) | (.22) | (.14) |
Dividends from net realized
gain on investments | | (1.50) | - | (.13) | (.82) | (.32) |
Total Distributions | | (1.63) | (.14) | (.28) | (1.04) | (.46) |
Net asset value, end of period | | 14.09 | 16.86 | 12.85 | 14.47 | 13.86 |
Total Return (%)b | | (7.54) | 32.34 | (9.42) | 13.00 | 2.41 |
Ratios/Supplemental Data (%): | | | | | | |
Ratio of total expenses
to average net assets | | 1.94 | 1.95 | 1.94 | 1.91 | 1.91 |
Ratio of net expenses
to average net assets | | 1.94 | 1.95 | 1.94 | 1.91 | 1.91 |
Ratio of net investment income
to average net assets | | 1.02 | .97 | 1.21 | 1.79 | 1.53 |
Portfolio Turnover Rate | | 52.78 | 26.61 | 18.42 | 27.51 | 21.82 |
Net Assets, end of period ($ x 1,000) | | 13,578 | 18,165 | 24,255 | 49,830 | 49,068 |
a Based on average shares outstanding.
b Exclusive of sales charge.
See notes to financial statements.
18
| | | | | | | |
| | |
| | Year Ended October 31, |
Class I Shares | | 2022 | 2021 | 2020 | 2019 | 2018 |
Per Share Data ($): | | | | | | |
Net asset value, beginning of period | | 15.39 | 11.76 | 13.30 | 12.83 | 13.10 |
Investment Operations: | | | | | | |
Net investment incomea | | .28 | .30 | .28 | .35 | .33 |
Net realized and unrealized
gain (loss) on investments | | (1.17) | 3.64 | (1.39) | 1.30 | .12 |
Total from Investment Operations | | (.89) | 3.94 | (1.11) | 1.65 | .45 |
Distributions: | | | | | | |
Dividends from net
investment income | | (.29) | (.31) | (.30) | (.36) | (.40) |
Dividends from net realized
gain on investments | | (1.50) | - | (.13) | (.82) | (.32) |
Total Distributions | | (1.79) | (.31) | (.43) | (1.18) | (.72) |
Net asset value, end of period | | 12.71 | 15.39 | 11.76 | 13.30 | 12.83 |
Total Return (%) | | (6.56) | 33.67 | (8.53) | 14.20 | 3.43 |
Ratios/Supplemental Data (%): | | | | | | |
Ratio of total expenses
to average net assets | | .92 | .93 | .94 | .91 | .90 |
Ratio of net expenses
to average net assets | | .92 | .93 | .94 | .91 | .90 |
Ratio of net investment income
to average net assets | | 2.05 | 2.02 | 2.22 | 2.78 | 2.55 |
Portfolio Turnover Rate | | 52.78 | 26.61 | 18.42 | 27.51 | 21.82 |
Net Assets, end of period ($ x 1,000) | | 262,292 | 234,242 | 190,883 | 309,206 | 262,268 |
a Based on average shares outstanding.
See notes to financial statements.
19
FINANCIAL HIGHLIGHTS (continued)
| | | | | | | |
| | |
| | | Year Ended October 31, |
Class Y Shares | | 2022 | 2021 | 2020 | 2019 | 2018 |
Per Share Data ($): | | | | | | |
Net asset value, beginning of period | | 15.39 | 11.75 | 13.29 | 12.82 | 13.09 |
Investment Operations: | | | | | | �� |
Net investment incomea | | .24 | .30 | .32 | .37 | .34 |
Net realized and unrealized
gain (loss) on investments | | (1.14) | 3.65 | (1.42) | 1.29 | .12 |
Total from Investment Operations | | (.90) | 3.95 | (1.10) | 1.66 | .46 |
Distributions: | | | | | | |
Dividends from net
investment income | | (.29) | (.31) | (.31) | (.37) | (.41) |
Dividends from net realized
gain on investments | | (1.50) | - | (.13) | (.82) | (.32) |
Total Distributions | | (1.79) | (.31) | (.44) | (1.19) | (.73) |
Net asset value, end of period | | 12.70 | 15.39 | 11.75 | 13.29 | 12.82 |
Total Return (%) | | (6.59) | 33.79 | (8.47) | 14.29 | 3.53 |
Ratios/Supplemental Data (%): | | | | | | |
Ratio of total expenses
to average net assets | | .85 | .92 | .85 | .84 | .83 |
Ratio of net expenses
to average net assets | | .85 | .92 | .85 | .84 | .83 |
Ratio of net investment income
to average net assets | | 1.96 | 2.03 | 2.48 | 2.93 | 2.61 |
Portfolio Turnover Rate | | 52.78 | 26.61 | 18.42 | 27.51 | 21.82 |
Net Assets, end of period ($ x 1,000) | | 202 | 42 | 27 | 39,585 | 43,267 |
a Based on average shares outstanding.
See notes to financial statements.
20
NOTES TO FINANCIAL STATEMENTS
NOTE 1—Significant Accounting Policies:
BNY Mellon Global Equity Income Fund (the “fund”) is a separate diversified series of BNY Mellon Investment Funds III (the “Trust”), which is registered under the Investment Company Act of 1940, as amended (the “Act”), as an open-end management investment company and operates as a series company currently offering four series, including the fund. The fund’s investment objective is to seek total return (consisting of capital appreciation and income). BNY Mellon Investment Adviser, Inc. (the “Adviser”), a wholly-owned subsidiary of The Bank of New York Mellon Corporation (“BNY Mellon”), serves as the fund’s investment adviser. Newton Investment Management Limited (the “Sub-Adviser”), a wholly-owned subsidiary of BNY Mellon and an affiliate of the Adviser, serves as the fund’s sub-adviser.
BNY Mellon Securities Corporation (the “Distributor”), a wholly-owned subsidiary of the Adviser, is the distributor of the fund’s shares. The fund is authorized to issue an unlimited number of $.001 par value shares of Beneficial Interest in each of the following classes of shares: Class A, Class C, Class I and Class Y. Class A and Class C shares are sold primarily to retail investors through financial intermediaries and bear Distribution and/or Shareholder Services Plan fees. Class A shares generally are subject to a sales charge imposed at the time of purchase. Class A shares bought without an initial sales charge as part of an investment of $1 million or more may be charged a contingent deferred sales charge (“CDSC”) of 1.00% if redeemed within one year. Class C shares are subject to a CDSC imposed on Class C shares redeemed within one year of purchase. Class C shares automatically convert to Class A shares eight years after the date of purchase, without the imposition of a sales charge. Class I shares are sold primarily to bank trust departments and other financial service providers (including BNY Mellon and its affiliates), acting on behalf of customers having a qualified trust or an investment account or relationship at such institution, and bear no Distribution or Shareholder Services Plan fees. Class Y shares are sold at net asset value per share generally to institutional investors, and bear no Distribution or Shareholder Services Plan fees. Class I and Class Y shares are offered without a front-end sales charge or CDSC. Other differences between the classes include the services offered to and the expenses borne by each class, the allocation of certain transfer agency costs and certain voting rights. Income, expenses (other than expenses attributable to a specific class), and realized and unrealized gains or losses on investments are allocated to each class of shares based on its relative net assets.
21
NOTES TO FINANCIAL STATEMENTS (continued)
The Trust accounts separately for the assets, liabilities and operations of each series. Expenses directly attributable to each series are charged to that series’ operations; expenses which are applicable to all series are allocated among them on a pro rata basis.
The Financial Accounting Standards Board (“FASB”) Accounting Standards Codification (“ASC”) is the exclusive reference of authoritative U.S. generally accepted accounting principles (“GAAP”) recognized by the FASB to be applied by nongovernmental entities. Rules and interpretive releases of the SEC under authority of federal laws are also sources of authoritative GAAP for SEC registrants. The fund is an investment company and applies the accounting and reporting guidance of the FASB ASC Topic 946 Financial Services-Investment Companies. The fund’s financial statements are prepared in accordance with GAAP, which may require the use of management estimates and assumptions. Actual results could differ from those estimates.
The Trust enters into contracts that contain a variety of indemnifications. The fund’s maximum exposure under these arrangements is unknown. The fund does not anticipate recognizing any loss related to these arrangements.
(a) Portfolio valuation: The fair value of a financial instrument is the amount that would be received to sell an asset or paid to transfer a liability in an orderly transaction between market participants at the measurement date (i.e., the exit price). GAAP establishes a fair value hierarchy that prioritizes the inputs of valuation techniques used to measure fair value. This hierarchy gives the highest priority to unadjusted quoted prices in active markets for identical assets or liabilities (Level 1 measurements) and the lowest priority to unobservable inputs (Level 3 measurements).
Additionally, GAAP provides guidance on determining whether the volume and activity in a market has decreased significantly and whether such a decrease in activity results in transactions that are not orderly. GAAP requires enhanced disclosures around valuation inputs and techniques used during annual and interim periods.
Various inputs are used in determining the value of the fund’s investments relating to fair value measurements. These inputs are summarized in the three broad levels listed below:
Level 1—unadjusted quoted prices in active markets for identical investments.
22
Level 2—other significant observable inputs (including quoted prices for similar investments, interest rates, prepayment speeds, credit risk, etc.).
Level 3—significant unobservable inputs (including the fund’s own assumptions in determining the fair value of investments).
The inputs or methodology used for valuing securities are not necessarily an indication of the risk associated with investing in those securities.
Changes in valuation techniques may result in transfers in or out of an assigned level within the disclosure hierarchy. Valuation techniques used to value the fund’s investments are as follows:
The Trust’s Board of Trustees (the “Board”) has designated the Adviser as the fund’s valuation designee, effective September 8, 2022, to make all fair value determinations with respect to the fund’s portfolio investments, subject to the Board’s oversight and pursuant to Rule 2a-5 under the Act.
Investments in equity securities are valued at the last sales price on the securities exchange or national securities market on which such securities are primarily traded. Securities listed on the National Market System for which market quotations are available are valued at the official closing price or, if there is no official closing price that day, at the last sales price. For open short positions, asked prices are used for valuation purposes. Bid price is used when no asked price is available. Registered investment companies that are not traded on an exchange are valued at their net asset value. All of the preceding securities are generally categorized within Level 1 of the fair value hierarchy.
Securities not listed on an exchange or the national securities market, or securities for which there were no transactions, are valued at the average of the most recent bid and asked prices. These securities are generally categorized within Level 2 of the fair value hierarchy.
Fair valuing of securities may be determined with the assistance of a pricing service using calculations based on indices of domestic securities and other appropriate indicators, such as prices of relevant ADRs and futures. Utilizing these techniques may result in transfers between Level 1 and Level 2 of the fair value hierarchy.
When market quotations or official closing prices are not readily available, or are determined not to accurately reflect fair value, such as when the value of a security has been significantly affected by events after the close of the exchange or market on which the security is principally traded (for example, a foreign exchange or market), but before the fund calculates its net asset value, the fund may value these investments at fair value as
23
NOTES TO FINANCIAL STATEMENTS (continued)
determined in accordance with the procedures approved by the Board. Certain factors may be considered when fair valuing investments such as: fundamental analytical data, the nature and duration of restrictions on disposition, an evaluation of the forces that influence the market in which the securities are purchased and sold, and public trading in similar securities of the issuer or comparable issuers. These securities are either categorized within Level 2 or 3 of the fair value hierarchy depending on the relevant inputs used.
For securities where observable inputs are limited, assumptions about market activity and risk are used and such securities are generally categorized within Level 3 of the fair value hierarchy.
Investments denominated in foreign currencies are translated to U.S. dollars at the prevailing rates of exchange.
The following is a summary of the inputs used as of October 31, 2022 in valuing the fund’s investments:
| | | | | | | |
| | Level 1-Unadjusted Quoted Prices | Level 2- Other Significant Observable Inputs | | Level 3-Significant Unobservable Inputs | Total | |
Assets ($) | | |
Investments in Securities:† | | |
Equity Securities - Common Stocks | 173,161,641 | 129,832,907 | †† | - | 302,994,548 | |
Equity Securities - Preferred Stocks | - | 10,297,076 | †† | - | 10,297,076 | |
Investment Companies | 8,258,809 | - | | - | 8,258,809 | |
† See Statement of Investments for additional detailed categorizations, if any.
†† Securities classified within Level 2 at period end as the values were determined pursuant to the fund’s fair valuation procedures.
(b) Foreign currency transactions: The fund does not isolate that portion of the results of operations resulting from changes in foreign exchange rates on investments from the fluctuations arising from changes in the market prices of securities held. Such fluctuations are included with the net realized and unrealized gain or loss on investments.
Net realized foreign exchange gains or losses arise from sales of foreign currencies, currency gains or losses realized on securities transactions between trade and settlement date, and the difference between the amounts of dividends, interest and foreign withholding taxes recorded on the fund’s books and the U.S. dollar equivalent of the amounts actually received or paid. Net unrealized foreign exchange gains and losses arise from changes in the value of assets and liabilities other than investments
24
resulting from changes in exchange rates. Foreign currency gains and losses on foreign currency transactions are also included with net realized and unrealized gain or loss on investments.
Foreign taxes: The fund may be subject to foreign taxes (a portion of which may be reclaimable) on income, stock dividends, realized and unrealized capital gains on investments or certain foreign currency transactions. Foreign taxes are recorded in accordance with the applicable foreign tax regulations and rates that exist in the foreign jurisdictions in which the fund invests. These foreign taxes, if any, are paid by the fund and are reflected in the Statement of Operations, if applicable. Foreign taxes payable or deferred or those subject to reclaims as of October 31, 2022, if any, are disclosed in the fund’s Statement of Assets and Liabilities.
(c) Securities transactions and investment income: Securities transactions are recorded on a trade date basis. Realized gains and losses from securities transactions are recorded on the identified cost basis. Dividend income is recognized on the ex-dividend date and interest income, including, where applicable, accretion of discount and amortization of premium on investments, is recognized on the accrual basis.
Pursuant to a securities lending agreement with BNY Mellon, the fund may lend securities to qualified institutions. It is the fund’s policy that, at origination, all loans are secured by collateral of at least 102% of the value of U.S. securities loaned and 105% of the value of foreign securities loaned. Collateral equivalent to at least 100% of the market value of securities on loan is maintained at all times. At October 31, 2022, the market value of the collateral was 97.6% of the market value of the securities on loan. The fund received additional collateral subsequent to year end which resulted in the market value of the collateral to be at least 100% of the market value of the securities on loan. Collateral is either in the form of cash, which can be invested in certain money market mutual funds managed by the Adviser, or U.S. Government and Agency securities. The fund is entitled to receive all dividends, interest and distributions on securities loaned, in addition to income earned as a result of the lending transaction. Should a borrower fail to return the securities in a timely manner, BNY Mellon is required to replace the securities for the benefit of the fund or credit the fund with the market value of the unreturned securities and is subrogated to the fund’s rights against the borrower and the collateral. Additionally, the contractual maturity of security lending transactions are on an overnight and continuous basis. During the period ended October 31, 2022, BNY Mellon earned $442 from the lending of the fund’s portfolio securities, pursuant to the securities lending agreement.
25
NOTES TO FINANCIAL STATEMENTS (continued)
(d) Affiliated issuers: Investments in other investment companies advised by the Adviser are considered “affiliated” under the Act.
(e) Market Risk: The value of the securities in which the fund invests may be affected by political, regulatory, economic and social developments, and developments that impact specific economic sectors, industries or segments of the market. The value of a security may also decline due to general market conditions that are not specifically related to a particular company or industry, such as real or perceived adverse economic conditions, changes in the general outlook for corporate earnings, changes in interest or currency rates, changes to inflation, adverse changes to credit markets or adverse investor sentiment generally. In addition, turbulence in financial markets and reduced liquidity in equity, credit and/or fixed income markets may negatively affect many issuers, which could adversely affect the fund. Global economies and financial markets are becoming increasingly interconnected, and conditions and events in one country, region or financial market may adversely impact issuers in a different country, region or financial market. These risks may be magnified if certain events or developments adversely interrupt the global supply chain; in these and other circumstances, such risks might affect companies world-wide. Recent examples include pandemic risks related to COVID-19 and aggressive measures taken world-wide in response by governments, including closing borders, restricting international and domestic travel, and the imposition of prolonged quarantines of large populations, and by businesses, including changes to operations and reducing staff.
Foreign Investment Risk: To the extent the fund invests in foreign securities, the fund’s performance will be influenced by political, social and economic factors affecting investments in foreign issuers. Special risk associated with investments in foreign issuers include exposure to currency fluctuations, less liquidity, less developed or less efficient trading markets, lack of comprehensive company information, political and economic instability and differing auditing and legal standards.
(f) Dividends and distributions to shareholders: Dividends and distributions are recorded on the ex-dividend date. Dividends from net investment income are normally declared and paid quarterly. Dividends from net realized capital gains, if any, are normally declared and paid annually, but the fund may make distributions on a more frequent basis to comply with the distribution requirements of the Internal Revenue Code of 1986, as amended (the “Code”). To the extent that net realized capital gains can be offset by capital loss carryovers, it is the policy of the fund not to distribute such gains. Income and capital gain distributions are
26
determined in accordance with income tax regulations, which may differ from GAAP.
(g) Federal income taxes: It is the policy of the fund to continue to qualify as a regulated investment company, if such qualification is in the best interests of its shareholders, by complying with the applicable provisions of the Code, and to make distributions of taxable income and net realized capital gain sufficient to relieve it from substantially all federal income and excise taxes.
As of and during the period ended October 31, 2022, the fund did not have any liabilities for any uncertain tax positions. The fund recognizes interest and penalties, if any, related to uncertain tax positions as income tax expense in the Statement of Operations. During the period ended October 31, 2022, the fund did not incur any interest or penalties.
Each tax year in the four-year period ended October 31, 2022 remains subject to examination by the Internal Revenue Service and state taxing authorities.
At October 31, 2022, the components of accumulated earnings on a tax basis were as follows: undistributed ordinary income $2,236,655, undistributed capital gains $33,104,855 and unrealized appreciation $7,444,786.
The tax character of distributions paid to shareholders during the fiscal years ended October 31, 2022 and October 31, 2021 were as follows: ordinary income $7,436,951 and $5,899,876, and long-term capital gains $28,417,435 and $0, respectively.
During the period ended October 31, 2022, as a result of permanent book to tax differences, primarily due to the tax treatment for treating a portion of the proceeds from redemptions as a distribution for tax purposes, the fund decreased total distributable earnings (loss) by $5,544,449 and increased paid-in capital by the same amount. Net assets and net asset value per share were not affected by this reclassification.
NOTE 2—Bank Lines of Credit:
The fund participates with other long-term open-end funds managed by the Adviser in a $823.5 million unsecured credit facility led by Citibank, N.A. (the “Citibank Credit Facility”) and a $300 million unsecured credit facility provided by BNY Mellon (the “BNYM Credit Facility”), each to be utilized primarily for temporary or emergency purposes, including the financing of redemptions (each, a “Facility”). The Citibank Credit Facility is available in two tranches: (i) Tranche A is in an amount equal to $688.5 million and is available to all long-term open-ended funds, including the
27
NOTES TO FINANCIAL STATEMENTS (continued)
fund, and (ii) Tranche B is an amount equal to $135 million and is available only to BNY Mellon Floating Rate Income Fund, a series of BNY Mellon Investment Funds IV, Inc. In connection therewith, the fund has agreed to pay its pro rata portion of commitment fees for Tranche A of the Citibank Credit Facility and the BNYM Credit Facility. Interest is charged to the fund based on rates determined pursuant to the terms of the respective Facility at the time of borrowing. During the period ended October 31, 2022, the fund did not borrow under the Facilities.
NOTE 3—Management Fee, Sub-Advisory Fee and Other Transactions with Affiliates:
(a) Pursuant to a management agreement with the Adviser and the Trust, the Trust had agreed to pay the Adviser a management fee computed at the annual rate of .75% of the value of the fund’s average daily net assets and is payable monthly.
Pursuant to a sub-investment advisory agreement between the Adviser and the Sub-Adviser, the Adviser pays the Sub-Adviser a monthly fee at an annual rate of .36% of the value of the fund’s average daily net assets.
During the period ended October 31, 2022, the Distributor retained $3,208 from commissions earned on sales of the fund’s Class A shares and $64 from CDSC fees on redemptions of the fund’s Class C shares.
(b) Under the Distribution Plan adopted pursuant to Rule 12b-1 under the Act, Class C shares pay the Distributor for distributing its shares at an annual rate of .75% of the value of its average daily net assets. The Distributor may pay one or more Service Agents in respect of advertising, marketing and other distribution services, and determines the amounts, if any, to be paid to Service Agents and the basis on which such payments are made. During the period ended October 31, 2022, Class C shares were charged $118,687 pursuant to the Distribution Plan.
(c) Under the Shareholder Services Plan, Class A and Class C shares pay the Distributor at an annual rate of .25% of the value of their average daily net assets for the provision of certain services. The services provided may include personal services relating to shareholder accounts, such as answering shareholder inquiries regarding the fund, and services related to the maintenance of shareholder accounts. The Distributor may make payments to Service Agents (securities dealers, financial institutions or other industry professionals) with respect to these services. The Distributor determines the amounts to be paid to Service Agents. During the period ended October 31, 2022, Class A and Class C shares were charged $131,917 and $39,562, respectively, pursuant to the Shareholder Services Plan.
28
Under its terms, the Distribution Plan and Shareholder Services Plan shall remain in effect from year to year, provided such continuance is approved annually by a vote of a majority of those Trustees who are not “interested persons” of the Trust and who have no direct or indirect financial interest in the operation of or in any agreement related to the Distribution Plan or Shareholder Services Plan.
The fund has an arrangement with BNY Mellon Transfer, Inc., (the “Transfer Agent”), a subsidiary of BNY Mellon and an affiliate of the Adviser, whereby the fund may receive earnings credits when positive cash balances are maintained, which are used to offset Transfer Agent fees. For financial reporting purposes, the fund includes transfer agent net earnings credits, if any, as an expense offset in the Statement of Operations.
The fund has an arrangement with The Bank of New York Mellon (the “Custodian”), a subsidiary of BNY Mellon and an affiliate of the Adviser, whereby the fund will receive interest income or be charged overdraft fees when cash balances are maintained. For financial reporting purposes, the fund includes this interest income and overdraft fees, if any, as interest income in the Statement of Operations.
The fund compensates the Transfer Agent, under a transfer agency agreement, for providing transfer agency and cash management services for the fund. The majority of Transfer Agent fees are comprised of amounts paid on a per account basis, while cash management fees are related to fund subscriptions and redemptions. During the period ended October 31, 2022, the fund was charged $10,589 for transfer agency services. These fees are included in Shareholder servicing costs in the Statement of Operations. These fees were partially offset by earnings credits of $286.
The fund compensates the Custodian, under a custody agreement, for providing custodial services for the fund. These fees are determined based on net assets, geographic region and transaction activity. During the period ended October 31, 2022, the fund was charged $44,113 pursuant to the custody agreement.
During the period ended October 31, 2022, the fund was charged $17,405 for services performed by the fund’s Chief Compliance Officer and his staff. These fees are included in Chief Compliance Officer fees in the Statement of Operations.
The components of “Due to BNY Mellon Investment Adviser, Inc. and affiliates” in the Statement of Assets and Liabilities consist of: management fee of $196,301, Distribution Plan fees of $8,315, Shareholder Services
29
NOTES TO FINANCIAL STATEMENTS (continued)
Plan fees of $12,742, Custodian fees of $22,538, Chief Compliance Officer fees of $5,078 and Transfer Agent fees of $1,669.
(d) Each Board member also serves as a Board member of other funds in the BNY Mellon Family of Funds complex. Annual retainer fees and attendance fees are allocated to each fund based on net assets.
NOTE 4—Securities Transactions:
The aggregate amount of purchases and sales of investment securities, excluding short-term securities and forward foreign currency exchange contracts (“forward contracts”), during the period ended October 31, 2022, amounted to $200,990,158 and $158,276,964, respectively.
Derivatives: A derivative is a financial instrument whose performance is derived from the performance of another asset. The fund enters into International Swaps and Derivatives Association, Inc. Master Agreements or similar agreements (collectively, “Master Agreements”) with its over-the-counter (“OTC”) derivative contract counterparties in order to, among other things, reduce its credit risk to counterparties. Master Agreements include provisions for general obligations, representations, collateral and events of default or termination. Under a Master Agreement, the fund may offset with the counterparty certain derivative financial instruments’ payables and/or receivables with collateral held and/or posted and create one single net payment in the event of default or termination. The SEC recently adopted Rule 18f-4 under the Act, which, effective August 18, 2022, regulates the use of derivatives transactions for certain funds registered under the Act. The fund is deemed a “limited” derivatives user under the rule and is required to limit its derivatives exposure so that the total notional value of derivatives does not exceed 10% of fund’s net assets, and is subject to certain reporting requirements.
Each type of derivative instrument that was held by the fund during the period ended October 31, 2022 is discussed below.
Forward Foreign Currency Exchange Contracts: The fund enters into forward contracts in order to hedge its exposure to changes in foreign currency exchange rates on its foreign portfolio holdings, to settle foreign currency transactions or as a part of its investment strategy. When executing forward contracts, the fund is obligated to buy or sell a foreign currency at a specified rate on a certain date in the future. With respect to sales of forward contracts, the fund incurs a loss if the value of the contract increases between the date the forward contract is opened and the date the forward contract is closed. The fund realizes a gain if the value of the contract decreases between those dates. With respect to purchases of forward contracts, the fund incurs a loss if the value of the contract
30
decreases between the date the forward contract is opened and the date the forward contract is closed. The fund realizes a gain if the value of the contract increases between those dates. Any realized or unrealized gains or losses which occurred during the period are reflected in the Statement of Operations. The fund is exposed to foreign currency risk as a result of changes in value of underlying financial instruments. The fund is also exposed to credit risk associated with counterparty non-performance on these forward contracts, which is generally limited to the unrealized gain on each open contract. This risk may be mitigated by Master Agreements, if any, between the fund and the counterparty and the posting of collateral, if any, by the counterparty to the fund to cover the fund’s exposure to the counterparty. As of October 31, 2022 there were no forward contracts outstanding.
The following summarizes the average market value of derivatives outstanding during the period ended October 31, 2022:
| | | |
| | Average Market Value ($) |
Forward contracts | | 1,272,864 |
At October 31, 2022, the cost of investments for federal income tax purposes was $313,985,758; accordingly, accumulated net unrealized appreciation on investments was $7,564,675, consisting of $39,805,847 gross unrealized appreciation and $32,241,172 gross unrealized depreciation.
31
REPORT OF INDEPENDENT REGISTERED PUBLIC ACCOUNTING FIRM
To the Shareholders of the Fund and Board of Trustees of
BNY Mellon Investment Funds III:
Opinion on the Financial Statements
We have audited the accompanying statement of assets and liabilities of BNY Mellon Global Equity Income Fund (the Fund), a series of BNY Mellon Investment Funds III, including the statement of investments, as of October 31, 2022, the related statement of operations for the year then ended, the statements of changes in net assets for each of the years in the two-year period then ended, and the related notes (collectively, the financial statements), and the financial highlights for each of the years in the five-year period then ended. In our opinion, the financial statements and financial highlights present fairly, in all material respects, the financial position of the Fund as of October 31, 2022, the results of its operations for the year then ended, the changes in its net assets for each of the years in the two-year period then ended, and the financial highlights for each of the years in the five-year period then ended, in conformity with U.S. generally accepted accounting principles.
Basis for Opinion
These financial statements and financial highlights are the responsibility of the Fund’s management. Our responsibility is to express an opinion on these financial statements and financial highlights based on our audits. We are a public accounting firm registered with the Public Company Accounting Oversight Board (United States) (PCAOB) and are required to be independent with respect to the Fund in accordance with the U.S. federal securities laws and the applicable rules and regulations of the Securities and Exchange Commission and the PCAOB.
We conducted our audits in accordance with the standards of the PCAOB. Those standards require that we plan and perform the audit to obtain reasonable assurance about whether the financial statements and financial highlights are free of material misstatement, whether due to error or fraud. Our audits included performing procedures to assess the risks of material misstatement of the financial statements and financial highlights, whether due to error or fraud, and performing procedures that respond to those risks. Such procedures included examining, on a test basis, evidence regarding the amounts and disclosures in the financial statements and financial highlights. Such procedures also included confirmation of securities owned as of October 31, 2022, by correspondence with the custodian and brokers or by other appropriate auditing procedures when replies from brokers were not received. Our audits also included evaluating the accounting principles used and significant estimates made by management, as well as evaluating the overall presentation of the financial statements and financial highlights. We believe that our audits provide a reasonable basis for our opinion.

We have served as the auditor of one or more BNY Mellon Investment Adviser, Inc. investment companies since 1994.
New York, New York
December 23, 2022
32
IMPORTANT TAX INFORMATION (Unaudited)
For federal tax purposes, the fund elects to provide each shareholder with their portion of the fund’s income sourced from foreign countries and taxes paid from foreign countries. The fund reports the maximum amount allowable but not less than $5,887,243 as income sourced from foreign countries for the fiscal year ended October 31, 2022 in accordance with Section 853(c)(2) of the Internal Revenue Code and also the fund reports the maximum amount allowable but not less than $533,673 as taxes paid from foreign countries for the fiscal year ended October 31, 2022 in accordance with Section 853(a) of the Internal Revenue Code. Where required by federal tax rules, shareholders will receive notification of their proportionate share of foreign sourced income and foreign taxes paid for the 2022 calendar year with Form 1099-DIV which will be mailed in early 2023. Also the fund designates the maximum amount allowable, but not less than $7,970,624 as ordinary income dividends paid during the fiscal year ended October 31, 2022 as qualified dividend income in accordance with Section 854(b)(1)(B) of the Internal Revenue Code. Also, the fund reports the maximum amount allowable but not less than 46.98% of ordinary income dividends paid during the year ended October 31, 2022 as eligible for the corporate dividends received deduction provided under Section 243 of the Internal Revenue Code in accordance with Section 854(b)(1)(A) of the Internal Revenue Code. The fund also hereby reports $1.4355 per share as a long-term capital distributions and $.0637 per share as a short-term capital gain distribution paid December 16, 2021.
33
BOARD MEMBERS INFORMATION (Unaudited)
Independent Board Members
Joseph S. DiMartino (79)
Chairman of the Board (1999)
Principal Occupation During Past 5 Years:
· Director or Trustee of funds in the BNY Mellon Family of Funds and certain other entities (as described in the fund’s Statement of Additional Information) (1995-Present)
Other Public Company Board Memberships During Past 5 Years:
· CBIZ, Inc., a public company providing professional business services, products and solutions, Director (1997-Present)
No. of Portfolios for which Board Member Serves: 94
———————
Francine J. Bovich (71)
Board Member (2012)
Principal Occupation During Past 5 Years:
· The Bradley Trusts, private trust funds, Trustee (2011-Present)
Other Public Company Board Memberships During Past 5 Years:
· Annaly Capital Management, Inc., a real estate investment trust, Director (2014-Present)
No. of Portfolios for which Board Member Serves: 54
———————
Andrew J. Donohue (72)
Board Member (2019)
Principal Occupation During Past 5 Years:
· Attorney, Solo Law Practice (2019-Present)
· Shearman & Sterling LLP. a law firm, Of Counsel (2017-2019)
· Chief of Staff to the Chair of the SEC (2015-2017)
Other Public Company Board Memberships During Past 5 Years:
· Oppenheimer Funds (58 funds), Director (2017-2019)
No. of Portfolios for which Board Member Serves: 44
———————
34
Kenneth A. Himmel (76)
Board Member (1988)
Principal Occupation During Past 5 Years:
· Gulf Related, an international real estate development company, Managing Partner (2010-Present)
· Related Urban Development, a real estate development company, President and Chief Executive Officer (1996-Present)
· American Food Management, a restaurant company, Chief Executive Officer (1983-Present)
· Himmel & Company, a real estate development company, President and Chief Executive Officer (1980-Present)
No. of Portfolios for which Board Member Serves: 22
———————
Roslyn M. Watson (73)
Board Member (1992)
Principal Occupation During Past 5 Years:
· Watson Ventures, Inc., a real estate investment company, Principal (1993-Present)
Other Public Company Board Memberships During Past 5 Years:
· American Express Bank, FSB, Director (1993-2018)
No. of Portfolios for which Board Member Serves: 44
———————
Benaree Pratt Wiley (76)
Board Member (1998)
Principal Occupation During Past 5 Years:
· The Wiley Group, a firm specializing in strategy and business development, Principal (2005-Present)
Other Public Company Board Memberships During Past 5 Years:
· CBIZ, Inc., a public company providing professional business services, products and solutions, Director (2008-Present)
· Blue Cross-Blue Shield of Massachusetts, Director (2004-2020)
No. of Portfolios for which Board Member Serves: 61
———————
35
BOARD MEMBERS INFORMATION (Unaudited) (continued)
Interested Board Member
Bradley Skapyak (63)
Board Member (2021)
Principal Occupation During Past 5 Years:
· Chief Operating Officer and Director of The Dreyfus Corporation (2009-2019)
· Chief Executive Officer and Director of the Distributor (2016-2019)
· Chairman and Director of The Dreyfus Transfer Agent, Inc. (2011-2019)
· Senior Vice President of The Bank of New York Mellon (2007-2019)
No. of Portfolios for which Board Member Serves: 22
Mr. Skapyak is deemed to be an Interested Board Member of the fund as a result of his ownership of unvested restricted stock units of BNY Mellon.
———————
The address of the Board Members and Officers is c/o BNY Mellon Investment Adviser, Inc., 240 Greenwich Street, New York, New York 10286. Additional information about each Board Member is available in the fund’s Statement of Additional Information which can be obtained from the Adviser free of charge by calling this toll free number: 1-800-373-9387.
36
OFFICERS OF THE FUND (Unaudited)
DAVID DIPETRILLO, President since January 2021.
Vice President and Director of the Adviser since February 2021; Head of North America Product, BNY Mellon Investment Management since January 2018; and Director of Product Strategy, BNY Mellon Investment Management from January 2016 to December 2017. He is an officer of 55 investment companies (comprised of 109 portfolios) managed by the Adviser or an affiliate of the Adviser. He is 44 years old and has been an employee of BNY Mellon since 2005.
JAMES WINDELS, Treasurer since November 2001.
Vice President of the Adviser since September 2020; and Director–BNY Mellon Fund Administration. He is an officer of 56 investment companies (comprised of 130 portfolios) managed by the Adviser or an affiliate of the Adviser. He is 64 years old and has been an employee of the Adviser since April 1985.
PETER M. SULLIVAN, Chief Legal Officer since July 2021 and Vice President and Assistant Secretary since March 2019.
Chief Legal Officer of the Adviser and Associate General Counsel of BNY Mellon since July 2021; Senior Managing Counsel of BNY Mellon from December 2020 to July 2021; and Managing Counsel of BNY Mellon from March 2009 to December 2020. He is an officer of 56 investment companies (comprised of 130 portfolios) managed by the Adviser or an affiliate of the Adviser. He is 54 years old and has been an employee of BNY Mellon since April 2004.
JAMES BITETTO, Vice President since August 2005 and Secretary since February 2018.
Senior Managing Counsel of BNY Mellon since December 2019; Managing Counsel of BNY Mellon from April 2014 to December 2019; and Secretary of the Adviser. He is an officer of 56 investment companies (comprised of 130 portfolios) managed by the Adviser or an affiliate of the Adviser. He is 56 years old and has been an employee of the Adviser since December 1996.
DEIRDRE CUNNANE, Vice President and Assistant Secretary since March 2019.
Managing Counsel of BNY Mellon since December 2021, Counsel of BNY Mellon from August 2018 to December 2021; and Senior Regulatory Specialist at BNY Mellon Investment Management Services from February 2016 to August 2018. She is an officer of 56 investment companies (comprised of 130 portfolios) managed by the Adviser or an affiliate of the Adviser. She is 32 years old and has been an employee of the Adviser since August 2018.
SARAH S. KELLEHER, Vice President and Assistant Secretary since April 2014.
Vice President of BNY Mellon ETF Investment Adviser; LLC since February 2020; Senior Managing Counsel of BNY Mellon since September 2021; Managing Counsel of BNY Mellon from December 2017 to September 2021; and Senior Counsel of BNY Mellon from March 2013 to December 2017. She is an officer of 56 investment companies (comprised of 130 portfolios) managed by the Adviser or an affiliate of the Adviser. She is 47 years old and has been an employee of the Adviser since March 2013.
JEFF PRUSNOFSKY, Vice President and Assistant Secretary since August 2005.
Senior Managing Counsel of BNY Mellon. He is an officer of 56 investment companies (comprised of 130 portfolios) managed by the Adviser or an affiliate of the Adviser. He is 57 years old and has been an employee of the Adviser since October 1990.
AMANDA QUINN, Vice President and Assistant Secretary since March 2020.
Counsel of BNY Mellon since June 2019; Regulatory Administration Manager at BNY Mellon Investment Management Services from September 2018 to May 2019; and Senior Regulatory Specialist at BNY Mellon Investment Management Services from April 2015 to August 2018. She is an officer of 56 investment companies (comprised of 130 portfolios) managed by the Adviser or an affiliate of the Adviser. She is 37 years old and has been an employee of the Adviser since June 2019.
37
OFFICERS OF THE FUND (Unaudited) (continued)
NATALYA ZELENSKY, Vice President and Assistant Secretary since March 2017.
Chief Compliance Officer since August 2021 and Vice President since February 2020 of BNY Mellon ETF Investment Adviser, LLC; Chief Compliance Officer since August 2021 and Vice President and Assistant Secretary since February 2020 of BNY Mellon ETF Trust; Managing Counsel of BNY Mellon from December 2019 to August 2021; Counsel of BNY Mellon from May 2016 to December 2019; and Assistant Secretary of the Adviser from April 2018 to August 2021. She is an officer of 55 investment companies (comprised of 129 portfolios) managed by the Adviser or an affiliate of the Adviser. She is 37 years old and has been an employee of BNY Mellon since May 2016.
DANIEL GOLDSTEIN, Vice President since March 2022.
Vice President and Head of Product Development of North America Product, BNY Mellon Investment Management since January 2018; Co-Head of Product Management, Development & Oversight of North America Product, BNY Mellon Investment Management from January 2010 to January 2018; and Senior Vice President, Development & Oversight of North America Product, BNY Mellon Investment Management since 2010. He is an officer of 55 investment companies (comprised of 109 portfolios) managed by the Adviser or an affiliate of the Adviser. He is 53 years old and has been an employee of the Distributor since 1991.
JOSEPH MARTELLA, Vice President since March 2022.
Vice President and Head of Product Management of North America Product, BNY Mellon Investment Management since January 2018; Director of Product Research and Analytics of North America Product, BNY Mellon Investment Management from January 2010 to January 2018; and Senior Vice President of North America Product, BNY Mellon Investment Management since 2010. He is an officer of 55 investment companies (comprised of 109 portfolios) managed by the Adviser or an affiliate of the Adviser. He is 46 years old and has been an employee of the Distributor since 1999.
GAVIN C. REILLY, Assistant Treasurer since December 2005.
Tax Manager–BNY Mellon Fund Administration. He is an officer of 56 investment companies (comprised of 130 portfolios) managed by the Adviser or an affiliate of the Adviser. He is 54 years old and has been an employee of the Adviser since April 1991.
ROBERT SALVIOLO, Assistant Treasurer since July 2007.
Senior Accounting Manager–BNY Mellon Fund Administration. He is an officer of 56 investment companies (comprised of 130 portfolios) managed by the Adviser or an affiliate of the Adviser. He is 55 years old and has been an employee of the Adviser since June 1989.
ROBERT SVAGNA, Assistant Treasurer since December 2002.
Senior Accounting Manager–BNY Mellon Fund Administration. He is an officer of 56 investment companies (comprised of 130 portfolios) managed by the Adviser or an affiliate of the Adviser. He is 55 years old and has been an employee of the Adviser since November 1990.
JOSEPH W. CONNOLLY, Chief Compliance Officer since October 2004.
Chief Compliance Officer of the BNY Mellon Family of Funds and BNY Mellon Funds Trust since 2004; and Chief Compliance Officer of the Adviser from 2004 until June 2021. He is an officer of 55 investment companies (comprised of 115 portfolios) managed by the Adviser. He is 65 years old.
CARIDAD M. CAROSELLA, Anti-Money Laundering Compliance Officer since January 2016.
Anti-Money Laundering Compliance Officer of the BNY Mellon Family of Funds and BNY Mellon Funds Trust. She is an officer of 48 investment companies (comprised of 122 portfolios) managed by the Adviser or an affiliate of the Adviser. She is 54 years old and has been an employee of the Distributor since 1997.
38
This page intentionally left blank.
39
This page intentionally left blank.
40
This page intentionally left blank.
41
BNY Mellon Global Equity Income Fund
240 Greenwich Street
New York, NY 10286
Adviser
BNY Mellon Investment Adviser, Inc.
240 Greenwich Street
New York, NY 10286
Sub-Adviser
Newton Investment Management Limited
160 Queen Victoria Street
London, EC4V, 4LA, UK
Custodian
The Bank of New York Mellon
240 Greenwich Street
New York, NY 10286
Transfer Agent &
Dividend Disbursing Agent
BNY Mellon Transfer, Inc.
240 Greenwich Street
New York, NY 10286
Distributor
BNY Mellon Securities Corporation
240 Greenwich Street
New York, NY 10286
| | |
Ticker Symbols: | Class A: DEQAX Class C: DEQCX Class I: DQEIX Class Y: DEQYX |
Telephone Call your financial representative or 1-800-373-9387
Mail The BNY Mellon Family of Funds, 144 Glenn Curtiss Boulevard, Uniondale, NY 11556-0144
E-mail Send your request to info@bnymellon.com
Internet Information can be viewed online or downloaded at www.im.bnymellon.com
The fund files its complete schedule of portfolio holdings with the Securities and Exchange Commission (“SEC”) for the first and third quarters of each fiscal year on Form N-PORT. The fund’s Forms N-PORT are available on the SEC’s website at www.sec.gov.
A description of the policies and procedures that the fund uses to determine how to vote proxies relating to portfolio securities and information regarding how the fund voted these proxies for the most recent 12-month period ended June 30 is available at www.im.bnymellon.com and on the SEC’s website at www.sec.gov and without charge, upon request, by calling 1-800-373-9387.
| | |
© 2022 BNY Mellon Securities Corporation
6175AR1022 | 
|
BNY Mellon International Bond Fund
| |
ANNUAL REPORT October 31, 2022 |
| |
Save time. Save paper. View your next shareholder report online as soon as it’s available. Log into www.im.bnymellon.com and sign up for eCommunications. It’s simple and only takes a few minutes. |
| |
The views expressed in this report reflect those of the portfolio manager(s) only through the end of the period covered and do not necessarily represent the views of BNY Mellon Investment Adviser, Inc. or any other person in the BNY Mellon Investment Adviser, Inc. organization. Any such views are subject to change at any time based upon market or other conditions and BNY Mellon Investment Adviser, Inc. disclaims any responsibility to update such views. These views may not be relied on as investment advice and, because investment decisions for a fund in the BNY Mellon Family of Funds are based on numerous factors, may not be relied on as an indication of trading intent on behalf of any fund in the BNY Mellon Family of Funds. |
| |
Not FDIC-Insured • Not Bank-Guaranteed • May Lose Value |
Contents
THE FUND
FOR MORE INFORMATION
Back Cover
DISCUSSION OF FUND PERFORMANCE (Unaudited)
For the period from November 1, 2021, through October 31, 2022, as provided by Nathaniel Hyde, CFA, Brendan Murphy, CFA and Scott Zaleski, CFA, Portfolio Managers employed by the fund’s sub-adviser, Insight North America LLC (“INA”).
Market and Fund Performance Overview
For the 12-month period ended October 31, 2022, the BNY Mellon International Bond Fund’s (the “fund”) Class A shares produced a total return of −23.48%, Class C shares returned −24.08%, Class I shares returned −23.26% and Class Y shares returned −23.19%.1 In comparison, the fund’s benchmark, the Bloomberg Global Aggregate ex USD Index (Unhedged) (the “Index”), produced a total return of −24.59% for the same period.2
International bonds lost ground during the period primarily as a result of sharply rising interest rates and increasing strength in the U.S. dollar. The fund outperformed the Index, largely due to effective interest-rate and foreign-currency positioning.
The Fund’s Investment Approach
The fund seeks to maximize total return through capital appreciation and income. To pursue its goal, the fund normally invests at least 80% of its net assets, plus any borrowings for investment purposes, in fixed-income securities. The fund also normally invests at least 65% of its assets in non-U.S. dollar-denominated, fixed-income securities of foreign governments and companies located in various countries, including emerging markets.
Generally, the fund seeks to maintain a portfolio with an average credit quality of investment grade. The fund’s portfolio managers focus on identifying undervalued government bond markets, currencies, sectors and securities and look for fixed-income securities with the most potential for added value, such as those involving the potential for credit upgrades, unique structural characteristics or innovative features. The portfolio managers select securities for the fund’s portfolio by using fundamental economic research and quantitative analysis to allocate assets among countries and currencies, focusing on sectors and individual securities that appear to be relatively undervalued, and actively trading among sectors.
Interest Rate Hikes Undermine Bond Markets
International bond investors faced turbulent geopolitical, macro-economic and market conditions during the reporting period. Inflationary pressures increased early in the period due to pandemic-related government stimulus and accommodative monetary policies, along with rising commodity prices and supply-chain bottlenecks. These pressures intensified in February 2022 when Russia attacked Ukraine, causing already elevated energy and commodity prices to spike higher. Outbreaks of the Omicron variant of COVID-19 led to lockdowns of varying severity and duration across the globe, particularly in China, interrupting economic activity while adding to supply-chain strains and further exacerbating inflation. Despite the risks to growth from war and pandemic, central banks felt compelled to act to try to curb inflation. Numerous rate increases took place globally, with more priced in by financial markets. Several central banks also began the process of quantitative tightening. These conditions produced a distinctly unfavorable backdrop for bonds, which fell sharply in value, with no real safe havens. International bond prices were further
2
undermined in U.S. dollar terms by the steadily rising value of the U.S. dollar relative to most of the world’s currencies.
Interest-Rate and Currency Positioning Enhance Relative Returns
The fund’s returns fell subject to the same broadly negative forces as the rest of the international bond market. However, returns relative to the Index were bolstered by favorable interest-rate positioning, which contributed approximately 150 basis points of excess return distributed throughout the period. (One basis point equals 0.01%.) Specifically, the fund benefited from short duration positions in the United States and UK, and, to a lesser extent, short positions in Europe. This positioning reflected our belief that the potential for central bank rate hikes was underappreciated by the market. As a result, the fund was affected by rapidly increasing inflationary pressures less severely than the Index. As the market priced in more aggressive central bank tightening, we gradually covered some of the fund’s short duration positioning. Local emerging markets positioning also contributed positively due to underweight holdings during most of the period. Small, long U.S. dollar positions held during the period added modestly to relative performance as well.
On the other hand, the fund’s positioning across spread sectors generally detracted from relative returns. In particular, the fund held mildly overweight exposure to corporate credit throughout the period in light of attractive valuations and in the expectation that monetary tightening would occur more gradually than it did. However, rapid interest-rate increases caused spreads on global corporate credit to nearly double during the period, undermining the performance of the fund’s position. A few other positions in local markets, including those of Australia, Japan and Mexico, also detracted from relative performance, but were generally balanced positions in other markets.
The fund used derivatives extensively, both to manage risk and to adopt active positions. The types of derivatives used by the fund included futures and interest-rate swaps, currency forwards and credit index products.
Growing More Constructive on Duration and Risk
In the wake of the U.S. Federal Reserve’s (the “Fed”) most aggressive series of rate hikes in four decades, we believe U.S. monetary policy has tightened enough to slow the economy meaningfully in the coming months, although the evidence does not yet indicate that a shift toward a more benign environment has begun. Nevertheless, we expect the pace of further tightening to ease going forward, potentially providing a favorable environment for fixed-income assets going forward. In addition, a moderation of the Fed’s program of tightening will likely reduce upward pressure on the U.S. dollar versus other countries’ currencies, creating more attractive fixed income investment opportunities in local developed and emerging markets.
Given this outlook, we have begun increasing the fund’s duration and risk exposure. Specifically, we have covered the fund’s underweight position in developed-market duration, moving to a neutral position as of the end of the reporting period, and with an eye toward further increasing exposure as investment opportunities present themselves. The fund
3
DISCUSSION OF FUND PERFORMANCE (Unaudited) (continued)
currently holds mildly overweight exposure to local emerging markets, where central banks have generally moved ahead of developed markets to begin reducing inflation.
November 15, 2022
1 Total return includes reinvestment of dividends and any capital gains paid and does not take into consideration the maximum initial sales charge in the case of Class A shares or the applicable contingent deferred sales charge imposed on redemptions in the case of Class C shares. Had these charges been reflected, returns would have been lower. Class I and Class Y shares are not subject to any initial or deferred sales charge. Past performance is no guarantee of future results. Share price and investment return fluctuate such that upon redemption, fund shares may be worth more or less than their original cost. The fund’s return reflects the absorption of certain fund expenses by BNY Mellon Investment Adviser, Inc. pursuant to an agreement in effect through March 1, 2023, at which time it may be extended, modified or terminated. Had these expenses not been absorbed, returns would have been lower.
2 Source: Lipper Inc. — The Bloomberg Global Aggregate ex USD Index (Unhedged) is a flagship measure of global investment grade debt from 24 local currency markets, excluding U.S. dollar-denominated bonds. This multi-currency benchmark includes treasury, government-related, corporate and securitized fixed-rate bonds from both developed- and emerging-market issuers. Investors cannot invest directly in any index.
Bonds are subject generally to interest-rate, credit, liquidity and market risks, to varying degrees, all of which are more fully described in the fund’s prospectus. Generally, all other factors being equal, bond prices are inversely related to interest-rate changes, and rate increases can cause price declines.
Recent market risks include pandemic risks related to COVID-19. The effects of COVID-19 have contributed to increased volatility in global markets and will likely affect certain countries, companies, industries and market sectors more dramatically than others. To the extent the fund may overweight its investments in certain countries, companies, industries or market sectors, such positions will increase the fund’s exposure to risk of loss from adverse developments affecting those countries, companies, industries or sectors.
High yield bonds are subject to increased credit risk and are considered speculative in terms of the issuer’s perceived ability to continue making interest payments on a timely basis and to repay principal upon maturity.
Foreign bonds are subject to special risks, including exposure to currency fluctuations, changing political and economic conditions and potentially less liquidity. These risks are generally greater with emerging-market countries than with more economically and politically established foreign countries.
The fund may, but is not required to, use derivative instruments. A small investment in derivatives could have a potentially large impact on the fund’s performance. The use of derivatives involves risks different from, or possibly greater than, the risks associated with investing directly in the underlying assets.
Investments in foreign currencies are subject to the risk that those currencies will decline in value relative to the U.S. dollar, or, in the case of hedged positions, that the U.S. dollar will decline relative to the currency being hedged. Currency rates in foreign countries may fluctuate significantly over short periods of time. A decline in the value of foreign currencies relative to the U.S. dollar will reduce the value of securities held by the fund and denominated in those currencies. The use of leverage may magnify the fund’s gains or losses. For derivatives with a leveraging component, adverse changes in the value or level of the underlying asset can result in a loss that is much greater than the original investment in the derivative.
4
FUND PERFORMANCE (Unaudited)
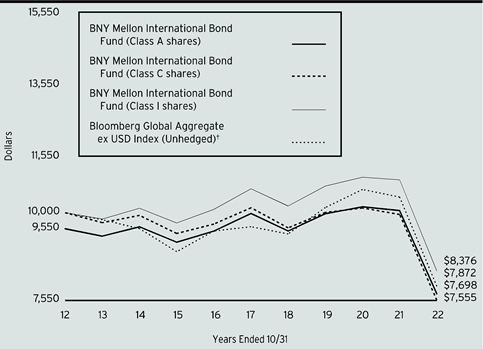
Comparison of change in value of a $10,000 investment in Class A shares, Class C shares and Class I shares of BNY Mellon International Bond Fund with a hypothetical investment of $10,000 in the Bloomberg Global Aggregate ex USD Index (Unhedged) (the “Index”).
† Source: Lipper Inc.
Past performance is not predictive of future performance.
The above graph compares a hypothetical investment of $10,000 made in Class A shares, Class C shares, and Class I shares of BNY Mellon International Bond Fund on 10/31/12 to a hypothetical investment of $10,000 made in the Index on that date. All dividends and capital gain distributions are reinvested.
The fund’s performance shown in the line graph above takes into account the maximum initial sales charge on Class A shares and all other applicable fees and expenses on all classes. The Index is a flagship measure of global investment-grade debt from 24 local currency markets, excluding U.S. dollar-denominated bonds. This multi-currency benchmark includes treasury, government-related, corporate and securitized fixed-rate bonds from both developed and emerging markets issuers. Unlike a mutual fund, the Index is not subject to charges, fees and other expenses. Investors cannot invest directly in any index. Further information relating to fund performance, including expense reimbursements, if applicable, is contained in the Financial Highlights section of the prospectus and elsewhere in this report.
5
FUND PERFORMANCE (Unaudited) (continued)
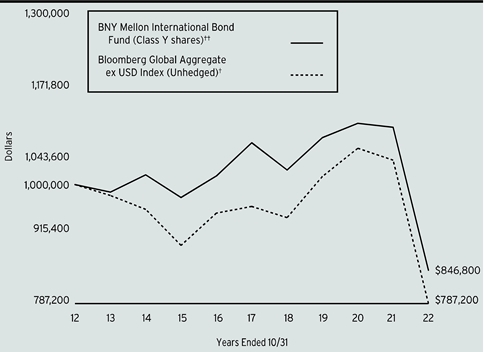
Comparison of change in value of a $1,000,000 investment in Class Y shares of BNY Mellon International Bond Fund with a hypothetical investment of $1,000,000 in the Bloomberg Global Aggregate ex USD Index (Unhedged) (the “Index”).
† Source: Lipper Inc.
†† The total return figures presented for Class Y shares of the fund reflect the performance of the fund’s Class A shares for the period prior to 7/1/13 (the inception date for Class Y shares), not reflecting the applicable sales charges for Class A shares.
Past performance is not predictive of future performance.
The above graph compares a hypothetical investment of $1,000,000 made in Class Y shares of BNY Mellon International Bond Fund on 10/31/12 to a hypothetical investment of $1,000,000 made in the Index on that date. All dividends and capital gain distributions are reinvested.
The fund’s performance shown in the line graph above takes into account all applicable fees and expenses of the fund’s Class Y shares. The Index is a flagship measure of global investment-grade debt from 24 local currency markets, excluding U.S. dollar-denominated bonds. This multi-currency benchmark includes treasury, government-related, corporate and securitized fixed-rate bonds from both developed and emerging markets issuers. Unlike a mutual fund, the Index is not subject to charges, fees and other expenses. Investors cannot invest directly in any index. Further information relating to fund performance, including expense reimbursements, if applicable, is contained in the Financial Highlights section of the prospectus and elsewhere in this report.
6
| | | | | |
Average Annual Total Returns as of 10/31/2022 |
| Inception | 1 Year | 5 Years | 10 Years |
Date |
Class A shares | | | | |
with maximum sales charge (4.50%) | 12/30/05 | -26.93% | -5.93% | -2.58% |
without sales charge | 12/30/05 | -23.48% | -5.06% | -2.13% |
Class C shares | | | | |
with applicable redemption charge† | 12/30/05 | -24.83% | -5.72% | -2.77% |
without redemption | 12/30/05 | -24.08% | -5.72% | -2.77% |
Class I shares | 12/30/05 | -23.26% | -4.73% | -1.76% |
Class Y shares | 7/1/13 | -23.19% | -4.66% | -1.65%†† |
Bloomberg Global Aggregate | | | | |
ex USD Index (Unhedged) | | -24.59% | -3.91% | -2.36% |
† The maximum contingent deferred sales charge for Class C shares is 1% for shares redeemed within one year of the date of purchase.
†† The total return performance figures presented for Class Y shares of the fund reflect the performance of the fund’s Class A shares for the period prior to 7/1/13 (the inception date for Class Y shares), not reflecting the applicable sales charges for Class A shares.
The performance data quoted represents past performance, which is no guarantee of future results. Share price and investment return fluctuate and an investor’s shares may be worth more or less than original cost upon redemption. Current performance may be lower or higher than the performance quoted. Go to www.im.bnymellon.com for the fund’s most recent month-end returns.
The fund’s performance shown in the graphs and table does not reflect the deduction of taxes that a shareholder would pay on fund distributions or the redemption of fund shares. In addition to the performance of Class A shares shown with and without a maximum sales charge, the fund's performance shown in the table takes into account all other applicable fees and expenses on all classes
7
UNDERSTANDING YOUR FUND’S EXPENSES (Unaudited)
As a mutual fund investor, you pay ongoing expenses, such as management fees and other expenses. Using the information below, you can estimate how these expenses affect your investment and compare them with the expenses of other funds. You also may pay one-time transaction expenses, including sales charges (loads) and redemption fees, which are not shown in this section and would have resulted in higher total expenses. For more information, see your fund’s prospectus or talk to your financial adviser.
Review your fund’s expenses
The table below shows the expenses you would have paid on a $1,000 investment in BNY Mellon International Bond Fund from May 1, 2022 to October 31, 2022. It also shows how much a $1,000 investment would be worth at the close of the period, assuming actual returns and expenses.
| | | | | | | |
Expenses and Value of a $1,000 Investment | |
Assume actual returns for the six months ended October 31, 2022 | |
| | | | | | |
| | Class A | Class C | Class I | Class Y | |
Expenses paid per $1,000† | $4.81 | $8.53 | $3.54 | $3.07 | |
Ending value (after expenses) | $872.30 | $869.20 | $873.80 | $873.60 | |
COMPARING YOUR FUND’S EXPENSES WITH THOSE OF OTHER FUNDS (Unaudited)
Using the SEC’s method to compare expenses
The Securities and Exchange Commission (“SEC”) has established guidelines to help investors assess fund expenses. Per these guidelines, the table below shows your fund’s expenses based on a $1,000 investment, assuming a hypothetical 5% annualized return. You can use this information to compare the ongoing expenses (but not transaction expenses or total cost) of investing in the fund with those of other funds. All mutual fund shareholder reports will provide this information to help you make this comparison. Please note that you cannot use this information to estimate your actual ending account balance and expenses paid during the period.
| | | | | | | |
Expenses and Value of a $1,000 Investment | |
Assuming a hypothetical 5% annualized return for the six months ended October 31, 2022 | |
| | | | | | |
| | Class A | Class C | Class I | Class Y | |
Expenses paid per $1,000† | $5.19 | $9.20 | $3.82 | $3.31 | |
Ending value (after expenses) | $1,020.06 | $1,016.08 | $1,021.42 | $1,021.93 | |
† | Expenses are equal to the fund’s annualized expense ratio of 1.02% for Class A, 1.81% for Class C, .75% for Class I and .65% for Class Y, multiplied by the average account value over the period, multiplied by 184/365 (to reflect the one-half year period). |
8
STATEMENT OF INVESTMENTS
October 31, 2022
| | | | | | | | | | |
| |
Description | Coupon
Rate (%) | | Maturity
Date | | Principal
Amount ($) | a | Value ($) | |
Bonds and Notes - 98.5% | | | | | |
Australia - 3.4% | | | | | |
Australia, Bonds, Ser. 158 | AUD | 1.25 | | 5/21/2032 | | 12,008,000 | | 6,156,703 | |
Australia, Sr. Unscd. Bonds, Ser. 150 | AUD | 3.00 | | 3/21/2047 | | 685,000 | | 363,649 | |
| | 6,520,352 | |
Austria - .6% | | | | | |
Austria, Sr. Unscd. Bonds | EUR | 2.02 | | 10/20/2028 | | 500,000 | b | 425,069 | |
Raiffeisen Bank International AG, Sr. Unscd. Notes | EUR | 0.05 | | 9/1/2027 | | 300,000 | | 231,864 | |
Raiffeisen Bank International AG, Sub. Notes | EUR | 2.88 | | 6/18/2032 | | 600,000 | | 453,032 | |
| | 1,109,965 | |
Bermuda - .4% | | | | | |
Textainer Marine Containers VII Ltd., Ser. 2021-1A, Cl. A | | 1.68 | | 2/20/2046 | | 931,667 | b | 771,322 | |
Canada - 3.5% | | | | | |
BMW Canada Auto Trust, Ser. 2021-1A, Cl. A3 | CAD | 0.76 | | 12/20/2025 | | 1,175,000 | b | 822,763 | |
Canada, Bonds | CAD | 2.00 | | 12/1/2051 | | 3,075,000 | | 1,696,323 | |
CNH Capital Canada Receivables Trust, Ser. 2021-1A, Cl. A2 | CAD | 1.00 | | 11/16/2026 | | 851,857 | b | 596,648 | |
Ford Auto Securitization Trust, Ser. 2020-AA, Cl. A3 | CAD | 1.15 | | 11/15/2025 | | 1,075,000 | b | 750,255 | |
Ford Auto Securitization Trust II, Ser. 2022-AA, Cl. A3 | CAD | 5.40 | | 9/15/2028 | | 1,107,000 | b | 815,378 | |
GMF Canada Leasing Trust, Ser. 2020-1A, Cl. A3 | CAD | 1.05 | | 11/20/2025 | | 326,654 | b | 238,353 | |
GMF Canada Leasing Trust, Ser. 2021-1A, Cl. A3 | CAD | 0.87 | | 5/20/2026 | | 1,125,000 | b | 808,784 | |
MBarc Credit Canada Inc., Ser. 2021-AA, Cl. A3 | CAD | 0.93 | | 2/17/2026 | | 875,000 | b | 617,699 | |
The Toronto-Dominion Bank, Sr. Unscd. Notes | EUR | 1.95 | | 4/8/2030 | | 387,000 | | 326,263 | |
| | 6,672,466 | |
China - 4.6% | | | | | |
China, Bonds | CNY | 3.73 | | 5/25/2070 | | 35,150,000 | | 5,442,993 | |
China, Unscd. Bonds | CNY | 3.81 | | 9/14/2050 | | 21,600,000 | | 3,330,280 | |
| | 8,773,273 | |
France - 8.0% | | | | | |
BNP Paribas SA, Sr. Unscd. Notes | EUR | 0.88 | | 7/11/2030 | | 1,300,000 | | 1,002,971 | |
BNP Paribas SA, Sr. Unscd. Notes | EUR | 2.10 | | 4/7/2032 | | 700,000 | | 553,336 | |
BPCE SA, Sr. Unscd. Bonds | EUR | 0.25 | | 1/14/2031 | | 400,000 | | 290,335 | |
BPCE SA, Sr. Unscd. Notes | EUR | 2.38 | | 4/26/2032 | | 500,000 | | 425,792 | |
9
STATEMENT OF INVESTMENTS (continued)
| | | | | | | | | | |
| |
Description | Coupon
Rate (%) | | Maturity
Date | | Principal
Amount ($) | a | Value ($) | |
Bonds and Notes - 98.5% (continued) | | | | | |
France - 8.0% (continued) | | | | | |
Credit Agricole Home Loan SFH SA, Covered Notes | EUR | 1.25 | | 3/24/2031 | | 1,600,000 | | 1,365,249 | |
Electricite de France SA, Jr. Sub. Notes | EUR | 2.63 | | 12/1/2027 | | 1,400,000 | c | 920,773 | |
France, Bonds | EUR | 6.36 | | 5/25/2032 | | 11,525,000 | | 8,900,552 | |
Orano SA, Sr. Unscd. Notes | EUR | 2.75 | | 3/8/2028 | | 500,000 | | 436,661 | |
Orano SA, Sr. Unscd. Notes | EUR | 4.88 | | 9/23/2024 | | 200,000 | | 201,165 | |
Suez SACA, Sr. Unscd. Notes | EUR | 2.38 | | 5/24/2030 | | 1,300,000 | | 1,095,539 | |
Suez SACA, Sr. Unscd. Notes | EUR | 2.88 | | 5/24/2034 | | 100,000 | | 81,011 | |
| | 15,273,384 | |
Germany - 9.6% | | | | | |
BASF SE, Sr. Unscd. Notes | EUR | 1.50 | | 3/17/2031 | | 200,000 | | 163,260 | |
Bundesobligation, Bonds, Ser. 185 | EUR | 0.10 | | 4/16/2027 | | 8,525,000 | | 7,712,402 | |
Bundesrepublik Deutschland Bundesanleihe, Bonds | EUR | 4.20 | | 8/15/2029 | | 700,000 | | 603,508 | |
Bundesrepublik Deutschland Bundesanleihe, Sr. Unscd. Bonds | EUR | 3.24 | | 8/15/2052 | | 6,120,000 | | 3,216,374 | |
Deutsche Bundesrepublik, Bonds | EUR | 0.10 | | 4/15/2033 | | 4,141,340 | d | 4,231,846 | |
Eurogrid GmbH, Gtd. Notes | EUR | 0.74 | | 4/21/2033 | | 1,400,000 | | 1,011,934 | |
Vonovia SE, Sr. Unscd. Notes | EUR | 0.75 | | 9/1/2032 | | 800,000 | | 507,114 | |
Vonovia SE, Sr. Unscd. Notes | EUR | 2.38 | | 3/25/2032 | | 1,200,000 | | 927,254 | |
| | 18,373,692 | |
Indonesia - .5% | | | | | |
Indonesia Treasury Bond, Bonds | IDR | 7.50 | | 4/15/2040 | | 15,580,000,000 | | 985,193 | |
Ireland - 1.2% | | | | | |
Hammerson Ireland Finance DAC, Gtd. Notes | EUR | 1.75 | | 6/3/2027 | | 1,400,000 | | 993,883 | |
Ireland, Bonds | EUR | 2.00 | | 2/18/2045 | | 1,610,000 | | 1,325,069 | |
| | 2,318,952 | |
Italy - 1.1% | | | | | |
Banco BPM SPA, Sub. Notes | EUR | 2.88 | | 6/29/2031 | | 200,000 | | 157,154 | |
Banco BPM SPA, Sub. Notes | EUR | 3.38 | | 1/19/2032 | | 200,000 | | 154,671 | |
Italy Buoni Poliennali Del Tesoro, Sr. Unscd. Bonds, Ser. CAC | EUR | 2.45 | | 9/1/2050 | | 2,460,000 | b | 1,692,494 | |
| | 2,004,319 | |
Japan - 20.3% | | | | | |
Japan (10 Year Issue), Bonds, Ser. 367 | JPY | 0.20 | | 6/20/2032 | | 314,000,000 | | 2,104,959 | |
Japan (2 Year Issue), Bonds, Ser. 422 | JPY | 0.10 | | 3/1/2023 | | 1,600,000,000 | | 10,771,003 | |
Japan (20 Year Issue), Bonds, Ser. 156 | JPY | 0.40 | | 3/20/2036 | | 1,788,350,000 | | 11,702,987 | |
Japan (30 Year Issue), Bonds, Ser. 66 | JPY | 0.40 | | 3/20/2050 | | 1,272,500,000 | | 6,720,879 | |
Japan (5 Year Issue), Bonds, Ser. 136 | JPY | 0.10 | | 6/20/2023 | | 1,105,000,000 | | 7,442,479 | |
| | 38,742,307 | |
10
| | | | | | | | | | |
| |
Description | Coupon
Rate (%) | | Maturity
Date | | Principal
Amount ($) | a | Value ($) | |
Bonds and Notes - 98.5% (continued) | | | | | |
Luxembourg - .1% | | | | | |
DH Europe Finance II Sarl, Gtd. Bonds | EUR | 0.20 | | 3/18/2026 | | 280,000 | | 249,193 | |
Mexico - 2.4% | | | | | |
Braskem Idesa SAPI, Sr. Scd. Notes | | 6.99 | | 2/20/2032 | | 275,000 | b | 184,606 | |
Mexico, Bonds, Ser. M | MXN | 7.75 | | 5/29/2031 | | 100,000,000 | | 4,447,728 | |
| | 4,632,334 | |
Netherlands - 2.1% | | | | | |
ABN AMRO Bank NV, Sr. Unscd. Notes | EUR | 0.50 | | 9/23/2029 | | 1,000,000 | | 770,452 | |
EDP Finance BV, Gtd. Notes | | 6.30 | | 10/11/2027 | | 245,000 | b | 244,177 | |
Enel Finance International NV, Gtd. Notes | EUR | 0.38 | | 6/17/2027 | | 690,000 | | 572,136 | |
Enel Finance International NV, Gtd. Notes | | 7.50 | | 10/14/2032 | | 510,000 | b | 511,527 | |
Enel Finance International NV, Gtd. Notes | | 7.75 | | 10/14/2052 | | 200,000 | b | 192,084 | |
ING Groep NV, Sr. Unscd. Notes | EUR | 0.88 | | 11/29/2030 | | 1,200,000 | | 912,557 | |
ING Groep NV, Sr. Unscd. Notes | EUR | 1.75 | | 2/16/2031 | | 500,000 | | 402,631 | |
Vonovia Finance BV, Gtd. Notes | EUR | 0.50 | | 9/14/2029 | | 100,000 | | 71,415 | |
Wintershall Dea Finance BV, Gtd. Bonds | EUR | 1.33 | | 9/25/2028 | | 300,000 | | 243,975 | |
| | 3,920,954 | |
New Zealand - .3% | | | | | |
New Zealand, Bonds, Ser. 433 | NZD | 3.50 | | 4/14/2033 | | 1,144,000 | | 627,544 | |
Romania - .4% | | | | | |
Romania, Bonds | EUR | 3.62 | | 5/26/2030 | | 550,000 | b | 428,036 | |
Romania, Sr. Unscd. Notes | EUR | 2.50 | | 2/8/2030 | | 405,000 | b | 293,894 | |
| | 721,930 | |
Singapore - .6% | | | | | |
Singapore, Bonds | SGD | 2.63 | | 5/1/2028 | | 1,710,000 | | 1,166,777 | |
South Africa - 1.0% | | | | | |
South Africa, Sr. Unscd. Bonds, Ser. 2035 | ZAR | 8.88 | | 2/28/2035 | | 41,161,000 | | 1,828,394 | |
South Korea - 1.7% | | | | | |
Korea Treasury Bond, Bonds | KRW | 3.13 | | 9/10/2052 | | 5,600,000,000 | | 3,275,158 | |
Spain - 3.3% | | | | | |
Ibercaja Banco SA, Sub. Notes | EUR | 2.75 | | 7/23/2030 | | 900,000 | | 729,328 | |
Spain, Sr. Unscd. Bonds | EUR | 0.70 | | 4/30/2032 | | 6,975,000 | b | 5,524,099 | |
| | 6,253,427 | |
Supranational - .9% | | | | | |
JBS USA, Gtd. Notes | | 3.63 | | 1/15/2032 | | 800,000 | b | 621,164 | |
The African Export-Import Bank, Sr. Unscd. Notes | | 5.25 | | 10/11/2023 | | 1,070,000 | | 1,052,644 | |
| | 1,673,808 | |
11
STATEMENT OF INVESTMENTS (continued)
| | | | | | | | | | |
| |
Description | Coupon
Rate (%) | | Maturity
Date | | Principal
Amount ($) | a | Value ($) | |
Bonds and Notes - 98.5% (continued) | | | | | |
Sweden - .3% | | | | | |
Sweden, Bonds, Ser. 1056 | SEK | 2.25 | | 6/1/2032 | | 6,825,000 | | 622,126 | |
Switzerland - 1.9% | | | | | |
Credit Suisse Group AG, Sr. Unscd. Notes | | 6.54 | | 8/12/2033 | | 1,532,000 | b | 1,335,477 | |
Swiss Confederation, Bonds | CHF | 0.50 | | 6/27/2032 | | 1,600,000 | | 1,509,437 | |
UBS Group AG, Sr. Unscd. Notes | EUR | 0.88 | | 11/3/2031 | | 1,082,000 | | 788,844 | |
| | 3,633,758 | |
Thailand - .1% | | | | | |
Thaioil Treasury Center Ltd., Gtd. Notes | | 5.38 | | 11/20/2048 | | 212,000 | | 147,021 | |
United Arab Emirates - .4% | | | | | |
Mamoura Diversified Global Holding Ltd., Gtd. Notes | | 2.50 | | 11/7/2024 | | 755,000 | | 716,235 | |
United Kingdom - 11.3% | | | | | |
BAT International Finance PLC, Gtd. Notes | EUR | 2.25 | | 1/16/2030 | | 395,000 | | 303,274 | |
Brass No. 10 PLC, Ser. 10-A, Cl. A1 | | 0.67 | | 4/16/2069 | | 262,374 | b | 247,895 | |
British American Tobacco PLC, Sub. Notes | EUR | 3.00 | | 9/27/2026 | | 700,000 | c | 520,797 | |
Gemgarto PLC, Ser. 2021-1A, Cl. A, 3 Month SONIO +0.59% | GBP | 2.71 | | 12/16/2067 | | 645,633 | b,e | 725,341 | |
Lanark Master Issuer PLC, Ser. 2020-1A, Cl. 2A, 3 Month SONIO +0.57% | GBP | 2.56 | | 12/22/2069 | | 666,250 | b,e | 762,130 | |
Paragon Mortgages No. 25 PLC, Ser. 2025, Cl. B, 3 Month SONIO +1.07% | GBP | 3.02 | | 5/15/2050 | | 250,000 | e | 284,078 | |
Tower Bridge Funding PLC, Ser. 2021-2, CI. A, 3 Month SONIO +0.78% | GBP | 2.76 | | 11/20/2063 | | 575,293 | e | 647,178 | |
United Kingdom, Bonds | GBP | 1.25 | | 7/22/2027 | | 850,000 | | 875,228 | |
United Kingdom, Bonds | GBP | 1.25 | | 7/31/2051 | | 6,250,000 | | 4,153,566 | |
United Kingdom, Bonds | GBP | 2.25 | | 9/7/2023 | | 8,525,000 | | 9,696,581 | |
United Kingdom Gilt, Bonds | GBP | 1.00 | | 1/31/2032 | | 3,525,000 | | 3,223,668 | |
| | 21,439,736 | |
United States - 18.5% | | | | | |
Americredit Automobile Receivables Trust, Ser. 2022-1, CI. A2 | | 2.05 | | 1/20/2026 | | 203,707 | | 200,786 | |
Berkshire Hathaway Finance Corp., Gtd. Notes | EUR | 1.50 | | 3/18/2030 | | 890,000 | | 747,537 | |
Celanese US Holdings LLC, Gtd. Bonds | EUR | 5.34 | | 1/19/2029 | | 1,174,000 | | 1,041,471 | |
Celanese US Holdings LLC, Gtd. Notes | EUR | 4.78 | | 7/19/2026 | | 430,000 | | 401,053 | |
Celanese US Holdings LLC, Gtd. Notes | | 6.38 | | 7/15/2032 | | 177,000 | | 161,285 | |
12
| | | | | | | | | | |
| |
Description | Coupon
Rate (%) | | Maturity
Date | | Principal
Amount ($) | a | Value ($) | |
Bonds and Notes - 98.5% (continued) | | | | | |
United States - 18.5% (continued) | | | | | |
CHC Commercial Mortgage Trust, Ser. 2019-CHC, Cl. B, 1 Month LIBOR +1.50% | | 4.91 | | 6/15/2034 | | 868,442 | b,e | 842,197 | |
CPS Auto Receivables Trust, Ser. 2021-D, Cl. B | | 1.09 | | 10/15/2027 | | 1,280,000 | b | 1,226,355 | |
Energy Transfer LP, Jr. Sub. Bonds, Ser. A | | 6.25 | | 2/15/2023 | | 680,000 | c,f | 566,429 | |
Exeter Automobile Receivables Trust, Ser. 2021-2A, Cl. C | | 0.98 | | 6/15/2026 | | 675,000 | | 638,165 | |
Federal Agricultural Mortgage Corp. Mortgage Trust, Ser. 2021-1, CI. A | | 2.18 | | 1/25/2051 | | 655,261 | b | 529,922 | |
Federal Home Loan Mortgage Corp. Multifamily Structured Credit Risk, Ser. 2021-MN1, Cl. M1, 1 Month SOFR +2.00% | | 5.00 | | 1/25/2051 | | 163,550 | b,e,g | 152,652 | |
FedEx Corp., Gtd. Bonds | EUR | 0.95 | | 5/4/2033 | | 1,950,000 | | 1,334,633 | |
Fidelity National Information Services Inc., Gtd. Notes | EUR | 2.00 | | 5/21/2030 | | 462,000 | | 389,077 | |
Fidelity National Information Services Inc., Sr. Unscd. Notes | EUR | 1.50 | | 5/21/2027 | | 196,000 | | 174,308 | |
Ford Motor Co., Sr. Unscd. Notes | | 3.25 | | 2/12/2032 | | 500,000 | | 376,262 | |
Ford Motor Co., Sr. Unscd. Notes | | 4.75 | | 1/15/2043 | | 520,000 | | 363,051 | |
Ford Motor Co., Sr. Unscd. Notes | | 6.10 | | 8/19/2032 | | 862,000 | f | 790,346 | |
Honeywell International Inc., Sr. Unscd. Bonds | EUR | 4.13 | | 11/2/2034 | | 1,308,000 | | 1,276,273 | |
JPMorgan Chase & Co., Sr. Unscd. Notes | EUR | 1.96 | | 3/23/2030 | | 530,000 | | 452,080 | |
Morgan Stanley, Sr. Unscd. Notes | EUR | 5.15 | | 1/25/2034 | | 1,809,000 | | 1,840,987 | |
MPT Operating Partnership LP, Gtd. Bonds | EUR | 0.99 | | 10/15/2026 | | 575,000 | | 425,678 | |
Nasdaq Inc., Sr. Unscd. Notes | EUR | 0.90 | | 7/30/2033 | | 1,148,000 | | 771,145 | |
National Grid North America Inc., Sr. Unscd. Notes | EUR | 1.05 | | 1/20/2031 | | 1,560,000 | | 1,177,787 | |
Newell Brands Inc., Sr. Unscd. Notes | | 6.63 | | 9/15/2029 | | 523,000 | f | 511,952 | |
Santander Drive Auto Receivables Trust, Ser. 2021-4, CI. C | | 1.26 | | 2/16/2027 | | 620,000 | | 590,836 | |
SBA Tower Trust, Asset Backed Notes | | 2.59 | | 10/15/2031 | | 695,000 | b | 523,804 | |
SLM Corp., Sr. Unscd. Notes | | 4.20 | | 10/29/2025 | | 260,000 | | 241,795 | |
The Dow Chemical Company, Sr. Unscd. Notes | | 6.90 | | 5/15/2053 | | 1,160,000 | | 1,173,257 | |
The Southern Company, Jr. Sub. Notes | EUR | 1.88 | | 9/15/2081 | | 625,000 | | 446,943 | |
U.S. Treasury Bonds | | 1.13 | | 5/15/2040 | | 7,575,000 | | 4,526,062 | |
WEA Finance LLC, Gtd. Notes | | 2.88 | | 1/15/2027 | | 283,000 | | 235,813 | |
WEA Finance LLC, Gtd. Notes | | 2.88 | | 1/15/2027 | | 380,000 | b | 316,639 | |
13
STATEMENT OF INVESTMENTS (continued)
| | | | | | | | | | |
| |
Description | Coupon
Rate (%) | | Maturity
Date | | Principal
Amount ($) | a | Value ($) | |
Bonds and Notes - 98.5% (continued) | | | | | |
United States - 18.5% (continued) | | | | | |
WEA Finance LLC, Gtd. Notes | | 4.75 | | 9/17/2044 | | 656,000 | b | 430,499 | |
Wells Fargo & Co., Sr. Unscd. Notes | EUR | 1.74 | | 5/4/2030 | | 1,740,000 | | 1,447,308 | |
Wells Fargo Commercial Mortgage Trust, Ser. 2021-SAVE, Cl. A, 1 Month LIBOR +1.15% | | 4.56 | | 2/15/2040 | | 568,139 | b,e | 536,744 | |
Federal Home Loan Mortgage Corp.: | | | |
4.50%, 6/1/2052 | | | 4,572,970 | g | 4,299,330 | |
Federal National Mortgage Association: | | | |
4.00%, 7/1/2052-8/1/2052 | | | 4,575,678 | g | 4,176,331 | |
| | 35,336,792 | |
Total Bonds and Notes
(cost $220,187,496) | | 187,790,412 | |
Description /Number of Contracts/Counterparty | Exercise
Price | | Expiration Date | | Notional Amount ($) | a | | |
Options Purchased - .0% | | | | | |
Call Options - .0% | | | | | |
Swiss Franc Cross Currency, Contracts 920,000 Barclays Capital, Inc. | GBP | 1.10 | | 11/1/2022 | | 920,000 | | 44,596 | |
Put Options - .0% | | | | | |
Swiss Franc Cross Currency, Contracts 920,000 Barclays Capital, Inc. | GBP | 1.01 | | 11/1/2022 | | 920,000 | | 0 | |
Swiss Franc Cross Currency, Contracts 920,000 Barclays Capital, Inc. | GBP | 1.04 | | 11/1/2022 | | 920,000 | | 0 | |
Total Options Purchased
(cost $32,953) | | 44,596 | |
Description | 1-Day
Yield (%) | | | | Shares | | | |
Investment Companies - 2.8% | | | | | |
Registered Investment Companies - 2.8% | | | | | |
Dreyfus Institutional Preferred Government Plus Money Market Fund, Institutional Shares
(cost $5,277,287) | | 3.23 | | | | 5,277,287 | h | 5,277,287 | |
14
| | | | | | | | | | |
| |
Description | 1-Day
Yield (%) | | | | Shares | | Value ($) | |
Investment of Cash Collateral for Securities Loaned - .7% | | | | | |
Registered Investment Companies - .7% | | | | | |
Dreyfus Institutional Preferred Government Plus Money Market Fund, SL Shares
(cost $1,360,980) | | 3.23 | | | | 1,360,980 | h | 1,360,980 | |
Total Investments (cost $226,858,716) | | 102.0% | 194,473,275 | |
Liabilities, Less Cash and Receivables | | (2.0%) | (3,851,707) | |
Net Assets | | 100.0% | 190,621,568 | |
LIBOR—London Interbank Offered Rate
SOFR—Secured Overnight Financing Rate
SONIA—Sterling Overnight Index Average
AUD—Australian Dollar
CAD—Canadian Dollar
CHF—Swiss Franc
CNY—Chinese Yuan Renminbi
EUR—Euro
GBP—British Pound
IDR—Indonesian Rupiah
JPY—Japanese Yen
KRW—South Korean Won
MXN—Mexican Peso
NZD—New Zealand Dollar
SEK—Swedish Krona
SGD—Singapore Dollar
ZAR—South African Rand
a Amount stated in U.S. Dollars unless otherwise noted above.
b Security exempt from registration pursuant to Rule 144A under the Securities Act of 1933. These securities may be resold in transactions exempt from registration, normally to qualified institutional buyers. At October 31, 2022, these securities were valued at $23,168,007 or 12.15% of net assets.
c Security is a perpetual bond with no specified maturity date. Maturity date shown is next reset date of the bond.
d Principal amount for accrual purposes is periodically adjusted based on changes in the Consumer Price Index.
e Variable rate security—interest rate resets periodically and rate shown is the interest rate in effect at period end. Security description also includes the reference rate and spread if published and available.
f Security, or portion thereof, on loan. At October 31, 2022, the value of the fund’s securities on loan was $1,868,727 and the value of the collateral was $1,965,400, consisting of cash collateral of $1,360,980 and U.S. Government & Agency securities valued at $604,420. In addition, the value of collateral may include pending sales that are also on loan.
g The Federal Housing Finance Agency (“FHFA”) placed the Federal Home Loan Mortgage Corporation and Federal National Mortgage Association into conservatorship with FHFA as the conservator. As such, the FHFA oversees the continuing affairs of these companies.
h Investment in affiliated issuer. The investment objective of this investment company is publicly available and can be found within the investment company’s prospectus.
15
STATEMENT OF INVESTMENTS (continued)
| | |
Portfolio Summary (Unaudited) † | Value (%) |
Foreign Governmental | 64.3 |
Banks | 6.4 |
U.S. Government Agencies Mortgage-Backed | 4.5 |
Asset-Backed Certificates/Auto Receivables | 3.5 |
Investment Companies | 3.5 |
Utilities | 3.3 |
U.S. Treasury Securities | 2.4 |
Real Estate | 2.3 |
Commercial Mortgage Pass-Through Certificates | 2.1 |
Chemicals | 1.6 |
Diversified Financials | 1.6 |
Automobiles & Components | .8 |
Asset-Backed Certificates | .7 |
Transportation | .7 |
Electronic Components | .7 |
Supranational Bank | .6 |
Energy | .5 |
Agriculture | .4 |
Insurance | .4 |
Metals & Mining | .3 |
Food Products | .3 |
Information Technology | .3 |
U.S. Government Agencies Collateralized Mortgage Obligations | .3 |
Consumer Staples | .3 |
Health Care | .1 |
U.S. Government Agencies Collateralized Municipal-Backed Securities | .1 |
Options Purchased | .0 |
| | 102.0 |
† Based on net assets.
See notes to financial statements.
| | | | | | | |
Affiliated Issuers | | | |
Description | Value ($) 10/31/2021 | Purchases ($)† | Sales ($) | Value ($) 10/31/2022 | Dividends/
Distributions ($) | |
Registered Investment Companies - 2.8% | | |
Dreyfus Institutional Preferred Government Plus Money Market Fund, Institutional Shares - 2.8% | 506,878 | 187,935,549 | (183,165,140) | 5,277,287 | 52,699 | |
16
| | | | | | | |
Description | Value ($) 10/31/2021 | Purchases ($)† | Sales ($) | Value ($) 10/31/2022 | Dividends/
Distributions ($) | |
Investment of Cash Collateral for Securities Loaned - .7% | | |
Dreyfus Institutional Preferred Government Plus Money Market Fund, SL Shares - .7% | 3,000,950 | 53,379,151 | (55,019,121) | 1,360,980 | 8,518 | †† |
Total - 3.5% | 3,507,828 | 241,314,700 | (238,184,261) | 6,638,267 | 61,217 | |
† Includes reinvested dividends/distributions.
†† Represents securities lending income earned from the reinvestment of cash collateral from loaned securities, net of fees and collateral investment expenses, and other payments to and from borrowers of securities.
See notes to financial statements.
| | | | | | | |
Futures | | | |
Description | Number of
Contracts | Expiration | Notional
Value ($) | Market
Value ($) | Unrealized Appreciation (Depreciation) ($) | |
Futures Long | | |
Euro-Schatz | 57 | 12/8/2022 | 6,024,625a | 6,023,675 | (950) | |
U.S. Treasury 10 Year Notes | 41 | 12/20/2022 | 4,554,274 | 4,534,344 | (19,930) | |
U.S. Treasury 5 Year Notes | 7 | 12/30/2022 | 744,056 | 746,156 | 2,100 | |
U.S. Treasury Long Bond | 2 | 12/20/2022 | 272,691 | 241,000 | (31,691) | |
Futures Short | | |
Canadian 10 Year Bond | 3 | 12/19/2022 | 265,092a | 270,922 | (5,830) | |
Euro-Bond | 73 | 12/8/2022 | 10,144,308a | 9,987,373 | 156,935 | |
U.S. Treasury 2 Year Notes | 1 | 12/30/2022 | 209,030 | 204,383 | 4,647 | |
U.S. Treasury Ultra Long Bond | 49 | 12/20/2022 | 6,540,649 | 6,255,156 | 285,493 | |
Ultra 10 Year U.S. Treasury Notes | 20 | 12/20/2022 | 2,318,942 | 2,319,688 | (746) | |
Gross Unrealized Appreciation | | 449,175 | |
Gross Unrealized Depreciation | | (59,147) | |
a Notional amounts in foreign currency have been converted to USD using relevant foreign exchange rates.
See notes to financial statements.
17
STATEMENT OF INVESTMENTS (continued)
| | | | | | | |
Options Written | | | |
Description/ Contracts/ Counterparties | Exercise Price | Expiration Date | Notional Amount | a | Value ($) | |
Call Options: | | | | | | |
Swaption Receiver Markit CDX North America Investment Grade Index Series 39, Payer 3 Month Fixed Rate of 1.00% terminating on 12/20/2027,
Contracts 20,300,000, Citigroup Global Markets Inc. | 0.95 | 12/21/2022 | 20,300,000 | b | (80,372) | |
Swaption Receiver Markit CDX North America Investment Grade Index Series 39, Payer 3 Month Fixed Rate of 1.00% terminating on 12/20/2027,
Contracts 20,100,000, Citigroup Global Markets Inc. | 1.00 | 12/21/2022 | 20,100,000 | b | (109,390) | |
Swiss Franc Cross Currency,
Contracts 920,000, Barclays Capital, Inc. | 1.10 | 11/1/2022 | 920,000 | GBP | (44,596) | |
U.S Treasury 10 Year December Future,
Contracts 52 | 115.00 | 11/25/2022 | 598,000,000 | | (4,062) | |
U.S Treasury 5 Year December Future,
Contracts 76 | 108.50 | 11/25/2022 | 824,600,000 | | (11,875) | |
Put Options: | | | | | | |
Swaption Payer Markit CDX North America Investment Grade Index Series 39, Receiver 3 Month Fixed Rate of 1.00% terminating on 12/20/2027,
Contracts 20,300,000, Citigroup Global Markets Inc. | 0.95 | 12/21/2022 | 20,300,000 | b | (63,563) | |
Swaption Payer Markit CDX North America Investment Grade Index Series 39, Receiver 3 Month Fixed Rate of 1.00% terminating on 12/20/2027,
Contracts 20,100,000, Citigroup Global Markets Inc. | 1.00 | 12/21/2022 | 20,100,000 | b | (49,393) | |
Swiss Franc Cross Currency,
Contracts 920,000, Barclays Capital, Inc. | 1.01 | 11/1/2022 | 920,000 | GBP | 0 | |
Swiss Franc Cross Currency,
Contracts 920,000, Barclays Capital, Inc. | 1.04 | 11/1/2022 | 920,000 | GBP | 0 | |
18
| | | | | | | |
Options Written | | | |
Description/ Contracts/ Counterparties | Exercise Price | Expiration Date | Notional Amount | a | Value ($) | |
Put Options:(continued) | | | | | | |
U.S Treasury 10 Year December Future,
Contracts 52 | 110.00 | 11/25/2022 | 572,000,000 | | (43,062) | |
U.S Treasury 5 Year December Future,
Contracts 76 | 105.00 | 11/25/2022 | 798,000,000 | | (15,438) | |
Total Options Written (premiums received $527,998) | | | | (421,751) | |
a Notional amount stated in U.S. Dollars unless otherwise indicated.
b Exercise price is referenced as basis points.
GBP—British Pound
See notes to financial statements.
| | | | | | |
Forward Foreign Currency Exchange Contracts | |
Counterparty/ Purchased
Currency | Purchased Currency
Amounts | Currency
Sold | Sold
Currency
Amounts | Settlement Date | Unrealized Appreciation (Depreciation) ($) |
Barclays Capital, Inc. |
United States Dollar | 3,900,808 | Chinese Yuan Renminbi | 28,000,000 | 11/16/2022 | 60,819 |
United States Dollar | 584,035 | New Zealand Dollar | 1,024,058 | 11/16/2022 | (11,518) |
United States Dollar | 333,000 | Japanese Yen | 48,377,937 | 11/16/2022 | 7,075 |
Chinese Yuan Renminbi | 3,590,886 | United States Dollar | 498,856 | 11/16/2022 | (8,948) |
South Korean Won | 5,350,869,000 | United States Dollar | 3,782,923 | 11/16/2022 | (26,448) |
Citigroup Global Markets Inc. |
Swedish Krona | 4,076,289 | United States Dollar | 367,000 | 11/16/2022 | 2,568 |
New Zealand Dollar | 1,747,972 | Australian Dollar | 1,539,000 | 11/16/2022 | 31,689 |
United States Dollar | 3,035,320 | British Pound | 2,660,000 | 11/16/2022 | (16,485) |
Australian Dollar | 1,449,699 | United States Dollar | 935,279 | 11/16/2022 | (7,561) |
Chinese Yuan Renminbi | 5,175,723 | United States Dollar | 723,000 | 11/16/2022 | (16,871) |
United States Dollar | 277,001 | Chinese Yuan Renminbi | 1,982,149 | 11/16/2022 | 6,574 |
Danish Krone | 6,300,000 | United States Dollar | 828,780 | 11/16/2022 | 8,412 |
Canadian Dollar | 100,000 | United States Dollar | 73,886 | 11/16/2022 | (479) |
19
STATEMENT OF INVESTMENTS (continued)
| | | | | | |
Counterparty/ Purchased
Currency | Purchased Currency
Amounts | Currency
Sold | Sold
Currency
Amounts | Settlement Date | Unrealized Appreciation (Depreciation) ($) |
Citigroup Global Markets Inc.(continued) |
Norwegian Krone | 3,782,485 | United States Dollar | 353,980 | 11/16/2022 | 10,039 |
Euro | 630,570 | United States Dollar | 616,000 | 11/16/2022 | 7,861 |
United States Dollar | 289,000 | Euro | 293,648 | 11/16/2022 | (1,523) |
Goldman Sachs & Co. LLC |
Malaysian Ringgit | 5,925,000 | United States Dollar | 1,271,733 | 11/16/2022 | (17,961) |
Swedish Krona | 700,000 | United States Dollar | 63,286 | 11/16/2022 | 178 |
Swedish Krona | 3,189,785 | Australian Dollar | 450,000 | 11/16/2022 | 1,223 |
Swiss Franc | 276,023 | United States Dollar | 279,027 | 11/16/2022 | (2,905) |
New Zealand Dollar | 508,778 | United States Dollar | 287,000 | 11/16/2022 | 8,886 |
Euro | 431,462 | United States Dollar | 421,000 | 11/16/2022 | 5,872 |
United States Dollar | 1,828,000 | Euro | 1,860,905 | 11/16/2022 | (13,105) |
Polish Zloty | 3,032,445 | United States Dollar | 604,634 | 11/16/2022 | 29,369 |
United States Dollar | 98,000 | Polish Zloty | 465,263 | 11/16/2022 | 726 |
Chinese Yuan Renminbi | 28,000,000 | United States Dollar | 3,860,058 | 11/16/2022 | (39,991) |
United States Dollar | 1,247,761 | Chinese Yuan Renminbi | 8,943,339 | 11/16/2022 | 27,613 |
Japanese Yen | 48,188,996 | United States Dollar | 333,000 | 11/16/2022 | (8,348) |
United States Dollar | 254,000 | Japanese Yen | 37,667,441 | 11/16/2022 | 232 |
United States Dollar | 911,591 | Taiwan Dollar | 29,139,000 | 11/16/2022 | 6,282 |
Hungarian Forint | 106,327,534 | United States Dollar | 242,378 | 11/16/2022 | 12,985 |
Chinese Yuan Renminbi | 170,423,142 | United States Dollar | 24,148,833 | 11/16/2022 | (776,581) |
Thai Baht | 45,440,000 | United States Dollar | 1,194,470 | 11/16/2022 | 860 |
United States Dollar | 114,706 | South Korean Won | 164,632,000 | 11/16/2022 | (871) |
Romanian Leu | 1,320,000 | United States Dollar | 259,514 | 11/16/2022 | 5,737 |
Canadian Dollar | 1,091,057 | United States Dollar | 795,000 | 11/16/2022 | 5,917 |
20
| | | | | | |
Counterparty/ Purchased
Currency | Purchased Currency
Amounts | Currency
Sold | Sold
Currency
Amounts | Settlement Date | Unrealized Appreciation (Depreciation) ($) |
HSBC Securities (USA) Inc. |
South Korean Won | 697,192,000 | United States Dollar | 487,888 | 11/16/2022 | 1,562 |
United States Dollar | 3,303,223 | South Korean Won | 4,720,240,000 | 11/16/2022 | (10,531) |
United States Dollar | 326,062 | Singapore Dollar | 466,361 | 11/16/2022 | (3,414) |
Czech Koruna | 12,144,006 | United States Dollar | 481,712 | 11/16/2022 | 7,951 |
Colombian Peso | 1,969,000,000 | United States Dollar | 424,812 | 11/16/2022 | (27,170) |
United States Dollar | 249,291 | Brazilian Real | 1,319,000 | 11/16/2022 | (5,111) |
United States Dollar | 802,237 | Canadian Dollar | 1,108,783 | 11/16/2022 | (11,693) |
United States Dollar | 196,000 | New Zealand Dollar | 337,500 | 11/16/2022 | (277) |
British Pound | 87,000 | New Zealand Dollar | 172,562 | 11/16/2022 | (541) |
New Zealand Dollar | 176,097 | British Pound | 89,000 | 11/16/2022 | 302 |
United States Dollar | 289,000 | Australian Dollar | 458,630 | 11/16/2022 | (4,495) |
United States Dollar | 3,065,160 | British Pound | 2,749,152 | 11/16/2022 | (88,928) |
Japanese Yen | 360,988,814 | United States Dollar | 2,496,336 | 11/16/2022 | (64,331) |
United States Dollar | 117,000 | Israeli Shekel | 413,630 | 11/16/2022 | (170) |
Chilean Peso | 212,617,000 | United States Dollar | 221,975 | 11/16/2022 | 2,774 |
Peruvian Nuevo Sol | 840,000 | United States Dollar | 210,184 | 11/16/2022 | 281 |
United States Dollar | 1,933,792 | South African Rand | 34,990,499 | 11/16/2022 | 31,277 |
Indonesian Rupiah | 28,993,787,000 | United States Dollar | 1,897,872 | 11/16/2022 | (39,522) |
United States Dollar | 451,013 | Indonesian Rupiah | 7,027,580,000 | 11/16/2022 | 582 |
Taiwan Dollar | 29,139,000 | United States Dollar | 915,457 | 11/16/2022 | (10,148) |
United States Dollar | 274,000 | Chinese Yuan Renminbi | 2,003,452 | 11/16/2022 | 667 |
Australian Dollar | 769,000 | New Zealand Dollar | 869,104 | 11/16/2022 | (13,325) |
J.P. Morgan Securities LLC |
United States Dollar | 407,000 | British Pound | 358,065 | 11/16/2022 | (3,806) |
21
STATEMENT OF INVESTMENTS (continued)
| | | | | | |
Counterparty/ Purchased
Currency | Purchased Currency
Amounts | Currency
Sold | Sold
Currency
Amounts | Settlement Date | Unrealized Appreciation (Depreciation) ($) |
J.P. Morgan Securities LLC(continued) |
New Zealand Dollar | 708,165 | United States Dollar | 399,900 | 11/16/2022 | 11,942 |
Brazilian Real | 1,319,000 | United States Dollar | 250,857 | 11/16/2022 | 3,545 |
Japanese Yen | 354,000,000 | United States Dollar | 2,407,191 | 11/16/2022 | (22,271) |
United States Dollar | 939,000 | Japanese Yen | 137,042,937 | 11/16/2022 | 15,733 |
Canadian Dollar | 4,640,575 | United States Dollar | 3,384,670 | 11/16/2022 | 21,857 |
United States Dollar | 1,006,601 | Canadian Dollar | 1,381,916 | 11/16/2022 | (7,828) |
Euro | 20,874,697 | United States Dollar | 20,424,717 | 11/16/2022 | 227,873 |
United States Dollar | 8,005,547 | Euro | 8,064,093 | 11/16/2022 | 27,256 |
United States Dollar | 487,819 | South Korean Won | 697,192,000 | 11/16/2022 | (1,631) |
Swedish Krona | 7,910,510 | United States Dollar | 711,395 | 11/16/2022 | 5,794 |
United States Dollar | 293,000 | Swedish Krona | 3,219,442 | 11/16/2022 | 1,116 |
United States Dollar | 78,000 | Singapore Dollar | 110,362 | 11/16/2022 | 31 |
Australian Dollar | 770,000 | New Zealand Dollar | 864,067 | 11/16/2022 | (9,756) |
United States Dollar | 3,542,111 | Mexican Peso | 71,729,673 | 11/16/2022 | (67,271) |
United States Dollar | 275,000 | Chinese Yuan Renminbi | 1,975,568 | 11/16/2022 | 5,471 |
Australian Dollar | 889,301 | United States Dollar | 569,807 | 11/16/2022 | (709) |
Israeli Shekel | 2,085,000 | United States Dollar | 591,597 | 11/16/2022 | (974) |
Gross Unrealized Appreciation | | | 606,931 |
Gross Unrealized Depreciation | | | (1,343,497) |
See notes to financial statements.
22
| | | | | | | | |
Centrally Cleared Interest Rate Swaps |
Received
Reference
Entity | Paid
Reference
Entity | Maturity Date | Notional
Amount ($) | Market
Value ($) | Upfront
Payments/
Receipts ($) | Unrealized Appreciation
(Depreciation) ($) |
USD - 3 Month LIBOR | USD Fixed at 0.969 | 6/28/2026 | 13,875,000 | 1,614,976 | 9,360 | 1,605,616 |
USD - 3 Month LIBOR | USD Fixed at 1.631 | 4/16/2031 | 13,600,000 | 2,433,332 | 1,297,004 | 1,136,328 |
Gross Unrealized Appreciation | 2,741,944 |
USD—United States Dollar
See notes to financial statements.
23
STATEMENT OF INVESTMENTS (continued)
| | | | | | |
Centrally Cleared Credit Default Swaps | |
Reference
Obligation | Maturity
Date | Notional
Amount ($)1 | Market
Value ($) | Upfront
Payments/
Receipts ($) | Unrealized Appreciation (Depreciation) ($) |
Sold Contracts:2 | |
Markit iTraxx Europe Index Series 38, Received Fixed Rate of 1.00% 3 Month | 12/20/2027 | 103,568,600 | (551,106) | (664,521) | 113,415 |
Purchased Contracts:3 | |
Markit CDX North America High Yield Index Series 39, Paid Fixed Rate of 5.00% 3 Month | 12/20/2027 | 8,720,000 | 15,335 | 274,172 | (258,837) |
Markit iTraxx Europe Crossover Index Series 38, Paid Fixed Rate of 5.00% 3 Month | 12/20/2027 | 9,388,375 | 148,613 | 460,101 | (311,488) |
Markit CDX North America Investment Grade Index Series 39, Paid Fixed Rate of 1.00% 3 Month | 12/20/2027 | 73,000,000 | (406,523) | (316,571) | (89,952) |
Gross Unrealized Appreciation | 113,415 |
Gross Unrealized Depreciation | (660,277) |
1 The maximum potential amount the fund could be required to pay as a seller of credit protection or receive as a buyer of credit protection if a credit event occurs as defined under the terms of the swap agreement.
2 If the fund is a seller of protection and a credit event occurs, as defined under the terms of the swap agreement, the fund will either (i) pay to the buyer of protection an amount equal to the notional amount of the swap and take delivery of the reference obligation or (ii) pay a net settlement amount in the form of cash or securities equal to the notional amount of the swap less the recovery value of the reference obligation.
3 If the fund is a buyer of protection and a credit event occurs, as defined under the terms of the swap agreement, the fund will either (i) receive from the seller of protection an amount equal to the notional amount of the swap and deliver the reference obligation or (ii) receive a net settlement amount in the form of cash or securities equal to the notional amount of the swap less the recovery value of the reference obligation.
See notes to financial statements.
24
STATEMENT OF ASSETS AND LIABILITIES
October 31, 2022
| | | | | | | |
| | | | | | |
| | | Cost | | Value | |
Assets ($): | | | | |
Investments in securities—See Statement of Investments
(including securities on loan, valued at $1,868,727)—Note 1(c): | | | |
Unaffiliated issuers | 220,220,449 | | 187,835,008 | |
Affiliated issuers | | 6,638,267 | | 6,638,267 | |
Cash denominated in foreign currency | | | 1,175,438 | | 1,169,775 | |
Cash collateral held by broker—Note 4 | | 7,847,090 | |
Receivable for investment securities sold | | 1,980,108 | |
Dividends, interest and securities lending income receivable | | 1,062,861 | |
Unrealized appreciation on forward foreign
currency exchange contracts—Note 4 | | 606,931 | |
Receivable for shares of Beneficial Interest subscribed | | 183,452 | |
Receivable for futures variation margin—Note 4 | | 136,173 | |
Receivable for swap variation margin—Note 4 | | 96,272 | |
Prepaid expenses | | | | | 48,754 | |
| | | | | 207,604,691 | |
Liabilities ($): | | | | |
Due to BNY Mellon Investment Adviser, Inc. and affiliates—Note 3(c) | | 115,163 | |
Payable for investment securities purchased | | 11,042,813 | |
Payable for shares of Beneficial Interest redeemed | | 2,542,059 | |
Liability for securities on loan—Note 1(c) | | 1,360,980 | |
Unrealized depreciation on forward foreign
currency exchange contracts—Note 4 | | 1,343,497 | |
Outstanding options written, at value
(premiums received $527,998)—Note 4 | | 421,751 | |
Trustees’ fees and expenses payable | | 7,016 | |
Interest payable—Note 2 | | 735 | |
Other accrued expenses | | | | | 149,109 | |
| | | | | 16,983,123 | |
Net Assets ($) | | | 190,621,568 | |
Composition of Net Assets ($): | | | | |
Paid-in capital | | | | | 422,798,831 | |
Total distributable earnings (loss) | | | | | (232,177,263) | |
Net Assets ($) | | | 190,621,568 | |
| | | | | | |
Net Asset Value Per Share | Class A | Class C | Class I | Class Y | |
Net Assets ($) | 25,222,919 | 1,792,608 | 134,568,384 | 29,037,657 | |
Shares Outstanding | 2,266,227 | 168,323 | 11,857,217 | 2,553,041 | |
Net Asset Value Per Share ($) | 11.13 | 10.65 | 11.35 | 11.37 | |
| | | | | |
See notes to financial statements. | | | | | |
25
STATEMENT OF OPERATIONS
Year Ended October 31, 2022
| | | | | | | |
| | | | | | |
| | | | | | |
Investment Income ($): | | | | |
Income: | | | | |
Interest (net of $57,141 foreign taxes withheld at source) | | | 4,712,926 | |
Dividends from affiliated issuers | | | 52,699 | |
Income from securities lending—Note 1(c) | | | 8,518 | |
Total Income | | | 4,774,143 | |
Expenses: | | | | |
Management fee—Note 3(a) | | | 1,325,411 | |
Shareholder servicing costs—Note 3(c) | | | 512,997 | |
Professional fees | | | 99,132 | |
Registration fees | | | 63,164 | |
Custodian fees—Note 3(c) | | | 47,871 | |
Prospectus and shareholders’ reports | | | 38,342 | |
Trustees’ fees and expenses—Note 3(d) | | | 26,714 | |
Chief Compliance Officer fees—Note 3(c) | | | 17,405 | |
Distribution fees—Note 3(b) | | | 16,739 | |
Loan commitment fees—Note 2 | | | 4,052 | |
Interest expense—Note 2 | | | 892 | |
Miscellaneous | | | 49,490 | |
Total Expenses | | | 2,202,209 | |
Less—reduction in expenses due to undertaking—Note 3(a) | | | (178,860) | |
Less—reduction in fees due to earnings credits—Note 3(c) | | | (1,012) | |
Net Expenses | | | 2,022,337 | |
Net Investment Income | | | 2,751,806 | |
Realized and Unrealized Gain (Loss) on Investments—Note 4 ($): | | |
Net realized gain (loss) on investments and foreign currency transactions | (41,936,428) | |
Net realized gain (loss) on futures | 2,742,807 | |
Net realized gain (loss) on options transactions | 656,793 | |
Net realized gain (loss) on forward foreign currency exchange contracts | (9,922,251) | |
Net realized gain (loss) on swap agreements | 4,701,021 | |
Net Realized Gain (Loss) | | | (43,758,058) | |
Net change in unrealized appreciation (depreciation) on investments
and foreign currency transactions | (29,592,313) | |
Net change in unrealized appreciation (depreciation) on futures | 848,525 | |
Net change in unrealized appreciation (depreciation) on
options transactions | 117,890 | |
Net change in unrealized appreciation (depreciation) on
forward foreign currency exchange contracts | (1,098,800) | |
Net change in unrealized appreciation (depreciation) on swap agreements | 2,582,315 | |
Net Change in Unrealized Appreciation (Depreciation) | | | (27,142,383) | |
Net Realized and Unrealized Gain (Loss) on Investments | | | (70,900,441) | |
Net (Decrease) in Net Assets Resulting from Operations | | (68,148,635) | |
| | | | | | |
See notes to financial statements. | | | | | |
26
STATEMENT OF CHANGES IN NET ASSETS
| | | | | | | | | | |
| | | | Year Ended October 31, |
| | | | 2022 | | 2021 | |
Operations ($): | | | | | | | | |
Net investment income | | | 2,751,806 | | | | 3,849,009 | |
Net realized gain (loss) on investments | | (43,758,058) | | | | 20,256,192 | |
Net change in unrealized appreciation
(depreciation) on investments | | (27,142,383) | | | | (24,569,408) | |
Net Increase (Decrease) in Net Assets
Resulting from Operations | (68,148,635) | | | | (464,207) | |
Distributions ($): | |
Distributions to shareholders: | | | | | | | | |
Class A | | | (681,445) | | | | (1,064,518) | |
Class C | | | (33,144) | | | | (166,033) | |
Class I | | | (4,291,133) | | | | (6,996,254) | |
Class Y | | | (868,122) | | | | (1,841,023) | |
Total Distributions | | | (5,873,844) | | | | (10,067,828) | |
Beneficial Interest Transactions ($): | |
Net proceeds from shares sold: | | | | | | | | |
Class A | | | 3,092,024 | | | | 12,424,807 | |
Class C | | | 58,228 | | | | 74,088 | |
Class I | | | 52,483,817 | | | | 57,054,309 | |
Class Y | | | 5,908,237 | | | | 11,304,272 | |
Distributions reinvested: | | | | | | | | |
Class A | | | 624,370 | | | | 960,971 | |
Class C | | | 29,266 | | | | 158,251 | |
Class I | | | 3,698,401 | | | | 6,113,196 | |
Class Y | | | 855,550 | | | | 1,755,686 | |
Cost of shares redeemed: | | | | | | | | |
Class A | | | (10,534,504) | | | | (14,026,251) | |
Class C | | | (495,174) | | | | (5,747,011) | |
Class I | | | (96,308,222) | | | | (101,204,458) | |
Class Y | | | (13,758,001) | | | | (37,258,624) | |
Increase (Decrease) in Net Assets
from Beneficial Interest Transactions | (54,346,008) | | | | (68,390,764) | |
Total Increase (Decrease) in Net Assets | (128,368,487) | | | | (78,922,799) | |
Net Assets ($): | |
Beginning of Period | | | 318,990,055 | | | | 397,912,854 | |
End of Period | | | 190,621,568 | | | | 318,990,055 | |
27
STATEMENT OF CHANGES IN NET ASSETS (continued)
| | | | | | | | | | |
| | | | Year Ended October 31, |
| | | | 2022 | | 2021 | |
Capital Share Transactions (Shares): | |
Class Aa,b | | | | | | | | |
Shares sold | | | 233,768 | | | | 801,549 | |
Shares issued for distributions reinvested | | | 44,134 | | | | 60,783 | |
Shares redeemed | | | (788,510) | | | | (907,597) | |
Net Increase (Decrease) in Shares Outstanding | (510,608) | | | | (45,265) | |
Class Ca | | | | | | | | |
Shares sold | | | 5,032 | | | | 4,937 | |
Shares issued for distributions reinvested | | | 2,149 | | | | 10,357 | |
Shares redeemed | | | (37,578) | | | | (383,555) | |
Net Increase (Decrease) in Shares Outstanding | (30,397) | | | | (368,261) | |
Class Ib | | | | | | | | |
Shares sold | | | 3,814,744 | | | | 3,617,074 | |
Shares issued for distributions reinvested | | | 257,576 | | | | 380,363 | |
Shares redeemed | | | (7,370,880) | | | | (6,415,981) | |
Net Increase (Decrease) in Shares Outstanding | (3,298,560) | | | | (2,418,544) | |
Class Y | | | | | | | | |
Shares sold | | | 445,516 | | | | 714,046 | |
Shares issued for distributions reinvested | | | 59,496 | | | | 109,005 | |
Shares redeemed | | | (1,023,656) | | | | (2,377,596) | |
Net Increase (Decrease) in Shares Outstanding | (518,644) | | | | (1,554,545) | |
| | | | | | | | | |
a | During the period ended October 31, 2022, 955 Class C shares representing $12,296 were automatically converted to 917 Class A shares and during the period ended October 31, 2021, 3,984 Class C shares representing $59,788 were automatically converted to 3,833 Class A shares. | |
b | During the period ended October 31, 2022, 1,363 Class A shares representing $16,439 were exchanged for 1,337 Class I shares and during the period ended October 31, 2021, 1,292 Class A shares representing $19,238 were exchanged for 1,268 Class I shares. | |
See notes to financial statements. | | | | | | | | |
28
FINANCIAL HIGHLIGHTS
The following tables describe the performance for each share class for the fiscal periods indicated. All information (except portfolio turnover rate) reflects financial results for a single fund share. Net asset value total return is calculated assuming an initial investment made at the net asset value at the beginning of the period, reinvestment of all dividends and distributions at net asset value during the period, and redemption at net asset value on the last day of the period. Net asset value total return includes adjustments in accordance with accounting principles generally accepted in the United States of America and as such, the net asset value for financial reporting purposes and the returns based upon those net asset values may differ from the net asset value and returns for shareholder transactions. These figures have been derived from the fund’s financial statements.
| | | | | | | |
| | |
| | Year Ended October 31, |
Class A Shares | | 2022 | 2021 | 2020 | 2019 | 2018 |
Per Share Data ($): | | | | | | |
Net asset value, beginning of period | | 14.81 | 15.33 | 15.04 | 14.68 | 16.09 |
Investment Operations: | | | | | | |
Net investment incomea | | .10 | .12 | .12 | .23 | .41 |
Net realized and unrealized
gain (loss) on investments | | (3.52) | (.25) | .17b | .51 | (1.17) |
Total from Investment Operations | | (3.42) | (.13) | .29 | .74 | (.76) |
Distributions: | | | | | | |
Dividends from
net investment income | | (.26) | (.39) | - | (.38) | (.65) |
Net asset value, end of period | | 11.13 | 14.81 | 15.33 | 15.04 | 14.68 |
Total Return (%)c | | (23.48) | (1.03) | 1.93 | 5.10 | (4.90) |
Ratios/Supplemental Data (%): | | | | | | |
Ratio of total expenses
to average net assets | | 1.57 | 1.80 | 1.66 | 1.41 | 1.29 |
Ratio of net expenses
to average net assets | | 1.02 | 1.02 | 1.02 | 1.02 | 1.02 |
Ratio of net investment income
to average net assets | | .78 | .77 | .83 | 1.53 | 2.59 |
Portfolio Turnover Rate | | 172.43 | 141.06 | 103.49 | 107.73 | 95.31 |
Net Assets, end of period ($ x 1,000) | | 25,223 | 41,115 | 43,274 | 55,243 | 56,842 |
a Based on average shares outstanding.
b In addition to net realized and unrealized losses on investments, this amount includes an increase in net asset value per share resulting from the timing of issuances and redemptions of shares in relation to fluctuating market values for the fund’s investments.
c Exclusive of sales charge.
See notes to financial statements.
29
FINANCIAL HIGHLIGHTS (continued)
| | | | | | | |
| | |
| | Year Ended October 31, |
Class C Shares | | 2022 | 2021 | 2020 | 2019 | 2018 |
Per Share Data ($): | | | | | | |
Net asset value, beginning of period | | 14.20 | 14.76 | 14.58 | 14.28 | 15.67 |
Investment Operations: | | | | | | |
Net investment incomea | | .00b | .01 | .03 | .13 | .31 |
Net realized and unrealized
gain (loss) on investments | | (3.37) | (.26) | .15c | .50 | (1.14) |
Total from Investment Operations | | (3.37) | (.25) | .18 | .63 | (.83) |
Distributions: | | | | | | |
Dividends from
net investment income | | (.18) | (.31) | - | (.33) | (.56) |
Net asset value, end of period | | 10.65 | 14.20 | 14.76 | 14.58 | 14.28 |
Total Return (%)d | | (24.08) | (1.78) | 1.23 | 4.51 | (5.56) |
Ratios/Supplemental Data (%): | | | | | | |
Ratio of total expenses
to average net assets | | 1.79 | 1.73 | 1.71 | 1.68 | 1.65 |
Ratio of net expenses
to average net assets | | 1.79 | 1.73 | 1.71 | 1.68 | 1.65 |
Ratio of net investment income
to average net assets | | .01 | .07 | .21 | .94 | 1.99 |
Portfolio Turnover Rate | | 172.43 | 141.06 | 103.49 | 107.73 | 95.31 |
Net Assets, end of period ($ x 1,000) | | 1,793 | 2,823 | 8,368 | 16,745 | 31,007 |
a Based on average shares outstanding.
b Amount represents less than .01 per share.
c In addition to net realized and unrealized losses on investments, this amount includes an increase in net asset value per share resulting from the timing of issuances and redemptions of shares in relation to fluctuating market values for the fund’s investments.
d Exclusive of sales charge.
See notes to financial statements.
30
| | | | | | | | |
| | |
| | Year Ended October 31, |
Class I Shares | | 2022 | 2021 | 2020 | 2019 | 2018 | |
Per Share Data ($): | | | | | | | |
Net asset value, beginning of period | | 15.09 | 15.59 | 15.24 | 14.85 | 16.28 | |
Investment Operations: | | | | | | | |
Net investment incomea | | .14 | .17 | .18 | .29 | .49 | |
Net realized and unrealized
gain (loss) on investments | | (3.59) | (.26) | .17b | .50 | (1.18) | |
Total from Investment Operations | | (3.45) | (.09) | .35 | .79 | (.69) | |
Distributions: | | | | | | | |
Dividends from
net investment income | | (.29) | (.41) | - | (.40) | (.74) | |
Net asset value, end of period | | 11.35 | 15.09 | 15.59 | 15.24 | 14.85 | |
Total Return (%) | | (23.26) | (.71) | 2.30 | 5.49 | (4.53) | |
Ratios/Supplemental Data (%): | | | | | | | |
Ratio of total expenses
to average net assets | | .73 | .70 | .69 | .66 | .63 | |
Ratio of net expenses
to average net assets | | .73 | .70 | .69 | .66 | .63 | |
Ratio of net investment income
to average net assets | | 1.07 | 1.10 | 1.21 | 1.94 | 3.09 | |
Portfolio Turnover Rate | | 172.43 | 141.06 | 103.49 | 107.73 | 95.31 | |
Net Assets, end of period ($ x 1,000) | | 134,568 | 228,633 | 274,030 | 478,195 | 816,809 | |
a Based on average shares outstanding.
b In addition to net realized and unrealized losses on investments, this amount includes an increase in net asset value per share resulting from the timing of issuances and redemptions of shares in relation to fluctuating market values for the fund’s investments.
See notes to financial statements.
31
FINANCIAL HIGHLIGHTS (continued)
| | | | | | | | |
| | | |
| | Year Ended October 31, |
Class Y Shares | | 2022 | 2021 | 2020 | 2019 | 2018 |
Per Share Data ($): | | | | | | |
Net asset value, beginning of period | | 15.11 | 15.62 | 15.25 | 14.85 | 16.29 |
Investment Operations: | | | | | | |
Net investment incomea | | .16 | .19 | .19 | .30 | .50 |
Net realized and unrealized
gain (loss) on investments | | (3.60) | (.28) | .18b | .52 | (1.19) |
Total from Investment Operations | | (3.44) | (.09) | .37 | .82 | (.69) |
Distributions: | | | | | | |
Dividends from
net investment income | | (.30) | (.42) | - | (.42) | (.75) |
Net asset value, end of period | | 11.37 | 15.11 | 15.62 | 15.25 | 14.85 |
Total Return (%) | | (23.19) | (.65) | 2.36 | 5.65 | (4.52) |
Ratios/Supplemental Data (%): | | | | | | |
Ratio of total expenses
to average net assets | | .64 | .61 | .59 | .57 | .56 |
Ratio of net expenses
to average net assets | | .64 | .61 | .59 | .57 | .56 |
Ratio of net investment income
to average net assets | | 1.16 | 1.18 | 1.25 | 1.99 | 3.14 |
Portfolio Turnover Rate | | 172.43 | 141.06 | 103.49 | 107.73 | 95.31 |
Net Assets, end of period ($ x 1,000) | | 29,038 | 46,419 | 72,241 | 77,966 | 89,726 |
a Based on average shares outstanding.
b In addition to net realized and unrealized losses on investments, this amount includes an increase in net asset value per share resulting from the timing of issuances and redemptions of shares in relation to fluctuating market values for the fund’s investments.
See notes to financial statements.
32
NOTES TO FINANCIAL STATEMENTS
NOTE 1—Significant Accounting Policies:
BNY Mellon International Bond Fund (the “fund”) is a separate non-diversified series of BNY Mellon Investment Funds III (the “Trust”), which is registered under the Investment Company Act of 1940, as amended (the “Act”), as an open-end management investment company and operates as a series company currently offering four series, including the fund. The fund’s investment objective is to seek to maximize total return through capital appreciation and income. BNY Mellon Investment Adviser, Inc. (the “Adviser”), a wholly-owned subsidiary of The Bank of New York Mellon Corporation (“BNY Mellon”), serves as the fund’s investment adviser. Insight North America LLC (the “Sub-Adviser”) a wholly-owned subsidiary of BNY Mellon and an affiliate of the Adviser, serves as the fund’s sub-adviser.
BNY Mellon Securities Corporation (the “Distributor”), a wholly-owned subsidiary of the Adviser, is the distributor of the fund’s shares. The fund is authorized to issue an unlimited number of $.001 par value shares of Beneficial Interest in each of the following classes of shares: Class A, Class C, Class I and Class Y. Class A and Class C shares are sold primarily to retail investors through financial intermediaries and bear Distribution and/or Shareholder Services Plan fees. Class A shares generally are subject to a sales charge imposed at the time of purchase. Class A shares bought without an initial sales charge as part of an investment of $1 million or more may be charged a contingent deferred sales charge (“CDSC”) of 1.00% if redeemed within one year. Class C shares are subject to a CDSC imposed on Class C shares redeemed within one year of purchase. Class C shares automatically convert to Class A shares eight years after the date of purchase, without the imposition of a sales charge. Class I shares are sold primarily to bank trust departments and other financial service providers (including BNY Mellon and its affiliates), acting on behalf of customers having a qualified trust or an investment account or relationship at such institution, and bear no Distribution or Shareholder Services Plan fees. Class Y shares are sold at net asset value per share generally to institutional investors, and bear no Distribution or Shareholder Services Plan fees. Class I and Class Y shares are offered without a front-end sales charge or CDSC. Other differences between the classes include the services offered to and the expenses borne by each class, the allocation of certain transfer agency costs, and certain voting rights. Income, expenses (other than expenses attributable to a specific class), and realized and unrealized gains or losses on investments are allocated to each class of shares based on its relative net assets.
33
NOTES TO FINANCIAL STATEMENTS (continued)
The Trust accounts separately for the assets, liabilities and operations of each series. Expenses directly attributable to each series are charged to that series’ operations; expenses which are applicable to all series are allocated among them on a pro rata basis.
The Financial Accounting Standards Board (“FASB”) Accounting Standards Codification (“ASC”) is the exclusive reference of authoritative U.S. generally accepted accounting principles (“GAAP”) recognized by the FASB to be applied by nongovernmental entities. Rules and interpretive releases of the SEC under authority of federal laws are also sources of authoritative GAAP for SEC registrants. The fund is an investment company and applies the accounting and reporting guidance of the FASB ASC Topic 946 Financial Services-Investment Companies. The fund’s financial statements are prepared in accordance with GAAP, which may require the use of management estimates and assumptions. Actual results could differ from those estimates.
The Trust enters into contracts that contain a variety of indemnifications. The fund’s maximum exposure under these arrangements is unknown. The fund does not anticipate recognizing any loss related to these arrangements.
(a) Portfolio valuation: The fair value of a financial instrument is the amount that would be received to sell an asset or paid to transfer a liability in an orderly transaction between market participants at the measurement date (i.e., the exit price). GAAP establishes a fair value hierarchy that prioritizes the inputs of valuation techniques used to measure fair value. This hierarchy gives the highest priority to unadjusted quoted prices in active markets for identical assets or liabilities (Level 1 measurements) and the lowest priority to unobservable inputs (Level 3 measurements).
Additionally, GAAP provides guidance on determining whether the volume and activity in a market has decreased significantly and whether such a decrease in activity results in transactions that are not orderly. GAAP requires enhanced disclosures around valuation inputs and techniques used during annual and interim periods.
Various inputs are used in determining the value of the fund’s investments relating to fair value measurements. These inputs are summarized in the three broad levels listed below:
Level 1—unadjusted quoted prices in active markets for identical investments.
34
Level 2—other significant observable inputs (including quoted prices for similar investments, interest rates, prepayment speeds, credit risk, etc.).
Level 3—significant unobservable inputs (including the fund’s own assumptions in determining the fair value of investments).
The inputs or methodology used for valuing securities are not necessarily an indication of the risk associated with investing in those securities.
Changes in valuation techniques may result in transfers in or out of an assigned level within the disclosure hierarchy. Valuation techniques used to value the fund’s investments are as follows:
The Trust’s Board of Trustees (the “Board”) has designated the Adviser as the fund’s valuation designee, effective September 8, 2022, to make all fair value determinations with respect to the fund’s portfolio investments, subject to the Board’s oversight and pursuant to Rule 2a-5 under the Act.
Registered investment companies that are not traded on an exchange are valued at their net asset value and are generally categorized within Level 1 of the fair value hierarchy.
Investments in debt securities, excluding short-term investments (other than U.S. Treasury Bills), futures, options and forward foreign currency exchange contracts (“forward contracts”) are valued each business day by one or more independent pricing services (each, a “Service”) approved by the Board. Investments for which quoted bid prices are readily available and are representative of the bid side of the market in the judgment of a Service are valued at the mean between the quoted bid prices (as obtained by a Service from dealers in such securities) and asked prices (as calculated by a Service based upon its evaluation of the market for such securities). Securities are valued as determined by a Service, based on methods which include consideration of the following: yields or prices of securities of comparable quality, coupon, maturity and type; indications as to values from dealers; and general market conditions. The Services are engaged under the general supervision of the Board. These securities are generally categorized within Level 2 of the fair value hierarchy.
When market quotations or official closing prices are not readily available, or are determined not to accurately reflect fair value, such as when the value of a security has been significantly affected by events after the close of the exchange or market on which the security is principally traded (for example, a foreign exchange or market), but before the fund calculates its net asset value, the fund may value these investments at fair value as determined in accordance with the procedures approved by the Board.
35
NOTES TO FINANCIAL STATEMENTS (continued)
Certain factors may be considered when fair valuing investments such as: fundamental analytical data, the nature and duration of restrictions on disposition, an evaluation of the forces that influence the market in which the securities are purchased and sold, and public trading in similar securities of the issuer or comparable issuers. These securities are either categorized within Level 2 or 3 of the fair value hierarchy depending on the relevant inputs used.
For securities where observable inputs are limited, assumptions about market activity and risk are used and such securities are generally categorized within Level 3 of the fair value hierarchy.
Investments denominated in foreign currencies are translated to U.S. dollars at the prevailing rates of exchange.
Forward contracts are valued at the forward rate and are generally categorized within Level 2 of the fair value hierarchy. Futures and options, which are traded on an exchange, are valued at the last sales price on the securities exchange on which such securities are primarily traded or at the last sales price on the national securities market on each business day and are generally categorized within Level 1 of the fair value hierarchy. Options traded over-the-counter (“OTC”) are valued at the mean between the bid and asked price and are generally categorized within Level 2 of the fair value hierarchy. Investments in swap agreements are valued each business day by a Service. Swaps agreements are valued by a Service by using a swap pricing model which incorporates among other factors, default probabilities, recovery rates, credit curves of the underlying issuer and swap spreads on interest rates and are generally categorized within Level 2 of the fair value hierarchy.
The following is a summary of the inputs used as of October 31, 2022 in valuing the fund’s investments:
| | | | | | | |
| | Level 1-Unadjusted Quoted Prices | Level 2- Other Significant Observable Inputs | | Level 3-Significant Unobservable Inputs | Total | |
Assets ($) | | |
Investments in Securities:† | | |
Asset-Backed Securities | - | 8,077,344 | | - | 8,077,344 | |
Commercial Mortgage-Backed | - | 4,045,563 | | - | 4,045,563 | |
Corporate Bonds | - | 39,486,210 | | - | 39,486,210 | |
Foreign Governmental | - | 122,496,998 | | - | 122,496,998 | |
36
| | | | | | | |
| | Level 1-Unadjusted Quoted Prices | Level 2- Other Significant Observable Inputs | | Level 3-Significant Unobservable Inputs | Total | |
Assets ($)(continued) | | |
Investments in Securities:†(continued) | | |
Investment Companies | 6,638,267 | - | | - | 6,638,267 | |
U.S. Government Agencies Collateralized Mortgage Obligations | - | 529,922 | | - | 529,922 | |
U.S. Government Agencies Collateralized Municipal-Backed Securities | - | 152,652 | | - | 152,652 | |
U.S. Government Agencies Mortgage-Backed | - | 8,475,661 | | - | 8,475,661 | |
U.S. Treasury Securities | - | 4,526,062 | | - | 4,526,062 | |
Other Financial Instruments: | | |
Forward Foreign Currency Exchange Contracts†† | - | 606,931 | | - | 606,931 | |
Futures†† | 449,175 | - | | - | 449,175 | |
Options Purchased | - | 44,596 | | - | 44,596 | |
Swap Agreements†† | - | 2,855,359 | | - | 2,855,359 | |
Liabilities ($) | | |
Other Financial Instruments: | | |
Forward Foreign Currency Exchange Contracts†† | - | (1,343,497) | | - | (1,343,497) | |
Futures†† | (59,147) | - | | - | (59,147) | |
Options Written | (74,437) | (347,314) | | - | (421,751) | |
Swap Agreements†† | - | (660,277) | | - | (660,277) | |
† See Statement of Investments for additional detailed categorizations, if any.
†† Amount shown represents unrealized appreciation (depreciation) at period end, but only variation margin on exchange-traded and centrally cleared derivatives, if any, are reported in the Statement of Assets and Liabilities.
(b) Foreign currency transactions: The fund does not isolate that portion of the results of operations resulting from changes in foreign exchange rates on investments from the fluctuations arising from changes
37
NOTES TO FINANCIAL STATEMENTS (continued)
in the market prices of securities held. Such fluctuations are included with the net realized and unrealized gain or loss on investments.
Net realized foreign exchange gains or losses arise from sales of foreign currencies, currency gains or losses realized on securities transactions between trade and settlement date, and the difference between the amounts of dividends, interest and foreign withholding taxes recorded on the fund’s books and the U.S. dollar equivalent of the amounts actually received or paid. Net unrealized foreign exchange gains and losses arise from changes in the value of assets and liabilities other than investments resulting from changes in exchange rates. Foreign currency gains and losses on foreign currency transactions are also included with net realized and unrealized gain or loss on investments.
Foreign taxes: The fund may be subject to foreign taxes (a portion of which may be reclaimable) on income, stock dividends, realized and unrealized capital gains on investments or certain foreign currency transactions. Foreign taxes are recorded in accordance with the applicable foreign tax regulations and rates that exist in the foreign jurisdictions in which the fund invests. These foreign taxes, if any, are paid by the fund and are reflected in the Statement of Operations, if applicable. Foreign taxes payable or deferred or those subject to reclaims as of October 31, 2022, if any, are disclosed in the fund’s Statement of Assets and Liabilities.
(c) Securities transactions and investment income: Securities transactions are recorded on a trade date basis. Realized gains and losses from securities transactions are recorded on the identified cost basis. Dividend income is recognized on the ex-dividend date and interest income, including, where applicable, accretion of discount and amortization of premium on investments, is recognized on the accrual basis.
Pursuant to a securities lending agreement with BNY Mellon, the fund may lend securities to qualified institutions. It is the fund’s policy that, at origination, all loans are secured by collateral of at least 102% of the value of U.S. securities loaned and 105% of the value of foreign securities loaned. Collateral equivalent to at least 100% of the market value of securities on loan is maintained at all times. Collateral is either in the form of cash, which can be invested in certain money market mutual funds managed by the Adviser, or U.S. Government and Agency securities. The fund is entitled to receive all dividends, interest and distributions on securities loaned, in addition to income earned as a result of the lending transaction. Should a borrower fail to return the securities in a timely manner, BNY Mellon is required to replace the securities for the benefit of the fund or credit the fund with the market value of the unreturned
38
securities and is subrogated to the fund’s rights against the borrower and the collateral. Additionally, the contractual maturity of security lending transactions are on an overnight and continuous basis. During the period ended October 31, 2022, BNY Mellon earned $265 from the lending of the fund’s portfolio securities, pursuant to the securities lending agreement.
(d) Affiliated issuers: Investments in other investment companies advised by the Adviser are considered “affiliated” under the Act.
(e) Market Risk: The value of the securities in which the fund invests may be affected by political, regulatory, economic and social developments, and developments that impact specific economic sectors, industries or segments of the market. The value of a security may also decline due to general market conditions that are not specifically related to a particular company or industry, such as real or perceived adverse economic conditions, changes in the general outlook for corporate earnings, changes in interest or currency rates, changes to inflation, adverse changes to credit markets or adverse investor sentiment generally. In addition, turbulence in financial markets and reduced liquidity in equity, credit and/or fixed income markets may negatively affect many issuers, which could adversely affect the fund. Global economies and financial markets are becoming increasingly interconnected, and conditions and events in one country, region or financial market may adversely impact issuers in a different country, region or financial market. These risks may be magnified if certain events or developments adversely interrupt the global supply chain; in these and other circumstances, such risks might affect companies world-wide. Recent examples include pandemic risks related to COVID-19 and aggressive measures taken world-wide in response by governments, including closing borders, restricting international and domestic travel, and the imposition of prolonged quarantines of large populations, and by businesses, including changes to operations and reducing staff.
Foreign Investment Risk: To the extent the fund invests in foreign securities, the fund’s performance will be influenced by political, social and economic factors affecting investments in foreign issuers. Special risk associated with investments in foreign issuers include exposure to currency fluctuations, less liquidity, less developed or less efficient trading markets, lack of comprehensive company information, political and economic instability and differing auditing and legal standards.
Non-Diversification Risk: The fund is non-diversified, which means that the fund may invest a relatively high percentage of its assets in a limited number of issuers. Therefore, the fund’s performance may be more vulnerable to changes in the market value of a single issuer or group of
39
NOTES TO FINANCIAL STATEMENTS (continued)
issuers and more susceptible to risks associated with a single economic, political or regulatory occurrence than a diversified fund.
Debt Risk: The fund invests primarily in debt securities. Failure of an issuer of the debt securities to make timely interest or principal payments, or a decline or the perception of a decline in the credit quality of a debt security, can cause the debt security’s price to fall, potentially lowering the fund’s share price. In addition, the value of debt securities may decline due to general market conditions that are not specifically related to a particular issuer, such as real or perceived adverse economic conditions, changes in outlook for corporate earnings, changes in interest or currency rates or adverse investor sentiment. Such values may also decline because of factors that affect a particular industry or country.
(f) Dividends and distributions to shareholders: Dividends and distributions are recorded on the ex-dividend date. Dividends from net investment income are normally declared and paid quarterly. Dividends from net realized capital gains, if any, are normally declared and paid annually, but the fund may make distributions on a more frequent basis to comply with the distribution requirements of the Internal Revenue Code of 1986, as amended (the “Code”). To the extent that net realized capital gains can be offset by capital loss carryovers, it is the policy of the fund not to distribute such gains. Income and capital gain distributions are determined in accordance with income tax regulations, which may differ from GAAP.
(g) Federal income taxes: It is the policy of the fund to continue to qualify as a regulated investment company, if such qualification is in the best interests of its shareholders, by complying with the applicable provisions of the Code, and to make distributions of taxable income and net realized capital gain sufficient to relieve it from substantially all federal income and excise taxes.
As of and during the period ended October 31, 2022, the fund did not have any liabilities for any uncertain tax positions. The fund recognizes interest and penalties, if any, related to uncertain tax positions as income tax expense in the Statement of Operations. During the period ended October 31, 2022, the fund did not incur any interest or penalties.
Each tax year in the four-year period ended October 31, 2022 remains subject to examination by the Internal Revenue Service and state taxing authorities.
At October 31, 2022, the components of accumulated earnings on a tax basis were as follows: accumulated capital and other losses $201,716,164 and unrealized depreciation $30,461,099.
40
The fund is permitted to carry forward capital losses for an unlimited period. Furthermore, capital loss carryovers retain their character as either short-term or long-term capital losses.
The accumulated capital loss carryover is available for federal income tax purposes to be applied against future net realized capital gains, if any, realized subsequent to October 31, 2022. The fund has $125,031,503 of short-term capital losses and $76,353,300 of long-term capital losses which can be carried forward for an unlimited period.
The tax character of distributions paid to shareholders during the fiscal years ended October 31, 2022 and October 31, 2021 were as follows: ordinary income $5,873,844 and $10,067,828, respectively.
During the period ended October 31, 2022, as a result of permanent book to tax differences, primarily due to net operating losses, the fund increased total distributable earnings (loss) by $7,618,662 and decreased paid-in capital by the same amount. Net assets and net asset value per share were not affected by this reclassification.
(h) New accounting pronouncements: In March 2020, the FASB issued Accounting Standards Update 2020-04, Reference Rate Reform (Topic 848): Facilitation of the Effects of Reference Rate Reform on Financial Reporting (“ASU 2020-04”), and in January 2021, the FASB issued Accounting Standards Update 2021-01, Reference Rate Reform (Topic 848): Scope (“ASU 2021-01”), which provides optional, temporary relief with respect to the financial reporting of contracts subject to certain types of modifications due to the planned discontinuation of the LIBOR and other interbank offered rates as of the end of 2021. The temporary relief provided by ASU 2020-04 and ASU 2021-01 is effective for certain reference rate-related contract modifications that occur during the period from March 12, 2020 through December 31, 2022 (“FASB Effective Date”). Management had evaluated the impact of ASU 2020-04 and ASU 2021-01 on the fund’s investments, derivatives, debt and other contracts that will undergo reference rate-related modifications as a result of the Reference Rate Reform. Management will be adopting ASU 2020-04 and ASU 2021-01 on FASB Effective Date or if amended ASU 2020-04 new extended FASB Effective Date, if any. Management will continue to work with other financial institutions and counterparties to modify contracts as required by applicable regulation and within the regulatory deadlines.
NOTE 2—Bank Lines of Credit:
The fund participates with other long-term open-end funds managed by the Adviser in a $823.5 million unsecured credit facility led by Citibank, N.A. (the “Citibank Credit Facility”) and a $300 million unsecured credit
41
NOTES TO FINANCIAL STATEMENTS (continued)
facility provided by BNY Mellon (the “BNYM Credit Facility”), each to be utilized primarily for temporary or emergency purposes, including the financing of redemptions (each, a “Facility”). The Citibank Credit Facility is available in two tranches: (i) Tranche A is in an amount equal to $688.5 million and is available to all long-term open-ended funds, including the fund, and (ii) Tranche B is an amount equal to $135 million and is available only to BNY Mellon Floating Rate Income Fund, a series of BNY Mellon Investment Funds IV, Inc. In connection therewith, the fund has agreed to pay its pro rata portion of commitment fees for Tranche A of the Citibank Credit Facility and the BNYM Credit Facility. Interest is charged to the fund based on rates determined pursuant to the terms of the respective Facility at the time of borrowing.
The average amount of borrowings outstanding under the Facilities during the period ended October 31, 2022 was approximately $27,945 with a related weighted average annualized interest rate of 3.19%.
NOTE 3—Management Fee, Sub-Advisory Fee and Other Transactions with Affiliates:
(a) Pursuant to a management agreement with the Adviser and the Trust, the Trust has agreed to pay the Adviser a management fee computed at the annual rate of .50% of the value of the fund’s average daily net assets and is payable monthly. The Adviser has contractually agreed, from November 1, 2021 through March 1, 2023, to waive receipt of its fees and/or assume the direct expenses of the Class A shares of the fund, so that the direct expenses of Class A shares (excluding Shareholder Services Plan fees, taxes, interest expense, brokerage commissions, commitment fees on borrowing and extraordinary expenses) do not exceed .77% of the value of the fund’s average daily net assets. On or after March 1, 2023, the Adviser may terminate this expense limitation at any time. The reduction in expenses, pursuant to the undertaking, amounted to $178,860 during the period ended October 31, 2022.
Pursuant to a sub-investment advisory agreement between the Adviser and the Sub-Adviser, the Adviser pays the Sub-Adviser a monthly fee at an annual rate of .24% of the value of the fund’s average daily net assets.
During the period ended October 31, 2022, the Distributor retained $1 from commissions earned on sales of the fund’s Class A shares and $5 from CDSC fees on redemptions of the fund’s Class C shares.
(b) Under the Distribution Plan adopted pursuant to Rule 12b-1 under the Act, Class C shares pay the Distributor for distributing its shares at an annual rate of .75% of the value of its average daily net assets. The Distributor may pay one or more Service Agents in respect of advertising,
42
marketing and other distribution services, and determines the amounts, if any, to be paid to Service Agents and the basis on which such payments are made. During the period ended October 31, 2022, Class C shares were charged $16,739 pursuant to the Distribution Plan.
(c) Under the Shareholder Services Plan, Class A and Class C shares pay the Distributor at an annual rate of .25% of the value of their average daily net assets for the provision of certain services. The services provided may include personal services relating to shareholder accounts, such as answering shareholder inquiries regarding the fund, and services related to the maintenance of shareholder accounts. The Distributor may make payments to Service Agents (securities dealers, financial institutions or other industry professionals) with respect to these services. The Distributor determines the amounts to be paid to Service Agents. During the period ended October 31, 2022, Class A and Class C shares were charged $82,173 and $5,580, respectively, pursuant to the Shareholder Services Plan.
Under its terms, the Distribution Plan and Shareholder Services Plan shall remain in effect from year to year, provided such continuance is approved annually by a vote of a majority of those Trustees who are not “interested persons” of the Trust and who have no direct or indirect financial interest in the operation of or in any agreement related to the Distribution Plan or Shareholder Services Plan.
The fund has an arrangement with BNY Mellon Transfer, Inc., (the “Transfer Agent”), a subsidiary of BNY Mellon and an affiliate of the Adviser, whereby the fund may receive earnings credits when positive cash balances are maintained, which are used to offset Transfer Agent fees. For financial reporting purposes, the fund includes transfer agent net earnings credits, if any, as an expense offset in the Statement of Operations.
The fund has an arrangement with The Bank of New York Mellon (the “Custodian”), a subsidiary of BNY Mellon and an affiliate of the Adviser, whereby the fund will receive interest income or be charged overdraft fees when cash balances are maintained. For financial reporting purposes, the fund includes this interest income and overdraft fees, if any, as interest income in the Statement of Operations.
The fund compensates the Transfer Agent, under a transfer agency agreement, for providing transfer agency and cash management services for the fund. The majority of Transfer Agent fees are comprised of amounts paid on a per account basis, while cash management fees are related to fund subscriptions and redemptions. During the period ended October 31, 2022, the fund was charged $33,247 for transfer agency
43
NOTES TO FINANCIAL STATEMENTS (continued)
services. These fees are included in Shareholder servicing costs in the Statement of Operations. These fees were partially offset by earnings credits of $1,012.
The fund compensates the Custodian, under a custody agreement, for providing custodial services for the fund. These fees are determined based on net assets, geographic region and transaction activity. During the period ended October 31, 2022, the fund was charged $47,871 pursuant to the custody agreement.
During the period ended October 31, 2022, the fund was charged $17,405 for services performed by the fund’s Chief Compliance Officer and his staff. These fees are included in Chief Compliance Officer fees in the Statement of Operations.
The components of “Due to BNY Mellon Investment Adviser, Inc. and affiliates” in the Statement of Assets and Liabilities consist of: management fee of $82,863, Distribution Plan fees of $1,121, Shareholder Services Plan fees of $5,734, Custodian fees of $23,527, Chief Compliance Officer fees of $5,078 and Transfer Agent fees of $3,974, which are offset against an expense reimbursement currently in effect in the amount of $7,134.
(d) Each Board member also serves as a Board member of other funds in the BNY Mellon Family of Funds complex. Annual retainer fees and attendance fees are allocated to each fund based on net assets.
NOTE 4—Securities Transactions:
The aggregate amount of purchases and sales (including paydowns) of investment securities, excluding short-term securities, futures, options transactions, forward contracts and swap agreements, during the period ended October 31, 2022, amounted to $422,084,245 and $496,445,531, respectively.
Derivatives: A derivative is a financial instrument whose performance is derived from the performance of another asset. The fund enters into International Swaps and Derivatives Association, Inc. Master Agreements or similar agreements (collectively, “Master Agreements”) with its OTC derivative contract counterparties in order to, among other things, reduce its credit risk to counterparties. Master Agreements include provisions for general obligations, representations, collateral and events of default or termination. Under a Master Agreement, the fund may offset with the counterparty certain derivative financial instruments’ payables and/or receivables with collateral held and/or posted and create one single net payment in the event of default or termination. The SEC recently adopted Rule 18f-4 under the Act, which, effective August 18, 2022, regulates the
44
use of derivatives transactions for certain funds registered under the Act. The fund's derivative transactions are subject to a value-at-risk leverage limit and certain reporting and other requirements pursuant to a derivatives risk management program adopted by the fund.
Each type of derivative instrument that was held by the fund during the period ended October 31, 2022 is discussed below.
Futures: In the normal course of pursuing its investment objective, the fund is exposed to market risk, including interest rate risk, as a result of changes in value of underlying financial instruments. The fund invests in futures in order to manage its exposure to or protect against changes in the market. A futures contract represents a commitment for the future purchase or a sale of an asset at a specified date. Upon entering into such contracts, these investments require initial margin deposits with a counterparty, which consist of cash or cash equivalents. The amount of these deposits is determined by the exchange or Board of Trade on which the contract is traded and is subject to change. Accordingly, variation margin payments are received or made to reflect daily unrealized gains or losses which are recorded in the Statement of Operations. When the contracts are closed, the fund recognizes a realized gain or loss which is reflected in the Statement of Operations. There is minimal counterparty credit risk to the fund with futures since they are exchange traded, and the exchange guarantees the futures against default. Futures open at October 31, 2022 are set forth in the Statement of Investments.
Options Transactions: The fund purchases and writes (sells) put and call options to hedge against changes in the values of interest rate, credit, currency or as a substitute for an investment. The fund is subject to market risk, credit risk, currency risk and interest rate risk in the course of pursuing its investment objectives through its investments in options contracts. A call option gives the purchaser of the option the right (but not the obligation) to buy, and obligates the writer to sell, the underlying financial instrument at the exercise price at any time during the option period, or at a specified date. Conversely, a put option gives the purchaser of the option the right (but not the obligation) to sell, and obligates the writer to buy the underlying financial instrument at the exercise price at any time during the option period, or at a specified date.
As a writer of call options, the fund receives a premium at the outset and then bears the market risk of unfavorable changes in the price of the financial instrument underlying the option. Generally, the fund realizes a gain, to the extent of the premium, if the price of the underlying financial instrument decreases between the date the option is written and the date on which the option is terminated. Generally, the fund incurs a loss if the
45
NOTES TO FINANCIAL STATEMENTS (continued)
price of the financial instrument increases between those dates. The maximum payout for those contracts is limited to the number of call option contracts written and the related strike prices, respectively.
As a writer of put options, the fund receives a premium at the outset and then bears the market risk of unfavorable changes in the price of the financial instrument underlying the option. Generally, the fund realizes a gain, to the extent of the premium, if the price of the underlying financial instrument increases between the date the option is written and the date on which the option is terminated. Generally, the fund incurs a loss if the price of the financial instrument decreases between those dates. The maximum payout for those contracts is limited to the number of put option contracts written and the related strike prices, respectively.
As a writer of an option, the fund has no control over whether the underlying financial instrument may be sold (call) or purchased (put) and as a result bears the market risk of an unfavorable change in the price of the financial instrument underlying the written option. There is a risk of loss from a change in value of such options which may exceed the related premiums received. This risk is mitigated by Master Agreements between the fund and the counterparty and the posting of collateral, if any, by the counterparty to the fund to cover the fund’s exposure to the counterparty. The Statement of Operations reflects any unrealized gains or losses which occurred during the period as well as any realized gains or losses which occurred upon the expiration or closing of the option transaction. Swaptions purchase and write options on swaps (“swaptions”) primarily preserve a return or spread on a particular investment or portion of the fund holdings. The purchaser and writer of a swaption is buying or granting the right to enter into a previously agreed upon interest rate or credit default swap agreement (interest rate risk and/or credit risk) at any time before the expiration of the option. Options purchased and written open at October 31, 2022 are set forth in the Statement of Investments.
Forward Foreign Currency Exchange Contracts: The fund enters into forward contracts in order to hedge its exposure to changes in foreign currency exchange rates on its foreign portfolio holdings, to settle foreign currency transactions or as a part of its investment strategy. When executing forward contracts, the fund is obligated to buy or sell a foreign currency at a specified rate on a certain date in the future. With respect to sales of forward contracts, the fund incurs a loss if the value of the contract increases between the date the forward contract is opened and the date the forward contract is closed. The fund realizes a gain if the value of the contract decreases between those dates. With respect to purchases of forward contracts, the fund incurs a loss if the value of the contract
46
decreases between the date the forward contract is opened and the date the forward contract is closed. The fund realizes a gain if the value of the contract increases between those dates. Any realized or unrealized gains or losses which occurred during the period are reflected in the Statement of Operations. The fund is exposed to foreign currency risk as a result of changes in value of underlying financial instruments. The fund is also exposed to credit risk associated with counterparty non-performance on these forward contracts, which is generally limited to the unrealized gain on each open contract. This risk may be mitigated by Master Agreements, if any, between the fund and the counterparty and the posting of collateral, if any, by the counterparty to the fund to cover the fund’s exposure to the counterparty. Forward contracts open at October 31, 2022 are set forth in the Statement of Investments.
Swap Agreements: The fund enters into swap agreements to exchange the interest rate on, or return generated by, one nominal instrument for the return generated by another nominal instrument. Swap agreements are privately negotiated in the OTC market or centrally cleared. The fund enters into these agreements to hedge certain market or interest rate risks, to manage the interest rate sensitivity (sometimes called duration) of fixed income securities, to provide a substitute for purchasing or selling particular securities or to increase potential returns.
For OTC swaps, the fund accrues for interim payments on a daily basis, with the net amount recorded within unrealized appreciation (depreciation) on swap agreements in the Statement of Assets and Liabilities. Once the interim payments are settled in cash, the net amount is recorded as a realized gain (loss) on swaps, in addition to realized gain (loss) recorded upon the termination of swap agreements in the Statement of Operations. Upfront payments made and/or received by the fund, are recorded as an asset and/or liability in the Statement of Assets and Liabilities and are recorded as a realized gain or loss ratably over the agreement’s term/event with the exception of forward starting interest rate swaps which are recorded as realized gains or losses on the termination date.
Upon entering into centrally cleared swap agreements, an initial margin deposit is required with a counterparty, which consists of cash or cash equivalents. The amount of these deposits is determined by the exchange on which the agreement is traded and is subject to change. The change in valuation of centrally cleared swaps is recorded as a receivable or payable for variation margin in the Statement of Assets and Liabilities. Payments received from (paid to) the counterparty, including upon termination, are recorded as realized gain (loss) in the Statement of Operations.
47
NOTES TO FINANCIAL STATEMENTS (continued)
Fluctuations in the value of swap agreements are recorded for financial statement purposes as unrealized appreciation or depreciation on swap agreements.
Interest Rate Swaps: Interest rate swaps involve the exchange of commitments to pay and receive interest based on a notional principal amount. The fund may elect to pay a fixed rate and receive a floating rate, or receive a fixed rate and pay a floating rate on a notional principal amount. The net interest received or paid on interest rate swap agreements is included within realized gain (loss) on swap agreements in the Statement of Operations. Interest rate swap agreements are subject to general market risk, liquidity risk, counterparty risk and interest rate risk.
For OTC swaps, the fund’s maximum risk of loss from counterparty risk is the discounted value of the cash flows to be received from the counterparty over the agreement’s remaining life, to the extent that the amount is positive. This risk may be mitigated by Master Agreements, if any, between the fund and the counterparty and the posting of collateral, if any, by the counterparty to the fund to cover the fund’s exposure to the counterparty. There is minimal counterparty risk to the fund with centrally cleared swaps since they are exchange traded and the exchange guarantees these swaps against default. Interest rate swaps open at October 31, 2022 are set forth in the Statement of Investments.
Credit Default Swaps: Credit default swaps involve commitments to pay a fixed interest rate in exchange for payment if a credit event affecting a third party (the referenced obligation or index) occurs. Credit events may include a failure to pay interest or principal, bankruptcy, or restructuring. The fund enters into these agreements to manage its exposure to the market or certain sectors of the market, to reduce its risk exposure to defaults of corporate and sovereign issuers, or to create exposure to corporate or sovereign issuers to which it is not otherwise exposed. For those credit default swaps in which the fund is paying a fixed rate, the fund is buying credit protection on the instrument. In the event of a credit event, the fund would receive the full notional amount for the reference obligation. For those credit default swaps in which the fund is receiving a fixed rate, the fund is selling credit protection on the underlying instrument. The maximum payouts for these agreements are limited to the notional amount of each swap. Credit default swaps may involve greater risks than if the fund had invested in the reference obligation directly and are subject to general market risk, liquidity risk, counterparty risk and credit risk. This risk may be mitigated by Master Agreements, if any, between the fund and the counterparty and the posting of collateral, if any, by the counterparty to the fund to cover the fund’s exposure to the counterparty.
48
The maximum potential amount of future payments (undiscounted) that a fund as a seller of protection could be required to make under a credit default swap agreement would be an amount equal to the notional amount of the agreement which may exceed the amount of unrealized appreciation or depreciation reflected in the Statement of Assets and Liabilities. Notional amounts of all credit default swap agreements are disclosed in the Statement of Swap Agreements, which summarizes open credit default swaps entered into by the fund. These potential amounts would be partially offset by any recovery values of the respective referenced obligations, underlying securities comprising the referenced index, upfront payments received upon entering into the agreement, or net amounts received from the settlement of buy protection credit default swap agreements entered into by the fund for the same referenced entity or entities. Credit default swaps open at October 31, 2022 are set forth in the Statement of Investments.
GAAP requires disclosure for (i) the nature and terms of the credit derivative, reasons for entering into the credit derivative, the events or circumstances that would require the seller to perform under the credit derivative, and the current status of the payment/performance risk of the credit derivative, (ii) the maximum potential amount of future payments (undiscounted) the seller could be required to make under the credit derivative, (iii) the fair value of the credit derivative, and (iv) the nature of any recourse provisions and assets held either as collateral or by third parties. All required disclosures have been made and are incorporated within the current period as part of the Notes to the Statement of Investments and disclosures within this Note.
The following tables show the fund’s exposure to different types of market risk as it relates to the Statement of Assets and Liabilities and the Statement of Operations, respectively.
49
NOTES TO FINANCIAL STATEMENTS (continued)
Fair value of derivative instruments as of October 31, 2022 is shown below:
| | | | | | | | |
| | Derivative
Assets ($) | | | | Derivative
Liabilities ($) | |
Interest rate risk | 3,191,119 | 1,2 | Interest rate risk | (133,584) | 1,3 |
Foreign exchange risk | 651,527 | 4,5 | Foreign exchange risk | (1,388,093) | 3,5 |
Credit risk | 113,415 | 2 | Credit risk | (962,995) | 2,3 |
Gross fair value of
derivative contracts | 3,956,061 | | | | (2,484,672) | |
| | | | | | |
| Statement of Assets and Liabilities location: | |
1 | Includes cumulative appreciation (depreciation) on futures as reported in the Statement of Futures, but only the
unpaid variation margin is reported in the Statement of Assets and Liabilities. |
2 | Includes cumulative appreciation (depreciation) on swap agreements as reported in the Statement of Swap
Agreements. Unrealized appreciation (depreciation) on OTC swap agreements and only unpaid variation
margin on cleared swap agreements, are reported in the Statement of Assets and Liabilities. |
3 | Outstanding options written, at value. | |
4 | Options purchased are included in Investments in securities—Unaffiliated issuers, at value. |
5 | Unrealized appreciation (depreciation) on forward foreign currency exchange contracts. |
The effect of derivative instruments in the Statement of Operations during the period ended October 31, 2022 is shown below:
| | | | | | | | | | | | |
Amount of realized gain (loss) on derivatives recognized in income ($) | |
Underlying
risk | Futures | 1 | Options
Transactions | 2 | Forward
Contracts | 3 | Swap
Agreements | 4 | Total | |
Interest rate | 2,742,807 | | 366,073 | | - | | 3,793,206 | | 6,902,086 | |
Foreign
exchange | - | | (142,511) | | (9,922,251) | | - | | (10,064,762) | |
Credit | - | | 433,231 | | - | | 907,815 | | 1,341,046 | |
Total | 2,742,807 | | 656,793 | | (9,922,251) | | 4,701,021 | | (1,821,630) | |
| | | | | | | | | | |
Net change in unrealized appreciation (depreciation)
on derivatives recognized in income ($) | |
Underlying
risk | Futures | 5 | Options
Transactions | 6 | Forward
Contracts | 7 | Swap
Agreements | 8 | Total | |
Interest rate | 848,525 | | 61,253 | | - | | 3,115,321 | | 4,025,099 | |
Foreign
exchange | - | | (12,052) | | (1,098,800) | | - | | (1,110,852) | |
Credit | - | | 68,689 | | - | | (533,006) | | (464,317) | |
Total | 848,525 | | 117,890 | | (1,098,800) | | 2,582,315 | | 2,449,930 | |
| | | | | | | | | | | |
| Statement of Operations location: | |
1 | Net realized gain (loss) on futures. | | |
2 | Net realized gain (loss) on options transactions. |
3 | Net realized gain (loss) on forward foreign currency exchange contracts. | | |
4 | Net realized gain (loss) on swap agreements. | | |
5 | Net change in unrealized appreciation (depreciation) on futures. | | |
6 | Net change in unrealized appreciation (depreciation) on options transactions. | | |
7 | Net change in unrealized appreciation (depreciation) on forward foreign currency exchange contracts. | |
8 | Net change in unrealized appreciation (depreciation) on swap agreements. | | |
50
The provisions of ASC Topic 210 “Disclosures about Offsetting Assets and Liabilities” require disclosure on the offsetting of financial assets and liabilities. These disclosures are required for certain investments, including derivative financial instruments subject to Master Agreements which are eligible for offsetting in the Statement of Assets and Liabilities and require the fund to disclose both gross and net information with respect to such investments. For financial reporting purposes, the fund does not offset derivative assets and derivative liabilities that are subject to Master Agreements in the Statement of Assets and Liabilities.
At October 31, 2022, derivative assets and liabilities (by type) on a gross basis are as follows:
| | | | | | |
Derivative Financial Instruments: | | Assets ($) | | Liabilities ($) | |
Futures | | 449,175 | | (59,147) | |
Options | | 44,596 | | (421,751) | |
Forward contracts | | 606,931 | | (1,343,497) | |
Swaps | | 2,855,359 | | (660,277) | |
Total gross amount of derivative | | | | | |
assets and liabilities in the | | | | | |
Statement of Assets and Liabilities | | 3,956,061 | | (2,484,672) | |
Derivatives not subject to | | | | | |
Master Agreements | | (3,304,534) | | 793,861 | |
Total gross amount of assets | | | | | |
and liabilities subject to | | | | | |
Master Agreements | | 651,527 | | (1,690,811) | |
The following tables present derivative assets and liabilities net of amounts available for offsetting under Master Agreements and net of related collateral received or pledged, if any, as of October 31, 2022:
| | | | | | | |
| | | Financial | | | |
| | | Instruments | | | |
| | | and Derivatives | | | |
| Gross Amount of | | Available | Collateral | | Net Amount of |
Counterparty | Assets ($) | 1 | for Offset ($) | Received ($) | 2 | Assets ($) |
Barclays Capital, Inc. | 112,490 | | (91,510) | - | | 20,980 |
Citigroup Global
Markets Inc. | 67,143 | | (67,143) | - | | - |
Goldman
Sachs & Co. LLC | 105,880 | | (105,880) | - | | - |
HSBC Securities
(USA) Inc. | 45,396 | | (45,396) | - | | - |
J.P. Morgan
Securities LLC | 320,618 | | (114,246) | - | | 206,372 |
Total | 651,527 | | (424,175) | - | | 227,352 |
| | | | | | |
51
NOTES TO FINANCIAL STATEMENTS (continued)
| | | | | | | |
| | | Financial | | | |
| | | Instruments | | | |
| | | and Derivatives | | | |
| Gross Amount of | | Available | Collateral | | Net Amount of |
Counterparty | Liabilities ($) | 1 | for Offset ($) | Pledged ($) | 2 | Liabilities ($) |
Barclays Capital, Inc. | (91,510) | | 91,510 | - | | - |
Citigroup Global
Markets Inc. | (345,637) | | 67,143 | 278,494 | | - |
Goldman
Sachs & Co. LLC | (859,762) | | 105,880 | 710,000 | | (43,882) |
HSBC Securities
(USA) Inc. | (279,656) | | 45,396 | 90,000 | | (144,260) |
J.P. Morgan
Securities LLC | (114,246) | | 114,246 | - | | - |
Total | (1,690,811) | | 424,175 | 1,078,494 | | (188,142) |
| | | | | | |
1 Absent a default event or early termination, OTC derivative assets and liabilities are presented at gross amounts
and are not offset in the Statement of Assets and Liabilities. |
2 In some instances, the actual collateral received and/or pledged may be more than the amount shown due to
over collateralization. |
The following summarizes the average market value of derivatives outstanding during the period ended October 31, 2022:
| | | |
| | Average Market Value ($) |
Interest rate futures | | 108,506,077 |
Interest rate options contracts | | 72,163 |
Foreign currency options contracts | | 180,289 |
Forward contracts | | 188,930,528 |
Credit options contracts | | 178,617 |
The following summarizes the average notional value of swap agreements outstanding during the period ended October 31, 2022:
| | | |
| | Average Notional Value ($) |
Interest rate swap agreements | | 45,107,879 |
Credit default swap agreements | | 80,639,077 |
| | |
At October 31, 2022, the cost of investments for federal income tax purposes was $227,635,856; accordingly, accumulated net unrealized depreciation on investments inclusive of derivative contracts was $30,482,242, consisting of $5,283,369 gross unrealized appreciation and $35,765,611 gross unrealized depreciation.
52
REPORT OF INDEPENDENT REGISTERED PUBLIC ACCOUNTING FIRM
To the Shareholders of the Fund and Board of Trustees of
BNY Mellon Investment Funds III:
Opinion on the Financial Statements
We have audited the accompanying statement of assets and liabilities of BNY Mellon International Bond Fund (the Fund), a series of BNY Mellon Investment Funds III, including the statement of investments, as of October 31, 2022, the related statement of operations for the year then ended, the statements of changes in net assets for each of the years in the two-year period then ended, and the related notes (collectively, the financial statements), and the financial highlights for each of the years in the five-year period then ended. In our opinion, the financial statements and financial highlights present fairly, in all material respects, the financial position of the Fund as of October 31, 2022, the results of its operations for the year then ended, the changes in its net assets for each of the years in the two-year period then ended, and the financial highlights for each of the years in the five-year period then ended, in conformity with U.S. generally accepted accounting principles.
Basis for Opinion
These financial statements and financial highlights are the responsibility of the Fund’s management. Our responsibility is to express an opinion on these financial statements and financial highlights based on our audits. We are a public accounting firm registered with the Public Company Accounting Oversight Board (United States) (PCAOB) and are required to be independent with respect to the Fund in accordance with the U.S. federal securities laws and the applicable rules and regulations of the Securities and Exchange Commission and the PCAOB.
We conducted our audits in accordance with the standards of the PCAOB. Those standards require that we plan and perform the audit to obtain reasonable assurance about whether the financial statements and financial highlights are free of material misstatement, whether due to error or fraud. Our audits included performing procedures to assess the risks of material misstatement of the financial statements and financial highlights, whether due to error or fraud, and performing procedures that respond to those risks. Such procedures included examining, on a test basis, evidence regarding the amounts and disclosures in the financial statements and financial highlights. Such procedures also included confirmation of securities owned as of October 31, 2022, by correspondence with the custodian and brokers or by other appropriate auditing procedures when replies from brokers were not received. Our audits also included evaluating the accounting principles used and significant estimates made by management, as well as evaluating the overall presentation of the financial statements and financial highlights. We believe that our audits provide a reasonable basis for our opinion.

We have served as the auditor of one or more BNY Mellon Investment Adviser, Inc. investment companies since 1994.
New York, New York
December 23, 2022
53
IMPORTANT TAX INFORMATION (Unaudited)
For federal tax purposes the fund designates the maximum amount allowable but not less than 22.07% as interest-related dividends in accordance with Sections 871(k)(1) and 881(e) of the Internal Revenue Code.
54
BOARD MEMBERS INFORMATION (Unaudited)
Independent Board Members
Joseph S. DiMartino (79)
Chairman of the Board (1999)
Principal Occupation During Past 5 Years:
· Director or Trustee of funds in the BNY Mellon Family of Funds and certain other entities (as described in the fund’s Statement of Additional Information) (1995-Present)
Other Public Company Board Memberships During Past 5 Years:
· CBIZ, Inc., a public company providing professional business services, products and solutions, Director (1997-Present)
No. of Portfolios for which Board Member Serves: 94
———————
Francine J. Bovich (71)
Board Member (2012)
Principal Occupation During Past 5 Years:
· The Bradley Trusts, private trust funds, Trustee (2011-Present)
Other Public Company Board Memberships During Past 5 Years:
· Annaly Capital Management, Inc., a real estate investment trust, Director (2014-Present)
No. of Portfolios for which Board Member Serves: 54
———————
Andrew J. Donohue (72)
Board Member (2019)
Principal Occupation During Past 5 Years:
· Attorney, Solo Law Practice (2019-Present)
· Shearman & Sterling LLP. a law firm, Of Counsel (2017-2019)
· Chief of Staff to the Chair of the SEC (2015-2017)
Other Public Company Board Memberships During Past 5 Years:
· Oppenheimer Funds (58 funds), Director (2017-2019)
No. of Portfolios for which Board Member Serves: 44
———————
55
BOARD MEMBERS INFORMATION (Unaudited) (continued)
Kenneth A. Himmel (76)
Board Member (1988)
Principal Occupation During Past 5 Years:
· Gulf Related, an international real estate development company, Managing Partner (2010-Present)
· Related Urban Development, a real estate development company, President and Chief Executive Officer (1996-Present)
· American Food Management, a restaurant company, Chief Executive Officer (1983-Present)
· Himmel & Company, a real estate development company, President and Chief Executive Officer (1980-Present)
No. of Portfolios for which Board Member Serves: 22
———————
Roslyn M. Watson (73)
Board Member (1992)
Principal Occupation During Past 5 Years:
· Watson Ventures, Inc., a real estate investment company, Principal (1993-Present)
Other Public Company Board Memberships During Past 5 Years:
· American Express Bank, FSB, Director (1993-2018)
No. of Portfolios for which Board Member Serves: 44
———————
Benaree Pratt Wiley (76)
Board Member (1998)
Principal Occupation During Past 5 Years:
· The Wiley Group, a firm specializing in strategy and business development, Principal (2005-Present)
Other Public Company Board Memberships During Past 5 Years:
· CBIZ, Inc., a public company providing professional business services, products and solutions, Director (2008-Present)
· Blue Cross-Blue Shield of Massachusetts, Director (2004-2020)
No. of Portfolios for which Board Member Serves: 61
———————
56
Interested Board Member
Bradley Skapyak (63)
Board Member (2021)
Principal Occupation During Past 5 Years:
· Chief Operating Officer and Director of The Dreyfus Corporation (2009-2019)
· Chief Executive Officer and Director of the Distributor (2016-2019)
· Chairman and Director of The Dreyfus Transfer Agent, Inc. (2011-2019)
· Senior Vice President of The Bank of New York Mellon (2007-2019)
No. of Portfolios for which Board Member Serves: 22
Mr. Skapyak is deemed to be an Interested Board Member of the fund as a result of his ownership of unvested restricted stock units of BNY Mellon.
———————
The address of the Board Members and Officers is c/o BNY Mellon Investment Adviser, Inc., 240 Greenwich Street, New York, New York 10286. Additional information about each Board Member is available in the fund’s Statement of Additional Information which can be obtained from the Adviser free of charge by calling this toll free number: 1-800-373-9387.
57
OFFICERS OF THE FUND (Unaudited)
DAVID DIPETRILLO, President since January 2021.
Vice President and Director of the Adviser since February 2021; Head of North America Product, BNY Mellon Investment Management since January 2018; and Director of Product Strategy, BNY Mellon Investment Management from January 2016 to December 2017. He is an officer of 55 investment companies (comprised of 109 portfolios) managed by the Adviser or an affiliate of the Adviser. He is 44 years old and has been an employee of BNY Mellon since 2005.
JAMES WINDELS, Treasurer since November 2001.
Vice President of the Adviser since September 2020; and Director–BNY Mellon Fund Administration. He is an officer of 56 investment companies (comprised of 130 portfolios) managed by the Adviser or an affiliate of the Adviser. He is 64 years old and has been an employee of the Adviser since April 1985.
PETER M. SULLIVAN, Chief Legal Officer since July 2021 and Vice President and Assistant Secretary since March 2019.
Chief Legal Officer of the Adviser and Associate General Counsel of BNY Mellon since July 2021; Senior Managing Counsel of BNY Mellon from December 2020 to July 2021; and Managing Counsel of BNY Mellon from March 2009 to December 2020. He is an officer of 56 investment companies (comprised of 130 portfolios) managed by the Adviser or an affiliate of the Adviser. He is 54 years old and has been an employee of BNY Mellon since April 2004.
JAMES BITETTO, Vice President since August 2005 and Secretary since February 2018.
Senior Managing Counsel of BNY Mellon since December 2019; Managing Counsel of BNY Mellon from April 2014 to December 2019; and Secretary of the Adviser. He is an officer of 56 investment companies (comprised of 130 portfolios) managed by the Adviser or an affiliate of the Adviser. He is 56 years old and has been an employee of the Adviser since December 1996.
DEIRDRE CUNNANE, Vice President and Assistant Secretary since March 2019.
Managing Counsel of BNY Mellon since December 2021, Counsel of BNY Mellon from August 2018 to December 2021; and Senior Regulatory Specialist at BNY Mellon Investment Management Services from February 2016 to August 2018. She is an officer of 56 investment companies (comprised of 130 portfolios) managed by the Adviser or an affiliate of the Adviser. She is 32 years old and has been an employee of the Adviser since August 2018.
SARAH S. KELLEHER, Vice President and Assistant Secretary since April 2014.
Vice President of BNY Mellon ETF Investment Adviser; LLC since February 2020; Senior Managing Counsel of BNY Mellon since September 2021; Managing Counsel of BNY Mellon from December 2017 to September 2021; and Senior Counsel of BNY Mellon from March 2013 to December 2017. She is an officer of 56 investment companies (comprised of 130 portfolios) managed by the Adviser or an affiliate of the Adviser. She is 47 years old and has been an employee of the Adviser since March 2013.
JEFF PRUSNOFSKY, Vice President and Assistant Secretary since August 2005.
Senior Managing Counsel of BNY Mellon. He is an officer of 56 investment companies (comprised of 130 portfolios) managed by the Adviser or an affiliate of the Adviser. He is 57 years old and has been an employee of the Adviser since October 1990.
AMANDA QUINN, Vice President and Assistant Secretary since March 2020.
Counsel of BNY Mellon since June 2019; Regulatory Administration Manager at BNY Mellon Investment Management Services from September 2018 to May 2019; and Senior Regulatory Specialist at BNY Mellon Investment Management Services from April 2015 to August 2018. She is an officer of 56 investment companies (comprised of 130 portfolios) managed by the Adviser or an affiliate of the Adviser. She is 37 years old and has been an employee of the Adviser since June 2019.
58
NATALYA ZELENSKY, Vice President and Assistant Secretary since March 2017.
Chief Compliance Officer since August 2021 and Vice President since February 2020 of BNY Mellon ETF Investment Adviser, LLC; Chief Compliance Officer since August 2021 and Vice President and Assistant Secretary since February 2020 of BNY Mellon ETF Trust; Managing Counsel of BNY Mellon from December 2019 to August 2021; Counsel of BNY Mellon from May 2016 to December 2019; and Assistant Secretary of the Adviser from April 2018 to August 2021. She is an officer of 55 investment companies (comprised of 129 portfolios) managed by the Adviser or an affiliate of the Adviser. She is 37 years old and has been an employee of BNY Mellon since May 2016.
DANIEL GOLDSTEIN, Vice President since March 2022.
Vice President and Head of Product Development of North America Product, BNY Mellon Investment Management since January 2018; Co-Head of Product Management, Development & Oversight of North America Product, BNY Mellon Investment Management from January 2010 to January 2018; and Senior Vice President, Development & Oversight of North America Product, BNY Mellon Investment Management since 2010. He is an officer of 55 investment companies (comprised of 109 portfolios) managed by the Adviser or an affiliate of the Adviser. He is 53 years old and has been an employee of the Distributor since 1991.
JOSEPH MARTELLA, Vice President since March 2022.
Vice President and Head of Product Management of North America Product, BNY Mellon Investment Management since January 2018; Director of Product Research and Analytics of North America Product, BNY Mellon Investment Management from January 2010 to January 2018; and Senior Vice President of North America Product, BNY Mellon Investment Management since 2010. He is an officer of 55 investment companies (comprised of 109 portfolios) managed by the Adviser or an affiliate of the Adviser. He is 46 years old and has been an employee of the Distributor since 1999.
GAVIN C. REILLY, Assistant Treasurer since December 2005.
Tax Manager–BNY Mellon Fund Administration. He is an officer of 56 investment companies (comprised of 130 portfolios) managed by the Adviser or an affiliate of the Adviser. He is 54 years old and has been an employee of the Adviser since April 1991.
ROBERT SALVIOLO, Assistant Treasurer since July 2007.
Senior Accounting Manager–BNY Mellon Fund Administration. He is an officer of 56 investment companies (comprised of 130 portfolios) managed by the Adviser or an affiliate of the Adviser. He is 55 years old and has been an employee of the Adviser since June 1989.
ROBERT SVAGNA, Assistant Treasurer since December 2002.
Senior Accounting Manager–BNY Mellon Fund Administration. He is an officer of 56 investment companies (comprised of 130 portfolios) managed by the Adviser or an affiliate of the Adviser. He is 55 years old and has been an employee of the Adviser since November 1990.
JOSEPH W. CONNOLLY, Chief Compliance Officer since October 2004.
Chief Compliance Officer of the BNY Mellon Family of Funds and BNY Mellon Funds Trust since 2004; and Chief Compliance Officer of the Adviser from 2004 until June 2021. He is an officer of 55 investment companies (comprised of 115 portfolios) managed by the Adviser. He is 65 years old.
CARIDAD M. CAROSELLA, Anti-Money Laundering Compliance Officer since January 2016.
Anti-Money Laundering Compliance Officer of the BNY Mellon Family of Funds and BNY Mellon Funds Trust. She is an officer of 48 investment companies (comprised of 122 portfolios) managed by the Adviser or an affiliate of the Adviser. She is 54 years old and has been an employee of the Distributor since 1997.
59
This page intentionally left blank.
60
This page intentionally left blank.
61
BNY Mellon International Bond Fund
240 Greenwich Street
New York, NY 10286
Adviser
BNY Mellon Investment Adviser, Inc.
240 Greenwich Street
New York, NY 10286
Sub-Adviser
Insight North America LLC
200 Park Avenue, 7th Floor
New York, NY 10166
Custodian
The Bank of New York Mellon
240 Greenwich Street
New York, NY 10286
Transfer Agent &
Dividend Disbursing Agent
BNY Mellon Transfer, Inc.
240 Greenwich Street
New York, NY 10286
Distributor
BNY Mellon Securities Corporation
240 Greenwich Street
New York, NY 10286
| | |
Ticker Symbols: | Class A: DIBAX Class C: DIBCX Class I: DIBRX Class Y: DIBYX |
Telephone Call your financial representative or 1-800-373-9387
Mail The BNY Mellon Family of Funds, 144 Glenn Curtiss Boulevard, Uniondale, NY 11556-0144
E-mail Send your request to info@bnymellon.com
Internet Information can be viewed online or downloaded at www.im.bnymellon.com
The fund files its complete schedule of portfolio holdings with the Securities and Exchange Commission (“SEC”) for the first and third quarters of each fiscal year on Form N-PORT. The fund’s Forms N-PORT are available on the SEC’s website at www.sec.gov.
A description of the policies and procedures that the fund uses to determine how to vote proxies relating to portfolio securities and information regarding how the fund voted these proxies for the most recent 12-month period ended June 30 is available at www.im.bnymellon.com and on the SEC’s website at www.sec.gov and without charge, upon request, by calling 1-800-373-9387.
| | |
© 2022 BNY Mellon Securities Corporation
6091AR1022 | 
|
Item 2. Code of Ethics.
The Registrant has adopted a code of ethics that applies to the Registrant's principal executive officer, principal financial officer, principal accounting officer or controller, or persons performing similar functions. There have been no amendments to, or waivers in connection with, the Code of Ethics during the period covered by this Report.
Item 3. Audit Committee Financial Expert.
The Registrant's Board has determined that Joseph S. DiMartino, a member of the Audit Committee of the Board, is an audit committee financial expert as defined by the Securities and Exchange Commission (the "SEC"). Joseph S. DiMartino is "independent" as defined by the SEC for purposes of audit committee financial expert determinations.
Item 4. Principal Accountant Fees and Services.
(a) Audit Fees. The aggregate fees billed for each of the last two fiscal years (the "Reporting Periods") for professional services rendered by the Registrant's principal accountant (the "Auditor") for the audit of the Registrant's annual financial statements or services that are normally provided by the Auditor in connection with the statutory and regulatory filings or engagements for the Reporting Periods, were $80,970 in 2021 and $82,600 in 2022.
(b) Audit-Related Fees. The aggregate fees billed in the Reporting Periods for assurance and related services by the Auditor that are reasonably related to the performance of the audit of the Registrant's financial statements and are not reported under paragraph (a) of this Item 4 were $10,740 in 2021 and $11,100 in 2022. These services consisted of one or more of the following: (i) agreed upon procedures related to compliance with Internal Revenue Code section 817(h), (ii) security counts required by Rule 17f-2 under the Investment Company Act of 1940, as amended, (iii) advisory services as to the accounting or disclosure treatment of Registrant transactions or events and (iv) advisory services to the accounting or disclosure treatment of the actual or potential impact to the Registrant of final or proposed rules, standards or interpretations by the Securities and Exchange Commission, the Financial Accounting Standards Boards or other regulatory or standard-setting bodies.
The aggregate fees billed in the Reporting Periods for non-audit assurance and related services by the Auditor to the Registrant's investment adviser (not including any sub-investment adviser whose role is primarily portfolio management and is subcontracted with or overseen by another investment adviser), and any entity controlling, controlled by or under common control with the investment adviser that provides ongoing services to the Registrant ("Service Affiliates"), that were reasonably related to the performance of the annual audit of the Service Affiliate, which required pre-approval by the Audit Committee were $0 in 2021 and $0 in 2022.
(c) Tax Fees. The aggregate fees billed in the Reporting Periods for professional services rendered by the Auditor for tax compliance, tax advice, and tax planning ("Tax Services") were $0 in 2021 and $0 in 2022. These services consisted of: (i) review or preparation of U.S. federal, state, local and excise tax returns; (ii) tax advice regarding tax qualification matters and/or treatment of various financial instruments held or proposed to be acquired or held, and (iii) determination of Passive Foreign Investment. The aggregate fees billed in the Reporting Periods for Tax Services by the Auditor to Service Affiliates, which required pre-approval by the Audit Committee were $0 in 2021 and $0 in 2022.
(d) All Other Fees. The aggregate fees billed in the Reporting Periods for products and services provided by the Auditor, other than the services reported in paragraphs (a) through (c) of this Item, were $0 in 2021 and $0 in 2022.
The aggregate fees billed in the Reporting Periods for Non-Audit Services by the Auditor to Service Affiliates, other than the services reported in paragraphs (b) through (c) of this Item, which required pre-approval by the Audit Committee, were $0 in 2021 and $0 in 2022.
(e)(1) Audit Committee Pre-Approval Policies and Procedures. The Registrant's Audit Committee has established policies and procedures (the "Policy") for pre-approval (within specified fee limits) of the Auditor's engagements for non-audit services to the Registrant and Service Affiliates without specific case-by-case consideration. The pre-approved services in the Policy can include pre-approved audit services, pre-approved audit-related services, pre-approved tax services and pre-approved all other services. Pre-approval considerations include whether the proposed services are compatible with maintaining the Auditor's independence. Pre-approvals pursuant to the Policy are considered annually.
(e)(2) Note. None of the services described in paragraphs (b) through (d) of this Item 4 were approved by the Audit Committee pursuant to paragraph (c)(7)(i)(C) of Rule 2-01 of Regulation S-X.
(f) None of the hours expended on the principal accountant's engagement to audit the registrant's financial statements for the most recent fiscal year were attributed to work performed by persons other than the principal accountant's full-time, permanent employees.
Non-Audit Fees. The aggregate non-audit fees billed by the Auditor for services rendered to the Registrant, and rendered to Service Affiliates, for the Reporting Periods were $3,851,043 in 2021 and $3,945,912 in 2022.
Auditor Independence. The Registrant's Audit Committee has considered whether the provision of non-audit services that were rendered to Service Affiliates, which were not pre-approved (not requiring pre-approval), is compatible with maintaining the Auditor's independence.
(j) Not applicable.
Item 5. Audit Committee of Listed Registrants.
Not applicable.
Item 6. Investments.
(a) Not applicable.
| Item 7. | Disclosure of Proxy Voting Policies and Procedures for Closed-End Management Investment Companies. |
Not applicable.
Item 8. Portfolio Managers of Closed-End Management Investment Companies.
Not applicable.
| Item 9. | Purchases of Equity Securities by Closed-End Management Investment Companies and Affiliated Purchasers. |
Not applicable.
| Item 10. | Submission of Matters to a Vote of Security Holders. |
There have been no material changes to the procedures applicable to Item 10.
| Item 11. | Controls and Procedures. |
(a) The Registrant's principal executive and principal financial officers have concluded, based on their evaluation of the Registrant's disclosure controls and procedures as of a date within 90 days of the filing date of this report, that the Registrant's disclosure controls and procedures are reasonably designed to ensure that information required to be disclosed by the Registrant on Form N-CSR is recorded, processed, summarized and reported within the required time periods and that information required to be disclosed by the Registrant in the reports that it files or submits on Form N-CSR is accumulated and communicated to the Registrant's management, including its principal executive and principal financial officers, as appropriate to allow timely decisions regarding required disclosure.
(b) There were no changes to the Registrant's internal control over financial reporting that occurred during the period covered by this report that have materially affected, or are reasonably likely to materially affect, the Registrant's internal control over financial reporting.
| Item 12. | Disclosure of Securities Lending Activities for Closed-End Management Investment Companies. |
Not applicable.
(a)(1) Code of ethics referred to in Item 2.
(a)(2) Certifications of principal executive and principal financial officers as required by Rule 30a-2(a) under the Investment Company Act of 1940.
(a)(3) Not applicable.
(b) Certification of principal executive and principal financial officers as required by Rule 30a-2(b) under the Investment Company Act of 1940.
SIGNATURES
Pursuant to the requirements of the Securities Exchange Act of 1934 and the Investment Company Act of 1940, the Registrant has duly caused this Report to be signed on its behalf by the undersigned, thereunto duly authorized.
BNY Mellon Investment Funds III
By: /s/ David J. DiPetrillo
David J. DiPetrillo
President (Principal Executive Officer)
Date: December 21, 2022
Pursuant to the requirements of the Securities Exchange Act of 1934 and the Investment Company Act of 1940, this Report has been signed below by the following persons on behalf of the Registrant and in the capacities and on the dates indicated.
By: /s/ David J. DiPetrillo
David J. DiPetrillo
President (Principal Executive Officer)
Date: December 21, 2022
By: /s/ James Windels
James Windels
Treasurer (Principal Financial Officer)
Date: December 21, 2022
EXHIBIT INDEX
(a)(1) Code of ethics referred to in Item 2.
(a)(2) Certifications of principal executive and principal financial officers as required by Rule 30a-2(a) under the Investment Company Act of 1940. (EX-99.CERT)
(b) Certification of principal executive and principal financial officers as required by Rule 30a-2(b) under the Investment Company Act of 1940. (EX-99.906CERT)