Draft
Exhibit 99.(c)(iii)
Discussion Materials for the Special Committee
K-Tel International, Inc.
December 8, 2006

Disclaimer |
| Draft |
We have been engaged by the Special Committee of K-Tel International, Inc. to render a fairness opinion with respect to a proposed transaction. These materials reflect our work to date in connection with our engagement and are subject to completion based on express transaction terms and completion of our analyses. These materials should not be taken as an indication of value or an expression of the fairness of a proposed transaction.

2
Table of Contents |
| Draft |
Section I |
| K-Tel International, Inc. Overview | |
|
|
|
|
Section II |
| Summary of Proposed Transaction | |
|
|
|
|
Section III |
| Summary of Due Diligence Procedures | |
|
|
|
|
Section IV |
| Preliminary Valuation Analyses | |
|
|
|
|
Section V |
| Appendices | |
3
| Draft |
SECTION 1
K-Tel International, Inc. Overview
4
K-Tel International, Inc. Overview |
| Draft |
· K-Tel International, Inc. (“K-Tel or the “Company”), incorporated in 1968, licenses its music catalog internationally and markets entertainment products mainly derived from its catalog through retail and direct response marketing channels in the United States and Europe.
· K-Tel’s proprietary master music catalog consists of approximately 6,000 titles consisting of original recordings and re-recordings of music from the 1950’s through today. The Company licenses the rights to its master recordings to third parties worldwide for use in albums. K-Tel also licenses its master recordings for films, television programs, commercials and electronic downloads to various media formats.
· Competitors include the following significantly larger companies:
· Sony BMG Corp.
· Time Warner, Inc.
· EMI Group PLC
· Industry Trends
· Music publishing generates high margin royalty income when a song is broadcast, sold, downloaded, used in a movie, television program, or performed publicly.
· The recorded music business is highly unpredictable and retail sales have been declining over the last several years, hurting profits at many companies.
· these trends have been particularly pronounced at K-Tel.
5
K-Tel International, Inc. Overview |
| Draft |
· Revenue has declined over the last five-years while operating losses have increased.
· Fiscal 2006 revenue fell 21% to $4.8 million from $6.0 million in fiscal 2005
· retail sales fell 54.8% to $2.1 million in fiscal 2006 from $4.6 million in fiscal 2005 due primarily to the Company’s transition from a distribution business to a licensing business.
· licensing revenue increased 84.6% in fiscal 2006
· Funding for operations has been accomplished through a combination of a revolving loan and a term loan.
· the creditor is an affiliate of K-Tel (the largest shareholder, Board Chairman, President and CEO)
· $12.4 million of total debt is outstanding as of September 30, 2006 (due July 20, 2008).
· In addition to high financial leverage, stockholders’ equity is negative $12.3 million and net working capital is negative $12.7 million, as of September 30, 2006.
· Due to significant recurring operating losses and a net working capital deficit, the Company’s auditor has issued a going concern opinion in connection with the fiscal 2006 financial statements.
6
K-Tel International, Inc. Overview |
| Draft |
Financial Summary
For the Years Ended June 30
($’s in Thousands)
|
|
|
|
|
|
|
|
|
|
|
| LTM |
| ||||||
|
| 2002 |
| 2003 |
| 2004 |
| 2005 |
| 2006 |
| 9/30/2006 |
| ||||||
Net Sales |
| $ | 6,891 |
| $ | 7,234 |
| $ | 6,679 |
| $ | 6,041 |
| $ | 4,804 |
| $ | 4,496 |
|
Cost of Goods Sold |
| 2,353 |
| 3,100 |
| 2,934 |
| 2,439 |
| 2,012 |
| 1,794 |
| ||||||
Gross Profit |
| $ | 4,538 |
| $ | 4,134 |
| $ | 3,745 |
| $ | 3,602 |
| $ | 2,792 |
| $ | 2,702 |
|
Operating Expenses |
| 4,584 |
| 3,985 |
| 3,778 |
| 3,692 |
| 3,217 |
| 3,167 |
| ||||||
Operating Income |
| $ | (46 | ) | $ | 149 |
| $ | (33 | ) | $ | (90 | ) | $ | (425 | ) | $ | (465 | ) |
Interest Expense |
| (472 | ) | (534 | ) | (497 | ) | (630 | ) | (800 | ) | (852 | ) | ||||||
Other Income (Expense) |
| (37 | ) | 74 |
| (20 | ) | 24 |
| 25 |
| 23 |
| ||||||
Pretax Income |
| $ | (555 | ) | $ | (311 | ) | $ | (550 | ) | $ | (696 | ) | $ | (1,200 | ) | $ | (1,294 | ) |
Income Taxes (Benefit) |
| (141 | ) | 0 |
| (168 | ) | (88 | ) | 0 |
| 0 |
| ||||||
Net Income (Loss) from Continuing Operations |
| $ | (414 | ) | $ | (311 | ) | $ | (382 | ) | $ | (608 | ) | $ | (1,200 | ) | $ | (1,294 | ) |
EPS - Basic and Fully Diluted |
| $ | (0.03 | ) | $ | (0.02 | ) | $ | (0.03 | ) | $ | (0.04 | ) | $ | (0.09 | ) | $ | (0.10 | ) |
|
|
|
|
|
|
|
|
|
|
|
|
|
| ||||||
Key Financial Metrics (b) |
|
|
|
|
|
|
|
|
|
|
|
|
| ||||||
Gross Margin |
| 65.9 | % | 57.1 | % | 56.1 | % | 59.6 | % | 58.1 | % | 60.1 | % | ||||||
Operating Margin |
| -0.7 | % | 2.1 | % | -0.5 | % | -1.5 | % | -8.8 | % | -10.3 | % | ||||||
Depreciation and Amortization |
| $ | 380 |
| $ | 315 |
| $ | 253 |
| $ | 224 |
| $ | 200 |
| $ | 192 |
|
EBITDA (a) |
| $ | 334 |
| $ | 464 |
| $ | 220 |
| $ | 134 |
| $ | (225 | ) | $ | (273 | ) |
EBITDA Margin |
| 4.8 | % | 6.4 | % | 3.3 | % | 2.2 | % | -4.7 | % | -6.1 | % | ||||||
|
|
|
|
|
|
|
|
|
|
|
|
|
| ||||||
Capital Expenditures |
| $ | 124 |
| $ | 18 |
| $ | 66 |
| $ | 42 |
| $ | 8 |
| $ | 11 |
|
Music Catalog Additions |
| $ | 0 |
| $ | 0 |
| $ | 26 |
| $ | 15 |
| $ | 0 |
| $ | 0 |
|
|
|
|
|
|
|
|
|
|
|
|
|
|
| ||||||
Cash |
| $ | 75 |
| $ | 1,219 |
| $ | 147 |
| $ | 1,272 |
| $ | 1,689 |
| $ | 1,470 |
|
Interest Bearing Debt |
| $ | 10,253 |
| $ | 11,515 |
| $ | 11,200 |
| $ | 11,518 |
| $ | 12,098 |
| $ | 12,399 |
|
Stockholders’ Equity |
| $ | (9,343 | ) | $ | (10,194 | ) | $ | (10,200 | ) | $ | (10,561 | ) | $ | (11,982 | ) | $ | (12,308 | ) |
Note:
(a) Operating income (EBIT) plus depreciation and amortization
(b) Based on SEC filings.
7
K-Tel International, Inc. Overview |
| Draft |
Current Ownership Structure (shares in 000s)
Institutional/Inside Investors |
| Shareholders of Record |
| # of Shares |
| % |
|
5% Shareholders (Phillip Kives persoally and/or affiliates) |
| 6 |
| 8,374 |
| 61.3 | % |
Minority Shareholders |
| Shareholders of Record |
| # of Shares |
| % |
|
Current Minority Shareholders |
| 1359 |
| 5,276 |
| 38.7 | % |
Total Shareholders |
| 1365 |
| 13,650 |
| 100.0 | % |
Float |
|
|
|
|
| 38.7 | % |
Source: 10-K and documents provided by management.
8
K-Tel International, Inc. Overview |
| Draft |
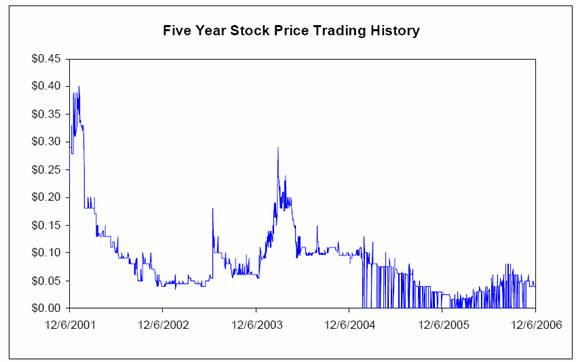
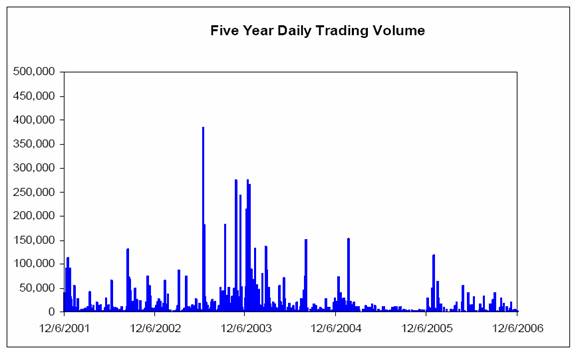
Stock Price Trading History
· The Company’s common stock currently trades on the pink-sheets.
· The Company has a small float and trades thinly.
9
K-Tel International, Inc. Overview |
| Draft |
Stock Trading History
Closing Stock Price (12/06/06) |
|
|
| $ | 0.04 |
| |
Market Capitalization (000’s) |
|
|
| $ | 546 |
| |
Float |
|
|
| 38.7 | % | ||
Weighted Average Stock Price Since (11/24/06) (1) |
|
|
| $ | 0.04 |
| |
52 Week High - Low |
| $ | 0.08 |
| $ | 0.01 |
|
3 Month Weighted Average Stock Price |
|
|
| $ | 0.05 |
| |
3 Month Average Daily Volume |
|
|
| 3,160 |
| ||
6 Month Weighted Average Stock Price |
|
|
| $ | 0.05 |
| |
6 Month Average Daily Volume |
|
|
| 3,776 |
| ||
12 Month Weighted Average Stock Price |
|
|
| $ | 0.04 |
| |
12 Month Average Daily Volume |
|
|
| 4,504 |
| ||
3 Year Weighted Average Stock Price |
|
|
| $ | 0.10 |
| |
3 Year Average Daily Volume |
|
|
| 7,864 |
| ||
(1) On 11/22/06, K-tel became current with its SEC filings by filing form 10-Qs for quarters ended 9/30/05, 12/31/05, 3/31/06 and 9/30/96 and filing the 10-K for fiscal year ended 6/30/06.
10
K-Tel International, Inc. Overview |
| Draft |
11
K-Tel International, Inc. Overview |
| Draft |
12
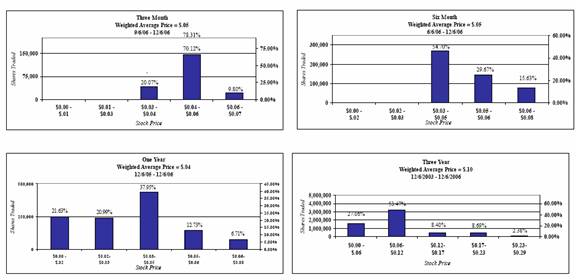
Volume Traded at Various Price Levels |
| Draft |
13
| Draft |
SECTION 2
Summary of Proposed Transaction
14
Summary of Proposed Transaction |
| Draft |
Proposed Transaction
· K-Tel is proposing to undertake a reverse stock split transaction that would have the effect of reducing the number of shareholders below 300, thus allowing for the termination of SEC reporting obligations.
· Reverse split of 1-for-5,000 existing shares held by a shareholder, with fractional shares being redeemed by K-Tel.
Management Rationale
· Stockholders are unable to benefit fully from public company status due to:
· low trading volume and small public float which limits shareholder liquidity
· the Company is not able to raise capital conventionally in the public markets
· the Company is not an attractive investment for intuitional investors
· the Company is not able to effectively use shares for acquisitions or to successfully attract and retain employees.
· The scale of the Company has changed dramatically and management considers the increasing annual costs and other burdens of continuing as an SEC reporting company to be outweighed by any benefit of continuing as such.
· A reverse split provides multiple benefits including;
· reduction of direct and indirect costs
· stockholders are able to sell without a brokerage commission
15
| Draft |
SECTION 3
Summary of Due Diligence Procedures
16
Due Diligence Procedures |
| Draft |
· We reviewed the following information regarding K-Tel:
· Annual report and form 10-K for the five fiscal years ended June 30, 2006;
· Form 10-Q for the three month period ended September 30, 2006;
· Form 8-Ks filed since 2005:
· Recent press releases;
· Apple download history provided by management;
· Listing of downloaded songs by title provided by management;
· Financial projections for the five fiscal years ending June 30, 2011 provided by management;
· breakdown of revenue by source
· estimates of net operating loss (NOL) tax benefits
· estimates of cost savings from public company status
· In addition, we held discussions with key management of K-Tel concerning the history and future outlook for the Company and other matters relevant to our analyses.
· Interviews with company counsel and a phone conference with the Special Committee of the Board of Directors of the Company.
17
| Draft |
SECTION 4
Preliminary Valuation Analyses
18
Preliminary Valuation Analyses |
| Draft |
Comparable Public Company Analysis
· This analysis compares selected financial and valuation metrics for of the Company relative to those of public companies that are similar based on lines of business, markets, customers, financial characteristics and other factors.
· We reviewed business descriptions, financial information (including estimated financial data) and stock market data on numerous public companies operating in music and video entertainment.
· We selected the following five companies as being the most comparable to the Company:
· Digital Music Group, Inc.
· Image Entertainment, Inc.
· Madacy Entertainment Income Fund
· MediaBay, Inc.
· Napster, Inc.
19
Valuation Analysis |
| Draft |
($’s in thousands, except per share data) |
|
|
| Market Capitalization and Enterprise Value |
| ||||||||||||||||||||||||||||
|
|
|
| Fiscal |
| LTM |
| Price |
| 52 Wk |
| 52 Wk |
| % of 52 |
| Market |
|
|
| Preferred |
| Minority |
| Enterprise |
| ||||||||
Company Name |
| Ticker |
| Year End |
| Period |
| 12/06/06 |
| High |
| Low |
| Wk High |
| Cap |
| Net Debt (1) |
| Stock |
| Interest |
| Value |
| ||||||||
Image Entertainment Inc. |
| DISK |
| 3/31/2006 |
| 9/30/2006 |
| $ | 3.28 |
| $ | 4.12 |
| $ | 2.91 |
| 79.6 | % | $ | 70,773 |
| $ | 21,435 |
| $ | 0 |
| $ | 0 |
| $ | 92,208 |
|
Madacy Entertainment Income Fund |
| MEG.UN |
| 12/31/2005 |
| 9/30/2006 |
| $ | 1.80 |
| $ | 6.83 |
| $ | 1.20 |
| 26.4 | % | $ | 13,596 |
| $ | 22,415 |
| $ | 0 |
| $ | 27,098 |
| $ | 63,109 |
|
Napster Inc. |
| NAPS |
| 3/31/2006 |
| 9/30/2006 |
| $ | 3.56 |
| $ | 5.10 |
| $ | 2.55 |
| 69.8 | % | $ | 159,844 |
| $ | (90,318 | ) | $ | 0 |
| $ | 0 |
| $ | 69,526 |
|
Digital Music Group Inc. |
| DMGI |
| 12/31/2005 |
| 9/30/2006 |
| $ | 5.50 |
| $ | 10.42 |
| $ | 3.75 |
| 52.8 | % | $ | 49,693 |
| $ | (24,165 | ) | $ | 0 |
| $ | 0 |
| $ | 25,527 |
|
MediaBay Inc. |
| MBAY |
| 12/31/2005 |
| 9/30/2006 |
| $ | 0.07 |
| $ | 1.98 |
| $ | 0.01 |
| 3.5 | % | $ | 736 |
| $ | 18,627 |
| $ | 0 |
| $ | 0 |
| $ | 19,363 |
|
|
|
|
|
|
|
|
|
|
|
|
|
|
|
|
|
|
|
|
|
|
|
|
|
|
| ||||||||
K-Tel International, Inc. |
|
|
| 6/30/2006 |
| 9/30/2006 |
| $ | 0.04 |
| $ | 0.08 |
| $ | 0.01 |
| 50.0 | % | $ | 546 |
| $ | 10,929 |
| $ | 0 |
| $ | 0 |
| $ | 11,475 |
|
Note:
(1.) Net debt equals interest bearing debt less cash.
20
Valuation Analysis |
| Draft |
|
|
|
| LTM Financial Data |
| Margins |
| Valuation Multiples |
| |||||||||||||||||||||||
($’s in thousands, except per share data) |
|
|
|
|
|
|
|
|
| Net |
|
|
|
|
|
|
| Net |
| EV/ |
| EV/ |
| EV/ |
|
|
| |||||
Company Name |
| Ticker |
| Revenue |
| EBITDA |
| EBIT |
| Income |
| EPS |
| EBITDA |
| EBIT |
| Income |
| Revenue |
| EBITDA |
| EBIT |
| P/E |
| |||||
Image Entertainment Inc. |
| DISK |
| $ | 114,768 |
| $ | 130 |
| $ | (2,498 | ) | $ | (4,047 | ) | $ | (0.19 | ) | 0.1 | % | -2.2 | % | -3.5 | % | 0.85x |
| 752.4x |
| NM |
| NM |
|
Madacy Entertainment Income Fund |
| MEG.UN |
| $ | 116,397 |
| $ | 8,635 |
| $ | 3,840 |
| $ | 3,287 |
| $ | 0.44 |
| 7.4 | % | 3.3 | % | 2.8 | % | 0.53x |
| 7.1x |
| 16.0x |
| 5.6x |
|
Napster Inc. |
| NAPS |
| $ | 103,887 |
| $ | (42,877 | ) | $ | (46,708 | ) | $ | (40,227 | ) | $ | (1.00 | ) | -41.3 | % | -45.0 | % | -38.7 | % | 0.66x |
| NM |
| NM |
| NM |
|
Digital Music Group Inc. |
| DMGI |
| $ | 2,549 |
| $ | (1,316 | ) | $ | (1,572 | ) | $ | (533 | ) | $ | (0.08 | ) | -51.6 | % | -61.7 | % | -20.9 | % | 9.31x |
| NM |
| NM |
| NM |
|
MediaBay Inc. |
| MBAY |
| $ | 5,407 |
| $ | (6,889 | ) | $ | (7,434 | ) | $ | (22,573 | ) | $ | (2.22 | ) | -127.4 | % | -137.5 | % | -417.5 | % | 3.58x |
| NM |
| NM |
| NM |
|
|
|
|
|
|
|
|
|
|
|
|
|
|
|
|
|
|
|
|
|
|
|
|
|
|
|
|
| |||||
|
| Max |
| $ | 116,397 |
| $ | 8,635 |
| $ | 3,840 |
| $ | 3,287 |
| $ | 0.44 |
| 7.4 | % | 3.3 | % | 2.8 | % | 9.31x |
| 7.1x |
| 16.0x |
| 5.6x |
|
|
| Mean |
| $ | 68,602 |
| $ | (8,464 | ) | $ | (10,875 | ) | $ | (12,819 | ) | $ | (0.61 | ) | -42.6 | % | -48.6 | % | -95.6 | % | 2.99x |
| 7.1x |
| 16.0x |
| 5.6x |
|
|
| Median |
| $ | 103,887 |
| $ | (1,316 | ) | $ | (2,498 | ) | $ | (4,047 | ) | $ | (0.19 | ) | -41.3 | % | -45.0 | % | -20.9 | % | 0.85x |
| 7.1x |
| 16.0x |
| 5.6x |
|
|
| Min |
| $ | 2,549 |
| $ | (42,877 | ) | $ | (46,708 | ) | $ | (40,227 | ) | $ | (2.22 | ) | -127.4 | % | -137.5 | % | -417.5 | % | 0.53x |
| 7.1x |
| 16.0x |
| 5.6x |
|
|
|
|
|
|
|
|
|
|
|
|
|
|
|
|
|
|
|
|
|
|
|
|
|
|
|
|
| |||||
K-Tel International, Inc. |
|
|
| $ | 4,496 |
| $ | (273 | ) | $ | (465 | ) | $ | (1,294 | ) | $ | (0.10 | ) | -6.1 | % | -10.3 | % | -28.8 | % | 2.55x |
| NM |
| NM |
| NM |
|
Source: Capital IQ
21
Valuation Analysis |
| Draft |
|
|
|
| One-Year Historical Growth |
| 3 Year CAGR |
| ||||||||||||
Company Name |
| Ticker |
| Revenue |
| EBITDA |
| EBIT |
| EPS |
| Revenue |
| EBITDA |
| EBIT |
| EPS |
|
Image Entertainment Inc. |
| DISK |
| 8.7 | % | -96.7 | % | NM |
| NM |
| 11.5 | % | -69.1 | % | NM |
| NM |
|
Madacy Entertainment Income Fund |
| MEG.UN |
| NM |
| NM |
| NM |
| 661.2 | % | NM |
| NM |
| NM |
| NM |
|
Napster Inc. |
| NAPS |
| 40.5 | % | NM |
| NM |
| NM |
| -0.7 | % | NM |
| NM |
| NM |
|
Digital Music Group Inc. |
| DMGI |
| NM |
| NM |
| NM |
| NM |
| NM |
| NM |
| NM |
| NM |
|
MediaBay Inc. |
| MBAY |
| -53.0 | % | NM |
| NM |
| NM |
| -49.8 | % | NM |
| NM |
| NM |
|
|
|
|
|
|
|
|
|
|
|
|
|
|
|
|
|
|
|
|
|
|
| Max |
| 40.5 | % | -96.7 | % | NM |
| 661.2 | % | 11.5 | % | -69.1 | % | NM |
| NM |
|
|
| Mean |
| -1.3 | % | -96.7 | % | NM |
| 661.2 | % | -13.0 | % | -69.1 | % | NM |
| NM |
|
|
| Median |
| 8.7 | % | -96.7 | % | NM |
| 661.2 | % | -0.7 | % | -69.1 | % | NM |
| NM |
|
|
| Min |
| -53.0 | % | -96.7 | % | NM |
| 661.2 | % | -49.8 | % | -69.1 | % | NM |
| NM |
|
Source: Capital IQ
22
Valuation Analysis |
| Draft |
($’s in thousands, except per share data) |
|
|
|
|
|
|
| CFY Estimated Financial Data |
| Margins |
| Valuation Multiples |
| |||||||||||||
|
|
|
| Fiscal |
| CFY |
|
|
|
|
|
|
|
|
| Net |
| EV/ |
| EV/ |
|
|
| |||
Company Name |
| Ticker |
| Year End |
| Period |
| Revenue |
| EBITDA |
| EPS |
| EBITDA |
| Income |
| Revenue |
| EBITDA |
| P/E |
| |||
Image Entertainment Inc. |
| DISK |
| 3/31/2006 |
| 3/31/2007 |
| $ | 98,833 |
| $ | (6,600 | ) | $ | (0.37 | ) | -6.7 | % | NA |
| 0.72x |
| NM |
| NM |
|
Madacy Entertainment Income Fund |
| MEG.UN |
| 12/31/2005 |
| 12/31/2006 |
| $ | 91,000 |
| $ | 7,460 |
| $ | 0.75 |
| 8.2 | % | 6.2 | % | 0.15x |
| 8.5x |
| 18.2x |
|
Napster Inc. |
| NAPS |
| 3/31/2006 |
| 3/31/2007 |
| $ | 109,241 |
| $ | (38,023 | ) | $ | (0.98 | ) | -34.8 | % | NA |
| 1.46x |
| NM |
| NM |
|
Digital Music Group Inc. |
| DMGI |
| 12/31/2005 |
| 12/31/2006 |
| $ | 10,923 |
| $ | 251 |
| $ | (0.19 | ) | 2.3 | % | NA |
| 4.55x |
| 101.7x |
| NM |
|
MediaBay Inc. |
| MBAY |
| 12/31/2005 |
| 12/31/2006 |
| NA |
| NA |
| NA |
| NA |
| NA |
| NA |
| NM |
| NM |
| |||
|
|
|
|
|
|
|
|
|
|
|
|
|
|
|
|
|
|
|
|
|
|
|
| |||
|
|
|
|
|
|
|
|
|
|
|
| Max |
| 8.2 | % | 6.2 | % | 4.55 | x | 8.5 | x | 18.2 | x | |||
|
|
|
|
|
|
|
|
|
|
|
| Mean |
| -7.7 | % | 6.2 | % | 1.72 | x | 8.5 | x | 18.2 | x | |||
|
|
|
|
|
|
|
|
|
|
|
| Median |
| -2.2 | % | 6.2 | % | 1.09 | x | 8.5 | x | 18.2 | x | |||
|
|
|
|
|
|
|
|
|
|
|
| Min |
| -34.8 | % | 6.2 | % | 0.15 | x | 8.5 | x | 18.2 | x | |||
23
Valuation Analysis |
| Draft |
($’s in thousands) |
|
|
| Balance Sheet |
| LTM Return |
| Leverage |
| Liquidity |
| |||||||||||||||||
|
|
|
|
|
|
|
|
|
|
|
|
|
|
|
|
|
| Total |
| EBIT/ Net |
|
|
|
|
| |||
|
|
|
| Total |
| Total |
| Stockholders’ |
|
|
|
|
| Debt (3) / |
|
|
| Debt/ |
| Interest |
| Current |
| Quick |
| |||
Company Name |
| Ticker |
| Assets |
| Liabilities |
| Equity |
| ROE(1) |
| ROA (2) |
| Total Capital (4) |
| D/E(5) |
| EBITDA |
| Expense |
| Ratio |
| Ratio |
| |||
Image Entertainment Inc. |
| DISK |
| $ | 95,229 |
| $ | 23,385 |
| $ | 36,085 |
| NM |
| NM |
| 39.3 | % | 64.8 | % | 1.80 |
| NM |
| 1.64 |
| 0.64 |
|
Madacy Entertainment Income Fund |
| MEG.UN |
| $ | 120,654 |
| $ | 22,656 |
| $ | 49,251 |
| NM |
| NM |
| 22.9 | % | 46.0 | % | 0.03 |
| 1.91 |
| 1.12 |
| 0.65 |
|
Napster Inc. |
| NAPS |
| $ | 138,178 |
| $ | 39,200 |
| $ | 98,976 |
| NM |
| NM |
| NM |
| NM |
| NM |
| NM |
| 2.67 |
| 2.54 |
|
Digital Music Group Inc. |
| DMGI |
| $ | 38,864 |
| $ | 2,775 |
| $ | 36,090 |
| NM |
| NM |
| 0.2 | % | 0.2 | % | NM |
| NM |
| 10.58 |
| 9.85 |
|
MediaBay Inc. |
| MBAY |
| $ | 10,223 |
| $ | 21,689 |
| $ | (16,136 | ) | NM |
| NM |
| 390.6 | % | NM |
| NM |
| NM |
| 0.18 |
| 0.13 |
|
|
|
|
|
|
|
|
|
|
|
|
|
|
|
|
|
|
|
|
|
|
|
|
|
|
| |||
Max |
|
|
| $ | 138,178 |
| $ | 39,200 |
| $ | 98,976 |
| NM |
| NM |
| 390.6 | % | 64.8 | % | 1.80 |
| 1.91 |
| 10.58 |
| 9.85 |
|
Mean |
|
|
| $ | 80,630 |
| $ | 21,941 |
| $ | 40,853 |
| NM |
| NM |
| 113.3 | % | 37.0 | % | 0.91 |
| 1.91 |
| 3.24 |
| 2.76 |
|
Median |
|
|
| $ | 95,229 |
| $ | 22,656 |
| $ | 36,090 |
| NM |
| NM |
| 31.1 | % | 46.0 | % | 0.91 |
| 1.91 |
| 1.64 |
| 0.65 |
|
Min |
|
|
| $ | 10,223 |
| $ | 2,775 |
| $ | -16,136 |
| NM |
| NM |
| 0.2 | % | 0.2 | % | 0.03 |
| 1.91 |
| 0.18 |
| 0.13 |
|
|
|
|
|
|
|
|
|
|
|
|
|
|
|
|
|
|
|
|
|
|
|
|
|
|
| |||
K-Tel International, Inc. |
|
|
| $ | 3,070 |
| $ | 15,378 |
| $ | (12,308 | ) | NM |
| NM |
| 100.0 | % | NM |
| NM |
| NM |
| 0.18 |
| 0.15 |
|
Note
(1.) ROA is calculated as EBIT * (1-tax rate) / total assets
(2.) ROE is calculated as net income / stockholders’ equity
(3.) Debt is equal to book value of interest bearing debt plus capital lease obligations.
(4.) Total capital is equal to interest bearing debt plus market capitalization.
(5.) D/E is equal to total liabilities divided by stockholders’ equity.
24
Valuation Analysis |
| Draft |
Comparable Merger and Acquisition Transactions
· This analysis compares selected financial and valuation metrics of the company with those of similar public and private companies that have recently been merged or acquired.
· We reviewed publicly available information, press releases and databases for industry transactions that closed since 2004 but data was insufficient. Accordingly, we did not perform a comparable merger and acquisition transaction analysis.
25
Valuation Analysis |
| Draft |
Discounted Cash Flow Analysis
· This analysis calculates the present value of the cash flow earned during the forecast period plus the value at the end of that period, referred to as the terminal value. The terminal value component recognizes that a company has a perpetual life and refers to the value of all future cash flows from an asset at a specific point in time.
· For purposes of this analysis, the following range of assumptions were used:
· 5 fiscal years of cash flows discounted to November 30, 2007
· Discount rates: 16.0% to 20.0%
· Terminal value: perpetual growth rates of year 5 free cash flow at 2.0% to 4.0%
· Analyzed the Company’s existing net operating loss (NOL) carry-forwards
· The projected financial data was prepared by management of K-Tel and excludes the retail segment of the business.
26
Cash Flow Projections |
| Draft |
|
| Actual |
|
|
| Years Ending June 30 |
| |||||||||||||||||||||||||||
($’s in Thousands) |
| 2006 |
| % |
| 2007 |
| % |
| 2008 |
| % |
| 2009 |
| % |
| 2010 |
| % |
| 2011 |
| % |
| Perpetuity |
| |||||||
|
|
|
|
|
|
|
|
|
|
|
|
|
|
|
|
|
|
|
|
|
|
|
|
|
|
|
| |||||||
Net Sales (a) |
| $ | 2,563 |
| 100 | % | $ | 2,325 |
| 100 | % | $ | 2,363 |
| 100 | % | $ | 2,413 |
| 100 | % | $ | 2,478 |
| 100 | % | $ | 2,557 |
| 100 | % | $ | 2,557 |
|
|
|
|
|
|
|
|
|
|
|
|
|
|
|
|
|
|
|
|
|
|
|
|
|
|
|
|
| |||||||
Licensing Expense |
|
|
|
|
|
|
|
|
|
|
|
|
|
|
|
|
|
|
|
|
|
|
|
|
|
|
| |||||||
Non Digital Expense |
| $ | 403 |
| 15.7 | % | $ | 352 |
| 15.2 | % | $ | 335 |
| 14.2 | % | $ | 318 |
| 13.2 | % | $ | 302 |
| 12.2 | % | $ | 287 |
| 11.2 | % | $ | 287 |
|
Digital Expense |
| 121 |
| 4.7 | % | 124 |
| 5.3 | % | 136 |
| 5.8 | % | 150 |
| 6.2 | % | 165 |
| 6.7 | % | 181 |
| 7.1 | % | 181 |
| |||||||
Trademark Licensing Expense |
| 0 |
| 0.0 | % | 0 |
| 0.0 | % | 0 |
| 0.0 | % | 0 |
| 0.0 | % | 0 |
| 0.0 | % | 0 |
| 0.0 | % | 0 |
| |||||||
Total Cost of Goods Sold |
| 524 |
| 20.5 | % | 476 |
| 20.5 | % | 471 |
| 19.9 | % | 468 |
| 19.4 | % | 467 |
| 18.9 | % | 469 |
| 18.3 | % | 469 |
| |||||||
|
|
|
|
|
|
|
|
|
|
|
|
|
|
|
|
|
|
|
|
|
|
|
|
|
|
|
| |||||||
Gross Profit |
| $ | 2,039 |
| 79.5 | % | $ | 1,849 |
| 79.5 | % | $ | 1,891 |
| 80.1 | % | $ | 1,945 |
| 80.6 | % | $ | 2,011 |
| 81.1 | % | $ | 2,089 |
| 81.7 | % | $ | 2,089 |
|
Selling, General, & Administrative |
| 1,191 |
| 46.5 | % | 1,035 |
| 44.5 | % | 1,056 |
| 44.7 | % | 1,077 |
| 44.6 | % | 1,098 |
| 44.3 | % | 1,120 |
| 43.8 | % | 1,120 |
| |||||||
Amortization Expense |
| 163 |
| 6.4 | % | 145 |
| 6.2 | % | 115 |
| 4.9 | % | 63 |
| 2.6 | % | 13 |
| 0.5 | % | 0 |
| 0.0 | % | 0 |
| |||||||
Operating Income (EBIT) |
| $ | 685 |
| 26.7 | % | $ | 669 |
| 28.8 | % | $ | 721 |
| 30.5 | % | $ | 805 |
| 33.4 | % | $ | 899 |
| 36.3 | % | $ | 968 |
| 37.9 | % | $ | 968 |
|
|
|
|
|
|
|
|
|
|
|
|
|
|
|
|
|
|
|
|
|
|
|
|
|
|
|
|
| |||||||
Beginning NOL Carryforward (b) |
|
|
|
|
| $ | 23,100 |
|
|
| $ | 22,431 |
|
|
| $ | 21,711 |
|
|
| $ | 20,906 |
|
|
| $ | 20,006 |
|
|
| $ | 19,038 |
| |
Less: NOL Used |
|
|
|
|
| (669 | ) |
|
| (721 | ) |
|
| (805 | ) |
|
| (899 | ) |
|
| (968 | ) |
|
| 0 |
| |||||||
Ending NOL |
|
|
|
|
| $ | 22,431 |
|
|
| $ | 21,711 |
|
|
| $ | 20,906 |
|
|
| $ | 20,006 |
|
|
| $ | 19,038 |
|
|
| $ | 19,038 |
| |
|
|
|
|
|
|
|
|
|
|
|
|
|
|
|
|
|
|
|
|
|
|
|
|
|
|
|
| |||||||
Net Taxes Paid @ 36% |
|
|
|
|
| 0 |
|
|
| 0 |
|
|
| 0 |
|
|
| 0 |
|
|
| 0 |
|
|
| 349 |
| |||||||
NOPAT (Net Operating Profit After Taxes) |
|
|
|
|
| $ | 669 |
|
|
| $ | 721 |
|
|
| $ | 805 |
|
|
| $ | 899 |
|
|
| $ | 968 |
|
|
| $ | 620 |
| |
|
|
|
|
|
|
|
|
|
|
|
|
|
|
|
|
|
|
|
|
|
|
|
|
|
|
|
| |||||||
Plus: Depreciation |
|
|
|
|
| $ | 145 |
|
|
| $ | 115 |
|
|
| $ | 63 |
|
|
| $ | 13 |
|
|
| $ | 0 |
|
|
| $ | 0 |
| |
Less: Capital Expenditures |
|
|
|
|
| 20 |
|
|
| 15 |
|
|
| 10 |
|
|
| 10 |
|
|
| 10 |
|
|
| 10 |
| |||||||
Less: Incremental Working Capital. |
|
|
|
|
| 0 |
|
|
| 0 |
|
|
| 0 |
|
|
| 0 |
|
|
| 0 |
|
|
| 0 |
| |||||||
Equals: Free Cash Flow |
|
|
|
|
| $ | 794 |
|
|
| $ | 821 |
|
|
| $ | 858 |
|
|
| $ | 902 |
|
|
| $ | 958 |
|
|
| $ | 610 |
| |
Note:
(a) Assumes shutdown of retail sales and transition to licensing segment as of beginning of fiscal 2007. Projections provided by K-tel management.
(b) The net operating loss (NOL) tax carry forward is approximately $43.2 million and $20.1 million relates to deductions associated with the exercise of stock options. The NOL to be used for offsetting taxable income is assumed to be $23.1 million according to management.
27
Valuation Analysis | Draft |
|
|
|
| WACC |
| ||||||||||||||
Present Value Calculations |
|
|
| 16.0% |
| 17.0% |
| 18.0% |
| 19.0% |
| 20.0% |
| ||||||
Present Value of 2007 - 2011 Cash Flows |
|
|
| $ | 3,014 |
| $ | 2,955 |
| $ | 2,899 |
| $ | 2,844 |
| $ | 2,791 |
| |
Plus: Present Value of Terminal Year |
|
|
|
|
|
|
|
|
|
|
|
|
| ||||||
Perpetuity Growth Rate |
| 2.0 | % | $ | 2,278 |
| $ | 2,126 |
| $ | 1,993 |
| $ | 1,876 |
| $ | 1,772 |
| |
|
| 3.0 | % | $ | 2,477 |
| $ | 2,300 |
| $ | 2,147 |
| $ | 2,013 |
| $ | 1,894 |
| |
|
| 4.0 | % | $ | 2,710 |
| $ | 2,501 |
| $ | 2,323 |
| $ | 2,168 |
| $ | 2,032 |
| |
Equals: Enterprise Value |
|
|
|
|
|
|
|
|
|
|
|
|
| ||||||
Perpetuity Growth Rate |
| 2.0 | % | $ | 5,292 |
| $ | 5,082 |
| $ | 4,892 |
| $ | 4,720 |
| $ | 4,563 |
| |
|
| 3.0 | % | $ | 5,491 |
| $ | 5,256 |
| $ | 5,046 |
| $ | 4,857 |
| $ | 4,686 |
| |
|
| 4.0 | % | $ | 5,724 |
| $ | 5,457 |
| $ | 5,222 |
| $ | 5,012 |
| $ | 4,824 |
| |
|
|
|
|
|
|
|
|
|
|
|
|
|
| ||||||
Debt |
| $ | 12,399 |
|
|
|
|
|
|
|
|
|
|
| |||||
Less: Cash |
| (1,470 | ) |
|
|
|
|
|
|
|
|
|
| ||||||
Less: Present Value of NOL’s |
| (2,501 | ) |
|
|
|
|
|
|
|
|
|
| ||||||
Equals: Net Debt (b) |
| $ | 8,428 |
|
|
|
|
|
|
|
|
|
|
| |||||
Equals: Equity Value |
|
|
|
|
|
|
|
|
|
|
|
|
| ||||||
Perpetuity Growth Rate |
| 2.0 | % | $ | (3,136 | ) | $ | (3,346 | ) | $ | (3,536 | ) | $ | (3,708 | ) | $ | (3,865 | ) | |
|
| 3.0 | % | $ | (2,937 | ) | $ | (3,172 | ) | $ | (3,382 | ) | $ | (3,571 | ) | $ | (3,742 | ) | |
|
| 4.0 | % | $ | (2,704 | ) | $ | (2,971 | ) | $ | (3,206 | ) | $ | (3,416 | ) | $ | (3,604 | ) | |
|
|
|
|
|
|
|
|
|
|
|
|
|
| ||||||
Equals: Equity Value (Per Share) (a) |
| 2.0 | % | $ | 0.00 |
| $ | 0.00 |
| $ | 0.00 |
| $ | 0.00 |
| $ | 0.00 |
| |
|
| 3.0 | % | $ | 0.00 |
| $ | 0.00 |
| $ | 0.00 |
| $ | 0.00 |
| $ | 0.00 |
| |
|
| 4.0 | % | $ | 0.00 |
| $ | 0.00 |
| $ | 0.00 |
| $ | 0.00 |
| $ | 0.00 |
| |
Note:
(a) Based on 13.65 million shares outstanding as of November 13, 2006.
28
| Draft |
Appendices
29
Reverse Stock Split Transactions | Draft |
($’s in thousands, except per share)
|
| Company |
| Stock |
| Market Cap At |
| Fractional |
| 20 Day Average |
| 20 Day |
| |||
6/1/2006 |
| Milastar Corporation |
| 1 - 250 |
| $ | 6,263 |
| $ | 2.66 |
| $ | 2.59 | (a) | 2.7 | % |
|
|
|
|
|
|
|
|
|
|
|
|
|
| |||
3/3/2006 |
| Major Automotive |
| 1 - 1000 |
| $ | 15,677 |
| $ | 1.90 |
| $ | 1.75 | (a) | 8.6 | % |
|
| Companies, Inc. |
|
|
|
|
|
|
|
|
|
|
| |||
|
|
|
|
|
|
|
|
|
|
|
|
|
| |||
1/10/2006 |
| Sagient Research, |
| 1 - 101 |
| $ | 2,830 |
| $ | 0.12 |
| $ | 0.10 | (a) | 20.0 | % |
|
| Inc. |
|
|
|
|
|
|
|
|
|
|
| |||
|
|
|
|
|
|
|
|
|
|
|
|
|
| |||
12/22/2005 |
| TouchTunes Music |
| 1 - 2000 |
| $ | 1,470 |
| $ | 0.50 |
| $ | 0.43 | (a) | 17.1 | % |
|
| corp. |
|
|
|
|
|
|
|
|
|
|
| |||
|
|
|
|
|
|
|
|
|
|
|
|
|
| |||
11/30/2005 |
| Refocus Group |
| 1 - 2000 |
| $ | 7,401 |
| $ | 0.35 |
| $ | 0.28 | (a) | 25.0 | % |
|
|
|
|
|
|
|
|
|
|
|
|
|
| |||
9/22/2005 |
| Community |
| 1 - 300 |
| $ | 14,728 |
| $ | 15.00 |
| $ | 13.95 | (a) | 7.5 | % |
|
| Invenstors Bancorp |
|
|
|
|
|
|
|
|
|
|
| |||
|
|
|
|
|
|
|
|
|
|
|
|
|
| |||
8/29/2005 |
| BF Enterprises |
| 1-3000 |
| $ | 29,684 |
| $ | 8.95 |
| $ | 8.54 | (a) | 4.8 | % |
|
|
|
|
|
|
|
|
|
|
|
|
|
| |||
8/24/2005 |
| Kestrel Energy |
| 1 - 100 |
| $ | 11 |
| $ | 1.42 |
| $ | 0.99 | (a) | 43.7 | % |
|
|
|
|
|
|
|
|
|
|
|
|
|
| |||
1/19/2005 |
| Max & Ermas |
| 1 - 200 |
| $ | 37,133 |
| $ | 16.00 |
| $ | 13.08 | (a) | 22.3 | % |
|
| Restaurants, Inc. |
|
|
|
|
|
|
|
|
|
|
| |||
|
|
|
|
|
|
|
|
|
|
|
|
|
| |||
1/10/2005 |
| Trek Resources |
| 1 - 100 |
| $ | 8,310 |
| $ | 2.50 |
| $ | 2.13 | (a) | 17.6 | % |
|
|
|
|
|
|
|
|
|
|
|
|
|
| |||
12/22/2004 |
| KS Bancorp, Ltd |
| 1 - 200 |
| $ | 26,334 |
| $ | 24.00 |
| $ | 16.35 | (a) | 46.8 | % |
|
|
|
|
|
|
|
|
|
|
|
|
|
| |||
11/4/2004 |
| Webco Industries, |
| NA |
| $ | 41,784 |
| $ | 6.50 |
| $ | 5.43 | (a) | 19.7 | % |
|
| Inc. |
|
|
|
|
|
|
|
|
|
|
| |||
|
|
|
|
|
|
|
|
|
|
|
|
|
| |||
1/9/2004 |
| Safeguard Health |
| 1 - 1,500 |
| $ | 11,185 |
| $ | 2.25 |
| $ | 1.90 | (a) | 18.4 | % |
|
| Enterprise, Inc. |
|
|
|
|
|
|
|
|
|
|
| |||
|
|
|
|
|
|
|
|
|
|
|
|
|
| |||
|
|
|
|
|
|
|
|
|
| Max |
| 46.8 | % | |||
|
|
|
|
|
|
|
|
|
| Median |
| 18.4 | % | |||
|
|
|
|
|
|
|
|
|
| Mean |
| 19.6 | % | |||
|
|
|
|
|
|
|
|
|
| Min |
| 2.7 | % | |||
Note:
(a). Based on 20 trading day average stock price information.
Source: Capital IQ, Bloomberg, and Craig-Hallum.
30
Preliminary Orderly Liquidation Analyses | Draft |
|
| Value |
| Asset Realization |
| Hypothetical Orderly |
| |||||||
|
| as of |
| Percentage |
| Liquidation Values |
| |||||||
|
| 9/30/2006 (1) |
| Low |
| High |
| Low |
| High |
| |||
ASSETS |
|
|
|
|
|
|
|
|
|
|
| |||
CURRENT ASSETS: |
|
|
|
|
|
|
|
|
|
|
| |||
Cash |
| $ | 1,470 |
| 100 | % | 100 | % | $ | 1,470 |
| $ | 1,470 |
|
Accounts Receivable |
| 632 |
| 85 | % | 95 | % | $ | 537 |
| $ | 600 |
| |
Inventory (3/31/06) |
| 452 |
| 50 | % | 60 | % | $ | 226 |
| $ | 271 |
| |
Royalty Advances |
| 7 |
| 100 | % | 100 | % | $ | 7 |
| $ | 7 |
| |
Prepaid Expenses and Other |
| 157 |
| 100 | % | 100 | % | $ | 157 |
| $ | 157 |
| |
Total Current Assets |
| $ | 2,718 |
|
|
|
|
| $ | 2,397 |
| $ | 2,506 |
|
|
|
|
|
|
|
|
|
|
|
|
| |||
NON-CURRENT ASSETS |
|
|
|
|
|
|
|
|
|
|
| |||
Net Fixed Assets |
| 53 |
| 0 | % | 0 | % | 0 |
| 0 |
| |||
Owned Catalog of Masters (2) |
| 2,500 |
| 90 | % | 100 | % | 2,250 |
| 2,500 |
| |||
Total Assets |
| $ | 5,271 |
|
|
|
|
| $ | 4,647 |
| $ | 5,006 |
|
|
|
|
|
|
|
|
|
|
|
|
| |||
LIABILITES |
|
|
|
|
|
|
|
|
|
|
| |||
Notes Payable |
| 12,399 |
| 100 | % | 100 | % | 12,399 |
| 12,399 |
| |||
Accounts payable |
| 967 |
| 100 | % | 100 | % | 967 |
| 967 |
| |||
Accrued royalties (3/31/06) |
| 1,872 |
| 100 | % | 100 | % | 1,872 |
| 1,872 |
| |||
Reserve for returns |
| 109 |
| 100 | % | 100 | % | 109 |
| 109 |
| |||
Net liabilities of discontinued operations |
| 31 |
| 100 | % | 100 | % | 31 |
| 31 |
| |||
Total Liabilities |
| $ | 15,378 |
|
|
|
|
| $ | 15,378 |
| $ | 15,378 |
|
|
|
|
|
|
|
|
|
|
|
|
| |||
GROSS PROCEEDS AVAILABLE FOR DISTRIBUTION (3) |
| $ | (10,731 | ) | $ | (10,372 |
| |||||||
Notes:
(1.) Based on 9/30/06 book value.
(2.) Based on Craig Hallum preliminary estimate using an illustrative relief-from-royalty calculation. Assumes a 25% royalty rate applied to a $2.5 million revenue stream, 40% corporate tax rate and a capitalization rate of 15% (K-Tel WACC of 18% minus long-term growth of 3.0%). This preliminary value estimate compares to $1.6 million paid for the master recordings of the catalog (consisting of more than 2,000 tracks) of Chancellor Records by Digital Music Group, Inc. on June 26, 2006 (per Digital Music Group June 30, 2006 form 10Q).
(3.) Prior to liquidation related costs and taxes.
31
Comparable Public Company Descriptions | Draft |
Comparable Public Company Descriptions
Company Name |
| Business Description |
Image Entertainment Inc. |
| Image Entertainment, Inc. engages in the acquisition, production, and distribution of content for release on DVD. It acquires and exploits distribution rights to various general and specialty content on DVD, CD, and other home entertainment formats, including comedy, music concerts, urban, television and theatrical, country, gospel, foreign and silent films, and youth culture/lifestyle. As of March 31, 2006, its catalogue included approximately 3,000 DVD and 200 CD titles. The company also has audio content rights for distribution on compact discs, including albums, television and movie soundtracks, comedy programs, audio compilations from its live concert DVDs, and broadway original cast recordings. It sells its products to traditional retailers, specialty retailers, Internet retailers, wholesale distributors, as well as alternative distribution channels, including direct-to-consumer print catalogs, direct response campaigns, subscription services/club sales, home shopping television channels, and other nontraditional sales channels. The company was incorporated as Key International Film Distributors, Inc. in 1975 and changed its name to Image Entertainment, Inc. in 1983. Image Entertainment is headquartered in Chatsworth, California.
|
|
|
|
Madacy Entertainment |
| Madacy Entertainment Income Fund operates as an unincorporated open-ended trust in Canada. The fund, through its wholly-owned subsidiary, Madacy Entertainment Trust, holds 65% interest in Madacy Entertainment LP, which develops, produces, and markets recorded music products, as well as offers home video products. It also involves in the distribution of othermusic labels, as well as in licensing of its proprietary recordings. Madacy Entertainment Income Fund is headquartered in Montreal, Canada.
|
|
|
|
Napster Inc. |
| Napster, Inc. provides online music for the consumer market. Its online music subscription services, Napster and Napster To Go, provide consumers with access to approximately 2,000,000 tracks. The company’s products help consumers to discover, access, and acquire songs by searching or browsing its catalogue, or accessing preprogrammed content through radio stations or customcompilations. Napster’s subscribers also have access to community features, such as sharing songs with other members and searching their collections. In addition, it operates a download music store, called Napster Light, where customers who are not subscribers, purchase individual tracks or albums. The company sells its online music services to end users worldwide through its Web site, affiliate network, and universities that have site licenses, as well as prepaid cards through its retail partners. It has strategic partnerships with Ericsson, Microsoft, Intel, iRiver, Dell, Samsung, Gateway, Toshiba, Tower Records Japan, Best Buy, Radio Shack, Dixons Group, The Link, PC World, and Currys. Napster was incorporated in 2000. It was formerly known as Roxio, Inc. and changed its name to Napster, Inc. in 2004. The company is headquartered in Los Angeles, California. |
|
|
|
Digital Music Group Inc. |
| Digital Music Group, Inc. provides digital music recordings to online music stores. It purchases, licenses, or distributes music recordings in digital format from record labels, artists, and other content owners; and processes these recordings through its digitalmusic processing system for delivery to online music stores. The company, through online music stores, offers consumers with access to music recordings, which are not readily accessible in music retailers or available in digital format. In addition, it provides means for music and other sound recording content owners to make their content available to consumers in online music stores. Further, Digital Music Group engages in the digital distribution of television, film, and video catalogs. The company distributes approximately 65,000 digital music recordings primarily to major online music stores and to selected specialty online music stores that offer its music recordings for sale to consumers. Digital Music Group was founded in April 2005. It was formerly known as Online Music Corporation and changed its name to Digital Music Group, Inc. in September 2005. The company is based in Sacramento, California. |
|
|
|
MediaBay Inc. |
| MediaBay, Inc. operates as digitalmedia, marketing, and publishing company in the United States. It offers audio titles in the areas of spoken audio entertainment, such as audio readings of books, newspapers, magazines, original productions, and radio broadcast transcripts. The company operates through three segments: Audio Book Club, Radio Spirits, and MediaBay.com. The Audio Book Club segment, a membership-based club, engages in the sale of audio books in direct mail and on the Internet. The Radio Spirits segment engages in the production, sale, licenses, and syndication of old-time radio programs. It also broadcasts its radio programs through a syndicated radio show on commercial stations in the United States, as well as broadcasts its 24-hour Radio Classics channels on Sirius and XM Satellite Radio. The MediaBay.com segment, a media portal, offers spoken word audio content in secure digital download formats. The company’s content library consists of genres of audiobooks, classic American radio shows, educational courses, university lectures, theatre plays, self improvement courses, television soundtracks, stand-up comedy, children's storytelling, parenting advice, and study guides. |
Company Name Business Description
32
Comparable Public Company–Trading Statistics | Draft |
|
|
|
| Public Float Analysis (daily trading volume in thousands) |
| ||||||||
|
|
|
| LTM12 Month |
|
|
|
|
| Average Daily |
| Average Daily |
|
|
|
|
| Average Daily |
| Public Float |
| Shares |
| Volume/Public |
| Volume/Shares |
|
Company Name |
| Ticker |
| Volume |
| Estimate |
| Outstanding |
| Float |
| Outstanding |
|
Image Entertainment Inc. |
| DISK |
| 50 |
| 43 | % | 21,577 |
| 0.54 | % | 0.23 | % |
Madacy Entertainment Income Fund |
| MEG.UN |
| 48 |
| 98 | % | 7,540 |
| 0.65 | % | 0.64 | % |
Napster Inc. |
| NAPS |
| 912 |
| 97 | % | 44,900 |
| 2.08 | % | 2.03 | % |
Digital Music Group Inc. |
| DMGI |
| 31 |
| 79 | % | 9,035 |
| 0.43 | % | 0.34 | % |
MediaBay Inc. |
| MBAY |
| 342 |
| 75 | % | 10,516 |
| 4.33 | % | 3.25 | % |
|
|
|
|
|
|
|
|
|
|
|
|
|
|
|
| Max |
| 912 |
| 98 | % | 44,900 |
| 4.33 | % | 3.25 | % |
|
| Mean |
| 276 |
| 79 | % | 18,714 |
| 1.60 | % | 1.30 | % |
|
| Median |
| 50 |
| 79 | % | 10,516 |
| 0.65 | % | 0.64 | % |
|
| Min |
| 31 |
| 43 | % | 7,540 |
| 0.43 | % | 0.23 | % |
|
|
|
|
|
|
|
|
|
|
|
|
|
|
K-Tel International, Inc. |
|
|
| 5 |
| 39 | % | 13,650 |
| 0.09 | % | 0.04 | % |
33
K-TEL Weighted Average Cost of Capital Analysis | Draft |
Weighted Average Cost of Capital Calculation
Capital Asset Pricing Model
|
|
|
| Cost of Capital |
|
|
| Contribution |
| ||
|
| Weight (a) |
| Pre-Tax |
| After Tax |
|
|
| to WACC |
|
Debt Capital |
| 40.0 | % | 9.3 | %(b) | 5.9 | % |
|
| 2.4 | % |
Equity Capital |
| 60.0 | % | na |
| 26.5 | % |
|
| 15.9 | % |
|
|
|
|
|
|
|
|
|
|
|
|
Assumed Tax Rate |
| 36.0 | % |
|
|
|
| WACC | 18.3 | % | |
Cost of Equity Calculation
Risk-Free Rate (c) |
| 4.6 | % |
Beta (d) |
| 1.66 |
|
Plus Market Risk Premium(e) |
| 6.3 | % |
Plus Size Premium(f) |
| 6.4 | % |
Plus Unsystematic Risk Premium(g) |
| 5.0 | % |
Cost of Common Equity |
| 26.5 | % |
Note:
(a) Based on a normalized capital structure (debt capitalization of Image Entertainment, Inc.)
(b) Based on current interest rate of K-Tel's existing debt.
(c) Based on 20-Year Treasury Bond Yield as of current date.
(d) 3 year levered beta of Image Entertainment, Inc. (Source: Bloomberg Financial)
(e) Source: Ibbotson Associates 2006 Yearbook.
(f) Source: Ibbotson Associates 2006 Yearbook.
(g) Craig-Hallum estimate of company specific risk.
Formula: Cost of Equity = (Risk Free Rate) + (Beta*Equity Risk Premium) + Equity Risk Premium + Unsystematic Risk Premium
34
Value of NOL Tax Benefits | Draft |
` |
| Indicated Present Value Calculation of NOL's ($'s in Thousands) |
| ||||||||||||||||
|
| 2012 |
| 2013 |
| 2014 |
| 2015 |
| 2016 |
| 2017 |
| ||||||
Unused NOL Beginning of Year |
| $ | 19,038 |
| $ | 18,138 |
| $ | 17,238 |
| $ | 16,338 |
| $ | 15,438 |
| $ | 14,538 |
|
Unused NOL End of Year |
| $ | 18,138 |
| $ | 17,238 |
| $ | 16,338 |
| $ | 15,438 |
| $ | 14,538 |
| $ | 13,638 |
|
Amount Used |
| $ | 900 |
| $ | 900 |
| $ | 900 |
| $ | 900 |
| $ | 900 |
| $ | 900 |
|
PV Factor @ 18% |
| 1.0863 |
| 1.2818 |
| 1.5125 |
| 1.7848 |
| 2.1061 |
| 2.4851 |
| ||||||
Present Value |
| $ | 829 |
| $ | 702 |
| $ | 595 |
| $ | 504 |
| $ | 427 |
| $ | 362 |
|
PV of NOL’s @ 2012-2032 |
| $ | 5,267 |
|
|
|
|
|
|
|
|
|
|
| |||||
Discount Factor @ 18% |
| 2.106 |
|
|
|
|
|
|
|
|
|
|
| ||||||
PV of NOL |
| $ | 2,501 |
|
|
|
|
|
|
|
|
|
|
| |||||
Source: Management
35