
INVESTOR PRESENTATION
Kaman Corporation
(NASDAQ: KAMN)
September 2006
The 12th Annual
Gabelli & Company, Inc.
Aircraft Supplier Conference
September 7-8, 2006
The New York Helmsley Hotel

Slide 1
FORWARD-LOOKING STATEMENTS
Forward-Looking Statements
This presentation may contain forward-looking information relating to the company's business and prospects, including the Aerospace, Industrial Distribution and Music businesses, operating cash flow, and other matters that involve a number of uncertainties that may cause actual results to differ materially from expectations. Those uncertainties include, but are not limited to: 1) the successful conclusion of competitions for government programs and thereafter contract negotiations with government authorities, both foreign and domestic; 2) political conditions in countries where the company does or intends to do business; 3) standard government contract provisions permitting renegotiation of terms and termination for the convenience of the government; 4) domestic and foreign economic and competitive conditions in markets served by the company, particularly defense, commercial aviation, industrial production and consumer market for music products; 5) resolution of outstanding issues and thereafter satisfactory completion of the Australian SH-2G(A)program; 6) receipt and successful execution of production orders for the JPF U.S. government contract including the exercise of all contract options and receipt of orders from foreign militaries, as both have been assumed in connection with goodwill impairment evaluations; 7) satisfactory resolution of i) warranty issues and the DCIS investigation related to the FMU-143 program and ii) supplier-related issues hindering the FMU-139 program, at Dayron; 8) maintenance of adequate business base in the Aerospace segment in order to absorb overhead and general and administrative expenses; 9) satisfactory results of negotiations with NAVAIR concerning purchase of the company's leased facility in Bloomfield, Connecticut; 10) continued support of the existing K-MAX helicopter fleet, including sale of existing K-MAX spare parts inventory and in 2007, availability of a redesigned clutch assembly system; 11) cost growth in connection with environmental remediation activities at the Moosup facility and such potential activities at the Bloomfield facility; 12) profitable integration of acquired businesses into the company's operations; 13) changes in supplier sales or vendor incentive policies; 14) the effect of price increases or decreases; 15) pension plan assumptions and future contributions; 16) continued availability of raw materials in adequate supplies; 17) the effects of currency exchange rates and foreign competition on future operations; 18) changes in laws and regulations, taxes, interest rates, inflation rates, general business conditions and other factors; and 19) other risks and uncertainties set forth in the company's annual, quarterly and current reports, and proxy statements. Any forward-looking information provided in this release should be considered with these factors in mind. The company assumes no obligation to update any forward-looking statements contained in this presentation.
Contact:
Russell H. Jones, SVP,Chief Investment Officer & Treasurer
(860) 243-6307
rhj-corp@kaman.com
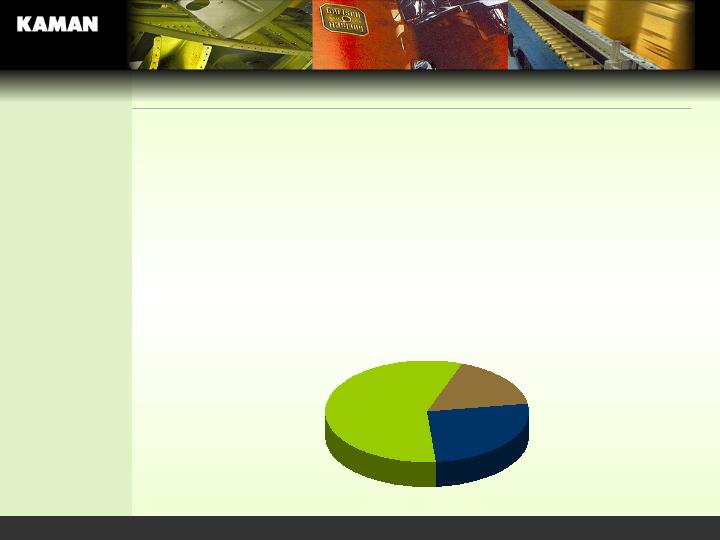
Corporate Profile
For the 12 months
SALES Ended 12/31/05
g
Aerospace 26% $288.0
g
Industrial Distribution 57% 621.9
g
Music 17% 191.3
100% $1,101.2
Slide 2
Percent Millions $
Percent Distribution of Sales
By Segment For 2005
Aerospace
SEGMENT OVERVIEW
Slide 3
2005 segment sales: $288.0 million
26%

Aerospace
Slide 4
Percent of
Millions $ Segment Sales Total Sales % Military
For the 12 Months Ended 12/31/05
1 Helicopters includes EODC and Kamatics includes RWG
g Aerostructures $ 55.0 19.1% 5.0% 67%
g Fuzing & M/M 58.4 20.3% 5.3% 78%
g Helicopters1 82.4 28.6% 7.3% 71%
g Kamatics1 92.2 32.0% 8.4% 33%
$288.0 100.% 26.0% 58%
AEROSPACE OPERATING UNIT SALES
(With Percent to Segment and Total Sales and Percent for Military Applications)

Aerospace
Slide 5
Sikorsky BLACKHAWK cockpit under
construction at Kaman’s Jacksonville facility
Aerostructures Division: Facilities in Jacksonville, FL and Wichita, KS
4
Produces parts and subassemblies for
various customers, including:
•
Military programs such as the Boeing C-17
military transport (approx. $1.1 million
per shipset through mid-2007) and
Sikorsky BLACK HAWK
helicopter cockpit (approximately $300
thousand per ship set)
per shipset through mid-2007) and
Sikorsky BLACK HAWK
helicopter cockpit (approximately $300
thousand per ship set)
•
Commercial programs such as the Boeing 737
(approximately $1.5 million annually), and 777 (approx.
$190 thousand/ship set)
$190 thousand/ship set)
4
Strategy: Take advantage of substantial opportunities
arising from the Tier 1 producers’ (Airbus, Bell,
Boeing, Sikorsky, Vought, etc.) offloading of
manufacturing work
Boeing, Sikorsky, Vought, etc.) offloading of
manufacturing work
4
Metallic-oriented at Jacksonville, Composite-oriented
at Wichita. Seeing opportunity for new programs at
both locations: Open capacity, well-located,
non-union, flexible, competitive
both locations: Open capacity, well-located,
non-union, flexible, competitive
Aerospace
Slide 6
Top: Hawk Missile
Bottom: JPF fuzes at Orlando facility
Fuzing Division: Facilities in Middletown, CT and Orlando, FL
4
Manufactures safe, arm and fuzing devices for a number of
major missile and bomb programs
4
Missile programs: AMRAAM, ATACMS, Brimstone, M-100
Hawk, Harpoon, JASSM, Maverick, SLAM-ER, Standard and
Tactical Tomahawk
Tactical Tomahawk
4
Bomb programs: Joint Programmable Fuze,
FMU-143, FMU-139, 40mm
4
Strategy: Become the leading producer of
fuzing systems for the U.S. and Allied
militaries – market size estimate: $650 million
militaries – market size estimate: $650 million
4
Principal customers: U.S. militaries, Boeing,
General Dynamics, Lockheed and Raytheon
4
Ramping up capabilities for production of the
152 A/B Joint Programmable Fuze: The
expected fuze of choice
expected fuze of choice

Aerospace
Slide 7
Top: Kaman SH-2G Super Seasprites
Bottom: Kaman K-MAX helicopter
Helicopters Division: Facilities in Bloomfield, CT
4
Markets and supports Kaman-made SH-2G Super
Seasprite maritime helicopter and K-MAX
“Aerial Truck” helicopter – and performs
subcontract helicopter programs
“Aerial Truck” helicopter – and performs
subcontract helicopter programs
4
Strategy: Exploit increasing opportunities in
subcontracting as the major producers move from
manufacturing to final assembly and
systems integration
manufacturing to final assembly and
systems integration
4
Principal customers include the governments of
Australia, Egypt, New Zealand and Poland;
the U.S. Department of State and others
the U.S. Department of State and others
4
Helicopters are expected to return at approximate 10-year service
intervals for standard depot level maintenance. The third of nine
aircraft in service with Egypt are now in process (approximately
$1.3 million/aircraft). Remainder expected over the next three years.
Initial funding received for proposed upgrade program.
aircraft in service with Egypt are now in process (approximately
$1.3 million/aircraft). Remainder expected over the next three years.
Initial funding received for proposed upgrade program.
4
Program for Australia, in loss position, is moving toward completion

Aerospace
Slide 8
Kamatics proprietary aerospace bearings
Kamatics & RWG: Facilities in Bloomfield, Ct and Dachsbach, Germany
4
Designs and makes proprietary self-lubricating
bearings for OEM and MRO use in nearly
all military and commercial aircraft
produced in North and South America
and Europe
all military and commercial aircraft
produced in North and South America
and Europe
4
Strategy: Maintain leadership in product
technical performance and application
engineering support while staying ahead of the
curve in product technology enhancement: Target
engineering support while staying ahead of the
curve in product technology enhancement: Target
the most demanding applications early in the aircraft design process as part of prime-contractors’ problem-solving teams – and effectively address customers’ needs by providing the highest performance available.
4
Market size: $0.5 billion high-end portion of the $ 1.2 billion
aerospace bearing market
4
Key customers include: U.S. and allied militaries (approximately
32% of 2005 sales), and commercial accounts with Boeing, Airbus,
Embraer, Bombardier and others (68% of sales). Largest customer
represents approximately 20% of 2005 sales, down from 43% in 1998
Embraer, Bombardier and others (68% of sales). Largest customer
represents approximately 20% of 2005 sales, down from 43% in 1998
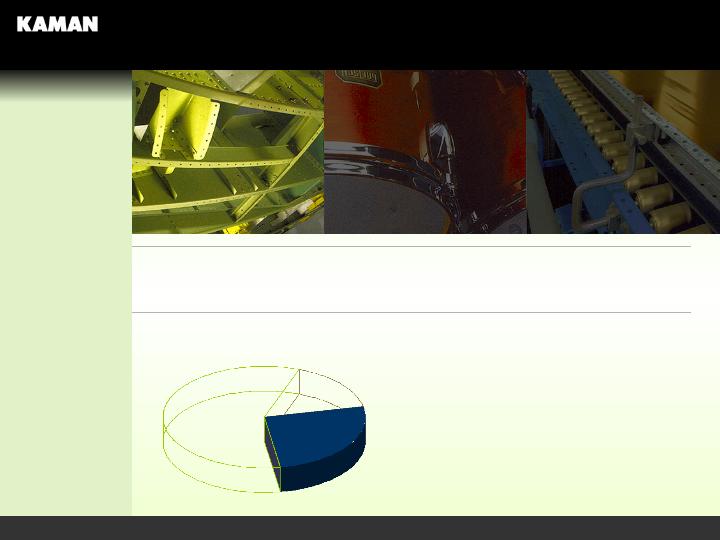
Industrial Distribution
SEGMENT OVERVIEW
Slide 9
2005 segment sales: $621.9 million
57%

Industrial Distribution
Slide 10
Kaman Industrial Technologies
4
Third largest player in $12 billion power transmission market.
Provides nearly two million products to more than 50,000 MRO
and OEM customers
and OEM customers
4
Strategy: Expand the geographic footprint in major industrial
markets to enhance competition for national and regional
accounts. Broaden the product line, and further enhance
accounts. Broaden the product line, and further enhance
operating and asset utilization efficiencies throughout the
enterprise
enterprise
4
Serves a broad cross section of North American industry with
local branches in 70 of the top 100 U.S. Industrial markets.
Growing national account base
Growing national account base
4
Now nearly 200 locations in the U.S., Canada and Mexico
4
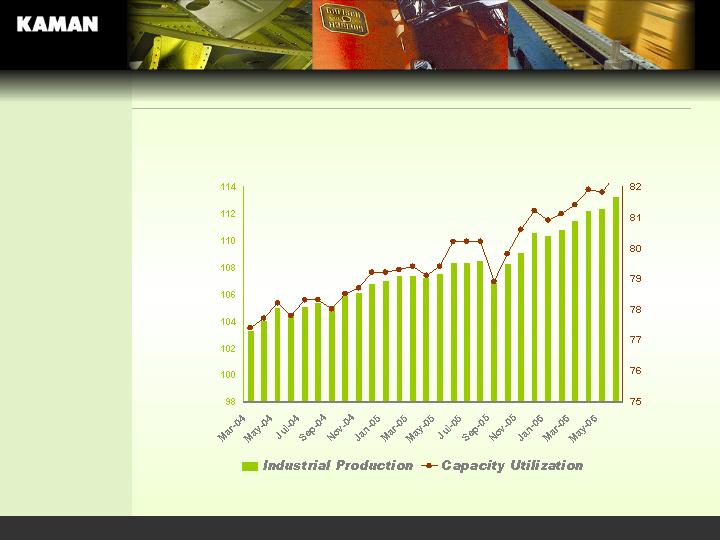
The business tends to closely track the U.S. Industrial
production and capacity utilization indices. Stable climate
expected at least through 2006.
expected at least through 2006.
Industrial Distribution
Source: Federal Reserve Board
Slide 11
FRB Indices Of Industrial Production
And Capacity Utilization:
Predictability: Segment closely tracks national indices
Predictability: Segment closely tracks national indices

Industrial Distribution
Slide 12
Portfolio Of Recognized Brands
More than 1.7 million products
Sold to more than 50,000 MRO and OEM customers
Industrial Distribution
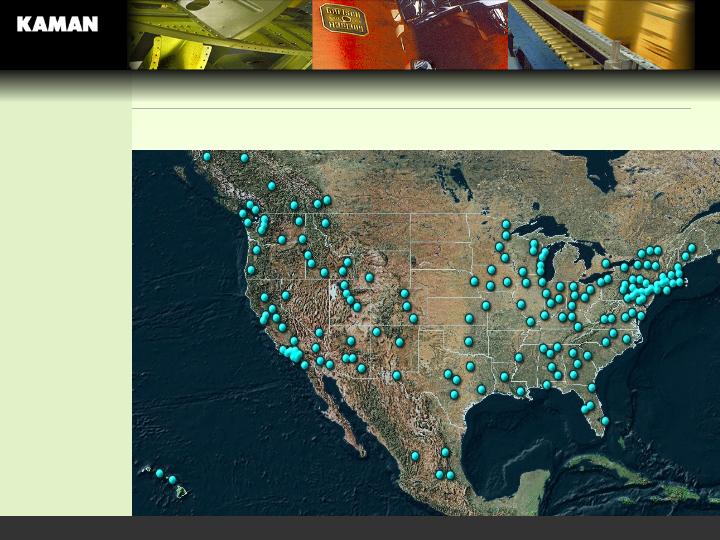
Slide 13
Geographical Coverage:
Nearly 200 locations in U.S. Canada and Mexico
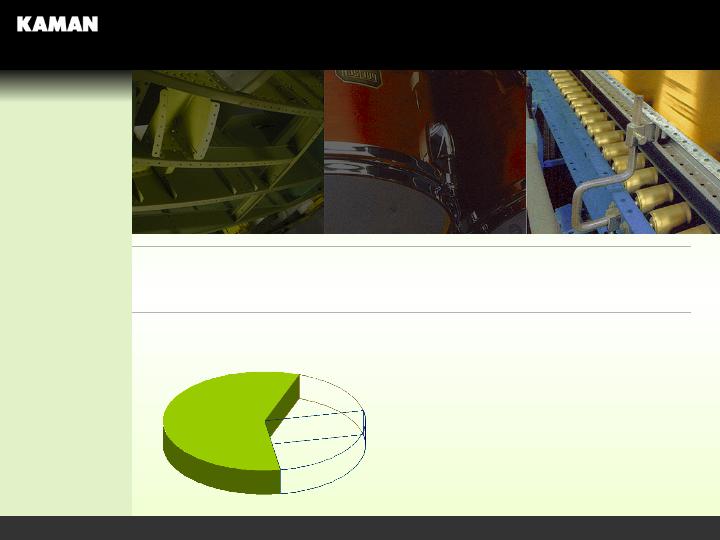
Music
SEGMENT OVERVIEW
Slide 14
2005 Segment sales: $191.3 million
17%

Music
Slide 15
Kaman Music
Top: Ovation Guitar
Bottom: Gretsch Drum Set
4
Largest independent distributor of musical
instruments and accessories in a $2.5 billion slice
of the $7.0 billion U.S. musical instruments
market: More than 20,000 products
of the $7.0 billion U.S. musical instruments
market: More than 20,000 products
4
Strategy: Build on Kaman’s strong brand identity while adding new
market-leading names to the company’s offering of proprietary
products
products
4
Purchased its largest competitor in 2005
4
Leads the market in use of technology, providing
systems to service customers at all levels
4
U.S. and Asian manufacturing supports Kaman’s
proprietary and licensed brands of premium products
4
Market is driven by consumer sentiment with the
"Back-to-School" and "Holiday" seasons being important market
indicators. Second half of year expected to be stronger than first half
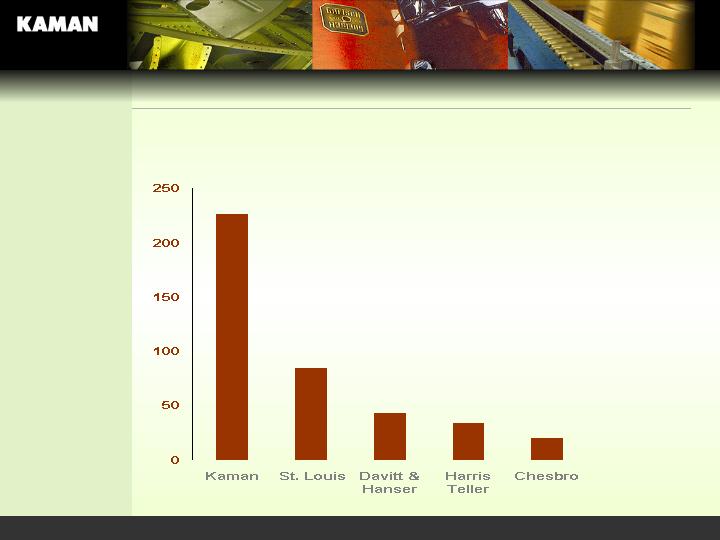
ESTIMATED SALES OF TOP INDEPENDENT DISTRIBUTORS
Kaman includes August 2005 acquisition of Musicorp
(AMOUNTS IN MILLIONS)
Slide 16
Source: Music Trades
Magazine
Music
Music
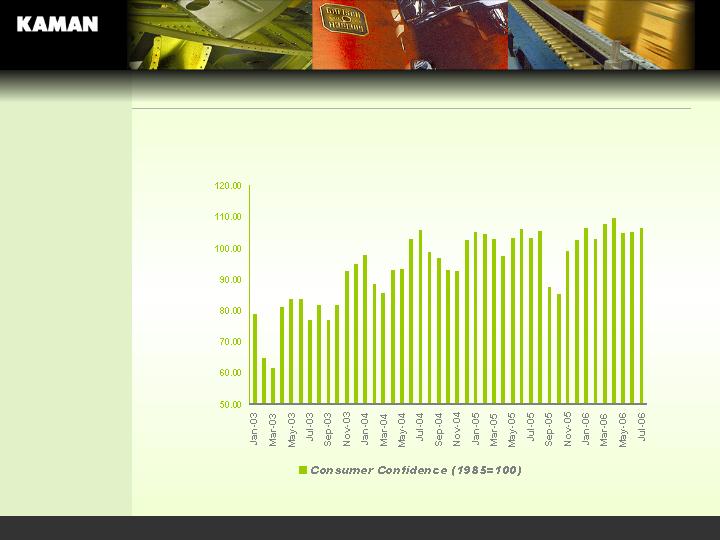
Slide 17
Source: The Conference Board
Consumer Confidence Index:
Segment Responds to “Back-to-school” and “Holiday” Spending Patterns

Music
Slide 18
Largest Independent Distributor: Over 20,000 Products in Total
Portfolio of Premium Brand Products Identified by These Logos
Represents 51% of Segment Sales

Financial Review
Slide 19

For the Three Months Ended | For the Six Months Ended | |||
In millions, except per share data | June 30, 2006 | July 1, 2005 | June 30, 2006 | July 1, 2005 |
| Net Sales | $ 293.0 | $ 271.3 | $ 589.6 | $ 534.6 |
% change | 8.0% | 9.6% | 10.3% | 8.5% |
| Gross Profit | $ 80.5 | $ 70.7 | $ 161.9 | $ 141.6 |
% of net sales | 27.5% | 26.1% | 27.5% | 26.5% |
| Selling, general & administrative | ||||
| expenses (S,G&A) | $ 67.0 | $ 64.0 | $ 137.1 | $ 126.2 |
% of net sales Operating Income % of net sales | 22.9% $ 14.0 4.8% | 23.6% $ 7.3 2.7% | 23.2% $ 25.7 4.3% | 23.6% $ 16.5 3.1% |
| Interest expense, net | 1.6 | 0.6 | 2.9 | 1.4 |
| Other expense, net | 0.3 | 0.5 | 0.6 | 0.7 |
| Net earnings | $ 7.5 | $ 2.8 | $ 13.4 | $ 7.5 |
| Net earnings per share - basic | $ .31 | $ .12 | $ .56 | $ .33 |
| Net earnings per share - diluted | $ .31 | $ .12 | $ .55 | $ .33 |
SELECTED CONSOLIDATED FINANCIAL INFORMATION
Slide 20

Slide 21

1 Corporate expense percentage is to Total Sales
For the Six Months Ended June 30, 2006 | ||||||
(In millions) | Sales | Operating Income | Operating Margin | |||
1H/06 | 1H/05 | 1H/06 | 1H/05 | 1H/06 | 1H/05 | |
Aerospace | $148.0 | $141.7 | $20.7 | $17.2 | 14.0% | 12.1% |
Industrial Distribution | 341.1 | 313.5 | 20.1 | 16.9 | 5.9% | 5.4% |
Music | 100.5 | 79.4 | 2.9 | 4.4 | 2.9% | 5.6% |
Corporate Expense | (18.1) | (22.1) | 1 (3.1%) | 1 (4.1%) | ||
Total | $589.6 | $534.6 | 2 $25.7 | 2 $16.5 | 4.3% | 3.1% |
2 Includes $0.1 in net gain on sales or disposal of assets
Slide 22
Segment Operating Highights
GAAP reconciliation applicable to the six months ended June 30, 2006 This table provides a reconciliation of reported Net Earnings determined under applicable generally accepted accounting principles (GAAP) to net earnings adjusted for the affect of various discrete items. | |||
Earnings Before Income Taxes | Net Earnings | Net Earnings Per Share Diluted | |
| As Reported | $22.2 | $13.4 | $0.56 |
| Add: | |||
| Addition to Loss Reserve: Australia | 5.3 | 3.2 | 0.13 |
Stock Appreciation Rights: Deductible and Non- Deductible | 0.5 | 0.4 | 0.02 |
| Subtract: | |||
| Gain from Capitalized Freight Adjustment | (1.6) | (0.9) | (0.04) |
| Recovery of Recapitalization Legal Fees | (0.5) | (0.5) | (0.02) |
| As Adjusted | $26.0 | $15.6 | $0.66 |
These adjustments represent certain discrete items. The Company uses certain financial measures internally to focus management on period-to-period changes in our business. Therefore, we believe that this supplemental information is meaningful to investors when considered in connection with the information contained in the GAAP presentation of financial information. The presentation of these items is not meant to represent results as defined by GAAP, nor as an alternative for financial performance as determined under GAAP.
For the Three Months Ended June 30, 2006 | ||||||
(In millions) | Sales | Operating Income | Operating Margin | |||
2Q/06 | 2Q/05 | 2Q/06 | 2Q/05 | 2Q/06 | 2Q/05 | |
Aerospace | $74.4 | $76.0 | $ 10.7 | $ 9.5 | 14.3% | 12.5% |
Industrial Distribution | 170.5 | 157.5 | 9.3 | 8.4 | 5.4% | 5.3% |
Music | 48.1 | 37.8 | 1.6 | 1.9 | 3.4% | 4.9% |
Corporate Expense | (7.6) | (12.6) | 1 (2.6%) | 1(4.6%) | ||
Total | $293.0 | $271.3 | $14.0 | 2 $7.3 | 4.8% | 2.7% |

As of 6/30/06 | As of 3/31/06 | As of 12/31/05 | |
Bank Debt, Notes Payable and Debentures | $101.4 | $103.5 | $64.8 |
Shareholders’ Equity | $281.1 | $274.0 | $269.8 |
Debt as % of Total Capitalization | 26.5% | 27.4% | 19.4% |
Capital Expenditures | $5.0 | $1.7 | $9.9 |
Depreciation & Amortization | $5.2 | $2.5 | $9.6 |
Slide 23
Balance Sheet and Capital Factors

Slide 24
Key Messages
–
Recapitalization completed in 2005 – New symbol: KAMN
•
1 share-1 vote structure achieved with < 4% dilution
–
10.7% increase in sales to $1.1 billion in 2005 vs. 2004
•
EPS of $0.57 (diluted) in 2005 compared to a loss of $0.52 in 2004
•
Dividend increased 13.6%
•
First full year of operations following realignment of Aerospace segment.
Transition still a work-in-process
–
10.3% increase in sales to $589.6 million in 1H/06 vs. 1H/05
•
Operating Income $25.7 million in first six months of 2006, up 56% from $16.5
million in year-ago period, including the effect of all net adjustments
•
EPS of $0.55 (diluted) for first six months of 2006 compared to $0.33 (diluted) in
the year-ago period, including the effect of all net adjustments
–
Seasoned management team aligned with shareholders through
performance-based compensation

–
Strategies for growth are in place for each segment
–
Business Climate Mostly Positive
–
Aerospace realignment yielding results: lower costs, new business wins
–
Industrial Distribution competing well and gaining market share
–
Music consumers affected by fuel costs, interest rates, consumer debt levels
–
Acquisition program augments organic growth
–
Nine acquisitions in past four years: Three for each segment
–
Most recent: Musicorp (MBT) was the largest indepedent musical instrument distribution after Kaman.
–
Diversified revenue stream and financial flexibility to pursue strategic
objectives
–
$150 million revolving credit provides availability through 2010
–
Investment grade: S&P rating of BBB- with stable outlook
Slide 25
Key Messages, cont.

All public information is available on the Kaman website: www.kaman.com
KAMN
KAMAN CORPORATION
Traded on NASDAQ Global Market