Free signup for more
- Track your favorite companies
- Receive email alerts for new filings
- Personalized dashboard of news and more
- Access all data and search results
Filing tables
KAMN similar filings
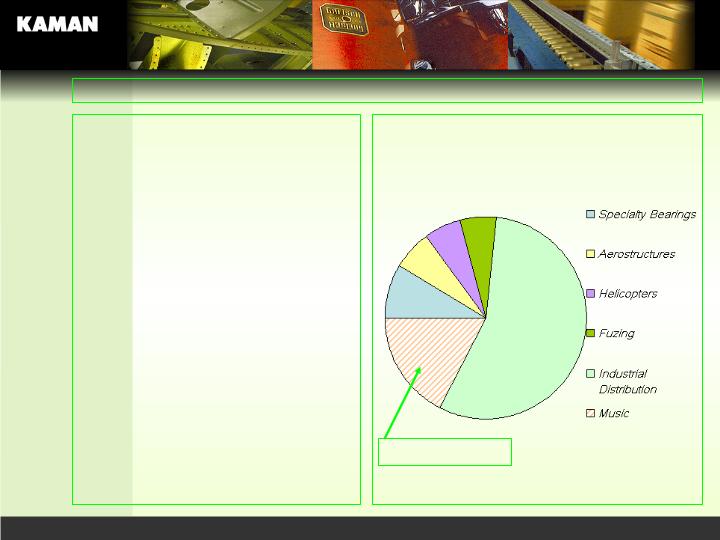
- 2 Jan 08 Kaman Completes Sale of 40 Millimeter Fuzing Business
- 2 Jan 08 Kaman Completes the Sale of Its Music Segment
- 27 Nov 07 Other Events
- 14 Nov 07 Other Events
- 8 Nov 07 Amendments to Articles of Incorporation or Bylaws
- 1 Nov 07 Kaman Reports 2007 Third Quarter, Nine Months Results
- 29 Oct 07 Kaman Announces Agreement to Sell Music Segment
Filing view
External links