Kaman Corporation (NASDAQ-GS: KAMN)
Kaman Corporation (NASDAQ-GS: KAMN)
Investor Presentation
August 12, 2010
2
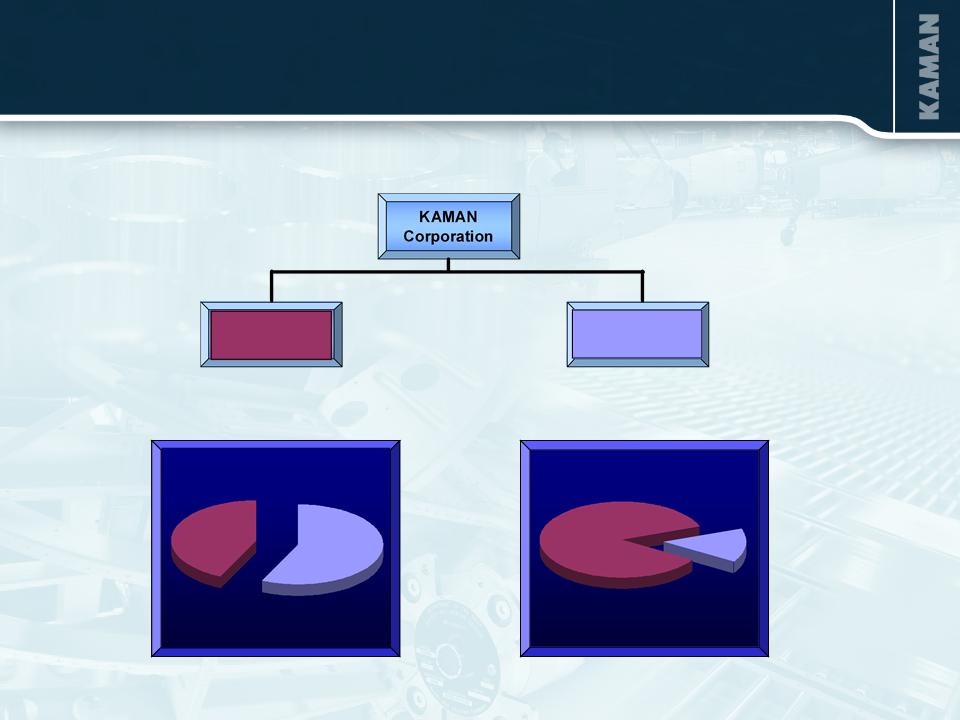
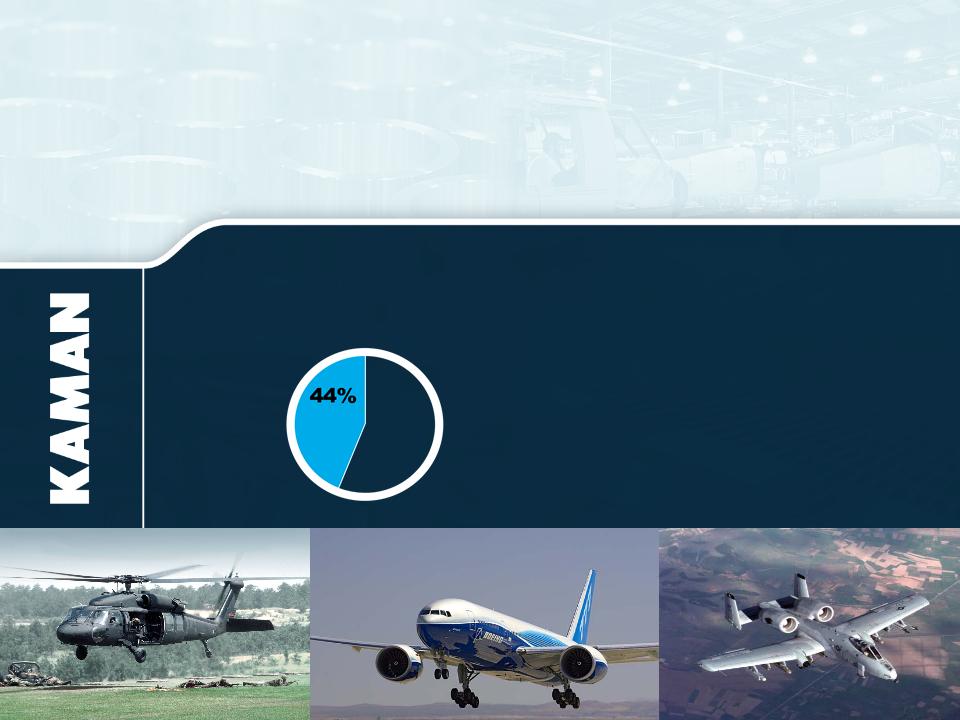
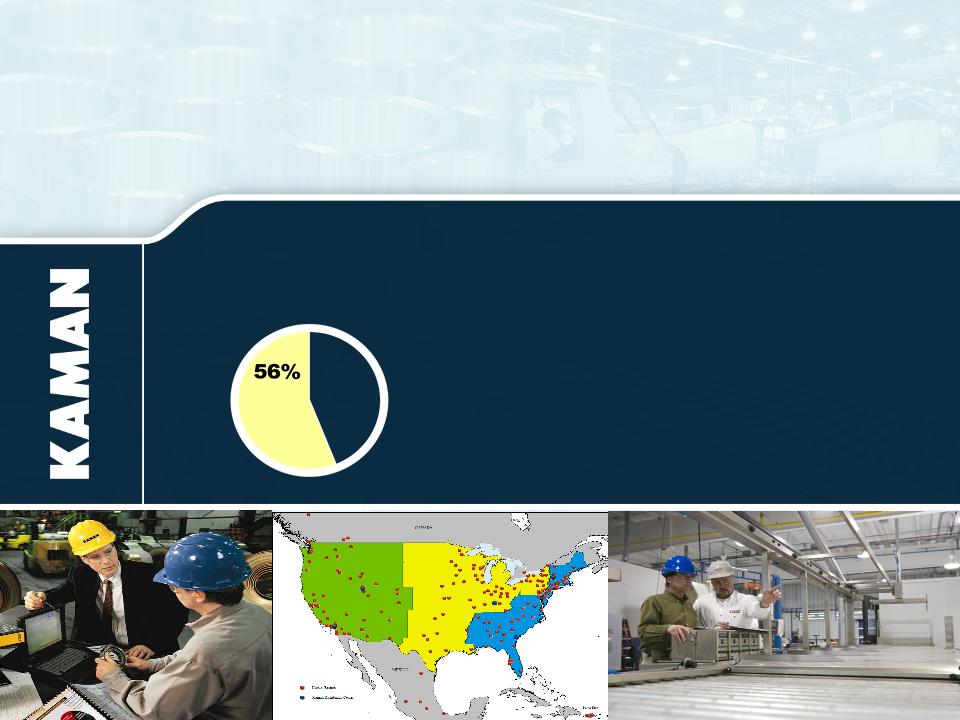
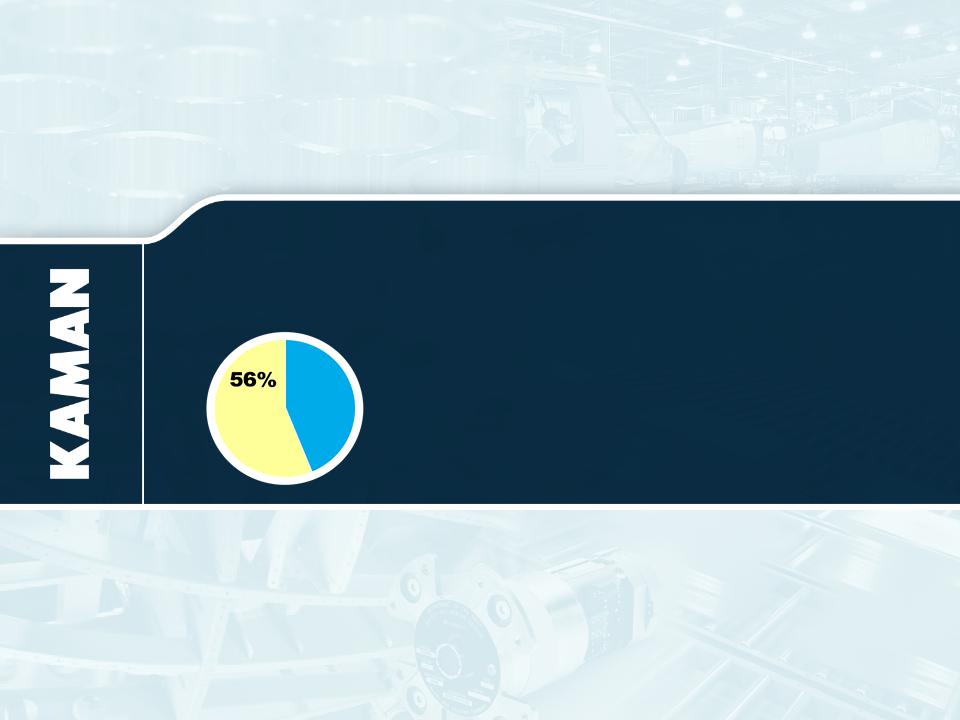
Distribution
56%
Aerospace
44%
2009 Sales
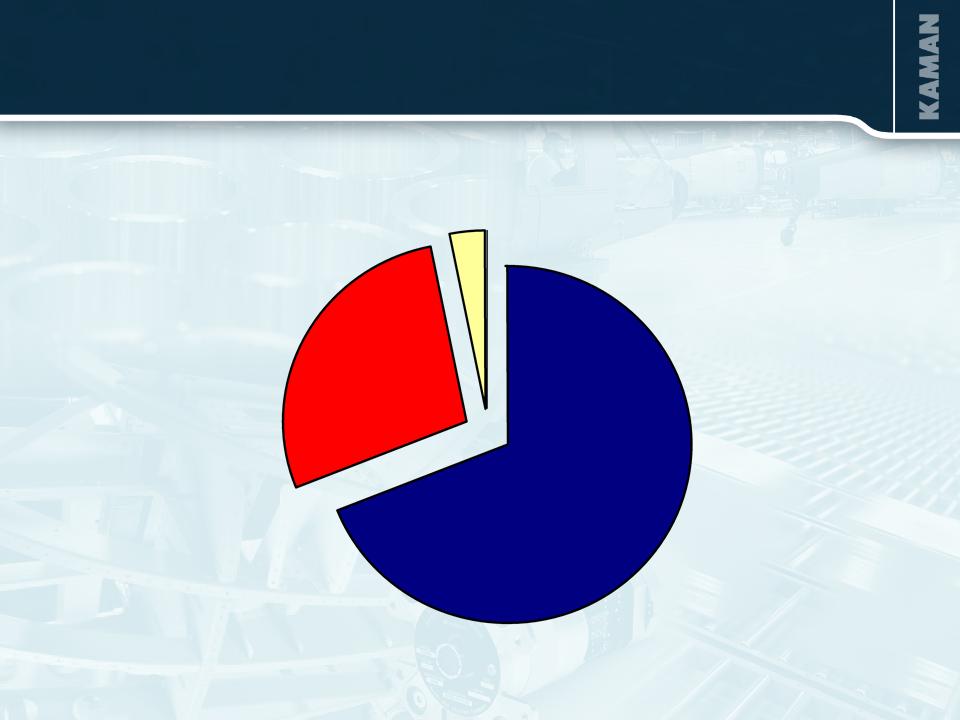
Distribution
14%
Aerospace
86%
2009 Segment
Operating Income*
2009 Sales $1,146 Million
4,303 Employees
Aerospace
Industrial
Distribution
NASDAQ GS: KAMN
KAMAN CORPORATION
* Operating profit after depreciation and before interest and corporate charges.
3
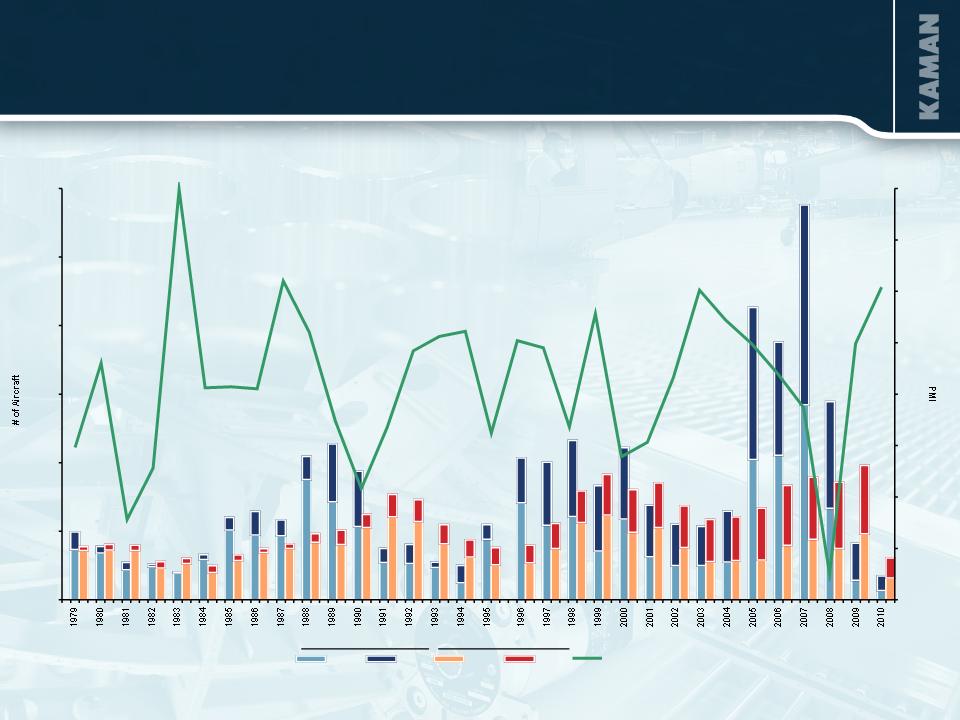
Source: Boeing and Airbus historical data and ISM
Aerospace Orders and Deliveries vs. ISM Index Over Time
WHY TWO BUSINESSES?
0
500
1,000
1,500
2,000
2,500
3,000
30.0
35.0
40.0
45.0
50.0
55.0
60.0
65.0
70.0
Boeing
Airbus
Boeing
Airbus
ISM index
Orders
Deliveries
4
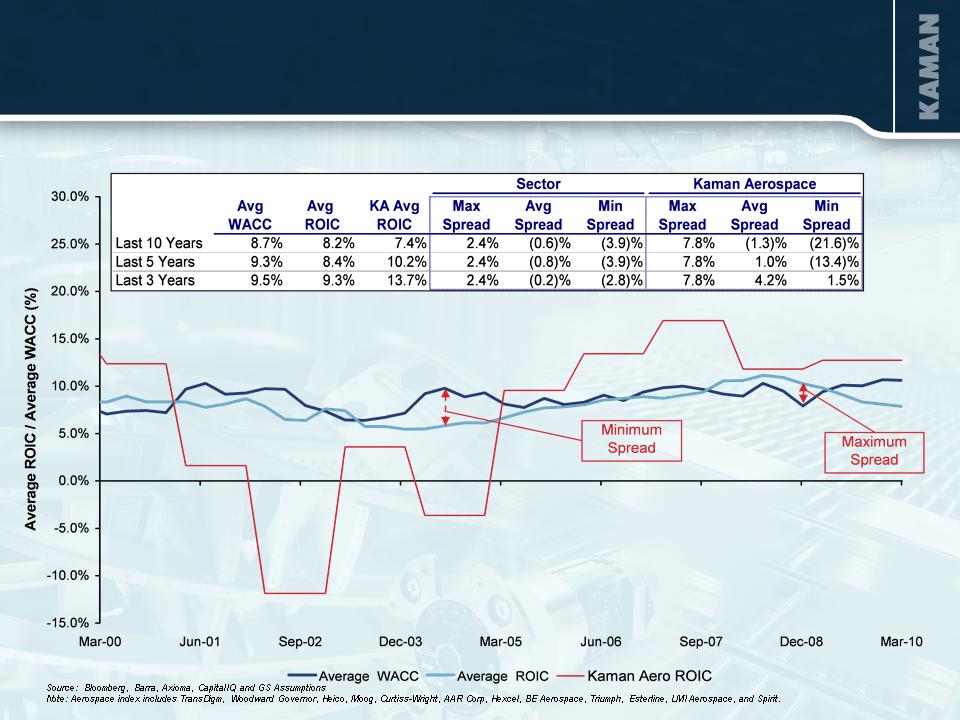
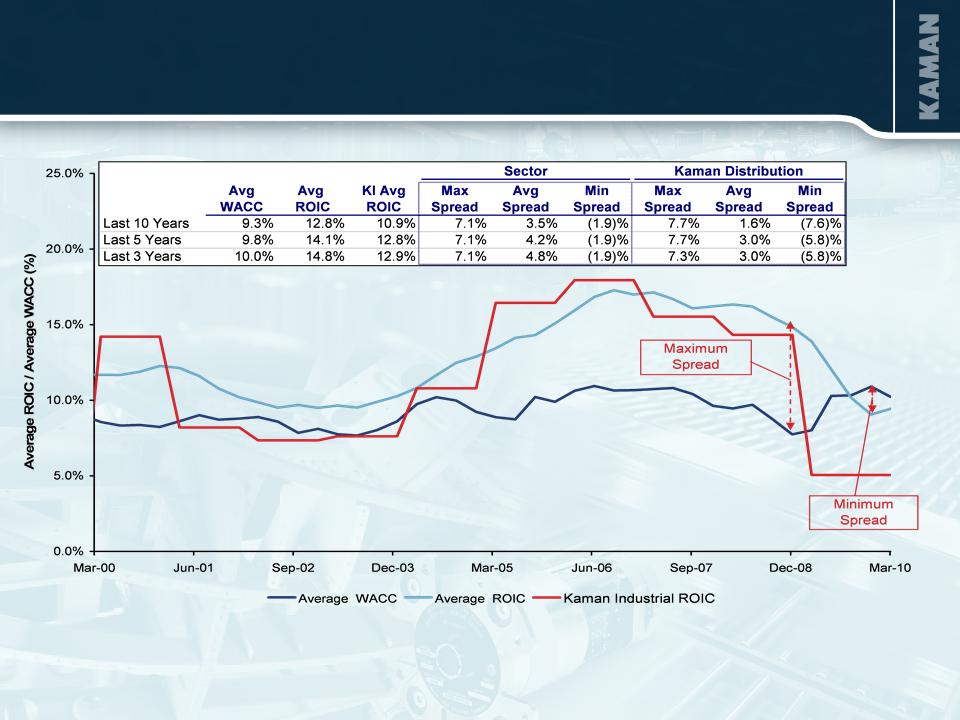
Note: WACC assumes marginal tax rate of 35%. Assumes barra predicted beta post 2005 and Bloomberg beta pre 2005. Assumes Rf as 30 year treasury rate.
AEROSPACE - Strategic Perspective
Illustrative ROIC versus WACC Analysis Over Time | Last 10 Years
5
Source: Bloomberg, Barra, Axioma, CapitalIQ and GS Assumptions
Note: Distribution index includes Fastenal, MSC Industrial, WW Grainger, Genuine Parts, Applied Industrial Technologies, DXP, WESCO, Anixter, Watsco, and Interline.
Note: WACC assumes marginal tax rate of 35%. Assumes barra predicted beta post 2005 and Bloomberg beta pre 2005. Assumes Rf as 30 year treasury rate.
INDUSTRIAL DISTRIBUTION - Strategic Perspective
Illustrative ROIC versus WACC Analysis Over Time | Last 10 Years
6
AEROSPACE SEGMENT
2009 Sales $501 million
7
Commercial
Military
Business/Regional
28%
69%
3%
Note: Based on 2009 sales
AEROSPACE - Business Mix
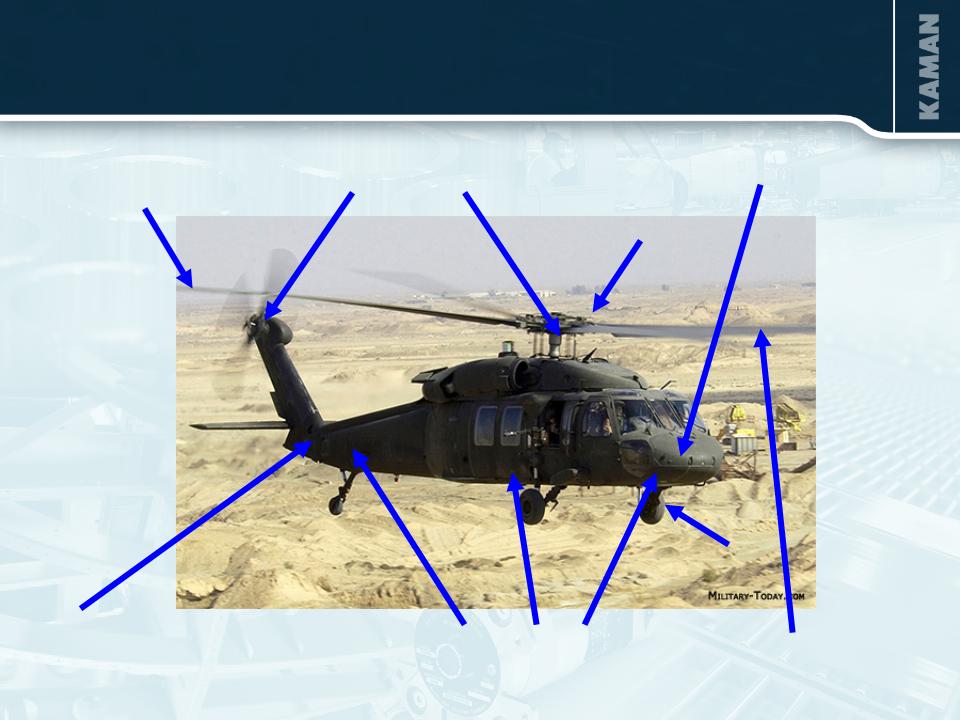
8
Manufacture of cockpit
Blade erosion coating
Manufacture and assembly
of tail rotor pylon
of tail rotor pylon
Sub assembly and
joining of fuselage
joining of fuselage
Blade manufacture, repair
and overhaul
and overhaul
Driveline couplings
Bushings
Flight control bearings
Bearing products
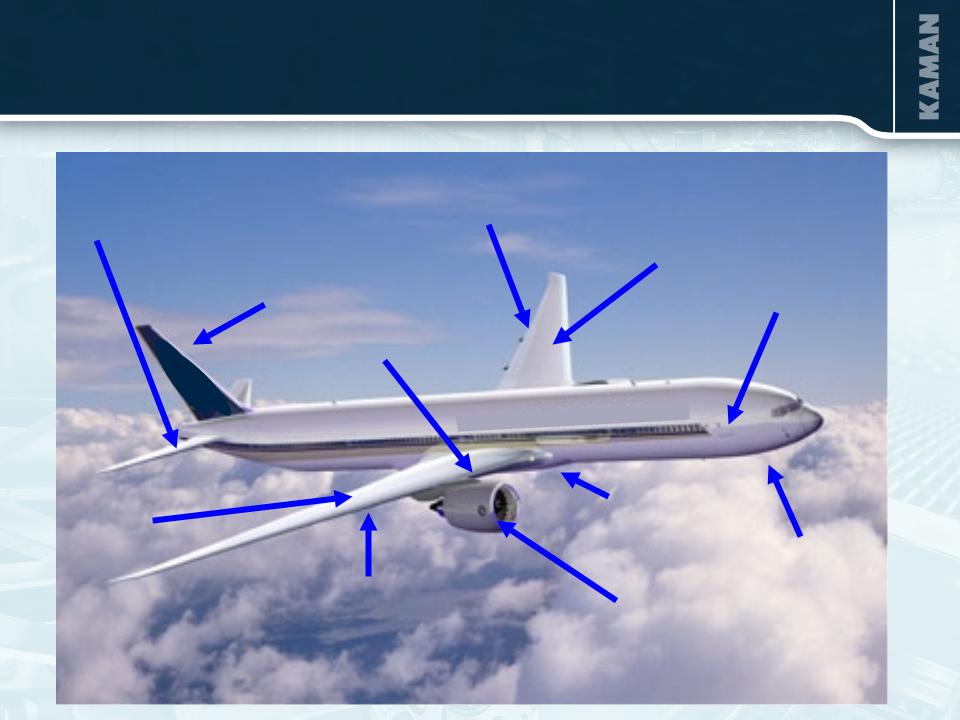
AEROSPACE - Programs/Capabilities
9
Fixed trailing edge
Fuel tank access doors
Top covers
Bearing products
Nose landing gear
Rudder
Main landing gear
Flaps
Horizontal stabilizer
Doors
Engine/thrust reverser
Flight controls
AEROSPACE - Programs/Capabilities
10
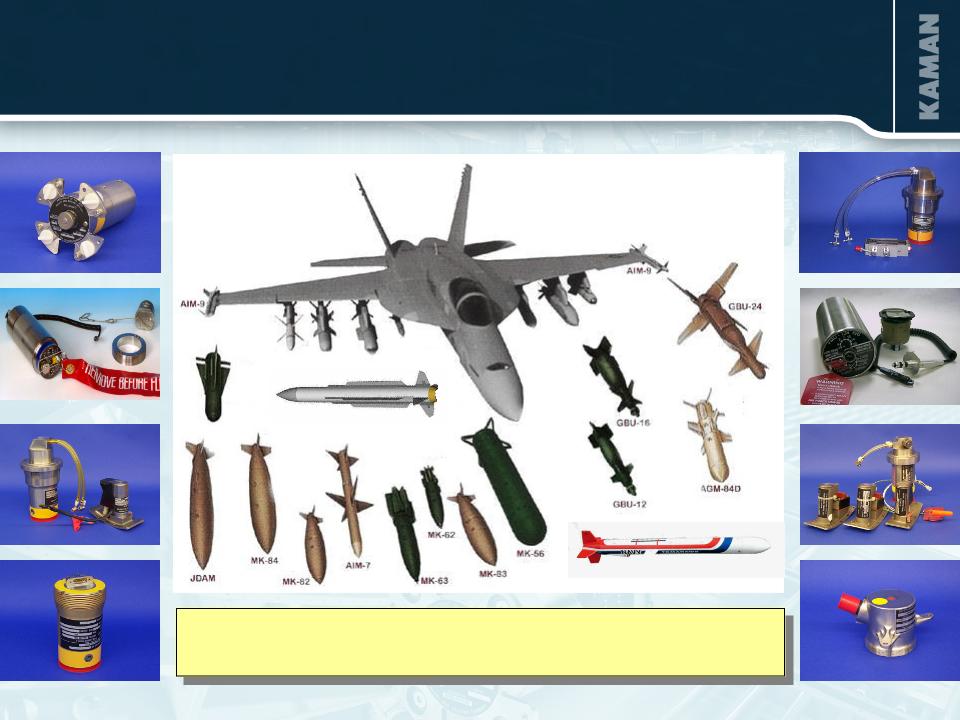
HARPOON
FMU-139
TOMAHAWK
STANDARD
MISSILE
MISSILE
SLAM-ER
AMRAAM
KPP Fuzes are on a Majority of Major Weapons
Systems
Systems
STANDARD
MISSILE
MISSILE
JPF
SLAM-ER
TOMAHAWK
AMRAAM
MAVERICK
AGM-65M
AEROSPACE - Programs/Capabilities
11
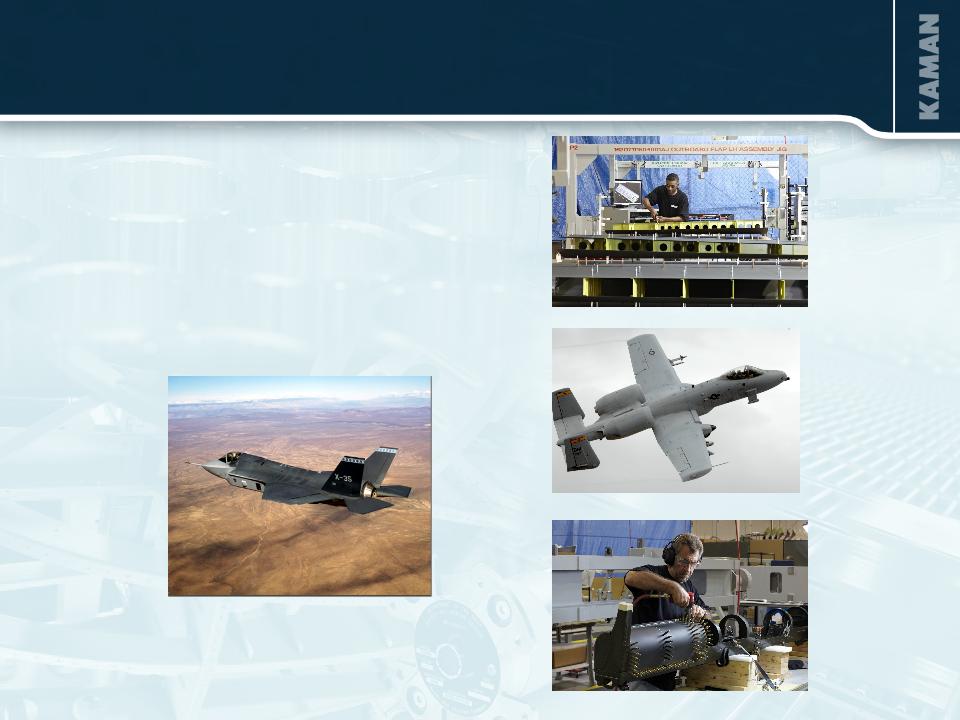
AEROSPACE - Programs/Capabilities
§ Tooling design and manufacture
12
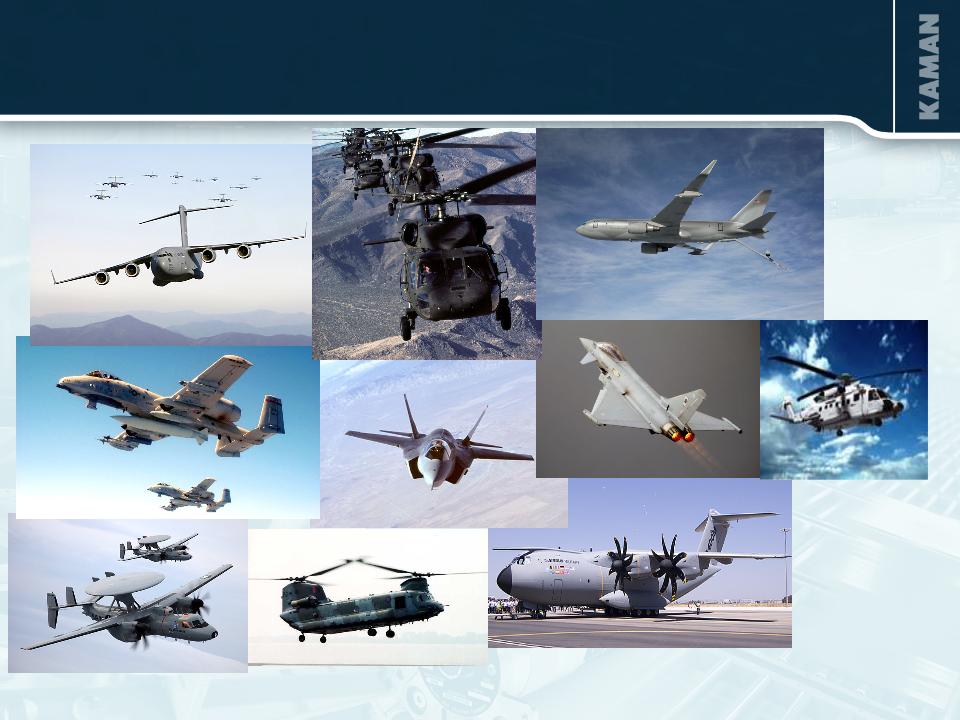
JSF
C-17
A-10
E-2D
Typhoon
UH-60
A400
CH-47
AEROSPACE - Principal Military Platforms
Boeing NewGen Tanker
MH-92
13
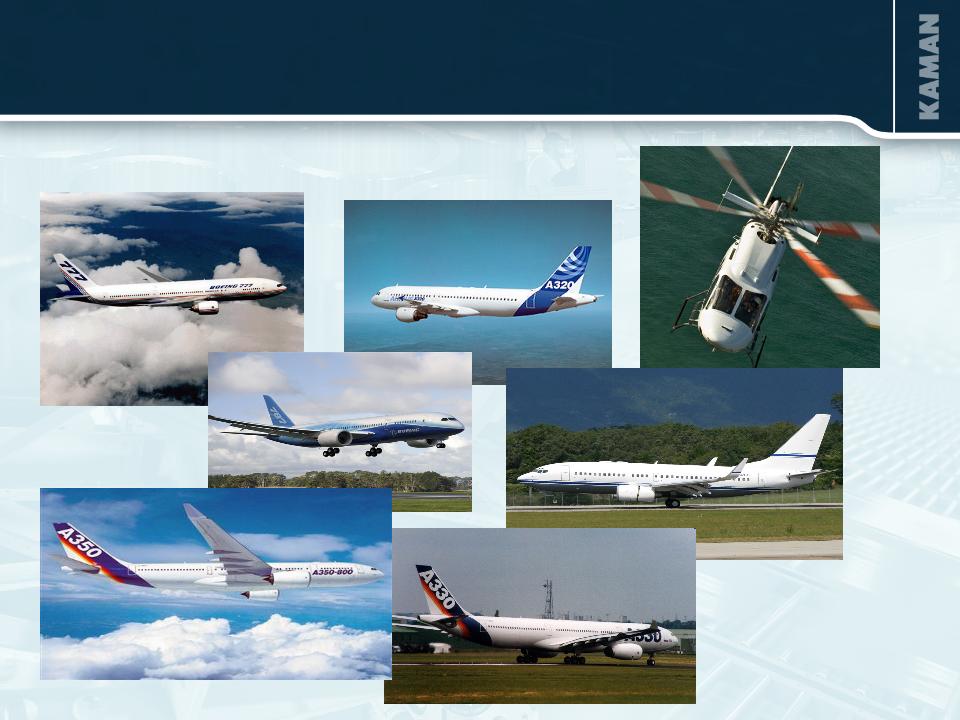
AEROSPACE - Commercial Significant Platforms
Airbus A320
Boeing 777
Airbus A330
Bell Helicopter
Boeing 787
Boeing 737
Airbus A350

14
AEROSPACE - Kamatics Lean Journey
§ Our Bloomfield Kamatics facility has very successfully
implemented lean manufacturing processes
implemented lean manufacturing processes
§ Since introducing lean in 2000 Kamatics has:
- Doubled sales
- Increased return on identifiable assets by more than 5,400
basis points
basis points
- Kept headcount constant
- Doubled sales per employee
- Increased on-time deliveries to more than 90% from less than
50%
50%
- Developed industry leading lead-times of four to eight weeks
from twelve to eighteen weeks
from twelve to eighteen weeks
§ The performance of this facility has been remarkable and today
it is a world-class manufacturing operation
it is a world-class manufacturing operation
15
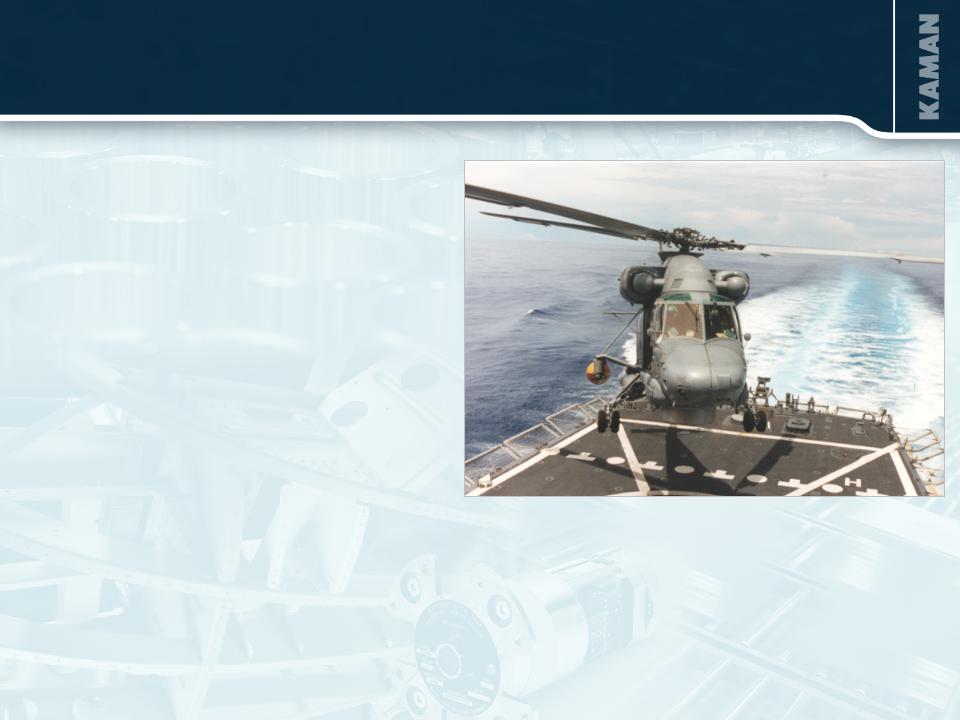
AEROSPACE - Kaman Helicopters
Kaman SH-2G Naval Helicopters
§ Support and Upgrades
§ Currently in service with Egypt,
New Zealand, Poland
New Zealand, Poland
§ Remarketing eleven SH-2G(I)s,
formerly Royal Australian Navy aircraft
formerly Royal Australian Navy aircraft
16
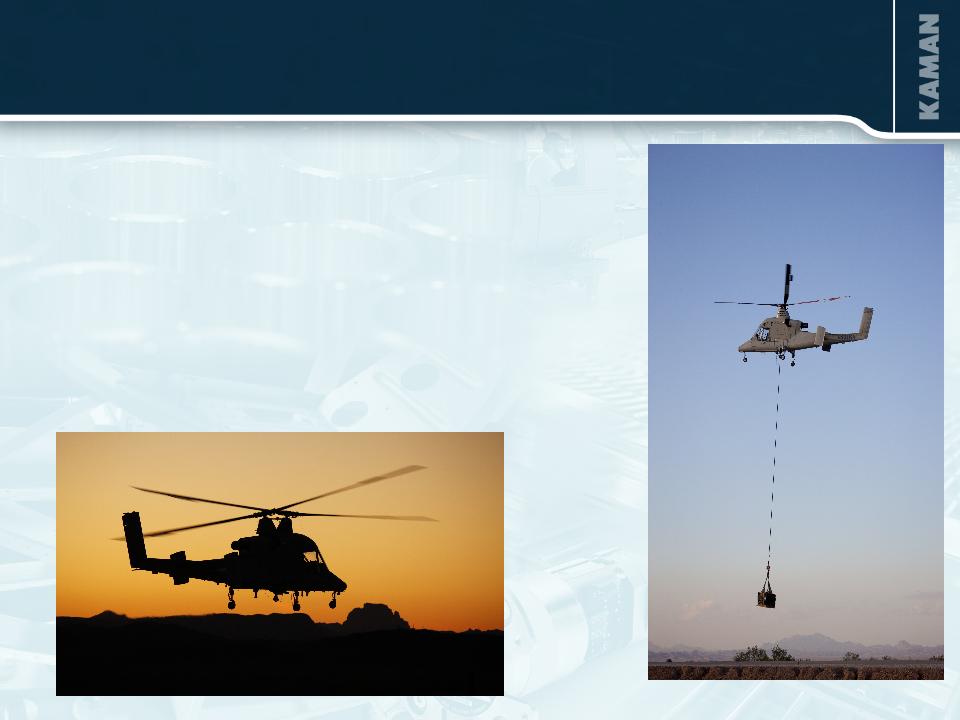
Kaman K-MAX®
§ K-MAX Commercial Helicopter
Support
Support
§ Teamed with Lockheed Martin to
develop an unmanned military version
of the K-MAX
develop an unmanned military version
of the K-MAX
§ Successfully demonstrated unmanned
K-MAX to the U.S. Marine Corps in
January 2010
K-MAX to the U.S. Marine Corps in
January 2010
AEROSPACE - Kaman Helicopters

17
- SH-2G(I)
- Unmanned K-MAX
AEROSPACE - Market Environment/Opportunities
§ Existing funded programs
- C-17
- JPF
- BLACK HAWK
§ Production ramp up
- A-10 re-wing
- Bell Helicopters
- B787
- JSF
- A380
§ New programs/opportunities
- JSF STOVL lift fan application
- AW 169
- Sukhoi Superjet 100
§ Continuation of outsourcing trend - primes and super tier 1’s
§ Acquisitions providing complementary capabilities and platforms
18
INDUSTRIAL DISTRIBUTION SEGMENT
2009 Sales $645 million

19
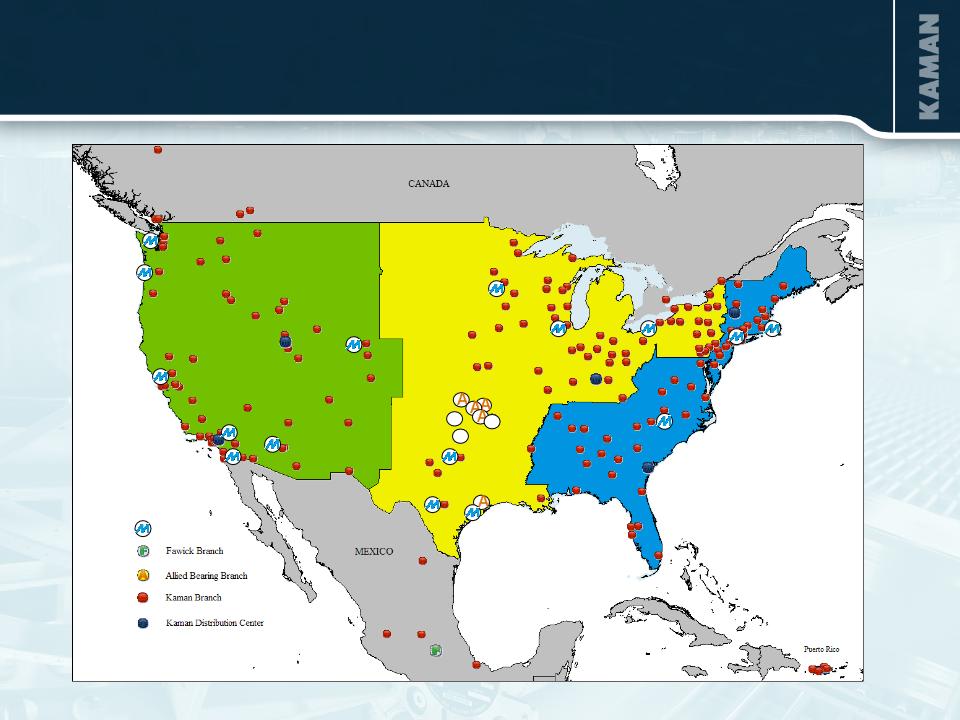
INDUSTRIAL DISTRIBUTION SEGMENT
§ Third largest industrial distribution firm serving $15 billion of a $23 billion power
transmission / motion control market.
transmission / motion control market.
§ 207 branches and 5 distribution centers
§ Major product categories:
- Bearings
- Mechanical and electrical power transmission
- Fluid Power
- Motion control
- Automation
- Material handling
§ Statistics
- $371,000 sales per employee (2009)
- 2,000 employees (approximately one third outside sales)
- 3.5 million SKUs
- 50,000+ customers
20
INDUSTRIAL DISTRIBUTION SEGMENT
A
A
A
Minarik
21
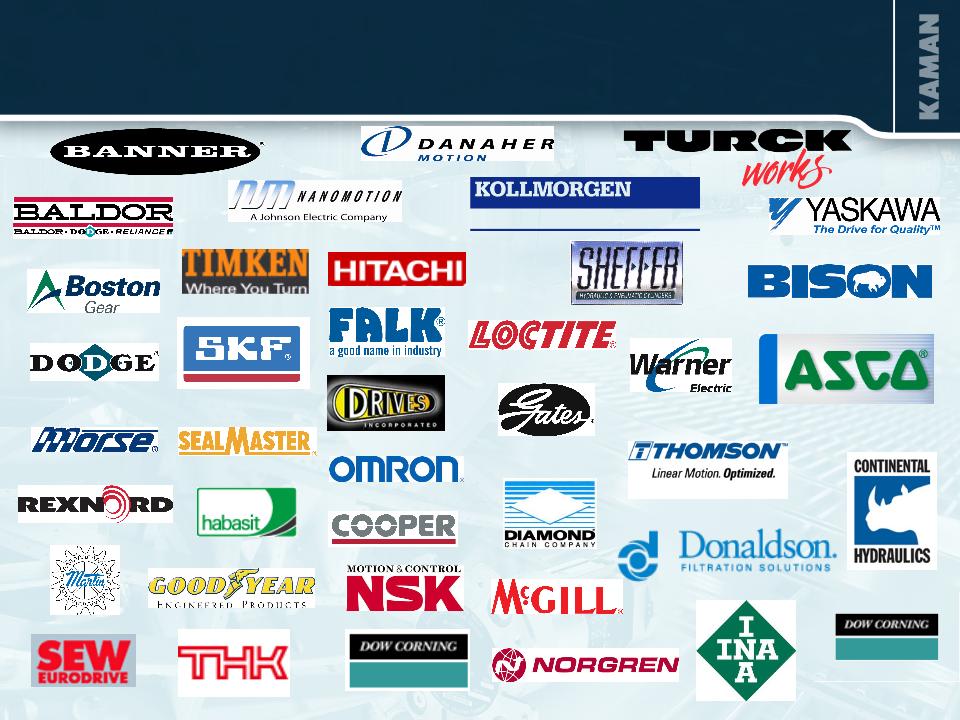
INDUSTRIAL DISTRIBUTION SEGMENT - Key Suppliers

22
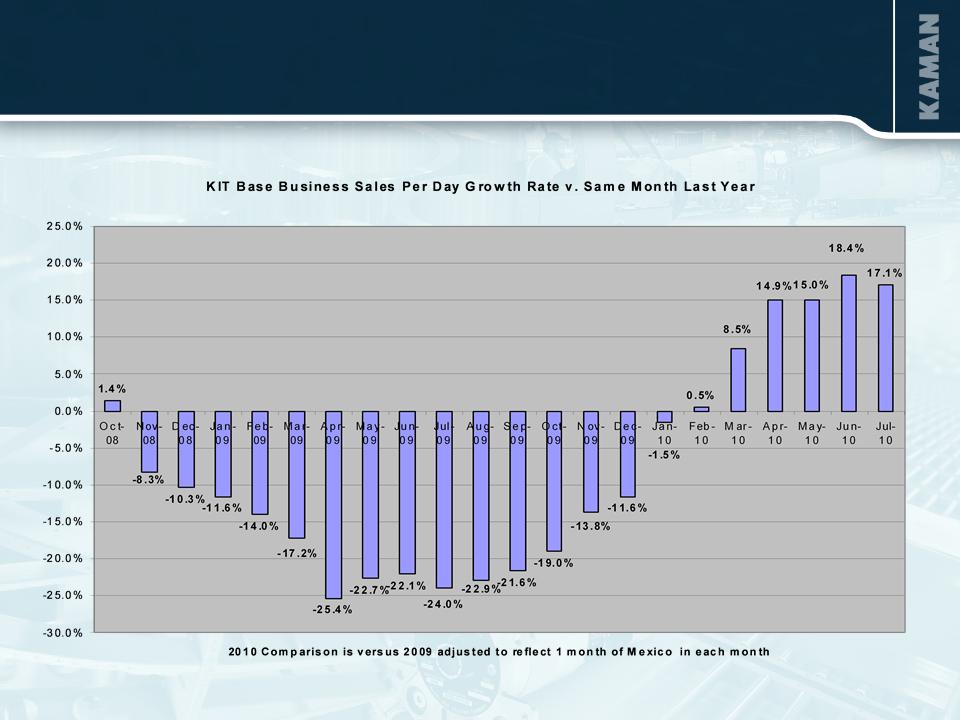
INDUSTRIAL DISTRIBUTION - Market Environment/Outlook
§ Strong organic growth
- Q210 up 17.5%
- OEM markets extremely strong
- MRO markets turned positive in Q2
- Broad based growth across geographies and end markets
§ Acquisitions accelerating growth
- Added $27 million in sales in Q210
- Added geographic coverage, product line expansions, strong franchises
- Acquisitions expected to add $90 to $95 million in 2010
- Minarik acquisition was accretive in Q210
§ Expect record sales in 2010 of $800 million to $815 million

23
SALES PER DAY - $(000)
24
SALES PER DAY GROWTH RATE

25
INDUSTRIAL DISTRIBUTION - Opportunities
§ Broaden our product offerings to gain additional business
from existing customers and new opportunities from a wider
slice of the market
from existing customers and new opportunities from a wider
slice of the market
- Product line additions from vendors such as:
• ASCO/Numatics
• Sheffer Corporation
• GEM® Steam Trap
• Bison Gear
- Launched ReliaMark brand of bearings,
roller chains, oil seals, and shaft collars
§ Recognize sales and cost synergies from the three
acquisitions completed in 2010
acquisitions completed in 2010
§ Expand our geographic footprint through acquisitions in major
industrial markets to enhance our position in the competition
for national and regional accounts
industrial markets to enhance our position in the competition
for national and regional accounts
26
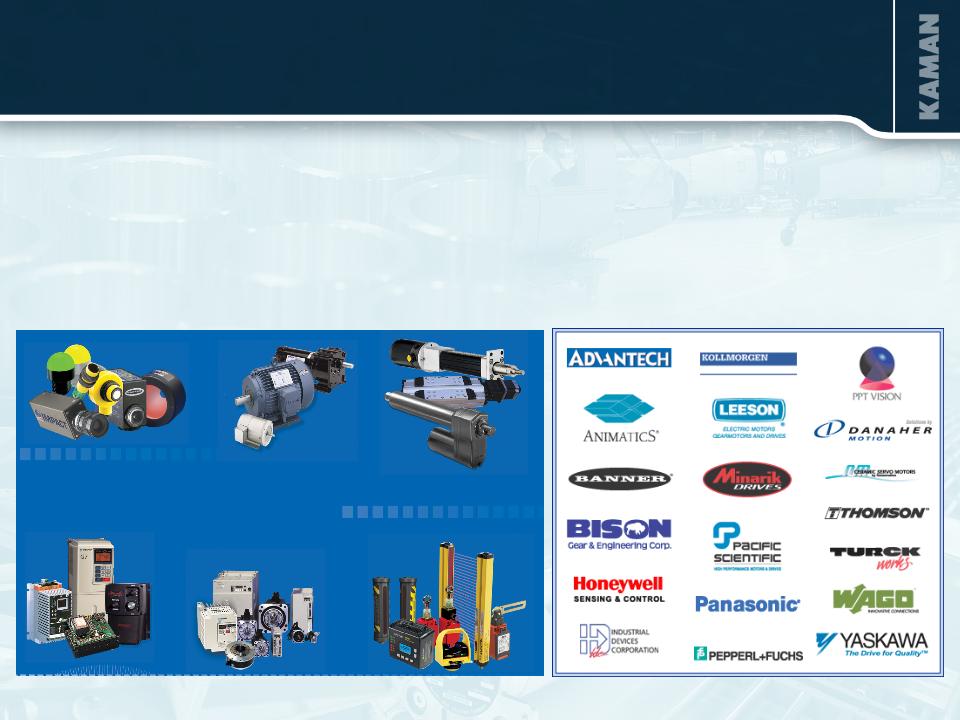
§ Minarik is a national distributor of motion control and automation products
§ 2009 Sales - $84 million
Vision Systems Motors & Gear Motors Actuators
AC & DC Drives Servo Motors Safety
& Controls
ACQUISITIONS - Minarik
27
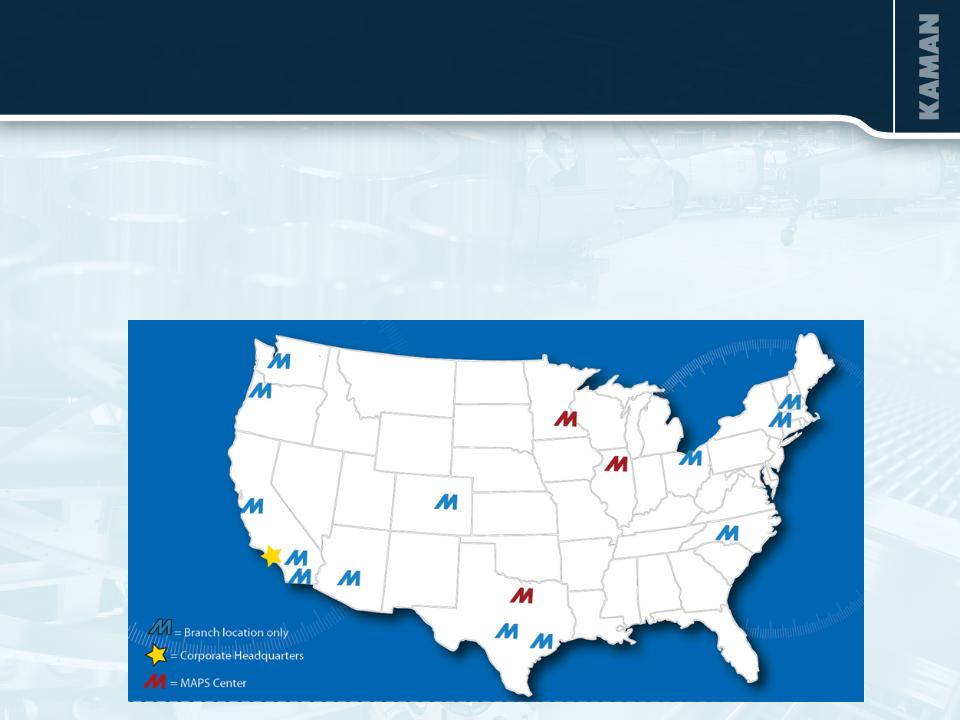
§ Minarik has 16 stocking distributor locations and 3 Minarik Applied Products
and Systems Centers (MAPS Centers) locations and approx. 215 employees
and Systems Centers (MAPS Centers) locations and approx. 215 employees
§ Expands KIT’s geographic coverage in key markets
§ Adds branch locations in 3 of the top 15 markets where KIT has not been
well represented (San Jose, Cleveland, Chicago)
well represented (San Jose, Cleveland, Chicago)
ACQUISITIONS - Minarik

28
§ Expands KIT’s product offering
§ Positions Kaman as an industry leader in US motion control and automation
markets
markets
§ Diversifies traditional MRO customer base through primary OEM presence
§ Organizational and cultural fit:
- Minarik will substantially strengthen KIT’s Automation Specialist group
- Minarik is realigning organization in a similar manner as KIT
ACQUISITIONS - Minarik

29
ACQUISITIONS
Business Overview
•Bearing & power transmission dist.
•Headquartered in Tulsa, OK
(October 31) 2007 2008 2009
Sales $28 MM $30 MM $22 MM
•8 branches located in Oklahoma, Arkansas
and Texas; 70+ employees
Strategic Rationale
•Geographic penetration
•Adds volume in our core product lines
•Provides access to chemical and petro-
chemical industries and oil and gas
industries
Transaction Summary
•Transaction closed April 5, 2010
•Purchase price $15MM
Strengths
•Product knowledge in our core bearing
and power transmission product lines
•Vendor authorizations with premier
brands
§ Allied Bearings Supply, Co., Inc.
30
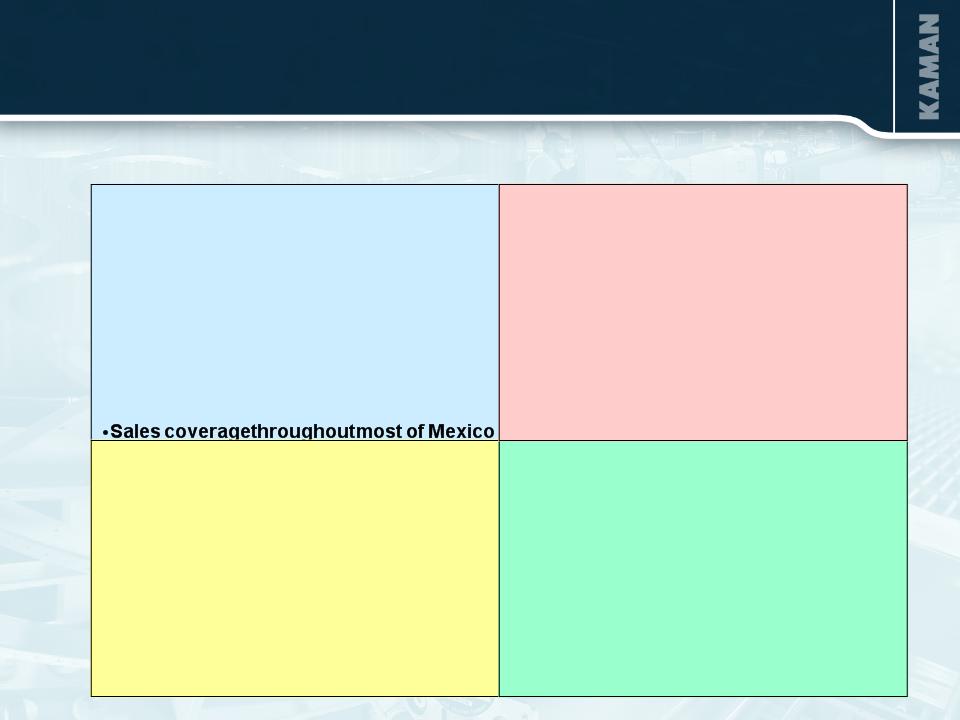
§ Fawick De Mexico
Business Overview
•Mexico City based fluid power distributor
•Headquartered in same building complex
as Kaman’s Delamac business
$ Pesos MM 2008 2009
Sales $43 MM $50 MM
Exchange Rate: 13.4 Pesos / US $
Strategic Rationale
•Adds fluid power to Delamac’s product
offering
•Adds higher margin product lines to
improve overall profitability of Delamac
•Adds exclusive franchises for Mexico
Transaction Summary
•Closed transaction 2/26/10
•Purchase price $4.4MM
Strengths
•Knowledge in fluid power product
applications
•Sales force covers almost all of Mexico
ACQUISITIONS

31
SUMMARY

32
2010 OUTLOOK UPDATE
Aerospace segment
§ We expect full year sales of $480 million to $490 million
§ We expect the full year operating margin to be between 14.0% and 14.5%
Industrial Distribution segment
§ We expect full year organic sales growth to be up 10% to 13% as compared to
2009
2009
§ Including completed acquisitions we expect full year sales to be in a range of
$800 million to $815 million
$800 million to $815 million
§ We expect operating margins for the full year of approximately 3.0% to 3.3%
Other
§ We expect corporate expenses, on average, to be in a range of $9.0 million to
$10.0 million per quarter
$10.0 million per quarter
§ We expect full year interest expense to be approximately $9.6 million (net interest
expense will be approximately $3.0 million as a result of a one-time interest
benefit)
expense will be approximately $3.0 million as a result of a one-time interest
benefit)

33
KAMAN CORPORATION - Summary
§ High margin aerospace business led by specialty bearing product lines
§ Industrial distribution business gaining market share in a fragmented
market via national account growth, geographic and product line
expansion
market via national account growth, geographic and product line
expansion
§ Long-term organic growth opportunities in both segments
§ Potential to further accelerate growth and increase scale through
additional acquisitions
additional acquisitions
§ Initiatives to optimize profit, increase cash flow generation, strengthen
competitive position
competitive position
§ Strong balance sheet to fund growth and strategic initiatives
��
34
APPENDIX
44%
2009 Sales $1,146 million

35
1 Corporate expense percentage is to Total Sales
(In thousands) SEGMENTS | Net Sales | Operating Income/(Loss) | Operating Margin | |||
Q2 2010 | Q2 2009 | Q2 2010 | Q2 2009 | Q2 2010 | Q2 2009 | |
Industrial Distribution | $210,924 | $155,954 | $7,713 | $3,065 | 3.7% | 2.0% |
Aerospace | 106,163 | 137,269 | 12,114 | 21,600 | 11.4% | 15.7% |
Net gain/(loss) on sale of assets | (56) | (53) | ||||
Corporate expense | (8,581) | (8,445) | 1 (2.7%) | 1(2.9%) | ||
Sales/Op. inc. from continuing ops | $317,087 | $293,223 | $11,190 | $16,167 | 3.5% | 5.5% |
INCOME STATEMENT HIGHLIGHTS
For the quarters ended July 2, 2010 and July 3, 2009
For the quarters ended July 2, 2010 and July 3, 2009

36
1 Corporate expense percentage is to Total Sales
(In thousands) SEGMENTS | Net Sales | Operating Income/(Loss) | Operating Margin | |||
2009 | 2008 | 2009 | 2008 | 2009 | 2008 | |
Industrial Distribution | $645,535 | $776,970 | $12,612 | $35,397 | 2.0% | 4.6% |
Aerospace | 500,696 | 476,625 | 74,996 | 61,608 | 15.0% | 12.9% |
Net gain/(loss) on sale of assets | (4) | 221 | ||||
Corporate expense | (33,662) | (31,960) | 1 (2.9%) | 1(2.5%) | ||
Sales/Op. inc. from continuing ops | $1,146,231 | $1,253,595 | $53,942 | $65,266 | 4.7% | 5.2% |
INCOME STATEMENT HIGHLIGHTS
For the years ended December 31
For the years ended December 31

37
(In Millions) | As of 07/02/10 | As of 12/31/09 | As of 12/31/08 |
Cash and Cash Equivalents | $7.1 | $18.0 | $8.2 |
Notes Payable and Long-term Debt | $103.3 | $63.6 | $94.2 |
Shareholders’ Equity | $334.5 | $312.9 | $274.3 |
Debt as % of Total Capitalization | 23.6% | 16.9% | 25.6% |
Capital Expenditures | $8.11 | $13.6 | $16.0 |
Depreciation & Amortization | $9.51 | $16.1 | $12.8 |
BALANCE SHEET AND CAPITAL FACTORS
1YTD at 7/2/10
38
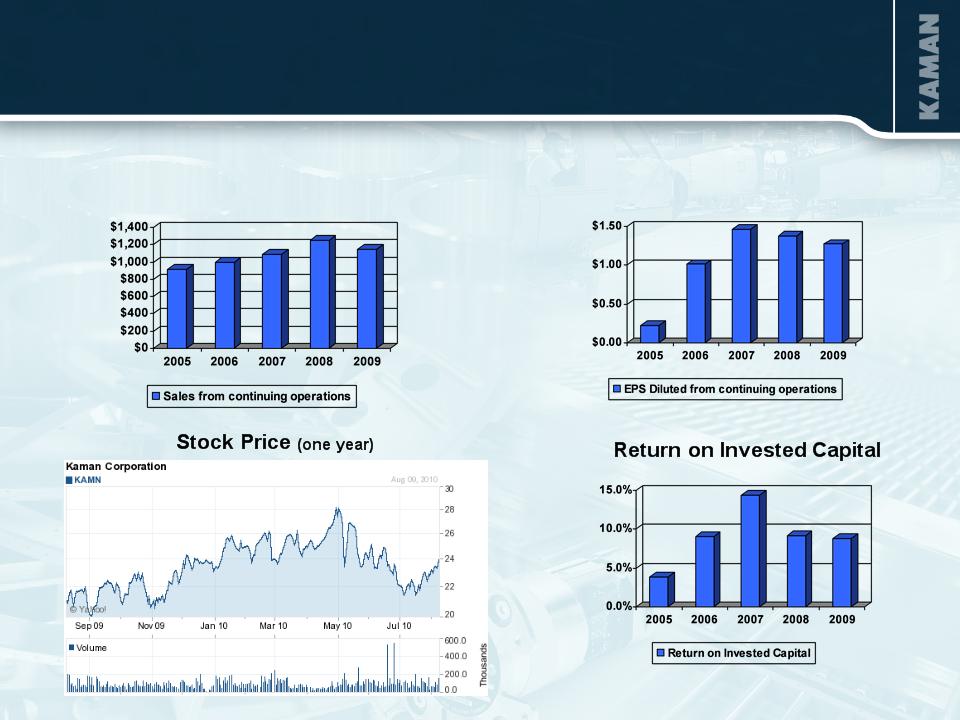
Sales
EPS
PERFORMANCE METRICS
39
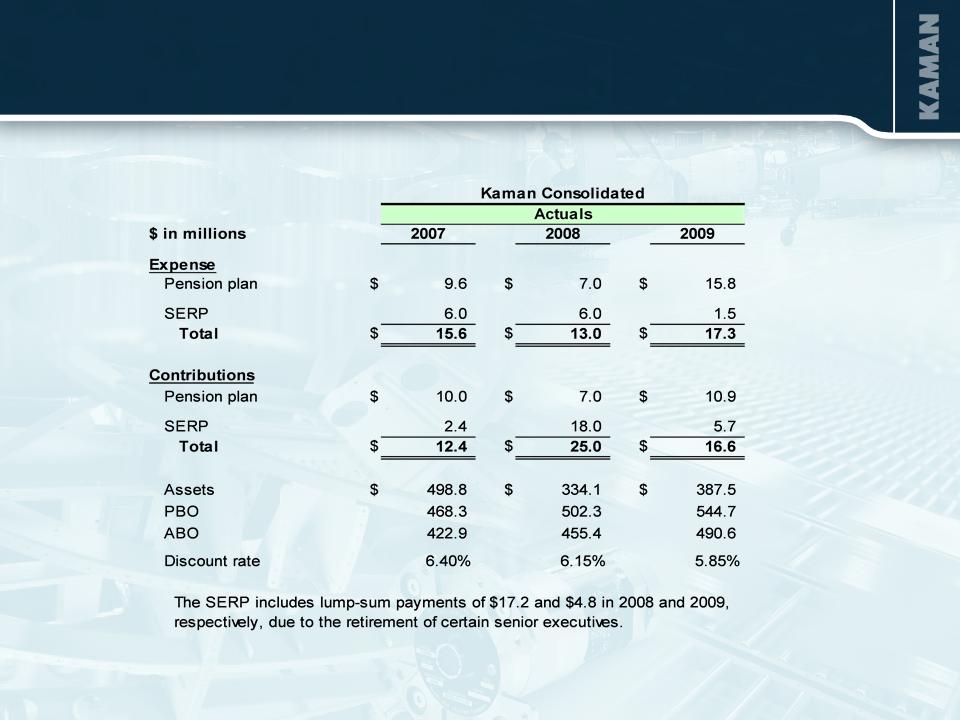
PENSION PLANS

40
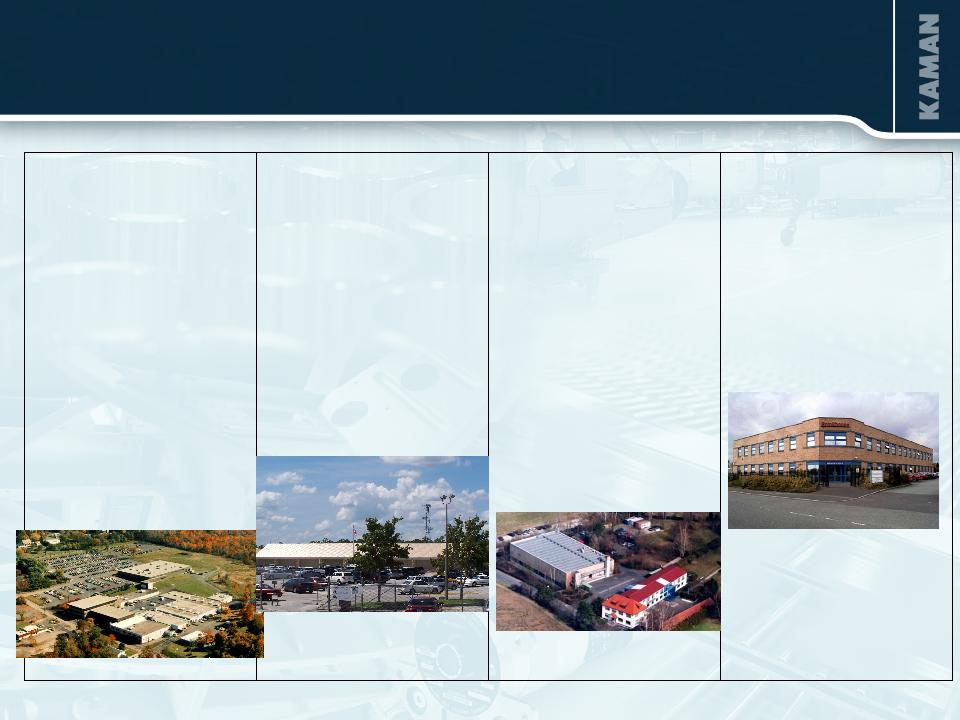
Bloomfield, CT
700,000 sq ft
•Mechanical
•Composites
•Large Assembly
Wichita, KS
168,000 sq ft
•Composites
•Structural
Bondments
•Composite
Assemblies
Jacksonville, FL
220,000 sq ft
•Fabrication-
ØMachining
ØSheet Metal Form
ØExtrusion
•Assembly
ØMajor Subs
ØFinal Structure
•Product Integration
Darwen, UK
208,000 sq ft
•Composites
•Metal Fabrication
•Tooling
•Assembly
AEROSPACE - Primary Facilities
•Helicopter assembly
and test facilities
•Bearing manufacturing
41
Manchester, UK
63,000 sq ft
•Aerospace
manufacturing
facility
manufacturing
facility
Orlando, FL
90,000 sq ft
•Bomb safe and
arming device
manufacturing
facility
arming device
manufacturing
facility
80 acre test range
Middletown, CT
202,000 sq ft
•Manufacturing facility
•Missile safe and
arming devices
arming devices
•Bomb safe and
arming devices
arming devices
•Ruggedized
memory
products
memory
products
•Measuring
products
products
Dachsbach, Germany
30,000 sq ft
•Manufacturing facility
•Spherical
bearings
bearings
•Ball bearings
•Rod ends
•Bushings
•Specialty
components
components
AEROSPACE - Primary Facilities

42
FORWARD-LOOKING STATEMENTS
This presentation contains forward-looking information relating to the company's business and prospects, including the Aerospace and
Industrial Distribution businesses, operating cash flow, and other matters that involve a number of uncertainties that may cause actual
results to differ materially from expectations. Those uncertainties include, but are not limited to: 1) the successful conclusion of
competitions for government programs and thereafter contract negotiations with government authorities, both foreign and domestic; 2)
political conditions in countries where the company does or intends to do business; 3) standard government contract provisions
permitting renegotiation of terms and termination for the convenience of the government; 4) domestic and foreign economic and
competitive conditions in markets served by the company, particularly the defense, commercial aviation and industrial production
markets; 5) risks associated with successful implementation and ramp up of significant new programs; 6) potential difficulties associated
with variable acceptance test results, given sensitive production materials and extreme test parameters; 7) management's success in
increasing the volume of profitable work at the Aerospace Wichita facility; 8) successful negotiation of the Sikorsky Canadian MH-92
program price; 9) successful resale of the SH-2G(I) aircraft, equipment and spare parts; 10) receipt and successful execution of production
orders for the JPF U.S. government contract, including the exercise of all contract options and receipt of orders from allied militaries, as
all have been assumed in connection with goodwill impairment evaluations; 11) satisfactory resolution of the company’s litigation relating
to the FMU-143 program; 12) continued support of the existing K-MAX helicopter fleet, including sale of existing K-MAX spare parts
inventory; 13) cost estimates associated with environmental remediation activities at the Bloomfield, Moosup and New Hartford, CT
facilities and our U.K. facilities; 14) profitable integration of acquired businesses into the company's operations; 15) changes in supplier
sales or vendor incentive policies; 16) the effects of price increases or decreases; 17) the effects of pension regulations, pension plan
assumptions and future contributions; 18) future levels of indebtedness and capital expenditures; 19) continued availability of raw
materials and other commodities in adequate supplies and the effect of increased costs for such items; 20) the effects of currency
exchange rates and foreign competition on future operations; 21) changes in laws and regulations, taxes, interest rates, inflation rates and
general business conditions; 22) future repurchases and/or issuances of common stock; and 23) other risks and uncertainties set forth in
the company's annual, quarterly and current reports, and proxy statements. Any forward-looking information provided in this presentation
should be considered with these factors in mind. The company assumes no obligation to update any forward-looking statements
contained in this presentation.
###
Contact: Eric Remington
V.P., Investor Relations
(860) 243-6334
Eric.Remington@kaman.com