* January 15, 2014 Investor Presentation
* Forward Looking Statements FORWARD-LOOKING STATEMENTS This presentation contains "forward-looking statements" within the meaning of the safe harbor provisions of the U.S. Private Securities Litigation Reform Act of 1995. Forward-looking statements also may be included in other publicly available documents issued by the Company and in oral statements made by our officers and representatives from time to time. These forward-looking statements are intended to provide management's current expectations or plans for our future operating and financial performance, based on assumptions currently believed to be valid. They can be identified by the use of words such as "anticipate," "intend," "plan," "goal," "seek," "believe," "project," "estimate," "expect," "strategy," "future," "likely," "may," "should," "will" and other words of similar meaning in connection with a discussion of future operating or financial performance. Examples of forward looking statements include, among others, statements relating to future sales, earnings, cash flows, results of operations, uses of cash and other measures of financial performance. Because forward-looking statements relate to the future, they are subject to inherent risks, uncertainties and other factors that may cause the Company's actual results and financial condition to differ materially from those expressed or implied in the forward-looking statements. Such risks, uncertainties and other factors include, among others: (i) changes in domestic and foreign economic and competitive conditions in markets served by the Company, particularly the defense, commercial aviation and industrial production markets; (ii) changes in government and customer priorities and requirements (including cost-cutting initiatives, government and customer shut-downs, the potential deferral of awards, terminations or reductions of expenditures to respond to the priorities of Congress and the Administration, or budgetary cuts resulting from Congressional actions or automatic sequestration under the Budget Control Act of 2011, as modified by the enactment of the Taxpayer Relief Act of 2012); (iii) changes in geopolitical conditions in countries where the Company does or intends to do business; (iv) the successful conclusion of competitions for government programs and thereafter contract negotiations with government authorities, both foreign and domestic; (v) the existence of standard government contract provisions permitting renegotiation of terms and termination for the convenience of the government; (vi) the conclusion to government inquiries or investigations regarding government programs, including the resolution of the Wichita matter; (vii) risks and uncertainties associated with the successful implementation and ramp up of significant new programs; (viii) potential difficulties associated with variable acceptance test results, given sensitive production materials and extreme test parameters; (ix) the receipt and successful execution of production orders for the JPF U.S. government contract, including the exercise of all contract options and receipt of orders from allied militaries, as all have been assumed in connection with goodwill impairment evaluations; (x) the continued support of the existing K-MAX® helicopter fleet, including sale of existing K-MAX® spare parts inventory; (xi) the accuracy of current cost estimates associated with environmental remediation activities, including activities at the Bloomfield, Moosup and New Hartford, CT facilities and our U.K. facilities; (xii) the profitable integration of acquired businesses into the Company's operations; (xiii) changes in supplier sales or vendor incentive policies; (xiv) the effects of price increases or decreases; (xv) the effects of pension regulations, pension plan assumptions, pension plan asset performance and future contributions; (xvi) future levels of indebtedness and capital expenditures; (xvii) the continued availability of raw materials and other commodities in adequate supplies and the effect of increased costs for such items; (xviii) the effects of currency exchange rates and foreign competition on future operations; (xix) changes in laws and regulations, taxes, interest rates, inflation rates and general business conditions; (xx) future repurchases and/or issuances of common stock; and (xxi) other risks and uncertainties set forth herein and in our Annual Report on Form 10-K for the year ended December 31, 2012. Any forward-looking information provided in this presentation should be considered with these factors in mind. We assume no obligation to update any forward-looking statements contained in this presentation. Contact: Eric Remington V.P., Investor Relations (860) 243-6334 Eric.Remington@kaman.com
* Aerospace - $586 million 40% 37% 12% 23% Distribution - $1,032 million Kaman Corporation – 2012 Sales Overview 64% 36% Distribution Aerospace $1.6B Revenues 12% 64% 36%
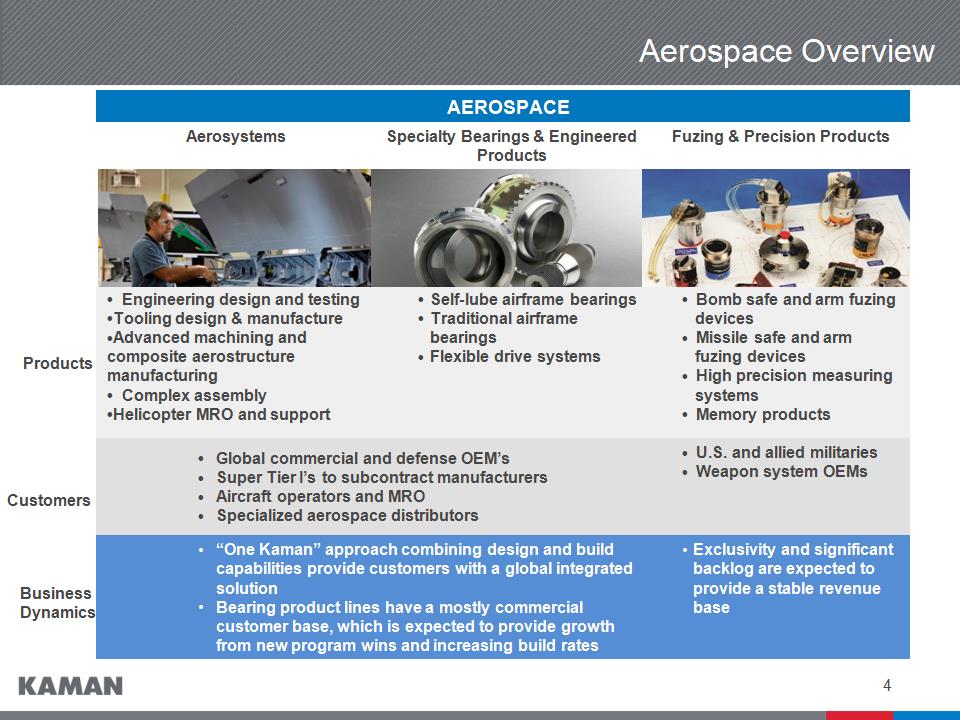
* Aerospace Overview AEROSPACE AEROSPACE AEROSPACE Aerosystems Specialty Bearings & Engineered Products Fuzing & Precision Products Engineering design and testing Tooling design & manufacture Advanced machining and composite aerostructure manufacturing Complex assembly Helicopter MRO and support Self-lube airframe bearings Traditional airframe bearings Flexible drive systems Bomb safe and arm fuzing devices Missile safe and arm fuzing devices High precision measuring systems Memory products Global commercial and defense OEM’s Super Tier I’s to subcontract manufacturers Aircraft operators and MRO Specialized aerospace distributors Global commercial and defense OEM’s Super Tier I’s to subcontract manufacturers Aircraft operators and MRO Specialized aerospace distributors U.S. and allied militaries Weapon system OEMs “One Kaman” approach combining design and build capabilities provide customers with a global integrated solution Bearing product lines have a mostly commercial customer base, which is expected to provide growth from new program wins and increasing build rates “One Kaman” approach combining design and build capabilities provide customers with a global integrated solution Bearing product lines have a mostly commercial customer base, which is expected to provide growth from new program wins and increasing build rates Exclusivity and significant backlog are expected to provide a stable revenue base Products Business Dynamics Customers
* Distribution Major Product Platforms Product Platform Bearings & Mechanical Power Transmission (BPT) Fluid Power Automation, Control and Energy (ACE) % of 2012 Sales (approximate) 61% 14% 25% Market Size $12.5 Billion $7.2 Billion $15.0 Billion Acquisitions since 2008 Industrial Supply Corp. Allied Bearings Supply Plains Bearing Fawick de Mexico Florida Bearings Ohio Gear Catching Fluidpower INRUMEC Northwest Hose Western Fluid Comp. Zeller Minarik Automation Technology Target Electronic Supply Major Suppliers
* Kaman Investment Merits Secular trends helping to drive significant long-term growth opportunities in Aerospace and Distribution Improved balance across the Aerospace segment between commercial and defense programs Increasing content of bearing products on new platforms Higher commercial build rates driving bearing and aerostructure sales Select reset and service life extension programs ramping up Distribution business gaining scale and capabilities via acquisitions and enhancing complementary product platforms Investing in new product development and applications, acquisitions and technology for long-term growth Strong balance sheet to drive growth and strategic initiatives Experienced management team
* Aerospace Business Drivers Kaman is well positioned to further penetrate Commercial OEM’s and Super Tier 1’s Proven capability to provide flexible low cost solutions Broadening geographic footprint to better serve customers and to provide lower cost option manufacturing alternatives Increasing production levels at Boeing and Airbus and A350 launch will support near term specialty bearing & aerostructures growth Defense platforms provide exposure to key vertical lift and reset programs Sole source long-term contractual position and solid backlog on key fuzing program provides stable revenue base
* Aerospace – Key 2014 Operational Objectives Continue to execute the New Zealand SH-2(G)I contract Build on the growth and success of bearing and fuzing product lines Successfully begin production in new German bearing and UK tooling facilities, which add capacity for growth Transition start up programs to full rate production to improve cash flow generation Build on the “One Kaman” effort to offer customers a one stop solution for their Aerosystem needs Successfully transition production of the 747-8 WTBF program to Kaman’s facilities from Boeing Winnipeg
* Distribution Business Drivers The addition of hydraulic, automation and motion control products adds content to MRO customers and meets the continued trend of customers transitioning to higher-technology applications, sensing equipment, energy efficiency and productivity solutions Manufacturers are increasing their use of national contracts to consolidated supply of MRO goods to production facilities and are driving compliance to its contracted suppliers Increased municipal investment in water, wastewater, and supporting control system infrastructure will benefit Kaman, which has unique products to service this sector Improved residential construction fundamentals are anticipated to drive increased demand across numerous industries served by Kaman
* Distribution – Key 2014 Operational Objectives Increase organic growth, capitalizing on expense leverage, through increased customer engagement and broader product offering across our three business platforms Continue to pursue accretive acquisitions and gain additional sales and cost synergies from the twelve acquisitions completed since 2010 Leverage strong supplier relationships to increase sales of higher margin product lines Begin deployment of new ERP system that will consolidate disparate systems and drive significant productivity enhancements
* Performance-Driven Annual Cash Incentive Annual cash incentive driven by financial performance Corporate – compared against the 5-year average of Russell 2000: Return on Investment EPS growth EPS performance against plan Individual Performance Business Units – compared against targets Return on Investment Year over year growth in operating income Year over year growth in sales Controllable cash flow Reviewed and approved by the Personnel and Compensation Committee of the Board of Directors
* Q&A