
Furmanite Corporation QUARTER ENDED MARCH 31, 2014 Charles R. Cox, Chairman & CEO Joseph E. Milliron, President & COO Robert S. Muff, Chief Financial Officer

Certain of the Company’s statements in this presentation are not purely historical, and as such are “forward-looking statements” within the meaning of the Private Securities Litigation Reform Act of 1995. These include statements regarding management’s plans, beliefs, expectations, intentions or projections of the future. Forward-looking statements involve risks and uncertainties, including without limitation, the various risks inherent in the Company’s business, and other risks and uncertainties detailed most recently in this presentation and the Company’s Form 10-K as of December 31, 2013 filed with the Securities and Exchange Commission. One or more of these factors could affect the Company’s business and financial results in future periods, and could cause actual results to differ materially from plans and projections. There can be no assurance that the forward-looking statements made in this presentation will prove to be accurate, and issuance of such forward-looking statements should not be regarded as a representation by the Company, or any other person, that the objectives and plans of the Company will be achieved. All forward-looking statements made in this presentation are based on information presently available to management, and the Company assumes no obligation to update any forward-looking statements. 2

Furmanite Corporation QUARTER ENDED MARCH 31, 2014 Charles R. Cox, Chairman & CEO 3

Furmanite Corporation QUARTER ENDED MARCH 31, 2014 Financial Review Robert S. Muff, Chief Financial Officer 4
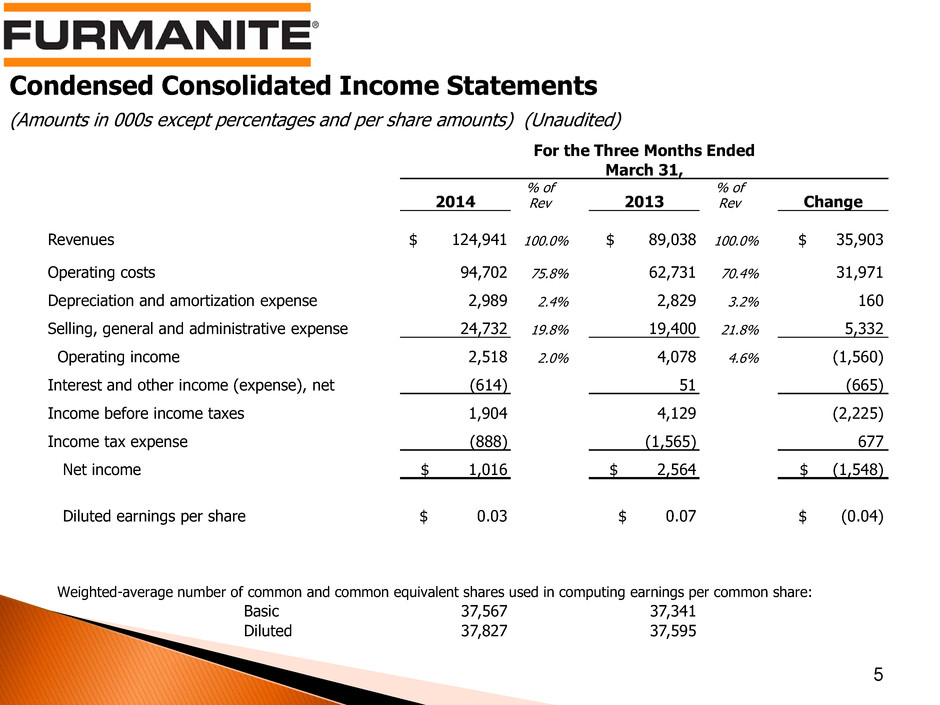
Condensed Consolidated Income Statements (Amounts in 000s except percentages and per share amounts) (Unaudited) 5 For the Three Months Ended March 31, 2014 % of Rev 2013 % of Rev Change Revenues $ 124,941 100.0% $ 89,038 100.0% $ 35,903 Operating costs 94,702 75.8% 62,731 70.4% 31,971 Depreciation and amortization expense 2,989 2.4% 2,829 3.2% 160 Selling, general and administrative expense 24,732 19.8% 19,400 21.8% 5,332 Operating income 2,518 2.0% 4,078 4.6% (1,560) Interest and other income (expense), net (614) 51 (665) Income before income taxes 1,904 4,129 (2,225) Income tax expense (888) (1,565) 677 Net income $ 1,016 $ 2,564 $ (1,548) Diluted earnings per share $ 0.03 $ 0.07 $ (0.04) Weighted-average number of common and common equivalent shares used in computing earnings per common share: Basic 37,567 37,341 Diluted 37,827 37,595
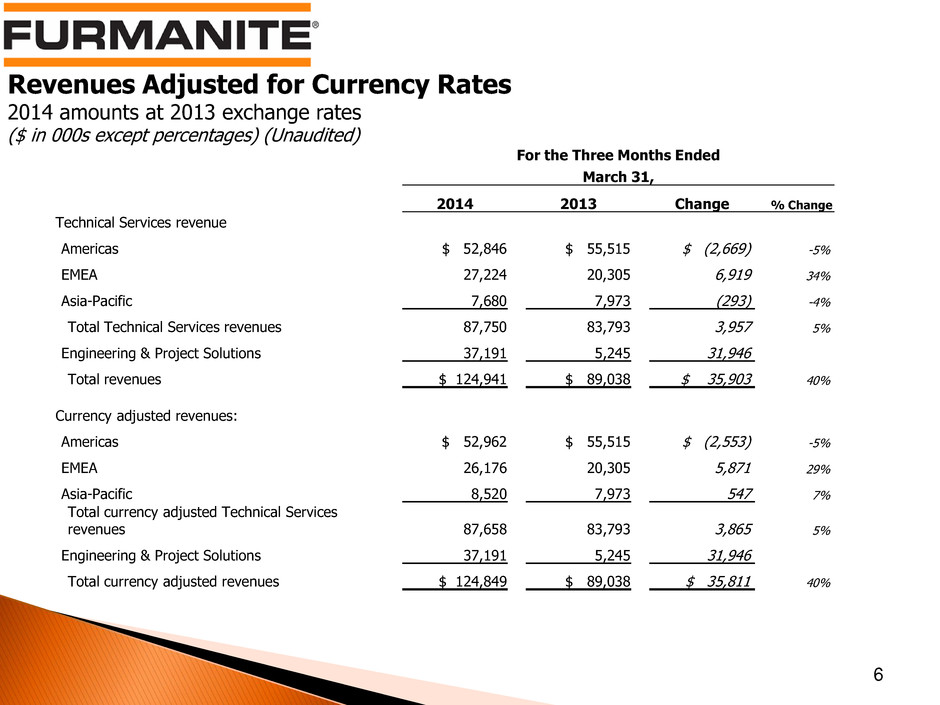
Revenues Adjusted for Currency Rates 2014 amounts at 2013 exchange rates ($ in 000s except percentages) (Unaudited) 6 For the Three Months Ended March 31, 2014 2013 Change % Change Technical Services revenue Americas $ 52,846 $ 55,515 $ (2,669) -5% EMEA 27,224 20,305 6,919 34% Asia-Pacific 7,680 7,973 (293) -4% Total Technical Services revenues 87,750 83,793 3,957 5% Engineering & Project Solutions 37,191 5,245 31,946 Total revenues $ 124,941 $ 89,038 $ 35,903 40% Currency adjusted revenues: Americas $ 52,962 $ 55,515 $ (2,553) -5% EMEA 26,176 20,305 5,871 29% Asia-Pacific 8,520 7,973 547 7% Total currency adjusted Technical Services revenues 87,658 83,793 3,865 5% Engineering & Project Solutions 37,191 5,245 31,946 Total currency adjusted revenues $ 124,849 $ 89,038 $ 35,811 40%
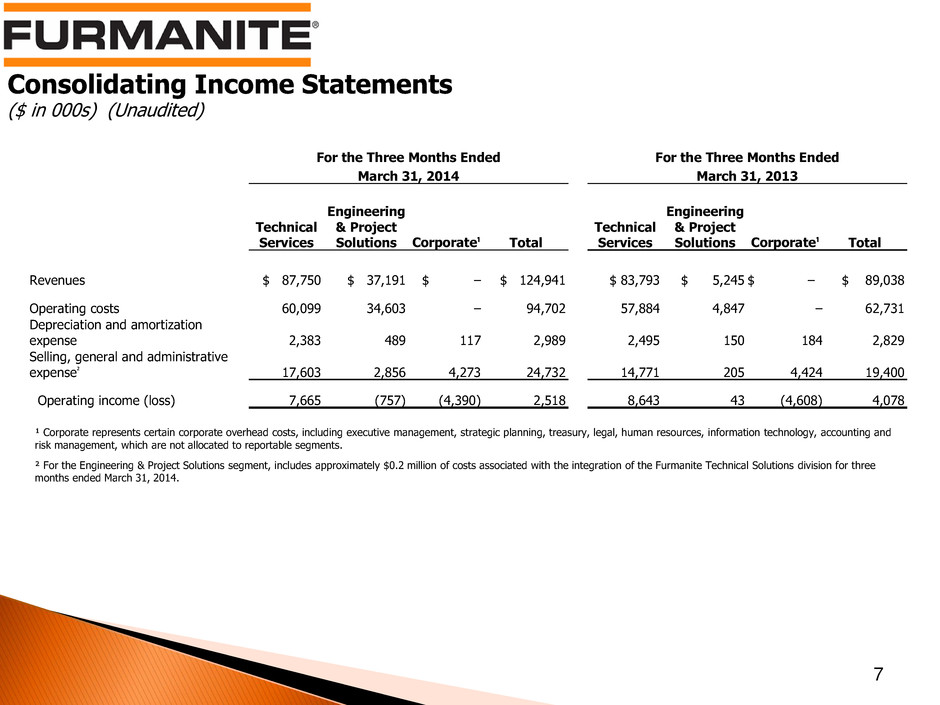
Consolidating Income Statements ($ in 000s) (Unaudited) 7 For the Three Months Ended For the Three Months Ended March 31, 2014 March 31, 2013 Technical Services Engineering & Project Solutions Corporate¹ Total Technical Services Engineering & Project Solutions Corporate¹ Total Revenues $ 87,750 $ 37,191 $ – $ 124,941 $ 83,793 $ 5,245 $ – $ 89,038 Operating costs 60,099 34,603 – 94,702 57,884 4,847 – 62,731 Depreciation and amortization expense 2,383 489 117 2,989 2,495 150 184 2,829 Selling, general and administrative expense² 17,603 2,856 4,273 24,732 14,771 205 4,424 19,400 Operating income (loss) 7,665 (757) (4,390) 2,518 8,643 43 (4,608) 4,078 ¹ Corporate represents certain corporate overhead costs, including executive management, strategic planning, treasury, legal, human resources, information technology, accounting and risk management, which are not allocated to reportable segments. ² For the Engineering & Project Solutions segment, includes approximately $0.2 million of costs associated with the integration of the Furmanite Technical Solutions division for three months ended March 31, 2014.
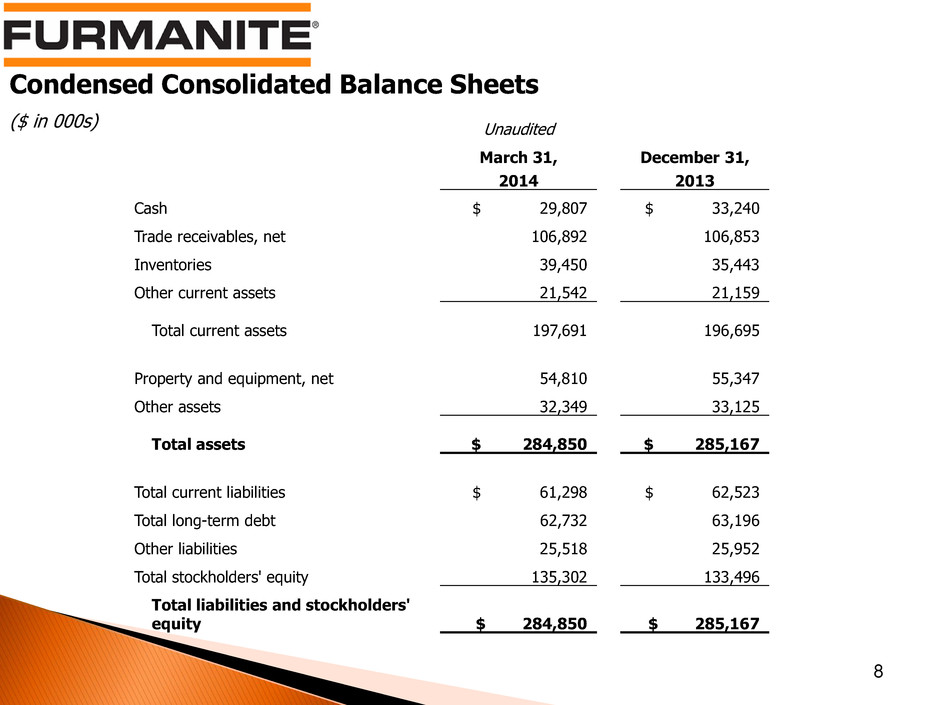
Condensed Consolidated Balance Sheets ($ in 000s) 8 Unaudited March 31, December 31, 2014 2013 Cash $ 29,807 $ 33,240 Trade receivables, net 106,892 106,853 Inventories 39,450 35,443 Other current assets 21,542 21,159 Total current assets 197,691 196,695 Property and equipment, net 54,810 55,347 Other assets 32,349 33,125 Total assets $ 284,850 $ 285,167 Total current liabilities $ 61,298 $ 62,523 Total long-term debt 62,732 63,196 Other liabilities 25,518 25,952 Total stockholders' equity 135,302 133,496 Total liabilities and stockholders' equity $ 284,850 $ 285,167

Condensed Consolidated Statements of Cash Flows ($ in 000s) (Unaudited) 9 For the Three Months Ended March 31, 2014 2013 Net income $ 1,016 $ 2,564 Depreciation, amortization and other non-cash items 2,823 4,003 Working capital changes (4,953) (9,909) Net cash used in operating activities (1,114) (3,342) Capital expenditures (1,679) (2,613) Acquisition of businesses – (905) Payments on debt (909) (1,449) Other, net (126) 12 Effect of exchange rate changes on cash 395 (534) Decrease in cash and cash equivalents (3,433) (8,831) Cash and cash equivalents at beginning of period 33,240 33,185 Cash and cash equivalents at end of period $ 29,807 $ 24,354
Furmanite Corporation QUARTER ENDED MARCH 31, 2014 Operations Review Joseph E. Milliron, President and Chief Operating Officer 10

The Americas¹ EMEA APAC ¹ Included in the Americas is Engineering & Project Solutions •2,041 technicians & engineers •72% of YTD revenues •45 locations •420 technicians & engineers •22% of YTD revenues •24 locations •126 technicians & engineers •6% of YTD revenues •16 locations •1,077 technicians & engineers •30% of YTD revenues •5 locations As of March 31, 2014 11
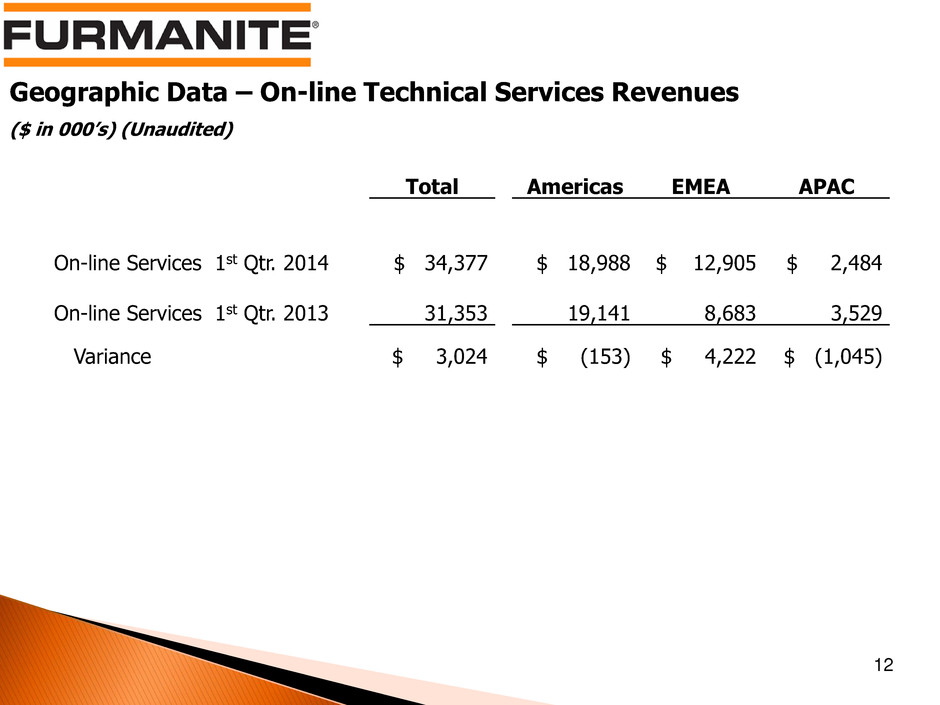
12 Geographic Data – On-line Technical Services Revenues ($ in 000’s) (Unaudited) Total Americas EMEA APAC On-line Services 1st Qtr. 2014 $ 34,377 $ 18,988 $ 12,905 $ 2,484 On-line Services 1st Qtr. 2013 31,353 19,141 8,683 3,529 Variance $ 3,024 $ (153) $ 4,222 $ (1,045)

Geographic Data – Off-line Technical Services Revenues ($ in 000’s) (Unaudited) 13 Total Americas EMEA APAC Off-line Services 1st Qtr. 2014 $ 43,529 $ 27,689 $ 11,221 $ 4,619 Off-line Services 1st Qtr. 2013 40,331 28,621 7,745 3,965 Variance $ 3,198 $ (932) $ 3,476 $ 654

Furmanite Corporation Review of 1Q 2014 May 5, 2014 www.furmanite.com 14