Exhibit 99.2
| Furmanite Corporation Review of 3Q 2009 Michael Rose, Chairman & CEO Joseph Milliron, President & COO Miguel Desdin, Senior Vice President & CFO |
| Safe Harbor Statement Certain of the Company's statements in this presentation are not purely historical, and as such are "forward-looking statements" within the meaning of the Private Securities Litigation Reform Act of 1995. These include statements regarding management's plans, beliefs, expectations, intentions or projections of the future. Forward-looking statements involve risks and uncertainties, including without limitation, the various risks inherent in the Company's business, and other risks and uncertainties detailed most recently in this presentation and the Company's Form 10-K as of December 31, 2008 filed with the Securities and Exchange Commission. One or more of these factors have affected, and could in the future affect the Company's business and financial results in future periods, and could cause actual results to differ materially from plans and projections. There can be no assurance that the forward-looking statements made in this document will prove to be accurate, and issuance of such forward-looking statements should not be regarded as a representation by the Company, or any other person, that the objectives and plans of the Company will be achieved. All forward-looking statements made in this presentation are based on information presently available to management, and the Company assumes no obligation to update any forward-looking statements. 2 11/06/2009 |
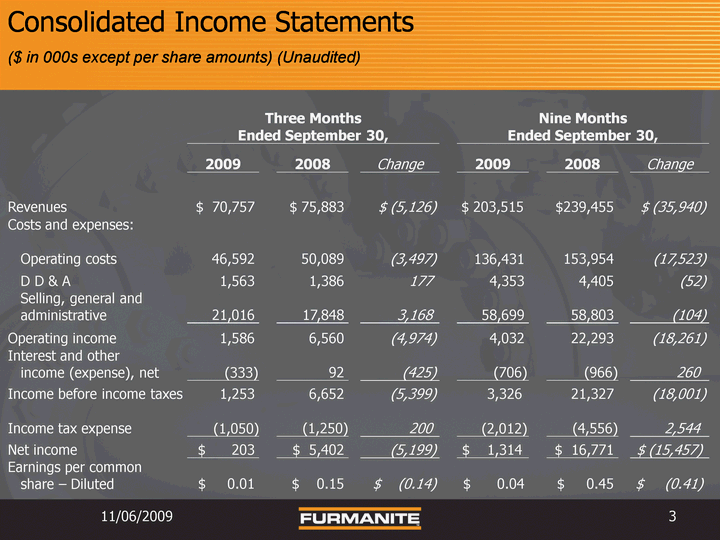
| Consolidated Income Statements ($ in 000s except per share amounts) (Unaudited) 11/06/2009 3 Three Months Three Months Three Months Three Months Three Months Nine Months Nine Months Nine Months Nine Months Nine Months Ended September 30, Ended September 30, Ended September 30, Ended September 30, Ended September 30, Ended September 30, Ended September 30, Ended September 30, Ended September 30, Ended September 30, 2009 2008 Change 2009 2008 Change Revenues $ 70,757 $ 75,883 $ (5,126) $ 203,515 $239,455 $ (35,940) Costs and expenses: Operating costs 46,592 50,089 (3,497) 136,431 153,954 (17,523) D D & A 1,563 1,386 177 4,353 4,405 (52) Selling, general and administrative 21,016 17,848 3,168 58,699 58,803 (104) Operating income 1,586 6,560 (4,974) 4,032 22,293 (18,261) Interest and other income (expense), net (333) 92 (425) (706) (966) 260 Income before income taxes 1,253 6,652 (5,399) 3,326 21,327 (18,001) Income tax expense (1,050) (1,250) 200 (2,012) (4,556) 2,544 Net income $ 203 $ 5,402 (5,199) $ 1,314 $ 16,771 $ (15,457) Earnings per common share - Diluted $ 0.01 $ 0.15 $ (0.14) $ 0.04 $ 0.45 $ (0.41) |
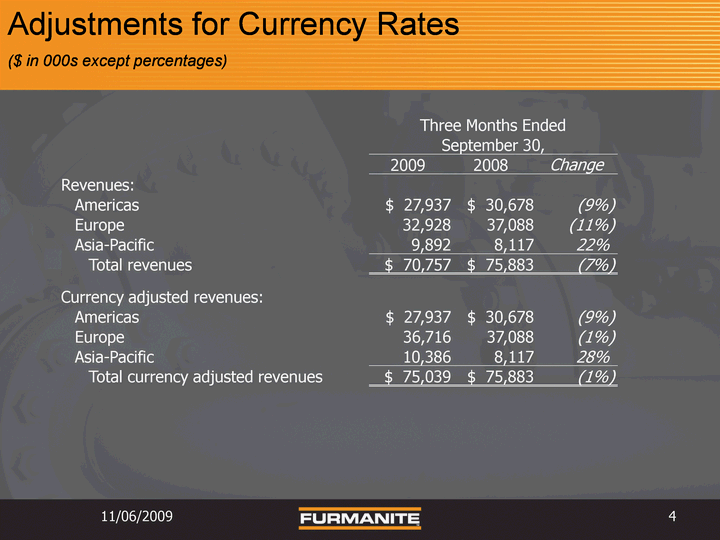
| Adjustments for Currency Rates ($ in 000s except percentages) 11/06/2009 4 Three Months Ended Three Months Ended Three Months Ended September 30, September 30, September 30, 2009 2008 Change Revenues: Americas $ 27,937 $ 30,678 (9%) Europe 32,928 37,088 (11%) Asia-Pacific 9,892 8,117 22% Total revenues $ 70,757 $ 75,883 (7%) Currency adjusted revenues: Americas $ 27,937 $ 30,678 (9%) Europe 36,716 37,088 (1%) Asia-Pacific 10,386 8,117 28% Total currency adjusted revenues $ 75,039 $ 75,883 (1%) |
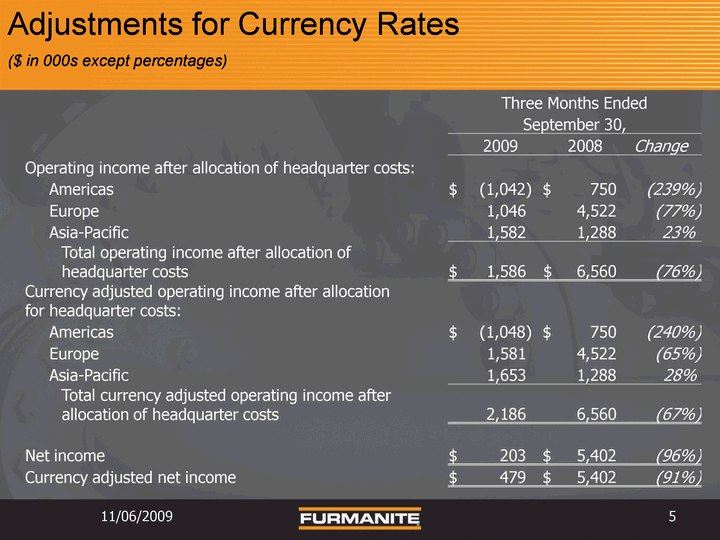
| Adjustments for Currency Rates ($ in 000s except percentages) 11/06/2009 5 Three Months Ended Three Months Ended Three Months Ended September 30, September 30, September 30, 2009 2008 Change Operating income after allocation of headquarter costs: Americas $ (1,042) $ 750 (239%) Europe 1,046 4,522 (77%) Asia-Pacific 1,582 1,288 23% Total operating income after allocation of headquarter costs $ 1,586 $ 6,560 (76%) Currency adjusted operating income after allocation for headquarter costs: Americas $ (1,048) $ 750 (240%) Europe 1,581 4,522 (65%) Asia-Pacific 1,653 1,288 28% Total currency adjusted operating income after allocation of headquarter costs 2,186 6,560 (67%) Net income $ 203 $ 5,402 (96%) Currency adjusted net income $ 479 $ 5,402 (91%) |

| Sept 30, Dec 31, 2009 2008 Change Cash $ 36,210 $ 30,793 $ 5,417 Trade receivable, net 59,696 64,879 (5,183) Inventories 27,896 24,868 3,028 Other current assets 6,854 7,187 (333) Total current assets 130,656 127,727 2,929 Property and equipment, net 30,532 29,278 1,254 Goodwill and other assets 18,538 16,273 2,265 Total assets $ 179,726 $ 173,278 $ 6,448 Total current liabilities $ 44,067 $ 43,901 $ 166 Total long-term debt, non-current 35,184 35,363 (179) Other liabilities 2,779 2,697 82 Total stockholders' equity 97,696 91,317 6,379 Total liabilities and stockholders' equity $ 179,726 $ 173,278 $ 6,448 Condensed Consolidated Balance Sheets ($ in 000s) 11/06/2009 6 |
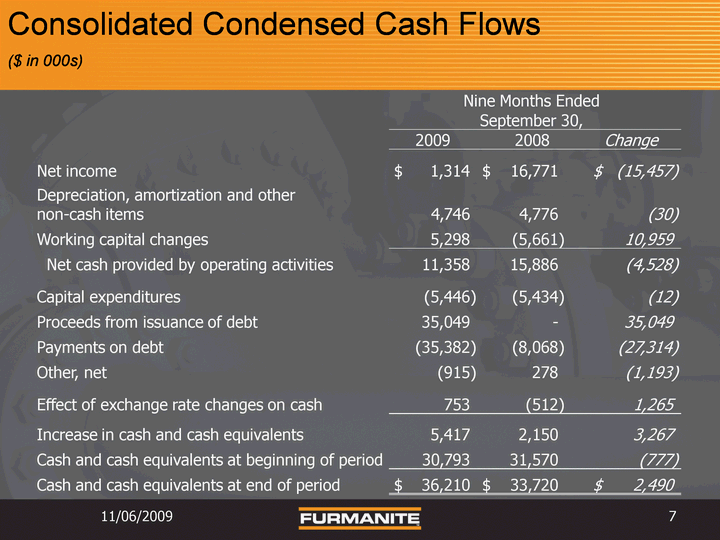
| Consolidated Condensed Cash Flows ($ in 000s) 11/06/2009 7 Nine Months Ended Nine Months Ended Nine Months Ended September 30, September 30, September 30, 2009 2008 Change Net income $ 1,314 $ 16,771 $ (15,457) Depreciation, amortization and other non-cash items 4,746 4,776 (30) Working capital changes 5,298 (5,661) 10,959 Net cash provided by operating activities 11,358 15,886 (4,528) Capital expenditures (5,446) (5,434) (12) Proceeds from issuance of debt 35,049 - 35,049 Payments on debt (35,382) (8,068) (27,314) Other, net (915) 278 (1,193) Effect of exchange rate changes on cash 753 (512) 1,265 Increase in cash and cash equivalents 5,417 2,150 3,267 Cash and cash equivalents at beginning of period 30,793 31,570 (777) Cash and cash equivalents at end of period $ 36,210 $ 33,720 $ 2,490 |

| Furmanite Corporation Review of Q3 2009 11/06/2009 8 |