Exhibit 99.1
| Furmanite Corporation 2008 Year in Review Michael L. Rose, Chairman & CEO Joseph E. Milliron, President & COO Howard C. Wadsworth, CFO |
| Safe Harbor Statement Certain of the Company's statements in this presentation are not purely historical, and as such are "forward-looking statements" within the meaning of the Private Securities Litigation Reform Act of 1995. These include statements regarding management's plans, beliefs, expectations, intentions or projections of the future. Forward-looking statements involve risks and uncertainties, including without limitation, the various risks inherent in the Company's business, and other risks and uncertainties detailed most recently in this presentation and the Company's Form 10-K as of December 31, 2008 filed with the Securities and Exchange Commission. One or more of these factors have affected, and could in the future affect the Company's business and financial results in future periods, and could cause actual results to differ materially from plans and projections. There can be no assurance that the forward-looking statements made in this document will prove to be accurate, and issuance of such forward-looking statements should not be regarded as a representation by the Company, or any other person, that the objectives and plans of the Company will be achieved. All forward-looking statements made in this presentation are based on information presently available to management, and the Company assumes no obligation to update any forward-looking statements. 2 03/16/2009 |

| Furmanite Corporation 2008 Year in Review Michael L. Rose, Chairman & CEO 03/16/2009 3 |
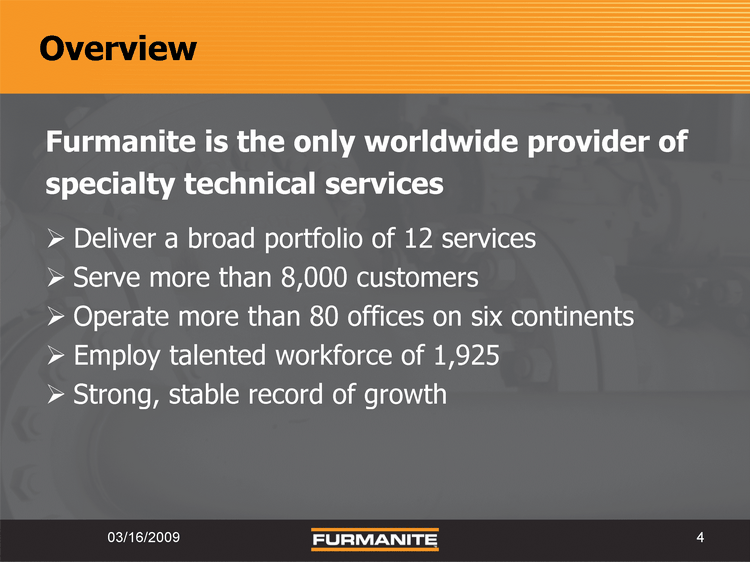
| Overview Furmanite is the only worldwide provider of specialty technical services Deliver a broad portfolio of 12 services Serve more than 8,000 customers Operate more than 80 offices on six continents Employ talented workforce of 1,925 Strong, stable record of growth 4 03/16/2009 |
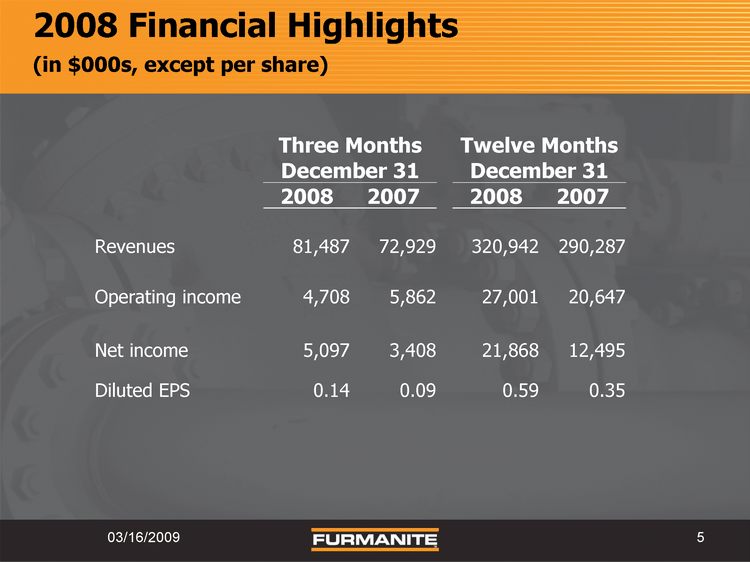
| 2008 Financial Highlights (in $000s, except per share) Three Months Three Months Twelve Months Twelve Months December 31 December 31 December 31 December 31 2008 2007 2008 2007 Revenues 81,487 72,929 320,942 290,287 Operating income 4,708 5,862 27,001 20,647 Net income 5,097 3,408 21,868 12,495 Diluted EPS 0.14 0.09 0.59 0.35 03/16/2009 5 |
| Furmanite Corporation 2008 Year in Review Howard C. Wadsworth, CFO 03/16/2009 6 |
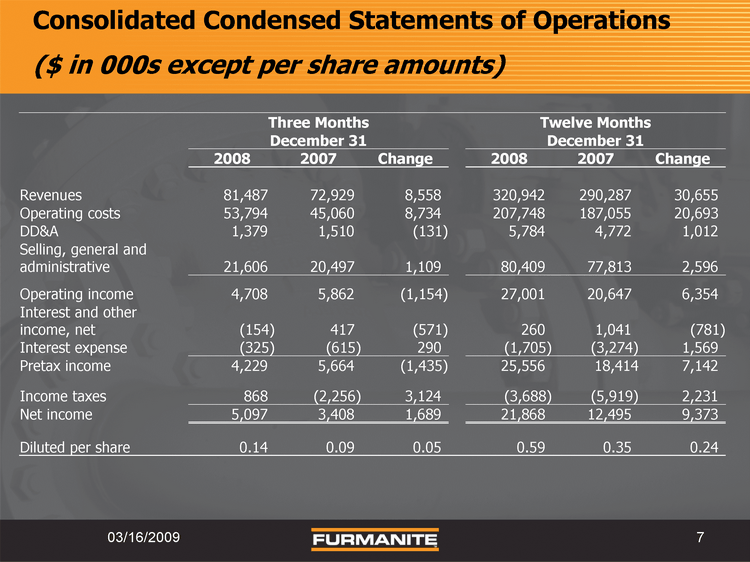
| Consolidated Condensed Statements of Operations ($ in 000s except per share amounts) Three Months Three Months Three Months Twelve Months Twelve Months Twelve Months December 31 December 31 December 31 December 31 December 31 December 31 2008 2007 Change 2008 2007 Change Revenues 81,487 72,929 8,558 320,942 290,287 30,655 Operating costs 53,794 45,060 8,734 207,748 187,055 20,693 DD&A 1,379 1,510 (131) 5,784 4,772 1,012 Selling, general and administrative 21,606 20,497 1,109 80,409 77,813 2,596 Operating income 4,708 5,862 (1,154) 27,001 20,647 6,354 Interest and other income, net (154) 417 (571) 260 1,041 (781) Interest expense (325) (615) 290 (1,705) (3,274) 1,569 Pretax income 4,229 5,664 (1,435) 25,556 18,414 7,142 Income taxes 868 (2,256) 3,124 (3,688) (5,919) 2,231 Net income 5,097 3,408 1,689 21,868 12,495 9,373 Diluted per share 0.14 0.09 0.05 0.59 0.35 0.24 03/16/2009 7 |
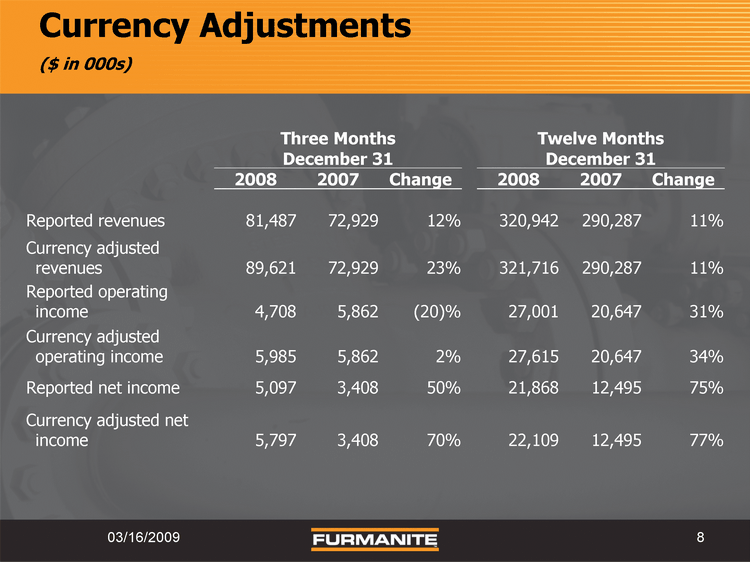
| Currency Adjustments ($ in 000s) Three Months Three Months Three Months Twelve Months Twelve Months Twelve Months December 31 December 31 December 31 December 31 December 31 December 31 2008 2007 Change 2008 2007 Change Reported revenues 81,487 72,929 12% 320,942 290,287 11% Currency adjusted revenues 89,621 72,929 23% 321,716 290,287 11% Reported operating income 4,708 5,862 (20)% 27,001 20,647 31% Currency adjusted operating income 5,985 5,862 2% 27,615 20,647 34% Reported net income 5,097 3,408 50% 21,868 12,495 75% Currency adjusted net income 5,797 3,408 70% 22,109 12,495 77% 03/16/2009 8 |
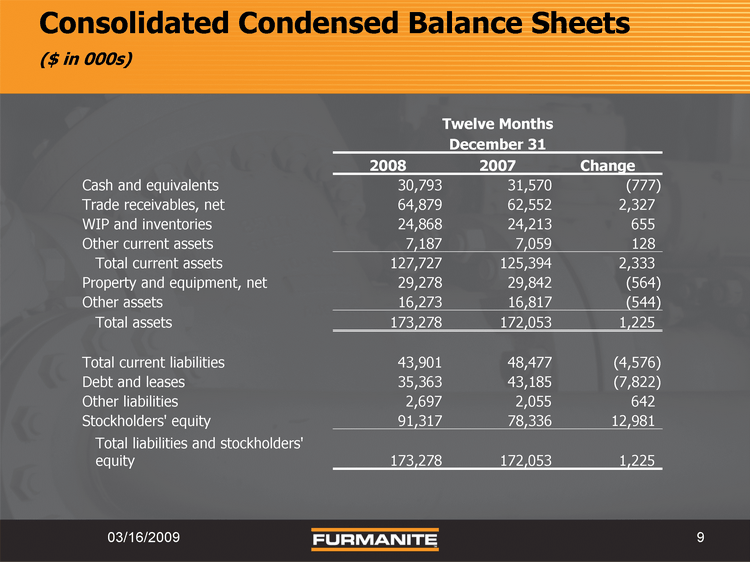
| Consolidated Condensed Balance Sheets ($ in 000s) Twelve Months Twelve Months Twelve Months December 31 December 31 December 31 2008 2007 Change Cash and equivalents 30,793 31,570 (777) Trade receivables, net 64,879 62,552 2,327 WIP and inventories 24,868 24,213 655 Other current assets 7,187 7,059 128 Total current assets 127,727 125,394 2,333 Property and equipment, net 29,278 29,842 (564) Other assets 16,273 16,817 (544) Total assets 173,278 172,053 1,225 Total current liabilities 43,901 48,477 (4,576) Debt and leases 35,363 43,185 (7,822) Other liabilities 2,697 2,055 642 Stockholders' equity 91,317 78,336 12,981 Total liabilities and stockholders' equity 173,278 172,053 1,225 03/16/2009 9 |
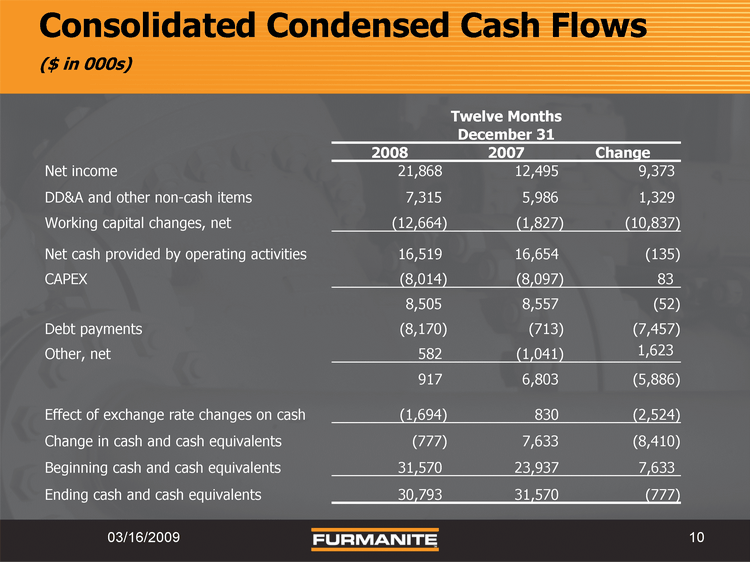
| Consolidated Condensed Cash Flows ($ in 000s) Twelve Months Twelve Months Twelve Months December 31 December 31 December 31 2008 2007 Change Net income 21,868 12,495 9,373 DD&A and other non-cash items 7,315 5,986 1,329 Working capital changes, net (12,664) (1,827) (10,837) Net cash provided by operating activities 16,519 16,654 (135) CAPEX (8,014) (8,097) 83 8,505 8,557 (52) Debt payments (8,170) (713) (7,457) Other, net 582 (1,041) 1,623 917 6,803 (5,886) Effect of exchange rate changes on cash (1,694) 830 (2,524) Change in cash and cash equivalents (777) 7,633 (8,410) Beginning cash and cash equivalents 31,570 23,937 7,633 Ending cash and cash equivalents 30,793 31,570 (777) 03/16/2009 10 |

| Furmanite Corporation 2008 Year in Review Joseph E. Milliron, President and COO 03/16/2009 11 |
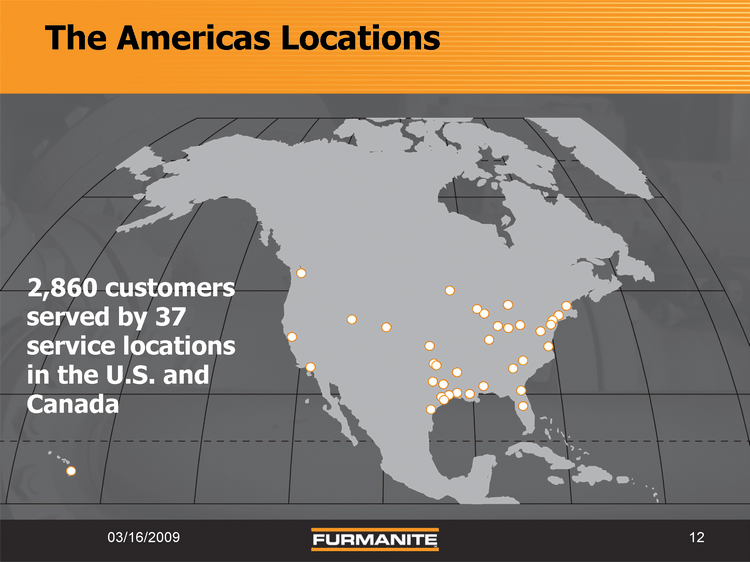
| The Americas Locations 2,860 customers served by 37 service locations in the U.S. and Canada 12 03/16/2009 |
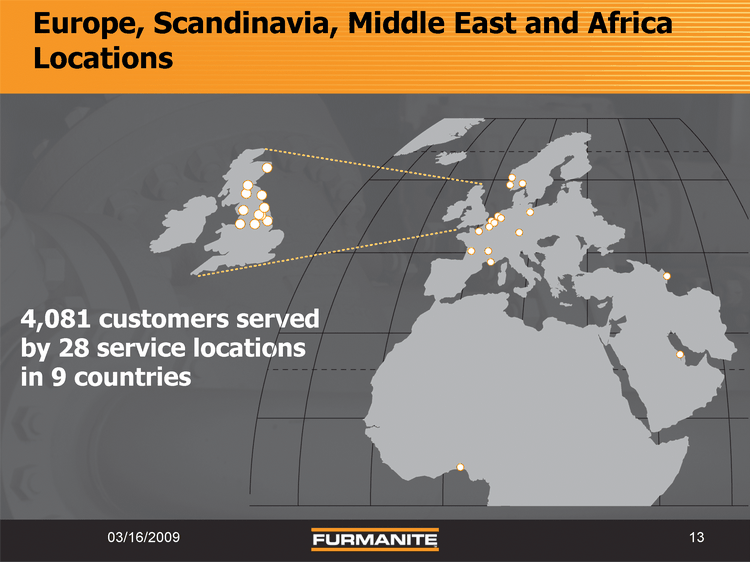
| Europe, Scandinavia, Middle East and Africa Locations 4,081 customers served by 28 service locations in 9 countries 13 03/16/2009 |
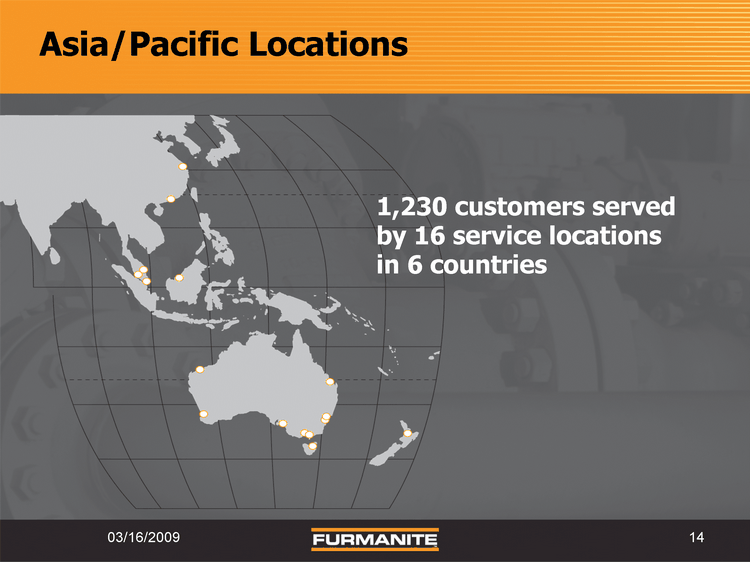
| Asia/Pacific Locations 1,230 customers served by 16 service locations in 6 countries 14 03/16/2009 |
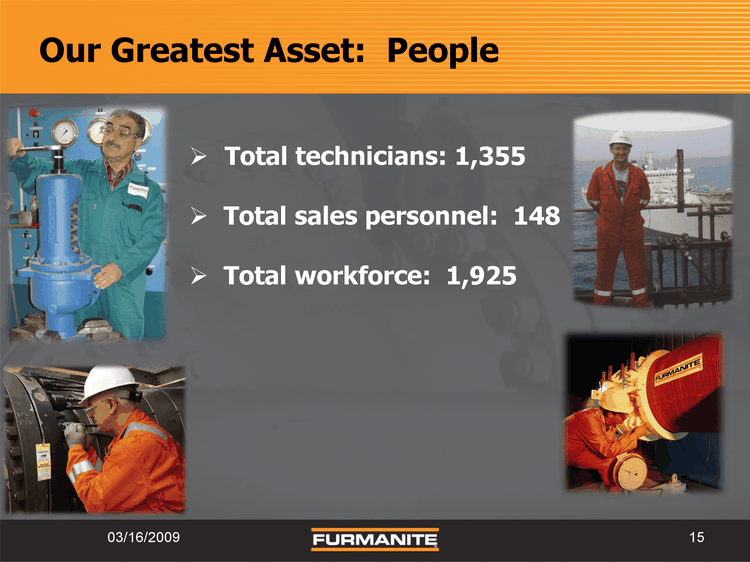
| Our Greatest Asset: People Total technicians: 1,355 Total sales personnel: 148 Total workforce: 1,925 03/16/2009 15 |
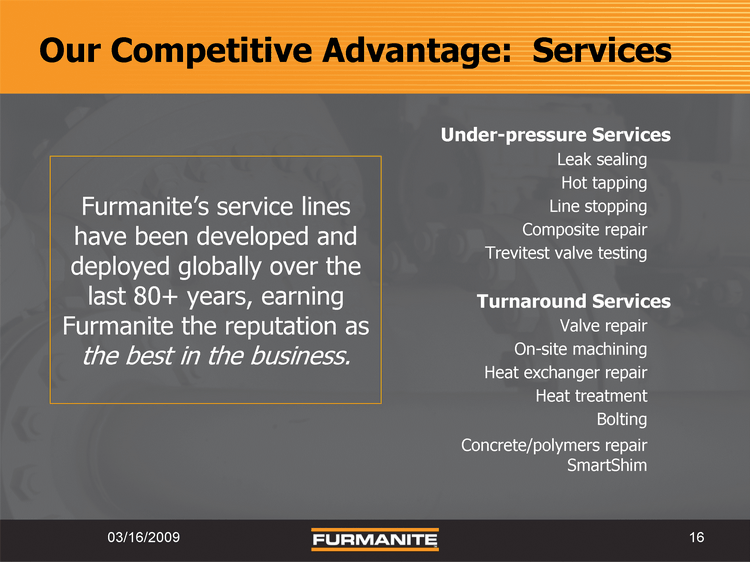
| Our Competitive Advantage: Services Under-pressure Services Leak sealing Hot tapping Line stopping Composite repair Trevitest valve testing Turnaround Services Valve repair On-site machining Heat exchanger repair Heat treatment Bolting Concrete/polymers repair SmartShim Furmanite's service lines have been developed and deployed globally over the last 80+ years, earning Furmanite the reputation as the best in the business. 03/16/2009 16 |
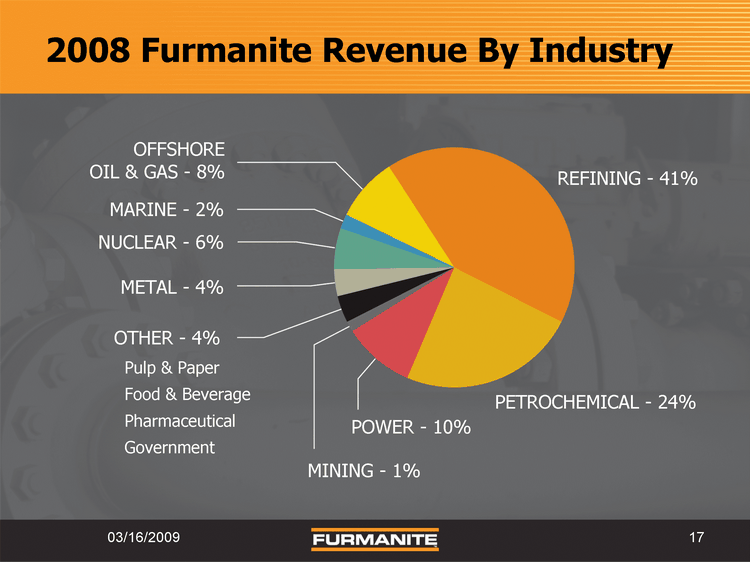
| 2008 Furmanite Revenue By Industry OFFSHORE OIL & GAS - 8% MARINE - 2% NUCLEAR - 6% METAL - 4% OTHER - 4% Pulp & Paper Food & Beverage Pharmaceutical Government POWER - 10% PETROCHEMICAL - 24% MINING - 1% REFINING - 41% 17 03/16/2009 |
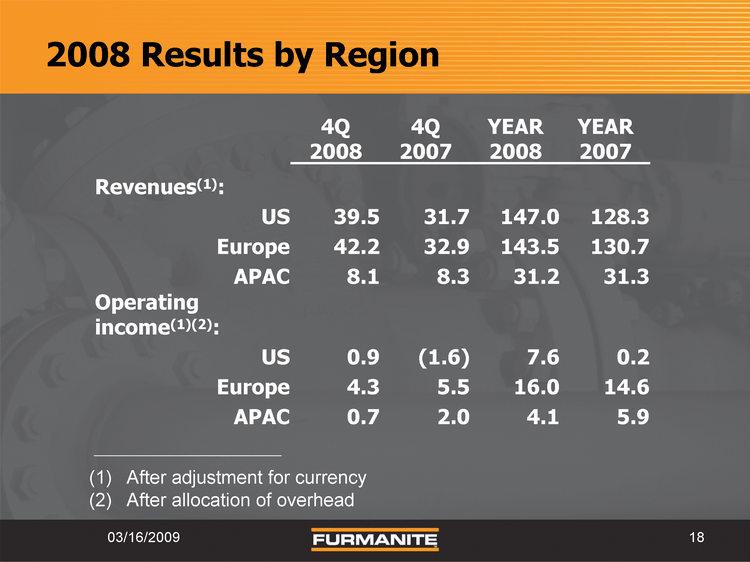
| 2008 Results by Region 4Q 2008 4Q 2007 YEAR 2008 YEAR 2007 Revenues(1): US 39.5 31.7 147.0 128.3 Europe 42.2 32.9 143.5 130.7 APAC 8.1 8.3 31.2 31.3 Operating income(1)(2): US 0.9 (1.6) 7.6 0.2 Europe 4.3 5.5 16.0 14.6 APAC 0.7 2.0 4.1 5.9 18 03/16/2009 After adjustment for currency After allocation of overhead |
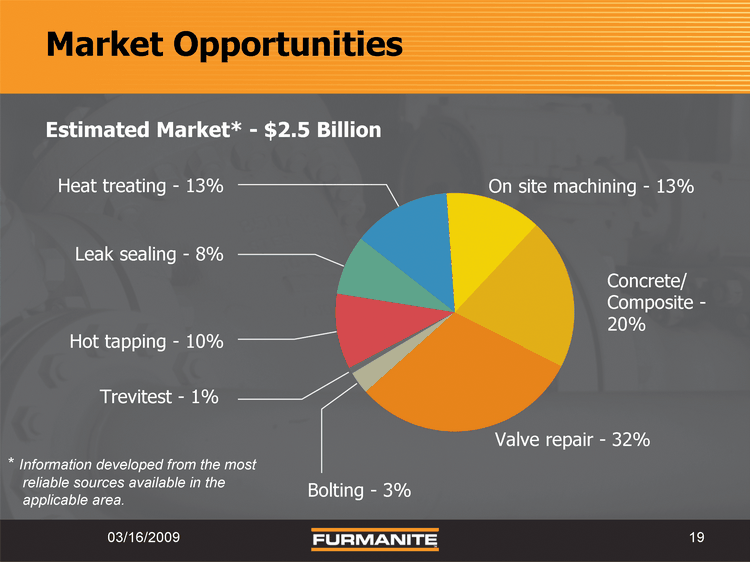
| Market Opportunities Heat treating - 13% Leak sealing - 8% Hot tapping - 10% Trevitest - 1% Concrete/ Composite - 20% Valve repair - 32% Bolting - 3% On site machining - 13% Estimated Market* - $2.5 Billion 19 03/16/2009 * Information developed from the most reliable sources available in the applicable area. |
| Furmanite Corporation 2008 Year in Review 03/16/2009 20 |