 Furmanite Corporation QUARTER ENDED SEPTEMBER 30, 2012 Charles R. Cox, Chairman & CEO Joseph E. Milliron, President & COO Robert S. Muff, Principal Financial Officer Exhibit 99.2 |
 2 Safe Harbor Statement Certain of the Company’s statements in this presentation are not purely historical, and as such are “forward-looking statements” within the meaning of the Private Securities Litigation Reform Act of 1995. These include statements regarding management’s plans, beliefs, expectations, intentions or projections of the future. Forward-looking statements involve risks and uncertainties, including without limitation, the various risks inherent in the Company’s business, and other risks and uncertainties detailed most recently in this presentation and the Company’s Form 10-K as of December 31, 2011 filed with the Securities and Exchange Commission. One or more of these factors could affect the Company’s business and financial results in future periods, and could cause actual results to differ materially from plans and projections. There can be no assurance that the forward-looking statements made in this document will prove to be accurate, and issuance of such forward-looking statements should not be regarded as a representation by the Company, or any other person, that the objectives and plans of the Company will be achieved. All forward-looking statements made in this presentation are based on information presently available to management, and the Company assumes no obligation to update any forward-looking statements. |
 3 Opening Comments • Perspective on Financial Results • Major Change for Furmanite in 2012 Charles R. Cox, Chairman & CEO |
 Furmanite Corporation QUARTER ENDED SEPTEMBER 30, 2012 Financial Review Robert S. Muff, Principal Financial Officer 4 |
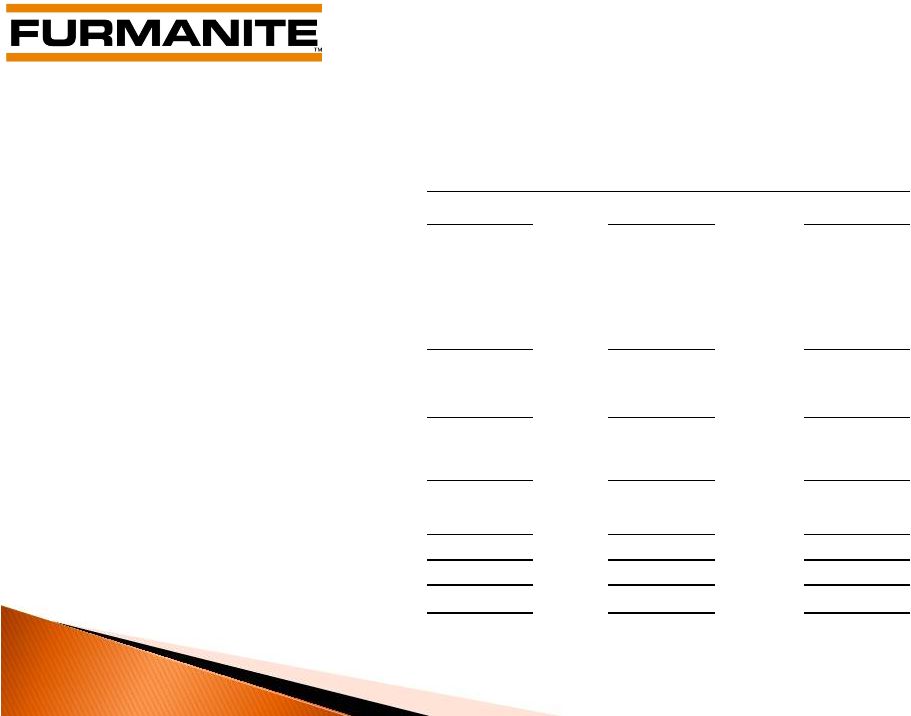
 Condensed Consolidated Statements of Operations ($ in 000s except percentages and per share amounts) (Unaudited) 5 For the Three Months Ended September 30, 2012 % of Rev 2011 % of Rev Change Revenues $ 75,579 100.0% $ 78,330 100.0% $ (2,751) Operating costs 56,141 74.3% 53,807 68.7% 2,334 Depreciation and amortization expense 2,329 3.1% 2,207 2.8% 122 Selling, general and administrative expense 17,613 23.3% 16,769 21.4% 844 Operating income (loss), excluding relocation and restructuring costs (504) -0.7% 5,547 7.1% (6,051) Relocation and restructuring costs 224 0.3% 25 0.0% 199 Operating income (loss) (728) -1.0% 5,522 7.1% (6,250) Interest and other income (expense), net (309) (604) 295 Income (loss) before income taxes (1,037) 4,918 (5,955) Income tax expense (243) (1,336) 1,093 Net income (loss) $ (1,280) $ 3,582 $ (4,862) Diluted earnings (loss) per share $ (0.03) $ 0.10 $ (0.13) Adjusted diluted earnings (loss) per share* $ (0.03) $ 0.10 $ (0.13) * Excludes $0.2 million of relocation and restructuring costs, net of tax for the three months ended September 30, 2012. Excludes a nominal amount of restructuring costs, net of tax for the three months ended September 30, 2011. |
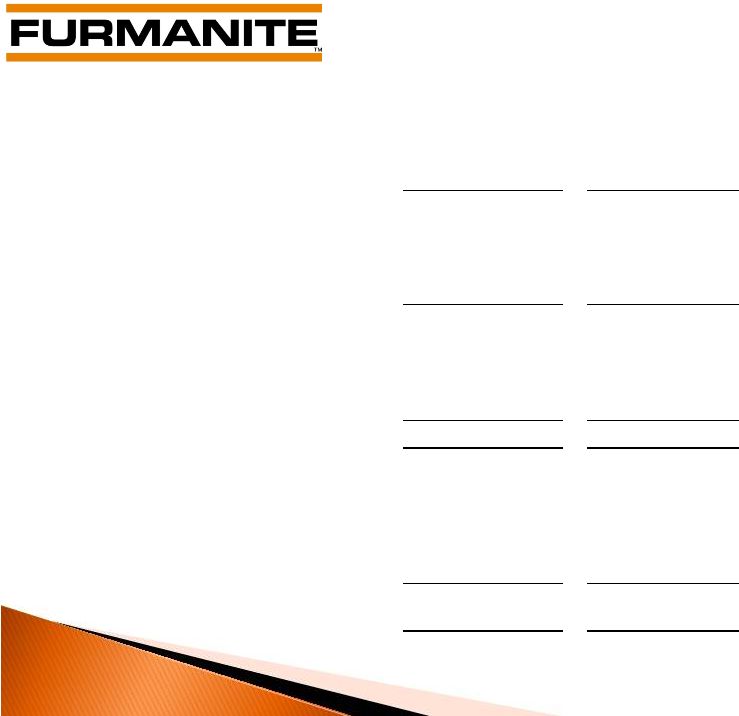
 Condensed Consolidated Statements of Operations ($ in 000s except percentages and per share amounts) (Unaudited) 6 For the Nine Months Ended September 30, 2012 % of Rev 2011 % of Rev Change Revenues $ 233,289 100.0% $ 234,393 100.0% $ (1,104) Operating costs 166,704 71.5% 160,532 68.5% 6,172 Depreciation and amortization expense 6,318 2.7% 6,280 2.7% 38 Selling, general and administrative expense 54,472 23.3% 51,357 21.9% 3,115 Operating income, excluding relocation and restructuring costs 5,795 2.5% 16,224 6.9% (10,429) Relocation and restructuring costs 2,471 1.1% 270 0.1% 2,201 Operating income 3,324 1.4% 15,954 6.8% (12,630) Interest and other income (expense), net (1,107) (857) (250) Income before income taxes 2,217 15,097 (12,880) Income tax expense (2,483) (2,343) (140) Net income (loss) $ (266) $ 12,754 $ (13,020) Diluted earnings (loss) per share $ (0.01) $ 0.34 $ (0.35) Adjusted diluted earnings (loss) per share* $ 0.04 $ 0.32 $ (0.28) * Excludes $1.7 million of relocation and restructuring costs, net of tax for the nine months ended September 30, 2012. Excludes $0.2 million of restructuring costs, net of tax and $1.2 million acquisition related income tax benefit for the nine months ended September 30, 2011. |
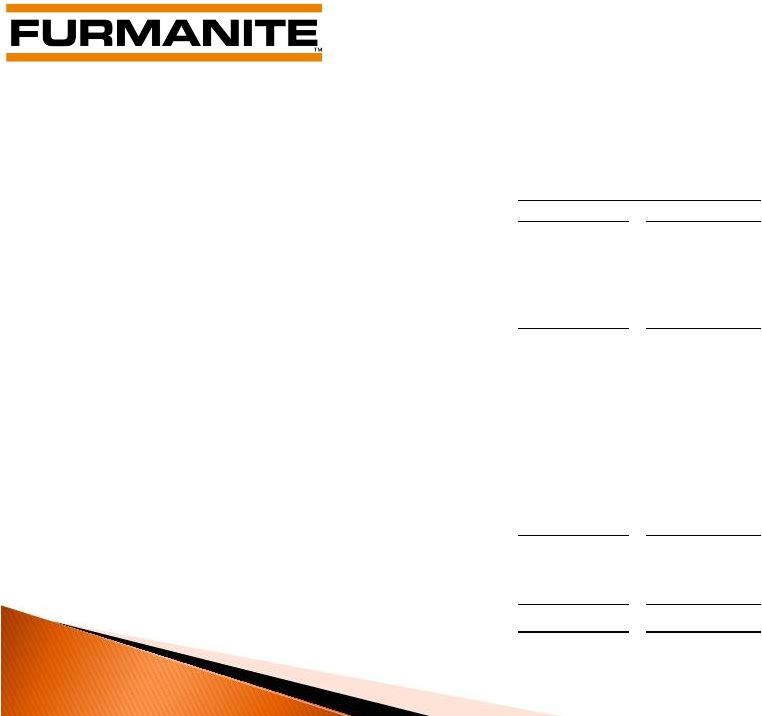
 Condensed Consolidated Balance Sheets ($ in 000s) 7 (Unaudited) September 30, December 31, 2012 2011 Cash $ 33,726 $ 34,524 Trade receivables, net 71,548 71,508 Inventories 34,197 26,557 Other current assets 11,521 13,171 Total current assets 150,992 145,760 Property and equipment, net 39,650 34,060 Other assets 32,529 27,412 Total assets $ 223,171 $ 207,232 Total current liabilities $ 46,427 $ 41,999 Total long-term debt 39,328 31,051 Other liabilities 16,026 15,293 Total stockholders' equity 121,390 118,889 Total liabilities and stockholders' equity $ 223,171 $ 207,232 |
 Condensed Consolidated Statements of Cash Flows ($ in 000s) (Unaudited) 8 For the Nine Months Ended September 30, 2012 2011 Net income (loss) $ (266) $ 12,754 Depreciation, amortization and other non-cash items 10,200 6,238 Working capital changes 256 (13,364) Net cash provided by operating activities 10,190 5,628 Capital expenditures (6,108) (3,915) Acquisitions of assets and business, net of cash acquired (11,700) (3,815) Payments on debt (32,720) (85) Proceeds from issuance of debt 39,300 – Other, net 63 402 Effect of exchange rate changes on cash 177 (287) Decrease in cash and cash equivalents (798) (2,072) Cash and cash equivalents at beginning of period 34,524 37,170 Cash and cash equivalents at end of period $ 33,726 $ 35,098 |
 Furmanite Corporation QUARTER ENDED SEPTEMBER 30, 2012 Operations Review Joseph E. Milliron, President and Chief Operating Officer 9 |
 10 • Previous Isolated Geographical Project Execution • Past inconsistent Performance • New “Orange Way” Global Project Execution • Expectation of Improved Project Performance Project Execution |
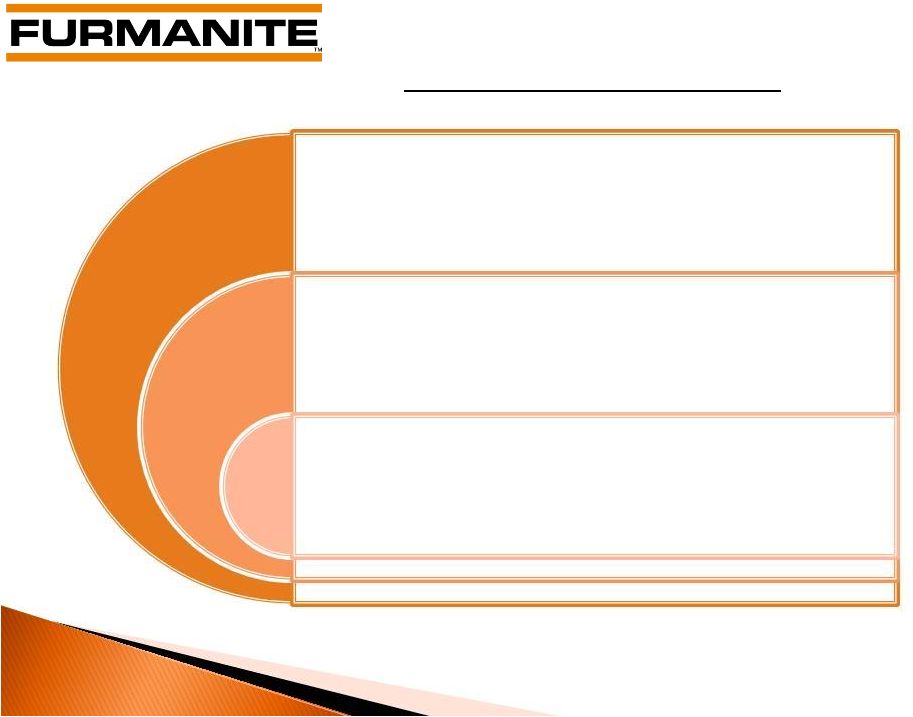 As of September 30, 2012 11 EMEA APAC The Americas • 744 technicians • 55% of YTD revenues • 30 locations • 380 technicians • 33% of YTD revenues • 30 locations • 137 technicians • 12% of YTD revenues • 15 locations Global Service Network |
 12 Business and Geographic Data – On-line¹ Services Revenues ($ in 000’s) (Unaudited) 1 Formerly referred to as under-pressure services Total Americas EMEA APAC On-line Services 3 Qtr. 2012 $ 30,525 $ 16,380 $ 10,214 $ 3,931 On-line Services 3 Qtr. 2011 30,877 15,678 11,523 3,676 Variance On-line Services YTD 2012 $ 90,619 $ 49,004 $ 30,001 $ 11,614 On-line Services YTD 2011 90,426 48,677 31,689 10,060 Variance $ 1,554 rd rd $ 255 $ (352) $ (1,309) $ 702 $ 327 $ (1,688) $ 193 |
 Business and Geographic Data – Off-line¹ Services Revenues ($ in 000’s) (Unaudited) 13 1 Formerly referred to as turnaround services Total Americas EMEA APAC Off-line Services 3 Qtr. 2012 $ 32,082 $ 17,335 $ 10,407 $ 4,340 Off-line Services 3 Qtr. 2011 33,083 12,388 13,348 7,347 Variance $ (1,001) Off-line Services YTD 2012 $ 103,452 $ 57,717 $ 30,745 $ 14,990 Off-line Services YTD 2011 103,261 48,153 39,037 16,071 Variance rd rd $ (2,941) $ (3,007) $ (8,292) $ (1,081) $ 4,947 $ 191 $ 9,564 |
 Furmanite Corporation QUARTER ENDED SEPTEMBER 30, 2012 Charles R. Cox, Chairman & CEO 14 |
 15 3 Quarter • Solid Revenues – No Earnings • European Restructuring behind us by year-end • Total Restructuring costs projected at $2.7 million • Underlying Margins within Prior Year Range Financial Comments rd – $1.9 million charge in fourth quarter |
 16 • 4 Quarter and Beyond look Potentially Strong • Furmanite is Experiencing More Positive Change – Fully Embraced by the Team • Performance-Based Incentives now in place Positive Future Outlook th |
 17 • Markets Remain Remarkably Consistent with 2010 and 2011 • Central Europe weak and other Europe markets are slightly weaker • Australia remains strong • We aim to be the Best and Most Competitive – Key to Success in Any Market Business Conditions |
 18 • Much Already Accomplished – Direction & Goals Clear • So Much to Improve – so Much Potential! • New Organization and Leadership Teams now in place • 2013 will be Exciting Summary |
 To safely and ethically establish Furmanite as the World leader in all our Service Lines by 2014, through Innovation, Global Teamwork, Market Dominance, Project Excellence and Customer Service Perfection. “The World Leader in All Service Lines by 2014” 19 Furmanite Vision |
 Furmanite Corporation Review of 3Q 2012 November 7, 2012 www.furmanite.com 20 |