
KANSAS CITY SOUTHERN Credit Suisse 7th Annual Industrials Conference ©KANSAS CITYSOUTHERN KCS

Safe Harbor Statement This presentation contains “forward-looking statements” within the meaning of the securities laws concerning potential future events involving KCS and its subsidiaries, which could materially differ from the events that actually occur. Words such as “projects,” “estimates,” “forecasts,” “believes,” “intends,” “expects,” “anticipates,” and similar expressions are intended to identify many of these forward-looking statements. Such forward-looking statements are based upon information currently available to management and management’s perception thereof as of the date hereof. Differences that actually occur could be caused by a number of external factors over which management has little or no control, including: competition and consolidation within the transportation industry; the business environment in industries that produce and use items shipped by rail; loss of the rail concession of KCS’ subsidiary, Kansas City Southern de México, S.A. de C.V.; the termination of, or failure to renew, agreements with customers, other railroads and third parties; access to capital; disruptions to KCS’ technology infrastructure, including its computer systems; natural events such as severe weather, hurricanes and floods; market and regulatory responses to climate change; legislative and regulatory developments and disputes; rail accidents or other incidents or accidents on KCS’ rail network or at KCS’ facilities or customer facilities involving the release of hazardous materials, including toxic inhalation hazards; fluctuation in prices or availability of key materials, in particular diesel fuel; dependency on certain key suppliers of core rail equipment; changes in securities and capital markets; unavailability of qualified personnel; labor difficulties, including strikes and work stoppages; acts of terrorism or risk of terrorist activities; war or risk of war; domestic and international economic, political and social conditions; the level of trade between the United States and Asia or Mexico; fluctuations in the peso-dollar exchange rate; increased demand and traffic congestion; the outcome of claims and litigation involving KCS or its subsidiaries; and other factors affecting the operation of the business. More detailed information about factors that could affect future events may be found in filings by KCS with the Securities and Exchange Commission, including KCS’ Annual Report on Form 10-K for the year ended December 31, 2018 (File No. 1-4717) and subsequent reports. Forward-looking statements are not, and should not be relied upon as, a guarantee of future performance or results, nor will they necessarily prove to be accurate indications of the times at or by which any such performance or results will be achieved. As a result, actual outcomes and results may differ materially from those expressed in forward-looking statements. KCS is not obligated to update any forward- looking statements to reflect future events or developments. All reconciliations to GAAP can be found on the KCS website, kcsouthern.com/investors. © KANSAS ©KANSAS CITYSOUTHERN KCS 2
JEFF SONGER EVP & CHIEF OPERATING OFFICER © KANSAS ©KANSAS CITYSOUTHERN KCS 3

KCS Integrates the North American Rail Network and Facilitates Cross-Border Trade Unique cross-border service over the Canada Pacific Laredo gateway Northwest Largest international rail interchange in North American in both volume & value of freight Chicago/ Upper Midwest Mid-Atlantic/ Links the heart of Mexico’s manufacturing Northeast region with all Class I rails Southwest Single connection between Mexico and Southeast all major markets in the U.S. & Canada Uniquely positioned to facilitate cross- border trade Despite recent trade uncertainty, trade between US and Mexico has grown by 17% since 2016* KCS’ franchise cross-border volumes have grown at a 12% CAGR from 2010 through 2018, and represent over 30% of revenue KCS’ total cross-border volumes have grown at an 8% CAGR from 2010 through 2018 and represent almost 50% of revenue ©KANSAS CITYSOUTHERN KCS *Source: https://usatrade.census.gov/ 4

QTD Q4 2019 Revenue Performance – YoY View Outlook Markets Key Drivers Chemical & • Petroleum: Benefits from refined product shipments to Mexico related to Energy Reform Petroleum Favorable – ~50% of • Metals benefiting from improved service relative to Q418 and changes in sourcing patterns Revenue Industrial & • Pulp & Paper rebounding sequentially due to improving service and market conditions Consumer • Military shipments up YOY Agriculture & • Grain volumes off to a slower than expected start to the quarter due to delayed harvest Minerals Neutral – ~20% of Revenue • GM volumes rebounding after strike earlier in the quarter Automotive • Business unit impacted by lower automotive production in Mexico • Lázaro Cárdenas shipments negatively impacted by early & abrupt ending to peak season Intermodal Negative – • Cross-border franchise volumes remain strong ~20% of Revenue • Crude Oil: spreads are widening, but YOY crude oil revenue is still negative Energy • Utility Coal: YOY growth driven by demand in Texas market © KANSAS ©KANSAS CITYSOUTHERN KCS 5

Border Strategy Old Process – USDHS Old Process - Mexico SAT • EDI • Manual • Require set-out • Random • No pre-clearance • Multiple set-outs • Multiple data sets • No pre-clearance New Process – Common Viewer Border Capacity • Origin/ • Carrier/ Shipper • Int’l Crews Destination • Driver • Yard to Yard • Shipment Data • License Plate • Common Viewer • Picture or X-ray • USDOT Number • Pre-clearance • Window elimination 40-60% Increase in Border Capacity Advantages CBP Advantages KCS • Single location • Trains that are pre-cleared • Common views of shipment • Faster border velocity • Single feed of waybill data • Fewer set-outs, (min 15,000 @$200) • Ability to tie into targeting system • Competitive advantage • Data analysis & video evidence • Deeper relationship with DHS/SAT © KANSAS ©KANSAS CITYSOUTHERN KCS 6

Positive Train Control Focus on interoperability testing throughout 2019 ©KANSAS CITYSOUTHERN KCS 7

Mexico Labor Strategy – One System, Similar Work Rules . Current State: Work rules and brakeman requirements delay operations in Mexico and increase the burden on employees and crew management to fill unnecessary assignments – Delays and operational inefficiencies negatively impact customer service, and – contribute to a competitive disadvantage vs. other transportation service providers, particularly truck. . Goal: Work rules & crew size requirements that align with U.S. and Canada – Service, operational & safety requirements should dictate crew size. Modernization of work rules in Mexico will promote a consistent and superior transportation service for KCS’s customers across North America © KANSAS ©KANSAS CITYSOUTHERN KCS 8

SAMEH FAHMY EVP OF PRECISION SCHEDULED RAILROADING © KANSAS ©KANSAS CITYSOUTHERN KCS 9
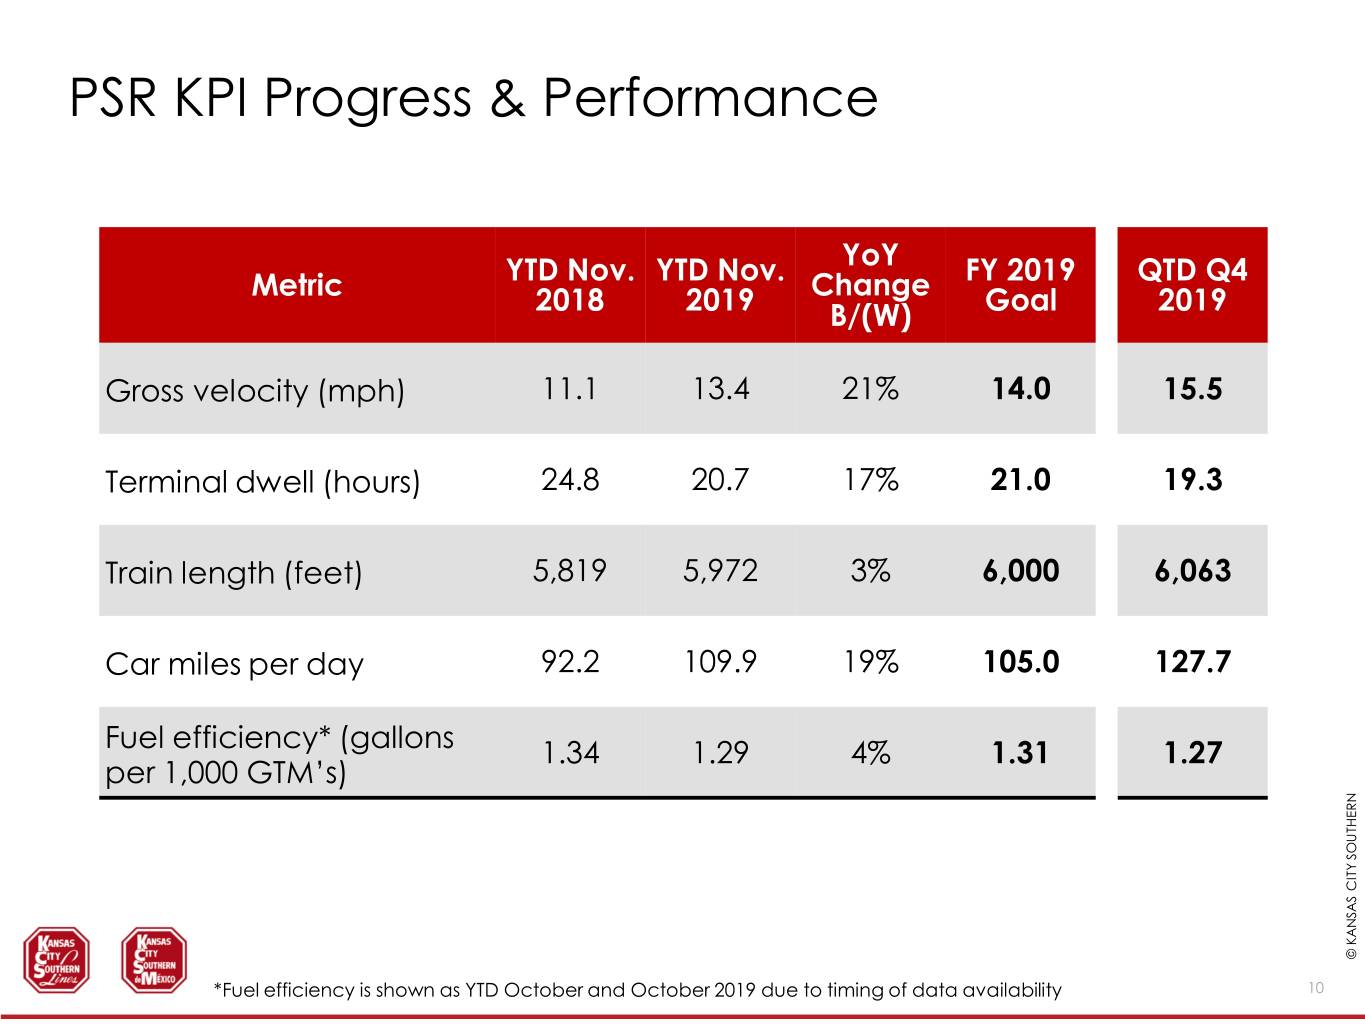
PSR KPI Progress & Performance YTD Nov. YTD Nov. YoY FY 2019 QTD Q4 Metric 2018 2019 Change Goal 2019 B/(W) Gross velocity (mph) 11.1 13.4 21% 14.0 15.5 Terminal dwell (hours) 24.8 20.7 17% 21.0 19.3 Train length (feet) 5,819 5,972 3% 6,000 6,063 Car miles per day 92.2 109.9 19% 105.0 127.7 Fuel efficiency* (gallons 1.34 1.29 4% 1.31 1.27 per 1,000 GTM’s) © KANSAS ©KANSAS CITYSOUTHERN KCS *Fuel efficiency is shown as YTD October and October 2019 due to timing of data availability 10
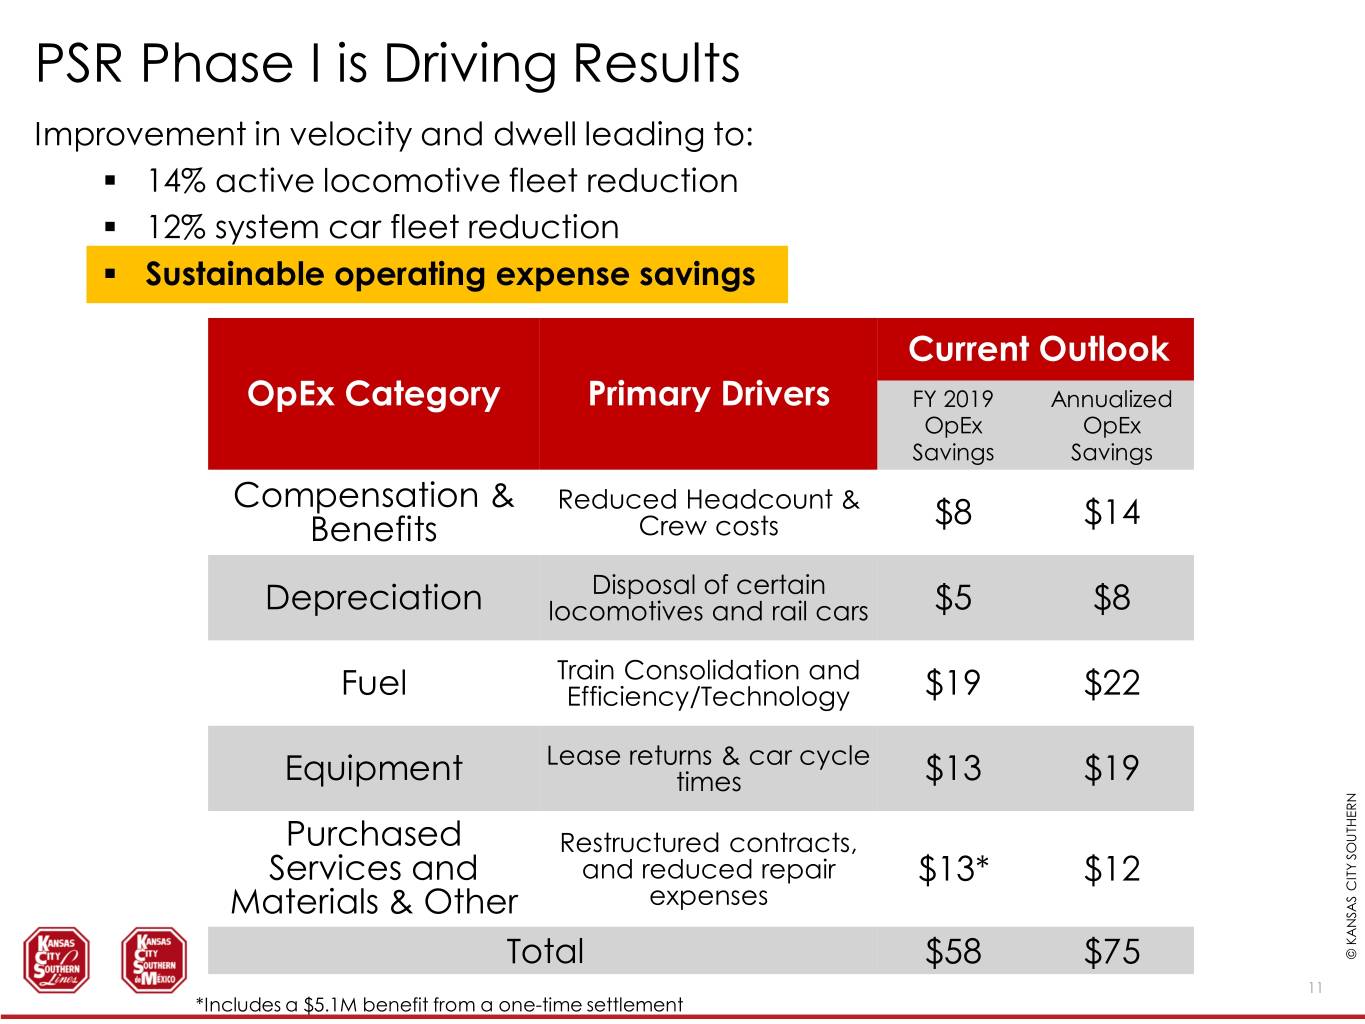
PSR Phase I is Driving Results Improvement in velocity and dwell leading to: . 14% active locomotive fleet reduction . 12% system car fleet reduction . Sustainable operating expense savings Current Outlook OpEx Category Primary Drivers FY 2019 Annualized OpEx OpEx Savings Savings Compensation & Reduced Headcount & $8 $14 Benefits Crew costs Disposal of certain Depreciation locomotives and rail cars $5 $8 Train Consolidation and Fuel Efficiency/Technology $19 $22 Lease returns & car cycle Equipment times $13 $19 Purchased Restructured contracts, Services and and reduced repair $13* $12 Materials & Other expenses Total $58 $75 ©KANSAS CITYSOUTHERN 11 KCS*Includes a $5.1M benefit from a one-time settlement
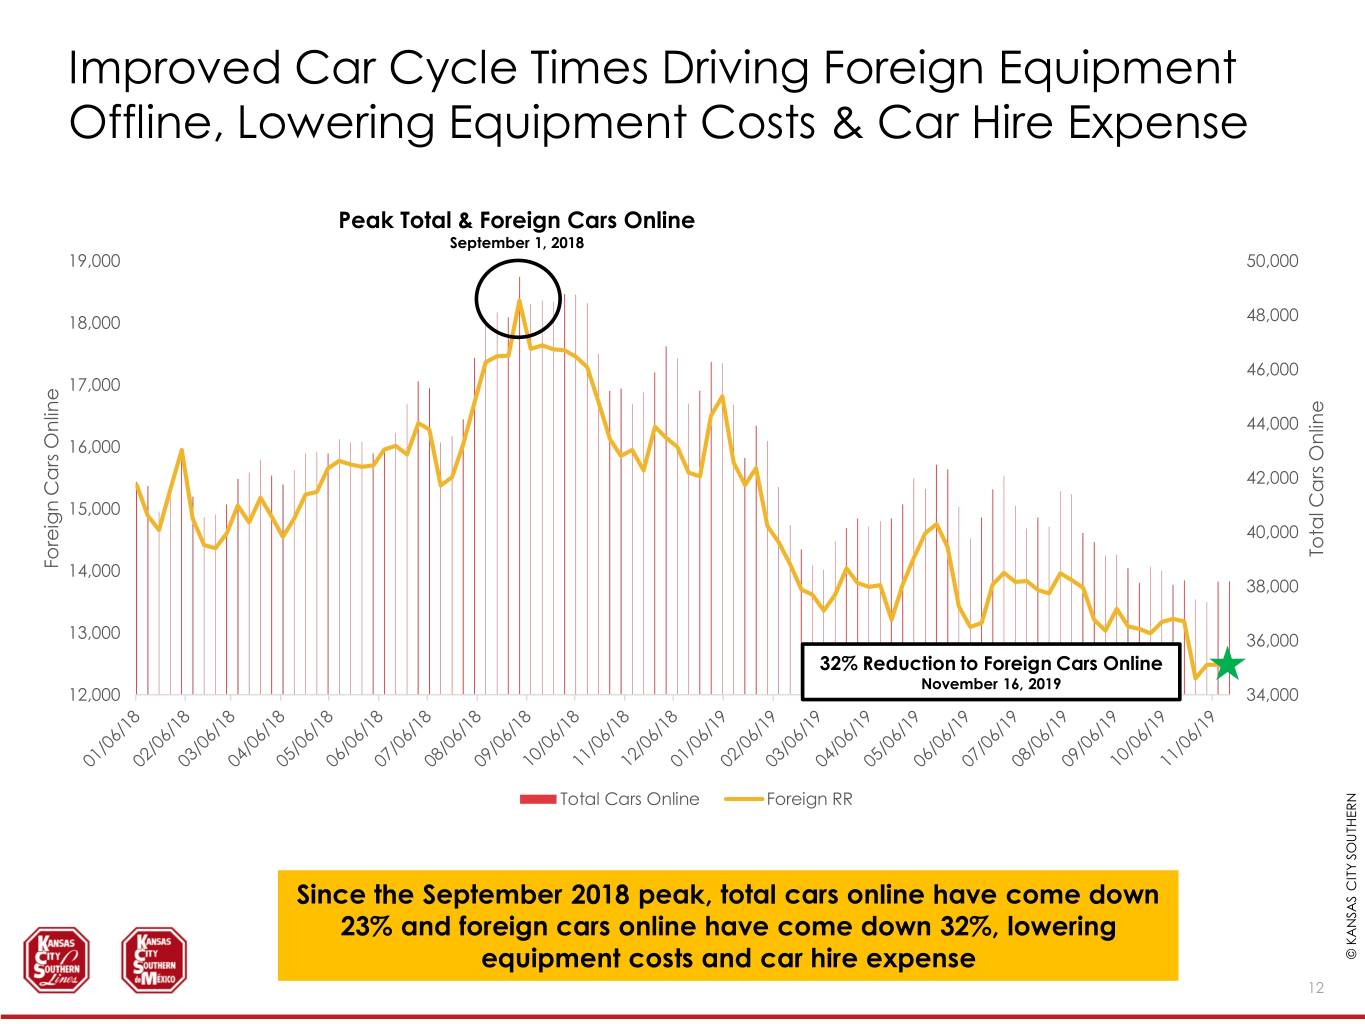
Improved Car Cycle Times Driving Foreign Equipment Offline, Lowering Equipment Costs & Car Hire Expense Peak Total & Foreign Cars Online September 1, 2018 19,000 50,000 18,000 48,000 46,000 17,000 44,000 16,000 42,000 15,000 40,000 Total Cars OnlineCars Total Foreign Cars Online Cars Foreign 14,000 38,000 13,000 36,000 32% Reduction to Foreign Cars Online November 16, 2019 12,000 34,000 Total Cars Online Foreign RR Since the September 2018 peak, total cars online have come down 23% and foreign cars online have come down 32%, lowering equipment costs and car hire expense ©KANSAS CITYSOUTHERN KCS 12

PSR Progress & Utilization of Fuel-Saving Technology Leading to Record Fuel Efficiency Fuel Efficiency Measured as 1,000 Gross Ton Miles moved per gallon of fuel 1.42 1.40 1.38 1.36 1.34 1.32 1.30 Improvement Sept. 2019 was an all time best Fuel 1.28 Efficiency! 1.26 Jan Feb Mar Apr May Jun Jul Aug Sep Oct Nov Dec 2018 2019 Fuel Efficiency and Cost Savings Initiatives: • Horsepower per Trailing Ton Compliance • Cross-Border Fueling ©KANSAS CITYSOUTHERN KCS • Trip OptimizerTM 13

White-Boarding Rollout Phase III – To be Rolled Out in January 2020 Laredo Focus: northbound, cross-border shipments Expected Results: improved cross-border Sanchez fluidity and service offering Saltillo Phase II – Rolled Out December 2nd Focus: freeing up capacity in Mexico’s industrial heartland Changes: TSP changes to run general purpose trains and changes Phase I – Rolled Out November 18th San Luis Potosi to where traffic is blocked Focus: streamlining the frequency Results: improved efficiency by and location of train stops forwarding like-destined railcars Changes: shifts were made to Escobedo Queretaro further into the network before the leverage our facilities farther south in Phase I Ahorcado next work event the network to perform switching and blocking duties Results: freed up capacity in northern Mexico, and reduced train stops through the San Luis Potosi area Estimated Efficiencies for Intermodal, Automotive and Manifest Trains: • Crew Starts: Down 5% • Train Miles: Down 4% • Work Events: Down 15% ©KANSAS CITYSOUTHERN KCS 14
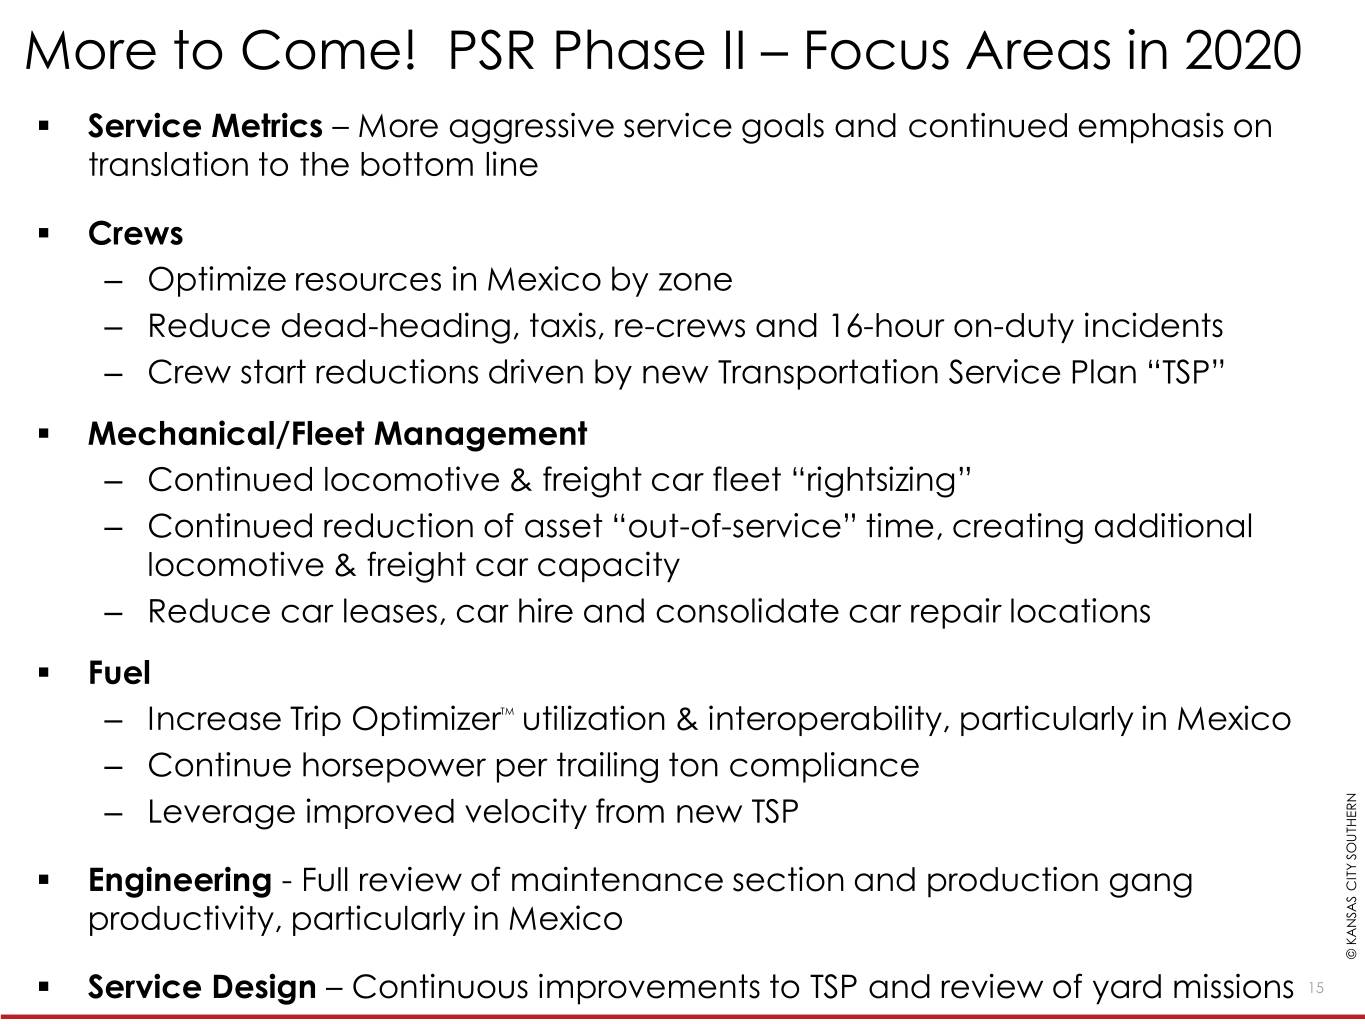
More to Come! PSR Phase II – Focus Areas in 2020 . Service Metrics – More aggressive service goals and continued emphasis on translation to the bottom line . Crews – Optimize resources in Mexico by zone – Reduce dead-heading, taxis, re-crews and 16-hour on-duty incidents – Crew start reductions driven by new Transportation Service Plan “TSP” . Mechanical/Fleet Management – Continued locomotive & freight car fleet “rightsizing” – Continued reduction of asset “out-of-service” time, creating additional locomotive & freight car capacity – Reduce car leases, car hire and consolidate car repair locations . Fuel – Increase Trip OptimizerTM utilization & interoperability, particularly in Mexico – Continue horsepower per trailing ton compliance – Leverage improved velocity from new TSP . Engineering - Full review of maintenance section and production gang productivity, particularly in Mexico © KANSAS ©KANSAS CITYSOUTHERN . ServiceKCS Design – Continuous improvements to TSP and review of yard missions 15
Thank You! www.KCSouthern.com © KANSAS ©KANSAS CITYSOUTHERN KCS 16


