UNITED STATES SECURITIES AND EXCHANGE COMMISSION
Washington, D.C. 20549
Form 10-Q
| | | |
þ | | QUARTERLY REPORT PURSUANT TO SECTION 13 OR 15(d) OF THE SECURITIES EXCHANGE ACT OF 1934 |
| | | For the quarterly period ended September 30, 2008 |
or |
o | | TRANSITION REPORT PURSUANT TO SECTION 13 OR 15(d) OF THE SECURITIES EXCHANGE ACT OF 1934 |
| | | For the transition period from to |
Commission File Number 1-4717
KANSAS CITY SOUTHERN
(Exact name of registrant as specified in its charter)
| | | | | |
Delaware
(State or other jurisdiction of
incorporation or organization)
427 West 12th Street,
Kansas City, Missouri
(Address of principal executive offices) | |  | | 44-0663509
(I.R.S. Employer
Identification No.)
64105
(Zip Code) |
816.983.1303
(Registrant’s telephone number, including area code)
None
(Former name, former address and former fiscal year, if changed since last report.)
Indicate by check mark whether the registrant (1) has filed all reports required to be filed by Section 13 or 15(d) of the Securities Exchange Act of 1934 during the preceding 12 months (or for such shorter period that the registrant was required to file such reports), and (2) has been subject to such filing requirements for the past 90 days. Yes þ No o
Indicate by check mark whether the registrant is a large accelerated filer, an accelerated filer, a non-accelerated filer, or a smaller reporting company. See the definitions of “large accelerated filer,” “accelerated filer” and “smaller reporting company” inRule 12b-2 of the Exchange Act. (Check one):
| | | |
| Large accelerated filer þ | Accelerated filer o | Non-accelerated filer o | Smaller reporting company o |
(Do not check if a smaller reporting company)
Indicate by check mark whether the registrant is a shell company (as defined inRule 12b-2 of the Exchange Act). Yes o No þ
Indicate the number of shares outstanding of each of the issuer’s classes of common stock, as of the latest practicable date.
| | | |
Class | | Outstanding at October 20, 2008 |
| |
| Common Stock, $0.01 per share par value | | 91,292,709 Shares |
Kansas City Southern
Form 10-Q
September 30, 2008
Index
2
Kansas City Southern
Form 10-Q
September 30, 2008
PART I — FINANCIAL INFORMATION
| |
| Item 1. | Financial Statements. |
Introductory Comments.
The Consolidated Financial Statements included herein have been prepared by Kansas City Southern, without audit, pursuant to the rules and regulations of the Securities and Exchange Commission (“SEC”). As used herein, “KCS” or the “Company” may refer to Kansas City Southern or, as the context requires, to one or more subsidiaries of Kansas City Southern. Certain information and footnote disclosures normally included in financial statements prepared in accordance with U.S. generally accepted accounting principles (“U.S. GAAP”) have been condensed, or omitted pursuant to such rules and regulations. The Company believes that the disclosures are adequate to enable a reasonable understanding of the information presented. These Consolidated Financial Statements should be read in conjunction with the consolidated financial statements and the related notes, as well as Management’s Discussion and Analysis of Financial Condition and Results of Operations, included in the Company’s Annual Report onForm 10-K for the year ended December 31, 2007, and Management’s Discussion and Analysis of Financial Condition and Results of Operations included in thisForm 10-Q. Results for the three and nine months ended September 30, 2008, are not necessarily indicative of the results expected for the full year ending December 31, 2008.
3
Kansas City Southern
| | | | | | | | | | | | | | | | | |
| | | Three Months
| | | Nine Months
| |
| | | Ended September 30, | | | Ended September 30, | |
| | | 2008 | | | 2007 | | | 2008 | | | 2007 | |
| | | (In millions, except share and per share amounts) | |
| | | (Unaudited) | |
| |
| Revenues | | $ | 491.5 | | | $ | 444.1 | | | $ | 1,428.3 | | | $ | 1,282.5 | |
| | | | | | | | | | | | | | | | | |
| Operating expenses: | | | | | | | | | | | | | | | | |
| Compensation and benefits | | | 92.2 | | | | 104.7 | | | | 296.6 | | | | 303.1 | |
| Purchased services | | | 51.0 | | | | 47.9 | | | | 145.6 | | | | 137.7 | |
| Fuel | | | 90.1 | | | | 66.6 | | | | 259.2 | | | | 194.8 | |
| Equipment costs | | | 45.1 | | | | 43.7 | | | | 138.8 | | | | 137.1 | |
| Depreciation and amortization | | | 43.0 | | | | 38.9 | | | | 124.5 | | | | 117.8 | |
| Casualties and insurance | | | 23.8 | | | | 15.9 | | | | 62.0 | | | | 52.8 | |
| Materials and other | | | 35.3 | | | | 28.2 | | | | 102.6 | | | | 85.5 | |
| | | | | | | | | | | | | | | | | |
| Total operating expenses | | | 380.5 | | | | 345.9 | | | | 1,129.3 | | | | 1,028.8 | |
| | | | | | | | | | | | | | | | | |
| Operating income | | | 111.0 | | | | 98.2 | | | | 299.0 | | | | 253.7 | |
| Equity in net earnings of unconsolidated affiliates | | | 5.0 | | | | 3.3 | | | | 13.8 | | | | 7.2 | |
| Interest expense | | | (35.5 | ) | | | (37.3 | ) | | | (102.7 | ) | | | (118.3 | ) |
| Debt retirement costs | | | — | | | | — | | | | (5.6 | ) | | | (6.9 | ) |
| Foreign exchange gain (loss) | | | (7.5 | ) | | | (1.9 | ) | | | 0.7 | | | | (1.6 | ) |
| Other income | | | 3.8 | | | | 2.0 | | | | 7.0 | | | | 5.9 | |
| | | | | | | | | | | | | | | | | |
| Income before income taxes and minority interest | | | 76.8 | | | | 64.3 | | | | 212.2 | | | | 140.0 | |
| Income tax expense | | | 25.1 | | | | 17.5 | | | | 67.2 | | | | 40.6 | |
| | | | | | | | | | | | | | | | | |
| Income before minority interest | | �� | 51.7 | | | | 46.8 | | | | 145.0 | | | | 99.4 | |
| Minority interest | | | 0.1 | | | | 0.1 | | | | 0.3 | | | | 0.3 | |
| | | | | | | | | | | | | | | | | |
| Net income | | | 51.6 | | | | 46.7 | | | | 144.7 | | | | 99.1 | |
| Preferred stock dividends | | | 2.7 | | | | 4.9 | | | | 12.4 | | | | 15.0 | |
| | | | | | | | | | | | | | | | | |
| Net income available to common shareholders | | $ | 48.9 | | | $ | 41.8 | | | $ | 132.3 | | | $ | 84.1 | |
| | | | | | | | | | | | | | | | | |
| Earnings per share: | | | | | | | | | | | | | | | | |
| Basic earnings per share | | $ | 0.55 | | | $ | 0.55 | | | $ | 1.62 | | | $ | 1.11 | |
| | | | | | | | | | | | | | | | | |
| Diluted earnings per share | | $ | 0.52 | | | $ | 0.48 | | | $ | 1.46 | | | $ | 1.00 | |
| | | | | | | | | | | | | | | | | |
Average shares outstanding (in thousands): | | | | | | | | | | | | | | | | |
| Basic | | | 88,400 | | | | 75,935 | | | | 81,618 | | | | 75,797 | |
| Potential dilutive common shares | | | 10,518 | | | | 21,716 | | | | 17,375 | | | | 14,781 | |
| | | | | | | | | | | | | | | | | |
| Diluted | | | 98,918 | | | | 97,651 | | | | 98,993 | | | | 90,578 | |
| | | | | | | | | | | | | | | | | |
See accompanying notes to consolidated financial statements.
4
Kansas City Southern
| | | | | | | | | |
| | | September 30,
| | | December 31,
| |
| | | 2008 | | | 2007 | |
| | | (In millions,
| |
| | | except share amounts) | |
| | | (Unaudited) | |
| |
ASSETS |
| Current assets: | | | | | | | | |
| Cash and cash equivalents | | $ | 96.5 | | | $ | 55.5 | |
| Accounts receivable, net | | | 218.9 | | | | 243.4 | |
| Restricted funds | | | 17.8 | | | | 11.5 | |
| Inventories | | | 98.4 | | | | 90.3 | |
| Deferred income taxes | | | 221.0 | | | | 177.8 | |
| Other current assets | | | 114.5 | | | | 67.2 | |
| | | | | | | | | |
| Total current assets | | | 767.1 | | | | 645.7 | |
| Investments | | | 68.8 | | | | 79.3 | |
| Property and equipment, net of accumulated depreciation of $894.1 million and $871.9 million at September 30, 2008 and December 31, 2007, respectively | | | 3,227.4 | | | | 2,917.8 | |
| Concession assets, net of accumulated amortization of $174.6 million and $129.2 million at September 30, 2008 and December 31, 2007, respectively | | | 1,199.4 | | | | 1,215.5 | |
| Other assets | | | 89.2 | | | | 69.9 | |
| | | | | | | | | |
| Total assets | | $ | 5,351.9 | | | $ | 4,928.2 | |
| | | | | | | | | |
| |
LIABILITIES AND STOCKHOLDERS’ EQUITY |
| Current liabilities: | | | | | | | | |
| Debt due within one year | | $ | 627.2 | | | $ | 650.9 | |
| Accounts and wages payable | | | 148.2 | | | | 121.1 | |
| Accrued liabilities | | | 318.3 | | | | 326.7 | |
| | | | | | | | | |
| Total current liabilities | | | 1,093.7 | | | | 1,098.7 | |
| | | | | | | | | |
| Other liabilities: | | | | | | | | |
| Long-term debt | | | 1,282.5 | | | | 1,105.0 | |
| Deferred income taxes | | | 624.3 | | | | 499.1 | |
| Other noncurrent liabilities and deferred credits | | | 213.2 | | | | 256.1 | |
| | | | | | | | | |
| Total other liabilities | | | 2,120.0 | | | | 1,860.2 | |
| | | | | | | | | |
| Minority interest | | | 262.1 | | | | 243.0 | |
| Commitments and contingencies | | | — | | | | — | |
| Stockholders’ equity: | | | | | | | | |
| $25 par, 4% noncumulative, preferred stock, 840,000 shares authorized, 649,736 shares issued, 242,170 shares outstanding | | | 6.1 | | | | 6.1 | |
| Series C — redeemable cumulative convertible perpetual preferred stock, $1 par, 4.25%, 400,000 shares authorized, issued, and outstanding at December 31, 2007 | | | — | | | | 0.4 | |
| Series D — cumulative convertible perpetual preferred stock, $1 par, 5.125%, 210,000 shares authorized and issued, 209,995 and 210,000 shares outstanding with a liquidation preference of $210.0 million at September 30, 2008 and December 31, 2007, respectively | | | 0.2 | | | | 0.2 | |
| $.01 par, common stock, 400,000,000 shares authorized; 106,252,860 and 92,863,585 shares issued at September 30, 2008 and December 31, 2007, respectively; 91,262,938 and 76,975,507 shares outstanding at September 30, 2008 and December 31, 2007,respectively | | | 0.9 | | | | 0.8 | |
| Paid in capital | | | 566.0 | | | | 549.5 | |
| Retained earnings | | | 1,301.2 | | | | 1,168.9 | |
| Accumulated other comprehensive income | | | 1.7 | | | | 0.4 | |
| | | | | | | | | |
| Total stockholders’ equity | | | 1,876.1 | | | | 1,726.3 | |
| | | | | | | | | |
| Total liabilities and stockholders’ equity | | $ | 5,351.9 | | | $ | 4,928.2 | |
| | | | | | | | | |
See accompanying notes to consolidated financial statements.
5
Kansas City Southern
| | | | | | | | | |
| | | Nine Months Ended
| |
| | | September 30, | |
| | | 2008 | | | 2007 | |
| | | (In millions) | |
| | | (Unaudited) | |
| |
Operating activities: | | | | | | | | |
| Net income | | $ | 144.7 | | | $ | 99.1 | |
| Adjustments to reconcile net income to net cash provided by operating activities: | | | | | | | | |
| Depreciation and amortization | | | 124.5 | | | | 117.8 | |
| Deferred income taxes | | | 66.0 | | | | 40.4 | |
| Equity in undistributed earnings of unconsolidated affiliates | | | (13.8 | ) | | | (7.2 | ) |
| Share-based and other deferred compensation | | | 13.6 | | | | 17.0 | |
| Minority interest | | | 0.3 | | | | 0.3 | |
| Distributions from unconsolidated affiliates | | | 14.3 | | | | — | |
| Loss (gain) on sale of assets | | | (1.9 | ) | | | (1.4 | ) |
| Excess tax benefit from share-based compensation | | | (2.0 | ) | | | — | |
| Debt retirement costs | | | 5.6 | | | | 6.9 | |
| Changes in working capital items: | | | | | | | | |
| Accounts receivable | | | 24.5 | | | | 49.8 | |
| Inventories | | | (8.1 | ) | | | (15.4 | ) |
| Other current assets | | | (49.1 | ) | | | 18.9 | |
| Accounts payable and accrued liabilities | | | 18.7 | | | | (46.4 | ) |
| Other, net | | | (4.2 | ) | | | 16.5 | |
| | | | | | | | | |
| Net cash provided by operating activities | | | 333.1 | | | | 296.3 | |
| | | | | | | | | |
Investing activities: | | | | | | | | |
| Capital expenditures | | | (415.6 | ) | | | (213.0 | ) |
| Proceeds from disposal of property | | | 17.6 | | | | 9.4 | |
| Contribution from NS for MSLLC (net of change in restricted contribution) | | | 18.8 | | | | 100.0 | |
| Property investments in MSLLC | | | (19.4 | ) | | | (87.7 | ) |
| Other, net | | | (18.7 | ) | | | (4.2 | ) |
| | | | | | | | | |
| Net cash used for investing activities | | | (417.3 | ) | | | (195.5 | ) |
| | | | | | | | | |
Financing activities: | | | | | | | | |
| Proceeds from issuance of long-term debt | | | 399.9 | | | | 286.7 | |
| Repayment of long-term debt | | | (258.9 | ) | | | (312.9 | ) |
| Debt costs | | | (12.7 | ) | | | (19.7 | ) |
| Proceeds from stock plans | | | 7.3 | | | | 0.7 | |
| Excess tax benefit from share-based compensation | | | 2.0 | | | | — | |
| Dividends paid | | | (12.4 | ) | | | (18.4 | ) |
| | | | | | | | | |
| Net cash provided by (used for) financing activities | | | 125.2 | | | | (63.6 | ) |
| | | | | | | | | |
| Cash and cash equivalents: | | | | | | | | |
| Net increase during each period | | | 41.0 | | | | 37.2 | |
| At beginning of year | | | 55.5 | | | | 79.0 | |
| | | | | | | | | |
| At end of period | | $ | 96.5 | | | $ | 116.2 | |
| | | | | | | | | |
See accompanying notes to consolidated financial statements.
6
Kansas City Southern
| |
| 1. | Accounting Policies and Interim Financial Statements. |
In the opinion of the management of KCS, the accompanying unaudited consolidated financial statements contain all adjustments necessary, which are of a normal and recurring nature, to present fairly the financial position of the Company as of September 30, 2008, and December 31, 2007, the results of operations for the three and nine months ended September 30, 2008 and 2007, and cash flows for the nine months ended September 30, 2008 and 2007. Certain information and footnote disclosure normally included in financial statements prepared in accordance with U.S. GAAP have been condensed or omitted. These consolidated financial statements should be read in conjunction with the financial statements and accompanying notes included in the Company’s Annual Report onForm 10-K for the year ended December 31, 2007. The results of operations for the three and nine months ended September 30, 2008, are not necessarily indicative of the results to be expected for the full year ending December 31, 2008. Certain prior year amounts have been reclassified to conform to the current year presentation.
| |
| 2. | Share-Based Compensation. |
At a special stockholders’ meeting held on October 7, 2008, the Company’s stockholders approved a new 2008 Stock Option and Performance Award Plan (the “2008 Plan”), which became effective on October 14, 2008. Future equity awards by the Company will be granted under, and governed by, the 2008 Plan and the related award agreements. Outstanding equity awards granted under the Company’s 1991 Amended and Restated Stock Option and Performance Award Plan (the “1991 Plan”), which expired on October 14, 2008, will continue to be governed by the terms and conditions of the 1991 Plan and the related award agreements.
Nonvested Stock. The 1991 Plan provides for the granting of nonvested stock awards to officers and other designated employees. The grant date fair value is based on the average market price of the stock on the date of the grant. These awards are subject to forfeiture if employment terminates during the vesting period, which is generally five year or three year cliff vesting for employees and one year for non-employee directors. The grant date fair value of nonvested shares, less estimated forfeitures, is recorded to compensation expense on a straight-line basis over the vesting period.
A summary of nonvested stock activity is as follows:
| | | | | | | | | | | | | |
| | | | | | Weighted-
| | | | |
| | | | | | Average
| | | Aggregate
| |
| | | Number of
| | | Grant Date
| | | Intrinsic
| |
Nine Months Ended September 30, 2008 | | Shares | | | Fair Value | | | Value | |
| | | | | | | | | In millions | |
| |
| Nonvested stock at December 31, 2007 | | | 1,014,628 | | | $ | 28.80 | | | | | |
| Granted | | | 221,679 | | | | 38.49 | | | | | |
| Vested | | | (133,329 | ) | | | 30.49 | | | | | |
| Forfeited | | | (274,843 | ) | | | 26.93 | | | | | |
| | | | | | | | | | | | | |
| Nonvested stock at September 30, 2008 | | | 828,135 | | | $ | 31.74 | | | $ | 36.7 | |
| | | | | | | | | | | | | |
Compensation cost on nonvested stock was $1.8 million and $1.4 million for the three months ended September 30, 2008 and 2007, and $3.5 million and $4.7 million for the nine months ended September 30, 2008 and 2007, respectively. The total income tax benefit recognized in the income statement for nonvested stock awards was $0.6 million and $0.5 million for the three months ended September 30, 2008 and 2007, and $1.3 million and $1.7 million for the nine months ended September 30, 2008 and 2007, respectively.
As of September 30, 2008, $15.7 million of unrecognized compensation costs related to nonvested stock is expected to be recognized over a weighted-average period of 1.53 years. The fair value (at vest date) of shares vested during the nine months ended September 30, 2008 was $5.1 million.
7
Kansas City Southern
Notes to Consolidated Financial Statements — (Continued)
Performance Based Awards. During 2007, the Company granted performance based nonvested stock awards. The awards granted establish an annual target number of shares that generally vest at the end of a three year requisite service period following the grant date. In addition to the three year service condition, the number of nonvested shares to be received depends on the attainment of performance goals based on the following annual measures: operating ratio, earnings before interest, tax, depreciation and amortization (EBITDA) and return on capital employed. The number of nonvested shares ultimately earned will range from zero to 200% of the annual target award.
A summary of performance based nonvested awards activity at target is as follows:
| | | | | | | | | |
| | | Target Number of
| | | Weighted-Average Grant
| |
Nine Months Ended September 30, 2008 | | Shares * | | | Date Fair Value | |
| |
| Nonvested stock at December 31, 2007 | | | 477,638 | | | $ | 30.82 | |
| Granted | | | 74,228 | | | | 39.14 | |
| Vested | | | (46,988 | ) | | | 30.13 | |
| Forfeited | | | (124,666 | ) | | | 29.93 | |
| | | | | | | | | |
| Nonvested stock at September 30, 2008 | | | 380,212 | | | $ | 32.82 | |
| | | | | | | | | |
| | |
| * | | The performance shares earned in 2007 were 122,983, which was approximately 120% of the annual target award granted for the 2007 performance period. Over the remaining two year performance period, participants in the aggregate can earn up to a maximum of 649,760 shares. |
The Company expenses the grant date fair value of the awards which are probable of being earned based on forecasted annual performance goals over the three year performance period. Compensation expense on performance based awards was less than $0.1 million and $0.7 million for the three months ended September 30, 2008 and 2007, and $1.3 million and $2.0 million for the nine months ended September 30, 2008 and 2007, respectively. The total income tax benefit recognized in the income statement for performance based awards was less than $0.1 million and $0.2 million for the three months ended September 30, 2008 and 2007, and $0.5 million and $0.7 million for the nine months ended September 30, 2008 and 2007, respectively.
As of September 30, 2008, $2.0 million of unrecognized compensation cost related to performance based awards is expected to be recognized over a weighted-average period of .72 years. The unrecognized compensation cost includes only the amount determined to be probable of being earned based upon the attainment of the annual performance goals. The fair value (at vest date) of shares vested during the nine months ended September 30, 2008 was $1.4 million.
| |
| 3. | Earnings Per Share Data. |
Basic earnings per common share is computed by dividing income available to common stockholders by the weighted average number of common shares outstanding for the period. Restricted stock granted to employees and officers is included in weighted average shares for purposes of computing basic earnings per common share as it is earned. Diluted earnings per share reflect the potential dilution that could occur if convertible securities were converted into common stock or stock options were exercised. The following table reconciles the weighted average shares used for the basic earnings per share computation to the shares used for the diluted earnings per share computation(in thousands):
| | | | | | | | | | | | | | | | | |
| | | Three Months
| | | Nine Months
| |
| | | Ended September 30, | | | Ended September 30, | |
| | | 2008 | | | 2007 | | | 2008 | | | 2007 | |
| |
| Basic shares | | | 88,400 | | | | 75,935 | | | | 81,618 | | | | 75,797 | |
| Effect of dilution | | | 10,518 | | | | 21,716 | | | | 17,375 | | | | 14,781 | |
| | | | | | | | | | | | | | | | | |
| Diluted shares | | | 98,918 | | | | 97,651 | | | | 98,993 | | | | 90,578 | |
| | | | | | | | | | | | | | | | | |
8
Kansas City Southern
Notes to Consolidated Financial Statements — (Continued)
Potentially dilutive shares excluded from the calculation(in thousands):
| | | | | | | | | | | | | | | | | |
| | | Three Months Ended
| | | Nine Months Ended
| |
| | | September 30, | | | September 30, | |
| | | 2008 | | | 2007 | | | 2008 | | | 2007 | |
| |
| Stock options where the exercise price is greater than the average market price of common shares | | | 15 | | | | 72 | | | | 15 | | | | 72 | |
| Convertible preferred stock which is anti-dilutive | | | — | | | | — | | | | — | | | | 7,000 | |
The following table reconciles net income available to common stockholders for purposes of basic earnings per share to net income available to common stockholders for purposes of diluted earnings per share(in millions):
| | | | | | | | | | | | | | | | | |
| | | Three Months Ended
| | | Nine Months Ended
| |
| | | September 30, | | | September 30, | |
| | | 2008 | | | 2007 | | | 2008 | | | 2007 | |
| |
| Net income available to common stockholders for purposes of computing basic earnings per share | | $ | 48.9 | | | $ | 41.8 | | | $ | 132.3 | | | $ | 84.1 | |
| Effect of dividends on conversion of convertible preferred stock | | | 2.7 | | | | 4.8 | | | | 12.3 | | | | 6.5 | |
| | | | | | | | | | | | | | | | | |
| Net income available to common stockholders for purposes of computing diluted earnings per share | | $ | 51.6 | | | $ | 46.6 | | | $ | 144.6 | | | $ | 90.6 | |
| | | | | | | | | | | | | | | | | |
| |
| 4. | Fair Value Measurements. |
In September 2006, the Financial Accounting Standards Board (the “FASB”) issued Statement of Financial Accounting Standards No. 157 “Fair Value Measurements” (“SFAS 157”), which defines fair value, establishes a framework for measuring fair value and enhances disclosures regarding fair value measurements. SFAS 157 does not require any new fair value measurements but rather eliminates inconsistencies in guidance found in various prior accounting pronouncements and is effective for fiscal years beginning after November 15, 2007. In February 2008, the FASB issued FASBFSP 157-2 which delays the effective date of SFAS 157 for all nonfinancial assets and nonfinancial liabilities, except those that are recognized or disclosed at fair value in the financial statements on a recurring basis (at least annually), until fiscal years beginning after November 15, 2008, and interim periods within those fiscal years. These nonfinancial items include assets and liabilities such as reporting units measured at fair value in a goodwill impairment test and nonfinancial assets acquired and liabilities assumed in a business combination. Effective January 1, 2008, KCS adopted SFAS 157 prospectively for financial assets and liabilities recognized at fair value on a recurring basis. The partial adoption of SFAS 157 for financial assets and liabilities did not have a material impact on KCS’ consolidated financial position, results of operations or cash flows.
SFAS 157 Hierarchy Tables. The following tables present information about the Company’s financial assets and liabilities measured at fair value on a recurring basis as of September 30, 2008, and indicates the fair value hierarchy of the valuation techniques utilized by the Company to determine such fair value. In general, fair values determined by Level 1 inputs utilize quoted prices (unadjusted) in active markets for identical assets or liabilities that the Company has the ability to access. Level 2 inputs include quoted prices for similar assets and liabilities in active markets, and inputs other than quoted prices that are observable for the asset or liability. Level 3 inputs are unobservable inputs for the asset or liability, and include situations where there is little, if any, market activity for the asset or liability. In certain cases, the inputs used to measure fair value may fall into different levels of the fair value hierarchy. In such cases, the level in the fair value hierarchy within which the fair value measurement in its entirety falls has been determined based on the lowest level input that is significant to the fair value measurement in its entirety. The Company’s assessment
9
Kansas City Southern
Notes to Consolidated Financial Statements — (Continued)
of the significance of a particular input to the fair value in its entirety requires judgment and considers factors specific to the asset or liability.
Assets and liabilities measured at fair value on a recurring basis as of September 30, 2008(in millions):
| | | | | | | | | | | | | | | | | |
| | | Fair Value Measurements | | | Assets at
| |
| | | Level 1 | | | Level 2 | | | Level 3 | | | Fair Value | |
| |
| Assets: | | | | | | | | | | | | | | | | |
| Investments(i) | | $ | — | | | $ | — | | | $ | 16.3 | | | $ | 16.3 | |
| Derivative financial instruments | | | — | | | | 2.3 | | | | — | | | | 2.3 | |
| | | | | | | | | | | | | | | | | |
| | | $ | — | | | $ | 2.3 | | | $ | 16.3 | | | $ | 18.6 | |
| | | | | | | | | | | | | | | | | |
| | |
| (i) | | Investments with Level 1 and/or Level 2 inputs are classified as a Level 3 investment in their entirety if it has at least one significant Level 3 input. |
The following table presents additional information about assets and liabilities measured at fair value on a recurring basis for which the Company has utilized Level 3 inputs to determine fair value.
Changes in Level 3 assets measured at fair value on a recurring basis for the three months ended September 30, 2008(in millions):
| | | | | |
| Balance at June 30, 2008 | | $ | 17.1 | |
| Total gains/(losses) (realized and unrealized) | | | — | |
| Purchases, issuances and settlements | | | (0.8 | ) |
| Transfers in and/or out of level 3 | | | — | |
| | | | | |
| Balance at September 30, 2008 | | $ | 16.3 | |
| | | | | |
Changes in Level 3 assets measured at fair value on a recurring basis for the nine months ended September 30, 2008(in millions):
| | | | | |
| Balance at December 31, 2007 | | $ | 37.8 | |
| Total gains/(losses) (realized and unrealized) | | | — | |
| Purchases, issuances and settlements | | | (21.5 | ) |
| Transfers in and/or out of level 3 | | | — | |
| | | | | |
| Balance at September 30, 2008 | | $ | 16.3 | |
| | | | | |
| |
| 5. | Derivative Instruments. |
The Company does not engage in the trading of derivative financial instruments except where the Company’s objective is to manage fuel price risk, foreign currency fluctuations, or the variability of forecasted interest payments attributable to changes in interest rates. In general, the Company enters into derivative transactions in limited situations based on management’s assessment of current market conditions and perceived risks. However, management intends to respond to evolving business and market conditions and in doing so, may enter into such transactions more frequently as deemed appropriate.
Forward starting interest rate swap. On March 18, 2008, the Company entered into a forward starting interest rate swap, which has been designated as a cash flow hedge under the Statement of Financial Accounting Standards No. 133, “Accounting for Derivative Instruments and Hedging Activities” (“SFAS 133”). The forward starting interest rate swap effectively converts interest payments from variable rates to fixed rates. The hedging instrument has a notional amount of $75.0 million and forward starting settlements indexed off the three-month London InterBank Offered Rate (“LIBOR”) will occur every quarter through March 28, 2011.
10
Kansas City Southern
Notes to Consolidated Financial Statements — (Continued)
On September 16, 2008, the Company entered into a forward starting interest rate swap, which has been designated as a cash flow hedge under SFAS 133. The forward starting interest rate swap effectively converts interest payments from variable rates to fixed rates. The hedging instrument has a notional amount of $50.0 million and forward starting settlements indexed off the three-month LIBOR will occur every quarter beginning September 30, 2008 through September 30, 2010.
The aforementioned swaps are highly effective as defined by SFAS 133 and as a result there will be de minimus income statement variability associated with ineffectiveness of these hedges. At September 30, 2008, the estimated fair value of the forward starting interest rate swaps was an unrealized gain of $2.3 million and was recognized in other assets in the consolidated balance sheet.
Foreign Currency Balance. At September 30, 2008, Kansas City Southern de Mexico, S.A. de C.V., a wholly-owned subsidiary of KCS (“KCSM”), had financial assets and liabilities denominated in Mexican pesos of Ps.1,917 million and Ps.697 million, respectively. At December 31, 2007, KCSM had financial assets and liabilities denominated in Mexican pesos of Ps.1,921 million and Ps.595 million, respectively. At September 30, 2008 and December 31, 2007, the exchange rate was Ps.10.79 per U.S. dollar and Ps.10.90 per U.S. dollar, respectively.
Other comprehensive income refers to revenues, expenses, gains and losses that under U.S. GAAP are included in comprehensive income, a component of stockholders’ equity within the consolidated balance sheets, rather than net income. Under existing accounting standards, other comprehensive income for KCS reflects the net unrealized gain on cash flow hedge, net of tax, and amortization of prior service credit, net of tax.
KCS’ total comprehensive income is as follows(in millions):
| | | | | | | | | | | | | | | | | |
| | | Three Months Ended
| | | Nine Months Ended
| |
| | | September 30, | | | September 30, | |
| | | 2008 | | | 2007 | | | 2008 | | | 2007 | |
| |
| Net income | | $ | 51.6 | | | $ | 46.7 | | | $ | 144.7 | | | $ | 99.1 | |
| Other comprehensive income: | | | | | | | | | | | | | | | | |
| Net unrealized gain on cash flow hedges, net of tax | | | 0.1 | | | | — | | | | 1.4 | | | | — | |
| Amortization of prior service credit, net of tax | | | (0.1 | ) | | | (0.1 | ) | | | (0.1 | ) | | | (0.1 | ) |
| | | | | | | | | | | | | | | | | |
| Total comprehensive income | | $ | 51.6 | | | $ | 46.6 | | | $ | 146.0 | | | $ | 99.0 | |
| | | | | | | | | | | | | | | | | |
On September 24, 2008, KCSM entered into a financing agreement (the “Agreement”) with DVB Bank AG (“DVB”). KCSM received the loan principal amount under the Agreement of $52.2 million on September 26, 2008. KCSM used the proceeds to finance approximately 80% of the purchase price oftwenty-nine ES44AC locomotives (the “Locomotives”) delivered and purchased by KCSM in June 2008. KCSM granted DVB a security interest in the Locomotives to secure the loan. The Agreement requires KCSM to make sixty equal quarterly principal payments plus interest at an annual rate of 6.195%. The first payment is due and payable on December 31, 2008, and the final payment is due and payable on September 29, 2023.
The Agreement contains representations, warranties and covenants typical of such equipment loan agreements. Events of default in the Agreement include, but are not limited to, certain payment defaults, certain bankruptcy and liquidation proceedings and the failure to perform any covenants or agreements
11
Kansas City Southern
Notes to Consolidated Financial Statements — (Continued)
contained in the Agreement. Any event of default could trigger acceleration of KCSM’s payment obligations under the terms of the Agreement.
| |
| 8. | Redemption of Series C Redeemable Cumulative Convertible Perpetual Preferred Stock. |
On June 12, 2008, the Company called for redemption all of the outstanding shares of its 4.25% Series C Redeemable Cumulative Convertible Perpetual Preferred Stock (the “Series C Preferred Stock”) with a redemption date of July 15, 2008 (the “Redemption Date”). The holders of the outstanding shares had the option to redeem at a redemption price of $500 per share or convert each share into 33.4728 shares of KCS common stock. Each share converted is also entitled to receive an appropriate number of common stock or other preferred stock purchase rights under KCS’ 2005 Rights Agreement. As of the Redemption Date, holders had converted all 400,000 shares of Series C Preferred Stock into 13,389,109 shares of common stock.
| |
| 9. | Commitments and Contingencies. |
Litigation. The Company is a party to various legal proceedings and administrative actions, all of which, except as set forth below, are of an ordinary, routine nature and incidental to its operations. Included in these proceedings are various tort claims brought by current and former employees for job related injuries and by third parties for injuries related to railroad operations. KCS aggressively defends these matters and has established liability reserves, which management believes are adequate to cover expected costs. Although it is not possible to predict the outcome of any legal proceeding, in the opinion of management, other than those proceedings described in detail below, such proceedings and actions should not, individually, or in the aggregate, have a material adverse effect on the Company’s financial condition and liquidity. However, a material adverse outcome in one or more of these proceedings could have a material adverse impact on the operating results of a particular quarter or fiscal year.
Environmental Liabilities. The Company’s U.S. operations are subject to extensive federal, state and local environmental laws and regulations. The major U.S. environmental laws to which the Company is subject include, among others, the Federal Comprehensive Environmental Response, Compensation and Liability Act (“CERCLA,” also known as the Superfund law), the Toxic Substances Control Act, the Federal Water Pollution Control Act, and the Hazardous Materials Transportation Act. CERCLA can impose joint and several liabilities for cleanup and investigation costs, without regard to fault or legality of the original conduct, on current and predecessor owners and operators of a site, as well as those who generate, or arrange for the disposal of, hazardous substances. The Company does not believe that compliance with the requirements imposed by the environmental legislation will impair its competitive capability or result in any material additional capital expenditures, operating or maintenance costs. The Company is, however, subject to environmental remediation costs as described below.
The Company’s Mexico operations are subject to Mexican federal and state laws and regulations relating to the protection of the environment through the establishment of standards for water discharge, water supply, emissions, noise pollution, hazardous substances and transportation and handling of hazardous and solid waste. The Mexican government may bring administrative and criminal proceedings and impose economic sanctions against companies that violate environmental laws, and temporarily or even permanently close non-complying facilities.
The risk of incurring environmental liability is inherent in the railroad industry. As part of serving the petroleum and chemicals industry, the Company transports hazardous materials and has a professional team available to respond to and handle environmental issues that might occur in the transport of such materials. Additionally, the Company is a partner in the Responsible Care® program and, as a result, has initiated additional environmental, health and safety programs. The Company performs ongoing reviews and evaluations of the various environmental programs and issues within the Company’s operations, and, as necessary, takes actions intended to limit the Company’s exposure to potential liability.
12
Kansas City Southern
Notes to Consolidated Financial Statements — (Continued)
The Company owns property that is, or has been, used for industrial purposes. Use of these properties may subject the Company to potentially material liabilities relating to the investigation and cleanup of contaminants, claims alleging personal injury, or property damage as the result of exposures to, or release of, hazardous substances. Although the Company is responsible for investigating and remediating contamination at several locations, based on currently available information, the Company does not expect any related liabilities, individually or collectively, to have a material impact on its financial position or cash flows. Should the Company become subject to more stringent cleanup requirements at these sites, discover additional contamination, or become subject to related personal or property damage claims, the Company could incur material costs in connection with these sites.
The Company records liabilities for remediation and restoration costs related to past activities when the Company’s obligation is probable and the costs can be reasonably estimated. Costs of ongoing compliance activities to current operations are expensed as incurred. The Company’s recorded liabilities for these issues represent its best estimates (on an undiscounted basis) of remediation and restoration costs that may be required to comply with present laws and regulations. Although these costs cannot be predicted with certainty, management believes that the ultimate outcome of identified matters will not have a material adverse effect on the Company’s consolidated financial position or cash flows.
Environmental remediation expense was $3.7 million and $5.3 million for the nine months ended September 30, 2008 and 2007, respectively, and was included in Casualties and insurance expense on the consolidated statements of income. Additionally, as of September 30, 2008, KCS had a liability for environmental remediation of $6.6 million. This amount was derived from a range of reasonable estimates based upon the studies and site surveys described above and in accordance with the Statement of Financial Accounting Standards No. 5, “Accounting for Contingencies” (“SFAS 5”).
Casualty Claim Reserves. The Company’s casualty and liability reserve is based on actuarial studies performed on an undiscounted basis. This reserve is based on personal injury claims filed and an estimate of claims incurred but not yet reported. While the ultimate amount of claims incurred is dependent on various factors, it is management’s opinion that the recorded liability is a reasonable estimate of aggregate future payments. Adjustments to the liability are reflected as operating expenses in the period in which changes to estimates are known. Casualty claims in excess of self-insurance levels are insured up to certain coverage amounts, depending on the type of claim and year of occurrence. The activity in the reserve follows(in millions):
| | | | | | | | | |
| | | Nine Months Ended
| |
| | | September 30, | |
| | | 2008 | | | 2007 | |
| |
| Balance at beginning of year | | $ | 90.0 | | | $ | 117.4 | |
| Accruals, net (includes the impact of actuarial studies) | | | 15.5 | | | | 19.5 | |
| Payments | | | (10.2 | ) | | | (49.8 | ) |
| | | | | | | | | |
| Balance at end of period | | $ | 95.3 | | | $ | 87.1 | |
| | | | | | | | | |
The casualty claim reserve balance as of September 30, 2008 is based on an updated study of casualty reserves for data through May 31, 2008 and review of the last four month’s experience. The activity for the nine months ended September 30, 2008 primarily relates to the net settlements and the reserves for Federal Employers Liability Act (“FELA”), third-party, and occupational illness claims. The changes to the reserve in the current year compared to the prior year primarily reflect a large litigation settlement in 2007 and the current accruals related to the trend of loss experience since the date of the prior study.
Reflecting potential uncertainty surrounding the outcome of casualty claims, it is reasonably possible based on assessments that future costs to settle casualty claims may range from approximately $89 million to $104 million. While the final outcome of these claims cannot be predicted with certainty, management
13
Kansas City Southern
Notes to Consolidated Financial Statements — (Continued)
believes that the $95.3 million recorded is the best estimate of the Company’s future obligations for the settlement of casualty claims at September 30, 2008. The most sensitive assumptions for personal injury accruals are the expected average cost per claim and the projected frequency rates for the number of claims that will ultimately result in payment. A 5% increase or decrease in either the expected average cost per claim or the frequency rate for claims with payments would result in an approximate $4.8 million increase or decrease in the Company’s recorded personal injury reserves.
Management believes that previous reserve estimates for prior claims were reasonable based on current information available. The Company is continuing its practice of accruing monthly for estimated claim costs, including any changes recommended by studies performed and evaluation of recent known trends; based on this practice, management believes all accruals are appropriately reflected.
Antitrust Lawsuit. As of September 30, 2008, 29 putative class actions were on file against KCSR, along with the other Class I U.S. railroads (and, in some cases, the Association of American Railroads), in various Federal district courts alleging that the railroads conspired to fix fuel surcharges in violation of U.S. antitrust laws. On November 6, 2007, the Judicial Panel on Multidistrict Litigation ordered that these putative class action cases be consolidated for pretrial handling before the United States District Court for the District of Columbia, where the matters remain pending (“the Multidistrict Litigation”). All of the plaintiffs in the Multidistrict Litigation filed a Consolidated Amended Complaint on April 15, 2008. KCSR was not named as a defendant in that Consolidated Amended Complaint pursuant to an agreement with the Multidistrict Litigation plaintiffs to toll the statute of limitations, and the Multidistrict Litigation will not proceed with KCSR as a party. In any event, KCSR maintains there is no merit to the price fixing allegations asserted against the Company. If KCSR is named as a defendant in lawsuits making such claims in the future, either in the Multidistrict Litigation or otherwise, the Company intends to vigorously contest such allegations.
The New Jersey Attorney General’s office, which had sought information regarding fuel surcharges from KCSR and other railroads, has informed KCSR that it is discontinuing its investigation of KCSR with respect to fuel surcharges.
Certain Disputes with Ferromex. KCSM andFerrocarril Mexicano, S.A. de C.V.(“Ferromex”) both initiated administrative proceedings seeking a determination by the MexicanSecretaría de Comunicaciones y Transportes(“Ministry of Communications and Transportation” or “SCT”) of the rates that the companies should pay each other in connection with the use of trackage rights, interline and terminal services. The SCT issued a ruling setting the rates for trackage rights in March of 2002, and a ruling setting the rates for interline and terminal services in August of 2002. KCSM and Ferromex challenged both rulings.
Following the trial and appellate court decisions, in February of 2006 the Mexican Supreme Court sustained KCSM’s appeal of the SCT’s trackage rights ruling, in effect vacating the ruling and ordering the SCT to issue a new ruling consistent with the Court’s decision. On June 27, 2008, KCSM was served with the new ruling issued by the SCT. In this ruling, the SCT established the consideration that KCSM and Ferromex must pay each other in connection with the use of the trackage rights granted in their respective concessions between 2002 and 2004, and further stated that in the event KCSM and Ferromex failed to reach an agreement in connection with the rates for the years after 2004, the SCT shall make a determination along the same lines. On September 19, 2008, KCSM appealed this new ruling with the MexicanTribunal Federal de Justicia Fiscal y Administrativa(“Administrative and Fiscal Federal Court”).
In April 2005, the Administrative and Fiscal Federal Court ruled in favor of KCSM in the challenge to the SCT interline and terminal services decision. Ferromex, however, challenged this court ruling before the Fifteenth Collegiate Court, and the Court ruled in its favor. Both Ferromex and KCSM have challenged the rulings on different grounds. This most recent challenge is now before the Mexican Supreme Court, which as of the date of this filing has yet to issue a decision on the matter.
14
Kansas City Southern
Notes to Consolidated Financial Statements — (Continued)
In addition to the above, Ferromex has filed three commercial proceedings against KCSM. In the first claim, which was served in 2001 and is related to the payment of consideration for interline services, KCSM received a favorable decision and Ferromex has been ordered to pay related costs and expenses. Although it has not yet done so, Ferromex has the right to challenge this decision. KCSM received an unfavorable decision in the second claim filed in 2004 and has filed a challenge to this judgment, the outcome of which is still pending. The third claim, filed in 2006, is an action for access to records related to interline services between 2002 and 2004. No decision has been rendered on the third claim. KCSM is continually analyzing all of the records related to this dispute to determine the adequacy of the reserves for the amounts due to as well as due from Ferromex.
KCSM expects various proceedings and appeals related to the matters described above to continue over the next few years. Although KCSM and Ferromex have challenged these matters based on different grounds and these cases continue to evolve, management believes the reserves related to these matters are adequate and does not believe there will be a future material impact to the results of operations arising out of these disputes.
Disputes Relating to the Provision of Services to a Large U.S. Auto Manufacturer. KCSM is involved in several disputes related to providing service to a large U.S. Auto Manufacturer (the “Auto Manufacturer”).
In March 2008, the Auto Manufacturer filed an arbitration suit against KCSM under a contract entered into in 1999 for services to the Auto Manufacturer’s plants in Mexico, which, as amended, had a stated termination date of January 31, 2008. The Auto Manufacturer claims that the contract was implicitly extended and continued in effect beyond its stated termination date, and that KCSM is therefore required to continue abiding by its terms, including, but not limited to, the rates contemplated in such contract. KCSM claims that the contract did in fact expire on its stated termination date of January 31, 2008, and that services rendered thereafter are thus subject to the general terms and conditions (including rates) applicable in the absence of a specific contract, pursuant to Mexican law. Accordingly, KCSM filed a counterclaim against the Auto Manufacturer to, among other things, recover the applicable rate difference. The Auto Manufacturer is also seeking a declaration by the arbitrator that the rates being assessed by KCSM are discriminatory, even though the rates being charged are within the legal rate limits set by Mexican law for such freight transportation. KCSM believes that the facts of this dispute provide it with strong legal arguments and intends to vigorously defend its claims in this proceeding. As a result, management believes the final resolution of these claims will not have any material impact on KCSM’s results of operations.
In May 2008, the SCT initiated a proceeding against KCSM, at the Auto Manufacturer’s request, alleging that KCSM impermissibly bundled international rail services and engaged in discriminatory pricing practices with respect to rail services provided by KCSM to the Auto Manufacturer. If the SCT finally determines that KCSM did engage in such actions, the SCT could impose sanctions on KCSM. On July 23, 2008, the SCT delivered notice to KCSM of new proceedings against KCSM, claiming, among other things, that KCSM refused to grant Ferromex access to certain trackage rights in Coahuila on six different occasions and thus denied Ferromex the ability to provide service to the Auto Manufacturer at this location.
Management believes it has strong defenses to all of these charges and intends to defend all these proceedings vigorously. KCSM does not believe that these SCT proceedings will have a material adverse effect on its results of operations or financial condition. However, if KCSM is ultimately sanctioned in connection with the bundling and discriminatory pricing practices alleged by the Auto Manufacturer, any such sanction would be considered a “generic” sanction under Mexican law (i.e., sanctions applied to conduct not specifically referred to in specific subsections of the Mexican railway law). If challenges against any such sanction are conclusively ruled adversely to KCSM and a sanction is effectively imposed, and if the SCT imposes other “generic” sanctions on four additional occasions over the remaining term of the Concession, KCSM could be subject to possible future SCT action seeking revocation of its Concession. Likewise, if each of the six refusals to allow Ferromex to serve the Auto Manufacturer in Coahuila is finally decided to warrant a separate sanction, KCSM could be subject to a future SCT action seeking revocation of its Concession.
15
Kansas City Southern
Notes to Consolidated Financial Statements — (Continued)
Revocation of the Concession would materially adversely affect KCSM’s results of operations and financial condition.
Disputes Relating to the Scope of the Mandatory Trackage Rights. KCSM and Ferromex are parties to various cases involving disputes over the application and proper interpretation of the mandatory trackage rights. In particular, in August 2002, the SCT issued a ruling related to Ferromex’s trackage rights in Monterrey, Nuevo León. KCSM and Ferromex both appealed the SCT’s ruling and after considerable litigation, on September 17, 2008, the Mexican Administrative and Fiscal Federal Court announced a decision, which if upheld, would grant Ferromex rights that KCSM believes to be broader than those set forth in both its and Ferromex’s concession titles. KCSM further believes that this decision conflicts with current applicable law and with relevant judicial precedents and intends to challenge it and to continue to pursue all other remedies available to it. KCSM believes that there will be no material adverse effect on KCSM’s results of operations or financial condition from the outcome of this case.
Other SCT Sanction Proceedings. In April 2006, the SCT initiated proceedings against KCSM, claiming that KCSM had failed to make certain minimum capital investments projected for 2004 and 2005 under its five-year business plan filed with the SCT prior to its April 2005 acquisition by Kansas City Southern or “KCS” (collectively, the “Capital Investment Proceedings”). KCSM believes it made capital expenditures exceeding the required amounts. KCSM responded to the SCT by providing evidence in support of its investments and explaining why it believes sanctions are not appropriate. In May 2007, KCSM was served with an SCT resolution regarding the Capital Investment Proceeding for 2004, where the SCT determined that KCSM had indeed failed to make the minimum capital investments required for such year, but resolved to impose no sanction as this would have been KCSM’s first breach of the relevant legal provisions. In June 2007, KCSM was served with an SCT resolution regarding the Capital Investment Proceeding for 2005, where the SCT determined that KCSM had indeed failed to make the minimum capital investments required for such year, and imposed a fine in the amount of Ps.46,800. KCSM has filed actions challenging both the 2004 and 2005 investment plan resolutions issued by the SCT. KCSM will have the right to challenge any adverse ruling by the Mexican Administrative and Fiscal Federal Court.
KCSM believes that even if sanctions are ultimately imposed as a consequence of the Capital Investment Proceedings, there will be no material adverse effect on its results of operations or financial condition. However, each of these potential sanctions is considered a “generic” sanction under Mexican law (i.e., sanctions applied to conduct not specifically referred to in specific subsections of the Mexican railway law). If these potential sanctions are conclusively ruled adversely against KCSM and sanctions are imposed, and if the SCT imposes other sanctions related to KCSM’s capital investments or other “generic” sanctions on three additional occasions over the remaining term of the Concession, KCSM could be subject to possible future SCT action seeking revocation of its Concession. Such revocation would materially adversely affect the results of operations and financial condition of KCSM.
Mancera Proceeding. In February 2006, Mancera Ernst & Young, S.C., (“Mancera”) filed a claim against KCSM seeking payment for an additional contingency fee for costs and expenses related to Mancera’s representation of KCSM in its value added tax or “VAT” claim against the Mexican government. In March 2006, KCSM responded to the claim. On April 15, 2008 KCSM was served with a resolution that required KCSM to pay an amount, which included interest and damages lower than the amount originally claimed by Mancera. This resolution was appealed by KCSM to challenge the payment of any interest and damages and was appealed by Mancera seeking to increase the amount it is to be paid for contingency fees. On September 30, 2008, KCSM was notified of the resolution by the Ninth Court of Appeals, which released KCSM from any obligation for damages to Mancera but increased the amount of fees to be paid to Mancera. KCSM intends to appeal this decision and believes that it has adequately reserved for its obligation under the engagement agreement with Mancera.
16
Kansas City Southern
Notes to Consolidated Financial Statements — (Continued)
Credit Risk. The Company continually monitors risk related to the recent downturn in the automotive industry and certain customer concentrations. Significant changes in customer concentration or payment terms, deterioration of customer credit-worthiness or weakening in economic trends could have a significant impact on the collectability of the Company’s receivables and operating results. If the financial condition of the Company’s customers were to deteriorate, resulting in an impairment of their ability to make payments, additional allowances may be required. Currently, management’s assessment is that it will collect all outstanding receivables, or at this time, based on its assessment has recorded necessary reserves as appropriate.
The liability for unrecognized tax benefits decreased from $32.6 million as of December 31, 2007 to $2.1 million as of September 30, 2008, primarily due to an Internal Revenue Service (“IRS”) examination settlement for years 1997 through 2002. The remaining $2.1 million liability for unrecognized tax benefits at September 30, 2008 would affect the effective income tax rate if recognized and is not expected to change in the next 12 months.
As a result of the IRS examination settlement, accrued interest and penalties on unrecognized tax benefits was reduced from $15.8 million to $0.1 million as of December 31, 2007 and September 30, 2008, respectively.
The Company strategically manages its rail operations as one reportable business segment over a single coordinated rail network that extends from the midwest and southeast portions of the United States south into Mexico and connects with other Class I railroads. Financial information reported at this level, such as revenues, operating income and cash flows from operations, is used by corporate management, including the Company’s chief operating decision-maker, in evaluating overall financial and operational performance, market strategies, as well as the decisions to allocate capital resources.
The Company’s strategic initiatives, which drive its operational direction, are developed and managed at the Company’s headquarters and targets are communicated to its various regional activity centers. Corporate management is responsible for, among others, KCS’ marketing strategy, the oversight of large cross-border customer accounts, overall planning and control of infrastructure and rolling stock, the allocation of capital resources based upon growth and capacity constraints over the coordinated network, and other functions such as financial planning, accounting, and treasury.
The role of each region is to manage the operational activities and monitor and control costs over the coordinated rail network. Such cost control is required to ensure that pre-established efficiency standards set at the corporate level are attained. The regional activity centers are responsible for executing the overall corporate strategy and operating plan established by corporate management as a coordinated system.
17
Kansas City Southern
Notes to Consolidated Financial Statements — (Continued)
The following tables(in millions)provide information by geographic area pursuant to Statement of Financial Accounting Standards No. 131, “Disclosures about Segments of an Enterprise and Related Information” (“SFAS 131”) as follows:
| | | | | | | | | | | | | | | | | |
| | | Three Months Ended
| | | Nine Months Ended
| |
| | | September 30, | | | September 30, | |
Revenues | | 2008 | | | 2007 | | | 2008 | | | 2007 | |
| |
| U.S. | | $ | 276.3 | | | $ | 234.3 | | | $ | 786.1 | | | $ | 683.1 | |
| Mexico | | | 215.2 | | | | 209.8 | | | | 642.2 | | | | 599.4 | |
| | | | | | | | | | | | | | | | | |
| Total revenues | | $ | 491.5 | | | $ | 444.1 | | | $ | 1,428.3 | | | $ | 1,282.5 | |
| | | | | | | | | | | | | | | | | |
| | | | | | | | | |
| | | September 30,
| | | December 31,
| |
Long-lived assets | | 2008 | | | 2007 | |
| |
| U.S. | | $ | 2,256.5 | | | $ | 2,045.0 | |
| Mexico | | | 2,170.3 | | | | 2,088.3 | |
| | | | | | | | | |
| Total long-lived assets | | $ | 4,426.8 | | | $ | 4,133.3 | |
| | | | | | | | | |
| |
| 12. | Condensed Consolidating Financial Information. |
KCSR has outstanding $200.0 million of 71/2% Senior Notes due 2009 and $275.0 million of 8.0% Senior Notes due 2015 which are unsecured obligations of KCSR, which are also jointly and severally and fully and unconditionally guaranteed on an unsecured senior basis by KCS and certain wholly-owned domestic subsidiaries. As a result, the following accompanying condensed consolidating financial information(in millions)has been prepared and presented pursuant to SECRegulation S-XRule 3-10 “Financial statements of guarantors and issuers of guaranteed securities registered or being registered.” This condensed information is not intended to present the financial position, results of operations and cash flows of the individual companies or groups of companies in accordance with U.S. GAAP. For the 71/2% senior note issue, KCSR registered exchange notes with the SEC that have substantially identical terms and associated guarantees; and all of the initial 71/2% senior notes have been exchanged for $200.0 million of registered exchange notes. The 8.0% senior notes were registered by means of an amendment to KCS’ shelf registration statement filed and declared effective by the SEC on May 23, 2008.
18
Kansas City Southern
Notes to Consolidated Financial Statements — (Continued)
CONDENSED CONSOLIDATING STATEMENTS OF INCOME
| | | | | | | | | | | | | | | | | | | | | | | | | |
| | | Three Months Ended September 30, 2008 | |
| | | | | | | | | Guarantor
| | | Non-Guarantor
| | | Consolidating
| | | Consolidated
| |
| | | Parent | | | KCSR | | | Subsidiaries | | | Subsidiaries | | | Adjustments | | | KCS | |
| |
| Revenues | | $ | — | | | $ | 253.7 | | | $ | 0.1 | | | $ | 245.8 | | | $ | (8.1 | ) | | $ | 491.5 | |
| Operating expenses | | | 1.8 | | | | 193.9 | | | | 6.2 | | | | 187.3 | | | | (8.7 | ) | | | 380.5 | |
| | | | | | | | | | | | | | | | | | | | | | | | | |
| Operating income (loss) | | | (1.8 | ) | | | 59.8 | | | | (6.1 | ) | | | 58.5 | | | | 0.6 | | | | 111.0 | |
| Equity in net earnings of unconsolidated affiliates | | | 54.1 | | | | 1.3 | | | | — | | | | 4.5 | | | | (54.9 | ) | | | 5.0 | |
| Interest expense | | | (0.2 | ) | | | (13.1 | ) | | | (0.1 | ) | | | (22.7 | ) | | | 0.6 | | | | (35.5 | ) |
| Foreign exchange loss | | | — | | | | — | | | | — | | | | (7.5 | ) | | | — | | | | (7.5 | ) |
| Other income | | | — | | | | 1.9 | | | | — | | | | 3.1 | | | | (1.2 | ) | | | 3.8 | |
| | | | | | | | | | | | | | | | | | | | | | | | | |
| Income (loss) before income taxes and minority interest | | | 52.1 | | | | 49.9 | | | | (6.2 | ) | | | 35.9 | | | | (54.9 | ) | | | 76.8 | |
| Income tax expense (benefit) | | | 0.4 | | | | 19.8 | | | | (2.3 | ) | | | 7.2 | | | | — | | | | 25.1 | |
| | | | | | | | | | | | | | | | | | | | | | | | | |
| Income (loss) before minority interest | | | 51.7 | | | | 30.1 | | | | (3.9 | ) | | | 28.7 | | | | (54.9 | ) | | | 51.7 | |
| Minority interest | | | 0.1 | | | | — | | | | — | | | | — | | | | — | | | | 0.1 | |
| | | | | | | | | | | | | | | | | | | | | | | | | |
| Net income (loss) | | $ | 51.6 | | | $ | 30.1 | | | $ | (3.9 | ) | | $ | 28.7 | | | $ | (54.9 | ) | | $ | 51.6 | |
| | | | | | | | | | | | | | | | | | | | | | | | | |
| | | | | | | | | | | | | | | | | | | | | | | | | |
| | | Three Months Ended September 30, 2007 | |
| | | | | | | | | Guarantor
| | | Non-Guarantor
| | | Consolidating
| | | Consolidated
| |
| | | Parent | | | KCSR | | | Subsidiaries | | | Subsidiaries | | | Adjustments | | | KCS | |
| |
| Revenues | | $ | — | | | $ | 209.6 | | | $ | 4.1 | | | $ | 238.3 | | | $ | (7.9 | ) | | $ | 444.1 | |
| Operating expenses | | | 6.3 | | | | 170.5 | | | | 5.4 | | | | 171.3 | | | | (7.6 | ) | | | 345.9 | |
| | | | | | | | | | | | | | | | | | | | | | | | | |
| Operating income (loss) | | | (6.3 | ) | | | 39.1 | | | | (1.3 | ) | | | 67.0 | | | | (0.3 | ) | | | 98.2 | |
| Equity in net earnings of unconsolidated affiliates | | | 51.0 | | | | 0.4 | | | | — | | | | 2.3 | | | | (50.4 | ) | | | 3.3 | |
| Interest income (expense) | | | 1.2 | | | | (17.0 | ) | | | (0.3 | ) | | | (21.7 | ) | | | 0.5 | | | | (37.3 | ) |
| Foreign exchange loss | | | — | | | | — | | | | — | | | | (1.9 | ) | | | — | | | | (1.9 | ) |
| Other income (expense) | | | (0.2 | ) | | | 0.1 | | | | — | | | | 2.3 | | | | (0.2 | ) | | | 2.0 | |
| | | | | | | | | | | | | | | | | | | | | | | | | |
| Income (loss) before income taxes and minority interest | | | 45.7 | | | | 22.6 | | | | (1.6 | ) | | | 48.0 | | | | (50.4 | ) | | | 64.3 | |
| Income tax expense (benefit) | | | (1.1 | ) | | | 8.4 | | | | (0.6 | ) | | | 10.8 | | | | — | | | | 17.5 | |
| | | | | | | | | | | | | | | | | | | | | | | | | |
| Income (loss) before minority interest | | | 46.8 | | | | 14.2 | | | | (1.0 | ) | | | 37.2 | | | | (50.4 | ) | | | 46.8 | |
| Minority interest | | | 0.1 | | | | — | | | | — | | | | — | | | | — | | | | 0.1 | |
| | | | | | | | | | | | | | | | | | | | | | | | | |
| Net income (loss) | | $ | 46.7 | | | $ | 14.2 | | | $ | (1.0 | ) | | $ | 37.2 | | | $ | (50.4 | ) | | $ | 46.7 | |
| | | | | | | | | | | | | | | | | | | | | | | | | |
19
CONDENSED CONSOLIDATING STATEMENTS OF INCOME — (Continued)
| | | | | | | | | | | | | | | | | | | | | | | | | |
| | | Nine Months Ended September 30, 2008 | |
| | | | | | | | | Guarantor
| | | Non-Guarantor
| | | Consolidating
| | | Consolidated
| |
| | | Parent | | | KCSR | | | Subsidiaries | | | Subsidiaries | | | Adjustments | | | KCS | |
| |
| Revenues | | $ | — | | | $ | 707.7 | | | $ | 8.6 | | | $ | 737.3 | | | $ | (25.3 | ) | | $ | 1,428.3 | |
| Operating expenses | | | 7.3 | | | | 571.6 | | | | 18.4 | | | | 558.8 | | | | (26.8 | ) | | | 1,129.3 | |
| | | | | | | | | | | | | | | | | | | | | | | | | |
| Operating income (loss) | | | (7.3 | ) | | | 136.1 | | | | (9.8 | ) | | | 178.5 | | | | 1.5 | | | | 299.0 | |
| Equity in net earnings (losses) of unconsolidated affiliates | | | 144.5 | | | | (0.2 | ) | | | — | | | | 12.9 | | | | (143.4 | ) | | | 13.8 | |
| Interest income (expense) | | | 4.1 | | | | (42.7 | ) | | | 1.5 | | | | (67.7 | ) | | | 2.1 | | | | (102.7 | ) |
| Debt retirement costs | | | — | | | | (5.6 | ) | | | — | | | | — | | | | — | | | | (5.6 | ) |
| Foreign exchange gain | | | — | | | | — | | | | — | | | | 0.7 | | | | — | | | | 0.7 | |
| Other income | | | — | | | | 5.5 | | | | — | | | | 5.0 | | | | (3.5 | ) | | | 7.0 | |
| | | | | | | | | | | | | | | | | | | | | | | | | |
| Income (loss) before income taxes and minority interest | | | 141.3 | | | | 93.1 | | | | (8.3 | ) | | | 129.4 | | | | (143.3 | ) | | | 212.2 | |
| Income tax expense (benefit) | | | (3.7 | ) | | | 39.1 | | | | (3.1 | ) | | | 34.9 | | | | — | | | | 67.2 | |
| | | | | | | | | | | | | | | | | | | | | | | | | |
| Income (loss) before minority interest | | | 145.0 | | | | 54.0 | | | | (5.2 | ) | | | 94.5 | | | | (143.3 | ) | | | 145.0 | |
| Minority interest | | | 0.3 | | | | — | | | | — | | | | — | | | | — | | | | 0.3 | |
| | | | | | | | | | | | | | | | | | | | | | | | | |
| Net income (loss) | | $ | 144.7 | | | $ | 54.0 | | | $ | (5.2 | ) | | $ | 94.5 | | | $ | (143.3 | ) | | $ | 144.7 | |
| | | | | | | | | | | | | | | | | | | | | | | | | |
| | | | | | | | | | | | | | | | | | | | | | | | | |
| | | Nine Months Ended September 30, 2007 | |
| | | | | | | | | Guarantor
| | | Non-Guarantor
| | | Consolidating
| | | Consolidated
| |
| | | Parent | | | KCSR | | | Subsidiaries | | | Subsidiaries | | | Adjustments | | | KCS | |
| |
| Revenues | | $ | — | | | $ | 611.2 | | | $ | 9.2 | | | $ | 684.2 | | | $ | (22.1 | ) | | $ | 1,282.5 | |
| Operating expenses | | | 18.0 | | | | 505.7 | | | | 14.2 | | | | 512.0 | | | | (21.1 | ) | | | 1,028.8 | |
| | | | | | | | | | | | | | | | | | | | | | | | | |
| Operating income (loss) | | | (18.0 | ) | | | 105.5 | | | | (5.0 | ) | | | 172.2 | | | | (1.0 | ) | | | 253.7 | |
| Equity in net earnings of unconsolidated affiliates | | | 113.0 | | | | 1.6 | | | | — | | | | 4.7 | | | | (112.1 | ) | | | 7.2 | |
| Interest expense | | | (1.8 | ) | | | (46.9 | ) | | | (1.0 | ) | | | (70.0 | ) | | | 1.4 | | | | (118.3 | ) |
| Debt retirement costs | | | — | | | | — | | | | — | | | | (6.9 | ) | | | — | | | | (6.9 | ) |
| Foreign exchange loss | | | — | | | | — | | | | — | | | | (1.6 | ) | | | — | | | | (1.6 | ) |
| Other income (expense) | | | (0.5 | ) | | | 1.3 | | | | — | | | | 5.5 | | | | (0.4 | ) | | | 5.9 | |
| | | | | | | | | | | | | | | | | | | | | | | | | |
| Income (loss) before income taxes and minority interest | | | 92.7 | | | | 61.5 | | | | (6.0 | ) | | | 103.9 | | | | (112.1 | ) | | | 140.0 | |
| Income tax expense (benefit) | | | (6.7 | ) | | | 23.5 | | | | (2.3 | ) | | | 26.1 | | | | — | | | | 40.6 | |
| | | | | | | | | | | | | | | | | | | | | | | | | |
| Income (loss) before minority interest | | | 99.4 | | | | 38.0 | | | | (3.7 | ) | | | 77.8 | | | | (112.1 | ) | | | 99.4 | |
| Minority interest | | | 0.3 | | | | — | | | | — | | | | — | | | | — | | | | 0.3 | |
| | | | | | | | | | | | | | | | | | | | | | | | | |
| Net income (loss) | | $ | 99.1 | | | $ | 38.0 | | | $ | (3.7 | ) | | $ | 77.8 | | | $ | (112.1 | ) | | $ | 99.1 | |
| | | | | | | | | | | | | | | | | | | | | | | | | |
20
Kansas City Southern
Notes to Consolidated Financial Statements — (Continued)
CONDENSED CONSOLIDATING BALANCE SHEETS
| | | | | | | | | | | | | | | | | | | | | | | | | |
| | | September 30, 2008 | |
| | | | | | | | | Guarantor
| | | Non-Guarantor
| | | Consolidating
| | | Consolidated
| |
| | | Parent | | | KCSR | | | Subsidiaries | | | Subsidiaries | | | Adjustments | | | KCS | |
| |
Assets: | | | | | | | | | | | | | | | | | | | | | | | | |
| Current assets | | $ | 21.2 | | | $ | 218.2 | | | $ | 2.2 | | | $ | 540.6 | | | $ | (15.1 | ) | | $ | 767.1 | |
| Investments held for operating purposes and affiliate investment | | | 2,243.2 | | | | 425.8 | | | | — | | | | 558.6 | | | | (3,158.8 | ) | | | 68.8 | |
| Property and equipment, net | | | — | | | | 1,439.3 | | | | 214.6 | | | | 1,573.5 | | | | — | | | | 3,227.4 | |
| Concession assets, net | | | — | | | | — | | | | — | | | | 1,199.4 | | | | — | | | | 1,199.4 | |
| Other assets | | | 1.3 | | | | 37.5 | | | | 0.4 | | | | 64.4 | | | | (14.4 | ) | | | 89.2 | |
| | | | | | | | | | | | | | | | | | | | | | | | | |
| Total assets | | $ | 2,265.7 | | | $ | 2,120.8 | | | $ | 217.2 | | | $ | 3,936.5 | | | $ | (3,188.3 | ) | | $ | 5,351.9 | |
| | | | | | | | | | | | | | | | | | | | | | | | | |
Liabilities and equity: | | | | | | | | | | | | | | | | | | | | | | | | |
| Current liabilities | | $ | 361.4 | | | $ | 314.1 | | | $ | 122.3 | | | $ | 307.9 | | | $ | (12.0 | ) | | $ | 1,093.7 | |
| Long-term debt | | | 0.2 | | | | 286.4 | | | | 0.5 | | | | 995.4 | | | | — | | | | 1,282.5 | |
| Deferred income taxes | | | 22.5 | | | | 370.8 | | | | 79.7 | | | | 151.3 | | | | — | | | | 624.3 | |
| Other liabilities | | | 4.0 | | | | 107.7 | | | | 8.1 | | | | 110.9 | | | | (17.5 | ) | | | 213.2 | |
| Minority interest | | | 1.5 | | | | 31.4 | | | | — | | | | 260.6 | | | | (31.4 | ) | | | 262.1 | |
| Stockholders’ equity | | | 1,876.1 | | | | 1,010.4 | | | | 6.6 | | | | 2,110.4 | | | | (3,127.4 | ) | | | 1,876.1 | |
| | | | | | | | | | | | | | | | | | | | | | | | | |
| Total liabilities and equity | | $ | 2,265.7 | | | $ | 2,120.8 | | | $ | 217.2 | | | $ | 3,936.5 | | | $ | (3,188.3 | ) | | $ | 5,351.9 | |
| | | | | | | | | | | | | | | | | | | | | | | | | |
| | | | | | | | | | | | | | | | | | | | | | | | | |
| | | December 31, 2007 | |
| | | | | | | | | Guarantor
| | | Non-Guarantor
| | | Consolidating
| | | Consolidated
| |
| | | Parent | | | KCSR | | | Subsidiaries | | | Subsidiaries | | | Adjustments | | | KCS | |
| |
Assets: | | | | | | | | | | | | | | | | | | | | | | | | |
| Current assets | | $ | 24.2 | | | $ | 268.7 | | | $ | 3.0 | | | $ | 405.7 | | | $ | (55.9 | ) | | $ | 645.7 | |
| Investments held for operating purposes and affiliate investment | | | 2,100.1 | | | | 436.7 | | | | — | | | | 571.3 | | | | (3,028.8 | ) | | | 79.3 | |
| Property and equipment, net | | | 0.6 | | | | 1,329.7 | | | | 219.5 | | | | 1,368.5 | | | | (0.5 | ) | | | 2,917.8 | |
| Concession assets, net | | | — | | | | — | | | | — | | | | 1,215.5 | | | | — | | | | 1,215.5 | |
| Other assets | | | 1.5 | | | | 27.4 | | | | — | | | | 41.0 | | | | — | | | | 69.9 | |
| | | | | | | | | | | | | | | | | | | | | | | | | |
| Total assets | | $ | 2,126.4 | | | $ | 2,062.5 | | | $ | 222.5 | | | $ | 3,602.0 | | | $ | (3,085.2 | ) | | $ | 4,928.2 | |
| | | | | | | | | | | | | | | | | | | | | | | | | |
Liabilities and equity: | | | | | | | | | | | | | | | | | | | | | | | | |
| Current liabilities | | $ | 355.5 | | | $ | 428.7 | | | $ | 111.4 | | | $ | 234.9 | | | $ | (31.8 | ) | | $ | 1,098.7 | |
| Long-term debt | | | 0.2 | | | | 207.3 | | | | 0.5 | | | | 897.0 | | | | — | | | | 1,105.0 | |
| Deferred income taxes | | | 11.9 | | | | 341.1 | | | | 83.0 | | | | 63.1 | | | | — | | | | 499.1 | |
| Other liabilities | | | 31.6 | | | | 99.2 | | | | 15.7 | | | | 133.6 | | | | (24.0 | ) | | | 256.1 | |
| Minority interest | | | 0.9 | | | | 31.4 | | | | — | | | | 239.8 | | | | (29.1 | ) | | | 243.0 | |
| Stockholders’ equity | | | 1,726.3 | | | | 954.8 | | | | 11.9 | | | | 2,033.6 | | | | (3,000.3 | ) | | | 1,726.3 | |
| | | | | | | | | | | | | | | | | | | | | | | | | |
| Total liabilities and equity | | $ | 2,126.4 | | | $ | 2,062.5 | | | $ | 222.5 | | | $ | 3,602.0 | | | $ | (3,085.2 | ) | | $ | 4,928.2 | |
| | | | | | | | | | | | | | | | | | | | | | | | | |
21
Kansas City Southern
Notes to Consolidated Financial Statements — (Continued)
CONDENSED CONSOLIDATING STATEMENTS OF CASH FLOWS
| | | | | | | | | | | | | | | | | | | | | | | | | |
| | | Nine Months Ended September 30, 2008 | |
| | | | | | | | | Guarantor
| | | Non-Guarantor
| | | Consolidating
| | | Consolidated
| |
| | | Parent | | | KCSR | | | Subsidiaries | | | Subsidiaries | | | Adjustments | | | KCS | |
| |
Operating activities: | | | | | | | | | | | | | | | | | | | | | | | | |
| Excluding intercompany activity | | $ | 0.4 | | | $ | 156.8 | | | $ | (9.7 | ) | | $ | 185.6 | | | $ | — | | | $ | 333.1 | |
| Intercompany activity | | | 3.2 | | | | (62.8 | ) | | | 11.2 | | | | 48.4 | | | | — | | | | — | |
| | | | | | | | | | | | | | | | | | | | | | | | | |
| Net cash provided | | | 3.6 | | | | 94.0 | | | | 1.5 | | | | 234.0 | | | | — | | | | 333.1 | |
| | | | | | | | | | | | | | | | | | | | | | | | | |
Investing activities: | | | | | | | | | | | | | | | | | | | | | | | | |
| Capital expenditures | | | — | | | | (150.6 | ) | | | (0.4 | ) | | | (264.6 | ) | | | — | | | | (415.6 | ) |
| Other investing activities | | | — | | | | 13.4 | | | | (0.9 | ) | | | (7.1 | ) | | | (7.1 | ) | | | (1.7 | ) |
| | | | | | | | | | | | | | | | | | | | | | | | | |
| Net cash used | | | — | | | | (137.2 | ) | | | (1.3 | ) | | | (271.7 | ) | | | (7.1 | ) | | | (417.3 | ) |
| | | | | | | | | | | | | | | | | | | | | | | | | |
Financing activities: | | | | | | | | | | | | | | | | | | | | | | | | |
| Proceeds from issuance of long-term debt | | | — | | | | 274.9 | | | | — | | | | 125.0 | | | | — | | | | 399.9 | |
| Repayment of long-term debt | | | (0.6 | ) | | | (234.0 | ) | | | — | | | | (24.3 | ) | | | — | | | | (258.9 | ) |
| Other financing activities | | | (3.1 | ) | | | (11.7 | ) | | | — | | | | (8.1 | ) | | | 7.1 | | | | (15.8 | ) |
| | | | | | | | | | | | | | | | | | | | | | | | | |
| Net cash provided (used) | | | (3.7 | ) | | | 29.2 | | | | — | | | | 92.6 | | | | 7.1 | | | | 125.2 | |
| | | | | | | | | | | | | | | | | | | | | | | | | |
Cash and cash equivalents: | | | | | | | | | | | | | | | | | | | | | | | | |
| Net increase (decrease) | | | (0.1 | ) | | | (14.0 | ) | | | 0.2 | | | | 54.9 | | | | — | | | | 41.0 | |
| At beginning of year | | | (0.2 | ) | | | 27.6 | | | | 0.1 | | | | 28.0 | | | | — | | | | 55.5 | |
| | | | | | | | | | | | | | | | | | | | | | | | | |
| At end of period | | $ | (0.3 | ) | | $ | 13.6 | | | $ | 0.3 | | | $ | 82.9 | | | $ | — | | | $ | 96.5 | |
| | | | | | | | | | | | | | | | | | | | | | | | | |
22
Kansas City Southern
Notes to Consolidated Financial Statements — (Continued)
| | | | | | | | | | | | | | | | | | | | | | | | | |
| | | Nine Months Ended September 30, 2007 | |
| | | | | | | | | Guarantor
| | | Non-Guarantor
| | | Consolidating
| | | Consolidated
| |
| | | Parent | | | KCSR | | | Subsidiaries | | | Subsidiaries | | | Adjustments | | | KCS | |
| |
Operating activities: | | | | | | | | | | | | | | | | | | | | | | | | |
| Excluding intercompany activity | | $ | (37.9 | ) | | $ | 158.7 | | | $ | 2.6 | | | $ | 172.9 | | | $ | — | | | $ | 296.3 | |
| Intercompany activity | | | 55.2 | | | | (17.8 | ) | | | (2.4 | ) | | | (35.0 | ) | | | — | | | | — | |
| | | | | | | | | | | | | | | | | | | | | | | | | |
| Net cash provided | | | 17.3 | | | | 140.9 | | | | 0.2 | | | | 137.9 | | | | — | | | | 296.3 | |
| | | | | | | | | | | | | | | | | | | | | | | | | |
Investing activities: | | | | | | | | | | | | | | | | | | | | | | | | |
| Capital expenditures | | | — | | | | (126.2 | ) | | | (0.2 | ) | | | (86.6 | ) | | | — | | | | (213.0 | ) |
| Contribution from NS for MSLLC (net of change in restricted contribution) | | | — | | | | — | | | | — | | | | 100.0 | | | | — | | | | 100.0 | |
| Property investments in MSLLC | | | — | | | | — | | | | — | | | | (87.7 | ) | | | — | | | | (87.7 | ) |
| Other investing activities | | | — | | | | (2.3 | ) | | | — | | | | 7.5 | | | | — | | | | 5.2 | |
| | | | | | | | | | | | | | | | | | | | | | | | | |
| Net cash used | | | — | | | | (128.5 | ) | | | (0.2 | ) | | | (66.8 | ) | | | — | | | | (195.5 | ) |
| | | | | | | | | | | | | | | | | | | | | | | | | |
Financing activities: | | | | | | | | | | | | | | | | | | | | | | | | |
| Proceeds from issuance of long-term debt | | | — | | | | 75.0 | | | | — | | | | 211.7 | | | | — | | | | 286.7 | |
| Repayment of long-term debt | | | — | | | | (75.3 | ) | | | — | | | | (237.6 | ) | | | — | | | | (312.9 | ) |
| Other financing activities | | | (17.7 | ) | | | (3.6 | ) | | | — | | | | (16.1 | ) | | | — | | | | (37.4 | ) |
| | | | | | | | | | | | | | | | | | | | | | | | | |
| Net cash used | | | (17.7 | ) | | | (3.9 | ) | | | — | | | | (42.0 | ) | | | — | | | | (63.6 | ) |
| | | | | | | | | | | | | | | | | | | | | | | | | |
Cash and cash equivalents: | | | | | | | | | | | | | | | | | | | | | | | | |
| Net increase (decrease) | | | (0.4 | ) | | | 8.5 | | | | — | | | | 29.1 | | | | — | | | | 37.2 | |
| At beginning of year | | | 0.2 | | | | 36.2 | | | | — | | | | 42.6 | | | | — | | | | 79.0 | |
| | | | | | | | | | | | | | | | | | | | | | | | | |
| At end of period | | $ | (0.2 | ) | | $ | 44.7 | | | $ | — | | | $ | 71.7 | | | $ | — | | | $ | 116.2 | |
| | | | | | | | | | | | | | | | | | | | | | | | | |
23
Report of Independent Registered Public Accounting Firm
The Board of Directors and Stockholders
Kansas City Southern:
We have reviewed the accompanying consolidated balance sheet of Kansas City Southern and subsidiaries (the Company) as of September 30, 2008, the related consolidated statements of income for the three-month and nine-month periods ended September 30, 2008 and 2007, and the related consolidated statements of cash flows for the nine-month periods ended September 30, 2008 and 2007. These consolidated financial statements are the responsibility of the Company’s management.
We conducted our review in accordance with the standards of the Public Company Accounting Oversight Board (United States). A review of interim financial information consists principally of applying analytical procedures and making inquiries of persons responsible for financial and accounting matters. It is substantially less in scope than an audit conducted in accordance with the standards of the Public Company Accounting Oversight Board (United States), the objective of which is the expression of an opinion regarding the financial statements taken as a whole. Accordingly, we do not express such an opinion.
Based on our review, we are not aware of any material modifications that should be made to the consolidated financial statements referred to above for them to be in conformity with U.S. generally accepted accounting principles.
We have previously audited, in accordance with the standards of the Public Company Accounting Oversight Board (United States), the consolidated balance sheet of the Company as of December 31, 2007, and the related consolidated statements of income, stockholders’ equity and comprehensive income, and cash flows for the year then ended (not presented herein); and in our report dated February 15, 2008, we expressed an unqualified opinion on those consolidated financial statements. Our report refers to the Company’s adoption of Financial Accounting Standards Board Interpretation No. 48,Accounting for Uncertainty in Income Taxes, effective January 1, 2007. In our opinion, the information set forth in the accompanying consolidated balance sheet as of December 31, 2007 is fairly stated, in all material respects, in relation to the consolidated balance sheet from which it has been derived.
KPMG LLP
Kansas City, Missouri
October 28, 2008
24
| |
| Item 2. | Management’s Discussion and Analysis of Financial Condition and Results of Operations. |
The discussion below, as well as other portions of thisForm 10-Q, contain forward-looking statements that are not based upon historical information. Such forward-looking statements are based upon information currently available to management and management’s perception thereof as of the date of thisForm 10-Q. Readers can identify these forward-looking statements by the use of such verbs as “expects,” “anticipates,” “believes” or similar verbs or conjugations of such verbs. The actual results of operations of Kansas City Southern (“KCS” or the “Company”) could materially differ from those indicated in forward-looking statements. The differences could be caused by a number of factors or combination of factors including, but not limited to, those factors identified in Item 7 “Management’s Discussion and Analysis of Financial Condition and Results of Operations” in the Company’s annual report onForm 10-K for the year ended December 31, 2007, which is on file with the U.S. Securities and Exchange Commission (FileNo. 1-4717) incorporated by reference and in Part II Item 1A — “Risk Factors” in theForm 10-K and thisForm 10-Q. Readers are strongly encouraged to consider these factors when evaluating forward-looking statements. Forward-looking statements contained in thisForm 10-Q will not be updated.
This discussion is intended to clarify and focus on the Company’s results of operations, certain changes in its financial position, liquidity, capital structure and business developments for the periods covered by the consolidated financial statements included under Item 1 of thisForm 10-Q. This discussion should be read in conjunction with those consolidated financial statements and the related notes, and is qualified by reference to them.
Critical Accounting Policies and Estimates.
The Company’s discussion and analysis of its financial position and results of operations is based upon its consolidated financial statements. The preparation of the financial statements requires estimation and judgment that affect the reported amounts of revenue, expenses, assets, and liabilities. The Company bases its estimates on historical experience and on various other assumptions that are believed to be reasonable under the circumstances, the results of which form the basis for making judgments about the accounting for assets and liabilities that are not readily apparent from other sources. If the estimates differ materially from actual results, the impact on the consolidated financial statements may be material. The Company’s critical accounting policies are disclosed in the 2007 annual report onForm 10-K. There have been no significant changes with respect to these policies during the first nine months of 2008.
Overview.
The Company is engaged in the freight rail transportation business operating a single coordinated rail network under one reportable business segment. The primary operating subsidiaries of the Company consists of the following: The Kansas City Southern Railway Company (“KCSR”), The Texas Mexican Railway Company (“TexMex”), Meridian Speedway, LLC (“MSLLC”), and Kansas City Southern de México, S.A. de C.V. (“KCSM”). The Company generates revenues and cash flows by providing customers with freight delivery services within its regions, and throughout North America through connections with other Class I rail carriers. Customers conduct business in a number of different industries, including electric-generating utilities, chemical and petroleum products, industrial and consumer products, agriculture and mineral products, automotive products and intermodal transportation. Appropriate eliminations and reclassifications have been recorded in deriving consolidated financial statements.
Third Quarter Analysis.
The Company reported quarterly earnings of $0.52 per diluted share on consolidated net income of $51.6 million for the three months ended September 30, 2008, compared to quarterly earnings of $0.48 per diluted share on consolidated net income of $46.7 million for the same period in 2007. The revenue growth of 10.7% during the third quarter 2008 was primarily driven by price increases, increased fuel surcharges, including participation, and certain new business growth.
Cash flows from operations increased to $333.1 million as compared to $296.3 million for the nine month periods ended September 30, 2008 and 2007, respectively, an increase of $36.8 million from the prior year
25
period. The increase is primarily due to increased net income and distributions from unconsolidated affiliates, continuous improvements in the collection of accounts receivable, partially offset by changes in other working capital items, resulting mainly from the timing of certain payments and receipts. Capital expenditures are a significant use of cash flows due to the capital intensive nature of railroad operations and the Company’s growth strategy. Cash used for capital expenditures for the nine months ended September 30, 2008 was $415.6 million as compared to $213.0 million for the same period in 2007.
Results of Operations.
Net income for the third quarter of 2008 increased $4.9 million compared to the prior year third quarter.
The following summarizes KCS’ income statement(in millions):
| | | | | | | | | | | | | | | | | |
| | | Three Months Ended
| | | | |
| | | September 30, | | | Change | |
| | | 2008 | | | 2007 | | | Dollars | | | Percent | |
| |
| Revenues | | $ | 491.5 | | | $ | 444.1 | | | $ | 47.4 | | | | 11 | % |
| Operating expenses | | | 380.5 | | | | 345.9 | | | | 34.6 | | | | 10 | % |
| | | | | | | | | | | | | | | | | |
| Operating income | | | 111.0 | | | | 98.2 | | | | 12.8 | | | | 13 | % |
| Equity in net earnings of unconsolidated affiliates | | | 5.0 | | | | 3.3 | | | | 1.7 | | | | 52 | % |
| Interest expense | | | (35.5 | ) | | | (37.3 | ) | | | 1.8 | | | | (5 | )% |
| Foreign exchange loss | | | (7.5 | ) | | | (1.9 | ) | | | (5.6 | ) | | | 295 | % |
| Other income | | | 3.8 | | | | 2.0 | | | | 1.8 | | | | 90 | % |
| | | | | | | | | | | | | | | | | |
| Income before income taxes and minority interest | | | 76.8 | | | | 64.3 | | | | 12.5 | | | | 19 | % |
| Income tax expense | | | 25.1 | | | | 17.5 | | | | 7.6 | | | | 43 | % |
| | | | | | | | | | | | | | | | | |
| Income before minority interest | | | 51.7 | | | | 46.8 | | | | 4.9 | | | | 10 | % |
| Minority interest | | | 0.1 | | | | 0.1 | | | | — | | | | — | |
| | | | | | | | | | | | | | | | | |
| Net income | | $ | 51.6 | | | $ | 46.7 | | | $ | 4.9 | | | | 10 | % |
| | | | | | | | | | | | | | | | | |
| | | | | | | | | | | | | | | | | |
| | | Nine Months Ended
| | | | |
| | | September 30, | | | Change | |
| | | 2008 | | | 2007 | | | Dollars | | | Percent | |
| |
| Revenues | | $ | 1,428.3 | | | $ | 1,282.5 | | | $ | 145.8 | | | | 11 | % |
| Operating expenses | | | 1,129.3 | | | | 1,028.8 | | | | 100.5 | | | | 10 | % |
| | | | | | | | | | | | | | | | | |
| Operating income | | | 299.0 | | | | 253.7 | | | | 45.3 | | | | 18 | % |
| Equity in net earnings of unconsolidated affiliates | | | 13.8 | | | | 7.2 | | | | 6.6 | | | | 92 | % |
| Interest expense | | | (102.7 | ) | | | (118.3 | ) | | | 15.6 | | | | (13 | )% |
| Debt retirement costs | | | (5.6 | ) | | | (6.9 | ) | | | 1.3 | | | | (19 | )% |
| Foreign exchange gain (loss) | | | 0.7 | | | | (1.6 | ) | | | 2.3 | | | | (144 | )% |
| Other income | | | 7.0 | | | | 5.9 | | | | 1.1 | | | | 19 | % |
| | | | | | | | | | | | | | | | | |
| Income before income taxes and minority interest | | | 212.2 | | | | 140.0 | | | | 72.2 | | | | 52 | % |
| Income tax expense | | | 67.2 | | | | 40.6 | | | | 26.6 | | | | 66 | % |
| | | | | | | | | | | | | | | | | |
| Income before minority interest | | | 145.0 | | | | 99.4 | | | | 45.6 | | | | 46 | % |
| Minority interest | | | 0.3 | | | | 0.3 | | | | — | | | | — | |
| | | | | | | | | | | | | | | | | |
| Net income | | $ | 144.7 | | | $ | 99.1 | | | $ | 45.6 | | | | 46 | % |
| | | | | | | | | | | | | | | | | |
26
Revenues.
The following summarizes revenues (in millions) and carload statistics(in thousands):
| | | | | | | | | | | | | | | | | | | | | | | | | | | | | | | | | |
| | | Revenues | | | Carloads and Units | |
| | | Three Months
| | | | | | Three Months
| | | | |
| | | Ended September 30, | | | Change | | | Ended September 30, | | | Change | |
| | | 2008 | | | 2007 | | | Dollars | | | Percent | | | 2008 | | | 2007 | | | Units | | | Percent | |
| |
| Chemical and petroleum | | $ | 92.3 | | | $ | 83.5 | | | $ | 8.8 | | | | 11 | % | | | 59.8 | | | | 58.2 | | | | 1.6 | | | | 3 | % |
| Industrial and consumer products | | | 138.5 | | | | 123.9 | | | | 14.6 | | | | 12 | % | | | 94.5 | | | | 95.0 | | | | (0.5 | ) | | | (1 | )% |
| Agriculture and minerals | | | 115.8 | | | | 103.1 | | | | 12.7 | | | | 12 | % | | | 72.8 | | | | 74.1 | | | | (1.3 | ) | | | (2 | )% |
| | | | | | | | | | | | | | | | | | | | | | | | | | | | | | | | | |
| Total general commodities | | | 346.6 | | | | 310.5 | | | | 36.1 | | | | 12 | % | | | 227.1 | | | | 227.3 | | | | (0.2 | ) | | | — | |
| Intermodal | | | 43.3 | | | | 37.4 | | | | 5.9 | | | | 16 | % | | | 136.8 | | | | 134.9 | | | | 1.9 | | | | 1 | % |
| Automotive | | | 25.1 | | | | 29.0 | | | | (3.9 | ) | | | (13 | )% | | | 21.5 | | | | 28.0 | | | | (6.5 | ) | | | (23 | )% |
| Coal | | | 57.3 | | | | 50.6 | | | | 6.7 | | | | 13 | % | | | 80.3 | | | | 79.8 | | | | 0.5 | | | | 1 | % |
| | | | | | | | | | | | | | | | | | | | | | | | | | | | | | | | | |
| Carload revenues, carloads and units | | | 472.3 | | | | 427.5 | | | | 44.8 | | | | 10 | % | | | 465.7 | | | | 470.0 | | | | (4.3 | ) | | | (1 | )% |
| | | | | | | | | | | | | | | | | | | | | | | | | | | | | | | | | |
| Other revenue | | | 19.2 | | | | 16.6 | | | | 2.6 | | | | 16 | % | | | | | | | | | | | | | | | | |
| | | | | | | | | | | | | | | | | | | | | | | | | | | | | | | | | |
| Total revenues(i) | | $ | 491.5 | | | $ | 444.1 | | | $ | 47.4 | | | | 11 | % | | | | | | | | | | | | | | | | |
| | | | | | | | | | | | | | | | | | | | | | | | | | | | | | | | | |
| (i) Included in revenues: | | | | | | | | | | | | | | | | | | | | | | | | | | | | | | | | |
| Fuel surcharge | | $ | 62.6 | | | $ | 34.2 | | | | | | | | | | | | | | | | | | | | | | | | | |
| | | | | | | | | | | | | | | | | | | | | | | | | | | | | | | | | |
| | | | | | | | | | | | | | | | | | | | | | | | | | | | | | | | | |
| | | Revenues | | | Carloads and Units | |
| | | Nine Months
| | | | | | Nine Months
| | | | |
| | | Ended September 30, | | | Change | | | Ended September 30, | | | Change | |
| | | 2008 | | | 2007 | | | Dollars | | | Percent | | | 2008 | | | 2007 | | | Units | | | Percent | |
| |
| Chemical and petroleum | | $ | 272.9 | | | $ | 237.4 | | | $ | 35.5 | | | | 15 | % | | | 186.0 | | | | 169.8 | | | | 16.2 | | | | 10 | % |
| Industrial and consumer products | | | 402.4 | | | | 370.7 | | | | 31.7 | | | | 9 | % | | | 290.6 | | | | 297.1 | | | | (6.5 | ) | | | (2 | )% |
| Agriculture and minerals | | | 342.3 | | | | 296.3 | | | | 46.0 | | | | 16 | % | | | 220.2 | | | | 222.7 | | | | (2.5 | ) | | | (1 | )% |
| | | | | | | | | | | | | | | | | | | | | | | | | | | | | | | | | |
| Total general commodities | | | 1,017.6 | | | | 904.4 | | | | 113.2 | | | | 13 | % | | | 696.8 | | | | 689.6 | | | | 7.2 | | | | 1 | % |
| Intermodal | | | 119.4 | | | | 103.7 | | | | 15.7 | | | | 15 | % | | | 388.4 | | | | 385.3 | | | | 3.1 | | | | 1 | % |
| Automotive | | | 85.5 | | | | 81.8 | | | | 3.7 | | | | 5 | % | | | 76.3 | | | | 79.5 | | | | (3.2 | ) | | | (4 | )% |
| Coal | | | 152.4 | | | | 141.2 | | | | 11.2 | | | | 8 | % | | | 221.8 | | | | 232.5 | | | | (10.7 | ) | | | (5 | )% |
| | | | | | | | | | | | | | | | | | | | | | | | | | | | | | | | | |
| Carload revenues, carloads and units | | | 1,374.9 | | | | 1,231.1 | | | | 143.8 | | | | 12 | % | | | 1,383.3 | | | | 1,386.9 | | | | (3.6 | ) | | | — | |
| | | | | | | | | | | | | | | | | | | | | | | | | | | | | | | | | |
| Other revenue | | | 53.4 | | | | 51.4 | | | | 2.0 | | | | 4 | % | | | | | | | | | | | | | | | | |
| | | | | | | | | | | | | | | | | | | | | | | | | | | | | | | | | |
| Total revenues(i) | | $ | 1,428.3 | | | $ | 1,282.5 | | | $ | 145.8 | | | | 11 | % | | | | | | | | | | | | | | | | |
| | | | | | | | | | | | | | | | | | | | | | | | | | | | | | | | | |
| (i) Included in revenues: | | | | | | | | | | | | | | | | | | | | | | | | | | | | | | | | |
| Fuel surcharge | | $ | 152.9 | | | $ | 95.6 | | | | | | | | | | | | | | | | | | | | | | | | | |
| | | | | | | | | | | | | | | | | | | | | | | | | | | | | | | | | |
For the three and nine months ended September 30, 2008, revenues increased $47.4 million and $145.8 million compared to the same periods in 2007, primarily due to certain new business growth, rate increases, and increased fuel surcharges, including participation, partially offset by a decrease in volume due to the impact of the hurricanes in the third quarter. The following discussion provides an analysis of revenues by commodity group.
27
| | | |
| | | Revenues by commodity
|
| | | group for the three months
|
| | | ended September 30, 2008 |
| |
Chemical and petroleum. Revenues increased $8.8 million and $35.5 million for the three and nine months ended September 30, 2008, compared to the same periods in 2007, due to targeted rate increases, fuel surcharge increases, and increased traffic volumes from new business primarily in the Plastics channel. | | .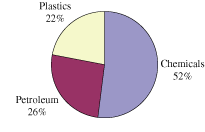 |
Industrial and consumer products. Revenues increased $14.6 million and $31.7 million for the three and nine months ended September 30, 2008, compared to the same periods in 2007, primarily due to higher demand in the Metals and scrap channel in coil and pipe products as well as new business within the channel, targeted rate increases, and fuel surcharge increases. These increases were partially offset by decreases in volume due to the declining housing market which impacted the Forest products channel and declines in beer export volume from Mexico reflected in the Other channel. | |
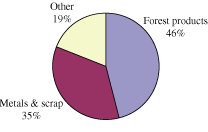 |
Agriculture and minerals. Revenues increased $12.7 million and $46.0 million for the three and nine months ended September 30, 2008, compared to the same periods in 2007, driven by targeted rate increases, fuel surcharge increases and increased length of haul of cross border traffic from customers moving their business from various competitors onto the KCS network. The Grain channel accounted for the majority of the revenue increase even with a later than forecasted harvest decreasing volume. This volume decrease was partially offset by increased traffic in the Ores and minerals channel, particularly in rock and sand products, due to the strong energy sector. | | 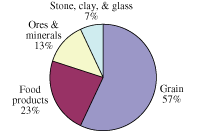 |
Intermodal. Revenues increased $5.9 million and $15.7 million for the three and nine months ended September 30, 2008, compared to the same periods in 2007. The primary drivers were increased imports and exports of intermodal containerized business originating and terminating at the port of Lázaro Cárdenas, targeted rate increases, and fuel surcharge increases.
Automotive. Revenues decreased $3.9 million for the three months ended September 30, 2008, compared to the same period in 2007. Decreases were driven by the overall downturn in the automotive industry as the higher cost of fuel and tightening credit markets have automobile manufacturers re-tooling factories to build more fuel efficient vehicles as well as developing programs to incent the purchase of new cars. Revenues increased $3.7 million for the nine months ended September 30, 2008, compared to the same period in 2007, due to targeted rate increases and new longer haul traffic in the first half of 2008.
Coal. Revenue increased $6.7 million and $11.2 million for the three and nine months ended September 30, 2008, compared to the same periods in 2007, due to an increase in fuel surcharge participation, increased length of haul, rate increases, and improved system velocity on coal trains at the end of the third quarter. The increase was partially offset by lower volumes during the first half of 2008 due to higher stockpile levels, utility customer maintenance outages, and adverse weather in the Midwest affecting deliveries.
28
Operating Expenses.
Operating expenses increased $34.6 million and $100.5 million for the three and nine months ended September 30, 2008, when compared to the same periods in 2007, as shown below(in millions).
| | | | | | | | | | | | | | | | | |
| | | Three Months
| | | | |
| | | Ended September 30, | | | Change | |
| | | 2008 | | | 2007 | | | Dollars | | | Percent | |
| |
| Compensation and benefits | | $ | 92.2 | | | $ | 104.7 | | | $ | (12.5 | ) | | | (12 | )% |
| Purchased services | | | 51.0 | | | | 47.9 | | | | 3.1 | | | | 6 | % |
| Fuel | | | 90.1 | | | | 66.6 | | | | 23.5 | | | | 35 | % |
| Equipment costs | | | 45.1 | | | | 43.7 | | | | 1.4 | | | | 3 | % |
| Depreciation and amortization | | | 43.0 | | | | 38.9 | | | | 4.1 | | | | 11 | % |
| Casualties and insurance | | | 23.8 | | | | 15.9 | | | | 7.9 | | | | 50 | % |
| Materials and other | | | 35.3 | | | | 28.2 | | | | 7.1 | | | | 25 | % |
| | | | | | | | | | | | | | | | | |
| Total operating expenses | | $ | 380.5 | | | $ | 345.9 | | | $ | 34.6 | | | | 10 | % |
| | | | | | | | | | | | | | | | | |
| | | | | | | | | | | | | | | | | |
| | | Nine Months
| | | | |
| | | Ended September 30, | | | Change | |
| | | 2008 | | | 2007 | | | Dollars | | | Percent | |
| |
| Compensation and benefits | | $ | 296.6 | | | $ | 303.1 | | | $ | (6.5 | ) | | | (2 | )% |
| Purchased services | | | 145.6 | | | | 137.7 | | | | 7.9 | | | | 6 | % |
| Fuel | | | 259.2 | | | | 194.8 | | | | 64.4 | | | | 33 | % |
| Equipment costs | | | 138.8 | | | | 137.1 | | | | 1.7 | | | | 1 | % |
| Depreciation and amortization | | | 124.5 | | | | 117.8 | | | | 6.7 | | | | 6 | % |
| Casualties and insurance | | | 62.0 | | | | 52.8 | | | | 9.2 | | | | 17 | % |
| Materials and other | | | 102.6 | | | | 85.5 | | | | 17.1 | | | | 20 | % |
| | | | | | | | | | | | | | | | | |
| Total operating expenses | | $ | 1,129.3 | | | $ | 1,028.8 | | | $ | 100.5 | | | | 10 | % |
| | | | | | | | | | | | | | | | | |
Compensation and benefits. Compensation and benefits decreased $12.5 million for the three months ended September 30, 2008, compared to the same period in 2007, primarily due to decreases in incentive compensation expense, including the Mexico statutory profit sharing expense, and an increase in capitalized overhead rates based on new and updated studies versus the prior year period. Compensation and benefits decreased $6.5 million for the nine months ended September 30, 2008. Increases due to annual wage and salary rate increases and severance obligations were offset by lower share-based compensation expense as a result of forfeitures in the second quarter of 2008, and the aforementioned decreases in incentive compensation, including the Mexico statutory profit sharing expense, and an increase in capitalized overhead rates.
Purchased services. Purchased services increased $3.1 million and $7.9 million for the three and nine months ended September 30, 2008, compared to the same periods in 2007, primarily due to an increase in locomotive maintenance expense in Mexico, equipment and track structure maintenance expenses and volume driven switching costs during the first half of 2008.
Fuel. Fuel expense increased $23.5 million and $64.4 million for the three and nine months ended September 30, 2008, compared with the same periods in 2007, primarily due to higher diesel fuel prices, partially offset by lower consumption in certain parts of the network and increased fuel efficiency driven primarily by older locomotives being replaced with new locomotives through a strategic initiative in 2007 and 2008.
Equipment costs. Equipment costs increased $1.4 million and $1.7 million for the three and nine months ended September 30, 2008, primarily due to an increase in locomotive lease expense partially offset by lower car hire expenses.
29
Depreciation and amortization. Depreciation and amortization expenses increased $4.1 million and $6.7 million for the three and nine months ended September 30, 2008, compared to the same periods in 2007, primarily due to a larger asset base reflecting a continued commitment to investment in Mexico.
Casualties and insurance. Casualties and insurance expenses increased $7.9 million for the three months ended September 30, 2008, compared to the same period in 2007, primarily due to damage caused by hurricanes and higher costs associated with fewer derailments. Casualties and insurance expenses increased $9.2 million for the nine months ended September 30, 2008 primarily due to the aforementioned damages caused by hurricanes and lower expense in 2007 from a favorable reinsurance litigation settlement received in the second quarter of 2007, primarily offset by decreases in personal injury, derailment and environmental expenses.
Materials and other. Materials and other expense increased $7.1 million and $17.1 million for the three and nine months ended September 30, 2008, compared to the same periods in 2007, due to increased materials and supplies used for the maintenance of freight cars and locomotives and lower sales and use tax in the first quarter of 2007 as a result of a favorable tax ruling.
Non-Operating Expenses.
Equity in Net Earnings (Losses) of Unconsolidated Affiliates. Equity in earnings from unconsolidated affiliates was $5.0 million and $13.8 million for the three and nine month periods ended September 30, 2008, compared to $3.3 million and $7.2 million for the same periods in 2007. Significant components of this change are as follows:
| | |
| | • | Equity in earnings from the operations of Panama Canal Railway Company (“PCRC”) was $3.0 million and $6.4 million for the three and nine month periods ended September 30, 2008, compared to $1.4 million and $3.1 million for the same periods in 2007. The increase is primarily due to increased freight revenue driven by higher volume. |
| |
| | • | Equity in earnings of Southern Capital Corporation, LLC (“Southern Capital”) was $1.1 million and $3.9 million for the three and nine month periods ended September 30, 2008, compared to $0.9 million and $3.4 million for the same periods in 2007. The increase is primarily attributed to increased lease income as well as a reduction in interest and administrative expenses. |
| |
| | • | KCSM’s equity in earnings of Ferrocarril y Terminal del Valle de México, S.A. de C.V. (“FTVM”) was $0.9 million and $3.5 million for the three and nine month periods ended September 30, 2008, compared to earnings of $1.0 million and $0.7 million for the same periods in 2007. The increase for the nine months ended September 30, 2008, is primarily due to a maintenance accrual adjustment in the second quarter of 2008 and a prior year loss recorded in the first quarter of 2007. |
Interest Expense. Interest expense decreased by $1.8 million and $15.6 million for the three and nine months ended September 30, 2008, compared to the same periods in 2007, primarily due to lower interest rates related to debt refinancing as well as lower accrued interest for various tax related matters as a result of certain settlements in the second quarter of 2008.
Debt Retirement Costs. Debt retirement costs were $1.3 million lower for the nine months ended September 30, 2008, compared to the same period in 2007. In May 2008, KCSR redeemed its 91/2% Senior Notes due October 1, 2008 and expensed $5.6 million for cash tender offer expenses and unamortized debt issuance costs. In June of 2007, KCSM redeemed its 121/2% Senior Notes due in 2012 and entered into a new bank credit agreement. The charge of $16.7 million for the call premium and the write-off of unamortized debt issuance costs associated with the extinguished debt was partially offset by the $9.8 million write off of the unamortized purchase accounting fair value effect related to the 121/2% Senior Notes.
30
Foreign Exchange. For the three and nine months ended September 30, 2008, the foreign exchange was a loss of $7.5 million and a gain of $0.7 million, compared to a foreign exchange loss of $1.9 million and $1.6 million for the same periods in 2007, due to fluctuations in the U.S. dollar versus the Mexican peso exchange rates. At October 27, 2008, the exchange rate was Ps.13.4 per U.S. dollar versus Ps.10.79 per U.S. dollar at September 30, 2008; should the exchange rate stay at this amount on December 31, 2008, it would result in a significant foreign currency loss in the fourth quarter of 2008.
Other Income. Other income for the three and nine months ended September 30, 2008, was $3.8 million and $7.0 million, compared to $2.0 million and $5.9 million for the same periods in 2007, and consists primarily of miscellaneous interest income and dividend income.
Income Tax Expense. For the three and nine months ended September 30, 2008, the income tax provision was $25.1 million and $67.2 million as compared to $17.5 million and $40.6 million for the same periods in 2007. The increase in the income tax provision was primarily due to higher pre-tax income. The effective income tax rate was 32.7% and 31.7% for the three and nine months ended September 30, 2008, as compared to 27.2% and 29.0% for the same periods in 2007. The increase in the effective tax rate is primarily attributable to a shift in the composition of income between the U.S. and Mexico and foreign exchange rate fluctuations.
Liquidity and Capital Resources.
Overview.
KCS’ primary uses of cash are to support operations; maintain and improve its railroad and information systems infrastructure; pay debt service and preferred stock dividends; acquire new and maintain existing locomotives, rolling stock and other equipment; and meet other obligations. See “Cash Flow Information” below.
As of September 30, 2008, KCS has a debt capitalization ratio (total debt as a percentage of total debt plus equity) of 50.4 percent. Its primary sources of liquidity are cash flows generated from operations, borrowings under its revolving credit facilities and access to debt and equity capital markets. Although KCS has had more than adequate access to the capital markets, as a non-investment grade company, the financial terms under which funding is obtained often contain restrictive covenants. The covenants constrain financial flexibility by restricting or prohibiting certain actions, including the ability to incur additional debt for any purpose other than refinancing existing debt, create or suffer to exist additional liens, make prepayments of particular debt, pay dividends on common stock, make capital investments, engage in transactions with stockholders and affiliates, issue capital stock, sell certain assets, and engage in mergers and consolidations or in sale-leaseback transactions. On September 30, 2008, total available liquidity (the unrestricted cash balance plus revolving credit facility availability) was approximately $203 million.
As a result of KCS acquiring a controlling interest in KCSM, KCSM became subject to the terms and conditions of the indenture governing KCSR’s 71/2% senior notes issue. The restrictive covenants of the indenture limit the ability of KCSM to incur additional debt for any purpose other than the refinancing of existing debt and certain new asset financing. The Company was in compliance with all of its debt covenants as of September 30, 2008.
The Company believes, based on current expectations, that cash and other liquid assets, operating cash flows, access to capital markets, and other available financing resources will be sufficient to fund anticipated operating, capital and debt service requirements and other commitments in the foreseeable future. However, KCS’ operating cash flow and financing alternatives can be unexpectedly impacted by various factors, some of which are outside of its control. For example, if KCS was to experience a substantial reduction in revenues or a substantial increase in operating costs or other liabilities, its operating cash flows could be significantly reduced. Additionally, the Company is subject to economic factors surrounding capital markets and its ability to obtain financing under reasonable terms is subject to market conditions. Recent volatility in capital markets and the tightening of market liquidity could impact KCS’ access to capital. Further, KCS’ cost of debt can be impacted by independent rating agencies, which assign debt ratings based on certain credit measurements such as interest coverage and leverage ratios.
31
As of September 30, 2008, Standard & Poor’s Rating Service (“S&P”) rated the senior secured debt as BB, the senior unsecured debt as BB-, and the preferred stock as CCC+. S&P also maintained a corporate rating on KCS of B+ and gave KCS a developing outlook, which the Company believes is positive. Moody’s Investors Service (“Moody’s”) rated the senior secured debt as Ba2, the senior unsecured debt of KCSR as B2, the senior unsecured debt of KCSM as B1, and the preferred stock as B3. Moody’s also maintained a corporate rating of B1 and its outlook remains stable for all issuers.
On September 24, 2008, KCSM entered into a financing agreement (the “Agreement”) with DVB Bank AG (“DVB”). KCSM received the loan principal amount under the Agreement of $52.2 million on September 26, 2008. KCSM used the proceeds to finance approximately 80% of the purchase price oftwenty-nine ES44AC locomotives (the “Locomotives”) delivered and purchased by KCSM in June 2008. KCSM granted DVB a security interest in the Locomotives to secure the loan. The Agreement requires KCSM to make sixty equal quarterly principal payments plus interest at an annual rate of 6.195%. The first payment is due and payable on December 31, 2008, and the final payment is due and payable on September 29, 2023.
The Agreement contains representations, warranties and covenants typical of such equipment loan agreements. Events of default in the Agreement include, but are not limited to, certain payment defaults, certain bankruptcy and liquidation proceedings and the failure to perform any covenants or agreements contained in the Agreement. Any event of default could trigger acceleration of KCSM’s payment obligations under the terms of the Agreement.
Cash Flow Information.
Summary cash flow data follows(in millions):
| | | | | | | | | |
| | | Nine Months Ended September 30, | |
| | | 2008 | | | 2007 | |
| |
| Cash flows provided by (used for): | | | | | | | | |
| Operating activities | | $ | 333.1 | | | $ | 296.3 | |
| Investing activities | | | (417.3 | ) | | | (195.5 | ) |
| Financing activities | | | 125.2 | | | | (63.6 | ) |
| | | | | | | | | |
| Net increase in cash and cash equivalents | | | 41.0 | | | | 37.2 | |
| Cash and cash equivalents beginning of year | | | 55.5 | | | | 79.0 | |
| | | | | | | | | |
| Cash and cash equivalents end of period | | $ | 96.5 | | | $ | 116.2 | |
| | | | | | | | | |
During the nine months ended September 30, 2008, the consolidated cash position increased $41.0 million from December 31, 2007, due to improved operating performance, net proceeds from the issuance of the 8.0% Senior Notes and loan proceeds received from financing locomotives, which were partially offset by a higher level of capital expenditures and redemption of the 91/2% Senior Notes. As compared to the nine months ended September 30, 2007, cash flow from operating activities increased $36.8 million as a result of improved operating performance, partially offset by changes in working capital items, resulting mainly from the timing of certain payments and receipts. Net investing cash outflows increased $221.8 million due to a higher level of capital expenditures. Financing activity cash inflows increased $188.8 million due to the proceeds from the issuance of the 8.0% Senior notes and from financing locomotives purchased in December 2007, January 2008 and June 2008, partially offset by the redemption of the 91/2% Senior Notes.
KCS’ cash flow from operations has historically been sufficient to fund operations, roadway capital expenditures, other capital improvements and debt service. External sources of cash (principally bank debt, public and private debt, preferred stock and leases) have been used to refinance existing indebtedness and to fund acquisitions, new investments and equipment additions.
Capital Expenditures.
Capital improvements for roadway track structures and improvements are generally funded with cash flows from operations. KCS has historically used internally generated cash flows, loans or lease financing for equipment acquisition.
32
The following summarizes the cash capital expenditures by type(in millions):
| | | | | | | | | |
| | | Nine Months Ended September 30, | |
| | | 2008 | | | 2007 | |
| |
| Roadway capital programs | | | | | | | | |
| Track structure | | $ | 142.9 | | | $ | 102.9 | |
| Other improvements | | | 30.3 | | | | 16.6 | |
| | | | | | | | | |
| Total roadway capital programs | | | 173.2 | | | | 119.5 | |
| Locomotive acquisitions | | | 79.2 | | | | 8.4 | |
| Capacity | | | 105.3 | | | | 31.0 | |
| Equipment | | | 33.3 | | | | 28.9 | |
| Information technology | | | 6.2 | | | | 5.9 | |
| Other | | | 18.4 | | | | 19.3 | |
| | | | | | | | | |
| Total capital expenditures | | $ | 415.6 | | | $ | 213.0 | |
| | | | | | | | | |
Other Matters.
Employee and Labor Relations. A negotiating process for new, major collective bargaining agreements covering all of KCSR’s union employees has been underway since the bargaining round was initiated November 1, 2004. Wages, health and welfare benefits, work rules and other issues have traditionally been addressed through industry-wide negotiations. KCSR participates as a member of the National Carrier’s Conference Committee representing the participating carriers. Long term agreement settlements have been reached during 2007 and in the first half of 2008 covering approximately 95% of KCSR’s unionized work force. Negotiations are ongoing with one remaining union representing KCSR employees and are expected to conclude in the fourth quarter of 2008 under similar terms to the other settlements. Existing agreements continue to remain in effect until new agreements are reached. Contract negotiations with the various unions generally take place over an extended period of time and have not historically resulted in any disruption to business operations during negotiations.
KCSM union employees are covered by one labor agreement, which was signed on June 23, 1997 between KCSM and the Sindicato de Trabajadores Ferrocarrileros de la República Mexicana (Mexican Railroad Union), for a term of 50 years, for the purpose of regulating the relationship between the parties and improving conditions for the union employees. Approximately 80% of KCSM employees are covered by this labor agreement. The compensation terms under this labor agreement are subject to renegotiation on an annual basis. The labor negotiation with the Union in Mexico has not historically resulted in any disruption to business operations. KCSM anticipates that the expected negotiations concluded in the early fourth quarter of 2008 will not have a material impact to the consolidated financial statements.
| |
| Item 3. | Quantitative and Qualitative Disclosures about Market Risk. |
There was no material change during the quarter from the information set forth in Part II, Item 7A. “Quantitative and Qualitative Disclosure about Market Risk” in the Annual Report onForm 10-K for the year ended December 31, 2007.
| |
| Item 4. | Controls and Procedures. |
(a) Disclosure Controls and Procedures
As of the end of the fiscal quarter for which this Quarterly Report onForm 10-Q is filed, the Company’s Chief Executive Officer and Chief Financial Officer have each reviewed and evaluated the effectiveness of the Company’s disclosure controls and procedures (as defined inRules 13a-15(e) and15d-15(e) under the Exchange Act). Based on that evaluation, the Chief Executive Officer and Chief Financial Officer have each concluded that the Company’s current disclosure controls and procedures are effective to ensure that
33
information required to be disclosed by the Company in reports that it files or submits under the Exchange Act is recorded, processed, summarized and reported within the time periods specified in the Securities and Exchange Commission rules and forms, and include controls and procedures designed to ensure that information required to be disclosed by the Company in such reports is accumulated and communicated to the Company’s management, including the Chief Executive Officer and Chief Financial Officer, as appropriate to allow timely decisions regarding required disclosure.
(b) Changes in Internal Control over Financial Reporting
There have not been any changes in the Company’s internal control over financial reporting that occurred during the fiscal quarter for which this Quarterly Report onForm 10-Q is filed that have materially affected, or are reasonably likely to materially affect, the Company’s internal controls over financial reporting.
| |
| Item 4T. | Controls and Procedures. |
Not applicable.
PART II — OTHER INFORMATION
| |
| Item 1. | Legal Proceedings. |
For information related to the Company’s settlements and other legal proceedings, see Note 9, Commitments and Contingencies under Part I, Item 1, of this quarterly report onForm 10-Q.
There were no material changes during the quarter in the Risk Factors disclosed in Item 1A — “Risk Factors” in our annual report onForm 10-K for the year ended December 31, 2007.
| |
| Item 2. | Unregistered Sale of Equity Securities and Use of Proceeds. |
None
| |
| Item 3. | Defaults upon Senior Securities. |
None
| |
| Item 4. | Submission of Matters to a Vote of Security Holders. |
On October 7, 2008, the Company held a special meeting of its stockholders (“the Meeting”) for the purpose of seeking stockholder approval of the KCS 2008 Stock Option and Performance Award Plan (the “Plan”). A total of 71,361,192 shares of the common stock, $.01 per share par value, and preferred stock, par value $25.00 per share, or 78.03% of the outstanding voting stock on the record date (91,457,913 shares), was represented at the Meeting, thereby constituting a quorum. These shares voted together as a single class. The number of votes cast for and against approval of the Plan is set forth in the following table:
| | | | | |
| | | Total Shares | |
| |
| Approval of 2008 Stock Option and Performance Award Plan | | | | |
| For | | | 64,933,168 | |
| Against | | | 6,343,473 | |
| Withheld | | | 84,551 | |
| | | | | |
| Total | | | 71,361,192 | |
| | | | | |
| |
| Item 5. | Other Information. |
None
34
| | | | | |
Exhibit No. | | Description of Exhibits Filed with this Report |
| |
| | 10 | .1 | | Loan Agreement, dated as of September 24, 2008, between Kansas City Southern de Mexico, S.A. de C.V. and DVB Bank AG, is attached to thisForm 10-Q as Exhibit 10.1. |
| | 15 | .1 | | Letter regarding unaudited interim financial information is attached to thisForm 10-Q as Exhibit 15.1. |
| | 31 | .1 | | Principal Executive Officer’s Certification Pursuant to Section 302 of the Sarbanes-Oxley Act of 2002 is attached to thisForm 10-Q as Exhibit 31.1. |
| | 31 | .2 | | Principal Financial Officer’s Certification Pursuant to Section 302 of the Sarbanes-Oxley Act of 2002 is attached to thisForm 10-Q as Exhibit 31.2. |
| | 32 | .1 | | Principal Executive Officer’s Certification furnished Pursuant to Section 906 of the Sarbanes-Oxley Act of 2002 is attached to thisForm 10-Q as Exhibit 32.1. |
| | 32 | .2 | | Principal Financial Officer’s Certification furnished Pursuant to Section 906 of the Sarbanes-Oxley Act of 2002 is attached to thisForm 10-Q as Exhibit 32.2. |
| | | | | |
Exhibit No. | | Description of Exhibits Incorporated by Reference |
| |
| | 10 | .2 | | Employment Agreement, dated September 10, 2008, between The Kansas City Southern Railway Company and David L. Starling, filed as Exhibit 10.1 to the Company’s Current Report onForm 8-K filed on September 15, 2008 (FileNo. 1-4717), is incorporated herein by reference as Exhibit 10.2. |
| | 10 | .3 | | Employment Agreement, dated August 15, 2008, between The Kansas City Southern Railway Company and Michael W. Upchurch, filed as Exhibit 10.1 to the Company’s Current Report onForm 8-K filed on October 22, 2008 (File No.1-4717), is incorporated herein by reference as Exhibit 10.3. |
| | 10 | .4 | | First Amendment to the Kansas City Southern 1991 Amended and Restated Stock Option and Performance Award Plan, effective July 2, 2008 filed as Exhibit 10.1 to the Company’s Current Report onForm 8-K filed on July 8, 2008 (FileNo. 1-4717), is incorporated herein by reference as Exhibit 10.4. |
| | 10 | .5 | | Kansas City Southern 2008 Stock Option and Performance Award Plan, effective October 14, 2008, filed as Exhibit 10.1 to the Company’s Current Report onForm 8-K filed on October 7, 2008(File No. 1-4717), is incorporated herein by reference as Exhibit 10.5. |
35
SIGNATURES
Pursuant to the requirements of the Securities Exchange Act of 1934, the Company has duly caused this report to be signed on its behalf by the undersigned thereunto duly authorized and in the capacities indicated on October 28, 2008.
Kansas City Southern
Michael W. Upchurch
Executive Vice President and Chief Financial Officer
(Principal Financial Officer)
Michael K. Borrows
Senior Vice President and Chief Accounting Officer
(Principal Accounting Officer)
36