Exhibit 99.1
Kansas City Southern Mike Up church - Executive Vice President & CFO Wells Fargo Securities 2013 Industrial and Construction Conference May 9, 2013
Safe Harbor Statement This presentation contains “forward-looking statements” within the meaning of the securities laws concerning potential future events involving KCS and its subsidiaries, which could materially differ from the events that actually occur. The words “projects,” “estimates,” “forecasts,” “believes,” “intends,” “expects,” “anticipates,” and similar expressions are intended to identify forward-looking statements. Such forward-looking statements are based upon information currently available to management and management’s perception thereof as of the date of this presentation. Differences that actually occur could be caused by a number of external factors over which management has little or no control, including: competition and consolidation within the transportation industry; the business environment in industries that produce and consume rail freight; revocation of the rail concession of KCS’s subsidiary, Kansas City Southern de México, S.A. de C.V.; the termination of, or failure to renew, agreements with customers, other railroads and third parties; interest rates; access to capital; disruptions to KCS’s technology infrastructure, including its computer systems; natural events such as severe weather, hurricanes and floods; market and regulatory responses to climate change; credit risk of customers and counterparties and their failure to meet their financial obligations; legislative and regulatory developments and disputes; rail accidents or other incidents or accidents along KCS’s rail network, facilities or customer facilities involving the release of hazardous materials, including toxic inhalation hazards; fluctuation in prices or availability of key materials, in particular diesel fuel; dependency on certain key suppliers of core rail equipment; changes in securities and capital markets; loss of key personnel; labor difficulties, including strikes and work stoppages; insufficiency of insurance to cover lost revenue, profits or other damages; acts of terrorism or risk of terrorist activities; war or risk of war; domestic and international economic conditions; political and economic conditions in Mexico and the level of trade between the United States and Mexico; the outcome of claims and litigation involving KCS or its subsidiaries; and other factors affecting the operation of the business. More detailed information about these factors may be found in filings by KCS with the Securities and Exchange Commission, including KCS’s Annual Report on Form 10-K for the year ended December 31, 2012 (File No. 1-4717) and subsequent reports. Forward-looking statements are not, and should not be relied upon as, a guarantee of future performance or results, nor will they necessarily prove to be accurate indications of the times at or by which any such performance or results will be achieved. As a result, actual outcomes and results may differ materially from those expressed in forward-looking statements. KCS is not obligated to update any forward-looking statements in this presentation to reflect future events or developments. All reconciliations to GAAP can be found on the KCS website, kcsouthern.com/investors. Kansas City Southern ©2013 2
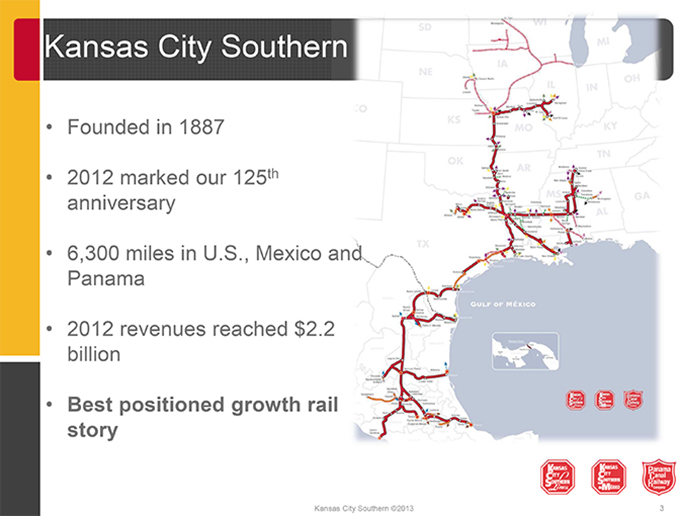
Founded in 1887 2012 marked our 125th anniversary 6,300 miles in U.S., Mexico and Panama 2012 revenues reached $2.2 billion Best positioned growth rail story Kansas City Southern ©2013 3
Q1 2013 Financial Results & Business Update Kansas City Southern ©2013 4
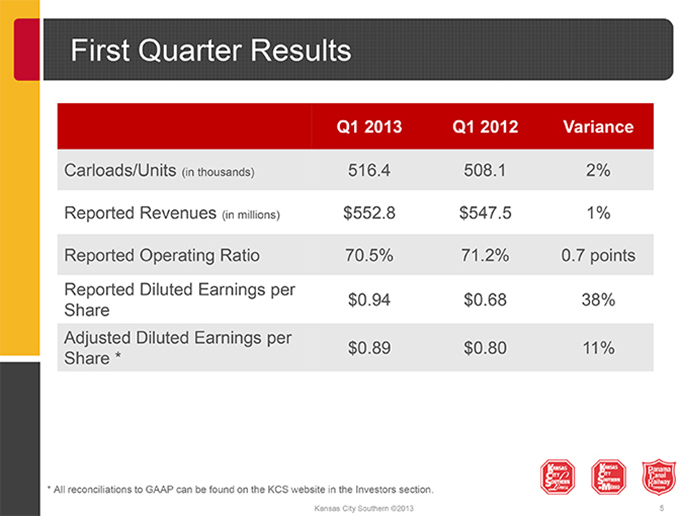
First Quarter Results
Q1 2013 Q1 2012 Variance
Carloads/Units (in thousands) 516.4 508.1 2%
Reported Revenues (in millions) $552.8 $547.5 1%
Reported Operating Ratio 70.5% 71.2% 0.7 points
Reported Diluted Earnings per
$0.94 $0.68 38% Share Adjusted Diluted Earnings per
$0.89 $0.80 11% Share *
* All reconciliations to GAAP can be found on the KCS website in the Investors section.
Kansas City Southern ©2013 5
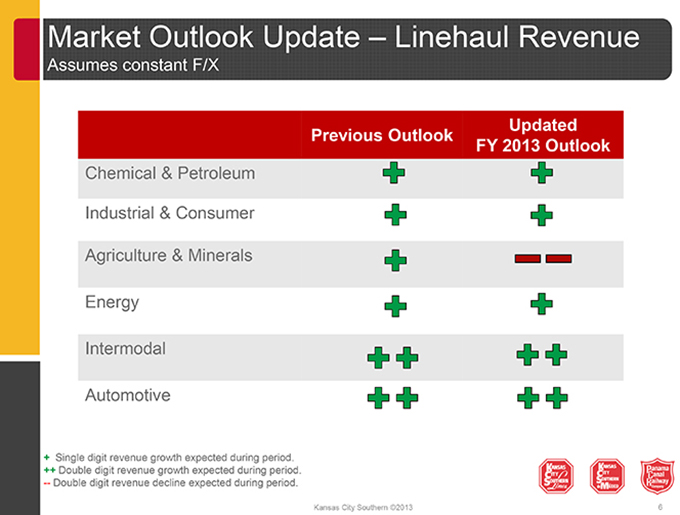
Market Outlook Update – Linehaul Revenue
Assumes constant F/X
Updated Previous Outlook FY 2013 Outlook
Chemical & Petroleum Industrial & Consumer Agriculture & Minerals Energy Intermodal Automotive
+ Single digit revenue growth expected during period.
++ Double digit revenue growth expected during period.
-- Double digit revenue decline expected during period.
Kansas City Southern ©2013 6
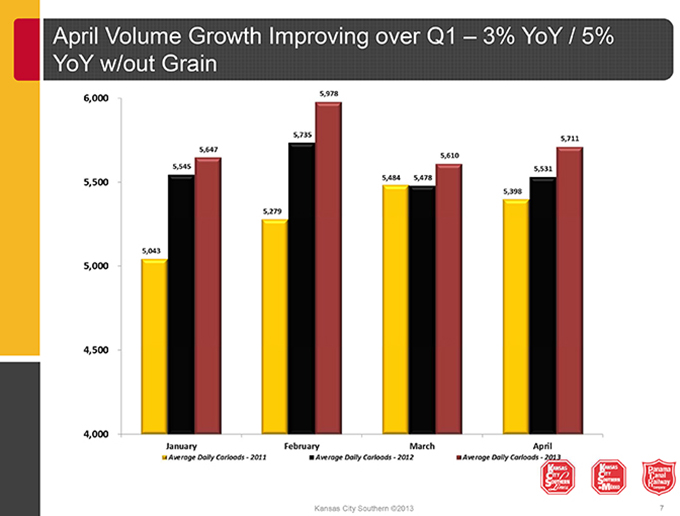
April Volume Growth Improving over Q1 – 3% YoY / 5% YoY w/out Grain
Kansas City Southern ©2013 7
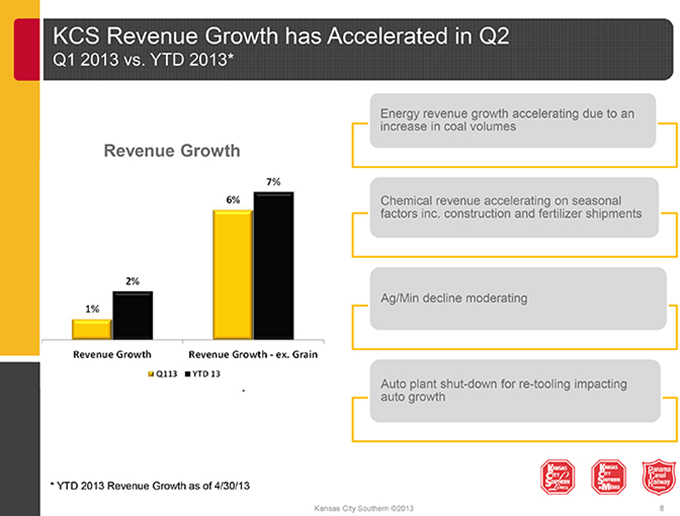
KCS Revenue Growth has Accelerated in Q2
Q1 2013 vs. YTD 2013*
Energy revenue growth accelerating due to an increase in coal volumes
Revenue Growth
Chemical revenue accelerating on seasonal factors inc. construction and fertilizer shipments
Ag/Min decline moderating
Auto plant shut-down for re-tooling impacting * auto growth
* YTD 2013 Revenue Growth as of 4/30/13
Kansas City Southern ©2013 8

Capital Structure & Credit
Kansas City Southern ©2013 9
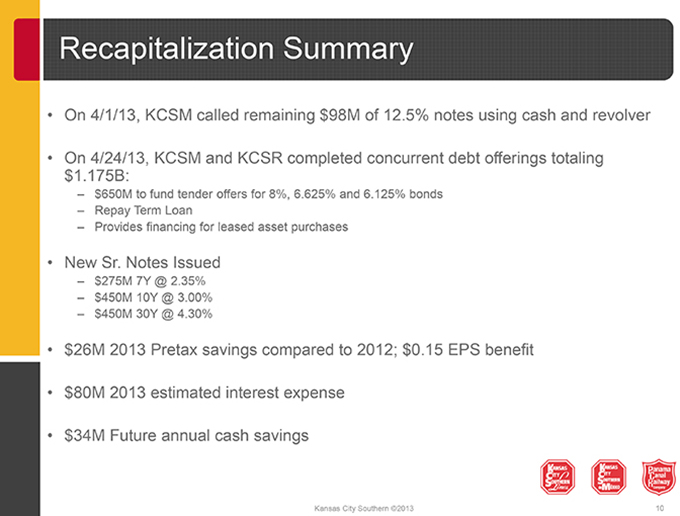
Recapitalization Summary
On 4/1/13, KCSM called remaining $98M of 12.5% notes using cash and revolver
On 4/24/13, KCSM and KCSR completed concurrent debt offerings totaling $1.175B:
– $650M to fund tender offers for 8%, 6.625% and 6.125% bonds
– Repay Term Loan
– Provides financing for leased asset purchases
New Sr. Notes Issued
– $275M 7Y @ 2.35%
– $450M 10Y @ 3.00%
– $450M 30Y @ 4.30%
$26M 2013 Pretax savings compared to 2012; $0.15 EPS benefit
$80M 2013 estimated interest expense
$34M Future annual cash savings
Kansas City Southern ©2013 10
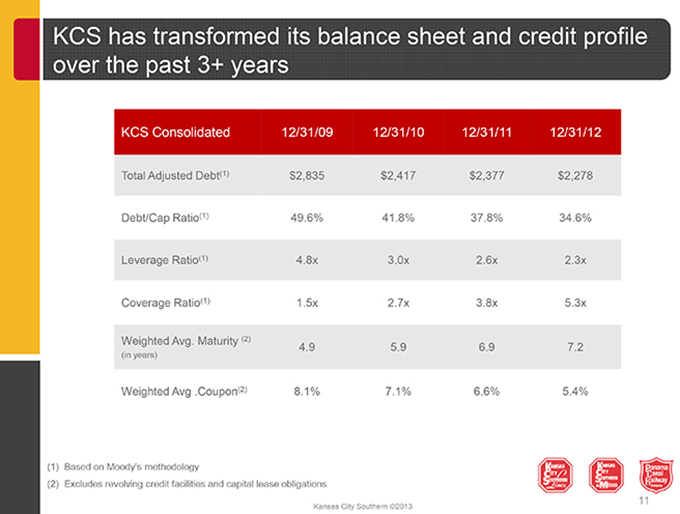
KCS has transformed its balance sheet and credit profile over the past 3+ years
KCS Consolidated 12/31/09 12/31/10 12/31/11 12/31/12
Total Adjusted Debt(1) $2,835 $2,417 $2,377 $2,278 Debt/Cap Ratio(1) 49.6% 41.8% 37.8% 34.6% Leverage Ratio(1) 4.8x 3.0x 2.6x 2.3x
Coverage Ratio(1) 1.5x 2.7x 3.8x 5.3x
Weighted Avg. Maturity (2)
4.9 5.9 6.9 7.2
(in years)
Weighted Avg .Coupon(2) 8.1% 7.1% 6.6% 5.4%
(1) Based on Moody’s methodology
(2) Excludes revolving credit facilities and capital lease obligations
11
Kansas City Southern ©2013

Comparing KSU’s Financing to its Rail Peers
Significant Tenor Extension at Attractive Coupons
30
Weighted Average Maturity Comparison (years)
24 Peer average = 16.3 years
24.3y 18
15.6y 16.8y
12 13.9y 14.2y 14.3y
13.1y
6 7.2y 0
Weighted Average Coupon Comparison (%)
Peer average = 5.68%
7.5%
6.0%
4.5% 6.32% 5.93% 5.63% 5.49% 5.40% 5.36% 5.36%
3.0% 3.73%
1.5%
0.0%
SOURCE: Bloomberg, Company Filings
Kansas City Southern ©2013 12
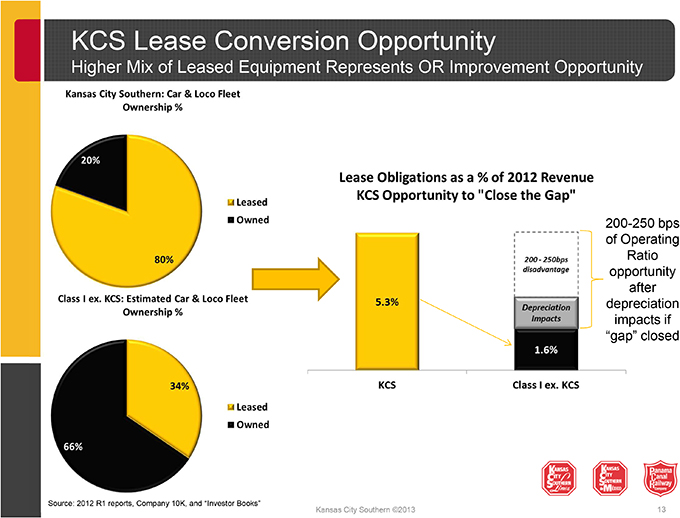
KCS Lease Conversion Opportunity
Higher Mix of Leased Equipment Represents OR Improvement Opportunity
200-250 bps of Operating Ratio opportunity after depreciation impacts if “gap” closed
Source: 2012 R1 reports, Company 10K, and “Investor Books”
Kansas City Southern ©2013 13
Strategic Growth Areas
Kansas City Southern ©2013 14
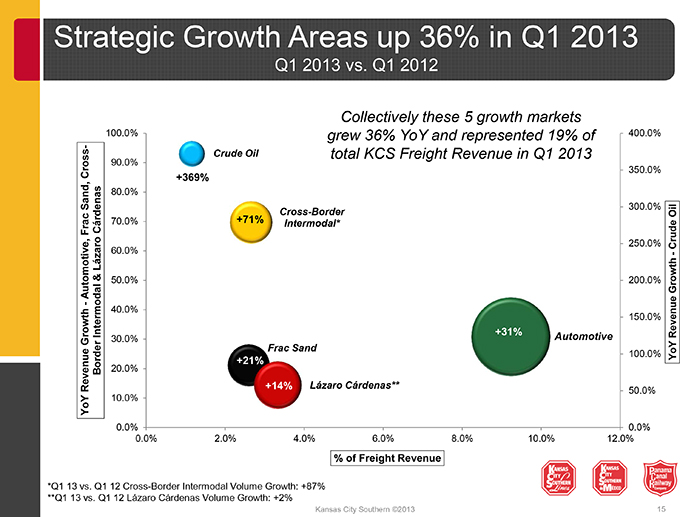
Strategic Growth Areas up 36% in Q1 2013
Q1 2013 vs. Q1 2012
Collectively these 5 growth markets
100.0% grew 36% YoY and represented 19% of 400.0%
Cross-
Crude Oil total KCS Freight Revenue in Q1 2013
90.0%
+369% 350.0% 80.0% Sand, 300.0%
Cross-Border Oil
Frac Cárdenas 70.0% +71% Intermodal*
250.0% Crude 60.0% -
Lázaro & 50.0% 200.0% Growth
Automotive,
- 40.0%
+35% 150.0%
Intermodal +31% Revenue
Growth 30.0% Automotive
Frac Sand
+21% 100.0% YoY
Border 20.0%
Revenue +14% Lázaro Cárdenas**
50.0% YoY 10.0% 0.0% 0.0% 0.0% 2.0% 4.0% 6.0% 8.0% 10.0% 12.0%
% of Freight Revenue
*Q1 13 vs. Q1 12 Cross-Border Intermodal Volume Growth: +87% **Q1 13 vs. Q1 12 Lázaro Cárdenas Volume Growth: +2%
Kansas City Southern ©2013 15

Automotive Franchise
Kansas City Southern ©2013 16
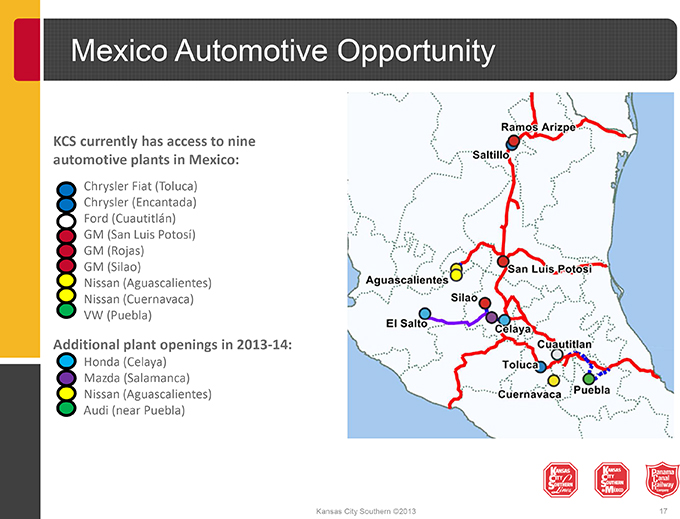
Mexico Automotive Opportunity
KCS currently has access to nine automotive plants in Mexico:
Chrysler Fiat (Toluca) Chrysler (Encantada) Ford (Cuautitlán) GM (San Luis Potosí) GM (Rojas) GM (Silao) Nissan (Aguascalientes) Nissan (Cuernavaca) VW (Puebla)
Additional plant openings in 2013-14:
Honda (Celaya) Mazda (Salamanca) Nissan (Aguascalientes) Audi (near Puebla)
Kansas City Southern ©2013 17
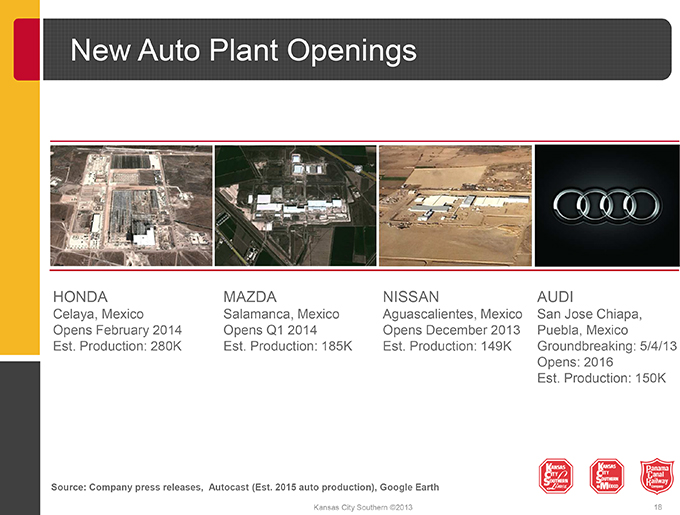
New Auto Plant Openings
HONDA MAZDA NISSAN AUDI
Celaya, Mexico Salamanca, Mexico Aguascalientes, Mexico San Jose Chiapa, Opens February 2014 Opens Q1 2014 Opens December 2013 Puebla, Mexico Est. Production: 280K Est. Production: 185K Est. Production: 149K Groundbreaking: 5/4/13 Opens: 2016 Est. Production: 150K
Source: Company press releases, Autocast (Est. 2015 auto production), Google Earth
Kansas City Southern ©2013 18
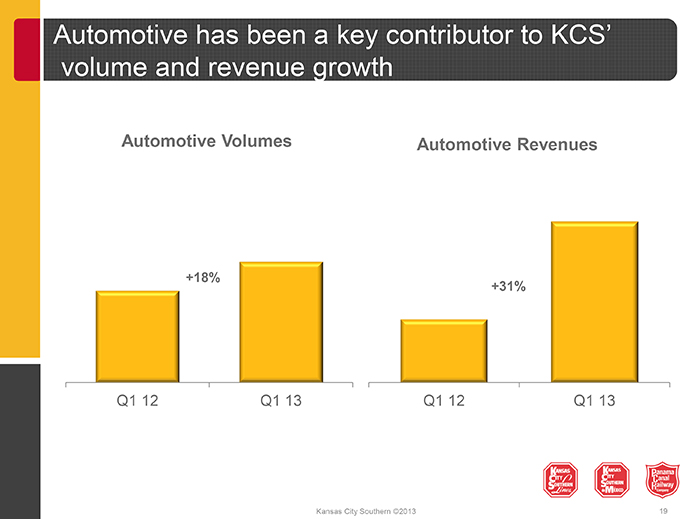
Automotive has been a key contributor to KCS’ volume and revenue growth
Automotive Volumes Automotive Revenues
+18%
+31%
Q1 12 Q1 13 Q1 12 Q1 13
Kansas City Southern ©2013 19
Cross Border Intermodal
Kansas City Southern ©2013 20
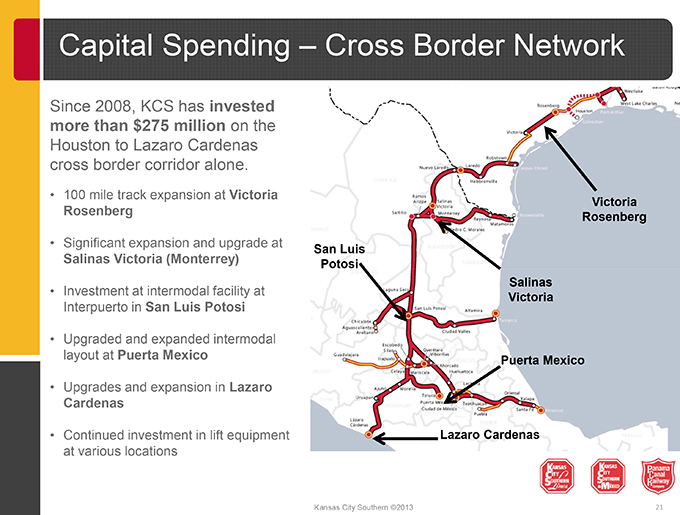
Capital Spending – Cross Border Network
Since 2008, KCS has invested more than $275 million on the
Houston to Lazaro Cardenas cross border corridor alone.
100 mile track expansion at Victoria
Rosenberg Victoria
Rosenberg
Significant expansion and upgrade at
Salinas Victoria (Monterrey) San Luis
Potosi
Salinas
Investment at intermodal facility at
Interpuerto in San Luis Potosi Victoria
Upgraded and expanded intermodal layout at Puerta Mexico
Puerta Mexico
Upgrades and expansion in Lazaro Cardenas
Continued investment in lift equipment Lazaro Cardenas at various locations
Kansas City Southern ©2013 21
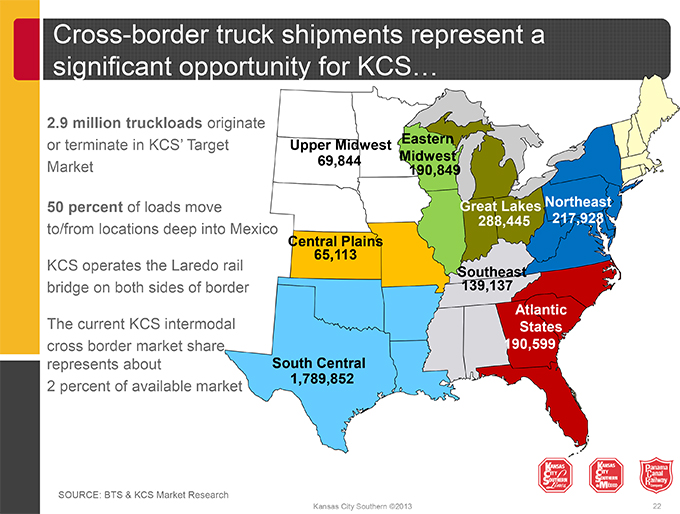
Cross-border truck shipments represent a
significant opportunity for KCS…
2.9 million truckloads originate
or terminate in KCS’ Target Upper Midwest Eastern
69,844 Midwest
Market 190,849
155K
50 percent of loads move Great LakesNortheast
to/from locations deep into Mexico 134K 288,445 217,928
Central Plains
65,113
KCS operates the Laredo rail Southeast
bridge on both sides of border 139,137
Atlantic
The current KCS intermodal States
cross border market share 190,599
represents about South Central
1,742K
2 percent of available market 1,789,852
SOURCE: BTS & KCS Market Research
Kansas City Southern ©2013 22
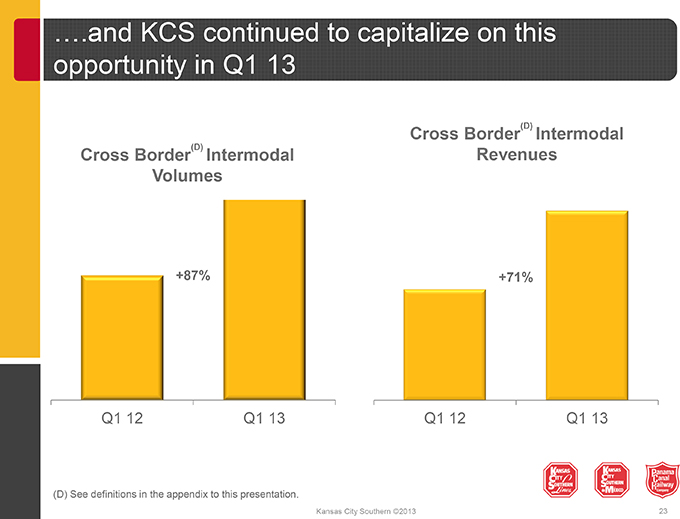
….and KCS continued to capitalize on this opportunity in Q1 13
(D)
Cross Border Intermodal
(D)
Cross Border Intermodal Revenues Volumes
+87% +71%
Q1 12 Q1 13 Q1 12 Q1 13
(D) See definitions in the appendix to this presentation.
Kansas City Southern ©2013 23
Lázaro Cárdenas
Kansas City Southern ©2013 24
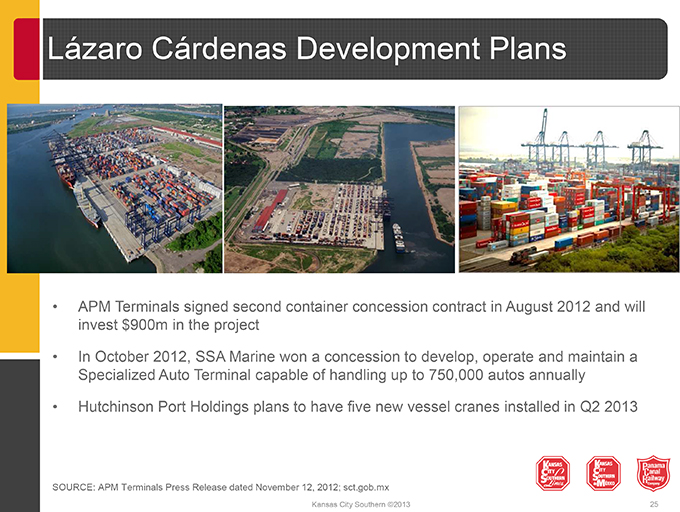
Lázaro Cárdenas Development Plans
• APM Terminals signed second container concession contract in August 2012 and will invest $900m in the project
• In October 2012, SSA Marine won a concession to develop, operate and maintain a Specialized Auto Terminal capable of handling up to 750,000 autos annually
• Hutchinson Port Holdings plans to have five new vessel cranes installed in Q2 2013
SOURCE: APM Terminals Press Release dated November 12, 2012; sct.gob.mx
Kansas City Southern ©2013 25
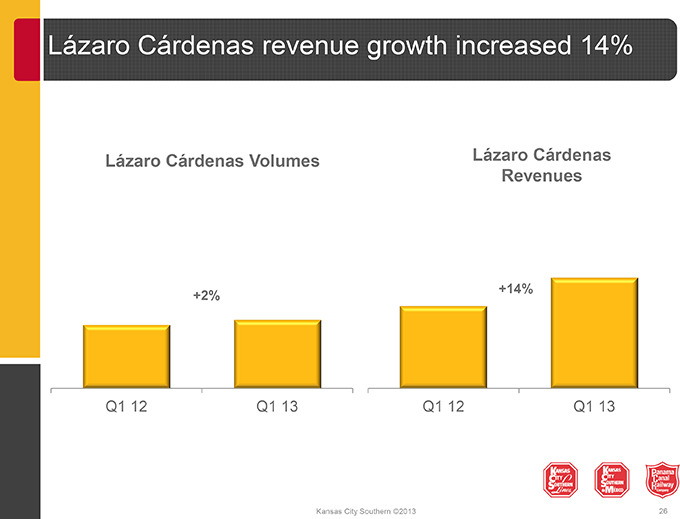
Lázaro Cárdenas revenue growth increased 14%
Lázaro Cárdenas Volumes Lázaro Cárdenas Revenues
+14% +2%
Q1 12 Q1 13 Q1 12 Q1 13
Kansas City Southern ©2013 26

Energy
Kansas City Southern ©2013 27
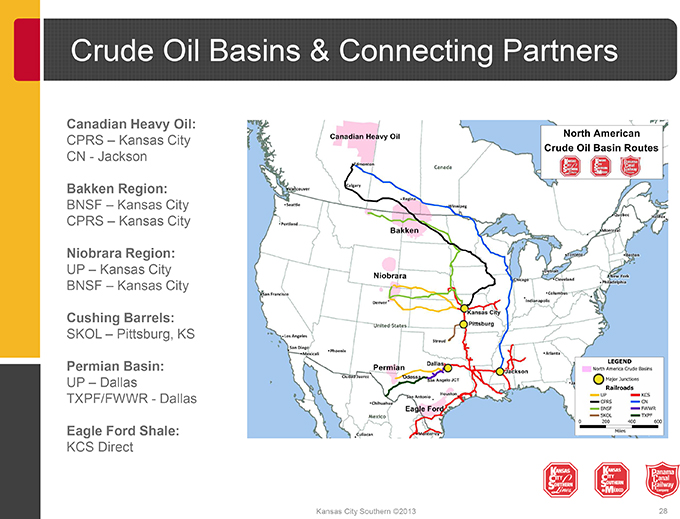
Crude Oil Basins & Connecting Partners
Canadian Heavy Oil:
CPRS – Kansas City CN - Jackson
Bakken Region:
BNSF – Kansas City CPRS – Kansas City
Niobrara Region:
UP – Kansas City BNSF – Kansas City
Cushing Barrels:
SKOL – Pittsburg, KS
Permian Basin:
UP – Dallas
TXPF/FWWR - Dallas
Eagle Ford Shale:
KCS Direct
Kansas City Southern ©2013 28
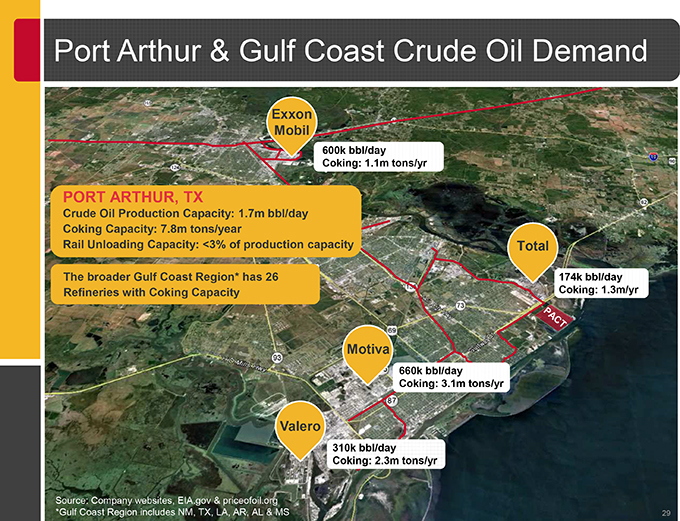
Port Arthur & Gulf Coast Crude Oil Demand
Exxon Mobil
600k bbl/day
Coking: 1.1m tons/yr
PORT ARTHUR, TX
Crude Oil Production Capacity: 1.7m bbl/day Coking Capacity: 7.8m tons/year
Rail Unloading Capacity: <3% of production capacity Total
The broader Gulf Coast Region* has 26 174k bbl/day Refineries with Coking Capacity Coking: 1.3m/yr
Motiva
660k bbl/day
Coking: 3.1m tons/yr
Valero
310k bbl/day
Coking: 2.3m tons/yr
Source: Company websites, EIA.gov & priceofoil.org
*Gulf Coast Region includes NM, TX, LA, AR, AL & MS 29
Conclusion
Kansas City Southern ©2013 30
KSU Investment Highlights
Best-positioned growth story in the industry with unique U.S.-Mexico cross-border network and the most profitable rail franchise in Mexico
Track record of strong financial and operating performance
Well-diversified customer base and commodity mix
Excellent strategic positioning with multiple growth drivers
Solid balance sheet with a commitment to maintaining investment grade credit rating
Kansas City Southern ©2013 31