Edison Electric Institute
38th Annual Financial Conference
October 27-29, 2003

Forward-Looking Statements
Disclosure
The following presentation contains some “forward-looking statements” with respect to
Westar’s future plans, expectations and goals, including management’s expectations with
respect to the execution of Westar’s restructuring plan and the implementation of
recommendations resulting from the Special Committee investigation. The Private Securities
Litigation Reform Act of 1995 has established that these statements qualify for safe harbors from
liability.
Although we believe that the expectations and goals reflected in such forward-looking
statements are based on reasonable assumptions, all forward-looking statements involve risk
and uncertainty. Therefore, actual results could vary materially from what we expect. Please
review our quarterly report on Form 10-Q for second quarter 2003 and our 2002 annual report on
Form 10-K for important risk factors that could cause results to differ materially from those in any
such forward-looking statements.
Any forward-looking statement speaks only as of the date such statement was made, and
we do not undertake any obligation to update any forward-looking statement to reflect events or
circumstances after the date on which such statement was made except as required by
applicable laws or regulations.

Strategy & Restructuring Plan
Strategy
Westar is returning to its roots as an
integrated electric utility in Kansas.

New Leadership
Executive Management
CEO, Jim Haines
22 years of utility experience; 16 years in Kansas
5 years as CEO of El Paso Electric
COO, Bill Moore
23 years of utility experience; all in Kansas
Both operational and financial experience
CFO, Mark Ruelle
17 years of utility experience; 11 years in Kansas
Both operational and financial experience
Corporate officers as a group average nearly 20 years of utility
industry experience

New Leadership
Board of Directors
New independent directors
Mollie Hale Carter (agriculture & banking interests, ADM board member)
Art Krause (retired CFO, Sprint)
Mike Morrissey (retired Ernst & Young audit partner)

Restructuring Plan
Reduce debt
Return to being a pure Kansas electric utility
Divest non-utility assets by year-end 2004
Dramatically simplify current corporate structure
On February 6th Westar Energy Inc. filed a restructuring
plan with the Kansas Corporation Commission (KCC)
On July 25th the KCC approved the Plan
as modified by a settlement agreement
Debt Reduction Progress
Expected
Expected Debt
Actual
Status
Timing
Debt Reduction Plan Component
Reduction (mm)
Results
Completed
Sale of ONEOK Stock - Tranche 1
$244
$244
Completed
Obtain relief from legal order to restructure
Completed
Obtain relief for Protection One interim support
Completed/Ongoing
Common Dividend Reduction
55*
On track
Completed
Sale of Protection One Europe
50-100
114
Completed
Obtain KCC approval of Debt Reduction Plan
Completed
Sale of ONEOK Stock - Tranche 2
180-290**
244
Completed
Sale of Utility Assets to Midwest Energy
N/A
24
Late '03 - Early '04
Sale of Protection One
500 - 650
1st Half 2004
Sale of ONEOK Stock - Tranche 3
115-150**
2nd Half 2004
Sale of ONEOK Stock - Tranche 4
115-150**
2003-04/Ongoing
Cash Flow From Operations
150-200
Late 2004
Possible Equity Issuance
0-250
* Savings expected through 2004
** Expected debt reduction amounts adjusted, assume remaining disposition in 2 equal tranche offerings
Note: All debt reduction figures are net of expected tax expense or benefit

Remaining Steps
Dispose of remaining ONEOK Holdings
13.7 million shares (14.5%)
Current market value approximately $285 million
Dispose of Protection One
Estimated range of value for debt reduction: $500 - $650 million
POI debt balance
Intercompany debt $216 million
Non-affiliate debt $333 million
$26 million held by Westar
Potential equity issuance
Manage amount and timing

Utility Operations
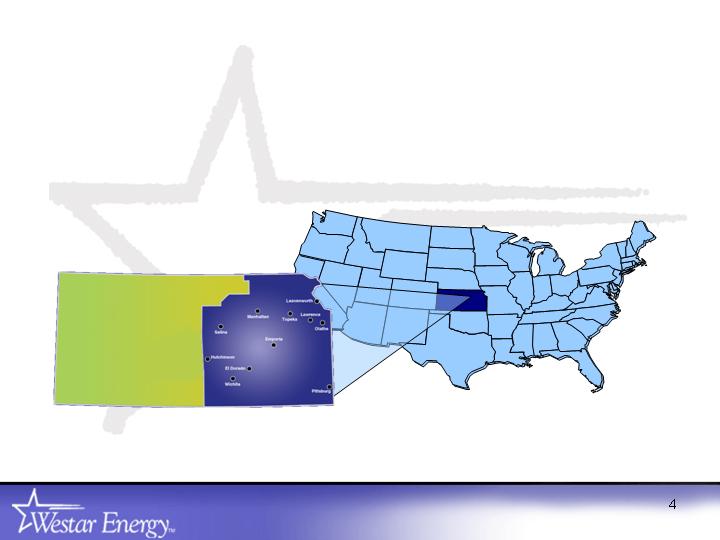
Westar Utility Operations
Kansas’ largest electric provider
647,000 customers
11,000 square mile service
territory
Nearly 6,000 MW of generation
Peak load of 4,655 MW
34,800 miles of T & D
About 2,000 employees
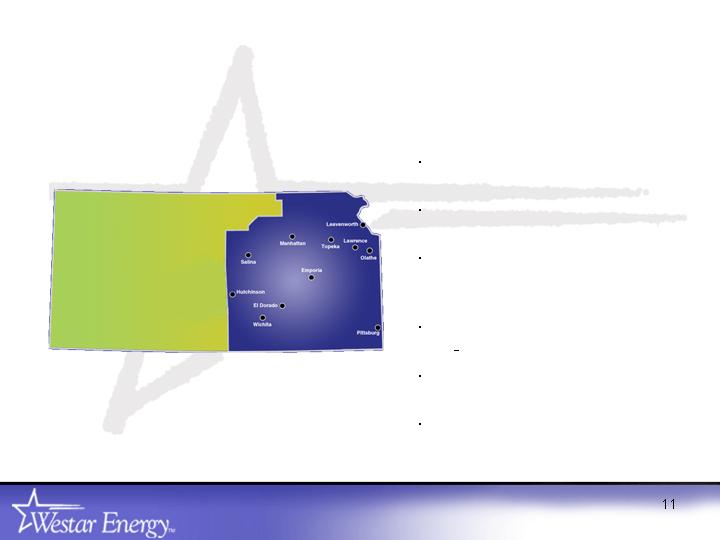
Service Territory
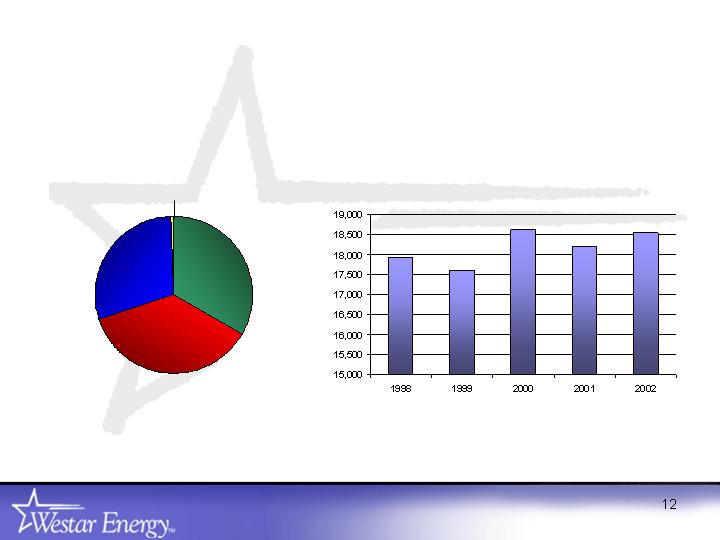
Diverse Customer Base
Retail MWh by Year
Retail Sales by Class
Year end 2002
Commercial
37%
Residential
33%
Industrial
29%
Other
1%
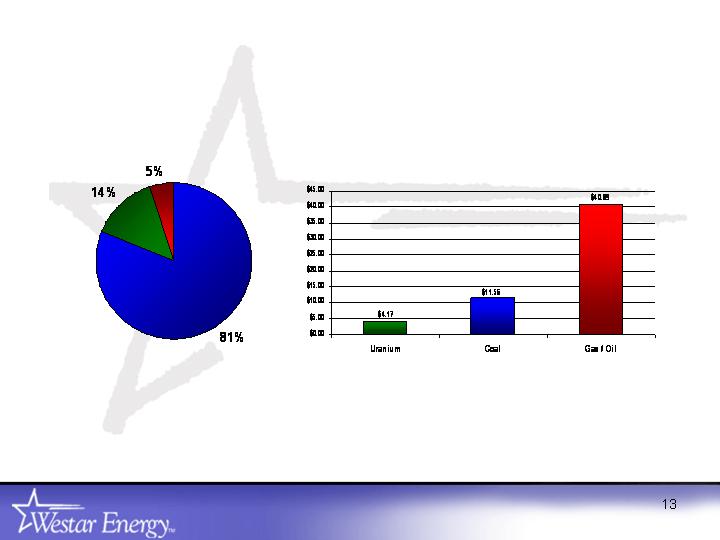
Generation Cost by Fuel Type
95% of the electricity generated is fueled by coal or uranium
Energy Sources
Fuel Cost by Source
$/MWh

Generation Performance
12 months ended September 2003
Capacity
Forced
Factor
Outage Rate
Availability
Coal
77%
3%
91%
Nuclear
101%
1%
99%
Gas/Oil
7%
10%
94%
2001
2002
2003
Net Generating Capacity
5,534
5,517
5,398
System Peak Responsibility
4,282
4,218
4,414
Capacity Margin
1,252
1,299
984
Reserve Margin
23%
24%
18%

Wolf Creek
NRC oversight indicators are “green”
More than four years with no violations
Received a “2” rating (Exemplary) in April 2003 INPO assessment
Operations Training Program accreditation renewed by the Nuclear
Accrediting Board in January 2003
2003 refueling outage began October 17

Generation and Marketing
Power Marketing
Value at Risk (VaR) limit of $2.4 million
Risk controls consistently applied
Trades occur only in areas we can physically send and receive power
(SPP, MAIN, ECAR, MAPP, SERC)
Power sales and purchases physically backstopped by what we can
consume or produce
Wholesale margins integral to rate-setting process
$19 million asset-based wholesale margins imputed to retail rates
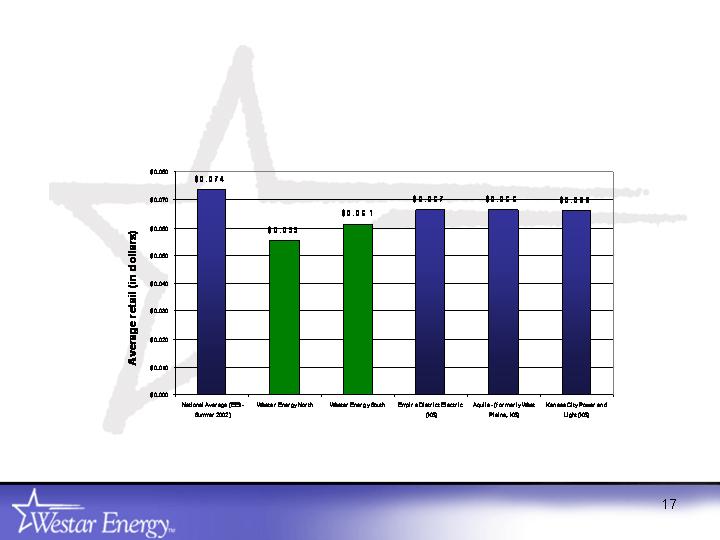
Total Retail Rate Comparison
Source: EEI, Jan. 1, 2003

Rate & Regulatory Matters
Kansas rate case to be filed May 1, 2005
Based on 2004 test year
New rates to be effective January 2006
Two rebates to retail customers:
$10.5 million May 1, 2005
$10 million January 1, 2006
Amortized at $707K/month through December 2005
EPA New Source Review

Market Response &
Investment Considerations
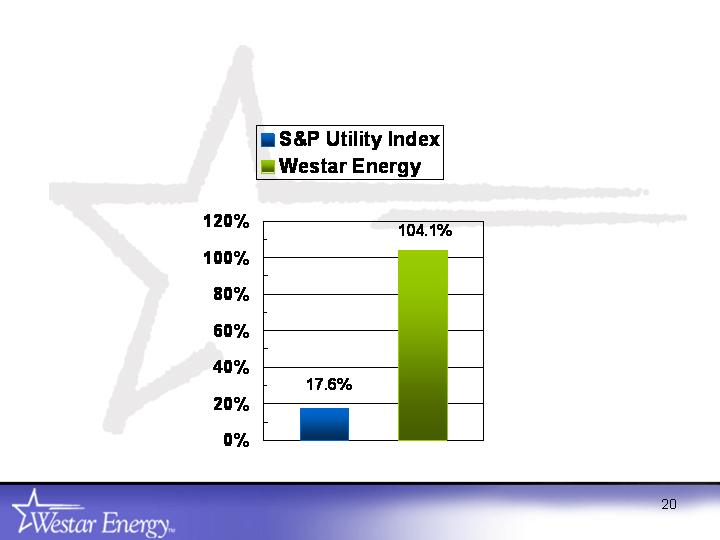
Year to Date Total Returns
Through 10/17/03

Frequently Asked Questions
Is there still value in the remaining steps of our
restructuring plan?
Is this a stock with dividend growth potential?

Illustrative Stock Valuation
Key valuation drivers
Results from remaining divestitures
Equity issuance
On-going utility operations
* Bloomberg 10/17/03
Dividend
Market/
P/E
Yield
Book
2004
S&P Utilities Index *
4.0%
1.6
X
13.5
X
Westar Energy ($19.46)
3.9%
1.3
X

Investment Thesis
Value
Potential for remaining value as recovery unfolds
Low dividend pay-out with opportunity for growth
Stable environment
Adequate, low-cost internal generation to meet load
Appropriate approach to off-system sales with rate-based generation
Stable, traditionally predictable service area economy
Strong utility management team
Regulatory environment
Significantly restored regulatory relations
Clear rate path through 2005
Kansas offers traditionally fair treatment when accompanied by traditional utility
behavior
Single state regulation

Appendix

Corporate Governance
Non-executive chairman of the board
All directors other than CEO are independent
Directors with diverse backgrounds and experience
Executive sessions of independent directors held regularly
No employee directors serve on the audit, finance, nominating,
compensation or corporate governance committees
All committees of the board have and maintain current charters

Corporate Governance (Cont.)
Board has and maintains a senior management succession plan
Independent board members have regular access to senior management
Internal audit/corporate compliance officer reports directly to audit
committee
Independent auditors perform only audit and audit related work
Disclosure committee formed from cross section of management
Disclosure controls reviewed quarterly
Whistleblower hotline established and actively managed by compliance
officer

Other Matters
U.S. Attorney investigation
SEC informal inquiry
Adequacy of proxy disclosures related to compensation
2002 financial restatements
FERC investigation
Shareholder lawsuits
Class action complaints and derivative lawsuit filed in early 2003
Arbitration proceeding with former management
Westar claims against former management exceed $100 million
Potential reversal of $53 million accounting reserve pending outcome

3rd Quarter 2003 Items
Cooling degree days
6.8% below 3rd quarter 2002 for Westar North service area
2.3% below 3rd quarter 2002 for Westar South service area
Utility sales volumes
Retail sales 2.0% below 2002
Total sales 2.9% below 2002
Utility revenues
2003 $438.2 million
2002 $442.1 million
Gain on sale of utility assets - $12.3 million
Charge for settlement of call option - $14.2 million
Gain on August 2003 ONEOK stock sale - $38.5 million
Potential additional write-down of Protection One Investment

Westar Energy
Investor Contact
Bruce Burns
Director Investor Relations
785-575-8227
bruce_burns@wr.com