Exhibit 99.1
Edison Electric Institute
39th Annual Financial Conference
San Diego, CA
October 24-27, 2004
Forward-Looking Statements Disclosure
The following presentation contains some “forward-looking statements” with respect to Westar Energy Inc.’s (“Westar”) future plans, expectations and goals, including management’s expectations with respect to future operating results and dividend growth. The Private Securities Litigation Reform Act of 1995 has established that these statements qualify for safe harbors from liability.
Although we believe that the expectations and goals reflected in such forward-looking statements are based on reasonable assumptions, all forward-looking statements involve risk and uncertainty. Therefore, actual results could vary materially from what we expect. Please review our 2003 annual report on Form 10-K/A for important risk factors that could cause results to differ materially from those in any such forward-looking statements. Any forward-looking statement speaks only as of the date such statement was made, and we do not undertake any obligation to update any forward-looking statement to reflect events or circumstances after the date on which such statement was made except as required by applicable laws or regulations.
2
Management Team Present
Jim Haines President and
Chief Executive Officer
Mark Ruelle Executive Vice President
& Chief Financial Officer
Doug Sterbenz Senior Vice President
Generation and Marketing
Greg Greenwood Treasurer
Bruce Burns Director Investor Relations
3

Westar Energy
Kansas
Topeka
Ticker (NYSE): WR
4

Transformation Complete
Proven, Conservative Business Strategy
Westar has executed on the debt reduction agenda set out for investors & regulators
Status Expected Debt Reduction Plan Component
Timing
Completed Sale of ONEOK Stock – Tranche 1
Completed Obtain relief from legal order to restructure
Completed Obtain relief for Protection One interim support
Completed Common Dividend Reduction
Completed Sale of Protection One Europe
Completed Obtain KCC approval of Debt Reduction Plan
Completed Sale of ONEOK Stock – Tranche 2
Completed Sale of Utility Assets to Midwest Energy
Completed Sale of ONEOK Stock – Final Tranche
Completed Sale of Protection One
Completed Equity Issuance
2003-04/Ongoing Cash Flow From Operations
Westar completed the plan on March 31st, 2004 – nine months ahead of deadline
Pure-play, Kansas-regulated, vertically integrated electric utility
Reduced risk profile
Business Financial Operating
Open communication and cooperation
5
Strategy of Reducing Risk
Business
Single line of business
Non-utility assets <1% of assets
Financial
Typical utility capital structure
Operating
Regulatory Fuel supply System reliability
6
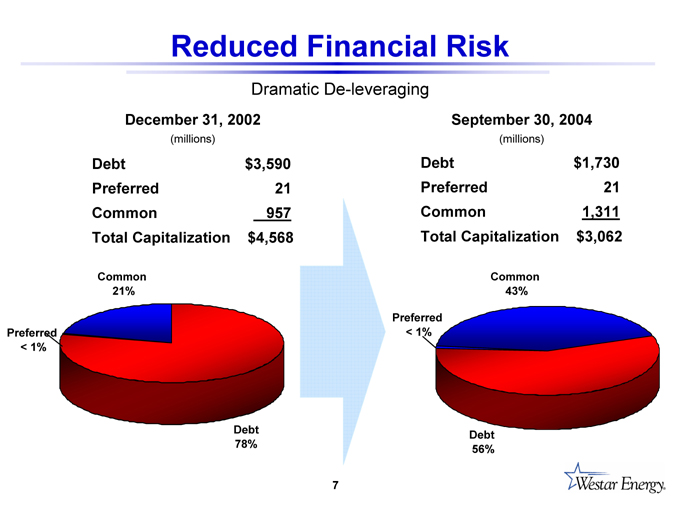
Reduced Financial Risk
Dramatic De-leveraging
December 31, 2002
(millions)
Debt $3,590
Preferred 21
Common 957
Total Capitalization $4,568
Common 21%
Preferred < 1%
Debt 78%
September 30, 2004
(millions)
Debt $1,730
Preferred 21
Common 1,311
Total Capitalization $3,062
Common 43%
Preferred < 1%
Debt 56%
7
Reduced Operating Risk
New management and directors
Re-established constructive regulatory relations with the KCC Diverse generating resources Secure base load fuel supplies Comprehensive risk management program Improved distribution reliability
8
Leadership
Senior Management
President & CEO, Jim Haines EVP & COO, Bill Moore EVP & CFO, Mark Ruelle
SVP Generation and Marketing, Doug Sterbenz
Strong mix of operational, regulatory and financial experience
Each executive officer has president / CEO experience in utility operations
9
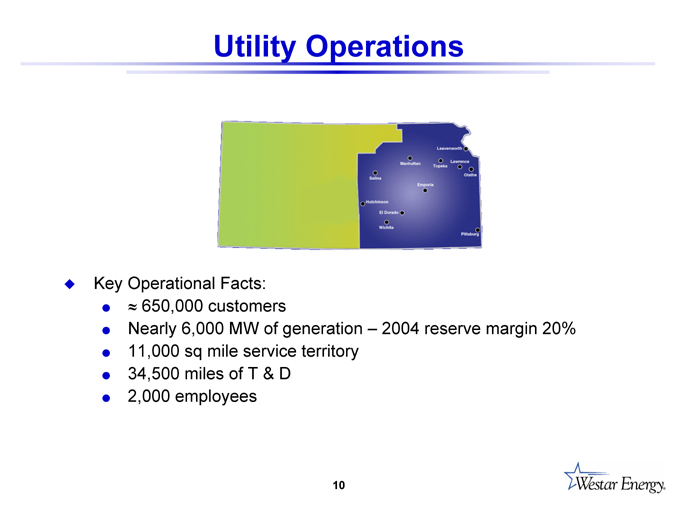
Utility Operations
Key Operational Facts:
» 650,000 customers
Nearly 6,000 MW of generation – 2004 reserve margin 20% 11,000 sq mile service territory 34,500 miles of T & D
2,000 employees
10
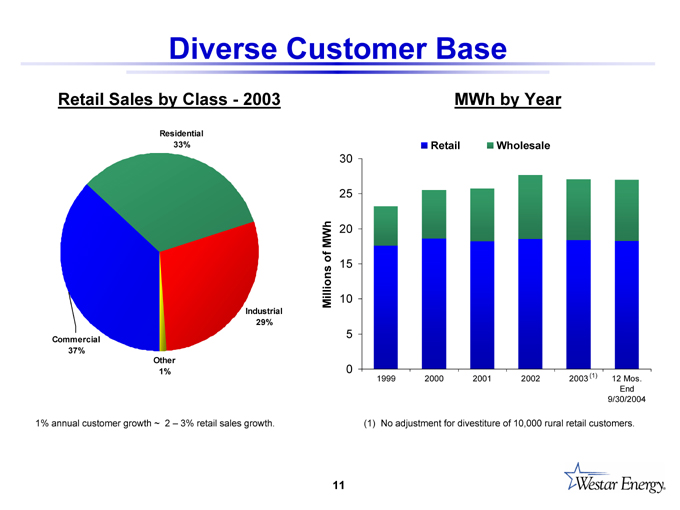
Diverse Customer Base
Retail Sales by Class - 2003
Residential 33%
Commercial 37%
Other 1%
Industrial 29%
1% annual customer growth ~ 2 – 3% retail sales growth.
MWh by Year
Retail
Wholesale
Millions of MWh
30 25 20 15 10 5 0
1999 2000 2001 2002 2003 (1) 12 Mos.
End 9/30/2004
(1) No adjustment for divestiture of 10,000 rural retail customers.
11
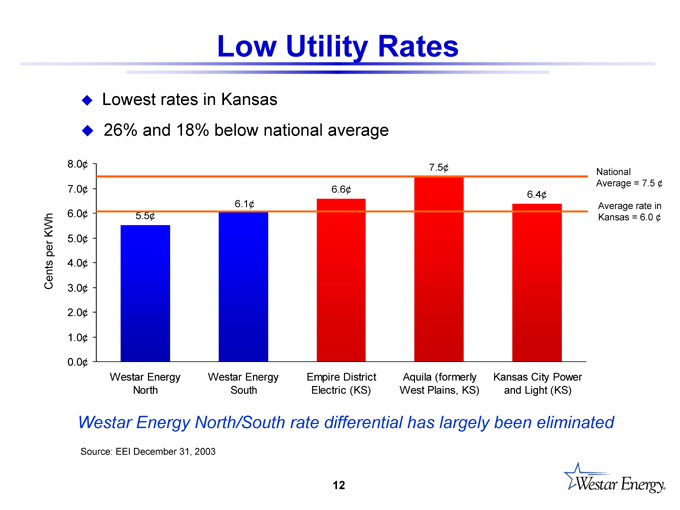
Low Utility Rates
Lowest rates in Kansas
26% and 18% below national average
Cents per KWh
8.0¢
7.0¢
6.0¢
5.0¢
4.0¢
3.0¢
2.0¢
1.0¢
0.0¢
5.5¢
6.1¢
6.6¢
7.5¢
6.4¢
National Average = 7.5 ¢
Average rate in Kansas = 6.0 ¢
Westar Energy Westar Energy Empire District Aquila (formerly Kansas City Power North South Electric (KS) West Plains, KS) and Light (KS)
Westar Energy North/South rate differential has largely been eliminated
Source: EEI December 31, 2003
12
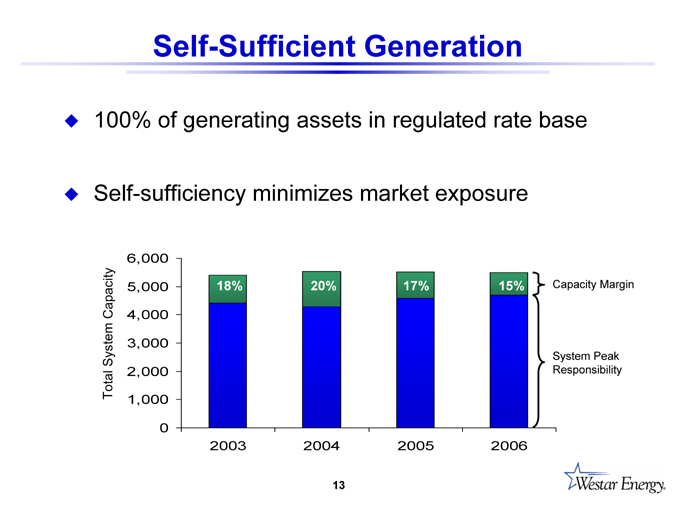
Self-Sufficient Generation
100% of generating assets in regulated rate base
Self-sufficiency minimizes market exposure
Total System Capacity
6,000 5,000 4,000 3,000 2,000 1,000 0
18% 20% 17% 15%
Capacity Margin
System Peak Responsibility
2003 2004 2005 2006
13
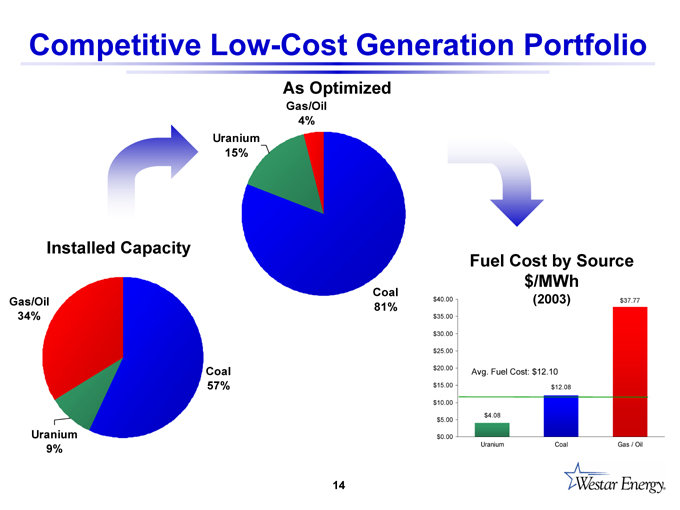
Competitive Low-Cost Generation Portfolio
As Optimized
Gas/Oil 4%
Uranium 15%
Installed Capacity
Gas/Oil 34%
Uranium 9%
Coal 57%
Coal 81%
Fuel Cost by Source $/MWh
(2003) $40.00 $35.00 $30.00 $25.00 $20.00 $15.00 $10.00 $5.00 $0.00
Avg. Fuel Cost: $12.10 $37.77 $12.08
Uranium $4.08
Coal
Gas / Oil
14

High Performing Generating Assets
Twelve Months Ended September 30, 2004
100% 90% 80% 70% 60% 50% 40% 30% 20% 10% 0%
78% 71%
91% 88%
Westar Industry Ave.
6% 7%
Base Load Capacity Factor
Intermediate & Peaking Availability Factor
Fleet Equivalent Forced Outage Rate
15
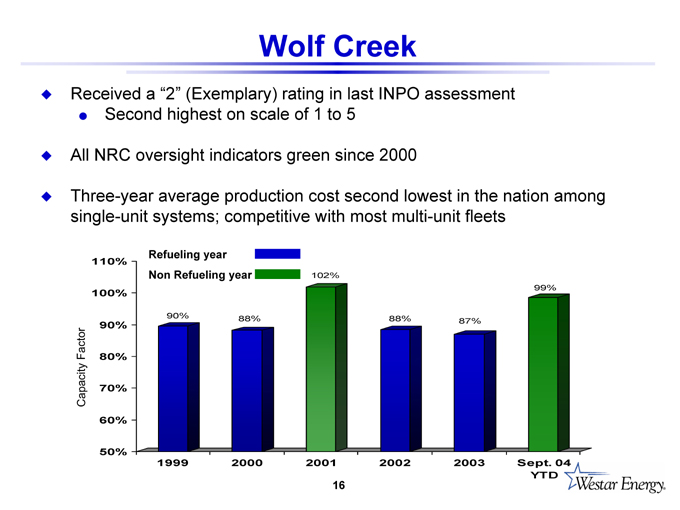
Wolf Creek
Received a “2” (Exemplary) rating in last INPO assessment
Second highest on scale of 1 to 5
All NRC oversight indicators green since 2000
Three-year average production cost second lowest in the nation among single-unit systems; competitive with most multi-unit fleets
Refueling year Non Refueling year
Capacity Factor
110% 100% 90% 80% 70% 60% 50%
90% 88%
102%
88% 87%
99%
1999 2000 2001 2002 2003 Sept. 04 YTD
16
Fuel Supply
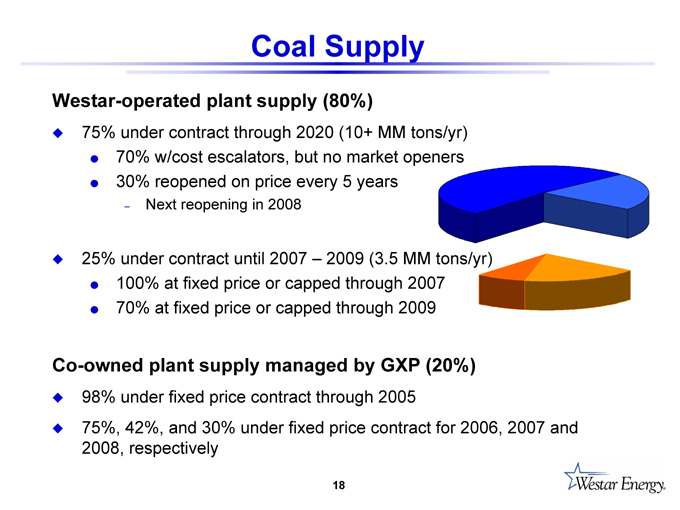
Coal Supply
Westar-operated plant supply (80%)
75% under contract through 2020 (10+ MM tons/yr)
70% w/cost escalators, but no market openers
30% reopened on price every 5 years
Next reopening in 2008
25% under contract until 2007 – 2009 (3.5 MM tons/yr)
100% at fixed price or capped through 2007
70% at fixed price or capped through 2009
Co-owned plant supply managed by GXP (20%)
98% under fixed price contract through 2005
75%, 42%, and 30% under fixed price contract for 2006, 2007 and 2008, respectively
18
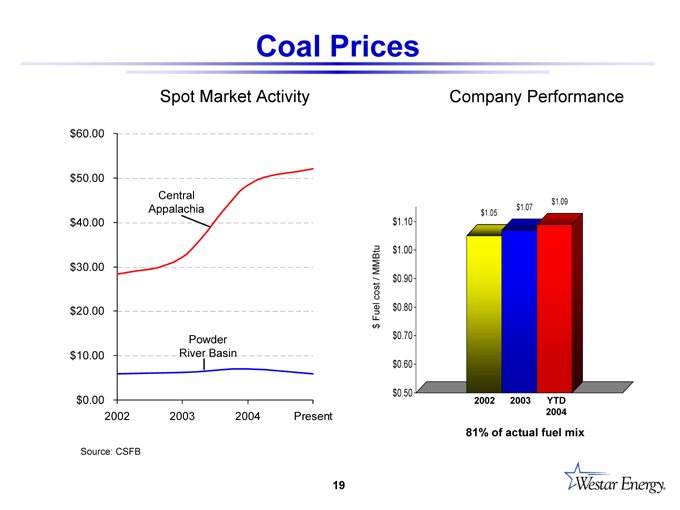
Coal Prices
Spot Market Activity
$60.00 $50.00 $40.00 $30.00 $20.00 $10.00 $0.00
2002 2003 2004 Present
Central Appalachia
Powder River Basin
Source: CSFB
Company Performance
$Fuel cost / MMBtu
$1.10 $1.00 $0.90 $0.80 $0.70 $0.60 $0.50
2002 2003 YTD 2004
$1.09 $1.07 $1.05
81% of actual fuel mix
19
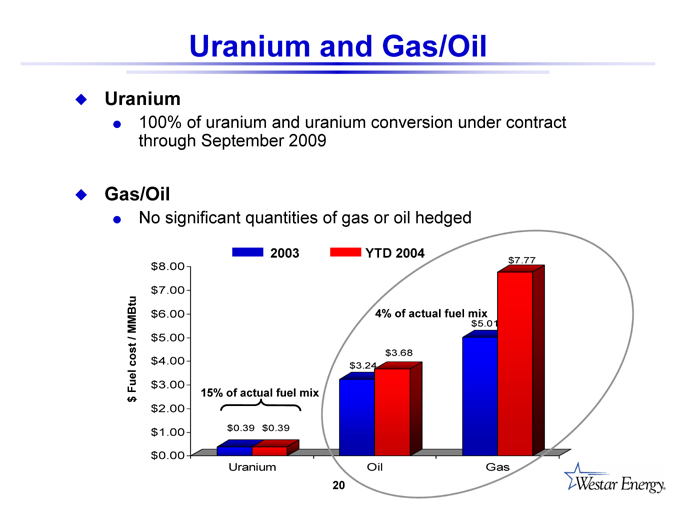
Uranium and Gas/Oil
Uranium
100% of uranium and uranium conversion under contract through September 2009
Gas/Oil
No significant quantities of gas or oil hedged
$Fuel cost / MMBtu
$8.00 $7.00 $6.00 $5.00 $4.00 $3.00 $2.00 $1.00 $0.00
2003 YTD 2004
Uranium Oil Gas
$0.39 $0.39
15% of actual fuel mix
$3.68 $3.24
4% of actual fuel mix
$5.01 $7.77
20
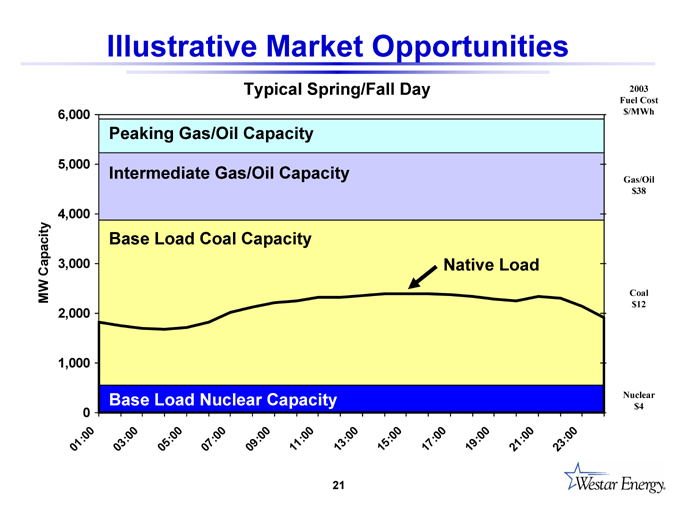
Illustrative Market Opportunities
Typical Spring/Fall Day
MW Capacity
6,000 5,000 4,000 3,000 2,000 1,000 0
01:00 03:00 05:00 07:00 09:00 11:00 13:00 15:00 17:00 19:00 21:00 23:00
2003 Fuel Cost $/MWh
Gas/Oil $38
Coal $12
Nuclear $4
Peaking Gas/Oil Capacity
Intermediate Gas/Oil Capacity
Base Load Coal Capacity
Base Load Nuclear Capacity
Native Load
21
Energy Marketing Supports Plant Utilization
Trades occur only where we can physically send and receive power (SPP, MAIN, ECAR, MAPP, SERC)
Power sales and purchases physically backstopped by what we can consume or produce
Minimizes risk of loss in the event of counterparty failure
Utility has first call on any wholesale transaction to meet native load
Energy Marketing enables Westar to optimize usage of its generation portfolio, maximizing value of assets while minimizing risk
22
Customer Operations
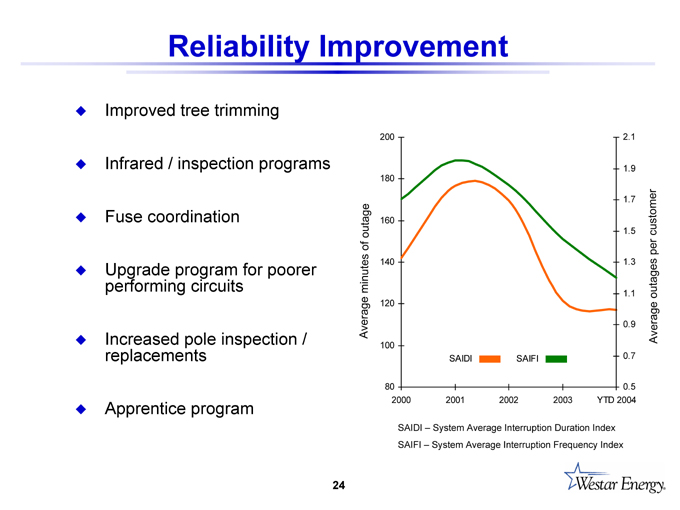
Reliability Improvement
Improved tree trimming
Infrared / inspection programs
Fuse coordination
Upgrade program for poorer performing circuits
Increased pole inspection / replacements
Apprentice program
Average minutes of outage
200 180 160 140 120 100 80
2000 2001 2002 2003 YTD 2004
2.1 1.9 1.7 1.5 1.3 1.1 0.9 0.7 0.5
Average outages per customer
SAIDI SAIFI
SAIDI – System Average Interruption Duration Index SAIFI – System Average Interruption Frequency Index
24
Customer Relationship Management
“Virtual Hold”
Estimated restoration time
Online billing and payment options
41% IVR self-service
96% answered call rate August YTD
87% answered within 30 seconds
25

Regulation
Ratemaking in Kansas
Historical test year used, but open to forward-looking adjustments
Statutory 240 days for rate cases
History of allowing fair ROEs
Openness toward new ideas
Allow fuel adjustment clause
Flow through of ad valorem tax changes
FAS 106/112 expense recovered through COLI / affordable housing tax credits
Historical environmental cost recovery
27
Rate & Regulatory Matters
Rate case to be filed May 1, 2005
Based on 2004 test year
New rates to be effective January 2006
Two rebates to retail customers
$10.5 million May 1, 2005
$10 million January 1, 2006
Amortizing $8.5 million / yr
28
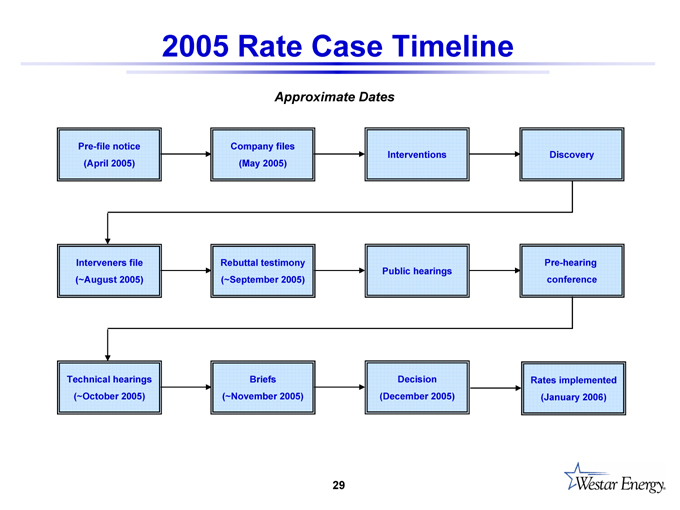
2005 Rate Case Timeline
Approximate Dates
Pre-file notice (April 2005)
Company files (May 2005)
Interventions
Discovery
Interveners file (~August 2005)
Rebuttal testimony (~September 2005)
Public hearings
Pre-hearing conference
Technical hearings (~October 2005)
Briefs (~November 2005)
Decision (December 2005)
Rates implemented (January 2006)
29
EPA New Source Review
Nationwide investigation of modifications at coal-fired power plants
Fall 2002 EPA issued Section 114 information request to Westar
Received notice of violation January 2004
Settlement discussions ongoing with the EPA
Expect recovery of clean air expenditures through rates
30

Transmission System Overview
Net investment of $309 million
Represents 8% of total net utility plant
Member of the Southwest Power Pool (SPP) since 1994
FERC recently granted SPP RTO status
Participating in resolving multi-state issues
31
Strong Liquidity and Credit Position
$300 million revolving credit facility
Undrawn as of September 30
$38 million of cash on hand September 30
Long-term debt reduced from $3.6 billion to $1.7 billion
More than $530 million redeemed in 2004
Refinanced more than $600 million of long-term debt
$386 million tax-exempt debt
$225 million first mortgage bonds
Light maturity ladder through 2006
2004—none
2005—$65 million
2006—$100 million
32

Current Focus
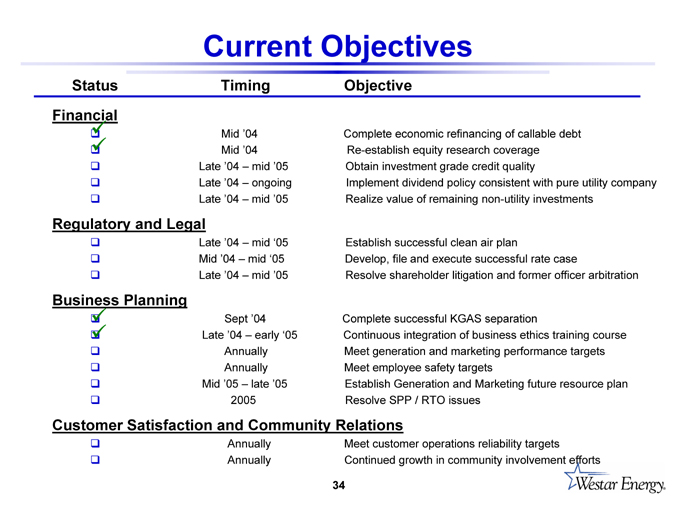
Current Objectives
Status Timing Objective
Financial
Mid ‘04 Complete economic refinancing of callable debt
Mid ‘04 Re-establish equity research coverage
Late ‘04 – mid ‘05 Obtain investment grade credit quality
Late ‘04 – ongoing Implement dividend policy consistent with pure utility company
Late ‘04 – mid ‘05 Realize value of remaining non-utility investments
Regulatory and Legal
Late ‘04 – mid ‘05 Establish successful clean air plan
Mid ‘04 – mid ‘05 Develop, file and execute successful rate case
Late ‘04 – mid ‘05 Resolve shareholder litigation and former officer arbitration
Business Planning
Sept ‘04 Complete successful KGAS separation
Late ‘04 – early ‘05 Continuous integration of business ethics training course
Annually Meet generation and marketing performance targets
Annually Meet employee safety targets
Mid ‘05 – late ‘05 Establish Generation and Marketing future resource plan
2005 Resolve SPP / RTO issues
Customer Satisfaction and Community Relations
Annually Meet customer operations reliability targets
Annually Continued growth in community involvement efforts
34
2005 Focus
Continue to minimize operating risk
Successful rate case
Conclude legacy litigation
Resolve EPA “new source” review
Refine long-term energy supply plan
FERC market power test
Implement SPP RTO
35

Investment Considerations
Common Dividend Policy
Restore dividend to level consistent with peers
Increase dividend to achieve 60% to 75% payout
Dividend announcement later this year
Payable January 2005
Next dividend review early 2006
37
Investment Highlights
Pure utility / constructive regulation
Diverse customer mix / below average utility rates
Reliable, low-cost generating assets
Stable environment / improving returns
Attractive dividend growth opportunity
38
Appendix
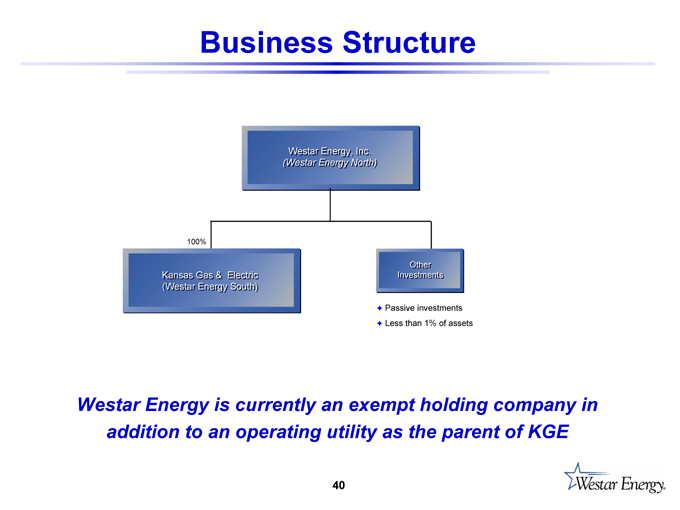
Business Structure
Westar Energy, Inc.
(Westar Energy North)
100%
Kansas Gas & Electric (Westar Energy South)
Other Investments
Passive investments Less than 1% of assets
Westar Energy is currently an exempt holding company in addition to an operating utility as the parent of KGE
40
PUHCA
Currently exempt from registration under 1935 Act
Predominately the intrastate exemption
SEC reevaluating continued eligibility for exemption
Evaluate options, as needed
Reorganize corporate structure
Register under the Act
We expect no material impact
41
Remaining Non-Utility Investments
Protection One
$26.6 million 7 3/8% Sr. Notes
Tax sharing payment participation (up to $15M)
Contingent value on sr. credit facility (up to $21M)
International Power Projects
Turkey Power Project
China Power Project
42

Corporate-Owned Life Insurance
Corporate-owned life insurance (COLI)
Income recorded for increases in cash surrender value and net death proceeds and is non-taxable
Interest expense recorded on amounts borrowed against policy value is tax deductible
Net premium payments made annually, majority covered by borrowing against increased cash surrender value
GAAP requires the amounts to be reported in operating, investing and financing sections on cash flow statement
2001 2002 2003
Premiums (23,732) (23,774) (23,866)
Increase in CSV 59,078 60,422 60,768
Death Benefits 314 2,308 0
Policy Interest (44,961) (46,182) (47,159)
Tax Benefit 17,884 18,370 18,759
43
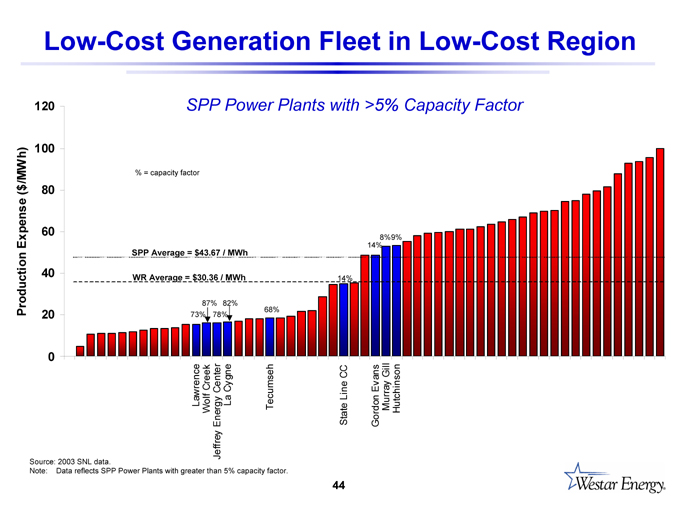
Low-Cost Generation Fleet in Low-Cost Region
SPP Power Plants with >5% Capacity Factor
Production Expense ($/MWh)
120 100 80 60 40 20 0
Lawrence Wolf Creek Jeffrey Energy Center La Cygne
Tecumseh
State Line CC
Gordon Evans Murray Gill Hutchinson
% = capacity factor
SPP Average = $43.67 / MWh
WR Average = $30.36 / MWh
87% 82%
68% 73% 78%
8%9% 14%
14%
Source: 2003 SNL data.
Note: Data reflects SPP Power Plants with greater than 5% capacity factor.
44

Regulation in Kansas
Three Commissioners appointed by governor (no more than 2 from same political party)
Term Ending
Brian Moline, (D) Chairman March 15, 2006
Robert Krehbiel, (D) March 15, 2007
Michael Moffet (R) March 15, 2008
Commission staff – combination of appointments and civil service positions
Staff of 46 in the utilities division
Common interveners in Kansas regulatory process
Citizens Utility Ratepayers Board (CURB)
Kansas Industrial Consumers (KIC)
Wichita School District
45
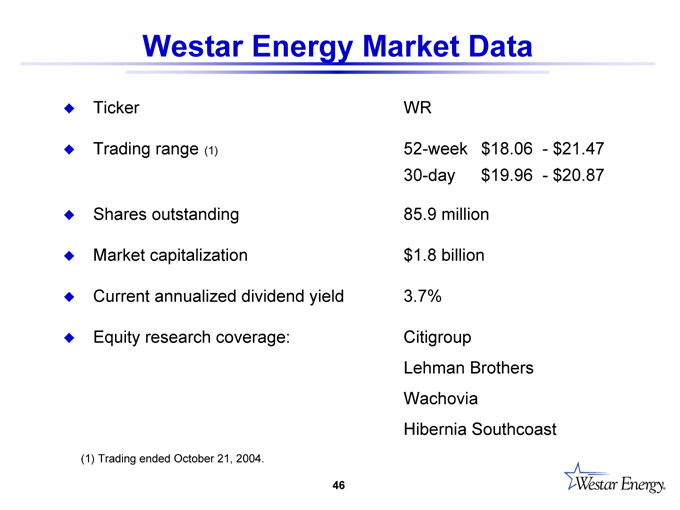
Westar Energy Market Data
Ticker WR
Trading range (1) 52-week $18.06 - $21.47
30-day $19.96 - $20.87
Shares outstanding 85.9 million
Market capitalization $1.8 billion
Current annualized dividend yield 3.7%
Equity research coverage: Citigroup
Lehman Brothers
Wachovia
Hibernia Southcoast
(1) Trading ended October 21, 2004.
46
Westar Energy Investor Contact
Bruce R. Burns Director Investor Relations 785-575-8227 bruce_burns@wr.com