 JP Morgan Corporate Access March 24, 2011 Boston, MA JP Morgan Corporate Access Exhibit 99.1 |
 2 Forward Looking Disclosures JP Morgan Corporate Access Forward-looking statements: Certain matters discussed in this presentation are “forward- looking statements.” The Private Securities Litigation Reform Act of 1995 has established that these statements qualify for safe harbors from liability. Forward-looking statements may include words like “believe,” “anticipate,” “target,” “expect,” “pro forma,” “estimate,” “intend,” “guidance” or words of similar meaning. Forward-looking statements describe future plans, objectives, expectations or goals. Although Westar Energy believes that its expectations are based on reasonable assumptions, all forward-looking statements involve risk and uncertainty. The factors that could cause actual results to differ materially from these forward-looking statements include those discussed herein as well as (1) those discussed in the company’s Annual Report on Form 10-K for the year ended Dec. 31, 2010 (a) under the heading, “Forward-Looking Statements,” (b) in ITEM 1. Business, (c) in ITEM 1A. Risk Factors, (d) in ITEM 7. Management’s Discussion and Analysis of Financial Condition and Results of Operations, and (e) in ITEM 8. Financial Statements and Supplementary Data: Notes 13 and 15; and (2) other factors discussed in the company’s filings with the Securities and Exchange Commission. Any forward-looking statement speaks only as of the date such statement was made, and the company does not undertake any obligation to update any forward-looking statement to reflect events or circumstances after the date on which such statement was made. |
 3 Recent Events • Reported strong 2010 results well above last year • Issued 2011 earnings guidance of $1.65 to $1.80 • Dividend increased for 7 th consecutive year • Add $270 million revolving credit facility • Issue 2011-2013 capital expenditure forecast • New KCC commissioner appointed • Outline active 2011 regulatory agenda JP Morgan Corporate Access |
 4 • EPS from continuing operations of $1.81 vs. $1.28 last year • Retail MWh sales increased 6% – Above plan • Warmer than normal weather • Signs of economic recovery – Industrials up 6% • Implemented all planned price adjustments (annualized amts): – Abbreviated rate case - $17 million – Transmission adjustments - $16 million – Environmental adjustment - $14 million – Energy efficiency adjustment - $6 million • No COLI proceeds in 2010 2010 Results Well Above 2009 JP Morgan Corporate Access |
 5 2011 Earnings Guidance of $1.65 to $1.80 • Plan price adjustments via tracking adjustments • Weather adjusted retail sales grow < 1% • O&M increase < 2% • SG&A flat to decrease < 1% • Depreciation increases < $15 million • AFUDC equity decreases < $2 million • COLI proceeds of $0.10 per share • Interest charges increases < $5 million • Effective tax rate of 29% - 31% • Funding 2011 construction program – Issue 12.7 million shares priced under forward sale agreements – Borrowing from revolving credit facilities and/or issuance of debt JP Morgan Corporate Access |
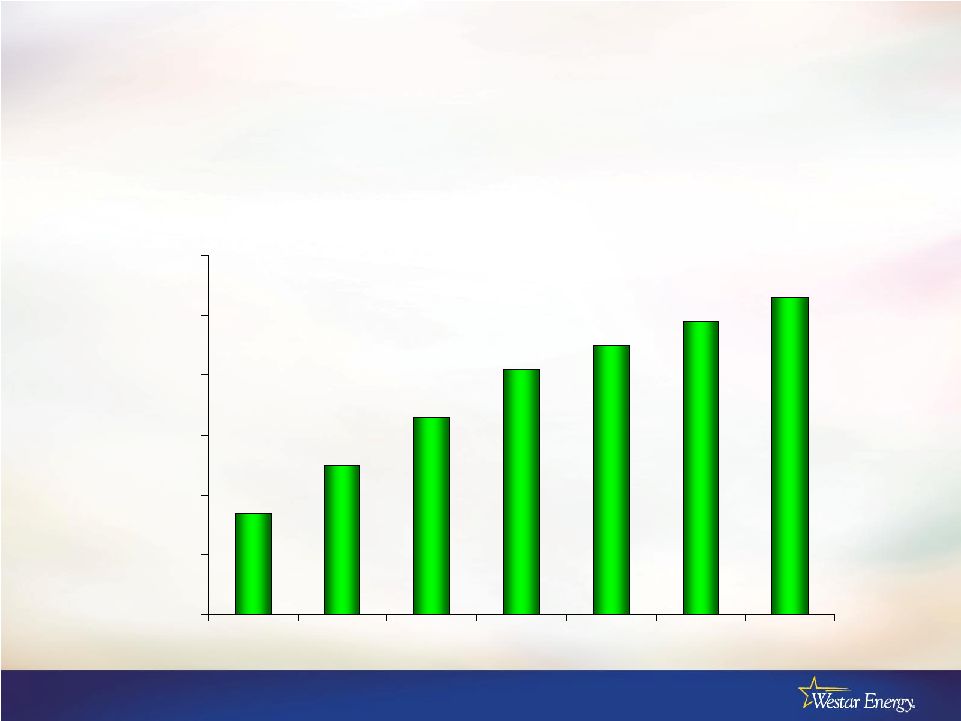 6 $0.92 $1.00 $1.08 $1.16 $1.20 $1.24 $1.28 $0.75 $0.85 $0.95 $1.05 $1.15 $1.25 $1.35 2005 2006 2007 2008 2009 2010 2011 Dividend • Quarterly dividend increased 3% effective April 1 • Long-standing dividend payout target of 60%-75% of earnings – 2011 guidance implies payout at upper end of range Indicated annual rate JP Morgan Corporate Access |
 7 • Four year maturity • 2 options to extend term up to 1 year • Accordion option allows for increase up to $400 million • Increased total credit lines to $1 billion – Existing $730 million facility – New $270 million facility New $270 Million Revolving Credit Facility JP Morgan Corporate Access |
 8 Capital Expenditure Forecast 2011 - 2013 Actual Forecast Forecast Forecast Forecast 2010 2011 2012 2013 2011 - 2013 Method of Cost Recovery Generation replacements and other 83.4 $ 130.4 $ 146.4 $ 150.6 $ 427.4 $ General Rate Case (GRC) Westar environmental 107.7 181.1 200.1 154.3 535.5 ECRR La Cygne environmental 3.9 63.0 171.0 195.1 429.1 ECRR Nuclear Fuel 35.3 25.1 30.1 41.7 96.9 Fuel adjustment clause Transmission 197.3 192.7 161.3 164.1 518.1 FERC formula rate/TDC Distribution New customers, replacements & other 78.7 95.9 102.2 106.4 304.5 GRC Smart grid (a) 10.3 13.6 13.6 GRC Other 23.5 19.8 15.0 11.0 45.8 GRC Total 540.1 $ 721.6 $ 826.1 $ 823.2 $ 2,370.9 $ (a) net of DOE matching grant In 2011, 2012 and 2013, Westar plans to incur additional expenditures related to the Prairie Wind Transmission joint venture (not inlcuded in above forecast amounts). Prairie Wind Transmission joint venture 2.7 $ 22.5 $ 13.8 $ 39.0 $ JP Morgan Corporate Access |
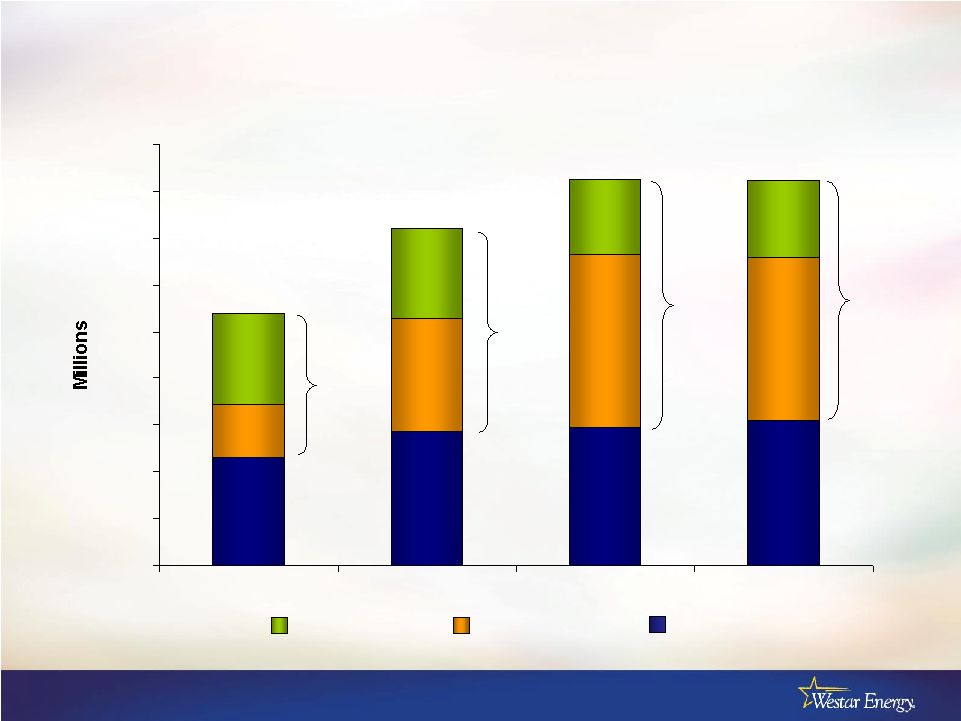 9 Capital Expenditure Forecast 2011 - 2013 $0 $100 $200 $300 $400 $500 $600 $700 $800 $900 2010 2011 2012 2013 $540 $722 $826 $823 Environmental Other Transmission 62% 65% 61% JP Morgan Corporate Access 57% |
 10 Cash Flow Guidance JP Morgan Corporate Access 2011E (Millions) Net income 205 $ Depreciation and amortization 285 Cash from operations 490 Less: Cash dividends 145 Internally generated cash 345 Less: CapEx 722 Net cash flow (377) $ Assumptions and notes: Net Income – midpoint of 2011 EPS guidance times average shares outstanding Average shares assumes issuance of shares priced under forward sale agreements Cash dividends - $1.28 indicated annual dividend with 6.5% of common dividend being reinvested |
 11 • Mark Sievers appointed by governor to serve 4-year term – Attorney and economist – Work experience includes telecommunications industry • Kansas Corporation Commission – Three-member board appointed by governor – Serve staggered four year terms • Current KCC commissioners – Thomas Wright • Current chairman • Term expires March 2014 – Ward Loyd • Term expires March 2012 KCC Commissioner Appointed JP Morgan Corporate Access |
 12 Significant Planned Regulatory Agenda • Seek predetermination for 370MW of renewables • Update TDC tariff • KCC docket reviewing retrofit economics for coal plants • Request siting authority for Prairie Wind Transmission line • Update ECRR tariff • Update energy efficiency rider • Plan to file general rate case late spring or early summer JP Morgan Corporate Access |
 13 2011 Plans JP Morgan Corporate Access |
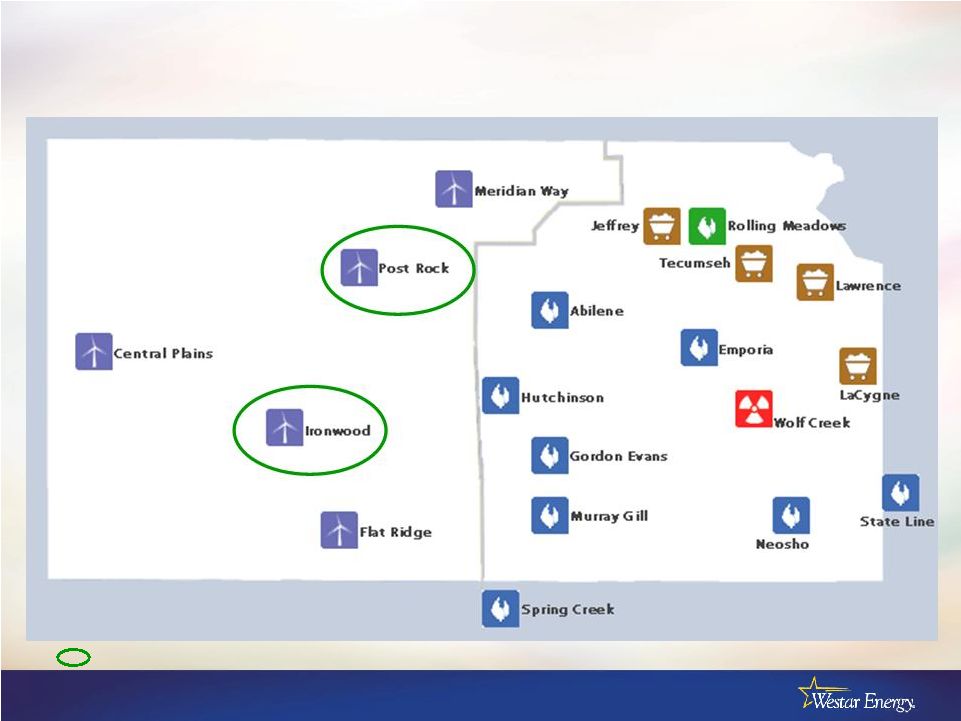
 14 • Statute requires < 200 MW additional renewables • Seeking predetermination from KCC for < 370 MW through PPAs – Tentative agreements for 2 projects • Post Rock Wind Farm - 201 MW • Ironwood Wind Farm – 168 MW – Expect both projects to be in-service by end 2012 • KCC Staff and CURB agree with company’s request • Expect decision in May 2011 Seeking Predetermination for 370 MW of Renewables JP Morgan Corporate Access |
 15 Annualized Rate & Revenue Changes Actual and Estimated 2010 2011 (Estimated) 2012 (Estimated) Base rates $17 million Feb (Abbreviated rate case) TBD Transmission rates $16 million Jan 1 $17 million Jan 1 < $17 million Jan 1 ECRR $14 million June 1 < $10 million June 1 < $29 million June 1 Energy Efficiency $6 million November < $11 million November < $13 million November JP Morgan Corporate Access |
 16 Major Construction Projects Underway • Environmental – Lawrence Energy Center • Install fabric filters, rebuild scrubbers, precipitator, low NOx system – Jeffery Energy Center • Install SCR on 1 unit – La Cygne Energy Center • Scrubbers, fabric filters, common chimney, SCR and low NOx system • Transmission – Wichita to Oklahoma 345 kV – Planning and design Prairie Wind line • SmartStar Lawrence – $40 million project reduced by 50% DOE match • Advanced outage management • Automated metering infrastructure JP Morgan Corporate Access |
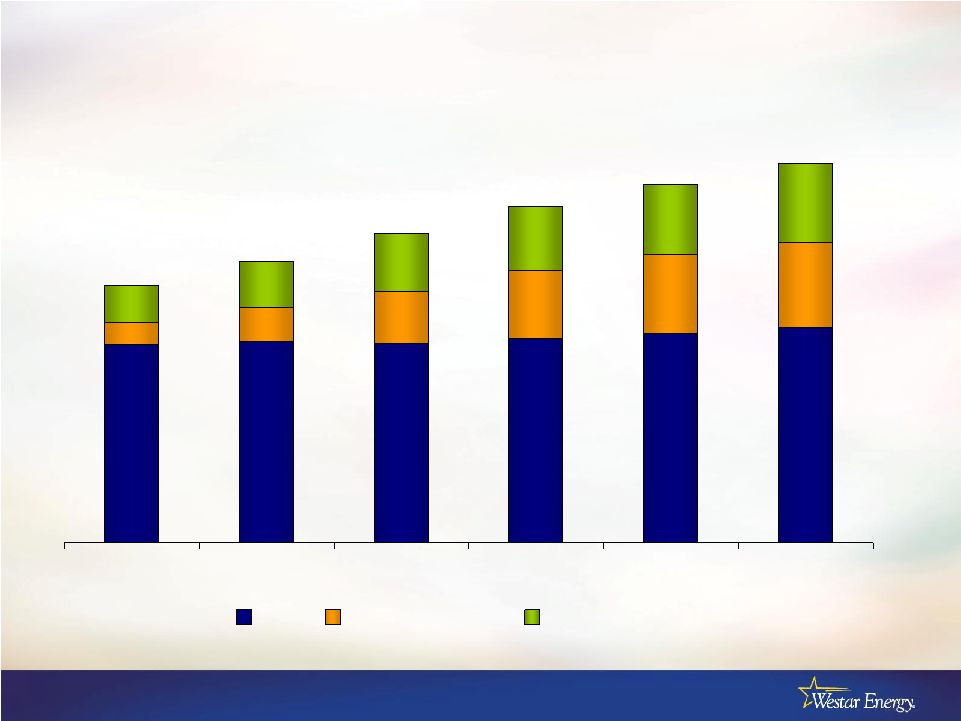 17 Projected Rate Base 2010 – 2015 (in billions) 2010 2011 2012 2013 2014 2015 Base Environmental Transmission $6.7 $6.3 $5.9 $5.4 $5.0 $4.5 $3.5 $3.5 $3.5 $3.6 $3.7 $3.8 JP Morgan Corporate Access $0.6 $0.8 $1.0 $1.1 $1.2 $1.4 $0.4 $0.6 $0.9 $1.2 $1.4 $1.5 |
 18 Transmission JP Morgan Corporate Access |
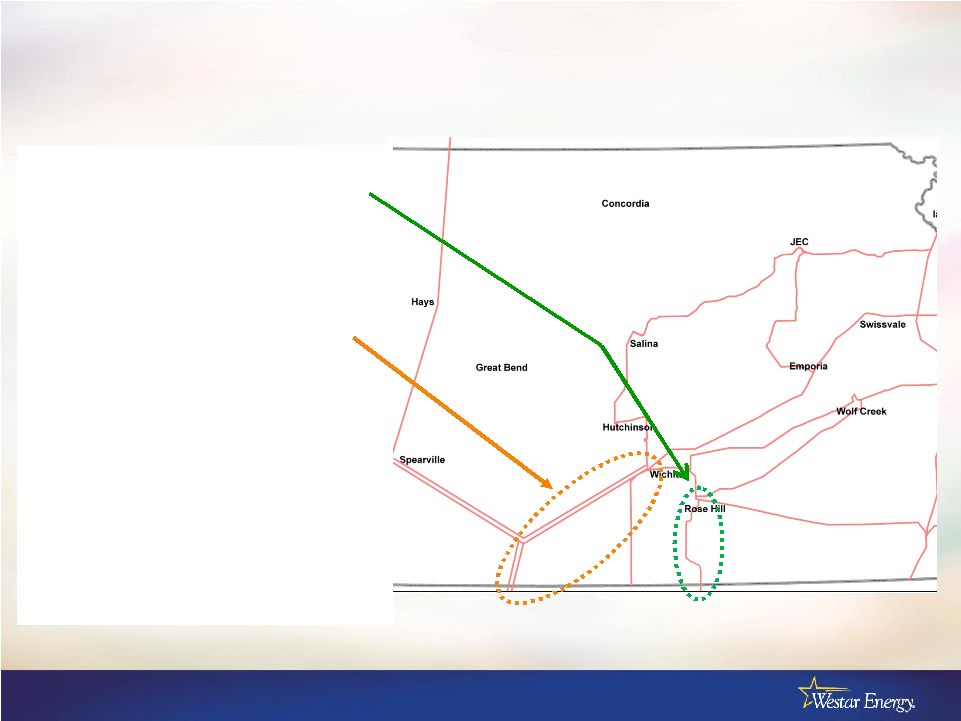 19 Major Transmission Investments Underway • Rose Hill – Oklahoma Under construction • Target completion mid 2012 • Investment < $100 million • Prairie Wind Transmission • 50/50 JV with ETA • Siting request Feb 2011 • Begin construction mid 2012 • Estimated completion 2014 • Project cost < $225 million JP Morgan Corporate Access |
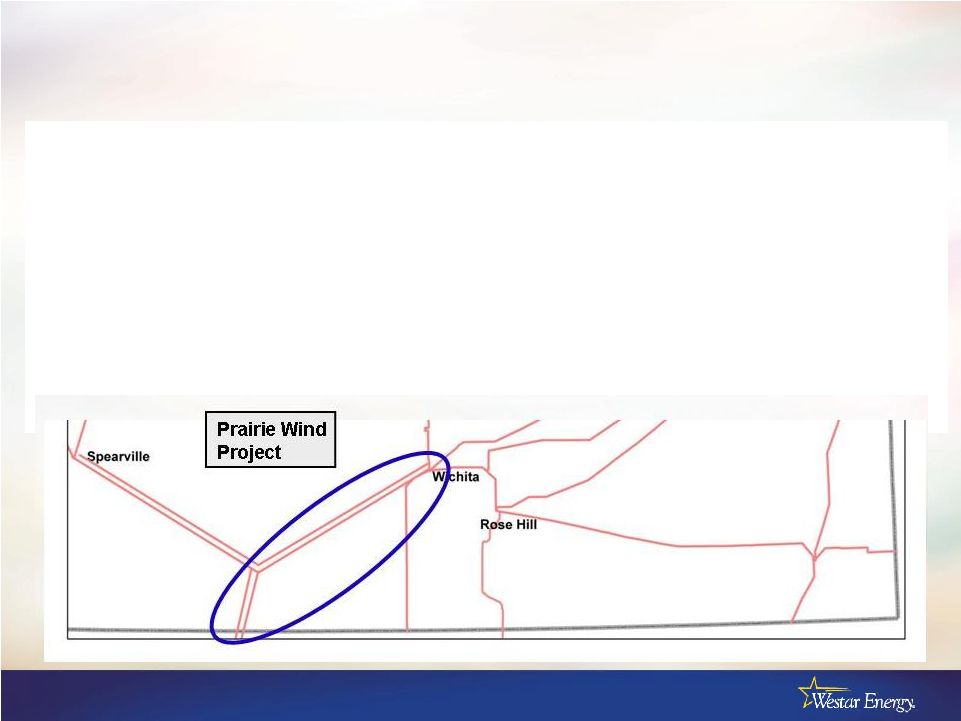 20 Prairie Wind Transmission, LLC • Joint venture formed between Westar Energy and Electric Transmission America – Venture to develop high voltage transmission in Kansas – 50% Westar / 50% ETA • ETA is joint venture between AEP Transmission Holding Company and MEHC America Transco, LLC (wholly-owned subsidiary of MidAmerican Energy Holdings Company) JP Morgan Corporate Access |
 21 Prairie Wind Transmission, LLC • Received FERC incentives – Abandonment costs – Recovery of pre-commercial development costs – CWIP recovery in rate base – 50/50 capital structure – Allowed ROE of 12.8% • KCC – Siting request filed Feb 28, 2011 • Southwest Power Pool – Regional cost allocation approved by FERC – “Notice to Construct” accepted – JV became a member of the SPP – Awaiting SPP adoption of formula rate JP Morgan Corporate Access |
 22 Prairie Wind JV Next Steps and Tentative Schedule • Obtain siting authority from KCC • Engineer and design • Acquire rights-of-way • Construction – Anticipated to start by mid 2012 – Target completion late 2014 JP Morgan Corporate Access |
 23 Profile JP Morgan Corporate Access |
 24 Strategic Approach • Embrace uncertainty and acknowledge inability to predict the future • Place a high value on flexibility – Operational – Financial – Regulatory • Leverage actions and strategies around intrinsic advantages • Seek collaborative and constructive approaches to regulation • Value proposition – Protect against downside while growing investor returns JP Morgan Corporate Access |
 25 • Pure-play, vertically integrated, rate-regulated • < 7,000 MW of generation • 6,200 miles transmission • 687,000 customers Kansas’ Largest Electric Provider JP Morgan Corporate Access |
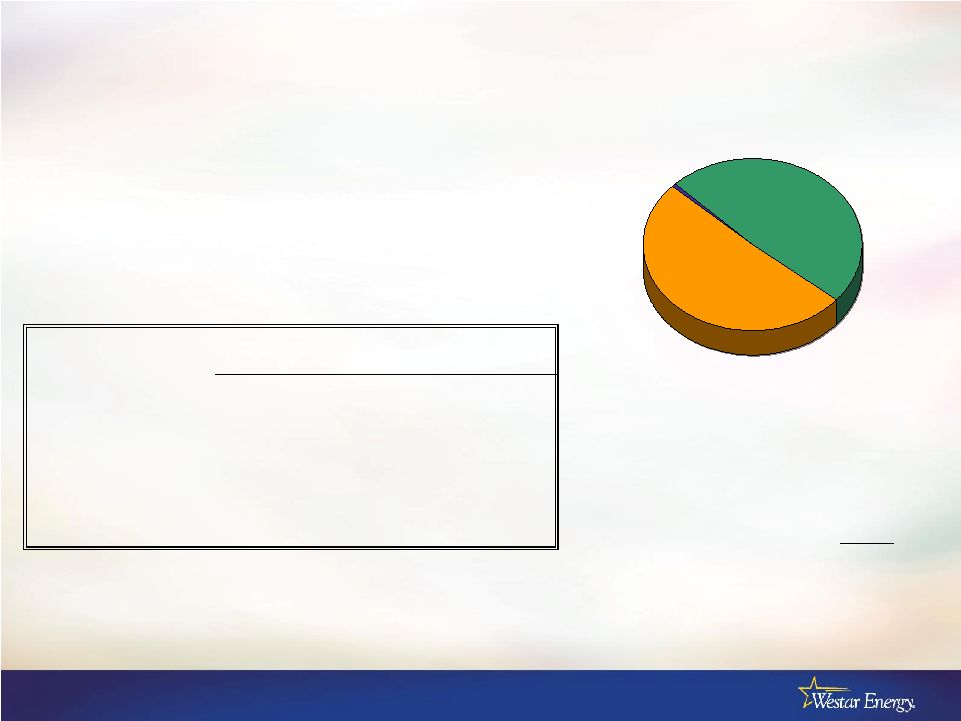
 26 Favorable Supply Portfolio $56.37 $17.45 $6.50 Uranium Coal Gas Ave. Fuel Cost $18.37/MWh Fuel Mix Coal 49% Gas 39% Wind 4% Uranium 8% MW Capacity 5.0¢ 6.0¢ 7.0¢ 8.0¢ 9.0¢ 10.0¢ Westar Energy Kansas City Power and Light (KS) Empire District Electric (KS) National Average 7.6¢ 8.4¢ 8.4¢ Low Rates Source: Edison Electric Institute 07/01/2010 Coal 74% Gas 7% Wind 3% Uranium 16% Cost of Fuel JP Morgan Corporate Access |
 27 Diverse Energy Sales (MWh) Chemical & oil Food processing Aerospace Consumer manufacturing Other Commercial 38% Residential 35% Industrial 27% 39% 17% 16% 16% 12% 12% 18% 8% 7% 3% 4% 48% Other General merchandise Grocery/ Convenience Real estate Health care Government Education JP Morgan Corporate Access |
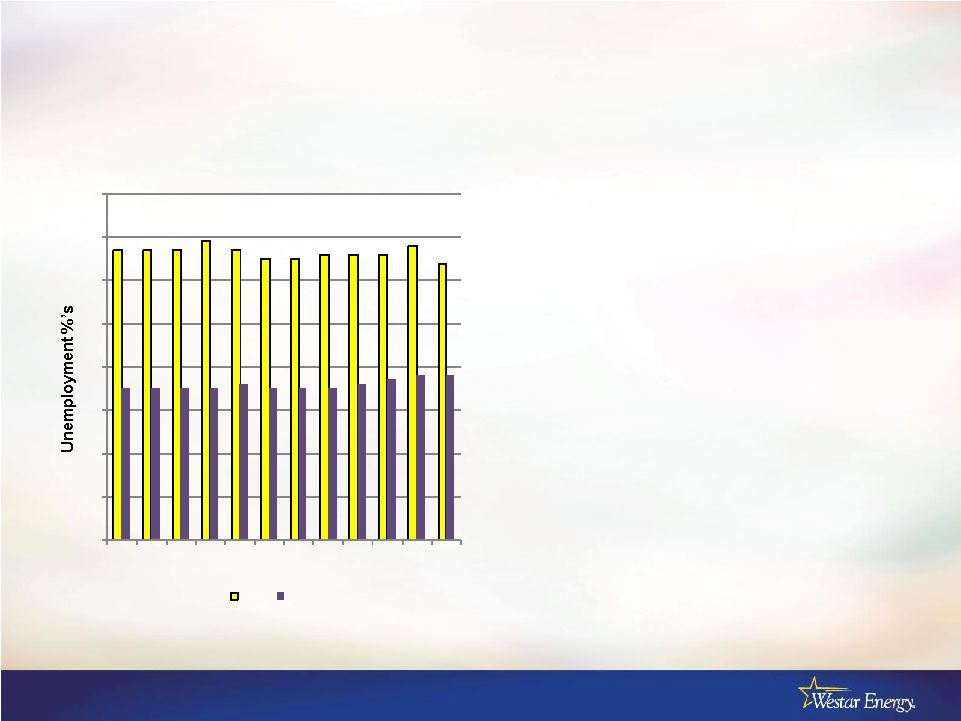 28 Strong Service Territory • Overall economic conditions significantly better than nation – No real estate crash – State unemployment remains 2+ pts favorable to nation • Industrial sales showing signs of recovery – ’10 up 6% over ‘09 levels • Pentagon awards refueling tanker contract to Boeing – Benefits Wichita and Kansas economy JP Morgan Corporate Access 3 4 5 6 7 8 9 10 11 Jan Feb Mar Apr May Jun Jul Aug Sep Oct Nov Dec Unemployment (latest 12 months) U.S. KS |
 29 Capitalization and Liquidity • Target < 50/50 capital structure • Solid investment grade credit • Total credit facility capacity $1 billion • No bonds mature before 2014 December 31, 2010 (a) (millions) Long-term, net $2,491 Preferred 21 Common 2,383 Total Capitalization $4,895 Debt 51% Equity 49% Preferred <1% Secured Unsecured Outlook Moody's Baa1 Baa3 Positive Fitch Ratings BBB+ BBB Positive Standard & Poor's BBB+ BBB Stable (a) Capitalization excludes short-term debt and adjustments for VIEs JP Morgan Corporate Access |
 30 Potential for High Voltage Transmission Growth A. JEC to Iatan Energy Center B. JEC to Concordia C. Concordia to Salina D. Salina to Hays E. JEC to Swissvale F. Hutchinson to Spearville G. Wichita to Rose Hill H. Wolf Creek to Emporia F G A B C E D H JP Morgan Corporate Access |
 31 Westar’s Value Proposition • Solid, transparent business strategy • Strong, experienced utility management team • Thoughtful, disciplined approach to operations, capital planning and financing • Constructive regulatory and policy environment – Results in lower prices for customers – Provides investors clarity • Focus on containing risks and maintaining returns • Diverse customer base and stable service territory JP Morgan Corporate Access |
 32 Rates and Regulation JP Morgan Corporate Access |
 33 Regulatory Approach • A sound regulatory and energy policy platform – KCC and FERC • Ultimately results in lower rates for customers Time Traditional GRC Riders coupled with GRC Ultimately, lower rates JP Morgan Corporate Access |
 34 Methods of Cost Recovery Revenue Requirement Method of Recovery Comment 1. Fuel, purchased power and environmental consumables Quarterly adjustment based on forecasted cost, with annual true-up Adjusts prices for actual costs, protecting both customers and investors from mispricing 2. Environmental capital Environmental Cost Recovery Rider adjusts annually Allows annual price adjustment to reflect capital costs for investments in emission controls 3. Transmission rate recovery FERC formula rate adjusts annually; companion retail tariff to reflect current revenue requirement Timely recovery of transmission system operating and capital costs 4. General capital investments Traditional rate case, but with predetermination and CWIP Typical rate case reflects current level of operating expenses and most recent plant investment 5. Property taxes Annual adjustment to reflect current property taxes Allows timely recovery of actual property tax costs in current rates 6. Extraordinary storm damages Traditionally deferred accounting treatment as rate base Smoothes period expenses for extraordinary storm restoration costs 7. Pension expenses Deferred as a regulatory asset for subsequent recovery Smoothes period expenses in excess of amount in base rates 8. Energy efficiency programs Deferred as a regulatory asset for subsequent recovery Smoothes period expenses for energy efficiency programs JP Morgan Corporate Access |
 35 Retail Energy Cost Adjustment (RECA) • Provides timely price adjustments for fuel and purchased power costs • Retail rates based on forecast of fuel and purchased power costs and retail sales – Set quarterly – Difference between forecast and actual is deferred • Quarterly approach produces more stable prices • Annual settlement of deferred balance • RECA also used to rebate wholesale margins as a credit to retail cost of service – Energy Marketing (i.e., non-asset) margins continue to be excluded from rate setting JP Morgan Corporate Access |
 36 Environmental Cost Recovery Rider Mechanics • ECRR adjusts retail rates annually to reflect capital investments in emission controls – Investments as of December 31 recovered in rates subsequent June – Eliminates need to file a rate case to capture rate base additions • Return of and on capital that is in service December 31 • Return on capital not yet placed in service December 31 (i.e., CWIP) • ECRR reduces regulatory lag – Regulatory lag limited to months, rather than longer lag typically associated with traditional rate case filings JP Morgan Corporate Access |
 37 Illustrative ECRR Mechanics (1) Illustration reflects only the projects publicly announced and assumes one-half of annual investment in service at year end (2) Illustration uses 12% pretax return and 4% depreciation recovery (3) Annual ECRR Tariff is effective June 1; assume Jan-May at prior year revenue requirement and Jun-Dec at new revenue requirement JP Morgan Corporate Access Clean Air Investment (1) 2008 2009 2010 2011 2012 2013 Year 1 Investment 238.4 $ Year 2 Investment 85.2 $ Year 3 Investment 111.7 $ Year 4 Investment 244.1 $ Year 5 Investment 375.1 $ Year 6 Investment 349.4 $ Environmental Investment 238.4 $ 323.6 $ 435.3 $ 679.4 $ 1,054.5 $ 1,403.9 $ Accumulated Depreciation Clean Air Investment Depreciation on Year 1 Investment 4.8 $ 9.5 $ 9.5 $ 9.5 $ 9.5 $ 9.5 $ Depreciation on Year 2 Investment 1.7 3.4 3.4 3.4 3.4 Depreciation on Year 3 Investment 2.2 4.5 4.5 4.5 Depreciation on Year 4 Investment 4.9 9.8 9.8 Depreciation on Year 5 Investment 7.5 15.0 Depreciation on Year 6 Investment 7.0 Annual Depreciation 4.8 $ 11.2 $ 15.2 $ 22.3 $ 34.7 $ 49.2 $ Total Accum Depreciation for Environmental Investment 4.8 $ 16.0 $ 31.2 $ 53.5 $ 88.2 $ 137.3 $ Environmental Investment, net of Accum. Depreciation 233.6 $ 307.6 $ 404.1 $ 625.9 $ 966.3 $ 1,266.6 $ Return on prior YE investment balance (2) 28.0 $ 36.9 $ 48.5 $ 75.1 $ 116.0 $ Return of prior YE investments completed 4.8 11.2 15.2 22.3 34.7 Annual ECRR Revenue Requirement 32.8 $ 48.2 $ 63.7 $ 97.4 $ 150.6 $ Estimated calendar year revenue recognition (3) 19.1 $ 41.8 $ 57.2 $ 83.3 $ 128.5 $ Cumulative ECRR revenue recognition 19.1 $ 60.9 $ 118.1 $ 201.4 $ 329.9 $ |
 38 Transmission Cost Recovery • FERC formula transmission rate – Changes in cost of service reflected in annual update of FERC tariff • Update posted each October using projected test year – Capital expenditures – O&M – Tariff based on year-end consolidated capital structure • FERC transmission changes effective January 1 • Allowed ROE 11.3% • Annual true-up compares projected revenue requirement to actual, with difference incorporated into next update – Incentives on recently completed central Kansas line • 12.3% ROE • Accelerated book depreciation of 15 vs. 45 years • Transmission Delivery Charge (TDC) – Retail rates adjusted to match changes to FERC tariff JP Morgan Corporate Access |
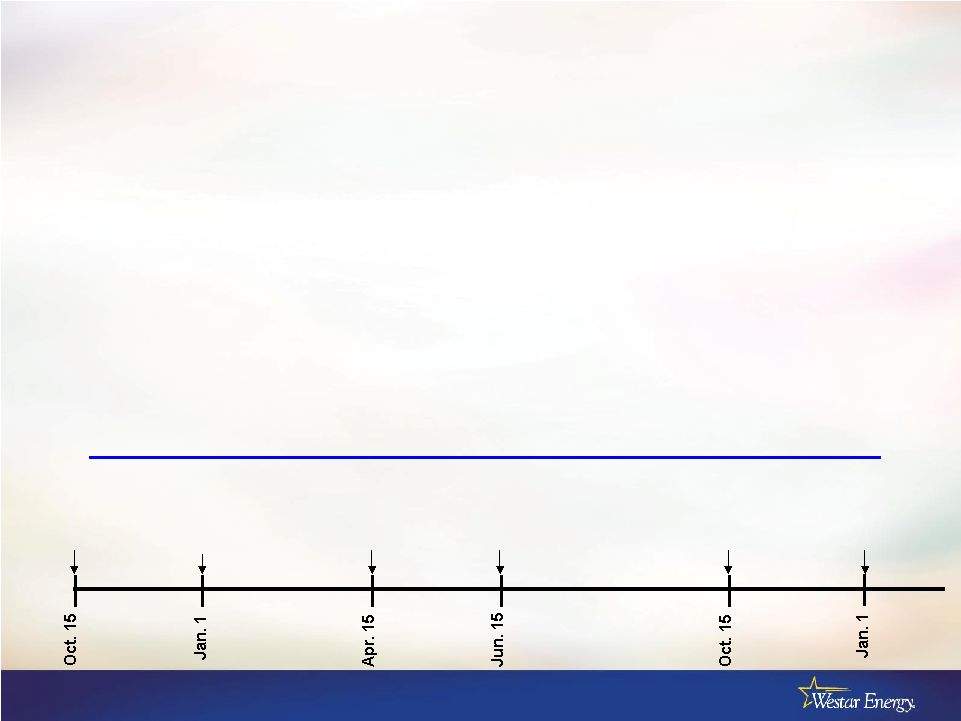 39 Transmission Formula Rate Mechanics • Fixed formula with changing inputs – Updated annually using Form 1 data – Established protocols for updates • Uses projected test year – Rate base (based on 13 month average) – O&M, depreciation and taxes – Cost of debt • Annual true-up incorporated in subsequent year’s formula inputs Establish Proj. 2011 Rev. Req. Establish Proj. 2012 Rev. Req. Start of 2012 Rate Year Start of 2011 Rate Year FERC Form 1 Released True-up between ’10 Proj. Rev. Req. and Actual Rev. Req. Transmission Formula Rate Time Line JP Morgan Corporate Access |
 40 Statutes for Predetermination and CWIP • Predetermination – Utilities can obtain order establishing ratemaking principles that will apply over the life of the asset • Construction Work in Progress (CWIP) – Utilities can include CWIP in rate cases JP Morgan Corporate Access |
 41 Pension Tracker • Defer as regulatory asset shortfall between funding of GAAP pension/OPEB expense and pension/OPEB currently authorized in rates • Maintain minimum funding level equal to GAAP pension/OPEB expense • Recover deferred expenses through multi-year amortization as part of next rate case JP Morgan Corporate Access |
 42 Energy Efficiency Initiatives • SmartStar Lawrence smart grid project – Installing < 48,000 “smart” meters – Advanced outage management system – Total project cost of < $40 million • Reduced by 50% DOE match – Expect to implement over 2 - 3 years • Deferred accounting for the cost of energy efficiency initiatives, such as – Smart thermostats – Customer educational programs – Demand response programs JP Morgan Corporate Access |
 43 Kansas’ Renewable Requirements • Renewable Portfolio Standard established – Installed capability standard in lieu of energy standard • 10% of peak load by 2011, 15% by 2016 and 20% after 2020 – Implies additional 150 to 200 MW for Westar – If generated in Kansas, treated at 110% of requirement – Relief from standard possible if costs would increase prices >1% • Potential to offset with RECs for initial period • Limited net metering – Limited to 1% of peak demand – Customer’s net metered sales can’t produce net negative sales • Environmental predictability – Legislation precludes state air emission levels from being more stringent than federal standards JP Morgan Corporate Access |
 44 Capital Structure for Ratemaking (Per Recent Orders) Capitalization Ratio Cost of Capital Weighted Cost of Capital Pre-tax Weighted Cost of Capital Long-term debt 48.66% 6.55% 3.19% 3.19% Preferred 0.51 4.55 .02 .04 Common 50.83 10.40 5.29 8.77 100.00% 8.50% 12.00% Capitalization Ratio Cost of Capital Weighted Cost of Capital Pre-tax Weighted Cost of Capital Long-term debt 52.38% 6.13% 3.21% 3.21% Preferred 0.45 4.52 .02 .03 Common 47.17 11.30 5.33 8.82 100.00% 8.56% 12.06% KCC FERC Transmission (1) Incentive ROE of 12.3% for applicable rate base (1) JP Morgan Corporate Access |
 45 Background JP Morgan Corporate Access |
 46 Westar Energy Legal Structure Kansas Gas and Electric Company Consolidated capital structure is used for ratemaking (Rate regulated utility) (Rate regulated utility) Westar Energy, Inc. Parent Subsidiary Combined company does business under the name “Westar Energy” JP Morgan Corporate Access |
 47 Westar’s Generating Resources JP Morgan Corporate Access Indicates proposed facility |
 48 Westar’s Plants Westar's MW Operator Years Installed Pulverized coal Jeffrey Energy Center 1,992 Westar 1978, 1980, 1983 Lawrence Energy Center 531 Westar 1954, 1960, 1971 Tecumseh Energy Center 205 Westar 1957, 1962 LaCygne Station 709 KCPL 1973, 1977 Nuclear Wolf Creek 544 WCNOC (1) 1985 Gas steam turbine Gordon Evans Energy Center 539 Westar 1961, 1967 Hutchinson Energy Center 167 Westar 1965 Murray Gill Energy Center 293 Westar 1952, 1954, 1956, 1959 Gas combustion turbine Abilene Energy Center 68 Westar 1973 Gordon Evans Energy Center 294 Westar 2000, 2001 Hutchinson Energy Center 230 Westar 1974, 1975 Spring Creek Energy Center 279 Westar 2001 Tecumseh Energy Center 37 Westar 1972 Emporia Energy Center 663 Westar 2008, 2009 Gas combined cycle State Line 201 EDE Co. 2001 Wind Meridian Way 96 Horizon (2) 2008 Central Plains 99 Westar 2009 Flat Ridge 100 Westar (3) 2009 Available generation At Dec. 31, 2009 7,047 (1) Wolf Creek Nuclear Operating Company is a company formed specifically to operate Wolf Creek for its owners. WCNOC is governed by a board of directors consisting of the CEO of WCNOC and senior executives of the plant owners. (2) 100% of generation purchased under Power Purchase Agreement (PPA) (3) 50% owned and 50% of generation purchased under PPA from BP Alternative Energy Westar Energy 2010 Results NERC 5-Year Average Plant Performance JP Morgan Corporate Access |
 49 Low-Cost Coal Fleet • Very low fuel cost – PRB coal – Excellent rail arrangements – Proximity to mines • Low embedded capital cost • No high-heat rate obsolete plants LAC 2 subject to lease agreement JP Morgan Corporate Access $0 $150 $300 $450 $600 Low Embedded Cost 5,000 7,000 9,000 11,000 13,000 Heat Rate |
 50 Westar Energy Coal Fleet Unit Capacity (MW) WR Share (MW) Age Heat Rate (Btu/kWh) Net Book Value (Millions) $/KW Jeffrey 2 725 667 30 11,256 200 $ 300 $ Jeffrey 1 722 665 32 11,204 216 $ 325 $ Jeffrey 3 716 659 27 11,265 325 $ 493 $ Lawrence 5 371 371 39 10,713 72 $ 194 $ La Cygne 1 736 368 37 10,497 117 $ 318 $ La Cygne 2 (a) 682 341 33 10,500 14 $ 41 $ Tecumseh 8 129 129 48 11,189 16 $ 124 $ Lawrence 4 108 108 50 11,605 41 $ 380 $ Tecumseh 7 73 73 53 11,749 28 $ 384 $ Lawrence 3 50 50 56 11,707 26 $ 520 $ 3,431 (a) Subject to lease agreement JP Morgan Corporate Access |
 51 Westar Coal Fleet Emission Control Equipment Unit Scrubber Precipitator Fabric Filter Low NOx SCR Jeffrey 1 Yes Yes No plans Yes Planned Jeffrey 2 Yes Yes No plans Planned No plans Jeffrey 3 Yes Yes No plans Yes No plans La Cygne 1 Yes NA Planned Yes Yes La Cygne 2 Planned Yes Planned Planned Planned Lawrence 3 No plans Yes No plans Planned No plans Lawrence 4 Yes NA Planned Planned No plans Lawrence 5 Yes NA Planned Planned No plans Tecumseh 7 No plans Yes No plans Yes No plans Tecumseh 8 No plans Yes No plans Planned No plans NA - Not Applicable No present projects underway for CO2 JP Morgan Corporate Access |
 52 Dramatic Improvement in Air Quality 0 40 80 120 2005 2006 2007 2008 2009 2010 20 40 60 2005 2006 2007 2008 2009 2010 Sulfur Dioxide 76% (000 tons) Nitrogen Oxide 49% (000 tons) JP Morgan Corporate Access |
 53 Westar-operated plant supply (80%) • JEC supply under contract through 2020 (10+ million tons/year) – 70% has no market openers – 30% reopened on price every 5 years • Next re-pricing will occur in 2013 – All volumes have cost escalators – Rail contract through 2013 • LEC/TEC supply under contract until 2012 (3.5 million tons/year) – 100% at fixed price or capped through 2012 – Rail contract through 2013 Co-owned plant supply managed by GXP (20%) • LAC supply (3 million tons/year) Coal Supply JP Morgan Corporate Access |